Embed Size (px)
Citation preview
1
Study on the effects of information disclosure on consumer choice of payment instruments Final Report December 2013
2
TABLE OF CONTENTS
1 Executive Summary ............................................................................................. 4
Introduction ....................................................................................................................... 4
Objectives ........................................................................................................................... 5
Methodology ....................................................................................................................... 6
Key findings ........................................................................................................................ 8
Conclusions ....................................................................................................................... 10
2 Introduction ...................................................................................................... 11
2.1 Background ................................................................................................................ 11
2.2 Research objectives ................................................................................................... 15
3 Experimental design .......................................................................................... 18
3.1 Overview ................................................................................................................... 18
3.2 Store types and payment scenarios ........................................................................... 18
3.3 Respondent segmentation ......................................................................................... 20
3.4 Payment methods ...................................................................................................... 21
3.5 Policy options and treatment versions ....................................................................... 22
3.6 Choice tasks and choice characteristics ..................................................................... 33
4 Consumer payment decision process ................................................................. 38
4.1 Guideline for analysis of results ................................................................................. 38
4.2 Awareness of payment costs ..................................................................................... 40
4.2.1 Limited awareness of payment costs ................................................................... 40
4.2.2 Knowledge gaps and misunderstandings on payment costs .................................... 41
4.3 Beliefs and attitudes .................................................................................................. 42
4.3.1 Consumer attitudes to payment methods ............................................................. 42
4.3.2 Information overload ......................................................................................... 47
4.4 Payment habits .......................................................................................................... 48
4.5 Steering methods....................................................................................................... 49
4.5.1 Current experience ........................................................................................... 49
4.5.2 Acceptability of steering methods ....................................................................... 52
5 Offline shopping payment experiments ............................................................. 54
5.1 Observed offline payment behaviour ......................................................................... 54
5.1.1 Offline choice tasks ........................................................................................... 54
5.1.2 Analysis of policy options in offline choice tasks .................................................... 58
5.2 Observed online payment behaviour .......................................................................... 61
5.2.1 Online choice tasks ........................................................................................... 61
3
5.2.2 Analysis of policy options in online choice tasks .................................................... 64
5.3 Findings of multivariate analysis ............................................................................... 67
5.3.1 Main biases and barriers of rational choices.......................................................... 68
5.3.2 Effectiveness of tested policy options .................................................................. 75
5.3.3 Drivers of relevance of payment costs ................................................................. 83
6 FINDINGS AND CONCLUSIONS .......................................................................... 86
7 GLOSSARY OF KEY TERMS ................................................................................. 90
8 TECHNICAL SUMMARY ....................................................................................... 92
8.1 Overview ................................................................................................................... 92
8.2 Online survey – technical summary ........................................................................... 93
8.3 Sampling design – country selection .......................................................................... 94
8.4 Within country sampling ............................................................................................ 97
9 Annex 1 - Bibliography ...................................................................................... 99
10 Annex 2 - Questionnaire .................................................................................. 101
11 Annex 3 – Data tables ..................................................................................... 146
4
This report was produced in the frame of a contract with the Executive Agency for Health and Consumers (EAHC) acting under its mandate from the European Commission. The content of this report represents the views of TNS and is its sole responsibility; it can in no way be taken to reflect the views of the European Commission and/or EAHC or any other body of the European Union. The European Commission and/or EAHC do not guarantee the accuracy of the data included in this report, nor do they accept responsibility for any use made by third parties thereof.
1 Executive Summary
Introduction
The way goods and services are paid for is changing. Card payments are progressively replacing cheques and cash payments and new mobile and internet payment methods are also entering the market and broadening the options available to consumers. On the one hand this changing landscape represents some advantages for the consumer, the retailer and the financial industry, and on the other hand it also highlights some of the key challenges in this market:
Increased usage of card payments against a context of high merchant service charges (and MIFs) indicates a lack of effective price competition.
The relatively limited choice of payment methods in spite of technological progress suggests market entry barriers for new payment service providers.
The cross-subsidisation of more expensive payment methods by having the same prices for goods and services for cash or debit/credit cards etc. is the root cause of the lack of cost transparency among consumers.
The European Commission is now considering a variety of regulatory measures to address the lack of transparency in this area and to improve competition between payment instruments1. Hence, this study aims to test the following assumption:
Does more transparency of payment charges change consumer behaviour in a way which enables more price competition?
The current consumer choice between payment options is based on anything but price, because the cost differences are typically hidden to the consumer. The question is whether and how the choice behaviour would change if there was more information available on the real costs attached to the choice of payment method.
The study therefore needs to include behavioural experiments to provide empirical evidence on whether this hypothesis is correct – in other words that, if consumers who during the
1 See the recently published Payments Legislative Package as of 24th July 2013:
http://ec.europa.eu/internal_market/payments/framework/index_en.htm
5
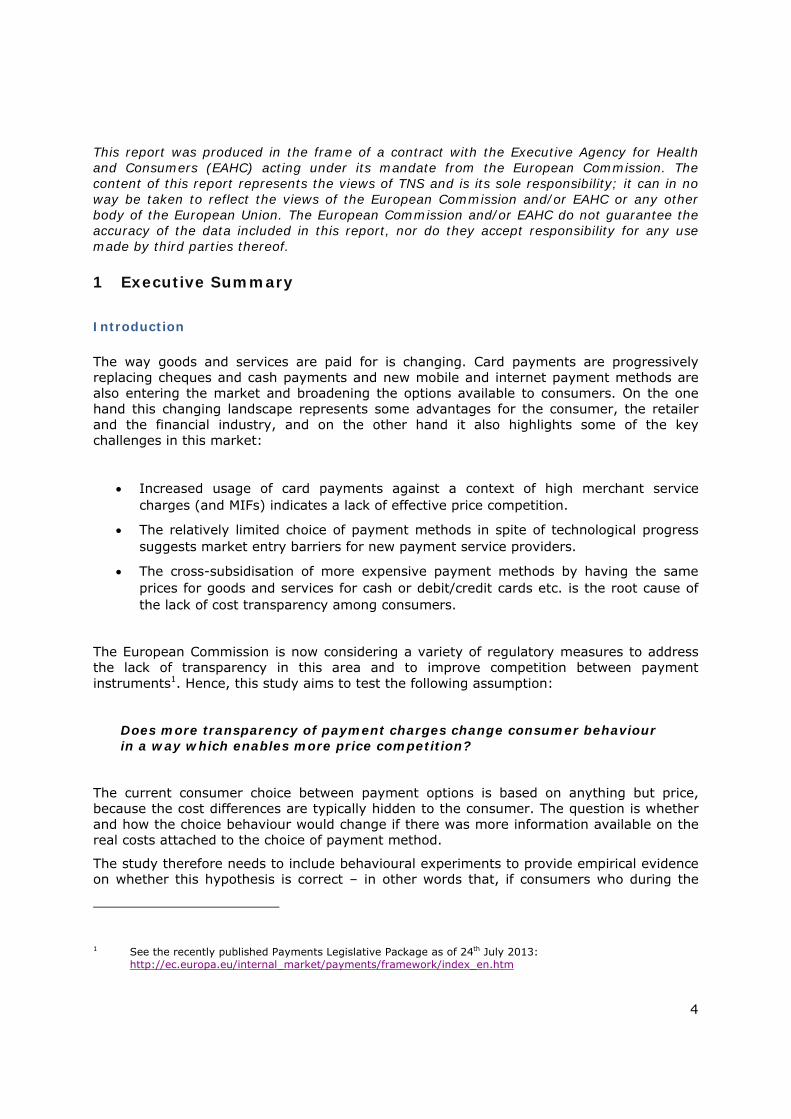
experiment received a more “transparent” treatment in terms of the information provided on payment costs, they will as a result take more cost-conscious decisions. This will help to determine which policy initiative will achieve the ultimate goal of lower charges in the market.
Objectives
The purpose of this research project is to explore the typical consumer’s decision process for a number of shopping scenarios and through this examine two issues specifically:
The average payers’ capacity to access, interpret and use existing information by identifying the main individual biases and external barriers that prevent them from making cost-conscious choices.
Identifying the most effective policy option(s) to make more cost-conscious decisions between payment methods from the individual consumer perspective.
The following policy options (transparency treatments) were tested in this study:
Merchant cost information – presented as a short and simple notice to the consumer that the merchant has to pay a fee for their payment to the card company involved.
Educational nudge – a more detailed intervention that outlined how much one could save over a year, if the consumer were to make cost-effective choices
Direct cost differentiation between payment methods for consumers
o Either with a positive framing of a rebate for using certain payment methods
o Or with a negative framing of a surcharge for using certain payment methods
Transparency Intervention
Control group
Comparison of cost-conscious decisions
UNIVERSE/SAMPLE: OUTCOME:
Ran
dom
spl
it
TREATMENT: IMPACT:
More competition
Lower charges
No competition
Unchanged
charges
6
In addition, the timing of the provision of information was considered as part of the experiment – either before the choice of product, before the choice of payment method, or after they have made their payment.
The research examines the impact of both the options and timings on consumer’s awareness and behaviour when it comes to choosing how to pay for goods and services.
Methodology
Following a preparatory desk research stage, a large scale multi-country quantitative study was conducted online. The fieldwork was conducted in 10 Member States in March 2013. The countries were as follows:
UK Italy Spain France Germany The Netherlands Denmark Finland Slovenia Poland
The sample comprised 10,041 payment card holders, i.e. each participant had at least one debit or credit card.
The survey included an assessment of the card holders’ ability and likelihood to choose the most suitable payment method. The experimental component took the form of behavioural choice experiment designed as randomised controlled trials to observe consumers’ payment choice behaviour in various shopping contexts:
Small purchase amount of 20 € (or equivalent) in an offline and an online department store
High purchase amount of 200 € (or equivalent) in an offline and an online department store
The offline store accepted three different payment methods: cash, debit card, credit card. The online store accepted four different payment methods: credit transfer, debit card, credit card and an online payment system. If a respondent did not own a debit (or credit) card, s/he was not presented this option in the choice experiment. The online shopping scenario was only presented to participants with online shopping experience.
7
In order to test the policy options including all realistic combinations of treatments and timings, 30 different treatment splits were developed with an additional control group. Each participant was randomly assigned to one of these splits with the specific treatment combination.
While the design aimed to represent a realistic setting of the choice situations in all countries, it is worth noting the following caveats:
Offline shopping scenarios were observed within an online context (due to the nature of the survey being conducted online)
Payment options like credit cards or debit cards were presented without brand names
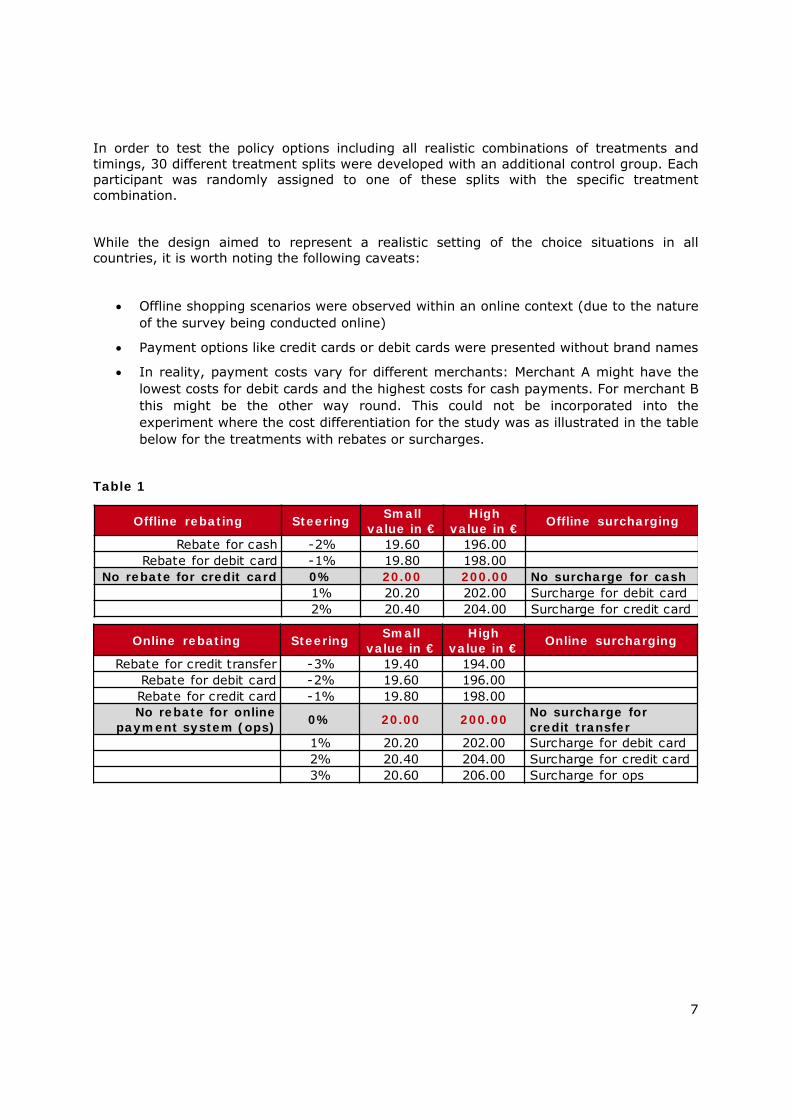
In reality, payment costs vary for different merchants: Merchant A might have the lowest costs for debit cards and the highest costs for cash payments. For merchant B this might be the other way round. This could not be incorporated into the experiment where the cost differentiation for the study was as illustrated in the table below for the treatments with rebates or surcharges.
Table 1
Offline rebating Steering Small value in €
High value in € Offline surcharging
Rebate for cash -2% 19.60 196.00Rebate for debit card -1% 19.80 198.00
No rebate for credit card 0% 20.00 200.00 No surcharge for cash1% 20.20 202.00 Surcharge for debit card2% 20.40 204.00 Surcharge for credit card
Online rebating Steering Small value in €
High value in € Online surcharging
Rebate for credit transfer -3% 19.40 194.00Rebate for debit card -2% 19.60 196.00Rebate for credit card -1% 19.80 198.00No rebate for online
payment system (ops) 0% 20.00 200.00 No surcharge for credit transfer
1% 20.20 202.00 Surcharge for debit card2% 20.40 204.00 Surcharge for credit card3% 20.60 206.00 Surcharge for ops
8
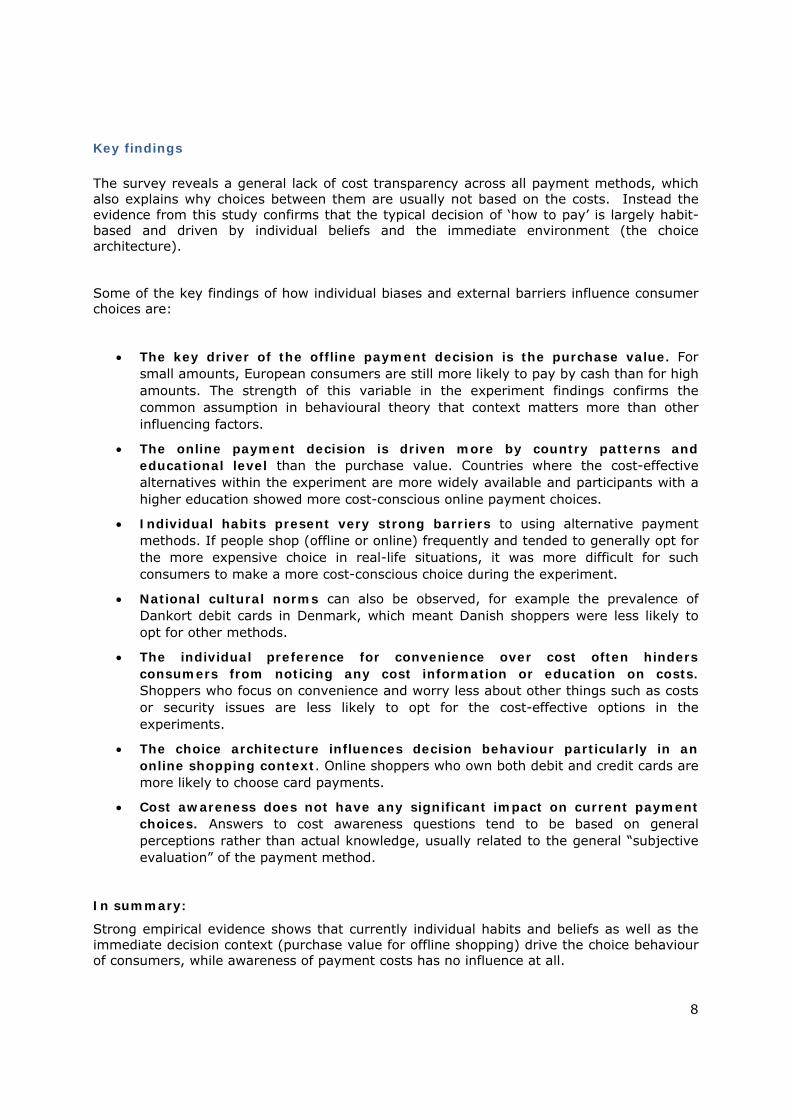
Key findings
The survey reveals a general lack of cost transparency across all payment methods, which also explains why choices between them are usually not based on the costs. Instead the evidence from this study confirms that the typical decision of ‘how to pay’ is largely habit-based and driven by individual beliefs and the immediate environment (the choice architecture).
Some of the key findings of how individual biases and external barriers influence consumer choices are:
The key driver of the offline payment decision is the purchase value. For small amounts, European consumers are still more likely to pay by cash than for high amounts. The strength of this variable in the experiment findings confirms the common assumption in behavioural theory that context matters more than other influencing factors.
The online payment decision is driven more by country patterns and educational level than the purchase value. Countries where the cost-effective alternatives within the experiment are more widely available and participants with a higher education showed more cost-conscious online payment choices.
Individual habits present very strong barriers to using alternative payment methods. If people shop (offline or online) frequently and tended to generally opt for the more expensive choice in real-life situations, it was more difficult for such consumers to make a more cost-conscious choice during the experiment.
National cultural norms can also be observed, for example the prevalence of Dankort debit cards in Denmark, which meant Danish shoppers were less likely to opt for other methods.
The individual preference for convenience over cost often hinders consumers from noticing any cost information or education on costs. Shoppers who focus on convenience and worry less about other things such as costs or security issues are less likely to opt for the cost-effective options in the experiments.
The choice architecture influences decision behaviour particularly in an online shopping context. Online shoppers who own both debit and credit cards are more likely to choose card payments.
Cost awareness does not have any significant impact on current payment choices. Answers to cost awareness questions tend to be based on general perceptions rather than actual knowledge, usually related to the general “subjective evaluation” of the payment method.
In summary:
Strong empirical evidence shows that currently individual habits and beliefs as well as the immediate decision context (purchase value for offline shopping) drive the choice behaviour of consumers, while awareness of payment costs has no influence at all.

9
How can this habit-driven, often unconscious, decision process be changed in order to encourage more price competition?
To identify the most effective policy option in driving cost-conscious consumer choices, the analysis of the experiments looked at the impact of each individual transparency treatment as well as at the 30 tested combinations in the treatment splits.
Some of the key findings about the effectiveness of the tested policy options influencing the consumer choices are as follows:
Simple information about the costs borne by the merchant is not effective at all in influencing consumer payment choice.
The educational nudge provides a significant and positive impact on cost-conscious payment choices by increasing the transparency of payment costs and making them more tangible to the shoppers. However, this tends to only influence consumers who are already concerned about payment costs and therefore the strength of this nudge tends to be limited.
Changing consumer behaviour often requires a big jolt, and it is often not enough to provide only information or education alone. This is very typical of low salience and habit driven behaviours and the reason why so many education interventions have little effect.
Monetary incentives (rebates) and disincentives (surcharges) are considerably more effective than information-based measures in driving cost-conscious choices. While rebates are six times more effective than the educational nudge, surcharges even double this effect. Therefore, there is strong empirical evidence that surcharges are by far the most effective transparency treatment among all tested policy options.
The difference between surcharges and rebates demonstrates the so-called “loss aversion” effect, whereby people will make more effort (and change their behaviour) to avoid a loss than to make a similar gain.
At the same time, the negative framing of surcharges could also lead to avoidance strategies. Surcharges are generally less popular than rebates. If consumers are asked directly, a significant proportion claim that they would go to another shop, while the majority would choose the cheaper options to avoid surcharges.
Previous experience with surcharges drives issue salience. While the experience with rebates does not have any influence on the individual relevance of costs, the experience with surcharges provides a lasting effect2.
2 This is again explained by behavioural theory: in “Thinking, Fast and Slow”, Daniel Kahneman discusses at length how people are more likely to remember negative experiences.
10
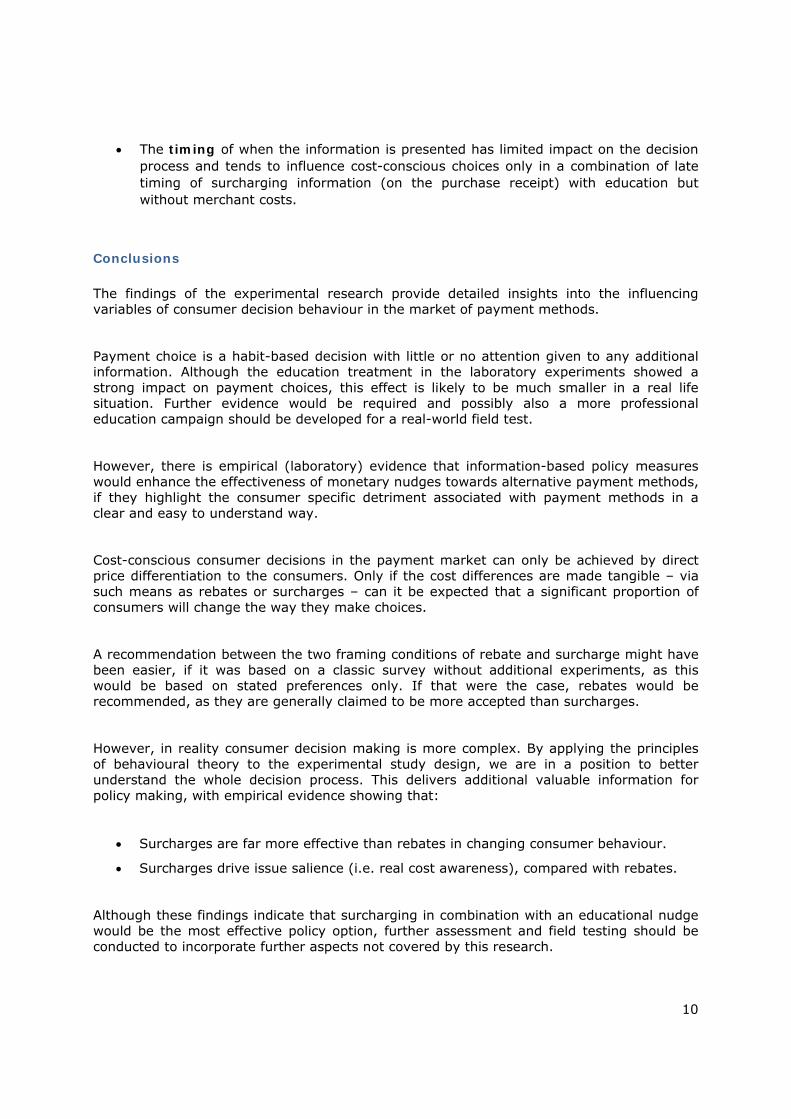
The timing of when the information is presented has limited impact on the decision process and tends to influence cost-conscious choices only in a combination of late timing of surcharging information (on the purchase receipt) with education but without merchant costs.
Conclusions
The findings of the experimental research provide detailed insights into the influencing variables of consumer decision behaviour in the market of payment methods.
Payment choice is a habit-based decision with little or no attention given to any additional information. Although the education treatment in the laboratory experiments showed a strong impact on payment choices, this effect is likely to be much smaller in a real life situation. Further evidence would be required and possibly also a more professional education campaign should be developed for a real-world field test.
However, there is empirical (laboratory) evidence that information-based policy measures would enhance the effectiveness of monetary nudges towards alternative payment methods, if they highlight the consumer specific detriment associated with payment methods in a clear and easy to understand way.
Cost-conscious consumer decisions in the payment market can only be achieved by direct price differentiation to the consumers. Only if the cost differences are made tangible – via such means as rebates or surcharges – can it be expected that a significant proportion of consumers will change the way they make choices.
A recommendation between the two framing conditions of rebate and surcharge might have been easier, if it was based on a classic survey without additional experiments, as this would be based on stated preferences only. If that were the case, rebates would be recommended, as they are generally claimed to be more accepted than surcharges.
However, in reality consumer decision making is more complex. By applying the principles of behavioural theory to the experimental study design, we are in a position to better understand the whole decision process. This delivers additional valuable information for policy making, with empirical evidence showing that:
Surcharges are far more effective than rebates in changing consumer behaviour.
Surcharges drive issue salience (i.e. real cost awareness), compared with rebates.
Although these findings indicate that surcharging in combination with an educational nudge would be the most effective policy option, further assessment and field testing should be conducted to incorporate further aspects not covered by this research.
11
2 Introduction
2.1 Background
The way goods and services are paid for is changing. Electronic payment methods are of ever increasing importance for making payments. Payment cards (including debit and credit cards) are now the most commonly used form of payment in the European Union after cash. While cash is still the preferred choice for the majority of payments at physical point of sale, the usage of cards is becoming increasingly widespread. In terms of relative importance, already in Canada and the USA payment cards are the most commonly used instruments, accounting for 68% and 58% respectively of all registered transactions made in 2010 (Bank for International Settlements, 2011). According to the European Central Bank (2010) in the European Union their market share is reported to be 38%, which is the highest of all non-cash payment methods available, well ahead of direct credits, direct debits and cheques.
While there is variation by Member State, the general trend is that card usage is increasing and already the landscape of retail payments has changed – the use of cheques has decreased dramatically and with rapid technological developments (including more electronic terminals at retail outlets and a continued increase in online shopping) it is likely that card usage will continue to increase, ultimately overtaking cash payments as the most common form of payment.
This brings advantages for the consumer, the retailer and the financial industry – and at the same time it also raises new challenges. However within the context of the Single Euro Payments Area (SEPA) initiative, new regulatory measures are needed to meet the challenges of this new payment landscape.
There are obvious benefits for consumers and retailers in terms of convenience, security and accounting. There is also the apparent benefit to the consumer of loyalty schemes and “rewards”. However this is where the benefits of payment cards become more complicated - the complex payment mechanism which underpins each transaction is not necessarily fair or transparent to neither the consumer using the card, nor the consumers who choose other payment mechanisms. The complexity of this payment market represents a potentially significant detriment to consumers.
An inter-bank fee or Multilateral Interchange Fee (MIF) is applied, whereby the issuing bank issues a collectively agreed fee to the acquiring bank. The issuing bank charges this fee for each transaction made. This is the start of a pricing chain which can be summarised as follows:
The issuing bank charges a MIF to the acquiring bank.
The acquiring bank recovers the MIF charged by the issuing bank by charging the merchant a fee, known as a Merchant Service Charge (MSC).
The merchant recovers the fee by directly or indirectly passing the cost onto the consumer.
12
There are other fees which are possible – in addition to interest charges, issuing banks can also charge cardholders for aspects of the service such as periodic fees (e.g. a monthly rate, calculated using the annual percentage rate) or account statements.
This so-called interchange is a complex system of payments, and the fact that the payments are “behind the scenes” means that consumers are often not aware of the charges they are paying. In addition, the interchange system is a profitable source of revenue for the retail banking sector. Card schemes compete for banks to issue their cards using the interchange fee that the banks pass onto merchants. The higher the interchange fee, the more likely the bank is to issue the card. The more banks that issue the card, the more consumers will use them. The banks attract cardholders with low fees and reward schemes that are funded via the interchange fee. Merchants are unwilling to risk losing a high proportion of consumers by not accepting the most popular card schemes. They may feel that a particular card is too expensive, but they do not wish to risk losing customers by choosing not to accept the card. They therefore pay the interchange fee.
Thus the competitive pressure on interchange fees does not reduce fees but instead drives them upward. The higher costs to merchants are eventually reflected in inflated prices to consumers – prices which are paid not only by cardholders, but those who use other less expensive means of payment.
The focus of this study is the method by which the merchant recoups the cost of the charge levied by the issuing bank, and how this cost is communicated to consumers.
Transparency and consumer choice
The cost implications of the payment instruments that consumers use are not visible. This is changing. Already, under an informal agreement with the European Commission, the two largest international card schemes (MasterCard and Visa) have reduced their MIFs. The benchmark is the so-called “merchant indifference” test, whereby card payment does not result in higher costs to retailers than a payment with cash. Cash payments also have cost implications of course – while the retailer may not see the costs as clearly as a MIF, there are of course accounting costs which result from cash payments, not to mention security risks.
The prohibition for merchants to charge customers a usage fee, or surcharge, in many card schemes has meant that the true costs have been hidden to the consumers via cross-subsidisation (i.e. the same – higher - price is paid by all customers regardless of payment method). Often, card schemes would forbid retailers from passing on an explicit fee to customers to cover their costs (due to the risk that it would reduce usage of the card scheme) and required that the fee be combined in their overall prices. What this means in effect is that whether a consumer pays for a purchase using a credit or debit card or not, they still pay a hidden fee on virtually every transaction they make.
13
It is estimated that these fees cost European shoppers tens of billions of Euros every year3. The fees drive up the cost of goods and services for all consumers whether they pay with plastic or cash. As a consequence of hidden interchange fees, prices are pushed up for everybody.
However following the adoption of the Payment Services Directive 2007/64/EC, retailers are now permitted to use surcharging. Similarly, rebates to customers using less costly payment instruments are also permitted. However, the Directive allows that individual EU Member States may disallow surcharging and the result is a Europe almost evenly divided on the issue.
While surcharging in principle increases transparency and consumer choice (in that they can choose a less expensive payment instrument), in actuality, surcharging remains relatively uncommon even in those countries where it is allowed. Retailers tend to be cautious about charging fees which can be perceived as unfair – especially given the low awareness of the interchange structure amongst consumers – and there is a fear that this will mean customers will be lost as a result.
Another negative aspect of surcharging is where merchants do not simply recoup the costs they pay, but actually try to make a profit from excessive surcharging. As long as the information is disclosed and customers have a “choice” of how they pay, national legislation in many EU Member States currently enables merchants to charge whatever they like within the law, with no maximum value for surcharges.
A notable example of this is airlines that subsidise the advertised (low) price of flights by additional surcharging for other aspects of the purchase, including the payment method. While there is technically a choice – consumers can avoid the charge if they pay using the airlines own prepaid card – in effect, the vast majority of consumers are provided with a “choice context” that forces them to pay this charge. While often described as an “administrative fee”, the fee is higher than the actual MIF charge for the merchant. This is an example of where surcharging, rather than increasing cost transparency actually has the opposite effect in that it reduces the clarity of the advertised price, and while presented as choice, in most cases consumers have no practicable alternative means of payment.
Under the Consumer Rights Directive4 due to come into force in June 2014, surcharging will be capped to reflect the real cost to the merchant.
3 http://ec.europa.eu/ireland/press_office/news_of_the_day/new-eu-rules-on-debit-and-credit-card-
payments-proposed_en.htm 4 http://eur-lex.europa.eu/LexUriServ/LexUriServ.do?uri=OJ:L:2011:304:0064:01:EN:HTML
14
The policy challenge: fragmented national policy schemes and lack of market transparency
The wide variety of MIFs applied in the EU, the different mechanisms by which merchants recoup the cost of the fees they pay and the overall lack of transparency to the consumer together represent a considerable challenge to the formation of an integrated market of debit and credit card payments as part of the Single Euro Payments Area (SEPA) initiative. The lack of transparency also represents a clear risk of consumer detriment in awareness of the cost implications of their payment method. The “no surcharge” rule means that consumers using less expensive payment methods are penalised. Surcharges while in principle offering a more transparent price indication to consumers in fact are either viewed with suspicion by the merchant, or are seen as a means of increasing revenue rather than simply covering their costs.
In 2011, the ECB5 examined the issues surrounding the MIF in payment cards markets from different angles and pointed out that it is crucial for the success of SEPA that cards can be used throughout the euro area to make euro payments without any regional differentiation. It concluded that:
“Transparency and clarity with respect to the real costs and benefits of different payment instruments are indispensable for a modern and harmonised European retail payments market. Interchange fees (if any) should be set at a reasonable level and should not prevent the use of efficient payment instruments.
A sharp increase in cardholder costs could induce consumers to use less efficient means of payment, thereby hampering the success of, and the objectives pursued by, the SEPA project. Interchange fees (if any) should be set to promote overall economic efficiency in compliance with competition rules. The future shape of the payment cards landscape in the euro area and the application of interchange fees (if any) would benefit from a fresh and European approach.”
The following year, the European Commission's Green Paper, entitled 'Towards an Integrated European Market for Card, Internet and Mobile Payments', was published on 11 January 20126.
It identified four main drivers for market integration in electronic payments:
Security;
Transparency and choice;
Competition;
5 European Central Bank, Interchange Fees in Card Payments, Occasional Papers Series, No 131, September
2011 6 http://eur-lex.europa.eu/LexUriServ/LexUriServ.do?uri=COM:2011:0941:FIN:EN:PDF
15
Innovation.
The European Commission stated that the contributions to the consultation will determine the need for EU action on the various issues raised in the Green Paper and the form this action should take. Following on the recommendations of this Green Paper, the European Commission is now considering a variety of regulatory measures to address the lack of transparency in this area and to improve competition between payment instruments. Given the lack of research in this area, this study was intended to provide data on the impact that the provision of the cost information borne by merchants has on consumer behaviour in terms of the choice of payment method they opt for. The key objective for the research is to identify whether improved transparency would allow consumers to make better choices in terms of using more efficient payment methods, and to test the different policy options under consideration. These policy options include the following:
Surcharging, with merchants levying a surcharge per transaction reflecting the real cost borne by them for that payment method
Offering rebates per transaction, again with the amount determined by the cost borne by them
Additional information provided on merchants’ payment costs
Educational intervention explaining the impact of payment charges for the consumer
In addition, the timing of the provision of information was to be considered in this study– in essence, before consumers choose a product, before they choose a payment method, or after they have made their payment.
The research examines the impact of both the options and timing on consumer’s awareness and behaviour when it comes to choosing how to pay for goods and services.
2.2 Research objectives
The ultimate goal of this study is to identify the most appropriate and effective way of increasing the “transparency” of payment costs between merchant and consumer, and which will have the consequence more optimal (cost-efficient) choices by consumers, and which eventually lead to fairer price competition between all payment methods.
16
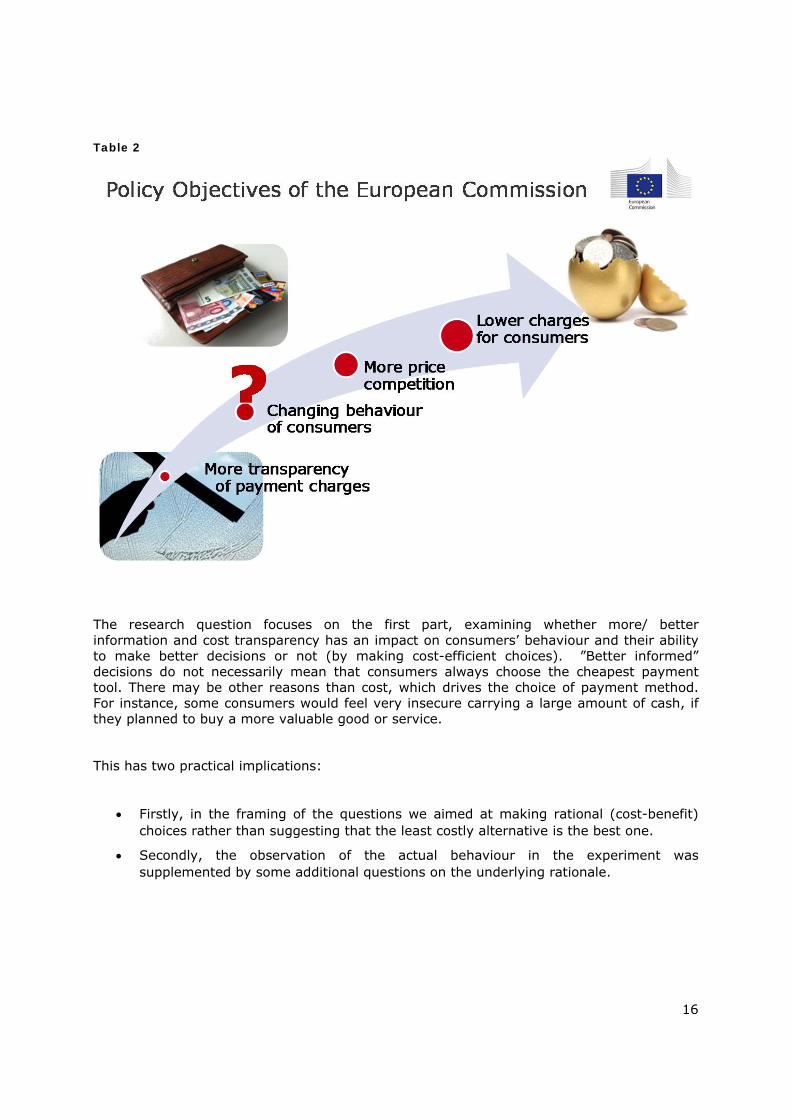
Table 2
The research question focuses on the first part, examining whether more/ better information and cost transparency has an impact on consumers’ behaviour and their ability to make better decisions or not (by making cost-efficient choices). ”Better informed” decisions do not necessarily mean that consumers always choose the cheapest payment tool. There may be other reasons than cost, which drives the choice of payment method. For instance, some consumers would feel very insecure carrying a large amount of cash, if they planned to buy a more valuable good or service.
This has two practical implications:
Firstly, in the framing of the questions we aimed at making rational (cost-benefit) choices rather than suggesting that the least costly alternative is the best one.
Secondly, the observation of the actual behaviour in the experiment was supplemented by some additional questions on the underlying rationale.
17
The key objectives of this study can be summarised as follows:
Explore consumer understanding of cost implications when choosing between alternative payment instruments, i.e. understanding the average consumers’ capacity to access, interpret and use any existing information and thereby:
Identify the most effective policy option(s) and timing of information disclosure for the consumer to make better (informed) decisions and thereby consider alternative (more efficient) payment methods:
These key objectives were conducted via primary research with consumers and supplemented with in-depth preparatory work including desk research in order to generate precise policy recommendations.
18
3 Experimental design
3.1 Overview
The questionnaire and the experimental design were developed by TNS in co-operation with EAHC, DG SANCO and JRC-IHCP. It consists of three main modules:
Pre-experimental questions, to screen and segment the sample in order to route the respondents properly through the experiment as well as questions that were required to collect information without a bias from the experiment (e.g. habits and cost awareness).
The core part of the online study was a behavioural choice experiment designed as randomised controlled trials to observe consumers’ payment preferences in various shopping contexts.
Post-experimental questions captured further relevant issues to back up and explain the experiment findings such as recall, choice rationale, stated preferences and attitudes.
The design of the experiments had to take into account the specific context that shoppers encounter when making payment decisions in real life (amongst other things to simulate current behaviour in a control group). In addition, potential policy options were developed to fit into the typical information and decision process of a payment scenario.
Several decisions had to be made in the set-up phase to finally define the experimental design, which on the one hand reflected reality as closely as possible and on the other hand allowed a reasonable reduction of complexity. There was a focus on key variables to reduce real world complexity and to avoid cognitive overburdening of respondents and allow meaningful statistical analysis.
This Chapter outlines the key challenges and issues which were considered for the final design of the experimental core part of the questionnaire.
3.2 Store types and payment scenarios
In theory, one may assume that the purchased product category has a certain influence on the choice of payment method. In fact, in some countries the interchange fees for VISA and MasterCard differ depending on the sector7, although most consumers are probably not
7 “Interchange fees in card payments” by Ann Börestam and Heiko Schmiedel, published in September 2011
http://www.ecb.int/pub/pdf/scpops/ecbocp131.pdf and Visa/MasterCard internet site:
19
aware of this. In order to avoid further complexity the experimental design did not specify sectors or product categories. The shopping scenarios were instead framed as department stores, which offered a broad range of products or services.
The only key differentiation included within the experiment was between an offline and online store. The interchange fee differs between online and offline payments at least in some countries. The main rationale for including both online and offline purchases is that online is a rapidly growing market which requires a different framing and choice architecture than traditional offline purchases.
The other key differentiation was between small and large purchase values. The hypothesis behind was that (at least for offline shopping scenarios) there will be a higher barrier to pay with cash for large purchases8.
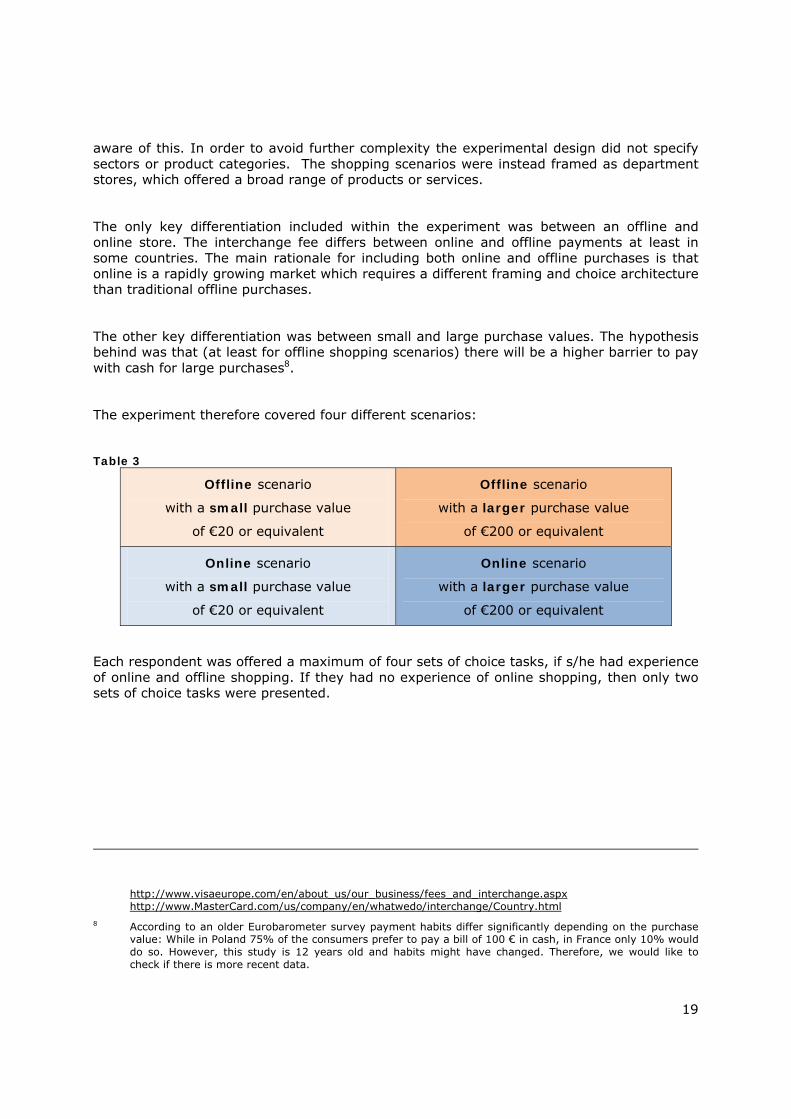
The experiment therefore covered four different scenarios:
Table 3
Offline scenario
with a small purchase value
of €20 or equivalent
Offline scenario
with a larger purchase value
of €200 or equivalent
Online scenario
with a small purchase value
of €20 or equivalent
Online scenario
with a larger purchase value
of €200 or equivalent
Each respondent was offered a maximum of four sets of choice tasks, if s/he had experience of online and offline shopping. If they had no experience of online shopping, then only two sets of choice tasks were presented.
http://www.visaeurope.com/en/about_us/our_business/fees_and_interchange.aspx http://www.MasterCard.com/us/company/en/whatwedo/interchange/Country.html
8 According to an older Eurobarometer survey payment habits differ significantly depending on the purchase value: While in Poland 75% of the consumers prefer to pay a bill of 100 € in cash, in France only 10% would do so. However, this study is 12 years old and habits might have changed. Therefore, we would like to check if there is more recent data.
20
The exact purchase value decided upon was based on the following rationale9:
€ 20 for the small purchase value
An amount that most consumers have in their wallets.
Well above the usual minimum thresholds for accepting most credit card payments.
A large number of consumers will not have already decided on a payment method, but the choice might be influenced by additional information or (dis)incentives.
€ 200 for the larger purchase value
An amount that most consumers would not have in their wallets and would require an evaluation of cost versus convenience (in terms of walking to the next ATM in an offline scenario).
Below a level that would be unrealistic for an unplanned shopping expenditure.
An amount large enough to assess whether the actual amount saved of a choice task is more important in high value scenarios, while the percentage saved is a more important factor in low value scenarios.
3.3 Respondent segmentation
The design needed to take into account that there will be a range of respondents with different payment means and experiences.
Since the sample was screened for consumers who owned at least one payment card (debit or credit), different types of respondent were provided with appropriate choices within the experiments:
Owners of credit cards and debit cards were presented both methods as possible payment options in all scenarios (together with other payment methods).
Non-credit card owners were not offered credit cards for payment.
Non-debit card owners were not offered debit cards for payment.
Shoppers with online shopping experience were presented additional online payment scenarios.
Non-online shoppers without experience were presented only offline payment scenarios.
9 Purchase values have been adjusted for selected EU Member States by x-rates (Denmark, Poland) and
disposable income (Poland and Slovenia).
21
This design meant that respondents only chose between payment methods they were familiar with.
3.4 Payment methods
There is a wide variety of payment methods available when one considers all possible payment scenarios: cash, foreign currencies, vouchers, cheques, traveller cheques, money card, debit cards used with signatures, debit cards used with PIN, credit cards with a four party scheme, credit card with a three party scheme, bank transfers, direct debit, etc.
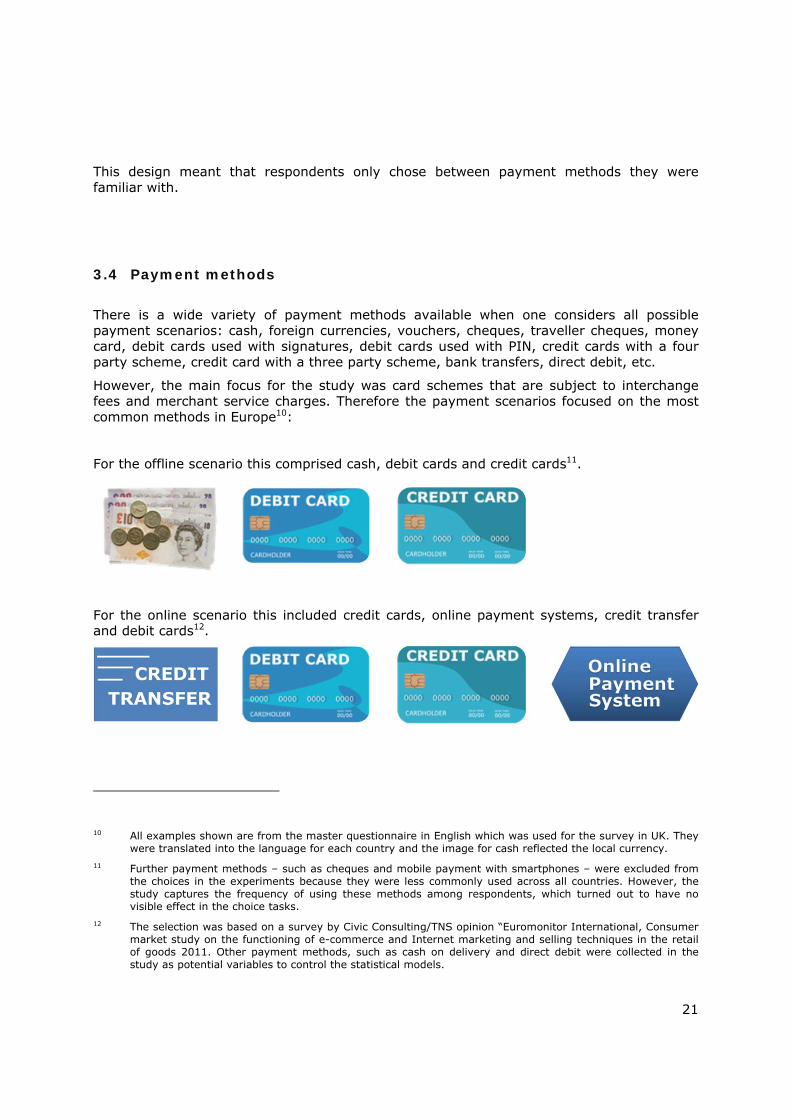
However, the main focus for the study was card schemes that are subject to interchange fees and merchant service charges. Therefore the payment scenarios focused on the most common methods in Europe10:
For the offline scenario this comprised cash, debit cards and credit cards11.
For the online scenario this included credit cards, online payment systems, credit transfer and debit cards12.
10 All examples shown are from the master questionnaire in English which was used for the survey in UK. They
were translated into the language for each country and the image for cash reflected the local currency. 11 Further payment methods – such as cheques and mobile payment with smartphones – were excluded from
the choices in the experiments because they were less commonly used across all countries. However, the study captures the frequency of using these methods among respondents, which turned out to have no visible effect in the choice tasks.
12 The selection was based on a survey by Civic Consulting/TNS opinion “Euromonitor International, Consumer market study on the functioning of e-commerce and Internet marketing and selling techniques in the retail of goods 2011. Other payment methods, such as cash on delivery and direct debit were collected in the study as potential variables to control the statistical models.
22
Real-world brands for card providers were excluded to avoid any bias caused by brands. It was not the objective of the study to identify differences between MasterCard and Visa, for example. However, the preliminary questions collected information about the card brands owned by the respondents.
When conducting any research about payment cards, a key challenge is to minimise confusion between debit and credit cards. Consumers are often not aware of the difference and need additional guidance for identifying the cards they own. Moreover, there are quite a lot of country specific differences in particular for debit card schemes.
Therefore, a country specific explanation was given to respondents before the first questions on card ownership. This explanation was repeated in the choice tasks within a mouse-over text:
Debit card, i.e. the purchase amount is deducted immediately from your bank account. Examples are: Maestro Card, Debit MasterCard, Visa Debit Card, Visa Electron Card [local additions in DK: Dankort; DE: EC-Karte, Girocard; FR: Carte Bleue, Carte Bancaire]
Credit card, i.e. the purchase amount is not deducted immediately from your account – instead you are sent a monthly bill and your payment is collected once a month or later. Examples are: Visa Credit Card, MasterCard Credit Card, American Express Card, and Diners Club Card
3.5 Policy options and treatment versions
The next dimension to be considered was the design of policy stimuli and the number of treatment splits to be tested. To examine the impact of possible policy options on the consumer’s decision-making the following stimuli were developed to test their effectiveness on driving rational choices:
Merchant cost information (additional information stimulus)
To test if there is any effect of a ‘fairness notion’, information about merchant fees was provided to respondents to make them more sensitive for the “hidden costs” and practices involved in the various card schemes.
Educational nudge (additional information stimulus)
In order to increase transparency and consumer awareness of possible payment costs, this treatment simulated an education campaign to some respondents before they proceeded to the choice scenarios.
Payment costs to consumers (steering stimuli)
This set of policy options focused on direct monetary incentives or disincentives for consumers. Payment scenarios with surcharges, rebates and no rebates were offered in the choice tasks.
The online (lab) environment included all scenarios, even those that may not be permitted by local legislation. Thus, all retailer steering options were tested across
23
all countries (i.e. including surcharging/rebating for example in France). Since payment steering methods are not very common for most consumers in Europe (regardless of legislation), this required a distinctive framing in all countries anyway.
Furthermore, it was assumed that a surcharge would only be levied if the payment costs were not included in the prices displayed on the products. Likewise, a rebate was only given if the payment costs of the most expensive method were already included in the displayed price.
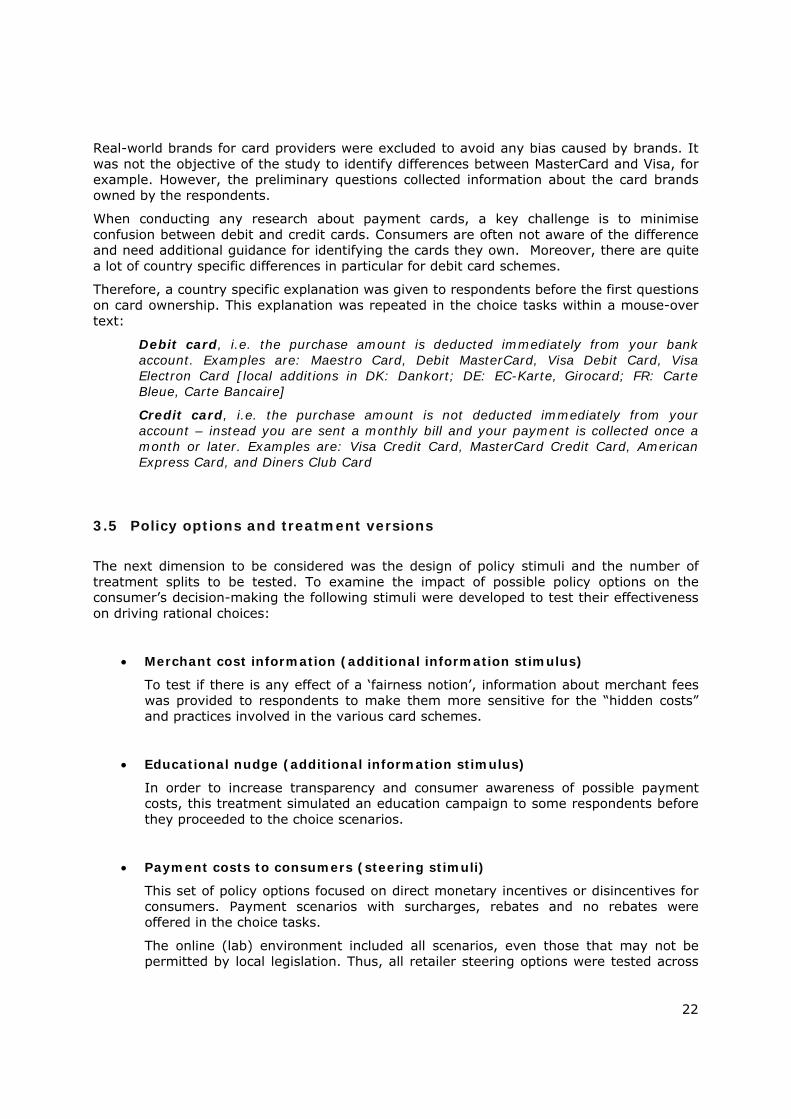
Moreover, the information on any split-relevant payment costs to consumers or merchant cost information was presented at different stages of the payment process. Thus, testing the effect of various timings, such as information given at the …
• Till only,
• Entrance and the till, or
• At the till and after check out as a receipt.
The stimuli were shown for both the online and offline scenarios, as well as for low and high purchase values. An exception was the education stimulus which was only shown once before the first choice task. An overview of the different combinations of stimuli is given in the chart below.
Table 4
24
Below, each of the policy options and stimuli is described in more detail.
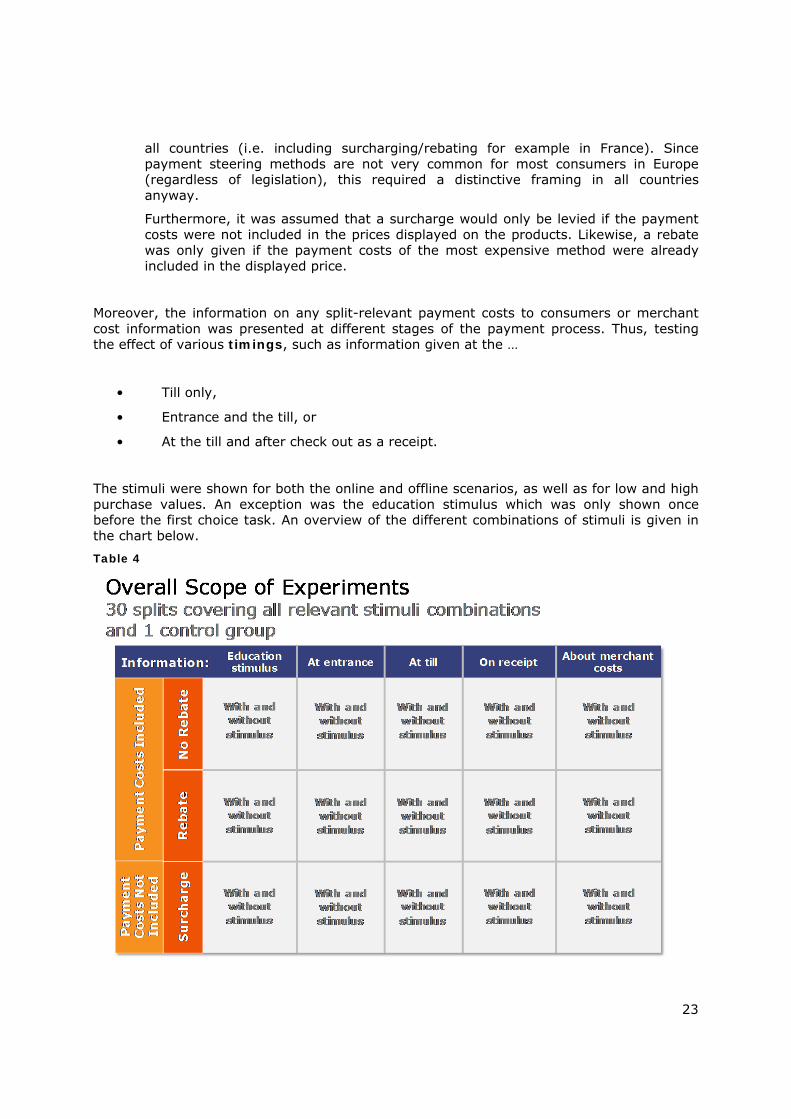
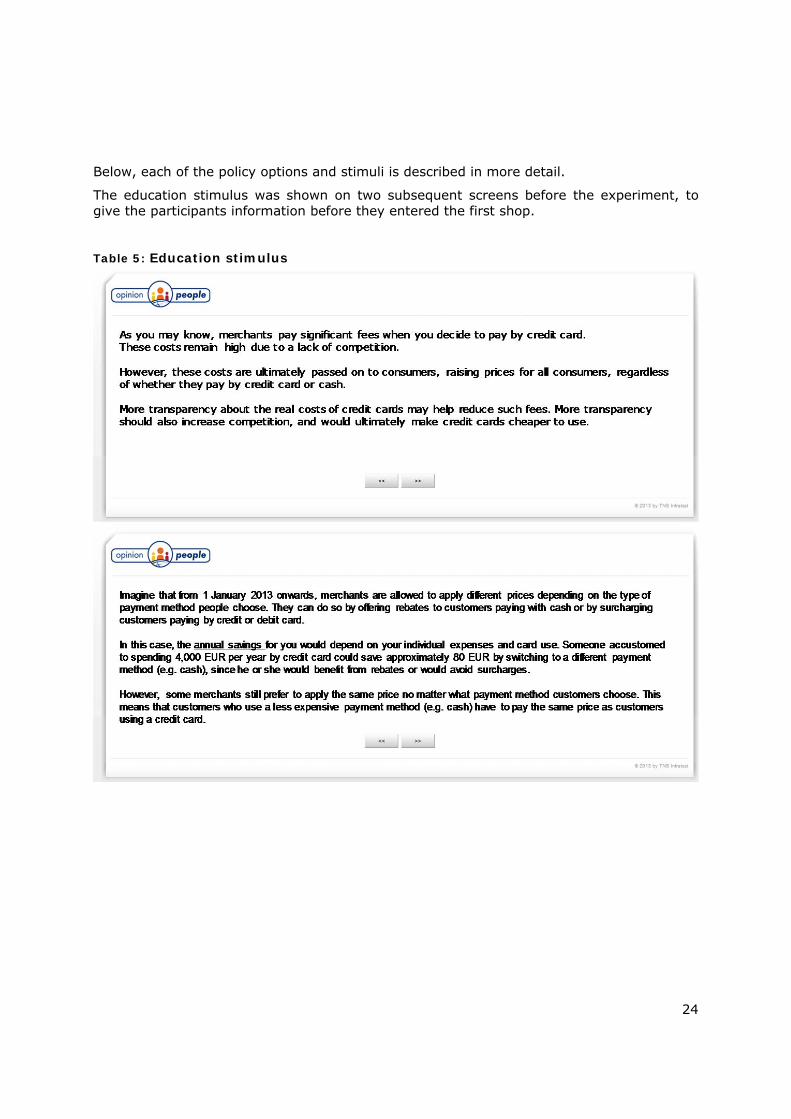
The education stimulus was shown on two subsequent screens before the experiment, to give the participants information before they entered the first shop.
Table 5: Education stimulus
25
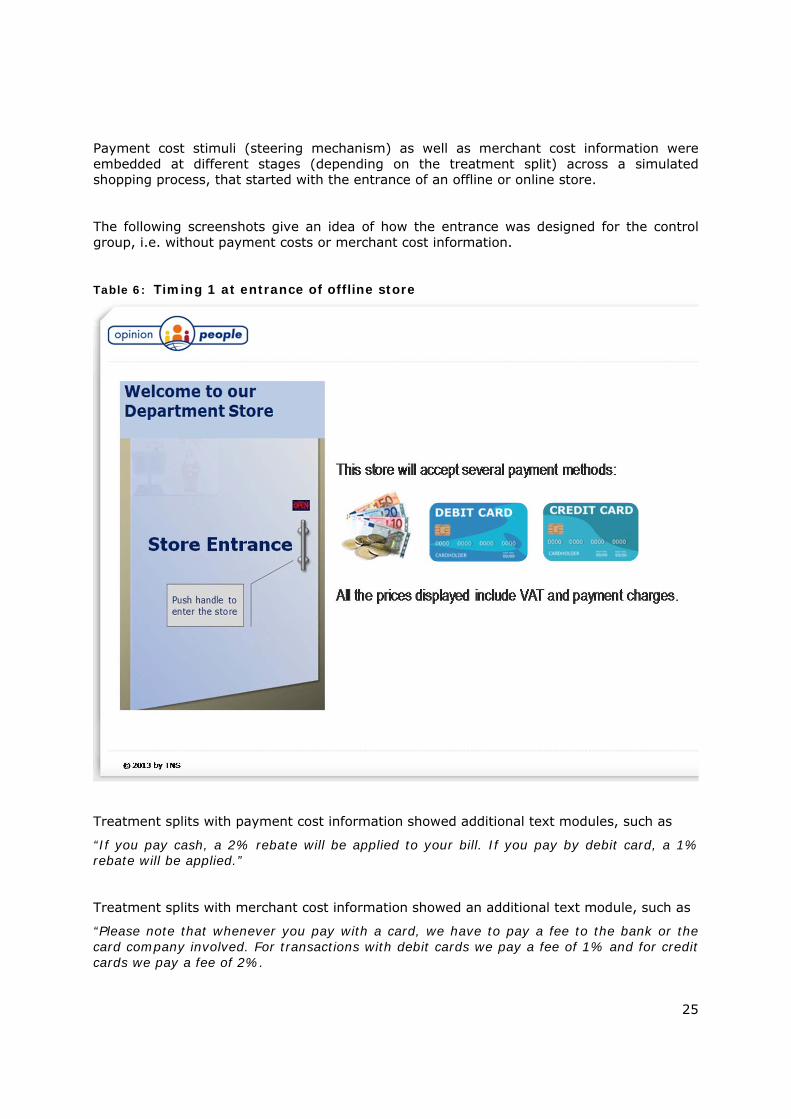
Payment cost stimuli (steering mechanism) as well as merchant cost information were embedded at different stages (depending on the treatment split) across a simulated shopping process, that started with the entrance of an offline or online store.
The following screenshots give an idea of how the entrance was designed for the control group, i.e. without payment costs or merchant cost information.
Table 6: Timing 1 at entrance of offline store
Treatment splits with payment cost information showed additional text modules, such as
“If you pay cash, a 2% rebate will be applied to your bill. If you pay by debit card, a 1% rebate will be applied.”
Treatment splits with merchant cost information showed an additional text module, such as
“Please note that whenever you pay with a card, we have to pay a fee to the bank or the card company involved. For transactions with debit cards we pay a fee of 1% and for credit cards we pay a fee of 2%.
26
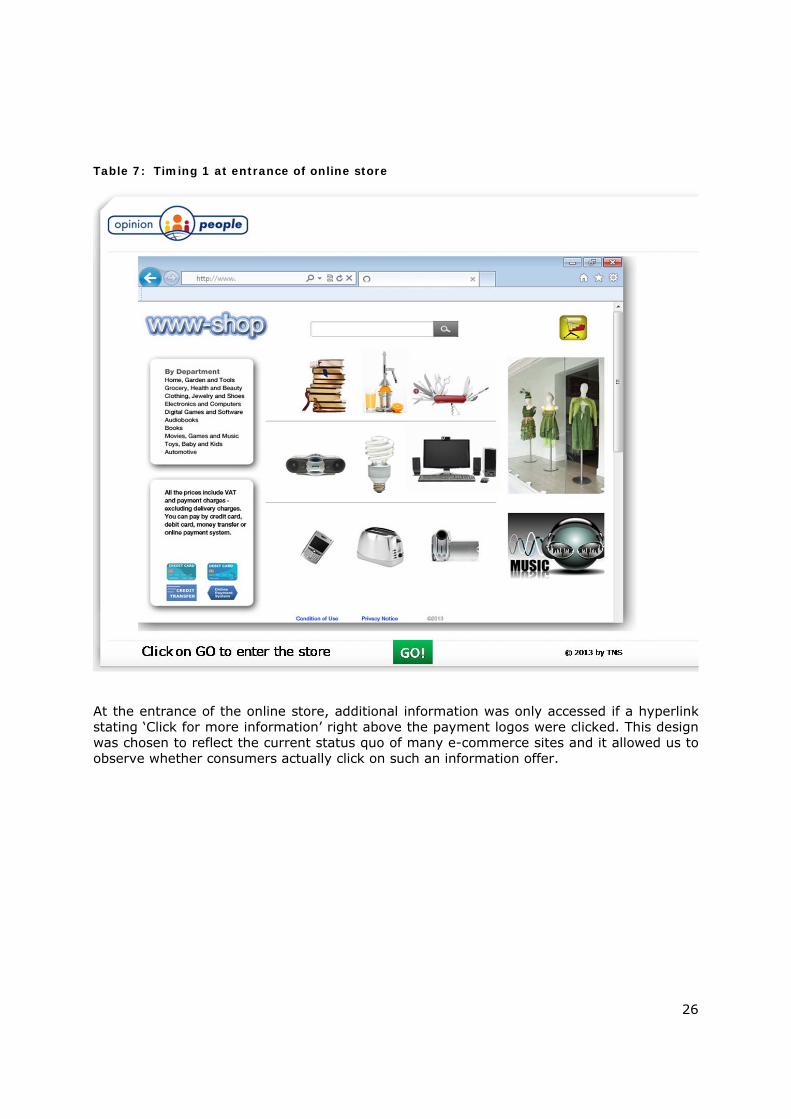
Table 7: Timing 1 at entrance of online store
At the entrance of the online store, additional information was only accessed if a hyperlink stating ‘Click for more information’ right above the payment logos were clicked. This design was chosen to reflect the current status quo of many e-commerce sites and it allowed us to observe whether consumers actually click on such an information offer.
27
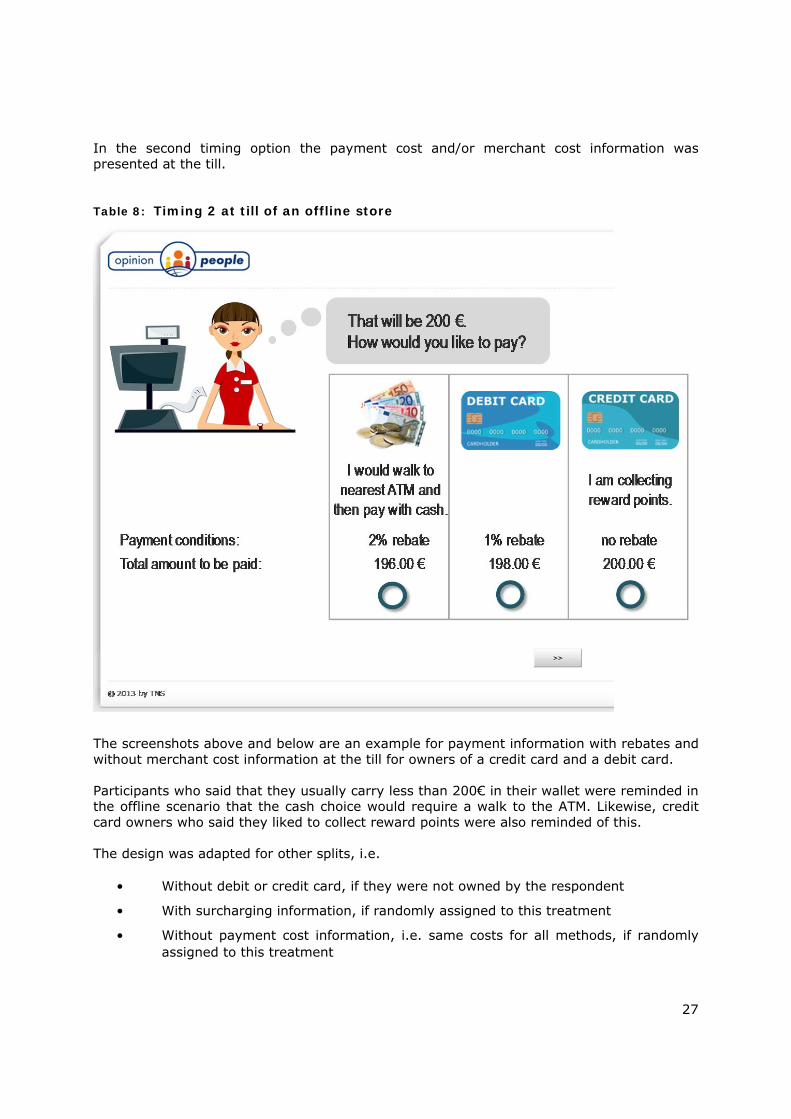
In the second timing option the payment cost and/or merchant cost information was presented at the till.
Table 8: Timing 2 at till of an offline store
The screenshots above and below are an example for payment information with rebates and without merchant cost information at the till for owners of a credit card and a debit card. Participants who said that they usually carry less than 200€ in their wallet were reminded in the offline scenario that the cash choice would require a walk to the ATM. Likewise, credit card owners who said they liked to collect reward points were also reminded of this. The design was adapted for other splits, i.e.
• Without debit or credit card, if they were not owned by the respondent
• With surcharging information, if randomly assigned to this treatment
• Without payment cost information, i.e. same costs for all methods, if randomly assigned to this treatment
28
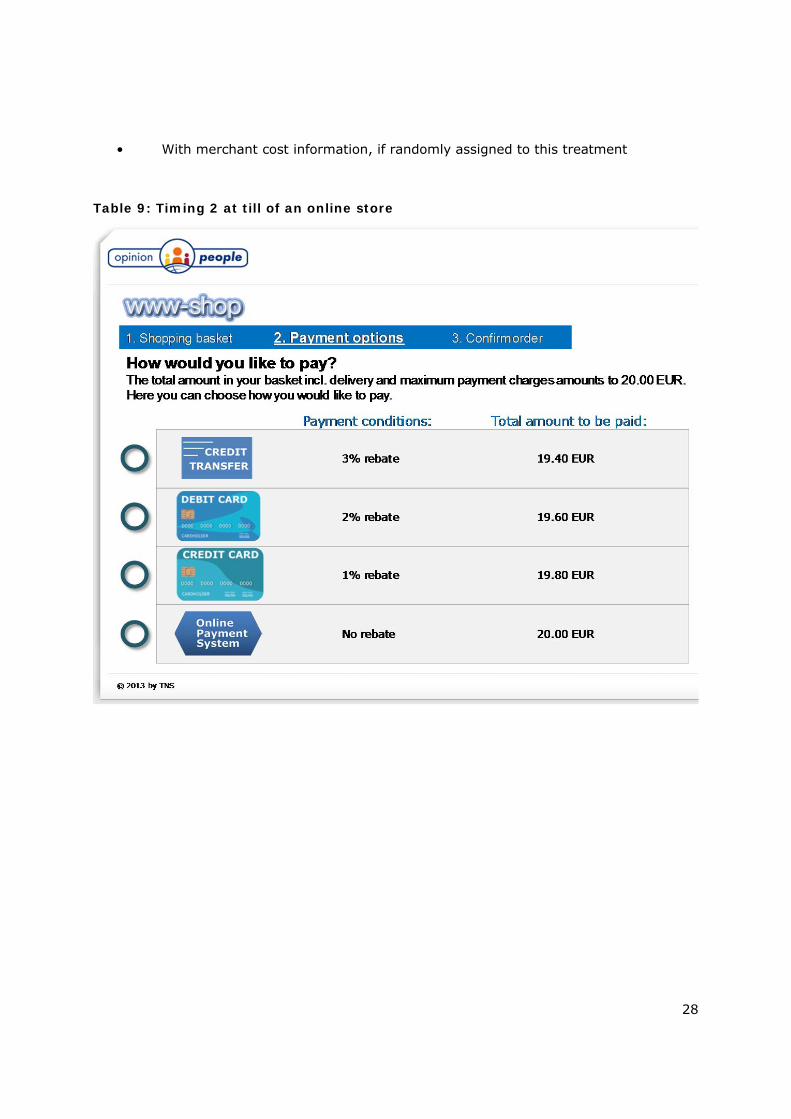
• With merchant cost information, if randomly assigned to this treatment
Table 9: Timing 2 at till of an online store
29
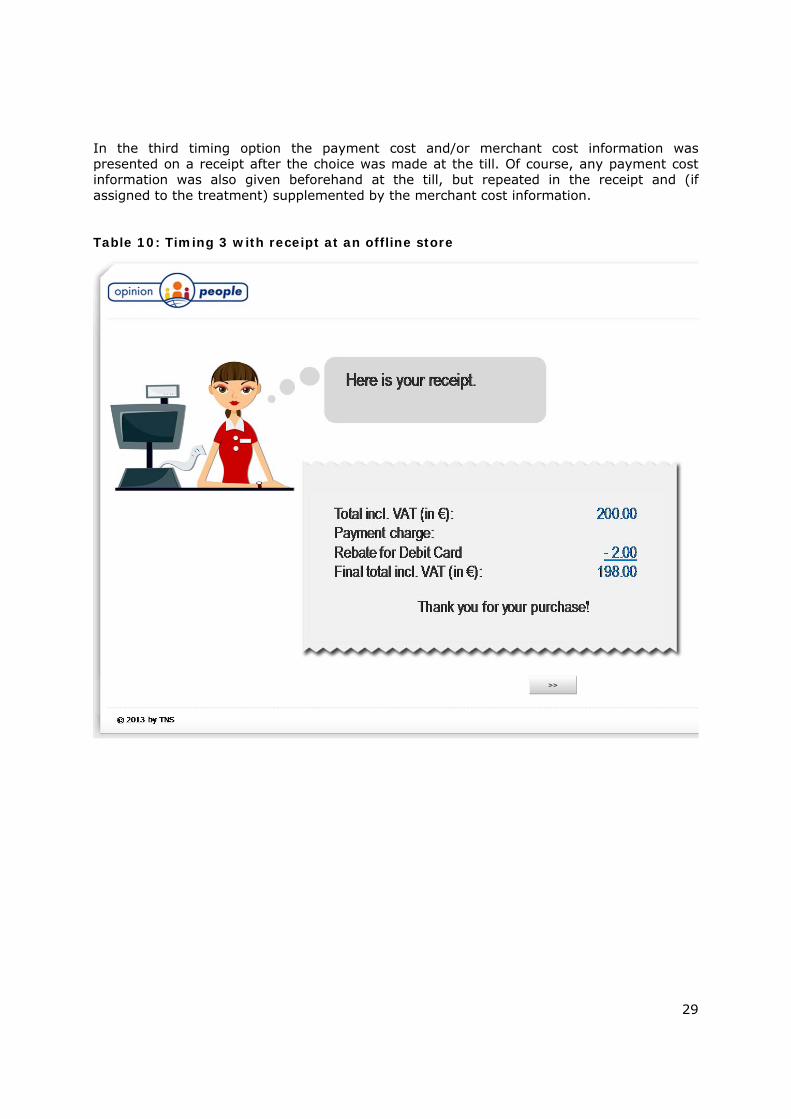
In the third timing option the payment cost and/or merchant cost information was presented on a receipt after the choice was made at the till. Of course, any payment cost information was also given beforehand at the till, but repeated in the receipt and (if assigned to the treatment) supplemented by the merchant cost information.
Table 10: Timing 3 with receipt at an offline store
30
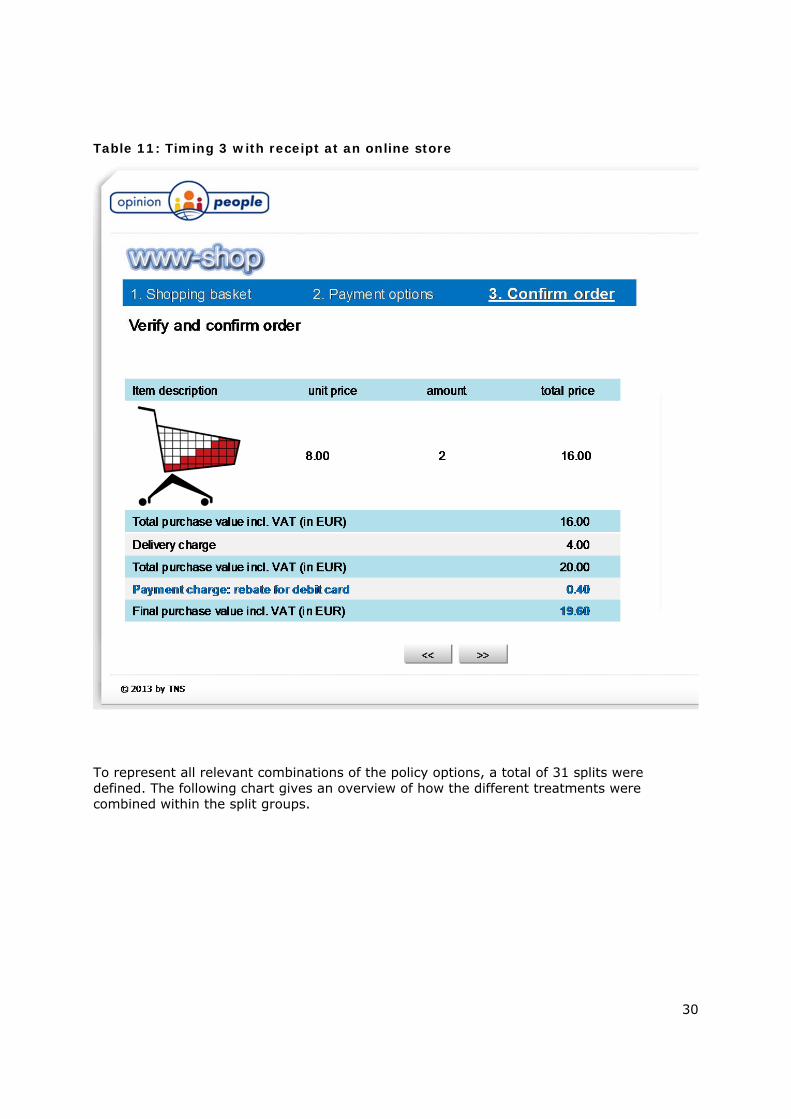
Table 11: Timing 3 with receipt at an online store
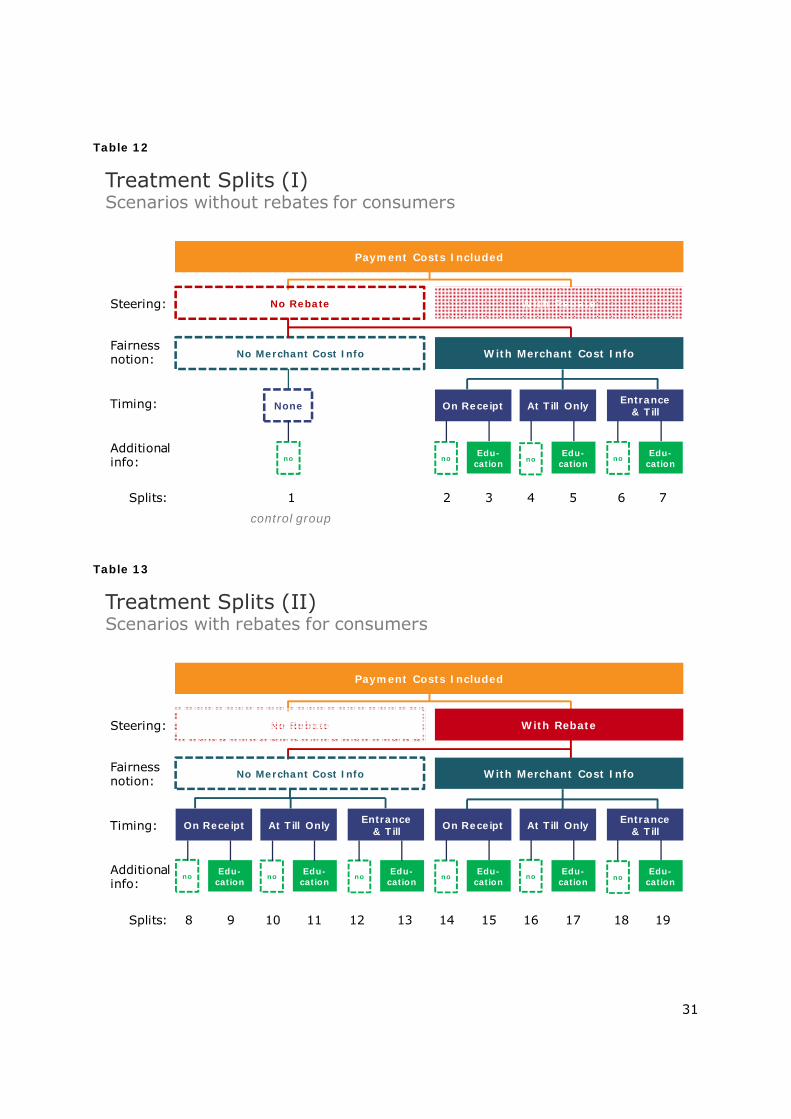
To represent all relevant combinations of the policy options, a total of 31 splits were defined. The following chart gives an overview of how the different treatments were combined within the split groups.
31
Table 12
Table 13
Payment Costs Included
No Rebate With Rebate
No Merchant Cost Info With Merchant Cost Info
Entrance & TillAt Till OnlyOn Receipt
Edu-cation
Edu-cation
Edu-cation
Splits: 1 2 3 4 5 6 7
None
no no nono
Timing:
Fairness notion:
Steering:
Additional info:
control group
Treatment Splits (I)Scenarios without rebates for consumers
Payment Costs Included
No Rebate With Rebate
No Merchant Cost Info With Merchant Cost Info
Entrance & TillAt Till OnlyOn ReceiptEntrance
& TillAt Till OnlyOn Receipt
Edu-cation
Edu-cation
Edu-cation
Edu-cation
Edu-cation
Edu-cation
Splits: 8 9 10 11 12 13 14 15 16 17 18 19
no no no no no no
Timing:
Fairness notion:
Steering:
Additional info:
Treatment Splits (II)Scenarios with rebates for consumers
32
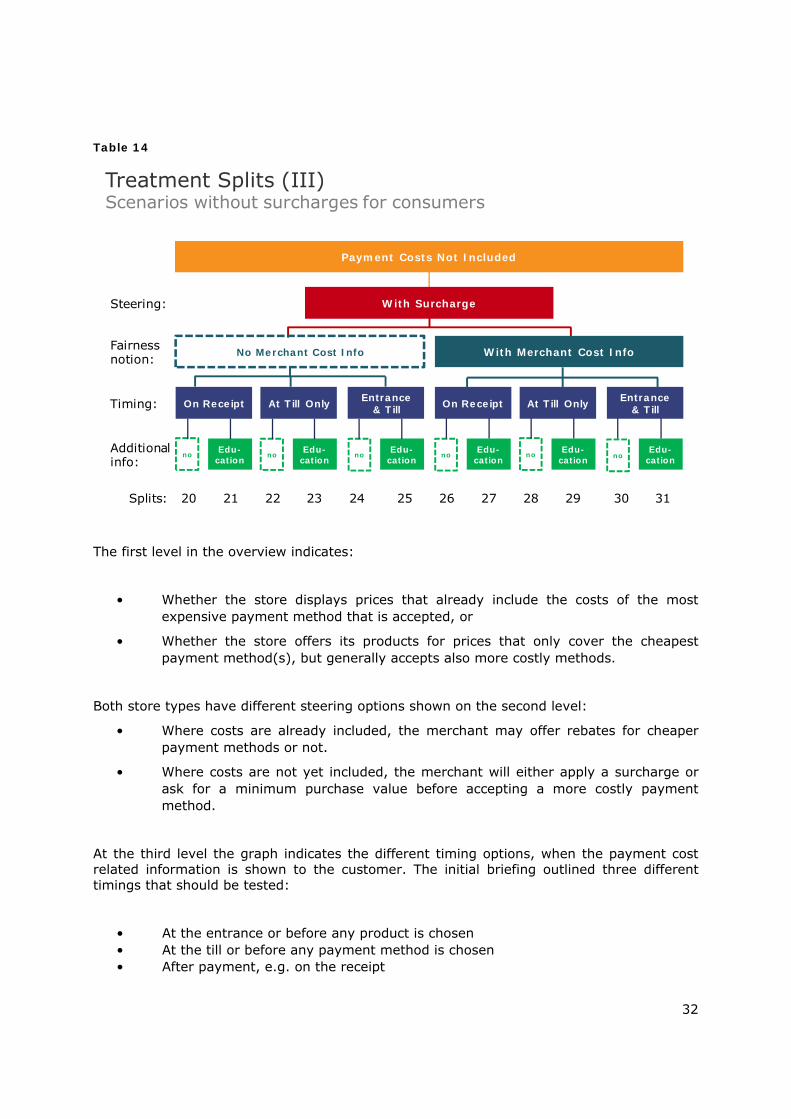
Table 14
The first level in the overview indicates:
• Whether the store displays prices that already include the costs of the most expensive payment method that is accepted, or
• Whether the store offers its products for prices that only cover the cheapest payment method(s), but generally accepts also more costly methods.
Both store types have different steering options shown on the second level:
• Where costs are already included, the merchant may offer rebates for cheaper payment methods or not.
• Where costs are not yet included, the merchant will either apply a surcharge or ask for a minimum purchase value before accepting a more costly payment method.
At the third level the graph indicates the different timing options, when the payment cost related information is shown to the customer. The initial briefing outlined three different timings that should be tested:
• At the entrance or before any product is chosen • At the till or before any payment method is chosen • After payment, e.g. on the receipt
Payment Costs Not Included
With Surcharge
No Merchant Cost Info With Merchant Cost Info
Entrance & TillAt Till OnlyOn ReceiptEntrance
& TillAt Till OnlyOn Receipt
Edu-cation
Edu-cation
Edu-cation
Edu-cation
Edu-cation
Edu-cation
Splits: 20 21 22 23 24 25 26 27 28 29 30 31
no no no no no no
Timing:
Fairness notion:
Steering:
Additional info:
Treatment Splits (III)Scenarios without surcharges for consumers
33
While the information given at the till might be expected to have the highest impact on the immediate consumer choice of payment methods, any information given after the payment can only influence subsequent purchase decisions and in some cases may lead to a cancellation of the current purchase. The disclosure of merchants’ payment costs after the payment was therefore included, but relevant costs to consumers (rebate/surcharge) were shown at the till at the latest.
Moreover, the information given at the entrance of a shop cannot replace having the information at the till, in case the customer doesn’t notice it. If this information is noticed at the entrance and found to be relevant, then this may lead to the consumer not proceeding into the shop at all or shopping for different amounts and type of products. These reactions on the information at a store entrance are best captured by a real field experiment, where interviewers can observe the behaviour in a realistic scenario. For an online lab experiment, it was not feasible within the time available to create a mock-up e-commerce portal with different shops and to simulate a shopping scenario from the selection of different shops and choosing different products until the final payment.
Therefore, the chosen test design will allow the observation of different time scenarios with different pieces of information including the entrance. However, it does not capture realistic reactions on whether shoppers would refuse to enter a store or whether they would cancel a purchase based on the information given at the entrance or provided on a receipt.
The fourth level of the test scenarios indicates whether any education treatment will be presented to give respondents a more detailed idea of payment costs related to credit cards.
To illustrate the robustness of the sample despite the large number of treatment splits – this is a short overview of the experimental sample design in numbers:
• The total sample covers 10 countries with overall 10,041 respondents.
• The participants were randomly assigned to one of the 31 splits with the objective to reach an equal distribution of around 324 per treatment split.
• The final sample spread across the different treatment versions ranges between 315 and 329 respondents, which serves as a sufficient sample base for statistical analysis.
3.6 Choice tasks and choice characteristics
The choice tasks were conducted after the pre-experiment questions and the introduction to the experiments. In the introduction there was an explanation of what to focus on and that there was a chance to receive an additional incentive from completing the questionnaire.
34
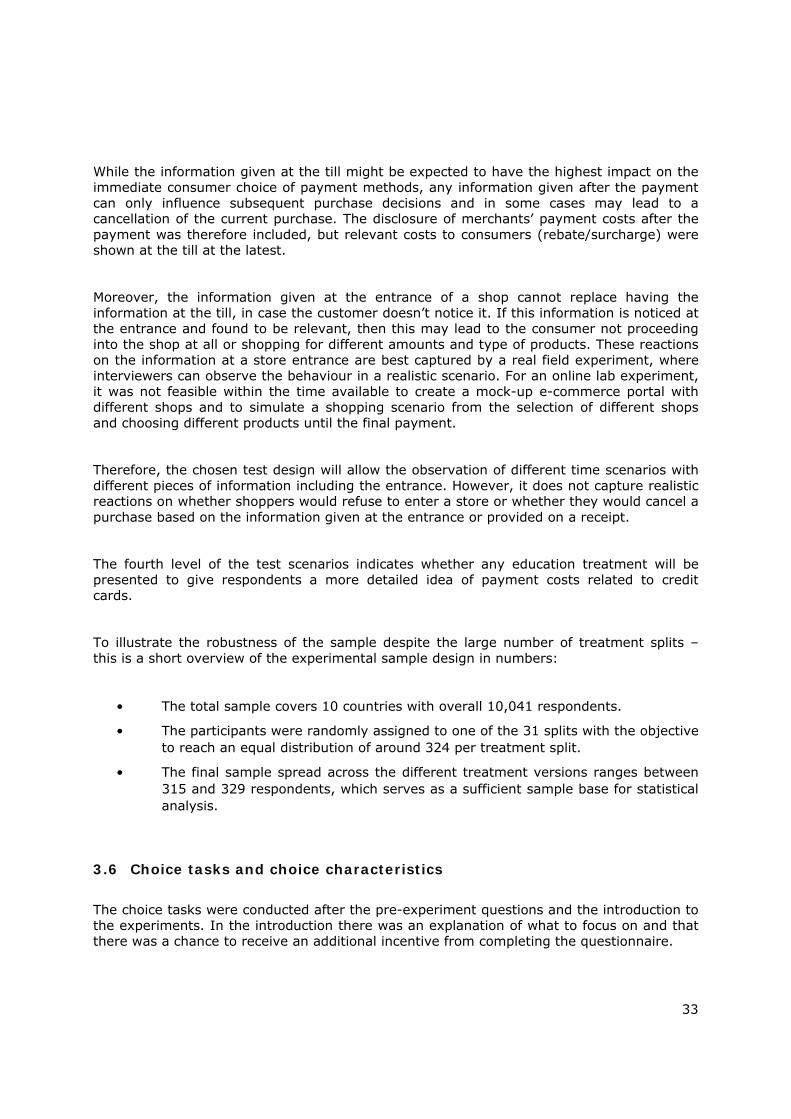
Table 15
The chart above shows the sequence of stimuli and choice tasks for the respondents. Generally speaking, each respondent went through a maximum of four choice scenarios:
1. Offline and small value,
2. Offline and high value,
3. Online and small value,
4. Online and high value.
Participants who had answered the question about their online shopping behaviour with “I never shop online” were not presented the two online choices. That means that the results of the online choice tasks are available for a slightly smaller number of respondents: due to the high incidence of online shoppers, the statistical base was only reduced by 684 respondents across the ten countries.
Questionnaire flow for respondents
Core experimentsPre-experiment questions
Post-experiment questions
– Screener with card ownership
– Payment habits incl. average amount of cash in wallet and card reward schemes
– Images of payment methods
– Awareness of payment costs
– Shopping type
– Evaluation of choice exercise
– Recall of treatment details & choice rationale
– Steering experience and stated preferences
– General attitudes and beliefs
– Demographics
If e
xper
ienc
ein
onl
ine
shop
ping
Intro to experiments
Education stimulus
Entrance info offline store
Shopping
Till info 20 €1st choice
Receipt info
Intro high value / recall of habits
Intro online scenario
Entrance info online store
Shopping
Till info 20 €3rd choice
Receipt info
Intro high value / recall of habits
Basket
Receipt info
Basket
Receipt info
Till info 200 €2nd choice Till info 200 €
4th choice
35
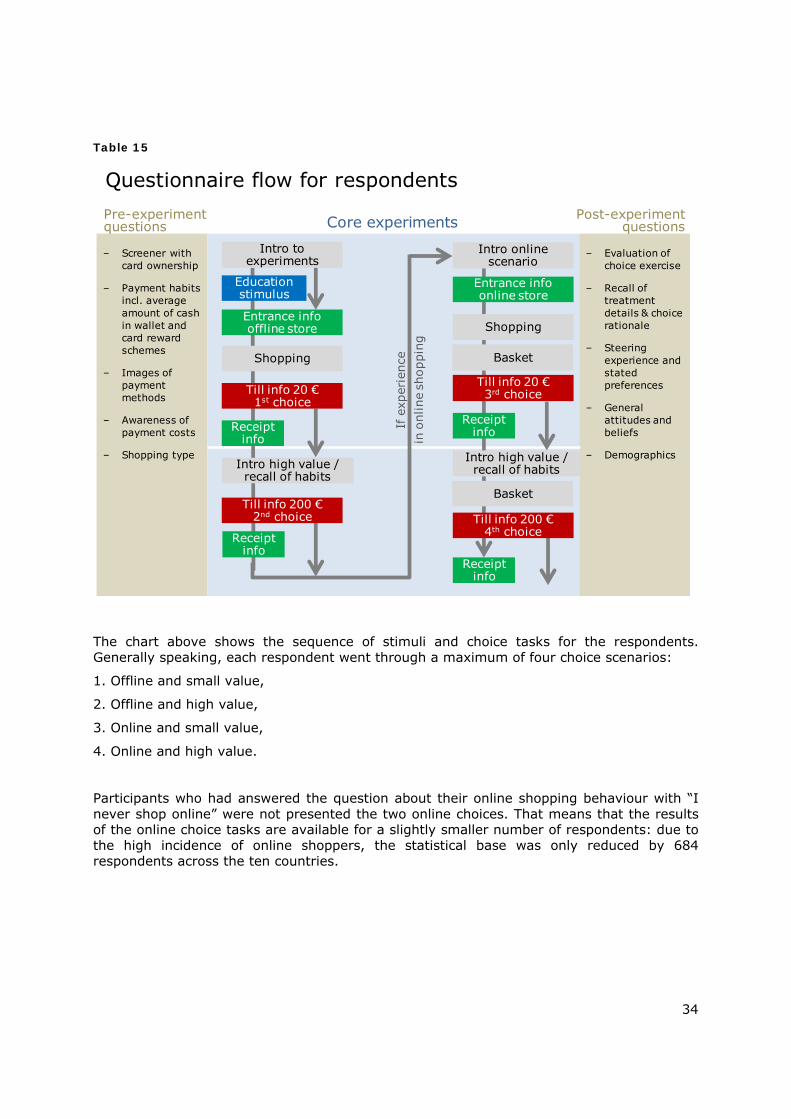
Table 16: Total number of participants in the offline and online experiments
Both offline and online choice tasks do, of course, represent hypothetical and therefore “virtual” experimental tasks, but to achieve a maximum of ecological validity13 the alternatives were presented in as realistic a way as possible.
Offline small purchase amount (Choice 1)
In the first scenario the consumer had to decide how to pay for an amount of 20 EUR. The amount was converted into the matching currencies for Denmark (krones), Poland (zloty), and the United Kingdom (sterling). Disposable income figures from EUROSTAT were also examined to adjust the amount in Poland and Slovenia.
The participants were able to choose between cash, debit card (if owned) and credit card (if owned). He or she was asked: “That will be 20 Euros. How would you like to pay?” As described in the previous Chapter, the choice was embedded into different stimuli, depending on the split group.
13 The ecological validity of a study means that it must approximate the real-world as closely as possible.
Country Offline Online
UK 1 006 992
France 1 001 955
Germany 1 003 983
Italy 1 013 939
Spain 1 003 930
Netherlands 1 005 944
Denmark 1 005 979
Finland 1 004 944
Poland 1 001 936
Slovenia 1 000 755
SUM 10 041 9 357

36
The characteristics of the payment cost information were defined as follows:
Table 17
Offline rebating Steering Small value in €
High value in € Offline surcharging
Rebate for cash -2% 19.60 196.00 Rebate for debit card -1% 19.80 198.00
No rebate for credit card 0% 20.00 200.00 No surcharge for cash 1% 20.20 202.00 Surcharge for debit card 2% 20.40 204.00 Surcharge for credit card
The steering levels were based on the upper levels of published MIFs for debit and credit cards14.
In reality, the range of payment costs varies from merchant to merchant depending on size, sector, country, as well as the negotiating power it may have with the relevant suppliers. The study does not claim that the cost levels for offline payments shown above (as well as below for online payments) reflect the situation for all merchants or transactions.
Offline high purchase amount (Choice 2)
The difference of the first choice task to the second was
a) The higher purchase amount of €200,
b) A reminder of the average amount of cash normally carried, i.e. if someone said before that they typically carried less than €200, then the cash option was only offered with the condition of walking to the next ATM15,
c) A reminder of the stated relevance of collecting reward points on credit card schemes was added16.
Online low purchase amount (Choice 3)
The third choice which had to be made was in an online store “www-shop” again with a low purchase amount of €20. However the payment methods differed. The respondents were able to choose between credit transfer, debit card (if owned), credit card (if owned), or online payment system. The payment cost information was defined as follows:
14 Based on the assumption that non-published MIFs are likely to be higher (European Central Bank,
Interchange fees in card payments, occasional papers series, no 131, 2011) 15 In this scenario the participants who said that they normally do not carry more than €200 in their wallet and
wanted to choose cash got the following note: “I would walk to nearest ATM and then pay with cash”. The respondents who stated that they normally have this amount in their wallet got the note “I usually have this amount of cash in my wallet”.
16 Respondents who said at the beginning that collecting reward points is “extremely/very/quite/slightly” important to them got the note: “I am collecting reward points.” Respondents who either said that “collecting reward points is not important at all to me” or “my credit card does not have a rewards scheme” were presented the note: “I am not collecting reward points.”
37
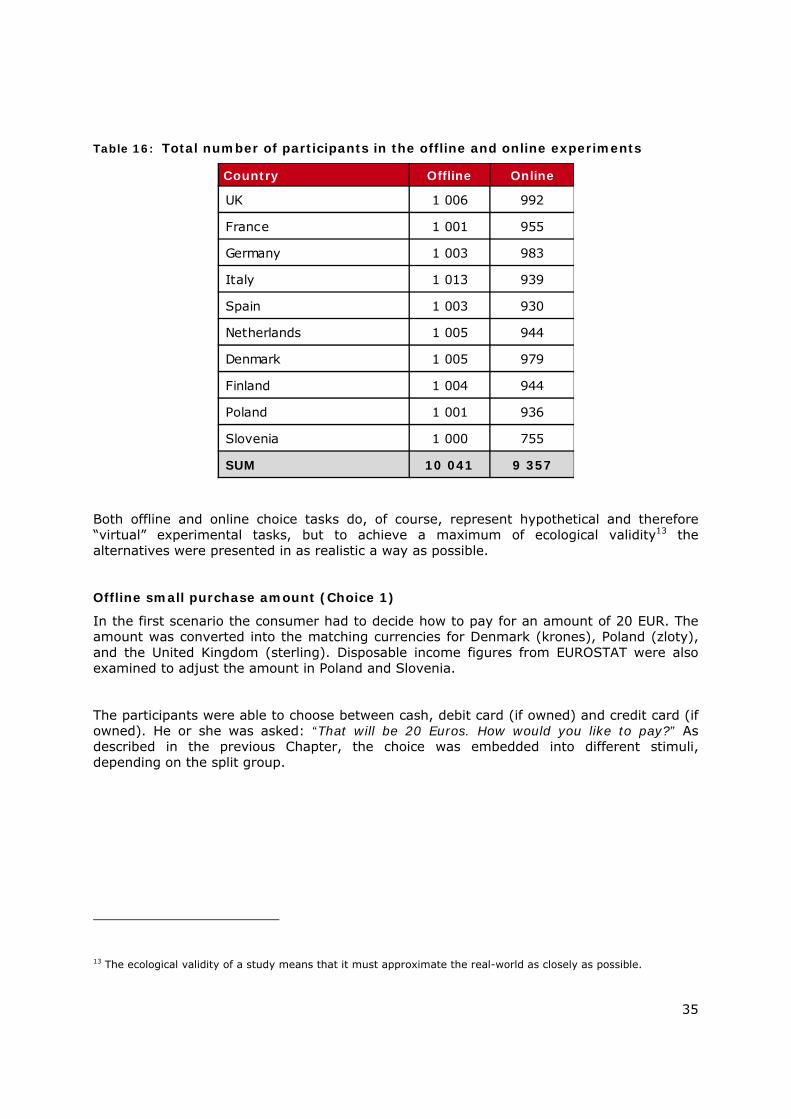
Table 18
Online rebating Steering Small value in €
High value in € Online surcharging
Rebate for credit transfer -3% 19.40 194.00 Rebate for debit card -2% 19.60 196.00 Rebate for credit card -1% 19.80 198.00 No rebate for online
payment system (OPS) 0% 20.00 200.00 No surcharge for credit transfer
1% 20.20 202.00 Surcharge for debit card 2% 20.40 204.00 Surcharge for credit card 3% 20.60 206.00 Surcharge for OPS
The steering levels were adjusted only slightly. As credit transfers normally do not involve any payment costs, this method was used to replace cash in the online scenarios. Debit and credit card received the same charge levels as offline, whereas the online payment system represents the most expensive option17.
Online high purchase amount (Choice 4)
The fourth and last choice which had to be made was again in an online context with a high purchase amount. The amount was the same as in the offline high purchase scenario (€200). There were no additional reminders like in the offline scenario. The payment methods were the same as in the small value purchase before.
17 In reality, online payment systems such as PayPal do not charge consumers, but merchants offering this
payment method. In many cases, these charges are higher than for credit cards because the service often runs via credit card registration and does not only cover the transaction itself but also often includes convenience and security features of the online gateway service. In addition, PayPal offers different categories of service including both free and fee-based (e.g. subscribing to ESCROW where funds are only released once the customer has received the merchandise.
38
4 Consumer payment decision process
4.1 Guideline for analysis of results
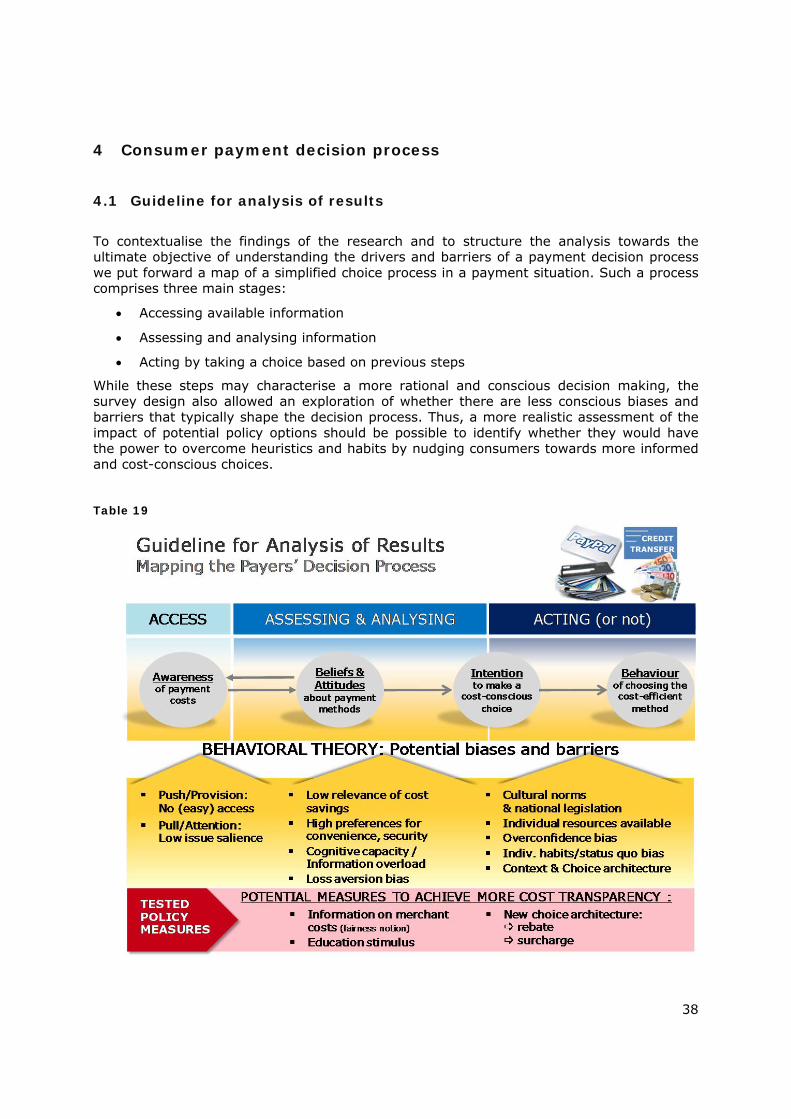
To contextualise the findings of the research and to structure the analysis towards the ultimate objective of understanding the drivers and barriers of a payment decision process we put forward a map of a simplified choice process in a payment situation. Such a process comprises three main stages:
Accessing available information
Assessing and analysing information
Acting by taking a choice based on previous steps
While these steps may characterise a more rational and conscious decision making, the survey design also allowed an exploration of whether there are less conscious biases and barriers that typically shape the decision process. Thus, a more realistic assessment of the impact of potential policy options should be possible to identify whether they would have the power to overcome heuristics and habits by nudging consumers towards more informed and cost-conscious choices.
Table 19
39
Of course, any online survey design is restricted in terms of capturing all of the relevant parameters for a real world design. However, most of the parameters listed in the overview were included in the study.
The policy measures – as described earlier – are not easily assigned to one of the three main stages of a decision process. In fact each individual stimulus more or less follows the theoretical order of accessing, analysing and acting. Any communication from education to persuasion will be more geared towards influencing awareness and beliefs and attitudes for a more sustainable and conscious behaviour change, which may not be seen immediately but over time. Changes in the choice architecture are known to have a more direct impact at the decision stage by overcoming status quo bias, i.e. more unconscious habits. Therefore, the hypothesis is that steering methods can be expected to show a more immediate effect as compared to pure information stimuli.
The subsequent analysis and description of survey findings will start off with the current awareness of payment costs among payment card holders (4.2) and will particularly explore existing knowledge gaps.
This is followed by looking at the relevant range of beliefs and attitudes (4.3) including not only direct questions on the relevance of choice parameters but also whether the cognitive capacity of the average consumer is sufficient to understand and recall the issues or whether the information provided was actually too much to process.
Chapter 4.4 outlines the current payment habits from card ownership to the frequency of usage of various payment methods. The usage behaviour can be primarily described as individual habits. However, there are some country biases observable, which can be caused by national legislation or cultural norms and traditions.
Previous experience with steering methods – as described in Chapter 4.5 – adds useful background information on explaining individual habits and cultural norms. It is complemented by an exploration of stated consumer acceptance of the proposed steering methods and timing of information, collected as stated preferences after the experiments. This overview of the survey finding introduces the subsequent analysis of the observed choice behaviour in the experiments that are introduced finally in Chapter 5.
40
4.2 Awareness of payment costs
4.2.1 Limited awareness of payment costs
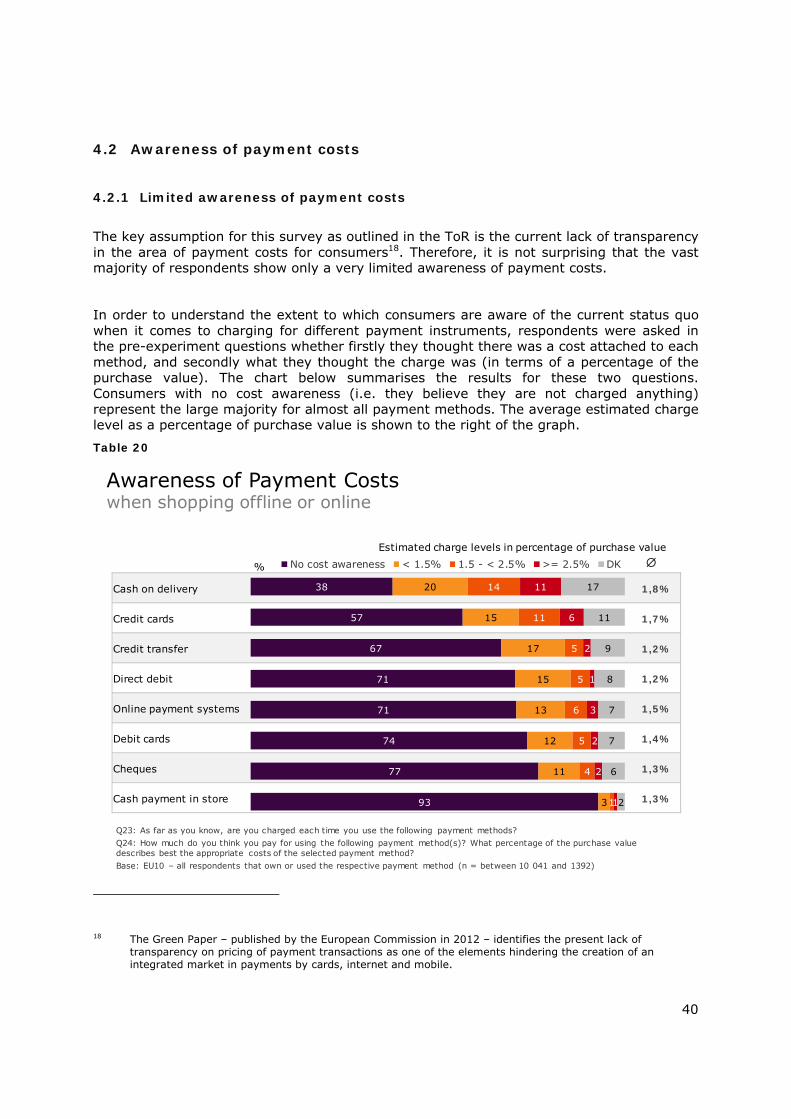
The key assumption for this survey as outlined in the ToR is the current lack of transparency in the area of payment costs for consumers18. Therefore, it is not surprising that the vast majority of respondents show only a very limited awareness of payment costs.
In order to understand the extent to which consumers are aware of the current status quo when it comes to charging for different payment instruments, respondents were asked in the pre-experiment questions whether firstly they thought there was a cost attached to each method, and secondly what they thought the charge was (in terms of a percentage of the purchase value). The chart below summarises the results for these two questions. Consumers with no cost awareness (i.e. they believe they are not charged anything) represent the large majority for almost all payment methods. The average estimated charge level as a percentage of purchase value is shown to the right of the graph.
Table 20
18 The Green Paper – published by the European Commission in 2012 – identifies the present lack of
transparency on pricing of payment transactions as one of the elements hindering the creation of an integrated market in payments by cards, internet and mobile.
Cash on delivery 1,8%
Credit cards 1,7%
Credit transfer 1,2%
Direct debit 1,2%
Online payment systems 1,5%
Debit cards 1,4%
Cheques 1,3%
Cash payment in store 1,3%
38
57
67
71
71
74
77
93
20
15
17
15
13
12
11
3
14
11
5
5
6
5
4
1
11
6
2
1
3
2
2
1
17
11
9
8
7
7
6
2
% No cost awareness < 1.5% 1.5 - < 2.5% >= 2.5% DK Estimated charge levels in percentage of purchase value
Awareness of Payment Costswhen shopping offline or online
Q23: As far as you know, are you charged each time you use the following payment methods? Q24: How much do you think you pay for using the following payment method(s)? What percentage of the purchase value describes best the appropriate costs of the selected payment method? Base: EU10 – all respondents that own or used the respective payment method (n = between 10 041 and 1392)
41
While awareness varies by payment instrument, in general there is (very) limited awareness of the charges that are levied. Costs are more likely to be attached with cash on delivery and credit cards, although even here the majority of respondents either did not know or thought there was no cost attached.
A large majority of consumers did not think they were charged for each of the other payment methods. This was particularly true for paying by cash where over nine in ten respondents thought there was no charge. While this is technically correct, in that MIF charges clearly do not apply to cash payments, the fact that many cash payments are higher in order to subsidise payment by other means is also not recognised by consumers.
Where respondents were aware that charges were applied, on average they estimated the charge to be approximately between 1-2%, with higher estimates for cash on delivery and credit cards19.
However the key finding of the data is that the vast majority of card owners have no idea that they are charged each time they choose a certain payment method. Only where consumers have experience or expectations of “visible” charges per transaction, such as for cash on delivery, there is a sizable awareness of additional costs in addition to the value of the purchase itself (e.g. delivery charges).
4.2.2 Knowledge gaps and misunderstandings on payment costs
Lack of transparency does not only cause knowledge gaps but also misunderstandings which may result in low attention or issue salience, once any cost information is presented.
The quantification of real knowledge gaps is not always straightforward, since it is at times difficult to distinguish in an online survey between answers based on vague guesses or misunderstandings or answers that are randomly correct. However, if we neglect the latter bias as something happening only rarely and combine the first two biases which present a barrier for accessing relevant cost information, some useful insights can be observed.
When focussing on the cost awareness of credit cards again, the first question “As far as you know are you charged each time you use the following payment methods?” was answered by only 0.3% with “Don’t know” (although offered as an equal answer option to yes or no). There seems to be no conscious knowledge gap from the respondents’ point of view.
19 When asking about the charge levels, this was not presented as an open question, but six categories were
offered from under 1% to more than 3%. The rationale for this design was the assumption that the majority of consumers will have no concrete information about MIF levels or other payment charges unless they have personal experience as a merchant.
42
However, there are 57% of credit card holders who are not aware of any payment costs. This gap increases further by adding the 11% of card holders who are aware of costs but have no idea about cost levels. Altogether the knowledge gap on credit card charges amounts to at least two thirds of card holders (68% minimum), if one assumes that the remaining share is not randomly guessed correct cost levels.
To conclude the findings in this Chapter:
There is a significant lack of cost transparency among card holders in Europe.
There are huge knowledge gaps on the fact of payment costs as well as on cost levels.
As a result of this knowledge gap, answers on cost awareness questions tend to be based on cost images and misunderstandings than actual cost knowledge.
Cost image is strongly related to the general evaluation of the payment method, i.e. perceptions of high cost tend to relate to negative perceptions (e.g. poor ease, security).
Cost image together with the general image of the payment method drives the frequency of usage at least for credit cards.
However, we will see later in Chapter 5.3.1 that the cost awareness has no significant impact on rational choices of payment methods with or without certain policy measures.
4.3 Beliefs and attitudes
4.3.1 Consumer attitudes to payment methods
In order to understand their response to the choice task experiment, there were a series of questions following the experiment to explore respondent attitudes and beliefs regarding payment methods, and to understand the perceived relevance of the choice parameters which shape the payment decision and get a fuller understanding of the drivers of their choices in the experiment.
43
Table 21
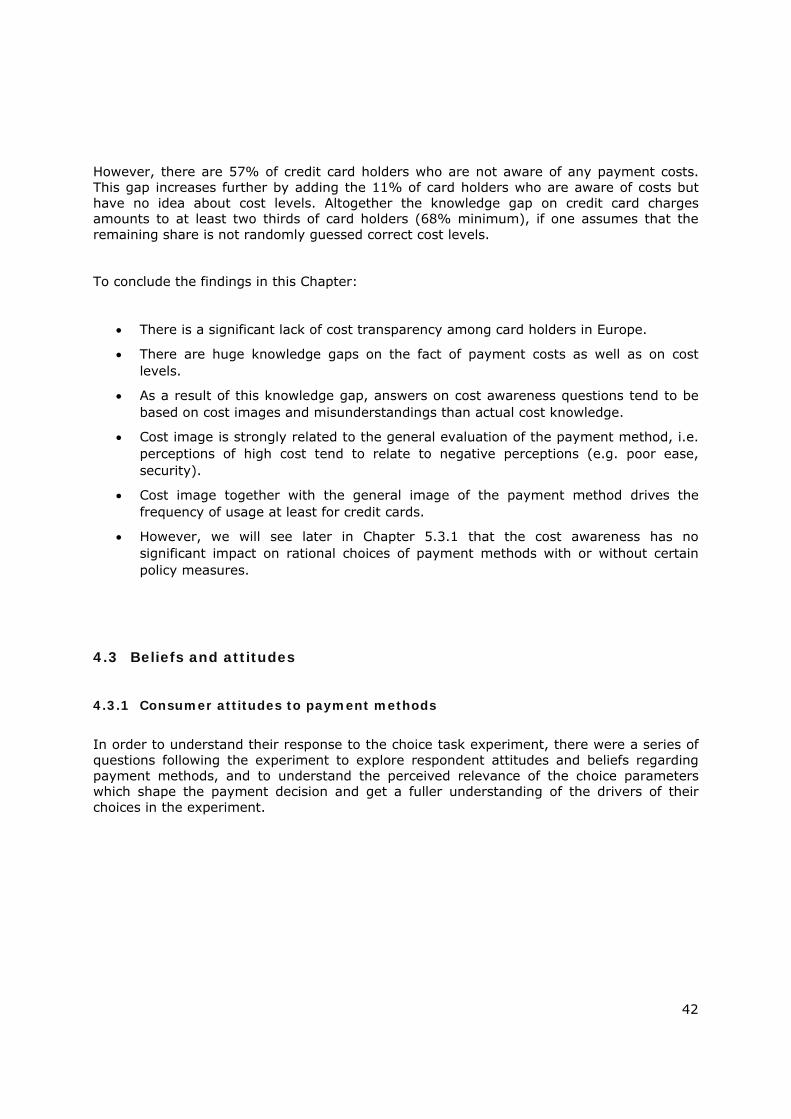
Overall there is a general preference for convenience over cost. Given the low level of cost awareness and the low transparency seen earlier, it is not surprising to see that cost is less of a driving factor for consumers. Even so, two thirds disagree that they do not bother about costs (65%), this compares with 83% who say that the most important thing is that a payment method is quick and easy.
Heavy credit card users were more likely to favour convenience over cost while older respondents (over 35) were more likely to be cost-conscious than younger respondents who were more likely to prioritise speed. Respondents in UK, France and the Netherlands were most likely to prioritise convenience (around nine in ten respondents in each country).
Respondents were then asked to prioritise the different payment methods they use in terms of their relative cost and ease. By correlating the responses, the relative cost and ease of each payment method are mapped on the chart below.
It is most important to me that a payment method is quick and easy. 84%
I generally do not bother about the costsof the different payment methods. 65%
34
7
50
27
14
36
3
29
%
Share of preference
Attitudes to payment methodsCosts vs. convenience
Q56 (statements 2./3.): To what extent do you agree or disagree with each of the following statements regarding payment methods? Base: EU10 – all respondents (n = 10 041)
Totally agree Tend to agreeTend to disagree
Totally disagree
44
Table 22
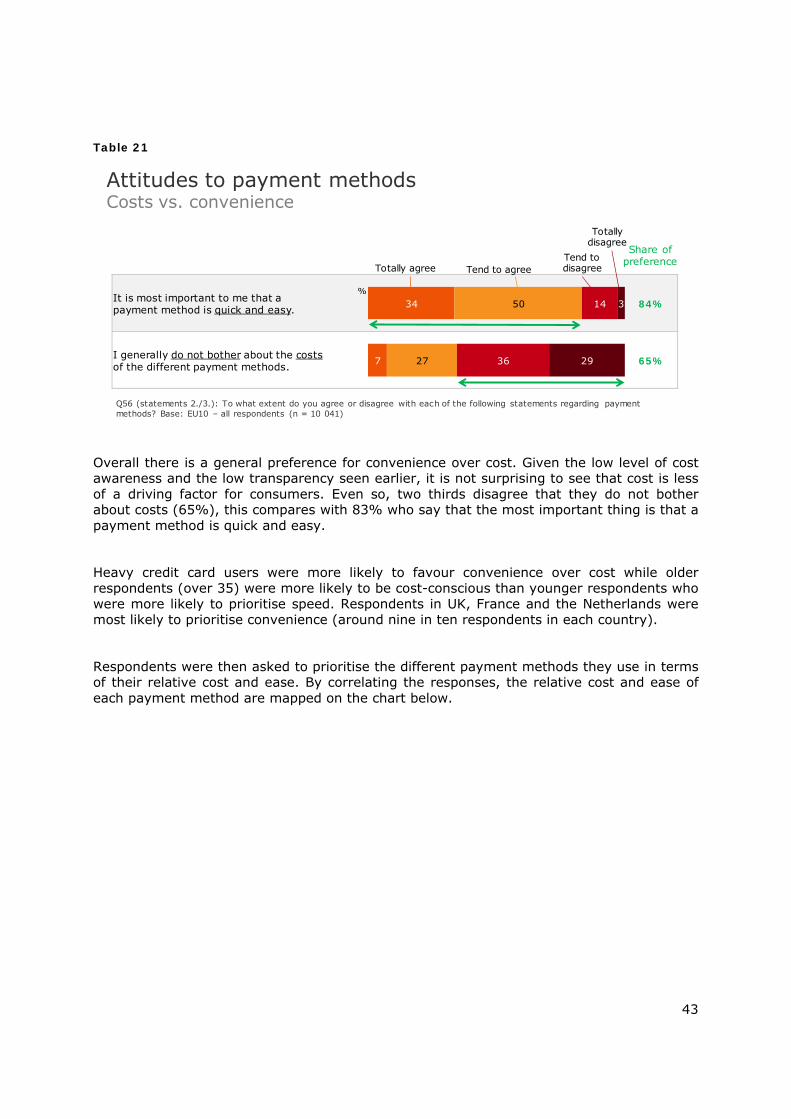
The main thing to note is the overlap between the different instruments on this matrix, indicating a lack of major consumer differentiation between most payment methods in terms of the criteria of cost and convenience, with the exception of credit transfers which are more notably behind in terms of convenience.
The overlap across the different payment methods again reflects the lack of consumer awareness of the real costs attached to difference payment methods. While cash payments are seen as the least costly, debit cards are seen as easier to use. Credit cards are widely perceived as the most expensive payment method while credit transfers are seen as relatively inexpensive, but more difficult to use than other payment methods. Online payment systems are placed somewhat in the middle both in terms of perceived cost and ease of use.
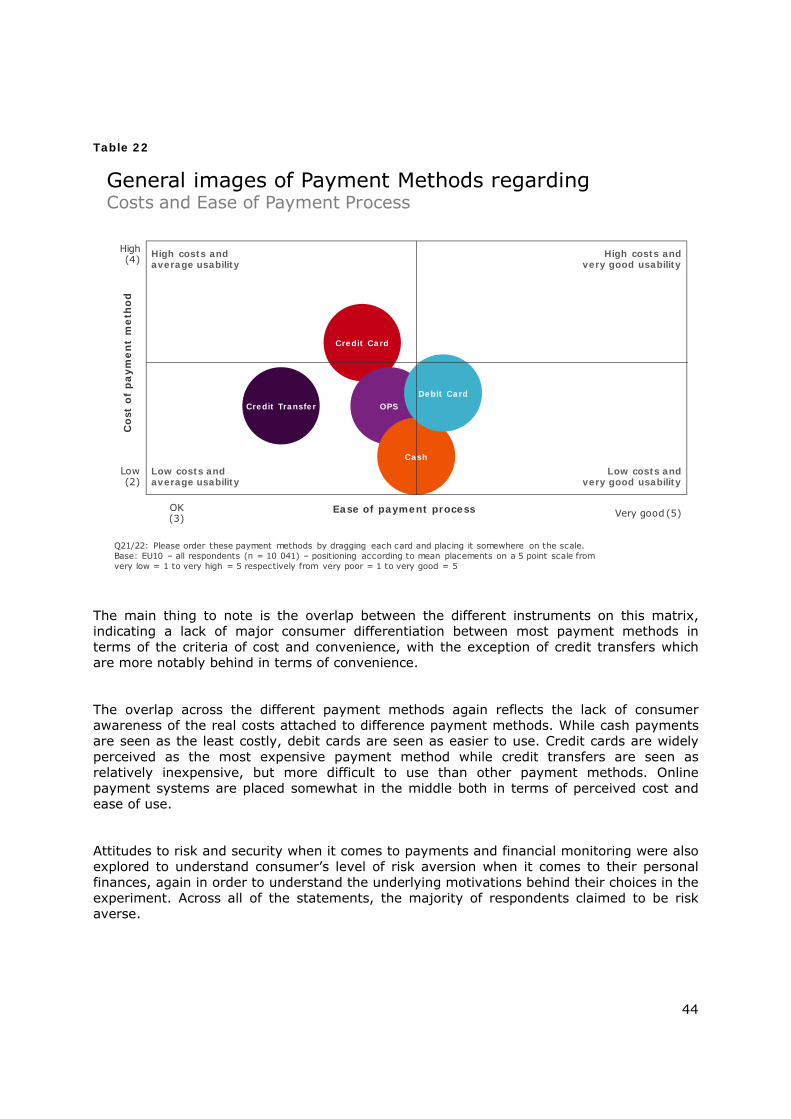
Attitudes to risk and security when it comes to payments and financial monitoring were also explored to understand consumer’s level of risk aversion when it comes to their personal finances, again in order to understand the underlying motivations behind their choices in the experiment. Across all of the statements, the majority of respondents claimed to be risk averse.
Credit Transfer
Credit Card
OPS
Cash
Debit Card
Ease of payment process
High costs andaverage usability
Low costs andaverage usability
High costs andvery good usability
Low costs andvery good usability
High(4)
Low(2)
OK (3) Very good (5)
Cos
t of
pay
men
t m
etho
d
General images of Payment Methods regarding Costs and Ease of Payment Process
Q21/22: Please order these payment methods by dragging each card and placing it somewhere on the scale. Base: EU10 – all respondents (n = 10 041) – positioning according to mean placements on a 5 point scale from very low = 1 to very high = 5 respectively from very poor = 1 to very good = 5
45
Table 23
Less than three quarters claim to closely monitor their expenditure on a daily basis, around seven in ten agree that they worry about their personal data being misused when making online payments and six in ten disagreed that they would use new payment methods such as mobile payments without having any concerns.
Respondents who did not use debit cards or credit cards online or used them infrequently, tended to be most risk averse. Income and employment status also affected how careful people were, with those on lower incomes or unemployed or retired tending to be more risk averse than those in employment or on high incomes.
Again, respondents were asked to prioritise the different payment methods they use in terms of their perceived security and their suitability for smaller purchases. The correlated responses are mapped on the chart below.
I check my expenditure daily, to keep control over my budget. 73%
When paying on the Internet I am always worried that my data could be misused. 69%
I would use new payment methods like mobile payments without any concerns. 62%
31
29
9
42
40
28
21
26
38
7
5
24
%
Share of risk averse
Attitudes to payment methodsRisk attitudes / security issues
Q56 (statements 1./4./5.): To what extent do you agree or disagree with each of the following statements regarding payment methods? Base: EU10 – all respondents (n = 10 041)
Totally agree Tend to agreeTend to disagree
Totally disagree

46
Table 24
There is more differentiation in consumer perceptions of different payment instruments in terms of their perceived security and how suitable they are for making smaller purchases. Cash payments stand out as both most secure and most suitable. Credit transfers, while rated highly for security are seen as least suitable for smaller purchases compared with the other methods.
Debit cards and credit cards are at a similar level in terms of perceived security, with debit cards slightly more likely to be seen as secure. However debit cards are much more likely to be seen as suitable for smaller purchases, second only to cash.
There is most overlap between credit cards and online payment systems, with online payment systems slightly less likely to be viewed as secure, and slightly more likely to be seen as suitable for smaller purchases.
It is clear that for small value payments cash is spontaneously the most preferred payment method in terms of the choice parameters of suitability and security. Within the choice task, where steering methods are employed (i.e. information and monetary incentives) this preference becomes even more pronounced.
Credit Transfer
Credit Card
OPS
Debit Card
Cash
Suitability for smaller purchases
High security andaverage suitability for smaller purchases
Average security andaverage suitability for smaller purchases
High security and very good for smaller
purchases
Average security andvery good for smaler purchases
High(4)
OK(3)
OK (3)
Very good(5)
Secu
rity
of
paym
ent
met
hod
General Images of Payment Methods regarding Security and Suitability for Smaller Purchases
Q21/22: Please order these payment methods by dragging each card and placing it somewhere on the scale. Base: EU10 – all respondents (n = 10 041) – positioning according to mean placements on a 5 point scale from very low = 1 to very high = 5 respectively from very poor = 1 to very good = 5
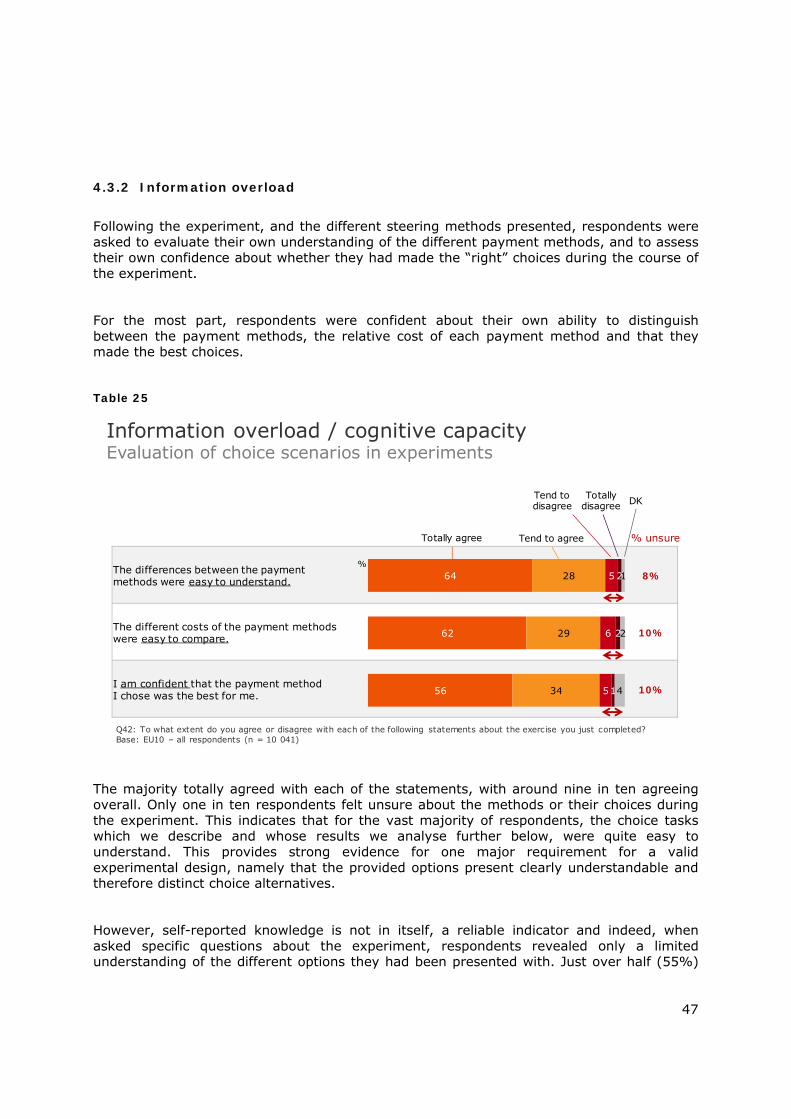
47
4.3.2 Information overload
Following the experiment, and the different steering methods presented, respondents were asked to evaluate their own understanding of the different payment methods, and to assess their own confidence about whether they had made the “right” choices during the course of the experiment.
For the most part, respondents were confident about their own ability to distinguish between the payment methods, the relative cost of each payment method and that they made the best choices.
Table 25
The majority totally agreed with each of the statements, with around nine in ten agreeing overall. Only one in ten respondents felt unsure about the methods or their choices during the experiment. This indicates that for the vast majority of respondents, the choice tasks which we describe and whose results we analyse further below, were quite easy to understand. This provides strong evidence for one major requirement for a valid experimental design, namely that the provided options present clearly understandable and therefore distinct choice alternatives.
However, self-reported knowledge is not in itself, a reliable indicator and indeed, when asked specific questions about the experiment, respondents revealed only a limited understanding of the different options they had been presented with. Just over half (55%)
The differences between the payment methods were easy to understand. 8%
The different costs of the payment methods were easy to compare. 10%
I am confident that the payment method I chose was the best for me. 10%
64
62
56
28
29
34
5
6
5
2
2
1
1
2
4
%
% unsure
Information overload / cognitive capacityEvaluation of choice scenarios in experiments
Q42: To what extent do you agree or disagree with each of the following statements about the exercise you just completed? Base: EU10 – all respondents (n = 10 041)
Totally agree Tend to agree
Tend to disagree
Totally disagree DK
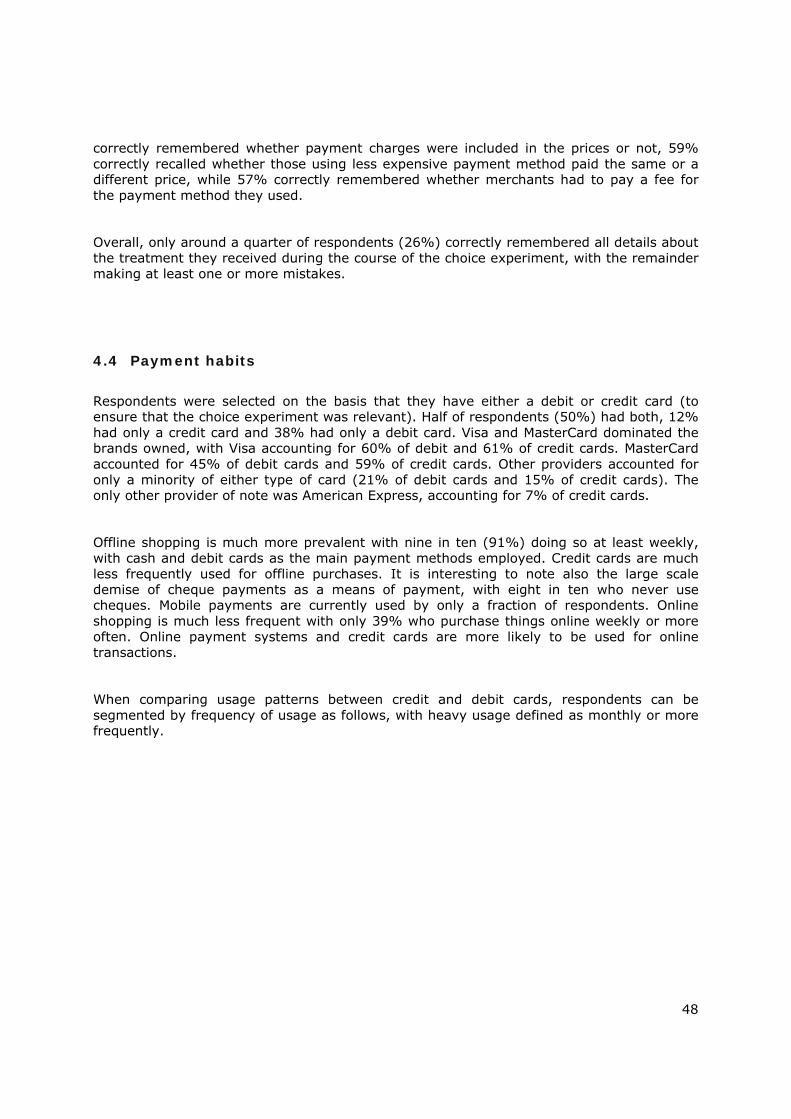
48
correctly remembered whether payment charges were included in the prices or not, 59% correctly recalled whether those using less expensive payment method paid the same or a different price, while 57% correctly remembered whether merchants had to pay a fee for the payment method they used.
Overall, only around a quarter of respondents (26%) correctly remembered all details about the treatment they received during the course of the choice experiment, with the remainder making at least one or more mistakes.
4.4 Payment habits
Respondents were selected on the basis that they have either a debit or credit card (to ensure that the choice experiment was relevant). Half of respondents (50%) had both, 12% had only a credit card and 38% had only a debit card. Visa and MasterCard dominated the brands owned, with Visa accounting for 60% of debit and 61% of credit cards. MasterCard accounted for 45% of debit cards and 59% of credit cards. Other providers accounted for only a minority of either type of card (21% of debit cards and 15% of credit cards). The only other provider of note was American Express, accounting for 7% of credit cards.
Offline shopping is much more prevalent with nine in ten (91%) doing so at least weekly, with cash and debit cards as the main payment methods employed. Credit cards are much less frequently used for offline purchases. It is interesting to note also the large scale demise of cheque payments as a means of payment, with eight in ten who never use cheques. Mobile payments are currently used by only a fraction of respondents. Online shopping is much less frequent with only 39% who purchase things online weekly or more often. Online payment systems and credit cards are more likely to be used for online transactions.
When comparing usage patterns between credit and debit cards, respondents can be segmented by frequency of usage as follows, with heavy usage defined as monthly or more frequently.
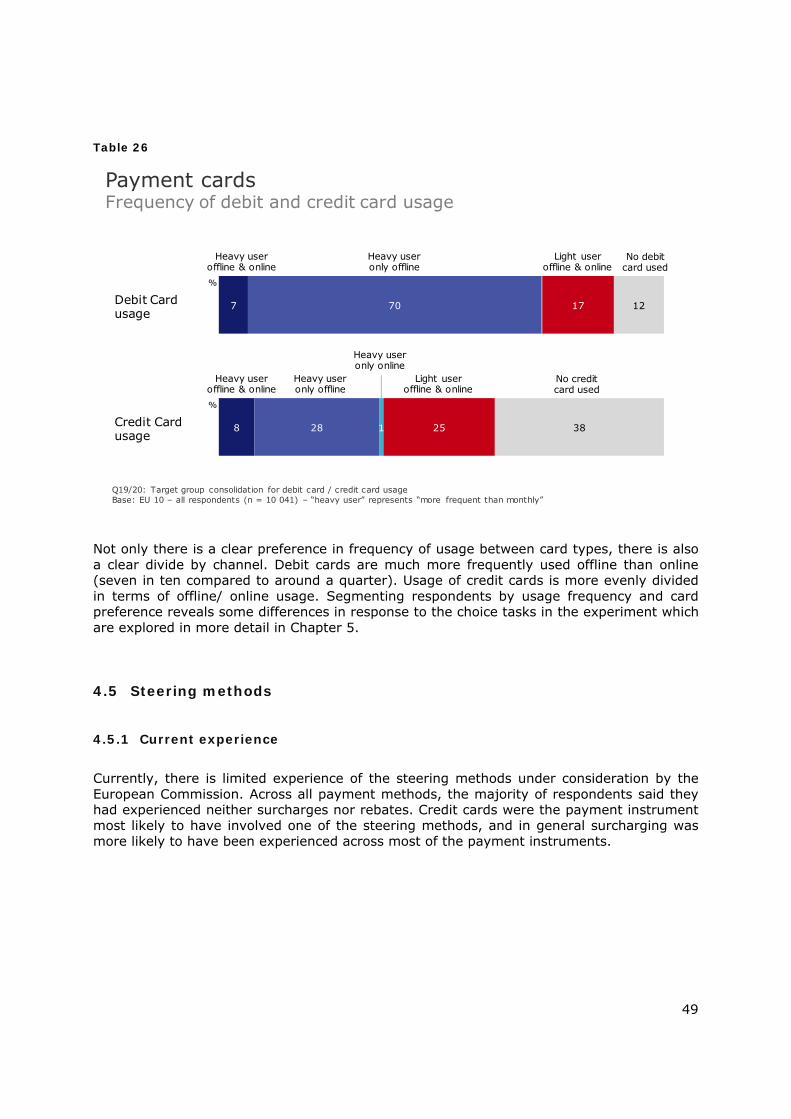
49
Table 26
Not only there is a clear preference in frequency of usage between card types, there is also a clear divide by channel. Debit cards are much more frequently used offline than online (seven in ten compared to around a quarter). Usage of credit cards is more evenly divided in terms of offline/ online usage. Segmenting respondents by usage frequency and card preference reveals some differences in response to the choice tasks in the experiment which are explored in more detail in Chapter 5.
4.5 Steering methods
4.5.1 Current experience
Currently, there is limited experience of the steering methods under consideration by the European Commission. Across all payment methods, the majority of respondents said they had experienced neither surcharges nor rebates. Credit cards were the payment instrument most likely to have involved one of the steering methods, and in general surcharging was more likely to have been experienced across most of the payment instruments.
Payment cardsFrequency of debit and credit card usage
Q19/20: Target group consolidation for debit card / credit card usageBase: EU 10 – all respondents (n = 10 041) – “heavy user” represents “more frequent than monthly”
7 70 17 12
%
Debit Card usage
Heavy user offline & online
Heavy user only offline
Light user offline & online
No debit card used
8 28 1 25 38
%
Credit Card usage
Heavy user offline & online
Heavy user only offline
Heavy user only online
Light user offline & online
No credit card used

50
Table 27
Fewer than four in ten had experienced either a surcharge (29%) or a rebate (11%) as a result of using a credit card.
For all of the other payment instruments, around three quarters had not experienced either steering method as a consequence of using it, and in the case of cheques this proportion increases to around nine in ten.
Where one of the steering methods had been experienced, it was more likely to be a surcharge although those opting to pay for direct debit or cash were more likely to have been offered a rebate.
There were significant country differences. Respondents in Slovenia were much more likely to have received a rebate for cash payment – around six in ten (62%) said they had done so. It was much less common in all of the other countries, falling to under a quarter for all other countries and as low as one in ten in France, the Netherlands and Denmark.
Credit card(n = 6217)
Online Payment System(n = 4255)
Direct debit(n = 1657)
Credit transfer(n = 2595)
Debit card(n = 8804)
Cash(n = 10041)
Cheque(n = 2595)
61
72
74
74
76
76
89
29
18
11
14
16
3
7
11
10
16
12
8
21
4
%
Steering MethodsExperience with surcharges and rebates
Q50: Looking back over the past 2 years, have you a) ever been asked to pay a surcharge b) ever been offered a rebate/discount related to the choice of a specific payment method, when shopping online or offline? Base: EU10 – respondents who own or used the respective payment method (n = between 10 041 and 1657)
RebateSurchargeNone of these
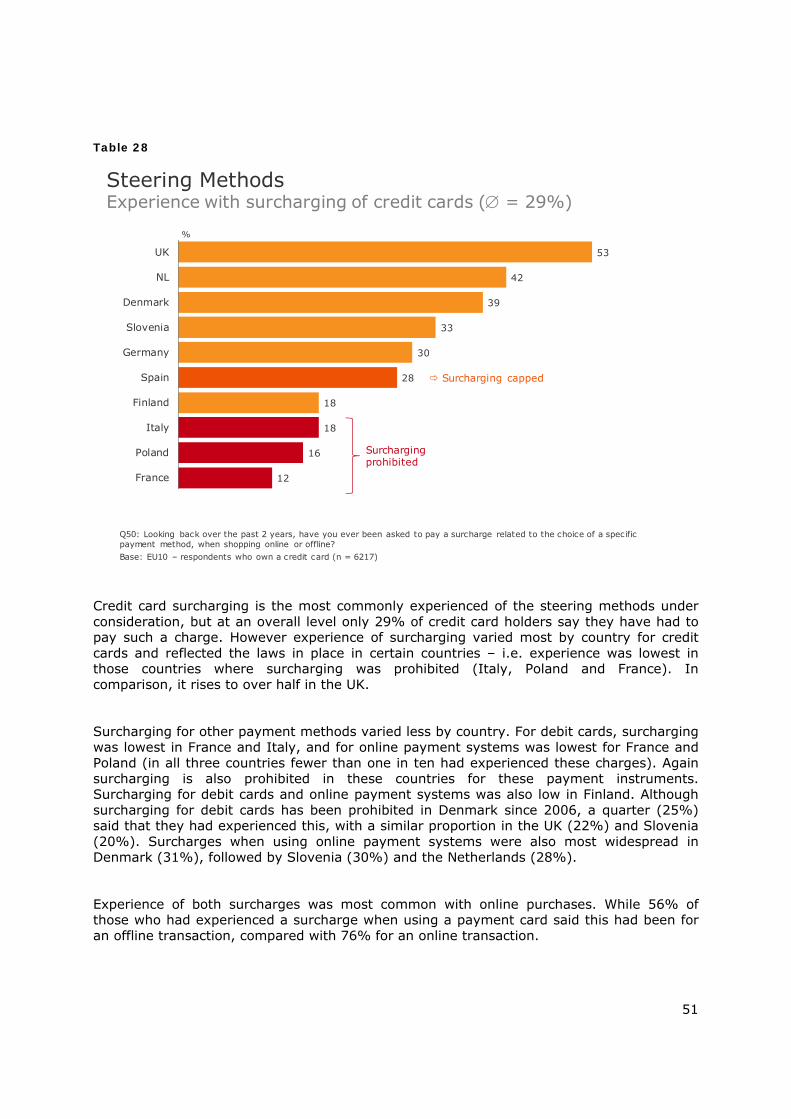
51
Table 28
Credit card surcharging is the most commonly experienced of the steering methods under consideration, but at an overall level only 29% of credit card holders say they have had to pay such a charge. However experience of surcharging varied most by country for credit cards and reflected the laws in place in certain countries – i.e. experience was lowest in those countries where surcharging was prohibited (Italy, Poland and France). In comparison, it rises to over half in the UK.
Surcharging for other payment methods varied less by country. For debit cards, surcharging was lowest in France and Italy, and for online payment systems was lowest for France and Poland (in all three countries fewer than one in ten had experienced these charges). Again surcharging is also prohibited in these countries for these payment instruments. Surcharging for debit cards and online payment systems was also low in Finland. Although surcharging for debit cards has been prohibited in Denmark since 2006, a quarter (25%) said that they had experienced this, with a similar proportion in the UK (22%) and Slovenia (20%). Surcharges when using online payment systems were also most widespread in Denmark (31%), followed by Slovenia (30%) and the Netherlands (28%).
Experience of both surcharges was most common with online purchases. While 56% of those who had experienced a surcharge when using a payment card said this had been for an offline transaction, compared with 76% for an online transaction.
12
16
18
18
28
30
33
39
42
53
France
Poland
Italy
Finland
Spain
Germany
Slovenia
Denmark
NL
UK
%
Steering MethodsExperience with surcharging of credit cards ( = 29%)
Q50: Looking back over the past 2 years, have you ever been asked to pay a surcharge related to the choice of a specific payment method, when shopping online or offline? Base: EU10 – respondents who own a credit card (n = 6217)
Surcharging prohibited
Surcharging capped
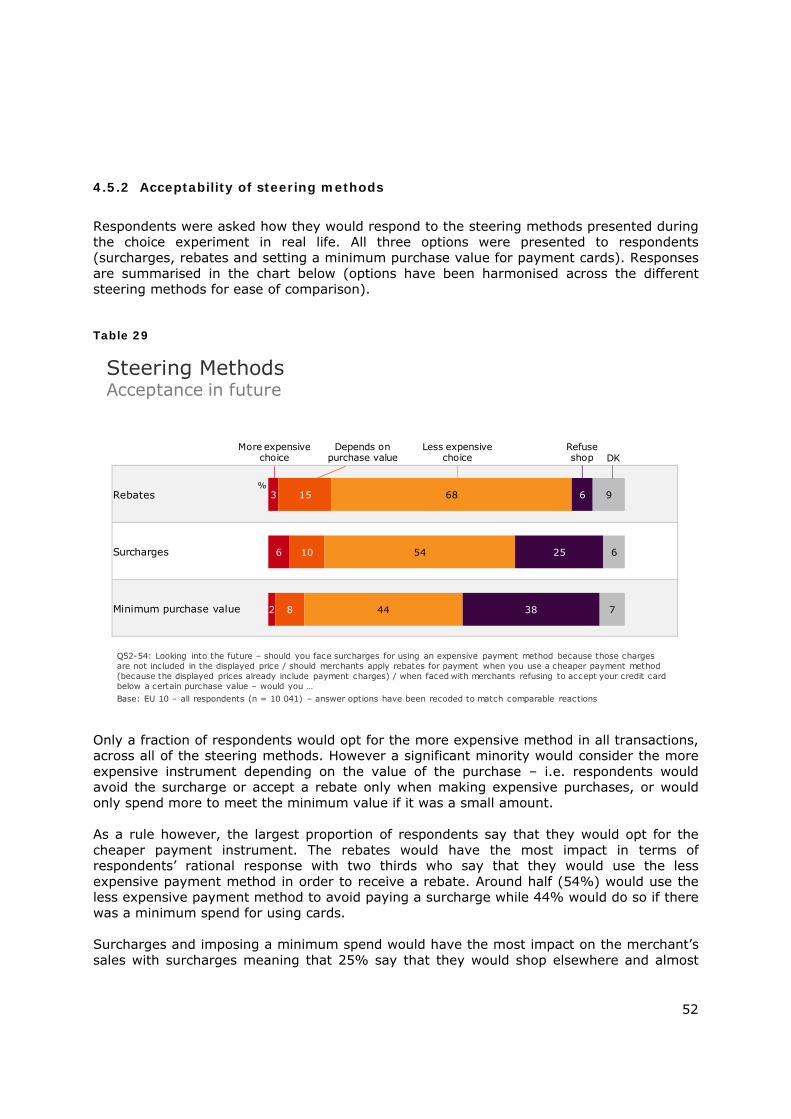
52
4.5.2 Acceptability of steering methods
Respondents were asked how they would respond to the steering methods presented during the choice experiment in real life. All three options were presented to respondents (surcharges, rebates and setting a minimum purchase value for payment cards). Responses are summarised in the chart below (options have been harmonised across the different steering methods for ease of comparison).
Table 29
Only a fraction of respondents would opt for the more expensive method in all transactions, across all of the steering methods. However a significant minority would consider the more expensive instrument depending on the value of the purchase – i.e. respondents would avoid the surcharge or accept a rebate only when making expensive purchases, or would only spend more to meet the minimum value if it was a small amount. As a rule however, the largest proportion of respondents say that they would opt for the cheaper payment instrument. The rebates would have the most impact in terms of respondents’ rational response with two thirds who say that they would use the less expensive payment method in order to receive a rebate. Around half (54%) would use the less expensive payment method to avoid paying a surcharge while 44% would do so if there was a minimum spend for using cards. Surcharges and imposing a minimum spend would have the most impact on the merchant’s sales with surcharges meaning that 25% say that they would shop elsewhere and almost
Rebates
Surcharges
Minimum purchase value
3
6
2
15
10
8
68
54
44
6
25
38
9
6
7
%
Steering MethodsAcceptance in future
Q52-54: Looking into the future – should you face surcharges for using an expensive payment method because those charges are not included in the displayed price / should merchants apply rebates for payment when you use a cheaper payment method (because the displayed prices already include payment charges) / when faced with merchants refusing to accept your credit card below a certain purchase value – would you …Base: EU 10 – all respondents (n = 10 041) – answer options have been recoded to match comparable reactions
More expensive choice
Less expensive choice
Depends on purchase value
Refuse shop DK
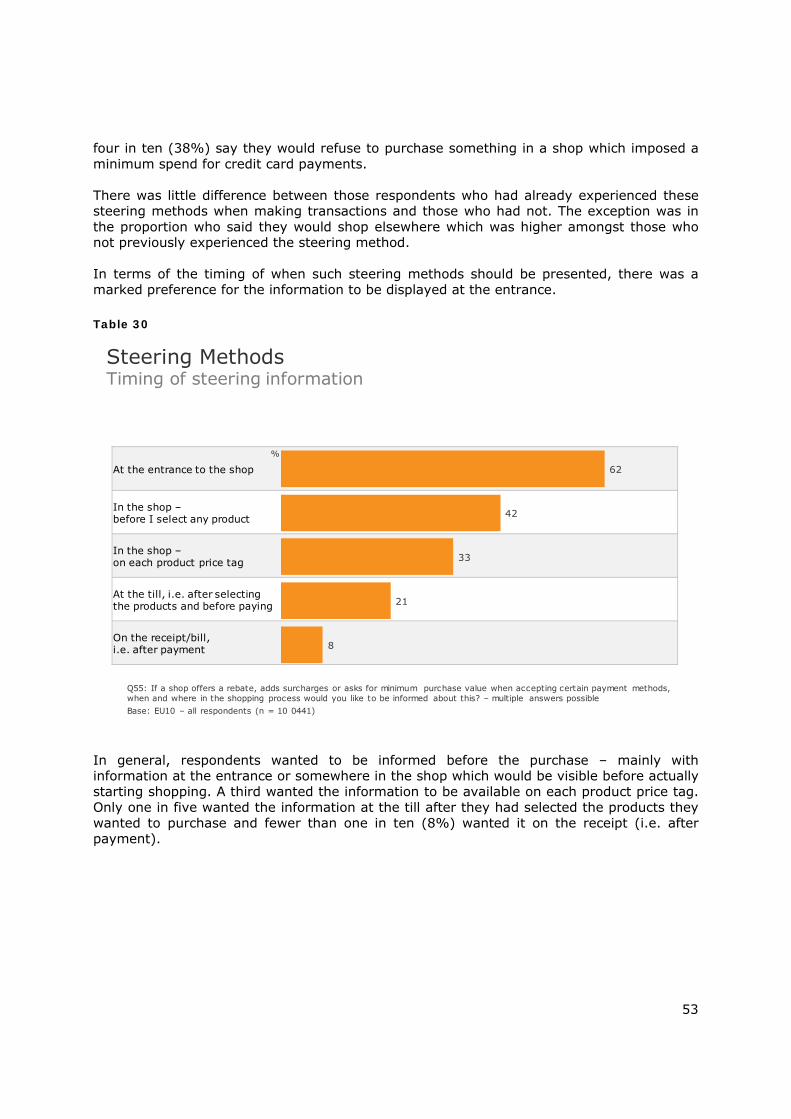
53
four in ten (38%) say they would refuse to purchase something in a shop which imposed a minimum spend for credit card payments. There was little difference between those respondents who had already experienced these steering methods when making transactions and those who had not. The exception was in the proportion who said they would shop elsewhere which was higher amongst those who not previously experienced the steering method. In terms of the timing of when such steering methods should be presented, there was a marked preference for the information to be displayed at the entrance. Table 30
In general, respondents wanted to be informed before the purchase – mainly with information at the entrance or somewhere in the shop which would be visible before actually starting shopping. A third wanted the information to be available on each product price tag. Only one in five wanted the information at the till after they had selected the products they wanted to purchase and fewer than one in ten (8%) wanted it on the receipt (i.e. after payment).
At the entrance to the shop
In the shop –before I select any product
In the shop –on each product price tag
At the till, i.e. after selecting the products and before paying
On the receipt/bill, i.e. after payment 8
21
33
42
62
%
Steering MethodsTiming of steering information
Q55: If a shop offers a rebate, adds surcharges or asks for minimum purchase value when accepting certain payment methods, when and where in the shopping process would you like to be informed about this? – multiple answers possibleBase: EU10 – all respondents (n = 10 0441)
54
5 Offline shopping payment experiments
This section explains the most important findings of the experimental part of the survey to provide answers for the ultimate research objectives:
a) What are the main individual biases and external barriers that prevent people from choosing the most appropriate payment method?
b) What are the most effective policy options – i.e. the most appropriate transparency of payment costs – to foster more cost-conscious choices of payment methods?
As the experiments covered offline and online payment scenarios, they are described in separate sections below as the choice architecture differs significantly.
However, both Chapters are outlined with a similar structure starting with a concise description of disaggregated findings of the observed decision behaviour in the choice tasks with suggestions for variables to be included in the statistical base model (1).
This is supplemented by a descriptive overview of observed choice behaviour for the tested policy options (2).
Eventually, in the final Chapter the discussed variables will be combined by multivariate analysis to answer the key questions about what are the statistically significant barriers and motivators (3).
5.1 Observed offline payment behaviour
5.1.1 Offline choice tasks
The first two choice tasks presented to all respondents were framed as an offline purchase in a department store with a first decision on a small purchase value of €20 and a second decision on a high value of €200.
The offline store accepted three payment methods: cash, debit card or credit card20. However, if the respondent did not own a debit or credit card, the choice focused only on the payment methods available in real life.
In the first low purchase value choice a large majority of almost three out of four chose cash, every fifth respondent paid with debit card and only 7% with a credit card. The second choice task for €200 shows a distinctively different choice behaviour with around half of the participants selecting the debit card, while one quarter chose cash and another quarter the credit card.
20 As outlined earlier, the differentiation between payment charges in the offline shopping treatments with
rebates and surcharges was defined as follows: cash was framed as the most cost-effective choice, credit card payment as the most expensive choice, and debit card payment represented an in-between option. This study does not claim this necessarily reflects the situation for all merchants.
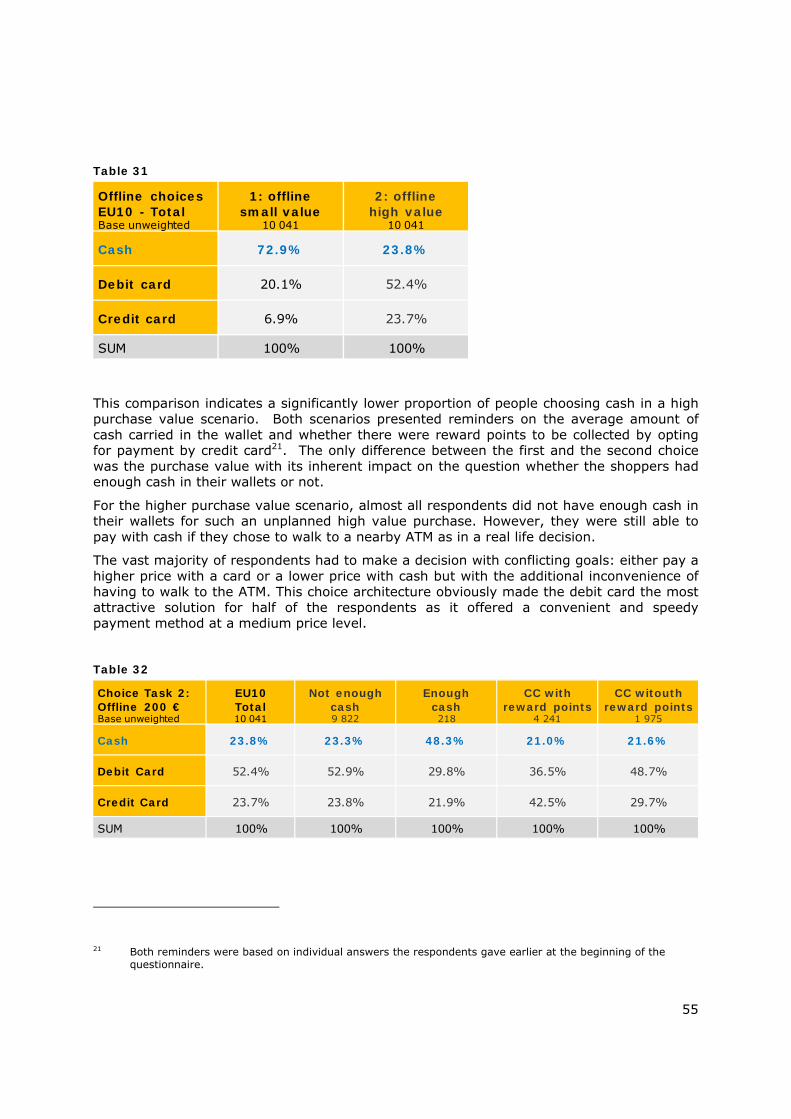
55
Table 31
This comparison indicates a significantly lower proportion of people choosing cash in a high purchase value scenario. Both scenarios presented reminders on the average amount of cash carried in the wallet and whether there were reward points to be collected by opting for payment by credit card21. The only difference between the first and the second choice was the purchase value with its inherent impact on the question whether the shoppers had enough cash in their wallets or not.
For the higher purchase value scenario, almost all respondents did not have enough cash in their wallets for such an unplanned high value purchase. However, they were still able to pay with cash if they chose to walk to a nearby ATM as in a real life decision.
The vast majority of respondents had to make a decision with conflicting goals: either pay a higher price with a card or a lower price with cash but with the additional inconvenience of having to walk to the ATM. This choice architecture obviously made the debit card the most attractive solution for half of the respondents as it offered a convenient and speedy payment method at a medium price level.
Table 32
21 Both reminders were based on individual answers the respondents gave earlier at the beginning of the
questionnaire.
Offline choicesEU10 - TotalBase unweighted
1: offline small value
10 041
2: offlinehigh value
10 041
Cash 72.9% 23.8%
Debit card 20.1% 52.4%
Credit card 6.9% 23.7%
SUM 100% 100%
Choice Task 2: Offline 200 €Base unweighted
EU10 Total10 041
Not enough cash9 822
Enough cash218
CC with reward points
4 241
CC witouth reward points
1 975
Cash 23.8% 23.3% 48.3% 21.0% 21.6%
Debit Card 52.4% 52.9% 29.8% 36.5% 48.7%
Credit Card 23.7% 23.8% 21.9% 42.5% 29.7%
SUM 100% 100% 100% 100% 100%
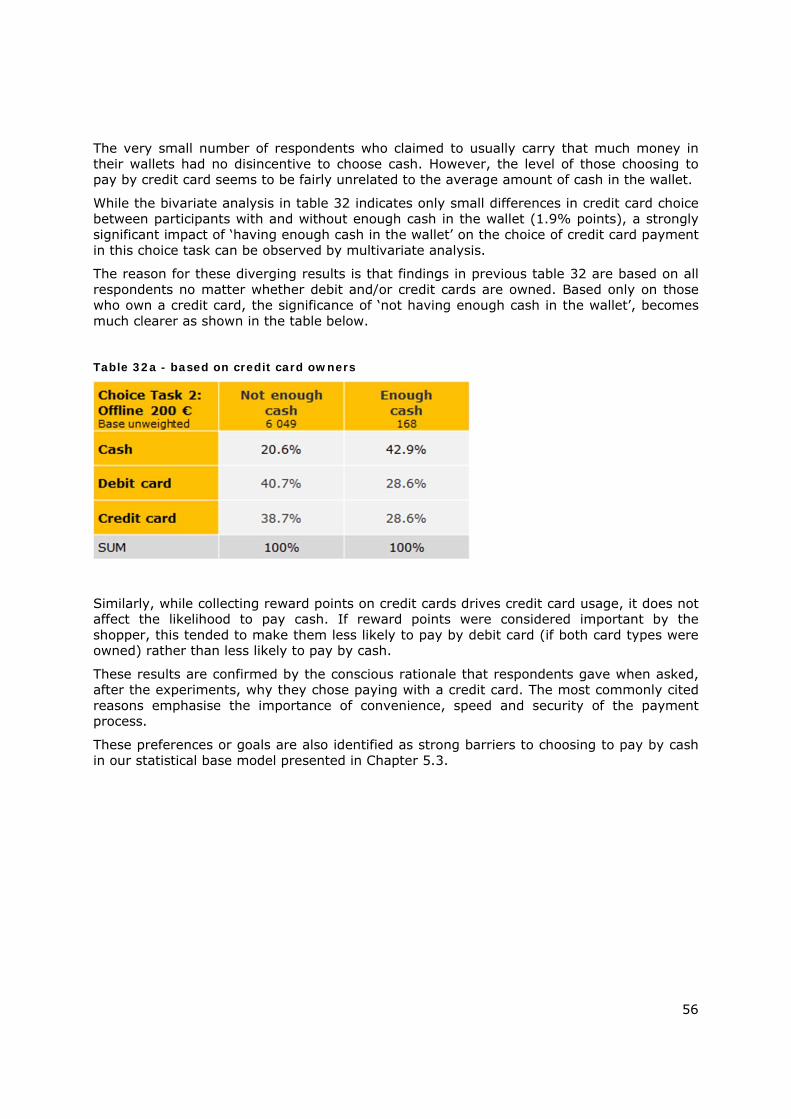
56
The very small number of respondents who claimed to usually carry that much money in their wallets had no disincentive to choose cash. However, the level of those choosing to pay by credit card seems to be fairly unrelated to the average amount of cash in the wallet.
While the bivariate analysis in table 32 indicates only small differences in credit card choice between participants with and without enough cash in the wallet (1.9% points), a strongly significant impact of ‘having enough cash in the wallet’ on the choice of credit card payment in this choice task can be observed by multivariate analysis.
The reason for these diverging results is that findings in previous table 32 are based on all respondents no matter whether debit and/or credit cards are owned. Based only on those who own a credit card, the significance of ‘not having enough cash in the wallet’, becomes much clearer as shown in the table below.
Table 32a - based on credit card owners
Similarly, while collecting reward points on credit cards drives credit card usage, it does not affect the likelihood to pay cash. If reward points were considered important by the shopper, this tended to make them less likely to pay by debit card (if both card types were owned) rather than less likely to pay by cash.
These results are confirmed by the conscious rationale that respondents gave when asked, after the experiments, why they chose paying with a credit card. The most commonly cited reasons emphasise the importance of convenience, speed and security of the payment process.
These preferences or goals are also identified as strong barriers to choosing to pay by cash in our statistical base model presented in Chapter 5.3.
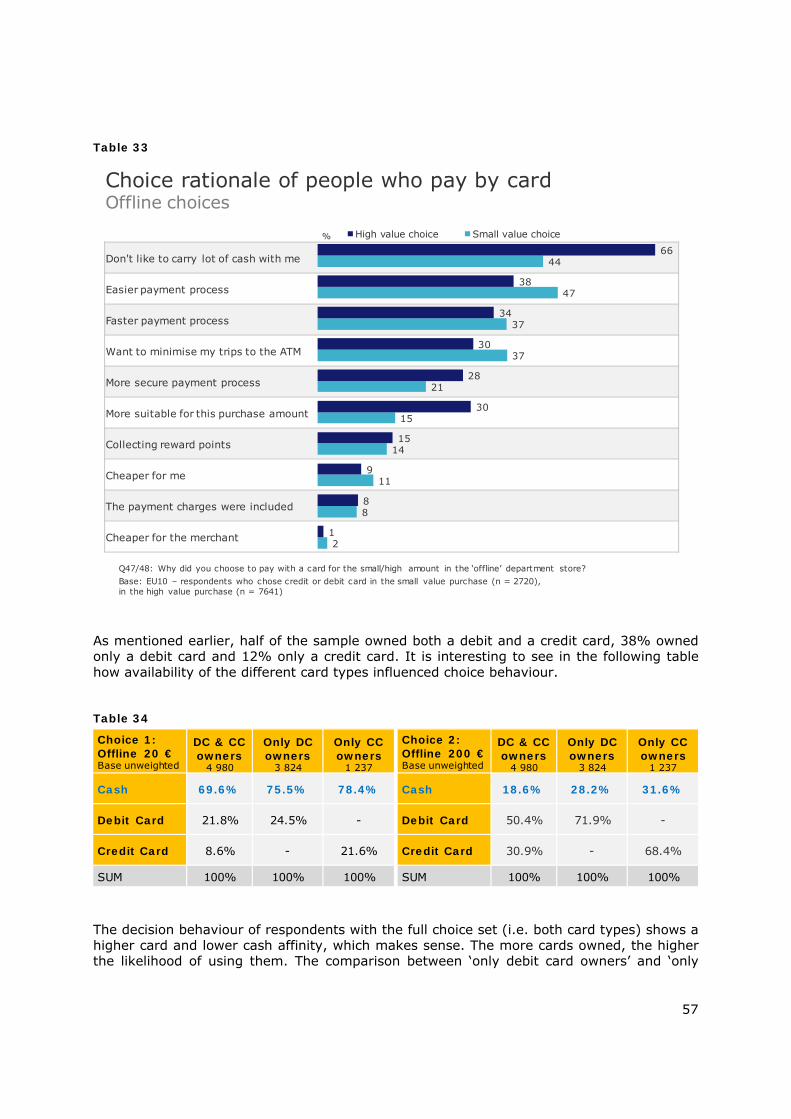
57
Table 33
As mentioned earlier, half of the sample owned both a debit and a credit card, 38% owned only a debit card and 12% only a credit card. It is interesting to see in the following table how availability of the different card types influenced choice behaviour.
Table 34
The decision behaviour of respondents with the full choice set (i.e. both card types) shows a higher card and lower cash affinity, which makes sense. The more cards owned, the higher the likelihood of using them. The comparison between ‘only debit card owners’ and ‘only
Don't like to carry lot of cash with me
Easier payment process
Faster payment process
Want to minimise my trips to the ATM
More secure payment process
More suitable for this purchase amount
Collecting reward points
Cheaper for me
The payment charges were included
Cheaper for the merchant 2
8
11
14
15
21
37
37
47
44
1
8
9
15
30
28
30
34
38
66% High value choice Small value choice
Choice rationale of people who pay by cardOffline choices
Q47/48: Why did you choose to pay with a card for the small/high amount in the ‘offline’ department store? Base: EU10 – respondents who chose credit or debit card in the small value purchase (n = 2720), in the high value purchase (n = 7641)
Choice 1: Offline 20 €Base unweighted
DC & CC owners
4 980
Only DC owners
3 824
Only CC owners
1 237
Cash 69.6% 75.5% 78.4%
Debit Card 21.8% 24.5% -
Credit Card 8.6% - 21.6%
SUM 100% 100% 100%
Choice 2: Offline 200 €Base unweighted
DC & CC owners
4 980
Only DC owners
3 824
Only CC owners
1 237
Cash 18.6% 28.2% 31.6%
Debit Card 50.4% 71.9% -
Credit Card 30.9% - 68.4%
SUM 100% 100% 100%
58
credit card owners’ shows a slightly higher inclination to use debit cards, where the price difference to cash was not as big as between credit cards and cash.
Based on this descriptive analysis on potential biases and barriers for rational choices, the base model for the multivariate analysis therefore included the following variables and hypotheses:
- Purchase value
o More likely to choose cash payment if low value
- Relevance of goals
o More likely to choose cash payment if prioritise cost over convenience
- Cards available
o Less likely to choose cash payment if both card schemes owned
- Relevance of collecting reward points with credit card
o No influence on cash payments but drives choice of credit card over debit card
- Amount of cash in wallet
o More likely to choose cash payment if usually carry sufficient cash in wallet
In addition the base model included a selection of variables on payment habits and cost awareness, as discussed in Chapter 4.
5.1.2 Analysis of policy options in offline choice tasks
The tested policy options will also be included in the final regression model. However, it will be more transparent for non-statisticians to see how the choice behaviour differs when comparing different treatment splits.
The steering mechanism options were already expected to have a strong influence on the choice behaviour as can be seen in the tables below.
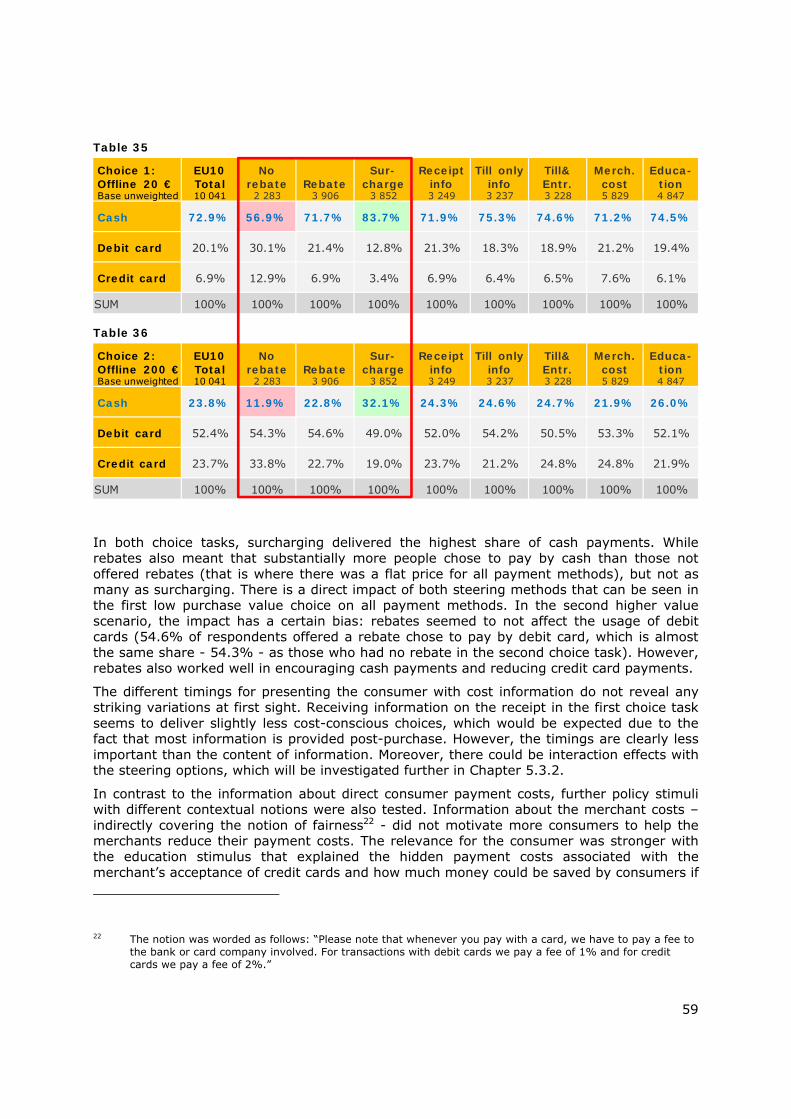
59
Table 35
Table 36
In both choice tasks, surcharging delivered the highest share of cash payments. While rebates also meant that substantially more people chose to pay by cash than those not offered rebates (that is where there was a flat price for all payment methods), but not as many as surcharging. There is a direct impact of both steering methods that can be seen in the first low purchase value choice on all payment methods. In the second higher value scenario, the impact has a certain bias: rebates seemed to not affect the usage of debit cards (54.6% of respondents offered a rebate chose to pay by debit card, which is almost the same share - 54.3% - as those who had no rebate in the second choice task). However, rebates also worked well in encouraging cash payments and reducing credit card payments.
The different timings for presenting the consumer with cost information do not reveal any striking variations at first sight. Receiving information on the receipt in the first choice task seems to deliver slightly less cost-conscious choices, which would be expected due to the fact that most information is provided post-purchase. However, the timings are clearly less important than the content of information. Moreover, there could be interaction effects with the steering options, which will be investigated further in Chapter 5.3.2.
In contrast to the information about direct consumer payment costs, further policy stimuli with different contextual notions were also tested. Information about the merchant costs – indirectly covering the notion of fairness22 - did not motivate more consumers to help the merchants reduce their payment costs. The relevance for the consumer was stronger with the education stimulus that explained the hidden payment costs associated with the merchant’s acceptance of credit cards and how much money could be saved by consumers if
22 The notion was worded as follows: “Please note that whenever you pay with a card, we have to pay a fee to
the bank or card company involved. For transactions with debit cards we pay a fee of 1% and for credit cards we pay a fee of 2%.”
Choice 1: Offline 20 €Base unweighted
EU10 Total10 041
No rebate
2 283Rebate
3 906
Sur-charge
3 852
Receipt info3 249
Till only info3 237
Till& Entr.3 228
Merch. cost5 829
Educa-tion4 847
Cash 72.9% 56.9% 71.7% 83.7% 71.9% 75.3% 74.6% 71.2% 74.5%
Debit card 20.1% 30.1% 21.4% 12.8% 21.3% 18.3% 18.9% 21.2% 19.4%
Credit card 6.9% 12.9% 6.9% 3.4% 6.9% 6.4% 6.5% 7.6% 6.1%
SUM 100% 100% 100% 100% 100% 100% 100% 100% 100%
Choice 2: Offline 200 €Base unweighted
EU10 Total10 041
No rebate
2 283Rebate
3 906
Sur-charge
3 852
Receipt info3 249
Till only info3 237
Till& Entr.3 228
Merch. cost5 829
Educa-tion4 847
Cash 23.8% 11.9% 22.8% 32.1% 24.3% 24.6% 24.7% 21.9% 26.0%
Debit card 52.4% 54.3% 54.6% 49.0% 52.0% 54.2% 50.5% 53.3% 52.1%
Credit card 23.7% 33.8% 22.7% 19.0% 23.7% 21.2% 24.8% 24.8% 21.9%
SUM 100% 100% 100% 100% 100% 100% 100% 100% 100%
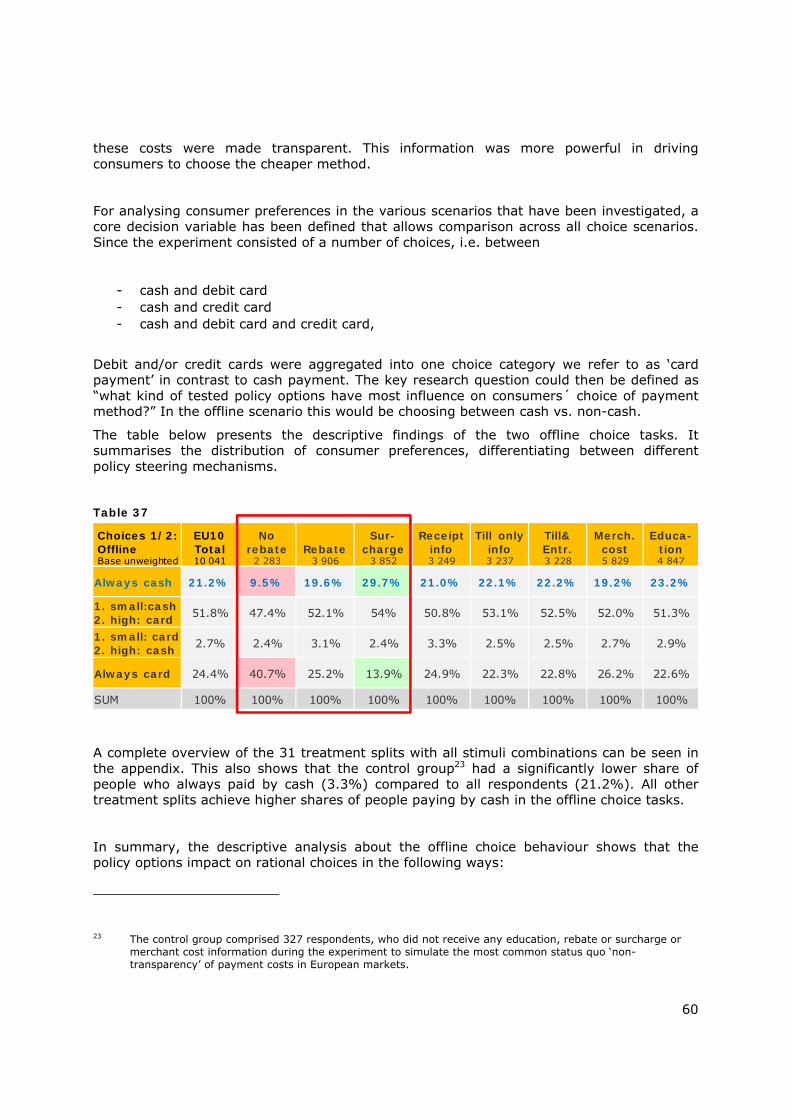
60
these costs were made transparent. This information was more powerful in driving consumers to choose the cheaper method.
For analysing consumer preferences in the various scenarios that have been investigated, a core decision variable has been defined that allows comparison across all choice scenarios. Since the experiment consisted of a number of choices, i.e. between
- cash and debit card - cash and credit card - cash and debit card and credit card,
Debit and/or credit cards were aggregated into one choice category we refer to as ‘card payment’ in contrast to cash payment. The key research question could then be defined as “what kind of tested policy options have most influence on consumers´ choice of payment method?” In the offline scenario this would be choosing between cash vs. non-cash.
The table below presents the descriptive findings of the two offline choice tasks. It summarises the distribution of consumer preferences, differentiating between different policy steering mechanisms.
Table 37
A complete overview of the 31 treatment splits with all stimuli combinations can be seen in the appendix. This also shows that the control group23 had a significantly lower share of people who always paid by cash (3.3%) compared to all respondents (21.2%). All other treatment splits achieve higher shares of people paying by cash in the offline choice tasks.
In summary, the descriptive analysis about the offline choice behaviour shows that the policy options impact on rational choices in the following ways:
23 The control group comprised 327 respondents, who did not receive any education, rebate or surcharge or
merchant cost information during the experiment to simulate the most common status quo ‘non-transparency’ of payment costs in European markets.
Choices 1/2: OfflineBase unweighted
EU10 Total10 041
No rebate
2 283Rebate
3 906
Sur-charge
3 852
Receipt info3 249
Till only info3 237
Till& Entr.3 228
Merch. cost5 829
Educa-tion4 847
Always cash 21.2% 9.5% 19.6% 29.7% 21.0% 22.1% 22.2% 19.2% 23.2%
1. small:cash2. high: card 51.8% 47.4% 52.1% 54% 50.8% 53.1% 52.5% 52.0% 51.3%
1. small: card 2. high: cash 2.7% 2.4% 3.1% 2.4% 3.3% 2.5% 2.5% 2.7% 2.9%
Always card 24.4% 40.7% 25.2% 13.9% 24.9% 22.3% 22.8% 26.2% 22.6%
SUM 100% 100% 100% 100% 100% 100% 100% 100% 100%
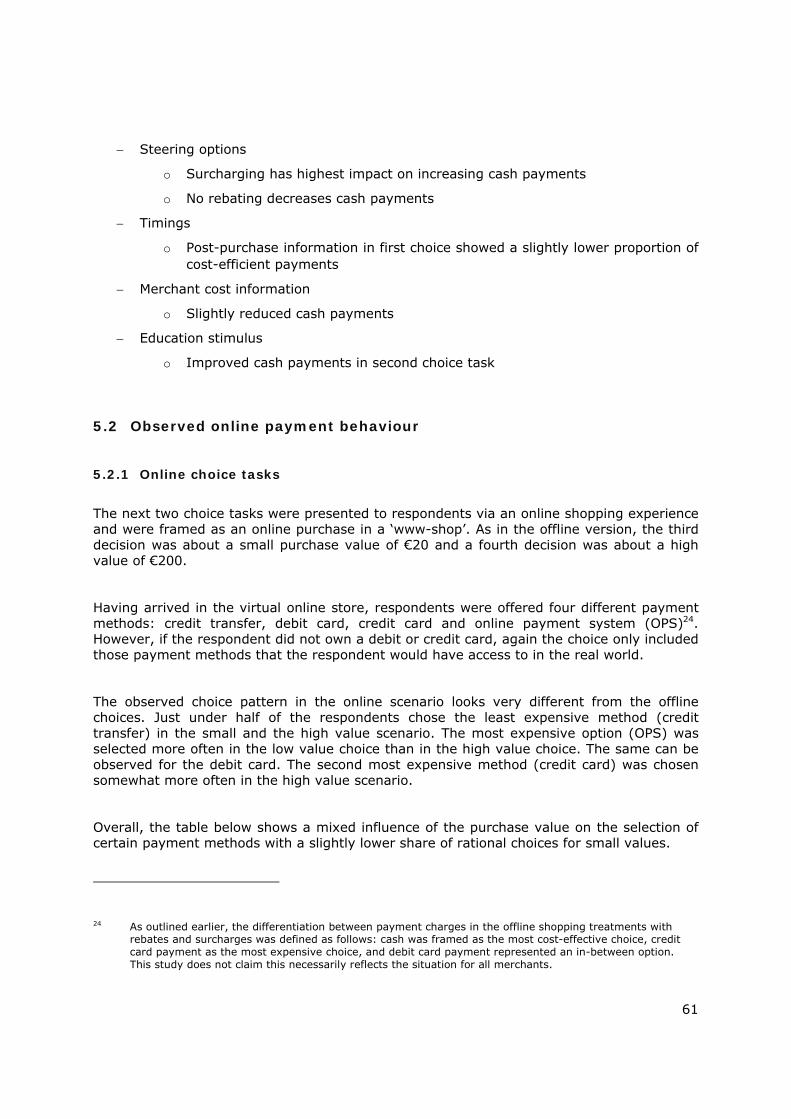
61
Steering options
o Surcharging has highest impact on increasing cash payments
o No rebating decreases cash payments
Timings
o Post-purchase information in first choice showed a slightly lower proportion of cost-efficient payments
Merchant cost information
o Slightly reduced cash payments
Education stimulus
o Improved cash payments in second choice task
5.2 Observed online payment behaviour
5.2.1 Online choice tasks
The next two choice tasks were presented to respondents via an online shopping experience and were framed as an online purchase in a ‘www-shop’. As in the offline version, the third decision was about a small purchase value of €20 and a fourth decision was about a high value of €200.
Having arrived in the virtual online store, respondents were offered four different payment methods: credit transfer, debit card, credit card and online payment system (OPS)24. However, if the respondent did not own a debit or credit card, again the choice only included those payment methods that the respondent would have access to in the real world.
The observed choice pattern in the online scenario looks very different from the offline choices. Just under half of the respondents chose the least expensive method (credit transfer) in the small and the high value scenario. The most expensive option (OPS) was selected more often in the low value choice than in the high value choice. The same can be observed for the debit card. The second most expensive method (credit card) was chosen somewhat more often in the high value scenario.
Overall, the table below shows a mixed influence of the purchase value on the selection of certain payment methods with a slightly lower share of rational choices for small values.
24 As outlined earlier, the differentiation between payment charges in the offline shopping treatments with
rebates and surcharges was defined as follows: cash was framed as the most cost-effective choice, credit card payment as the most expensive choice, and debit card payment represented an in-between option. This study does not claim this necessarily reflects the situation for all merchants.
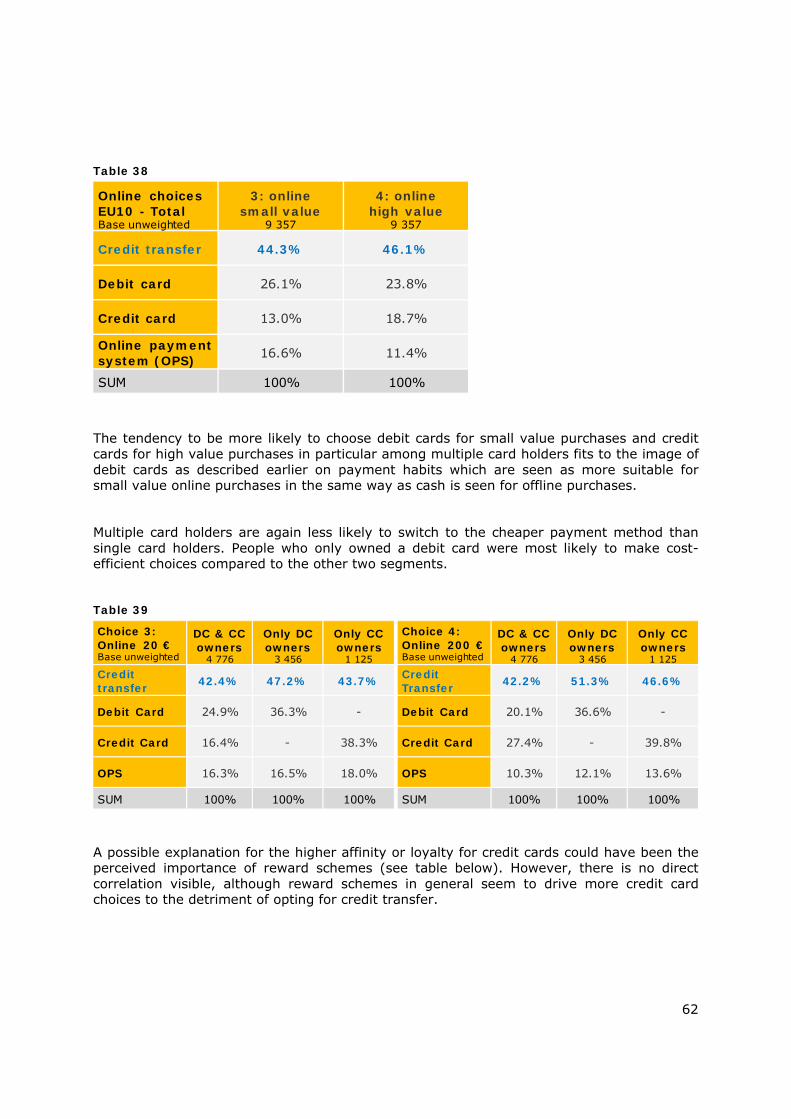
62
Table 38
The tendency to be more likely to choose debit cards for small value purchases and credit cards for high value purchases in particular among multiple card holders fits to the image of debit cards as described earlier on payment habits which are seen as more suitable for small value online purchases in the same way as cash is seen for offline purchases.
Multiple card holders are again less likely to switch to the cheaper payment method than single card holders. People who only owned a debit card were most likely to make cost-efficient choices compared to the other two segments.
Table 39
A possible explanation for the higher affinity or loyalty for credit cards could have been the perceived importance of reward schemes (see table below). However, there is no direct correlation visible, although reward schemes in general seem to drive more credit card choices to the detriment of opting for credit transfer.
Online choicesEU10 - TotalBase unweighted
3: onlinesmall value
9 357
4: onlinehigh value
9 357
Credit transfer 44.3% 46.1%
Debit card 26.1% 23.8%
Credit card 13.0% 18.7%
Online payment system (OPS) 16.6% 11.4%
SUM 100% 100%
Choice 3: Online 20 €Base unweighted
DC & CC owners
4 776
Only DC owners
3 456
Only CC owners
1 125Credit transfer 42.4% 47.2% 43.7%
Debit Card 24.9% 36.3% -
Credit Card 16.4% - 38.3%
OPS 16.3% 16.5% 18.0%
SUM 100% 100% 100%
Choice 4: Online 200 €Base unweighted
DC & CC owners
4 776
Only DC owners
3 456
Only CC owners
1 125Credit Transfer 42.2% 51.3% 46.6%
Debit Card 20.1% 36.6% -
Credit Card 27.4% - 39.8%
OPS 10.3% 12.1% 13.6%
SUM 100% 100% 100%
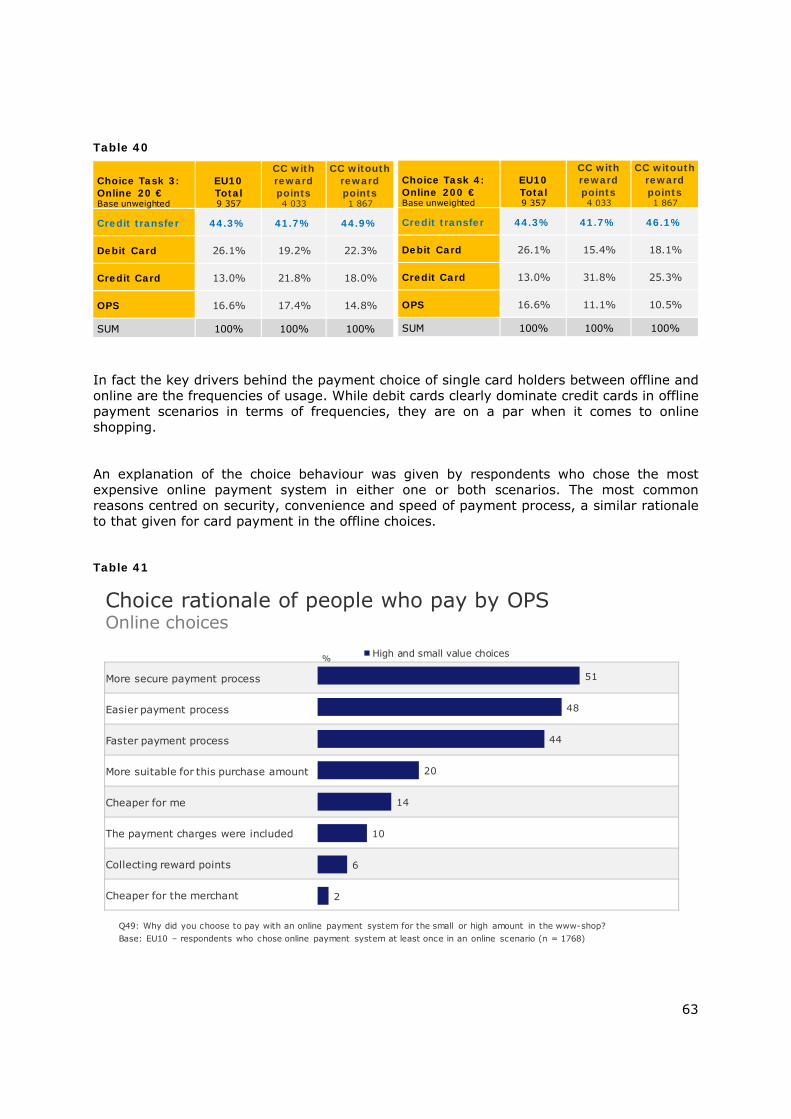
63
Table 40
In fact the key drivers behind the payment choice of single card holders between offline and online are the frequencies of usage. While debit cards clearly dominate credit cards in offline payment scenarios in terms of frequencies, they are on a par when it comes to online shopping.
An explanation of the choice behaviour was given by respondents who chose the most expensive online payment system in either one or both scenarios. The most common reasons centred on security, convenience and speed of payment process, a similar rationale to that given for card payment in the offline choices.
Table 41
Choice Task 3: Online 20 €Base unweighted
EU10 Total9 357
CC with reward points4 033
CC witouth reward points1 867
Credit transfer 44.3% 41.7% 44.9%
Debit Card 26.1% 19.2% 22.3%
Credit Card 13.0% 21.8% 18.0%
OPS 16.6% 17.4% 14.8%
SUM 100% 100% 100%
Choice Task 4: Online 200 €Base unweighted
EU10 Total9 357
CC with reward points4 033
CC witouth reward points1 867
Credit transfer 44.3% 41.7% 46.1%
Debit Card 26.1% 15.4% 18.1%
Credit Card 13.0% 31.8% 25.3%
OPS 16.6% 11.1% 10.5%
SUM 100% 100% 100%
More secure payment process
Easier payment process
Faster payment process
More suitable for this purchase amount
Cheaper for me
The payment charges were included
Collecting reward points
Cheaper for the merchant 2
6
10
14
20
44
48
51
% High and small value choices
Choice rationale of people who pay by OPSOnline choices
Q49: Why did you choose to pay with an online payment system for the small or high amount in the www-shop? Base: EU10 – respondents who chose online payment system at least once in an online scenario (n = 1768)
64
However, this is more surprising in an online environment as there is no comparable inconvenience which would equate to ‘not having enough cash’ in the offline scenario. The relative barriers towards an easy and speedy payment process are more related to having the required information details at hand. The perceived security, ease and speed of online payment methods seemed to be highly dependent on individual habits, experiences and preferences. Therefore it was pertinent to take those individual goals into account within the final regression model.
As a short summary of the descriptive analysis on potential biases and barriers for rational choices, the multivariate base model for the online scenario includes (among others) the
- Purchase value
o Slightly more credit transfer payments if high value purchase
- Relevance of goals
o More credit transfer payments if cost prioritised over convenience
- Cards available
o Less credit transfer payments if both card schemes owned
- Relevance of collecting reward points with credit card
o More credit transfer payments if no reward points collected
In addition the base model also covers a selection of variables on payment habits and cost awareness, which have been discussed in Chapter 4.
5.2.2 Analysis of policy options in online choice tasks
The bivariate comparison of policy stimuli shows a similar picture as in the offline tasks. The impact of the steering option surcharging is again the most effective in driving most online shoppers to take the most cost-efficient choice. Respondents who were offered only flat prices without rebates were least likely to choose the least expensive payment method of credit transfer.

65
Table 42
Table 43
Rebates and surcharges were applied in a linear design from 0% to 3%. There was a direct impact visible for each payment method in both choices except for the debit card in the third choice task, where the rebate did not only motivate respondents to pay with the least expensive method but also with the second least expensive (which was the debit card).
Reflecting the offline scenario, the timing of the provision of the payment cost had no visible effect on payment choices. The additional information on merchant costs (fairness25) presented in the online scenarios led to fewer rational choices and a higher likelihood of choosing the most expensive payment method (OPS). On the other hand, the education stimulus motivated cost-efficient choices not only in the offline scenario but also in the subsequent online scenario.
The dependent goal variable was again defined to ensure comparable results. The online scenarios were slightly more complex with one additional choice option for all respondents, i.e. between
25 The notion was worded as follows: “Please note that whenever you pay with a card or with an online
payment system, we have to pay a fee to the bank or card company involved. For transactions with debit cards we pay a fee of 1%, for credit cards 2%, and for online payment systems 3% of the transaction amount.”
Choice 3: Online 20 €Base unweighted
EU10 Total9 357
No rebate
2 116Rebate
3 636
Sur-charge
3 605
Receipt info3 044
Till only info2 999
Till& Entr.3 003
Merch. cost5 434
Educa-tion4 518
Credit transfer 44.3% 21.4% 43.3% 58.9% 44.7% 45.3% 45.9% 41.5% 47.7%
Debit card 26.1% 26.5% 29.0% 23.1% 25.2% 28.4% 25.0% 26.3% 25.7%
Credit card 13.0% 16.7% 14.0% 9.7% 13.1% 11.7% 13.2% 13.3% 12.0%
OPS 16.6% 35.4% 13.7% 8.4% 16.9% 14.6% 15.8% 18.9% 14.6%
SUM 100% 100% 100% 100% 100% 100% 100% 100% 100%
Choice 4: Online 200 €Base unweighted
EU10 Total9 357
No rebate
2 116Rebate
3 636
Sur-charge
3 605
Receipt info3 044
Till only info2 999
Till& Entr.3 003
Merch. cost5 434
Educa-tion4 518
Credit transfer 46.1% 24.0% 48.9% 56.2% 47.6% 46.7% 46.8% 43.2% 49.5%
Debit card 23.8% 25.5% 24.0% 22.6% 23.0% 25.3% 23.4% 24.0% 23.2%
Credit card 18.7% 26.4% 18.0% 15.0% 18.5% 17.5% 18.7% 19.6% 17.5%
OPS 11.4% 24.1% 9.1% 6.2% 10.9% 10.4% 11.0% 13.3% 9.8%
SUM 100% 100% 100% 100% 100% 100% 100% 100% 100%
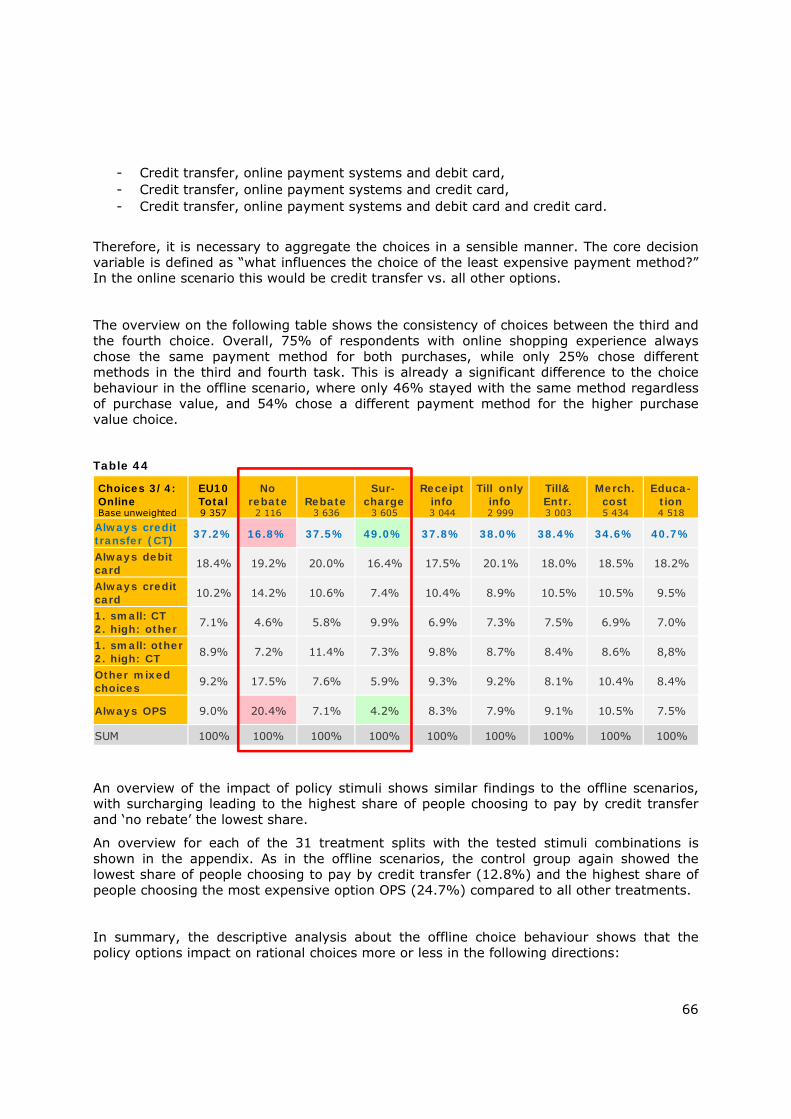
66
- Credit transfer, online payment systems and debit card, - Credit transfer, online payment systems and credit card, - Credit transfer, online payment systems and debit card and credit card.
Therefore, it is necessary to aggregate the choices in a sensible manner. The core decision variable is defined as “what influences the choice of the least expensive payment method?” In the online scenario this would be credit transfer vs. all other options.
The overview on the following table shows the consistency of choices between the third and the fourth choice. Overall, 75% of respondents with online shopping experience always chose the same payment method for both purchases, while only 25% chose different methods in the third and fourth task. This is already a significant difference to the choice behaviour in the offline scenario, where only 46% stayed with the same method regardless of purchase value, and 54% chose a different payment method for the higher purchase value choice.
Table 44
An overview of the impact of policy stimuli shows similar findings to the offline scenarios, with surcharging leading to the highest share of people choosing to pay by credit transfer and ‘no rebate’ the lowest share.
An overview for each of the 31 treatment splits with the tested stimuli combinations is shown in the appendix. As in the offline scenarios, the control group again showed the lowest share of people choosing to pay by credit transfer (12.8%) and the highest share of people choosing the most expensive option OPS (24.7%) compared to all other treatments.
In summary, the descriptive analysis about the offline choice behaviour shows that the policy options impact on rational choices more or less in the following directions:
Choices 3/4: OnlineBase unweighted
EU10 Total9 357
No rebate
2 116Rebate
3 636
Sur-charge
3 605
Receipt info3 044
Till only info2 999
Till& Entr.3 003
Merch. cost5 434
Educa-tion4 518
Always credit transfer (CT) 37.2% 16.8% 37.5% 49.0% 37.8% 38.0% 38.4% 34.6% 40.7%
Always debit card 18.4% 19.2% 20.0% 16.4% 17.5% 20.1% 18.0% 18.5% 18.2%
Always creditcard 10.2% 14.2% 10.6% 7.4% 10.4% 8.9% 10.5% 10.5% 9.5%
1. small: CT 2. high: other 7.1% 4.6% 5.8% 9.9% 6.9% 7.3% 7.5% 6.9% 7.0%
1. small: other 2. high: CT 8.9% 7.2% 11.4% 7.3% 9.8% 8.7% 8.4% 8.6% 8,8%
Other mixed choices 9.2% 17.5% 7.6% 5.9% 9.3% 9.2% 8.1% 10.4% 8.4%
Always OPS 9.0% 20.4% 7.1% 4.2% 8.3% 7.9% 9.1% 10.5% 7.5%
SUM 100% 100% 100% 100% 100% 100% 100% 100% 100%
67
Steering options
o Surcharging has the highest impact on increasing credit transfer payments
o No rebating has negative impact on credit transfer payments
Timings
o No impact seen
Merchant cost information
o Slightly negative impact on credit transfer payments
Education stimulus
o Positive impact on credit transfer payments in second choice task
5.3 Findings of multivariate analysis
In this section, we present the summary results of the multivariate analysis conducted, using binary logistic regression to identify the major determinants which influenced cost-conscious payment behaviour in the choice experiments. Cost-conscious payment behaviour is defined as respondents choosing cash in the offline scenario and credit transfer in the online scenario26.
The first goal of the multivariate analysis was to identify what influences payment tool decisions27. The second goal paid particular attention to the potential effects of the various policy options under evaluation in this study.
The presentation of the results begins in Chapter 5.3.1 with the summary results of what we refer to as the ‘base model’, i.e. not controlling for the potential effects of policy options, but focussing on the main individual biases and external barriers.
This is followed by Chapter 5.3.2 which adds the policy stimuli to the base model to identify the most effective measure to make more informed choices among debit and/or credit card owners.
To make it easier to read, in the following analysis, exact technical values are replaced by graphs showing the direction and strength of influence for at least moderately significant factors. The appendix provides a detailed overview of the results of the following multivariate analysis.
26 Technically speaking, this means that for the logistic regressions (the results of which are shown below) in
the offline scenario(s) if cash was chosen or in the online scenario(s) if credit transfer was the selected option then the dependent variable was coded as ‘1’.
27 Furthermore we have run all these models with a dependent variable of most expensive choice in order to analyse irrational payment behaviour. The most expensive choice was defined by choosing online payment system in the online scenario and credit card in the offline scenario. For respondents without a credit card, debit card was assigned to be the most expensive choice. On the whole, the multivariate analysis show the same results but in the opposite direction of influence. Hence, the validity of the subsequent results can be additionally confirmed.
68
5.3.1 Main biases and barriers of rational choices
The previous chapters have already discussed the potential variables included within the base model in detail. The selection was based on conceptual considerations and in-depth analysis of the bivariate associations between the variables considered as well as the dependent variable for the behavioural experiments.
There are actually two base models: one for the offline and one for the online scenario. However, they are structured in a similar way, and both cover the following six dimensions:
Purchase value, Relevance of goals, Cards available, Payment habits, Cost awareness, Socio-demographics.
The decision to include the purchase value as a variable was made as separate analysis did not show any substantially different results. The high and low purchase values were therefore combined into one variable for the base regression model.
Socio-demographic variables were selected according to their expected and/or actual impact on payment choices. Country, age, gender and education have a significant impact, while income levels did not although expected to do so28.
The two base models are both statistically significant and explain a reasonable portion of the variation in the dependent variable. The offline model explains about 38%29 of the behavioural variance, whereas the online model explains about 19% both with significances well below 0.001.
Within both base models almost all included variables are having a strong influence on cost-conscious choices with some plausible distinctions between the online and offline version.
28 We know from other financial research that these topics are often influenced by income or asset levels. The
lack of any visible impact might be due to the difficulties of collecting realistic answers of such a sensitive topic via online research as well as cross-country difficulties in capturing country-specific categories.
29 Binary logistical regression models are typically evaluated by Pseudo R2 to assess the quality of the model by its explanatory power. The displayed R2 has been defined according to Nagelkerke.
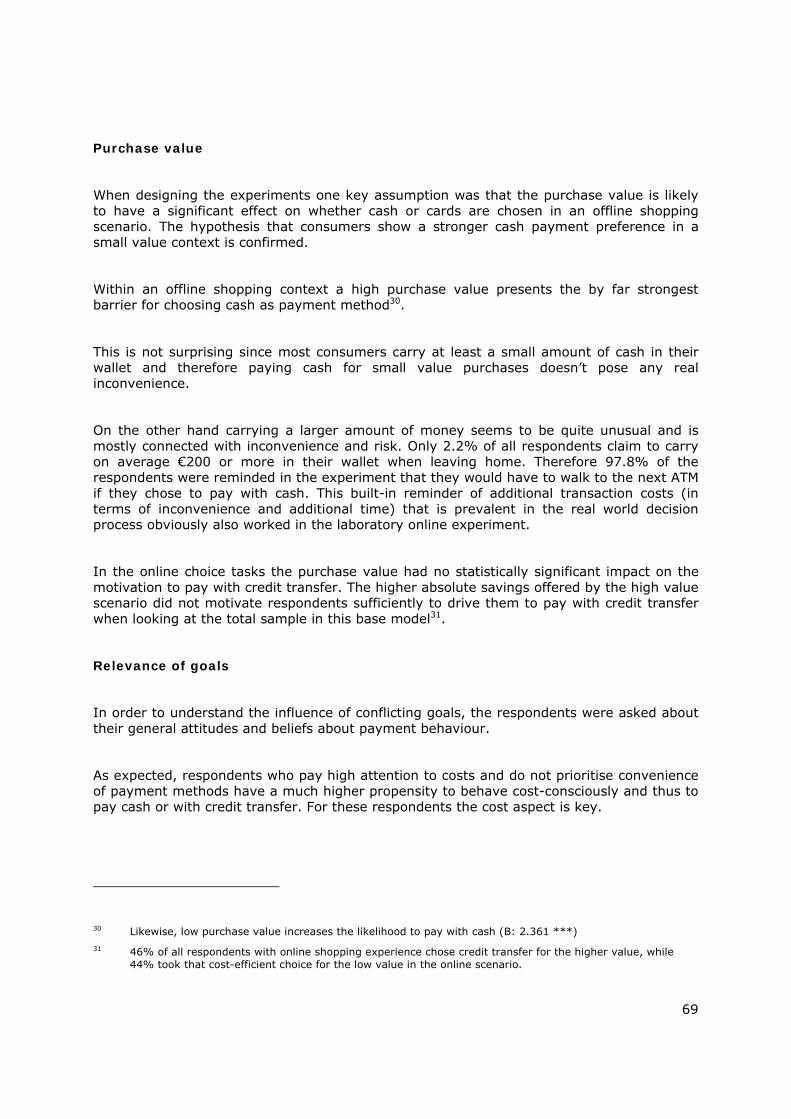
69
Purchase value
When designing the experiments one key assumption was that the purchase value is likely to have a significant effect on whether cash or cards are chosen in an offline shopping scenario. The hypothesis that consumers show a stronger cash payment preference in a small value context is confirmed.
Within an offline shopping context a high purchase value presents the by far strongest barrier for choosing cash as payment method30.
This is not surprising since most consumers carry at least a small amount of cash in their wallet and therefore paying cash for small value purchases doesn’t pose any real inconvenience.
On the other hand carrying a larger amount of money seems to be quite unusual and is mostly connected with inconvenience and risk. Only 2.2% of all respondents claim to carry on average €200 or more in their wallet when leaving home. Therefore 97.8% of the respondents were reminded in the experiment that they would have to walk to the next ATM if they chose to pay with cash. This built-in reminder of additional transaction costs (in terms of inconvenience and additional time) that is prevalent in the real world decision process obviously also worked in the laboratory online experiment.
In the online choice tasks the purchase value had no statistically significant impact on the motivation to pay with credit transfer. The higher absolute savings offered by the high value scenario did not motivate respondents sufficiently to drive them to pay with credit transfer when looking at the total sample in this base model31.
Relevance of goals
In order to understand the influence of conflicting goals, the respondents were asked about their general attitudes and beliefs about payment behaviour.
As expected, respondents who pay high attention to costs and do not prioritise convenience of payment methods have a much higher propensity to behave cost-consciously and thus to pay cash or with credit transfer. For these respondents the cost aspect is key.
30 Likewise, low purchase value increases the likelihood to pay with cash (B: 2.361 ***) 31 46% of all respondents with online shopping experience chose credit transfer for the higher value, while
44% took that cost-efficient choice for the low value in the online scenario.
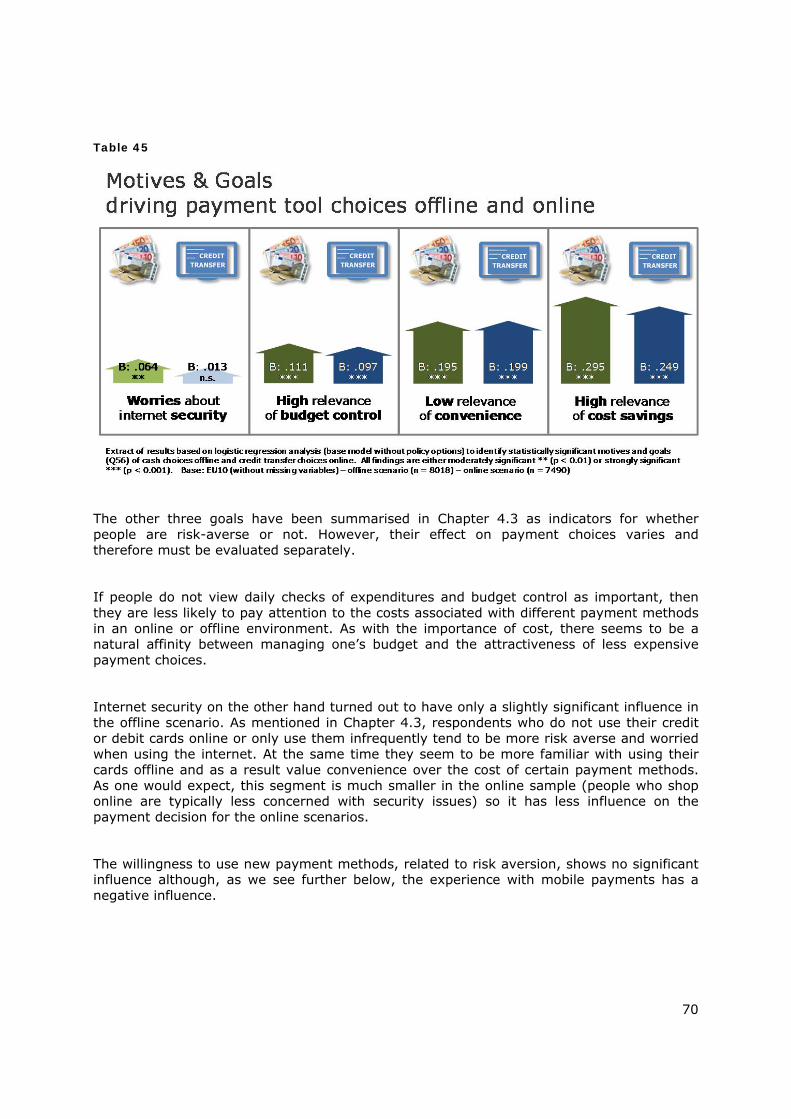
70
Table 45
The other three goals have been summarised in Chapter 4.3 as indicators for whether people are risk-averse or not. However, their effect on payment choices varies and therefore must be evaluated separately.
If people do not view daily checks of expenditures and budget control as important, then they are less likely to pay attention to the costs associated with different payment methods in an online or offline environment. As with the importance of cost, there seems to be a natural affinity between managing one’s budget and the attractiveness of less expensive payment choices.
Internet security on the other hand turned out to have only a slightly significant influence in the offline scenario. As mentioned in Chapter 4.3, respondents who do not use their credit or debit cards online or only use them infrequently tend to be more risk averse and worried when using the internet. At the same time they seem to be more familiar with using their cards offline and as a result value convenience over the cost of certain payment methods. As one would expect, this segment is much smaller in the online sample (people who shop online are typically less concerned with security issues) so it has less influence on the payment decision for the online scenarios.
The willingness to use new payment methods, related to risk aversion, shows no significant influence although, as we see further below, the experience with mobile payments has a negative influence.
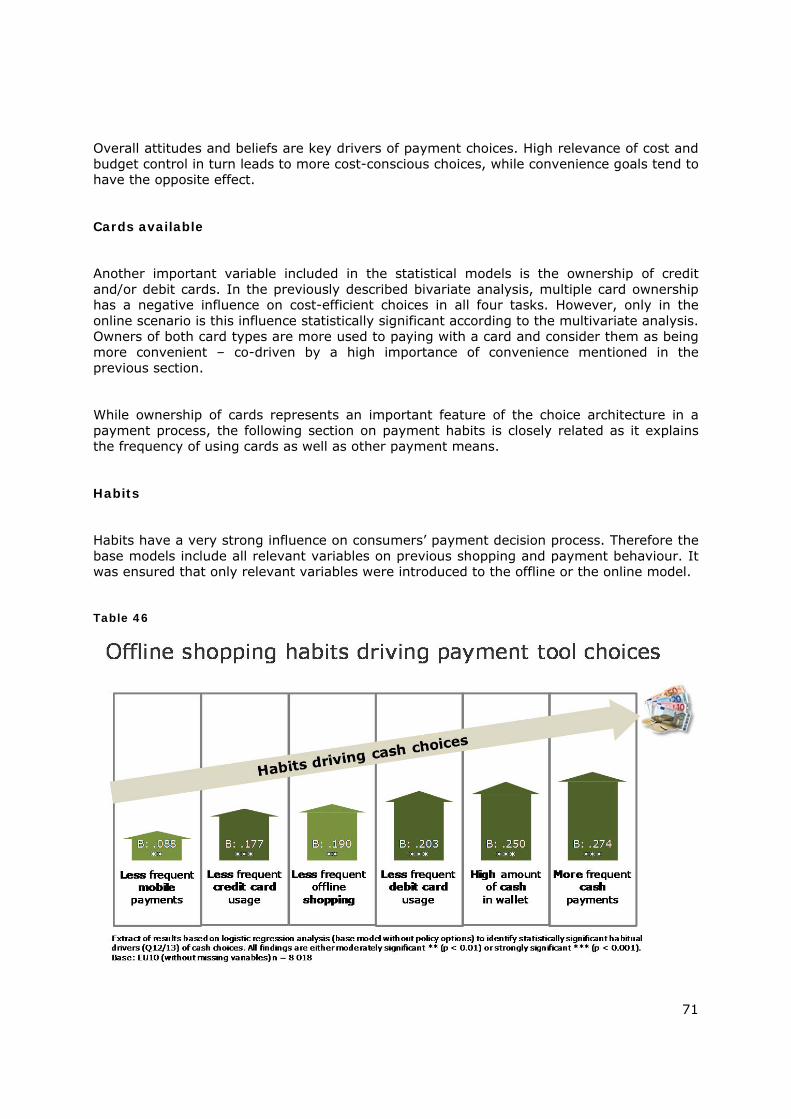
71
Overall attitudes and beliefs are key drivers of payment choices. High relevance of cost and budget control in turn leads to more cost-conscious choices, while convenience goals tend to have the opposite effect.
Cards available
Another important variable included in the statistical models is the ownership of credit and/or debit cards. In the previously described bivariate analysis, multiple card ownership has a negative influence on cost-efficient choices in all four tasks. However, only in the online scenario is this influence statistically significant according to the multivariate analysis. Owners of both card types are more used to paying with a card and consider them as being more convenient – co-driven by a high importance of convenience mentioned in the previous section.
While ownership of cards represents an important feature of the choice architecture in a payment process, the following section on payment habits is closely related as it explains the frequency of using cards as well as other payment means.
Habits
Habits have a very strong influence on consumers’ payment decision process. Therefore the base models include all relevant variables on previous shopping and payment behaviour. It was ensured that only relevant variables were introduced to the offline or the online model.
Table 46
72
All habitual factors in the model for the offline scenario were statistically significant. As expected there is a strongly significant positive relationship between the amount of cash in wallet and the probability of paying cash. That means that the higher the amount of cash a respondent has in the wallet the more likely that s/he will pay with cash in the offline choice experiment. This interdependency has already been described before in relation to the purchase value.
In all model specifications one can see that those who shop most frequently, regardless of online or offline, are least likely to pay by cash or credit transfer. This aspect might also be related to convenience and everyday shopping habits. As expected, the multivariate analysis shows that people tend to stick with their habitual behaviours. Thus, the more a respondent is used to pay with a certain payment method the less is her or his willingness to change this behaviour.
The only difference between the online and offline results is that the habit of using the more expensive payment options of cards or OPS does not show any effect on choosing the most cost-efficient method. The key habits that influence the cost-conscious online decision are the frequency of shopping online and paying by credit transfer as well as (only moderately significant) the lack of relevance of reward points associated with credit cards.
Table 47
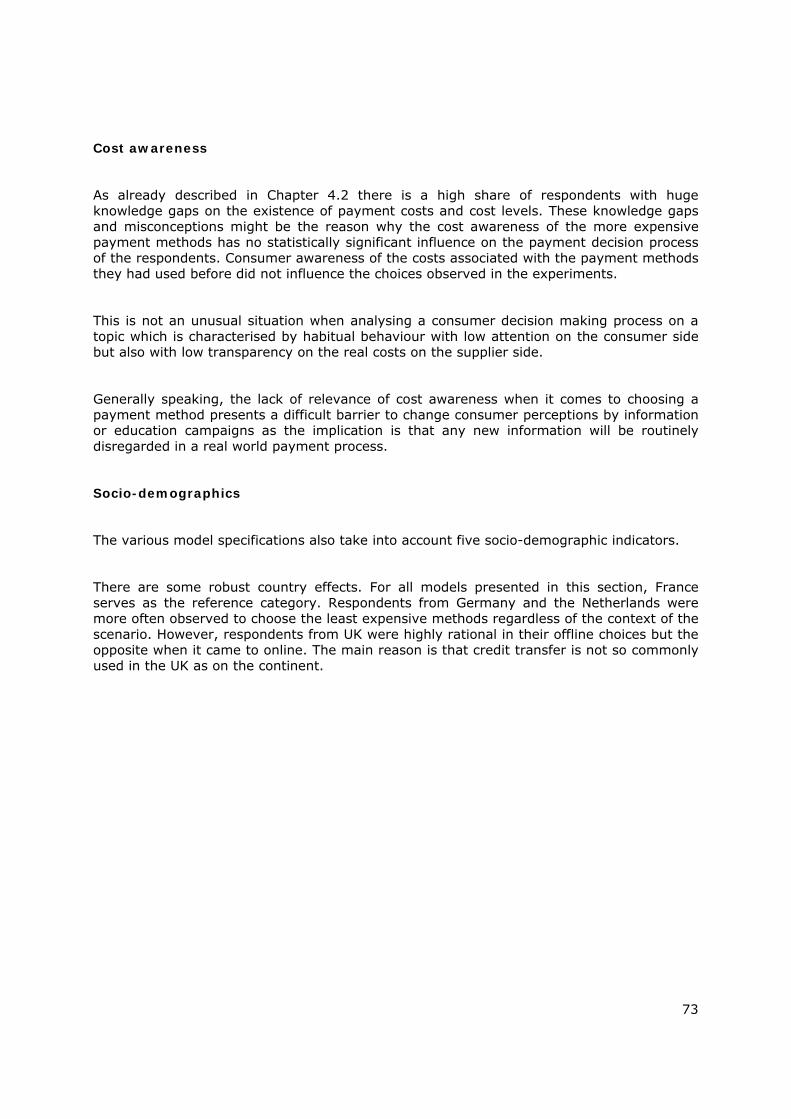
73
Cost awareness
As already described in Chapter 4.2 there is a high share of respondents with huge knowledge gaps on the existence of payment costs and cost levels. These knowledge gaps and misconceptions might be the reason why the cost awareness of the more expensive payment methods has no statistically significant influence on the payment decision process of the respondents. Consumer awareness of the costs associated with the payment methods they had used before did not influence the choices observed in the experiments.
This is not an unusual situation when analysing a consumer decision making process on a topic which is characterised by habitual behaviour with low attention on the consumer side but also with low transparency on the real costs on the supplier side.
Generally speaking, the lack of relevance of cost awareness when it comes to choosing a payment method presents a difficult barrier to change consumer perceptions by information or education campaigns as the implication is that any new information will be routinely disregarded in a real world payment process.
Socio-demographics
The various model specifications also take into account five socio-demographic indicators.
There are some robust country effects. For all models presented in this section, France serves as the reference category. Respondents from Germany and the Netherlands were more often observed to choose the least expensive methods regardless of the context of the scenario. However, respondents from UK were highly rational in their offline choices but the opposite when it came to online. The main reason is that credit transfer is not so commonly used in the UK as on the continent.
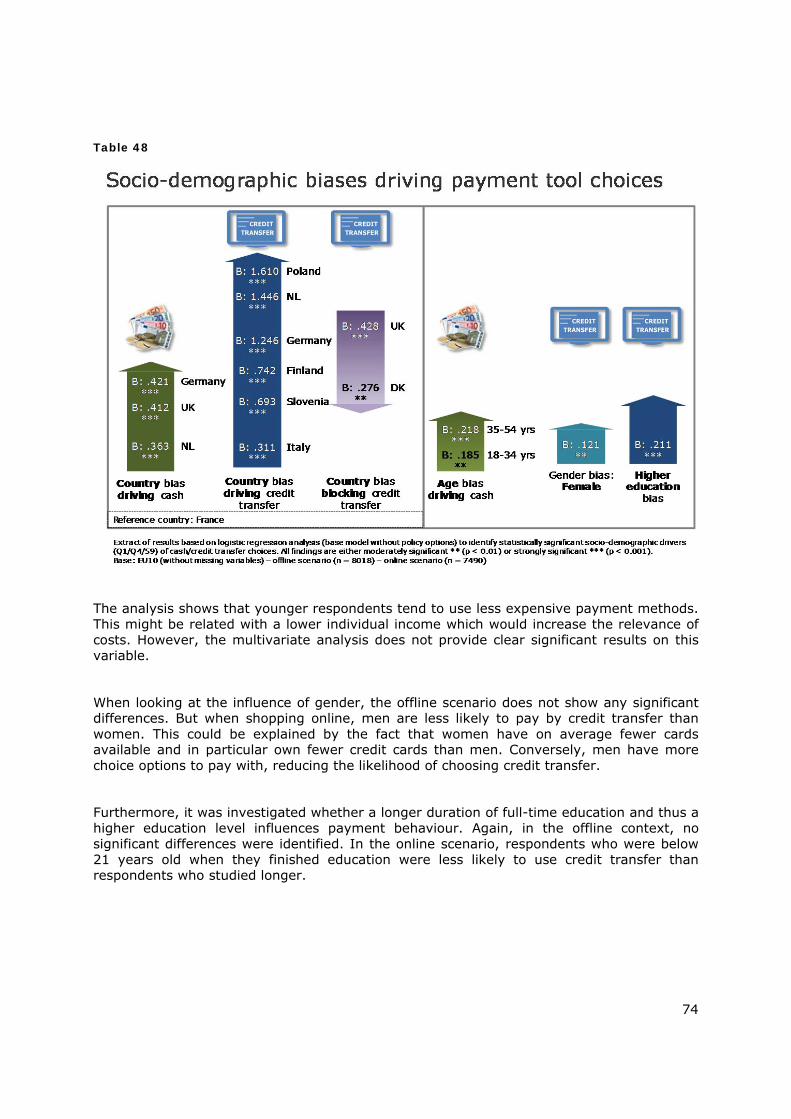
74
Table 48
The analysis shows that younger respondents tend to use less expensive payment methods. This might be related with a lower individual income which would increase the relevance of costs. However, the multivariate analysis does not provide clear significant results on this variable.
When looking at the influence of gender, the offline scenario does not show any significant differences. But when shopping online, men are less likely to pay by credit transfer than women. This could be explained by the fact that women have on average fewer cards available and in particular own fewer credit cards than men. Conversely, men have more choice options to pay with, reducing the likelihood of choosing credit transfer.
Furthermore, it was investigated whether a longer duration of full-time education and thus a higher education level influences payment behaviour. Again, in the offline context, no significant differences were identified. In the online scenario, respondents who were below 21 years old when they finished education were less likely to use credit transfer than respondents who studied longer.
75
In summary the main biases and barriers of cost-conscious choices are:
- Beliefs and attitudes
o Low relevance of costs and budget control
o High relevance of convenience
- Payment habits
o High frequency of shopping online or offline
o Low frequency of paying by the cheapest method
o High frequency of paying with more expensive methods (only offline)
o Low amount of cash in wallet in combination with high purchase values (only offline)
- Having more than one card scheme available (debit and credit card)
- Socio-demographics
o Cultural traditions in UK ‘credit transfer not common’ and Denmark ‘dominant debit card scheme of Dankort’ (both only online)
o Age 55+ (offline), age 35+ (online)
o Men (only online)
o Lower education levels (only online)
5.3.2 Effectiveness of tested policy options
To answer the second key question in this research on the most effective policy options, the base model was enhanced by adding the tested policy stimuli.
There are different ways of including these variables, either as individual stimuli as presented in the previous chapters.
- No rebate - Rebate - Surcharge - Education - Merchant costs - Timings
Alternatively they can be presented as individual treatment splits with policy combinations, e.g.:
- Split 1: no rebate and no other information (control group) - Split 2: no rebate with merchant cost information on receipt - … - Split 31: surcharge with information at entrance and till with merchant costs and
education
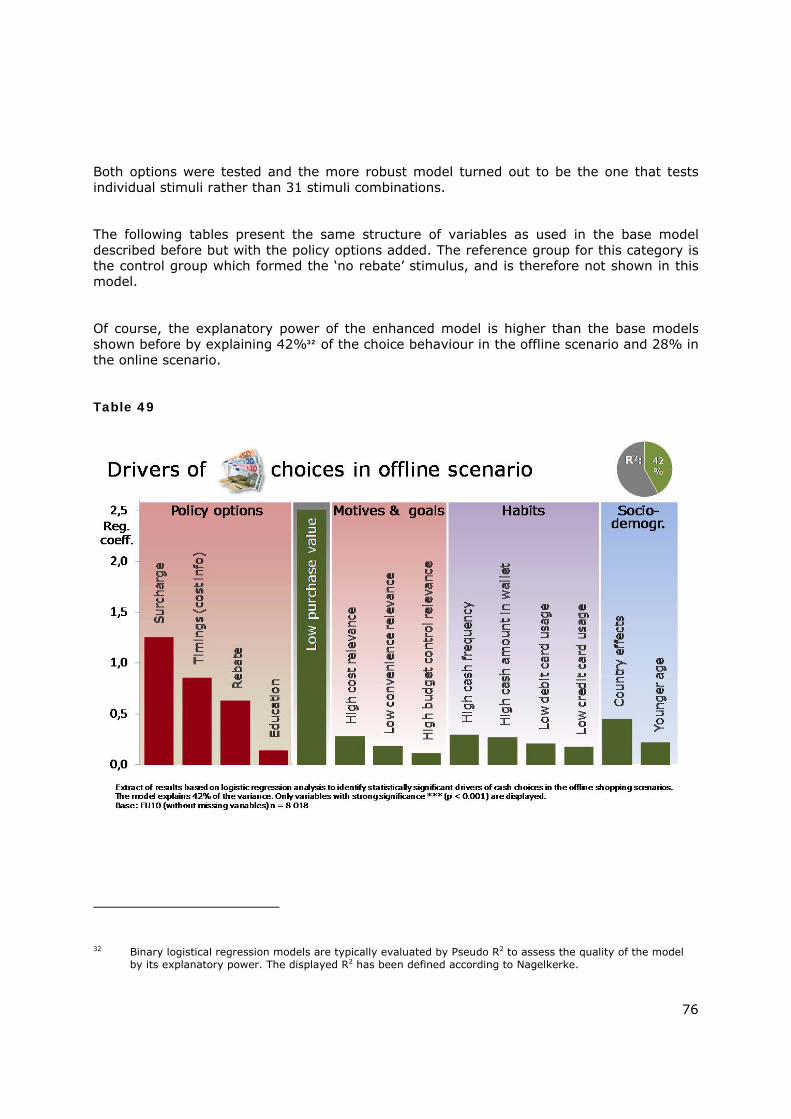
76
Both options were tested and the more robust model turned out to be the one that tests individual stimuli rather than 31 stimuli combinations.
The following tables present the same structure of variables as used in the base model described before but with the policy options added. The reference group for this category is the control group which formed the ‘no rebate’ stimulus, and is therefore not shown in this model.
Of course, the explanatory power of the enhanced model is higher than the base models shown before by explaining 42%32 of the choice behaviour in the offline scenario and 28% in the online scenario.
Table 49
32 Binary logistical regression models are typically evaluated by Pseudo R2 to assess the quality of the model
by its explanatory power. The displayed R2 has been defined according to Nagelkerke.
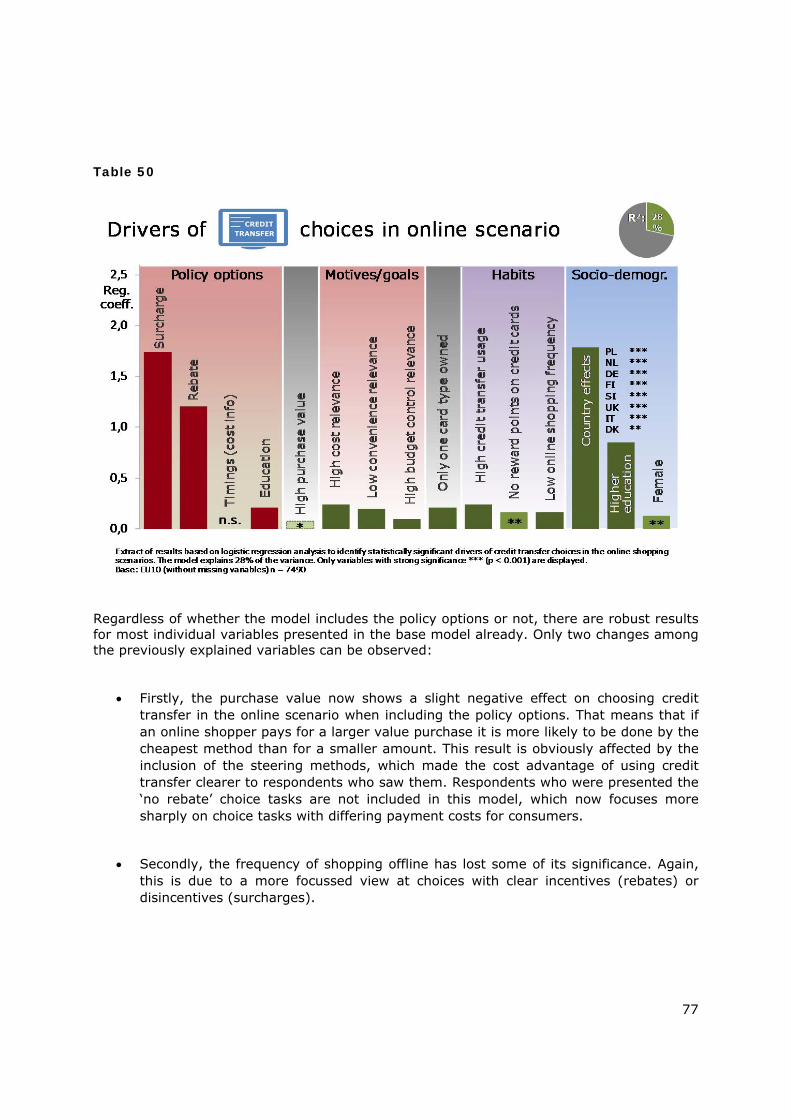
77
Table 50
Regardless of whether the model includes the policy options or not, there are robust results for most individual variables presented in the base model already. Only two changes among the previously explained variables can be observed:
Firstly, the purchase value now shows a slight negative effect on choosing credit transfer in the online scenario when including the policy options. That means that if an online shopper pays for a larger value purchase it is more likely to be done by the cheapest method than for a smaller amount. This result is obviously affected by the inclusion of the steering methods, which made the cost advantage of using credit transfer clearer to respondents who saw them. Respondents who were presented the ‘no rebate’ choice tasks are not included in this model, which now focuses more sharply on choice tasks with differing payment costs for consumers.
Secondly, the frequency of shopping offline has lost some of its significance. Again, this is due to a more focussed view at choices with clear incentives (rebates) or disincentives (surcharges).
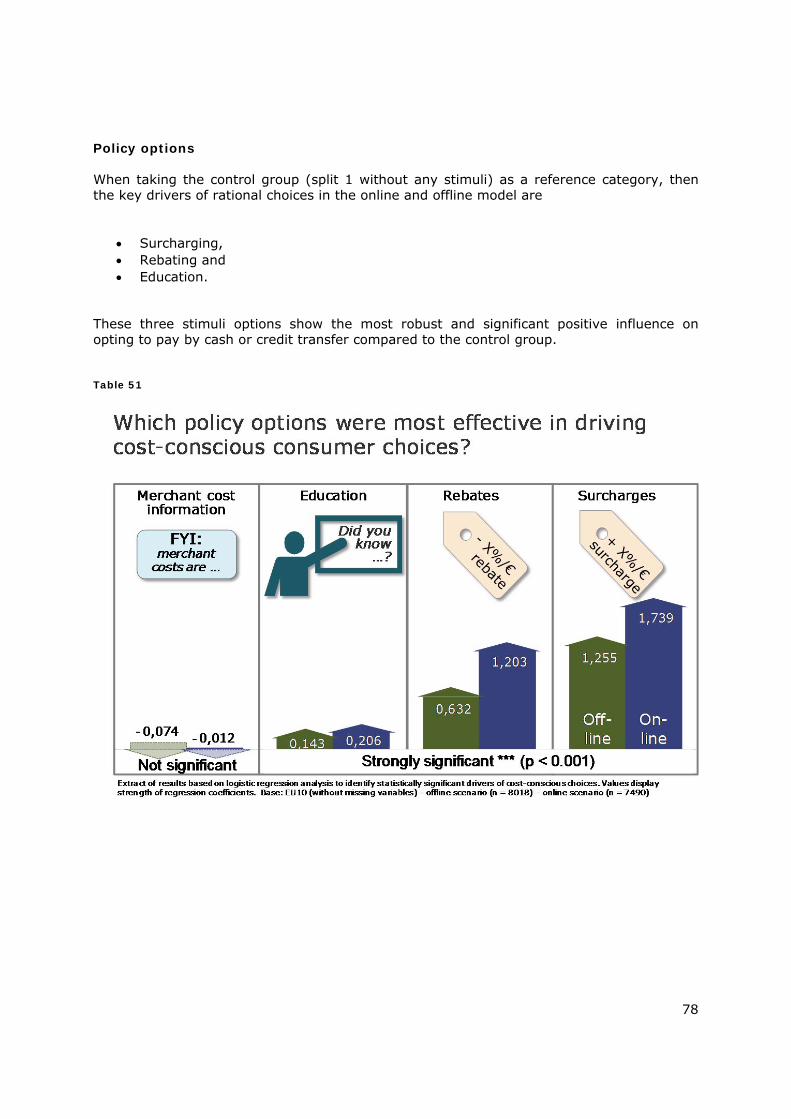
78
Policy options
When taking the control group (split 1 without any stimuli) as a reference category, then the key drivers of rational choices in the online and offline model are
Surcharging, Rebating and Education.
These three stimuli options show the most robust and significant positive influence on opting to pay by cash or credit transfer compared to the control group.
Table 51
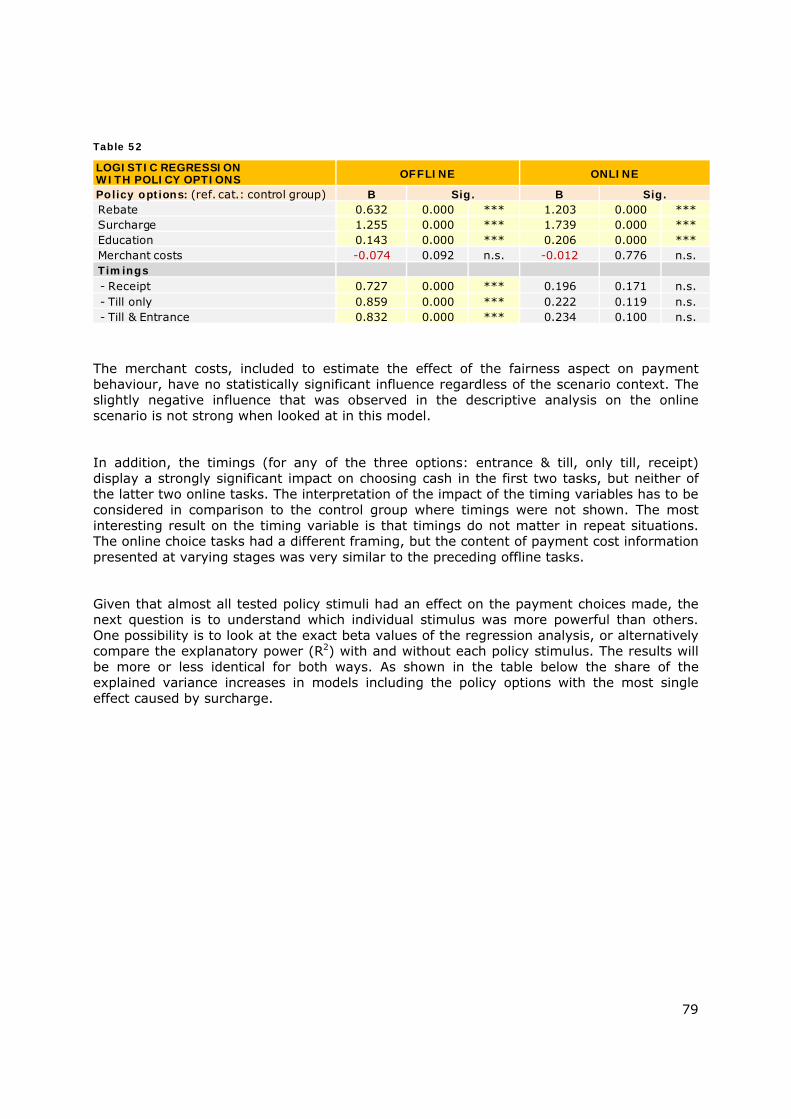
79
Table 52
The merchant costs, included to estimate the effect of the fairness aspect on payment behaviour, have no statistically significant influence regardless of the scenario context. The slightly negative influence that was observed in the descriptive analysis on the online scenario is not strong when looked at in this model.
In addition, the timings (for any of the three options: entrance & till, only till, receipt) display a strongly significant impact on choosing cash in the first two tasks, but neither of the latter two online tasks. The interpretation of the impact of the timing variables has to be considered in comparison to the control group where timings were not shown. The most interesting result on the timing variable is that timings do not matter in repeat situations. The online choice tasks had a different framing, but the content of payment cost information presented at varying stages was very similar to the preceding offline tasks.
Given that almost all tested policy stimuli had an effect on the payment choices made, the next question is to understand which individual stimulus was more powerful than others. One possibility is to look at the exact beta values of the regression analysis, or alternatively compare the explanatory power (R2) with and without each policy stimulus. The results will be more or less identical for both ways. As shown in the table below the share of the explained variance increases in models including the policy options with the most single effect caused by surcharge.
LOGISTIC REGRESSIONWITH POLICY OPTIONS OFFLINE ONLINE
Policy options: (ref. cat.: control group) B Sig. B Sig.Rebate 0.632 0.000 *** 1.203 0.000 ***Surcharge 1.255 0.000 *** 1.739 0.000 ***Education 0.143 0.000 *** 0.206 0.000 ***Merchant costs -0.074 0.092 n.s. -0.012 0.776 n.s.Timings- Receipt 0.727 0.000 *** 0.196 0.171 n.s.- Till only 0.859 0.000 *** 0.222 0.119 n.s.- Till & Entrance 0.832 0.000 *** 0.234 0.100 n.s.
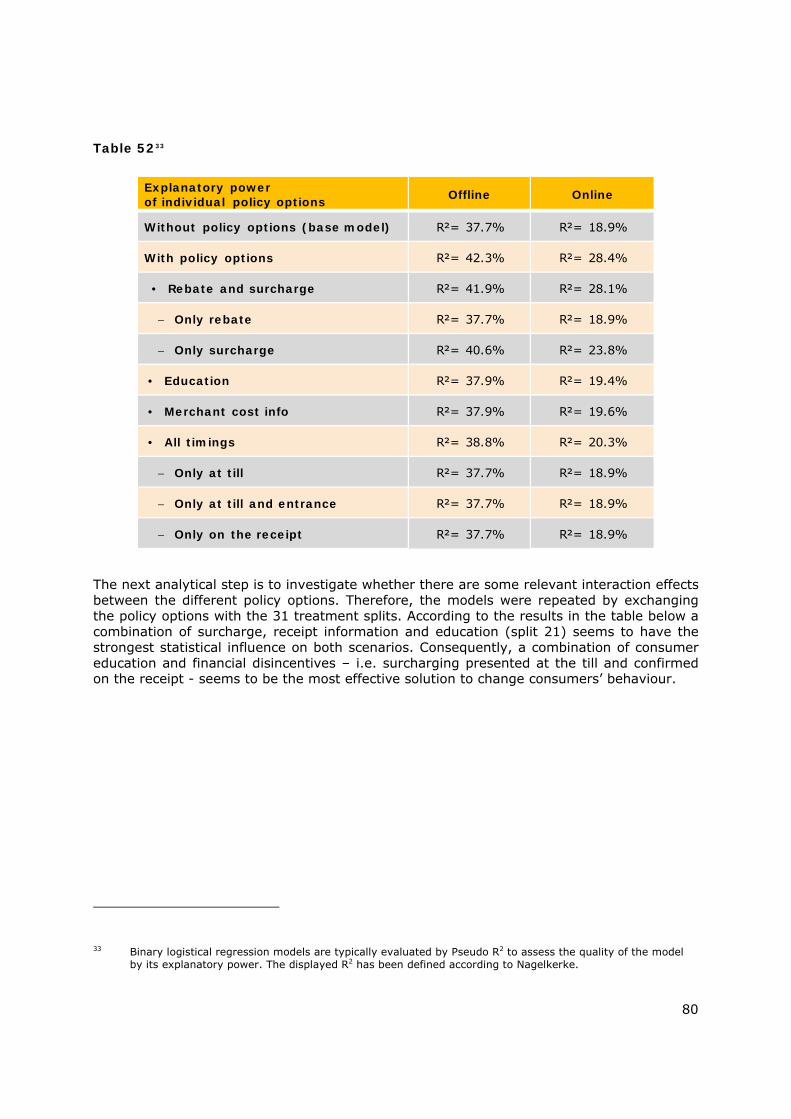
80
Table 5233
The next analytical step is to investigate whether there are some relevant interaction effects between the different policy options. Therefore, the models were repeated by exchanging the policy options with the 31 treatment splits. According to the results in the table below a combination of surcharge, receipt information and education (split 21) seems to have the strongest statistical influence on both scenarios. Consequently, a combination of consumer education and financial disincentives – i.e. surcharging presented at the till and confirmed on the receipt - seems to be the most effective solution to change consumers’ behaviour.
33 Binary logistical regression models are typically evaluated by Pseudo R2 to assess the quality of the model
by its explanatory power. The displayed R2 has been defined according to Nagelkerke.
Explanatory power of individual policy options Offline Online
Without policy options (base model) R²= 37.7% R²= 18.9%
With policy options R²= 42.3% R²= 28.4%
• Rebate and surcharge R²= 41.9% R²= 28.1%
Only rebate R²= 37.7% R²= 18.9%
Only surcharge R²= 40.6% R²= 23.8%
• Education R²= 37.9% R²= 19.4%
• Merchant cost info R²= 37.9% R²= 19.6%
• All timings R²= 38.8% R²= 20.3%
Only at till R²= 37.7% R²= 18.9%
Only at till and entrance R²= 37.7% R²= 18.9%
Only on the receipt R²= 37.7% R²= 18.9%

81
Table 53
However, the difference of the impact strength (the value shown in column B) between the split version with the highest ranking and the top 10 combinations are not large. The following patterns are apparent, when looking at the commonalities and differences of the top 10 splits:
- All combinations include surcharges - 6 splits out of the top 10 show education - 4 splits out of the top 10 show merchant cost information - Equal spread of timings within the top 10
Another analytical approach to see if there is any relevant interdependency between the timing and steering mechanism is to go back to our previous base model with individual policy stimuli and add the combinations of timing options and steering options.
The goal of this analysis is to identify if there is any best or worse timing for surcharges, rebates or for no rebates.
LOGISTIC REGRESSIONWITH POLICY OPTIONS OFFLINE ONLINE RANK
Policy options: (ref. cat.: control group) B Sig. B Sig.Split 2: no rebate – receipt – mc 0.288 0.082 n.s. -0.035 0.848 n.s. 30Split 3: no rebate – receipt – mc – edu 0.482 0.003 ** 0.152 0.379 n.s. 29Split 4: no rebate – till – mc 0.977 0.000 *** 0.181 0.287 n.s. 27Split 5: no rebate – till – mc – edu 1.041 0.000 *** 0.655 0.000 *** 26Split 6: no rebate – enttill – mc 0.817 0.000 *** 0.169 0.328 n.s. 28Split 7: no rebate – enttill – mc – edu 1.170 0.000 *** 0.640 0.000 *** 25Split 8: rebate – receipt 1.307 0.000 *** 1.408 0.000 *** 21Split 9: rebate – receipt - edu 1.543 0.000 *** 1.501 0.000 *** 19Split 10: rebate – till 1.369 0.000 *** 1.444 0.000 *** 20Split 11: rebate – till – edu 1.644 0.000 *** 1.621 0.000 *** 16Split 12: rebate – enttill 1.287 0.000 *** 1.374 0.000 *** 22Split 13: rebate – enttill – edu 1.649 0.000 *** 1.664 0.000 *** 15Split 14: rebate – receipt – mc 1.444 0.000 *** 1.614 0.000 *** 18Split 15: rebate – receipt – mc – edu 1.616 0.000 *** 1.719 0.000 *** 14Split 16: rebate – till – mc 1.385 0.000 *** 1.171 0.000 *** 24Split 17: rebate – till – mc – edu 1.626 0.000 *** 1.752 0.000 *** 13Split 18: rebate – enttill – mc 1.323 0.000 *** 1.279 0.000 *** 23Split 19: rebate – enttill – mc – edu 1.533 0.000 *** 1.687 0.000 *** 17Split 20: surcharge – receipt 1.994 0.000 *** 2.050 0.000 *** 9Split 21: surcharge – receipt – edu 2.354 0.000 *** 2.244 0.000 *** 1Split 22: surcharge – till 2.252 0.000 *** 1.985 0.000 *** 5Split 23: surcharge – till – edu 2.000 0.000 *** 2.086 0.000 *** 7Split 24: surcharge – enttill 2.248 0.000 *** 2.068 0.000 *** 3Split 25: surcharge – enttill – edu 2.271 0.000 *** 2.077 0.000 *** 2Split 26: surcharge – receipt – mc 2.021 0.000 *** 1.844 0.000 *** 12Split 27: surcharge – receipt – mc – edu 2.037 0.000 *** 2.055 0.000 *** 6Split 28: surcharge – till – mc 2.117 0.000 *** 2.175 0.000 *** 4Split 29: surcharge – till – mc – edu 2.056 0.000 *** 1.963 0.000 *** 10Split 30: surcharge – enttill – mc 1.937 0.000 *** 2.020 0.000 *** 11Split 31: surcharge – enttill – mc – edu 1.934 0.000 *** 2.127 0.000 *** 8
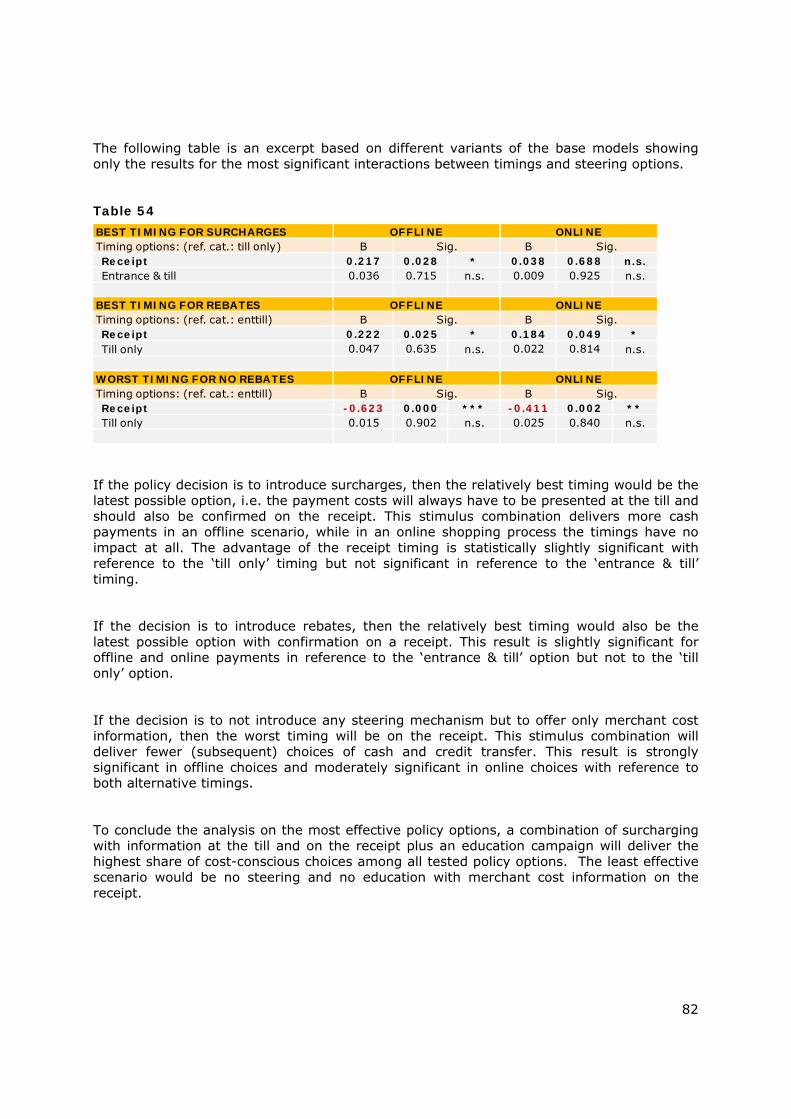
82
The following table is an excerpt based on different variants of the base models showing only the results for the most significant interactions between timings and steering options.
Table 54
If the policy decision is to introduce surcharges, then the relatively best timing would be the latest possible option, i.e. the payment costs will always have to be presented at the till and should also be confirmed on the receipt. This stimulus combination delivers more cash payments in an offline scenario, while in an online shopping process the timings have no impact at all. The advantage of the receipt timing is statistically slightly significant with reference to the ‘till only’ timing but not significant in reference to the ‘entrance & till’ timing.
If the decision is to introduce rebates, then the relatively best timing would also be the latest possible option with confirmation on a receipt. This result is slightly significant for offline and online payments in reference to the ‘entrance & till’ option but not to the ‘till only’ option.
If the decision is to not introduce any steering mechanism but to offer only merchant cost information, then the worst timing will be on the receipt. This stimulus combination will deliver fewer (subsequent) choices of cash and credit transfer. This result is strongly significant in offline choices and moderately significant in online choices with reference to both alternative timings.
To conclude the analysis on the most effective policy options, a combination of surcharging with information at the till and on the receipt plus an education campaign will deliver the highest share of cost-conscious choices among all tested policy options. The least effective scenario would be no steering and no education with merchant cost information on the receipt.
BEST TIMING FOR SURCHARGES OFFLINE ONLINETiming options: (ref. cat.: till only) B Sig. B Sig.Receipt 0.217 0.028 * 0.038 0.688 n.s.Entrance & till 0.036 0.715 n.s. 0.009 0.925 n.s.
BEST TIMING FOR REBATES OFFLINE ONLINETiming options: (ref. cat.: enttill) B Sig. B Sig.Receipt 0.222 0.025 * 0.184 0.049 *Till only 0.047 0.635 n.s. 0.022 0.814 n.s.
WORST TIMING FOR NO REBATES OFFLINE ONLINETiming options: (ref. cat.: enttill) B Sig. B Sig.Receipt -0.623 0.000 *** -0.411 0.002 **Till only 0.015 0.902 n.s. 0.025 0.840 n.s.
83
5.3.3 Drivers of relevance of payment costs
In addition to the main research objectives covered in the previous sections there are further insights that can help to fine tune recommendations based on the behavioural study. This section covers the question about what makes payment costs an issue which is salient (or relevant) to consumers.
While the question about whether consumers bother about the costs of different payment methods is the key survey metric for cost-conscious behaviour, the data shows that over one third of European consumers do not bother about payment costs at all. Therefore, it can be valuable to look more closely at the factors that influence the level of relevance of payment costs to consumers.
There are several hypotheses for how the relevance of payment costs might be influenced e.g.
a) A general lack of cost awareness, b) Similar cost perceptions for different payment methods, c) Not being exposed to the education treatment in the experiment, d) No previous experience with rebates or surcharging.
To identify the relevant drivers a logistical regression model was developed with the goal variable “I bother about payment costs” and a set of potentially influencing variables covering similar dimensions as in the base model used before – adjusted to the new analytical focus:
experience, awareness, images of costs (as above) relevance of other motives and goals (as in base model) cards owned and payment habits (as in base model) socio-demographics (countries, gender, age, education as in base model)
a) The lack of cost awareness34 does not turn out to be related to the relevance of payment costs. At first glance, there even seems to be a reverse relationship indicating that awareness of payment costs has a tendency to reduce the issue salience. However, this is not statistically significant at all. The statistical analysis reveals that there is no stable correlation or influence of a conscious awareness of costs that can explain the individual relevance of costs.
34 The lack of cost awareness was defined as follows: Respondents who did not say “yes, I am charged each
time I am paying with a debit card, credit card or online payment system” (in Q23.2/3/7). If a respondent said yes at least to one of these payment methods, s/he would be considered to be aware of payment costs.
84
b) Moreover, having similar cost perceptions35 for different payment methods are likewise not the cause of low issue salience. There is again a slight tendency for a reverse correlation, which again is not statistically significant. This supports the notion that the questions about cost awareness and cost images asked before the experiments are merely based on vague images rather than hard facts – which is no surprise given the lack of transparency in this market.
c) The education treatment – which was effective in influencing choice behaviour within the experiments – did not change the overall salience of payment costs to consumers, which was collected after the experiments. This suggests that the ‘one-time exposure’ of an education treatment has primarily only influenced those consumers who were already interested in payment costs. In order to effect a more sustainable change in belief (and behaviour), it is obviously not enough to offer a single and/or one-off treatment.
d) Among all of the tested hypotheses the key driver of issue salience was revealed to be previous experience with being surcharged within the past 2 years for choosing a specific payment method. This was the only variable that showed a very strong statistical influence. By contrast, previous experience with rebates or discounts had no discernible influence.
These overall observations seem to reflect the typical behavioural phenomenon of loss aversion. People feel a loss more acutely than an equivalent gain and therefore tend to put more effort into avoiding loss than ensuring gain. Since surcharges are incentives framed as a loss and rebates are incentives framed as a gain, rebates are more popular and accepted but surcharges are more memorable and more effective in influencing sustainable beliefs and behaviour.
35 Similar cost perceptions were defined as follows: Respondents who evaluated the cost of payment methods
with similar answers, i.e. either all “low or very low” or all “OK” or all “high or very high” or all “DK” (Q22.2).
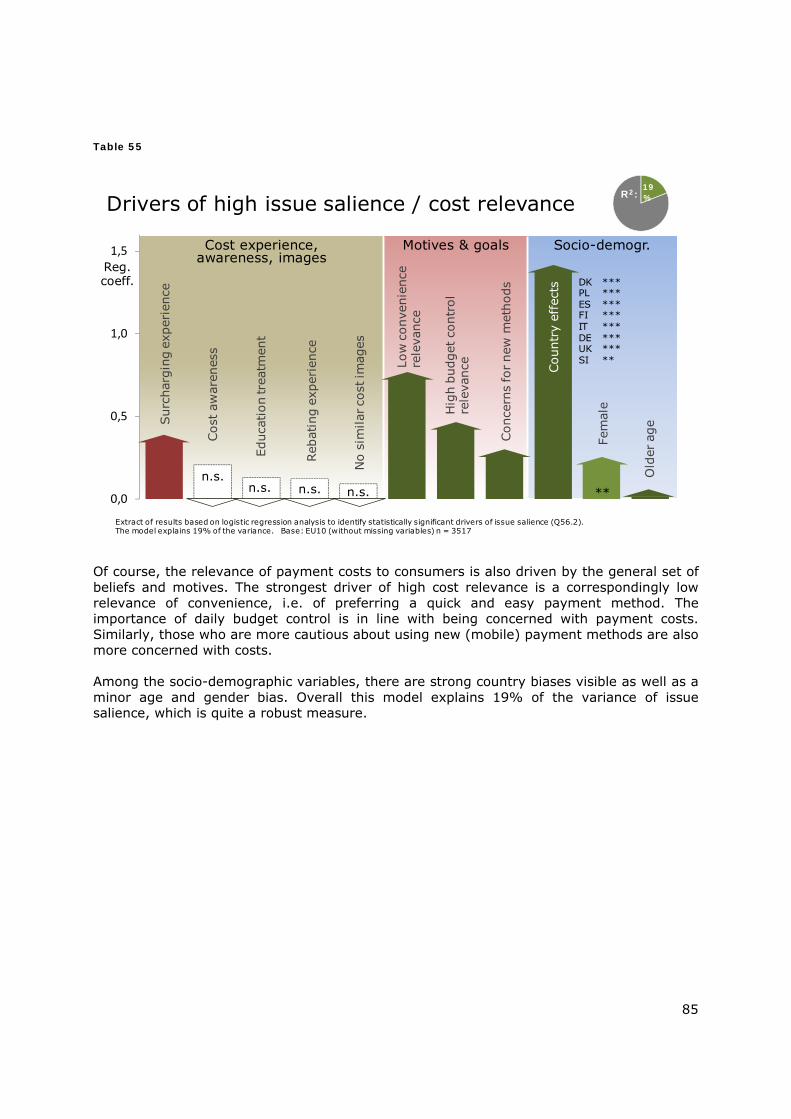
85
Table 55
Of course, the relevance of payment costs to consumers is also driven by the general set of beliefs and motives. The strongest driver of high cost relevance is a correspondingly low relevance of convenience, i.e. of preferring a quick and easy payment method. The importance of daily budget control is in line with being concerned with payment costs. Similarly, those who are more cautious about using new (mobile) payment methods are also more concerned with costs. Among the socio-demographic variables, there are strong country biases visible as well as a minor age and gender bias. Overall this model explains 19% of the variance of issue salience, which is quite a robust measure.
Reg. coeff.
Extract of results based on logistic regression analysis to identify statistically significant drivers of issue salience (Q56.2). The model explains 19% of the variance. Base: EU10 (without missing variables) n = 3517
0,0
0,5
1,0
1,5 Cost experience, awareness, images
Motives & goals Socio-demogr.
Drivers of high issue salience / cost relevance19%R2:
No
sim
ilar c
ost i
mag
es
Sur
char
ging
exp
erie
nce
Cos
t aw
aren
ess
Educ
atio
n tr
eatm
ent
Reb
atin
g ex
peri
ence
Fem
ale
Con
cern
s fo
r ne
w m
etho
ds
Old
er a
ge
n.s.**
Cou
ntry
eff
ects
n.s. n.s. n.s.
Hig
h bu
dget
con
trol
re
leva
nceLo
w c
onve
nien
ce
rele
vanc
e
DK ***PL ***ES ***FI ***IT ***DE ***UK ***SI **
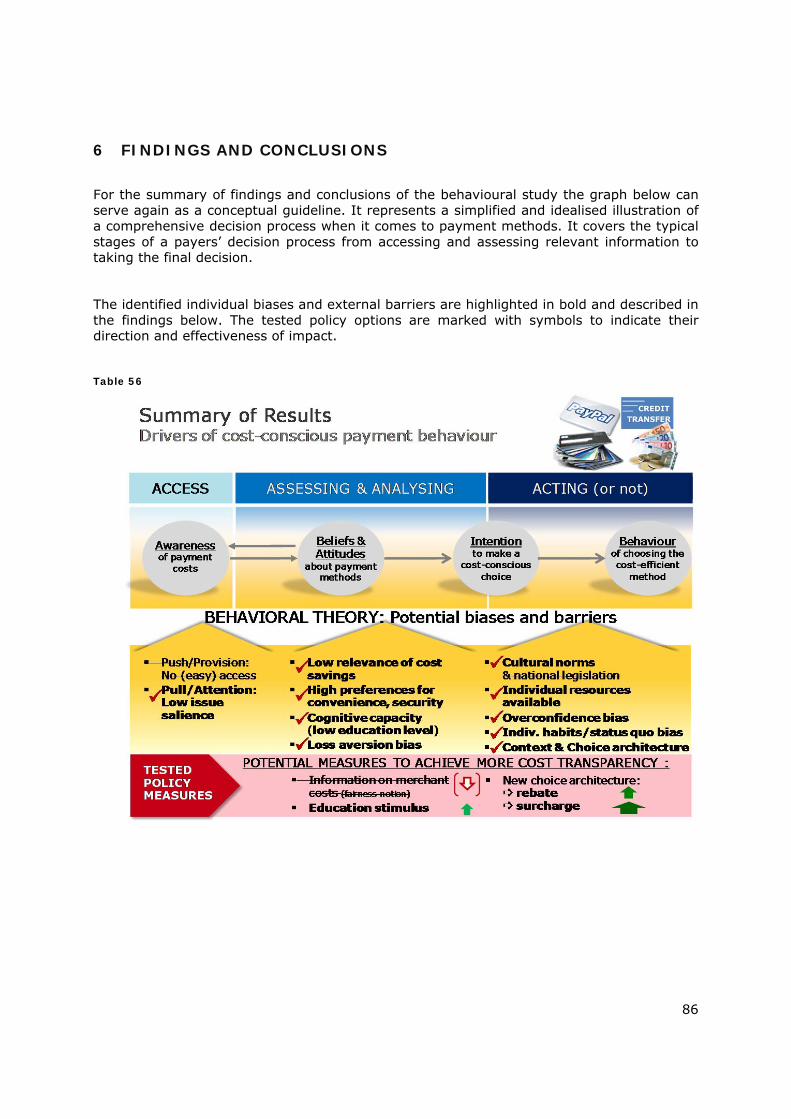
86
6 FINDINGS AND CONCLUSIONS
For the summary of findings and conclusions of the behavioural study the graph below can serve again as a conceptual guideline. It represents a simplified and idealised illustration of a comprehensive decision process when it comes to payment methods. It covers the typical stages of a payers’ decision process from accessing and assessing relevant information to taking the final decision.
The identified individual biases and external barriers are highlighted in bold and described in the findings below. The tested policy options are marked with symbols to indicate their direction and effectiveness of impact.
Table 56
87
Strong empirical evidence shows that both policy types, monetary as well as information / education based have a significant impact on the choice behaviour of consumers.
Monetary incentives vs. disincentives have a strong impact on consumer behaviour. Among all of the policy options tested in this study, the strongest positive impact towards cash or credit transfer is achieved by having a “disincentive” for paying by card/ Online Payment System: levying a surcharge on prices. Offering a rebate also generates the expected nudge towards cost-conscious choices, although the effect is not as strong as with surcharges. Yet, the overall main finding based on our online experimental study is that real monetary (dis)incentives may provide a promising policy steering tool.
Education - increasing transparency of payment costs and making them more tangible to the shoppers also provides an effective nudge into the direction of cost-conscious choices. However, this one-off nudge reaches only those consumers who are already concerned about payment costs and does not increase issue salience among consumers who prefer convenience over costs.
Whether merchant cost information is presented or not did not make any significant difference in the experimental online study. The fairness notion of this treatment did not influence the shoppers or create sympathy for the merchant. Hence, this type of information can be omitted as it is not effective in affecting payment choice.
The timing options, when the payment costs or merchant costs are presented to consumers only play a significant role in very specific combinations. Overall they are only relevant during the first offline choice and are not seen in the online choices. The least effective combination is the late receipt timing of merchant costs in a ‘no rebate’ scenario. The most effective combination tested in our online experimental design is the late receipt timing of surcharging information with education but without merchant costs.
Strong empirical evidence shows that individual habits, beliefs and the immediate context / choice architecture have a huge impact on the choice behaviour of consumers, while awareness of payment costs has no influence.
The purchase value of the choice situation has the overall strongest impact on payment method preferences when consumers shop offline. The findings confirm the assumption that the choice in favour or against cash payment largely depends on whether a consumer tends to have a sufficient amount of cash on them or not.
The choice architecture of consumers is determined by the availability of different card schemes, which influences decision behaviour particularly in an online shopping context. Online shoppers who own both debit and credit cards, are less likely to choose other options and more likely to choose card payments.
88
Individual habits present very strong barriers if the frequency of shopping (offline or online) is high and when the cheapest method as outlined in the experiment (cash or credit transfer) is not used very often. In the offline scenario, there are additional strong barriers when there is a high frequency of using cards or new mobile payment methods or when carrying only small amounts of cash.
Cultural norms can be observed by typical country patterns of individual habits, such as the dominance of Dankort debit cards in Denmark, which prevent Danish shoppers from choosing other methods. Likewise, in the UK where a debit and credit card payment culture is more widespread and credit transfers atypical, it is difficult for British online shoppers to make a rational decision in favour of credit transfer.
A general preference for convenience over cost drives people to choose the more expensive payment options. Shoppers who focus on convenience and worry less about other things such as costs or security issues are less likely to opt for the more cost-conscious methods.
Existing national legislation (i.e. the respective policy status quo) such as prohibiting surcharging are revealed by the previous experiences of card holders with less experience of steering measures in those countries (i.e. France, Poland, Italy). However, there is no impact on the choice behaviour in the experiments.
Cost awareness does not have any significant impact on current payment choices, which confirms the initial assumption of a lack of transparency in the market for consumers. As a result of this measurable knowledge gap, answers on cost awareness questions tend to be based on general perceptions and misunderstandings rather than actual cost knowledge. These perceptions of cost are strongly related to the general “subjective evaluation” of the payment method.
Consumer choice from available payment methods is a highly habitualised decision with little or no attention given to any additional information.
The minimal impact of cost awareness on the choice behaviour as well as on the perceived relevance of the payment cost issue to consumers presents a difficult hurdle to the effectiveness of information-based policy measures. Although the education treatment in the laboratory experiments displayed a significant impact on payment choices, this effect is likely to be much smaller in a real life situation with typically more distractions and more time spent between education and decision-making.
That said there is empirical evidence that information-based policy measures would enhance the effectiveness of monetary nudges towards cost-conscious choices, if they highlight the consumer specific detriment in a clear and easy to understand way. While the mere information about the merchants’ payment costs was ignored, the explanation of possible annual savings for the consumers did motivate in particular the cost-conscious consumers to make cost-efficient choices.
89
Loss aversion effect: Surcharges are more effective in driving cost-conscious consumer choices than rebates. At the same time surcharges are also less popular among consumers than rebates.
The discrepancy in popularity and impact can also be described as ‘loss aversion’. According to behavioural theory this is a principle whereby people are more likely to change their behaviour in order to avoid a loss than to make an equivalent gain36. This effect explains why monetary disincentives (surcharging) are so much more effective in changing consumer behaviour than rebates or information-based stimuli.
On the other hand, negative framings such as surcharges are not popular and are likely to lead to avoidance strategies. If consumers have a choice between a merchant who offers rebates for certain payment methods and another merchant who surcharges for certain payment methods, the merchant who offers rebates will tend to be preferred.
Within the context of this research - the decision on whether surcharging or rebating should be recommended may depend on additional aspects to be considered. While rebates are generally welcomed by consumers, surcharges may lead to more consumers refusing to shop with merchants who impose such conditions. However, the lower level of consumer acceptance may change as surcharges become more widespread.
Consumers with previous surcharging experience develop a higher issue salience (i.e. real cost-awareness).
To empower consumers more sustainably when making choices among payment methods, it will be necessary to increase issue salience respectively real and lasting cost-awareness. The only actionable driver identified was the previous experience with surcharging. This creates a more concrete experience of payment costs which is memorised also for future choices, in contrast to the quickly forgotten experience of a rebate or a one-off education treatment.
These core results provide promising empirical evidence for a set of policy options, which would result in a change of the choice architecture consumers would face if legislative actions were to be implemented across the EU. It indicates the strong, direct impact of changing the monetary cost-benefit balance of different payment methods by introducing rebates or surcharges. It also shows that educational measures in raising cost awareness would also help. However it is a combined approach which will be most effective.
36 As described by Professor Richard Thaler in 1980: “Imposing a surcharge (which is likely to be judged a
loss) is considered more unfair than eliminating a discount (a reduction of a gain). This distinction explains why firms that charge cash customers one price and credit card customers a higher price always refer to the cash price as a discount rather than to the credit card price as a surcharge.”

90
7 GLOSSARY OF KEY TERMS
Credit and debit cards Credit cards allow the cardholder to postpone paying the full amount due at the end of each month. The cardholder normally pays interest on the outstanding balance, i.e. the amount carried forward to the following month and any purchases made before the next payment date. Debit cards allow cardholders to pay for goods and services by card, but there is no credit. The customer is debited as soon as the sale is made. Multilateral Interchange Fee (MIF) The MIF refers to the fee that the bank of a merchant pays a the bank of a customer when a merchant allows cards that use major credit card networks like MasterCard, Visa or Discover for sales transactions. In the course of sales transaction using a credit card, the customer’s bank takes away an interchange fee from the quantity that it pays to an acquiring bank for handling a debit card or credit card transaction of a merchant. At that time, the acquiring bank moves ahead and pays the merchant the quantity of the sales transaction, less the interchange fee and a smaller additional one that goes to the acquiring bank. Merchant Service Charge or Commission (MSC)
A charge paid by a merchant to their acquirer, calculated as a percentage of turnover or fixed charge per transaction or a combination of both. Usually credit cards are charged on turnover and debit cards on transactions.
Three and four party schemes
Where the card scheme acts as issuing and acquiring entity, this is known as a “three-party” card scheme. However, the vast majority of card schemes in Europe use the “four-party” card scheme wherein the issuer has a contract with the cardholder, and the acquirer with the merchant. Multivariate analysis
As the name indicates, multivariate analysis comprises a set of techniques dedicated to the analysis of data sets with more than one variable.
91
Logistical regression
Regression analysis is the main multivariate technique used in this study and seeks to investigate relationships between variables, in order to ascertain the causal effect of one variable upon another—the effect of the different policy options on consumer behaviour in this instance. It uses “regression models” - statistical models which describe the variation in one (or more) variable(s) when one or more other variable(s) vary. Statistical significance
When a statistic is significant, it simply means that you are very sure that the statistic is reliable. Statistical significance does not always indicate practical significance. The calculation of statistical significance (significance testing) is subject to a certain degree of error. Sample size is an important component of statistical significance in that larger samples are less prone to flukes. The level at which one can accept whether an event is statistically significant is known as the significance level or p-value.
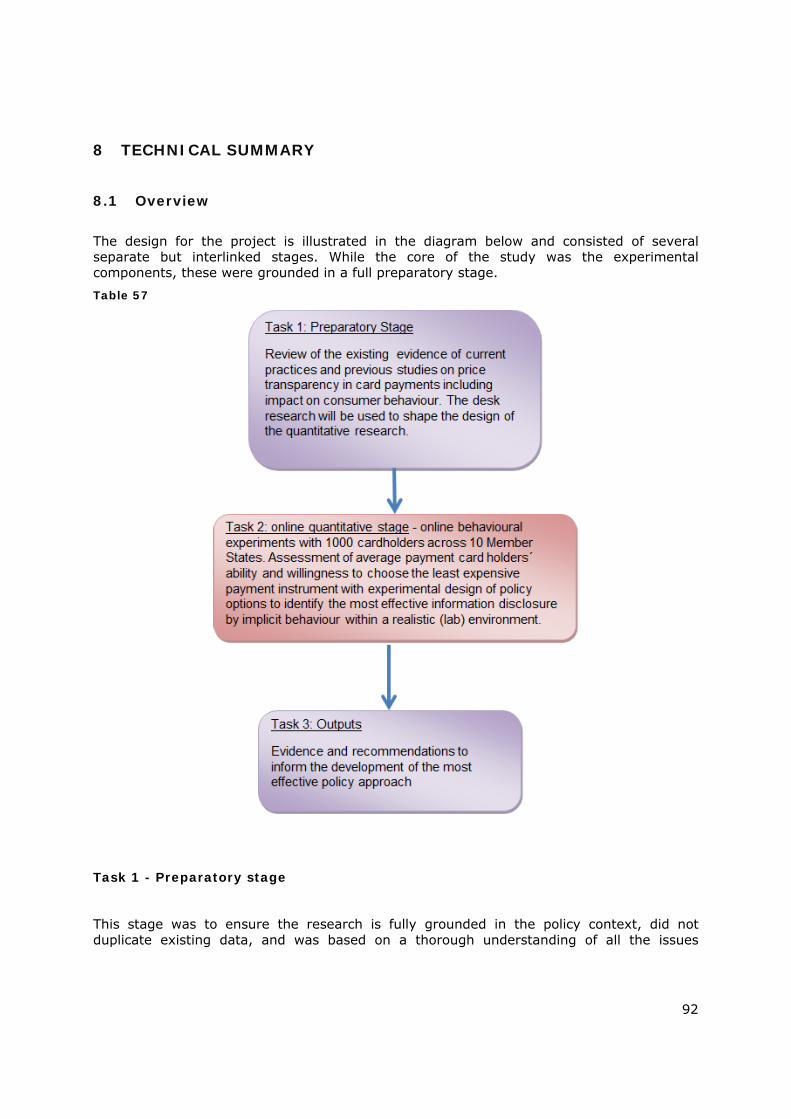
92
8 TECHNICAL SUMMARY
8.1 Overview
The design for the project is illustrated in the diagram below and consisted of several separate but interlinked stages. While the core of the study was the experimental components, these were grounded in a full preparatory stage.
Table 57
Task 1 - Preparatory stage
This stage was to ensure the research is fully grounded in the policy context, did not duplicate existing data, and was based on a thorough understanding of all the issues
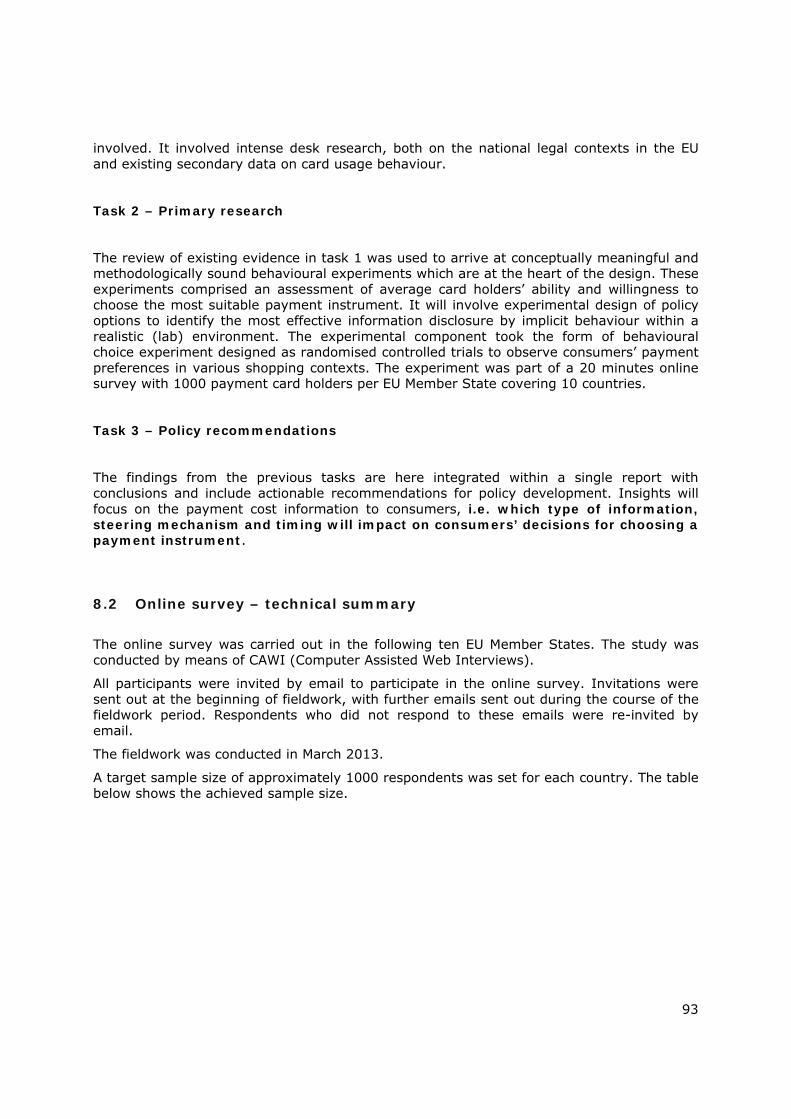
93
involved. It involved intense desk research, both on the national legal contexts in the EU and existing secondary data on card usage behaviour.
Task 2 – Primary research
The review of existing evidence in task 1 was used to arrive at conceptually meaningful and methodologically sound behavioural experiments which are at the heart of the design. These experiments comprised an assessment of average card holders’ ability and willingness to choose the most suitable payment instrument. It will involve experimental design of policy options to identify the most effective information disclosure by implicit behaviour within a realistic (lab) environment. The experimental component took the form of behavioural choice experiment designed as randomised controlled trials to observe consumers’ payment preferences in various shopping contexts. The experiment was part of a 20 minutes online survey with 1000 payment card holders per EU Member State covering 10 countries.
Task 3 – Policy recommendations
The findings from the previous tasks are here integrated within a single report with conclusions and include actionable recommendations for policy development. Insights will focus on the payment cost information to consumers, i.e. which type of information, steering mechanism and timing will impact on consumers’ decisions for choosing a payment instrument.
8.2 Online survey – technical summary
The online survey was carried out in the following ten EU Member States. The study was conducted by means of CAWI (Computer Assisted Web Interviews).
All participants were invited by email to participate in the online survey. Invitations were sent out at the beginning of fieldwork, with further emails sent out during the course of the fieldwork period. Respondents who did not respond to these emails were re-invited by email.
The fieldwork was conducted in March 2013.
A target sample size of approximately 1000 respondents was set for each country. The table below shows the achieved sample size.

94
Table 58
COUNTRY COMPLETED SURVEYS
UK 1 006
Italy 1 013
Spain 1 003
France 1 001
Germany 1 003
Netherlands 1 005
Denmark 1 005
Finland 1 004
Slovenia 1 000
Poland 1 001
Total 10 041
Once fieldwork was completed, a data file for each country was generated following a specific data map.
To produce tables and other outputs based on the data set, the data have been weighted according to target figures for gender and age distribution in each country. We applied rim weighting, using an iterative procedure to achieve an even distribution of results across the entire dataset while balancing the gender and age figures to pre-determined totals. It simultaneously weights the specified characteristics and disturbs each variable as little as possible.
8.3 Sampling design – country selection
Generally speaking, one common challenge is to maximize the “representativeness” of a country sample, i.e. maximize the “inference potential” of a given country selection. Two issues are central here: the “maximum population (or market) coverage principle” and the “maximum heterogeneity coverage principle”. The first solely takes the population or market size of selected countries into account, whereas the second one brings in other substantial criteria for country selection: the countries chosen should represent the full range of variables of interest, thereby representing a maximum of heterogeneity of all the key variables.
In the table below we present the country selection for the study on payment cost transparency which reflects both the maximum population coverage criteria as well as,
95
based on our pre-analysis of available market indicators, maximum heterogeneity coverage principle.
Table 59
Country Population size
Surcharging legislation37
% of card transactions among all payments38
UK 47,508,811 Allowed Very high (≥ 50%)
Italy 48,517,748 Prohibited Medium (30 to < 40%)
Spain 36,793,761 Capped High (40 to < 50%)
France 48,754,823 Prohibited High (40 to < 50%)
Germany 66,451,766 Allowed Very low (< 20%)
Netherlands 12,763,825 Allowed High (40 to < 50%)
Denmark 4,209,265 Prohibited for debit cards Very high (≥ 50%)
Finland 4,154,280 Allowed Very high (≥ 50%)
Slovenia 1,667,409 Allowed Medium (30 to < 40%)
Poland 30,455,706 Prohibited Medium (30 to < 40%)
Our country sample includes the five EU countries with the highest population share plus five further countries. All ten countries cover approximately 300 million consumers aged 18 and older, representing 76% of the EU universe.
The selection reflects our pre-analysis of market specific country profiles based on a report exploring issues surrounding multilateral interchange fees (MIFs) from the European Central Bank39. The annexes of the ECB paper display data from the European System of Central Banks in 2010, which give an overview of the level of interchange fees at least for some schemes in several countries. The additional countries (except for Denmark) were selected as they seem to have the highest (known) interchange fees in Europe.
37 Based on the information given in the TOR (see footnote on page 4) 38 Based on ECB data from 2011 in a table stating the relative importance of the main payment instruments in
the EU - published on 10th September 2012 39 “Interchange fees in card payments” by Ann Börestam and Heiko Schmiedel, published in September 2011
http://www.ecb.int/pub/pdf/scpops/ecbocp131.pdf and Visa/MasterCard internet site: http://www.visaeurope.com/en/about_us/our_business/fees_and_interchange.aspx http://www.MasterCard.com/us/company/en/whatwedo/interchange/Country.html
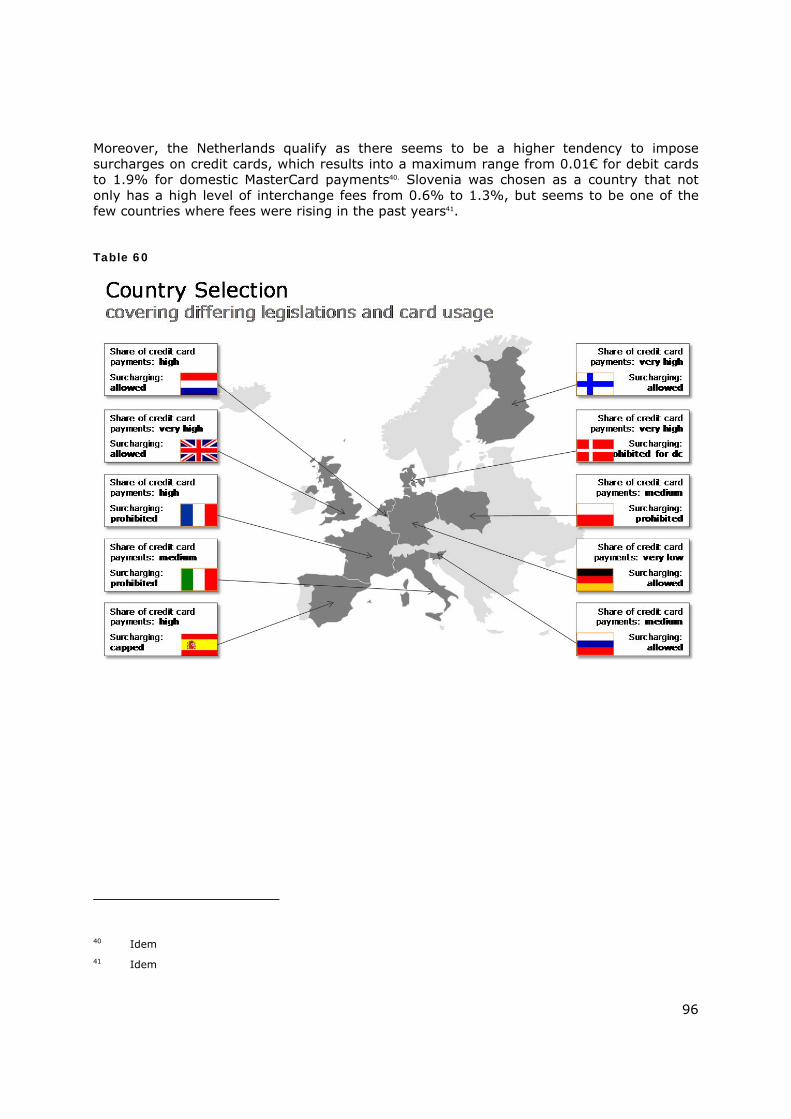
96
Moreover, the Netherlands qualify as there seems to be a higher tendency to impose surcharges on credit cards, which results into a maximum range from 0.01€ for debit cards to 1.9% for domestic MasterCard payments40. Slovenia was chosen as a country that not only has a high level of interchange fees from 0.6% to 1.3%, but seems to be one of the few countries where fees were rising in the past years41.
Table 60
40 Idem 41 Idem
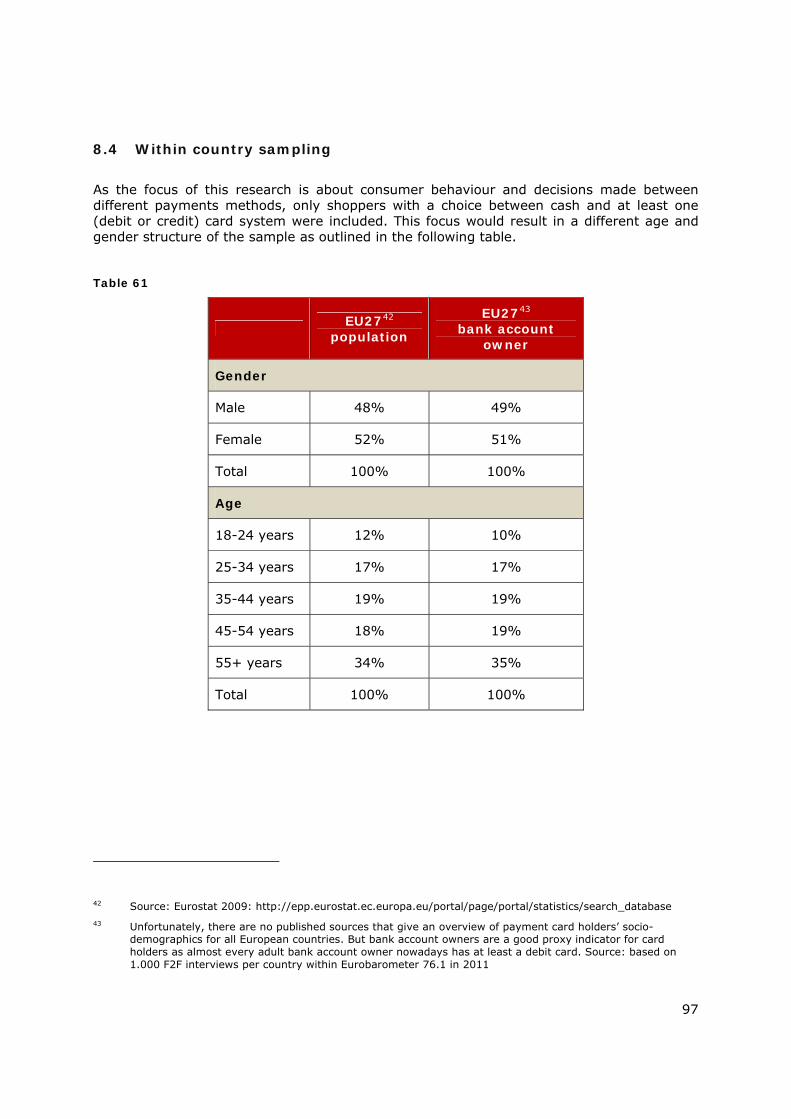
97
8.4 Within country sampling
As the focus of this research is about consumer behaviour and decisions made between different payments methods, only shoppers with a choice between cash and at least one (debit or credit) card system were included. This focus would result in a different age and gender structure of the sample as outlined in the following table.
Table 61
EU2742 population
EU2743 bank account
owner
Gender
Male 48% 49%
Female 52% 51%
Total 100% 100%
Age
18-24 years 12% 10%
25-34 years 17% 17%
35-44 years 19% 19%
45-54 years 18% 19%
55+ years 34% 35%
Total 100% 100%
42 Source: Eurostat 2009: http://epp.eurostat.ec.europa.eu/portal/page/portal/statistics/search_database 43 Unfortunately, there are no published sources that give an overview of payment card holders’ socio-
demographics for all European countries. But bank account owners are a good proxy indicator for card holders as almost every adult bank account owner nowadays has at least a debit card. Source: based on 1.000 F2F interviews per country within Eurobarometer 76.1 in 2011
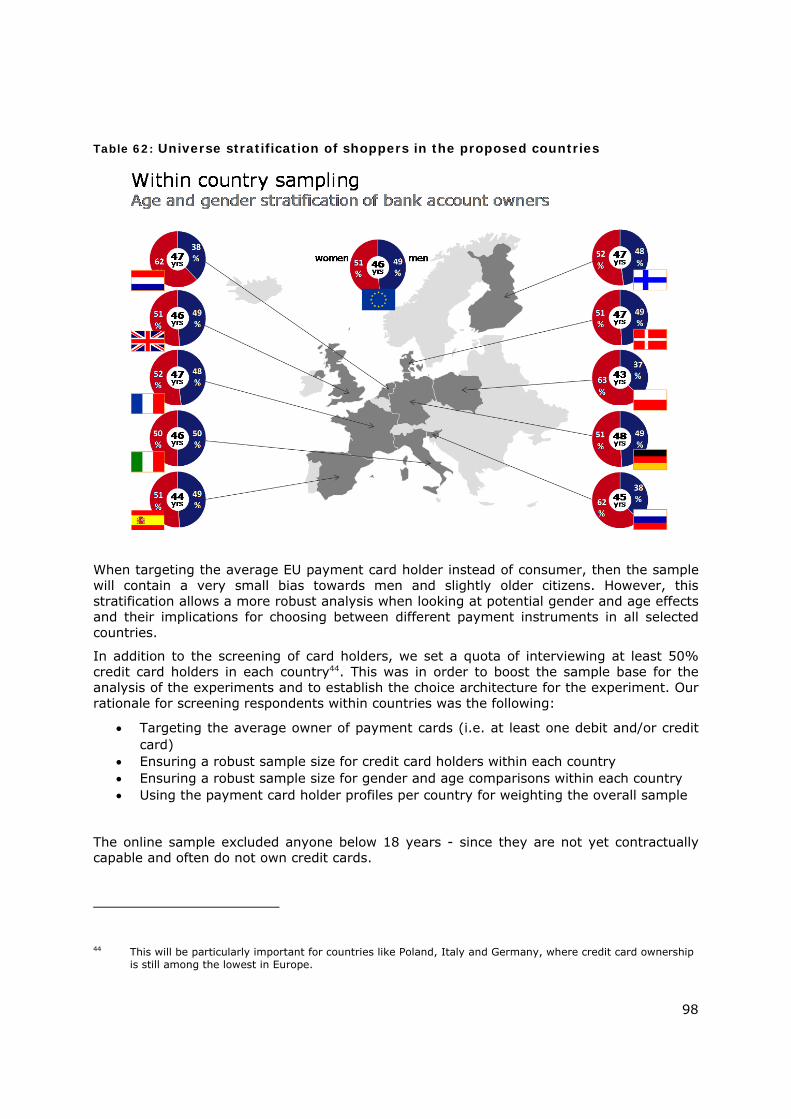
98
Table 62: Universe stratification of shoppers in the proposed countries
When targeting the average EU payment card holder instead of consumer, then the sample will contain a very small bias towards men and slightly older citizens. However, this stratification allows a more robust analysis when looking at potential gender and age effects and their implications for choosing between different payment instruments in all selected countries.
In addition to the screening of card holders, we set a quota of interviewing at least 50% credit card holders in each country44. This was in order to boost the sample base for the analysis of the experiments and to establish the choice architecture for the experiment. Our rationale for screening respondents within countries was the following:
Targeting the average owner of payment cards (i.e. at least one debit and/or credit card)
Ensuring a robust sample size for credit card holders within each country Ensuring a robust sample size for gender and age comparisons within each country Using the payment card holder profiles per country for weighting the overall sample
The online sample excluded anyone below 18 years - since they are not yet contractually capable and often do not own credit cards.
44 This will be particularly important for countries like Poland, Italy and Germany, where credit card ownership
is still among the lowest in Europe.
99
9 Annex 1 - Bibliography
European Commission, Green Paper: Towards an integrated European market for card, internet and mobile payments, 2012
http://eur-lex.europa.eu/LexUriServ/LexUriServ.do?uri=COM:2011:0941:FIN:EN:PDF
The Commission's Green Paper, entitled 'Towards an Integrated European Market for Card, Internet and Mobile Payments' (the Green Paper), was published on 11 January 2012 for a three month consultation. It identified four main drivers for market integration in electronic and card payments:
security; transparency and choice; competition; and innovation.
The Commission looked at various practices and developments, including MIFs, cross-border acquiring, co-badging, access to information on the availability of funds and to settlement systems, payment security, price transparency, interoperability between service providers and governance issues. Payments Legislative Package, July 2013
http://ec.europa.eu/internal_market/payments/framework/index_en.htm
On 24 July 2013, the Commission adopted a legislative package in the field of the EU payments framework. This package which proposes a revised Payments Services Directive (PSD2) and a Regulation on Multilateral Interchange Fees (MIFs) will help the payments framework to better serve the needs of an effective European payments market, fully contributing to a payments environment which nurtures competition, innovation and security to the benefits of all stakeholders and consumers in particular. Modernisation of the legislative framework for retail payments was also defined as one of the key actions of the Commission Single Market Act II and is inter alia a response to the Commission’s Green Paper “Towards an integrated European market for card, internet and mobile payments” of 2012.
European Central Bank, Interchange Fees in Card Payments, Occasional Papers Series, No 131, September 2011
This paper from the ECB looks at the issues surrounding the MIF in payment cards markets from different angels. Currently, the Eurosystem’s public stance on the interchange fees is neutral, however, the ECB found it important to facilitate a constructive dialogue among the stakeholders involved in the debate.
The paper points out that it is crucial for the success of SEPA that cards can be used throughout the euro area to make euro payments without any regional differentiation.
To this aim, the paper looks into the background of MIFs and also provides a review of relevant literature. In addition, a deep insight into antitrust policy and regulatory perspectives is provided, together with a review of selected legal assessments of interchange fees such as the EU Commission decision on MasterCard of 2007.
100
The paper concludes that:
“Transparency and clarity with respect to the real costs and benefits of different payment instruments are indispensable for a modern and harmonised European retail payments market. Interchange fees (if any) should be set at a reasonable level and should not prevent the use of efficient payment instruments.
A sharp increase in cardholder costs could induce consumers to use less efficient means of payment, thereby hampering the success of, and the objectives pursued by, the SEPA project. Interchange fees (if any) should be set to promote overall economic efficiency in compliance with competition rules. The future shape of the payment cards landscape in the euro area and the application of interchange fees (if any) would benefit from a fresh and European approach.”

101
10 Annex 2 - Questionnaire
Payment Transparency Study 2013 | version 9 | © TNS 102
Name of survey Payment Transparency Study 2013
Client name DG SANCO
Author(s) Anna Rysina Elke Himmelsbach
This questionnaire was written according to TNS quality procedures checked by Quality Department and Translations
CAWI Questionnaire
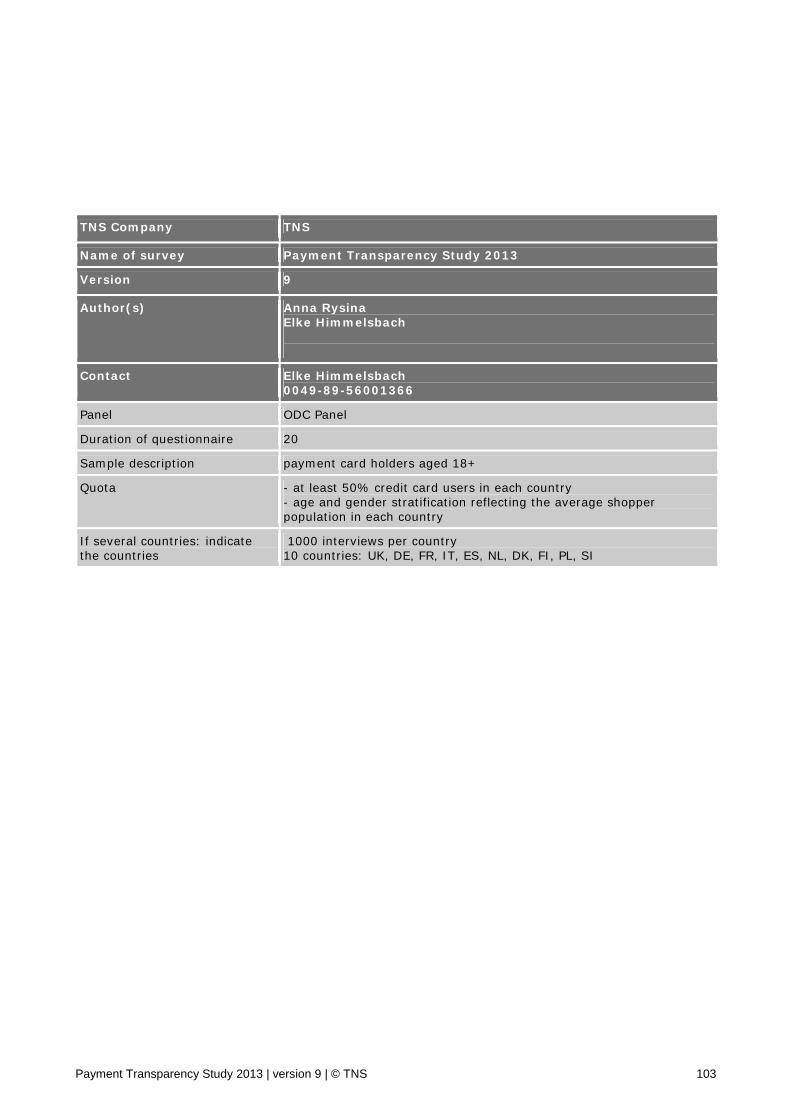
Payment Transparency Study 2013 | version 9 | © TNS 103
TNS Company TNS
Name of survey Payment Transparency Study 2013
Version 9
Author(s) Anna Rysina Elke Himmelsbach
Contact Elke Himmelsbach 0049-89-56001366
Panel ODC Panel
Duration of questionnaire 20
Sample description payment card holders aged 18+
Quota - at least 50% credit card users in each country - age and gender stratification reflecting the average shopper population in each country
If several countries: indicate the countries
1000 interviews per country 10 countries: UK, DE, FR, IT, ES, NL, DK, FI, PL, SI
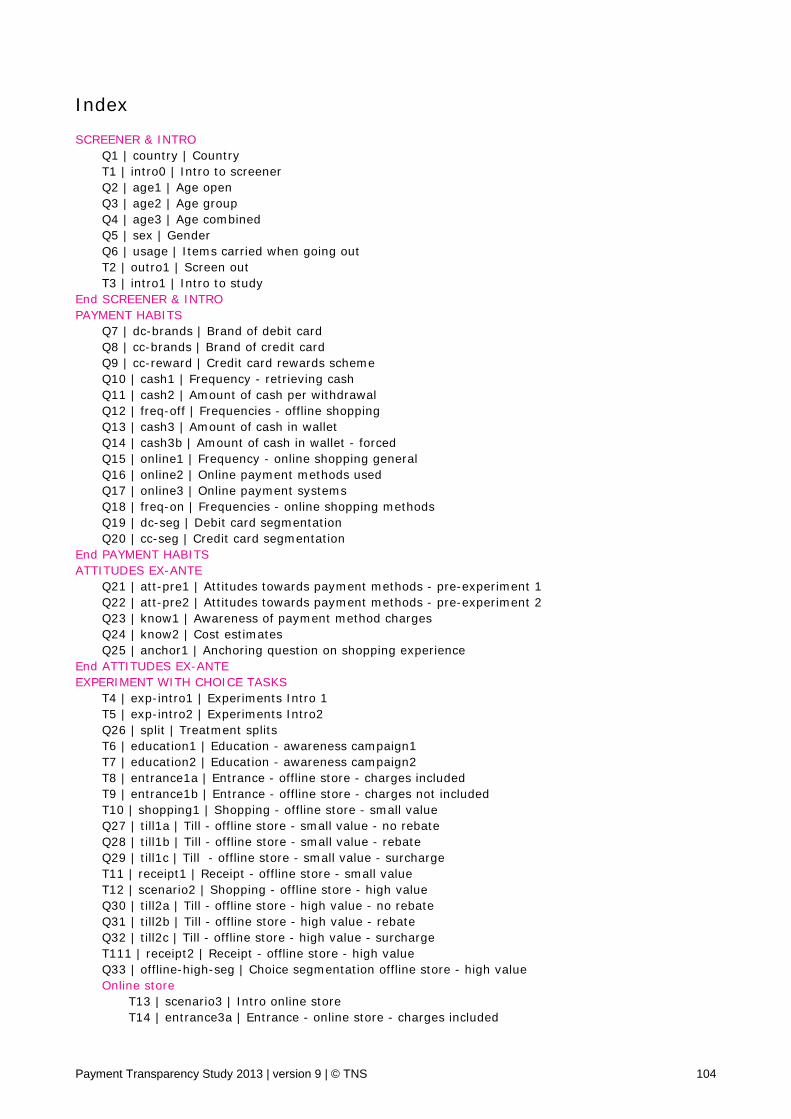
Payment Transparency Study 2013 | version 9 | © TNS 104
Index SCREENER & INTRO Q1 | country | Country T1 | intro0 | Intro to screener Q2 | age1 | Age open Q3 | age2 | Age group Q4 | age3 | Age combined Q5 | sex | Gender Q6 | usage | Items carried when going out T2 | outro1 | Screen out T3 | intro1 | Intro to study End SCREENER & INTRO PAYMENT HABITS Q7 | dc-brands | Brand of debit card Q8 | cc-brands | Brand of credit card Q9 | cc-reward | Credit card rewards scheme Q10 | cash1 | Frequency - retrieving cash Q11 | cash2 | Amount of cash per withdrawal Q12 | freq-off | Frequencies - offline shopping Q13 | cash3 | Amount of cash in wallet Q14 | cash3b | Amount of cash in wallet - forced Q15 | online1 | Frequency - online shopping general Q16 | online2 | Online payment methods used Q17 | online3 | Online payment systems Q18 | freq-on | Frequencies - online shopping methods Q19 | dc-seg | Debit card segmentation Q20 | cc-seg | Credit card segmentation End PAYMENT HABITS ATTITUDES EX-ANTE Q21 | att-pre1 | Attitudes towards payment methods - pre-experiment 1 Q22 | att-pre2 | Attitudes towards payment methods - pre-experiment 2 Q23 | know1 | Awareness of payment method charges Q24 | know2 | Cost estimates Q25 | anchor1 | Anchoring question on shopping experience End ATTITUDES EX-ANTE EXPERIMENT WITH CHOICE TASKS T4 | exp-intro1 | Experiments Intro 1 T5 | exp-intro2 | Experiments Intro2 Q26 | split | Treatment splits T6 | education1 | Education - awareness campaign1 T7 | education2 | Education - awareness campaign2 T8 | entrance1a | Entrance - offline store - charges included T9 | entrance1b | Entrance - offline store - charges not included T10 | shopping1 | Shopping - offline store - small value Q27 | till1a | Till - offline store - small value - no rebate Q28 | till1b | Till - offline store - small value - rebate Q29 | till1c | Till - offline store - small value - surcharge T11 | receipt1 | Receipt - offline store - small value T12 | scenario2 | Shopping - offline store - high value Q30 | till2a | Till - offline store - high value - no rebate Q31 | till2b | Till - offline store - high value - rebate Q32 | till2c | Till - offline store - high value - surcharge T111 | receipt2 | Receipt - offline store - high value Q33 | offline-high-seg | Choice segmentation offline store - high value Online store T13 | scenario3 | Intro online store T14 | entrance3a | Entrance - online store - charges included
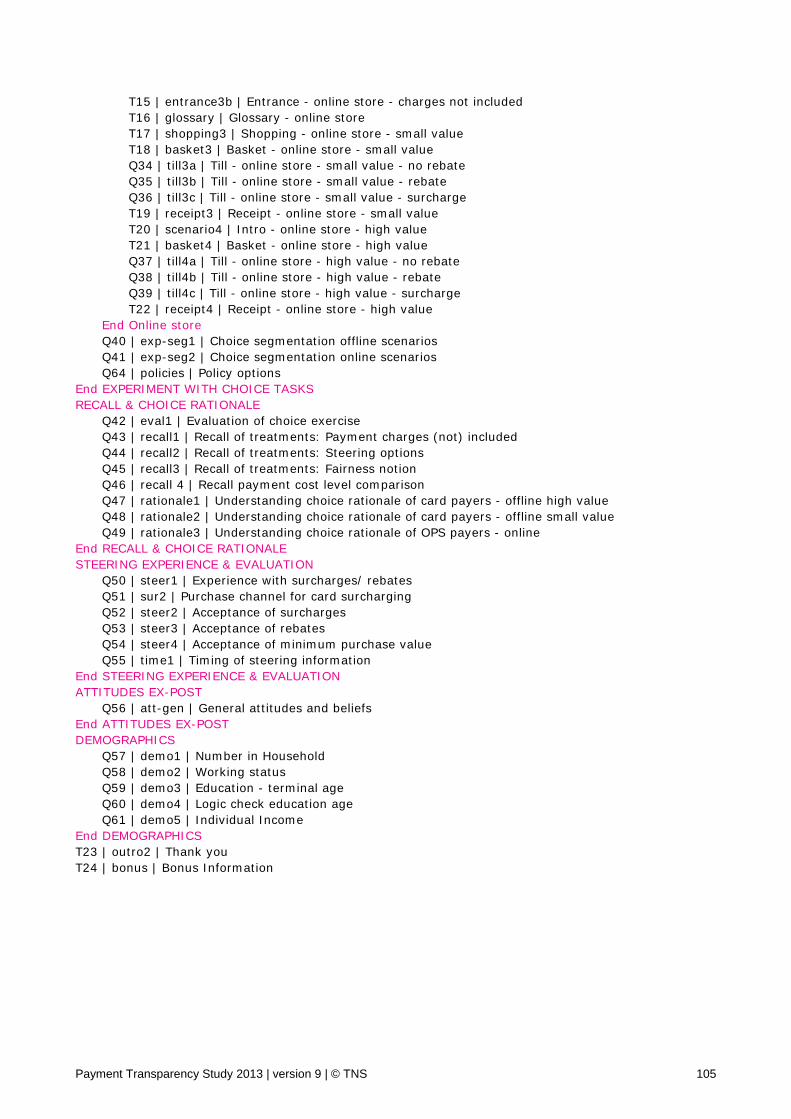
Payment Transparency Study 2013 | version 9 | © TNS 105
T15 | entrance3b | Entrance - online store - charges not included T16 | glossary | Glossary - online store T17 | shopping3 | Shopping - online store - small value T18 | basket3 | Basket - online store - small value Q34 | till3a | Till - online store - small value - no rebate Q35 | till3b | Till - online store - small value - rebate Q36 | till3c | Till - online store - small value - surcharge T19 | receipt3 | Receipt - online store - small value T20 | scenario4 | Intro - online store - high value T21 | basket4 | Basket - online store - high value Q37 | till4a | Till - online store - high value - no rebate Q38 | till4b | Till - online store - high value - rebate Q39 | till4c | Till - online store - high value - surcharge T22 | receipt4 | Receipt - online store - high value End Online store Q40 | exp-seg1 | Choice segmentation offline scenarios Q41 | exp-seg2 | Choice segmentation online scenarios Q64 | policies | Policy options End EXPERIMENT WITH CHOICE TASKS RECALL & CHOICE RATIONALE Q42 | eval1 | Evaluation of choice exercise Q43 | recall1 | Recall of treatments: Payment charges (not) included Q44 | recall2 | Recall of treatments: Steering options Q45 | recall3 | Recall of treatments: Fairness notion Q46 | recall 4 | Recall payment cost level comparison Q47 | rationale1 | Understanding choice rationale of card payers - offline high value Q48 | rationale2 | Understanding choice rationale of card payers - offline small value Q49 | rationale3 | Understanding choice rationale of OPS payers - online End RECALL & CHOICE RATIONALE STEERING EXPERIENCE & EVALUATION Q50 | steer1 | Experience with surcharges/ rebates Q51 | sur2 | Purchase channel for card surcharging Q52 | steer2 | Acceptance of surcharges Q53 | steer3 | Acceptance of rebates Q54 | steer4 | Acceptance of minimum purchase value Q55 | time1 | Timing of steering information End STEERING EXPERIENCE & EVALUATION ATTITUDES EX-POST Q56 | att-gen | General attitudes and beliefs End ATTITUDES EX-POST DEMOGRAPHICS Q57 | demo1 | Number in Household Q58 | demo2 | Working status Q59 | demo3 | Education - terminal age Q60 | demo4 | Logic check education age Q61 | demo5 | Individual Income End DEMOGRAPHICS T23 | outro2 | Thank you T24 | bonus | Bonus Information
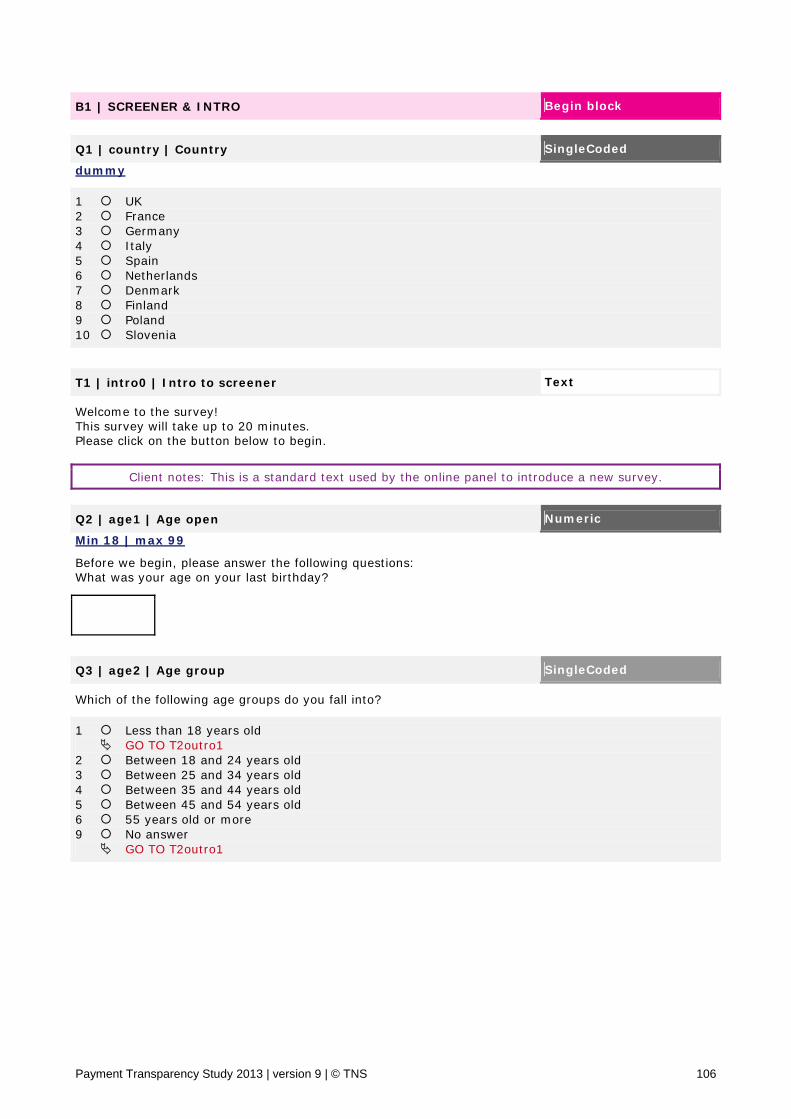
Payment Transparency Study 2013 | version 9 | © TNS 106
B1 | SCREENER & INTRO Begin block
Q1 | country | Country SingleCoded
dummy
1 UK 2 France 3 Germany 4 Italy 5 Spain 6 Netherlands 7 Denmark 8 Finland 9 Poland 10 Slovenia
T1 | intro0 | Intro to screener Text Welcome to the survey! This survey will take up to 20 minutes. Please click on the button below to begin.
Client notes: This is a standard text used by the online panel to introduce a new survey.
Q2 | age1 | Age open Numeric
Min 18 | max 99 Before we begin, please answer the following questions: What was your age on your last birthday?
Q3 | age2 | Age group SingleCoded Which of the following age groups do you fall into?
1 Less than 18 years old GO TO T2outro1 2 Between 18 and 24 years old 3 Between 25 and 34 years old 4 Between 35 and 44 years old 5 Between 45 and 54 years old 6 55 years old or more 9 No answer GO TO T2outro1
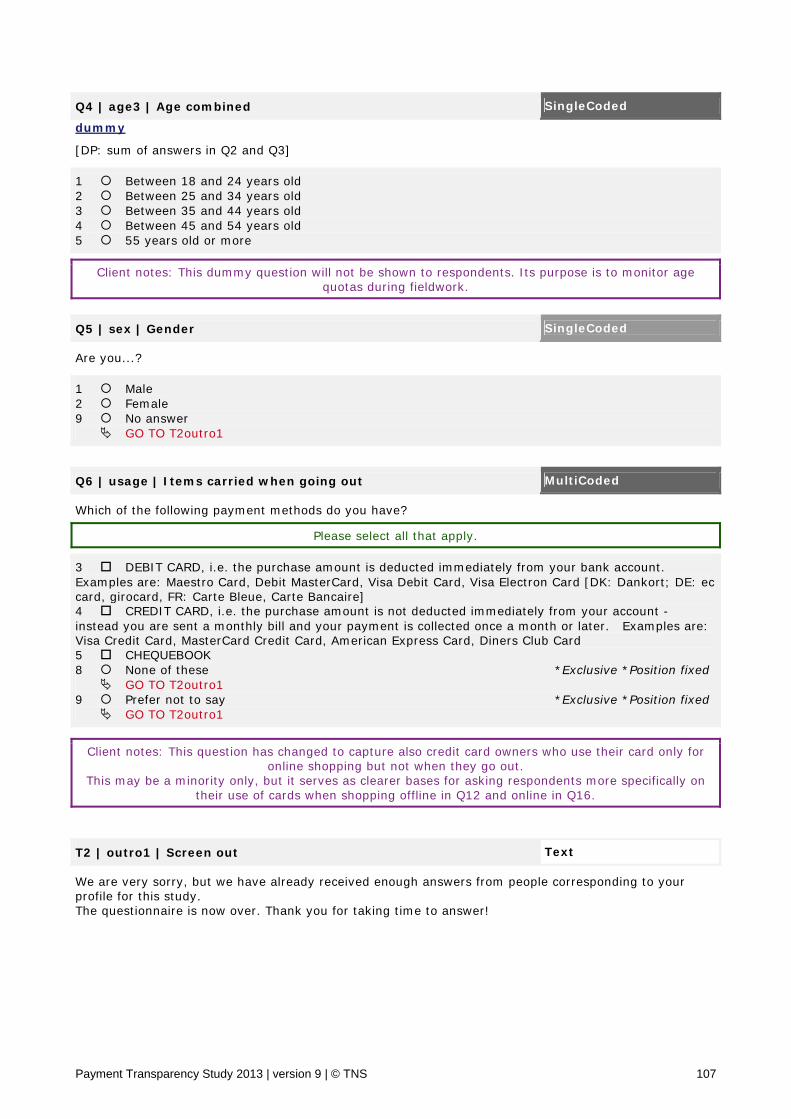
Payment Transparency Study 2013 | version 9 | © TNS 107
Q4 | age3 | Age combined SingleCoded
dummy [DP: sum of answers in Q2 and Q3]
1 Between 18 and 24 years old 2 Between 25 and 34 years old 3 Between 35 and 44 years old 4 Between 45 and 54 years old 5 55 years old or more
Client notes: This dummy question will not be shown to respondents. Its purpose is to monitor age quotas during fieldwork.
Q5 | sex | Gender SingleCoded Are you...?
1 Male 2 Female 9 No answer GO TO T2outro1
Q6 | usage | Items carried when going out MultiCoded Which of the following payment methods do you have?
Please select all that apply.
3 DEBIT CARD, i.e. the purchase amount is deducted immediately from your bank account. Examples are: Maestro Card, Debit MasterCard, Visa Debit Card, Visa Electron Card [DK: Dankort; DE: ec card, girocard, FR: Carte Bleue, Carte Bancaire] 4 CREDIT CARD, i.e. the purchase amount is not deducted immediately from your account - instead you are sent a monthly bill and your payment is collected once a month or later. Examples are: Visa Credit Card, MasterCard Credit Card, American Express Card, Diners Club Card 5 CHEQUEBOOK 8 None of these *Exclusive *Position fixed GO TO T2outro1 9 Prefer not to say *Exclusive *Position fixed GO TO T2outro1
Client notes: This question has changed to capture also credit card owners who use their card only for online shopping but not when they go out.
This may be a minority only, but it serves as clearer bases for asking respondents more specifically on their use of cards when shopping offline in Q12 and online in Q16.
T2 | outro1 | Screen out Text We are very sorry, but we have already received enough answers from people corresponding to your profile for this study. The questionnaire is now over. Thank you for taking time to answer!
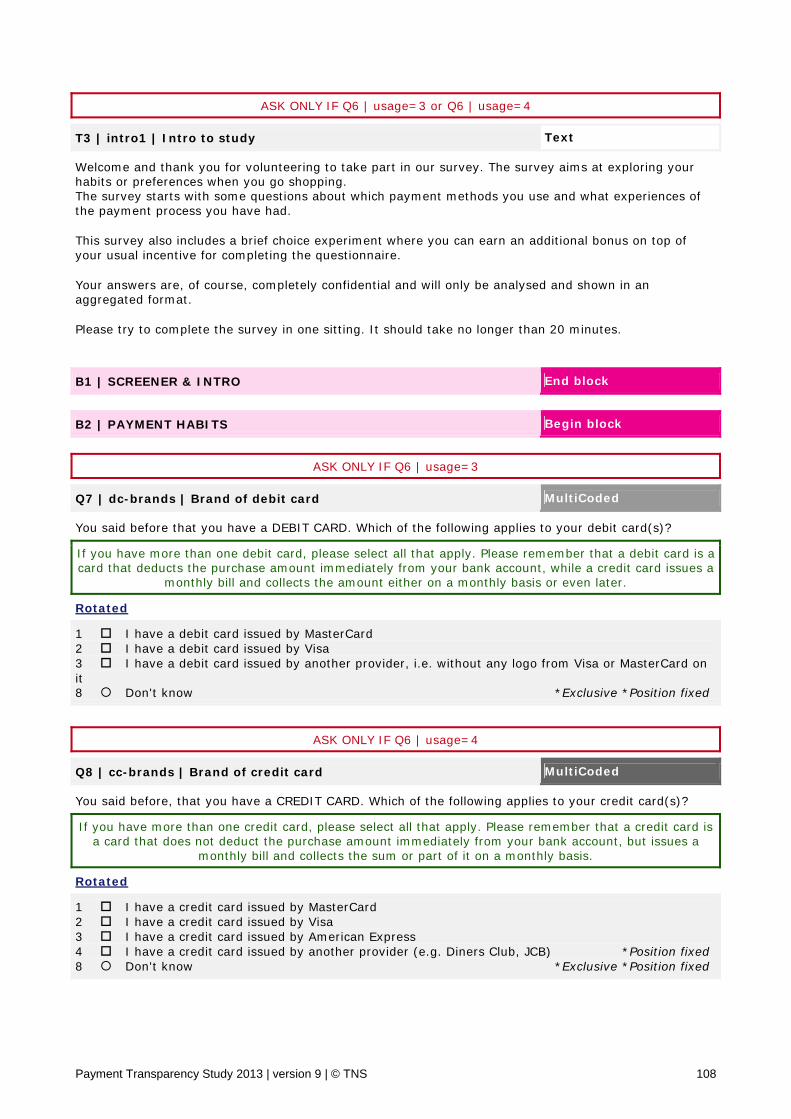
Payment Transparency Study 2013 | version 9 | © TNS 108
ASK ONLY IF Q6 | usage=3 or Q6 | usage=4
T3 | intro1 | Intro to study Text Welcome and thank you for volunteering to take part in our survey. The survey aims at exploring your habits or preferences when you go shopping. The survey starts with some questions about which payment methods you use and what experiences of the payment process you have had. This survey also includes a brief choice experiment where you can earn an additional bonus on top of your usual incentive for completing the questionnaire. Your answers are, of course, completely confidential and will only be analysed and shown in an aggregated format. Please try to complete the survey in one sitting. It should take no longer than 20 minutes.
B1 | SCREENER & INTRO End block
B2 | PAYMENT HABITS Begin block
ASK ONLY IF Q6 | usage=3
Q7 | dc-brands | Brand of debit card MultiCoded You said before that you have a DEBIT CARD. Which of the following applies to your debit card(s)?
If you have more than one debit card, please select all that apply. Please remember that a debit card is a card that deducts the purchase amount immediately from your bank account, while a credit card issues a
monthly bill and collects the amount either on a monthly basis or even later. Rotated
1 I have a debit card issued by MasterCard 2 I have a debit card issued by Visa 3 I have a debit card issued by another provider, i.e. without any logo from Visa or MasterCard on it 8 Don't know *Exclusive *Position fixed
ASK ONLY IF Q6 | usage=4
Q8 | cc-brands | Brand of credit card MultiCoded You said before, that you have a CREDIT CARD. Which of the following applies to your credit card(s)?
If you have more than one credit card, please select all that apply. Please remember that a credit card is a card that does not deduct the purchase amount immediately from your bank account, but issues a
monthly bill and collects the sum or part of it on a monthly basis. Rotated
1 I have a credit card issued by MasterCard 2 I have a credit card issued by Visa 3 I have a credit card issued by American Express 4 I have a credit card issued by another provider (e.g. Diners Club, JCB) *Position fixed8 Don't know *Exclusive *Position fixed
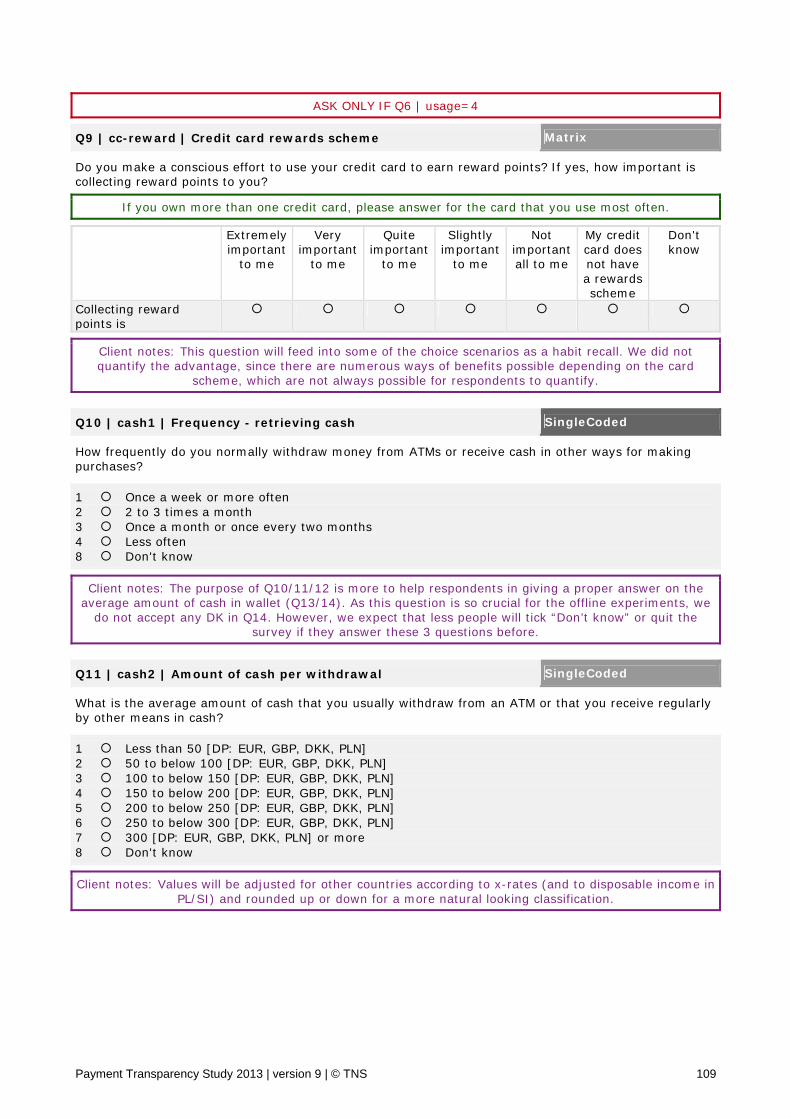
Payment Transparency Study 2013 | version 9 | © TNS 109
ASK ONLY IF Q6 | usage=4
Q9 | cc-reward | Credit card rewards scheme Matrix Do you make a conscious effort to use your credit card to earn reward points? If yes, how important is collecting reward points to you?
If you own more than one credit card, please answer for the card that you use most often. Extremely
important to me
Very important
to me
Quite important
to me
Slightly important
to me
Not important all to me
My credit card does not have a rewards scheme
Don't know
Collecting reward points is
Client notes: This question will feed into some of the choice scenarios as a habit recall. We did not quantify the advantage, since there are numerous ways of benefits possible depending on the card
scheme, which are not always possible for respondents to quantify.
Q10 | cash1 | Frequency - retrieving cash SingleCoded How frequently do you normally withdraw money from ATMs or receive cash in other ways for making purchases?
1 Once a week or more often 2 2 to 3 times a month 3 Once a month or once every two months 4 Less often 8 Don't know
Client notes: The purpose of Q10/11/12 is more to help respondents in giving a proper answer on the average amount of cash in wallet (Q13/14). As this question is so crucial for the offline experiments, we
do not accept any DK in Q14. However, we expect that less people will tick “Don’t know” or quit the survey if they answer these 3 questions before.
Q11 | cash2 | Amount of cash per withdrawal SingleCoded What is the average amount of cash that you usually withdraw from an ATM or that you receive regularly by other means in cash?
1 Less than 50 [DP: EUR, GBP, DKK, PLN] 2 50 to below 100 [DP: EUR, GBP, DKK, PLN] 3 100 to below 150 [DP: EUR, GBP, DKK, PLN] 4 150 to below 200 [DP: EUR, GBP, DKK, PLN] 5 200 to below 250 [DP: EUR, GBP, DKK, PLN] 6 250 to below 300 [DP: EUR, GBP, DKK, PLN] 7 300 [DP: EUR, GBP, DKK, PLN] or more 8 Don't know
Client notes: Values will be adjusted for other countries according to x-rates (and to disposable income in PL/SI) and rounded up or down for a more natural looking classification.
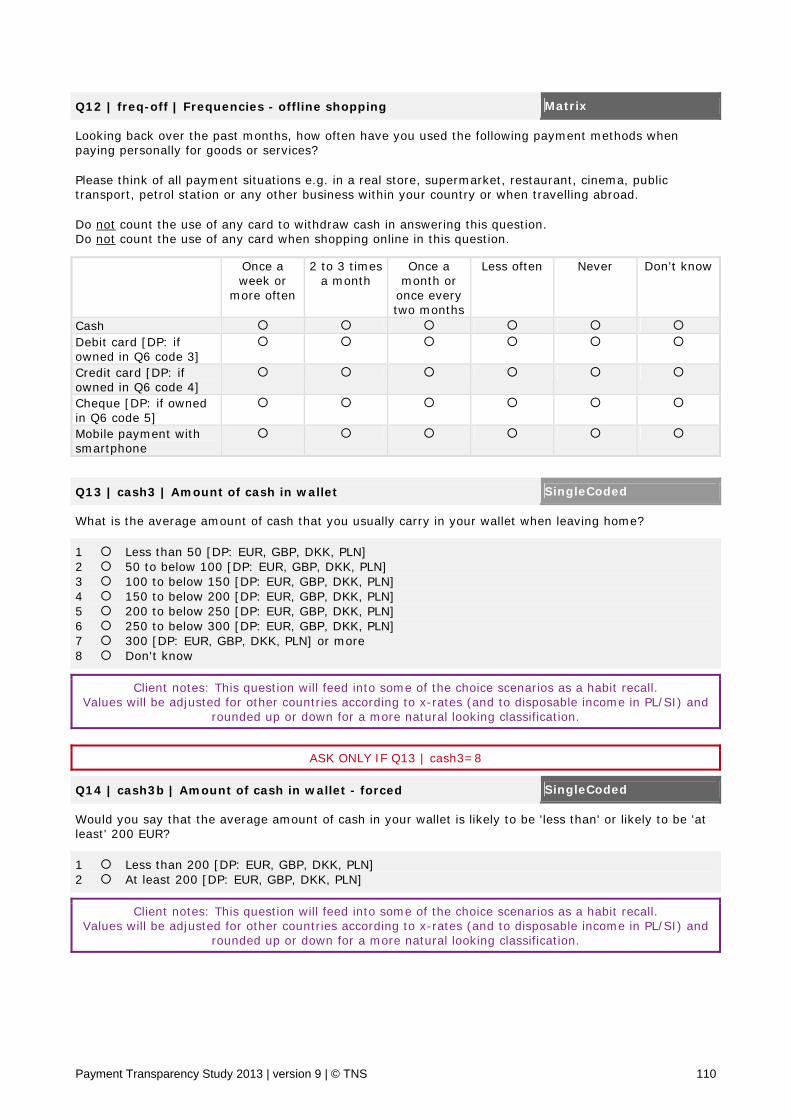
Payment Transparency Study 2013 | version 9 | © TNS 110
Q12 | freq-off | Frequencies - offline shopping Matrix Looking back over the past months, how often have you used the following payment methods when paying personally for goods or services? Please think of all payment situations e.g. in a real store, supermarket, restaurant, cinema, public transport, petrol station or any other business within your country or when travelling abroad. Do not count the use of any card to withdraw cash in answering this question. Do not count the use of any card when shopping online in this question. Once a
week or more often
2 to 3 times a month
Once a month or
once every two months
Less often Never Don't know
Cash Debit card [DP: if owned in Q6 code 3]
Credit card [DP: if owned in Q6 code 4]
Cheque [DP: if owned in Q6 code 5]
Mobile payment with smartphone
Q13 | cash3 | Amount of cash in wallet SingleCoded What is the average amount of cash that you usually carry in your wallet when leaving home?
1 Less than 50 [DP: EUR, GBP, DKK, PLN] 2 50 to below 100 [DP: EUR, GBP, DKK, PLN] 3 100 to below 150 [DP: EUR, GBP, DKK, PLN] 4 150 to below 200 [DP: EUR, GBP, DKK, PLN] 5 200 to below 250 [DP: EUR, GBP, DKK, PLN] 6 250 to below 300 [DP: EUR, GBP, DKK, PLN] 7 300 [DP: EUR, GBP, DKK, PLN] or more 8 Don't know
Client notes: This question will feed into some of the choice scenarios as a habit recall. Values will be adjusted for other countries according to x-rates (and to disposable income in PL/SI) and
rounded up or down for a more natural looking classification.
ASK ONLY IF Q13 | cash3=8
Q14 | cash3b | Amount of cash in wallet - forced SingleCoded Would you say that the average amount of cash in your wallet is likely to be 'less than' or likely to be 'at least' 200 EUR?
1 Less than 200 [DP: EUR, GBP, DKK, PLN] 2 At least 200 [DP: EUR, GBP, DKK, PLN]
Client notes: This question will feed into some of the choice scenarios as a habit recall. Values will be adjusted for other countries according to x-rates (and to disposable income in PL/SI) and
rounded up or down for a more natural looking classification.
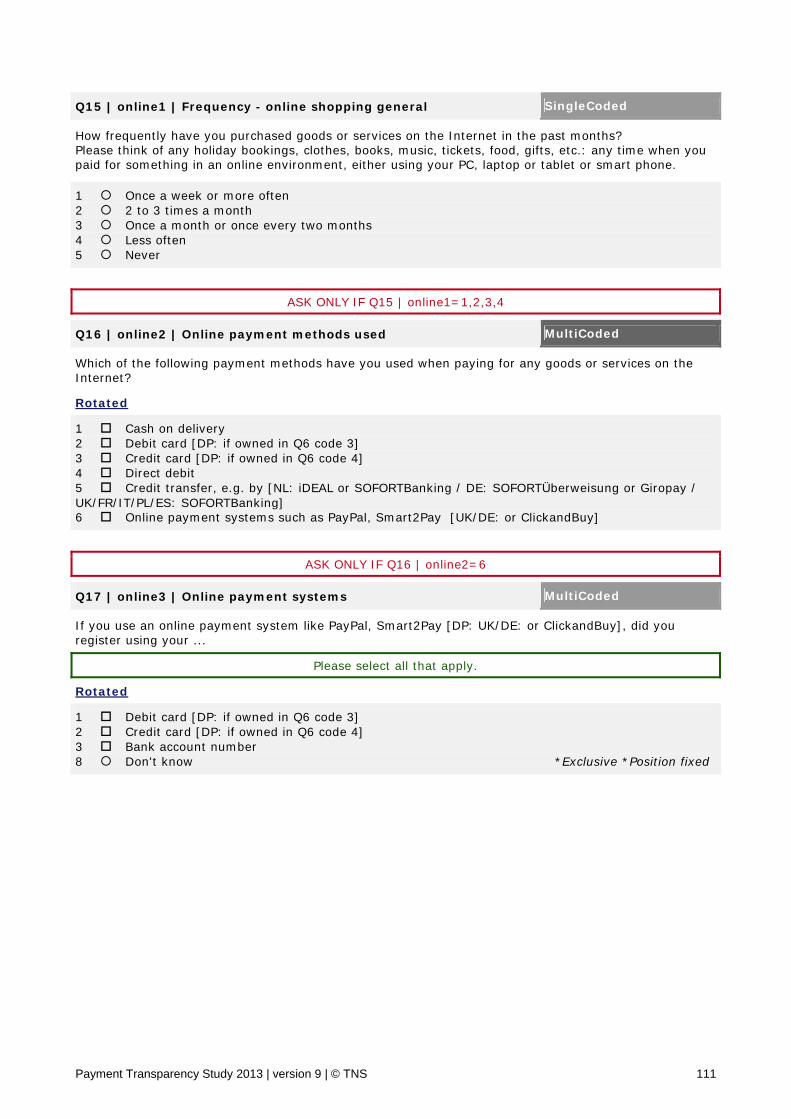
Payment Transparency Study 2013 | version 9 | © TNS 111
Q15 | online1 | Frequency - online shopping general SingleCoded How frequently have you purchased goods or services on the Internet in the past months? Please think of any holiday bookings, clothes, books, music, tickets, food, gifts, etc.: any time when you paid for something in an online environment, either using your PC, laptop or tablet or smart phone.
1 Once a week or more often 2 2 to 3 times a month 3 Once a month or once every two months 4 Less often 5 Never
ASK ONLY IF Q15 | online1=1,2,3,4
Q16 | online2 | Online payment methods used MultiCoded Which of the following payment methods have you used when paying for any goods or services on the Internet? Rotated
1 Cash on delivery 2 Debit card [DP: if owned in Q6 code 3] 3 Credit card [DP: if owned in Q6 code 4] 4 Direct debit 5 Credit transfer, e.g. by [NL: iDEAL or SOFORTBanking / DE: SOFORTÜberweisung or Giropay / UK/FR/IT/PL/ES: SOFORTBanking] 6 Online payment systems such as PayPal, Smart2Pay [UK/DE: or ClickandBuy]
ASK ONLY IF Q16 | online2=6
Q17 | online3 | Online payment systems MultiCoded If you use an online payment system like PayPal, Smart2Pay [DP: UK/DE: or ClickandBuy], did you register using your ...
Please select all that apply. Rotated
1 Debit card [DP: if owned in Q6 code 3] 2 Credit card [DP: if owned in Q6 code 4] 3 Bank account number 8 Don't know *Exclusive *Position fixed
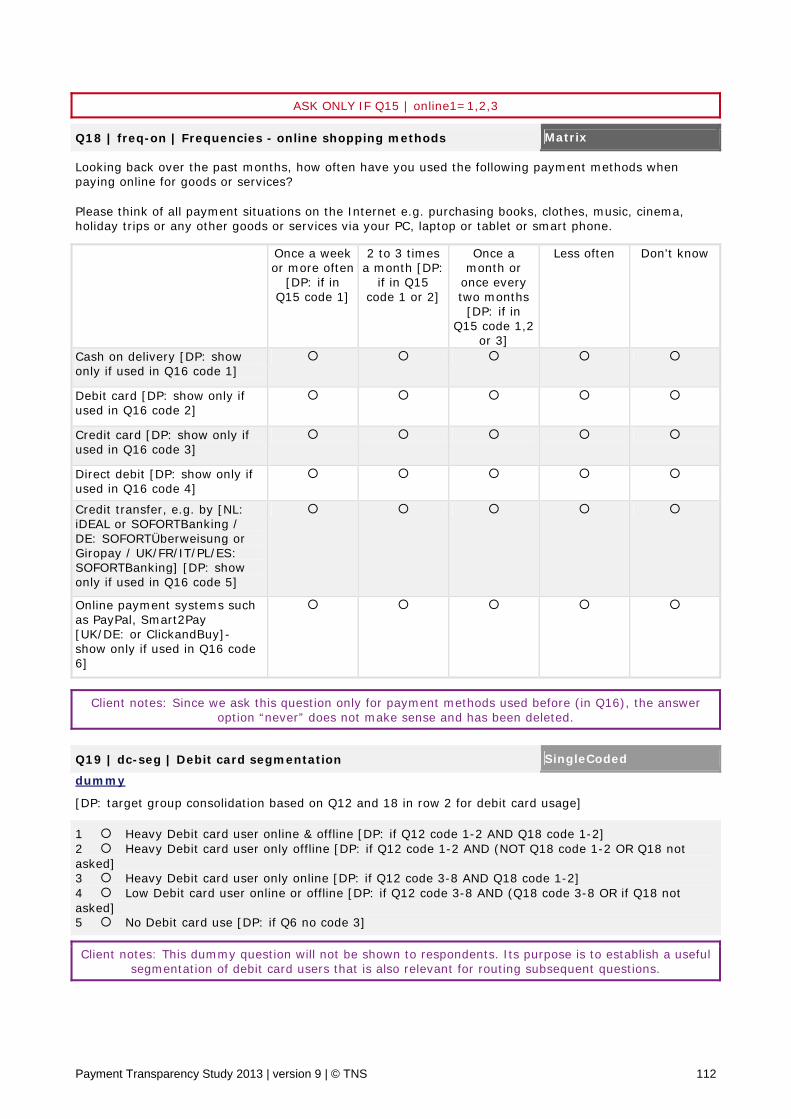
Payment Transparency Study 2013 | version 9 | © TNS 112
ASK ONLY IF Q15 | online1=1,2,3
Q18 | freq-on | Frequencies - online shopping methods Matrix Looking back over the past months, how often have you used the following payment methods when paying online for goods or services? Please think of all payment situations on the Internet e.g. purchasing books, clothes, music, cinema, holiday trips or any other goods or services via your PC, laptop or tablet or smart phone. Once a week
or more often [DP: if in
Q15 code 1]
2 to 3 times a month [DP:
if in Q15 code 1 or 2]
Once a month or
once every two months
[DP: if in Q15 code 1,2
or 3]
Less often Don't know
Cash on delivery [DP: show only if used in Q16 code 1]
Debit card [DP: show only if used in Q16 code 2]
Credit card [DP: show only if used in Q16 code 3]
Direct debit [DP: show only if used in Q16 code 4]
Credit transfer, e.g. by [NL: iDEAL or SOFORTBanking / DE: SOFORTÜberweisung or Giropay / UK/FR/IT/PL/ES: SOFORTBanking] [DP: show only if used in Q16 code 5]
Online payment systems such as PayPal, Smart2Pay [UK/DE: or ClickandBuy]- show only if used in Q16 code 6]
Client notes: Since we ask this question only for payment methods used before (in Q16), the answer option “never” does not make sense and has been deleted.
Q19 | dc-seg | Debit card segmentation SingleCoded
dummy [DP: target group consolidation based on Q12 and 18 in row 2 for debit card usage]
1 Heavy Debit card user online & offline [DP: if Q12 code 1-2 AND Q18 code 1-2] 2 Heavy Debit card user only offline [DP: if Q12 code 1-2 AND (NOT Q18 code 1-2 OR Q18 not asked] 3 Heavy Debit card user only online [DP: if Q12 code 3-8 AND Q18 code 1-2] 4 Low Debit card user online or offline [DP: if Q12 code 3-8 AND (Q18 code 3-8 OR if Q18 not asked] 5 No Debit card use [DP: if Q6 no code 3]
Client notes: This dummy question will not be shown to respondents. Its purpose is to establish a useful segmentation of debit card users that is also relevant for routing subsequent questions.
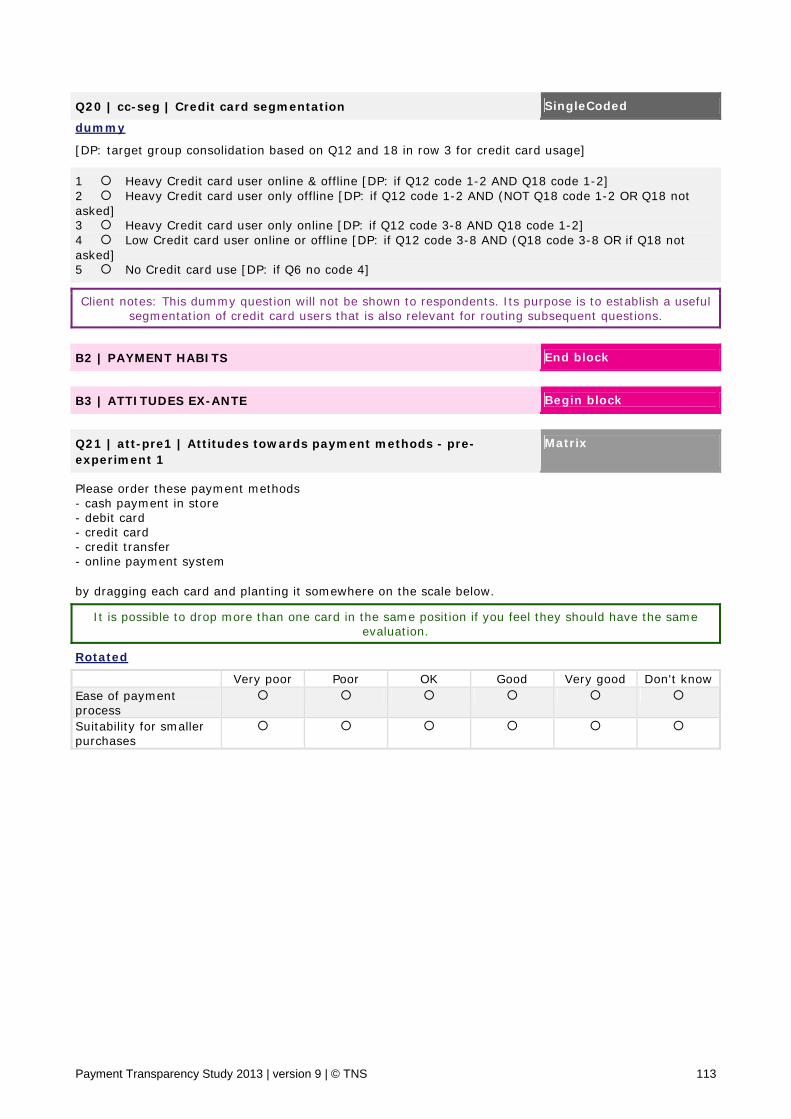
Payment Transparency Study 2013 | version 9 | © TNS 113
Q20 | cc-seg | Credit card segmentation SingleCoded
dummy [DP: target group consolidation based on Q12 and 18 in row 3 for credit card usage]
1 Heavy Credit card user online & offline [DP: if Q12 code 1-2 AND Q18 code 1-2] 2 Heavy Credit card user only offline [DP: if Q12 code 1-2 AND (NOT Q18 code 1-2 OR Q18 not asked] 3 Heavy Credit card user only online [DP: if Q12 code 3-8 AND Q18 code 1-2] 4 Low Credit card user online or offline [DP: if Q12 code 3-8 AND (Q18 code 3-8 OR if Q18 not asked] 5 No Credit card use [DP: if Q6 no code 4]
Client notes: This dummy question will not be shown to respondents. Its purpose is to establish a useful segmentation of credit card users that is also relevant for routing subsequent questions.
B2 | PAYMENT HABITS End block
B3 | ATTITUDES EX-ANTE Begin block
Q21 | att-pre1 | Attitudes towards payment methods - pre-experiment 1
Matrix
Please order these payment methods - cash payment in store - debit card - credit card - credit transfer - online payment system by dragging each card and planting it somewhere on the scale below.
It is possible to drop more than one card in the same position if you feel they should have the same evaluation.
Rotated Very poor Poor OK Good Very good Don't knowEase of payment process
Suitability for smaller purchases
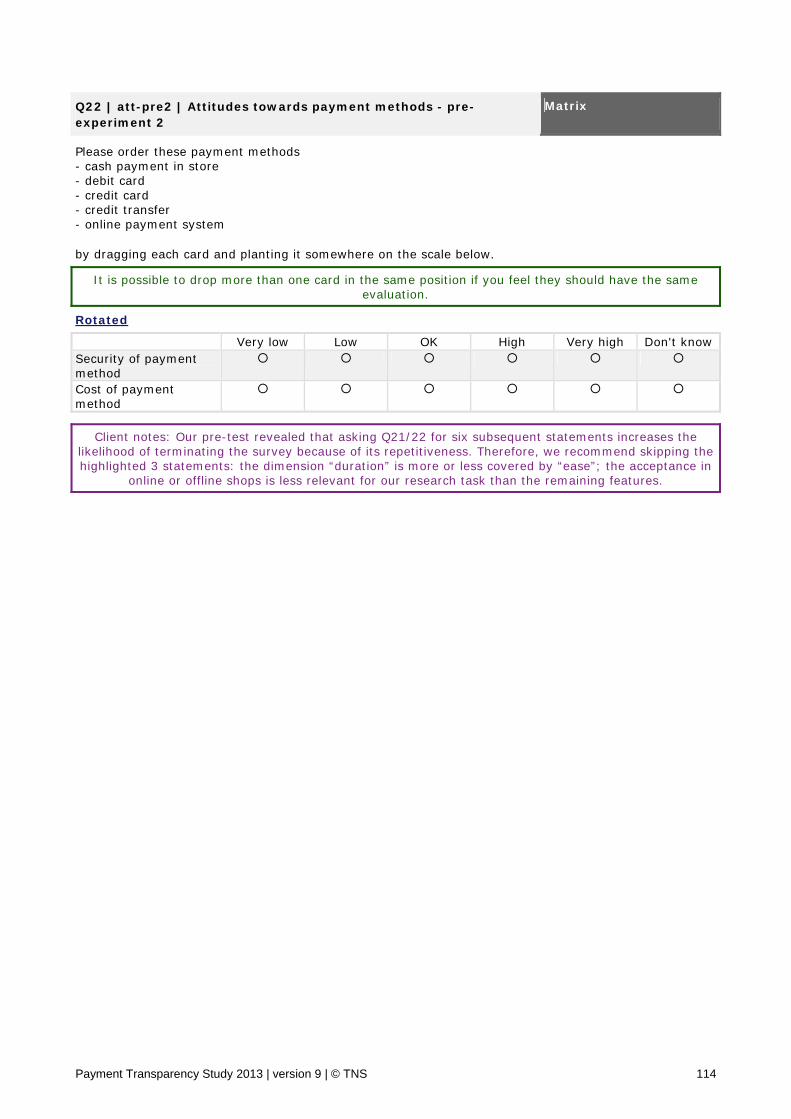
Payment Transparency Study 2013 | version 9 | © TNS 114
Q22 | att-pre2 | Attitudes towards payment methods - pre-experiment 2
Matrix
Please order these payment methods - cash payment in store - debit card - credit card - credit transfer - online payment system by dragging each card and planting it somewhere on the scale below.
It is possible to drop more than one card in the same position if you feel they should have the same evaluation.
Rotated Very low Low OK High Very high Don't knowSecurity of payment method
Cost of payment method
Client notes: Our pre-test revealed that asking Q21/22 for six subsequent statements increases the likelihood of terminating the survey because of its repetitiveness. Therefore, we recommend skipping the highlighted 3 statements: the dimension “duration” is more or less covered by “ease”; the acceptance in
online or offline shops is less relevant for our research task than the remaining features.
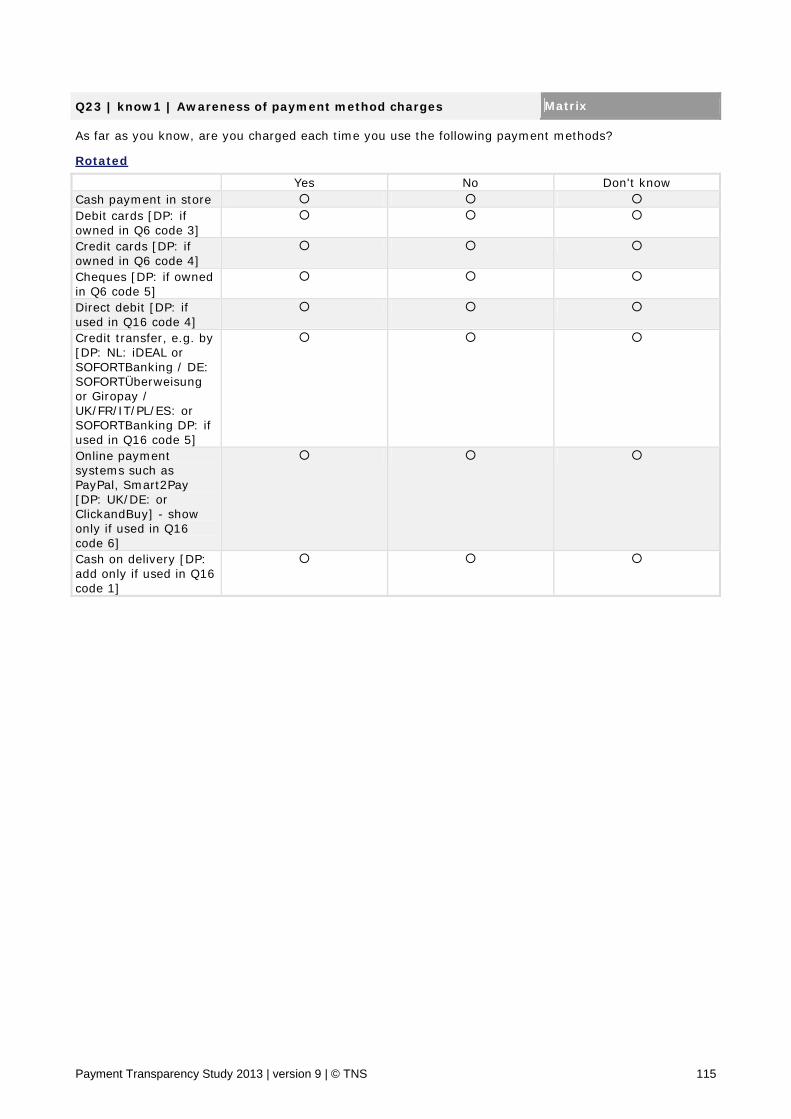
Payment Transparency Study 2013 | version 9 | © TNS 115
Q23 | know1 | Awareness of payment method charges Matrix As far as you know, are you charged each time you use the following payment methods? Rotated Yes No Don't know Cash payment in store Debit cards [DP: if owned in Q6 code 3]
Credit cards [DP: if owned in Q6 code 4]
Cheques [DP: if owned in Q6 code 5]
Direct debit [DP: if used in Q16 code 4]
Credit transfer, e.g. by [DP: NL: iDEAL or SOFORTBanking / DE: SOFORTÜberweisung or Giropay / UK/FR/IT/PL/ES: or SOFORTBanking DP: if used in Q16 code 5]
Online payment systems such as PayPal, Smart2Pay [DP: UK/DE: or ClickandBuy] - show only if used in Q16 code 6]
Cash on delivery [DP: add only if used in Q16 code 1]
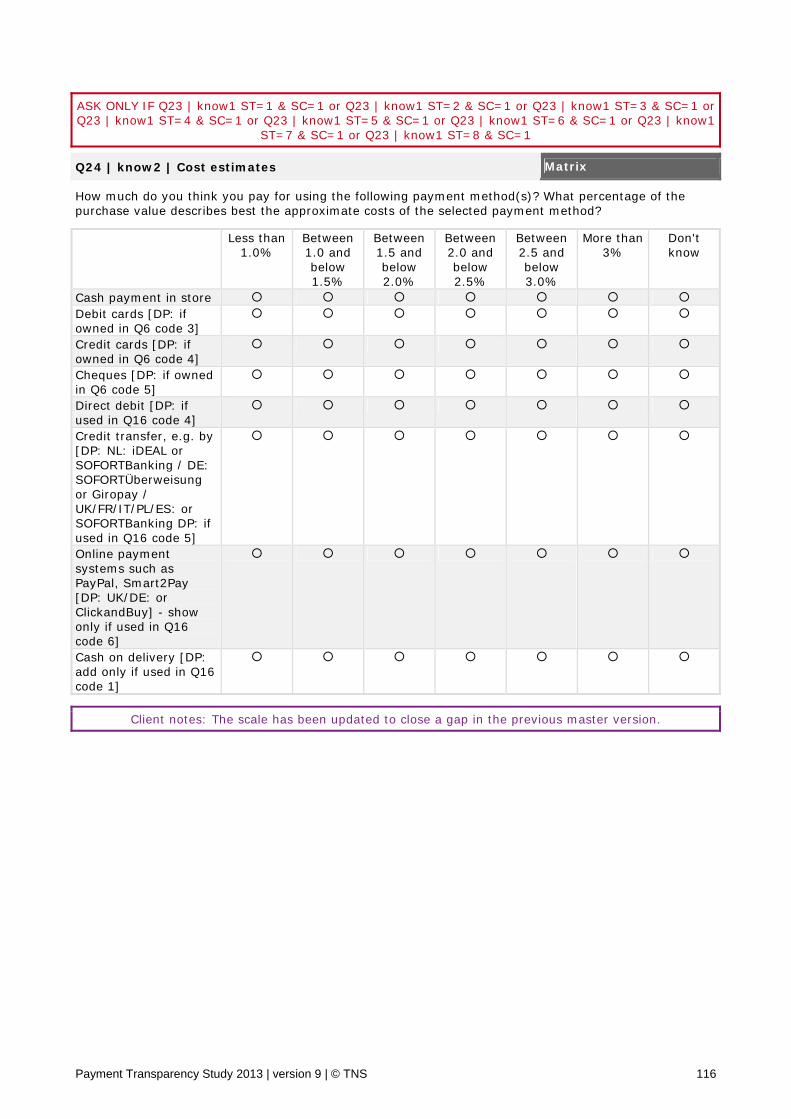
Payment Transparency Study 2013 | version 9 | © TNS 116
ASK ONLY IF Q23 | know1 ST=1 & SC=1 or Q23 | know1 ST=2 & SC=1 or Q23 | know1 ST=3 & SC=1 or Q23 | know1 ST=4 & SC=1 or Q23 | know1 ST=5 & SC=1 or Q23 | know1 ST=6 & SC=1 or Q23 | know1
ST=7 & SC=1 or Q23 | know1 ST=8 & SC=1
Q24 | know2 | Cost estimates Matrix How much do you think you pay for using the following payment method(s)? What percentage of the purchase value describes best the approximate costs of the selected payment method? Less than
1.0% Between 1.0 and below 1.5%
Between 1.5 and below 2.0%
Between 2.0 and below 2.5%
Between 2.5 and below 3.0%
More than 3%
Don't know
Cash payment in store Debit cards [DP: if owned in Q6 code 3]
Credit cards [DP: if owned in Q6 code 4]
Cheques [DP: if owned in Q6 code 5]
Direct debit [DP: if used in Q16 code 4]
Credit transfer, e.g. by [DP: NL: iDEAL or SOFORTBanking / DE: SOFORTÜberweisung or Giropay / UK/FR/IT/PL/ES: or SOFORTBanking DP: if used in Q16 code 5]
Online payment systems such as PayPal, Smart2Pay [DP: UK/DE: or ClickandBuy] - show only if used in Q16 code 6]
Cash on delivery [DP: add only if used in Q16 code 1]
Client notes: The scale has been updated to close a gap in the previous master version.
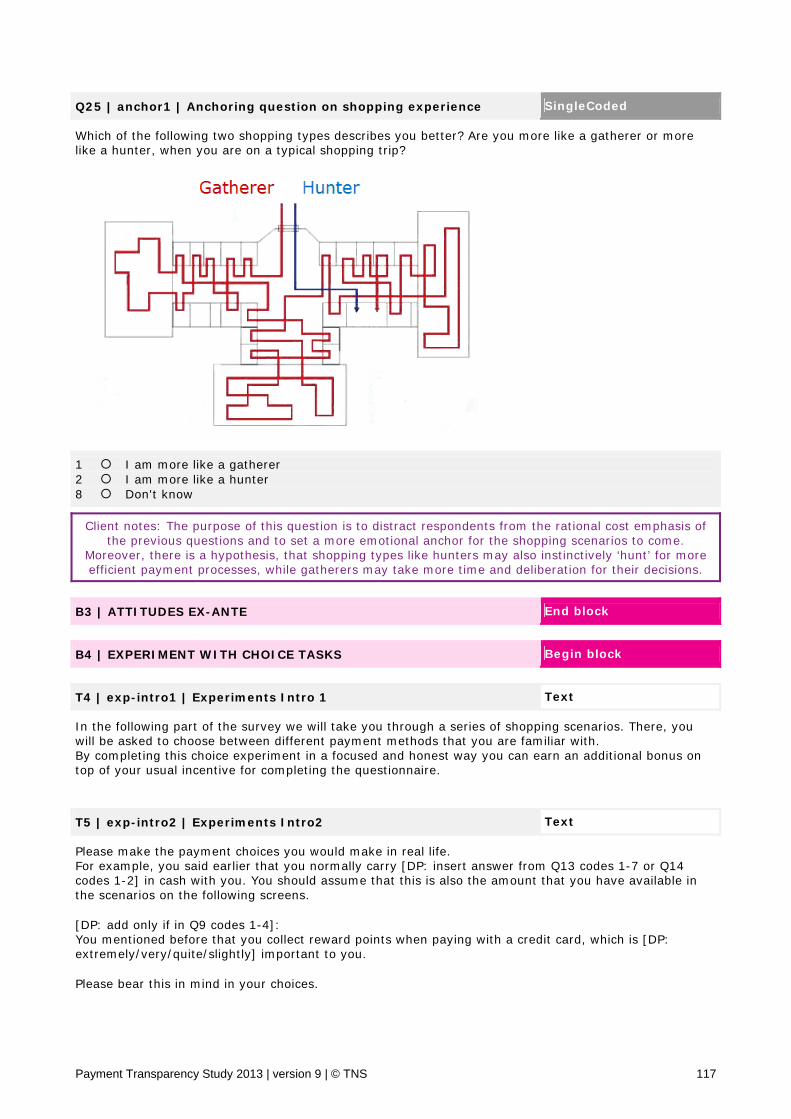
Payment Transparency Study 2013 | version 9 | © TNS 117
Q25 | anchor1 | Anchoring question on shopping experience SingleCoded Which of the following two shopping types describes you better? Are you more like a gatherer or more like a hunter, when you are on a typical shopping trip?
1 I am more like a gatherer 2 I am more like a hunter 8 Don't know
Client notes: The purpose of this question is to distract respondents from the rational cost emphasis of the previous questions and to set a more emotional anchor for the shopping scenarios to come.
Moreover, there is a hypothesis, that shopping types like hunters may also instinctively ‘hunt’ for more efficient payment processes, while gatherers may take more time and deliberation for their decisions.
B3 | ATTITUDES EX-ANTE End block
B4 | EXPERIMENT WITH CHOICE TASKS Begin block
T4 | exp-intro1 | Experiments Intro 1 Text In the following part of the survey we will take you through a series of shopping scenarios. There, you will be asked to choose between different payment methods that you are familiar with. By completing this choice experiment in a focused and honest way you can earn an additional bonus on top of your usual incentive for completing the questionnaire.
T5 | exp-intro2 | Experiments Intro2 Text Please make the payment choices you would make in real life. For example, you said earlier that you normally carry [DP: insert answer from Q13 codes 1-7 or Q14 codes 1-2] in cash with you. You should assume that this is also the amount that you have available in the scenarios on the following screens. [DP: add only if in Q9 codes 1-4]: You mentioned before that you collect reward points when paying with a credit card, which is [DP: extremely/very/quite/slightly] important to you. Please bear this in mind in your choices.

Payment Transparency Study 2013 | version 9 | © TNS 118
Q26 | split | Treatment splits SingleCoded
dummy [DP: Question is needed for transparent routing and REPORTAL analysis: Equal sample size across splits all at random]
1 Split 1: no rebate - never 2 Split 2: no rebate - after - mc 3 Split 3: no rebate - after - mc - edu 4 Split 4: no rebate - till - mc 5 Split 5: no rebate - till - mc - edu 6 Split 6: no rebate - enttill - mc 7 Split 7: no rebate - enttill - mc - edu 8 Split 8: rebate - after 9 Split 9: rebate - after - edu 10 Split 10: rebate - till 11 Split 11: rebate - till - edu 12 Split 12: rebate - enttill 13 Split 13: rebate - enttill - edu 14 Split 14: rebate - after - mc 15 Split 15: rebate - after - mc - edu 16 Split 16: rebate - till - mc 17 Split 17: rebate - till - mc - edu 18 Split 18: rebate - enttill - mc 19 Split 19: rebate - enttill - mc - edu 20 Split 20: surcharge - after 21 Split 21: surcharge - after - edu 22 Split 22: surcharge - till 23 Split 23: surcharge - till - edu 24 Split 24: surcharge - enttill 25 Split 25: surcharge - enttill - edu 26 Split 26: surcharge - after - mc 27 Split 27: surcharge - after - mc - edu 28 Split 28: surcharge - till - mc 29 Split 29: surcharge - till - mc - edu 30 Split 30: surcharge - enttill - mc 31 Split 31: surcharge - enttill - mc - edu
ASK ONLY IF Q26 | split=3,5,7,9,11,13,15,17,19,21,23,25,27,29,31
T6 | education1 | Education - awareness campaign1 Text As you may know, merchants pay significant fees when you decide to pay by credit card. These costs remain high due to a lack of competition. However, these costs are ultimately passed on to consumers, raising prices for all consumers, regardless of whether they pay by credit card or cash. More transparency about the real costs of credit cards may help reduce such fees. More transparency should also increase competition, and would ultimately make credit cards cheaper to use.
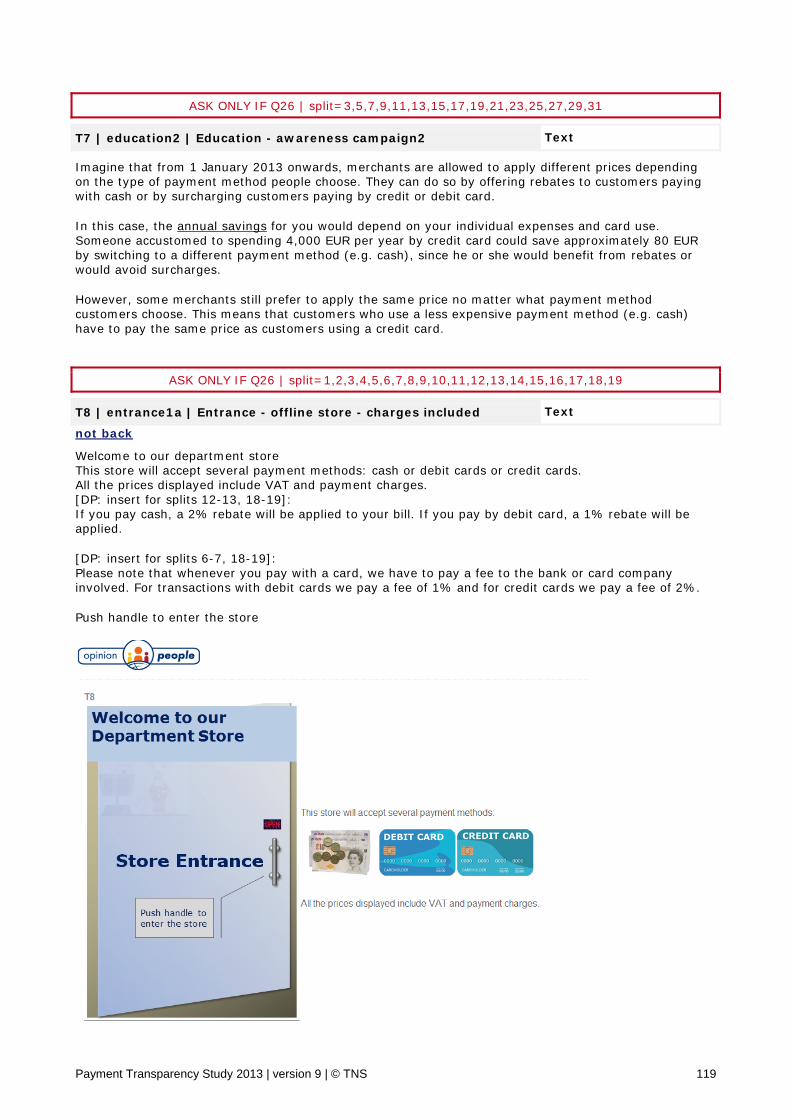
Payment Transparency Study 2013 | version 9 | © TNS 119
ASK ONLY IF Q26 | split=3,5,7,9,11,13,15,17,19,21,23,25,27,29,31
T7 | education2 | Education - awareness campaign2 Text Imagine that from 1 January 2013 onwards, merchants are allowed to apply different prices depending on the type of payment method people choose. They can do so by offering rebates to customers paying with cash or by surcharging customers paying by credit or debit card. In this case, the annual savings for you would depend on your individual expenses and card use. Someone accustomed to spending 4,000 EUR per year by credit card could save approximately 80 EUR by switching to a different payment method (e.g. cash), since he or she would benefit from rebates or would avoid surcharges. However, some merchants still prefer to apply the same price no matter what payment method customers choose. This means that customers who use a less expensive payment method (e.g. cash) have to pay the same price as customers using a credit card.
ASK ONLY IF Q26 | split=1,2,3,4,5,6,7,8,9,10,11,12,13,14,15,16,17,18,19
T8 | entrance1a | Entrance - offline store - charges included Text
not back Welcome to our department store This store will accept several payment methods: cash or debit cards or credit cards. All the prices displayed include VAT and payment charges. [DP: insert for splits 12-13, 18-19]: If you pay cash, a 2% rebate will be applied to your bill. If you pay by debit card, a 1% rebate will be applied. [DP: insert for splits 6-7, 18-19]: Please note that whenever you pay with a card, we have to pay a fee to the bank or card company involved. For transactions with debit cards we pay a fee of 1% and for credit cards we pay a fee of 2%. Push handle to enter the store
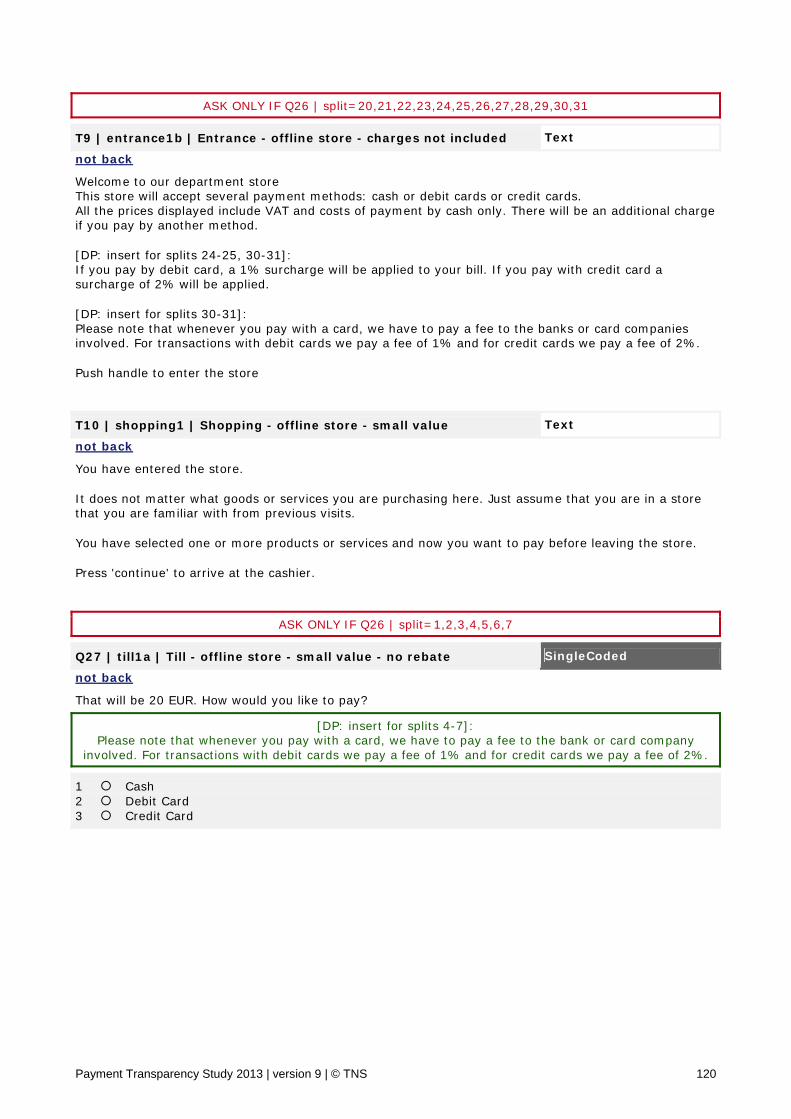
Payment Transparency Study 2013 | version 9 | © TNS 120
ASK ONLY IF Q26 | split=20,21,22,23,24,25,26,27,28,29,30,31
T9 | entrance1b | Entrance - offline store - charges not included Text
not back Welcome to our department store This store will accept several payment methods: cash or debit cards or credit cards. All the prices displayed include VAT and costs of payment by cash only. There will be an additional charge if you pay by another method. [DP: insert for splits 24-25, 30-31]: If you pay by debit card, a 1% surcharge will be applied to your bill. If you pay with credit card a surcharge of 2% will be applied. [DP: insert for splits 30-31]: Please note that whenever you pay with a card, we have to pay a fee to the banks or card companies involved. For transactions with debit cards we pay a fee of 1% and for credit cards we pay a fee of 2%. Push handle to enter the store
T10 | shopping1 | Shopping - offline store - small value Text
not back You have entered the store. It does not matter what goods or services you are purchasing here. Just assume that you are in a store that you are familiar with from previous visits. You have selected one or more products or services and now you want to pay before leaving the store. Press 'continue' to arrive at the cashier.
ASK ONLY IF Q26 | split=1,2,3,4,5,6,7
Q27 | till1a | Till - offline store - small value - no rebate SingleCoded
not back That will be 20 EUR. How would you like to pay?
[DP: insert for splits 4-7]: Please note that whenever you pay with a card, we have to pay a fee to the bank or card company
involved. For transactions with debit cards we pay a fee of 1% and for credit cards we pay a fee of 2%.
1 Cash 2 Debit Card 3 Credit Card
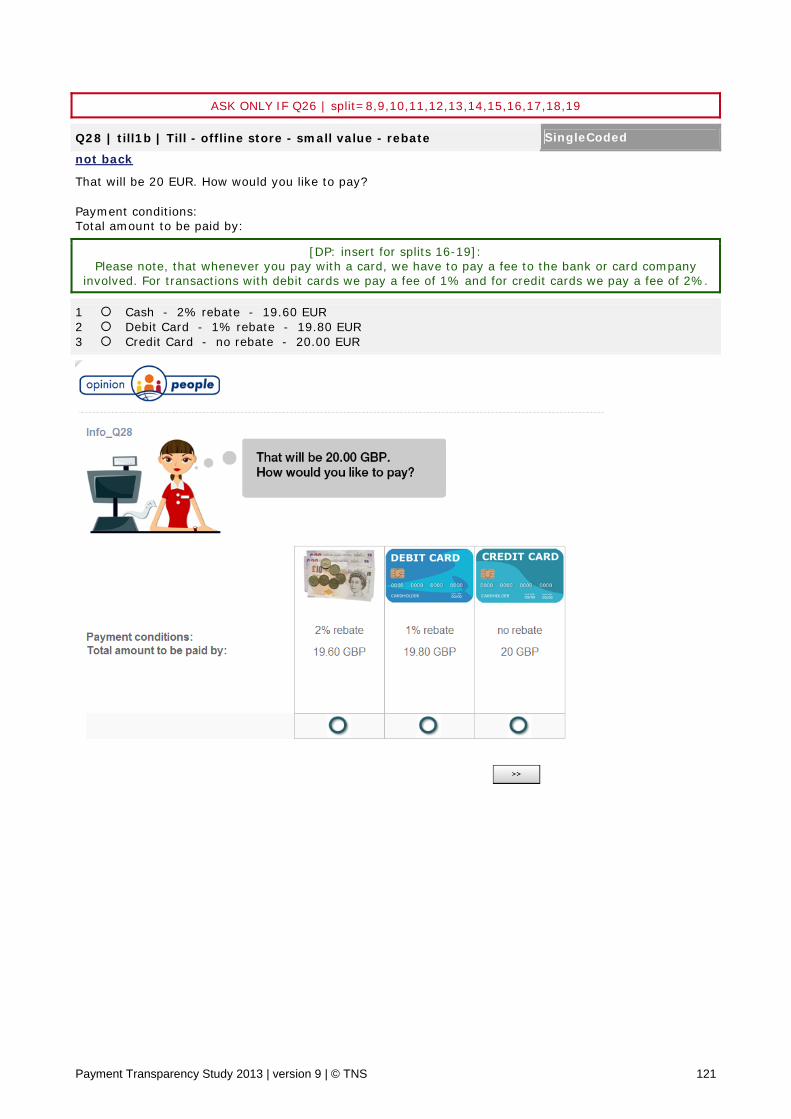
Payment Transparency Study 2013 | version 9 | © TNS 121
ASK ONLY IF Q26 | split=8,9,10,11,12,13,14,15,16,17,18,19
Q28 | till1b | Till - offline store - small value - rebate SingleCoded
not back That will be 20 EUR. How would you like to pay? Payment conditions: Total amount to be paid by:
[DP: insert for splits 16-19]: Please note, that whenever you pay with a card, we have to pay a fee to the bank or card company
involved. For transactions with debit cards we pay a fee of 1% and for credit cards we pay a fee of 2%.
1 Cash - 2% rebate - 19.60 EUR 2 Debit Card - 1% rebate - 19.80 EUR 3 Credit Card - no rebate - 20.00 EUR
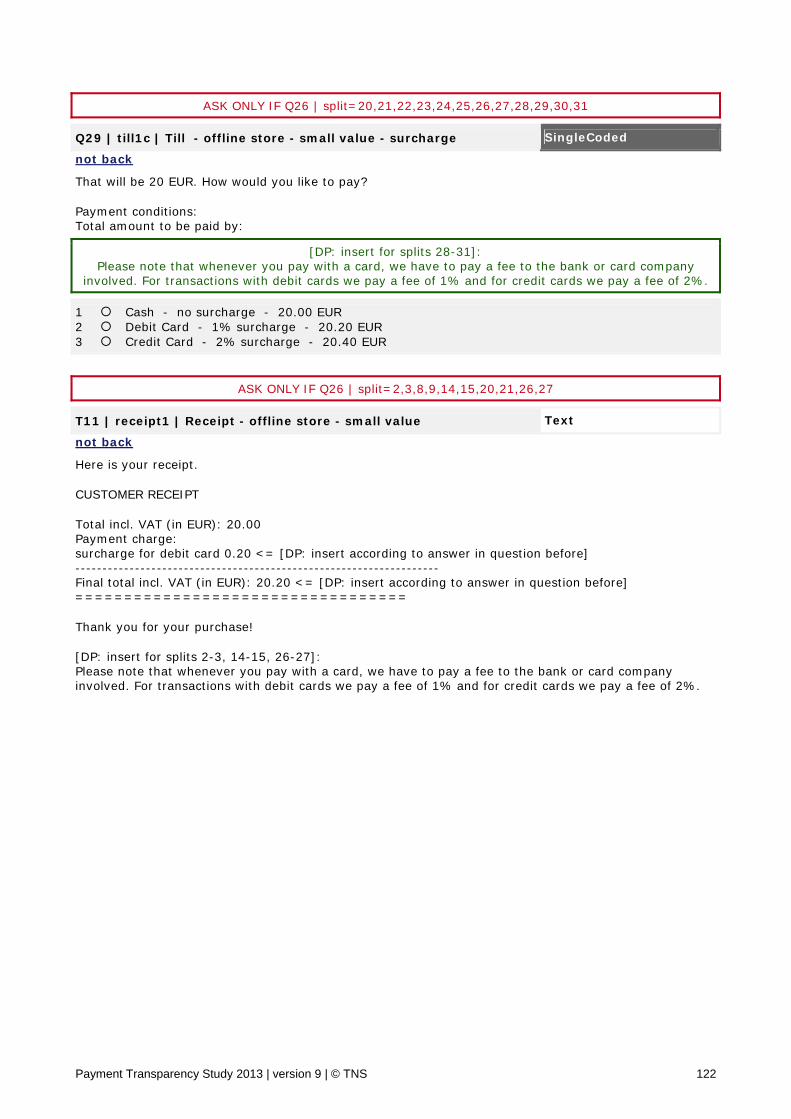
Payment Transparency Study 2013 | version 9 | © TNS 122
ASK ONLY IF Q26 | split=20,21,22,23,24,25,26,27,28,29,30,31
Q29 | till1c | Till - offline store - small value - surcharge SingleCoded
not back That will be 20 EUR. How would you like to pay? Payment conditions: Total amount to be paid by:
[DP: insert for splits 28-31]: Please note that whenever you pay with a card, we have to pay a fee to the bank or card company
involved. For transactions with debit cards we pay a fee of 1% and for credit cards we pay a fee of 2%.
1 Cash - no surcharge - 20.00 EUR 2 Debit Card - 1% surcharge - 20.20 EUR 3 Credit Card - 2% surcharge - 20.40 EUR
ASK ONLY IF Q26 | split=2,3,8,9,14,15,20,21,26,27
T11 | receipt1 | Receipt - offline store - small value Text
not back Here is your receipt. CUSTOMER RECEIPT Total incl. VAT (in EUR): 20.00 Payment charge: surcharge for debit card 0.20 <= [DP: insert according to answer in question before] ------------------------------------------------------------------- Final total incl. VAT (in EUR): 20.20 <= [DP: insert according to answer in question before] ================================== Thank you for your purchase! [DP: insert for splits 2-3, 14-15, 26-27]: Please note that whenever you pay with a card, we have to pay a fee to the bank or card company involved. For transactions with debit cards we pay a fee of 1% and for credit cards we pay a fee of 2%.
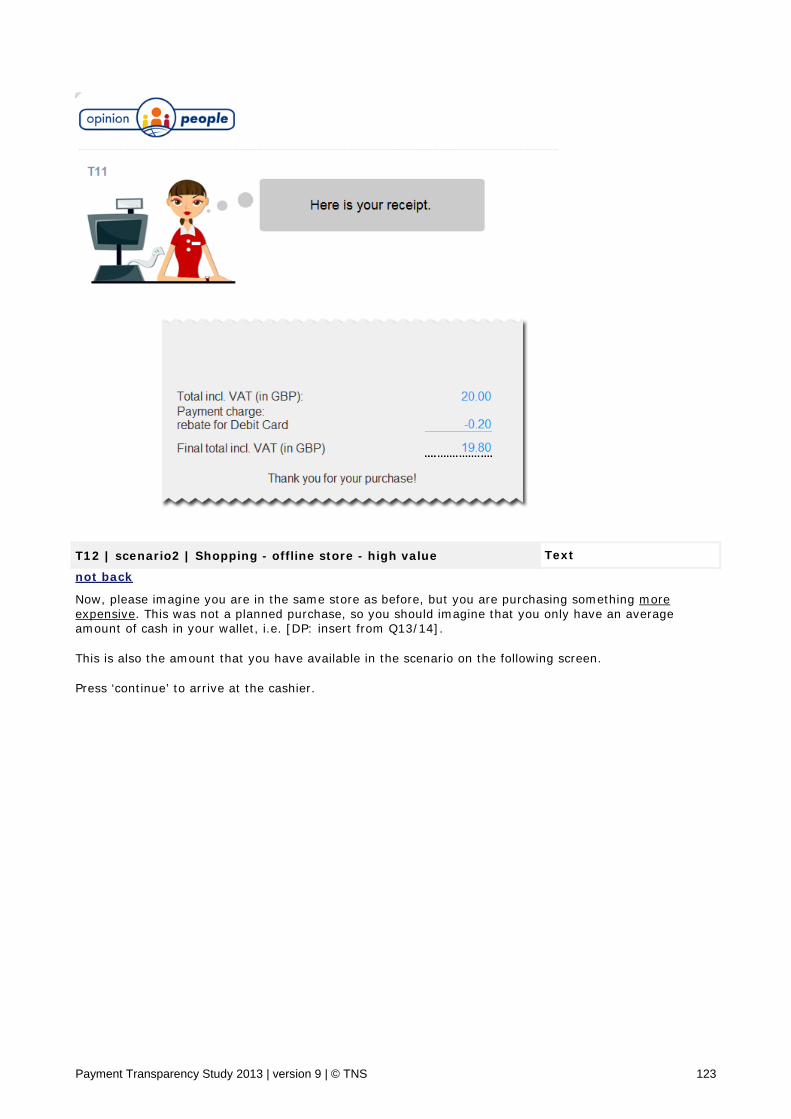
Payment Transparency Study 2013 | version 9 | © TNS 123
T12 | scenario2 | Shopping - offline store - high value Text
not back Now, please imagine you are in the same store as before, but you are purchasing something more expensive. This was not a planned purchase, so you should imagine that you only have an average amount of cash in your wallet, i.e. [DP: insert from Q13/14]. This is also the amount that you have available in the scenario on the following screen. Press ‘continue’ to arrive at the cashier.
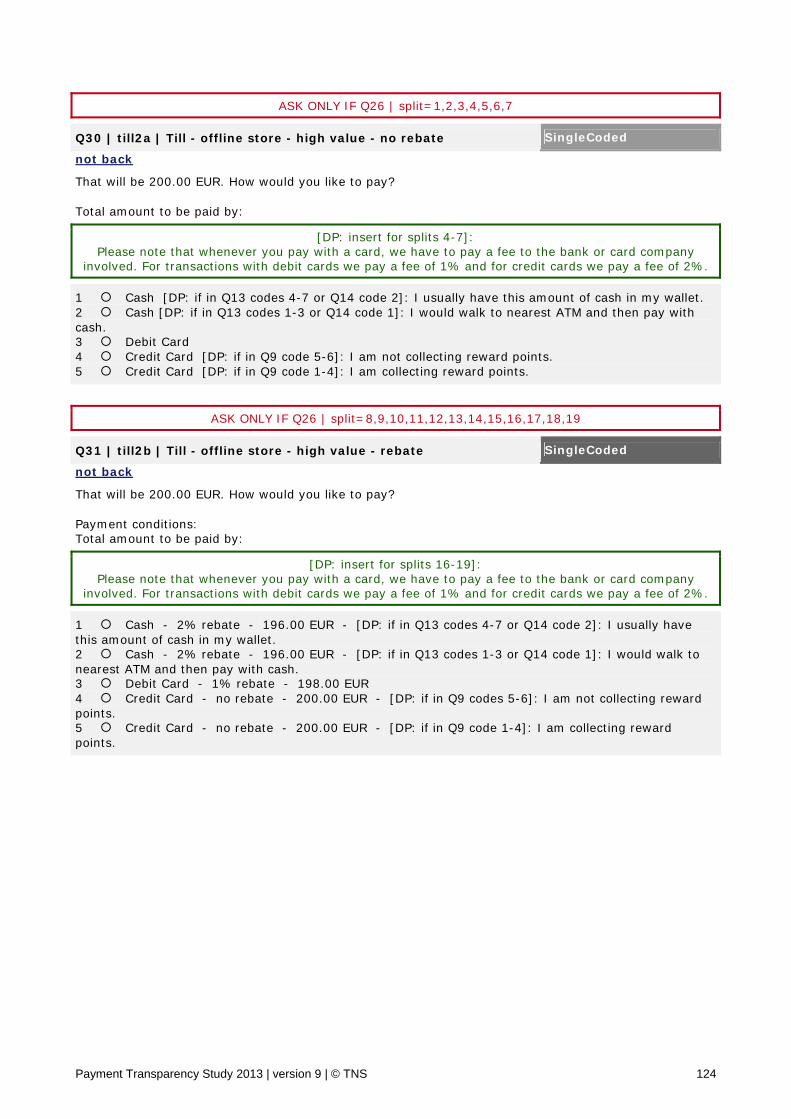
Payment Transparency Study 2013 | version 9 | © TNS 124
ASK ONLY IF Q26 | split=1,2,3,4,5,6,7
Q30 | till2a | Till - offline store - high value - no rebate SingleCoded
not back That will be 200.00 EUR. How would you like to pay? Total amount to be paid by:
[DP: insert for splits 4-7]: Please note that whenever you pay with a card, we have to pay a fee to the bank or card company
involved. For transactions with debit cards we pay a fee of 1% and for credit cards we pay a fee of 2%.
1 Cash [DP: if in Q13 codes 4-7 or Q14 code 2]: I usually have this amount of cash in my wallet. 2 Cash [DP: if in Q13 codes 1-3 or Q14 code 1]: I would walk to nearest ATM and then pay with cash. 3 Debit Card 4 Credit Card [DP: if in Q9 code 5-6]: I am not collecting reward points. 5 Credit Card [DP: if in Q9 code 1-4]: I am collecting reward points.
ASK ONLY IF Q26 | split=8,9,10,11,12,13,14,15,16,17,18,19
Q31 | till2b | Till - offline store - high value - rebate SingleCoded
not back That will be 200.00 EUR. How would you like to pay? Payment conditions: Total amount to be paid by:
[DP: insert for splits 16-19]: Please note that whenever you pay with a card, we have to pay a fee to the bank or card company
involved. For transactions with debit cards we pay a fee of 1% and for credit cards we pay a fee of 2%.
1 Cash - 2% rebate - 196.00 EUR - [DP: if in Q13 codes 4-7 or Q14 code 2]: I usually have this amount of cash in my wallet. 2 Cash - 2% rebate - 196.00 EUR - [DP: if in Q13 codes 1-3 or Q14 code 1]: I would walk to nearest ATM and then pay with cash. 3 Debit Card - 1% rebate - 198.00 EUR 4 Credit Card - no rebate - 200.00 EUR - [DP: if in Q9 codes 5-6]: I am not collecting reward points. 5 Credit Card - no rebate - 200.00 EUR - [DP: if in Q9 code 1-4]: I am collecting reward points.
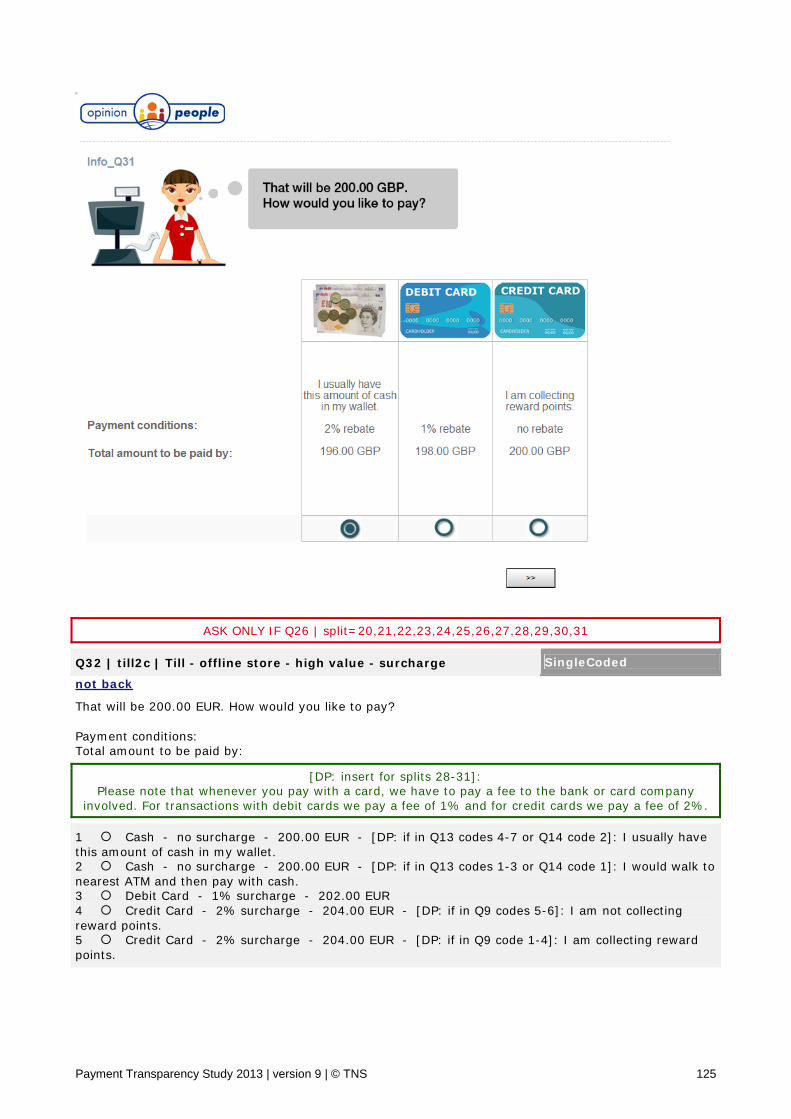
Payment Transparency Study 2013 | version 9 | © TNS 125
ASK ONLY IF Q26 | split=20,21,22,23,24,25,26,27,28,29,30,31
Q32 | till2c | Till - offline store - high value - surcharge SingleCoded
not back That will be 200.00 EUR. How would you like to pay? Payment conditions: Total amount to be paid by:
[DP: insert for splits 28-31]: Please note that whenever you pay with a card, we have to pay a fee to the bank or card company
involved. For transactions with debit cards we pay a fee of 1% and for credit cards we pay a fee of 2%.
1 Cash - no surcharge - 200.00 EUR - [DP: if in Q13 codes 4-7 or Q14 code 2]: I usually have this amount of cash in my wallet. 2 Cash - no surcharge - 200.00 EUR - [DP: if in Q13 codes 1-3 or Q14 code 1]: I would walk to nearest ATM and then pay with cash. 3 Debit Card - 1% surcharge - 202.00 EUR 4 Credit Card - 2% surcharge - 204.00 EUR - [DP: if in Q9 codes 5-6]: I am not collecting reward points. 5 Credit Card - 2% surcharge - 204.00 EUR - [DP: if in Q9 code 1-4]: I am collecting reward points.
Payment Transparency Study 2013 | version 9 | © TNS 126
T111 | receipt2 | Receipt - offline store - high value Text
not back Here is your receipt. CUSTOMER RECEIPT Total incl. VAT (in EUR): 200.00 Payment charge: surcharge for debit card 2.00 <= [DP: insert according to answer in question before] ------------------------------------------------------------------- Final total incl. VAT (in EUR): 202.00 <= [DP: insert according to answer in question before] ================================== Thank you for your purchase! [DP: insert for splits 2-3, 14-15, 26-27]: Please note that whenever you pay with a card, we have to pay a fee to the bank or card company involved. For transactions with debit cards we pay a fee of 1% and for credit cards we pay a fee of 2%.
Q33 | offline-high-seg | Choice segmentation offline store - high value
SingleCoded
dummy [DP: target group consolidation based on questions offline store high value]
1 Cash [DP: if code 1 or 2 in Q30-32] 2 Debit Card [DP: if code 3 in Q30-32] 3 Credit Card [DP: if code 4 or 5 in Q30-32]
Client notes: This dummy question will not be shown to respondents. Its purpose is to establish a useful segmentation on choice behaviour that is also relevant for routing subsequent questions.
ASK ONLY IF Q15 | online1=1,2,3,4
B5 | Online store Begin block
T13 | scenario3 | Intro online store Text
not back Next, please imagine you are purchasing something on the Internet. Again, we ask you to choose the payment method you would also use in real life.
ASK ONLY IF Q26 | split=1,2,3,4,5,6,7,8,9,10,11,12,13,14,15,16,17,18,19
T14 | entrance3a | Entrance - online store - charges included Text
not back Welcome to our www-shop All the prices include VAT and payment charges - excluding delivery charges. You can pay by credit card, debit card, money transfer or online payment system. [DP: add hyperlink for splits 6-7, 12-13, 18-19]: More information Click on 'GO' to enter the store
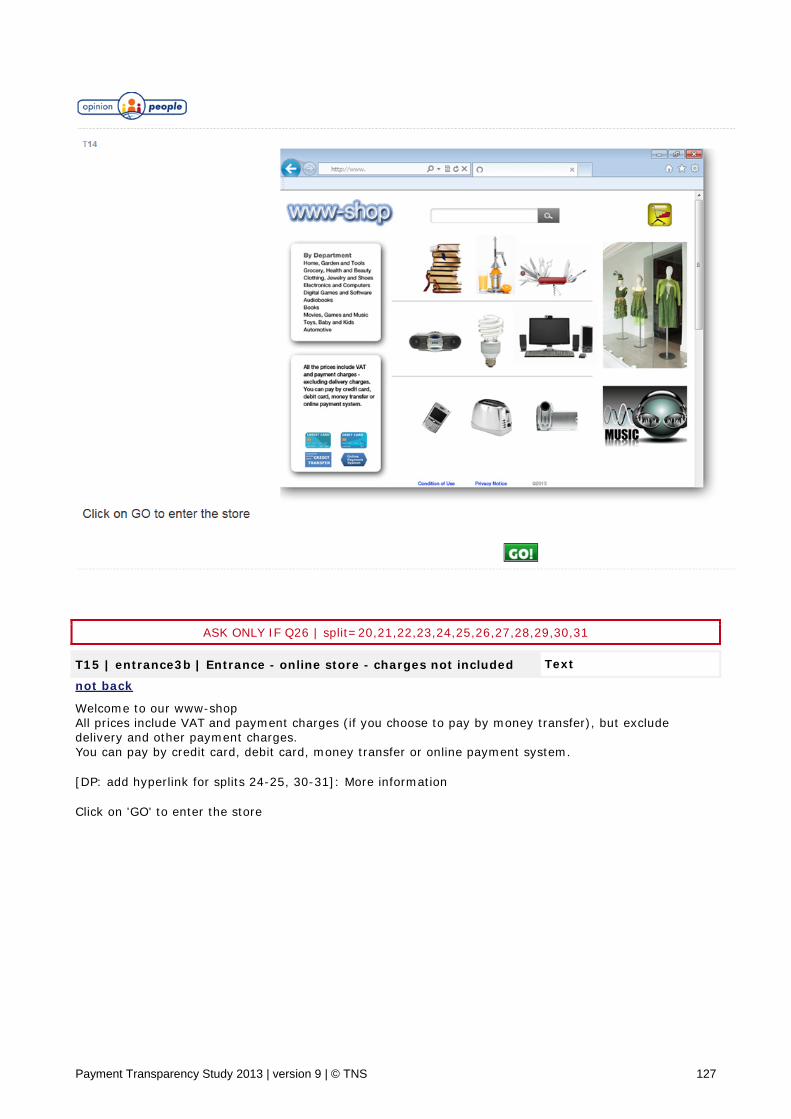
Payment Transparency Study 2013 | version 9 | © TNS 127
ASK ONLY IF Q26 | split=20,21,22,23,24,25,26,27,28,29,30,31
T15 | entrance3b | Entrance - online store - charges not included Text
not back Welcome to our www-shop All prices include VAT and payment charges (if you choose to pay by money transfer), but exclude delivery and other payment charges. You can pay by credit card, debit card, money transfer or online payment system. [DP: add hyperlink for splits 24-25, 30-31]: More information Click on 'GO' to enter the store
Payment Transparency Study 2013 | version 9 | © TNS 128
T16 | glossary | Glossary - online store Text More information on payment options [DP: for splits 12-13, 18-19]: If you pay by - credit transfer 3% - debit card 2% - credit card 1% - online payment system 0% a rebate will be applied to the cost of your purchase. [DP: for splits 24-25, 30-31]: If you pay by - credit transfer 0% - debit card 1% - credit card 2% - online payment system 3% a surcharge will be applied to the cost of purchase. [DP: for splits 6-7, 18-19, 30-31]: Please note that whenever you pay with a card or with an online payment system, we have to pay a fee to the bank or card company involved. For transactions with debit cards we pay a fee of 1%, for credit cards 2% and for online payment systems 3% of the transaction amount.
T17 | shopping3 | Shopping - online store - small value Text
not back Assume you have browsed the online shop. It does not matter what goods or services you are purchasing here. Just assume that you are in an online store that you are familiar with from previous visits. You have selected one or more products or services and now you want to pay before leaving the store. Press 'continue' to go to the checkout.
T18 | basket3 | Basket - online store - small value Text
not back 1. Shopping basket These are all items in your basket. Item description - unit price - amount - total price 8.00 - 2 - 16.00 Total purchase value incl. VAT (in EUR) 16.00 Delivery charges 4.00 Total purchase value incl. VAT (in EUR) 20.00
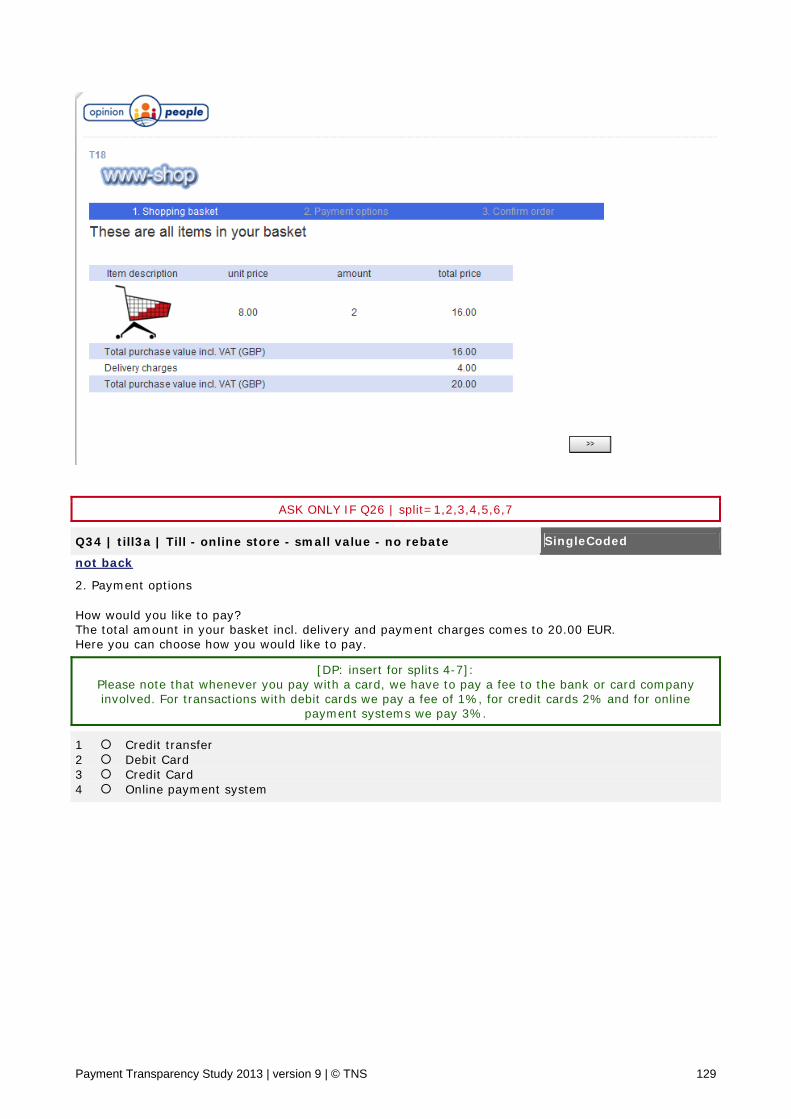
Payment Transparency Study 2013 | version 9 | © TNS 129
ASK ONLY IF Q26 | split=1,2,3,4,5,6,7
Q34 | till3a | Till - online store - small value - no rebate SingleCoded
not back 2. Payment options How would you like to pay? The total amount in your basket incl. delivery and payment charges comes to 20.00 EUR. Here you can choose how you would like to pay.
[DP: insert for splits 4-7]: Please note that whenever you pay with a card, we have to pay a fee to the bank or card company involved. For transactions with debit cards we pay a fee of 1%, for credit cards 2% and for online
payment systems we pay 3%.
1 Credit transfer 2 Debit Card 3 Credit Card 4 Online payment system
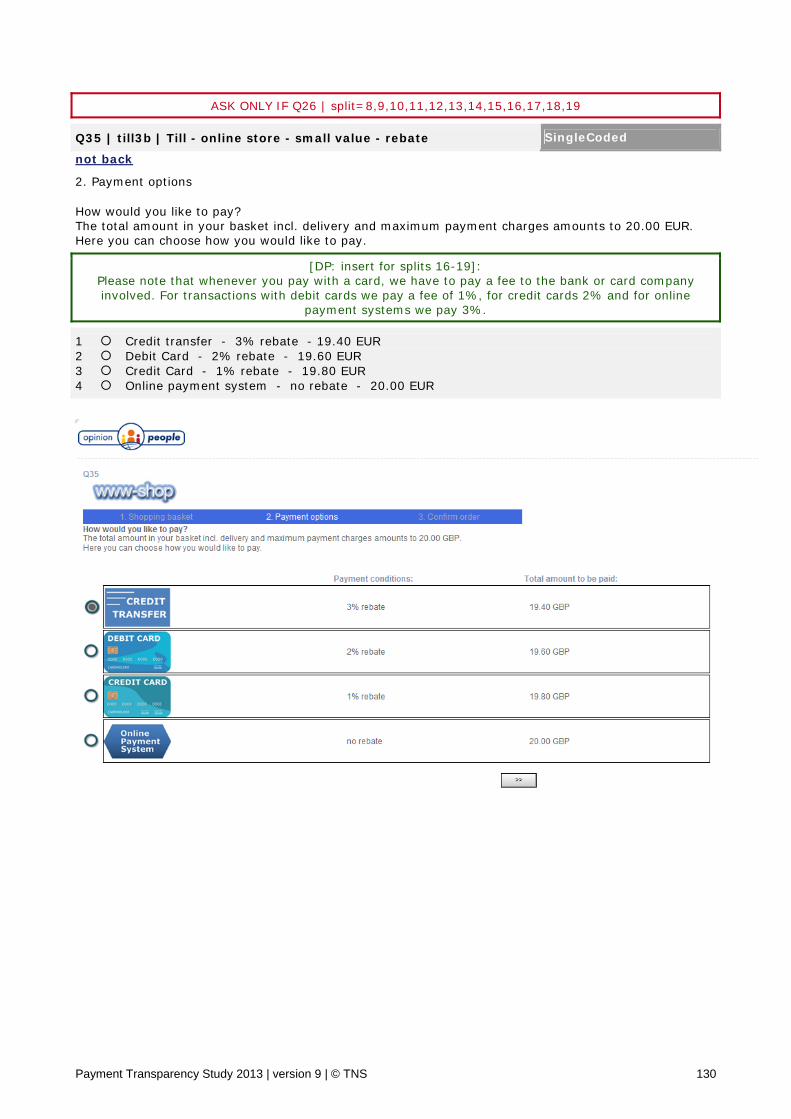
Payment Transparency Study 2013 | version 9 | © TNS 130
ASK ONLY IF Q26 | split=8,9,10,11,12,13,14,15,16,17,18,19
Q35 | till3b | Till - online store - small value - rebate SingleCoded
not back 2. Payment options How would you like to pay? The total amount in your basket incl. delivery and maximum payment charges amounts to 20.00 EUR. Here you can choose how you would like to pay.
[DP: insert for splits 16-19]: Please note that whenever you pay with a card, we have to pay a fee to the bank or card company involved. For transactions with debit cards we pay a fee of 1%, for credit cards 2% and for online
payment systems we pay 3%.
1 Credit transfer - 3% rebate - 19.40 EUR 2 Debit Card - 2% rebate - 19.60 EUR 3 Credit Card - 1% rebate - 19.80 EUR 4 Online payment system - no rebate - 20.00 EUR
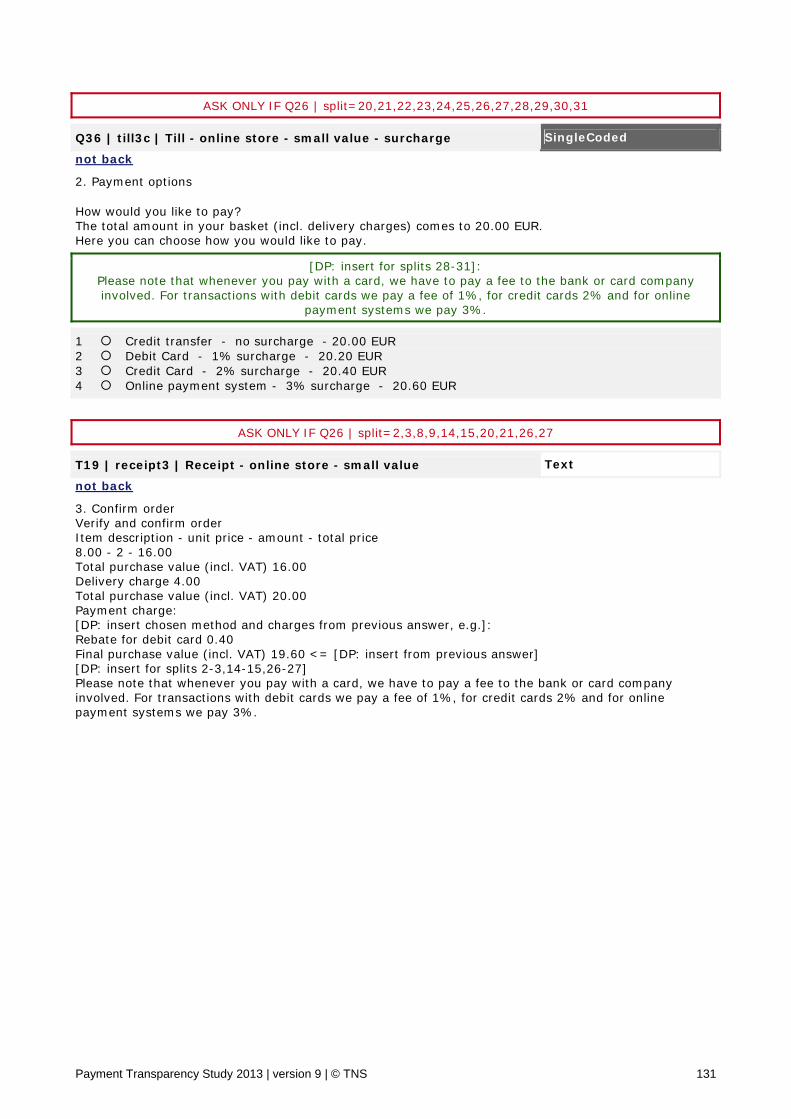
Payment Transparency Study 2013 | version 9 | © TNS 131
ASK ONLY IF Q26 | split=20,21,22,23,24,25,26,27,28,29,30,31
Q36 | till3c | Till - online store - small value - surcharge SingleCoded
not back 2. Payment options How would you like to pay? The total amount in your basket (incl. delivery charges) comes to 20.00 EUR. Here you can choose how you would like to pay.
[DP: insert for splits 28-31]: Please note that whenever you pay with a card, we have to pay a fee to the bank or card company involved. For transactions with debit cards we pay a fee of 1%, for credit cards 2% and for online
payment systems we pay 3%.
1 Credit transfer - no surcharge - 20.00 EUR 2 Debit Card - 1% surcharge - 20.20 EUR 3 Credit Card - 2% surcharge - 20.40 EUR 4 Online payment system - 3% surcharge - 20.60 EUR
ASK ONLY IF Q26 | split=2,3,8,9,14,15,20,21,26,27
T19 | receipt3 | Receipt - online store - small value Text
not back 3. Confirm order Verify and confirm order Item description - unit price - amount - total price 8.00 - 2 - 16.00 Total purchase value (incl. VAT) 16.00 Delivery charge 4.00 Total purchase value (incl. VAT) 20.00 Payment charge: [DP: insert chosen method and charges from previous answer, e.g.]: Rebate for debit card 0.40 Final purchase value (incl. VAT) 19.60 <= [DP: insert from previous answer] [DP: insert for splits 2-3,14-15,26-27] Please note that whenever you pay with a card, we have to pay a fee to the bank or card company involved. For transactions with debit cards we pay a fee of 1%, for credit cards 2% and for online payment systems we pay 3%.
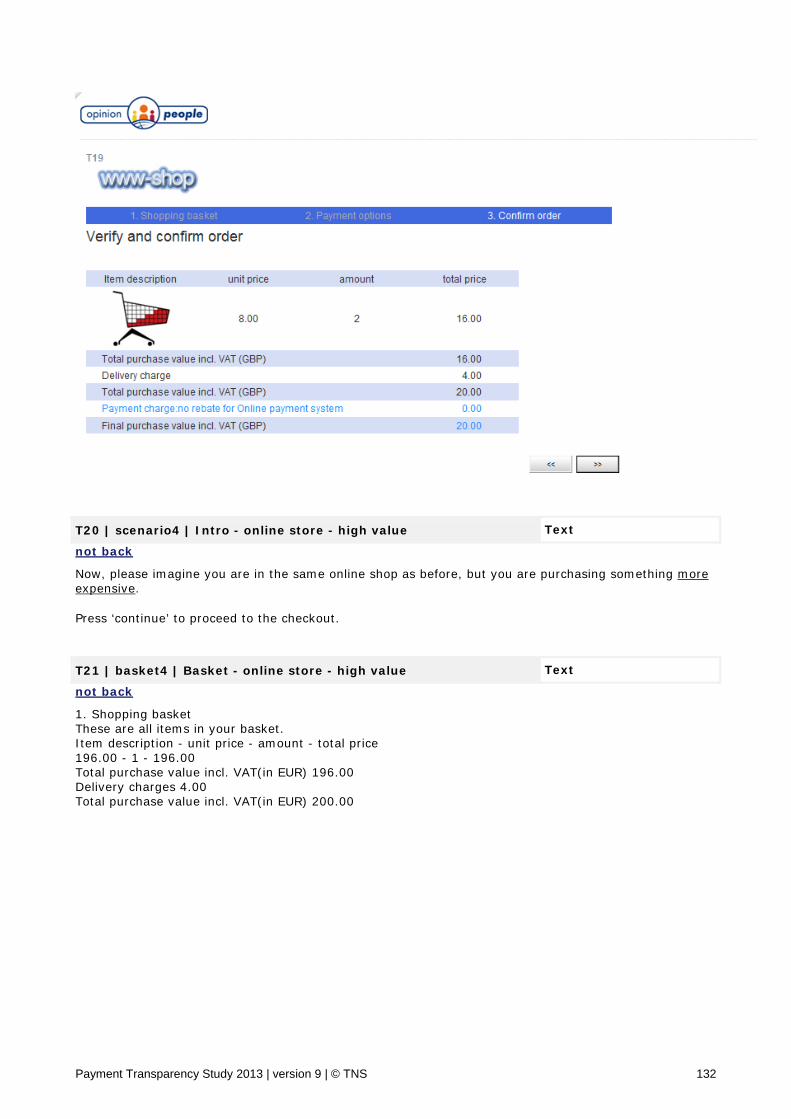
Payment Transparency Study 2013 | version 9 | © TNS 132
T20 | scenario4 | Intro - online store - high value Text
not back Now, please imagine you are in the same online shop as before, but you are purchasing something more expensive. Press ‘continue’ to proceed to the checkout.
T21 | basket4 | Basket - online store - high value Text
not back 1. Shopping basket These are all items in your basket. Item description - unit price - amount - total price 196.00 - 1 - 196.00 Total purchase value incl. VAT(in EUR) 196.00 Delivery charges 4.00 Total purchase value incl. VAT(in EUR) 200.00
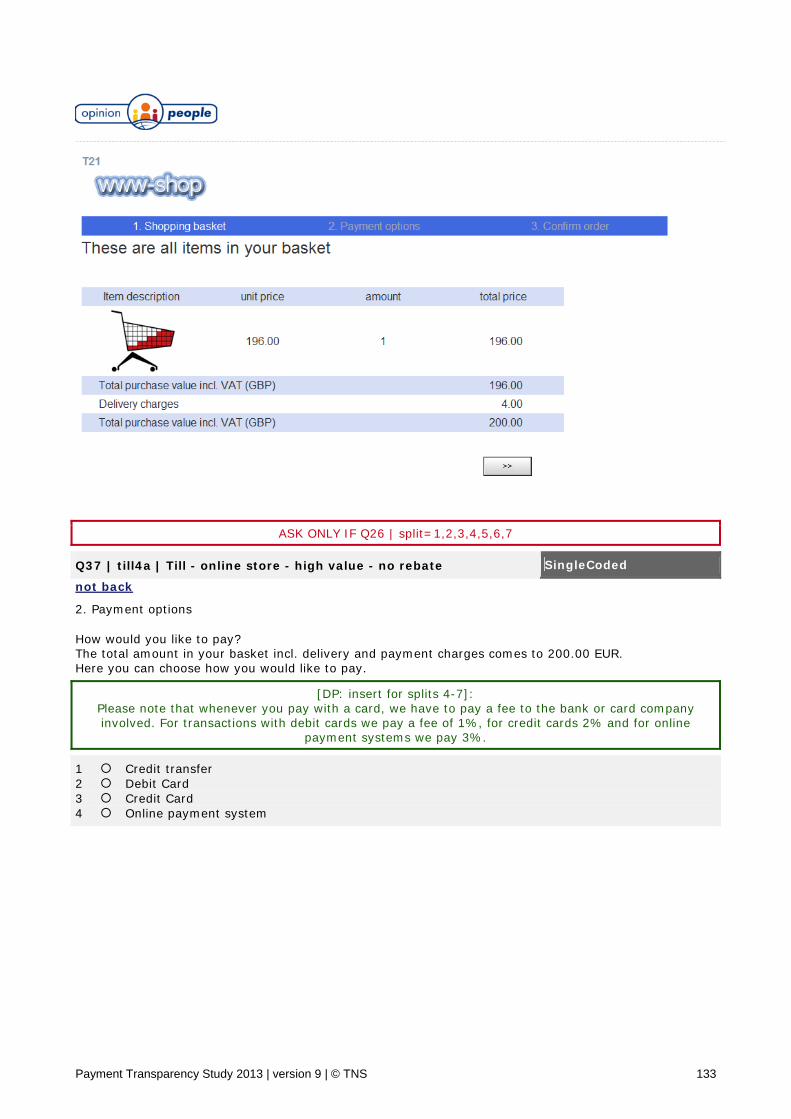
Payment Transparency Study 2013 | version 9 | © TNS 133
ASK ONLY IF Q26 | split=1,2,3,4,5,6,7
Q37 | till4a | Till - online store - high value - no rebate SingleCoded
not back 2. Payment options How would you like to pay? The total amount in your basket incl. delivery and payment charges comes to 200.00 EUR. Here you can choose how you would like to pay.
[DP: insert for splits 4-7]: Please note that whenever you pay with a card, we have to pay a fee to the bank or card company involved. For transactions with debit cards we pay a fee of 1%, for credit cards 2% and for online
payment systems we pay 3%.
1 Credit transfer 2 Debit Card 3 Credit Card 4 Online payment system
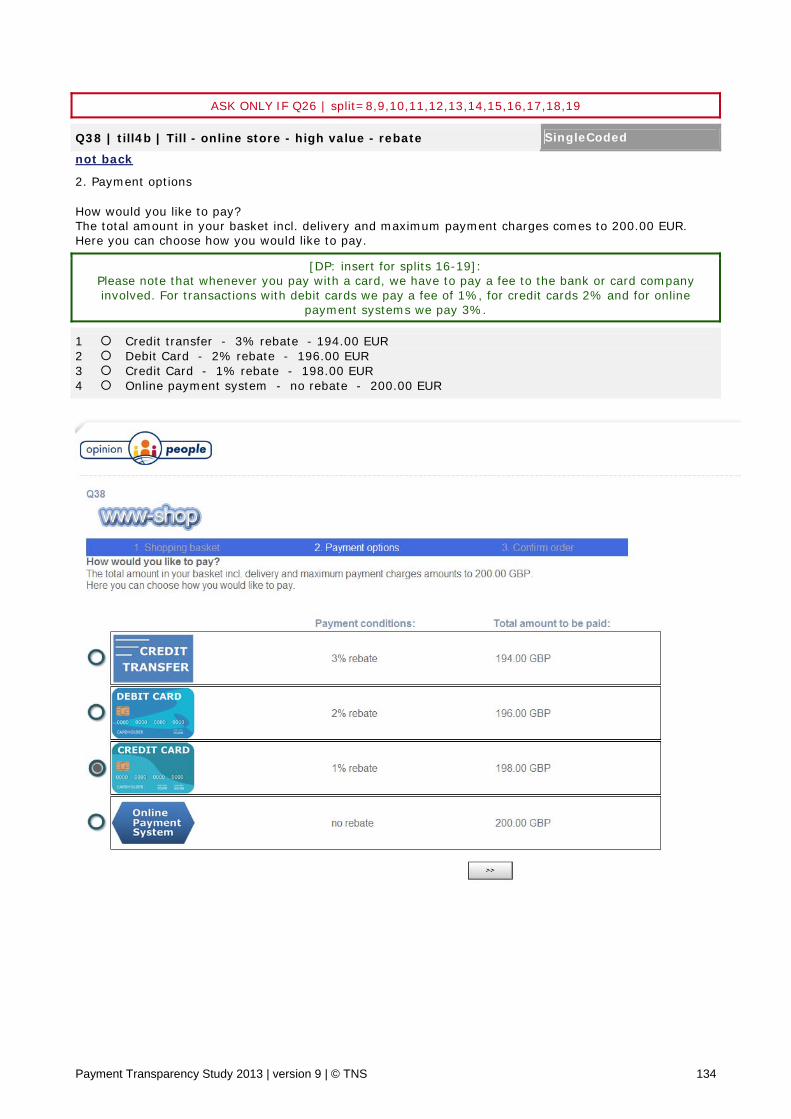
Payment Transparency Study 2013 | version 9 | © TNS 134
ASK ONLY IF Q26 | split=8,9,10,11,12,13,14,15,16,17,18,19
Q38 | till4b | Till - online store - high value - rebate SingleCoded
not back 2. Payment options How would you like to pay? The total amount in your basket incl. delivery and maximum payment charges comes to 200.00 EUR. Here you can choose how you would like to pay.
[DP: insert for splits 16-19]: Please note that whenever you pay with a card, we have to pay a fee to the bank or card company involved. For transactions with debit cards we pay a fee of 1%, for credit cards 2% and for online
payment systems we pay 3%.
1 Credit transfer - 3% rebate - 194.00 EUR 2 Debit Card - 2% rebate - 196.00 EUR 3 Credit Card - 1% rebate - 198.00 EUR 4 Online payment system - no rebate - 200.00 EUR
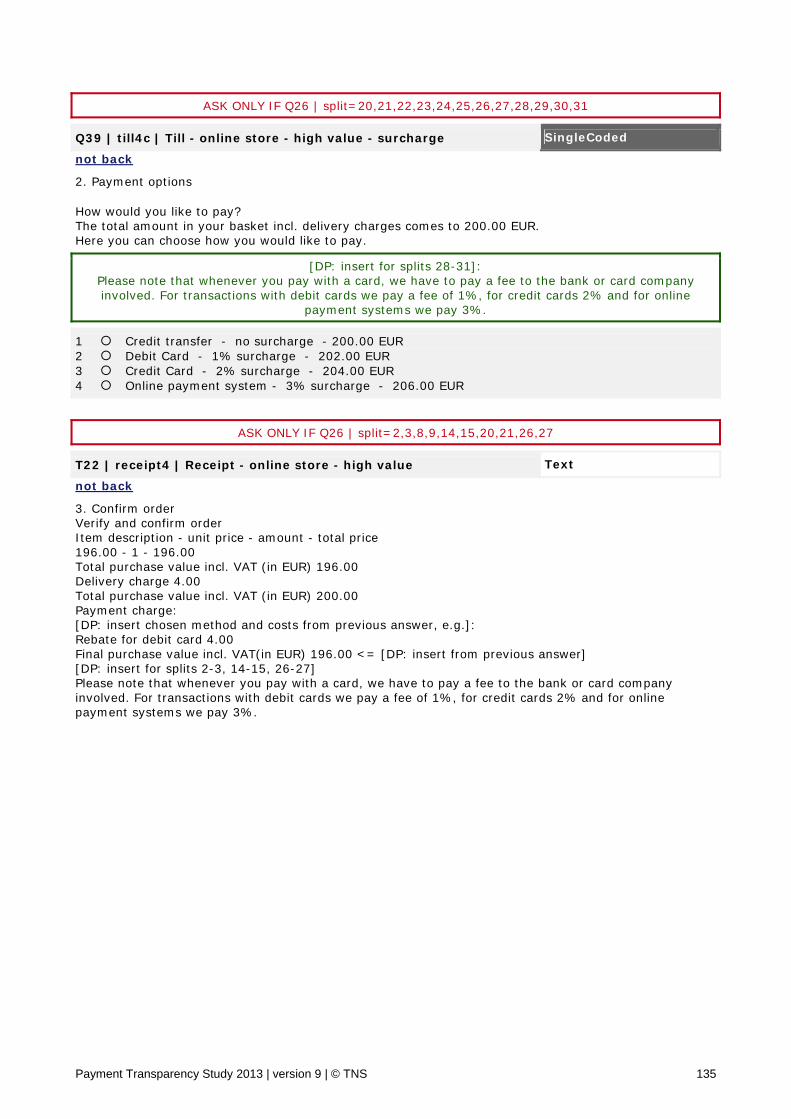
Payment Transparency Study 2013 | version 9 | © TNS 135
ASK ONLY IF Q26 | split=20,21,22,23,24,25,26,27,28,29,30,31
Q39 | till4c | Till - online store - high value - surcharge SingleCoded
not back 2. Payment options How would you like to pay? The total amount in your basket incl. delivery charges comes to 200.00 EUR. Here you can choose how you would like to pay.
[DP: insert for splits 28-31]: Please note that whenever you pay with a card, we have to pay a fee to the bank or card company involved. For transactions with debit cards we pay a fee of 1%, for credit cards 2% and for online
payment systems we pay 3%.
1 Credit transfer - no surcharge - 200.00 EUR 2 Debit Card - 1% surcharge - 202.00 EUR 3 Credit Card - 2% surcharge - 204.00 EUR 4 Online payment system - 3% surcharge - 206.00 EUR
ASK ONLY IF Q26 | split=2,3,8,9,14,15,20,21,26,27
T22 | receipt4 | Receipt - online store - high value Text
not back 3. Confirm order Verify and confirm order Item description - unit price - amount - total price 196.00 - 1 - 196.00 Total purchase value incl. VAT (in EUR) 196.00 Delivery charge 4.00 Total purchase value incl. VAT (in EUR) 200.00 Payment charge: [DP: insert chosen method and costs from previous answer, e.g.]: Rebate for debit card 4.00 Final purchase value incl. VAT(in EUR) 196.00 <= [DP: insert from previous answer] [DP: insert for splits 2-3, 14-15, 26-27] Please note that whenever you pay with a card, we have to pay a fee to the bank or card company involved. For transactions with debit cards we pay a fee of 1%, for credit cards 2% and for online payment systems we pay 3%.
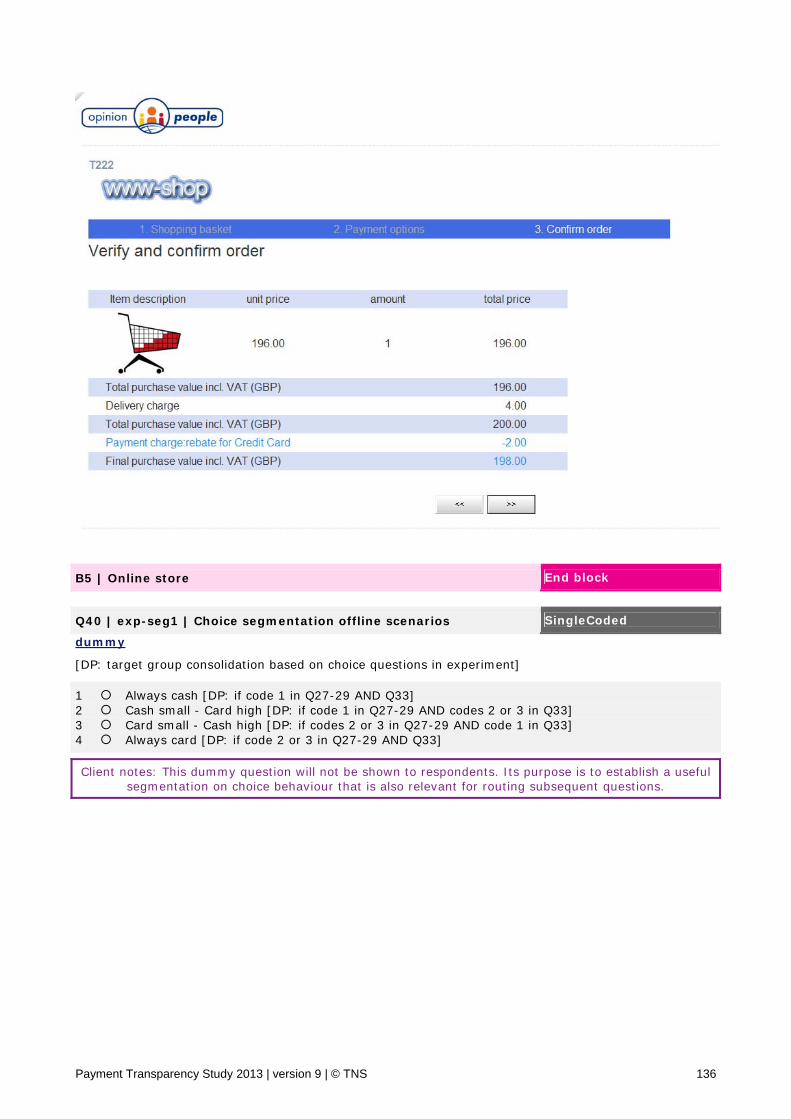
Payment Transparency Study 2013 | version 9 | © TNS 136
B5 | Online store End block
Q40 | exp-seg1 | Choice segmentation offline scenarios SingleCoded
dummy [DP: target group consolidation based on choice questions in experiment]
1 Always cash [DP: if code 1 in Q27-29 AND Q33] 2 Cash small - Card high [DP: if code 1 in Q27-29 AND codes 2 or 3 in Q33] 3 Card small - Cash high [DP: if codes 2 or 3 in Q27-29 AND code 1 in Q33] 4 Always card [DP: if code 2 or 3 in Q27-29 AND Q33]
Client notes: This dummy question will not be shown to respondents. Its purpose is to establish a useful segmentation on choice behaviour that is also relevant for routing subsequent questions.
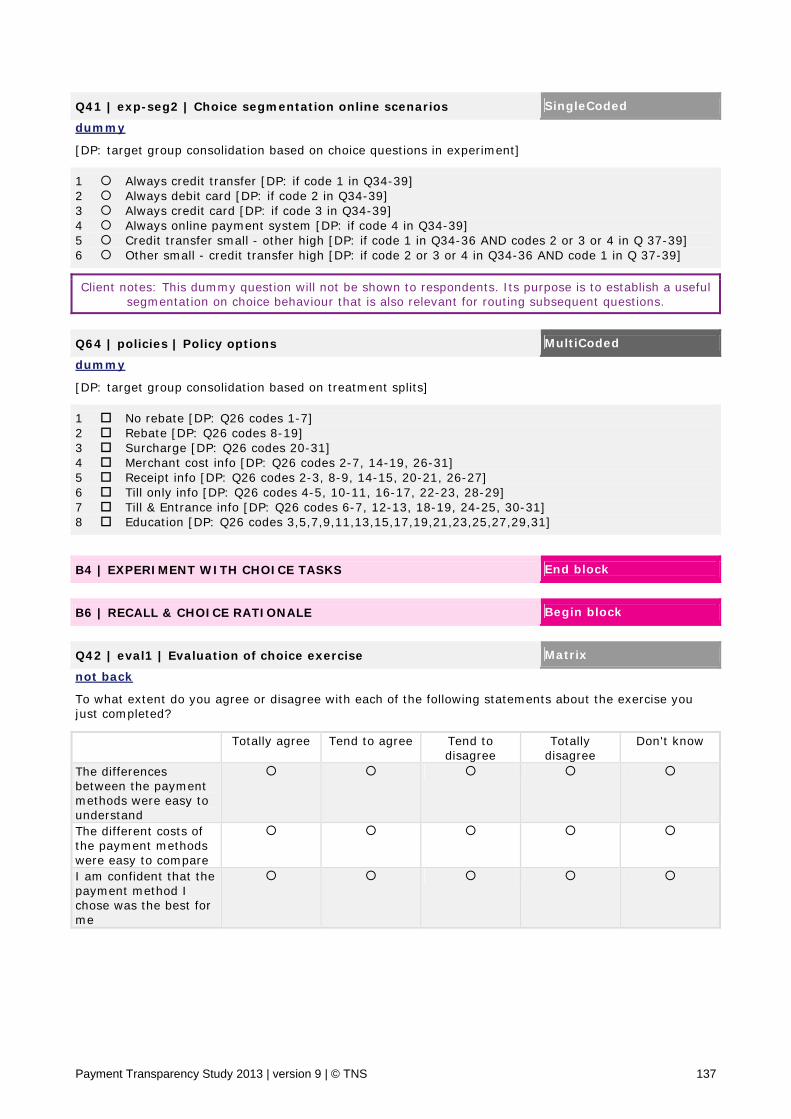
Payment Transparency Study 2013 | version 9 | © TNS 137
Q41 | exp-seg2 | Choice segmentation online scenarios SingleCoded
dummy [DP: target group consolidation based on choice questions in experiment]
1 Always credit transfer [DP: if code 1 in Q34-39] 2 Always debit card [DP: if code 2 in Q34-39] 3 Always credit card [DP: if code 3 in Q34-39] 4 Always online payment system [DP: if code 4 in Q34-39] 5 Credit transfer small - other high [DP: if code 1 in Q34-36 AND codes 2 or 3 or 4 in Q 37-39] 6 Other small - credit transfer high [DP: if code 2 or 3 or 4 in Q34-36 AND code 1 in Q 37-39]
Client notes: This dummy question will not be shown to respondents. Its purpose is to establish a useful segmentation on choice behaviour that is also relevant for routing subsequent questions.
Q64 | policies | Policy options MultiCoded
dummy [DP: target group consolidation based on treatment splits]
1 No rebate [DP: Q26 codes 1-7] 2 Rebate [DP: Q26 codes 8-19] 3 Surcharge [DP: Q26 codes 20-31] 4 Merchant cost info [DP: Q26 codes 2-7, 14-19, 26-31] 5 Receipt info [DP: Q26 codes 2-3, 8-9, 14-15, 20-21, 26-27] 6 Till only info [DP: Q26 codes 4-5, 10-11, 16-17, 22-23, 28-29] 7 Till & Entrance info [DP: Q26 codes 6-7, 12-13, 18-19, 24-25, 30-31] 8 Education [DP: Q26 codes 3,5,7,9,11,13,15,17,19,21,23,25,27,29,31]
B4 | EXPERIMENT WITH CHOICE TASKS End block
B6 | RECALL & CHOICE RATIONALE Begin block
Q42 | eval1 | Evaluation of choice exercise Matrix
not back To what extent do you agree or disagree with each of the following statements about the exercise you just completed? Totally agree Tend to agree Tend to
disagreeTotally
disagree Don't know
The differences between the payment methods were easy to understand
The different costs of the payment methods were easy to compare
I am confident that the payment method I chose was the best for me
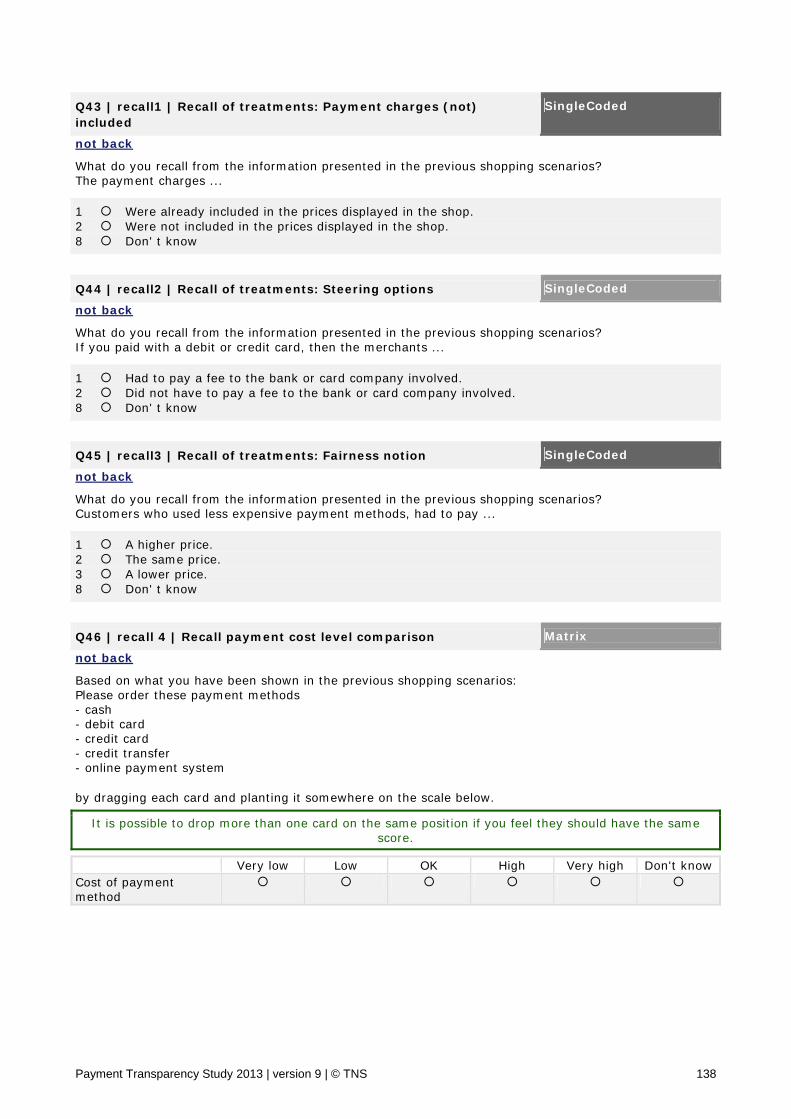
Payment Transparency Study 2013 | version 9 | © TNS 138
Q43 | recall1 | Recall of treatments: Payment charges (not) included
SingleCoded
not back What do you recall from the information presented in the previous shopping scenarios? The payment charges ...
1 Were already included in the prices displayed in the shop. 2 Were not included in the prices displayed in the shop. 8 Don' t know
Q44 | recall2 | Recall of treatments: Steering options SingleCoded
not back What do you recall from the information presented in the previous shopping scenarios? If you paid with a debit or credit card, then the merchants ...
1 Had to pay a fee to the bank or card company involved. 2 Did not have to pay a fee to the bank or card company involved. 8 Don' t know
Q45 | recall3 | Recall of treatments: Fairness notion SingleCoded
not back What do you recall from the information presented in the previous shopping scenarios? Customers who used less expensive payment methods, had to pay ...
1 A higher price. 2 The same price. 3 A lower price. 8 Don' t know
Q46 | recall 4 | Recall payment cost level comparison Matrix
not back Based on what you have been shown in the previous shopping scenarios: Please order these payment methods - cash - debit card - credit card - credit transfer - online payment system by dragging each card and planting it somewhere on the scale below.
It is possible to drop more than one card on the same position if you feel they should have the same score.
Very low Low OK High Very high Don't knowCost of payment method
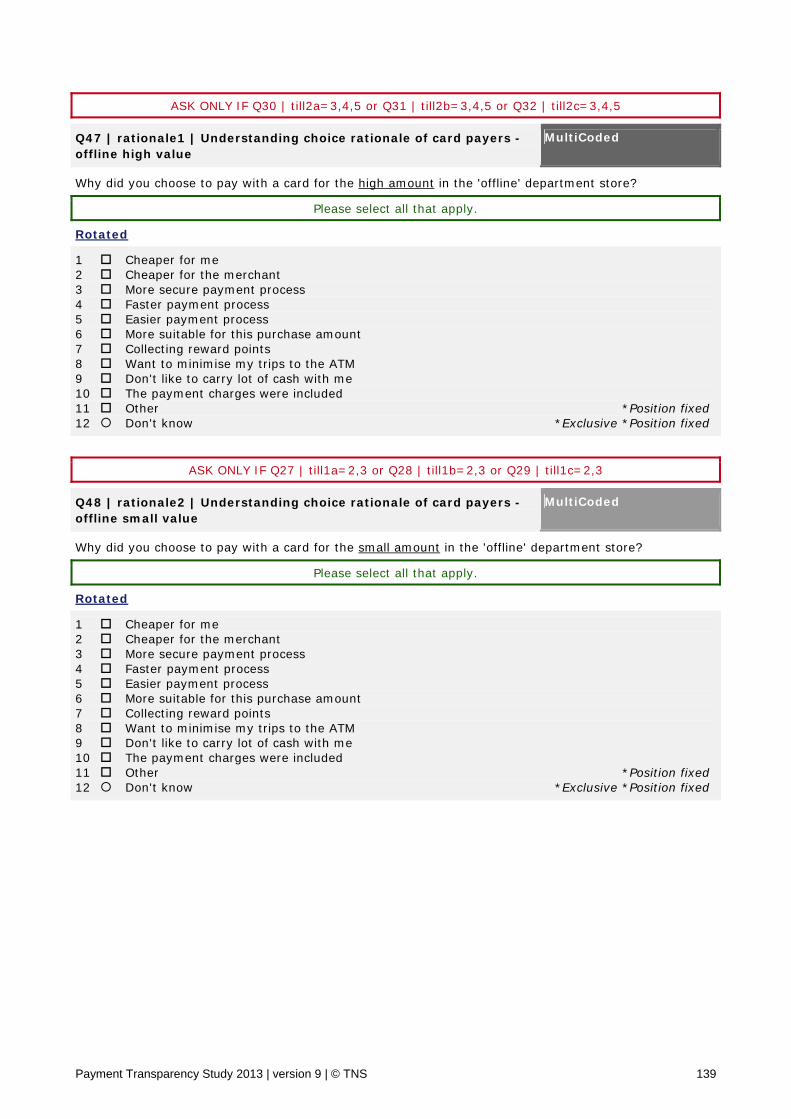
Payment Transparency Study 2013 | version 9 | © TNS 139
ASK ONLY IF Q30 | till2a=3,4,5 or Q31 | till2b=3,4,5 or Q32 | till2c=3,4,5
Q47 | rationale1 | Understanding choice rationale of card payers - offline high value
MultiCoded
Why did you choose to pay with a card for the high amount in the 'offline' department store?
Please select all that apply. Rotated
1 Cheaper for me 2 Cheaper for the merchant 3 More secure payment process 4 Faster payment process 5 Easier payment process 6 More suitable for this purchase amount 7 Collecting reward points 8 Want to minimise my trips to the ATM 9 Don't like to carry lot of cash with me 10 The payment charges were included 11 Other *Position fixed12 Don't know *Exclusive *Position fixed
ASK ONLY IF Q27 | till1a=2,3 or Q28 | till1b=2,3 or Q29 | till1c=2,3
Q48 | rationale2 | Understanding choice rationale of card payers - offline small value
MultiCoded
Why did you choose to pay with a card for the small amount in the 'offline' department store?
Please select all that apply. Rotated
1 Cheaper for me 2 Cheaper for the merchant 3 More secure payment process 4 Faster payment process 5 Easier payment process 6 More suitable for this purchase amount 7 Collecting reward points 8 Want to minimise my trips to the ATM 9 Don't like to carry lot of cash with me 10 The payment charges were included 11 Other *Position fixed12 Don't know *Exclusive *Position fixed
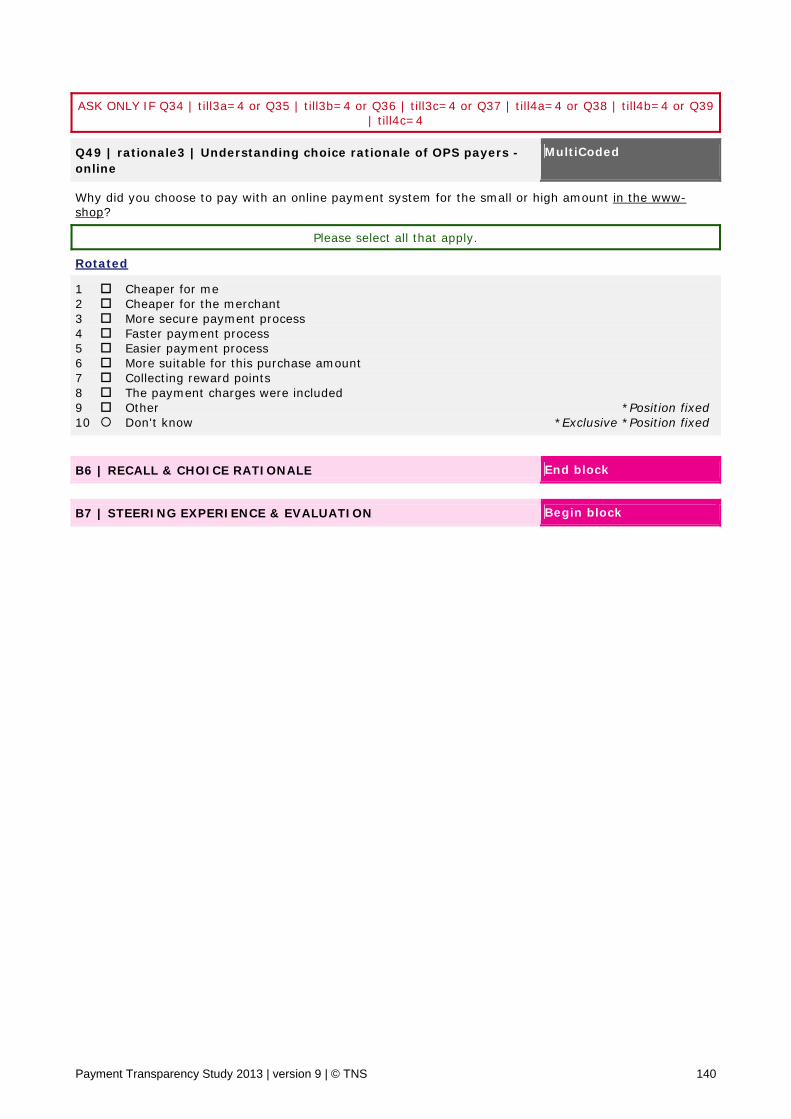
Payment Transparency Study 2013 | version 9 | © TNS 140
ASK ONLY IF Q34 | till3a=4 or Q35 | till3b=4 or Q36 | till3c=4 or Q37 | till4a=4 or Q38 | till4b=4 or Q39 | till4c=4
Q49 | rationale3 | Understanding choice rationale of OPS payers - online
MultiCoded
Why did you choose to pay with an online payment system for the small or high amount in the www-shop?
Please select all that apply. Rotated
1 Cheaper for me 2 Cheaper for the merchant 3 More secure payment process 4 Faster payment process 5 Easier payment process 6 More suitable for this purchase amount 7 Collecting reward points 8 The payment charges were included 9 Other *Position fixed10 Don't know *Exclusive *Position fixed
B6 | RECALL & CHOICE RATIONALE End block
B7 | STEERING EXPERIENCE & EVALUATION Begin block
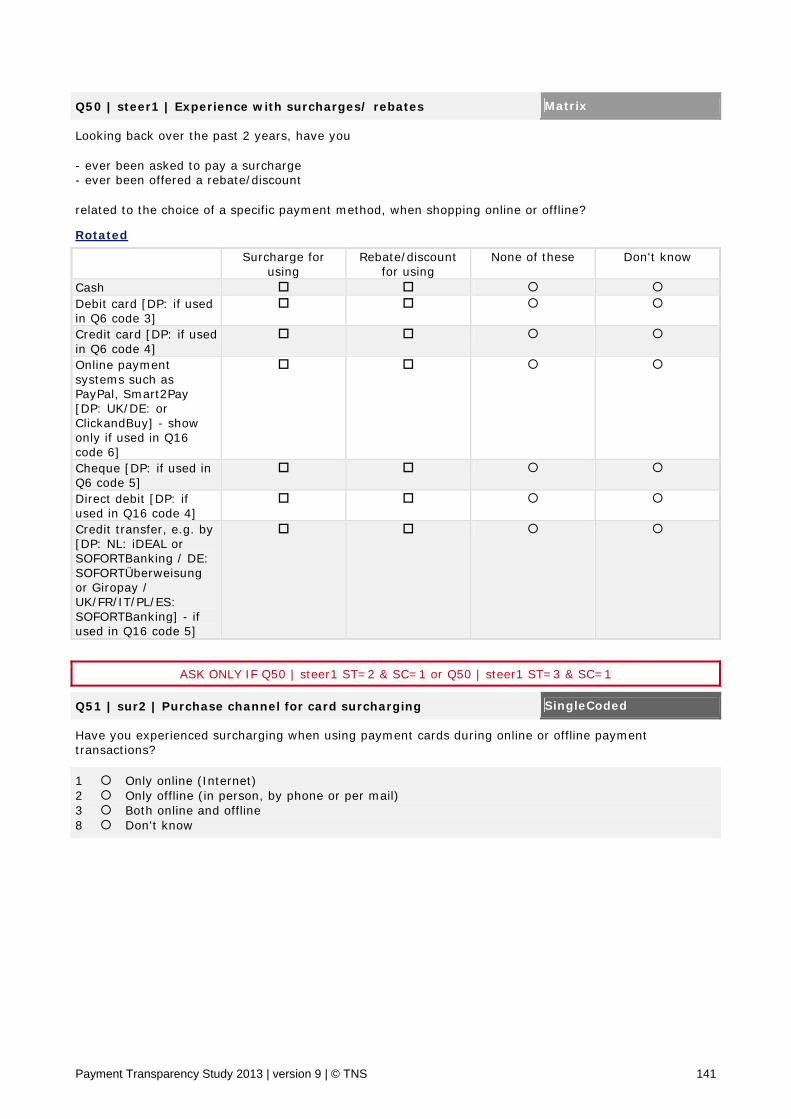
Payment Transparency Study 2013 | version 9 | © TNS 141
Q50 | steer1 | Experience with surcharges/ rebates Matrix Looking back over the past 2 years, have you - ever been asked to pay a surcharge - ever been offered a rebate/discount related to the choice of a specific payment method, when shopping online or offline? Rotated Surcharge for
using Rebate/discount
for usingNone of these Don't know
Cash Debit card [DP: if used in Q6 code 3]
Credit card [DP: if used in Q6 code 4]
Online payment systems such as PayPal, Smart2Pay [DP: UK/DE: or ClickandBuy] - show only if used in Q16 code 6]
Cheque [DP: if used in Q6 code 5]
Direct debit [DP: if used in Q16 code 4]
Credit transfer, e.g. by [DP: NL: iDEAL or SOFORTBanking / DE: SOFORTÜberweisung or Giropay / UK/FR/IT/PL/ES: SOFORTBanking] - if used in Q16 code 5]
ASK ONLY IF Q50 | steer1 ST=2 & SC=1 or Q50 | steer1 ST=3 & SC=1
Q51 | sur2 | Purchase channel for card surcharging SingleCoded Have you experienced surcharging when using payment cards during online or offline payment transactions?
1 Only online (Internet) 2 Only offline (in person, by phone or per mail) 3 Both online and offline 8 Don't know
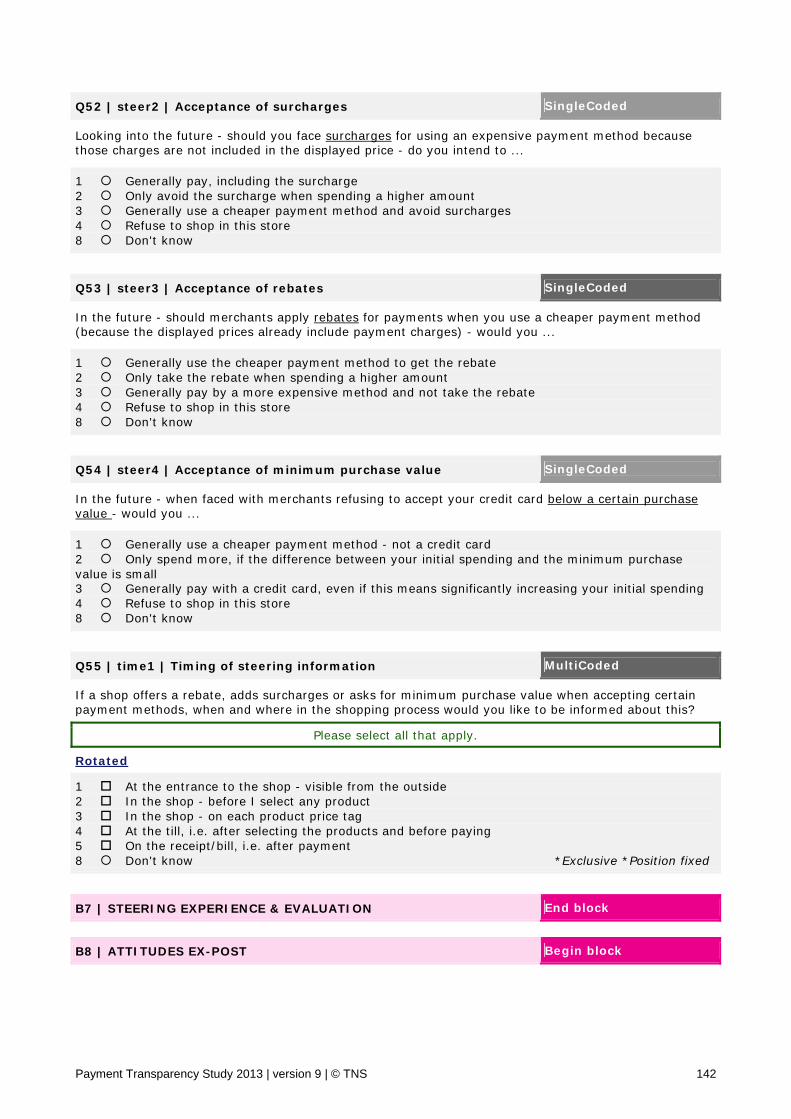
Payment Transparency Study 2013 | version 9 | © TNS 142
Q52 | steer2 | Acceptance of surcharges SingleCoded Looking into the future - should you face surcharges for using an expensive payment method because those charges are not included in the displayed price - do you intend to ...
1 Generally pay, including the surcharge 2 Only avoid the surcharge when spending a higher amount 3 Generally use a cheaper payment method and avoid surcharges 4 Refuse to shop in this store 8 Don't know
Q53 | steer3 | Acceptance of rebates SingleCoded In the future - should merchants apply rebates for payments when you use a cheaper payment method (because the displayed prices already include payment charges) - would you ...
1 Generally use the cheaper payment method to get the rebate 2 Only take the rebate when spending a higher amount 3 Generally pay by a more expensive method and not take the rebate 4 Refuse to shop in this store 8 Don't know
Q54 | steer4 | Acceptance of minimum purchase value SingleCoded In the future - when faced with merchants refusing to accept your credit card below a certain purchase value - would you ...
1 Generally use a cheaper payment method - not a credit card 2 Only spend more, if the difference between your initial spending and the minimum purchase value is small 3 Generally pay with a credit card, even if this means significantly increasing your initial spending 4 Refuse to shop in this store 8 Don't know
Q55 | time1 | Timing of steering information MultiCoded If a shop offers a rebate, adds surcharges or asks for minimum purchase value when accepting certain payment methods, when and where in the shopping process would you like to be informed about this?
Please select all that apply. Rotated
1 At the entrance to the shop - visible from the outside 2 In the shop - before I select any product 3 In the shop - on each product price tag 4 At the till, i.e. after selecting the products and before paying 5 On the receipt/bill, i.e. after payment 8 Don't know *Exclusive *Position fixed
B7 | STEERING EXPERIENCE & EVALUATION End block
B8 | ATTITUDES EX-POST Begin block
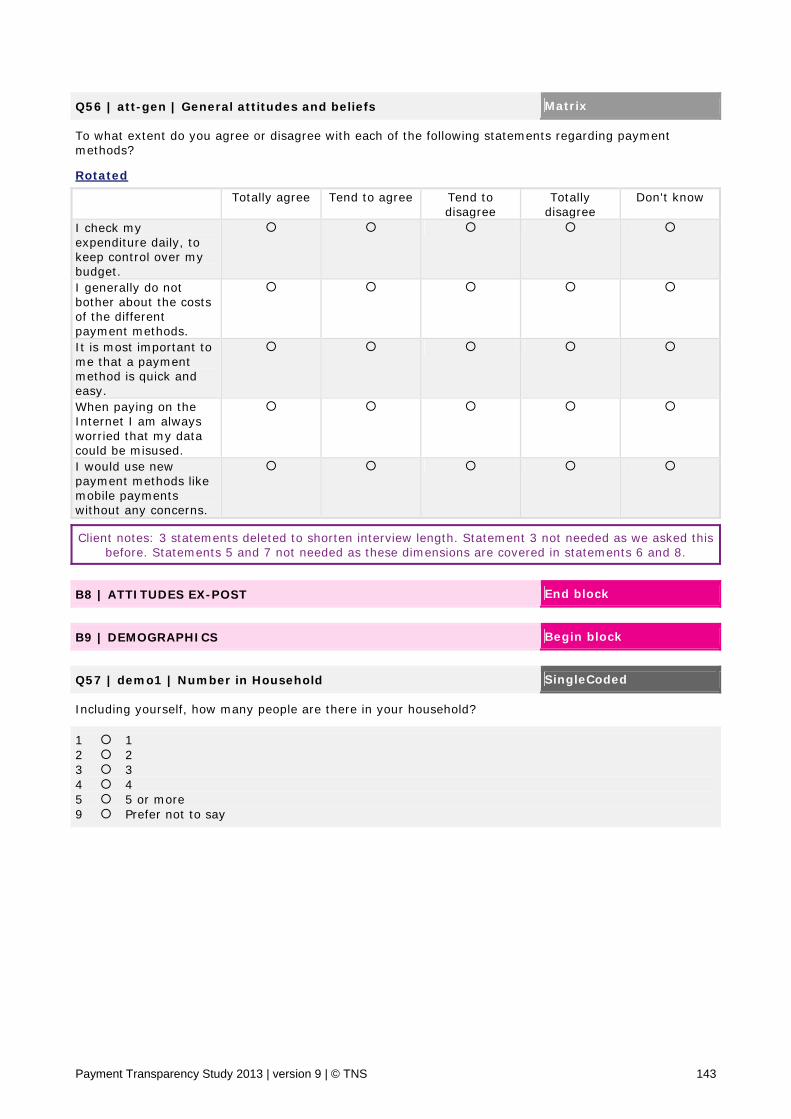
Payment Transparency Study 2013 | version 9 | © TNS 143
Q56 | att-gen | General attitudes and beliefs Matrix To what extent do you agree or disagree with each of the following statements regarding payment methods? Rotated Totally agree Tend to agree Tend to
disagreeTotally
disagree Don't know
I check my expenditure daily, to keep control over my budget.
I generally do not bother about the costs of the different payment methods.
It is most important to me that a payment method is quick and easy.
When paying on the Internet I am always worried that my data could be misused.
I would use new payment methods like mobile payments without any concerns.
Client notes: 3 statements deleted to shorten interview length. Statement 3 not needed as we asked this before. Statements 5 and 7 not needed as these dimensions are covered in statements 6 and 8.
B8 | ATTITUDES EX-POST End block
B9 | DEMOGRAPHICS Begin block
Q57 | demo1 | Number in Household SingleCoded Including yourself, how many people are there in your household?
1 1 2 2 3 3 4 4 5 5 or more 9 Prefer not to say
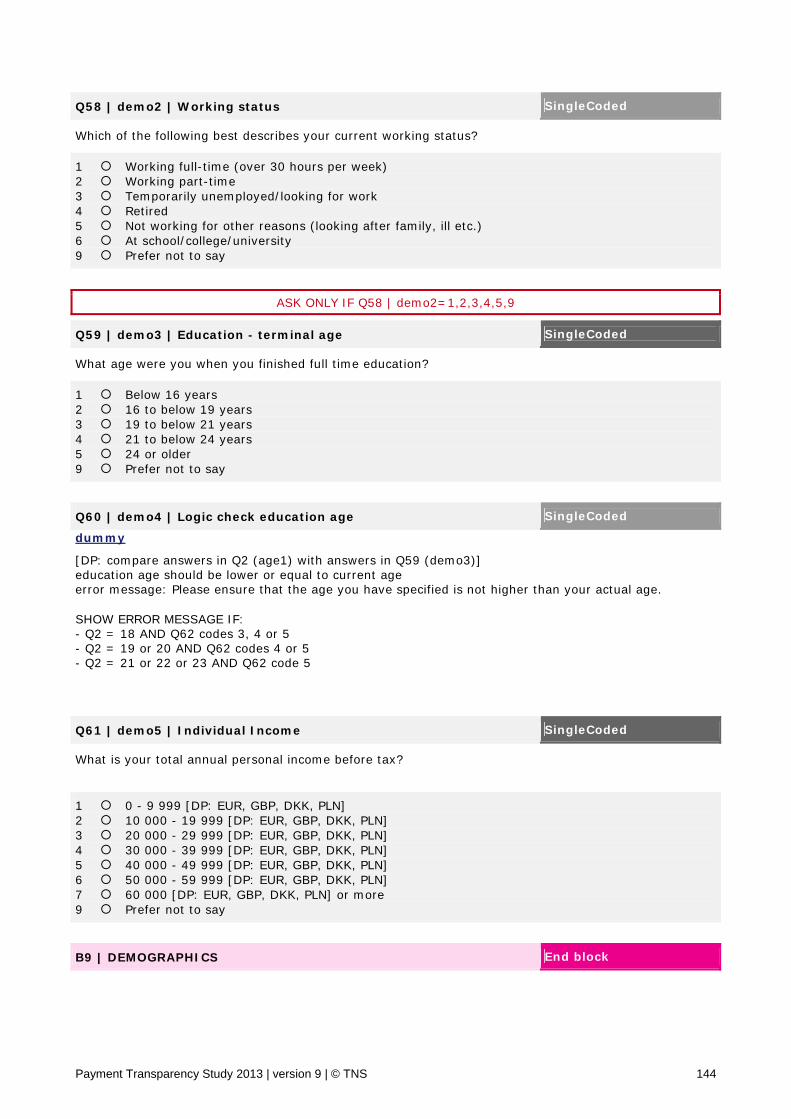
Payment Transparency Study 2013 | version 9 | © TNS 144
Q58 | demo2 | Working status SingleCoded Which of the following best describes your current working status?
1 Working full-time (over 30 hours per week) 2 Working part-time 3 Temporarily unemployed/looking for work 4 Retired 5 Not working for other reasons (looking after family, ill etc.) 6 At school/college/university 9 Prefer not to say
ASK ONLY IF Q58 | demo2=1,2,3,4,5,9
Q59 | demo3 | Education - terminal age SingleCoded What age were you when you finished full time education?
1 Below 16 years 2 16 to below 19 years 3 19 to below 21 years 4 21 to below 24 years 5 24 or older 9 Prefer not to say
Q60 | demo4 | Logic check education age SingleCoded
dummy [DP: compare answers in Q2 (age1) with answers in Q59 (demo3)] education age should be lower or equal to current age error message: Please ensure that the age you have specified is not higher than your actual age. SHOW ERROR MESSAGE IF: - Q2 = 18 AND Q62 codes 3, 4 or 5 - Q2 = 19 or 20 AND Q62 codes 4 or 5 - Q2 = 21 or 22 or 23 AND Q62 code 5
Q61 | demo5 | Individual Income SingleCoded What is your total annual personal income before tax?
1 0 - 9 999 [DP: EUR, GBP, DKK, PLN] 2 10 000 - 19 999 [DP: EUR, GBP, DKK, PLN] 3 20 000 - 29 999 [DP: EUR, GBP, DKK, PLN] 4 30 000 - 39 999 [DP: EUR, GBP, DKK, PLN] 5 40 000 - 49 999 [DP: EUR, GBP, DKK, PLN] 6 50 000 - 59 999 [DP: EUR, GBP, DKK, PLN] 7 60 000 [DP: EUR, GBP, DKK, PLN] or more 9 Prefer not to say
B9 | DEMOGRAPHICS End block
Payment Transparency Study 2013 | version 9 | © TNS 145
T23 | outro2 | Thank you Text Thank you so much for participating in our survey. The questionnaire is now complete.
T24 | bonus | Bonus Information Text As mentioned earlier, you have a chance to win an extra bonus. With only a little be of luck you will be among the winners who will soon receive a note with the exact amount.

146
11 Annex 3 – Data tables
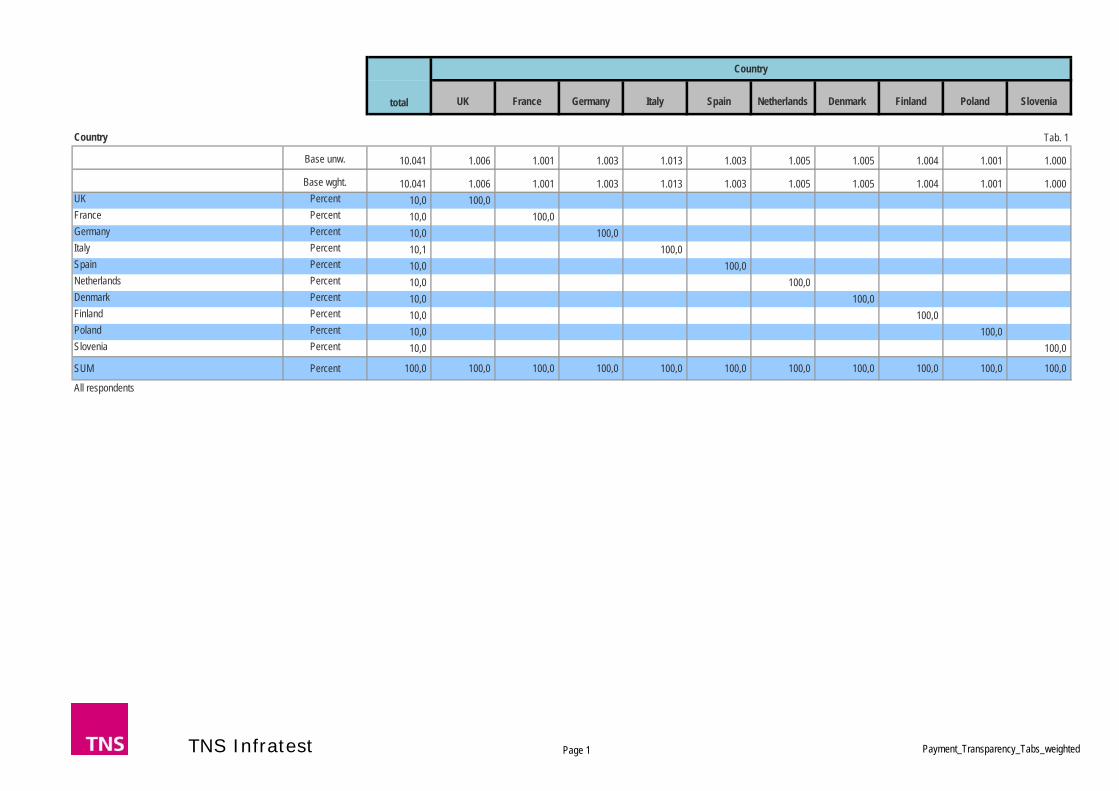
UK France Germany Italy Spain Netherlands Denmark Finland Poland Slovenia
Tab. 1
Base unw. 10.041 1.006 1.001 1.003 1.013 1.003 1.005 1.005 1.004 1.001 1.000
Base wght. 10.041 1.006 1.001 1.003 1.013 1.003 1.005 1.005 1.004 1.001 1.000 UK Percent 10,0 100,0 France Percent 10,0 100,0 Germany Percent 10,0 100,0 Italy Percent 10,1 100,0 Spain Percent 10,0 100,0 Netherlands Percent 10,0 100,0 Denmark Percent 10,0 100,0 Finland Percent 10,0 100,0 Poland Percent 10,0 100,0 Slovenia Percent 10,0 100,0
SUM Percent 100,0 100,0 100,0 100,0 100,0 100,0 100,0 100,0 100,0 100,0 100,0
All respondents
Country
Country
total
TNS Infratest Page 1 Payment_Transparency_Tabs_weighted

UK France Germany Italy Spain Netherlands Denmark Finland Poland Slovenia
Country
total
Tab. 2
Base unw. 10.041 1.006 1.001 1.003 1.013 1.003 1.005 1.005 1.004 1.001 1.000
Base wght. 10.041 1.006 1.001 1.003 1.013 1.003 1.005 1.005 1.004 1.001 1.000 18 - 24 Percent 11,8 13,3 12,6 10,5 9,8 11,0 10,3 11,7 11,5 15,9 11,8 25 - 34 Percent 17,0 17,1 15,7 13,9 16,8 21,2 14,5 16,0 15,9 19,3 19,3 35 - 44 Percent 18,1 18,9 17,0 17,7 20,9 17,9 22,5 17,9 16,0 15,7 16,4 45 - 54 Percent 17,3 15,1 17,3 19,3 14,1 17,7 18,7 17,2 18,3 17,7 17,5 55 and more Percent 35,8 35,6 37,4 38,6 38,4 32,2 34,0 37,1 38,3 31,4 35,0
SUM Percent 100,0 100,0 100,0 100,0 100,0 100,0 100,0 100,0 100,0 100,0 100,0 Mean 46,0 46,1 46,8 47,5 46,2 44,0 46,9 47,3 46,7 43,2 44,8 All respondents
AgeWhich of the following age groups do you fall into?
TNS Infratest Page 2 Payment_Transparency_Tabs_weighted
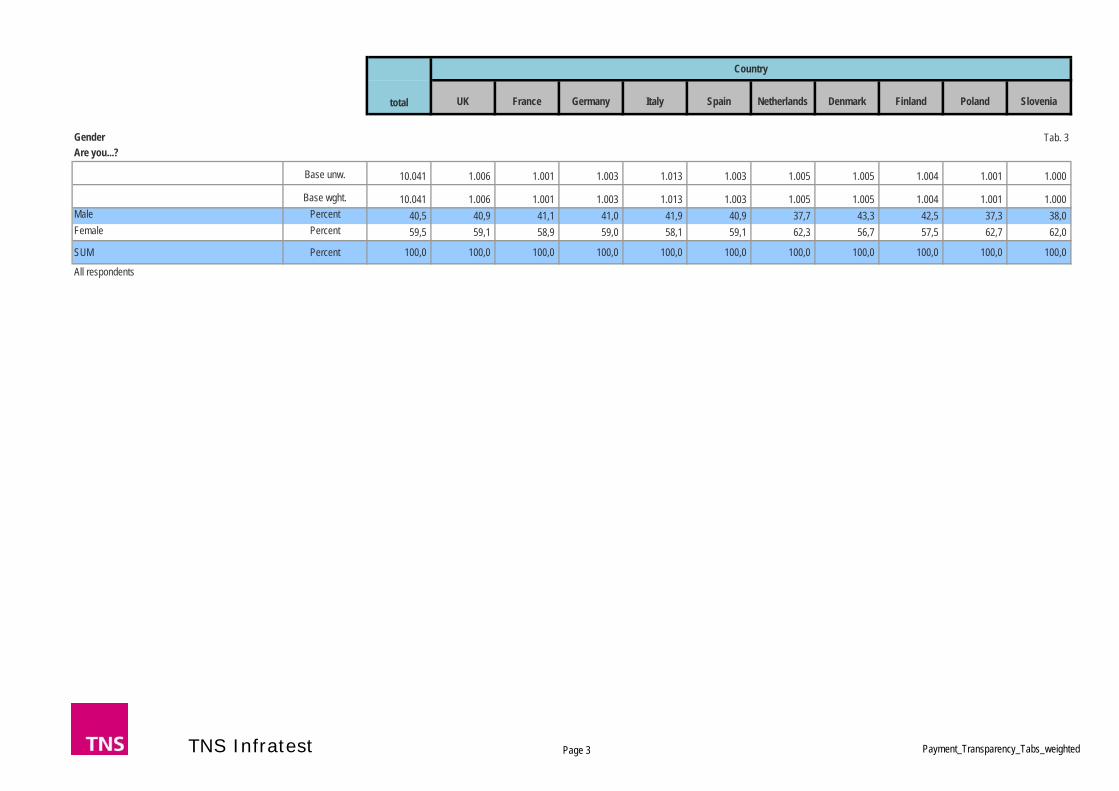
UK France Germany Italy Spain Netherlands Denmark Finland Poland Slovenia
Country
total
Tab. 3
Base unw. 10.041 1.006 1.001 1.003 1.013 1.003 1.005 1.005 1.004 1.001 1.000
Base wght. 10.041 1.006 1.001 1.003 1.013 1.003 1.005 1.005 1.004 1.001 1.000 Male Percent 40,5 40,9 41,1 41,0 41,9 40,9 37,7 43,3 42,5 37,3 38,0 Female Percent 59,5 59,1 58,9 59,0 58,1 59,1 62,3 56,7 57,5 62,7 62,0
SUM Percent 100,0 100,0 100,0 100,0 100,0 100,0 100,0 100,0 100,0 100,0 100,0
All respondents
GenderAre you...?
TNS Infratest Page 3 Payment_Transparency_Tabs_weighted
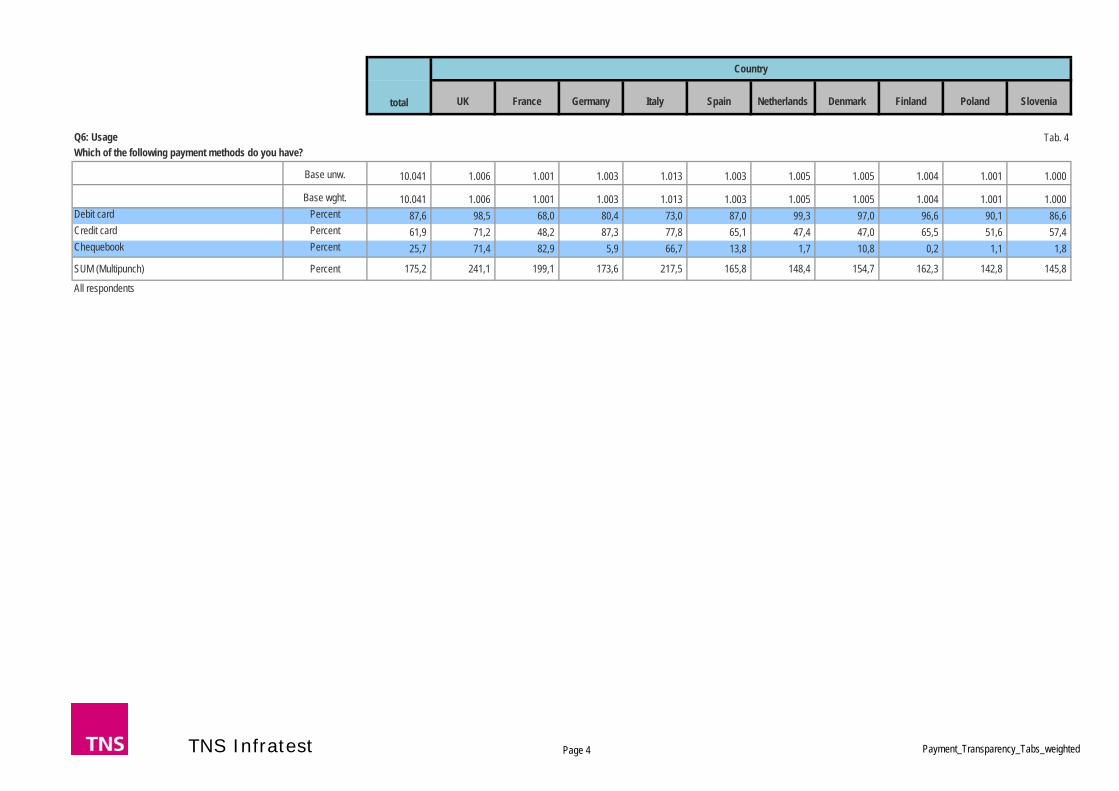
UK France Germany Italy Spain Netherlands Denmark Finland Poland Slovenia
Country
total
Tab. 4
Base unw. 10.041 1.006 1.001 1.003 1.013 1.003 1.005 1.005 1.004 1.001 1.000
Base wght. 10.041 1.006 1.001 1.003 1.013 1.003 1.005 1.005 1.004 1.001 1.000 Debit card Percent 87,6 98,5 68,0 80,4 73,0 87,0 99,3 97,0 96,6 90,1 86,6 Credit card Percent 61,9 71,2 48,2 87,3 77,8 65,1 47,4 47,0 65,5 51,6 57,4 Chequebook Percent 25,7 71,4 82,9 5,9 66,7 13,8 1,7 10,8 0,2 1,1 1,8
SUM (Multipunch) Percent 175,2 241,1 199,1 173,6 217,5 165,8 148,4 154,7 162,3 142,8 145,8
All respondents
Q6: UsageWhich of the following payment methods do you have?
TNS Infratest Page 4 Payment_Transparency_Tabs_weighted
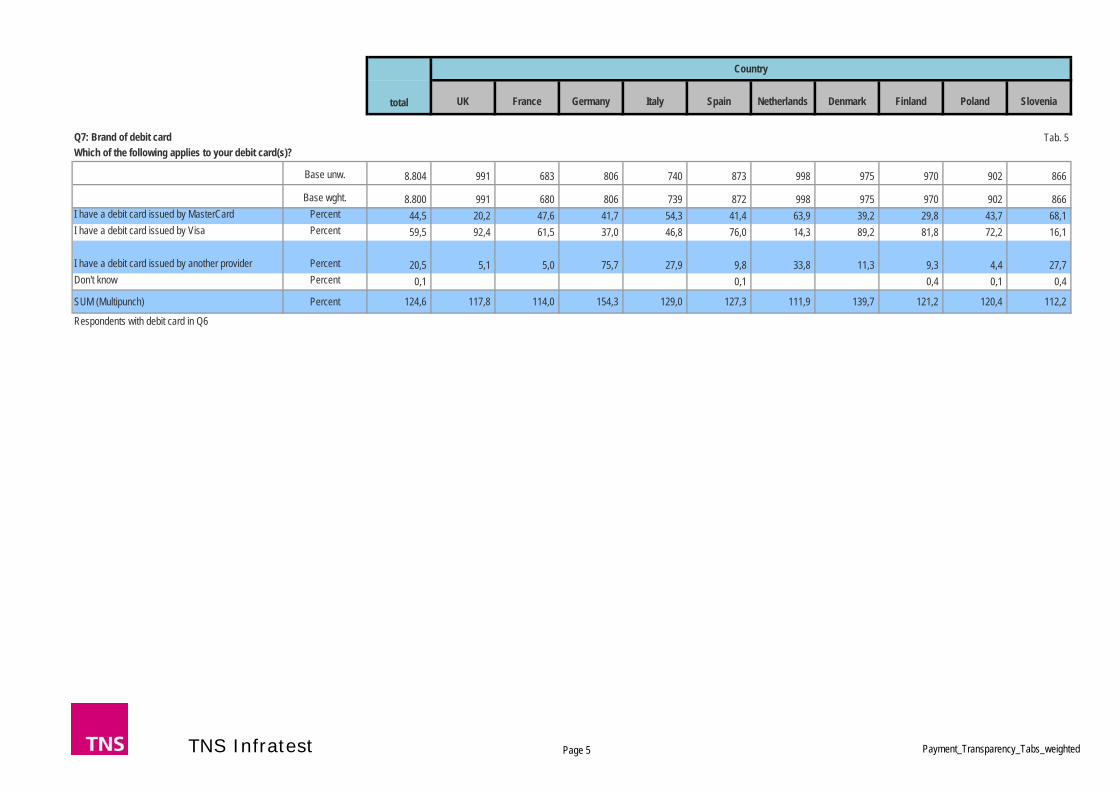
UK France Germany Italy Spain Netherlands Denmark Finland Poland Slovenia
Country
total
Tab. 5
Base unw. 8.804 991 683 806 740 873 998 975 970 902 866
Base wght. 8.800 991 680 806 739 872 998 975 970 902 866 I have a debit card issued by MasterCard Percent 44,5 20,2 47,6 41,7 54,3 41,4 63,9 39,2 29,8 43,7 68,1 I have a debit card issued by Visa Percent 59,5 92,4 61,5 37,0 46,8 76,0 14,3 89,2 81,8 72,2 16,1
I have a debit card issued by another provider Percent 20,5 5,1 5,0 75,7 27,9 9,8 33,8 11,3 9,3 4,4 27,7 Don't know Percent 0,1 0,1 0,4 0,1 0,4
SUM (Multipunch) Percent 124,6 117,8 114,0 154,3 129,0 127,3 111,9 139,7 121,2 120,4 112,2
Respondents with debit card in Q6
Q7: Brand of debit cardWhich of the following applies to your debit card(s)?
TNS Infratest Page 5 Payment_Transparency_Tabs_weighted
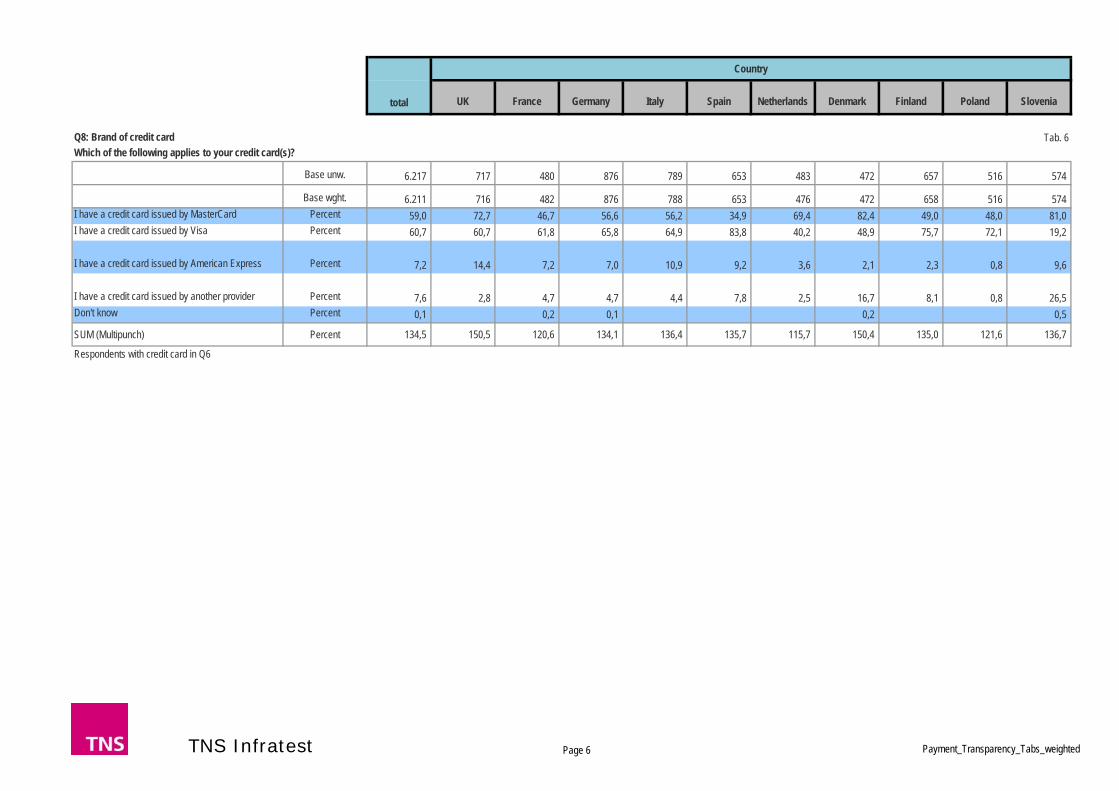
UK France Germany Italy Spain Netherlands Denmark Finland Poland Slovenia
Country
total
Tab. 6
Base unw. 6.217 717 480 876 789 653 483 472 657 516 574
Base wght. 6.211 716 482 876 788 653 476 472 658 516 574 I have a credit card issued by MasterCard Percent 59,0 72,7 46,7 56,6 56,2 34,9 69,4 82,4 49,0 48,0 81,0 I have a credit card issued by Visa Percent 60,7 60,7 61,8 65,8 64,9 83,8 40,2 48,9 75,7 72,1 19,2
I have a credit card issued by American Express Percent 7,2 14,4 7,2 7,0 10,9 9,2 3,6 2,1 2,3 0,8 9,6
I have a credit card issued by another provider Percent 7,6 2,8 4,7 4,7 4,4 7,8 2,5 16,7 8,1 0,8 26,5 Don't know Percent 0,1 0,2 0,1 0,2 0,5
SUM (Multipunch) Percent 134,5 150,5 120,6 134,1 136,4 135,7 115,7 150,4 135,0 121,6 136,7
Respondents with credit card in Q6
Q8: Brand of credit cardWhich of the following applies to your credit card(s)?
TNS Infratest Page 6 Payment_Transparency_Tabs_weighted
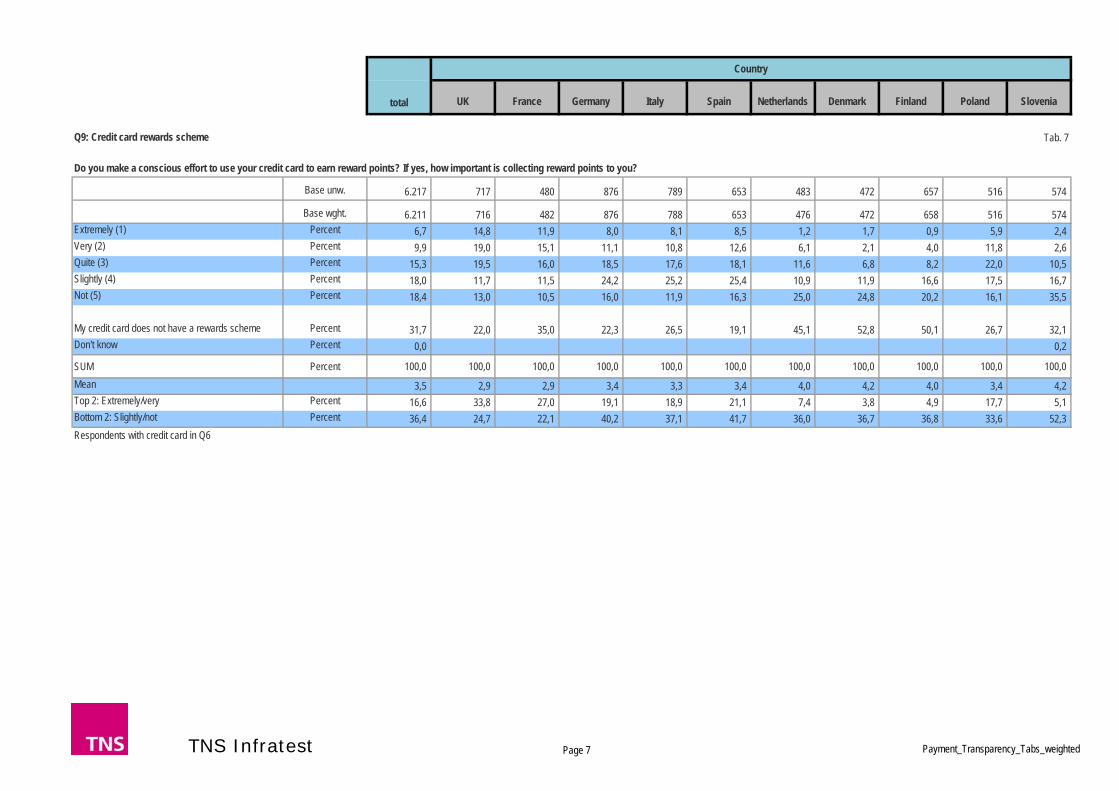
UK France Germany Italy Spain Netherlands Denmark Finland Poland Slovenia
Country
total
Tab. 7
Base unw. 6.217 717 480 876 789 653 483 472 657 516 574
Base wght. 6.211 716 482 876 788 653 476 472 658 516 574 Extremely (1) Percent 6,7 14,8 11,9 8,0 8,1 8,5 1,2 1,7 0,9 5,9 2,4 Very (2) Percent 9,9 19,0 15,1 11,1 10,8 12,6 6,1 2,1 4,0 11,8 2,6 Quite (3) Percent 15,3 19,5 16,0 18,5 17,6 18,1 11,6 6,8 8,2 22,0 10,5 Slightly (4) Percent 18,0 11,7 11,5 24,2 25,2 25,4 10,9 11,9 16,6 17,5 16,7 Not (5) Percent 18,4 13,0 10,5 16,0 11,9 16,3 25,0 24,8 20,2 16,1 35,5
My credit card does not have a rewards scheme Percent 31,7 22,0 35,0 22,3 26,5 19,1 45,1 52,8 50,1 26,7 32,1 Don't know Percent 0,0 0,2
SUM Percent 100,0 100,0 100,0 100,0 100,0 100,0 100,0 100,0 100,0 100,0 100,0 Mean 3,5 2,9 2,9 3,4 3,3 3,4 4,0 4,2 4,0 3,4 4,2 Top 2: Extremely/very Percent 16,6 33,8 27,0 19,1 18,9 21,1 7,4 3,8 4,9 17,7 5,1 Bottom 2: Slightly/not Percent 36,4 24,7 22,1 40,2 37,1 41,7 36,0 36,7 36,8 33,6 52,3 Respondents with credit card in Q6
Q9: Credit card rewards scheme
Do you make a conscious effort to use your credit card to earn reward points? If yes, how important is collecting reward points to you?
TNS Infratest Page 7 Payment_Transparency_Tabs_weighted
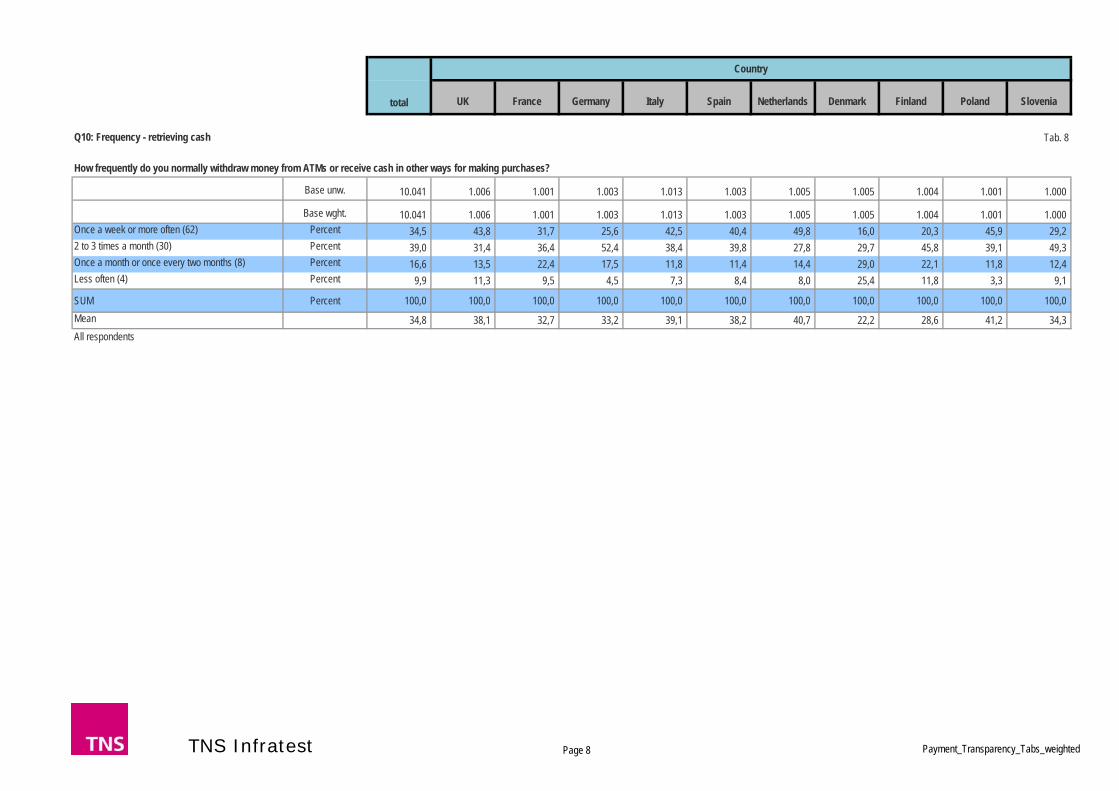
UK France Germany Italy Spain Netherlands Denmark Finland Poland Slovenia
Country
total
Tab. 8
Base unw. 10.041 1.006 1.001 1.003 1.013 1.003 1.005 1.005 1.004 1.001 1.000
Base wght. 10.041 1.006 1.001 1.003 1.013 1.003 1.005 1.005 1.004 1.001 1.000 Once a week or more often (62) Percent 34,5 43,8 31,7 25,6 42,5 40,4 49,8 16,0 20,3 45,9 29,2 2 to 3 times a month (30) Percent 39,0 31,4 36,4 52,4 38,4 39,8 27,8 29,7 45,8 39,1 49,3 Once a month or once every two months (8) Percent 16,6 13,5 22,4 17,5 11,8 11,4 14,4 29,0 22,1 11,8 12,4 Less often (4) Percent 9,9 11,3 9,5 4,5 7,3 8,4 8,0 25,4 11,8 3,3 9,1
SUM Percent 100,0 100,0 100,0 100,0 100,0 100,0 100,0 100,0 100,0 100,0 100,0 Mean 34,8 38,1 32,7 33,2 39,1 38,2 40,7 22,2 28,6 41,2 34,3 All respondents
Q10: Frequency - retrieving cash
How frequently do you normally withdraw money from ATMs or receive cash in other ways for making purchases?
TNS Infratest Page 8 Payment_Transparency_Tabs_weighted
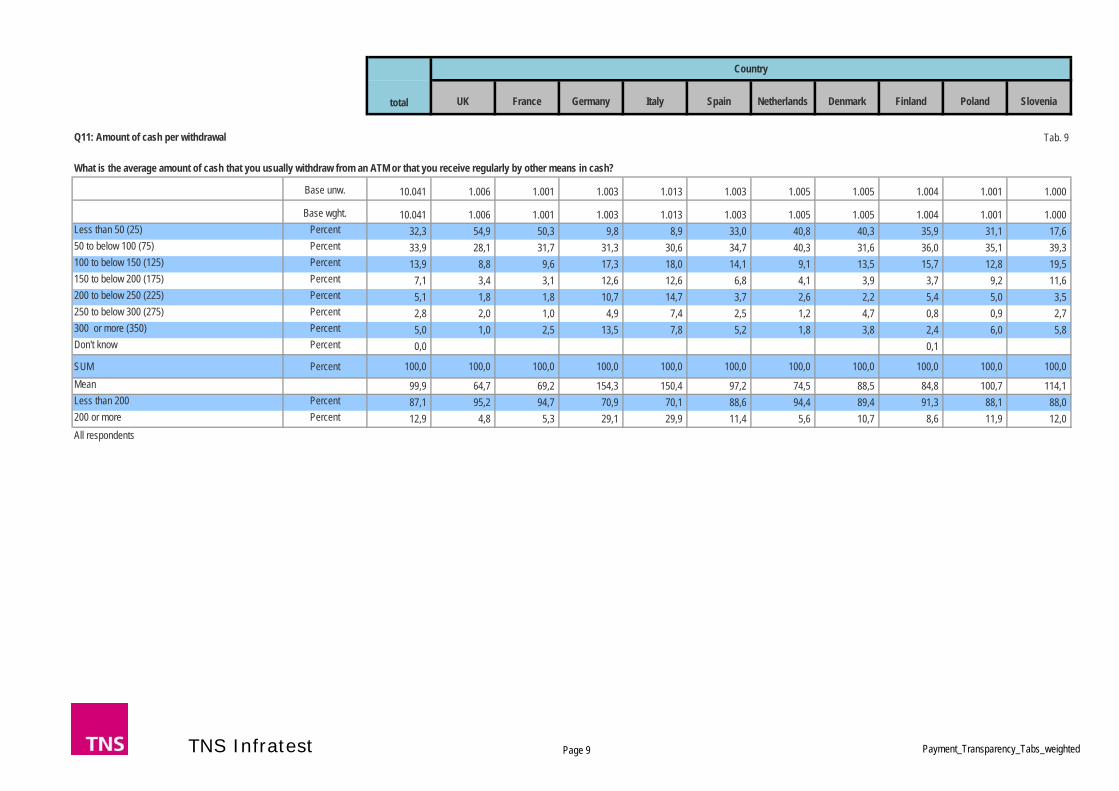
UK France Germany Italy Spain Netherlands Denmark Finland Poland Slovenia
Country
total
Tab. 9
Base unw. 10.041 1.006 1.001 1.003 1.013 1.003 1.005 1.005 1.004 1.001 1.000
Base wght. 10.041 1.006 1.001 1.003 1.013 1.003 1.005 1.005 1.004 1.001 1.000 Less than 50 (25) Percent 32,3 54,9 50,3 9,8 8,9 33,0 40,8 40,3 35,9 31,1 17,6 50 to below 100 (75) Percent 33,9 28,1 31,7 31,3 30,6 34,7 40,3 31,6 36,0 35,1 39,3 100 to below 150 (125) Percent 13,9 8,8 9,6 17,3 18,0 14,1 9,1 13,5 15,7 12,8 19,5 150 to below 200 (175) Percent 7,1 3,4 3,1 12,6 12,6 6,8 4,1 3,9 3,7 9,2 11,6 200 to below 250 (225) Percent 5,1 1,8 1,8 10,7 14,7 3,7 2,6 2,2 5,4 5,0 3,5 250 to below 300 (275) Percent 2,8 2,0 1,0 4,9 7,4 2,5 1,2 4,7 0,8 0,9 2,7 300 or more (350) Percent 5,0 1,0 2,5 13,5 7,8 5,2 1,8 3,8 2,4 6,0 5,8 Don't know Percent 0,0 0,1
SUM Percent 100,0 100,0 100,0 100,0 100,0 100,0 100,0 100,0 100,0 100,0 100,0 Mean 99,9 64,7 69,2 154,3 150,4 97,2 74,5 88,5 84,8 100,7 114,1 Less than 200 Percent 87,1 95,2 94,7 70,9 70,1 88,6 94,4 89,4 91,3 88,1 88,0 200 or more Percent 12,9 4,8 5,3 29,1 29,9 11,4 5,6 10,7 8,6 11,9 12,0 All respondents
Q11: Amount of cash per withdrawal
What is the average amount of cash that you usually withdraw from an ATM or that you receive regularly by other means in cash?
TNS Infratest Page 9 Payment_Transparency_Tabs_weighted

UK France Germany Italy Spain Netherlands Denmark Finland Poland Slovenia
Country
total
Tab. 10
Base unw. 10.041 1.006 1.001 1.003 1.013 1.003 1.005 1.005 1.004 1.001 1.000
Base wght. 10.041 1.006 1.001 1.003 1.013 1.003 1.005 1.005 1.004 1.001 1.000 Once a week or more often (62) Percent 62,4 68,4 60,3 74,5 74,3 72,2 63,9 48,2 47,3 69,7 45,1 2 to 3 times a month (30) Percent 21,5 20,3 21,0 17,7 16,9 18,0 19,4 25,7 30,4 20,8 24,6 Once a month or once every two months (8) Percent 7,3 4,6 8,3 5,0 3,7 4,1 4,8 12,5 12,0 4,3 14,3 Less often (4) Percent 7,6 5,6 8,9 2,3 5,0 4,9 10,0 11,6 9,6 4,0 13,8 Never (0) Percent 1,2 1,2 1,6 0,6 0,1 0,8 1,9 2,0 0,8 1,1 1,9 Don't know Percent 0,1 0,1 0,1 0,3
SUM Percent 100,0 100,0 100,0 100,0 100,0 100,0 100,0 100,0 100,0 100,0 100,0 Mean 46,0 49,1 44,7 52,0 51,6 50,7 46,2 39,0 39,8 50,0 37,2 Top 2: Often/fortnightly Percent 83,9 88,7 81,3 92,1 91,2 90,2 83,3 73,8 77,7 90,5 69,7 Bottom 2: Less often/never Percent 8,8 6,8 10,5 2,9 5,1 5,7 11,9 13,6 10,4 5,1 15,7 All respondents
Q12_1: Frequency offline payment methods - cash
How often have you used the following payment methods when paying personally for goods or services?
TNS Infratest Page 10 Payment_Transparency_Tabs_weighted

UK France Germany Italy Spain Netherlands Denmark Finland Poland Slovenia
Country
total
Tab. 11
Base unw. 8.804 991 683 806 740 873 998 975 970 902 866
Base wght. 8.800 991 680 806 739 872 998 975 970 902 866 Once a week or more often (62) Percent 58,7 52,8 69,3 43,8 42,2 39,3 79,9 85,3 79,8 55,7 29,2 2 to 3 times a month (30) Percent 22,1 23,6 22,3 31,4 31,9 32,4 13,2 6,9 12,0 26,5 27,3 Once a month or once every two months (8) Percent 8,5 10,8 3,2 9,3 11,2 11,4 4,0 2,5 4,1 8,3 21,5 Less often (4) Percent 7,3 10,2 3,1 10,2 10,4 12,6 2,2 3,2 3,3 5,5 14,0 Never (0) Percent 3,3 2,6 2,0 5,3 4,2 4,2 0,8 2,1 0,8 4,1 7,5 Don't know Percent 0,1 0,1 0,2 0,1 0,6
SUM Percent 100,0 100,0 100,0 100,0 100,0 100,0 100,0 100,0 100,0 100,0 100,0 Mean 44,0 41,1 50,1 37,7 37,1 35,6 53,9 55,3 53,5 43,4 28,7 Top 2: Often/fortnightly Percent 80,8 76,4 91,6 75,2 74,1 71,7 93,1 92,2 91,8 82,2 56,5 Bottom 2: Less often/never Percent 10,6 12,8 5,1 15,5 14,6 16,8 3,0 5,2 4,1 9,5 21,5 Respondents with debit card in Q6
Q12_2: Frequency offline payment methods - debit card
How often have you used the following payment methods when paying personally for goods or services?
TNS Infratest Page 11 Payment_Transparency_Tabs_weighted

UK France Germany Italy Spain Netherlands Denmark Finland Poland Slovenia
Country
total
Tab. 12
Base unw. 6.217 717 480 876 789 653 483 472 657 516 574
Base wght. 6.211 716 482 876 788 653 476 472 658 516 574 Once a week or more often (62) Percent 30,3 38,2 62,7 20,7 34,3 30,9 8,6 27,1 17,5 36,3 31,4 2 to 3 times a month (30) Percent 26,9 23,4 21,2 35,5 31,7 29,5 17,6 20,6 22,8 31,9 26,3 Once a month or once every two months (8) Percent 18,4 17,3 5,1 21,9 19,5 17,4 24,8 14,2 21,0 18,1 20,1 Less often (4) Percent 19,8 17,0 6,3 17,5 12,3 18,6 41,5 29,5 33,5 11,4 16,0 Never (0) Percent 4,6 4,0 4,6 4,5 2,2 3,5 7,5 8,5 5,2 2,4 5,9 Don't know Percent 0,1 0,2 0,2 0,2 0,4
SUM Percent 100,0 100,0 100,0 100,0 100,0 100,0 100,0 100,0 100,0 100,0 100,0 Mean 29,1 32,8 45,9 25,9 32,8 30,2 14,3 25,3 20,7 34,0 29,7 Top 2: Often/fortnightly Percent 57,2 61,7 83,8 56,2 66,0 60,3 26,2 47,7 40,3 68,2 57,7 Bottom 2: Less often/never Percent 24,4 21,0 10,9 21,9 14,5 22,1 49,0 37,9 38,7 13,7 22,0 Respondents with credit card in Q6
Q12_3: Frequency offline payment methods - credit card
How often have you used the following payment methods when paying personally for goods or services?
TNS Infratest Page 12 Payment_Transparency_Tabs_weighted
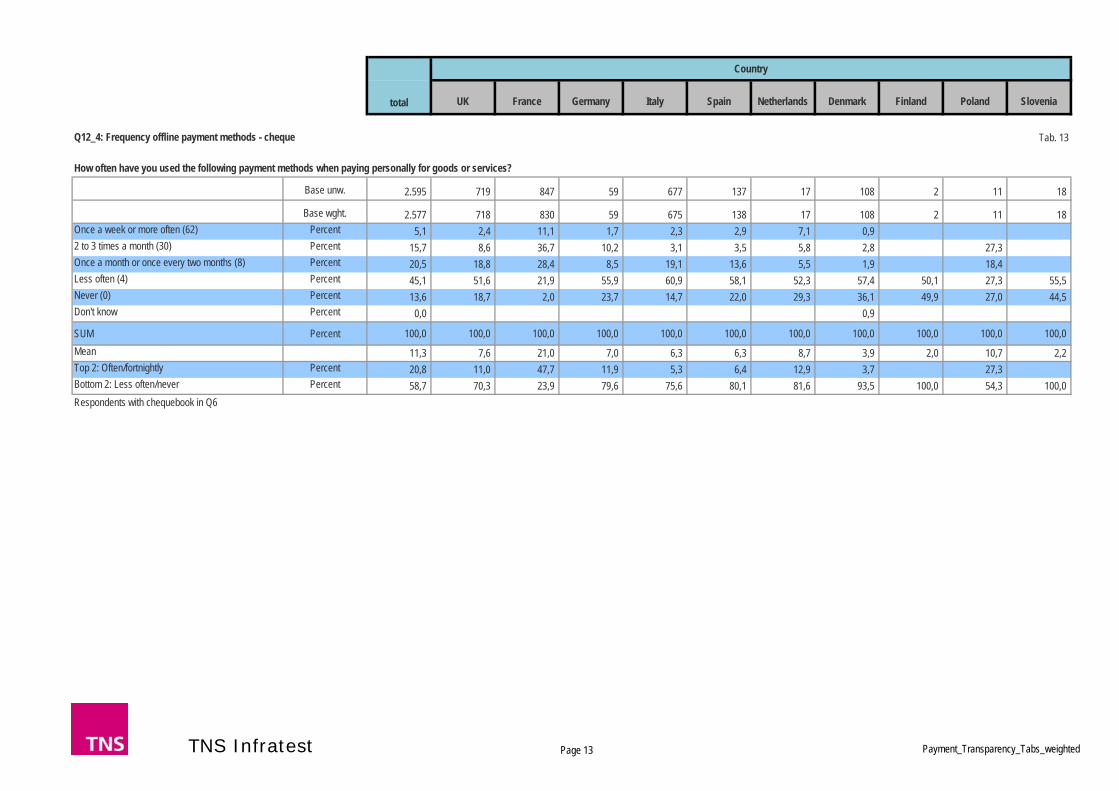
UK France Germany Italy Spain Netherlands Denmark Finland Poland Slovenia
Country
total
Tab. 13
Base unw. 2.595 719 847 59 677 137 17 108 2 11 18
Base wght. 2.577 718 830 59 675 138 17 108 2 11 18 Once a week or more often (62) Percent 5,1 2,4 11,1 1,7 2,3 2,9 7,1 0,9 2 to 3 times a month (30) Percent 15,7 8,6 36,7 10,2 3,1 3,5 5,8 2,8 27,3 Once a month or once every two months (8) Percent 20,5 18,8 28,4 8,5 19,1 13,6 5,5 1,9 18,4 Less often (4) Percent 45,1 51,6 21,9 55,9 60,9 58,1 52,3 57,4 50,1 27,3 55,5 Never (0) Percent 13,6 18,7 2,0 23,7 14,7 22,0 29,3 36,1 49,9 27,0 44,5 Don't know Percent 0,0 0,9
SUM Percent 100,0 100,0 100,0 100,0 100,0 100,0 100,0 100,0 100,0 100,0 100,0 Mean 11,3 7,6 21,0 7,0 6,3 6,3 8,7 3,9 2,0 10,7 2,2 Top 2: Often/fortnightly Percent 20,8 11,0 47,7 11,9 5,3 6,4 12,9 3,7 27,3 Bottom 2: Less often/never Percent 58,7 70,3 23,9 79,6 75,6 80,1 81,6 93,5 100,0 54,3 100,0 Respondents with chequebook in Q6
Q12_4: Frequency offline payment methods - cheque
How often have you used the following payment methods when paying personally for goods or services?
TNS Infratest Page 13 Payment_Transparency_Tabs_weighted
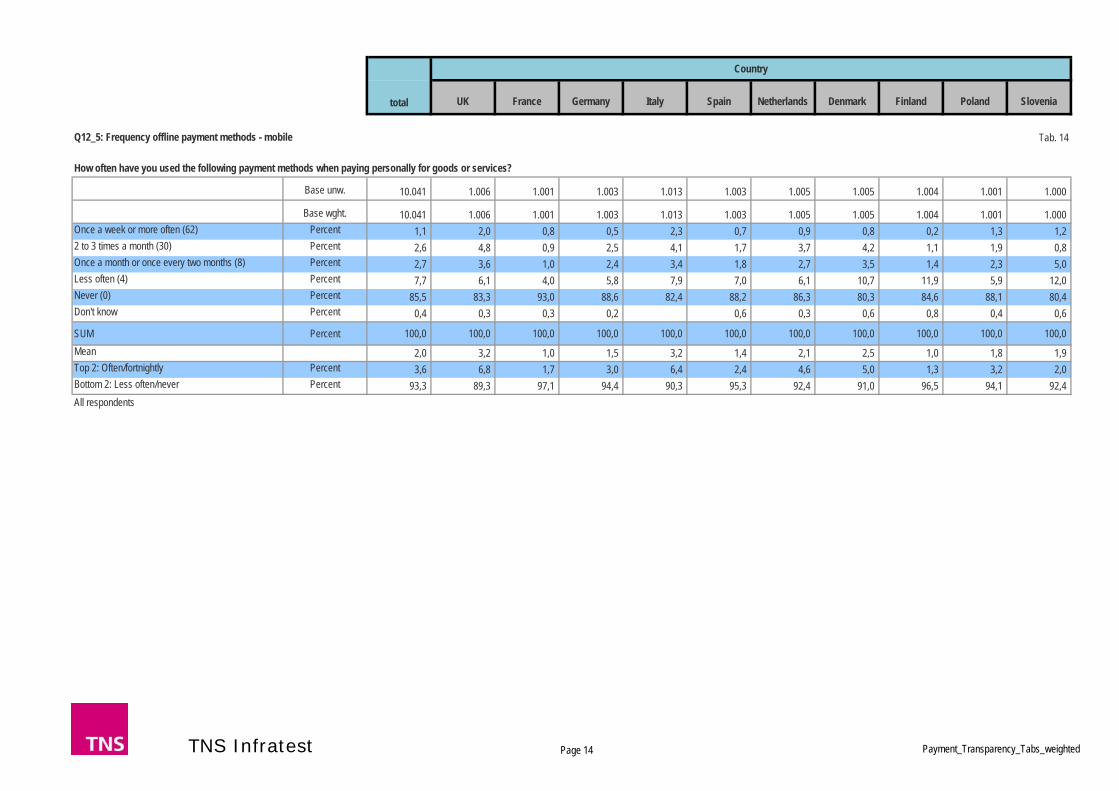
UK France Germany Italy Spain Netherlands Denmark Finland Poland Slovenia
Country
total
Tab. 14
Base unw. 10.041 1.006 1.001 1.003 1.013 1.003 1.005 1.005 1.004 1.001 1.000
Base wght. 10.041 1.006 1.001 1.003 1.013 1.003 1.005 1.005 1.004 1.001 1.000 Once a week or more often (62) Percent 1,1 2,0 0,8 0,5 2,3 0,7 0,9 0,8 0,2 1,3 1,2 2 to 3 times a month (30) Percent 2,6 4,8 0,9 2,5 4,1 1,7 3,7 4,2 1,1 1,9 0,8 Once a month or once every two months (8) Percent 2,7 3,6 1,0 2,4 3,4 1,8 2,7 3,5 1,4 2,3 5,0 Less often (4) Percent 7,7 6,1 4,0 5,8 7,9 7,0 6,1 10,7 11,9 5,9 12,0 Never (0) Percent 85,5 83,3 93,0 88,6 82,4 88,2 86,3 80,3 84,6 88,1 80,4 Don't know Percent 0,4 0,3 0,3 0,2 0,6 0,3 0,6 0,8 0,4 0,6
SUM Percent 100,0 100,0 100,0 100,0 100,0 100,0 100,0 100,0 100,0 100,0 100,0 Mean 2,0 3,2 1,0 1,5 3,2 1,4 2,1 2,5 1,0 1,8 1,9 Top 2: Often/fortnightly Percent 3,6 6,8 1,7 3,0 6,4 2,4 4,6 5,0 1,3 3,2 2,0 Bottom 2: Less often/never Percent 93,3 89,3 97,1 94,4 90,3 95,3 92,4 91,0 96,5 94,1 92,4 All respondents
Q12_5: Frequency offline payment methods - mobile
How often have you used the following payment methods when paying personally for goods or services?
TNS Infratest Page 14 Payment_Transparency_Tabs_weighted
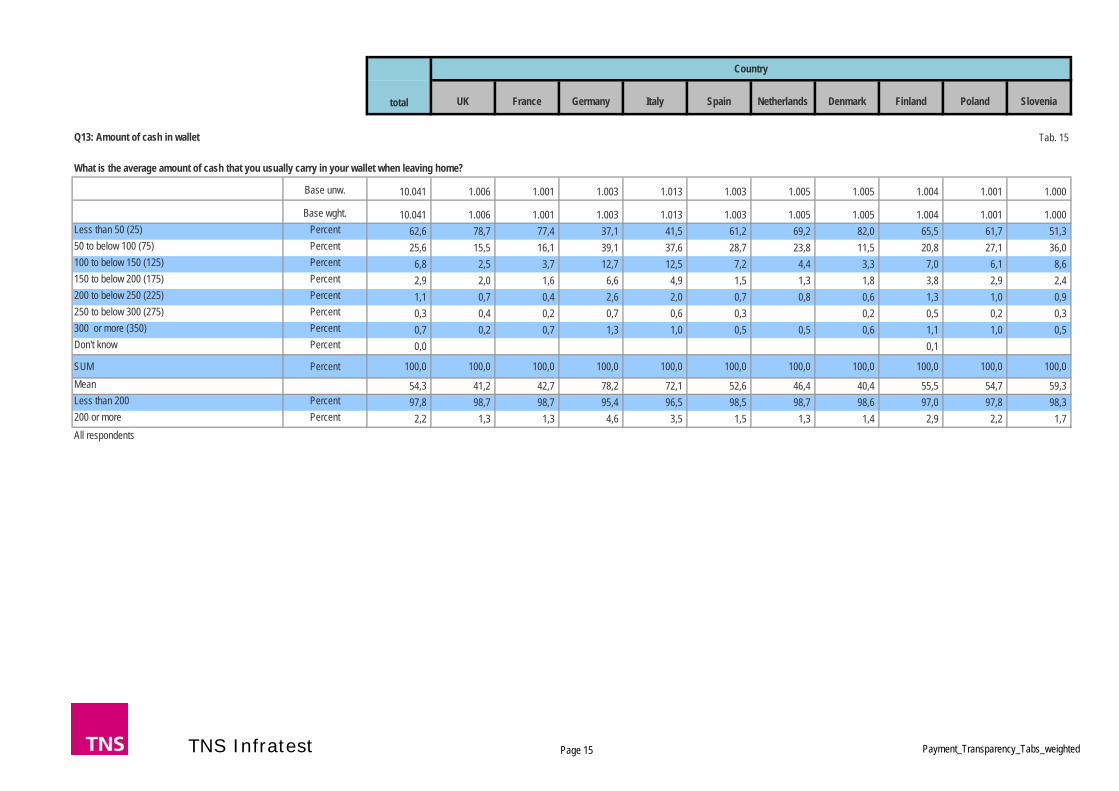
UK France Germany Italy Spain Netherlands Denmark Finland Poland Slovenia
Country
total
Tab. 15
Base unw. 10.041 1.006 1.001 1.003 1.013 1.003 1.005 1.005 1.004 1.001 1.000
Base wght. 10.041 1.006 1.001 1.003 1.013 1.003 1.005 1.005 1.004 1.001 1.000 Less than 50 (25) Percent 62,6 78,7 77,4 37,1 41,5 61,2 69,2 82,0 65,5 61,7 51,3 50 to below 100 (75) Percent 25,6 15,5 16,1 39,1 37,6 28,7 23,8 11,5 20,8 27,1 36,0 100 to below 150 (125) Percent 6,8 2,5 3,7 12,7 12,5 7,2 4,4 3,3 7,0 6,1 8,6 150 to below 200 (175) Percent 2,9 2,0 1,6 6,6 4,9 1,5 1,3 1,8 3,8 2,9 2,4 200 to below 250 (225) Percent 1,1 0,7 0,4 2,6 2,0 0,7 0,8 0,6 1,3 1,0 0,9 250 to below 300 (275) Percent 0,3 0,4 0,2 0,7 0,6 0,3 0,2 0,5 0,2 0,3 300 or more (350) Percent 0,7 0,2 0,7 1,3 1,0 0,5 0,5 0,6 1,1 1,0 0,5 Don't know Percent 0,0 0,1
SUM Percent 100,0 100,0 100,0 100,0 100,0 100,0 100,0 100,0 100,0 100,0 100,0 Mean 54,3 41,2 42,7 78,2 72,1 52,6 46,4 40,4 55,5 54,7 59,3 Less than 200 Percent 97,8 98,7 98,7 95,4 96,5 98,5 98,7 98,6 97,0 97,8 98,3 200 or more Percent 2,2 1,3 1,3 4,6 3,5 1,5 1,3 1,4 2,9 2,2 1,7 All respondents
Q13: Amount of cash in wallet
What is the average amount of cash that you usually carry in your wallet when leaving home?
TNS Infratest Page 15 Payment_Transparency_Tabs_weighted

UK France Germany Italy Spain Netherlands Denmark Finland Poland Slovenia
Country
total
Tab. 16
Base unw. 1 1
Base wght. 1 1 Less than 200 Percent 100,0 100,0 At least 200 Percent
SUM Percent 100,0 100,0
Respondents with don't know-Answer in Q13
Q14: Amount of cash in wallet
Would you say that the average amount of cash in your wallet is likely to be "less than" or likely to be "at least" 200 EUR?
TNS Infratest Page 16 Payment_Transparency_Tabs_weighted
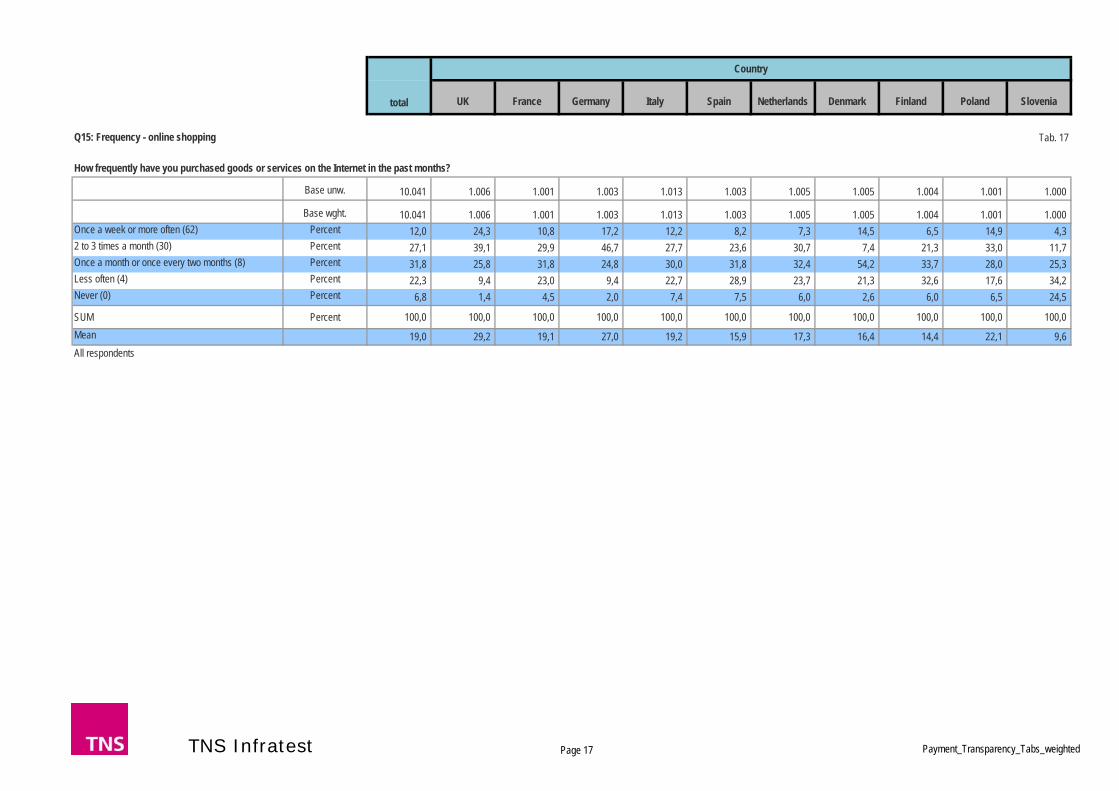
UK France Germany Italy Spain Netherlands Denmark Finland Poland Slovenia
Country
total
Tab. 17
Base unw. 10.041 1.006 1.001 1.003 1.013 1.003 1.005 1.005 1.004 1.001 1.000
Base wght. 10.041 1.006 1.001 1.003 1.013 1.003 1.005 1.005 1.004 1.001 1.000 Once a week or more often (62) Percent 12,0 24,3 10,8 17,2 12,2 8,2 7,3 14,5 6,5 14,9 4,3 2 to 3 times a month (30) Percent 27,1 39,1 29,9 46,7 27,7 23,6 30,7 7,4 21,3 33,0 11,7 Once a month or once every two months (8) Percent 31,8 25,8 31,8 24,8 30,0 31,8 32,4 54,2 33,7 28,0 25,3 Less often (4) Percent 22,3 9,4 23,0 9,4 22,7 28,9 23,7 21,3 32,6 17,6 34,2 Never (0) Percent 6,8 1,4 4,5 2,0 7,4 7,5 6,0 2,6 6,0 6,5 24,5
SUM Percent 100,0 100,0 100,0 100,0 100,0 100,0 100,0 100,0 100,0 100,0 100,0 Mean 19,0 29,2 19,1 27,0 19,2 15,9 17,3 16,4 14,4 22,1 9,6 All respondents
Q15: Frequency - online shopping
How frequently have you purchased goods or services on the Internet in the past months?
TNS Infratest Page 17 Payment_Transparency_Tabs_weighted
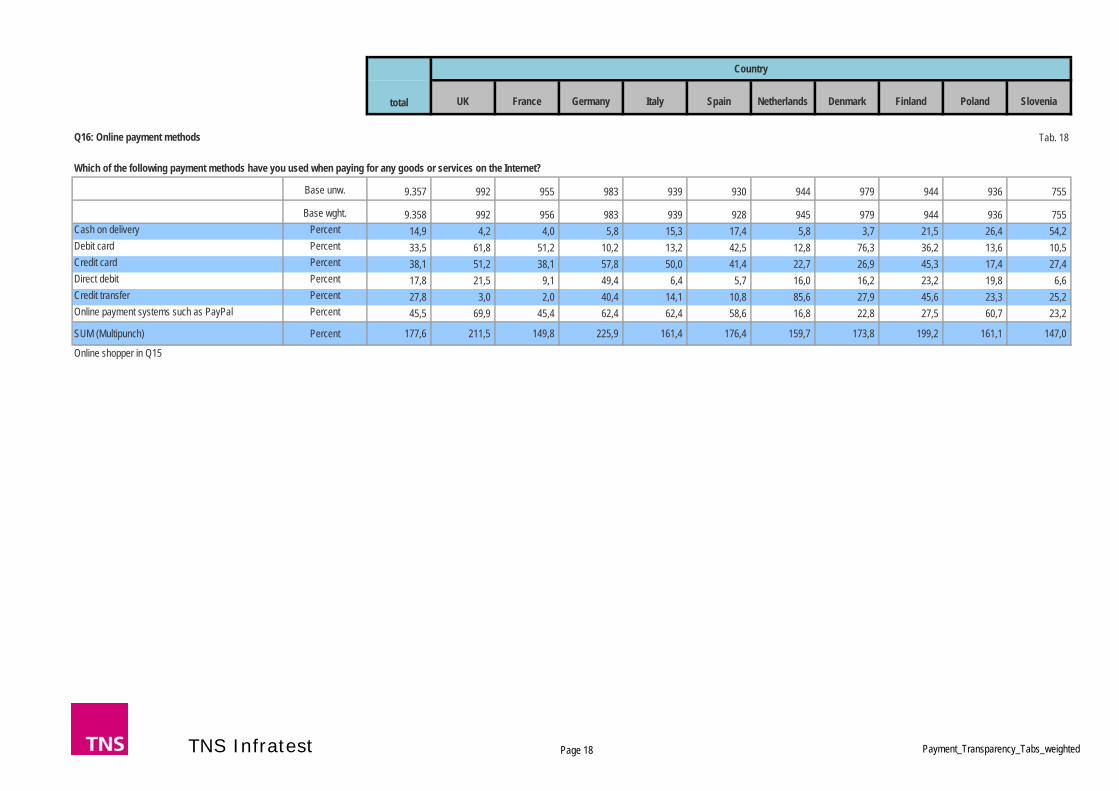
UK France Germany Italy Spain Netherlands Denmark Finland Poland Slovenia
Country
total
Tab. 18
Base unw. 9.357 992 955 983 939 930 944 979 944 936 755
Base wght. 9.358 992 956 983 939 928 945 979 944 936 755 Cash on delivery Percent 14,9 4,2 4,0 5,8 15,3 17,4 5,8 3,7 21,5 26,4 54,2 Debit card Percent 33,5 61,8 51,2 10,2 13,2 42,5 12,8 76,3 36,2 13,6 10,5 Credit card Percent 38,1 51,2 38,1 57,8 50,0 41,4 22,7 26,9 45,3 17,4 27,4 Direct debit Percent 17,8 21,5 9,1 49,4 6,4 5,7 16,0 16,2 23,2 19,8 6,6 Credit transfer Percent 27,8 3,0 2,0 40,4 14,1 10,8 85,6 27,9 45,6 23,3 25,2 Online payment systems such as PayPal Percent 45,5 69,9 45,4 62,4 62,4 58,6 16,8 22,8 27,5 60,7 23,2
SUM (Multipunch) Percent 177,6 211,5 149,8 225,9 161,4 176,4 159,7 173,8 199,2 161,1 147,0
Online shopper in Q15
Q16: Online payment methods
Which of the following payment methods have you used when paying for any goods or services on the Internet?
TNS Infratest Page 18 Payment_Transparency_Tabs_weighted
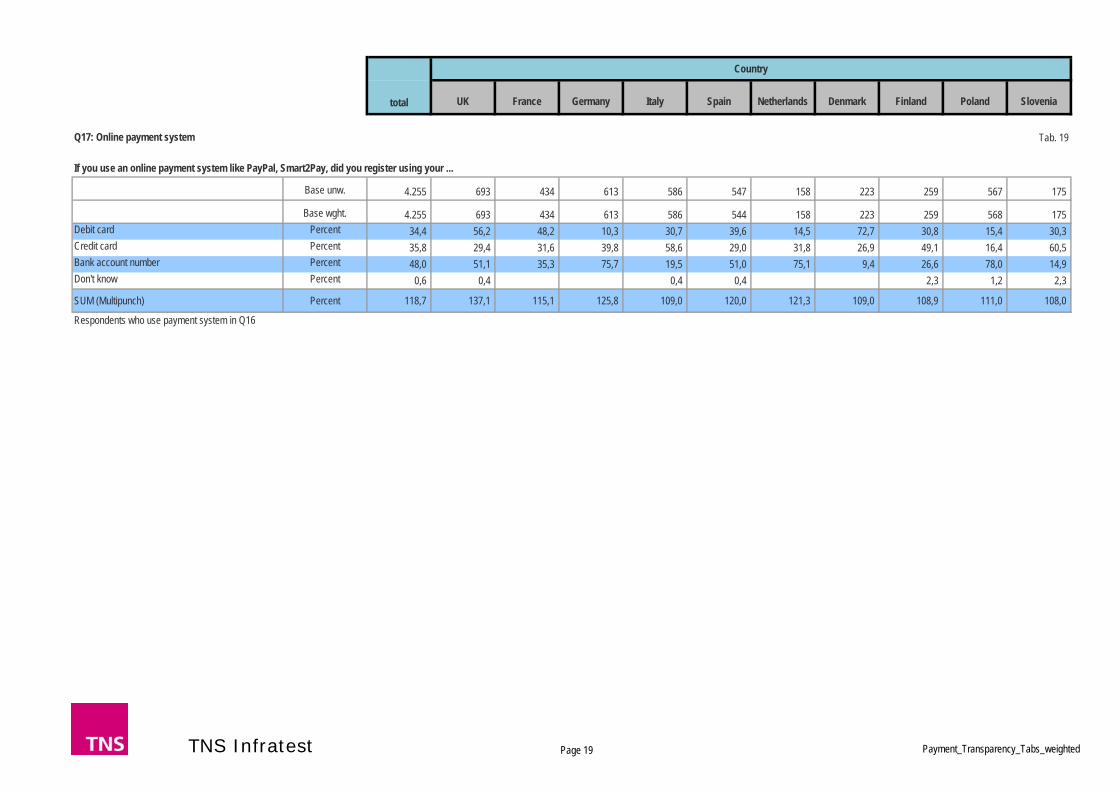
UK France Germany Italy Spain Netherlands Denmark Finland Poland Slovenia
Country
total
Tab. 19
Base unw. 4.255 693 434 613 586 547 158 223 259 567 175
Base wght. 4.255 693 434 613 586 544 158 223 259 568 175 Debit card Percent 34,4 56,2 48,2 10,3 30,7 39,6 14,5 72,7 30,8 15,4 30,3 Credit card Percent 35,8 29,4 31,6 39,8 58,6 29,0 31,8 26,9 49,1 16,4 60,5 Bank account number Percent 48,0 51,1 35,3 75,7 19,5 51,0 75,1 9,4 26,6 78,0 14,9 Don't know Percent 0,6 0,4 0,4 0,4 2,3 1,2 2,3
SUM (Multipunch) Percent 118,7 137,1 115,1 125,8 109,0 120,0 121,3 109,0 108,9 111,0 108,0
Respondents who use payment system in Q16
Q17: Online payment system
If you use an online payment system like PayPal, Smart2Pay, did you register using your ...
TNS Infratest Page 19 Payment_Transparency_Tabs_weighted
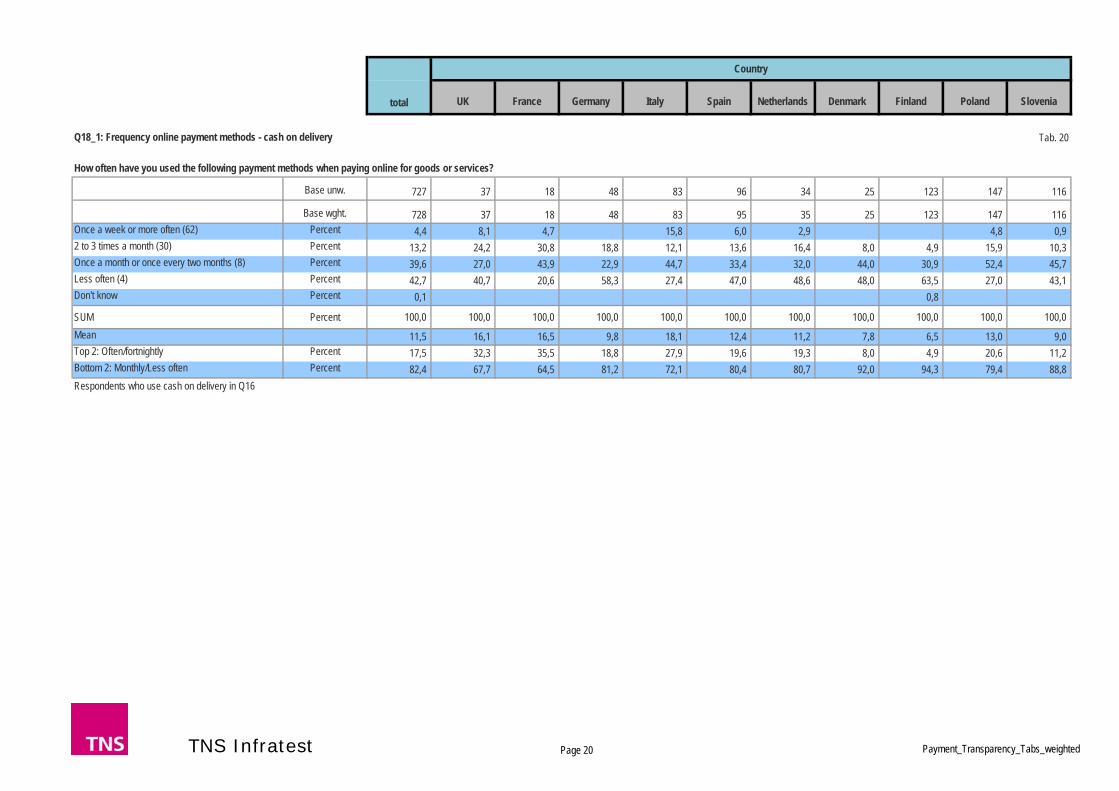
UK France Germany Italy Spain Netherlands Denmark Finland Poland Slovenia
Country
total
Tab. 20
Base unw. 727 37 18 48 83 96 34 25 123 147 116
Base wght. 728 37 18 48 83 95 35 25 123 147 116 Once a week or more often (62) Percent 4,4 8,1 4,7 15,8 6,0 2,9 4,8 0,9 2 to 3 times a month (30) Percent 13,2 24,2 30,8 18,8 12,1 13,6 16,4 8,0 4,9 15,9 10,3 Once a month or once every two months (8) Percent 39,6 27,0 43,9 22,9 44,7 33,4 32,0 44,0 30,9 52,4 45,7 Less often (4) Percent 42,7 40,7 20,6 58,3 27,4 47,0 48,6 48,0 63,5 27,0 43,1 Don't know Percent 0,1 0,8
SUM Percent 100,0 100,0 100,0 100,0 100,0 100,0 100,0 100,0 100,0 100,0 100,0 Mean 11,5 16,1 16,5 9,8 18,1 12,4 11,2 7,8 6,5 13,0 9,0 Top 2: Often/fortnightly Percent 17,5 32,3 35,5 18,8 27,9 19,6 19,3 8,0 4,9 20,6 11,2 Bottom 2: Monthly/Less often Percent 82,4 67,7 64,5 81,2 72,1 80,4 80,7 92,0 94,3 79,4 88,8 Respondents who use cash on delivery in Q16
Q18_1: Frequency online payment methods - cash on delivery
How often have you used the following payment methods when paying online for goods or services?
TNS Infratest Page 20 Payment_Transparency_Tabs_weighted

UK France Germany Italy Spain Netherlands Denmark Finland Poland Slovenia
Country
total
Tab. 21
Base unw. 1.845 480 214 86 78 221 75 336 209 95 51
Base wght. 1.843 480 212 86 78 219 76 336 209 95 51 Once a week or more often (62) Percent 12,2 18,1 9,2 7,0 28,4 8,5 5,5 13,1 4,3 12,7 5,9 2 to 3 times a month (30) Percent 27,6 37,4 33,0 33,7 17,8 24,8 27,6 19,1 15,3 36,8 17,6 Once a month or once every two months (8) Percent 44,1 30,9 44,1 43,0 40,0 45,9 44,1 60,4 49,2 41,1 47,1 Less often (4) Percent 15,9 13,6 13,8 16,3 13,9 20,4 22,8 7,4 30,6 7,3 29,4 Don't know Percent 0,2 0,5 0,5 2,1
SUM Percent 100,0 100,0 100,0 100,0 100,0 100,0 100,0 100,0 100,0 100,0 100,0 Mean 20,1 25,5 19,7 18,5 26,7 17,3 16,1 19,0 12,5 23,0 13,9 Top 2: Often/fortnightly Percent 39,8 55,6 42,2 40,7 46,2 33,3 33,1 32,1 19,7 49,5 23,5 Bottom 2: Monthly/Less often Percent 60,0 44,4 57,8 59,3 53,8 66,3 66,9 67,9 79,9 48,4 76,5 Respondents who use debit card in Q16
Q18_2: Frequency online payment methods - debit card
How often have you used the following payment methods when paying online for goods or services?
TNS Infratest Page 21 Payment_Transparency_Tabs_weighted

UK France Germany Italy Spain Netherlands Denmark Finland Poland Slovenia
Country
total
Tab. 22
Base unw. 2.296 398 154 466 257 216 171 165 256 115 98
Base wght. 2.292 398 155 466 256 214 169 165 257 115 98 Once a week or more often (62) Percent 10,3 17,3 12,3 8,4 15,2 6,9 6,4 8,5 3,9 13,9 5,1 2 to 3 times a month (30) Percent 27,8 32,9 35,3 35,6 28,4 21,3 23,6 18,8 18,0 28,0 18,4 Once a month or once every two months (8) Percent 43,0 32,7 43,4 41,4 42,8 49,2 38,4 57,6 48,8 38,2 52,0 Less often (4) Percent 18,8 17,1 9,0 14,6 13,6 22,7 31,6 15,2 29,3 18,2 24,5 Don't know Percent 0,1 1,7
SUM Percent 100,0 100,0 100,0 100,0 100,0 100,0 100,0 100,0 100,0 100,0 100,0 Mean 18,9 23,9 22,0 19,8 21,9 15,5 15,4 16,1 12,9 21,2 13,8 Top 2: Often/fortnightly Percent 38,1 50,2 47,6 44,0 43,6 28,1 30,0 27,3 21,9 41,9 23,5 Bottom 2: Monthly/Less often Percent 61,8 49,8 52,4 56,0 56,4 71,9 70,0 72,7 78,1 56,4 76,5 Respondents who use credit card in Q16
Q18_3: Frequency online payment methods - credit card
How often have you used the following payment methods when paying online for goods or services?
TNS Infratest Page 22 Payment_Transparency_Tabs_weighted

UK France Germany Italy Spain Netherlands Denmark Finland Poland Slovenia
Country
total
Tab. 23
Base unw. 1.240 189 59 422 46 36 101 118 147 100 22
Base wght. 1.246 189 64 422 46 35 103 118 147 100 22 Once a week or more often (62) Percent 6,5 11,6 4,1 5,0 28,6 2,7 2,4 3,4 1,4 12,1 4,5 2 to 3 times a month (30) Percent 25,1 26,4 21,5 34,4 15,1 11,2 21,8 16,1 15,0 25,9 13,6 Once a month or once every two months (8) Percent 45,3 40,2 41,0 46,4 28,2 36,0 39,8 55,9 50,3 48,1 54,6 Less often (4) Percent 22,9 21,7 33,4 14,2 28,0 47,4 36,1 23,7 32,7 14,0 27,3 Don't know Percent 0,2 2,8 0,9 0,7
SUM Percent 100,0 100,0 100,0 100,0 100,0 100,0 100,0 100,0 100,0 100,0 100,0 Mean 16,1 19,2 13,6 17,7 25,7 10,1 12,6 12,5 10,7 19,6 12,4 Top 2: Often/fortnightly Percent 31,6 38,1 25,6 39,4 43,8 13,9 24,2 19,5 16,3 38,0 18,2 Bottom 2: Monthly/Less often Percent 68,2 61,9 74,4 60,6 56,2 83,3 75,8 79,7 83,0 62,0 81,9 Respondents who use direct debit in Q16
Q18_4: Frequency online payment methods - direct debit
How often have you used the following payment methods when paying online for goods or services?
TNS Infratest Page 23 Payment_Transparency_Tabs_weighted

UK France Germany Italy Spain Netherlands Denmark Finland Poland Slovenia
Country
total
Tab. 24
Base unw. 1.531 28 16 338 101 77 304 202 254 133 78
Base wght. 1.534 28 17 338 101 77 305 202 254 133 78 Once a week or more often (62) Percent 6,2 3,6 9,5 6,2 8,0 5,1 6,9 3,5 4,3 13,7 2,6 2 to 3 times a month (30) Percent 20,6 35,8 10,6 21,0 18,0 16,8 32,5 12,4 11,8 27,9 12,8 Once a month or once every two months (8) Percent 42,9 21,3 33,9 41,4 43,5 36,6 48,1 44,6 45,6 33,0 48,7 Less often (4) Percent 29,9 39,3 46,0 31,1 30,6 40,2 12,5 39,1 37,4 24,8 35,9 Don't know Percent 0,4 0,3 1,3 0,5 0,8 0,7
SUM Percent 100,0 100,0 100,0 100,0 100,0 100,0 100,0 100,0 100,0 100,0 100,0 Mean 14,7 16,2 13,6 14,8 15,1 12,9 18,4 11,0 11,5 20,6 10,8 Top 2: Often/fortnightly Percent 26,7 39,4 20,1 27,2 26,0 21,9 39,4 15,8 16,2 41,5 15,4 Bottom 2: Monthly/Less often Percent 72,9 60,6 79,9 72,5 74,0 76,8 60,6 83,7 83,1 57,8 84,6 Respondents who use credit transfer in Q16
Q18_5: Frequency online payment methods - credit transfer
How often have you used the following payment methods when paying online for goods or services?
TNS Infratest Page 24 Payment_Transparency_Tabs_weighted
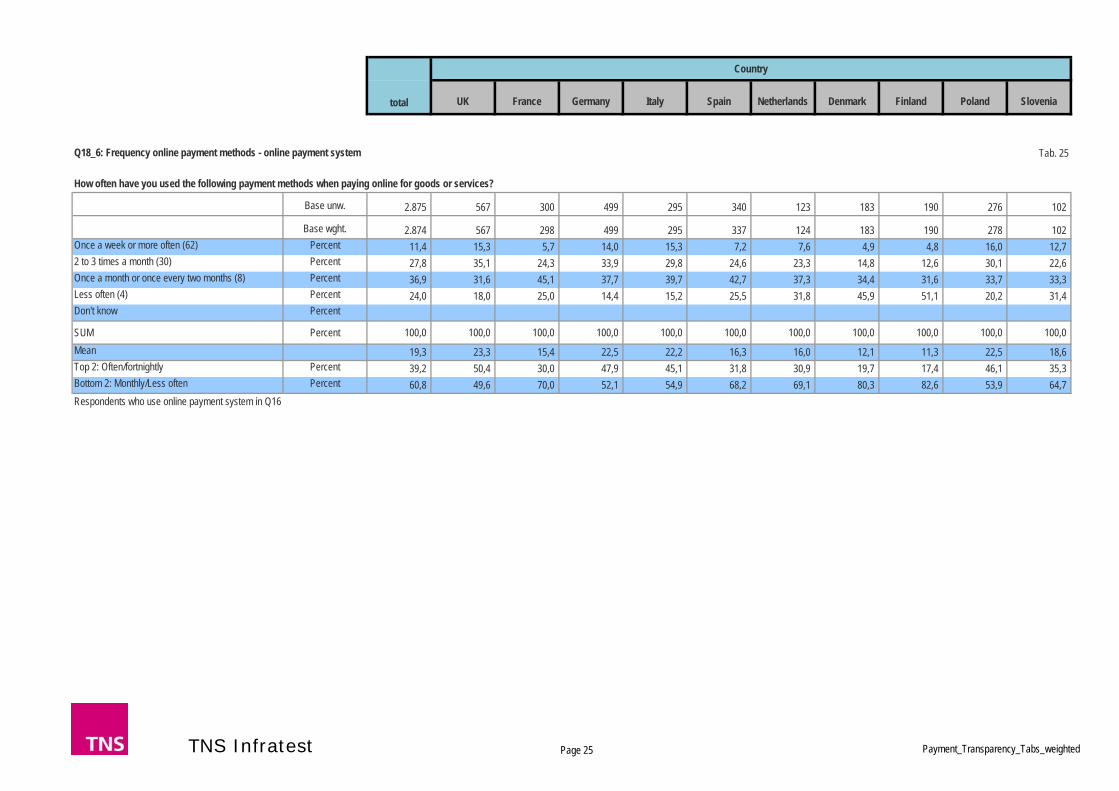
UK France Germany Italy Spain Netherlands Denmark Finland Poland Slovenia
Country
total
Tab. 25
Base unw. 2.875 567 300 499 295 340 123 183 190 276 102
Base wght. 2.874 567 298 499 295 337 124 183 190 278 102 Once a week or more often (62) Percent 11,4 15,3 5,7 14,0 15,3 7,2 7,6 4,9 4,8 16,0 12,7 2 to 3 times a month (30) Percent 27,8 35,1 24,3 33,9 29,8 24,6 23,3 14,8 12,6 30,1 22,6 Once a month or once every two months (8) Percent 36,9 31,6 45,1 37,7 39,7 42,7 37,3 34,4 31,6 33,7 33,3 Less often (4) Percent 24,0 18,0 25,0 14,4 15,2 25,5 31,8 45,9 51,1 20,2 31,4 Don't know Percent
SUM Percent 100,0 100,0 100,0 100,0 100,0 100,0 100,0 100,0 100,0 100,0 100,0 Mean 19,3 23,3 15,4 22,5 22,2 16,3 16,0 12,1 11,3 22,5 18,6 Top 2: Often/fortnightly Percent 39,2 50,4 30,0 47,9 45,1 31,8 30,9 19,7 17,4 46,1 35,3 Bottom 2: Monthly/Less often Percent 60,8 49,6 70,0 52,1 54,9 68,2 69,1 80,3 82,6 53,9 64,7 Respondents who use online payment system in Q16
Q18_6: Frequency online payment methods - online payment system
How often have you used the following payment methods when paying online for goods or services?
TNS Infratest Page 25 Payment_Transparency_Tabs_weighted

UK France Germany Italy Spain Netherlands Denmark Finland Poland Slovenia
Country
total
Tab. 26
Base unw. 10.041 1.006 1.001 1.003 1.013 1.003 1.005 1.005 1.004 1.001 1.000
Base wght. 10.041 1.006 1.001 1.003 1.013 1.003 1.005 1.005 1.004 1.001 1.000 Heavy Debit card user online & offline Percent 7,0 25,5 8,7 3,2 3,5 6,9 2,5 10,5 3,9 4,6 1,0 Heavy Debit card user only offline Percent 63,8 49,7 53,6 57,2 50,6 55,5 89,9 79,0 84,8 69,4 47,9 Heavy Debit card user only online Percent 0,3 1,0 0,3 0,3 0,1 0,4 0,3 0,2 0,1 0,2 Low Debit card user online or offline Percent 16,6 22,3 5,4 19,6 18,8 24,3 6,9 7,3 7,8 16,0 37,5 No Debit card use Percent 12,4 1,5 32,0 19,6 27,0 13,0 0,7 3,0 3,4 9,9 13,4
SUM Percent 100,0 100,0 100,0 100,0 100,0 100,0 100,0 100,0 100,0 100,0 100,0
All respondents
Q19: Debit card segmentation
TNS Infratest Page 26 Payment_Transparency_Tabs_weighted
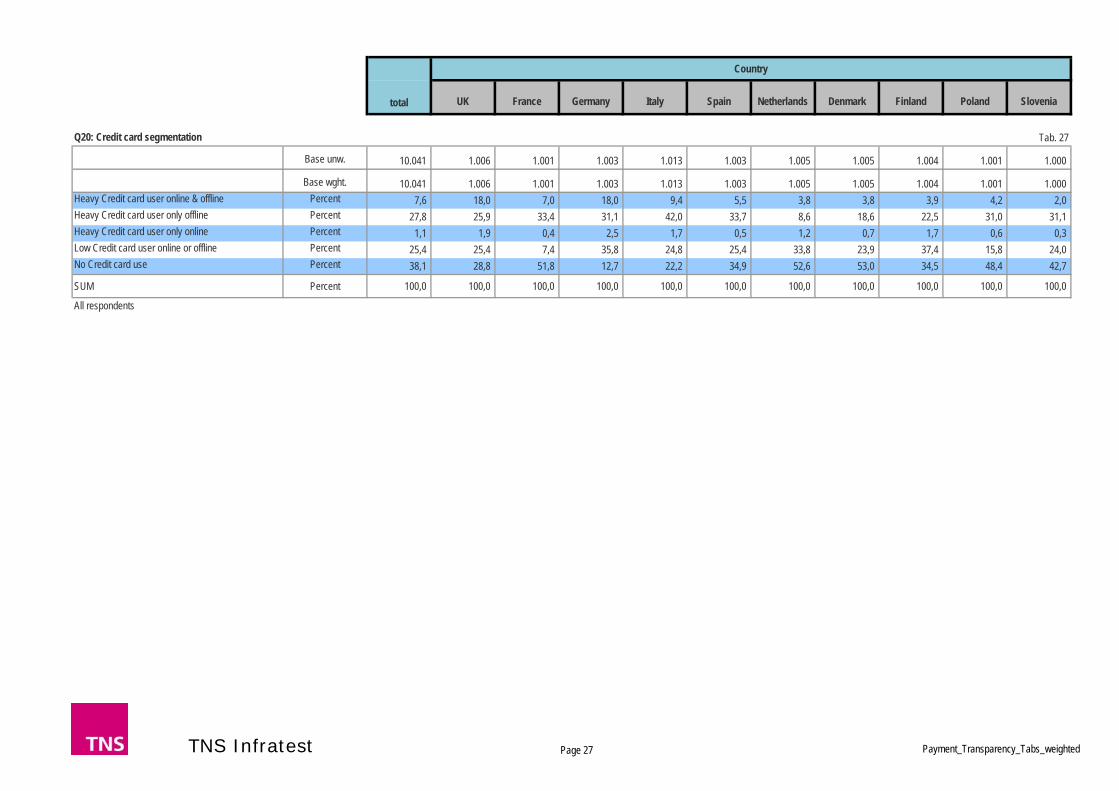
UK France Germany Italy Spain Netherlands Denmark Finland Poland Slovenia
Country
total
Tab. 27
Base unw. 10.041 1.006 1.001 1.003 1.013 1.003 1.005 1.005 1.004 1.001 1.000
Base wght. 10.041 1.006 1.001 1.003 1.013 1.003 1.005 1.005 1.004 1.001 1.000 Heavy Credit card user online & offline Percent 7,6 18,0 7,0 18,0 9,4 5,5 3,8 3,8 3,9 4,2 2,0 Heavy Credit card user only offline Percent 27,8 25,9 33,4 31,1 42,0 33,7 8,6 18,6 22,5 31,0 31,1 Heavy Credit card user only online Percent 1,1 1,9 0,4 2,5 1,7 0,5 1,2 0,7 1,7 0,6 0,3 Low Credit card user online or offline Percent 25,4 25,4 7,4 35,8 24,8 25,4 33,8 23,9 37,4 15,8 24,0 No Credit card use Percent 38,1 28,8 51,8 12,7 22,2 34,9 52,6 53,0 34,5 48,4 42,7
SUM Percent 100,0 100,0 100,0 100,0 100,0 100,0 100,0 100,0 100,0 100,0 100,0
All respondents
Q20: Credit card segmentation
TNS Infratest Page 27 Payment_Transparency_Tabs_weighted
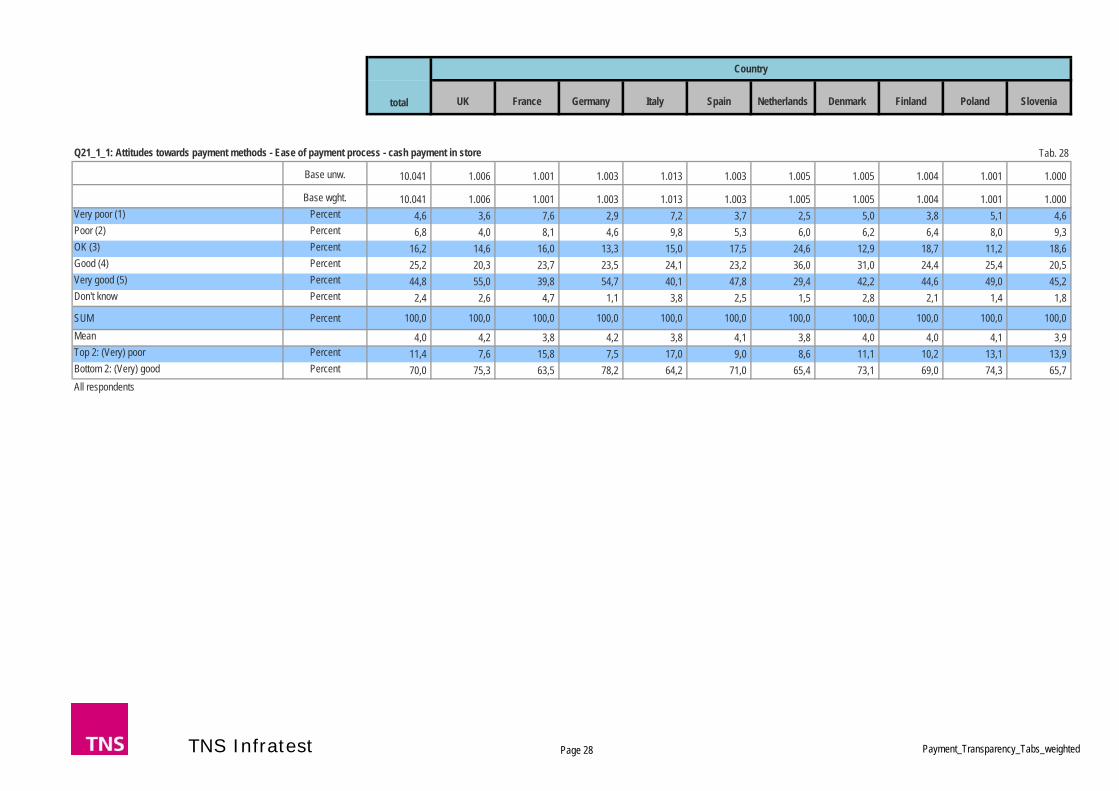
UK France Germany Italy Spain Netherlands Denmark Finland Poland Slovenia
Country
total
Tab. 28
Base unw. 10.041 1.006 1.001 1.003 1.013 1.003 1.005 1.005 1.004 1.001 1.000
Base wght. 10.041 1.006 1.001 1.003 1.013 1.003 1.005 1.005 1.004 1.001 1.000 Very poor (1) Percent 4,6 3,6 7,6 2,9 7,2 3,7 2,5 5,0 3,8 5,1 4,6 Poor (2) Percent 6,8 4,0 8,1 4,6 9,8 5,3 6,0 6,2 6,4 8,0 9,3 OK (3) Percent 16,2 14,6 16,0 13,3 15,0 17,5 24,6 12,9 18,7 11,2 18,6 Good (4) Percent 25,2 20,3 23,7 23,5 24,1 23,2 36,0 31,0 24,4 25,4 20,5 Very good (5) Percent 44,8 55,0 39,8 54,7 40,1 47,8 29,4 42,2 44,6 49,0 45,2 Don't know Percent 2,4 2,6 4,7 1,1 3,8 2,5 1,5 2,8 2,1 1,4 1,8
SUM Percent 100,0 100,0 100,0 100,0 100,0 100,0 100,0 100,0 100,0 100,0 100,0 Mean 4,0 4,2 3,8 4,2 3,8 4,1 3,8 4,0 4,0 4,1 3,9 Top 2: (Very) poor Percent 11,4 7,6 15,8 7,5 17,0 9,0 8,6 11,1 10,2 13,1 13,9 Bottom 2: (Very) good Percent 70,0 75,3 63,5 78,2 64,2 71,0 65,4 73,1 69,0 74,3 65,7 All respondents
Q21_1_1: Attitudes towards payment methods - Ease of payment process - cash payment in store
TNS Infratest Page 28 Payment_Transparency_Tabs_weighted

UK France Germany Italy Spain Netherlands Denmark Finland Poland Slovenia
Country
total
Tab. 29
Base unw. 10.041 1.006 1.001 1.003 1.013 1.003 1.005 1.005 1.004 1.001 1.000
Base wght. 10.041 1.006 1.001 1.003 1.013 1.003 1.005 1.005 1.004 1.001 1.000 Very poor (1) Percent 2,8 0,3 3,5 2,9 9,1 1,7 0,5 1,6 0,4 4,5 3,5 Poor (2) Percent 4,7 1,2 5,8 6,5 8,6 4,1 1,2 3,1 3,3 6,7 6,4 OK (3) Percent 15,0 10,6 16,2 19,1 17,6 19,7 15,0 8,0 12,5 14,1 17,1 Good (4) Percent 30,3 30,7 28,1 28,6 25,1 34,3 44,5 26,3 30,4 27,8 27,6 Very good (5) Percent 39,9 55,8 32,0 28,0 27,5 36,8 37,1 53,8 52,0 40,5 35,8 Don't know Percent 7,3 1,4 14,5 14,9 12,3 3,5 1,8 7,3 1,5 6,4 9,6
SUM Percent 100,0 100,0 100,0 100,0 100,0 100,0 100,0 100,0 100,0 100,0 100,0 Mean 4,1 4,4 3,9 3,9 3,6 4,0 4,2 4,4 4,3 4,0 3,9 Top 2: (Very) poor Percent 7,5 1,5 9,3 9,4 17,6 5,8 1,7 4,7 3,7 11,2 9,9 Bottom 2: (Very) good Percent 70,3 86,5 60,0 56,6 52,5 71,0 81,6 80,1 82,4 68,3 63,4 All respondents
Q21_2_1: Attitudes towards payment methods - Ease of payment process - debit card
TNS Infratest Page 29 Payment_Transparency_Tabs_weighted

UK France Germany Italy Spain Netherlands Denmark Finland Poland Slovenia
Country
total
Tab. 30
Base unw. 10.041 1.006 1.001 1.003 1.013 1.003 1.005 1.005 1.004 1.001 1.000
Base wght. 10.041 1.006 1.001 1.003 1.013 1.003 1.005 1.005 1.004 1.001 1.000 Very poor (1) Percent 5,0 2,9 4,8 1,6 3,7 3,9 6,9 5,2 8,8 6,6 5,5 Poor (2) Percent 7,5 5,1 6,4 3,3 6,0 6,8 11,7 6,7 10,9 9,2 8,7 OK (3) Percent 18,5 14,0 16,4 20,1 16,7 22,7 21,7 16,9 23,8 14,4 17,8 Good (4) Percent 27,2 26,3 29,9 34,7 32,0 30,8 22,8 22,4 24,1 24,0 24,7 Very good (5) Percent 32,4 42,8 35,5 37,6 38,3 30,6 13,7 33,4 24,8 31,4 35,7 Don't know Percent 9,5 8,9 7,0 2,7 3,3 5,2 23,2 15,4 7,7 14,4 7,6
SUM Percent 100,0 100,0 100,0 100,0 100,0 100,0 100,0 100,0 100,0 100,0 100,0 Mean 3,8 4,1 3,9 4,1 4,0 3,8 3,3 3,9 3,5 3,8 3,8 Top 2: (Very) poor Percent 12,5 8,0 11,2 4,9 9,8 10,7 18,6 11,8 19,6 15,8 14,2 Bottom 2: (Very) good Percent 59,6 69,1 65,4 72,3 70,3 61,4 36,5 55,8 48,9 55,4 60,4 All respondents
Q21_3_1: Attitudes towards payment methods - Ease of payment process - credit card
TNS Infratest Page 30 Payment_Transparency_Tabs_weighted
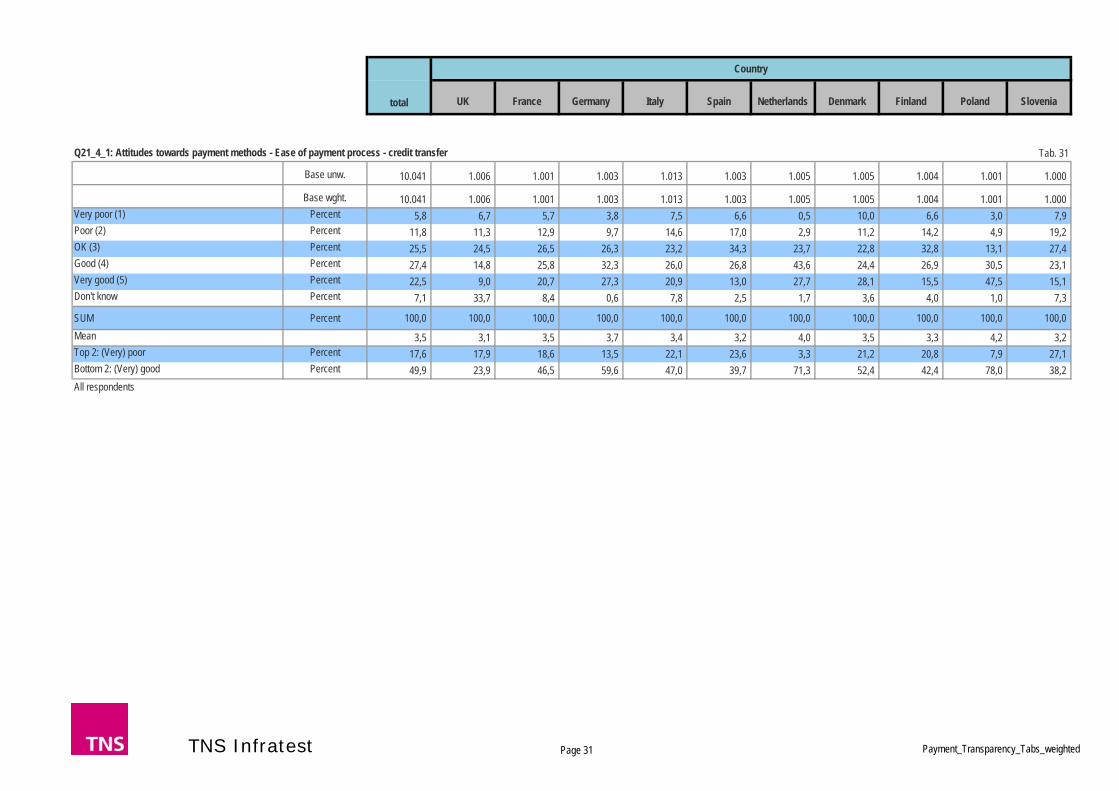
UK France Germany Italy Spain Netherlands Denmark Finland Poland Slovenia
Country
total
Tab. 31
Base unw. 10.041 1.006 1.001 1.003 1.013 1.003 1.005 1.005 1.004 1.001 1.000
Base wght. 10.041 1.006 1.001 1.003 1.013 1.003 1.005 1.005 1.004 1.001 1.000 Very poor (1) Percent 5,8 6,7 5,7 3,8 7,5 6,6 0,5 10,0 6,6 3,0 7,9 Poor (2) Percent 11,8 11,3 12,9 9,7 14,6 17,0 2,9 11,2 14,2 4,9 19,2 OK (3) Percent 25,5 24,5 26,5 26,3 23,2 34,3 23,7 22,8 32,8 13,1 27,4 Good (4) Percent 27,4 14,8 25,8 32,3 26,0 26,8 43,6 24,4 26,9 30,5 23,1 Very good (5) Percent 22,5 9,0 20,7 27,3 20,9 13,0 27,7 28,1 15,5 47,5 15,1 Don't know Percent 7,1 33,7 8,4 0,6 7,8 2,5 1,7 3,6 4,0 1,0 7,3
SUM Percent 100,0 100,0 100,0 100,0 100,0 100,0 100,0 100,0 100,0 100,0 100,0 Mean 3,5 3,1 3,5 3,7 3,4 3,2 4,0 3,5 3,3 4,2 3,2 Top 2: (Very) poor Percent 17,6 17,9 18,6 13,5 22,1 23,6 3,3 21,2 20,8 7,9 27,1 Bottom 2: (Very) good Percent 49,9 23,9 46,5 59,6 47,0 39,7 71,3 52,4 42,4 78,0 38,2 All respondents
Q21_4_1: Attitudes towards payment methods - Ease of payment process - credit transfer
TNS Infratest Page 31 Payment_Transparency_Tabs_weighted

UK France Germany Italy Spain Netherlands Denmark Finland Poland Slovenia
Country
total
Tab. 32
Base unw. 10.041 1.006 1.001 1.003 1.013 1.003 1.005 1.005 1.004 1.001 1.000
Base wght. 10.041 1.006 1.001 1.003 1.013 1.003 1.005 1.005 1.004 1.001 1.000 Very poor (1) Percent 4,8 1,1 3,0 3,3 6,8 4,5 1,3 4,5 5,5 4,2 14,2 Poor (2) Percent 6,7 3,0 6,1 6,7 6,4 6,6 3,8 8,1 9,5 5,6 11,1 OK (3) Percent 20,3 18,5 26,2 21,7 18,2 21,3 21,8 21,0 23,4 13,7 17,2 Good (4) Percent 25,0 24,3 24,4 23,8 24,9 29,1 35,5 25,5 25,1 22,0 14,9 Very good (5) Percent 34,7 47,7 35,4 40,0 38,6 33,0 30,7 21,4 27,4 49,7 23,3 Don't know Percent 8,5 5,5 5,0 4,5 5,1 5,6 7,0 19,6 9,2 4,9 19,3
SUM Percent 100,0 100,0 100,0 100,0 100,0 100,0 100,0 100,0 100,0 100,0 100,0 Mean 3,9 4,2 3,9 3,9 3,9 3,8 4,0 3,6 3,7 4,1 3,3 Top 2: (Very) poor Percent 11,5 4,1 9,1 10,0 13,2 11,1 5,1 12,5 14,9 9,8 25,3 Bottom 2: (Very) good Percent 59,7 72,0 59,8 63,8 63,6 62,1 66,2 46,9 52,5 71,7 38,2 All respondents
Q21_5_1: Attitudes towards payment methods - Ease of payment process - online payment system
TNS Infratest Page 32 Payment_Transparency_Tabs_weighted

UK France Germany Italy Spain Netherlands Denmark Finland Poland Slovenia
Country
total
Tab. 33
Base unw. 10.041 1.006 1.001 1.003 1.013 1.003 1.005 1.005 1.004 1.001 1.000
Base wght. 10.041 1.006 1.001 1.003 1.013 1.003 1.005 1.005 1.004 1.001 1.000 Very poor (1) Percent 3,6 3,4 5,7 1,6 6,2 2,6 1,9 3,3 2,4 4,1 4,9 Poor (2) Percent 4,6 2,2 5,4 2,6 8,3 3,7 4,0 4,4 3,5 4,8 6,9 OK (3) Percent 11,9 11,4 12,0 7,5 12,2 14,9 16,0 9,9 10,1 10,5 14,4 Good (4) Percent 20,9 17,7 18,3 18,3 20,6 21,7 29,8 22,2 19,7 19,4 21,4 Very good (5) Percent 57,0 62,6 54,5 69,6 49,6 54,9 47,4 57,7 62,8 60,3 50,6 Don't know Percent 2,1 2,7 4,2 0,4 3,2 2,2 0,9 2,6 1,6 1,0 1,8
SUM Percent 100,0 100,0 100,0 100,0 100,0 100,0 100,0 100,0 100,0 100,0 100,0 Mean 4,3 4,4 4,2 4,5 4,0 4,3 4,2 4,3 4,4 4,3 4,1 Top 2: (Very) poor Percent 8,2 5,6 11,1 4,2 14,5 6,3 5,9 7,7 5,9 8,9 11,8 Bottom 2: (Very) good Percent 77,9 80,3 72,7 87,9 70,2 76,6 77,2 79,9 82,5 79,7 72,0 All respondents
Q21_1_2: Attitudes towards payment methods - Suitability for smaller purchases - cash payment in store
TNS Infratest Page 33 Payment_Transparency_Tabs_weighted
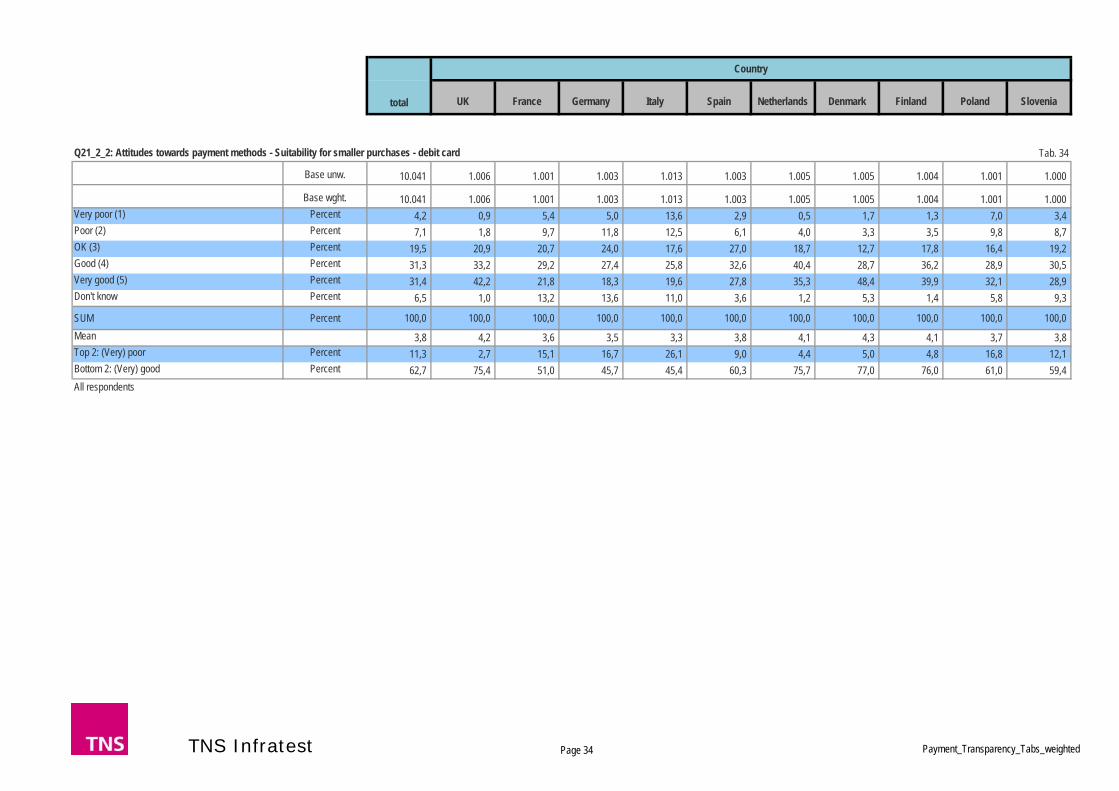
UK France Germany Italy Spain Netherlands Denmark Finland Poland Slovenia
Country
total
Tab. 34
Base unw. 10.041 1.006 1.001 1.003 1.013 1.003 1.005 1.005 1.004 1.001 1.000
Base wght. 10.041 1.006 1.001 1.003 1.013 1.003 1.005 1.005 1.004 1.001 1.000 Very poor (1) Percent 4,2 0,9 5,4 5,0 13,6 2,9 0,5 1,7 1,3 7,0 3,4 Poor (2) Percent 7,1 1,8 9,7 11,8 12,5 6,1 4,0 3,3 3,5 9,8 8,7 OK (3) Percent 19,5 20,9 20,7 24,0 17,6 27,0 18,7 12,7 17,8 16,4 19,2 Good (4) Percent 31,3 33,2 29,2 27,4 25,8 32,6 40,4 28,7 36,2 28,9 30,5 Very good (5) Percent 31,4 42,2 21,8 18,3 19,6 27,8 35,3 48,4 39,9 32,1 28,9 Don't know Percent 6,5 1,0 13,2 13,6 11,0 3,6 1,2 5,3 1,4 5,8 9,3
SUM Percent 100,0 100,0 100,0 100,0 100,0 100,0 100,0 100,0 100,0 100,0 100,0 Mean 3,8 4,2 3,6 3,5 3,3 3,8 4,1 4,3 4,1 3,7 3,8 Top 2: (Very) poor Percent 11,3 2,7 15,1 16,7 26,1 9,0 4,4 5,0 4,8 16,8 12,1 Bottom 2: (Very) good Percent 62,7 75,4 51,0 45,7 45,4 60,3 75,7 77,0 76,0 61,0 59,4 All respondents
Q21_2_2: Attitudes towards payment methods - Suitability for smaller purchases - debit card
TNS Infratest Page 34 Payment_Transparency_Tabs_weighted

UK France Germany Italy Spain Netherlands Denmark Finland Poland Slovenia
Country
total
Tab. 35
Base unw. 10.041 1.006 1.001 1.003 1.013 1.003 1.005 1.005 1.004 1.001 1.000
Base wght. 10.041 1.006 1.001 1.003 1.013 1.003 1.005 1.005 1.004 1.001 1.000 Very poor (1) Percent 10,0 7,1 9,6 6,9 8,5 8,6 14,9 8,6 17,3 10,1 8,0 Poor (2) Percent 16,3 12,8 12,6 20,8 13,5 14,7 22,0 14,0 26,3 12,4 13,8 OK (3) Percent 23,1 25,1 23,1 28,2 23,1 29,4 20,4 17,9 23,3 17,9 22,3 Good (4) Percent 22,3 21,6 25,3 23,1 29,0 24,5 13,5 20,8 17,8 23,4 24,0 Very good (5) Percent 19,5 24,3 23,1 18,4 22,4 17,6 7,2 24,6 9,9 21,8 25,4 Don't know Percent 8,9 9,1 6,4 2,6 3,6 5,2 22,1 14,1 5,4 14,5 6,5
SUM Percent 100,0 100,0 100,0 100,0 100,0 100,0 100,0 100,0 100,0 100,0 100,0 Mean 3,3 3,5 3,4 3,3 3,4 3,3 2,7 3,5 2,8 3,4 3,5 Top 2: (Very) poor Percent 26,2 19,9 22,2 27,7 22,0 23,3 36,9 22,6 43,6 22,5 21,8 Bottom 2: (Very) good Percent 41,8 45,9 48,4 41,5 51,4 42,1 20,7 45,4 27,7 45,1 49,4 All respondents
Q21_3_2: Attitudes towards payment methods - Suitability for smaller purchases - credit card
TNS Infratest Page 35 Payment_Transparency_Tabs_weighted

UK France Germany Italy Spain Netherlands Denmark Finland Poland Slovenia
Country
total
Tab. 36
Base unw. 10.041 1.006 1.001 1.003 1.013 1.003 1.005 1.005 1.004 1.001 1.000
Base wght. 10.041 1.006 1.001 1.003 1.013 1.003 1.005 1.005 1.004 1.001 1.000 Very poor (1) Percent 13,1 12,7 13,6 12,2 18,0 16,8 2,1 16,8 12,9 8,2 17,2 Poor (2) Percent 21,6 18,5 22,6 24,9 22,4 28,9 10,4 19,1 30,6 13,9 24,3 OK (3) Percent 25,2 22,5 23,2 28,1 22,0 27,3 31,4 23,7 29,1 17,6 27,4 Good (4) Percent 19,5 11,0 19,3 19,3 19,6 15,8 34,7 20,2 14,3 26,9 13,4 Very good (5) Percent 13,8 4,7 13,0 14,6 11,9 7,8 18,9 15,7 9,7 31,6 10,6 Don't know Percent 6,9 30,6 8,4 0,9 6,2 3,5 2,5 4,5 3,5 1,7 7,1
SUM Percent 100,0 100,0 100,0 100,0 100,0 100,0 100,0 100,0 100,0 100,0 100,0 Mean 3,0 2,7 2,9 3,0 2,8 2,7 3,6 3,0 2,8 3,6 2,7 Top 2: (Very) poor Percent 34,6 31,2 36,2 37,1 40,4 45,6 12,5 35,9 43,5 22,1 41,5 Bottom 2: (Very) good Percent 33,3 15,7 32,2 33,9 31,5 23,6 53,6 35,9 23,9 58,6 24,0 All respondents
Q21_4_2: Attitudes towards payment methods - Suitability for smaller purchases - credit transfer
TNS Infratest Page 36 Payment_Transparency_Tabs_weighted

UK France Germany Italy Spain Netherlands Denmark Finland Poland Slovenia
Country
total
Tab. 37
Base unw. 10.041 1.006 1.001 1.003 1.013 1.003 1.005 1.005 1.004 1.001 1.000
Base wght. 10.041 1.006 1.001 1.003 1.013 1.003 1.005 1.005 1.004 1.001 1.000 Very poor (1) Percent 9,8 3,8 6,0 13,2 12,7 9,1 3,3 8,3 11,9 9,6 19,9 Poor (2) Percent 12,6 5,4 9,6 16,0 9,6 13,4 10,1 13,4 20,2 12,1 15,8 OK (3) Percent 24,2 24,9 24,5 26,0 21,3 26,5 29,3 23,9 28,5 17,6 19,6 Good (4) Percent 21,3 23,1 26,4 16,6 23,6 23,1 30,4 17,5 15,7 25,8 10,8 Very good (5) Percent 23,3 36,4 26,4 23,2 28,5 22,5 19,6 17,2 16,0 28,6 14,0 Don't know Percent 8,9 6,6 7,0 5,1 4,4 5,4 7,2 19,7 7,8 6,5 19,9
SUM Percent 100,0 100,0 100,0 100,0 100,0 100,0 100,0 100,0 100,0 100,0 100,0 Mean 3,4 3,9 3,6 3,2 3,5 3,4 3,6 3,3 3,0 3,6 2,8 Top 2: (Very) poor Percent 22,3 9,1 15,7 29,2 22,3 22,4 13,4 21,7 32,1 21,7 35,7 Bottom 2: (Very) good Percent 44,5 59,4 52,8 39,7 52,1 45,6 50,1 34,7 31,7 54,3 24,8 All respondents
Q21_5_2: Attitudes towards payment methods - Suitability for smaller purchases - online payment system
TNS Infratest Page 37 Payment_Transparency_Tabs_weighted

UK France Germany Italy Spain Netherlands Denmark Finland Poland Slovenia
Country
total
Tab. 38
Base unw. 10.041 1.006 1.001 1.003 1.013 1.003 1.005 1.005 1.004 1.001 1.000
Base wght. 10.041 1.006 1.001 1.003 1.013 1.003 1.005 1.005 1.004 1.001 1.000 Very low (1) Percent 6,5 10,2 12,2 4,7 9,8 4,0 4,8 7,4 3,8 4,3 4,2 Low (2) Percent 7,7 9,4 9,5 6,4 9,9 4,6 11,0 5,1 7,1 8,3 5,4 OK (3) Percent 20,0 20,2 20,2 17,1 18,3 21,2 33,8 14,4 19,7 21,3 14,1 High (4) Percent 19,7 16,8 17,7 18,9 21,8 19,6 22,0 17,6 20,3 22,8 19,3 Very high (5) Percent 42,3 37,8 30,6 51,5 35,4 48,0 26,8 50,4 47,4 40,8 54,4 Don't know Percent 3,8 5,7 9,9 1,5 4,8 2,5 1,7 5,2 1,7 2,6 2,6
SUM Percent 100,0 100,0 100,0 100,0 100,0 100,0 100,0 100,0 100,0 100,0 100,0 Mean 3,9 3,7 3,5 4,1 3,7 4,1 3,6 4,0 4,0 3,9 4,2 Top 2: (Very) low Percent 14,2 19,5 21,7 11,1 19,7 8,6 15,7 12,4 10,9 12,6 9,6 Bottom 2: (Very) high Percent 62,0 54,7 48,2 70,4 57,2 67,7 48,8 68,0 67,7 63,5 73,7 All respondents
Q22_1_3: Attitudes towards payment methods - Security of payment method - cash payment in store
TNS Infratest Page 38 Payment_Transparency_Tabs_weighted

UK France Germany Italy Spain Netherlands Denmark Finland Poland Slovenia
Country
total
Tab. 39
Base unw. 10.041 1.006 1.001 1.003 1.013 1.003 1.005 1.005 1.004 1.001 1.000
Base wght. 10.041 1.006 1.001 1.003 1.013 1.003 1.005 1.005 1.004 1.001 1.000 Very low (1) Percent 2,9 1,6 5,1 3,4 7,4 2,7 1,0 0,9 1,3 2,9 2,8 Low (2) Percent 7,5 4,8 11,8 7,7 13,7 8,7 4,1 2,7 5,8 8,7 6,8 OK (3) Percent 30,5 31,0 34,6 32,1 29,9 32,5 39,7 22,3 31,6 29,0 21,8 High (4) Percent 33,7 37,8 22,2 27,3 25,7 34,3 37,4 41,1 41,0 34,9 35,2 Very high (5) Percent 17,8 22,4 11,2 14,5 9,6 18,5 16,0 26,9 18,3 17,0 23,5 Don't know Percent 7,7 2,5 15,1 15,1 13,7 3,3 1,9 6,2 2,0 7,5 9,9
SUM Percent 100,0 100,0 100,0 100,0 100,0 100,0 100,0 100,0 100,0 100,0 100,0 Mean 3,6 3,8 3,3 3,5 3,2 3,6 3,6 4,0 3,7 3,6 3,8 Top 2: (Very) low Percent 10,4 6,4 16,9 11,1 21,1 11,4 5,1 3,6 7,1 11,6 9,6 Bottom 2: (Very) high Percent 51,5 60,1 33,3 41,8 35,3 52,8 53,4 68,0 59,4 51,9 58,7 All respondents
Q22_2_3: Attitudes towards payment methods - Security of payment method - debit card
TNS Infratest Page 39 Payment_Transparency_Tabs_weighted

UK France Germany Italy Spain Netherlands Denmark Finland Poland Slovenia
Country
total
Tab. 40
Base unw. 10.041 1.006 1.001 1.003 1.013 1.003 1.005 1.005 1.004 1.001 1.000
Base wght. 10.041 1.006 1.001 1.003 1.013 1.003 1.005 1.005 1.004 1.001 1.000 Very low (1) Percent 3,9 1,9 4,8 2,2 5,5 3,4 6,5 2,1 5,1 3,7 3,8 Low (2) Percent 9,1 4,9 11,9 8,7 12,2 9,3 11,8 3,8 10,2 9,9 8,8 OK (3) Percent 30,5 26,2 37,5 35,9 38,2 33,5 29,1 21,6 30,8 27,1 24,8 High (4) Percent 29,4 32,5 26,1 32,2 27,3 32,6 21,3 31,6 29,9 28,7 32,2 Very high (5) Percent 17,2 25,7 12,2 18,2 13,3 16,3 9,3 22,4 17,5 13,6 23,4 Don't know Percent 9,9 8,9 7,5 2,8 3,5 5,0 22,1 18,5 6,6 17,0 7,0
SUM Percent 100,0 100,0 100,0 100,0 100,0 100,0 100,0 100,0 100,0 100,0 100,0 Mean 3,5 3,8 3,3 3,6 3,3 3,5 3,2 3,8 3,5 3,5 3,7 Top 2: (Very) low Percent 13,0 6,8 16,7 10,9 17,7 12,7 18,2 5,9 15,2 13,6 12,6 Bottom 2: (Very) high Percent 46,6 58,2 38,3 50,4 40,6 48,9 30,6 54,0 47,4 42,3 55,6 All respondents
Q22_3_3: Attitudes towards payment methods - Security of payment method - credit card
TNS Infratest Page 40 Payment_Transparency_Tabs_weighted

UK France Germany Italy Spain Netherlands Denmark Finland Poland Slovenia
Country
total
Tab. 41
Base unw. 10.041 1.006 1.001 1.003 1.013 1.003 1.005 1.005 1.004 1.001 1.000
Base wght. 10.041 1.006 1.001 1.003 1.013 1.003 1.005 1.005 1.004 1.001 1.000 Very low (1) Percent 3,4 3,4 3,2 2,0 6,0 3,4 1,9 6,5 1,9 1,4 4,5 Low (2) Percent 8,2 8,0 9,0 5,0 10,0 9,2 6,0 10,6 8,9 4,9 10,7 OK (3) Percent 27,8 24,5 31,6 24,1 27,1 31,9 41,4 20,8 33,2 20,9 22,4 High (4) Percent 30,3 19,1 26,8 36,7 29,2 30,7 32,3 30,1 31,1 41,2 26,3 Very high (5) Percent 22,7 9,6 20,6 31,5 20,7 21,9 15,9 28,3 20,2 30,2 28,2 Don't know Percent 7,6 35,5 8,8 0,7 7,0 3,0 2,5 3,9 4,8 1,4 7,9
SUM Percent 100,0 100,0 100,0 100,0 100,0 100,0 100,0 100,0 100,0 100,0 100,0 Mean 3,7 3,4 3,6 3,9 3,5 3,6 3,6 3,7 3,6 4,0 3,7 Top 2: (Very) low Percent 11,6 11,4 12,2 7,0 16,0 12,6 7,9 17,0 10,8 6,3 15,2 Bottom 2: (Very) high Percent 53,0 28,7 47,4 68,2 49,9 52,6 48,2 58,3 51,3 71,4 54,5 All respondents
Q22_4_3: Attitudes towards payment methods - Security of payment method - credit transfer
TNS Infratest Page 41 Payment_Transparency_Tabs_weighted

UK France Germany Italy Spain Netherlands Denmark Finland Poland Slovenia
Country
total
Tab. 42
Base unw. 10.041 1.006 1.001 1.003 1.013 1.003 1.005 1.005 1.004 1.001 1.000
Base wght. 10.041 1.006 1.001 1.003 1.013 1.003 1.005 1.005 1.004 1.001 1.000 Very low (1) Percent 6,2 1,8 5,0 4,1 8,8 8,5 2,7 3,6 3,8 5,5 18,4 Low (2) Percent 10,5 3,6 14,7 9,4 9,3 16,3 8,5 8,7 10,0 8,1 16,9 OK (3) Percent 31,5 27,4 36,7 33,2 35,4 26,9 44,3 28,9 35,3 28,9 18,4 High (4) Percent 25,3 31,9 22,5 27,1 24,4 26,7 24,6 23,2 23,9 33,1 15,4 Very high (5) Percent 17,2 27,7 16,5 20,1 16,8 17,8 11,7 13,6 17,2 17,6 12,7 Don't know Percent 9,3 7,6 4,6 6,2 5,3 3,9 8,2 22,1 9,8 6,9 18,2
SUM Percent 100,0 100,0 100,0 100,0 100,0 100,0 100,0 100,0 100,0 100,0 100,0 Mean 3,4 3,9 3,3 3,5 3,3 3,3 3,4 3,4 3,5 3,5 2,8 Top 2: (Very) low Percent 16,8 5,4 19,7 13,5 18,1 24,8 11,2 12,2 13,8 13,6 35,3 Bottom 2: (Very) high Percent 42,5 59,6 39,0 47,2 41,2 44,5 36,3 36,8 41,2 50,7 28,1 All respondents
Q22_5_3: Attitudes towards payment methods - Security of payment method - online payment system
TNS Infratest Page 42 Payment_Transparency_Tabs_weighted
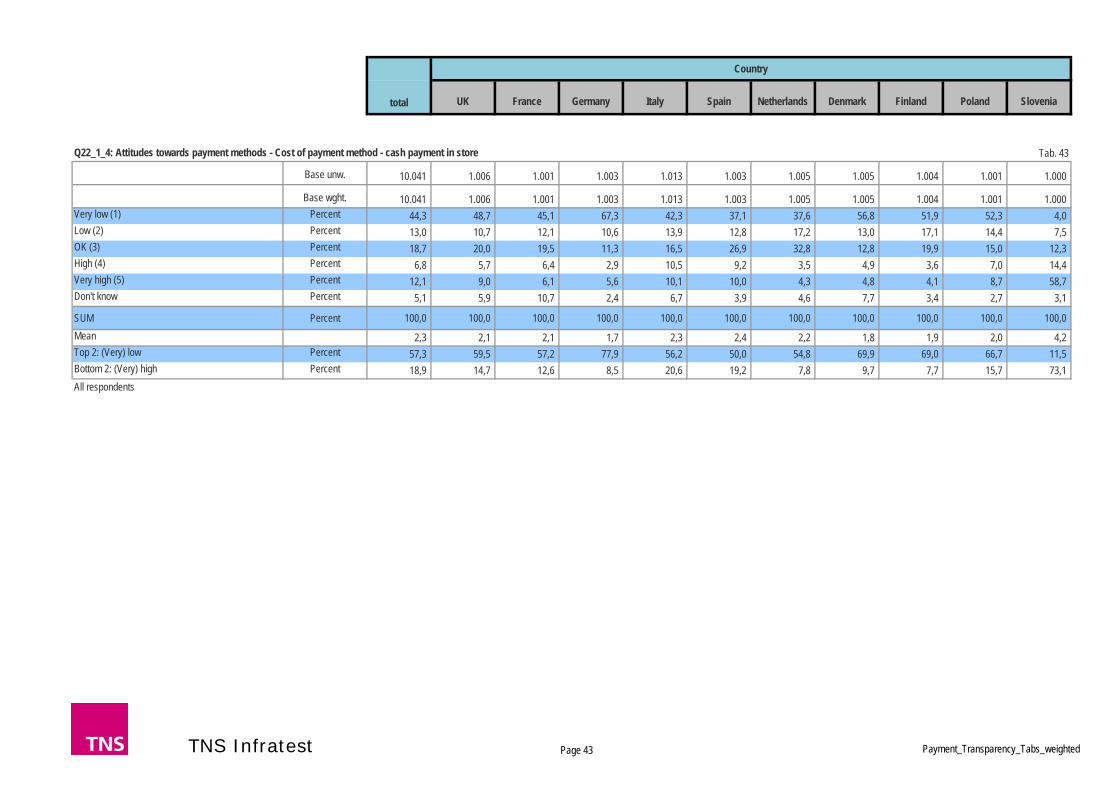
UK France Germany Italy Spain Netherlands Denmark Finland Poland Slovenia
Country
total
Tab. 43
Base unw. 10.041 1.006 1.001 1.003 1.013 1.003 1.005 1.005 1.004 1.001 1.000
Base wght. 10.041 1.006 1.001 1.003 1.013 1.003 1.005 1.005 1.004 1.001 1.000 Very low (1) Percent 44,3 48,7 45,1 67,3 42,3 37,1 37,6 56,8 51,9 52,3 4,0 Low (2) Percent 13,0 10,7 12,1 10,6 13,9 12,8 17,2 13,0 17,1 14,4 7,5 OK (3) Percent 18,7 20,0 19,5 11,3 16,5 26,9 32,8 12,8 19,9 15,0 12,3 High (4) Percent 6,8 5,7 6,4 2,9 10,5 9,2 3,5 4,9 3,6 7,0 14,4 Very high (5) Percent 12,1 9,0 6,1 5,6 10,1 10,0 4,3 4,8 4,1 8,7 58,7 Don't know Percent 5,1 5,9 10,7 2,4 6,7 3,9 4,6 7,7 3,4 2,7 3,1
SUM Percent 100,0 100,0 100,0 100,0 100,0 100,0 100,0 100,0 100,0 100,0 100,0 Mean 2,3 2,1 2,1 1,7 2,3 2,4 2,2 1,8 1,9 2,0 4,2 Top 2: (Very) low Percent 57,3 59,5 57,2 77,9 56,2 50,0 54,8 69,9 69,0 66,7 11,5 Bottom 2: (Very) high Percent 18,9 14,7 12,6 8,5 20,6 19,2 7,8 9,7 7,7 15,7 73,1 All respondents
Q22_1_4: Attitudes towards payment methods - Cost of payment method - cash payment in store
TNS Infratest Page 43 Payment_Transparency_Tabs_weighted

UK France Germany Italy Spain Netherlands Denmark Finland Poland Slovenia
Country
total
Tab. 44
Base unw. 10.041 1.006 1.001 1.003 1.013 1.003 1.005 1.005 1.004 1.001 1.000
Base wght. 10.041 1.006 1.001 1.003 1.013 1.003 1.005 1.005 1.004 1.001 1.000 Very low (1) Percent 16,5 29,6 14,6 25,0 16,5 14,3 11,7 16,0 14,3 19,6 3,6 Low (2) Percent 18,3 16,4 15,6 19,0 16,6 17,3 18,1 21,7 26,0 21,2 10,7 OK (3) Percent 34,3 32,8 31,7 27,2 29,9 40,4 46,5 36,7 43,2 29,0 24,9 High (4) Percent 15,0 10,4 15,5 9,0 14,9 16,9 14,8 12,3 9,7 15,6 30,6 Very high (5) Percent 6,9 7,5 6,4 3,3 5,3 7,1 4,6 5,2 3,3 7,0 19,6 Don't know Percent 9,1 3,3 16,1 16,4 16,7 4,0 4,3 8,1 3,6 7,7 10,6
SUM Percent 100,0 100,0 100,0 100,0 100,0 100,0 100,0 100,0 100,0 100,0 100,0 Mean 2,8 2,5 2,8 2,4 2,7 2,8 2,8 2,7 2,6 2,7 3,6 Top 2: (Very) low Percent 34,8 46,0 30,2 44,1 33,1 31,5 29,8 37,7 40,2 40,8 14,3 Bottom 2: (Very) high Percent 21,9 17,9 22,0 12,3 20,2 24,0 19,4 17,5 13,0 22,6 50,2 All respondents
Q22_2_4: Attitudes towards payment methods - Cost of payment method - debit card
TNS Infratest Page 44 Payment_Transparency_Tabs_weighted

UK France Germany Italy Spain Netherlands Denmark Finland Poland Slovenia
Country
total
Tab. 45
Base unw. 10.041 1.006 1.001 1.003 1.013 1.003 1.005 1.005 1.004 1.001 1.000
Base wght. 10.041 1.006 1.001 1.003 1.013 1.003 1.005 1.005 1.004 1.001 1.000 Very low (1) Percent 10,2 10,7 13,6 20,4 14,5 9,1 4,1 7,4 4,2 11,6 6,1 Low (2) Percent 12,4 10,0 12,9 17,6 13,9 11,8 6,6 11,6 10,0 12,7 17,2 OK (3) Percent 30,5 31,5 31,4 34,2 34,5 34,8 24,2 31,0 31,7 26,4 25,2 High (4) Percent 22,5 23,7 20,5 18,1 23,3 23,5 25,2 19,5 27,9 19,9 23,3 Very high (5) Percent 12,7 13,1 11,9 6,3 8,3 14,4 16,2 10,2 17,2 11,1 18,8 Don't know Percent 11,7 11,0 9,8 3,5 5,4 6,5 23,8 20,4 9,1 18,3 9,4
SUM Percent 100,0 100,0 100,0 100,0 100,0 100,0 100,0 100,0 100,0 100,0 100,0 Mean 3,2 3,2 3,0 2,7 3,0 3,2 3,6 3,2 3,5 3,1 3,3 Top 2: (Very) low Percent 22,6 20,8 26,5 38,0 28,5 20,9 10,7 19,0 14,2 24,3 23,3 Bottom 2: (Very) high Percent 35,2 36,8 32,4 24,3 31,6 37,9 41,4 29,7 45,1 31,1 42,1 All respondents
Q22_3_4: Attitudes towards payment methods - Cost of payment method - credit card
TNS Infratest Page 45 Payment_Transparency_Tabs_weighted

UK France Germany Italy Spain Netherlands Denmark Finland Poland Slovenia
Country
total
Tab. 46
Base unw. 10.041 1.006 1.001 1.003 1.013 1.003 1.005 1.005 1.004 1.001 1.000
Base wght. 10.041 1.006 1.001 1.003 1.013 1.003 1.005 1.005 1.004 1.001 1.000 Very low (1) Percent 16,9 8,5 13,6 37,4 13,5 9,8 16,7 19,4 10,4 26,2 13,3 Low (2) Percent 19,5 11,5 15,3 23,4 17,4 13,2 17,7 19,4 22,5 23,3 31,1 OK (3) Percent 30,7 25,3 29,2 26,8 32,8 29,2 46,5 31,7 34,5 28,4 22,2 High (4) Percent 16,2 10,4 21,6 8,0 20,0 28,2 9,6 14,2 18,5 15,1 16,0 Very high (5) Percent 7,2 5,7 8,7 3,3 8,6 15,6 2,8 8,0 5,9 5,7 7,4 Don't know Percent 9,7 38,8 11,5 1,1 7,8 3,9 6,6 7,3 8,3 1,4 10,0
SUM Percent 100,0 100,0 100,0 100,0 100,0 100,0 100,0 100,0 100,0 100,0 100,0 Mean 2,7 2,9 3,0 2,2 2,9 3,3 2,6 2,7 2,9 2,5 2,7 Top 2: (Very) low Percent 36,3 19,9 28,9 60,8 30,9 23,0 34,5 38,8 32,9 49,5 44,4 Bottom 2: (Very) high Percent 23,3 16,1 30,3 11,3 28,6 43,9 12,5 22,2 24,4 20,8 23,4 All respondents
Q22_4_4: Attitudes towards payment methods - Cost of payment method - credit transfer
TNS Infratest Page 46 Payment_Transparency_Tabs_weighted

UK France Germany Italy Spain Netherlands Denmark Finland Poland Slovenia
Country
total
Tab. 47
Base unw. 10.041 1.006 1.001 1.003 1.013 1.003 1.005 1.005 1.004 1.001 1.000
Base wght. 10.041 1.006 1.001 1.003 1.013 1.003 1.005 1.005 1.004 1.001 1.000 Very low (1) Percent 17,5 20,6 21,7 27,6 18,7 15,2 10,8 8,1 11,7 28,6 12,0 Low (2) Percent 16,2 13,7 13,4 19,3 16,4 17,0 16,2 13,3 19,3 22,0 11,5 OK (3) Percent 34,5 35,2 36,5 31,2 37,5 38,3 43,6 37,2 37,4 29,3 18,8 High (4) Percent 11,2 9,4 11,6 7,7 13,1 14,5 10,7 10,0 13,1 6,7 14,8 Very high (5) Percent 6,9 7,0 5,8 4,9 6,9 8,0 4,4 4,3 3,1 5,8 18,6 Don't know Percent 13,7 14,1 11,0 9,3 7,4 7,0 14,3 27,2 15,3 7,6 24,3
SUM Percent 100,0 100,0 100,0 100,0 100,0 100,0 100,0 100,0 100,0 100,0 100,0 Mean 2,7 2,6 2,6 2,4 2,7 2,8 2,8 2,8 2,7 2,3 3,2 Top 2: (Very) low Percent 33,7 34,3 35,1 47,0 35,1 32,2 27,0 21,4 31,1 50,6 23,5 Bottom 2: (Very) high Percent 18,0 16,4 17,5 12,6 20,0 22,5 15,1 14,2 16,2 12,5 33,4 All respondents
Q22_5_4: Attitudes towards payment methods - Cost of payment method - online payment system
TNS Infratest Page 47 Payment_Transparency_Tabs_weighted
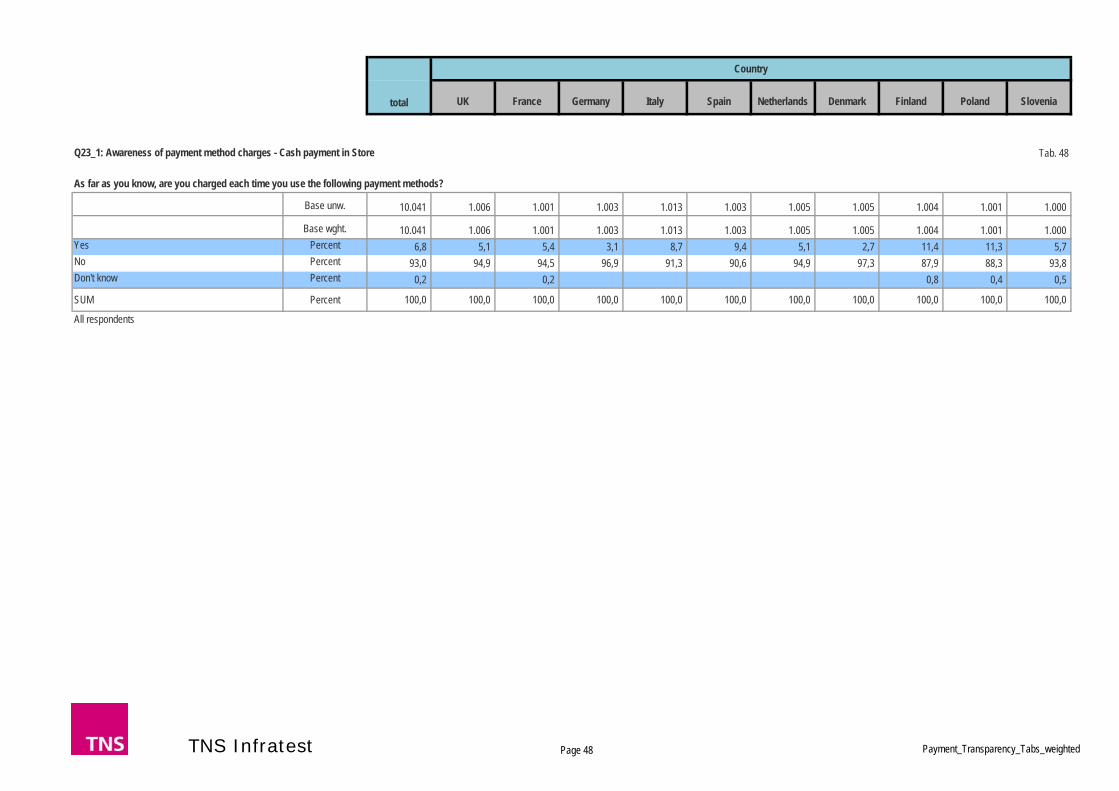
UK France Germany Italy Spain Netherlands Denmark Finland Poland Slovenia
Country
total
Tab. 48
Base unw. 10.041 1.006 1.001 1.003 1.013 1.003 1.005 1.005 1.004 1.001 1.000
Base wght. 10.041 1.006 1.001 1.003 1.013 1.003 1.005 1.005 1.004 1.001 1.000 Yes Percent 6,8 5,1 5,4 3,1 8,7 9,4 5,1 2,7 11,4 11,3 5,7 No Percent 93,0 94,9 94,5 96,9 91,3 90,6 94,9 97,3 87,9 88,3 93,8 Don't know Percent 0,2 0,2 0,8 0,4 0,5
SUM Percent 100,0 100,0 100,0 100,0 100,0 100,0 100,0 100,0 100,0 100,0 100,0
All respondents
Q23_1: Awareness of payment method charges - Cash payment in Store
As far as you know, are you charged each time you use the following payment methods?
TNS Infratest Page 48 Payment_Transparency_Tabs_weighted

UK France Germany Italy Spain Netherlands Denmark Finland Poland Slovenia
Country
total
Tab. 49
Base unw. 8.804 991 683 806 740 873 998 975 970 902 866
Base wght. 8.800 991 680 806 739 872 998 975 970 902 866 Yes Percent 25,5 9,7 29,0 20,3 25,6 24,5 27,3 24,6 22,9 37,1 36,6 No Percent 74,2 90,3 70,9 79,0 74,3 75,5 72,7 75,2 76,3 62,4 62,7 Don't know Percent 0,3 0,1 0,6 0,1 0,2 0,8 0,6 0,7
SUM Percent 100,0 100,0 100,0 100,0 100,0 100,0 100,0 100,0 100,0 100,0 100,0
Respondents with debit card in Q6
Q23_2: Awareness of payment method charges - Debit cards
As far as you know, are you charged each time you use the following payment methods?
TNS Infratest Page 49 Payment_Transparency_Tabs_weighted

UK France Germany Italy Spain Netherlands Denmark Finland Poland Slovenia
Country
total
Tab. 50
Base unw. 6.217 717 480 876 789 653 483 472 657 516 574
Base wght. 6.211 716 482 876 788 653 476 472 658 516 574 Yes Percent 43,0 38,4 33,5 30,8 43,1 39,9 59,0 58,9 44,6 48,8 45,5 No Percent 56,7 61,5 66,5 68,8 56,9 59,7 41,1 41,1 54,4 51,2 53,8 Don't know Percent 0,3 0,1 0,3 0,4 1,1 0,7
SUM Percent 100,0 100,0 100,0 100,0 100,0 100,0 100,0 100,0 100,0 100,0 100,0
Respondents with credit card in Q6
Q23_3: Awareness of payment method charges - Credit cards
As far as you know, are you charged each time you use the following payment methods?
TNS Infratest Page 50 Payment_Transparency_Tabs_weighted

UK France Germany Italy Spain Netherlands Denmark Finland Poland Slovenia
Country
total
Tab. 51
Base unw. 2.595 719 847 59 677 137 17 108 2 11 18
Base wght. 2.577 718 830 59 675 138 17 108 2 11 18 Yes Percent 22,7 10,7 18,3 34,0 30,8 33,8 56,4 55,6 49,9 36,5 33,3 No Percent 77,2 89,0 81,7 66,0 69,1 66,2 43,7 44,4 50,1 63,5 66,7 Don't know Percent 0,1 0,3 0,2
SUM Percent 100,0 100,0 100,0 100,0 100,0 100,0 100,0 100,0 100,0 100,0 100,0
Respondents with chequebook in Q6
Q23_4: Awareness of payment method charges - Cheques
As far as you know, are you charged each time you use the following payment methods?
TNS Infratest Page 51 Payment_Transparency_Tabs_weighted

UK France Germany Italy Spain Netherlands Denmark Finland Poland Slovenia
Country
total
Tab. 52
Base unw. 1.657 213 81 485 60 54 151 159 219 185 50
Base wght. 1.663 213 87 485 60 53 152 159 219 185 50 Yes Percent 29,5 11,8 46,9 15,9 50,2 37,0 20,1 44,0 27,0 55,6 72,0 No Percent 70,1 88,2 53,1 83,9 49,8 63,0 79,9 56,0 71,2 43,8 28,0 Don't know Percent 0,4 0,2 1,8 0,5
SUM Percent 100,0 100,0 100,0 100,0 100,0 100,0 100,0 100,0 100,0 100,0 100,0
Respondents who use direct debit in Q16
Q23_5: Awareness of payment method charges - Direct debit
As far as you know, are you charged each time you use the following payment methods?
TNS Infratest Page 52 Payment_Transparency_Tabs_weighted
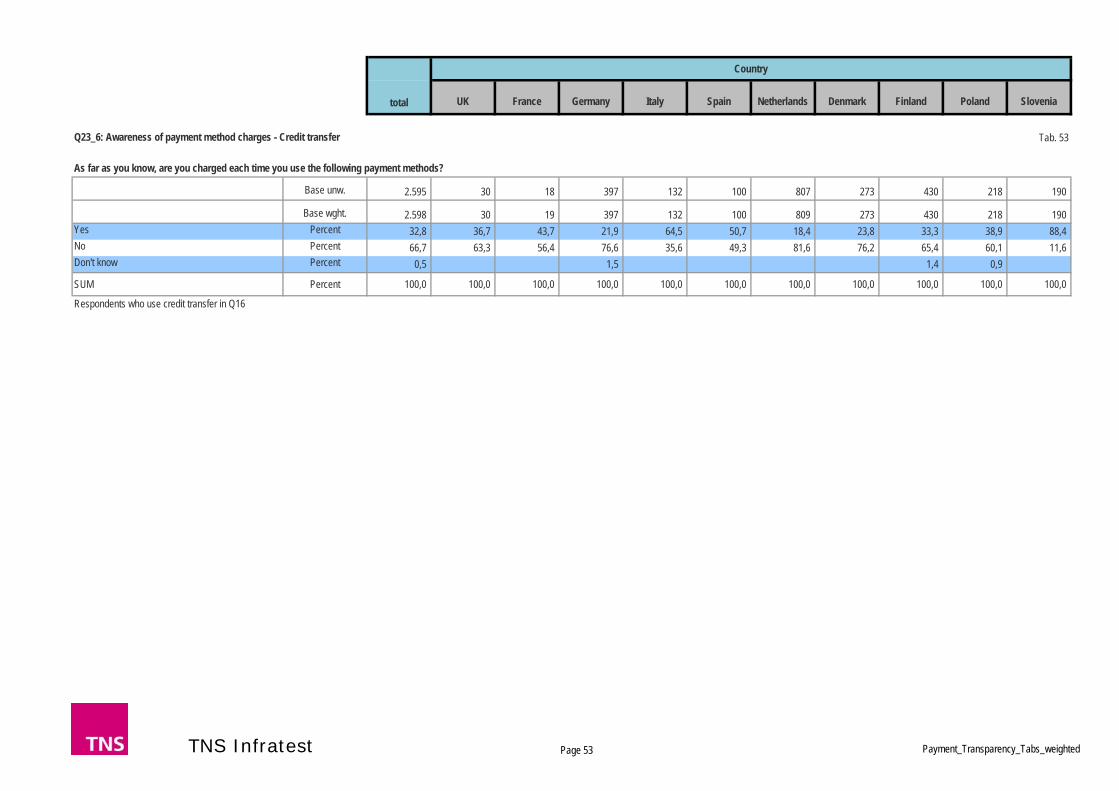
UK France Germany Italy Spain Netherlands Denmark Finland Poland Slovenia
Country
total
Tab. 53
Base unw. 2.595 30 18 397 132 100 807 273 430 218 190
Base wght. 2.598 30 19 397 132 100 809 273 430 218 190 Yes Percent 32,8 36,7 43,7 21,9 64,5 50,7 18,4 23,8 33,3 38,9 88,4 No Percent 66,7 63,3 56,4 76,6 35,6 49,3 81,6 76,2 65,4 60,1 11,6 Don't know Percent 0,5 1,5 1,4 0,9
SUM Percent 100,0 100,0 100,0 100,0 100,0 100,0 100,0 100,0 100,0 100,0 100,0
Respondents who use credit transfer in Q16
Q23_6: Awareness of payment method charges - Credit transfer
As far as you know, are you charged each time you use the following payment methods?
TNS Infratest Page 53 Payment_Transparency_Tabs_weighted
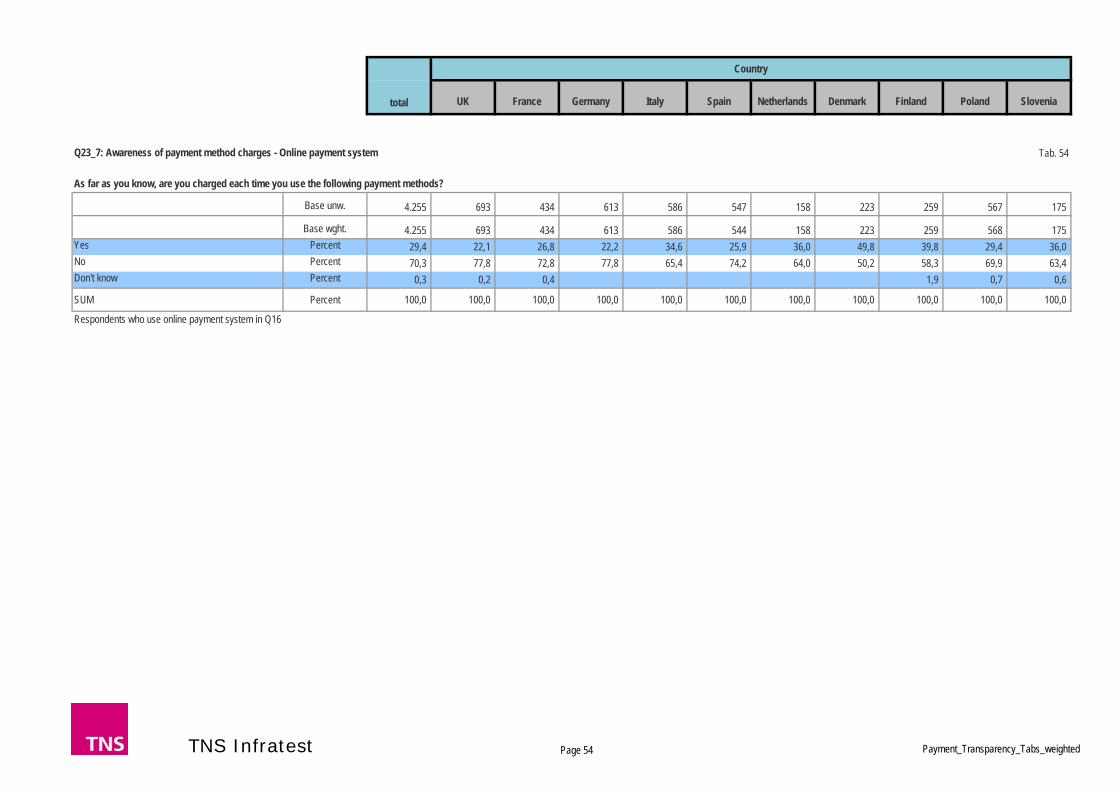
UK France Germany Italy Spain Netherlands Denmark Finland Poland Slovenia
Country
total
Tab. 54
Base unw. 4.255 693 434 613 586 547 158 223 259 567 175
Base wght. 4.255 693 434 613 586 544 158 223 259 568 175 Yes Percent 29,4 22,1 26,8 22,2 34,6 25,9 36,0 49,8 39,8 29,4 36,0 No Percent 70,3 77,8 72,8 77,8 65,4 74,2 64,0 50,2 58,3 69,9 63,4 Don't know Percent 0,3 0,2 0,4 1,9 0,7 0,6
SUM Percent 100,0 100,0 100,0 100,0 100,0 100,0 100,0 100,0 100,0 100,0 100,0
Respondents who use online payment system in Q16
Q23_7: Awareness of payment method charges - Online payment system
As far as you know, are you charged each time you use the following payment methods?
TNS Infratest Page 54 Payment_Transparency_Tabs_weighted

UK France Germany Italy Spain Netherlands Denmark Finland Poland Slovenia
Country
total
Tab. 55
Base unw. 1.392 41 38 57 143 163 55 36 203 247 409
Base wght. 1.391 41 38 57 143 162 55 36 203 247 409 Yes Percent 61,7 29,2 58,9 64,9 58,8 68,5 31,1 25,0 80,3 56,7 64,3 No Percent 38,1 70,8 41,1 33,3 41,2 31,5 68,9 75,0 18,7 43,3 35,7 Don't know Percent 0,2 1,8 1,0
SUM Percent 100,0 100,0 100,0 100,0 100,0 100,0 100,0 100,0 100,0 100,0 100,0
Respondents who use cash on delivery in Q16
Q23_8: Awareness of payment method charges - Cash on delivery
As far as you know, are you charged each time you use the following payment methods?
TNS Infratest Page 55 Payment_Transparency_Tabs_weighted

UK France Germany Italy Spain Netherlands Denmark Finland Poland Slovenia
Country
total
Tab. 56
Base unw. 676 51 51 31 88 94 50 27 114 113 57
Base wght. 681 51 54 31 88 94 51 27 114 113 57 Less than 1.0% (0,5) Percent 39,2 33,3 32,7 22,6 24,0 44,2 28,5 22,2 56,2 40,0 57,9 Between 1.0 and below 1.5% (1,25) Percent 9,5 5,9 18,2 9,7 6,8 6,3 9,7 14,8 6,2 15,0 7,0 Between 1.5 and below 2.0% (1,75) Percent 9,5 15,7 6,5 16,2 19,2 10,6 10,0 7,4 3,5 6,1 5,3 Between 2.0 and below 2.5% (2,25) Percent 5,4 5,9 5,0 19,4 10,2 7,2 6,2 1,8 3,6 Between 2.5 and below 3.0% (2,75) Percent 4,7 11,7 6,7 6,9 4,3 3,9 2,6 5,3 1,8 More than 3% (3,5) Percent 6,5 7,9 1,9 6,4 11,5 5,3 10,1 2,7 9,8 5,3 Don't know Percent 25,2 19,7 28,9 25,8 21,5 22,2 31,6 55,6 27,2 20,3 22,8
SUM Percent 100,0 100,0 100,0 100,0 100,0 100,0 100,0 100,0 100,0 100,0 100,0 Mean 1,28 1,55 1,22 1,59 1,73 1,22 1,52 0,96 0,86 1,33 0,91 Top 2: Below 1.5% Percent 48,7 39,1 50,9 32,3 30,8 50,5 38,2 37,0 62,3 54,9 64,9 Bottom 2: 2.5% or more Percent 11,2 19,6 8,6 6,4 18,3 9,6 14,0 5,3 15,1 7,0 Respondents with cost awareness in Q23_1
Q24_1: Cost estimates - Cash payment in StoreHow much do you think you pay for using the following payment method(s)?
TNS Infratest Page 56 Payment_Transparency_Tabs_weighted
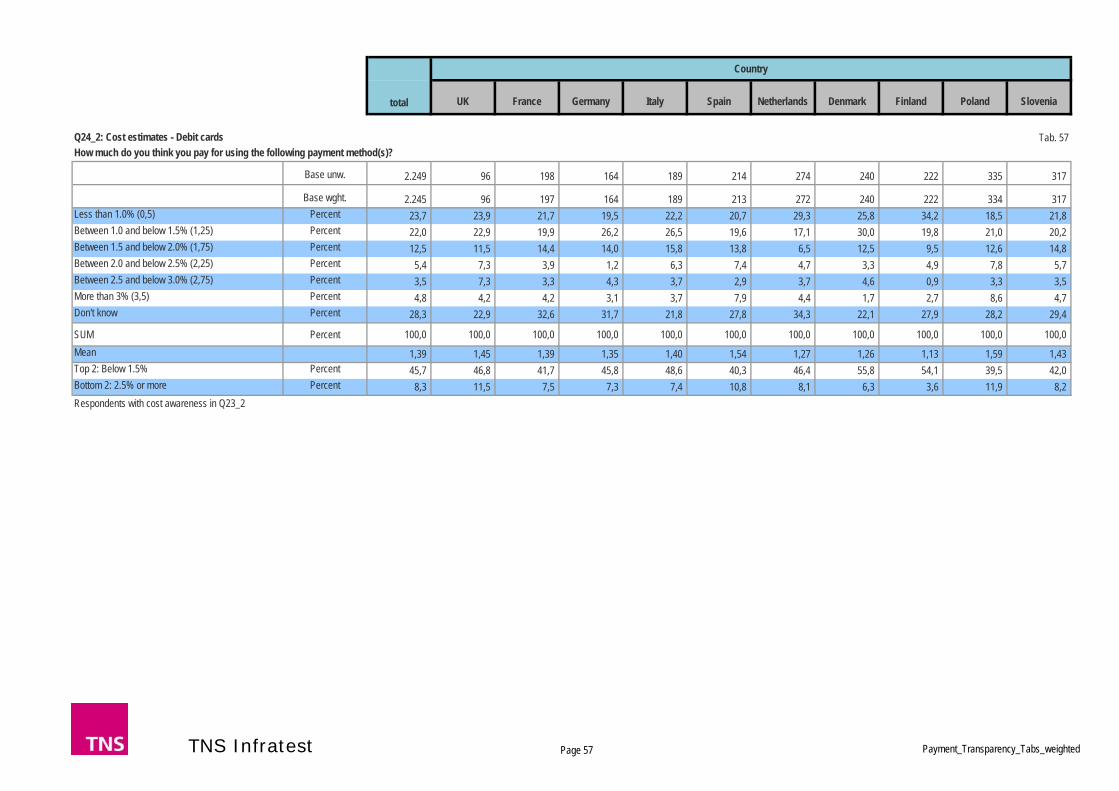
UK France Germany Italy Spain Netherlands Denmark Finland Poland Slovenia
Country
total
Tab. 57
Base unw. 2.249 96 198 164 189 214 274 240 222 335 317
Base wght. 2.245 96 197 164 189 213 272 240 222 334 317 Less than 1.0% (0,5) Percent 23,7 23,9 21,7 19,5 22,2 20,7 29,3 25,8 34,2 18,5 21,8 Between 1.0 and below 1.5% (1,25) Percent 22,0 22,9 19,9 26,2 26,5 19,6 17,1 30,0 19,8 21,0 20,2 Between 1.5 and below 2.0% (1,75) Percent 12,5 11,5 14,4 14,0 15,8 13,8 6,5 12,5 9,5 12,6 14,8 Between 2.0 and below 2.5% (2,25) Percent 5,4 7,3 3,9 1,2 6,3 7,4 4,7 3,3 4,9 7,8 5,7 Between 2.5 and below 3.0% (2,75) Percent 3,5 7,3 3,3 4,3 3,7 2,9 3,7 4,6 0,9 3,3 3,5 More than 3% (3,5) Percent 4,8 4,2 4,2 3,1 3,7 7,9 4,4 1,7 2,7 8,6 4,7 Don't know Percent 28,3 22,9 32,6 31,7 21,8 27,8 34,3 22,1 27,9 28,2 29,4
SUM Percent 100,0 100,0 100,0 100,0 100,0 100,0 100,0 100,0 100,0 100,0 100,0 Mean 1,39 1,45 1,39 1,35 1,40 1,54 1,27 1,26 1,13 1,59 1,43 Top 2: Below 1.5% Percent 45,7 46,8 41,7 45,8 48,6 40,3 46,4 55,8 54,1 39,5 42,0 Bottom 2: 2.5% or more Percent 8,3 11,5 7,5 7,3 7,4 10,8 8,1 6,3 3,6 11,9 8,2 Respondents with cost awareness in Q23_2
Q24_2: Cost estimates - Debit cardsHow much do you think you pay for using the following payment method(s)?
TNS Infratest Page 57 Payment_Transparency_Tabs_weighted

UK France Germany Italy Spain Netherlands Denmark Finland Poland Slovenia
Country
total
Tab. 58
Base unw. 2.673 275 160 270 339 261 284 278 293 252 261
Base wght. 2.671 275 162 270 339 260 281 278 293 252 261 Less than 1.0% (0,5) Percent 14,4 8,4 18,6 13,3 18,5 10,0 13,1 18,0 13,3 11,9 19,5 Between 1.0 and below 1.5% (1,25) Percent 20,7 21,0 19,6 26,3 25,7 13,6 13,6 33,5 18,4 16,3 16,5 Between 1.5 and below 2.0% (1,75) Percent 17,1 19,3 16,2 15,2 16,9 13,9 13,8 20,1 19,5 18,3 17,6 Between 2.0 and below 2.5% (2,25) Percent 8,5 16,4 4,4 6,7 6,8 8,6 9,8 3,2 10,2 9,1 8,1 Between 2.5 and below 3.0% (2,75) Percent 6,2 5,8 3,3 8,5 4,7 9,5 5,0 3,2 5,1 7,9 8,8 More than 3% (3,5) Percent 8,5 7,7 10,2 5,2 5,0 12,8 15,8 4,0 9,2 9,9 6,9 Don't know Percent 24,6 21,4 27,6 24,8 22,5 31,6 28,8 18,0 24,2 26,6 22,6
SUM Percent 100,0 100,0 100,0 100,0 100,0 100,0 100,0 100,0 100,0 100,0 100,0 Mean 1,71 1,83 1,62 1,63 1,50 2,00 1,95 1,42 1,76 1,84 1,65 Top 2: Below 1.5% Percent 35,1 29,4 38,1 39,7 44,1 23,6 26,8 51,4 31,7 28,2 36,0 Bottom 2: 2.5% or more Percent 14,7 13,5 13,6 13,7 9,7 22,3 20,8 7,2 14,3 17,9 15,7 Respondents with cost awareness in Q23_3
Q24_3: Cost estimates - Credit cardsHow much do you think you pay for using the following payment method(s)?
TNS Infratest Page 58 Payment_Transparency_Tabs_weighted
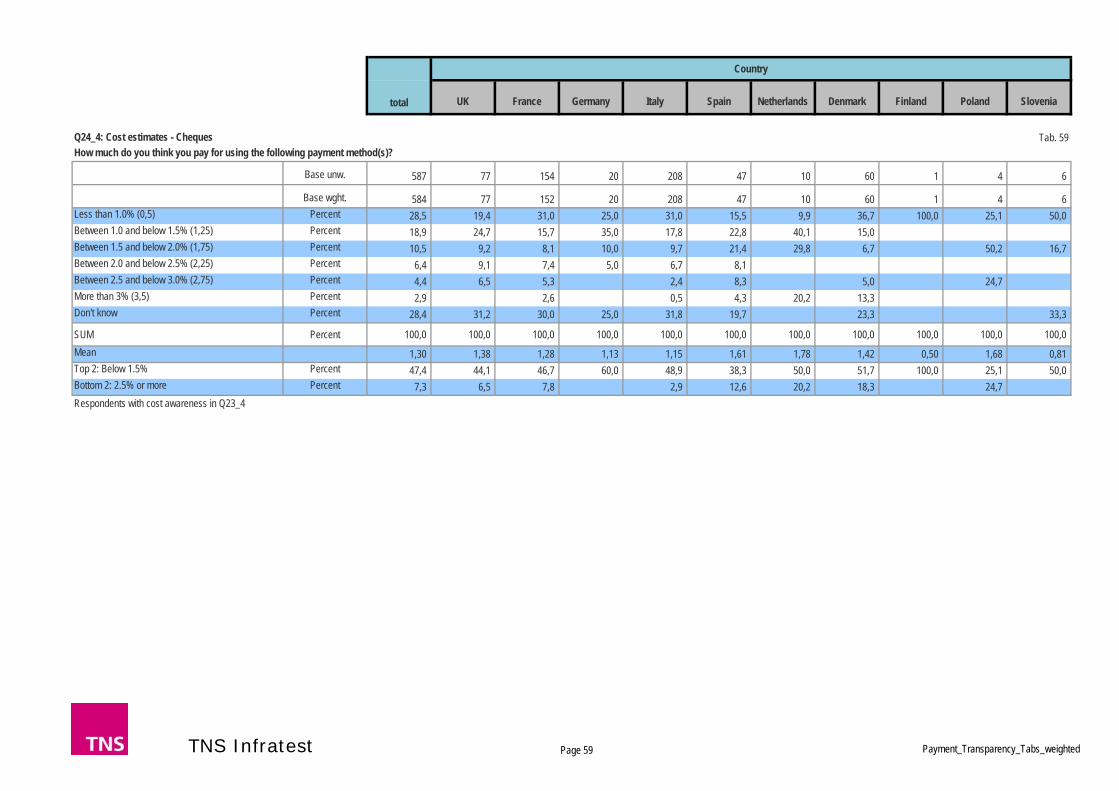
UK France Germany Italy Spain Netherlands Denmark Finland Poland Slovenia
Country
total
Tab. 59
Base unw. 587 77 154 20 208 47 10 60 1 4 6
Base wght. 584 77 152 20 208 47 10 60 1 4 6 Less than 1.0% (0,5) Percent 28,5 19,4 31,0 25,0 31,0 15,5 9,9 36,7 100,0 25,1 50,0 Between 1.0 and below 1.5% (1,25) Percent 18,9 24,7 15,7 35,0 17,8 22,8 40,1 15,0 Between 1.5 and below 2.0% (1,75) Percent 10,5 9,2 8,1 10,0 9,7 21,4 29,8 6,7 50,2 16,7 Between 2.0 and below 2.5% (2,25) Percent 6,4 9,1 7,4 5,0 6,7 8,1 Between 2.5 and below 3.0% (2,75) Percent 4,4 6,5 5,3 2,4 8,3 5,0 24,7 More than 3% (3,5) Percent 2,9 2,6 0,5 4,3 20,2 13,3 Don't know Percent 28,4 31,2 30,0 25,0 31,8 19,7 23,3 33,3
SUM Percent 100,0 100,0 100,0 100,0 100,0 100,0 100,0 100,0 100,0 100,0 100,0 Mean 1,30 1,38 1,28 1,13 1,15 1,61 1,78 1,42 0,50 1,68 0,81 Top 2: Below 1.5% Percent 47,4 44,1 46,7 60,0 48,9 38,3 50,0 51,7 100,0 25,1 50,0 Bottom 2: 2.5% or more Percent 7,3 6,5 7,8 2,9 12,6 20,2 18,3 24,7 Respondents with cost awareness in Q23_4
Q24_4: Cost estimates - ChequesHow much do you think you pay for using the following payment method(s)?
TNS Infratest Page 59 Payment_Transparency_Tabs_weighted

UK France Germany Italy Spain Netherlands Denmark Finland Poland Slovenia
Country
total
Tab. 60
Base unw. 488 25 38 77 30 20 30 70 59 103 36
Base wght. 491 25 41 77 30 20 31 70 59 103 36 Less than 1.0% (0,5) Percent 31,7 28,0 16,7 45,5 29,9 30,4 19,2 30,0 30,5 33,0 36,1 Between 1.0 and below 1.5% (1,25) Percent 19,7 32,0 24,7 14,3 20,0 24,9 28,1 14,3 17,0 20,5 19,5 Between 1.5 and below 2.0% (1,75) Percent 9,3 3,9 4,6 7,8 23,6 14,8 10,0 10,2 12,6 2,8 Between 2.0 and below 2.5% (2,25) Percent 6,2 8,0 6,8 6,5 9,9 14,9 9,6 4,3 1,7 7,8 Between 2.5 and below 3.0% (2,75) Percent 2,6 4,7 6,8 3,2 2,9 1,7 3,9 2,8 More than 3% (3,5) Percent 2,4 4,0 2,1 1,3 4,8 2,9 1,7 3,8 2,8 Don't know Percent 28,0 24,1 40,4 24,7 9,9 10,2 39,9 35,7 37,3 18,5 36,2
SUM Percent 100,0 100,0 100,0 100,0 100,0 100,0 100,0 100,0 100,0 100,0 100,0 Mean 1,20 1,22 1,39 0,97 1,35 1,37 1,25 1,21 1,09 1,30 1,01 Top 2: Below 1.5% Percent 51,4 60,0 41,4 59,8 49,9 55,3 47,3 44,3 47,5 53,4 55,5 Bottom 2: 2.5% or more Percent 5,0 4,0 6,8 1,3 6,8 4,8 3,2 5,7 3,4 7,7 5,6 Respondents with cost awareness in Q23_5
Q24_5: Cost estimates - Direct debitHow much do you think you pay for using the following payment method(s)?
TNS Infratest Page 60 Payment_Transparency_Tabs_weighted

UK France Germany Italy Spain Netherlands Denmark Finland Poland Slovenia
Country
total
Tab. 61
Base unw. 850 11 8 87 85 51 147 65 143 85 168
Base wght. 852 11 8 87 85 51 148 65 143 85 168 Less than 1.0% (0,5) Percent 29,5 9,1 28,7 29,4 25,5 28,5 35,4 25,8 33,9 33,3 Between 1.0 and below 1.5% (1,25) Percent 22,4 36,3 35,3 19,5 22,4 30,0 26,0 20,0 13,3 16,5 28,6 Between 1.5 and below 2.0% (1,75) Percent 8,9 36,4 11,5 7,0 13,4 6,0 4,6 11,2 9,5 7,7 Between 2.0 and below 2.5% (2,25) Percent 6,2 9,1 22,2 3,5 11,8 3,9 5,4 1,5 4,9 8,3 7,2 Between 2.5 and below 3.0% (2,75) Percent 1,9 9,1 3,5 2,3 1,9 2,0 1,4 2,4 More than 3% (3,5) Percent 3,2 2,3 2,3 5,7 3,7 3,1 2,8 5,9 2,4 Don't know Percent 27,9 42,5 31,0 24,7 19,6 28,5 35,4 40,6 25,8 18,5
SUM Percent 100,0 100,0 100,0 100,0 100,0 100,0 100,0 100,0 100,0 100,0 100,0 Mean 1,23 1,59 1,64 1,22 1,28 1,34 1,23 1,01 1,24 1,26 1,19 Top 2: Below 1.5% Percent 51,9 45,4 35,3 48,3 51,8 55,5 54,5 55,4 39,1 50,4 61,9 Bottom 2: 2.5% or more Percent 5,1 9,1 5,8 4,7 7,6 5,6 3,1 4,2 5,9 4,8 Respondents with cost awareness in Q23_6
Q24_6: Cost estimates - Credit transferHow much do you think you pay for using the following payment method(s)?
TNS Infratest Page 61 Payment_Transparency_Tabs_weighted

UK France Germany Italy Spain Netherlands Denmark Finland Poland Slovenia
Country
total
Tab. 62
Base unw. 1.249 153 115 136 202 142 57 111 103 167 63
Base wght. 1.250 153 116 136 203 141 57 111 103 167 63 Less than 1.0% (0,5) Percent 22,3 15,7 22,0 19,1 28,8 23,0 19,1 13,5 23,3 26,4 28,6 Between 1.0 and below 1.5% (1,25) Percent 23,0 23,6 21,1 23,5 25,8 22,8 23,3 28,8 21,4 20,3 14,3 Between 1.5 and below 2.0% (1,75) Percent 13,7 12,4 9,8 24,3 9,9 13,6 19,0 14,4 7,8 12,6 20,6 Between 2.0 and below 2.5% (2,25) Percent 7,2 10,5 8,7 8,1 5,9 6,9 10,8 4,5 6,8 7,2 1,6 Between 2.5 and below 3.0% (2,75) Percent 5,5 9,2 4,0 3,7 6,9 6,5 1,7 4,5 2,9 6,6 3,2 More than 3% (3,5) Percent 5,3 8,5 7,2 2,2 3,4 4,7 7,3 5,4 3,9 5,4 7,9 Don't know Percent 23,1 20,3 27,3 19,1 19,3 22,6 18,9 28,8 34,0 21,5 23,8
SUM Percent 100,0 100,0 100,0 100,0 100,0 100,0 100,0 100,0 100,0 100,0 100,0 Mean 1,48 1,72 1,51 1,45 1,34 1,47 1,56 1,54 1,34 1,45 1,42 Top 2: Below 1.5% Percent 45,2 39,2 43,1 42,7 54,6 45,8 42,3 42,3 44,7 46,7 42,9 Bottom 2: 2.5% or more Percent 10,8 17,6 11,2 5,9 10,3 11,2 9,0 9,9 6,8 12,0 11,1 Respondents with cost awareness in Q23_7
Q24_7: Cost estimates - Online payment systemHow much do you think you pay for using the following payment method(s)?
TNS Infratest Page 62 Payment_Transparency_Tabs_weighted

UK France Germany Italy Spain Netherlands Denmark Finland Poland Slovenia
Country
total
Tab. 63
Base unw. 860 12 23 37 84 112 17 9 163 140 263
Base wght. 859 12 22 37 84 111 17 9 163 140 263 Less than 1.0% (0,5) Percent 16,9 33,2 37,1 18,9 10,7 13,5 13,1 11,1 14,1 21,3 17,5 Between 1.0 and below 1.5% (1,25) Percent 15,2 16,8 16,9 10,8 13,1 9,1 22,6 11,1 11,7 12,1 22,4 Between 1.5 and below 2.0% (1,75) Percent 14,3 16,6 3,9 21,6 22,5 15,2 11,5 11,1 11,6 6,4 17,1 Between 2.0 and below 2.5% (2,25) Percent 7,3 16,6 10,8 10,8 10,4 8,6 5,8 5,3 Between 2.5 and below 3.0% (2,75) Percent 6,2 4,4 8,1 6,0 8,9 7,2 5,5 6,4 5,7 More than 3% (3,5) Percent 11,7 4,4 16,2 11,8 7,2 11,7 11,1 13,5 18,7 9,1 Don't know Percent 28,4 16,8 33,4 13,5 25,0 35,8 34,0 55,6 35,0 29,3 22,8
SUM Percent 100,0 100,0 100,0 100,0 100,0 100,0 100,0 100,0 100,0 100,0 100,0 Mean 1,77 1,25 1,11 1,90 1,91 1,83 1,75 1,75 1,90 1,88 1,64 Top 2: Below 1.5% Percent 32,2 50,0 54,0 29,7 23,8 22,5 35,7 22,2 25,8 33,4 39,9 Bottom 2: 2.5% or more Percent 17,8 8,7 24,3 17,9 16,2 18,9 11,1 19,0 25,1 14,8 Respondents with cost awareness in Q23_8
Q24_8: Cost estimates - Cash on deliveryHow much do you think you pay for using the following payment method(s)?
TNS Infratest Page 63 Payment_Transparency_Tabs_weighted
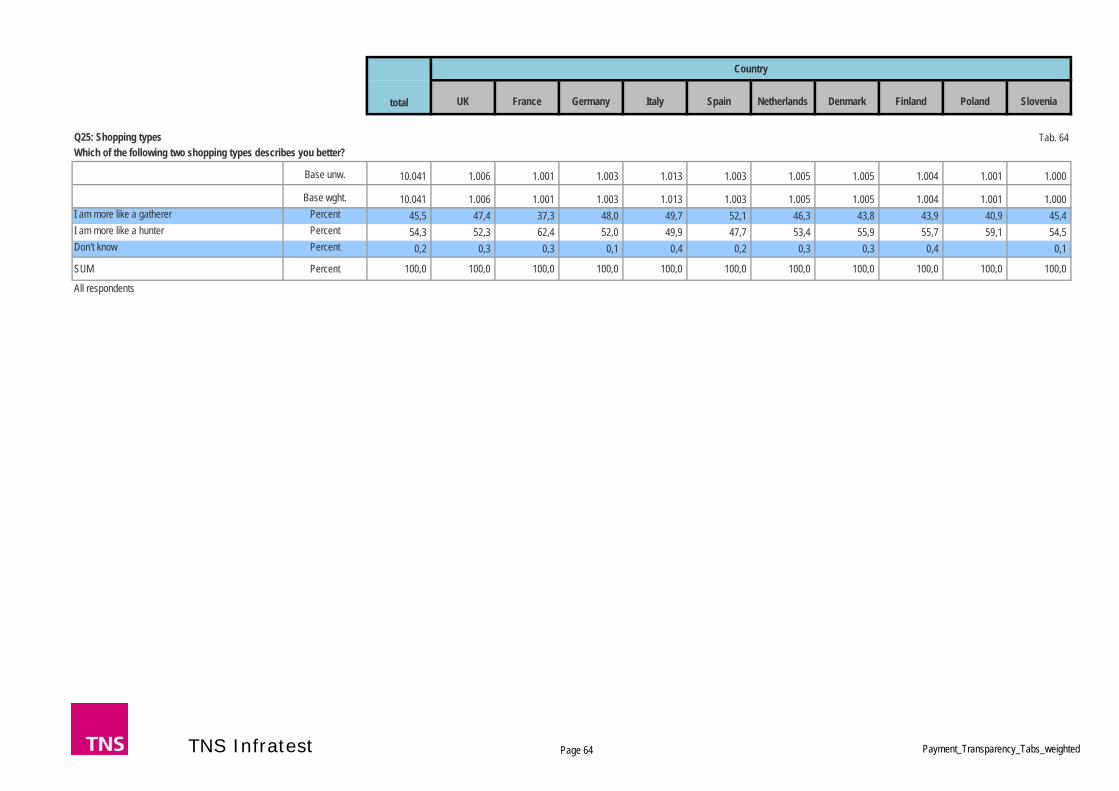
UK France Germany Italy Spain Netherlands Denmark Finland Poland Slovenia
Country
total
Tab. 64
Base unw. 10.041 1.006 1.001 1.003 1.013 1.003 1.005 1.005 1.004 1.001 1.000
Base wght. 10.041 1.006 1.001 1.003 1.013 1.003 1.005 1.005 1.004 1.001 1.000 I am more like a gatherer Percent 45,5 47,4 37,3 48,0 49,7 52,1 46,3 43,8 43,9 40,9 45,4 I am more like a hunter Percent 54,3 52,3 62,4 52,0 49,9 47,7 53,4 55,9 55,7 59,1 54,5 Don't know Percent 0,2 0,3 0,3 0,1 0,4 0,2 0,3 0,3 0,4 0,1
SUM Percent 100,0 100,0 100,0 100,0 100,0 100,0 100,0 100,0 100,0 100,0 100,0
All respondents
Q25: Shopping typesWhich of the following two shopping types describes you better?
TNS Infratest Page 64 Payment_Transparency_Tabs_weighted
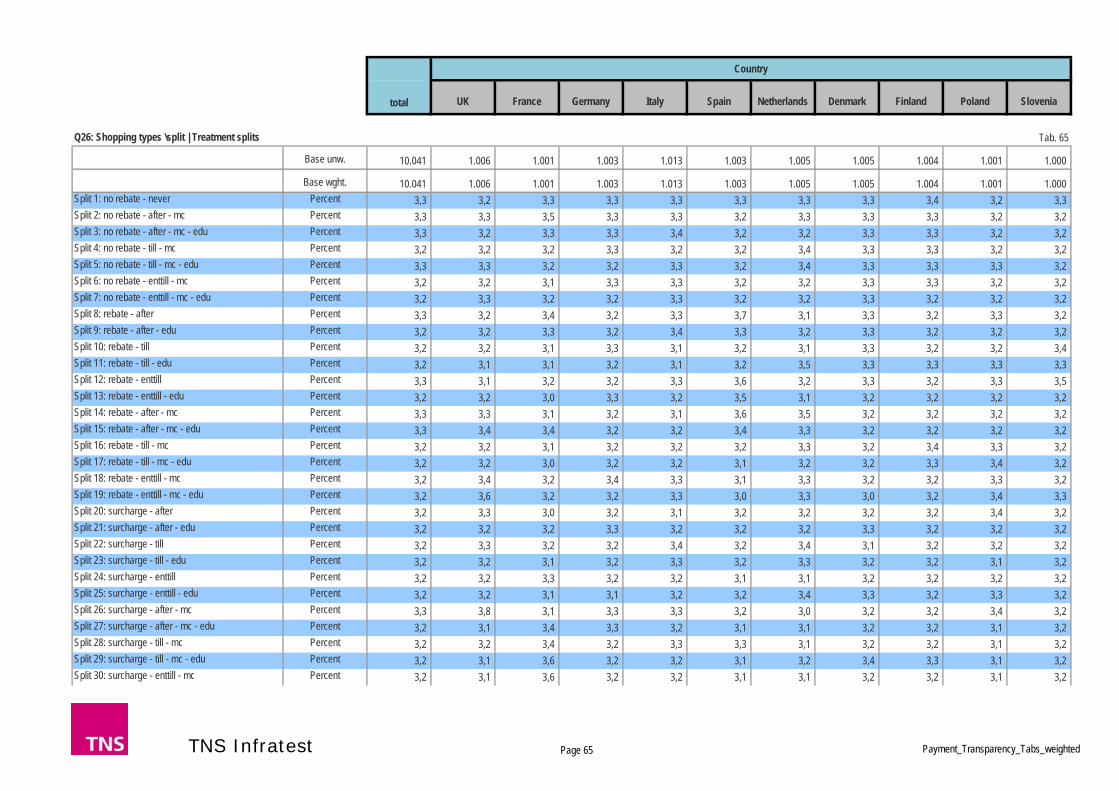
UK France Germany Italy Spain Netherlands Denmark Finland Poland Slovenia
Country
total
Tab. 65
Base unw. 10.041 1.006 1.001 1.003 1.013 1.003 1.005 1.005 1.004 1.001 1.000
Base wght. 10.041 1.006 1.001 1.003 1.013 1.003 1.005 1.005 1.004 1.001 1.000 Split 1: no rebate - never Percent 3,3 3,2 3,3 3,3 3,3 3,3 3,3 3,3 3,4 3,2 3,3 Split 2: no rebate - after - mc Percent 3,3 3,3 3,5 3,3 3,3 3,2 3,3 3,3 3,3 3,2 3,2 Split 3: no rebate - after - mc - edu Percent 3,3 3,2 3,3 3,3 3,4 3,2 3,2 3,3 3,3 3,2 3,2 Split 4: no rebate - till - mc Percent 3,2 3,2 3,2 3,3 3,2 3,2 3,4 3,3 3,3 3,2 3,2 Split 5: no rebate - till - mc - edu Percent 3,3 3,3 3,2 3,2 3,3 3,2 3,4 3,3 3,3 3,3 3,2 Split 6: no rebate - enttill - mc Percent 3,2 3,2 3,1 3,3 3,3 3,2 3,2 3,3 3,3 3,2 3,2 Split 7: no rebate - enttill - mc - edu Percent 3,2 3,3 3,2 3,2 3,3 3,2 3,2 3,3 3,2 3,2 3,2 Split 8: rebate - after Percent 3,3 3,2 3,4 3,2 3,3 3,7 3,1 3,3 3,2 3,3 3,2 Split 9: rebate - after - edu Percent 3,2 3,2 3,3 3,2 3,4 3,3 3,2 3,3 3,2 3,2 3,2 Split 10: rebate - till Percent 3,2 3,2 3,1 3,3 3,1 3,2 3,1 3,3 3,2 3,2 3,4 Split 11: rebate - till - edu Percent 3,2 3,1 3,1 3,2 3,1 3,2 3,5 3,3 3,3 3,3 3,3 Split 12: rebate - enttill Percent 3,3 3,1 3,2 3,2 3,3 3,6 3,2 3,3 3,2 3,3 3,5 Split 13: rebate - enttill - edu Percent 3,2 3,2 3,0 3,3 3,2 3,5 3,1 3,2 3,2 3,2 3,2 Split 14: rebate - after - mc Percent 3,3 3,3 3,1 3,2 3,1 3,6 3,5 3,2 3,2 3,2 3,2 Split 15: rebate - after - mc - edu Percent 3,3 3,4 3,4 3,2 3,2 3,4 3,3 3,2 3,2 3,2 3,2 Split 16: rebate - till - mc Percent 3,2 3,2 3,1 3,2 3,2 3,2 3,3 3,2 3,4 3,3 3,2 Split 17: rebate - till - mc - edu Percent 3,2 3,2 3,0 3,2 3,2 3,1 3,2 3,2 3,3 3,4 3,2 Split 18: rebate - enttill - mc Percent 3,2 3,4 3,2 3,4 3,3 3,1 3,3 3,2 3,2 3,3 3,2 Split 19: rebate - enttill - mc - edu Percent 3,2 3,6 3,2 3,2 3,3 3,0 3,3 3,0 3,2 3,4 3,3 Split 20: surcharge - after Percent 3,2 3,3 3,0 3,2 3,1 3,2 3,2 3,2 3,2 3,4 3,2 Split 21: surcharge - after - edu Percent 3,2 3,2 3,2 3,3 3,2 3,2 3,2 3,3 3,2 3,2 3,2 Split 22: surcharge - till Percent 3,2 3,3 3,2 3,2 3,4 3,2 3,4 3,1 3,2 3,2 3,2 Split 23: surcharge - till - edu Percent 3,2 3,2 3,1 3,2 3,3 3,2 3,3 3,2 3,2 3,1 3,2 Split 24: surcharge - enttill Percent 3,2 3,2 3,3 3,2 3,2 3,1 3,1 3,2 3,2 3,2 3,2 Split 25: surcharge - enttill - edu Percent 3,2 3,2 3,1 3,1 3,2 3,2 3,4 3,3 3,2 3,3 3,2 Split 26: surcharge - after - mc Percent 3,3 3,8 3,1 3,3 3,3 3,2 3,0 3,2 3,2 3,4 3,2 Split 27: surcharge - after - mc - edu Percent 3,2 3,1 3,4 3,3 3,2 3,1 3,1 3,2 3,2 3,1 3,2 Split 28: surcharge - till - mc Percent 3,2 3,2 3,4 3,2 3,3 3,3 3,1 3,2 3,2 3,1 3,2 Split 29: surcharge - till - mc - edu Percent 3,2 3,1 3,6 3,2 3,2 3,1 3,2 3,4 3,3 3,1 3,2 Split 30: surcharge - enttill - mc Percent 3,2 3,1 3,6 3,2 3,2 3,1 3,1 3,2 3,2 3,1 3,2
Q26: Shopping types \split | Treatment splits
TNS Infratest Page 65 Payment_Transparency_Tabs_weighted

UK France Germany Italy Spain Netherlands Denmark Finland Poland Slovenia
Country
total
Split 31: surcharge - enttill - mc - edu Percent 3,1 3,1 3,3 3,2 3,2 3,1 3,0 3,2 3,2 3,1 3,2
SUM Percent 100,0 100,0 100,0 100,0 100,0 100,0 100,0 100,0 100,0 100,0 100,0
All respondents
TNS Infratest Page 66 Payment_Transparency_Tabs_weighted
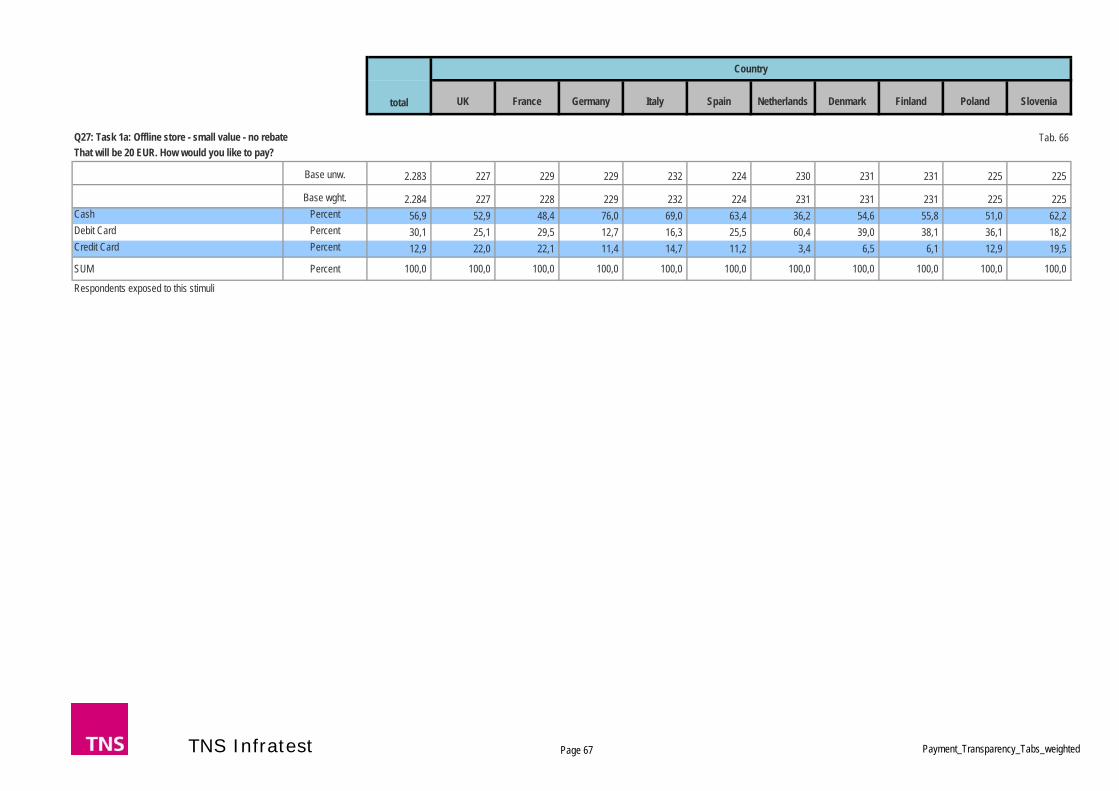
UK France Germany Italy Spain Netherlands Denmark Finland Poland Slovenia
Country
total
Tab. 66
Base unw. 2.283 227 229 229 232 224 230 231 231 225 225
Base wght. 2.284 227 228 229 232 224 231 231 231 225 225 Cash Percent 56,9 52,9 48,4 76,0 69,0 63,4 36,2 54,6 55,8 51,0 62,2 Debit Card Percent 30,1 25,1 29,5 12,7 16,3 25,5 60,4 39,0 38,1 36,1 18,2 Credit Card Percent 12,9 22,0 22,1 11,4 14,7 11,2 3,4 6,5 6,1 12,9 19,5
SUM Percent 100,0 100,0 100,0 100,0 100,0 100,0 100,0 100,0 100,0 100,0 100,0
Respondents exposed to this stimuli
Q27: Task 1a: Offline store - small value - no rebateThat will be 20 EUR. How would you like to pay?
TNS Infratest Page 67 Payment_Transparency_Tabs_weighted
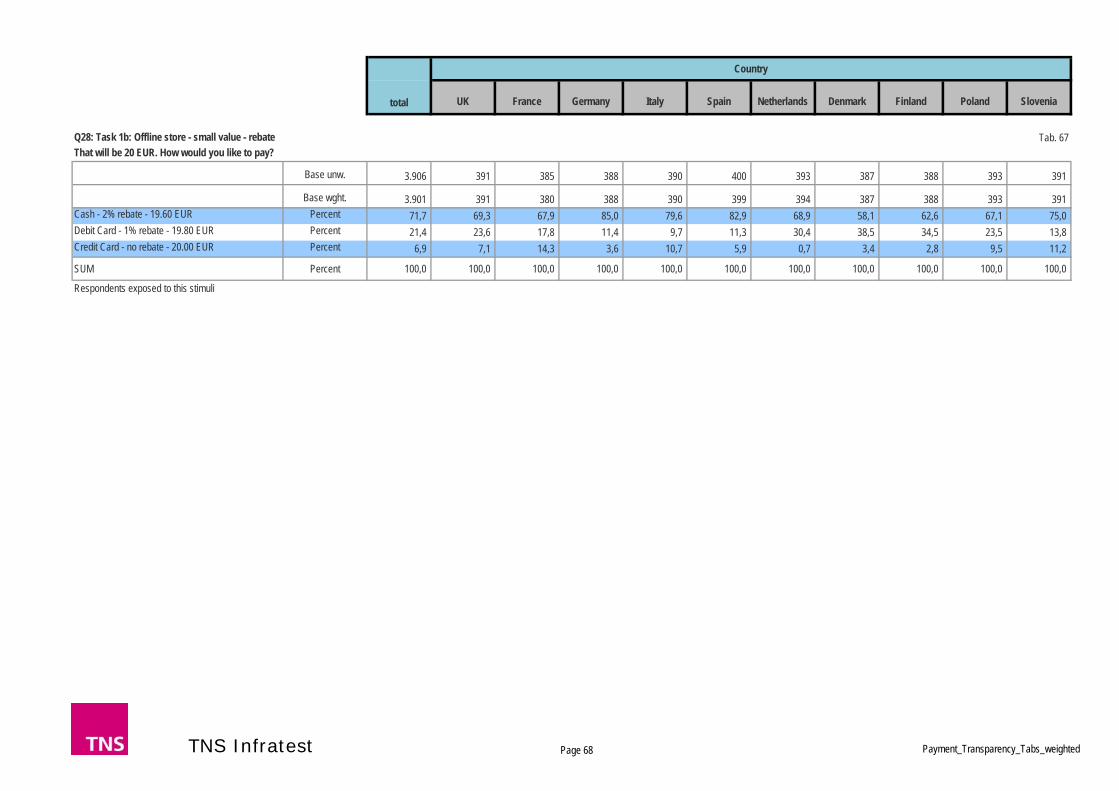
UK France Germany Italy Spain Netherlands Denmark Finland Poland Slovenia
Country
total
Tab. 67
Base unw. 3.906 391 385 388 390 400 393 387 388 393 391
Base wght. 3.901 391 380 388 390 399 394 387 388 393 391 Cash - 2% rebate - 19.60 EUR Percent 71,7 69,3 67,9 85,0 79,6 82,9 68,9 58,1 62,6 67,1 75,0 Debit Card - 1% rebate - 19.80 EUR Percent 21,4 23,6 17,8 11,4 9,7 11,3 30,4 38,5 34,5 23,5 13,8 Credit Card - no rebate - 20.00 EUR Percent 6,9 7,1 14,3 3,6 10,7 5,9 0,7 3,4 2,8 9,5 11,2
SUM Percent 100,0 100,0 100,0 100,0 100,0 100,0 100,0 100,0 100,0 100,0 100,0
Respondents exposed to this stimuli
Q28: Task 1b: Offline store - small value - rebateThat will be 20 EUR. How would you like to pay?
TNS Infratest Page 68 Payment_Transparency_Tabs_weighted
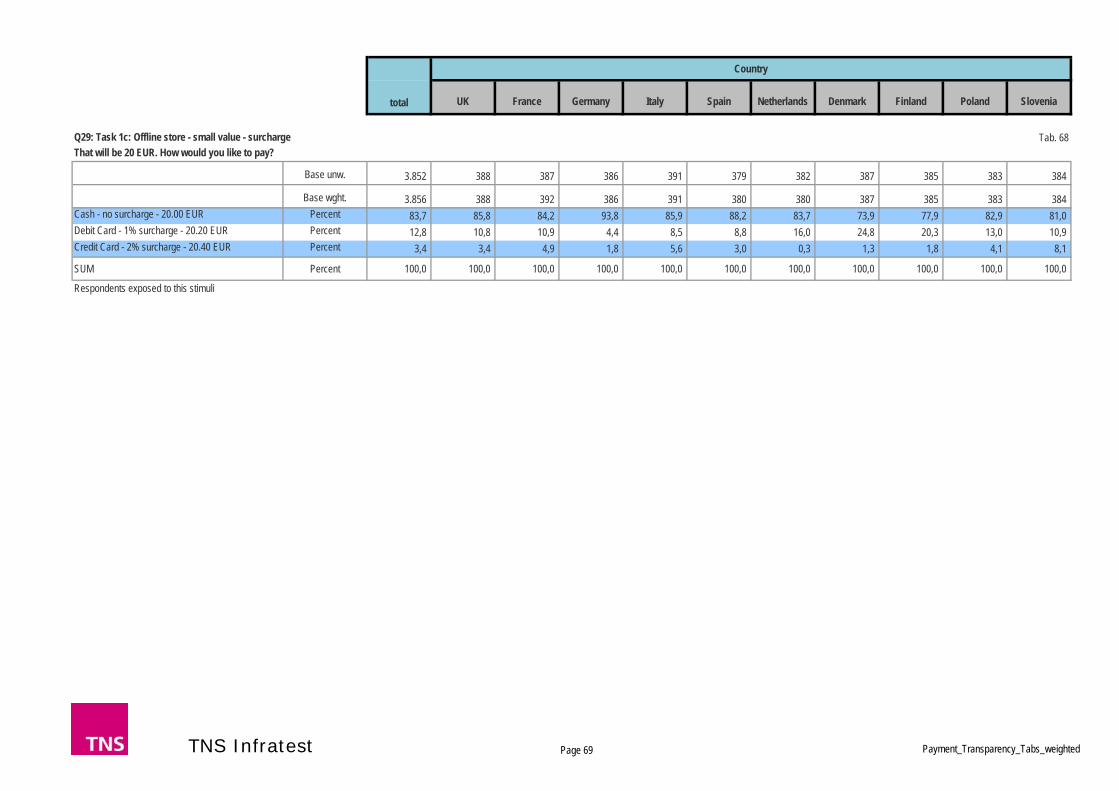
UK France Germany Italy Spain Netherlands Denmark Finland Poland Slovenia
Country
total
Tab. 68
Base unw. 3.852 388 387 386 391 379 382 387 385 383 384
Base wght. 3.856 388 392 386 391 380 380 387 385 383 384 Cash - no surcharge - 20.00 EUR Percent 83,7 85,8 84,2 93,8 85,9 88,2 83,7 73,9 77,9 82,9 81,0 Debit Card - 1% surcharge - 20.20 EUR Percent 12,8 10,8 10,9 4,4 8,5 8,8 16,0 24,8 20,3 13,0 10,9 Credit Card - 2% surcharge - 20.40 EUR Percent 3,4 3,4 4,9 1,8 5,6 3,0 0,3 1,3 1,8 4,1 8,1
SUM Percent 100,0 100,0 100,0 100,0 100,0 100,0 100,0 100,0 100,0 100,0 100,0
Respondents exposed to this stimuli
Q29: Task 1c: Offline store - small value - surchargeThat will be 20 EUR. How would you like to pay?
TNS Infratest Page 69 Payment_Transparency_Tabs_weighted

UK France Germany Italy Spain Netherlands Denmark Finland Poland Slovenia
Country
total
Tab. 69
Base unw. 2.283 227 229 229 232 224 230 231 231 225 225
Base wght. 2.284 227 228 229 232 224 231 231 231 225 225 Cash: I usually have this amount of cash in my wallet. Percent 0,6 0,4 0,4 2,2 0,4 0,5 0,4 0,4 0,4 0,4 0,4 Cash: I would walk to nearest ATM and then pay with cash. Percent 11,3 11,5 8,1 12,7 9,1 10,7 9,9 14,7 8,7 12,4 15,1 Debit Card Percent 54,3 40,1 54,6 35,8 38,7 51,0 79,0 72,7 69,7 58,6 42,2 Credit Card: I am not collecting reward points. Percent 13,1 12,4 17,9 13,5 16,0 9,8 4,2 7,8 11,7 8,9 29,3 Credit Card: I am collecting reward points. Percent 20,7 35,6 19,0 35,8 35,8 28,1 6,4 4,3 9,5 19,6 12,9
SUM Percent 100,0 100,0 100,0 100,0 100,0 100,0 100,0 100,0 100,0 100,0 100,0 Cash Percent 11,9 11,9 8,5 14,8 9,5 11,2 10,3 15,2 9,1 12,8 15,6 Credit Card Percent 33,8 48,0 36,9 49,4 51,7 37,8 10,7 12,1 21,2 28,5 42,2 Respondents exposed to this stimuli
Q30: Task 2a: Offline store - high value - no rebateThat will be 200.00 EUR. How would you like to pay?
TNS Infratest Page 70 Payment_Transparency_Tabs_weighted
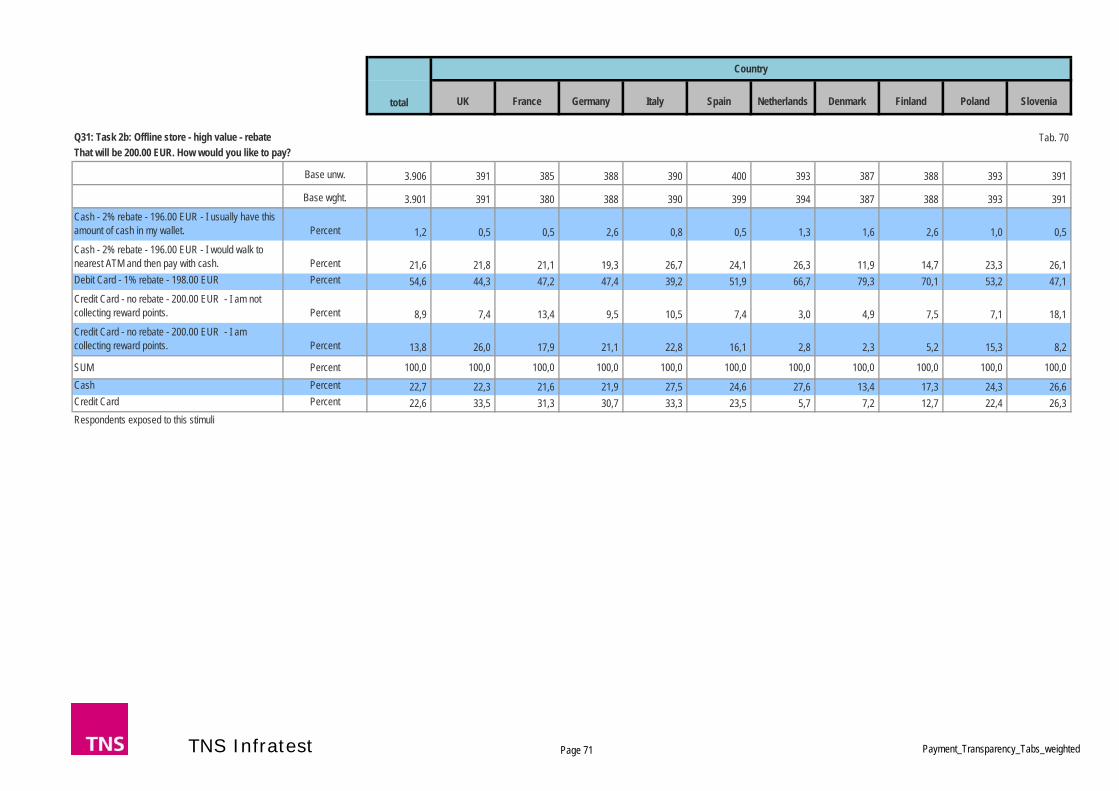
UK France Germany Italy Spain Netherlands Denmark Finland Poland Slovenia
Country
total
Tab. 70
Base unw. 3.906 391 385 388 390 400 393 387 388 393 391
Base wght. 3.901 391 380 388 390 399 394 387 388 393 391 Cash - 2% rebate - 196.00 EUR - I usually have this amount of cash in my wallet. Percent 1,2 0,5 0,5 2,6 0,8 0,5 1,3 1,6 2,6 1,0 0,5 Cash - 2% rebate - 196.00 EUR - I would walk to nearest ATM and then pay with cash. Percent 21,6 21,8 21,1 19,3 26,7 24,1 26,3 11,9 14,7 23,3 26,1 Debit Card - 1% rebate - 198.00 EUR Percent 54,6 44,3 47,2 47,4 39,2 51,9 66,7 79,3 70,1 53,2 47,1 Credit Card - no rebate - 200.00 EUR - I am not collecting reward points. Percent 8,9 7,4 13,4 9,5 10,5 7,4 3,0 4,9 7,5 7,1 18,1 Credit Card - no rebate - 200.00 EUR - I am collecting reward points. Percent 13,8 26,0 17,9 21,1 22,8 16,1 2,8 2,3 5,2 15,3 8,2
SUM Percent 100,0 100,0 100,0 100,0 100,0 100,0 100,0 100,0 100,0 100,0 100,0 Cash Percent 22,7 22,3 21,6 21,9 27,5 24,6 27,6 13,4 17,3 24,3 26,6 Credit Card Percent 22,6 33,5 31,3 30,7 33,3 23,5 5,7 7,2 12,7 22,4 26,3 Respondents exposed to this stimuli
Q31: Task 2b: Offline store - high value - rebateThat will be 200.00 EUR. How would you like to pay?
TNS Infratest Page 71 Payment_Transparency_Tabs_weighted
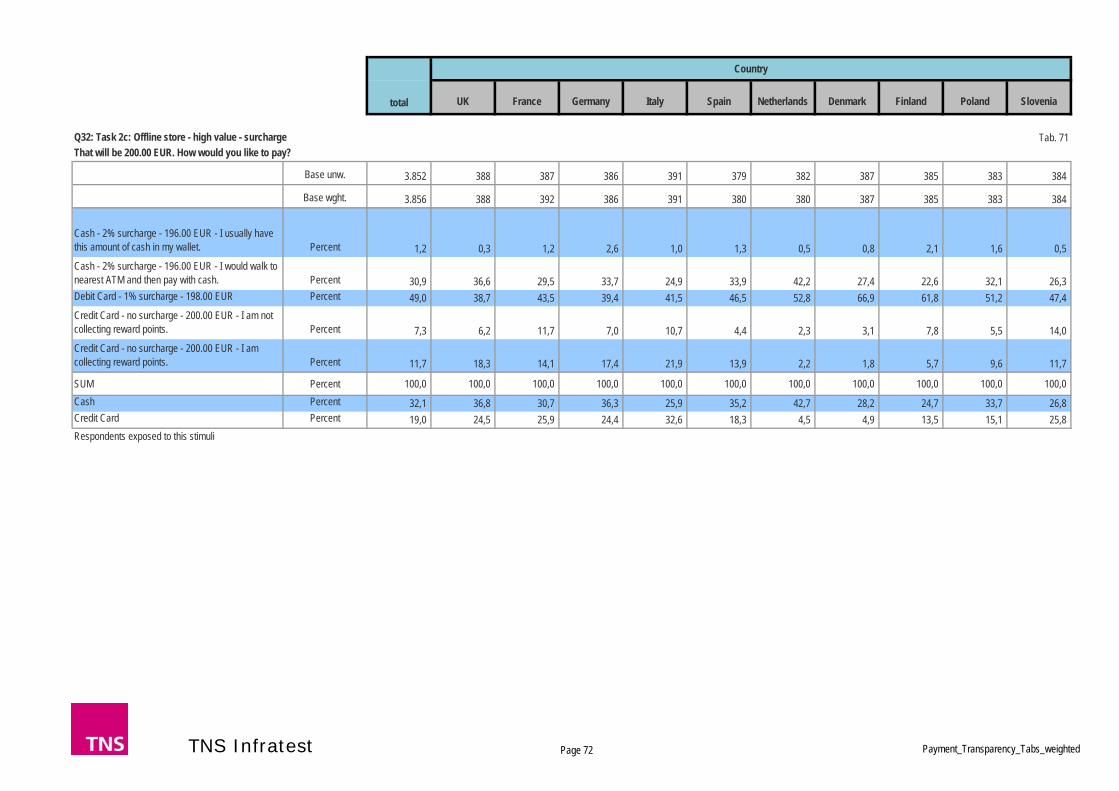
UK France Germany Italy Spain Netherlands Denmark Finland Poland Slovenia
Country
total
Tab. 71
Base unw. 3.852 388 387 386 391 379 382 387 385 383 384
Base wght. 3.856 388 392 386 391 380 380 387 385 383 384
Cash - 2% surcharge - 196.00 EUR - I usually have this amount of cash in my wallet. Percent 1,2 0,3 1,2 2,6 1,0 1,3 0,5 0,8 2,1 1,6 0,5 Cash - 2% surcharge - 196.00 EUR - I would walk to nearest ATM and then pay with cash. Percent 30,9 36,6 29,5 33,7 24,9 33,9 42,2 27,4 22,6 32,1 26,3 Debit Card - 1% surcharge - 198.00 EUR Percent 49,0 38,7 43,5 39,4 41,5 46,5 52,8 66,9 61,8 51,2 47,4 Credit Card - no surcharge - 200.00 EUR - I am not collecting reward points. Percent 7,3 6,2 11,7 7,0 10,7 4,4 2,3 3,1 7,8 5,5 14,0 Credit Card - no surcharge - 200.00 EUR - I am collecting reward points. Percent 11,7 18,3 14,1 17,4 21,9 13,9 2,2 1,8 5,7 9,6 11,7
SUM Percent 100,0 100,0 100,0 100,0 100,0 100,0 100,0 100,0 100,0 100,0 100,0 Cash Percent 32,1 36,8 30,7 36,3 25,9 35,2 42,7 28,2 24,7 33,7 26,8 Credit Card Percent 19,0 24,5 25,9 24,4 32,6 18,3 4,5 4,9 13,5 15,1 25,8 Respondents exposed to this stimuli
Q32: Task 2c: Offline store - high value - surchargeThat will be 200.00 EUR. How would you like to pay?
TNS Infratest Page 72 Payment_Transparency_Tabs_weighted
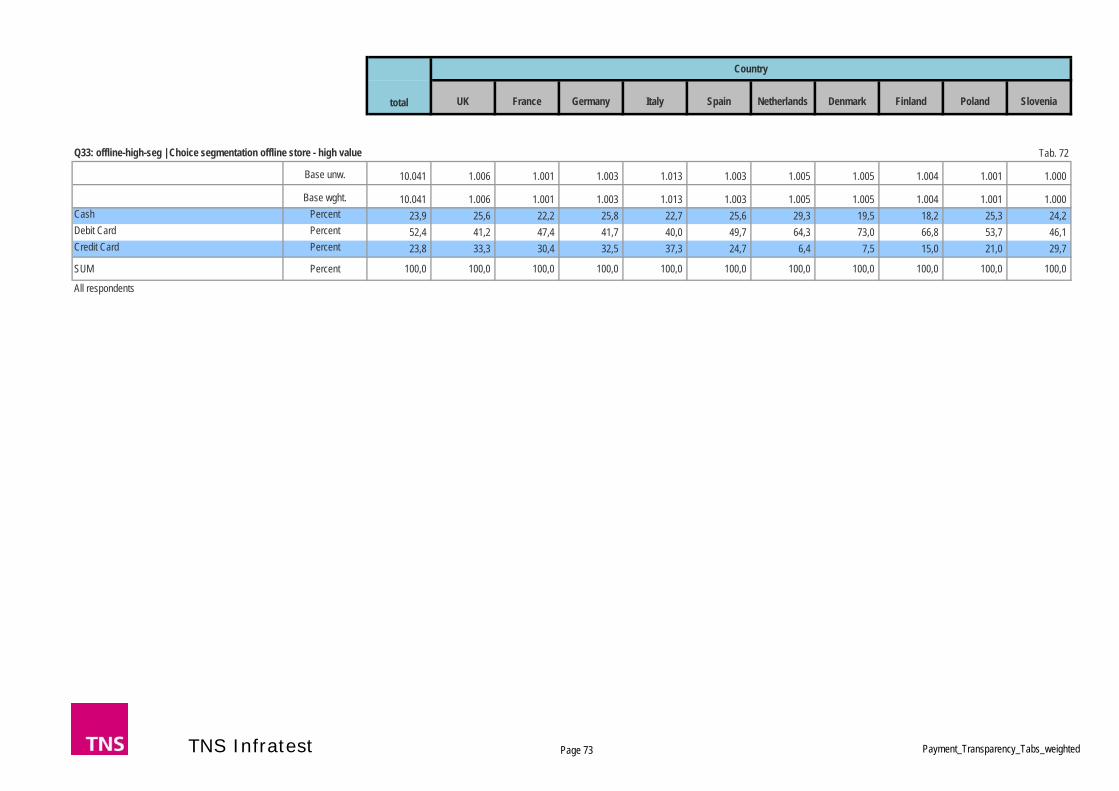
UK France Germany Italy Spain Netherlands Denmark Finland Poland Slovenia
Country
total
Tab. 72
Base unw. 10.041 1.006 1.001 1.003 1.013 1.003 1.005 1.005 1.004 1.001 1.000
Base wght. 10.041 1.006 1.001 1.003 1.013 1.003 1.005 1.005 1.004 1.001 1.000 Cash Percent 23,9 25,6 22,2 25,8 22,7 25,6 29,3 19,5 18,2 25,3 24,2 Debit Card Percent 52,4 41,2 47,4 41,7 40,0 49,7 64,3 73,0 66,8 53,7 46,1 Credit Card Percent 23,8 33,3 30,4 32,5 37,3 24,7 6,4 7,5 15,0 21,0 29,7
SUM Percent 100,0 100,0 100,0 100,0 100,0 100,0 100,0 100,0 100,0 100,0 100,0
All respondents
Q33: offline-high-seg | Choice segmentation offline store - high value
TNS Infratest Page 73 Payment_Transparency_Tabs_weighted

UK France Germany Italy Spain Netherlands Denmark Finland Poland Slovenia
Country
total
Tab. 73
Base unw. 2.116 220 223 226 217 210 212 221 217 211 159
Base wght. 2.117 220 222 226 217 210 214 221 217 211 159 Credit transfer Percent 21,4 4,1 4,6 36,3 7,4 9,7 40,6 8,1 30,4 44,9 31,4 Debit Card Percent 26,5 39,1 32,7 5,3 11,5 30,4 13,4 75,6 23,0 10,4 20,8 Credit Card Percent 16,7 19,5 25,8 17,3 24,0 18,1 6,9 13,1 14,8 6,1 22,0 Online payment system Percent 35,5 37,3 36,8 41,2 57,1 41,8 39,1 3,2 31,8 38,6 25,8
SUM Percent 100,0 100,0 100,0 100,0 100,0 100,0 100,0 100,0 100,0 100,0 100,0
Respondents exposed to this stimuli
Q34: Task 3a: Online store - small value - no rebate
How would you like to pay? The total amount in your basket incl. delivery and payment charges comes to 20.00 EUR.
TNS Infratest Page 74 Payment_Transparency_Tabs_weighted
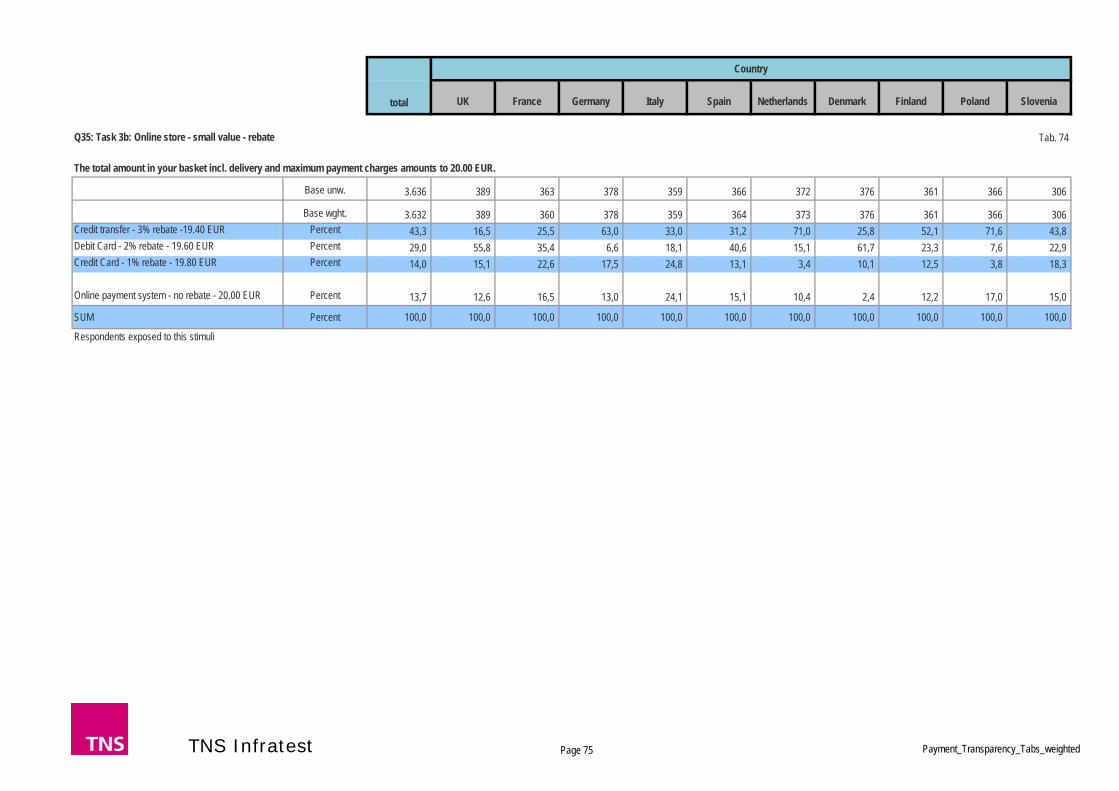
UK France Germany Italy Spain Netherlands Denmark Finland Poland Slovenia
Country
total
Tab. 74
Base unw. 3.636 389 363 378 359 366 372 376 361 366 306
Base wght. 3.632 389 360 378 359 364 373 376 361 366 306 Credit transfer - 3% rebate -19.40 EUR Percent 43,3 16,5 25,5 63,0 33,0 31,2 71,0 25,8 52,1 71,6 43,8 Debit Card - 2% rebate - 19.60 EUR Percent 29,0 55,8 35,4 6,6 18,1 40,6 15,1 61,7 23,3 7,6 22,9 Credit Card - 1% rebate - 19.80 EUR Percent 14,0 15,1 22,6 17,5 24,8 13,1 3,4 10,1 12,5 3,8 18,3
Online payment system - no rebate - 20.00 EUR Percent 13,7 12,6 16,5 13,0 24,1 15,1 10,4 2,4 12,2 17,0 15,0
SUM Percent 100,0 100,0 100,0 100,0 100,0 100,0 100,0 100,0 100,0 100,0 100,0
Respondents exposed to this stimuli
Q35: Task 3b: Online store - small value - rebate
The total amount in your basket incl. delivery and maximum payment charges amounts to 20.00 EUR.
TNS Infratest Page 75 Payment_Transparency_Tabs_weighted

UK France Germany Italy Spain Netherlands Denmark Finland Poland Slovenia
Country
total
Tab. 75
Base unw. 3.605 383 369 379 363 354 360 382 366 359 290
Base wght. 3.609 383 375 379 363 354 358 382 366 359 290 Credit transfer - no surcharge - 20.00 EUR Percent 58,9 35,8 46,6 73,9 51,4 49,8 85,5 35,9 69,7 83,8 58,6 Debit Card - 1% surcharge - 20.20 EUR Percent 23,1 42,8 30,1 6,1 11,8 30,8 7,5 57,3 15,0 5,3 21,0 Credit Card - 2% surcharge - 20.40 EUR Percent 9,7 14,3 14,1 10,6 22,2 7,7 1,6 5,8 6,3 2,5 12,1
Online payment system - 3% surcharge - 20.60 EUR Percent 8,4 7,1 9,3 9,5 14,6 11,6 5,4 1,1 9,0 8,4 8,3
SUM Percent 100,0 100,0 100,0 100,0 100,0 100,0 100,0 100,0 100,0 100,0 100,0
Respondents exposed to this stimuli
Q36: Task 3c: Online store - small value - surcharge
How would you like to pay? The total amount in your basket (incl. delivery charges) comes to 20.00 EUR.
TNS Infratest Page 76 Payment_Transparency_Tabs_weighted
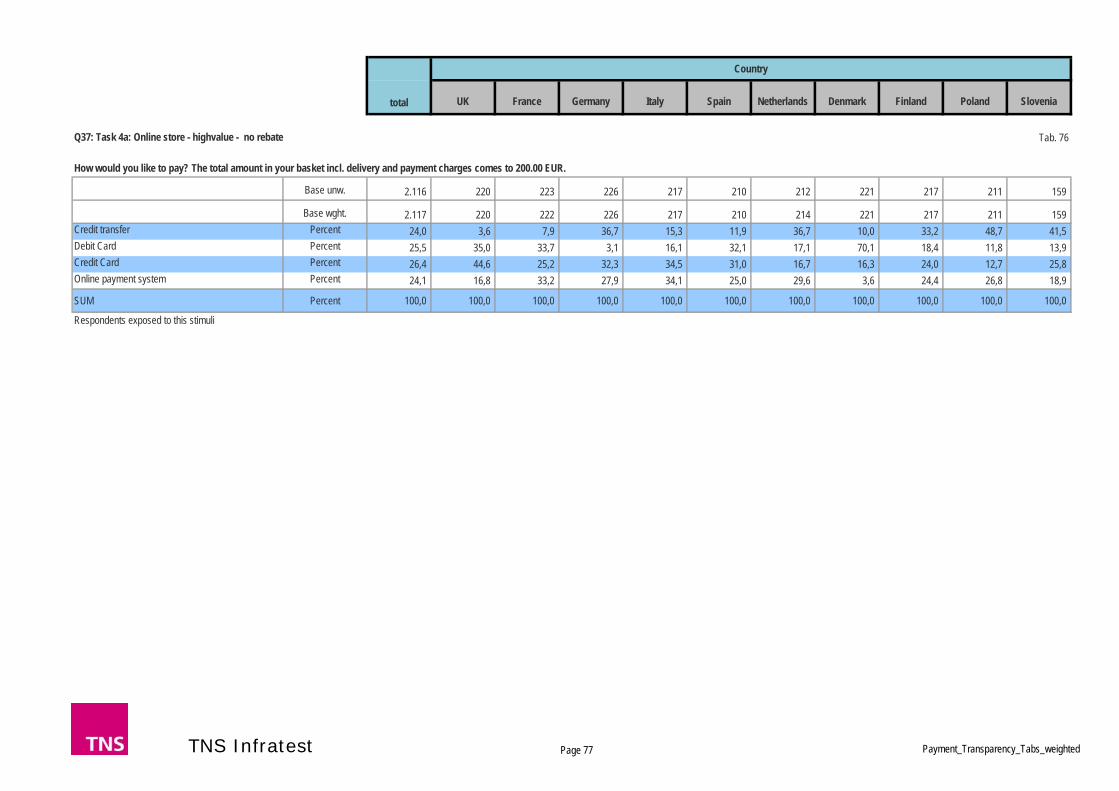
UK France Germany Italy Spain Netherlands Denmark Finland Poland Slovenia
Country
total
Tab. 76
Base unw. 2.116 220 223 226 217 210 212 221 217 211 159
Base wght. 2.117 220 222 226 217 210 214 221 217 211 159 Credit transfer Percent 24,0 3,6 7,9 36,7 15,3 11,9 36,7 10,0 33,2 48,7 41,5 Debit Card Percent 25,5 35,0 33,7 3,1 16,1 32,1 17,1 70,1 18,4 11,8 13,9 Credit Card Percent 26,4 44,6 25,2 32,3 34,5 31,0 16,7 16,3 24,0 12,7 25,8 Online payment system Percent 24,1 16,8 33,2 27,9 34,1 25,0 29,6 3,6 24,4 26,8 18,9
SUM Percent 100,0 100,0 100,0 100,0 100,0 100,0 100,0 100,0 100,0 100,0 100,0
Respondents exposed to this stimuli
Q37: Task 4a: Online store - highvalue - no rebate
How would you like to pay? The total amount in your basket incl. delivery and payment charges comes to 200.00 EUR.
TNS Infratest Page 77 Payment_Transparency_Tabs_weighted
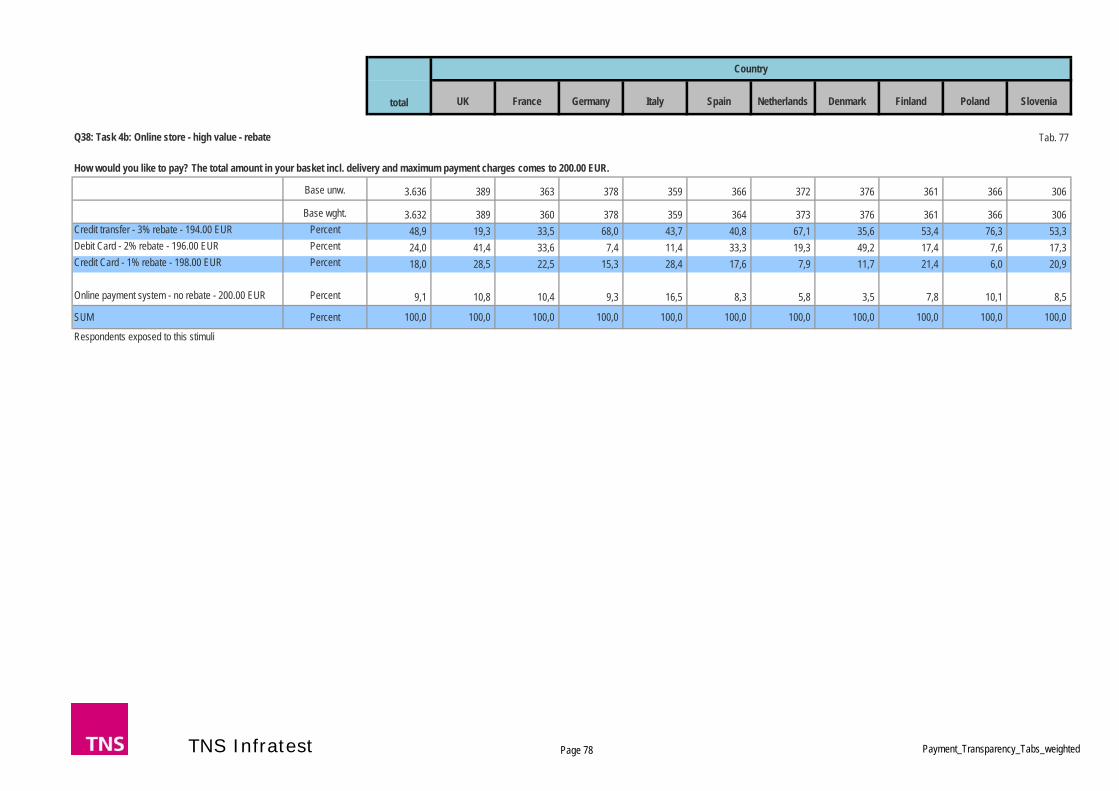
UK France Germany Italy Spain Netherlands Denmark Finland Poland Slovenia
Country
total
Tab. 77
Base unw. 3.636 389 363 378 359 366 372 376 361 366 306
Base wght. 3.632 389 360 378 359 364 373 376 361 366 306 Credit transfer - 3% rebate - 194.00 EUR Percent 48,9 19,3 33,5 68,0 43,7 40,8 67,1 35,6 53,4 76,3 53,3 Debit Card - 2% rebate - 196.00 EUR Percent 24,0 41,4 33,6 7,4 11,4 33,3 19,3 49,2 17,4 7,6 17,3 Credit Card - 1% rebate - 198.00 EUR Percent 18,0 28,5 22,5 15,3 28,4 17,6 7,9 11,7 21,4 6,0 20,9
Online payment system - no rebate - 200.00 EUR Percent 9,1 10,8 10,4 9,3 16,5 8,3 5,8 3,5 7,8 10,1 8,5
SUM Percent 100,0 100,0 100,0 100,0 100,0 100,0 100,0 100,0 100,0 100,0 100,0
Respondents exposed to this stimuli
Q38: Task 4b: Online store - high value - rebate
How would you like to pay? The total amount in your basket incl. delivery and maximum payment charges comes to 200.00 EUR.
TNS Infratest Page 78 Payment_Transparency_Tabs_weighted

UK France Germany Italy Spain Netherlands Denmark Finland Poland Slovenia
Country
total
Tab. 78
Base unw. 3.605 383 369 379 363 354 360 382 366 359 290
Base wght. 3.609 383 375 379 363 354 358 382 366 359 290 Credit transfer - no surcharge - 200.00 EUR Percent 56,2 25,6 46,8 68,3 56,4 50,7 78,9 39,5 62,5 82,2 53,5 Debit Card - 1% surcharge - 202.00 EUR Percent 22,6 46,0 28,6 5,6 10,7 28,6 11,8 51,1 12,8 8,1 19,7 Credit Card - 2% surcharge - 204.00 EUR Percent 15,0 24,5 18,1 16,4 23,5 12,1 5,5 7,6 18,1 5,5 19,0 Online payment system - 3% surcharge - 206.00 EUR Percent 6,2 3,9 6,5 9,8 9,4 8,7 3,7 1,8 6,6 4,2 7,9
SUM Percent 100,0 100,0 100,0 100,0 100,0 100,0 100,0 100,0 100,0 100,0 100,0
Respondents exposed to this stimuli
Q39: Task 4c: Online store - high value - surcharge
How would you like to pay? The total amount in your basket incl. delivery charges comes to 200.00 EUR.
TNS Infratest Page 79 Payment_Transparency_Tabs_weighted
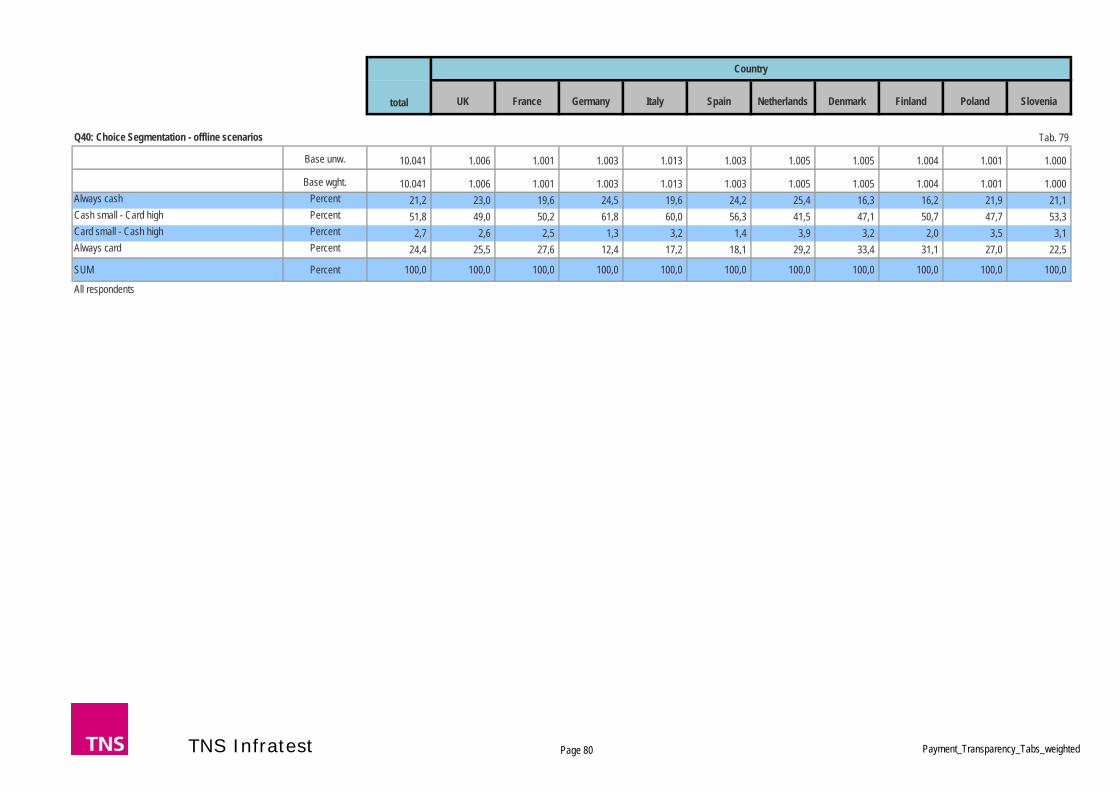
UK France Germany Italy Spain Netherlands Denmark Finland Poland Slovenia
Country
total
Tab. 79
Base unw. 10.041 1.006 1.001 1.003 1.013 1.003 1.005 1.005 1.004 1.001 1.000
Base wght. 10.041 1.006 1.001 1.003 1.013 1.003 1.005 1.005 1.004 1.001 1.000 Always cash Percent 21,2 23,0 19,6 24,5 19,6 24,2 25,4 16,3 16,2 21,9 21,1 Cash small - Card high Percent 51,8 49,0 50,2 61,8 60,0 56,3 41,5 47,1 50,7 47,7 53,3 Card small - Cash high Percent 2,7 2,6 2,5 1,3 3,2 1,4 3,9 3,2 2,0 3,5 3,1 Always card Percent 24,4 25,5 27,6 12,4 17,2 18,1 29,2 33,4 31,1 27,0 22,5
SUM Percent 100,0 100,0 100,0 100,0 100,0 100,0 100,0 100,0 100,0 100,0 100,0
All respondents
Q40: Choice Segmentation - offline scenarios
TNS Infratest Page 80 Payment_Transparency_Tabs_weighted
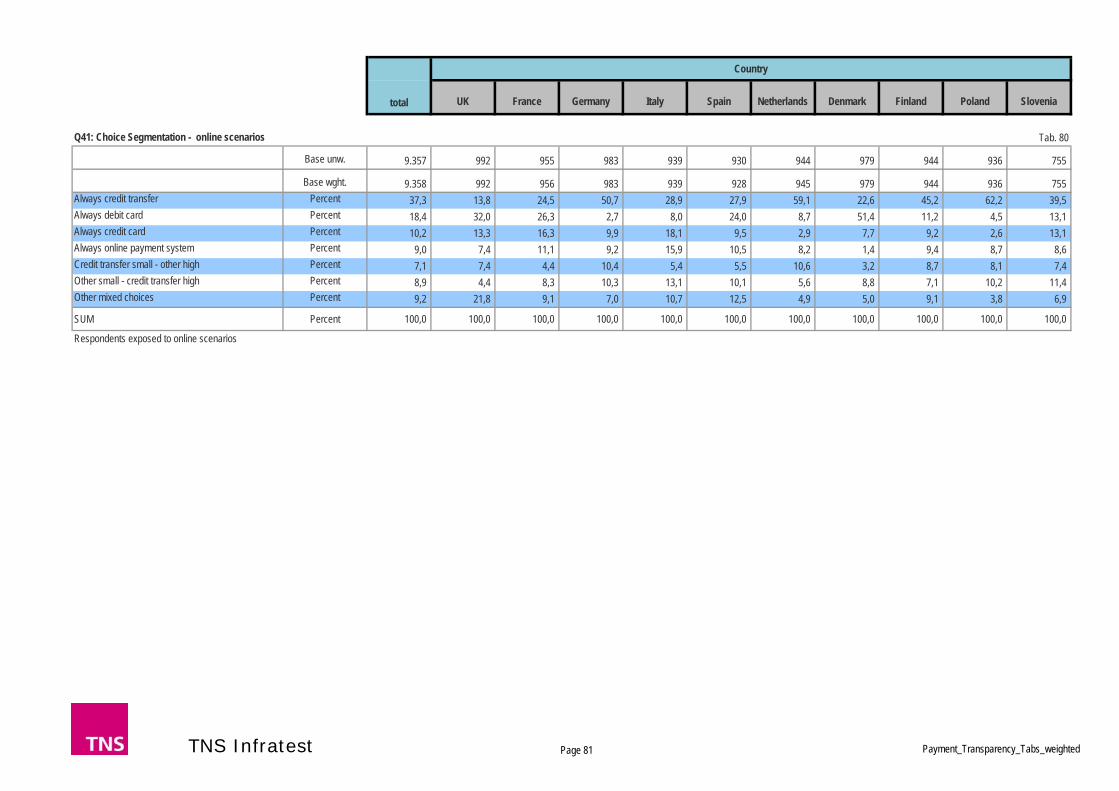
UK France Germany Italy Spain Netherlands Denmark Finland Poland Slovenia
Country
total
Tab. 80
Base unw. 9.357 992 955 983 939 930 944 979 944 936 755
Base wght. 9.358 992 956 983 939 928 945 979 944 936 755 Always credit transfer Percent 37,3 13,8 24,5 50,7 28,9 27,9 59,1 22,6 45,2 62,2 39,5 Always debit card Percent 18,4 32,0 26,3 2,7 8,0 24,0 8,7 51,4 11,2 4,5 13,1 Always credit card Percent 10,2 13,3 16,3 9,9 18,1 9,5 2,9 7,7 9,2 2,6 13,1 Always online payment system Percent 9,0 7,4 11,1 9,2 15,9 10,5 8,2 1,4 9,4 8,7 8,6 Credit transfer small - other high Percent 7,1 7,4 4,4 10,4 5,4 5,5 10,6 3,2 8,7 8,1 7,4 Other small - credit transfer high Percent 8,9 4,4 8,3 10,3 13,1 10,1 5,6 8,8 7,1 10,2 11,4 Other mixed choices Percent 9,2 21,8 9,1 7,0 10,7 12,5 4,9 5,0 9,1 3,8 6,9
SUM Percent 100,0 100,0 100,0 100,0 100,0 100,0 100,0 100,0 100,0 100,0 100,0
Respondents exposed to online scenarios
Q41: Choice Segmentation - online scenarios
TNS Infratest Page 81 Payment_Transparency_Tabs_weighted

UK France Germany Italy Spain Netherlands Denmark Finland Poland Slovenia
Country
total
Tab. 81
Base unw. 10.041 1.006 1.001 1.003 1.013 1.003 1.005 1.005 1.004 1.001 1.000
Base wght. 10.041 1.006 1.001 1.003 1.013 1.003 1.005 1.005 1.004 1.001 1.000 Totally agree Percent 64,0 58,2 61,4 77,9 69,6 73,4 64,8 59,5 45,4 63,3 66,2 Tend to agree Percent 28,5 33,8 31,1 19,5 24,9 21,8 28,9 27,7 39,5 30,7 27,2 Tend to disagree Percent 4,8 5,0 5,2 2,0 3,6 3,1 4,6 6,9 10,5 2,7 4,3 Totally disagree Percent 1,5 0,9 1,7 0,3 0,7 1,1 0,9 4,0 2,5 2,3 1,1 Don't know Percent 1,2 2,1 0,7 0,4 1,3 0,6 0,8 2,0 2,1 1,0 1,2
SUM Percent 100,0 100,0 100,0 100,0 100,0 100,0 100,0 100,0 100,0 100,0 100,0 Mean 1,4 1,5 1,5 1,2 1,3 1,3 1,4 1,5 1,7 1,4 1,4 All respondents
Q42_1: Evaluation of choice exercise - Easy to understand
To what extent do you agree or disagree with each of the following statements about the exercise you just completed?
TNS Infratest Page 82 Payment_Transparency_Tabs_weighted

UK France Germany Italy Spain Netherlands Denmark Finland Poland Slovenia
Country
total
Tab. 82
Base unw. 10.041 1.006 1.001 1.003 1.013 1.003 1.005 1.005 1.004 1.001 1.000
Base wght. 10.041 1.006 1.001 1.003 1.013 1.003 1.005 1.005 1.004 1.001 1.000 Totally agree Percent 61,8 60,1 60,0 70,9 62,8 67,8 64,9 63,1 42,7 63,4 62,1 Tend to agree Percent 28,8 33,0 31,6 22,1 29,0 26,7 28,0 23,6 35,3 30,6 28,6 Tend to disagree Percent 5,8 3,7 5,0 5,2 5,5 3,8 4,1 7,8 13,2 2,9 6,8 Totally disagree Percent 2,0 1,0 2,7 0,7 0,9 1,1 1,2 3,2 6,2 2,1 1,3 Don't know Percent 1,5 2,2 0,7 1,1 1,8 0,7 1,8 2,4 2,6 1,0 1,2
SUM Percent 100,0 100,0 100,0 100,0 100,0 100,0 100,0 100,0 100,0 100,0 100,0 Mean 1,5 1,4 1,5 1,3 1,4 1,4 1,4 1,5 1,8 1,4 1,5 All respondents
Q42_2: Evaluation of choice exercise - Easy to compare
To what extent do you agree or disagree with each of the following statements about the exercise you just completed?
TNS Infratest Page 83 Payment_Transparency_Tabs_weighted

UK France Germany Italy Spain Netherlands Denmark Finland Poland Slovenia
Country
total
Tab. 83
Base unw. 10.041 1.006 1.001 1.003 1.013 1.003 1.005 1.005 1.004 1.001 1.000
Base wght. 10.041 1.006 1.001 1.003 1.013 1.003 1.005 1.005 1.004 1.001 1.000 Totally agree Percent 56,3 54,3 41,5 69,1 60,8 61,1 62,4 57,0 45,0 56,8 55,1 Tend to agree Percent 33,9 36,1 43,7 24,7 33,3 31,9 30,6 27,8 43,8 36,2 31,2 Tend to disagree Percent 4,5 4,5 5,9 3,3 2,9 3,6 3,7 6,5 3,9 2,1 9,1 Totally disagree Percent 1,3 1,4 1,5 0,4 0,7 1,1 0,7 2,0 1,0 2,2 1,7 Don't know Percent 4,0 3,8 7,4 2,5 2,4 2,3 2,6 6,8 6,3 2,7 2,9
SUM Percent 100,0 100,0 100,0 100,0 100,0 100,0 100,0 100,0 100,0 100,0 100,0 Mean 1,5 1,5 1,6 1,3 1,4 1,4 1,4 1,5 1,6 1,5 1,6 All respondents
Q42_3: Evaluation of choice exercise - Best choice
To what extent do you agree or disagree with each of the following statements about the exercise you just completed?
TNS Infratest Page 84 Payment_Transparency_Tabs_weighted
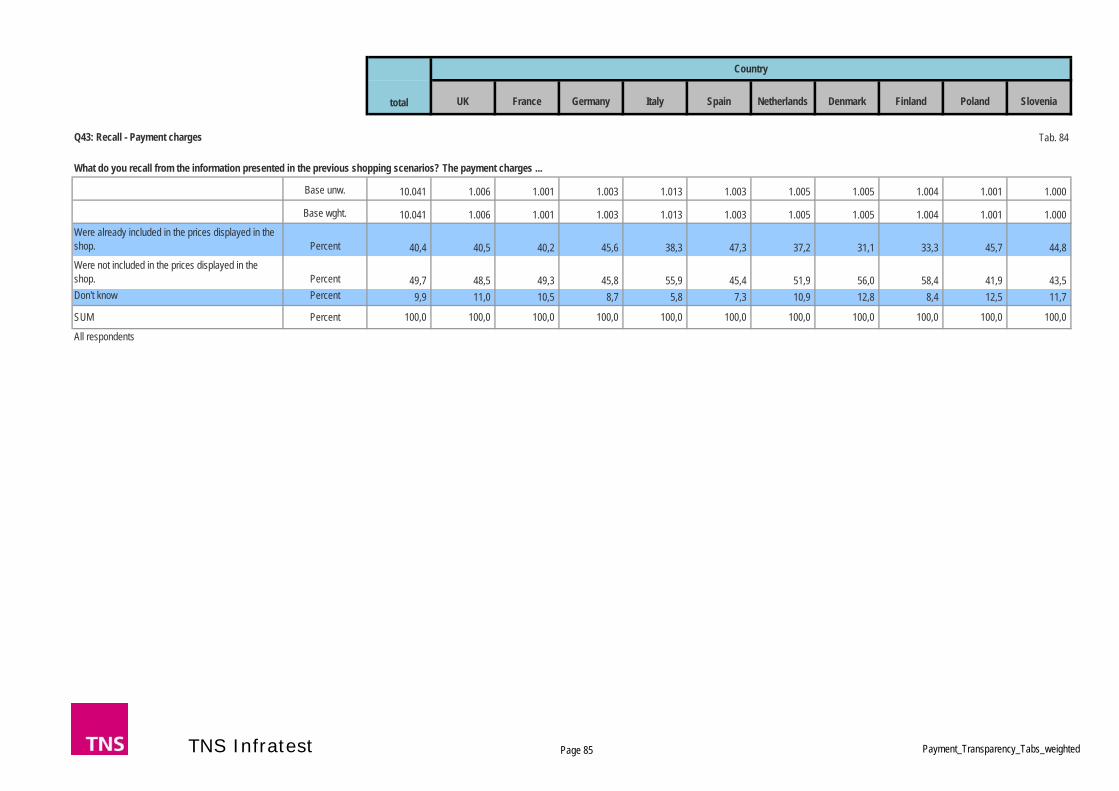
UK France Germany Italy Spain Netherlands Denmark Finland Poland Slovenia
Country
total
Tab. 84
Base unw. 10.041 1.006 1.001 1.003 1.013 1.003 1.005 1.005 1.004 1.001 1.000
Base wght. 10.041 1.006 1.001 1.003 1.013 1.003 1.005 1.005 1.004 1.001 1.000 Were already included in the prices displayed in the shop. Percent 40,4 40,5 40,2 45,6 38,3 47,3 37,2 31,1 33,3 45,7 44,8 Were not included in the prices displayed in the shop. Percent 49,7 48,5 49,3 45,8 55,9 45,4 51,9 56,0 58,4 41,9 43,5 Don't know Percent 9,9 11,0 10,5 8,7 5,8 7,3 10,9 12,8 8,4 12,5 11,7
SUM Percent 100,0 100,0 100,0 100,0 100,0 100,0 100,0 100,0 100,0 100,0 100,0
All respondents
Q43: Recall - Payment charges
What do you recall from the information presented in the previous shopping scenarios? The payment charges ...
TNS Infratest Page 85 Payment_Transparency_Tabs_weighted

UK France Germany Italy Spain Netherlands Denmark Finland Poland Slovenia
Country
total
Tab. 85
Base unw. 10.041 1.006 1.001 1.003 1.013 1.003 1.005 1.005 1.004 1.001 1.000
Base wght. 10.041 1.006 1.001 1.003 1.013 1.003 1.005 1.005 1.004 1.001 1.000 Had to pay a fee to the bank or card company involved. Percent 69,1 65,1 63,3 70,4 74,1 72,6 68,2 60,6 75,2 74,8 66,8 Did not have to pay a fee to the bank or card company involved. Percent 17,3 21,7 27,2 18,4 17,1 16,3 13,3 15,2 13,6 15,0 15,6 Don't know Percent 13,6 13,2 9,4 11,3 8,9 11,2 18,4 24,2 11,2 10,3 17,6
SUM Percent 100,0 100,0 100,0 100,0 100,0 100,0 100,0 100,0 100,0 100,0 100,0
All respondents
Q44: Recall - Steering options
What do you recall from the information presented in the previous shopping scenarios? If you paid with a debit or credit card, then the merchants ...
TNS Infratest Page 86 Payment_Transparency_Tabs_weighted
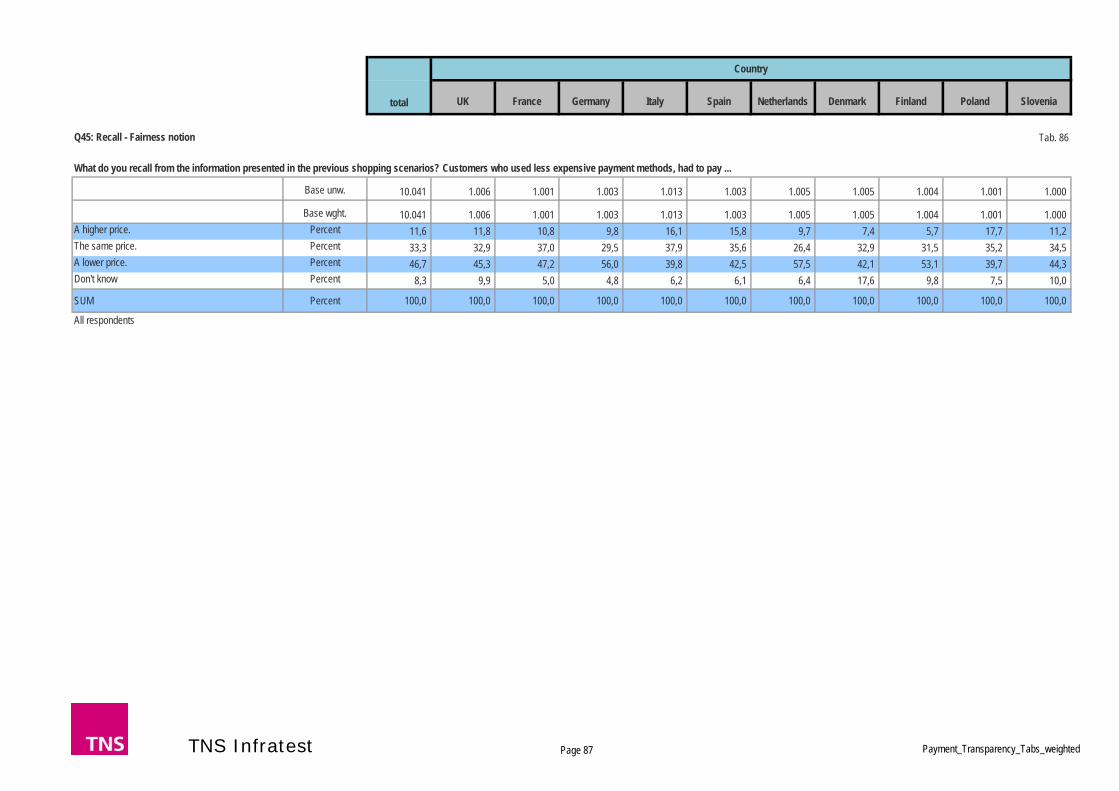
UK France Germany Italy Spain Netherlands Denmark Finland Poland Slovenia
Country
total
Tab. 86
Base unw. 10.041 1.006 1.001 1.003 1.013 1.003 1.005 1.005 1.004 1.001 1.000
Base wght. 10.041 1.006 1.001 1.003 1.013 1.003 1.005 1.005 1.004 1.001 1.000 A higher price. Percent 11,6 11,8 10,8 9,8 16,1 15,8 9,7 7,4 5,7 17,7 11,2 The same price. Percent 33,3 32,9 37,0 29,5 37,9 35,6 26,4 32,9 31,5 35,2 34,5 A lower price. Percent 46,7 45,3 47,2 56,0 39,8 42,5 57,5 42,1 53,1 39,7 44,3 Don't know Percent 8,3 9,9 5,0 4,8 6,2 6,1 6,4 17,6 9,8 7,5 10,0
SUM Percent 100,0 100,0 100,0 100,0 100,0 100,0 100,0 100,0 100,0 100,0 100,0
All respondents
Q45: Recall - Fairness notion
What do you recall from the information presented in the previous shopping scenarios? Customers who used less expensive payment methods, had to pay ...
TNS Infratest Page 87 Payment_Transparency_Tabs_weighted
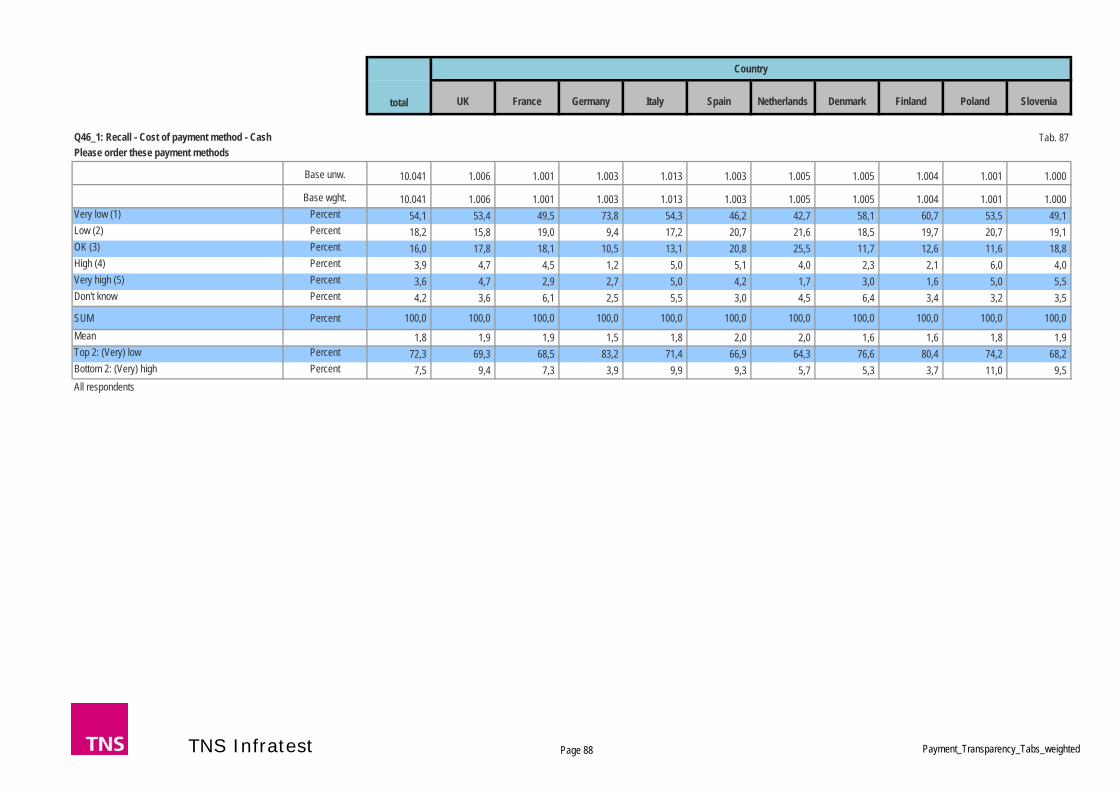
UK France Germany Italy Spain Netherlands Denmark Finland Poland Slovenia
Country
total
Tab. 87
Base unw. 10.041 1.006 1.001 1.003 1.013 1.003 1.005 1.005 1.004 1.001 1.000
Base wght. 10.041 1.006 1.001 1.003 1.013 1.003 1.005 1.005 1.004 1.001 1.000 Very low (1) Percent 54,1 53,4 49,5 73,8 54,3 46,2 42,7 58,1 60,7 53,5 49,1 Low (2) Percent 18,2 15,8 19,0 9,4 17,2 20,7 21,6 18,5 19,7 20,7 19,1 OK (3) Percent 16,0 17,8 18,1 10,5 13,1 20,8 25,5 11,7 12,6 11,6 18,8 High (4) Percent 3,9 4,7 4,5 1,2 5,0 5,1 4,0 2,3 2,1 6,0 4,0 Very high (5) Percent 3,6 4,7 2,9 2,7 5,0 4,2 1,7 3,0 1,6 5,0 5,5 Don't know Percent 4,2 3,6 6,1 2,5 5,5 3,0 4,5 6,4 3,4 3,2 3,5
SUM Percent 100,0 100,0 100,0 100,0 100,0 100,0 100,0 100,0 100,0 100,0 100,0 Mean 1,8 1,9 1,9 1,5 1,8 2,0 2,0 1,6 1,6 1,8 1,9 Top 2: (Very) low Percent 72,3 69,3 68,5 83,2 71,4 66,9 64,3 76,6 80,4 74,2 68,2 Bottom 2: (Very) high Percent 7,5 9,4 7,3 3,9 9,9 9,3 5,7 5,3 3,7 11,0 9,5 All respondents
Q46_1: Recall - Cost of payment method - CashPlease order these payment methods
TNS Infratest Page 88 Payment_Transparency_Tabs_weighted

UK France Germany Italy Spain Netherlands Denmark Finland Poland Slovenia
Country
total
Tab. 88
Base unw. 10.041 1.006 1.001 1.003 1.013 1.003 1.005 1.005 1.004 1.001 1.000
Base wght. 10.041 1.006 1.001 1.003 1.013 1.003 1.005 1.005 1.004 1.001 1.000 Very low (1) Percent 4,7 7,2 2,8 5,9 7,4 5,0 2,7 4,0 3,6 4,8 4,1 Low (2) Percent 14,9 14,8 10,3 15,7 14,5 14,5 12,7 16,7 20,8 12,6 16,0 OK (3) Percent 40,8 47,5 36,1 34,6 37,7 39,9 42,8 45,6 45,4 41,0 37,7 High (4) Percent 28,1 24,3 30,6 28,2 23,5 32,2 35,8 23,6 25,2 28,3 29,8 Very high (5) Percent 5,6 4,3 10,0 5,8 5,1 6,0 2,8 5,5 2,7 8,9 5,4 Don't know Percent 5,8 2,0 10,2 9,9 11,9 2,5 3,2 4,7 2,3 4,5 7,0
SUM Percent 100,0 100,0 100,0 100,0 100,0 100,0 100,0 100,0 100,0 100,0 100,0 Mean 3,2 3,0 3,4 3,1 3,1 3,2 3,2 3,1 3,0 3,2 3,2 Top 2: (Very) low Percent 19,6 22,0 13,1 21,5 21,9 19,5 15,4 20,7 24,4 17,4 20,1 Bottom 2: (Very) high Percent 33,8 28,5 40,6 34,0 28,6 38,2 38,6 29,1 27,9 37,2 35,2 All respondents
Q46_2: Recall - Cost of payment method - Debit cardPlease order these payment methods
TNS Infratest Page 89 Payment_Transparency_Tabs_weighted

UK France Germany Italy Spain Netherlands Denmark Finland Poland Slovenia
Country
total
Tab. 89
Base unw. 10.041 1.006 1.001 1.003 1.013 1.003 1.005 1.005 1.004 1.001 1.000
Base wght. 10.041 1.006 1.001 1.003 1.013 1.003 1.005 1.005 1.004 1.001 1.000 Very low (1) Percent 3,0 2,4 2,9 4,3 5,7 3,2 1,8 2,4 0,9 2,8 3,7 Low (2) Percent 7,6 6,9 7,1 10,1 10,7 7,6 3,7 6,4 5,9 8,8 8,5 OK (3) Percent 27,8 26,3 32,1 27,7 36,0 27,8 14,3 31,7 24,2 25,9 31,5 High (4) Percent 38,5 40,5 38,2 41,6 33,4 41,5 38,5 35,4 44,5 36,9 34,7 Very high (5) Percent 16,8 18,1 14,8 14,6 11,5 16,1 29,0 12,9 19,8 15,9 15,8 Don't know Percent 6,3 5,9 4,8 1,8 2,8 3,8 12,9 11,1 4,7 9,8 5,8
SUM Percent 100,0 100,0 100,0 100,0 100,0 100,0 100,0 100,0 100,0 100,0 100,0 Mean 3,6 3,7 3,6 3,5 3,4 3,6 4,0 3,6 3,8 3,6 3,5 Top 2: (Very) low Percent 10,6 9,3 10,0 14,4 16,4 10,8 5,4 8,8 6,8 11,6 12,2 Bottom 2: (Very) high Percent 55,4 58,6 53,0 56,1 44,8 57,6 67,5 48,4 64,4 52,8 50,5 All respondents
Q46_3: Recall - Cost of payment method - Credit cardPlease order these payment methods
TNS Infratest Page 90 Payment_Transparency_Tabs_weighted

UK France Germany Italy Spain Netherlands Denmark Finland Poland Slovenia
Country
total
Tab. 90
Base unw. 10.041 1.006 1.001 1.003 1.013 1.003 1.005 1.005 1.004 1.001 1.000
Base wght. 10.041 1.006 1.001 1.003 1.013 1.003 1.005 1.005 1.004 1.001 1.000 Very low (1) Percent 24,1 20,6 20,4 43,0 20,8 15,9 23,6 25,6 28,8 28,5 14,3 Low (2) Percent 25,3 18,0 24,6 28,5 23,6 25,7 27,6 27,5 27,6 28,9 21,4 OK (3) Percent 26,7 23,3 30,0 19,3 30,9 28,7 34,1 25,6 23,6 24,7 27,0 High (4) Percent 13,0 12,8 14,7 5,9 13,9 19,8 8,9 11,1 12,7 10,1 20,4 Very high (5) Percent 4,9 6,9 4,8 2,1 5,3 6,3 1,8 4,1 3,6 6,0 7,7 Don't know Percent 5,9 18,5 5,6 1,2 5,5 3,6 3,9 6,2 3,8 1,9 9,2
SUM Percent 100,0 100,0 100,0 100,0 100,0 100,0 100,0 100,0 100,0 100,0 100,0 Mean 2,5 2,6 2,6 1,9 2,6 2,7 2,4 2,4 2,3 2,3 2,8 Top 2: (Very) low Percent 49,5 38,6 44,9 71,5 44,4 41,6 51,2 53,0 56,4 57,4 35,7 Bottom 2: (Very) high Percent 17,9 19,7 19,5 8,0 19,2 26,1 10,7 15,2 16,2 16,1 28,1 All respondents
Q46_4: Recall - Cost of payment method - Credit transferPlease order these payment methods
TNS Infratest Page 91 Payment_Transparency_Tabs_weighted
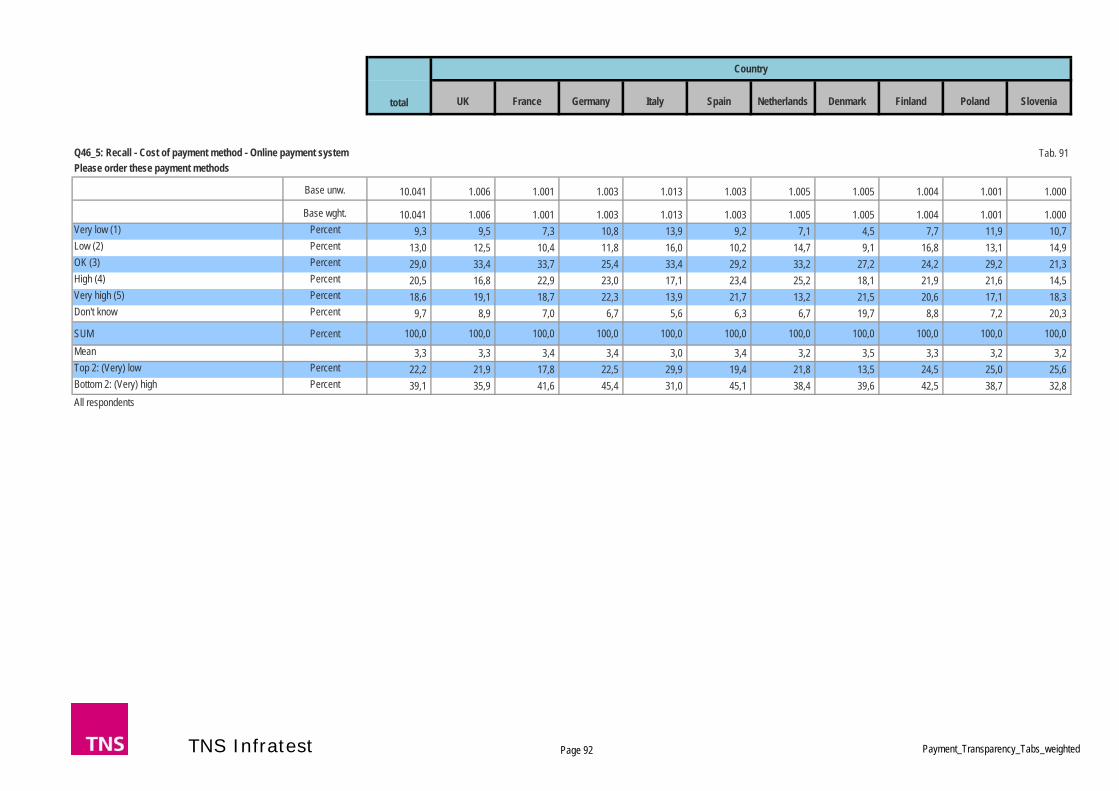
UK France Germany Italy Spain Netherlands Denmark Finland Poland Slovenia
Country
total
Tab. 91
Base unw. 10.041 1.006 1.001 1.003 1.013 1.003 1.005 1.005 1.004 1.001 1.000
Base wght. 10.041 1.006 1.001 1.003 1.013 1.003 1.005 1.005 1.004 1.001 1.000 Very low (1) Percent 9,3 9,5 7,3 10,8 13,9 9,2 7,1 4,5 7,7 11,9 10,7 Low (2) Percent 13,0 12,5 10,4 11,8 16,0 10,2 14,7 9,1 16,8 13,1 14,9 OK (3) Percent 29,0 33,4 33,7 25,4 33,4 29,2 33,2 27,2 24,2 29,2 21,3 High (4) Percent 20,5 16,8 22,9 23,0 17,1 23,4 25,2 18,1 21,9 21,6 14,5 Very high (5) Percent 18,6 19,1 18,7 22,3 13,9 21,7 13,2 21,5 20,6 17,1 18,3 Don't know Percent 9,7 8,9 7,0 6,7 5,6 6,3 6,7 19,7 8,8 7,2 20,3
SUM Percent 100,0 100,0 100,0 100,0 100,0 100,0 100,0 100,0 100,0 100,0 100,0 Mean 3,3 3,3 3,4 3,4 3,0 3,4 3,2 3,5 3,3 3,2 3,2 Top 2: (Very) low Percent 22,2 21,9 17,8 22,5 29,9 19,4 21,8 13,5 24,5 25,0 25,6 Bottom 2: (Very) high Percent 39,1 35,9 41,6 45,4 31,0 45,1 38,4 39,6 42,5 38,7 32,8 All respondents
Q46_5: Recall - Cost of payment method - Online payment systemPlease order these payment methods
TNS Infratest Page 92 Payment_Transparency_Tabs_weighted
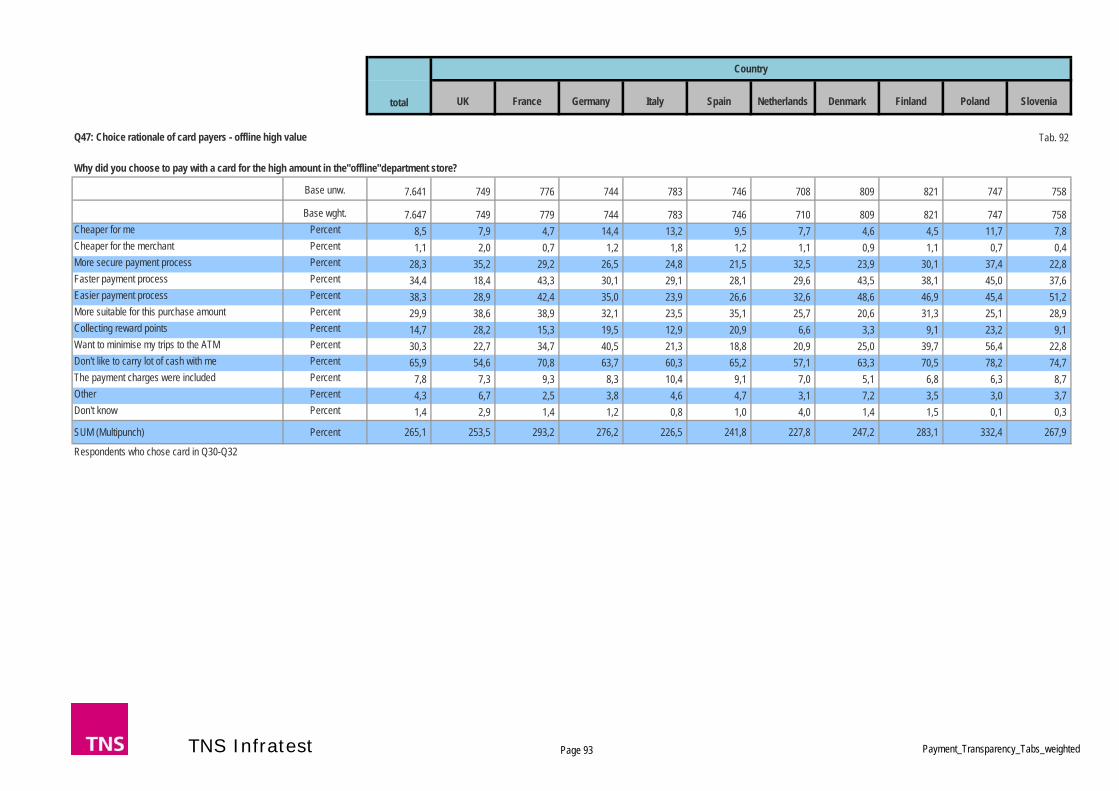
UK France Germany Italy Spain Netherlands Denmark Finland Poland Slovenia
Country
total
Tab. 92
Base unw. 7.641 749 776 744 783 746 708 809 821 747 758
Base wght. 7.647 749 779 744 783 746 710 809 821 747 758 Cheaper for me Percent 8,5 7,9 4,7 14,4 13,2 9,5 7,7 4,6 4,5 11,7 7,8 Cheaper for the merchant Percent 1,1 2,0 0,7 1,2 1,8 1,2 1,1 0,9 1,1 0,7 0,4 More secure payment process Percent 28,3 35,2 29,2 26,5 24,8 21,5 32,5 23,9 30,1 37,4 22,8 Faster payment process Percent 34,4 18,4 43,3 30,1 29,1 28,1 29,6 43,5 38,1 45,0 37,6 Easier payment process Percent 38,3 28,9 42,4 35,0 23,9 26,6 32,6 48,6 46,9 45,4 51,2 More suitable for this purchase amount Percent 29,9 38,6 38,9 32,1 23,5 35,1 25,7 20,6 31,3 25,1 28,9 Collecting reward points Percent 14,7 28,2 15,3 19,5 12,9 20,9 6,6 3,3 9,1 23,2 9,1 Want to minimise my trips to the ATM Percent 30,3 22,7 34,7 40,5 21,3 18,8 20,9 25,0 39,7 56,4 22,8 Don't like to carry lot of cash with me Percent 65,9 54,6 70,8 63,7 60,3 65,2 57,1 63,3 70,5 78,2 74,7 The payment charges were included Percent 7,8 7,3 9,3 8,3 10,4 9,1 7,0 5,1 6,8 6,3 8,7 Other Percent 4,3 6,7 2,5 3,8 4,6 4,7 3,1 7,2 3,5 3,0 3,7 Don't know Percent 1,4 2,9 1,4 1,2 0,8 1,0 4,0 1,4 1,5 0,1 0,3
SUM (Multipunch) Percent 265,1 253,5 293,2 276,2 226,5 241,8 227,8 247,2 283,1 332,4 267,9
Respondents who chose card in Q30-Q32
Q47: Choice rationale of card payers - offline high value
Why did you choose to pay with a card for the high amount in the"offline"department store?
TNS Infratest Page 93 Payment_Transparency_Tabs_weighted

UK France Germany Italy Spain Netherlands Denmark Finland Poland Slovenia
Country
total
Tab. 93
Base unw. 2.720 282 307 137 207 195 331 368 332 305 256
Base wght. 2.716 282 302 137 207 195 332 368 332 305 256 Cheaper for me Percent 10,9 13,1 7,7 16,1 19,7 11,0 16,2 4,1 6,0 15,5 5,9 Cheaper for the merchant Percent 1,8 5,0 1,0 4,4 1,5 1,5 2,1 0,5 1,2 1,3 1,6 More secure payment process Percent 21,1 16,0 16,9 21,2 18,3 18,5 30,2 17,4 21,7 29,1 19,5 Faster payment process Percent 36,9 20,9 35,0 34,3 24,7 26,7 31,5 50,5 47,9 48,1 35,6 Easier payment process Percent 46,9 38,7 39,9 42,3 28,0 29,3 48,1 57,3 59,0 51,5 57,0 More suitable for this purchase amount Percent 15,1 17,4 10,5 16,8 12,6 13,2 18,2 10,6 22,0 11,8 18,0 Collecting reward points Percent 13,5 22,7 16,9 18,3 9,6 26,2 5,9 3,5 11,1 20,6 9,4 Want to minimise my trips to the ATM Percent 37,0 29,8 38,7 44,5 32,8 37,3 21,2 29,6 50,6 53,7 35,1 Don't like to carry lot of cash with me Percent 44,1 37,2 52,4 41,6 40,5 44,3 35,7 37,5 52,4 45,2 53,9 The payment charges were included Percent 7,6 10,3 9,4 11,0 12,0 9,7 7,5 4,1 5,1 6,9 4,7 Other Percent 6,0 4,6 5,8 5,8 10,2 6,0 2,4 10,1 3,9 6,2 5,9 Don't know Percent 2,5 3,6 2,8 1,5 1,0 2,0 5,5 3,5 1,8 1,2
SUM (Multipunch) Percent 243,3 219,2 237,0 257,7 210,8 225,9 224,5 228,8 282,8 289,9 247,6
Respondents who chose card in Q27-Q29
Q48: Choice rationale of card payers - offline small value
Why did you choose to pay with a card for the small amount in the"offline"department store?
TNS Infratest Page 94 Payment_Transparency_Tabs_weighted
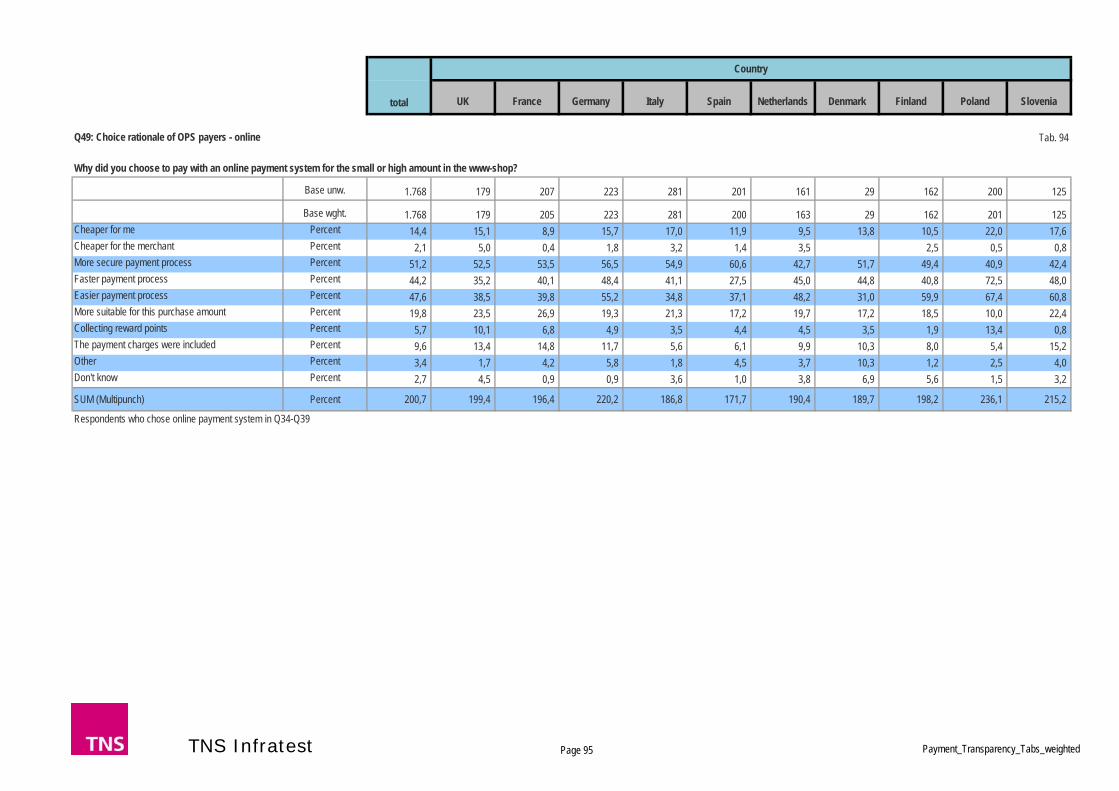
UK France Germany Italy Spain Netherlands Denmark Finland Poland Slovenia
Country
total
Tab. 94
Base unw. 1.768 179 207 223 281 201 161 29 162 200 125
Base wght. 1.768 179 205 223 281 200 163 29 162 201 125 Cheaper for me Percent 14,4 15,1 8,9 15,7 17,0 11,9 9,5 13,8 10,5 22,0 17,6 Cheaper for the merchant Percent 2,1 5,0 0,4 1,8 3,2 1,4 3,5 2,5 0,5 0,8 More secure payment process Percent 51,2 52,5 53,5 56,5 54,9 60,6 42,7 51,7 49,4 40,9 42,4 Faster payment process Percent 44,2 35,2 40,1 48,4 41,1 27,5 45,0 44,8 40,8 72,5 48,0 Easier payment process Percent 47,6 38,5 39,8 55,2 34,8 37,1 48,2 31,0 59,9 67,4 60,8 More suitable for this purchase amount Percent 19,8 23,5 26,9 19,3 21,3 17,2 19,7 17,2 18,5 10,0 22,4 Collecting reward points Percent 5,7 10,1 6,8 4,9 3,5 4,4 4,5 3,5 1,9 13,4 0,8 The payment charges were included Percent 9,6 13,4 14,8 11,7 5,6 6,1 9,9 10,3 8,0 5,4 15,2 Other Percent 3,4 1,7 4,2 5,8 1,8 4,5 3,7 10,3 1,2 2,5 4,0 Don't know Percent 2,7 4,5 0,9 0,9 3,6 1,0 3,8 6,9 5,6 1,5 3,2
SUM (Multipunch) Percent 200,7 199,4 196,4 220,2 186,8 171,7 190,4 189,7 198,2 236,1 215,2
Respondents who chose online payment system in Q34-Q39
Q49: Choice rationale of OPS payers - online
Why did you choose to pay with an online payment system for the small or high amount in the www-shop?
TNS Infratest Page 95 Payment_Transparency_Tabs_weighted

UK France Germany Italy Spain Netherlands Denmark Finland Poland Slovenia
Country
total
Tab. 95
Base unw. 10.041 1.006 1.001 1.003 1.013 1.003 1.005 1.005 1.004 1.001 1.000
Base wght. 10.041 1.006 1.001 1.003 1.013 1.003 1.005 1.005 1.004 1.001 1.000 Selected Percent 3,0 3,5 3,2 2,3 5,0 4,1 2,3 1,7 1,4 3,4 2,9 Not selected Percent 97,0 96,5 96,8 97,7 95,1 95,9 97,8 98,3 98,6 96,6 97,1
SUM Percent 100,0 100,0 100,0 100,0 100,0 100,0 100,0 100,0 100,0 100,0 100,0
All respondents
Q50a: Experience with surcharges - Cash
Looking back over the past 2 years, have you related to the choice of a specific payment method, when shopping online or offline?
TNS Infratest Page 96 Payment_Transparency_Tabs_weighted
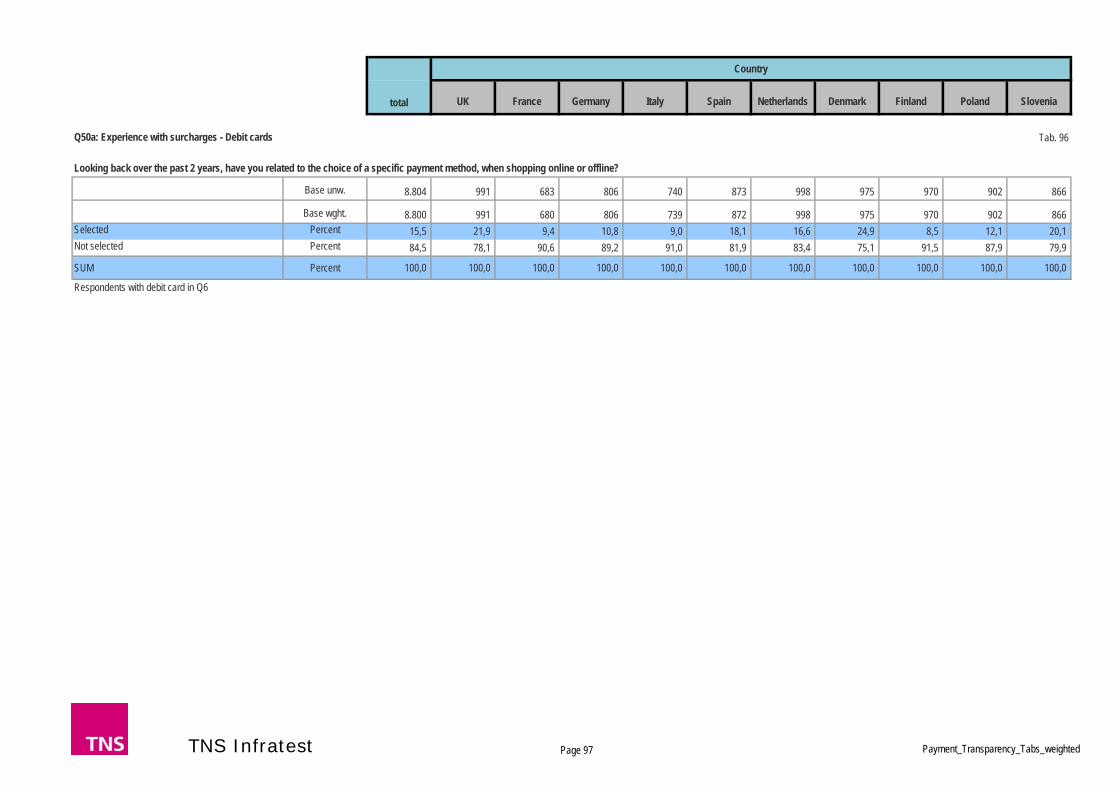
UK France Germany Italy Spain Netherlands Denmark Finland Poland Slovenia
Country
total
Tab. 96
Base unw. 8.804 991 683 806 740 873 998 975 970 902 866
Base wght. 8.800 991 680 806 739 872 998 975 970 902 866 Selected Percent 15,5 21,9 9,4 10,8 9,0 18,1 16,6 24,9 8,5 12,1 20,1 Not selected Percent 84,5 78,1 90,6 89,2 91,0 81,9 83,4 75,1 91,5 87,9 79,9
SUM Percent 100,0 100,0 100,0 100,0 100,0 100,0 100,0 100,0 100,0 100,0 100,0
Respondents with debit card in Q6
Q50a: Experience with surcharges - Debit cards
Looking back over the past 2 years, have you related to the choice of a specific payment method, when shopping online or offline?
TNS Infratest Page 97 Payment_Transparency_Tabs_weighted

UK France Germany Italy Spain Netherlands Denmark Finland Poland Slovenia
Country
total
Tab. 97
Base unw. 6.217 717 480 876 789 653 483 472 657 516 574
Base wght. 6.211 716 482 876 788 653 476 472 658 516 574 Selected Percent 28,7 52,9 11,7 29,5 17,7 27,5 42,1 39,0 17,7 15,5 32,6 Not selected Percent 71,4 47,1 88,3 70,5 82,3 72,5 57,9 61,0 82,3 84,5 67,4
SUM Percent 100,0 100,0 100,0 100,0 100,0 100,0 100,0 100,0 100,0 100,0 100,0
Respondents with credit card in Q6
Q50a: Experience with surcharges - Credit cards
Looking back over the past 2 years, have you related to the choice of a specific payment method, when shopping online or offline?
TNS Infratest Page 98 Payment_Transparency_Tabs_weighted

UK France Germany Italy Spain Netherlands Denmark Finland Poland Slovenia
Country
total
Tab. 98
Base unw. 4.255 693 434 613 586 547 158 223 259 567 175
Base wght. 4.255 693 434 613 586 544 158 223 259 568 175 Selected Percent 18,2 15,5 9,4 23,4 19,0 22,7 28,3 31,4 15,1 7,4 30,3 Not selected Percent 81,8 84,5 90,6 76,7 81,1 77,3 71,7 68,6 84,9 92,6 69,7
SUM Percent 100,0 100,0 100,0 100,0 100,0 100,0 100,0 100,0 100,0 100,0 100,0
Respondents with online payment system in Q6
Q50a: Experience with surcharges - Online payment systems such as PayPal, Smart2Pay
Looking back over the past 2 years, have you related to the choice of a specific payment method, when shopping online or offline?
TNS Infratest Page 99 Payment_Transparency_Tabs_weighted

UK France Germany Italy Spain Netherlands Denmark Finland Poland Slovenia
Country
total
Tab. 99
Base unw. 2.595 719 847 59 677 137 17 108 2 11 18
Base wght. 2.577 718 830 59 675 138 17 108 2 11 18 Selected Percent 7,1 6,7 5,0 15,3 6,3 14,5 35,2 11,1 49,9 18,1 5,6 Not selected Percent 92,9 93,3 95,0 84,7 93,7 85,5 64,8 88,9 50,1 81,9 94,5
SUM Percent 100,0 100,0 100,0 100,0 100,0 100,0 100,0 100,0 100,0 100,0 100,0
Respondents with chequebook in Q6
Q50a: Experience with surcharges - Cheque
Looking back over the past 2 years, have you related to the choice of a specific payment method, when shopping online or offline?
TNS Infratest Page 100 Payment_Transparency_Tabs_weighted

UK France Germany Italy Spain Netherlands Denmark Finland Poland Slovenia
Country
total
Tab. 100
Base unw. 1.657 213 81 485 60 54 151 159 219 185 50
Base wght. 1.663 213 87 485 60 53 152 159 219 185 50 Selected Percent 11,2 9,4 12,3 8,3 18,4 22,8 5,7 18,2 6,4 13,6 32,0 Not selected Percent 88,8 90,6 87,7 91,7 81,6 77,2 94,3 81,8 93,6 86,4 68,0
SUM Percent 100,0 100,0 100,0 100,0 100,0 100,0 100,0 100,0 100,0 100,0 100,0
Respondents who use direct debit in Q16
Q50a: Experience with surcharges - Direct debit
Looking back over the past 2 years, have you related to the choice of a specific payment method, when shopping online or offline?
TNS Infratest Page 101 Payment_Transparency_Tabs_weighted

UK France Germany Italy Spain Netherlands Denmark Finland Poland Slovenia
Country
total
Tab. 101
Base unw. 2.595 30 18 397 132 100 807 273 430 218 190
Base wght. 2.598 30 19 397 132 100 809 273 430 218 190 Selected Percent 13,8 30,1 23,6 10,6 14,4 26,7 12,8 7,3 13,7 8,7 29,0 Not selected Percent 86,3 69,9 76,4 89,4 85,7 73,3 87,3 92,7 86,3 91,3 71,1
SUM Percent 100,0 100,0 100,0 100,0 100,0 100,0 100,0 100,0 100,0 100,0 100,0
Respondents who use credit transfer in Q16
Q50a: Experience with surcharges - Credit transfer
Looking back over the past 2 years, have you related to the choice of a specific payment method, when shopping online or offline?
TNS Infratest Page 102 Payment_Transparency_Tabs_weighted

UK France Germany Italy Spain Netherlands Denmark Finland Poland Slovenia
Country
total
Tab. 102
Base unw. 10.041 1.006 1.001 1.003 1.013 1.003 1.005 1.005 1.004 1.001 1.000
Base wght. 10.041 1.006 1.001 1.003 1.013 1.003 1.005 1.005 1.004 1.001 1.000 Selected Percent 20,7 12,7 11,3 24,1 22,1 20,0 10,0 7,6 14,2 23,2 62,3 Not selected Percent 79,3 87,3 88,7 75,9 77,9 80,0 90,0 92,4 85,8 76,8 37,7
SUM Percent 100,0 100,0 100,0 100,0 100,0 100,0 100,0 100,0 100,0 100,0 100,0
All respondents
Q50b: Experience with rebates - Cash
Looking back over the past 2 years, have you related to the choice of a specific payment method, when shopping online or offline?
TNS Infratest Page 103 Payment_Transparency_Tabs_weighted

UK France Germany Italy Spain Netherlands Denmark Finland Poland Slovenia
Country
total
Tab. 103
Base unw. 8.804 991 683 806 740 873 998 975 970 902 866
Base wght. 8.800 991 680 806 739 872 998 975 970 902 866 Selected Percent 8,3 7,0 5,7 5,8 9,5 12,1 5,6 4,9 8,3 17,4 6,6 Not selected Percent 91,7 93,0 94,3 94,2 90,6 87,9 94,4 95,1 91,7 82,7 93,4
SUM Percent 100,0 100,0 100,0 100,0 100,0 100,0 100,0 100,0 100,0 100,0 100,0
Respondents with debit card in Q6
Q50b: Experience with rebates - Debit cards
Looking back over the past 2 years, have you related to the choice of a specific payment method, when shopping online or offline?
TNS Infratest Page 104 Payment_Transparency_Tabs_weighted

UK France Germany Italy Spain Netherlands Denmark Finland Poland Slovenia
Country
total
Tab. 104
Base unw. 6.217 717 480 876 789 653 483 472 657 516 574
Base wght. 6.211 716 482 876 788 653 476 472 658 516 574 Selected Percent 10,8 6,8 7,3 9,8 16,3 14,2 4,8 7,4 6,2 26,3 7,8 Not selected Percent 89,2 93,2 92,7 90,2 83,7 85,8 95,2 92,6 93,8 73,7 92,2
SUM Percent 100,0 100,0 100,0 100,0 100,0 100,0 100,0 100,0 100,0 100,0 100,0
Respondents with credit card in Q6
Q50b: Experience with rebates - Credit cards
Looking back over the past 2 years, have you related to the choice of a specific payment method, when shopping online or offline?
TNS Infratest Page 105 Payment_Transparency_Tabs_weighted

UK France Germany Italy Spain Netherlands Denmark Finland Poland Slovenia
Country
total
Tab. 105
Base unw. 4.255 693 434 613 586 547 158 223 259 567 175
Base wght. 4.255 693 434 613 586 544 158 223 259 568 175 Selected Percent 10,2 5,4 6,5 11,6 15,1 9,5 10,4 4,5 7,7 15,7 12,6 Not selected Percent 89,8 94,7 93,5 88,4 84,9 90,5 89,6 95,5 92,3 84,3 87,4
SUM Percent 100,0 100,0 100,0 100,0 100,0 100,0 100,0 100,0 100,0 100,0 100,0
Respondents with Online payment system in Q6
Q50b: Experience with rebates - Online payment systems such as PayPal, Smart2Pay
Looking back over the past 2 years, have you related to the choice of a specific payment method, when shopping online or offline?
TNS Infratest Page 106 Payment_Transparency_Tabs_weighted

UK France Germany Italy Spain Netherlands Denmark Finland Poland Slovenia
Country
total
Tab. 106
Base unw. 2.595 719 847 59 677 137 17 108 2 11 18
Base wght. 2.577 718 830 59 675 138 17 108 2 11 18 Selected Percent 4,0 3,2 3,5 5,1 5,5 3,7 11,6 1,9 9,3 Not selected Percent 96,1 96,8 96,5 94,9 94,5 96,4 88,4 98,2 100,0 90,8 100,0
SUM Percent 100,0 100,0 100,0 100,0 100,0 100,0 100,0 100,0 100,0 100,0 100,0
Respondents with chequebook in Q6
Q50b: Experience with rebates - Cheque
Looking back over the past 2 years, have you related to the choice of a specific payment method, when shopping online or offline?
TNS Infratest Page 107 Payment_Transparency_Tabs_weighted

UK France Germany Italy Spain Netherlands Denmark Finland Poland Slovenia
Country
total
Tab. 107
Base unw. 1.657 213 81 485 60 54 151 159 219 185 50
Base wght. 1.663 213 87 485 60 53 152 159 219 185 50 Selected Percent 15,7 27,2 13,3 16,1 21,8 10,9 18,3 11,3 6,4 15,7 12,0 Not selected Percent 84,3 72,8 86,8 83,9 78,3 89,1 81,8 88,7 93,6 84,3 88,0
SUM Percent 100,0 100,0 100,0 100,0 100,0 100,0 100,0 100,0 100,0 100,0 100,0
Respondents who use direct debit in Q16
Q50b: Experience with rebates - Direct debit
Looking back over the past 2 years, have you related to the choice of a specific payment method, when shopping online or offline?
TNS Infratest Page 108 Payment_Transparency_Tabs_weighted

UK France Germany Italy Spain Netherlands Denmark Finland Poland Slovenia
Country
total
Tab. 108
Base unw. 2.595 30 18 397 132 100 807 273 430 218 190
Base wght. 2.598 30 19 397 132 100 809 273 430 218 190 Selected Percent 12,4 10,0 4,5 16,4 20,6 20,8 11,9 4,4 7,9 18,0 13,2 Not selected Percent 87,6 90,0 95,5 83,6 79,4 79,2 88,1 95,6 92,1 82,0 86,8
SUM Percent 100,0 100,0 100,0 100,0 100,0 100,0 100,0 100,0 100,0 100,0 100,0
Respondents who use credit transfer in Q16
Q50b: Experience with rebates - Credit transfer
Looking back over the past 2 years, have you related to the choice of a specific payment method, when shopping online or offline?
TNS Infratest Page 109 Payment_Transparency_Tabs_weighted

UK France Germany Italy Spain Netherlands Denmark Finland Poland Slovenia
Country
total
Tab. 109
Base unw. 10.041 1.006 1.001 1.003 1.013 1.003 1.005 1.005 1.004 1.001 1.000
Base wght. 10.041 1.006 1.001 1.003 1.013 1.003 1.005 1.005 1.004 1.001 1.000 Selected Percent 76,4 84,5 85,3 73,9 73,1 76,0 87,9 90,1 84,3 73,4 35,2 Not selected Percent 23,6 15,5 14,7 26,1 26,9 24,0 12,1 10,0 15,7 26,6 64,8
SUM Percent 100,0 100,0 100,0 100,0 100,0 100,0 100,0 100,0 100,0 100,0 100,0
All respondents
Q50c: No experience with surcharges/rebates - Cash
Looking back over the past 2 years, have you related to the choice of a specific payment method, when shopping online or offline?
TNS Infratest Page 110 Payment_Transparency_Tabs_weighted

UK France Germany Italy Spain Netherlands Denmark Finland Poland Slovenia
Country
total
Tab. 110
Base unw. 8.804 991 683 806 740 873 998 975 970 902 866
Base wght. 8.800 991 680 806 739 872 998 975 970 902 866 Selected Percent 76,4 72,0 85,1 83,5 82,1 70,3 78,3 70,5 83,2 70,9 72,4 Not selected Percent 23,6 28,0 14,9 16,5 17,9 29,8 21,7 29,5 16,8 29,1 27,6
SUM Percent 100,0 100,0 100,0 100,0 100,0 100,0 100,0 100,0 100,0 100,0 100,0
Respondents with debit card in Q6
Q50c: No experience with surcharges/rebates - Debit cards
Looking back over the past 2 years, have you related to the choice of a specific payment method, when shopping online or offline?
TNS Infratest Page 111 Payment_Transparency_Tabs_weighted
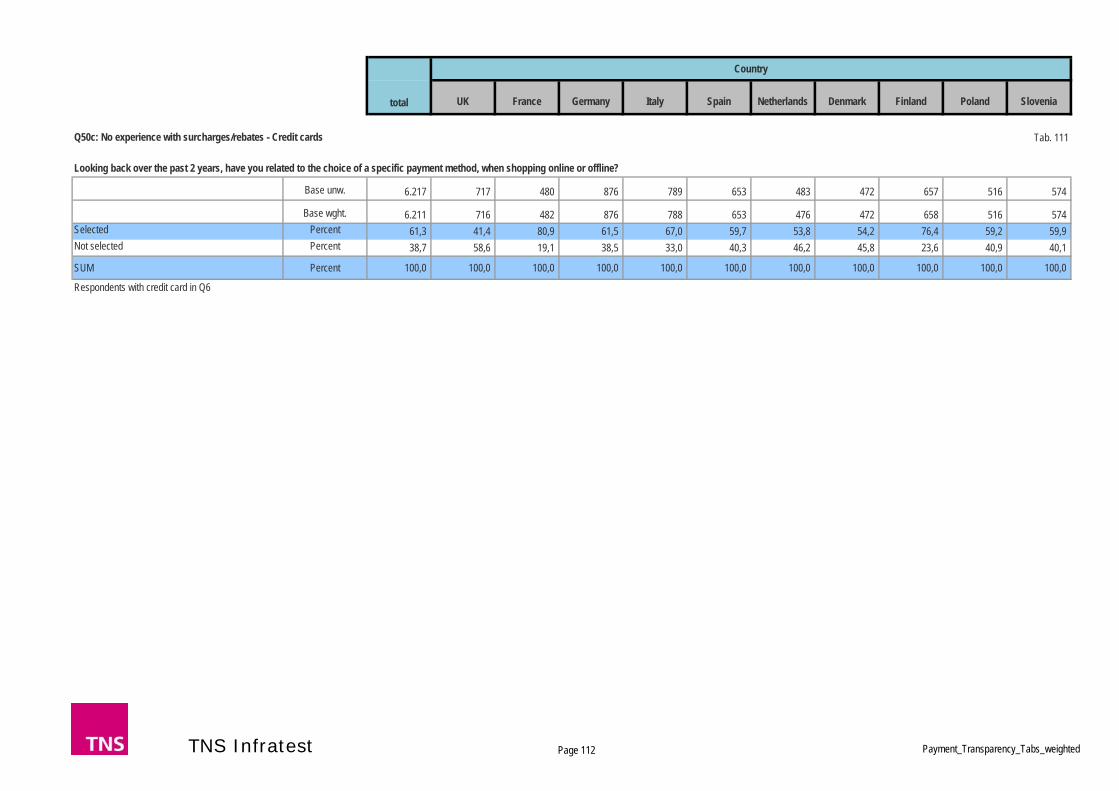
UK France Germany Italy Spain Netherlands Denmark Finland Poland Slovenia
Country
total
Tab. 111
Base unw. 6.217 717 480 876 789 653 483 472 657 516 574
Base wght. 6.211 716 482 876 788 653 476 472 658 516 574 Selected Percent 61,3 41,4 80,9 61,5 67,0 59,7 53,8 54,2 76,4 59,2 59,9 Not selected Percent 38,7 58,6 19,1 38,5 33,0 40,3 46,2 45,8 23,6 40,9 40,1
SUM Percent 100,0 100,0 100,0 100,0 100,0 100,0 100,0 100,0 100,0 100,0 100,0
Respondents with credit card in Q6
Q50c: No experience with surcharges/rebates - Credit cards
Looking back over the past 2 years, have you related to the choice of a specific payment method, when shopping online or offline?
TNS Infratest Page 112 Payment_Transparency_Tabs_weighted

UK France Germany Italy Spain Netherlands Denmark Finland Poland Slovenia
Country
total
Tab. 112
Base unw. 4.255 693 434 613 586 547 158 223 259 567 175
Base wght. 4.255 693 434 613 586 544 158 223 259 568 175 Selected Percent 72,0 80,3 84,1 65,6 66,2 68,6 62,5 64,1 77,3 76,7 57,7 Not selected Percent 28,0 19,7 15,9 34,5 33,8 31,4 37,5 35,9 22,8 23,4 42,3
SUM Percent 100,0 100,0 100,0 100,0 100,0 100,0 100,0 100,0 100,0 100,0 100,0
Respondents who use online payment system in Q16
Q50c: No experience with surcharges/rebates - Online payment systems such as PayPal, Smart2Pay
Looking back over the past 2 years, have you related to the choice of a specific payment method, when shopping online or offline?
TNS Infratest Page 113 Payment_Transparency_Tabs_weighted

UK France Germany Italy Spain Netherlands Denmark Finland Poland Slovenia
Country
total
Tab. 113
Base unw. 2.595 719 847 59 677 137 17 108 2 11 18
Base wght. 2.577 718 830 59 675 138 17 108 2 11 18 Selected Percent 88,8 90,1 91,4 79,6 88,0 81,9 53,3 87,0 50,1 72,6 88,9 Not selected Percent 11,2 9,9 8,6 20,4 12,0 18,1 46,7 13,0 49,9 27,4 11,1
SUM Percent 100,0 100,0 100,0 100,0 100,0 100,0 100,0 100,0 100,0 100,0 100,0
Respondents with chequebook in Q6
Q50c: No experience with surcharges/rebates - Cheque
Looking back over the past 2 years, have you related to the choice of a specific payment method, when shopping online or offline?
TNS Infratest Page 114 Payment_Transparency_Tabs_weighted

UK France Germany Italy Spain Netherlands Denmark Finland Poland Slovenia
Country
total
Tab. 114
Base unw. 1.657 213 81 485 60 54 151 159 219 185 50
Base wght. 1.663 213 87 485 60 53 152 159 219 185 50 Selected Percent 73,5 64,8 74,4 75,9 59,8 66,4 77,5 71,7 86,7 71,3 54,0 Not selected Percent 26,5 35,2 25,6 24,1 40,2 33,6 22,5 28,3 13,3 28,7 46,0
SUM Percent 100,0 100,0 100,0 100,0 100,0 100,0 100,0 100,0 100,0 100,0 100,0
Respondents who use direct debit in Q16
Q50c: No experience with surcharges/rebates - Direct debit
Looking back over the past 2 years, have you related to the choice of a specific payment method, when shopping online or offline?
TNS Infratest Page 115 Payment_Transparency_Tabs_weighted

UK France Germany Italy Spain Netherlands Denmark Finland Poland Slovenia
Country
total
Tab. 115
Base unw. 2.595 30 18 397 132 100 807 273 430 218 190
Base wght. 2.598 30 19 397 132 100 809 273 430 218 190 Selected Percent 74,2 63,2 71,9 73,5 65,8 52,6 76,1 88,3 78,4 73,3 57,9 Not selected Percent 25,8 36,8 28,1 26,5 34,2 47,4 23,9 11,7 21,6 26,7 42,1
SUM Percent 100,0 100,0 100,0 100,0 100,0 100,0 100,0 100,0 100,0 100,0 100,0
Respondents who use credit transfer in Q16
Q50c: No experience with surcharges/rebates - Credit transfer
Looking back over the past 2 years, have you related to the choice of a specific payment method, when shopping online or offline?
TNS Infratest Page 116 Payment_Transparency_Tabs_weighted

UK France Germany Italy Spain Netherlands Denmark Finland Poland Slovenia
Country
total
Tab. 116
Base unw. 2.562 461 99 294 177 249 322 344 165 158 293
Base wght. 2.565 461 102 294 177 248 323 344 165 158 293 Only online (Internet) Percent 42,6 38,6 42,5 56,8 47,5 38,0 47,0 46,8 37,6 42,4 29,0 Only offline (in person, by phone or per mail) Percent 23,4 17,8 34,0 16,3 27,7 31,1 24,9 13,1 27,9 30,4 30,7 Both online and offline Percent 32,5 42,9 21,6 24,8 23,7 30,1 27,5 39,5 30,9 25,3 37,2 Don't know Percent 1,4 0,7 1,9 2,0 1,2 0,9 0,6 0,6 3,6 1,9 3,1
SUM Percent 100,0 100,0 100,0 100,0 100,0 100,0 100,0 100,0 100,0 100,0 100,0
Respondents with surcharge experience when using payment cards in Q50
Q51: Purchase channel for card surcharging
Have you experienced surcharging when using payment cards during online or offline payment transactions?
TNS Infratest Page 117 Payment_Transparency_Tabs_weighted
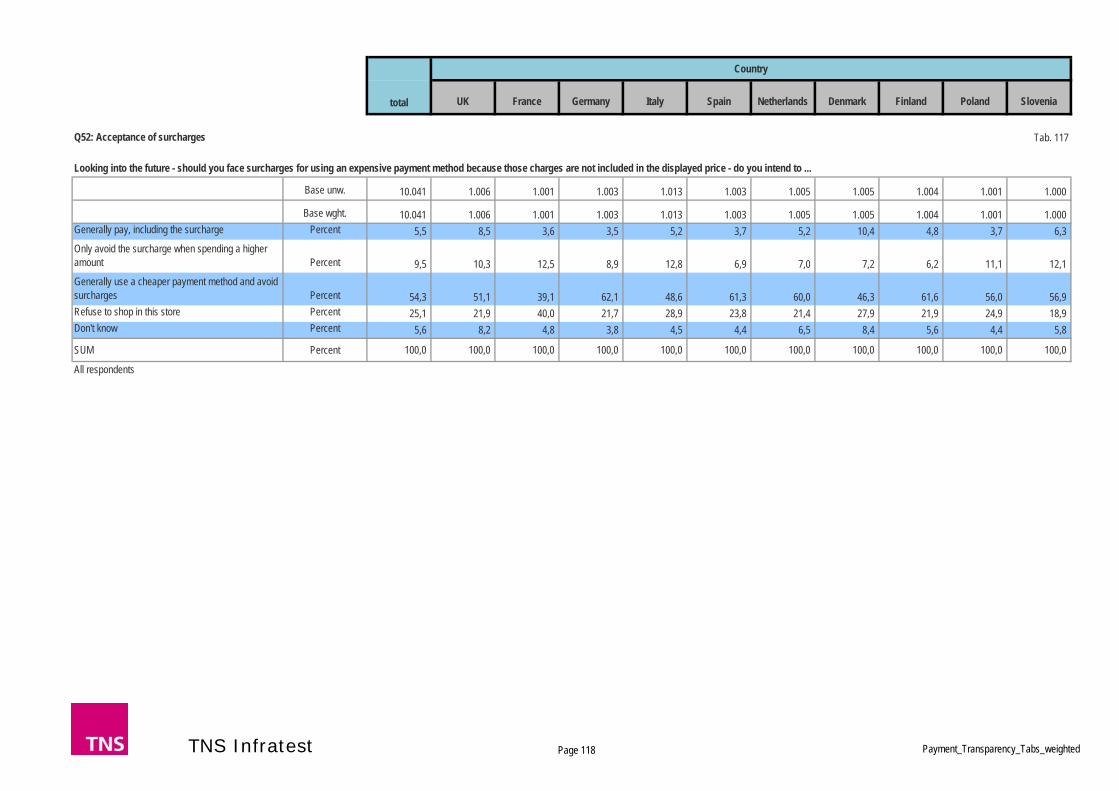
UK France Germany Italy Spain Netherlands Denmark Finland Poland Slovenia
Country
total
Tab. 117
Base unw. 10.041 1.006 1.001 1.003 1.013 1.003 1.005 1.005 1.004 1.001 1.000
Base wght. 10.041 1.006 1.001 1.003 1.013 1.003 1.005 1.005 1.004 1.001 1.000 Generally pay, including the surcharge Percent 5,5 8,5 3,6 3,5 5,2 3,7 5,2 10,4 4,8 3,7 6,3 Only avoid the surcharge when spending a higher amount Percent 9,5 10,3 12,5 8,9 12,8 6,9 7,0 7,2 6,2 11,1 12,1 Generally use a cheaper payment method and avoid surcharges Percent 54,3 51,1 39,1 62,1 48,6 61,3 60,0 46,3 61,6 56,0 56,9 Refuse to shop in this store Percent 25,1 21,9 40,0 21,7 28,9 23,8 21,4 27,9 21,9 24,9 18,9 Don't know Percent 5,6 8,2 4,8 3,8 4,5 4,4 6,5 8,4 5,6 4,4 5,8
SUM Percent 100,0 100,0 100,0 100,0 100,0 100,0 100,0 100,0 100,0 100,0 100,0
All respondents
Q52: Acceptance of surcharges
Looking into the future - should you face surcharges for using an expensive payment method because those charges are not included in the displayed price - do you intend to ...
TNS Infratest Page 118 Payment_Transparency_Tabs_weighted
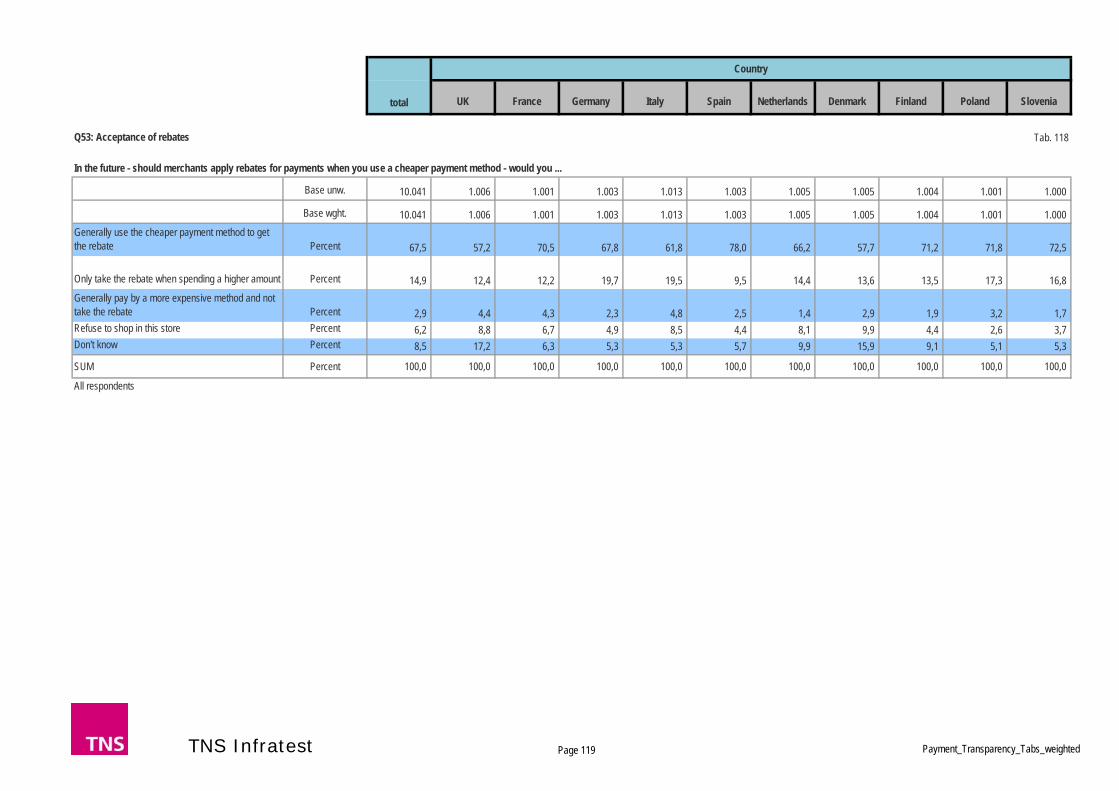
UK France Germany Italy Spain Netherlands Denmark Finland Poland Slovenia
Country
total
Tab. 118
Base unw. 10.041 1.006 1.001 1.003 1.013 1.003 1.005 1.005 1.004 1.001 1.000
Base wght. 10.041 1.006 1.001 1.003 1.013 1.003 1.005 1.005 1.004 1.001 1.000 Generally use the cheaper payment method to get the rebate Percent 67,5 57,2 70,5 67,8 61,8 78,0 66,2 57,7 71,2 71,8 72,5
Only take the rebate when spending a higher amount Percent 14,9 12,4 12,2 19,7 19,5 9,5 14,4 13,6 13,5 17,3 16,8 Generally pay by a more expensive method and not take the rebate Percent 2,9 4,4 4,3 2,3 4,8 2,5 1,4 2,9 1,9 3,2 1,7 Refuse to shop in this store Percent 6,2 8,8 6,7 4,9 8,5 4,4 8,1 9,9 4,4 2,6 3,7 Don't know Percent 8,5 17,2 6,3 5,3 5,3 5,7 9,9 15,9 9,1 5,1 5,3
SUM Percent 100,0 100,0 100,0 100,0 100,0 100,0 100,0 100,0 100,0 100,0 100,0
All respondents
Q53: Acceptance of rebates
In the future - should merchants apply rebates for payments when you use a cheaper payment method - would you ...
TNS Infratest Page 119 Payment_Transparency_Tabs_weighted
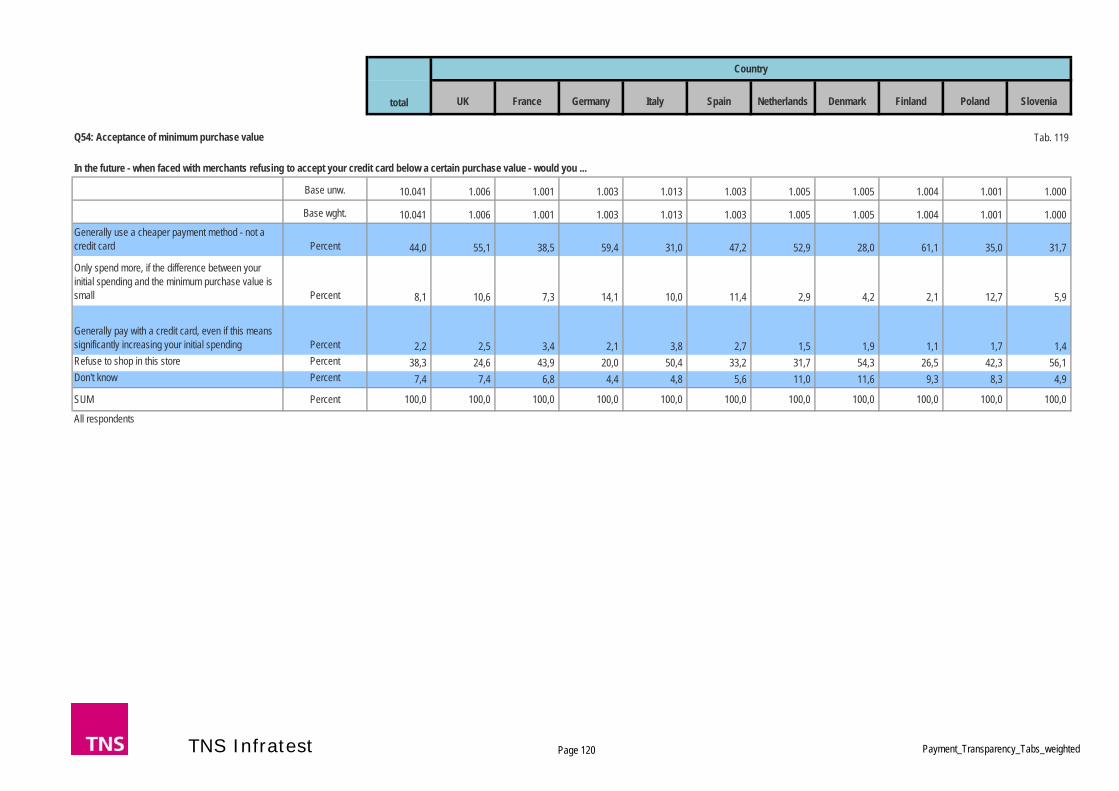
UK France Germany Italy Spain Netherlands Denmark Finland Poland Slovenia
Country
total
Tab. 119
Base unw. 10.041 1.006 1.001 1.003 1.013 1.003 1.005 1.005 1.004 1.001 1.000
Base wght. 10.041 1.006 1.001 1.003 1.013 1.003 1.005 1.005 1.004 1.001 1.000 Generally use a cheaper payment method - not a credit card Percent 44,0 55,1 38,5 59,4 31,0 47,2 52,9 28,0 61,1 35,0 31,7
Only spend more, if the difference between your initial spending and the minimum purchase value is small Percent 8,1 10,6 7,3 14,1 10,0 11,4 2,9 4,2 2,1 12,7 5,9
Generally pay with a credit card, even if this means significantly increasing your initial spending Percent 2,2 2,5 3,4 2,1 3,8 2,7 1,5 1,9 1,1 1,7 1,4 Refuse to shop in this store Percent 38,3 24,6 43,9 20,0 50,4 33,2 31,7 54,3 26,5 42,3 56,1 Don't know Percent 7,4 7,4 6,8 4,4 4,8 5,6 11,0 11,6 9,3 8,3 4,9
SUM Percent 100,0 100,0 100,0 100,0 100,0 100,0 100,0 100,0 100,0 100,0 100,0
All respondents
Q54: Acceptance of minimum purchase value
In the future - when faced with merchants refusing to accept your credit card below a certain purchase value - would you ...
TNS Infratest Page 120 Payment_Transparency_Tabs_weighted
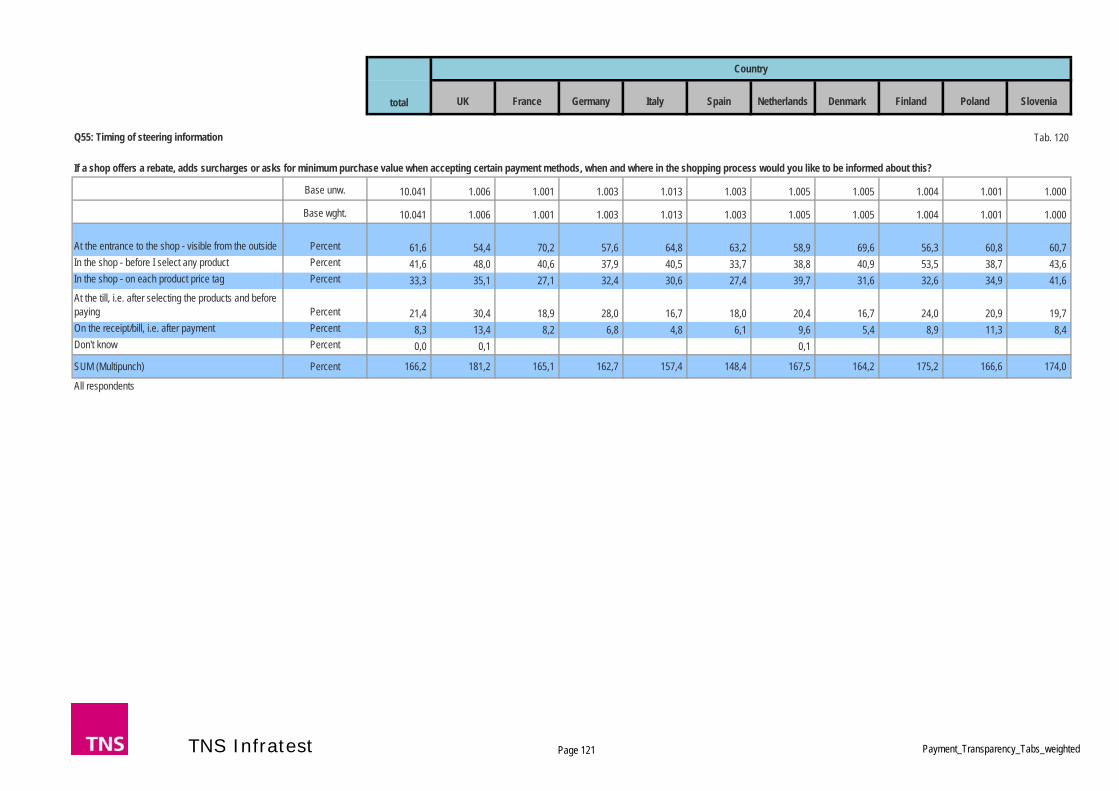
UK France Germany Italy Spain Netherlands Denmark Finland Poland Slovenia
Country
total
Tab. 120
Base unw. 10.041 1.006 1.001 1.003 1.013 1.003 1.005 1.005 1.004 1.001 1.000
Base wght. 10.041 1.006 1.001 1.003 1.013 1.003 1.005 1.005 1.004 1.001 1.000
At the entrance to the shop - visible from the outside Percent 61,6 54,4 70,2 57,6 64,8 63,2 58,9 69,6 56,3 60,8 60,7 In the shop - before I select any product Percent 41,6 48,0 40,6 37,9 40,5 33,7 38,8 40,9 53,5 38,7 43,6 In the shop - on each product price tag Percent 33,3 35,1 27,1 32,4 30,6 27,4 39,7 31,6 32,6 34,9 41,6 At the till, i.e. after selecting the products and before paying Percent 21,4 30,4 18,9 28,0 16,7 18,0 20,4 16,7 24,0 20,9 19,7 On the receipt/bill, i.e. after payment Percent 8,3 13,4 8,2 6,8 4,8 6,1 9,6 5,4 8,9 11,3 8,4 Don't know Percent 0,0 0,1 0,1
SUM (Multipunch) Percent 166,2 181,2 165,1 162,7 157,4 148,4 167,5 164,2 175,2 166,6 174,0
All respondents
Q55: Timing of steering information
If a shop offers a rebate, adds surcharges or asks for minimum purchase value when accepting certain payment methods, when and where in the shopping process would you like to be informed about this?
TNS Infratest Page 121 Payment_Transparency_Tabs_weighted

UK France Germany Italy Spain Netherlands Denmark Finland Poland Slovenia
Country
total
Tab. 121
Base unw. 10.041 1.006 1.001 1.003 1.013 1.003 1.005 1.005 1.004 1.001 1.000
Base wght. 10.041 1.006 1.001 1.003 1.013 1.003 1.005 1.005 1.004 1.001 1.000 Totally agree (1) Percent 30,7 27,9 43,9 31,6 42,0 36,2 27,6 21,4 13,0 34,9 28,2 Tend to agree (2) Percent 42,0 45,0 40,3 43,5 44,1 47,9 43,3 40,6 36,2 40,8 37,9 Tend to disagree (3) Percent 20,7 22,6 12,9 20,6 11,9 12,9 23,2 23,0 34,4 18,3 26,8 Totally disagree (4) Percent 6,7 4,3 3,0 4,3 1,9 3,0 5,8 15,0 16,6 6,0 7,1 Don't know Percent 0,0 0,2 0,1 0,1
SUM Percent 100,0 100,0 100,0 100,0 100,0 100,0 100,0 100,0 100,0 100,0 100,0 Mean 2,0 2,0 1,7 2,0 1,7 1,8 2,1 2,3 2,5 2,0 2,1 All respondents
Q56_1: General attitudes and beliefs - I check my expenditure daily, to keep control over my budget.
To what extent do you agree or disagree with each of the following statements regarding payment methods?
TNS Infratest Page 122 Payment_Transparency_Tabs_weighted
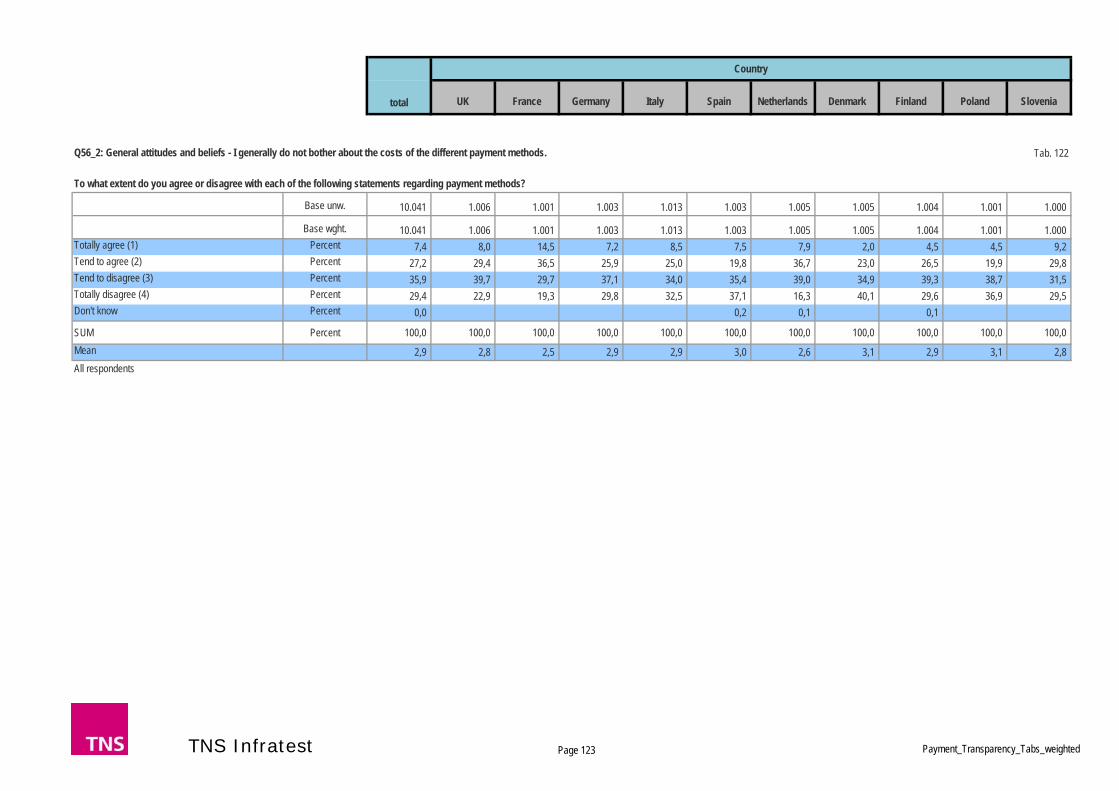
UK France Germany Italy Spain Netherlands Denmark Finland Poland Slovenia
Country
total
Tab. 122
Base unw. 10.041 1.006 1.001 1.003 1.013 1.003 1.005 1.005 1.004 1.001 1.000
Base wght. 10.041 1.006 1.001 1.003 1.013 1.003 1.005 1.005 1.004 1.001 1.000 Totally agree (1) Percent 7,4 8,0 14,5 7,2 8,5 7,5 7,9 2,0 4,5 4,5 9,2 Tend to agree (2) Percent 27,2 29,4 36,5 25,9 25,0 19,8 36,7 23,0 26,5 19,9 29,8 Tend to disagree (3) Percent 35,9 39,7 29,7 37,1 34,0 35,4 39,0 34,9 39,3 38,7 31,5 Totally disagree (4) Percent 29,4 22,9 19,3 29,8 32,5 37,1 16,3 40,1 29,6 36,9 29,5 Don't know Percent 0,0 0,2 0,1 0,1
SUM Percent 100,0 100,0 100,0 100,0 100,0 100,0 100,0 100,0 100,0 100,0 100,0 Mean 2,9 2,8 2,5 2,9 2,9 3,0 2,6 3,1 2,9 3,1 2,8 All respondents
Q56_2: General attitudes and beliefs - I generally do not bother about the costs of the different payment methods.
To what extent do you agree or disagree with each of the following statements regarding payment methods?
TNS Infratest Page 123 Payment_Transparency_Tabs_weighted

UK France Germany Italy Spain Netherlands Denmark Finland Poland Slovenia
Country
total
Tab. 123
Base unw. 10.041 1.006 1.001 1.003 1.013 1.003 1.005 1.005 1.004 1.001 1.000
Base wght. 10.041 1.006 1.001 1.003 1.013 1.003 1.005 1.005 1.004 1.001 1.000 Totally agree (1) Percent 33,8 35,9 36,9 38,6 33,0 25,3 35,1 36,2 25,7 33,3 38,1 Tend to agree (2) Percent 49,6 54,5 50,2 45,6 47,1 56,4 51,7 47,0 51,7 48,7 43,5 Tend to disagree (3) Percent 13,7 8,6 10,0 12,8 17,2 15,6 11,7 12,9 19,2 15,6 13,2 Totally disagree (4) Percent 2,9 1,1 2,9 3,0 2,7 2,5 1,6 3,9 3,4 2,3 5,2 Don't know Percent 0,0 0,1 0,2 0,1
SUM Percent 100,0 100,0 100,0 100,0 100,0 100,0 100,0 100,0 100,0 100,0 100,0 Mean 1,9 1,7 1,8 1,8 1,9 2,0 1,8 1,8 2,0 1,9 1,9 All respondents
Q56_3: General attitudes and beliefs - It is most important to me that a payment method is quick and easy.
To what extent do you agree or disagree with each of the following statements regarding payment methods?
TNS Infratest Page 124 Payment_Transparency_Tabs_weighted

UK France Germany Italy Spain Netherlands Denmark Finland Poland Slovenia
Country
total
Tab. 124
Base unw. 10.041 1.006 1.001 1.003 1.013 1.003 1.005 1.005 1.004 1.001 1.000
Base wght. 10.041 1.006 1.001 1.003 1.013 1.003 1.005 1.005 1.004 1.001 1.000 Totally agree (1) Percent 29,4 21,1 39,1 19,4 35,5 47,7 15,9 19,4 28,8 19,8 47,0 Tend to agree (2) Percent 39,5 47,1 37,7 43,1 40,8 38,8 42,4 37,5 41,3 35,2 31,4 Tend to disagree (3) Percent 25,7 28,2 18,8 32,6 19,9 11,7 35,4 30,3 26,6 37,8 16,1 Totally disagree (4) Percent 5,3 3,6 4,3 4,9 3,9 1,7 6,3 12,8 3,3 7,2 5,3 Don't know Percent 0,0 0,1 0,1 0,2
SUM Percent 100,0 100,0 100,0 100,0 100,0 100,0 100,0 100,0 100,0 100,0 100,0 Mean 2,1 2,1 1,9 2,2 1,9 1,7 2,3 2,4 2,0 2,3 1,8 All respondents
Q56_4: General attitudes and beliefs - When paying on the Internet I am always worried that my data could be misused.
To what extent do you agree or disagree with each of the following statements regarding payment methods?
TNS Infratest Page 125 Payment_Transparency_Tabs_weighted

UK France Germany Italy Spain Netherlands Denmark Finland Poland Slovenia
Country
total
Tab. 125
Base unw. 10.041 1.006 1.001 1.003 1.013 1.003 1.005 1.005 1.004 1.001 1.000
Base wght. 10.041 1.006 1.001 1.003 1.013 1.003 1.005 1.005 1.004 1.001 1.000 Totally agree (1) Percent 9,0 8,6 6,7 4,9 15,2 13,1 7,1 6,8 5,0 11,1 11,1 Tend to agree (2) Percent 28,4 24,8 20,2 24,1 41,1 31,3 25,0 27,3 29,4 38,0 22,8 Tend to disagree (3) Percent 38,4 36,5 34,1 46,6 34,7 35,6 43,1 32,1 42,4 38,6 40,3 Totally disagree (4) Percent 24,1 30,1 39,0 24,4 9,0 19,9 24,6 33,8 22,9 12,2 25,5 Don't know Percent 0,1 0,1 0,1 0,2 0,3 0,1 0,3
SUM Percent 100,0 100,0 100,0 100,0 100,0 100,0 100,0 100,0 100,0 100,0 100,0 Mean 2,8 2,9 3,1 2,9 2,4 2,6 2,9 2,9 2,8 2,5 2,8 All respondents
Q56_5: General attitudes and beliefs - I would use new payment methods like mobile payments without any concerns.
To what extent do you agree or disagree with each of the following statements regarding payment methods?
TNS Infratest Page 126 Payment_Transparency_Tabs_weighted
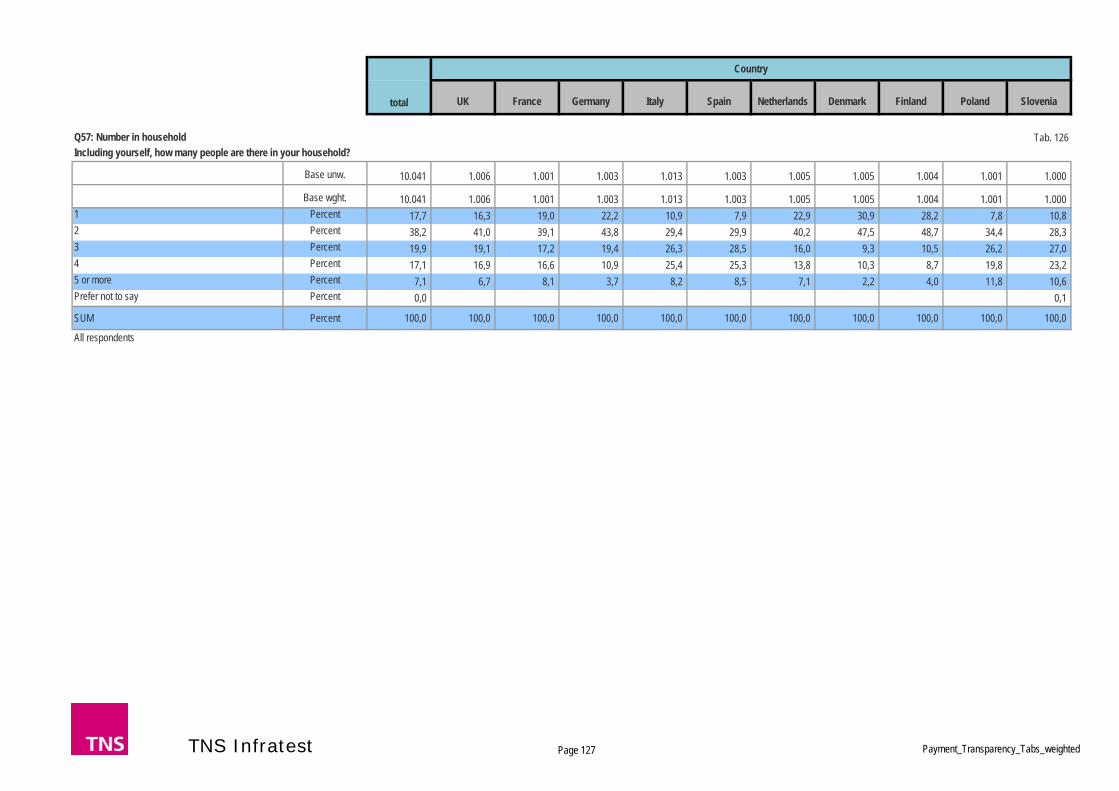
UK France Germany Italy Spain Netherlands Denmark Finland Poland Slovenia
Country
total
Tab. 126
Base unw. 10.041 1.006 1.001 1.003 1.013 1.003 1.005 1.005 1.004 1.001 1.000
Base wght. 10.041 1.006 1.001 1.003 1.013 1.003 1.005 1.005 1.004 1.001 1.000 1 Percent 17,7 16,3 19,0 22,2 10,9 7,9 22,9 30,9 28,2 7,8 10,8 2 Percent 38,2 41,0 39,1 43,8 29,4 29,9 40,2 47,5 48,7 34,4 28,3 3 Percent 19,9 19,1 17,2 19,4 26,3 28,5 16,0 9,3 10,5 26,2 27,0 4 Percent 17,1 16,9 16,6 10,9 25,4 25,3 13,8 10,3 8,7 19,8 23,2 5 or more Percent 7,1 6,7 8,1 3,7 8,2 8,5 7,1 2,2 4,0 11,8 10,6 Prefer not to say Percent 0,0 0,1
SUM Percent 100,0 100,0 100,0 100,0 100,0 100,0 100,0 100,0 100,0 100,0 100,0
All respondents
Q57: Number in householdIncluding yourself, how many people are there in your household?
TNS Infratest Page 127 Payment_Transparency_Tabs_weighted
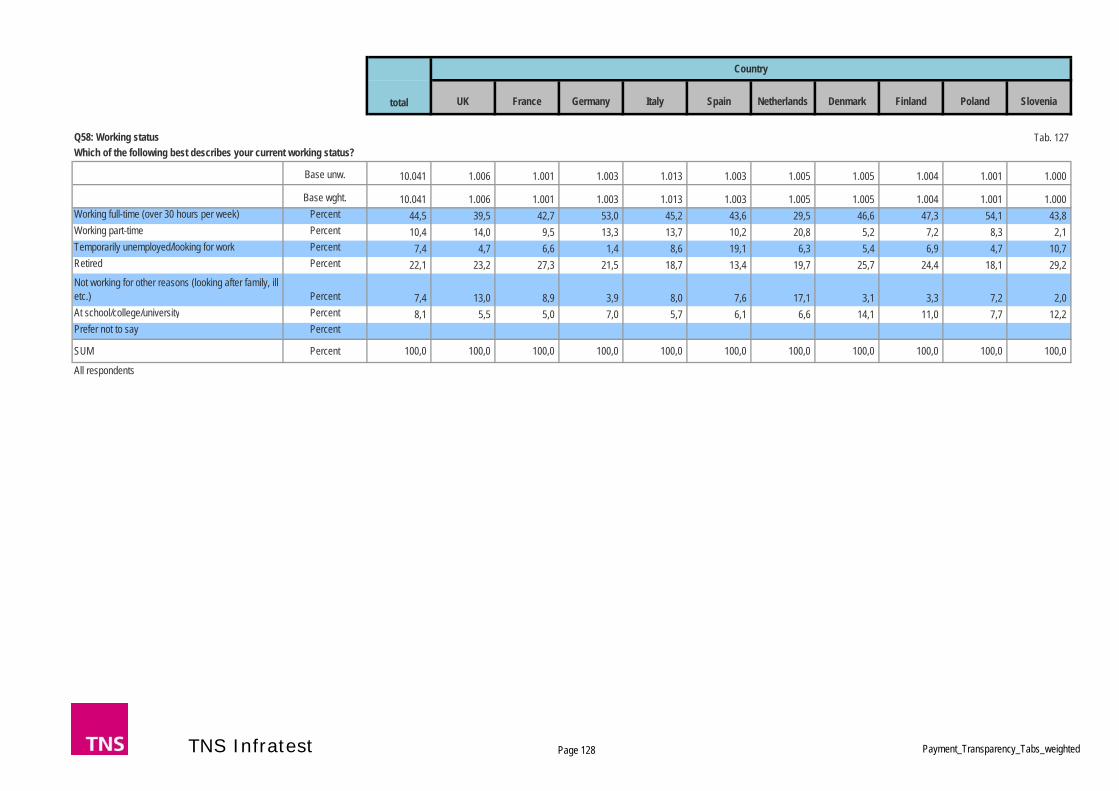
UK France Germany Italy Spain Netherlands Denmark Finland Poland Slovenia
Country
total
Tab. 127
Base unw. 10.041 1.006 1.001 1.003 1.013 1.003 1.005 1.005 1.004 1.001 1.000
Base wght. 10.041 1.006 1.001 1.003 1.013 1.003 1.005 1.005 1.004 1.001 1.000 Working full-time (over 30 hours per week) Percent 44,5 39,5 42,7 53,0 45,2 43,6 29,5 46,6 47,3 54,1 43,8 Working part-time Percent 10,4 14,0 9,5 13,3 13,7 10,2 20,8 5,2 7,2 8,3 2,1 Temporarily unemployed/looking for work Percent 7,4 4,7 6,6 1,4 8,6 19,1 6,3 5,4 6,9 4,7 10,7 Retired Percent 22,1 23,2 27,3 21,5 18,7 13,4 19,7 25,7 24,4 18,1 29,2 Not working for other reasons (looking after family, ill etc.) Percent 7,4 13,0 8,9 3,9 8,0 7,6 17,1 3,1 3,3 7,2 2,0 At school/college/university Percent 8,1 5,5 5,0 7,0 5,7 6,1 6,6 14,1 11,0 7,7 12,2 Prefer not to say Percent
SUM Percent 100,0 100,0 100,0 100,0 100,0 100,0 100,0 100,0 100,0 100,0 100,0
All respondents
Which of the following best describes your current working status?Q58: Working status
TNS Infratest Page 128 Payment_Transparency_Tabs_weighted
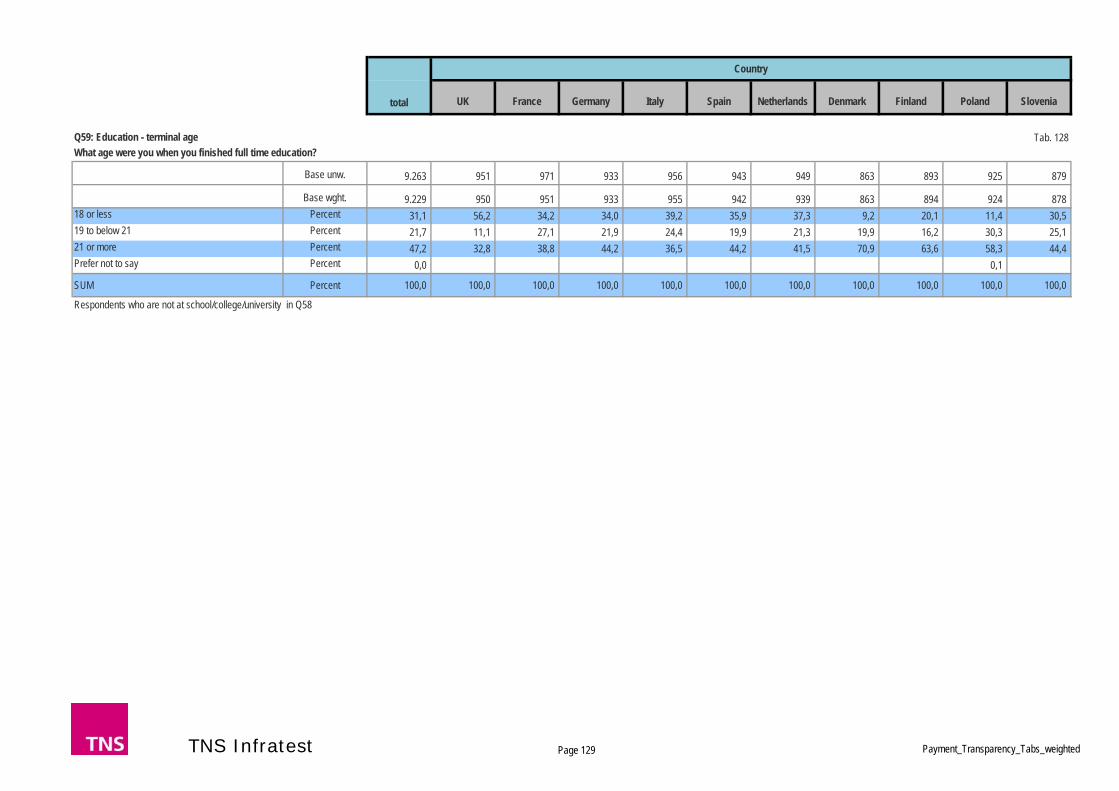
UK France Germany Italy Spain Netherlands Denmark Finland Poland Slovenia
Country
total
Tab. 128
Base unw. 9.263 951 971 933 956 943 949 863 893 925 879
Base wght. 9.229 950 951 933 955 942 939 863 894 924 878 18 or less Percent 31,1 56,2 34,2 34,0 39,2 35,9 37,3 9,2 20,1 11,4 30,5 19 to below 21 Percent 21,7 11,1 27,1 21,9 24,4 19,9 21,3 19,9 16,2 30,3 25,1 21 or more Percent 47,2 32,8 38,8 44,2 36,5 44,2 41,5 70,9 63,6 58,3 44,4 Prefer not to say Percent 0,0 0,1
SUM Percent 100,0 100,0 100,0 100,0 100,0 100,0 100,0 100,0 100,0 100,0 100,0
Respondents who are not at school/college/university in Q58
Q59: Education - terminal ageWhat age were you when you finished full time education?
TNS Infratest Page 129 Payment_Transparency_Tabs_weighted

UK France Germany Italy Spain Netherlands Denmark Finland Poland Slovenia
Country
total
Tab. 129
Base unw. 10.041 1.006 1.001 1.003 1.013 1.003 1.005 1.005 1.004 1.001 1.000
Base wght. 10.041 1.006 1.001 1.003 1.013 1.003 1.005 1.005 1.004 1.001 1.000 0 - 9 999 Percent 16,3 24,0 12,3 9,8 17,5 21,6 13,6 5,6 9,0 28,1 21,9 10 000 - 19 999 Percent 22,1 27,1 27,9 14,8 20,4 25,1 15,2 13,0 14,1 33,0 30,7 20 000 - 29 999 Percent 18,2 18,7 25,0 16,2 23,7 20,3 16,5 12,6 19,1 15,2 14,8 30 000 - 39 999 Percent 12,4 9,6 13,4 16,5 13,4 11,6 15,3 12,1 20,2 4,5 7,8 40 000 - 49 999 Percent 7,7 5,7 5,4 10,7 4,3 6,1 9,5 19,1 11,5 2,4 2,7 50 000 - 59 999 Percent 4,4 1,7 4,7 8,0 3,5 1,9 4,4 10,9 6,1 1,7 1,2 60 000 or more Percent 5,2 3,9 3,9 12,1 2,9 1,5 5,3 14,9 4,6 1,6 0,9 Prefer not to say Percent 13,6 9,4 7,4 12,2 14,2 12,0 20,2 11,7 15,4 13,6 20,0
SUM Percent 100,0 100,0 100,0 100,0 100,0 100,0 100,0 100,0 100,0 100,0 100,0 Low income (< 20 000) Percent 38,5 51,1 40,2 24,5 37,9 46,7 28,8 18,6 23,2 61,1 52,6 Medium income (20 to < 50 000) Percent 20,2 15,3 18,9 27,1 17,7 17,7 24,8 31,2 31,6 6,9 10,5 High income (>= 50 000) Percent 9,6 5,6 8,6 20,1 6,4 3,4 9,7 25,8 10,7 3,3 2,1 All respondents
Q61: IncomeWhat is your total annual personal income before tax?
TNS Infratest Page 130 Payment_Transparency_Tabs_weighted
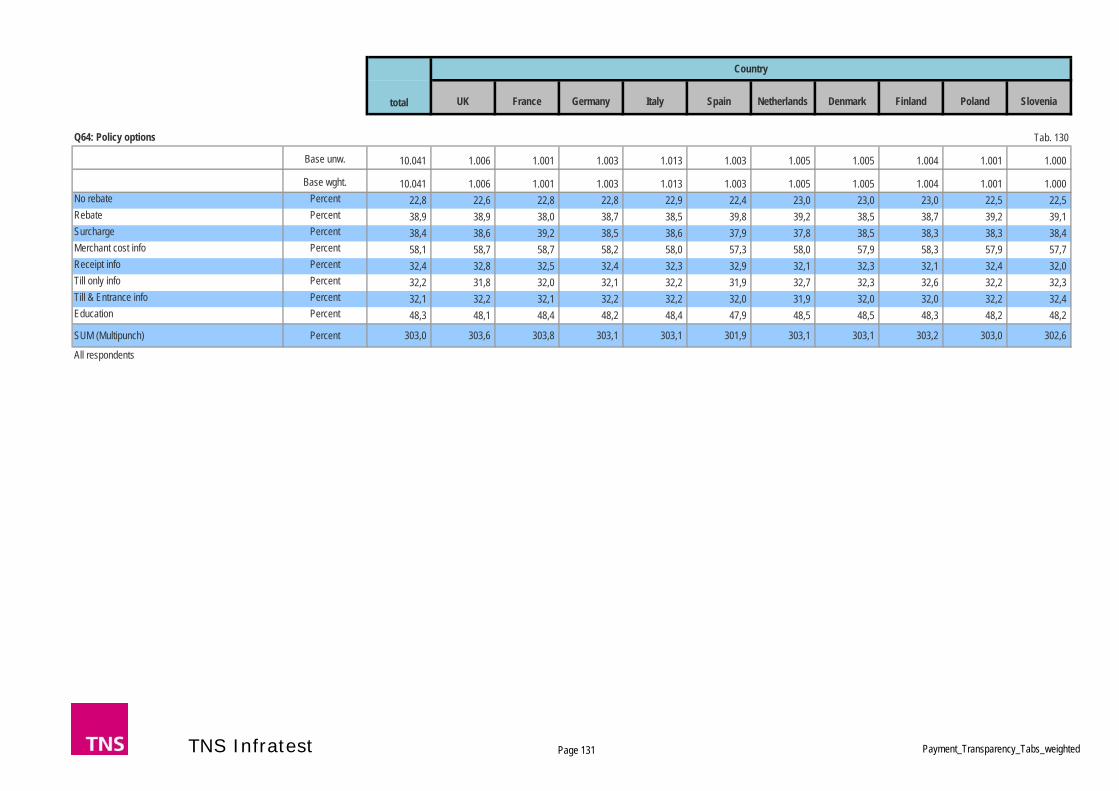
UK France Germany Italy Spain Netherlands Denmark Finland Poland Slovenia
Country
total
Tab. 130
Base unw. 10.041 1.006 1.001 1.003 1.013 1.003 1.005 1.005 1.004 1.001 1.000
Base wght. 10.041 1.006 1.001 1.003 1.013 1.003 1.005 1.005 1.004 1.001 1.000 No rebate Percent 22,8 22,6 22,8 22,8 22,9 22,4 23,0 23,0 23,0 22,5 22,5 Rebate Percent 38,9 38,9 38,0 38,7 38,5 39,8 39,2 38,5 38,7 39,2 39,1 Surcharge Percent 38,4 38,6 39,2 38,5 38,6 37,9 37,8 38,5 38,3 38,3 38,4 Merchant cost info Percent 58,1 58,7 58,7 58,2 58,0 57,3 58,0 57,9 58,3 57,9 57,7 Receipt info Percent 32,4 32,8 32,5 32,4 32,3 32,9 32,1 32,3 32,1 32,4 32,0 Till only info Percent 32,2 31,8 32,0 32,1 32,2 31,9 32,7 32,3 32,6 32,2 32,3 Till & Entrance info Percent 32,1 32,2 32,1 32,2 32,2 32,0 31,9 32,0 32,0 32,2 32,4 Education Percent 48,3 48,1 48,4 48,2 48,4 47,9 48,5 48,5 48,3 48,2 48,2
SUM (Multipunch) Percent 303,0 303,6 303,8 303,1 303,1 301,9 303,1 303,1 303,2 303,0 302,6
All respondents
Q64: Policy options
TNS Infratest Page 131 Payment_Transparency_Tabs_weighted

UK France Germany Italy Spain Netherlands Denmark Finland Poland Slovenia
Country
total
Tab. 131
Base unw. 4.847 484 487 483 489 480 487 487 485 483 482
Base wght. 4.846 484 484 483 490 480 488 487 485 483 482 <15 seconds (8) Percent 17,8 17,6 22,9 22,4 20,0 25,1 20,3 14,8 7,8 16,6 10,4 15-<30 seconds (23) Percent 13,1 19,2 14,6 9,5 13,3 13,0 15,4 11,3 13,2 8,3 12,9 30-<45 seconds (38) Percent 20,3 22,7 17,6 19,7 23,6 18,2 22,3 21,2 21,0 15,2 21,2 45-<60 seconds (53) Percent 19,1 17,4 19,1 17,8 20,5 17,6 18,2 18,9 22,9 18,6 20,5 60+ seconds (68) Percent 29,7 23,2 25,9 30,6 22,7 26,1 23,8 33,9 35,0 41,3 35,0
SUM Percent 100,0 100,0 100,0 100,0 100,0 100,0 100,0 100,0 100,0 100,0 100,0 Mean 42,5 39,4 39,6 41,7 39,9 39,0 39,5 44,9 47,6 47,0 46,5 All respondents
TS1: Timestamp - Education stimulus
TNS Infratest Page 132 Payment_Transparency_Tabs_weighted
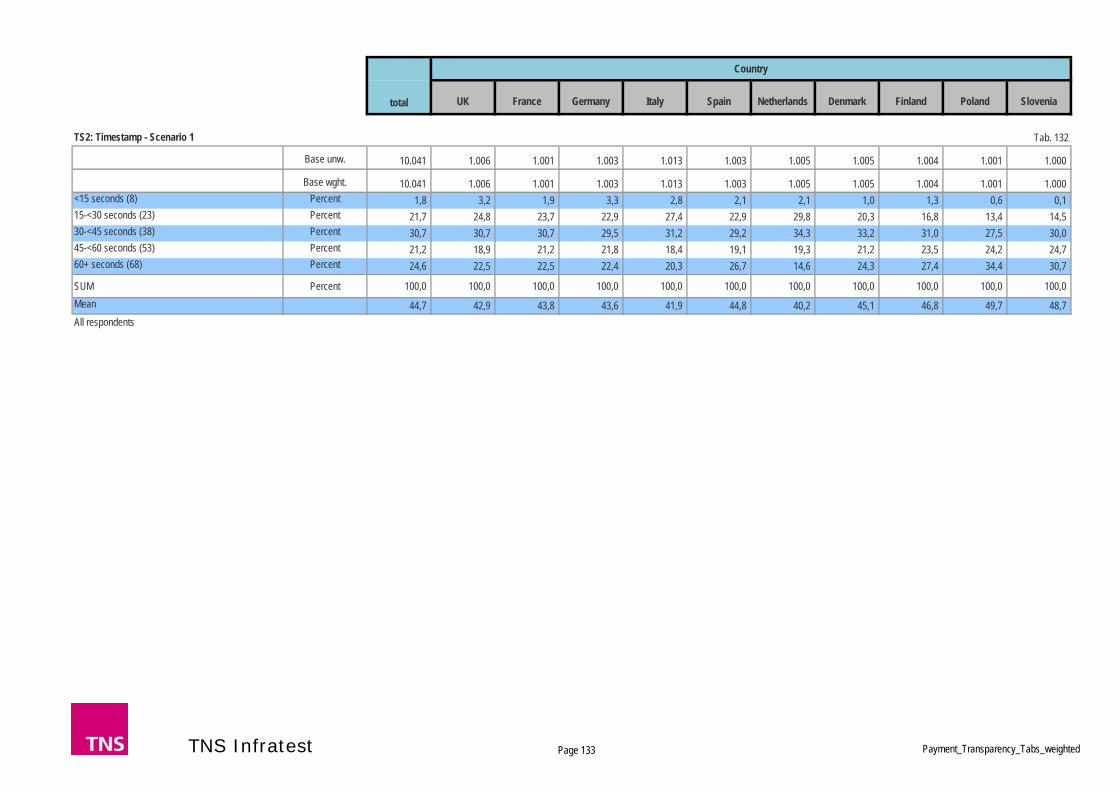
UK France Germany Italy Spain Netherlands Denmark Finland Poland Slovenia
Country
total
Tab. 132
Base unw. 10.041 1.006 1.001 1.003 1.013 1.003 1.005 1.005 1.004 1.001 1.000
Base wght. 10.041 1.006 1.001 1.003 1.013 1.003 1.005 1.005 1.004 1.001 1.000 <15 seconds (8) Percent 1,8 3,2 1,9 3,3 2,8 2,1 2,1 1,0 1,3 0,6 0,1 15-<30 seconds (23) Percent 21,7 24,8 23,7 22,9 27,4 22,9 29,8 20,3 16,8 13,4 14,5 30-<45 seconds (38) Percent 30,7 30,7 30,7 29,5 31,2 29,2 34,3 33,2 31,0 27,5 30,0 45-<60 seconds (53) Percent 21,2 18,9 21,2 21,8 18,4 19,1 19,3 21,2 23,5 24,2 24,7 60+ seconds (68) Percent 24,6 22,5 22,5 22,4 20,3 26,7 14,6 24,3 27,4 34,4 30,7
SUM Percent 100,0 100,0 100,0 100,0 100,0 100,0 100,0 100,0 100,0 100,0 100,0 Mean 44,7 42,9 43,8 43,6 41,9 44,8 40,2 45,1 46,8 49,7 48,7 All respondents
TS2: Timestamp - Scenario 1
TNS Infratest Page 133 Payment_Transparency_Tabs_weighted

UK France Germany Italy Spain Netherlands Denmark Finland Poland Slovenia
Country
total
Tab. 133
Base unw. 10.041 1.006 1.001 1.003 1.013 1.003 1.005 1.005 1.004 1.001 1.000
Base wght. 10.041 1.006 1.001 1.003 1.013 1.003 1.005 1.005 1.004 1.001 1.000 <15 seconds (8) Percent 19,9 22,9 26,0 21,8 26,1 23,8 22,6 15,3 17,2 12,7 11,0 15-<30 seconds (23) Percent 47,9 49,4 47,8 47,6 46,0 45,8 52,0 52,2 45,8 44,5 47,8 30-<45 seconds (38) Percent 21,0 16,2 17,1 22,3 17,9 18,2 19,1 21,7 25,1 25,6 26,4 45-<60 seconds (53) Percent 6,6 5,9 4,2 4,6 5,4 6,6 3,7 6,4 8,3 11,2 9,5 60+ seconds (68) Percent 4,7 5,7 5,0 3,8 4,6 5,7 2,6 4,4 3,6 6,1 5,3
SUM Percent 100,0 100,0 100,0 100,0 100,0 100,0 100,0 100,0 100,0 100,0 100,0 Mean 27,2 26,3 25,2 26,2 25,5 26,7 24,7 27,8 28,3 31,0 30,5 All respondents
TS3: Timestamp - Scenario 2
TNS Infratest Page 134 Payment_Transparency_Tabs_weighted

UK France Germany Italy Spain Netherlands Denmark Finland Poland Slovenia
Country
total
Tab. 134
Base unw. 9.360 995 955 983 939 930 944 979 944 936 755
Base wght. 9.361 995 956 983 939 928 945 979 944 936 755 <15 seconds (8) Percent 0,4 0,8 0,1 0,8 0,4 0,5 0,2 0,2 0,2 0,3 15-<30 seconds (23) Percent 12,5 13,6 11,7 15,8 16,5 12,3 17,6 10,7 8,7 7,6 9,7 30-<45 seconds (38) Percent 27,0 28,6 30,7 30,2 26,0 26,6 29,2 29,1 21,9 22,8 23,2 45-<60 seconds (53) Percent 22,0 21,8 23,1 20,1 20,7 23,3 23,3 20,4 24,4 19,7 23,8 60+ seconds (68) Percent 38,2 35,2 34,4 33,0 36,4 37,3 29,7 39,5 44,8 49,7 43,3
SUM Percent 100,0 100,0 100,0 100,0 100,0 100,0 100,0 100,0 100,0 100,0 100,0 Mean 50,8 49,6 50,0 48,3 49,4 50,7 47,7 51,3 53,7 54,6 53,1 All respondents
TS4: Timestamp - Scenario 3
TNS Infratest Page 135 Payment_Transparency_Tabs_weighted

UK France Germany Italy Spain Netherlands Denmark Finland Poland Slovenia
Country
total
Tab. 135
Base unw. 9.360 995 955 983 939 930 944 979 944 936 755
Base wght. 9.361 995 956 983 939 928 945 979 944 936 755 <15 seconds (8) Percent 30,6 27,2 33,0 33,9 35,7 30,2 36,4 31,9 28,0 21,8 27,7 15-<30 seconds (23) Percent 48,6 48,2 49,9 48,4 46,4 47,6 47,4 48,4 47,3 50,2 52,7 30-<45 seconds (38) Percent 13,2 14,5 12,2 12,5 11,6 13,0 10,1 12,4 16,5 17,6 11,2 45-<60 seconds (53) Percent 3,9 5,0 2,2 3,0 2,2 4,1 2,4 4,6 4,6 5,8 5,7 60+ seconds (68) Percent 3,7 5,1 2,8 2,2 4,1 5,2 3,6 2,8 3,7 4,6 2,6
SUM Percent 100,0 100,0 100,0 100,0 100,0 100,0 100,0 100,0 100,0 100,0 100,0 Mean 23,2 24,9 21,8 21,7 21,9 24,0 21,4 22,7 24,3 26,2 23,4 All respondents
TS5: Timestamp - Scenario 4
TNS Infratest Page 136 Payment_Transparency_Tabs_weighted

UK France Germany Italy Spain Netherlands Denmark Finland Poland Slovenia
Country
total
Tab. 136
Base unw. 1.954 198 193 196 197 197 195 193 193 196 196
Base wght. 1.948 198 189 196 197 196 195 193 193 196 196 Click for more information Percent 1,5 1,5 1,0 2,0 1,5 1,0 0,5 1,0 2,1 2,6 1,5 No click for more information Percent 98,5 98,5 99,0 98,0 98,5 99,0 99,5 99,0 97,9 97,4 98,5
SUM Percent 100,0 100,0 100,0 100,0 100,0 100,0 100,0 100,0 100,0 100,0 100,0
Respondents with hyperlink treatment
T14 Click: Click rate - Online Store charges included
TNS Infratest Page 137 Payment_Transparency_Tabs_weighted
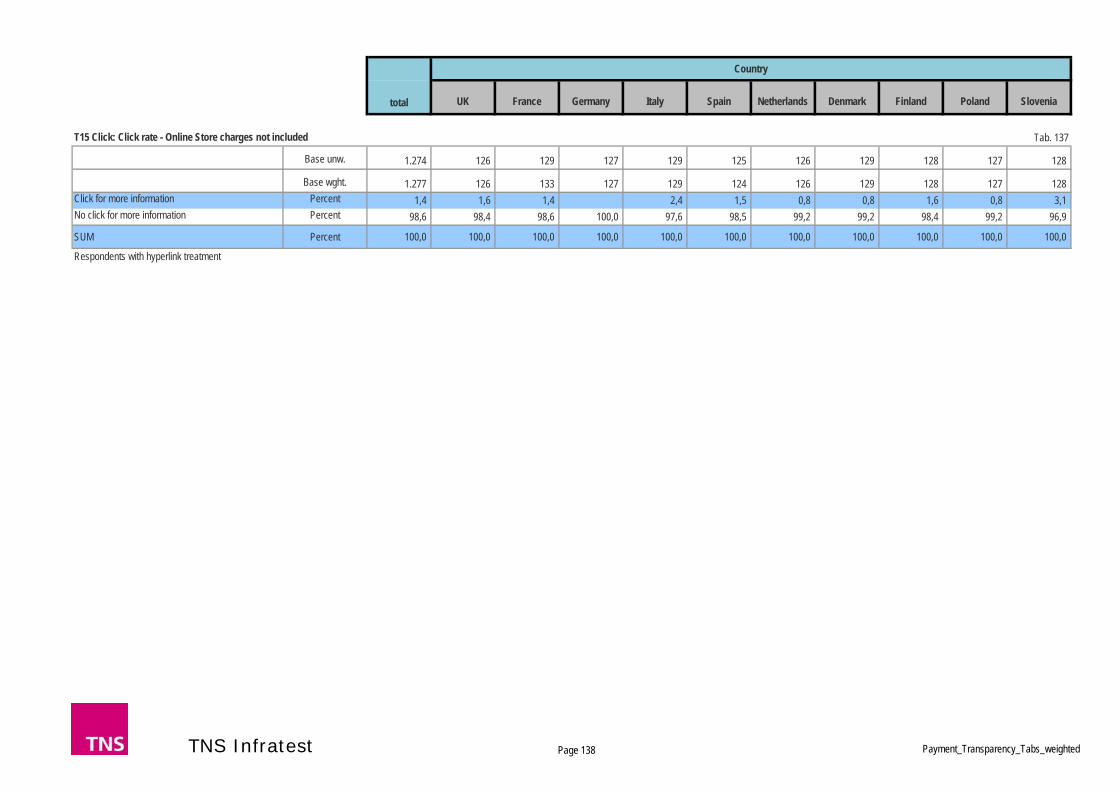
UK France Germany Italy Spain Netherlands Denmark Finland Poland Slovenia
Country
total
Tab. 137
Base unw. 1.274 126 129 127 129 125 126 129 128 127 128
Base wght. 1.277 126 133 127 129 124 126 129 128 127 128 Click for more information Percent 1,4 1,6 1,4 2,4 1,5 0,8 0,8 1,6 0,8 3,1 No click for more information Percent 98,6 98,4 98,6 100,0 97,6 98,5 99,2 99,2 98,4 99,2 96,9
SUM Percent 100,0 100,0 100,0 100,0 100,0 100,0 100,0 100,0 100,0 100,0 100,0
Respondents with hyperlink treatment
T15 Click: Click rate - Online Store charges not included
TNS Infratest Page 138 Payment_Transparency_Tabs_weighted

UK France Germany Italy Spain Netherlands Denmark Finland Poland Slovenia
Country
total
Tab. 138
Base unw. 3.228 324 322 323 326 322 321 322 321 323 324
Base wght. 3.225 324 322 323 326 321 320 322 321 323 324 Click for more information Percent 1,5 1,6 1,2 1,2 1,8 1,2 0,6 0,9 1,9 1,9 2,2 No click for more information Percent 98,6 98,5 98,8 98,8 98,2 98,8 99,4 99,1 98,1 98,1 97,8
SUM Percent 100,0 100,0 100,0 100,0 100,0 100,0 100,0 100,0 100,0 100,0 100,0
Respondents with hyperlink treatment
T14/T15 Click: Click rate - Online Store combined
TNS Infratest Page 139 Payment_Transparency_Tabs_weighted


![[ FINANCIAL SERVICES SECTOR ]international.gc.ca/.../canada-financial_services... · Growth in the financial services industry is driven by technology—a sector in which Canada is](https://img.pdfslide.us/doc/110x75/5f449c5ce6ffd203fc0dd5a5/-financial-services-sector-growth-in-the-financial-services-industry-is-driven.jpg)