Embed Size (px)
Citation preview
九州大学学術情報リポジトリKyushu University Institutional Repository
STUDY ON SURFACE ENERGY PARAMETERS ANDMORPHOLOGY OF PROMISING ADSORBENT MATERIALS
エム, エル, パラシュ
http://hdl.handle.net/2324/4110543
出版情報:九州大学, 2020, 博士(学術), 課程博士バージョン:権利関係:
STUDY ON SURFACE ENERGY
PARAMETERS AND MORPHOLOGY OF
PROMISING ADSORBENT MATERIALS
Dissertation
Doctor of Philosophy
by
M L Palash
M. Eng. (KU, Japan), M. Sc. (DU, Bangladesh)
Department of Energy and Environmental Engineering
Interdisciplinary Graduate School of Engineering Sciences
Kyushu University
Japan
May 2020
STUDY ON SURFACE ENERGY PARAMETERS
AND MORPHOLOGY OF PROMISING
ADSORBENT MATERIALS
A dissertation submitted in partial fulfillment of the requirements for
the award of the degree of
Doctor of Philosophy
by
M L Palash
M. Eng. (KU, Japan), M. Sc. (DU, Bangladesh)
Supervisor: Professor Bidyut Baran Saha
Department of Energy and Environmental Engineering
Interdisciplinary Graduate School of Engineering Sciences
Kyushu University
Japan
May 2020
3 | P a g e
Summary
The demand for adsorption technologies is rapidly rising in various applications due to
its applicability in utilizing low-temperature heat sources (industrial waste heat or solar heat)
and environmentally friendly refrigerators (H2O, CO2, NH3, CH4O, etc.). The application area
includes but not limited to refrigeration & heat pumping, water production & treatment, air
conditioning & thermal comfort, and thermal energy storage. The critical component of the
adsorption technologies is the porous materials, known as adsorbents. The morphological
features of the adsorbents require to have some distinctive features like high surface area, meso
or microporosity, and optimum affinity towards refrigerants to become suitable for the
adsorption-based systems. Many promising adsorbents (silica gel, activated carbons, metal-
organic frameworks) are already synthesized having the mentioned features; still, there is no
clear breakthrough in adsorption systems found. One of the reasons behind this is the existing
gap between material science (MS) and applied thermal engineering (ATE).
This research gap predominantly depends on the existence of the intermediate
characterization technique, which supposes to relate the morphological features with the
adsorption phenomenon. For example, the material scientist explains the new adsorbents by
using surface area, pore size distribution, thermal/cycle stability to provide implicit indications
for the ATE scientists to understand the applicability of these adsorbents for their targeted
systems. Afterward, these adsorbents are further characterized by employing
volumetric/gravimetric adsorption techniques to measure the adsorption characteristics, such
as adsorption isotherms and kinetics measurements. Based on the adsorption pairs, the
isotherms are categorized into six major parts with two subparts (according to the International
Union of Pure and Applied Chemistry (IUPAC)) and shows an indirect relationship with the
morphological features of the adsorbents. Although the isotherm modeling has been reported
widely in the literature, however, it still lacks a universal approach in predicting the adsorption
isotherms of all available types. Recently, it is found that the surface energy of the adsorbents
plays a vital role in developing a universal model for all eight major types of isotherms.
Therefore, it is assumed that surface energy might be the predicted intermediate
characterization technique that can mitigate the existing gap up to some reasonable level
between MS and ATE.
4 | P a g e
The surface energy is a distinctive feature of adsorbents, which is rarely measured;
indeed, it carries essential information for the adsorption process. The only surface
morphological characterization does not provide the full feature of a surface; it is vitally
required to measure the surface activities which can be performed by surface energy
measurements. The total surface energy is divided into two components; dispersive and
specific. Dispersive surface energy is related to van der Waals interaction between the
adsorbate and adsorbent molecules, whereas specific surface energy depends on the acid-base
interactions. The separate measurement of these two components carries useful information;
however, the related research is hardly found in the literature.
From the above perspective, this thesis emphasizes the novel characterization techniques
that can employ in developing promising adsorbents for adsorption-based systems. The
research stresses several factors, firstly, extracting the morphological and surface activity
information of the promising adsorbents using novel characterizing techniques. Secondly,
finding a thermodynamic relationship between surface activities with the texture properties.
Finally, it includes the synthesis and characterization of metal-organic frameworks to enhance
the performance of adsorption chillers, which concludes with an insight of the enhancement
from the surface energy point of view.
In this research, atomic force microscopy (AFM) was used for extracting surface 3D
images, which is further employs to calculate the surface porosity information. AFM is an
excellent equipment for measuring texture information, which has many advanced features for
taking both the qualitative and quantitative data of the surface texture. However, it still not
convenient in measuring adsorbents having highly rough (> 10 nm) surfaces. Therefore, a novel
approach is developed to measure the adsorbent surfaces to generate height images. Provided
3D visualization exploits the surfaces with many distinctive features that are rarely found in
the literature. Additionally, the height data was used to detect the surface pores by utilizing
watershed segmentation. These detected pores are counted and compared with the N2-
adsorption techniques for understanding the differences and integrability.
The surface energy analysis in the infinite dilution was performed by Inverse Gas
Chromatography (IGC) technique to measure dispersive and specific components for various
promising silica gels (RD silica gel, Chromatorex, Home silica gel, and B-type silica gel). In
the IGC experiment, the silica gels were placed in 3 mm columns in a stationary phase. Three
non-polar solvents (Hexane, Heptane, Octane) and Five polar solvents (Ethanol,
dichloromethane, acetone, ethyl acetate, acetone) were carried through the column by helium
gas. From this experiment, the dispersive component is found dominating, and the highest
5 | P a g e
value was observed for RD granular silica gel. The trend of dispersive surface energy follows
the variation of surface area. It was interestingly found that porosity also influences the
dispersive component of the surface energy. Despite having a similar surface area, surface
energy is higher for RD silica gel than chromatorex. It is predicted that the higher the surface
energy in the infinite dilution, the higher will be the adsorption uptake because surfaces contain
high energy sites that might contribute significantly to the adsorption process. However, high
surface energy might generate high isosteric heat that can consequently reduce the adsorption
uptake. These results led to further experiments on the activated carbon-based adsorbents,
which exhibits high surface energy (>200 mJ m-2) than the silica gels (<100 mJ m-2).
The experiments conducted on the activated carbons (Maxsorb III, WPT-AC, H2-treated
Maxsorb) were slightly different from that of silica gels. Here, the measurement of isosteric
heat and isotherms in the Henry region were targeted to calculate the energetic behaviors of a
single component adsorbate-adsorbent system (ethanol-activated carbon pair) in terms of
enthalpy and entropy. A thermodynamic trend is established between the specific entropy and
the Henry’s law constant including the pore volume of adsorbents, and one can predict the
isosteric heats and adsorbent-pore-size for activated carbon + ethanol system by extending the
proposed linear trend, which is predicted to significantly contribute in tailoring the adsorbent
materials for the design of adsorption bed with a minimal or maximum driving force depending
on the types of heat transformation applications. However, the improvement mostly depends
on the modification of the pores and surface area, which might limit the tailoring efficiency.
On the other hand, another class of adsorbents, namely, metal-organic frameworks (MOFs), is
heightening interest in the field of adsorption due to its distinctive inherent properties. The
interior decoration of MOFs can be modified targeting the application area. As can be seen
from the mentioned studies, the morphological variation brings huge impacts on surface energy
and adsorption properties; it was assumed that modification of MOFs might deliver
extraordinary results on the adsorption process.
A rigorous review of promising MOFs and their modification were performed to select
the suitable MOF for adsorption chiller applications. After synthesizing a wide variety of
MOFs (Aluminium Fumarate, MIL-101 (Fe), MIL-100(Fe), MOF-74 (Co), MOF-74(Ni),
CAU-10H, HKAUST-1), aluminum fumarate was selected for analysis and modification. A
modified protocol was used to develop a tailored MOF developed in our laboratory (SMOF) to
enhance the yield and water adsorption uptake, which is then doped with various concentration
metal ions (Fe, Co) to observe the variation on water adsorption isotherms. Interestingly found
that the newly synthesized SMOF exhibits significantly high uptake and shifts the water
6 | P a g e
adsorption isotherms towards the lower pressure region. Both the findings are crucial for the
development of adsorption chillers; the analysis shows that SMOF improves the specific
cooling efficiency (SCE) up to 150%.
To deliver an insight into the improvement, the surface energy of the SMOFs was
conducted in the lower pressure region. A comparison of surface energy components between
the SMOFs reveals that the dispersive surface energy of the doped SMOFs was significantly
improved. However, the improvement of the specific surface energy was not compelling
considering dispersive surface energy. The doped ions only contributed to tailoring the
morphological properties.
7 | P a g e
Acknowledgments
This thesis is an outcome of a challenging yet fun-filled journey at Kyushu University,
which was made possible by the support, guidance, and encouragement from several
individuals. It is a wonderful opportunity for me to express my sincere thanks and gratitude to
all of them.
To begin with, I thank my advisor Professor Bidyut Baran Saha, for his support and
encouragement throughout my doctoral work. The success of the present study is due to his
wise counsel and timely advice on prioritizing the tasks at hand. He provided me with a
comfortable environment at the workplace and much-needed freedom to carry out my research
work. Being a resourceful man, he has been instrumental in connecting me with the right person
at various phases of my Ph.D. Interactions with him have helped widen my perspective in
multiple aspects of life. I hope to continue these interactions and get opportunities to work with
him in the future as well.
I would like to express my gratitude to my mentor Professor Takahiko Miyazaki
invaluable suggestions and encouragement throughout my entire study life in Japan.
I am indebted to Associate professor Kyaw Thu for his inspiring guidance whenever
asked for. He is an excellent young professor having the superior ability of multitasking, which
makes him my role model for the rest of my academic career. I would also like to express my
appreciation to Dr. Sivasankaran Harish for providing valuable suggestions with admirable
guidance from the very beginning of my doctoral study.
I am also grateful to Dr. Animesh Pal, Mr. Tahmid Hasan Rupam, and Ms. Israt Jahan
for their valuable assistance and for providing me the opportunity to discuss the technical
results of this work at any time.
I am also thankful to Professor Munim Kumar Barai for hosting the domestic internship
at Ritsumeikan Asia Pacific University, Oita, Japan. I am very grateful to Professor Anutosh
Chakraborty to give me the opportunity to work with him at Nanyang Technological
University (NTU), Singapore, and for teaching me the modern technique of synthesizing
promising metal-organic frameworks.
I am also indebted to Professor Bidyut Baran Saha, Professor Takahiko Miyazaki,
Professor Kazuhide Ito, and Associate Professor Jin Miyawaki for evaluating this work and
for their valuable feedback.
I am thankful to all of my present and former laboratory members and staff for their help
and kind cooperation. In particular, I must thank Late Professor Mahfuza Sharifa Sultana,

8 | P a g e
Dr. Kutub Uddin, Dr. Sourav Mitra, Dr. Amirul Islam, Dr. Mahbubul Muttakin, Mr. Sampad
Ghosh, Mr. Kaiser Ahmed Rocky, Mr. Matiar Rahman, Ms. Mahua Jahan Alam, Mr. Perera
Colombatantirige Uthpala Amoda, Mr. Shamal Chandra Karmaker, Mr. Mir Shariful Islam,
Mr. Hosan Shahadat, Mr. Ye Lei, and Mr. Hisham Maher Abdelwahab Mohamed for making
me feel comfortable in the lab and for supporting me in various ways.
I would also like to special thanks to Mrs. Tandra Bhuiyan Saha, wife of my
Supervisor, for giving advice, suggestions, and taking care during my stay in Japan. Because
of her wise suggestions, my Japan life was very smooth, funny, and enjoyable.
I wish to express my heartfelt indebtedness Advanced Graduate Program in Global
Strategy for Green Asia (GA), IGSES, Kyushu University for providing scholarship, and all
other facilities required in this study. I would like to acknowledge I2CNER at Kyushu
University for the access to their experimental facilities. I am also grateful to all staff of Green
Asia and IGSES for supporting me in various ways during my stay at Kyushu University. I
consider myself fortunate to have enjoyed the opportunity of working at Kyushu University
under the supervision of honorable Professor Bidyut Baran Saha. I am grateful to the authority
of the University of Dhaka, Bangladesh, for granting the study leave and giving me the
opportunity to study at Kyushu University. Special thanks to technical staff, Mr. Shoji Hirano
and Ms. Yoka Hara, Ms. Yoshiko Kano, and Ms. Yuku Hayashi, for helping me in various
ways during my stay in Japan.
I would like to express my gratefulness to my father, Late Md. Fazlul Haque, my
inspiration, and an exemplary role model. I express my humble obligation to my affectionate
and loving mother, sister, brother-in-law, and all the family members for their love, inspiration,
and prayers for me. In particular, I am thankful and would like to express my gratitude to my
mother, Mrs. Khawla Khatun, sister Dr. Ayesha Akhter, brother-in-law Dr. Md. Rafiqul
Islam, and my elder brother like maternal uncle Mr. M. A. Mamoon for everything they have
done for me.
Finally, I am thankful to my angels Arisha Mariam, Aariz Faizan, and Aarib Faiyaz,
for keeping me happy and energetic throughout this amazing journey. And I would like to
dedicate this thesis to my beloved Mahfuza Faruquee, whose immense sacrifice and constant
encouragement made all of these possible.
M L Palash
Kyushu University, Japan
9 | P a g e
List of Publications
Awards
1. “Silver Award-Young Researcher Award on Energy Research” given by the
president of Kyushu University under the "Kyushu University Platform of Inter-
/Transdisciplinary Energy Research", Jan. 28, 2020, Fukuoka, Japan.
2. “President’s Award” from the President of Kyushu University for producing most
excellent results as a team in the Kyushu University Challenge and Creation Project,
Mar. 29, 2019.
3. “HULT Prize Japan National Winner” for the most innovative idea entitled
“Distributed Cold Storage for Vegetables and Life Saving Drugs Without Electricity”,
Osaka, Japan, 20th May 2018.
4. “QREC C&C Challenge”, won the challenge as a team member of S-cube, Kyushu
University, May 13, 2018, Fukuoka, Japan.
5. “Best Poster award”, for conference paper presented at International Exchange and
Innovation conference on Engineering & Sciences, Oct. 18-19, 2018, Fukuoka, Japan.
6. “QREC J.O.C Challenge”, won the challenge as a team member of S-cube, Kyushu
University, April 24, 2018, Fukuoka, Japan.
7. “QREC GC&C Challenge”, won the challenge as a team member of S-cube, Kyushu
University, Jan. 16 2018, Fukuoka, Japan.
8. “Bronze Award-Young Researcher Award on Energy Research” given by the
president of Kyushu University under the "Kyushu University Platform of Inter-
/Transdisciplinary Energy Research", Jan. 30, 2018, Fukuoka, Japan.
9. “Hult Prize Kyushu University Championship, Japan, as a team leader of S-cube,
we have won the national championship of Japan for our project titled as “Distributed
system for the farmers of Bangladesh”, Dec. 17, 2017, Fukuoka, Japan.
Journal Publications
1. M. L. Palash, Israt Jahan, Tahmid Hasan Rupam, Sivasankaran Harish, Bidyut Baran
Saha, “Novel technique for improving the water adsorption isotherms of metal-organic
10 | P a g e
frameworks for performance enhancement of adsorption driven chillers”, Inorganica
Chimica Acta, 501 (2020).
2. M. L. Palash, Sourav Mitra, Shivasankaran Harish, Kyaw Thu, Bidyut Baran Saha,
“An approach for quantitative analysis of pore size distribution of silica gel using
atomic force microscopy”, International Journal of Refrigeration, 105, pp. 72-79
(2019).
3. Israt Jahan, M. A. Islam, M. L. Palash, Kaiser Ahmed Rocky, Tahmid Hasan Rupam,
Bidyut Baran Saha, “Experimental study on the influence of metal doping on
thermophysical properties of porous aluminum fumarate”, Heat Transfer Engineering,
42 (13-14), 2020. (Accepted)
4. M. L. Palash, Animesh Pal, Tahmid Hasan Rupam, Bidyut Baran Saha, “Surface
characterization of different particulate silica gels by inverse gas chromatography at
infinite dilution”, Colloids and Surfaces A: Physicochemical and Engineering Aspects,
603, 125209.
Presentation at an International Conference
1. M. L. Palash*, Animesh Pal, Bidyut Baran Saha, “Investigation of surface energy of
porous adsorbents”, 5th International exchange and Innovation Conference on
Engineering & Sciences (IEICES 2019), pp. 32-33, Oct 24-25, 2019, Fukuoka, Japan.
2. Tahmid Hasan Rupam*, M. L. Palash, Israt Jahan, Bidyut Baran Saha, “Adsorption
characteristic of aluminium fumarate metal-organic frameworks”, 5th International
exchange and Innovation Conference on Engineering & Sciences (IEICES 2019), pp.
34-35 Oct 24-25, 2019, Fukuoka, Japan.
3. T. H. Rupam*, M. L. Palash, Israt Jahan, S. Bhaumik and B. B. Saha "Shifting of
adsorption isotherm induced by transitional metal doping in aluminum fumarate"
International Conference on “Water, Energy and Biodiversity (WEB) for Sustainable
Development of BIMSTEC Countries (WEB for BIMSTEC-2019)” Agartala, Tripura,
India, 12-14 December 2019. (Best Oral Presentation Award).
4. M. L. Palash*, Animesh Pal, Kyaw Thu, Bidyut Baran Saha, “Study on Surface
Characteristics of Various Adsorbents using Inverse Gas Chromatography”, 5th
International Conference on Polygeneration (ICP 2019), May 15-17, 2019, Fukuoka,
Japan.
11 | P a g e
5. B. B. Saha*, M. L. Palash, “Metal-organic Frameworks as adsorbents for heat pump
applications”, the International Workshop on Environmental Engineering 2019, Nago,
Okinawa, Japan, June 25-28, 2019.
6. T. H. Rupam*, M. L. Palash, I. Jahan, S. Harish and B. B. Saha "Green Synthesis and
Adsorption characterisation of an aluminum based metal organic framework" Proc. of
21st Cross Straits Symposium on Energy and Environmental Science and Technology
(CSS-EEST), Shanghai Jiao Tong University, Shanghai, China, 24-27 November 2019.
7. M. L. Palash*, Kyaw Thu, Bidyut Baran Saha, “Qualitative and Quantitative
characterization of nano-porous materials” International Exchange and Innovation
Conference on Engineering & Sciences, Oct. 18-19, 2018, Fukuoka, Japan.
8. M. L. Palash*, Kyaw Thu, Bidyut Baran Saha, “Surface Characterization of Porous
Materials for Adsorption Cooling Systems”, International Conference on Material
Science and Semiconductor Devices, Sept. 7-8, 2018, Dhaka, Bangladesh.
9. M. L. Palash*, S. Mitra, S. Harish, Kyaw Thu, K. Takahashi, B.B. Saha “An Approach
for Quantitative Analysis of Pore Size Distribution of Silica Gel Using Atomic Force
Microscopy”, International Sorption Heat Pump Conference (ISHPC 2017), Aug. 7-10,
2017, Tokyo, Japan.
* Presenting Author.
Presentation at a Domestic Conference and Symposium
1. M. L. Palash*, B.B. Saha, “Surface energy characterization of various porous
adsorbents”. Hydrogenius and I2CNER Joint Research Symposium, Kyushu
University, Fukuoka, Japan, Jan 31 2020. [Oral]
2. M. L. Palash*, Tahmid Hasan Rupam, Israt Zahan, Bidyut Baran Saha,
“Functionalization of porous material for developing adsorption-based portable passive
water harvester”, Energy week 2020, Kyushu University, Fukuoka, Japan, Jan 28, 2020.
3. M. L. Palash*, Tahmid Hasan Rupam, Israt Jahan, Bidyut Baran Saha, “Study on
Metal-organic Frameworks (MOFs) as Energy Materials for Adsorption-based Heat
Pumps”, National Conference on Physics 2019, Dhaka Bangladesh, MS-07, pp. 42, Feb
07-09, 2019.
4. M. L. Palash*, Animesh Pal, Kyaw Thu, Bidyut Baran Saha, “Study on Surface Energy
Components to Develop Functional Materials for Heating/Cooling Applications”,
I2CNER Annual Symposium 2019, Kyushu University , Fukuoka, Japan, Jan. 31, 2019
12 | P a g e
5. M. L. Palash*, Sourav Mitra, Kyaw Thu, Koji Takahashi, Bidyut Baran Saha,
“Implementing direct imaging technique for quantitative analysis of surface porosity
of mesoporous adsorbents”, Q-PIT Annual Symposium 2018, Kyushu University,
Fukuoka, japan.
6. M. L. Palash*, Kyaw Thu, Bidyut Baran Saha, “Quantitative and qualitative
characterization of nanoporous materials”, 47th International exchange and Innovation
Conference on Engineering & Sciences (IEICES 2018), Kyushu University, Japan, Oct.
18-19, 2018.
7. M. L. Palash* “Topographic analysis of silica gel imaged with Scanning Probe
Microscopy”, FY2016 Green Asia Program Short-term Fieldwork in Taiwan, Jan. 17-
19, 2017, Kaohsiung, Taiwan.
8. M. L. Palash*, S. Mitra, K. Thu, B. B. Saha, “Study of In-situ and Ex-situ Porosity Of
Mesoporous Silica Gel”, International Forum for Green Asia 2017, Kyushu University,
November, 2017, Fukuoka, Japan.
9. M. L. Palash*, S. Mitra, S. Harish, Kyaw Thu, B. B. Saha, “Topographic analysis of
silica gel imaged with atomic force microscopy”, The 18th Cross-Straits Symposium on
Energy and Environmental Science & Technology, pp. 47-48, Dec. 4-6, 2016,
Shanghai, China.
* Presenting Author.
13 | P a g e
Contents
Summary ............................................................................................................................. 3
Acknowledgements .............................................................................................................. 7
List of Publications .............................................................................................................. 9
List of Figures.................................................................................................................... 17
List of Tables ..................................................................................................................... 21
Chapter 1 Introduction ..................................................................................................... 22
1.1 Background .................................................................................................................. 22
1.2 Adsorption cooling system ........................................................................................... 24
1.2.1 Principle of adsorption ........................................................................................ 24
1.2.2 Working principle of adsorption cooling system .................................................. 24
1.3 Adsorbents for cooling application ............................................................................... 26
1.3.1 Silicate ................................................................................................................ 27
1.3.2 Zeolite ................................................................................................................. 28
1.3.3 Activated carbon (AC) ........................................................................................ 29
1.3.4 Metal-organic frameworks (MOFs) ..................................................................... 29
1.4 Characterization techniques .......................................................................................... 31
1.5 Enhancing performance ................................................................................................ 33
1.5.1 Metal coating/doping: ......................................................................................... 33
1.5.2 Composite ........................................................................................................... 33
1.6 Motivation.. .................................................................................................................. 34
1.7 Aims and objectives of the thesis .................................................................................. 37
1.8 Organization of the thesis ............................................................................................. 38
Chapter 2 Overview of Modern Characterization Techniques ....................................... 41
2.1 Adsorption.. ................................................................................................................. 41
2.1.1 Basic of the adsorption process ........................................................................... 41
2.1.2 Factor influencing adsorption process.................................................................. 42
2.2 Heat transfer applications of adsorption ........................................................................ 43
2.3 3D-imaging using Atomic Force Microscopy (AFM) ................................................... 45
2.4 Characterization at zero coverage using Inverse Gas Chromatography (IGC) ............... 51
2.4.1 Components of IGC ............................................................................................ 51
14 | P a g e
2.4.2 Probe molecule detection technique..................................................................... 52
2.4.3 Operation modes ................................................................................................. 54
2.4.4 Applications of IGC ............................................................................................ 54
2.5 Approaches of this thesis .............................................................................................. 56
Chapter 3 Morphological Study of Porous Materials using Atomic Force Microscopy . 58
3.1 Material….. .................................................................................................................. 58
3.2 Experimental apparatus and procedure ......................................................................... 58
3.2.1 Experimental apparatus ....................................................................................... 59
3.2.2 Generation of three-dimensional images .............................................................. 60
3.2.3 Measuring conditions .......................................................................................... 61
3.2.4 Measurement procedure ...................................................................................... 62
3.2.5 Error analysis and minimization .......................................................................... 63
3.2.6 Image processing................................................................................................. 65
3.3 Results and Discussions ............................................................................................... 65
3.3.1 Porous properties................................................................................................. 67
3.3.2 Qualitative study of the surface using SPM ......................................................... 69
3.3.3 Quantitative analysis of topographic images ........................................................ 70
3.4 Conclusions .................................................................................................................. 74
Chapter 4 Surface Energy Characterisation of Different Porous adsorbents by Inverse
Gas Chromatography ....................................................................................................... 75
4.1 Introduction .................................................................................................................. 75
4.2 Theory…… .................................................................................................................. 77
4.3 Materials… .................................................................................................................. 81
4.4 Experimental ................................................................................................................ 81
4.5 Results and discussion .................................................................................................. 83
4.5.1 Surface energies .................................................................................................. 83
4.5.2 Gibbs free energy of polar components ............................................................... 87
4.5.3 Effect of morphology and comparison among various adsorbents ........................ 90
4.6 Conclusions .................................................................................................................. 91
Chapter 5 Experimental Investigation of Adsorption Isotherms and Heat of Adsorption
at Henry Region for Activated Carbon/Ethanol Pairs..................................................... 93
5.1 Introduction .................................................................................................................. 93
5.2 Material….. .................................................................................................................. 94
15 | P a g e
5.3 Experimental ................................................................................................................ 95
5.4 Results and discussion .................................................................................................. 96
5.4.1 Isotherms at Henry region ................................................................................... 96
5.4.2 The heat of adsorption at zero coverage ............................................................. 104
5.4.3 Entropy modeling .............................................................................................. 108
5.5 Conclusions ................................................................................................................ 113
Chapter 6 Novel Technique for Improving Water Adsorption Isotherms of Metal-organic
Frameworks..................................................................................................................... 115
6.1 Introduction ................................................................................................................ 115
6.2 Experimental .............................................................................................................. 117
6.2.1 Material and synthesis ....................................................................................... 117
6.2.2 Material Characterization .................................................................................. 118
6.3 Results and Discussion ............................................................................................... 119
6.3.1 Physical Properties ............................................................................................ 119
6.3.2 Adsorption isotherms ........................................................................................ 123
6.4 Conclusions ................................................................................................................ 126
Chapter 7 Study on Surface Activities of Improved Metal-doped Metal-organic
Frameworks..................................................................................................................... 127
7.1 Materials synthesis and preparation ............................................................................ 127
7.2 Experimental procedure.............................................................................................. 128
7.3 Results and discussion ................................................................................................ 129
7.3.1 Morphological characterization ......................................................................... 129
7.3.2 Water Adsorption isotherms .............................................................................. 129
7.3.3 Surface energies of studied SMOF samples ....................................................... 132
7.3.4 Specific Gibbs free energy ................................................................................ 137
7.4 Comparative analysis ................................................................................................. 139
7.5 Conclusions ................................................................................................................ 141
Chapter 8 Overall conclusions and recommendations .................................................. 142
8.1 Overall conclusions .................................................................................................... 142
8.2 Recommendations ...................................................................................................... 146
References........................................................................................................................ 148
Appendix A. Three-dimensional images of various adsorbents .................................... 164

16 | P a g e
Appendix B. Example of surface energy date measured for RD granular silica gel using
Inverse Gas Chromatography ........................................................................................ 166
Appendix C. Henry region isotherm data of activated carbon/ethanol pairs ............... 170
Appendix D. SMOF synthesis and water adsorption isotherms .................................... 172
17 | P a g e
List of Figures
Fig. 1.1. (a) Schematic of adsorption cooling system (b) adsorption-desorption isotherm at
different temperatures (T1<T2). ........................................................................25
Fig. 1.2. Composite C has a more significant difference between AB and DC line, which is a
measure of effective uptake. The effective uptake of the composite is more
significant than Maxsorb III [14]. (Reprinted with the permission of
publisher) .........................................................................................................27
Fig. 1.3. Water adsorption isotherm at 25℃ for various MOFs . .........................................31
Fig. 1.4. Fundamental queries that motivates to pursue this thesis work. .............................35
Fig. 1.5. Prediction of the role of surface energy on Type I isotherms . ...............................36
Fig. 1.6. Preliminary target was to improve surface energy in the lower pressure region where
surface energy is higher....................................................................................38
Fig. 2.1. A general view of the adsorption process. .............................................................42
Fig. 2.2. Influential factors of the adsorption process, (a) textural properties, (b) surface
energy. .............................................................................................................43
Fig. 2.3. Application of adsorption technologies. A) building energy management B)
decarbonization in the industrial sectors. ..........................................................44
Fig. 2.4. The fundamental operation of Scanning Probe Microscopy (a) tip-surface analogy
with a blind man’s walking. (b) schematic of probe surface interaction. ...........46
Fig. 2.5. Built-in optical lever a) schematic of optical lever b) laser path in SPM-9700. ......46
Fig. 2.6. The schematic diagram of SPM-9700 operated in contact mode . .........................47
Fig. 2.7. Modes of operation of Scanning Probe Microscopy. .............................................48
Fig. 2.8. Experimental procedure to extract AFM images. ..................................................49
Fig. 2.9. SPM images of Silica gel a) position of the cantilever on sample b) Tilted raw image
c) Flatten image d) 3D image after flattening. ..................................................50
Fig. 2.10. SPM images of activated carbon a) Phase image b) height image c) 3D image....50
Fig. 2.11. Schematic diagram of Inverse Gas Chromatography. ..........................................52
Fig. 2.12. A typical chromatographic peak in IGC generated on the Maxsorb III sample by
ethanol probe molecule for 0.01 fractional coverage at 303 K. The probes are
injected using the pulse method. .......................................................................53
Fig. 2.13. Approaches of this thesis. ...................................................................................57
Fig. 3.1. Schematic diagram of SPM system operated in phase mode. ................................60
18 | P a g e
Fig. 3.2. Scanning pattern of SPM a) raster scanning pattern b) trace and retrace line graph
confirming reproducibility c) line graph showing corrupt scanning. .................61
Fig. 3.3. Scanning spherical silica gel using AFM a) schematic of the surface of silica gel and
the influence of set point to optimize the movement of SPM probe. B) 3D
topographic image of a silica gel surface with line profile showing height variation
along a flat surface. ..........................................................................................62
Fig. 3.4. Error measurement procedure, (a) 3D view of the standard calibration sample and its
corresponding line graph, (b) measured height of individual pitches of TGG1. .64
Fig. 3.5. BET-N2 experiment onto various silica gel (a) N2 adsorption/desorption isotherm (b)
NLDFT pore size distribution...........................................................................68
Fig. 3.6. Extended 3D images of various porous materials. .................................................69
Fig. 3.7. Filtering high topographic information a) raw image which contains large height
variation, b) corresponding frequencies of spatial image, c) image after applying
filter d) zoomed raw image, e) zoomed filtered image shows the existence of
similar curvatures as in the raw image. .............................................................71
Fig. 3.8. AFM experiment on various silica gel (a) variation of different drop size to determine
the effect on the surface area and the skewness values are shown in each bar graph,
(b) pore size distribution is showing surface porosity. ......................................72
Fig. 3.9. Pore size distribution of different porous material, (a) Silica-Alumina (b)
Acetaminophen. ...............................................................................................74
Fig. 4.1. Schematic diagram of Inverse Gas Chromatography. ............................................82
Fig. 4.2. (a) Retention volume (VN) of alkanes (b) fitted alkane series obtained with RD
granular silica gel. ............................................................................................84
Fig. 4.3. Adsorption uptake of (a) Heptane and (b) Dichloromethane onto different types of
silica gels. ........................................................................................................85
Fig. 4.4. Comparison of (a) dispersive; (b) specific; and (c) total surface energy among the
different types of silica gels. .............................................................................87
Fig. 4.5. The typical diagram for determining the specific Gibbs free energy (ΔGSP) by
polarization method for RD granular silica gel at 0.03 coverage. ......................88
Fig. 4.6. Gibbs free energy changes of adsorption for polar probes (a) surface coverage of
0.03 and (b) surface coverage of 0.05. ..............................................................89
Fig. 4.7. Correlation between the dispersive component of surface energy and morphological
characteristics. (a) variation with specific surface area (b) variation with pore size
distribution. ......................................................................................................90
19 | P a g e
Fig. 4.8. Comparison of dispersive surface energy among the various adsorbents. (1st 4 silica
gels (measured data); SBA-16, SBA-15; Maxsorb III ; A-20 (measured data); and
Chemviron F400, Norit SA4). ..........................................................................91
Fig. 5.1. Schematic diagram of IGC-SEA equipment. .........................................................96
Fig. 5.2. Simplified illustration of step 1 to measure isotherm (Maxsorb III/ethanol pair at 303
K) ....................................................................................................................97
Fig. 5.3. Simplified illustration of step 2 to measure isotherm (Maxsorb III/ethanol pair at 303
K) ....................................................................................................................98
Fig. 5.4. Simplified illustration of step 3 to measure isotherm (Maxsorb III/ethanol pair at 303
K) ....................................................................................................................99
Fig. 5.5. Ethanol adsorption on Maxsorb III at Henry region. ........................................... 100
Fig. 5.6. Ethanol adsorption on WPT-AC at Henry region. ............................................... 100
Fig. 5.7. Ethanol adsorption on M-AC at Henry region. .................................................... 101
Fig. 5.8. Ethanol adsorption on H2-Maxsorb III at Henry region. ...................................... 101
Fig. 5.9. Comparison of Henry’s constant for different pairs............................................. 103
Fig. 5.10. Determination of heat of adsorption for Maxsorb III/ethanol pairs. Experiment was
conducted two times to confirm the data regeneration ability. ........................ 105
Fig. 5.11. Determination plot of heat of adsorption for WPT-AC/ethanol pairs. ................ 105
Fig. 5.12. Determination of heat of adsorption for M-AC/ethanol pairs. ........................... 106
Fig. 5.13. Determination of heat of adsorption for H2-Maxsorb/ethanol pairs. .................. 106
Fig. 5.14. Comparison of heat of adsorption for all studied samples at different surface
coverage. ....................................................................................................... 107
Fig. 5.15. Comparison of measured heat of adsorption with the theoretically found values
addressed at various literature. ....................................................................... 108
Fig. 5.16. The relation between adsorbed phase specific entropy and the ratio of Henry
constant and total pore volume of adsorbents at 328 K temperature. ............... 111
Fig. 5.17. The relation between adsorbed phase specific entropy against surface coverage at
328 K temperature.......................................................................................... 112
Fig. 6.1. Scanning electron micrography (SEM) of different SMOFs (a) SMOF (b)10% Co-
SMOF (c) 10% Ni-SMOF. ............................................................................. 120
Fig. 6.2. XRD of different MOF samples. ......................................................................... 121
Fig. 6.3. TGA of SMOF samples. ..................................................................................... 122
Fig. 6.4. The pore size distribution of studied samples. ..................................................... 123
Fig. 6.5. Water adsorption isotherms of different samples................................................. 124
20 | P a g e
Fig. 6.6. Enhanced uptake of doped aluminum fumarate. The water uptake is significantly
increased in the lower pressure region. ........................................................... 125
Fig. 6.7. Comparison of △q (Effective uptake) between RD silica gel/water and SMOF/water.
...................................................................................................................... 126
Fig. 7.1. Water desorption isotherms of the studied SMOFs at 303 K temperature. ........... 130
Fig. 7.2. Water desorption isotherms of the studied SMOFs at 333 K temperature. ........... 131
Fig. 7.3. Retention volume vs coverage for alkanes of all the studied samples. ................. 133
Fig. 7.4. Uptakes of the polar probes on 10% Co-SMOFs at 513 K temperature for 0.005
coverage ........................................................................................................ 134
Fig. 7.5. The dispersive surface energy of all studied samples. ......................................... 135
Fig. 7.6. The specific surface energy of studied samples. .................................................. 136
Fig. 7.7. The total surface energy of all studied samples ................................................... 137
Fig. 7.8. Comparison of Work of adhesion for different adsorbent/water pairs at 0.1 coverage.
...................................................................................................................... 141
21 | P a g e
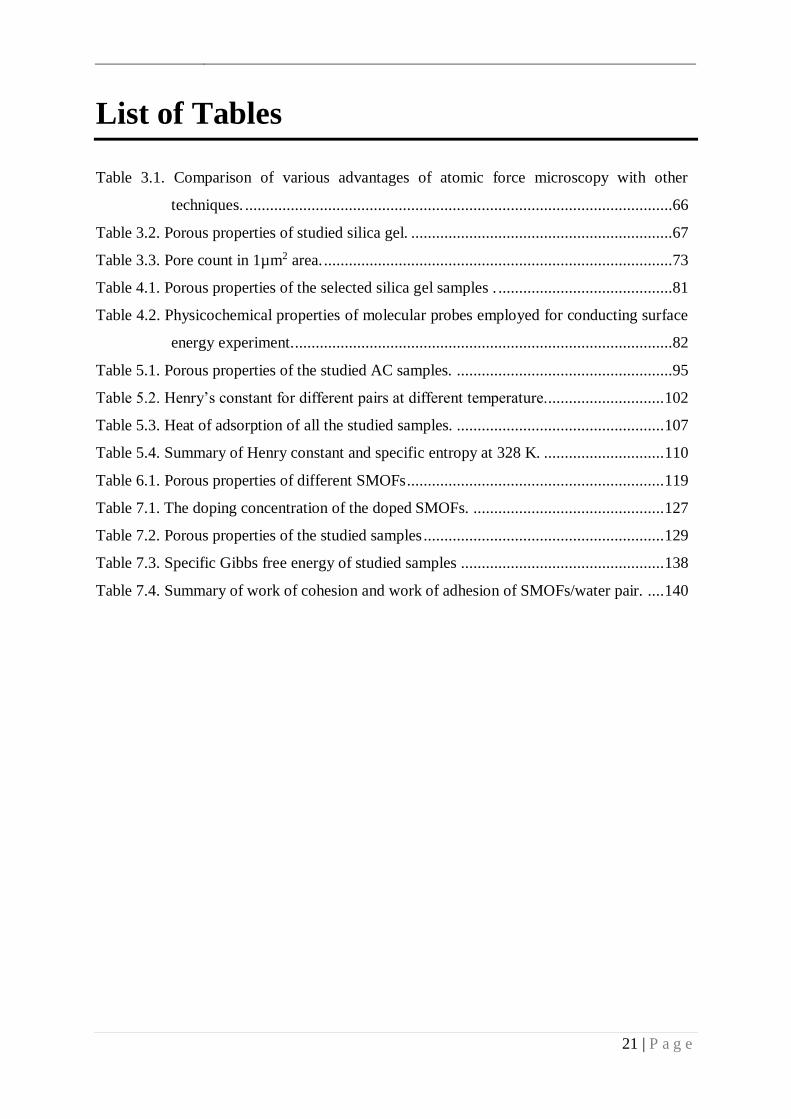
List of Tables
Table 3.1. Comparison of various advantages of atomic force microscopy with other
techniques. .......................................................................................................66
Table 3.2. Porous properties of studied silica gel. ...............................................................67
Table 3.3. Pore count in 1µm2 area. ....................................................................................73
Table 4.1. Porous properties of the selected silica gel samples . ..........................................81
Table 4.2. Physicochemical properties of molecular probes employed for conducting surface
energy experiment. ...........................................................................................82
Table 5.1. Porous properties of the studied AC samples. ....................................................95
Table 5.2. Henry’s constant for different pairs at different temperature............................. 102
Table 5.3. Heat of adsorption of all the studied samples. .................................................. 107
Table 5.4. Summary of Henry constant and specific entropy at 328 K. ............................. 110
Table 6.1. Porous properties of different SMOFs .............................................................. 119
Table 7.1. The doping concentration of the doped SMOFs. .............................................. 127
Table 7.2. Porous properties of the studied samples .......................................................... 129
Table 7.3. Specific Gibbs free energy of studied samples ................................................. 138
Table 7.4. Summary of work of cohesion and work of adhesion of SMOFs/water pair. .... 140
22 | P a g e
Chapter 1
Introduction Equation Chapter 1 Section 1
The research on adsorption cooling and heat pump system got momentum after observing
the worldwide energy crisis along with the obligation of international protocols, which limits
the production and utilization of CFCs and HCFCs as refrigerants. The adsorption heat pump
(AHP) is found to be a safe and viable alternative to the mechanical vapor compression system
because of the following advantageous features: (i) ability to use effectively low-grade waste
heat or solar heat of temperature below 100°C as the driving heat source, (ii) it can utilize
natural and/or alternative refrigerants having zero or negligible global warming potential, (iii)
no moving parts, (iv) does not require electricity other than the heat transfer fluid pumps and
electromagnetic valves, and (v) require negligible maintenance. However, due to having lower
Coefficient of Performance (COP) and bulkier size make it less compatible with the vapor
compression system. The possible way to improve the performance of adsorption chiller is by
introducing new adsorbent materials with distinctive features. This chapter explains the
motivation of this thesis to adsorption heat pump systems. The objectives and outline of this
thesis are presented in the latter part of the chapter.
1.1 Background
Maintaining a proper thermal environment is not optional, but it becomes essential for
human life because it influences productivity and health. Thermal comfort has a close relation
to various aspects of human behavior; providing a cool environment is the most crucial part of
achieving this [1]. Air conditioning and refrigeration are a useful technique ever used in
developed countries to maintain the standard of thermal comfort for occupants of buildings. In
developing countries, the use of cooling is becoming popular day by day. The increasing
interest in the cooling system to maintain thermal comfortability has an adverse effect on
energy consumption. It is estimated that the conventional vapor compression refrigeration
system used for air conditioning consumes 45 percent of the total electricity consumed in
commercial and household buildings [2]. On top of that 15 percent of the total electricity
consumed in the world are by refrigeration and air-conditioning [3].
The developing world plays a significant role in increasing the demand for air-
conditioning and refrigeration, which is alone anticipated to surge 33-fold by 2100 because of
the rise of income and urbanization. Because of this fact, within 2060, people will use more
CHAPTER 1 INTRODUCTION
23 | P a g e
energy for cooling than heating [4]. The conventional system used for cooling applications uses
a vapor compression cycle, which has a two-fold environment pollution nature. A large amount
of electricity consumed by the system is produced by burning fossil fuel; on the other hand, the
refrigerants used in the system are not environment friendly. The global warming potential of
these gases is, in some cases, more than 4000 times dangerous than carbon dioxide. For
example, diesel driven refrigerator on food trailers releases 30 times more hazardous matter
and six-time more nitrogen oxide than the engine drives the vehicle.
Highlighting the importance of an energy-efficient environment-friendly heat-driven
sorption system has the immense potential [5] as a viable alternative to the electricity-driven
vapor compression system. The expedient part of the sorption system is, it replaces the vapor
compression cycle by a “thermal compressor”. In the absorption system, the sorbent part is
liquid, and in adsorption, it is solid. Adsorption cooling systems can be driven by low-grade
waste heat or solar heat. However, the absorption cooling system required high-grade waste
heat, which can be found in steam or even combustion. Compare to absorption systems,
adsorption chiller is in several steps forward, considering no possibilities of crystallization,
corrosion, hazardous leaks. These features make this system superior in air conditioning and
heat recovery system [6,7]. Although initially, the primary application was restricted to
industrial sectors, solar-driven adsorption is gradually gaining attention in domestic
refrigeration and cooling sectors [8].
There are many challenges still to overcome in adsorption cooling systems because of
having various technical constraints. It cannot be considered for direct-fired because of the
requirement of an ample amount of primary energy, only waste or solar heat driven are proven
to be beneficial. It still has a lower COP compare to absorption and conventional vapor
compression system. The larger size also makes it challenging to become cost-competitive to
other technologies. There are three principal areas for successful implementation of adsorption
cooling systems; the adsorbent selection/tailoring, device construction, and advanced cycles.
Generally, they are highly correlated and dependent on operational conditions. Particularly, the
careful design of adsorbents ideal for particular adsorption cooling applications is of primary
importance [9]. Therefore, this thesis targeted the characterization and tailoring of adsorbents
to contribute to the primary challenge for improving the performance of adsorption chillers.
CHAPTER 1 INTRODUCTION
24 | P a g e
1.2 Adsorption cooling system
1.2.1 Principle of adsorption
The crucial part of an adsorption process is a porous solid which provides an identical
large surface area (>500 m2 g-1) and large pore volumes. These two phenomena lead to sizeable
adsorptive capacity [10]. The surface of the solid material is usually unsaturated and
unbalanced. When the surface is brought into contact with the gas, an interaction is materialized
between the unbalanced molecular forces at the surface and the gas molecular forces. The
reason behind that is solid surface tends to satisfy these residual forces by attracting and
retaining on its surface to the molecules, atoms, or ions of the gas. This phenomenon results in
a higher concentration of the gas or liquid in the near vicinity of the solid surface than in the
bulk gas or vapor phase, despite the nature of the gas or vapor [11]. The process is known as
adsorption.
Depending on the constraining force during the adsorption, this process may take place
in two ways; physisorption and chemisorption. In the Physisorption process, the adsorbate
molecules are attracted to the adsorbent surface by the weak van der Waals force, which is
similar to the molecular forces of cohesion. There are not any changes in the chemical
composition of the adsorption pair. The chemisorption process involves valence forces arising
from the sharing of electrons between the adsorbent and the adsorbate atoms. These forces
result in a chemical reaction and forming a complex surface compound. The forces of these
formed bonds are much stronger than the Van der Waals force. It should be mentioned that the
adsorptive action is physical for almost all solid adsorbents, which are commonly used in
adsorption cooling systems [12].
1.2.2 Working principle of adsorption cooling system
The adsorption cooling system works similarly as the conventional refrigerator, except it
has no mechanical compressor. This mechanical part is replaced by the thermal compressor,
which is shown in Fig. 1.1(a). The adsorbent containing the refrigerant is heated by the solar
collectors or waste heat, and the adsorbed refrigerant is expulsed as vapor and condenses in the
condenser. The condensed refrigerant is then transferred to the evaporator via the expansion
valve, leading to a lower pressure area. The refrigerant evaporates in the evaporator, taking up
the heat from the chilled water and finally adsorbed in the cooled adsorbent part. Coldwater
then evacuates the adsorption heat. Continuous cooling can be achieved by the assistance of
two separate adsorption beds.
CHAPTER 1 INTRODUCTION
25 | P a g e
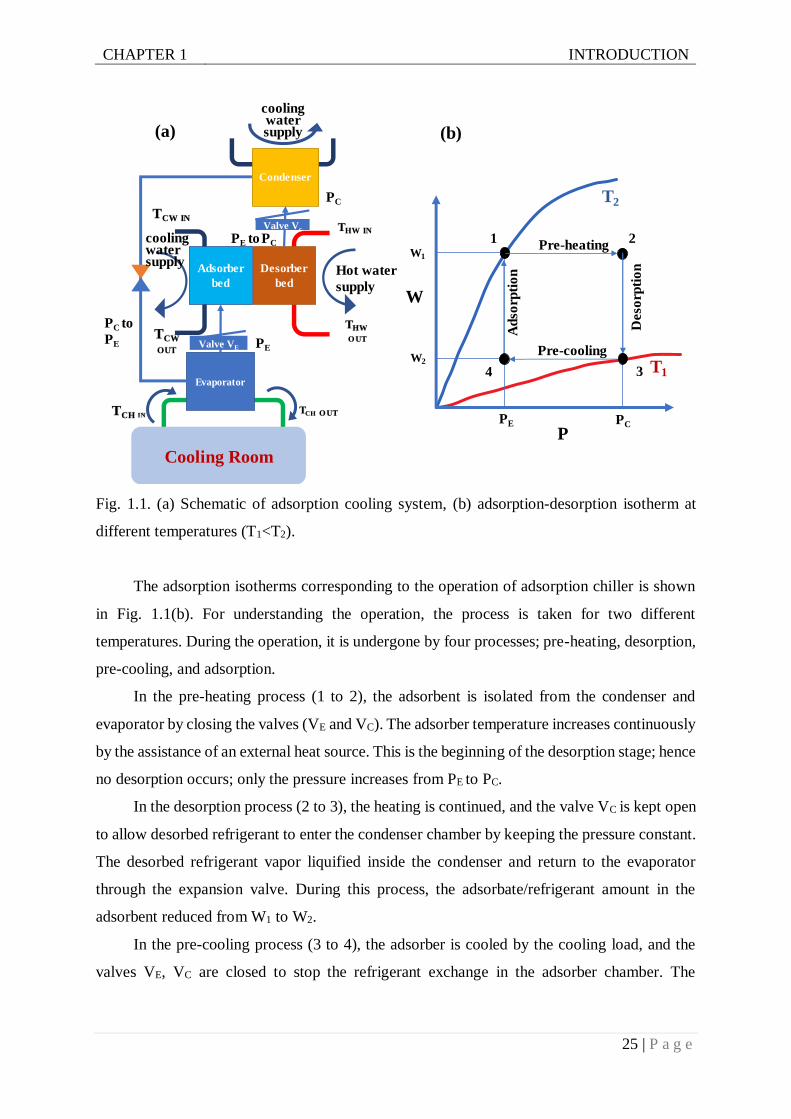
Fig. 1.1. (a) Schematic of adsorption cooling system, (b) adsorption-desorption isotherm at
different temperatures (T1<T2).
The adsorption isotherms corresponding to the operation of adsorption chiller is shown
in Fig. 1.1(b). For understanding the operation, the process is taken for two different
temperatures. During the operation, it is undergone by four processes; pre-heating, desorption,
pre-cooling, and adsorption.
In the pre-heating process (1 to 2), the adsorbent is isolated from the condenser and
evaporator by closing the valves (VE and VC). The adsorber temperature increases continuously
by the assistance of an external heat source. This is the beginning of the desorption stage; hence
no desorption occurs; only the pressure increases from PE to PC.
In the desorption process (2 to 3), the heating is continued, and the valve VC is kept open
to allow desorbed refrigerant to enter the condenser chamber by keeping the pressure constant.
The desorbed refrigerant vapor liquified inside the condenser and return to the evaporator
through the expansion valve. During this process, the adsorbate/refrigerant amount in the
adsorbent reduced from W1 to W2.
In the pre-cooling process (3 to 4), the adsorber is cooled by the cooling load, and the
valves VE, VC are closed to stop the refrigerant exchange in the adsorber chamber. The
Evaporator
Adsorber
bed
Condenser
Desorber
bed
Cooling Room
THW IN
THW
O UT
TCW IN
TCW
OUT
cooling water supply
Hot water
supply
PC
cooling water supply
PEValve VE
TCH INTCH O UT
PC to
PE
PE to PC
Valve Vc
W
P
T2
T1
W1
1
PE
Ad
sorp
tio
n
2Pre-heating
PC
3
Deso
rpti
on
4
Pre-coolingW2
(a) (b)
CHAPTER 1 INTRODUCTION
26 | P a g e
temperature is decreased; as a consequence, the pressure of the adsorber chamber dropped from
PC to PE.
In the adsorption process (4 to 1), the pressure is kept constant at PE, and the adsorber
bed is connected to the evaporator through valve VE. The refrigerant vapor enters the
evaporator chamber and adsorbs by the adsorbent in the adsorber bed. During the adsorption
process, the adsorbate uptake increases from W2 to W1.
Therefore, during the adsorption process, the refrigerant is evaporated by gaining heat
from the environment, and hence the cooling effect of this cycle occurs. Conversely, the heating
effect occurs when the refrigerant is condensed by releasing heat to the environment.
The adsorption isotherms, shown in Fig. 1.1(b) are the key characteristics discussed in
this thesis. It will be rigorously analyzed in a different situation and will try to find a correlation
with the different properties of adsorbents.
1.3 Adsorbents for cooling application
A large number of porous material are addressed by the different scientific community
which is available by naturally and synthetically [12,13]. However, not all these porous
materials are suitable for the cooling application. One of the essential properties of these
materials can guide to select suitable adsorbent materials is sorption capacity. The strong
interaction between adsorbate and adsorbent leads to high sorption capacity, whereas weak
interaction leads to low capacity. For a cooling application, moderate affinity forces are
required between adsorbent and adsorbate. This affinity can be calculated by the boundary
condition of the refrigeration cycle. Observing the isosters both for adsorption and desorption
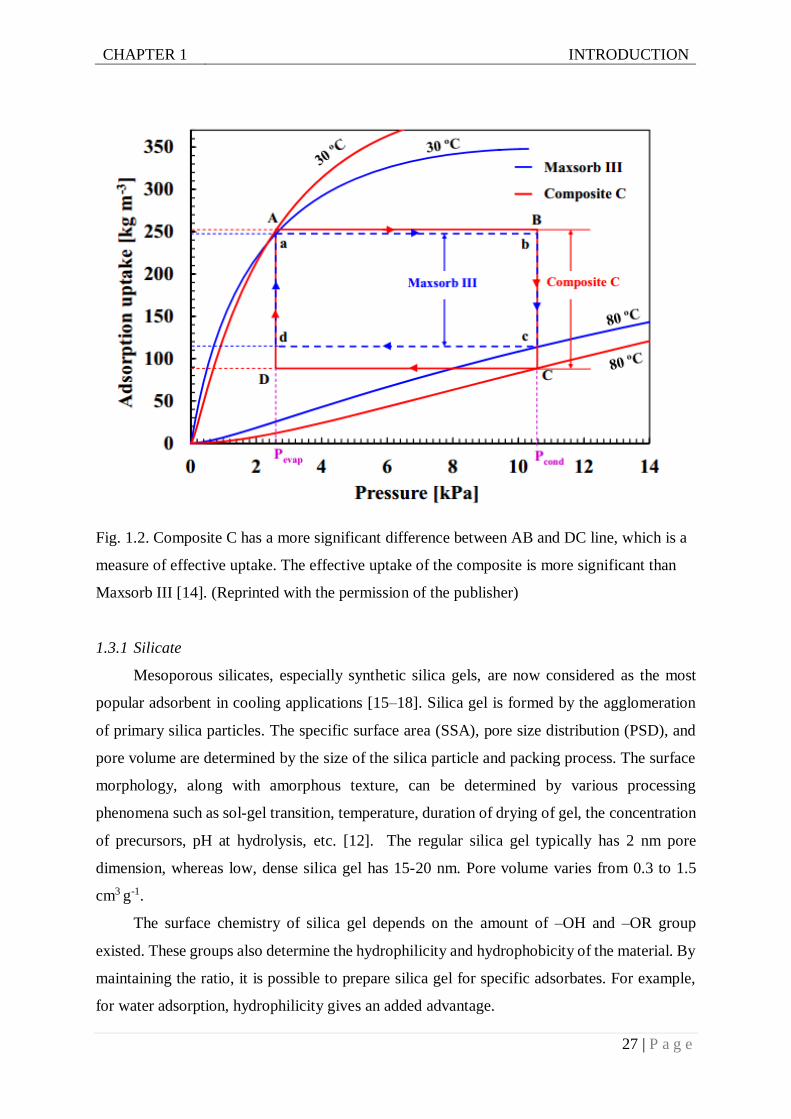
often, it is possible to select the effective adsorbent. For example, effective uptake measured
from the claperon diagram is useful to predict the usefulness of the adsorbent in adsorption
cooling applications. It is preferable to having efficient uptake having substantial value. For
example, consolidated composite activated carbon shows more considerable effective uptake
than the pristine in an experiment using ethanol pair. Fig. 1.2 shows an experimental result
depicting the effectiveness of new composite materials. Here, composite C comprises of more
considerable effective uptake, which makes it potential for cooling application. Several
promising materials for cooling applications are included below.
CHAPTER 1 INTRODUCTION
27 | P a g e
Fig. 1.2. Composite C has a more significant difference between AB and DC line, which is a
measure of effective uptake. The effective uptake of the composite is more significant than
Maxsorb III [14]. (Reprinted with the permission of the publisher)
1.3.1 Silicate
Mesoporous silicates, especially synthetic silica gels, are now considered as the most
popular adsorbent in cooling applications [15–18]. Silica gel is formed by the agglomeration
of primary silica particles. The specific surface area (SSA), pore size distribution (PSD), and
pore volume are determined by the size of the silica particle and packing process. The surface
morphology, along with amorphous texture, can be determined by various processing
phenomena such as sol-gel transition, temperature, duration of drying of gel, the concentration
of precursors, pH at hydrolysis, etc. [12]. The regular silica gel typically has 2 nm pore
dimension, whereas low, dense silica gel has 15-20 nm. Pore volume varies from 0.3 to 1.5
cm3 g-1.
The surface chemistry of silica gel depends on the amount of –OH and –OR group
existed. These groups also determine the hydrophilicity and hydrophobicity of the material. By
maintaining the ratio, it is possible to prepare silica gel for specific adsorbates. For example,
for water adsorption, hydrophilicity gives an added advantage.
CHAPTER 1 INTRODUCTION
28 | P a g e
Other than silica gel, there are other forms of silicates available. One of these is silica
aerogels, which is a particular type of amorphous silicates with an open system [19]. For gas
transport, its built-in nature of having meso- and macro-pores gives an extra advantage. This
type of silicates has a lower bulk density, which leads to low mechanical strength and low
thermal conductivity. Aerogels are merely used in cooling systems due to having high relative
pressure and vapor capillary condensation.
Another promising type of silica gel is ordered silicates, which comprise regular system
channels and uniform pore dimensions [20,21]. Usually, the silicates are irregular shaped, and
these types are regularly shaped. For instance, MCM-41 has a hexagonal array of pore size.
Due to having mesopores, these types of silica gel adsorb water and methanol at very high P/Po
for adsorption chiller. Nevertheless, this uniform ordered structure can be used as hosts for
various composite adsorbents [22–24].
Silicates have a significant disadvantage in having a lack of strong hydrophilic property,
which makes the chiller system gigantic. Despite these silicates are still popular in industries
because it is commercially available, cheap and stable. Furthermore, regeneration is possible
at a very low temperature, typically below 45℃ in multistage cycles [25].
1.3.2 Zeolite
Zeolite is another class of adsorbent which is used in adsorption application vastly.
Zeolites in nature are more hydrophobic than silica gels. These materials contain negatively
charged aluminosilicate, which makes the host framework balanced by various counter cations.
Around 200 types of zeolite framework has been addressed by the various scientific community
[12,26]. The adsorption property of these materials is adjustable by changing the
aluminum/silicon ratio [27]. Hydrophilic nature can be enhanced by increasing this ratio. A
favorite example of this type of zeolites is type A [28]. The water uptake of these type zeolites
are very high and can be achievable in low relative pressure. It exhibits a strong interaction
with water molecules with electrostatic fields and the balancing cations, which is advantageous
for gas drying. However, this nature is not useful for adsorption cooling applications. For a
cooling application, property tuning is required, such as molecular sieving is often adopted.
Another tool for tuning is post-synthetic ion exchange [29]. To use water as a working pair
with zeolite, popularly used materials are zeolite 4A and zeolite NaX [30–32]. However, zeolite
shows either high or very low affinity to water, which is not advantageous for the cooling
application.
CHAPTER 1 INTRODUCTION
29 | P a g e
1.3.3 Activated carbon (AC)
Activated carbon is a favorite material for gas separation and purification because having
a large surface area and significant porosity. It also has potential application in cooling systems;
many studies have been adopted with various working pairs [31,33–35]. Besides, the
theoretical study of effects on the physical properties of carbon on cooling performance has
been studied in Ref. [34]. In this article, the condition for having the best performance optimum
physical condition of AC is shown. Researchers also develop an optimum process to develop
activated carbon for heat pump applications [36]. Most of the research has been adopted in
finding an optimal adsorbate-adsorbent pair for a cooling application that is covered in the later
section.
1.3.4 Metal-organic frameworks (MOFs)
MOFs are considered as the most potential porous material in heat pump applications
because of having noticeable micropore volume, surface area, and a wide range of flexibility
on modifying the internal structure [37–41]. For a cooling application, the principal focus is on
water adsorption properties and storage capacities. These properties are strongly related to
specific pore volume. Recently the specific pore volumes of MIL-101 have been addressed 2
cm3 g-1 [42]. Besides having this high porous MOF, Omar et al. introduce a new generation of
MOF having 7000 m2 g-1 BET surface area having pore volume 4.4 cm3 g-1 [43]. Additionally,
geometric flexibility, such as a reversible change in the structure and physical response to
adsorbate changes. Based on surface area and pore volume MOFs are far more superior than
zeolites, silica gel, and porous carbons. However, stability in the adsorption and desorption
cycle depicts the weakness of MOFs in the cooling application. Some of the popular MOFs
which have potential in adsorption cooling are listed below.
i) HKUST-1: The molecular structure consists of Cu-BTC structure, where BTC is
benzene-1,3,5-tri-carboxylate. This MOF is researched for different applications along with as
a model MOF for simulation studies to cognize interactions between guests and framework
[45]. Strong influence has been observed in unsaturated Cu sites, which are potential for
adsorption [46]. Additionally, water adsorption on HKUST-1 shows promising results [47]. By
taking a different sample of these MOF water adsorption characteristics are analyzed, and
maximum uptake is observed 0.55 g g-1 for p/po=0.90 [48]. The overall measured range for
water uptake is between 0.3-0.55 g g-1, which is promising compared to silica gel and zeolite.
CHAPTER 1 INTRODUCTION
30 | P a g e
This high uptake makes HKUST-1 promising for the cooling application. However, it has
demerits in hydrothermal stability, which can be improved by a new synthesis method [49].
ii) ISE-1: This MOF synthesized in earlier stages, which shows better performance for
low-temperature heating and cooling application. The water uptake is relatively smaller; the
maximum uptake reported is 0.21 g g-1. One positive side is water stability, which makes it
promising for the cooling application.
iii) MIL-100 and MIL-101: These MOFs are named after the Institut Lavoisier’s Material
section, which is considered the most promising applicant for the cooling application. The
water adsorption experiment is reported at 0.939 g g-1. This experiment was conveyed using
MIL-101 under typical conditions, adsorption at 40℃, desorption at 90℃, and vapor pressure
were 5.6 kPa [50]. Many other reported water uptakes for MIL-101(Cr) is 1.37 g g-1, 1.43 g g-
1, which are considerably higher than traditional adsorbents use in cooling systems. Similarly,
MIL-100(Cr) also provides higher uptake (0.8 g g-1) [51]. Only a small hysteresis is shown in
MIL-100 compare to MIL-101. That means, MIL-100 contains more pores in the microporous
region than MIL-101. The authors also run adsorption cycles for 2000 times and found no
declination in the adsorption process [51]. Therefore, accumulating all the advantages, MIL-
100 is found preferable than MIL-101 for adsorption chiller application.
iv) Basolite/aluminum fumarate: Sigma Aldrich co. Commercially developed this
material, more specifically A100 and F300. Basolite A100 is identical to of MIL-53(Cr), the
commercial production of this type of MOF shows higher adsorption capacity [52]. Adsorption
isotherm shows a delayed increase due to having a narrow and open pore. Narrow pores are
advantageous for the adsorption of water molecules [53].
v) CAU-10H: Aluminium isophthalate is a new type of MOF that shows high water
adsorption and stability, which is advantageous for adsorption cooling applications. It is found
that thermal stability is higher than other reported MOFs; it was stable for several thousand
adsorptions and desorption cycles while working fluid water is used [54]. The water uptake of
0.26 g g−1 for the coated sample is lower compared to that of other decent and stable MOFs,
like aluminum-fumarate coating (0.35 g g−1). There are MOFs that have higher water capacities
like UiO-66 (0.45 g g−1), MIL-100(Fe) (0.65 g g−1), but have demerits from the perspective of
cycling.
CHAPTER 1 INTRODUCTION
31 | P a g e
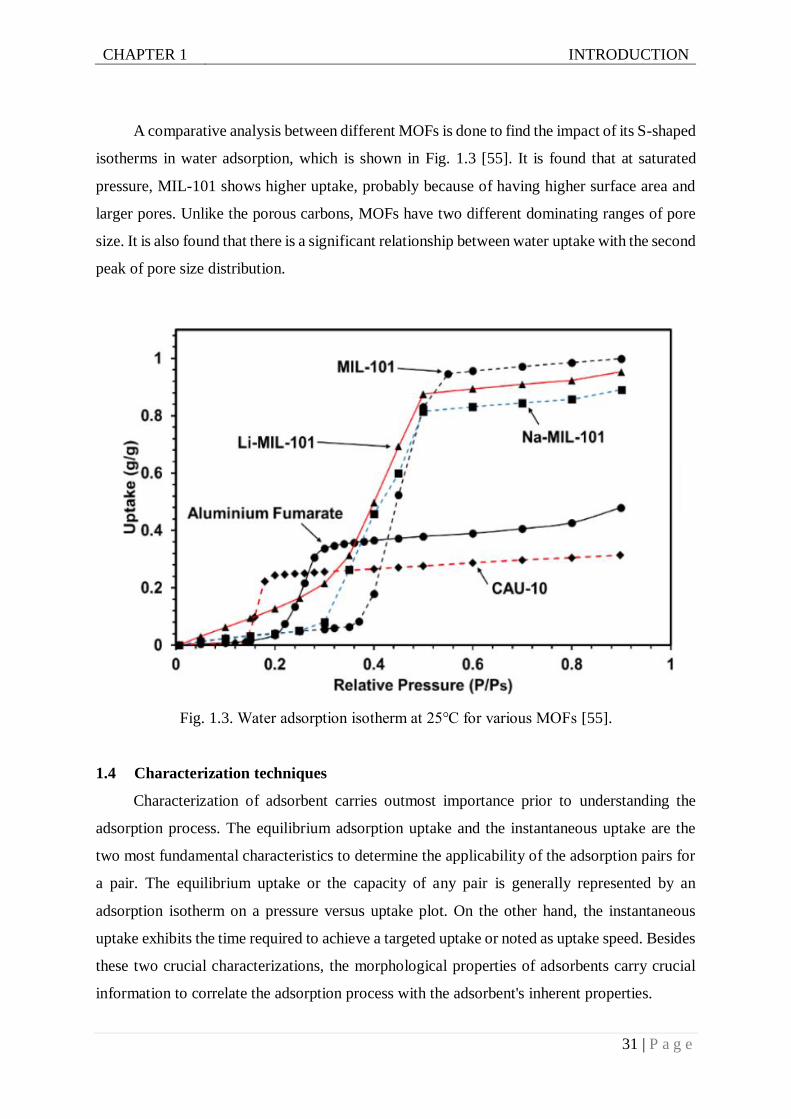
A comparative analysis between different MOFs is done to find the impact of its S-shaped
isotherms in water adsorption, which is shown in Fig. 1.3 [55]. It is found that at saturated
pressure, MIL-101 shows higher uptake, probably because of having higher surface area and
larger pores. Unlike the porous carbons, MOFs have two different dominating ranges of pore
size. It is also found that there is a significant relationship between water uptake with the second
peak of pore size distribution.
Fig. 1.3. Water adsorption isotherm at 25℃ for various MOFs [55].
1.4 Characterization techniques
Characterization of adsorbent carries outmost importance prior to understanding the
adsorption process. The equilibrium adsorption uptake and the instantaneous uptake are the
two most fundamental characteristics to determine the applicability of the adsorption pairs for
a pair. The equilibrium uptake or the capacity of any pair is generally represented by an
adsorption isotherm on a pressure versus uptake plot. On the other hand, the instantaneous
uptake exhibits the time required to achieve a targeted uptake or noted as uptake speed. Besides
these two crucial characterizations, the morphological properties of adsorbents carry crucial
information to correlate the adsorption process with the adsorbent's inherent properties.
CHAPTER 1 INTRODUCTION
32 | P a g e
The morphological characterization is the primary task that is performed by material
scientists. Particle size, surface area and porosity are the three key characteristics that control
various properties of materials such as adsorption, filter-ability, flowability, agglomeration, the
storage capacity of fluids and gas. In the case of gas adsorption, which has a major application
in energy-efficient chiller systems, specific surface area (SSA) and pore size distribution(PSD)
is needed to determine quantitatively [56]. Larger SSA means higher adsorption where PSD is
directly related to the response of adsorbent to adsorbate. For example, activated carbon is
considered a suitable adsorbent because of having high SSA, which is about 3000 m2 g-1 [57].
Similarly, different PSD of adsorbents contribute to varying adsorption kinetics for
specific adsorption. Adsorption kinetics of ethanol onto activated carbon and mesoporous silica
gel is completely different due to PSD [58]. Therefore, measuring these characteristics is
practiced prior to much research.
Following the high impact of these types of characterization, there are various methods
existed to measure SSA and PSD. Gas adsorption & expansion, imaging, and light scattering
are the most common techniques for measuring these characteristics. In gas adsorption, a
reference gas, usually Nitrogen (N2), is used as an adsorbate, which is sent to the sample in a
low-pressure condition [59]. Since N2 is used below its critical point, capillary condensation is
considered as an essential factor that provides information related to pore size distribution [60].
The scattering method uses small or ultra small-angle scattering to determine the particle size
and porosity.
On the other hand, imaging techniques are more of a straight forward method, which
takes the images of the surface to extract the topographic information of the surface. A wide
range of imaging methods is available to determine the type of porosity of different porous
materials. Optical Microscopy and Transmission Electron Microscopy(TEM)[61], Scanning
Electron Microscopy (SEM) [62], X-ray spectroscopy, Nuclear Magnetic Resonance Imaging
(NMRI) are the notable techniques in this category. Atomic Force Microscopy is a considerably
new technique which has an identical feature of providing height based information of surface
[63]. This feature can be used to identify pores in the nanometre range, and additionally, pore
volume can be calculated.
However, morphological properties are not capable of explaining the surface activities.
However, several thermal properties like the heat of adsorption of a particular pair, specific
heat capacity, and thermal conductivity of adsorbents are often measured to predict the surface
activities. These measurements are not adequate to understand the surface activities on the
adsorption process. For example, the heat of adsorption measurement can only predict the
CHAPTER 1 INTRODUCTION
33 | P a g e
surface interaction; it lacks on identifying the source of interactions. It can not measure the
dispersive and the electrostatic interaction separately. On the other hand, surface energy
measurement provided by the inverse gas chromatography technique can identify both the
interaction separately [64].
It is of utmost importance to characterize the surface energy component separately. The
dispersive component is related to the van der Waals attraction, and the specific/electrostatic
interaction includes polarization, dipole, acid-base, and magnetic[65]. It is found that in
activated carbon materials, the dispersive surface energy is dominating, whereas, in silica gel,
both the surface energy components are domination [66,67].
1.5 Enhancing performance
Weak thermal conductivity and mass transfer properties are the major problems that are
prior required to solve the problem in making the cooling system more profitable and viable.
Various approaches are adopted to improve the material properties which are listed below:
1.5.1 Metal coating/doping:
Thermal conductivity enhancement of the adsorbent is one effective way of improving
the heat transfer in adsorption systems and thereby speeding up the process of
adsorption/desorption. By doping high thermally conductive materials to adsorbents is a
straightforward attempt to increase thermal conductivity [68]. It is found that about 2-25%
conductivity is improved by adding copper powder into activated carbon. Another group uses
graphite blocks with silica gel and found significant improvement in both heat and mass
transfer [69]. It is also possible to increase thermal conductivity by introducing metal coating.
By using thermal gradient synthesis, a polycrystalline layer of MOFs can be grown, which
shows the stable coating of HKUST-1which shows high thermal coupling to the substrate [70].
Coating with the sputtering method of copper on RD type silica gel also found 45% higher than
the pristine one. However, it increases the specific heat [71].
1.5.2 Composite
It is possible to improve adsorption characteristics by making composite materials form
porous adsorbents. Guillenminot et al. [72] found significant improvement in both thermal
conductivity and heat transfer coefficient by adding copper foam on zeolite (35-65 copper –
zeolite ratio). For activated carbon, adding expanded graphite and binder shows a proportional
relation with thermal conductivity with graphite content [14,25].
CHAPTER 1 INTRODUCTION
34 | P a g e
1.5.2.1 Adsorbate/adsorbent pair:
Besides improving the properties of the material, it is possible to improve adsorption
performance by selecting proper pairs. The selection of adsorption pairs largely depends on
the chemical, physical, and thermodynamic properties [73]. A comparative study has been done
by Younes et al. [74] with various adsorbent/adsorbate pairs. He showed for activated carbon
uptake varies 0.6-1.03 kg kg-1 when methanol is taken as the adsorbate. The uptake increases
when ethanol is used rather than methanol. The highest uptake is observed for activated carbon/
CO2 pair, which is 1.73 kg kg-1 [75].
1.5.2.2 Surface treatment:
Surface functionalities are one of the significant, influential parameters of adsorption
characteristics. Kil et al. [76] studied the influence of the different concentrations of oxygen
contents on adsorption of ethanol on activated carbon. They found that an abundance of oxygen
content decreased the ethanol adsorption and lowered the adsorption equilibrium time.
1.6 Motivation
The above study provides that the adsorption cooling system is a promising technique for
remediation of continuous degradation of the environmental condition due to conventional
refrigeration systems. However, until now, there is no visible breakthrough in the adsorption
heat pump is. The bottleneck behind this situation is the introduction of suitable pairs. For
several decades a lot of researchers are finding the solution; still, adsorption systems are
commercially not feasible. It is believed that the breakthrough might come from the material
side. An extremely well adsorbent/adsorbate pair having high uptake capacity and kinetics
might increase the coefficient of performance (COP), which is now significantly low. To assist
this finding of new pairs throughout the thesis, several non-conventional techniques are
adopted. Fig. 1.4 illustrates the fundamentals queries of the adsorption process that motivates
this thesis work.
First of all, the work focuses on taking the surface images to understand the adsorbent
properties. Besides adopting the conventional techniques of imaging like SEM and TEM, this
is the very first time the AFM technique is applied to extract the surface images. The motivation
for using AFM comes from the fundamental drawbacks of conventional techniques. For
example, TEM is not suitable for taking images of adsorbents in a practical situation; a lot of
pre-processing is required before taking the image. Similarly, both the SEM and TEM requires
to operate in the vacuum condition that might not predict the situation of the surface in the
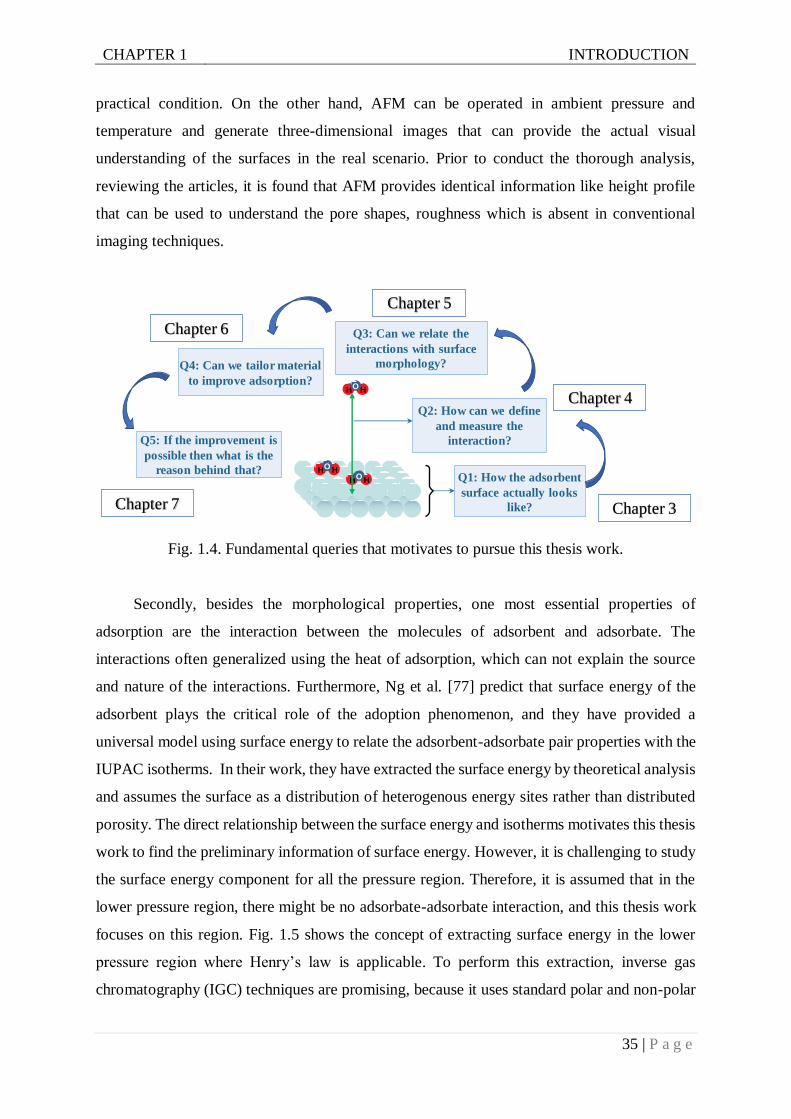
CHAPTER 1 INTRODUCTION
35 | P a g e
practical condition. On the other hand, AFM can be operated in ambient pressure and
temperature and generate three-dimensional images that can provide the actual visual
understanding of the surfaces in the real scenario. Prior to conduct the thorough analysis,
reviewing the articles, it is found that AFM provides identical information like height profile
that can be used to understand the pore shapes, roughness which is absent in conventional
imaging techniques.
Fig. 1.4. Fundamental queries that motivates to pursue this thesis work.
Secondly, besides the morphological properties, one most essential properties of
adsorption are the interaction between the molecules of adsorbent and adsorbate. The
interactions often generalized using the heat of adsorption, which can not explain the source
and nature of the interactions. Furthermore, Ng et al. [77] predict that surface energy of the
adsorbent plays the critical role of the adoption phenomenon, and they have provided a
universal model using surface energy to relate the adsorbent-adsorbate pair properties with the
IUPAC isotherms. In their work, they have extracted the surface energy by theoretical analysis
and assumes the surface as a distribution of heterogenous energy sites rather than distributed
porosity. The direct relationship between the surface energy and isotherms motivates this thesis
work to find the preliminary information of surface energy. However, it is challenging to study
the surface energy component for all the pressure region. Therefore, it is assumed that in the
lower pressure region, there might be no adsorbate-adsorbate interaction, and this thesis work
focuses on this region. Fig. 1.5 shows the concept of extracting surface energy in the lower
pressure region where Henry’s law is applicable. To perform this extraction, inverse gas
chromatography (IGC) techniques are promising, because it uses standard polar and non-polar
H HO
H HO
H HO Q1: How the adsorbent
surface actually looks
like?
Q2: How can we define
and measure the
interaction?
Q3: Can we relate the
interactions with surface
morphology?Q4: Can we tailor material
to improve adsorption?
Q5: If the improvement is
possible then what is the
reason behind that?
Chapter 3
Chapter 4
Chapter 5
Chapter 6
Chapter 7
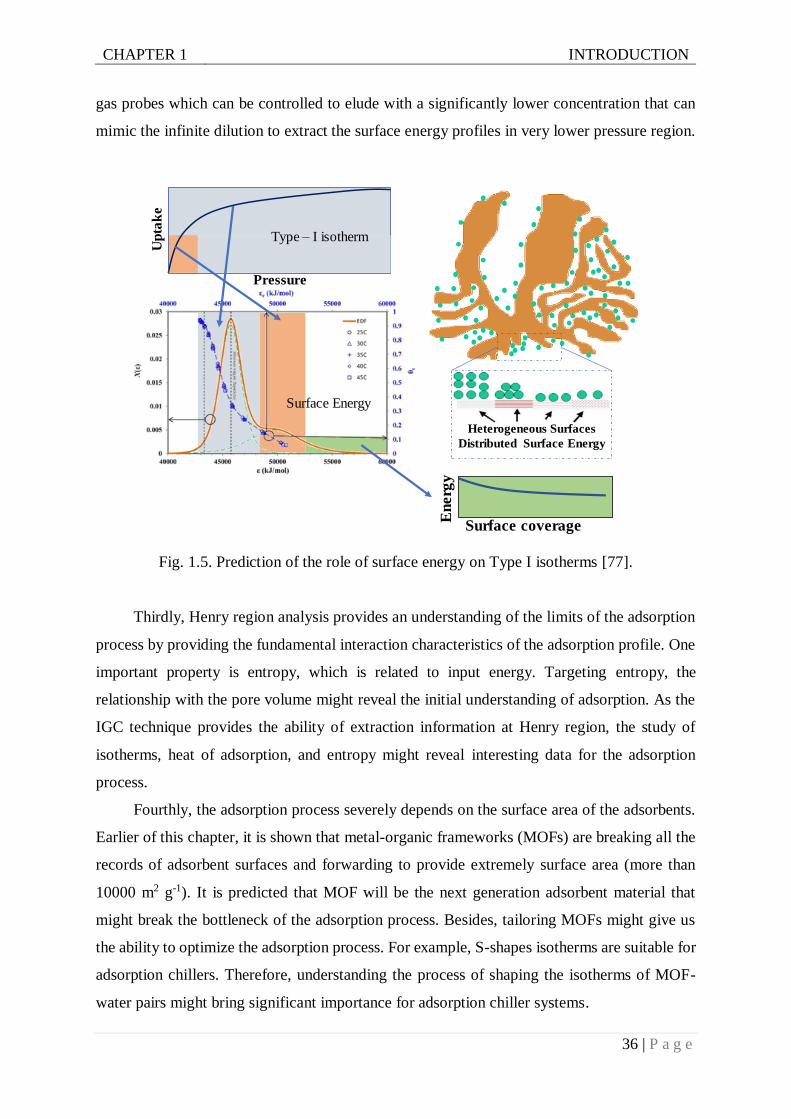
CHAPTER 1 INTRODUCTION
36 | P a g e
gas probes which can be controlled to elude with a significantly lower concentration that can
mimic the infinite dilution to extract the surface energy profiles in very lower pressure region.
Fig. 1.5. Prediction of the role of surface energy on Type I isotherms [77].
Thirdly, Henry region analysis provides an understanding of the limits of the adsorption
process by providing the fundamental interaction characteristics of the adsorption profile. One
important property is entropy, which is related to input energy. Targeting entropy, the
relationship with the pore volume might reveal the initial understanding of adsorption. As the
IGC technique provides the ability of extraction information at Henry region, the study of
isotherms, heat of adsorption, and entropy might reveal interesting data for the adsorption
process.
Fourthly, the adsorption process severely depends on the surface area of the adsorbents.
Earlier of this chapter, it is shown that metal-organic frameworks (MOFs) are breaking all the
records of adsorbent surfaces and forwarding to provide extremely surface area (more than
10000 m2 g-1). It is predicted that MOF will be the next generation adsorbent material that
might break the bottleneck of the adsorption process. Besides, tailoring MOFs might give us
the ability to optimize the adsorption process. For example, S-shapes isotherms are suitable for
adsorption chillers. Therefore, understanding the process of shaping the isotherms of MOF-
water pairs might bring significant importance for adsorption chiller systems.
Heterogeneous Surfaces
Distributed Surface Energy
Pressure
Up
tak
e
Surface Energy
Type – I isotherm
Surface coverage
En
erg
y
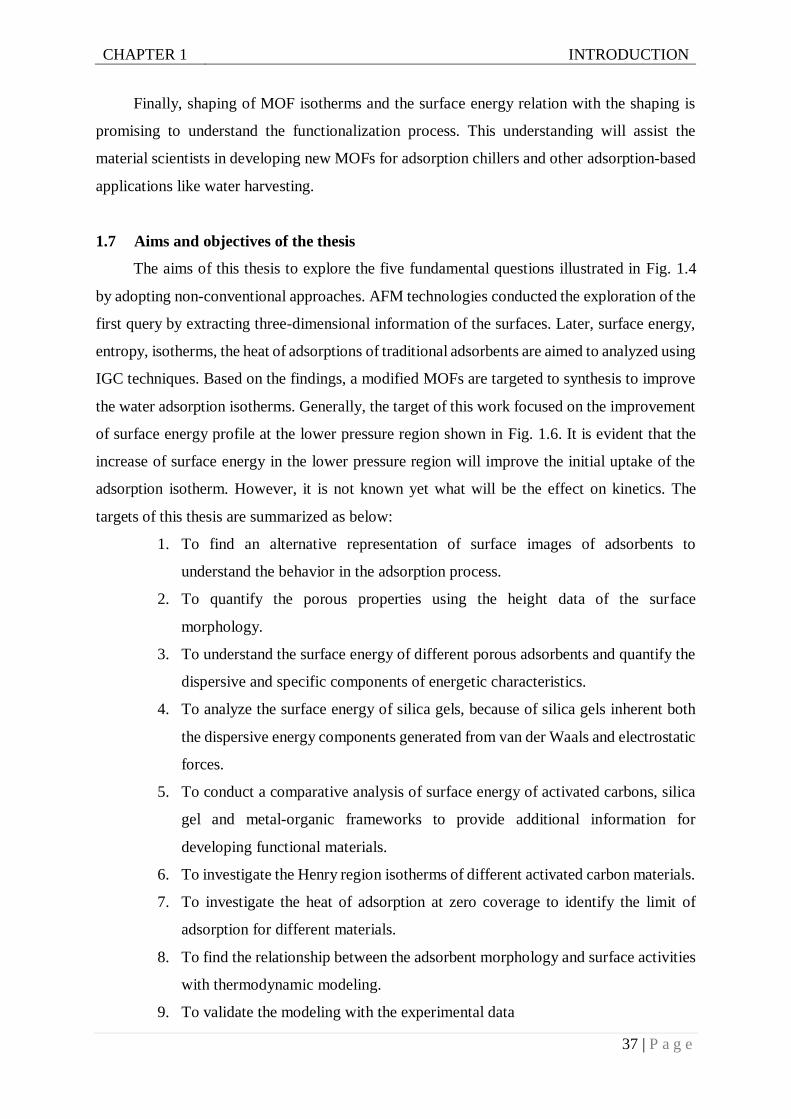
CHAPTER 1 INTRODUCTION
37 | P a g e
Finally, shaping of MOF isotherms and the surface energy relation with the shaping is
promising to understand the functionalization process. This understanding will assist the
material scientists in developing new MOFs for adsorption chillers and other adsorption-based
applications like water harvesting.
1.7 Aims and objectives of the thesis
The aims of this thesis to explore the five fundamental questions illustrated in Fig. 1.4
by adopting non-conventional approaches. AFM technologies conducted the exploration of the
first query by extracting three-dimensional information of the surfaces. Later, surface energy,
entropy, isotherms, the heat of adsorptions of traditional adsorbents are aimed to analyzed using
IGC techniques. Based on the findings, a modified MOFs are targeted to synthesis to improve
the water adsorption isotherms. Generally, the target of this work focused on the improvement
of surface energy profile at the lower pressure region shown in Fig. 1.6. It is evident that the
increase of surface energy in the lower pressure region will improve the initial uptake of the
adsorption isotherm. However, it is not known yet what will be the effect on kinetics. The
targets of this thesis are summarized as below:
1. To find an alternative representation of surface images of adsorbents to
understand the behavior in the adsorption process.
2. To quantify the porous properties using the height data of the surface
morphology.
3. To understand the surface energy of different porous adsorbents and quantify the
dispersive and specific components of energetic characteristics.
4. To analyze the surface energy of silica gels, because of silica gels inherent both
the dispersive energy components generated from van der Waals and electrostatic
forces.
5. To conduct a comparative analysis of surface energy of activated carbons, silica
gel and metal-organic frameworks to provide additional information for
developing functional materials.
6. To investigate the Henry region isotherms of different activated carbon materials.
7. To investigate the heat of adsorption at zero coverage to identify the limit of
adsorption for different materials.
8. To find the relationship between the adsorbent morphology and surface activities
with thermodynamic modeling.
9. To validate the modeling with the experimental data
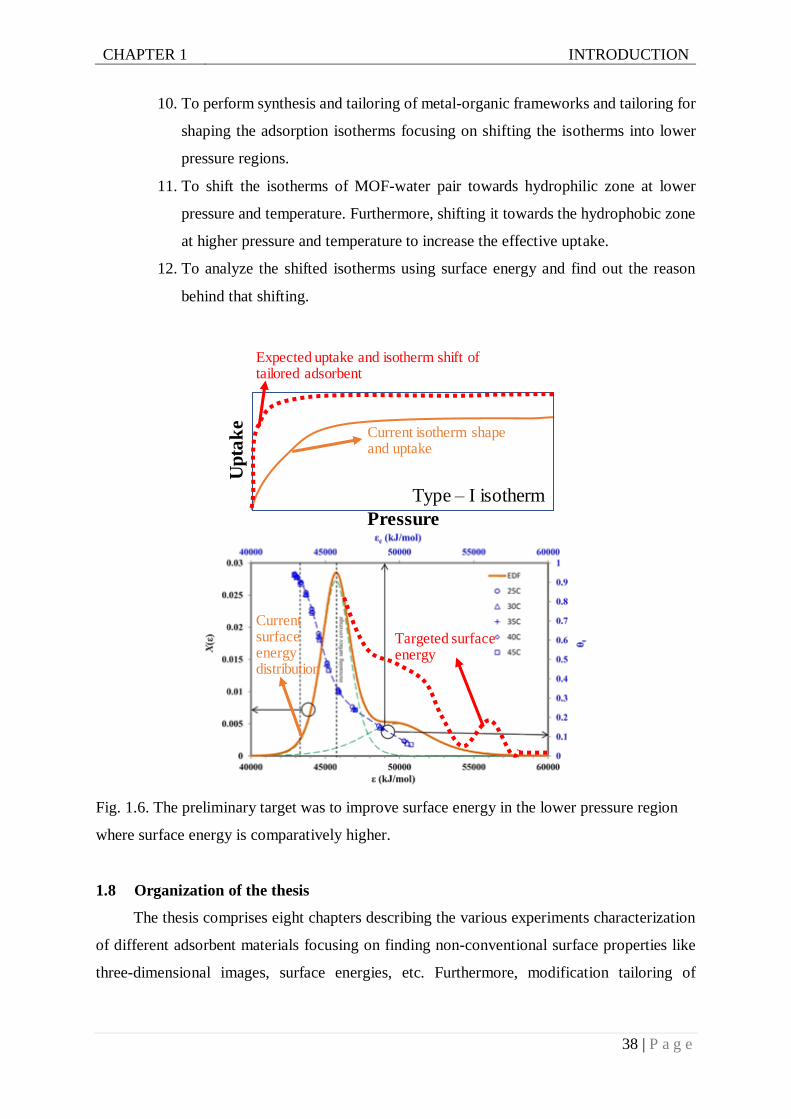
CHAPTER 1 INTRODUCTION
38 | P a g e
10. To perform synthesis and tailoring of metal-organic frameworks and tailoring for
shaping the adsorption isotherms focusing on shifting the isotherms into lower
pressure regions.
11. To shift the isotherms of MOF-water pair towards hydrophilic zone at lower
pressure and temperature. Furthermore, shifting it towards the hydrophobic zone
at higher pressure and temperature to increase the effective uptake.
12. To analyze the shifted isotherms using surface energy and find out the reason
behind that shifting.
Fig. 1.6. The preliminary target was to improve surface energy in the lower pressure region
where surface energy is comparatively higher.
1.8 Organization of the thesis
The thesis comprises eight chapters describing the various experiments characterization
of different adsorbent materials focusing on finding non-conventional surface properties like
three-dimensional images, surface energies, etc. Furthermore, modification tailoring of
Pressure
Up
tak
e
Targeted surface energy
Type – I isotherm
Current surface energy distribution
Current isotherm shape and uptake
Expected uptake and isotherm shift of tailored adsorbent
CHAPTER 1 INTRODUCTION
39 | P a g e
aluminum fumarate is included to enhance the water adsorption characteristics, which are later
analyzed with surface energy and work of adhesion. The arrangement of the thesis is as follows:
Chapter 1: Introduction
Chapter 2: Overview of Modern Characterization Techniques
Chapter 3: Morphological Study of Porous Materials using Atomic Force Microscopy
Chapter 4: Surface Energy Characterisation of Different Porous Adsorbents by Inverse
Gas Chromatography
Chapter 5: Experimental Investigation of Adsorption Isotherms and Heat of Adsorption
at Henry Region for Activated Carbon/Ethanol Pairs
Chapter 6: Novel Technique for Improving Water Adsorption Isotherms of Metal-
organic Frameworks
Chapter 7: Study on Surface Activities of Improved Metal-doped Metal-organic
Frameworks
Chapter 8: Overall conclusions and recommendations
The key points of each chapter are given as follows:
Chapter 1 gives an overview of the thesis with a concise literature review. It also presents
the aims and objectives of the current research work. The chapter ends with the organization
of the thesis.
Chapter 2 presents the general introduction of the modern characterization techniques
used in the present works. It has two major parts; i) introduction and operational principle of
atomic force microscopy, ii) overview of measuring technique of surface energy components
using inverse gas chromatography technique.
Chapter 3 describes the measurement processes of surface morphology of different
adsorbents, which includes various silica gels, activated carbons, etc. Using AFM, the three-
dimensional surface images are extracted and presented in various forms. The measured height
data is processed using watershed segmentation method, and the irregular pores are counted to
measure the pore size distribution. The pore size distribution data is then compared with the
conventional method.
Chapter 4 presents the experimental studies of surface energy components of various
adsorbents. Silica gels are the primarily focused adsorbents for the surface energy
measurements. It is found that dispersive and specific surface energy is dominant in the silica
gel samples. However, activated carbons are dominated by only the dispersive component of
the surface energy.
CHAPTER 1 INTRODUCTION
40 | P a g e
Chapter 5 presents the experimental procedures to measure the energetic parameters of
activated carbon/ethanol pairs in the Henry region. The experimental method is inspired by the
surface energy measurement described in chapter 4. The experiments are carried out using
inverse gas chromatography method at adsorption temperature ranging from 303K to 353 K.
This chapter comprises of three major parts: i) Measurement of Henry region isotherms, ii)
measurement of zero coverage isosteric heat and iii) modeling of specific entropy with pore
volume.
Chapter 6 describes the green synthesis process of aluminum fumarate with improved
adsorption characteristics. Furthermore, it provides an overview of the in-situ doping process
of MOFs that further enhances the adsorption characteristics.
Chapter 7 provides insights into the improvement of adsorption characteristics described
in chapter 6 using surface energy analysis. The surface energy components are compared with
the water adsorption isotherms to find an implicit relation between them. The chapter ends with
an intense comparison of work of adhesion of various promising adsorbents.
In chapter 8, the thesis ends with the significant findings where the originality and
contribution of the author and recommendations for future improvements have been made. It
is concluded with the in-situ doping are promising for tailoring metal-organic frameworks,
which can provide the ability to control the shape of adsorption isotherms. Furthermore, it is
observed that surface energy can be used as an intermediate characterization technique to
mitigate the gap of understanding between MS and ATE scientists. The explanation of
improvement of SMOF is possible with surface energy analysis where morphological analysis
failed.
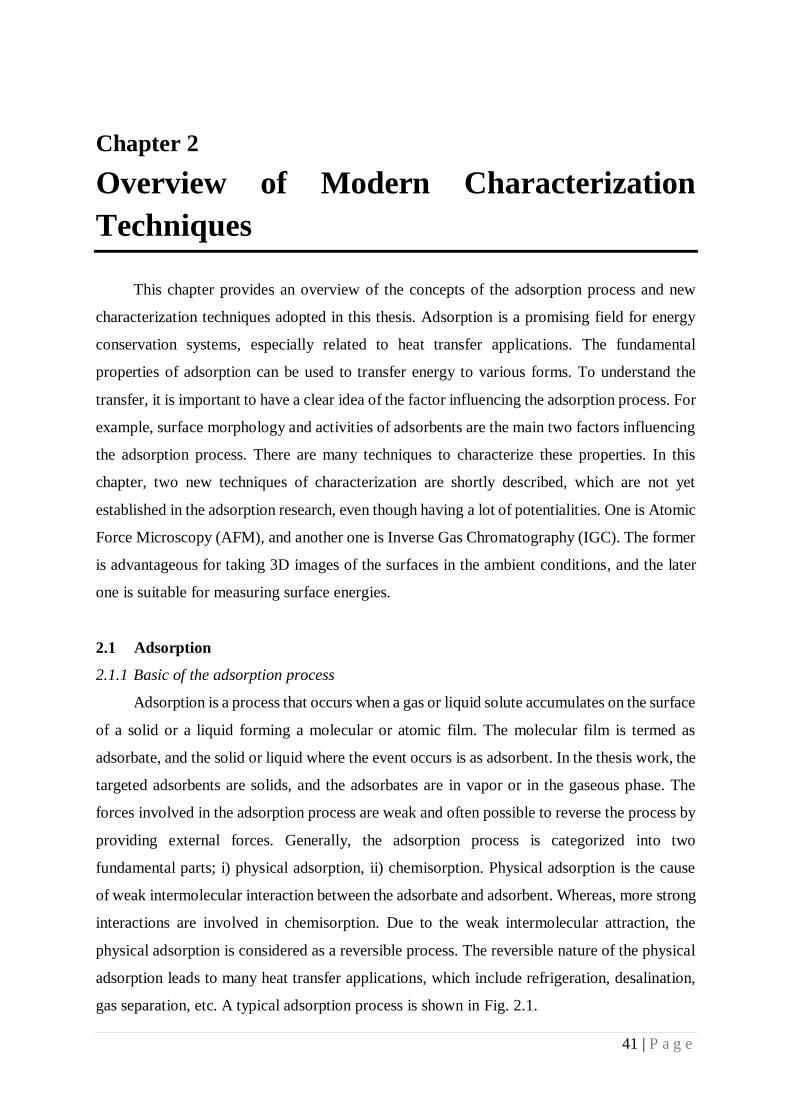
41 | P a g e
Chapter 2
Overview of Modern Characterization
Techniques Equation Chapter 2 Section 1
This chapter provides an overview of the concepts of the adsorption process and new
characterization techniques adopted in this thesis. Adsorption is a promising field for energy
conservation systems, especially related to heat transfer applications. The fundamental
properties of adsorption can be used to transfer energy to various forms. To understand the
transfer, it is important to have a clear idea of the factor influencing the adsorption process. For
example, surface morphology and activities of adsorbents are the main two factors influencing
the adsorption process. There are many techniques to characterize these properties. In this
chapter, two new techniques of characterization are shortly described, which are not yet
established in the adsorption research, even though having a lot of potentialities. One is Atomic
Force Microscopy (AFM), and another one is Inverse Gas Chromatography (IGC). The former
is advantageous for taking 3D images of the surfaces in the ambient conditions, and the later
one is suitable for measuring surface energies.
2.1 Adsorption
2.1.1 Basic of the adsorption process
Adsorption is a process that occurs when a gas or liquid solute accumulates on the surface
of a solid or a liquid forming a molecular or atomic film. The molecular film is termed as
adsorbate, and the solid or liquid where the event occurs is as adsorbent. In the thesis work, the
targeted adsorbents are solids, and the adsorbates are in vapor or in the gaseous phase. The
forces involved in the adsorption process are weak and often possible to reverse the process by
providing external forces. Generally, the adsorption process is categorized into two
fundamental parts; i) physical adsorption, ii) chemisorption. Physical adsorption is the cause
of weak intermolecular interaction between the adsorbate and adsorbent. Whereas, more strong
interactions are involved in chemisorption. Due to the weak intermolecular attraction, the
physical adsorption is considered as a reversible process. The reversible nature of the physical
adsorption leads to many heat transfer applications, which include refrigeration, desalination,
gas separation, etc. A typical adsorption process is shown in Fig. 2.1.
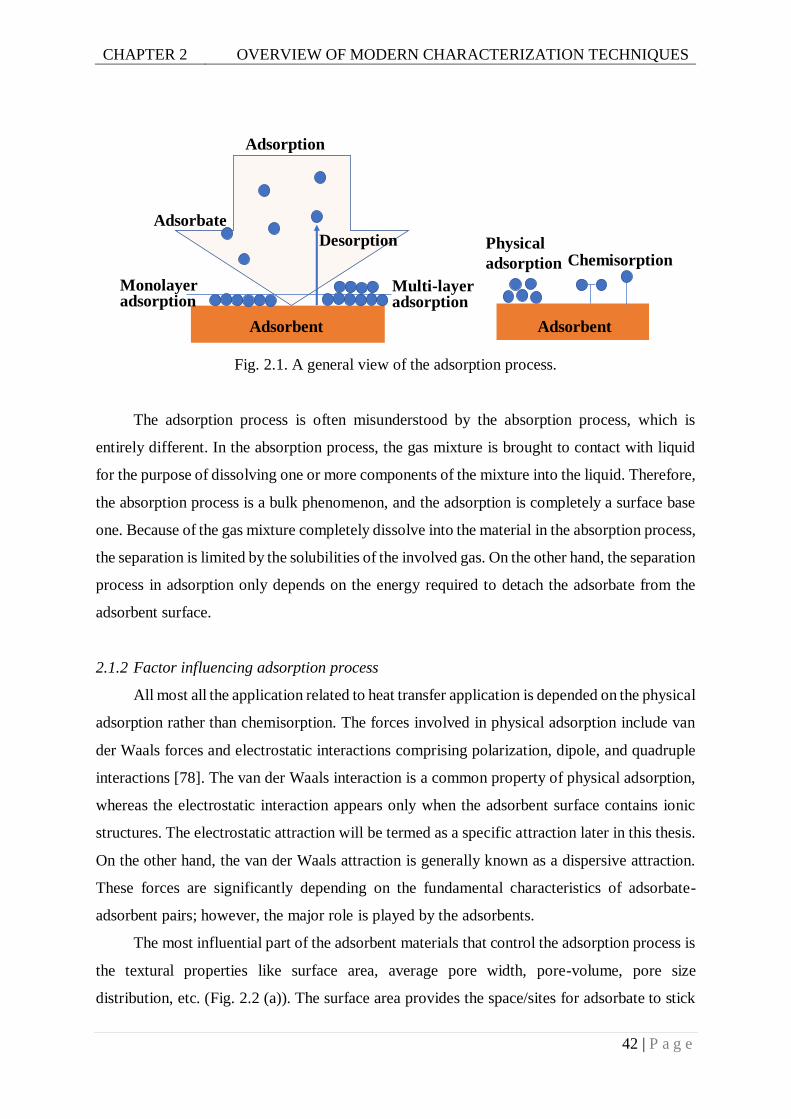
CHAPTER 2 OVERVIEW OF MODERN CHARACTERIZATION TECHNIQUES
42 | P a g e
Fig. 2.1. A general view of the adsorption process.
The adsorption process is often misunderstood by the absorption process, which is
entirely different. In the absorption process, the gas mixture is brought to contact with liquid
for the purpose of dissolving one or more components of the mixture into the liquid. Therefore,
the absorption process is a bulk phenomenon, and the adsorption is completely a surface base
one. Because of the gas mixture completely dissolve into the material in the absorption process,
the separation is limited by the solubilities of the involved gas. On the other hand, the separation
process in adsorption only depends on the energy required to detach the adsorbate from the
adsorbent surface.
2.1.2 Factor influencing adsorption process
All most all the application related to heat transfer application is depended on the physical
adsorption rather than chemisorption. The forces involved in physical adsorption include van
der Waals forces and electrostatic interactions comprising polarization, dipole, and quadruple
interactions [78]. The van der Waals interaction is a common property of physical adsorption,
whereas the electrostatic interaction appears only when the adsorbent surface contains ionic
structures. The electrostatic attraction will be termed as a specific attraction later in this thesis.
On the other hand, the van der Waals attraction is generally known as a dispersive attraction.
These forces are significantly depending on the fundamental characteristics of adsorbate-
adsorbent pairs; however, the major role is played by the adsorbents.
The most influential part of the adsorbent materials that control the adsorption process is
the textural properties like surface area, average pore width, pore-volume, pore size
distribution, etc. (Fig. 2.2 (a)). The surface area provides the space/sites for adsorbate to stick
Adsorbate
Adsorbent
Monolayer adsorption
Multi-layer adsorption
Adsorption
Desorption Physical
adsorption Chemisorption
Adsorbent
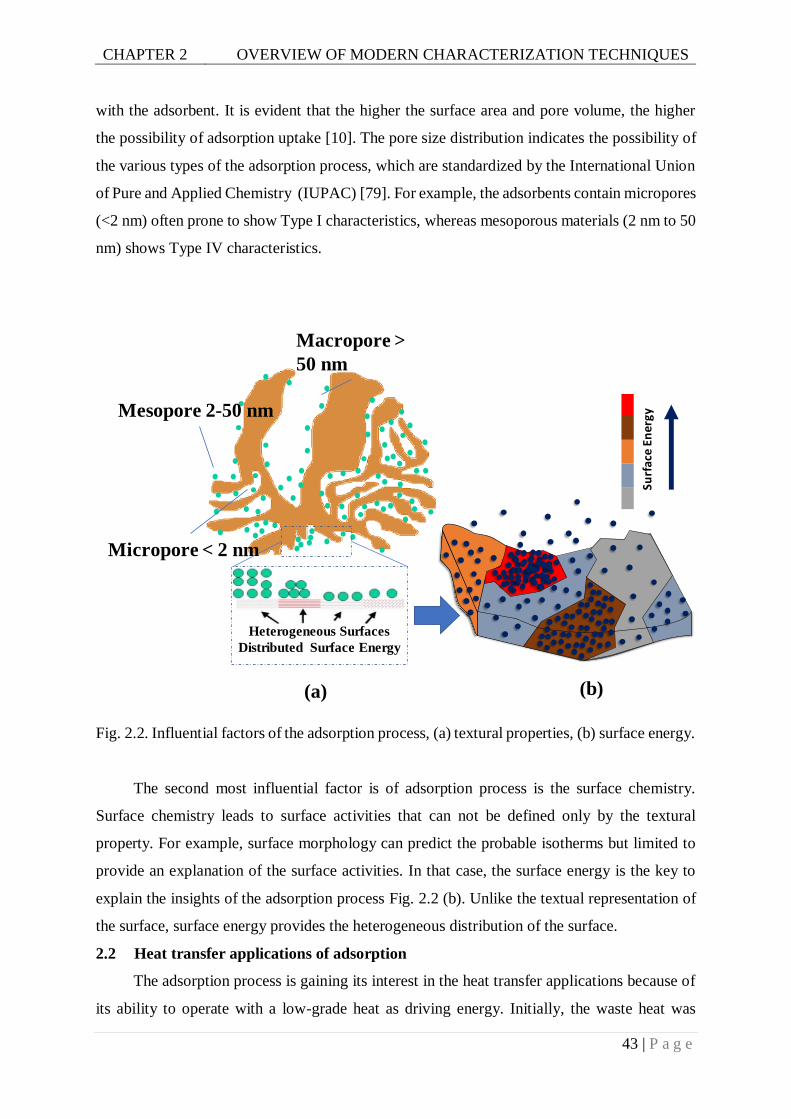
CHAPTER 2 OVERVIEW OF MODERN CHARACTERIZATION TECHNIQUES
43 | P a g e
with the adsorbent. It is evident that the higher the surface area and pore volume, the higher
the possibility of adsorption uptake [10]. The pore size distribution indicates the possibility of
the various types of the adsorption process, which are standardized by the International Union
of Pure and Applied Chemistry (IUPAC) [79]. For example, the adsorbents contain micropores
(<2 nm) often prone to show Type I characteristics, whereas mesoporous materials (2 nm to 50
nm) shows Type IV characteristics.
Fig. 2.2. Influential factors of the adsorption process, (a) textural properties, (b) surface energy.
The second most influential factor is of adsorption process is the surface chemistry.
Surface chemistry leads to surface activities that can not be defined only by the textural
property. For example, surface morphology can predict the probable isotherms but limited to
provide an explanation of the surface activities. In that case, the surface energy is the key to
explain the insights of the adsorption process Fig. 2.2 (b). Unlike the textual representation of
the surface, surface energy provides the heterogeneous distribution of the surface.
2.2 Heat transfer applications of adsorption
The adsorption process is gaining its interest in the heat transfer applications because of
its ability to operate with a low-grade heat as driving energy. Initially, the waste heat was
Heterogeneous Surfaces
Distributed Surface EnergySu
rfac
e En
ergy
Micropore < 2 nm
Macropore >
50 nm
Mesopore 2-50 nm
(a) (b)
CHAPTER 2 OVERVIEW OF MODERN CHARACTERIZATION TECHNIQUES
44 | P a g e
thought of as primary source energy; however, recently, solar energy is increasing its
potentiality to become an important source of driving energy.
Fig. 2.3. Application of adsorption technologies. A) building energy management B)
decarbonization in the industrial sectors.
For building energy management, adsorption based rotary wheels can efficiently make
enthalpy recovery from the exhaust air of the conditioned spaces to reduce the energy
consumption for fresh air handling. Passive solar-powered adsorption-based dehumidifiers
integrated into building envelopes (roof, wall, window, etc.) are very promising to achieve
zero-energy building. Utilization of adsorbents achieving electricity-to-chemical energy at
night and chemical energy-to-heat at day for space heating is an effective way to reduce the
electricity bill in terms of peak and valley time price. Meanwhile, desiccant-coated heat
exchangers have demonstrated a great future to dramatically improve the energy efficiency of
typical air conditioners. In the case of industrial decarbonization, low temperature (~50˚C)
waste heat from cooling water of the data center can drive the adsorption chiller to lower the
cooling needs. Similarly, the waste heat from the engine exhaust of the truck and fish boat also
can power the adsorption systems to make cooling and ice, respectively. Meanwhile, the giant
waste heat in oil, iron, and power industry can be recovered cheaply by adsorption technologies
to achieve cogeneration.
Although this field is up-and-coming, it still faces enormous challenges. In the last
decade, several novel adsorbents have been reported by MS scientists for AHC with great
predicted performances, but ATE scientists challenge their real performances, which are not
always so optimistic. This overestimation is mainly because the analysis was based on limited
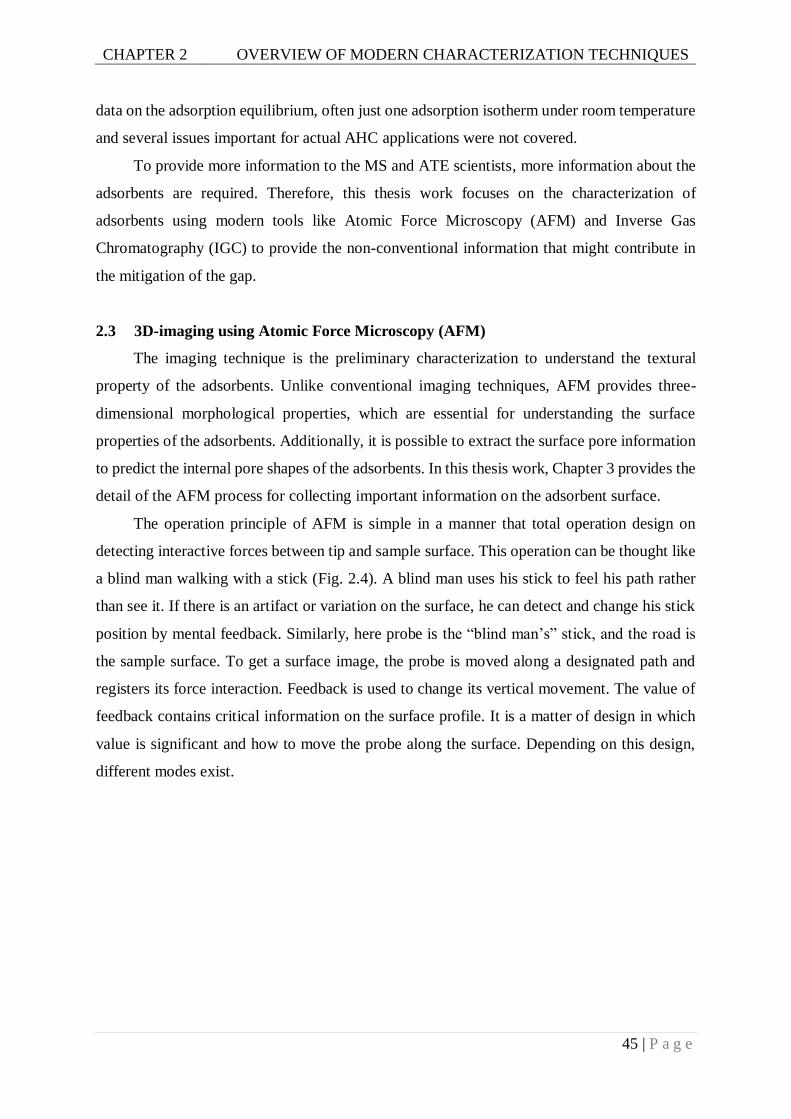
CHAPTER 2 OVERVIEW OF MODERN CHARACTERIZATION TECHNIQUES
45 | P a g e
data on the adsorption equilibrium, often just one adsorption isotherm under room temperature
and several issues important for actual AHC applications were not covered.
To provide more information to the MS and ATE scientists, more information about the
adsorbents are required. Therefore, this thesis work focuses on the characterization of
adsorbents using modern tools like Atomic Force Microscopy (AFM) and Inverse Gas
Chromatography (IGC) to provide the non-conventional information that might contribute in
the mitigation of the gap.
2.3 3D-imaging using Atomic Force Microscopy (AFM)
The imaging technique is the preliminary characterization to understand the textural
property of the adsorbents. Unlike conventional imaging techniques, AFM provides three-
dimensional morphological properties, which are essential for understanding the surface
properties of the adsorbents. Additionally, it is possible to extract the surface pore information
to predict the internal pore shapes of the adsorbents. In this thesis work, Chapter 3 provides the
detail of the AFM process for collecting important information on the adsorbent surface.
The operation principle of AFM is simple in a manner that total operation design on
detecting interactive forces between tip and sample surface. This operation can be thought like
a blind man walking with a stick (Fig. 2.4). A blind man uses his stick to feel his path rather
than see it. If there is an artifact or variation on the surface, he can detect and change his stick
position by mental feedback. Similarly, here probe is the “blind man’s” stick, and the road is
the sample surface. To get a surface image, the probe is moved along a designated path and
registers its force interaction. Feedback is used to change its vertical movement. The value of
feedback contains critical information on the surface profile. It is a matter of design in which
value is significant and how to move the probe along the surface. Depending on this design,
different modes exist.
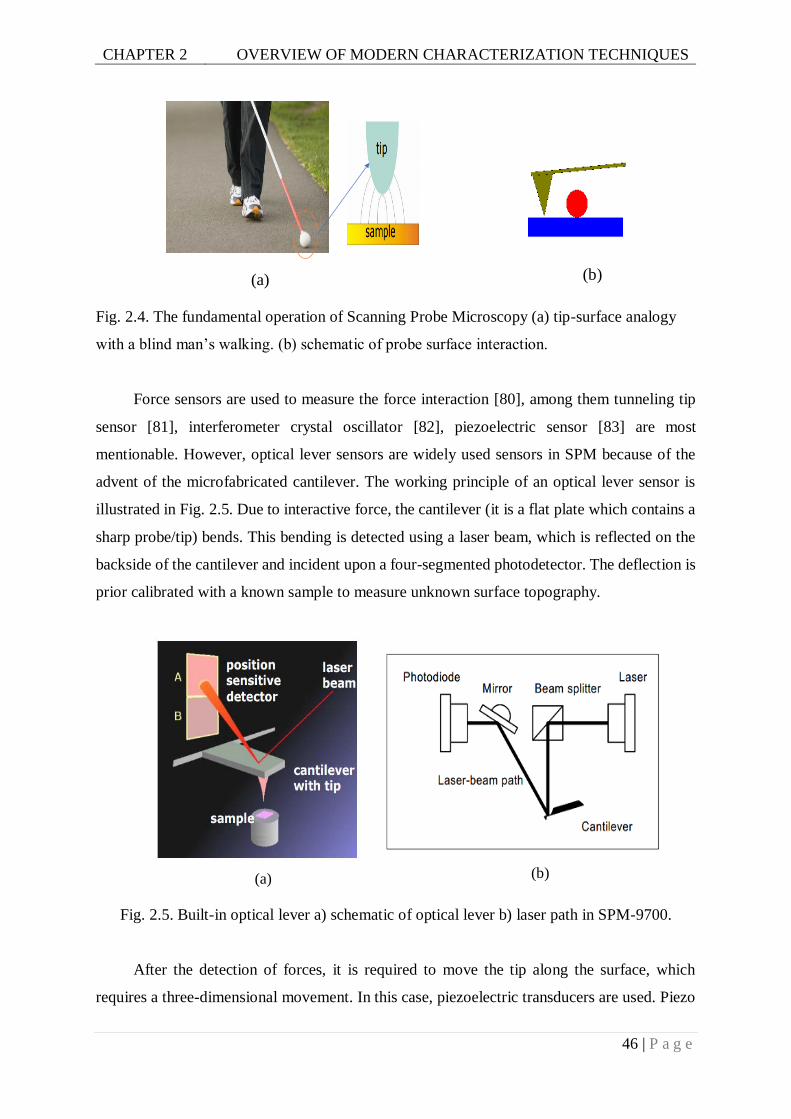
CHAPTER 2 OVERVIEW OF MODERN CHARACTERIZATION TECHNIQUES
46 | P a g e
Fig. 2.4. The fundamental operation of Scanning Probe Microscopy (a) tip-surface analogy
with a blind man’s walking. (b) schematic of probe surface interaction.
Force sensors are used to measure the force interaction [80], among them tunneling tip
sensor [81], interferometer crystal oscillator [82], piezoelectric sensor [83] are most
mentionable. However, optical lever sensors are widely used sensors in SPM because of the
advent of the microfabricated cantilever. The working principle of an optical lever sensor is
illustrated in Fig. 2.5. Due to interactive force, the cantilever (it is a flat plate which contains a
sharp probe/tip) bends. This bending is detected using a laser beam, which is reflected on the
backside of the cantilever and incident upon a four-segmented photodetector. The deflection is
prior calibrated with a known sample to measure unknown surface topography.
Fig. 2.5. Built-in optical lever a) schematic of optical lever b) laser path in SPM-9700.
After the detection of forces, it is required to move the tip along the surface, which
requires a three-dimensional movement. In this case, piezoelectric transducers are used. Piezo
(b)(a)
(b)(a)
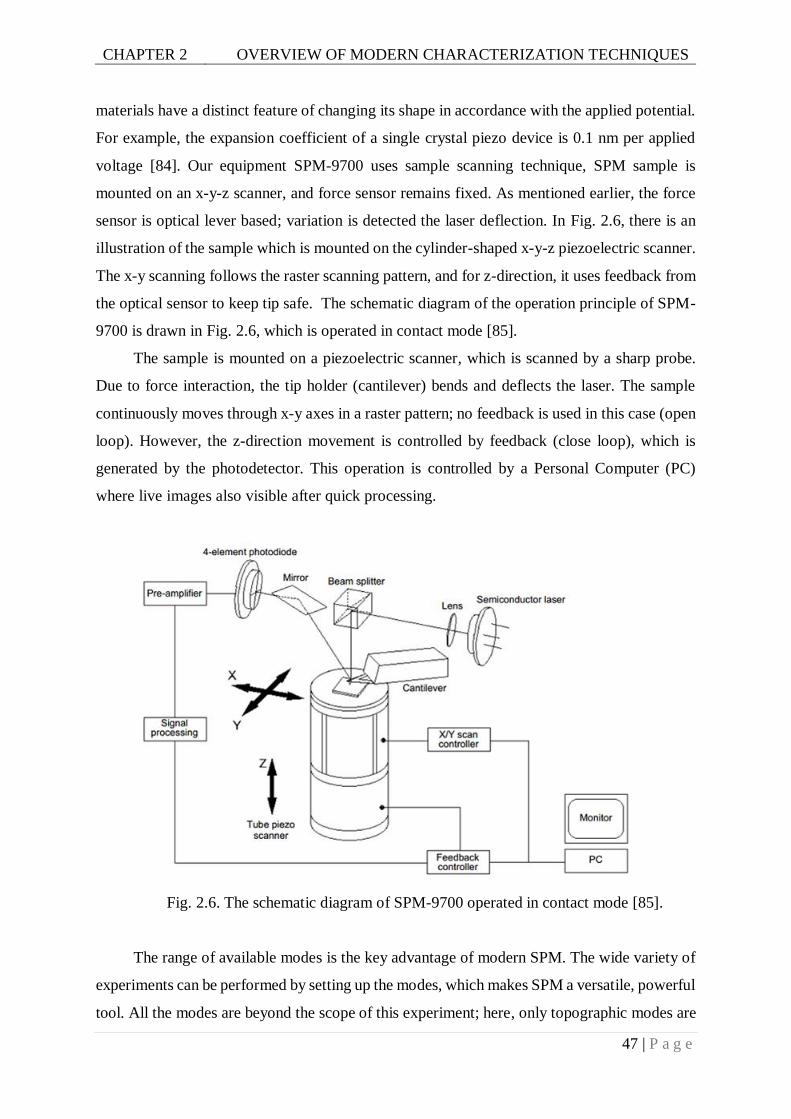
CHAPTER 2 OVERVIEW OF MODERN CHARACTERIZATION TECHNIQUES
47 | P a g e
materials have a distinct feature of changing its shape in accordance with the applied potential.
For example, the expansion coefficient of a single crystal piezo device is 0.1 nm per applied
voltage [84]. Our equipment SPM-9700 uses sample scanning technique, SPM sample is
mounted on an x-y-z scanner, and force sensor remains fixed. As mentioned earlier, the force
sensor is optical lever based; variation is detected the laser deflection. In Fig. 2.6, there is an
illustration of the sample which is mounted on the cylinder-shaped x-y-z piezoelectric scanner.
The x-y scanning follows the raster scanning pattern, and for z-direction, it uses feedback from
the optical sensor to keep tip safe. The schematic diagram of the operation principle of SPM-
9700 is drawn in Fig. 2.6, which is operated in contact mode [85].
The sample is mounted on a piezoelectric scanner, which is scanned by a sharp probe.
Due to force interaction, the tip holder (cantilever) bends and deflects the laser. The sample
continuously moves through x-y axes in a raster pattern; no feedback is used in this case (open
loop). However, the z-direction movement is controlled by feedback (close loop), which is
generated by the photodetector. This operation is controlled by a Personal Computer (PC)
where live images also visible after quick processing.
Fig. 2.6. The schematic diagram of SPM-9700 operated in contact mode [85].
The range of available modes is the key advantage of modern SPM. The wide variety of
experiments can be performed by setting up the modes, which makes SPM a versatile, powerful
tool. All the modes are beyond the scope of this experiment; here, only topographic modes are
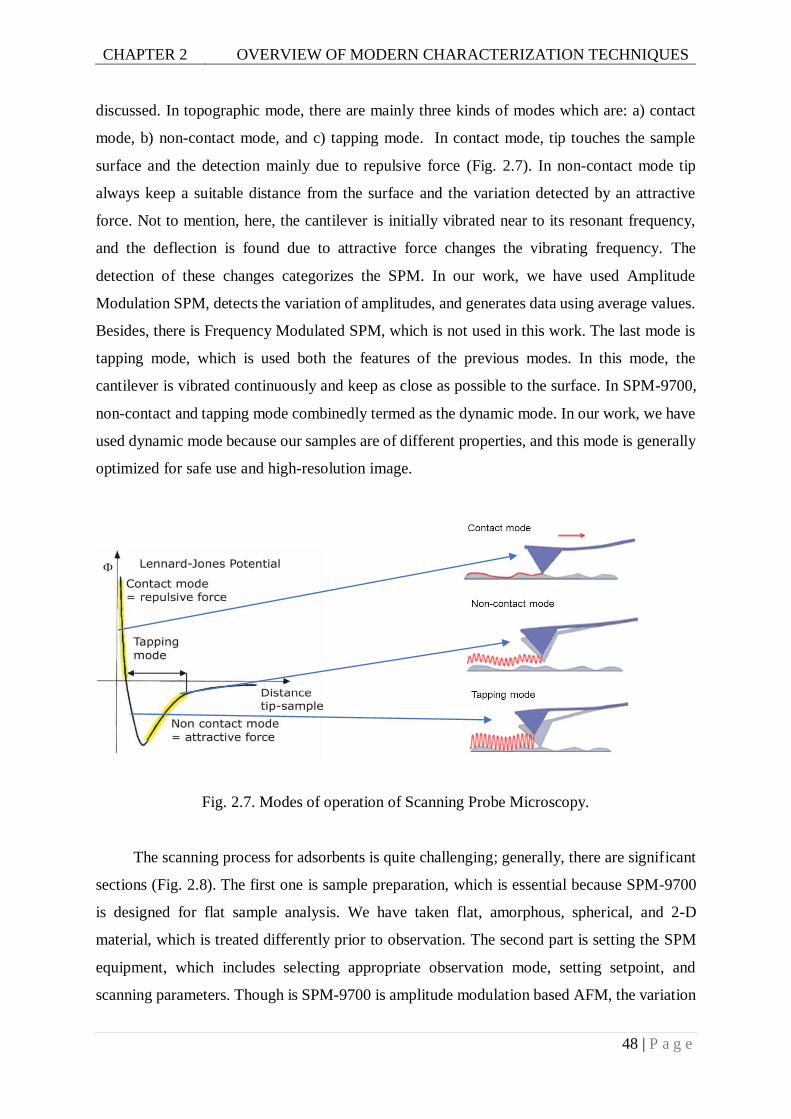
CHAPTER 2 OVERVIEW OF MODERN CHARACTERIZATION TECHNIQUES
48 | P a g e
discussed. In topographic mode, there are mainly three kinds of modes which are: a) contact
mode, b) non-contact mode, and c) tapping mode. In contact mode, tip touches the sample
surface and the detection mainly due to repulsive force (Fig. 2.7). In non-contact mode tip
always keep a suitable distance from the surface and the variation detected by an attractive
force. Not to mention, here, the cantilever is initially vibrated near to its resonant frequency,
and the deflection is found due to attractive force changes the vibrating frequency. The
detection of these changes categorizes the SPM. In our work, we have used Amplitude
Modulation SPM, detects the variation of amplitudes, and generates data using average values.
Besides, there is Frequency Modulated SPM, which is not used in this work. The last mode is
tapping mode, which is used both the features of the previous modes. In this mode, the
cantilever is vibrated continuously and keep as close as possible to the surface. In SPM-9700,
non-contact and tapping mode combinedly termed as the dynamic mode. In our work, we have
used dynamic mode because our samples are of different properties, and this mode is generally
optimized for safe use and high-resolution image.
Fig. 2.7. Modes of operation of Scanning Probe Microscopy.
The scanning process for adsorbents is quite challenging; generally, there are significant
sections (Fig. 2.8). The first one is sample preparation, which is essential because SPM-9700
is designed for flat sample analysis. We have taken flat, amorphous, spherical, and 2-D
material, which is treated differently prior to observation. The second part is setting the SPM
equipment, which includes selecting appropriate observation mode, setting setpoint, and
scanning parameters. Though is SPM-9700 is amplitude modulation based AFM, the variation
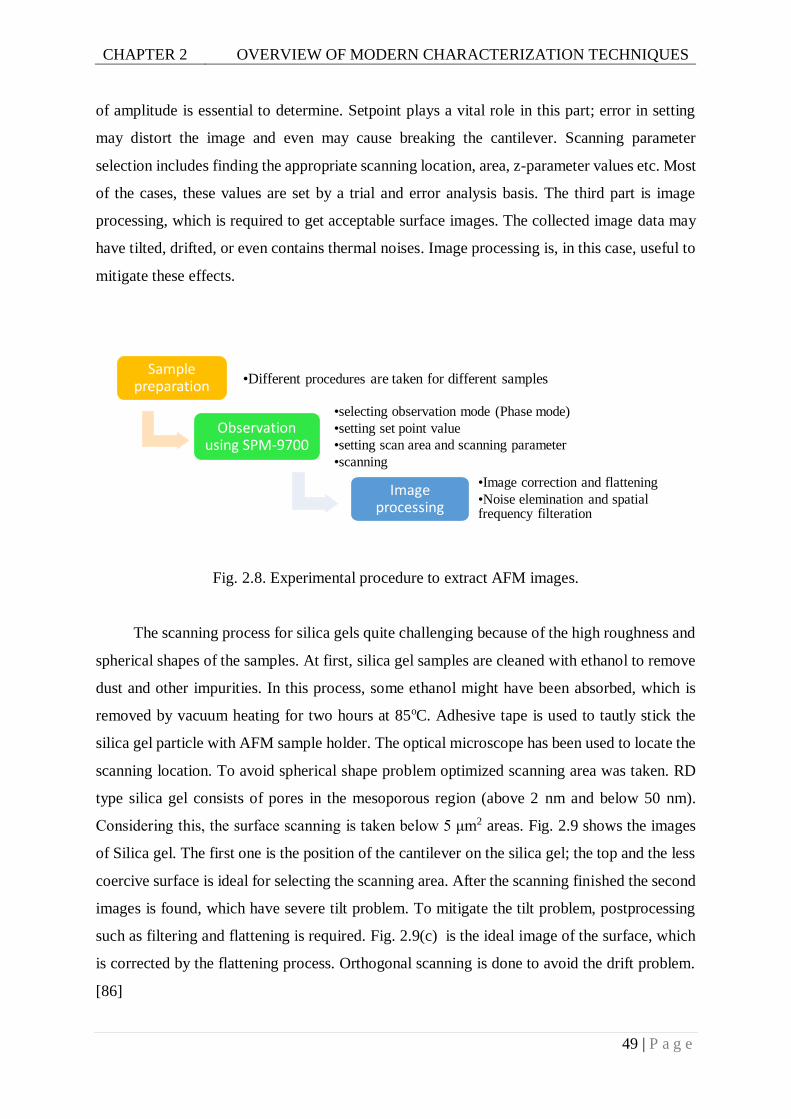
CHAPTER 2 OVERVIEW OF MODERN CHARACTERIZATION TECHNIQUES
49 | P a g e
of amplitude is essential to determine. Setpoint plays a vital role in this part; error in setting
may distort the image and even may cause breaking the cantilever. Scanning parameter
selection includes finding the appropriate scanning location, area, z-parameter values etc. Most
of the cases, these values are set by a trial and error analysis basis. The third part is image
processing, which is required to get acceptable surface images. The collected image data may
have tilted, drifted, or even contains thermal noises. Image processing is, in this case, useful to
mitigate these effects.
Fig. 2.8. Experimental procedure to extract AFM images.
The scanning process for silica gels quite challenging because of the high roughness and
spherical shapes of the samples. At first, silica gel samples are cleaned with ethanol to remove
dust and other impurities. In this process, some ethanol might have been absorbed, which is
removed by vacuum heating for two hours at 85oC. Adhesive tape is used to tautly stick the
silica gel particle with AFM sample holder. The optical microscope has been used to locate the
scanning location. To avoid spherical shape problem optimized scanning area was taken. RD
type silica gel consists of pores in the mesoporous region (above 2 nm and below 50 nm).
Considering this, the surface scanning is taken below 5 μm2 areas. Fig. 2.9 shows the images
of Silica gel. The first one is the position of the cantilever on the silica gel; the top and the less
coercive surface is ideal for selecting the scanning area. After the scanning finished the second
images is found, which have severe tilt problem. To mitigate the tilt problem, postprocessing
such as filtering and flattening is required. Fig. 2.9(c) is the ideal image of the surface, which
is corrected by the flattening process. Orthogonal scanning is done to avoid the drift problem.
[86]
Sample preparation •Different procedures are taken for different samples
Observation using SPM-9700
•selecting observation mode (Phase mode)
•setting set point value
•setting scan area and scanning parameter
•scanning
Image processing
•Image correction and flattening
•Noise elemination and spatial frequency filteration
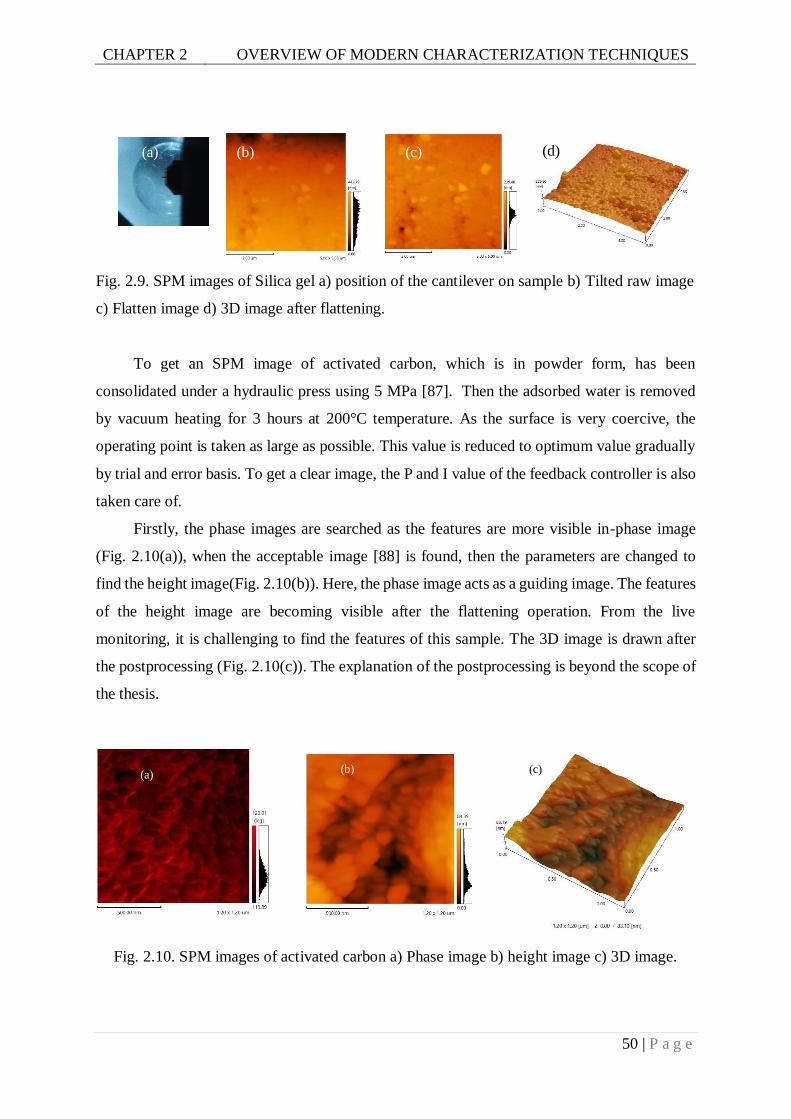
CHAPTER 2 OVERVIEW OF MODERN CHARACTERIZATION TECHNIQUES
50 | P a g e
Fig. 2.9. SPM images of Silica gel a) position of the cantilever on sample b) Tilted raw image
c) Flatten image d) 3D image after flattening.
To get an SPM image of activated carbon, which is in powder form, has been
consolidated under a hydraulic press using 5 MPa [87]. Then the adsorbed water is removed
by vacuum heating for 3 hours at 200°C temperature. As the surface is very coercive, the
operating point is taken as large as possible. This value is reduced to optimum value gradually
by trial and error basis. To get a clear image, the P and I value of the feedback controller is also
taken care of.
Firstly, the phase images are searched as the features are more visible in-phase image
(Fig. 2.10(a)), when the acceptable image [88] is found, then the parameters are changed to
find the height image(Fig. 2.10(b)). Here, the phase image acts as a guiding image. The features
of the height image are becoming visible after the flattening operation. From the live
monitoring, it is challenging to find the features of this sample. The 3D image is drawn after
the postprocessing (Fig. 2.10(c)). The explanation of the postprocessing is beyond the scope of
the thesis.
Fig. 2.10. SPM images of activated carbon a) Phase image b) height image c) 3D image.
(a) (b) (c) (d)
(a)(b) (c)
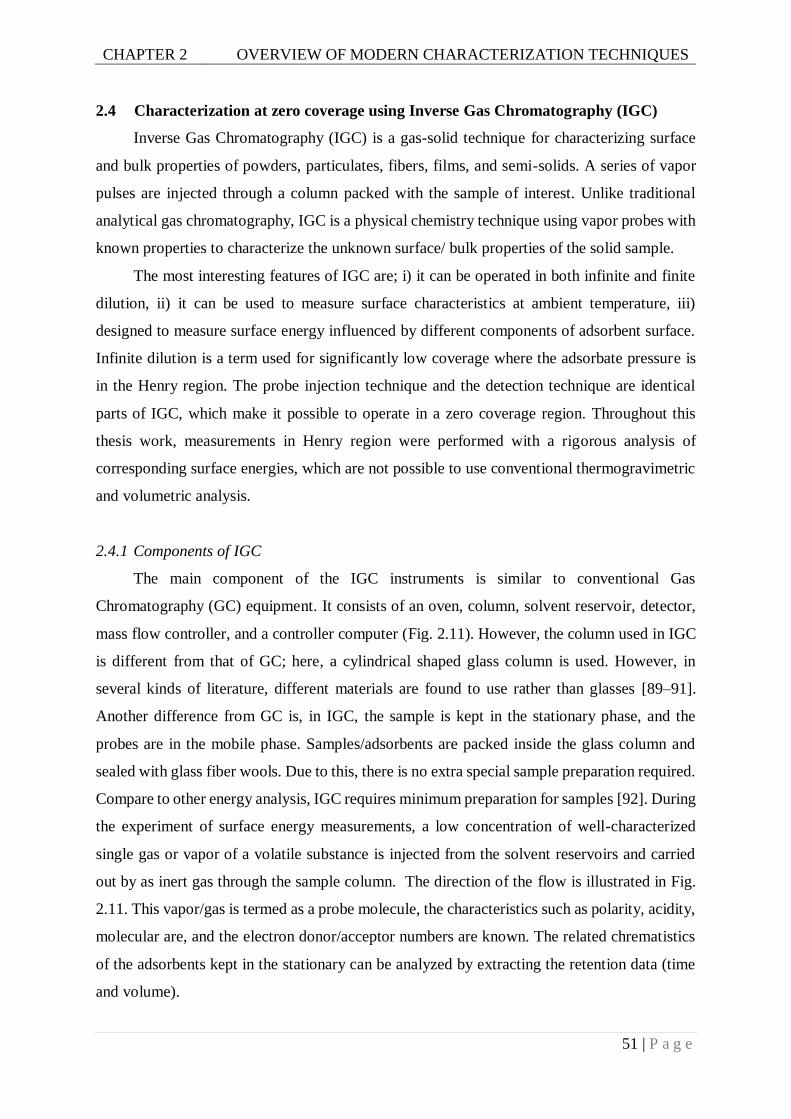
CHAPTER 2 OVERVIEW OF MODERN CHARACTERIZATION TECHNIQUES
51 | P a g e
2.4 Characterization at zero coverage using Inverse Gas Chromatography (IGC)
Inverse Gas Chromatography (IGC) is a gas-solid technique for characterizing surface
and bulk properties of powders, particulates, fibers, films, and semi-solids. A series of vapor
pulses are injected through a column packed with the sample of interest. Unlike traditional
analytical gas chromatography, IGC is a physical chemistry technique using vapor probes with
known properties to characterize the unknown surface/ bulk properties of the solid sample.
The most interesting features of IGC are; i) it can be operated in both infinite and finite
dilution, ii) it can be used to measure surface characteristics at ambient temperature, iii)
designed to measure surface energy influenced by different components of adsorbent surface.
Infinite dilution is a term used for significantly low coverage where the adsorbate pressure is
in the Henry region. The probe injection technique and the detection technique are identical
parts of IGC, which make it possible to operate in a zero coverage region. Throughout this
thesis work, measurements in Henry region were performed with a rigorous analysis of
corresponding surface energies, which are not possible to use conventional thermogravimetric
and volumetric analysis.
2.4.1 Components of IGC
The main component of the IGC instruments is similar to conventional Gas
Chromatography (GC) equipment. It consists of an oven, column, solvent reservoir, detector,
mass flow controller, and a controller computer (Fig. 2.11). However, the column used in IGC
is different from that of GC; here, a cylindrical shaped glass column is used. However, in
several kinds of literature, different materials are found to use rather than glasses [89–91].
Another difference from GC is, in IGC, the sample is kept in the stationary phase, and the
probes are in the mobile phase. Samples/adsorbents are packed inside the glass column and
sealed with glass fiber wools. Due to this, there is no extra special sample preparation required.
Compare to other energy analysis, IGC requires minimum preparation for samples [92]. During
the experiment of surface energy measurements, a low concentration of well-characterized
single gas or vapor of a volatile substance is injected from the solvent reservoirs and carried
out by as inert gas through the sample column. The direction of the flow is illustrated in Fig.
2.11. This vapor/gas is termed as a probe molecule, the characteristics such as polarity, acidity,
molecular are, and the electron donor/acceptor numbers are known. The related chrematistics
of the adsorbents kept in the stationary can be analyzed by extracting the retention data (time
and volume).
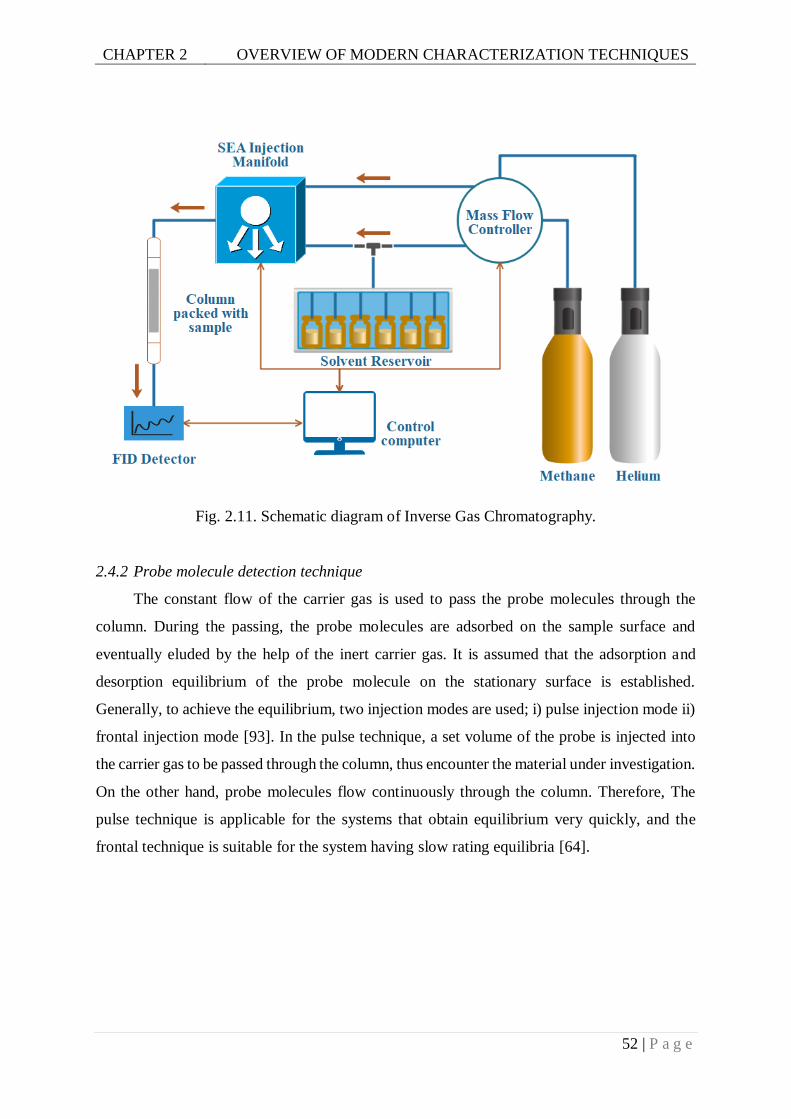
CHAPTER 2 OVERVIEW OF MODERN CHARACTERIZATION TECHNIQUES
52 | P a g e
Fig. 2.11. Schematic diagram of Inverse Gas Chromatography.
2.4.2 Probe molecule detection technique
The constant flow of the carrier gas is used to pass the probe molecules through the
column. During the passing, the probe molecules are adsorbed on the sample surface and
eventually eluded by the help of the inert carrier gas. It is assumed that the adsorption and
desorption equilibrium of the probe molecule on the stationary surface is established.
Generally, to achieve the equilibrium, two injection modes are used; i) pulse injection mode ii)
frontal injection mode [93]. In the pulse technique, a set volume of the probe is injected into
the carrier gas to be passed through the column, thus encounter the material under investigation.
On the other hand, probe molecules flow continuously through the column. Therefore, The
pulse technique is applicable for the systems that obtain equilibrium very quickly, and the
frontal technique is suitable for the system having slow rating equilibria [64].
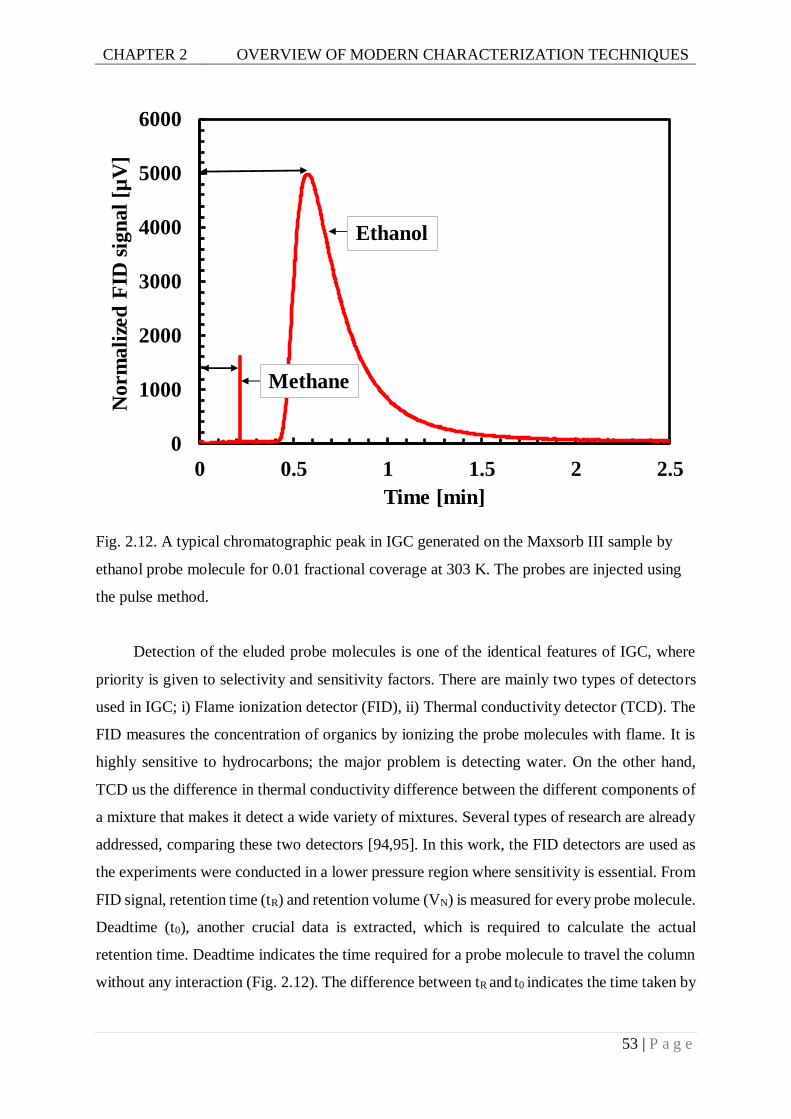
CHAPTER 2 OVERVIEW OF MODERN CHARACTERIZATION TECHNIQUES
53 | P a g e
Fig. 2.12. A typical chromatographic peak in IGC generated on the Maxsorb III sample by
ethanol probe molecule for 0.01 fractional coverage at 303 K. The probes are injected using
the pulse method.
Detection of the eluded probe molecules is one of the identical features of IGC, where
priority is given to selectivity and sensitivity factors. There are mainly two types of detectors
used in IGC; i) Flame ionization detector (FID), ii) Thermal conductivity detector (TCD). The
FID measures the concentration of organics by ionizing the probe molecules with flame. It is
highly sensitive to hydrocarbons; the major problem is detecting water. On the other hand,
TCD us the difference in thermal conductivity difference between the different components of
a mixture that makes it detect a wide variety of mixtures. Several types of research are already
addressed, comparing these two detectors [94,95]. In this work, the FID detectors are used as
the experiments were conducted in a lower pressure region where sensitivity is essential. From
FID signal, retention time (tR) and retention volume (VN) is measured for every probe molecule.
Deadtime (t0), another crucial data is extracted, which is required to calculate the actual
retention time. Deadtime indicates the time required for a probe molecule to travel the column
without any interaction (Fig. 2.12). The difference between tR and t0 indicates the time taken by
0
1000
2000
3000
4000
5000
6000
0 0.5 1 1.5 2 2.5
Norm
ali
zed
FID
sig
nal
[µV
]
Time [min]
Ethanol
Methane
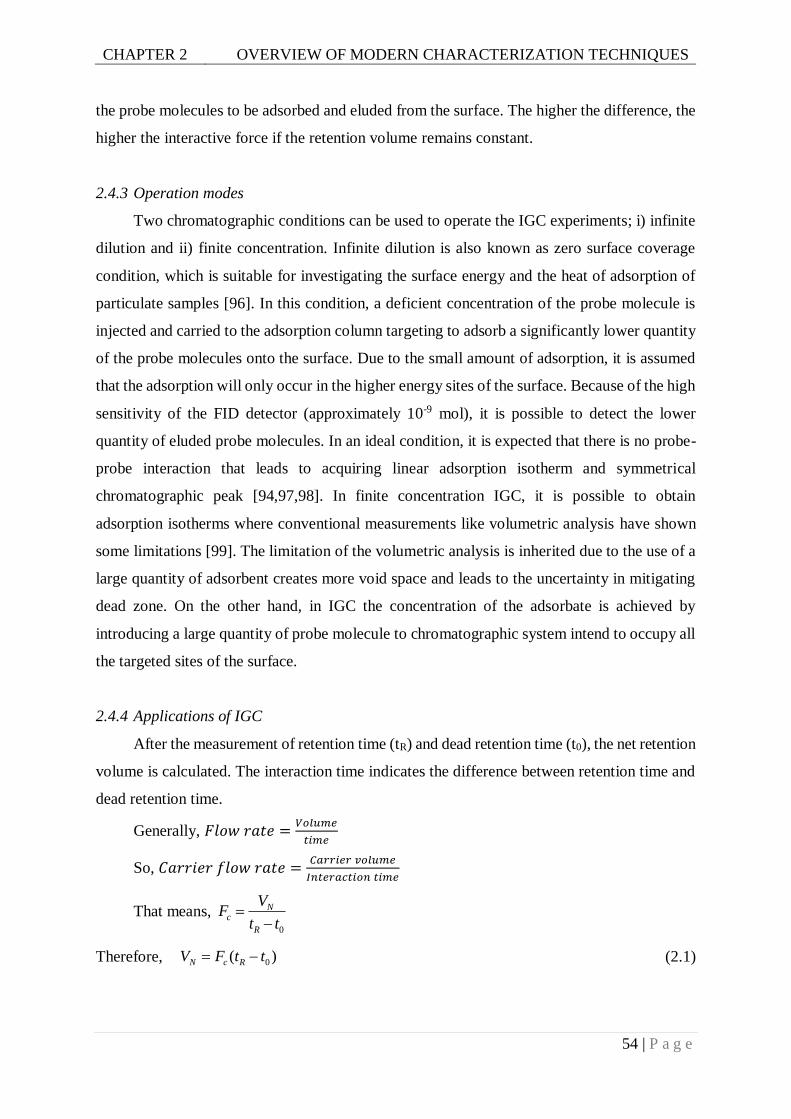
CHAPTER 2 OVERVIEW OF MODERN CHARACTERIZATION TECHNIQUES
54 | P a g e
the probe molecules to be adsorbed and eluded from the surface. The higher the difference, the
higher the interactive force if the retention volume remains constant.
2.4.3 Operation modes
Two chromatographic conditions can be used to operate the IGC experiments; i) infinite
dilution and ii) finite concentration. Infinite dilution is also known as zero surface coverage
condition, which is suitable for investigating the surface energy and the heat of adsorption of
particulate samples [96]. In this condition, a deficient concentration of the probe molecule is
injected and carried to the adsorption column targeting to adsorb a significantly lower quantity
of the probe molecules onto the surface. Due to the small amount of adsorption, it is assumed
that the adsorption will only occur in the higher energy sites of the surface. Because of the high
sensitivity of the FID detector (approximately 10-9 mol), it is possible to detect the lower
quantity of eluded probe molecules. In an ideal condition, it is expected that there is no probe-
probe interaction that leads to acquiring linear adsorption isotherm and symmetrical
chromatographic peak [94,97,98]. In finite concentration IGC, it is possible to obtain
adsorption isotherms where conventional measurements like volumetric analysis have shown
some limitations [99]. The limitation of the volumetric analysis is inherited due to the use of a
large quantity of adsorbent creates more void space and leads to the uncertainty in mitigating
dead zone. On the other hand, in IGC the concentration of the adsorbate is achieved by
introducing a large quantity of probe molecule to chromatographic system intend to occupy all
the targeted sites of the surface.
2.4.4 Applications of IGC
After the measurement of retention time (tR) and dead retention time (t0), the net retention
volume is calculated. The interaction time indicates the difference between retention time and
dead retention time.
Generally, 𝐹𝑙𝑜𝑤 𝑟𝑎𝑡𝑒 =𝑉𝑜𝑙𝑢𝑚𝑒
𝑡𝑖𝑚𝑒
So, 𝐶𝑎𝑟𝑟𝑖𝑒𝑟 𝑓𝑙𝑜𝑤 𝑟𝑎𝑡𝑒 =𝐶𝑎𝑟𝑟𝑖𝑒𝑟 𝑣𝑜𝑙𝑢𝑚𝑒
𝐼𝑛𝑡𝑒𝑟𝑎𝑐𝑡𝑖𝑜𝑛 𝑡𝑖𝑚𝑒
That means, 0
Nc
R
VF
t t
Therefore, 0( )N c RV F t t (2.1)
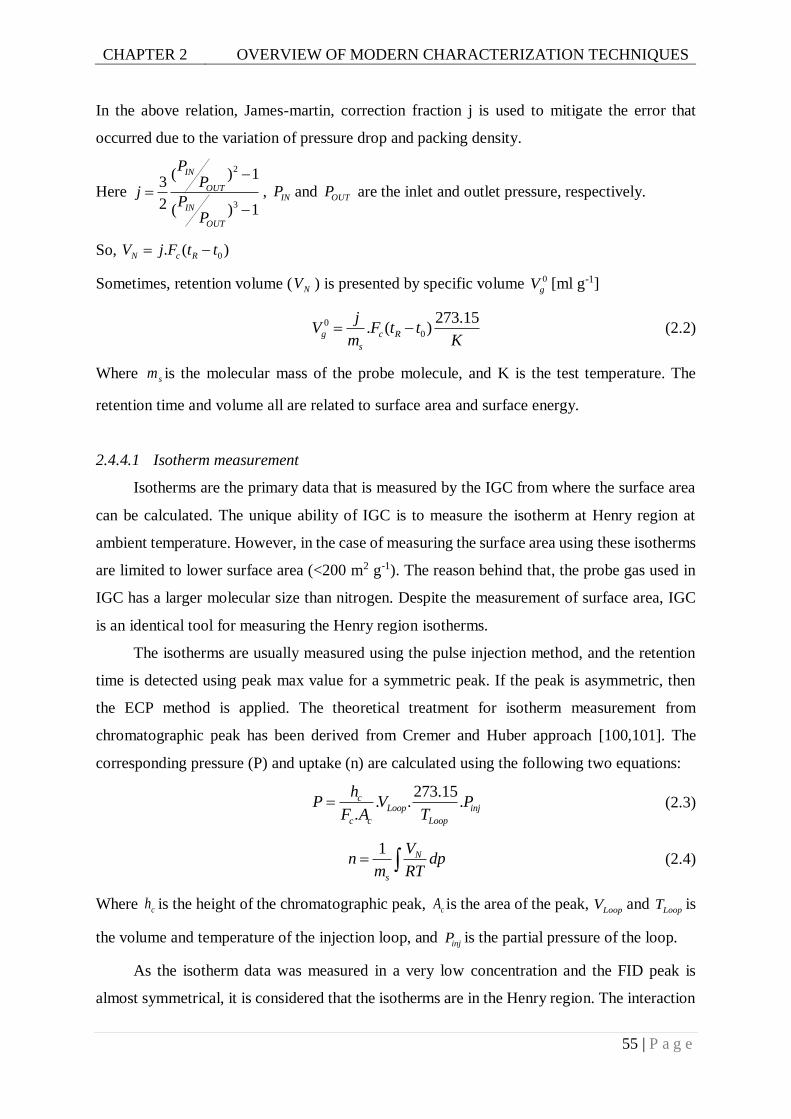
CHAPTER 2 OVERVIEW OF MODERN CHARACTERIZATION TECHNIQUES
55 | P a g e
In the above relation, James-martin, correction fraction j is used to mitigate the error that
occurred due to the variation of pressure drop and packing density.
Here
2
3
( ) 13
2 ( ) 1
IN
OUT
IN
OUT
PP
jP
P
, INP and OUTP are the inlet and outlet pressure, respectively.
So, 0. ( )N c RV j F t t
Sometimes, retention volume ( NV ) is presented by specific volume 0
gV [ml g-1]
0
0
273.15. ( )g c R
s
jV F t t
m K (2.2)
Where sm is the molecular mass of the probe molecule, and K is the test temperature. The
retention time and volume all are related to surface area and surface energy.
2.4.4.1 Isotherm measurement
Isotherms are the primary data that is measured by the IGC from where the surface area
can be calculated. The unique ability of IGC is to measure the isotherm at Henry region at
ambient temperature. However, in the case of measuring the surface area using these isotherms
are limited to lower surface area (<200 m2 g-1). The reason behind that, the probe gas used in
IGC has a larger molecular size than nitrogen. Despite the measurement of surface area, IGC
is an identical tool for measuring the Henry region isotherms.
The isotherms are usually measured using the pulse injection method, and the retention
time is detected using peak max value for a symmetric peak. If the peak is asymmetric, then
the ECP method is applied. The theoretical treatment for isotherm measurement from
chromatographic peak has been derived from Cremer and Huber approach [100,101]. The
corresponding pressure (P) and uptake (n) are calculated using the following two equations:
273.15
. . ..
cLoop inj
c c Loop
hP V P
F A T (2.3)
1 N
s
Vn dp
m RT (2.4)
Where ch is the height of the chromatographic peak, cA is the area of the peak, LoopV and LoopT is
the volume and temperature of the injection loop, and injP is the partial pressure of the loop.
As the isotherm data was measured in a very low concentration and the FID peak is
almost symmetrical, it is considered that the isotherms are in the Henry region. The interaction
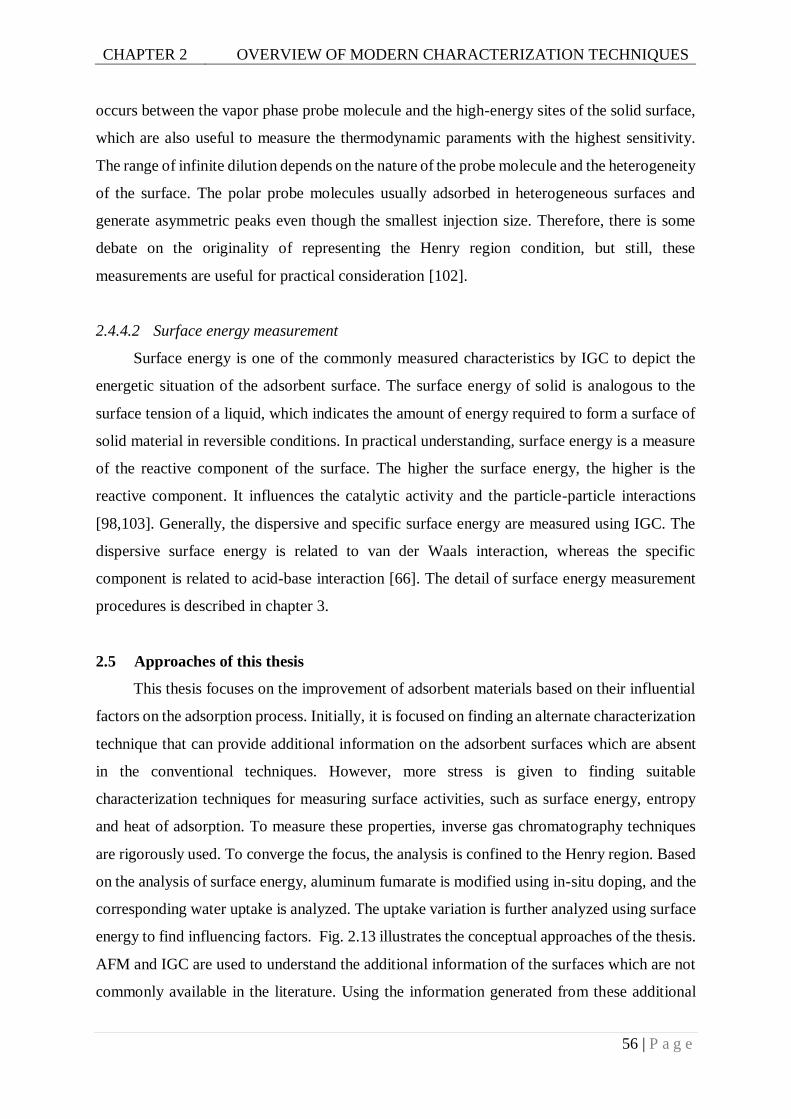
CHAPTER 2 OVERVIEW OF MODERN CHARACTERIZATION TECHNIQUES
56 | P a g e
occurs between the vapor phase probe molecule and the high-energy sites of the solid surface,
which are also useful to measure the thermodynamic paraments with the highest sensitivity.
The range of infinite dilution depends on the nature of the probe molecule and the heterogeneity
of the surface. The polar probe molecules usually adsorbed in heterogeneous surfaces and
generate asymmetric peaks even though the smallest injection size. Therefore, there is some
debate on the originality of representing the Henry region condition, but still, these
measurements are useful for practical consideration [102].
2.4.4.2 Surface energy measurement
Surface energy is one of the commonly measured characteristics by IGC to depict the
energetic situation of the adsorbent surface. The surface energy of solid is analogous to the
surface tension of a liquid, which indicates the amount of energy required to form a surface of
solid material in reversible conditions. In practical understanding, surface energy is a measure
of the reactive component of the surface. The higher the surface energy, the higher is the
reactive component. It influences the catalytic activity and the particle-particle interactions
[98,103]. Generally, the dispersive and specific surface energy are measured using IGC. The
dispersive surface energy is related to van der Waals interaction, whereas the specific
component is related to acid-base interaction [66]. The detail of surface energy measurement
procedures is described in chapter 3.
2.5 Approaches of this thesis
This thesis focuses on the improvement of adsorbent materials based on their influential
factors on the adsorption process. Initially, it is focused on finding an alternate characterization
technique that can provide additional information on the adsorbent surfaces which are absent
in the conventional techniques. However, more stress is given to finding suitable
characterization techniques for measuring surface activities, such as surface energy, entropy
and heat of adsorption. To measure these properties, inverse gas chromatography techniques
are rigorously used. To converge the focus, the analysis is confined to the Henry region. Based
on the analysis of surface energy, aluminum fumarate is modified using in-situ doping, and the
corresponding water uptake is analyzed. The uptake variation is further analyzed using surface
energy to find influencing factors. Fig. 2.13 illustrates the conceptual approaches of the thesis.
AFM and IGC are used to understand the additional information of the surfaces which are not
commonly available in the literature. Using the information generated from these additional
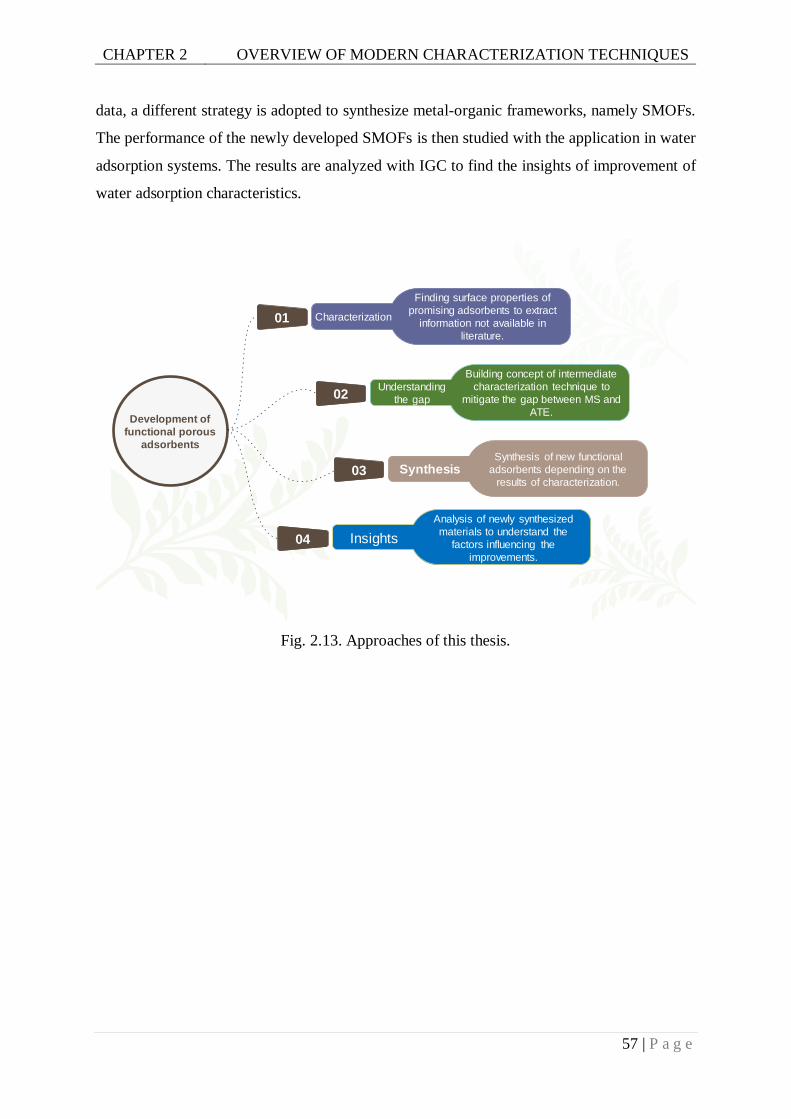
CHAPTER 2 OVERVIEW OF MODERN CHARACTERIZATION TECHNIQUES
57 | P a g e
data, a different strategy is adopted to synthesize metal-organic frameworks, namely SMOFs.
The performance of the newly developed SMOFs is then studied with the application in water
adsorption systems. The results are analyzed with IGC to find the insights of improvement of
water adsorption characteristics.
Fig. 2.13. Approaches of this thesis.
Finding surface properties of
promising adsorbents to extract
information not available in
literature.
Characterization01
Building concept of intermediate
characterization technique to
mitigate the gap between MS and
ATE.
Understanding
the gap 02
Synthesis of new functional
adsorbents depending on the
results of characterization.Synthesis 03
Analysis of newly synthesized
materials to understand the
factors influencing the
improvements.
Insights04
Development of
functional porous
adsorbents
58 | P a g e
Chapter 3
Morphological Study of Porous Materials
using Atomic Force Microscopy Equation Chapter 3 Section 1
This chapter discusses a direct approach for assessing irregularly shaped pore distribution
of porous materials using Atomic Force Microscopy (AFM). Using the tapping mode, AFM is
employed to obtain the surface topographic information of the porous materials commonly
used in adsorption applications. Three different types of silica gels are investigated by an image
processing technique for the pore size-related information. Mesopores in a specified region is
visualized then quantified and counted using 2-D Fast Fourier Transformation (2D FFT)
technique. The results obtained by the AFM technique are then compared with the BET surface
area and pore size distribution (NLDFT) extracted from the N2 adsorption isotherms.
3.1 Material
Silica gel samples from several sources are used in this study; the first type of silica gel
is collected form Fuji silica Ltd (SS1), which is popularly used in an adsorption-based chiller
system. The second sample is a generic silica gel commercially used for humidity control in
food preservation (SS2). The last sample is CaCl2 coated silica gel, which is used for laboratory
applications (SS3). The unique feature of this silica gel type is its property to change its color
during the adsorption process.
3.2 Experimental apparatus and procedure
In this study, surface imaging of silica gel is carried out using a scanning probe
microscopy (SPM-9700, Shimadzu Corp., Japan). Atomic Force Microscopy (AFM) is one
type of SPM. Unlike the other microscopy techniques, SPM uses a sharp probe to measure the
interactive forces between the tip of the probe and the molecules on the surface of a sample.
The variation of the interactive forces contains a broad range of information on surfaces, such
as topography, viscosity, elasticity, surface energy, etc. By selecting the probe type and mode
of operation, different kinds of information can be obtained. For instance, silicon tip is useful
with the dynamic mode of operation for measuring the topographic variation of samples,
whereas in the nano-indentation testing diamond tip with contact mode is preferable. In this
CHAPTER 3
MORPHOLOGICAL STUDY OF POROUS MATERIALS USING
ATOMIC FORCE MICROSCOPY
59 | P a g e
study, tips made of monolithic silicon (NCHR-20, Nanoworld AG, Switzerland) are used with
phase mode to determine the three-dimensional topographic images.
3.2.1 Experimental apparatus
A schematic diagram of the SPM system operated in-phase mode is illustrated in Fig.
3.1. In this figure, the sample holder is shown in the center position where the sample is placed;
the precise feed of the holder is controlled by the piezoelectric scanner. In this equipment, the
movement of the cantilever is fixed to a lateral axis, and this movement is restricted only to
bring the cantilever near the sample. During scanning, cantilever remains in a fixed position,
and the sample moves in a controlled manner using the piezo scanner. The horizontal
movement is maintained by the parameters set before scanning, and the lateral movement is
controlled by a feedback controller. Lateral movement serves two crucial tasks; one is it keeps
the probe at a safe distance from the sample surface, and the second one is it carries the
information of forces acting vertically. SPM can be operated in various modes, and each mode
does a different task. For example, only topographic data can be retrieved during the operation
of phase mode; here, tips are usually moving very near to the sample surface to measure the
repulsive force between tip and sample. On the other hand, in non-contact mode, the probe
keeps a distance to measure the attractive force between tip and sample. Another favorite mode
is intermittent contact mode, where tip taps the surface and generates phase and topographic
data. In this mode, which is also known as phase mode, the cantilever is excited near to its
resonance frequency to measure the amount force generated due to both the attraction and
repulsion between sample and tip, which changes in accordance with tip-sample separation
distance[104]. These interactive forces shift the cantilever frequency, which can be detected by
an optical lever sensor. In amplitude-modulated SPM, the output signal contains noise, which
is eliminated by the lock-in detector. The equipment used in this study includes two lock-in
detectors to generate two separate signals comprising sine and cosine components to find the
phase differences.
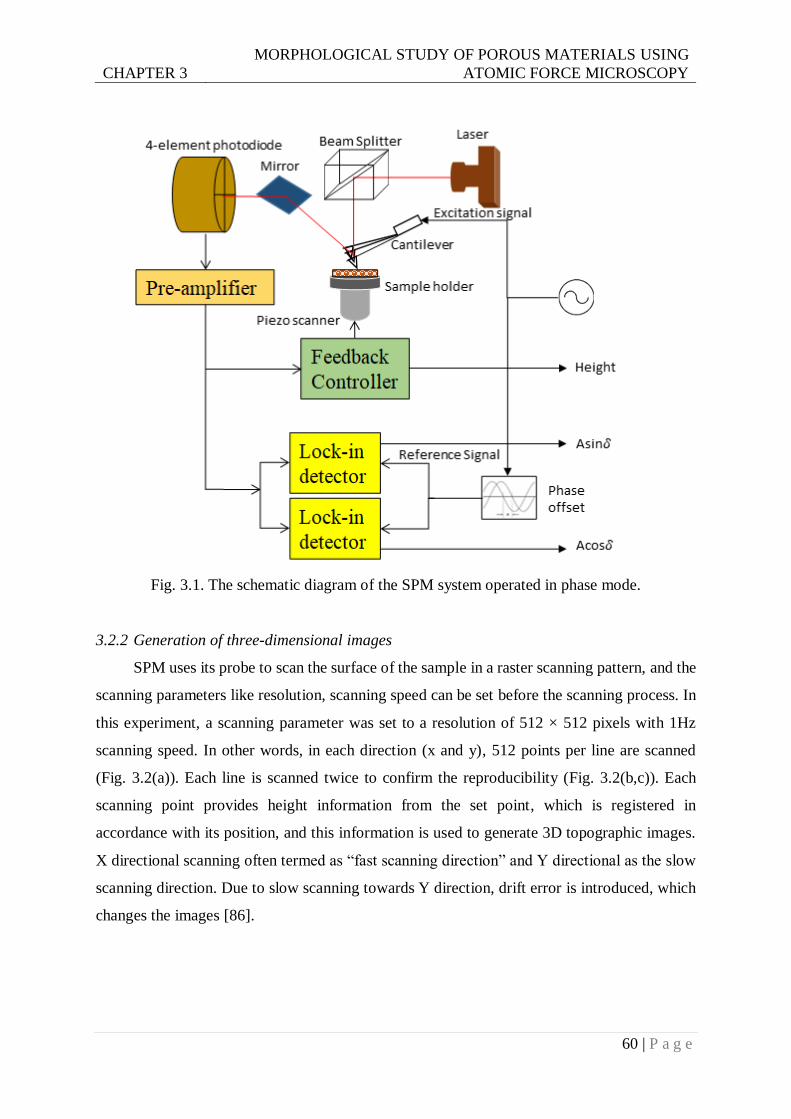
CHAPTER 3
MORPHOLOGICAL STUDY OF POROUS MATERIALS USING
ATOMIC FORCE MICROSCOPY
60 | P a g e
Fig. 3.1. The schematic diagram of the SPM system operated in phase mode.
3.2.2 Generation of three-dimensional images
SPM uses its probe to scan the surface of the sample in a raster scanning pattern, and the
scanning parameters like resolution, scanning speed can be set before the scanning process. In
this experiment, a scanning parameter was set to a resolution of 512 × 512 pixels with 1Hz
scanning speed. In other words, in each direction (x and y), 512 points per line are scanned
(Fig. 3.2(a)). Each line is scanned twice to confirm the reproducibility (Fig. 3.2(b,c)). Each
scanning point provides height information from the set point, which is registered in
accordance with its position, and this information is used to generate 3D topographic images.
X directional scanning often termed as “fast scanning direction” and Y directional as the slow
scanning direction. Due to slow scanning towards Y direction, drift error is introduced, which
changes the images [86].
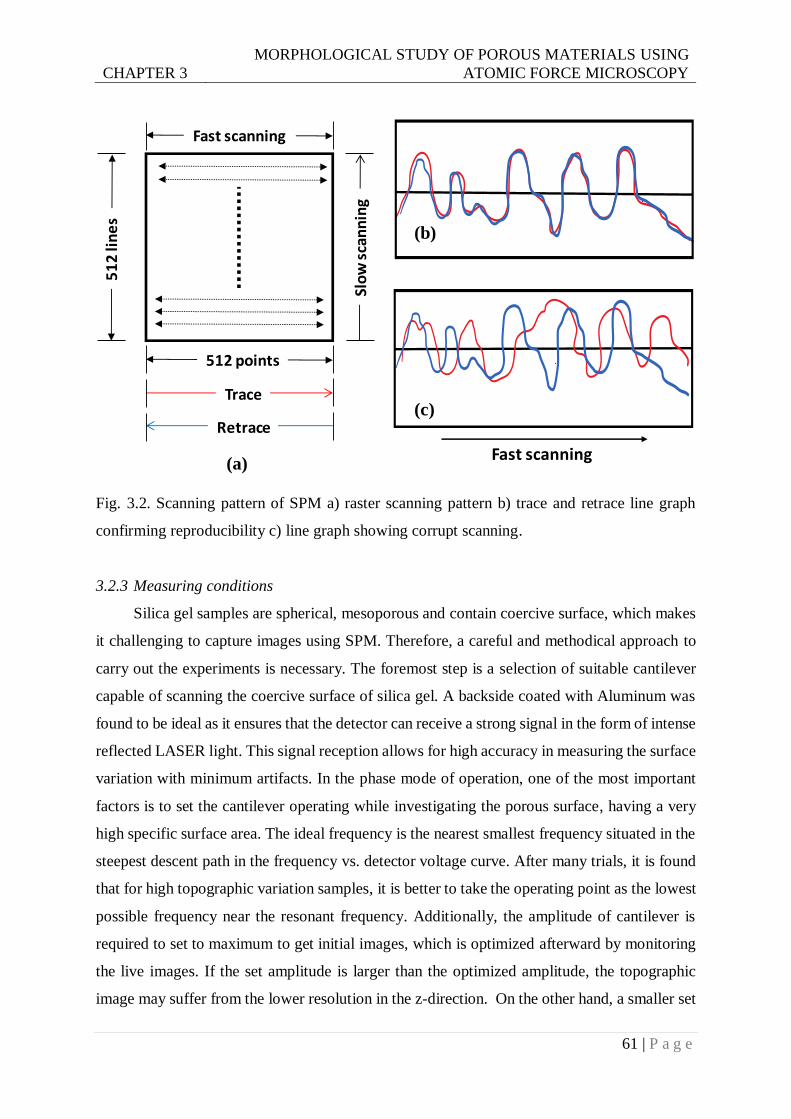
CHAPTER 3
MORPHOLOGICAL STUDY OF POROUS MATERIALS USING
ATOMIC FORCE MICROSCOPY
61 | P a g e
Fig. 3.2. Scanning pattern of SPM a) raster scanning pattern b) trace and retrace line graph
confirming reproducibility c) line graph showing corrupt scanning.
3.2.3 Measuring conditions
Silica gel samples are spherical, mesoporous and contain coercive surface, which makes
it challenging to capture images using SPM. Therefore, a careful and methodical approach to
carry out the experiments is necessary. The foremost step is a selection of suitable cantilever
capable of scanning the coercive surface of silica gel. A backside coated with Aluminum was
found to be ideal as it ensures that the detector can receive a strong signal in the form of intense
reflected LASER light. This signal reception allows for high accuracy in measuring the surface
variation with minimum artifacts. In the phase mode of operation, one of the most important
factors is to set the cantilever operating while investigating the porous surface, having a very
high specific surface area. The ideal frequency is the nearest smallest frequency situated in the
steepest descent path in the frequency vs. detector voltage curve. After many trials, it is found
that for high topographic variation samples, it is better to take the operating point as the lowest
possible frequency near the resonant frequency. Additionally, the amplitude of cantilever is
required to set to maximum to get initial images, which is optimized afterward by monitoring
the live images. If the set amplitude is larger than the optimized amplitude, the topographic
image may suffer from the lower resolution in the z-direction. On the other hand, a smaller set
512 points
51
2 li
ne
s
Fast scanning
Slo
w s
can
nin
g
Trace
Retrace
(a)
(b)
(c)
Fast scanning
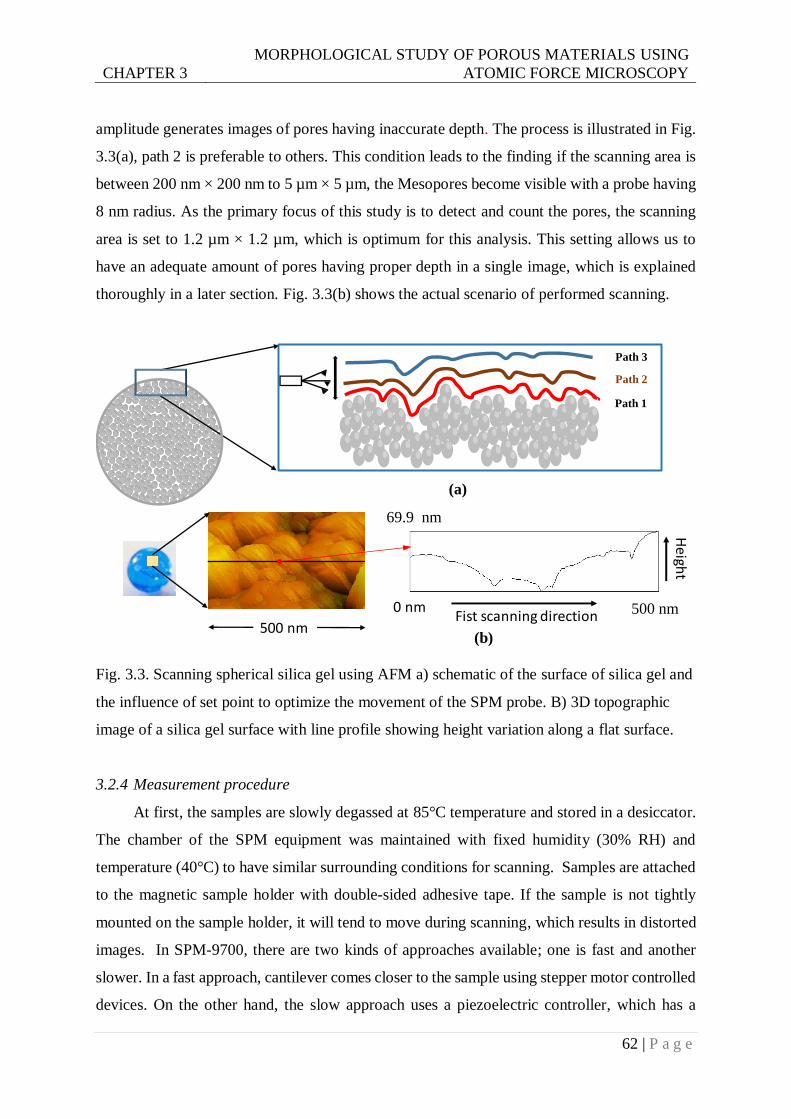
CHAPTER 3
MORPHOLOGICAL STUDY OF POROUS MATERIALS USING
ATOMIC FORCE MICROSCOPY
62 | P a g e
amplitude generates images of pores having inaccurate depth. The process is illustrated in Fig.
3.3(a), path 2 is preferable to others. This condition leads to the finding if the scanning area is
between 200 nm × 200 nm to 5 µm × 5 µm, the Mesopores become visible with a probe having
8 nm radius. As the primary focus of this study is to detect and count the pores, the scanning
area is set to 1.2 µm × 1.2 µm, which is optimum for this analysis. This setting allows us to
have an adequate amount of pores having proper depth in a single image, which is explained
thoroughly in a later section. Fig. 3.3(b) shows the actual scenario of performed scanning.
Fig. 3.3. Scanning spherical silica gel using AFM a) schematic of the surface of silica gel and
the influence of set point to optimize the movement of the SPM probe. B) 3D topographic
image of a silica gel surface with line profile showing height variation along a flat surface.
3.2.4 Measurement procedure
At first, the samples are slowly degassed at 85°C temperature and stored in a desiccator.
The chamber of the SPM equipment was maintained with fixed humidity (30% RH) and
temperature (40°C) to have similar surrounding conditions for scanning. Samples are attached
to the magnetic sample holder with double-sided adhesive tape. If the sample is not tightly
mounted on the sample holder, it will tend to move during scanning, which results in distorted
images. In SPM-9700, there are two kinds of approaches available; one is fast and another
slower. In a fast approach, cantilever comes closer to the sample using stepper motor controlled
devices. On the other hand, the slow approach uses a piezoelectric controller, which has a
500 nm
(a)
(b)
Path 1
Path 2
Path 3
500 nm
69.9 nm
Fist scanning direction
He
ight
0 nm
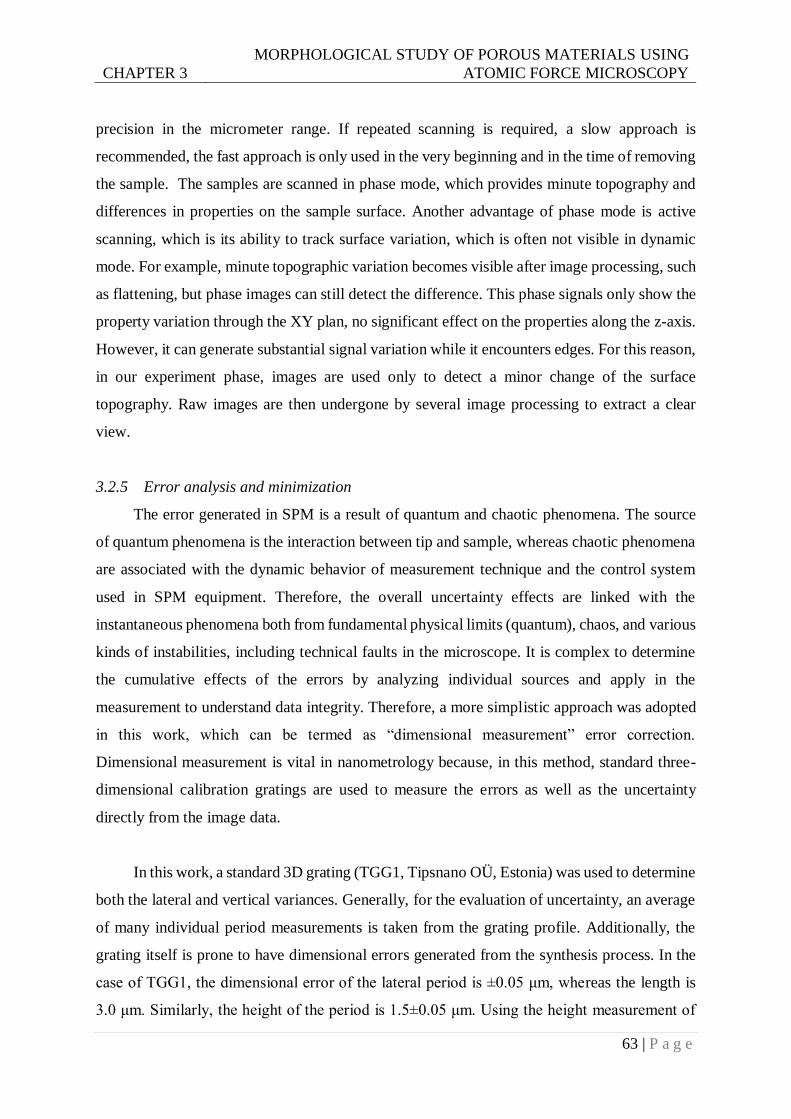
CHAPTER 3
MORPHOLOGICAL STUDY OF POROUS MATERIALS USING
ATOMIC FORCE MICROSCOPY
63 | P a g e
precision in the micrometer range. If repeated scanning is required, a slow approach is
recommended, the fast approach is only used in the very beginning and in the time of removing
the sample. The samples are scanned in phase mode, which provides minute topography and
differences in properties on the sample surface. Another advantage of phase mode is active
scanning, which is its ability to track surface variation, which is often not visible in dynamic
mode. For example, minute topographic variation becomes visible after image processing, such
as flattening, but phase images can still detect the difference. This phase signals only show the
property variation through the XY plan, no significant effect on the properties along the z-axis.
However, it can generate substantial signal variation while it encounters edges. For this reason,
in our experiment phase, images are used only to detect a minor change of the surface
topography. Raw images are then undergone by several image processing to extract a clear
view.
3.2.5 Error analysis and minimization
The error generated in SPM is a result of quantum and chaotic phenomena. The source
of quantum phenomena is the interaction between tip and sample, whereas chaotic phenomena
are associated with the dynamic behavior of measurement technique and the control system
used in SPM equipment. Therefore, the overall uncertainty effects are linked with the
instantaneous phenomena both from fundamental physical limits (quantum), chaos, and various
kinds of instabilities, including technical faults in the microscope. It is complex to determine
the cumulative effects of the errors by analyzing individual sources and apply in the
measurement to understand data integrity. Therefore, a more simplistic approach was adopted
in this work, which can be termed as “dimensional measurement” error correction.
Dimensional measurement is vital in nanometrology because, in this method, standard three-
dimensional calibration gratings are used to measure the errors as well as the uncertainty
directly from the image data.
In this work, a standard 3D grating (TGG1, Tipsnano OÜ, Estonia) was used to determine
both the lateral and vertical variances. Generally, for the evaluation of uncertainty, an average
of many individual period measurements is taken from the grating profile. Additionally, the
grating itself is prone to have dimensional errors generated from the synthesis process. In the
case of TGG1, the dimensional error of the lateral period is ±0.05 μm, whereas the length is
3.0 μm. Similarly, the height of the period is 1.5±0.05 μm. Using the height measurement of
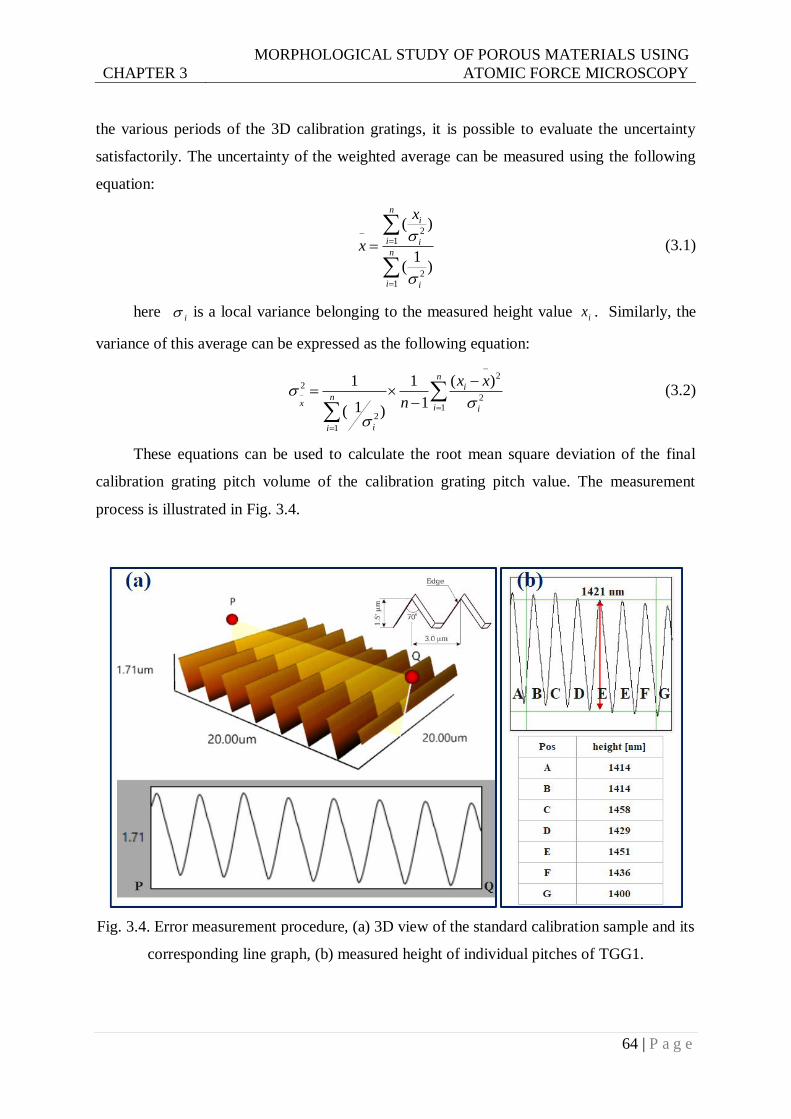
CHAPTER 3
MORPHOLOGICAL STUDY OF POROUS MATERIALS USING
ATOMIC FORCE MICROSCOPY
64 | P a g e
the various periods of the 3D calibration gratings, it is possible to evaluate the uncertainty
satisfactorily. The uncertainty of the weighted average can be measured using the following
equation:
2
1
21
( )
1( )
ni
i in
i i
x
x
(3.1)
here i is a local variance belonging to the measured height value ix . Similarly, the
variance of this average can be expressed as the following equation:
2
2
21
2
1
1 1 ( )
11( )
ni
nx
i i
ii
x x
n
(3.2)
These equations can be used to calculate the root mean square deviation of the final
calibration grating pitch volume of the calibration grating pitch value. The measurement
process is illustrated in Fig. 3.4.
Fig. 3.4. Error measurement procedure, (a) 3D view of the standard calibration sample and its
corresponding line graph, (b) measured height of individual pitches of TGG1.
CHAPTER 3
MORPHOLOGICAL STUDY OF POROUS MATERIALS USING
ATOMIC FORCE MICROSCOPY
65 | P a g e
Using the above equations, the weighted average of the height measurement is 1440 nm,
and the variance of this mean is 56 nm, which is 0.025% of the mean. Compare to the actual
measurement; the variance is negligible. The SPM-9700 equipment includes a build-in
calibration system, which provides the ability to correct the height measurement for each
sample. In this work, mean correction is used for every measurement prior to image processing.
3.2.6 Image processing
Post-processing of SPM data is carried out to obtain designated features. In order to
calculate the height, image leveling is required. As the pores are irregular shaped, choice of
wrong leveling methods may eliminate valuable information of the pores. For this purpose, a
plane fit leveling technique is used wherein a standard fitting determines the inner surface, and
then this surface is subtracted from individual data. Sometimes the inclination of the surface is
increased when a line of best fit differs from the profile inclination. After completion of this
flattening process, images are further treated by 1D Fourier Transformation (1D-FFT) to
eliminate the line noises. Then a filter is applied to select the noise frequencies, and finally, the
inverse transformation is used to attain a filtered image. Third-party software like Gwyddion
provides a 1D FFT filter to remove the noise frequencies by suppressing corresponding values
to neighboring frequencies [105]. Gwyddion (Version 2.49, 2017) is used in the present
investigation to remove horizontal line noise by using vertical direction 1D FFT filter.
3.3 Results and Discussions
AFM shows many identical features over BET and other imaging techniques, which are
advantageous for the characterization of porous materials. The most useful one is the extraction
of three-dimensional images which contain various important topographic information. For
instance, it is possible to measure the roughness of the surface using AFM. This surface
roughness data has a close relationship with adsorption isotherms; even the isosteric heat tends
to affect mostly by surface roughness in low the density region [106]. Besides, the
thermodynamic formulation of different adsorbent materials shows the dependency of water
uptake on a particular pore structure [107]. AFM can generate 3D data, which can be used to
better understanding of pore structures and shapes along with surface area measurements.
A conventional technique for measurement of pore size distribution and surface area is
by using gas adsorption technique, which is an indirect technique. The measured surface area
is not the actual surface area, rather tagged as BET surface area. Furthermore, the pore size
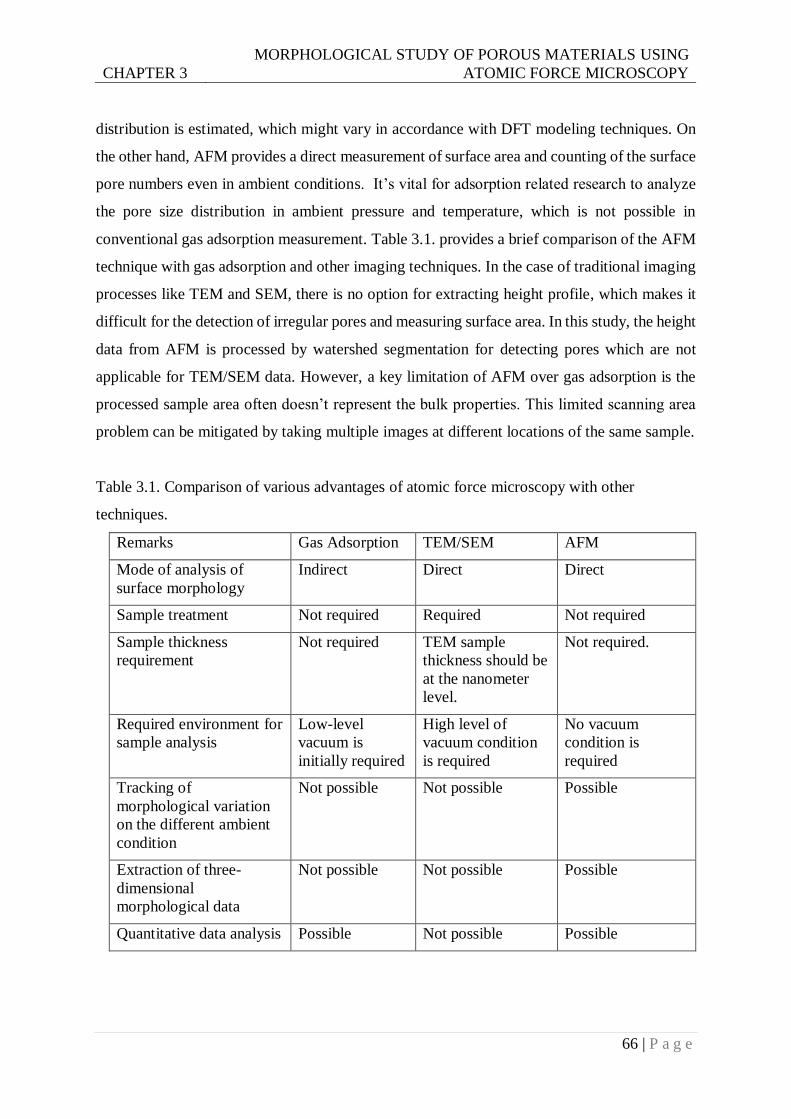
CHAPTER 3
MORPHOLOGICAL STUDY OF POROUS MATERIALS USING
ATOMIC FORCE MICROSCOPY
66 | P a g e
distribution is estimated, which might vary in accordance with DFT modeling techniques. On
the other hand, AFM provides a direct measurement of surface area and counting of the surface
pore numbers even in ambient conditions. It’s vital for adsorption related research to analyze
the pore size distribution in ambient pressure and temperature, which is not possible in
conventional gas adsorption measurement. Table 3.1. provides a brief comparison of the AFM
technique with gas adsorption and other imaging techniques. In the case of traditional imaging
processes like TEM and SEM, there is no option for extracting height profile, which makes it
difficult for the detection of irregular pores and measuring surface area. In this study, the height
data from AFM is processed by watershed segmentation for detecting pores which are not
applicable for TEM/SEM data. However, a key limitation of AFM over gas adsorption is the
processed sample area often doesn’t represent the bulk properties. This limited scanning area
problem can be mitigated by taking multiple images at different locations of the same sample.
Table 3.1. Comparison of various advantages of atomic force microscopy with other
techniques.
Remarks Gas Adsorption TEM/SEM AFM
Mode of analysis of
surface morphology
Indirect Direct Direct
Sample treatment Not required Required Not required
Sample thickness
requirement
Not required TEM sample
thickness should be
at the nanometer
level.
Not required.
Required environment for
sample analysis
Low-level
vacuum is
initially required
High level of
vacuum condition
is required
No vacuum
condition is
required
Tracking of
morphological variation
on the different ambient
condition
Not possible Not possible Possible
Extraction of three-
dimensional
morphological data
Not possible Not possible Possible
Quantitative data analysis Possible Not possible Possible
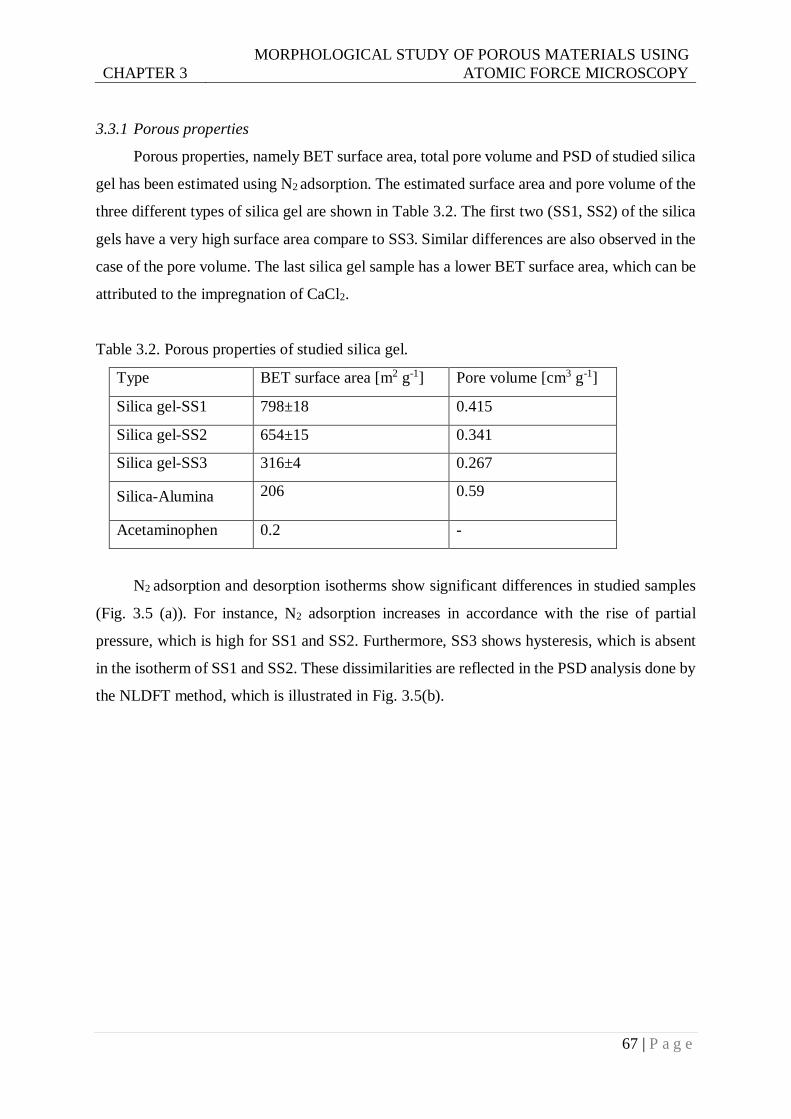
CHAPTER 3
MORPHOLOGICAL STUDY OF POROUS MATERIALS USING
ATOMIC FORCE MICROSCOPY
67 | P a g e
3.3.1 Porous properties
Porous properties, namely BET surface area, total pore volume and PSD of studied silica
gel has been estimated using N2 adsorption. The estimated surface area and pore volume of the
three different types of silica gel are shown in Table 3.2. The first two (SS1, SS2) of the silica
gels have a very high surface area compare to SS3. Similar differences are also observed in the
case of the pore volume. The last silica gel sample has a lower BET surface area, which can be
attributed to the impregnation of CaCl2.
Table 3.2. Porous properties of studied silica gel.
Type BET surface area [m2 g-1] Pore volume [cm3 g-1]
Silica gel-SS1 798±18 0.415
Silica gel-SS2 654±15 0.341
Silica gel-SS3 316±4 0.267
Silica-Alumina 206 0.59
Acetaminophen 0.2 -
N2 adsorption and desorption isotherms show significant differences in studied samples
(Fig. 3.5 (a)). For instance, N2 adsorption increases in accordance with the rise of partial
pressure, which is high for SS1 and SS2. Furthermore, SS3 shows hysteresis, which is absent
in the isotherm of SS1 and SS2. These dissimilarities are reflected in the PSD analysis done by
the NLDFT method, which is illustrated in Fig. 3.5(b).
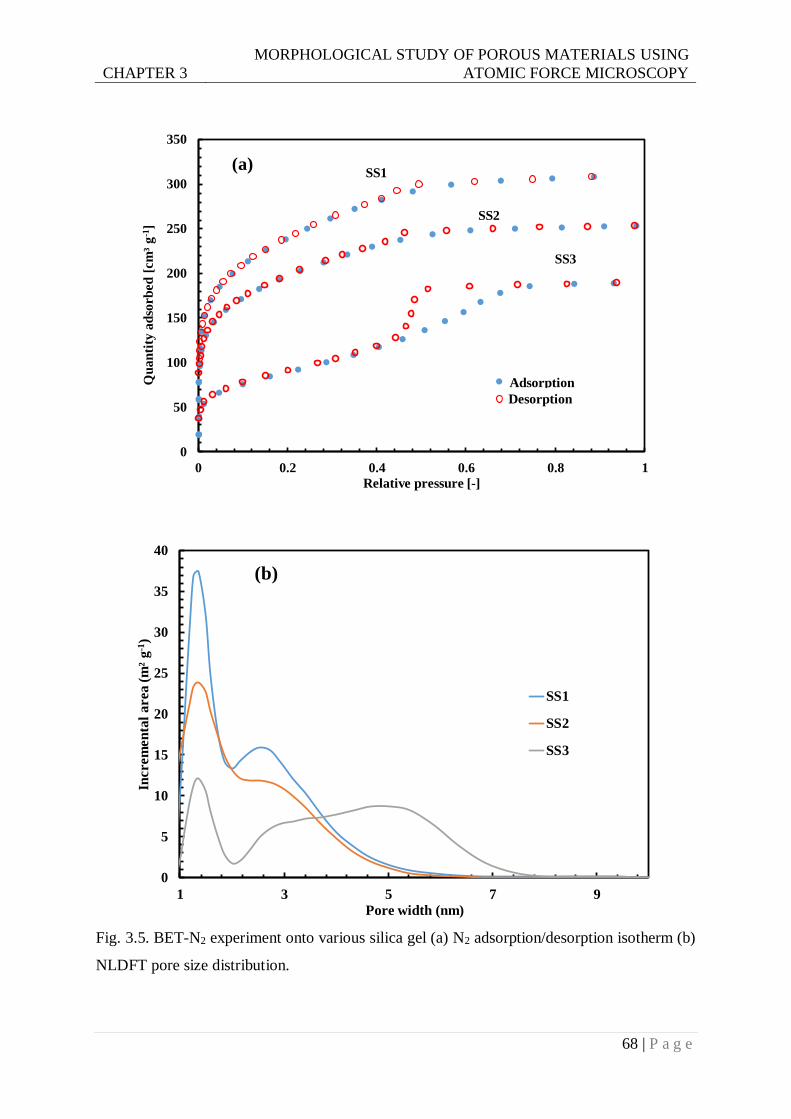
CHAPTER 3
MORPHOLOGICAL STUDY OF POROUS MATERIALS USING
ATOMIC FORCE MICROSCOPY
68 | P a g e
Fig. 3.5. BET-N2 experiment onto various silica gel (a) N2 adsorption/desorption isotherm (b)
NLDFT pore size distribution.
0
50
100
150
200
250
300
350
0 0.2 0.4 0.6 0.8 1
Qu
an
tity
ad
sorb
ed
[cm
³ g
-1]
Relative pressure [-]
Adsorption
desorption
SS1
SS2
SS3
Adsorption
Desorption
(a)
0
5
10
15
20
25
30
35
40
1 3 5 7 9
Increm
en
tal
area (
m²
g-1
)
Pore width (nm)
SS1
SS2
SS3
(b)
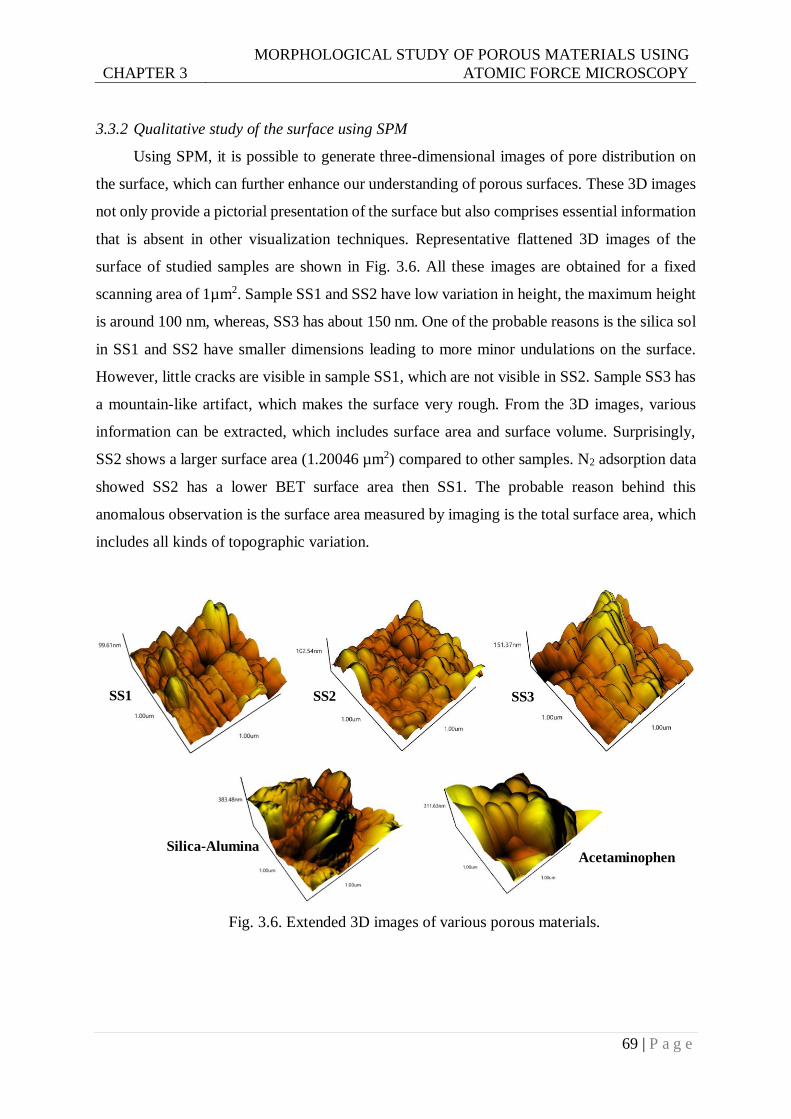
CHAPTER 3
MORPHOLOGICAL STUDY OF POROUS MATERIALS USING
ATOMIC FORCE MICROSCOPY
69 | P a g e
3.3.2 Qualitative study of the surface using SPM
Using SPM, it is possible to generate three-dimensional images of pore distribution on
the surface, which can further enhance our understanding of porous surfaces. These 3D images
not only provide a pictorial presentation of the surface but also comprises essential information
that is absent in other visualization techniques. Representative flattened 3D images of the
surface of studied samples are shown in Fig. 3.6. All these images are obtained for a fixed
scanning area of 1µm2. Sample SS1 and SS2 have low variation in height, the maximum height
is around 100 nm, whereas, SS3 has about 150 nm. One of the probable reasons is the silica sol
in SS1 and SS2 have smaller dimensions leading to more minor undulations on the surface.
However, little cracks are visible in sample SS1, which are not visible in SS2. Sample SS3 has
a mountain-like artifact, which makes the surface very rough. From the 3D images, various
information can be extracted, which includes surface area and surface volume. Surprisingly,
SS2 shows a larger surface area (1.20046 µm2) compared to other samples. N2 adsorption data
showed SS2 has a lower BET surface area then SS1. The probable reason behind this
anomalous observation is the surface area measured by imaging is the total surface area, which
includes all kinds of topographic variation.
Fig. 3.6. Extended 3D images of various porous materials.
SS1 SS2 SS3
Silica-AluminaAcetaminophen
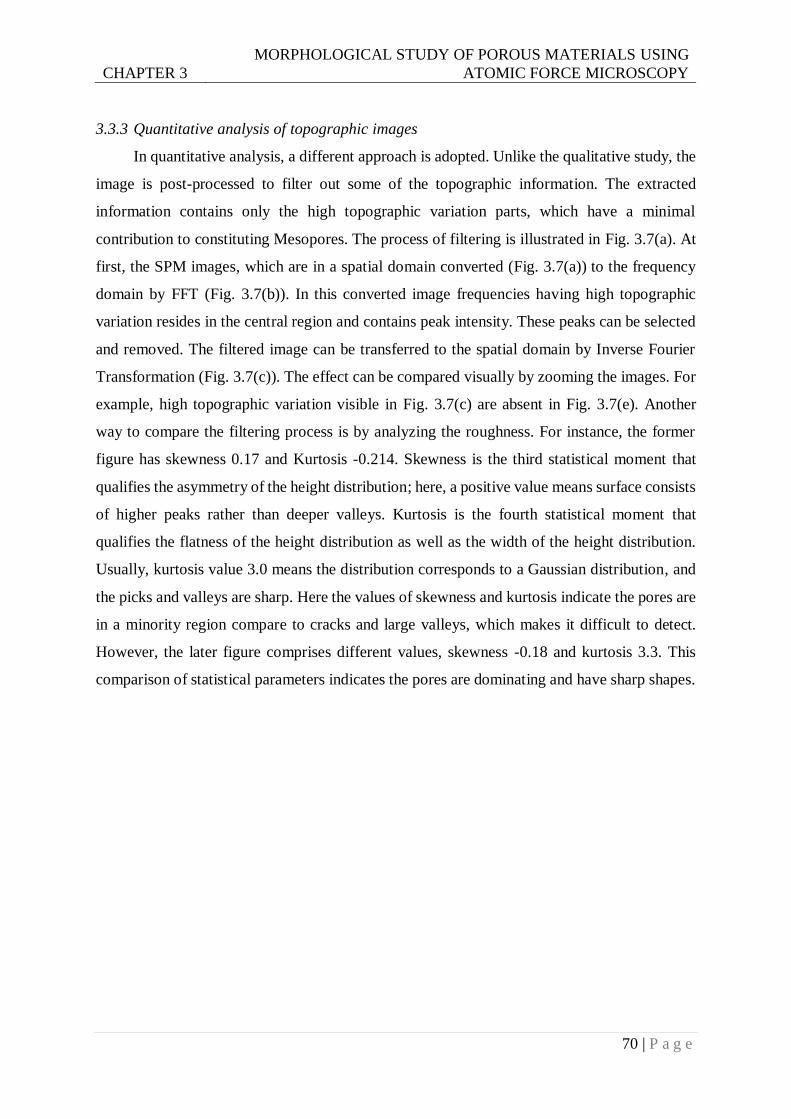
CHAPTER 3
MORPHOLOGICAL STUDY OF POROUS MATERIALS USING
ATOMIC FORCE MICROSCOPY
70 | P a g e
3.3.3 Quantitative analysis of topographic images
In quantitative analysis, a different approach is adopted. Unlike the qualitative study, the
image is post-processed to filter out some of the topographic information. The extracted
information contains only the high topographic variation parts, which have a minimal
contribution to constituting Mesopores. The process of filtering is illustrated in Fig. 3.7(a). At
first, the SPM images, which are in a spatial domain converted (Fig. 3.7(a)) to the frequency
domain by FFT (Fig. 3.7(b)). In this converted image frequencies having high topographic
variation resides in the central region and contains peak intensity. These peaks can be selected
and removed. The filtered image can be transferred to the spatial domain by Inverse Fourier
Transformation (Fig. 3.7(c)). The effect can be compared visually by zooming the images. For
example, high topographic variation visible in Fig. 3.7(c) are absent in Fig. 3.7(e). Another
way to compare the filtering process is by analyzing the roughness. For instance, the former
figure has skewness 0.17 and Kurtosis -0.214. Skewness is the third statistical moment that
qualifies the asymmetry of the height distribution; here, a positive value means surface consists
of higher peaks rather than deeper valleys. Kurtosis is the fourth statistical moment that
qualifies the flatness of the height distribution as well as the width of the height distribution.
Usually, kurtosis value 3.0 means the distribution corresponds to a Gaussian distribution, and
the picks and valleys are sharp. Here the values of skewness and kurtosis indicate the pores are
in a minority region compare to cracks and large valleys, which makes it difficult to detect.
However, the later figure comprises different values, skewness -0.18 and kurtosis 3.3. This
comparison of statistical parameters indicates the pores are dominating and have sharp shapes.
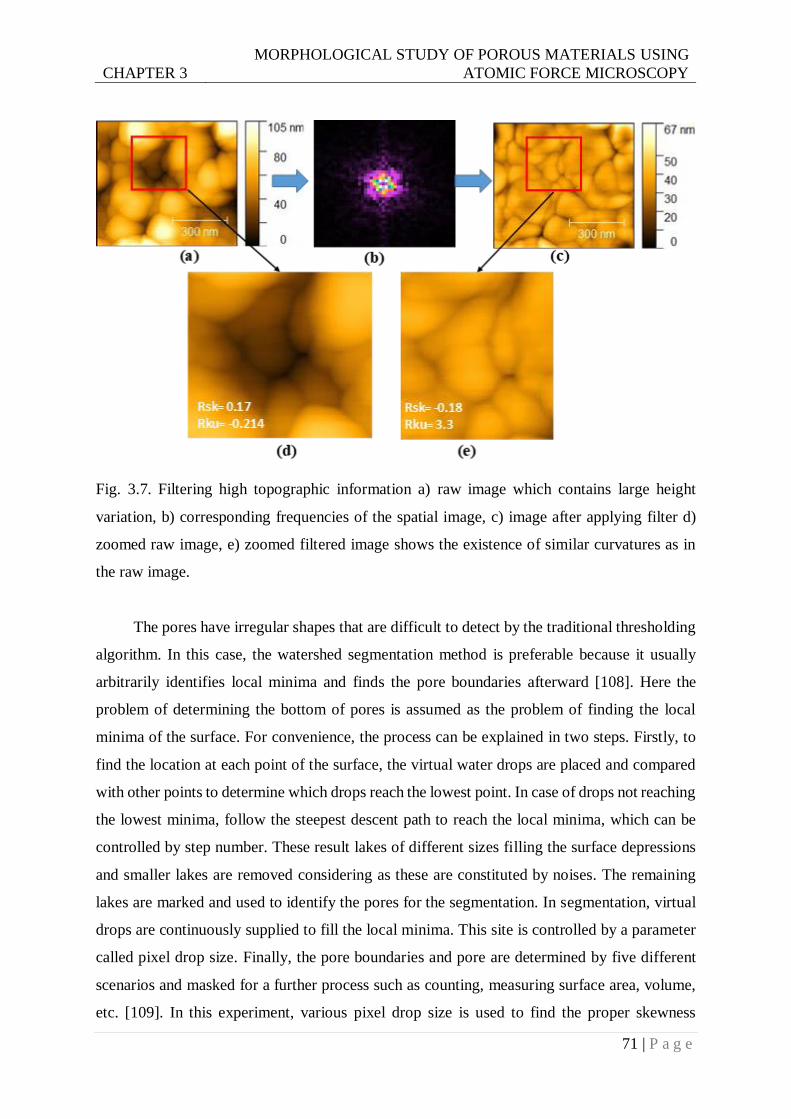
CHAPTER 3
MORPHOLOGICAL STUDY OF POROUS MATERIALS USING
ATOMIC FORCE MICROSCOPY
71 | P a g e
Fig. 3.7. Filtering high topographic information a) raw image which contains large height
variation, b) corresponding frequencies of the spatial image, c) image after applying filter d)
zoomed raw image, e) zoomed filtered image shows the existence of similar curvatures as in
the raw image.
The pores have irregular shapes that are difficult to detect by the traditional thresholding
algorithm. In this case, the watershed segmentation method is preferable because it usually
arbitrarily identifies local minima and finds the pore boundaries afterward [108]. Here the
problem of determining the bottom of pores is assumed as the problem of finding the local
minima of the surface. For convenience, the process can be explained in two steps. Firstly, to
find the location at each point of the surface, the virtual water drops are placed and compared
with other points to determine which drops reach the lowest point. In case of drops not reaching
the lowest minima, follow the steepest descent path to reach the local minima, which can be
controlled by step number. These result lakes of different sizes filling the surface depressions
and smaller lakes are removed considering as these are constituted by noises. The remaining
lakes are marked and used to identify the pores for the segmentation. In segmentation, virtual
drops are continuously supplied to fill the local minima. This site is controlled by a parameter
called pixel drop size. Finally, the pore boundaries and pore are determined by five different
scenarios and masked for a further process such as counting, measuring surface area, volume,
etc. [109]. In this experiment, various pixel drop size is used to find the proper skewness
CHAPTER 3
MORPHOLOGICAL STUDY OF POROUS MATERIALS USING
ATOMIC FORCE MICROSCOPY
72 | P a g e
parameter. In Fig. 3.8(a) variation of surface area and skewness are shown for various silica
gel samples. It is found that for SS1, SS2, and SS3 silica gel, the skewness decreases until drop
size reaches 1.01. This statistical parameter stipulates that at the turning point, the identified
pores remain in the valley region, but after that, it expanded to the open flat areas, which may
not constitute the region of pores. Considering this, in the case of pore size determination, the
before mentioned drop sizes are taken.
Fig. 3.8. AFM experiment on various silica gel (a) variation of different drop sizes to determine
the effect on the surface area and the skewness values are shown in each bar graph, (b) pore
size distribution is showing surface porosity.
The masked pore regions are counted, and normalized PSD is shown in Fig. 3.8(b). Mean
radius data is considered as the pores are concave shaped, and this data indicates the mean
distance from the pore center of mass to its boundary. The trend of surface porosity shows a
significant peak in the distribution at 2–4 nm on the surface of every sample. However, SS2
another minor peak at around 12 nm whereas SS3 shows multiple small peaks in the porosity
distribution curve. This indicates slight heterogeneity in porosity for SS2 and SS3 samples.
The numerical values of pore count data are shown in Table 3.3. SS1 has the most substantial
number of pores on the surface, amongst which 238 mesopores are counted within the scanned
1µm2 of surface area. SS3 has the least pore counts among all the silica gel samples, which are
expected due to the impregnation of CaCl2. Interestingly, the trend in the number of pores
counted by the present method has a direct correlation with the surface area measured by the
BET-N2 method. SS1 has the highest BET-surface area, and so is the number of pores counted
0
5
10
15
20
25
30
0.51 1.01 2.01 3.01
Increase
d s
urfa
ce a
rea [
%]
Pixel drop size [%]
SS1 SS2 SS3
-1.2
8
-2.5
0
-1.9
0
-1.4
9
-2.6
9
-1.9
1
-1.4
4
-2.6
1
-1.5
7
-1.3
6
-2.2
7
-1.2
8
0
0.05
0.1
0.15
0.2
0.25
0.3
0.35
0 10 20 30 40 50
No
rm
ali
zed
po
re c
ou
nt
Mean pore radius [nm]
SS1
SS2
SS3
(a) (b)
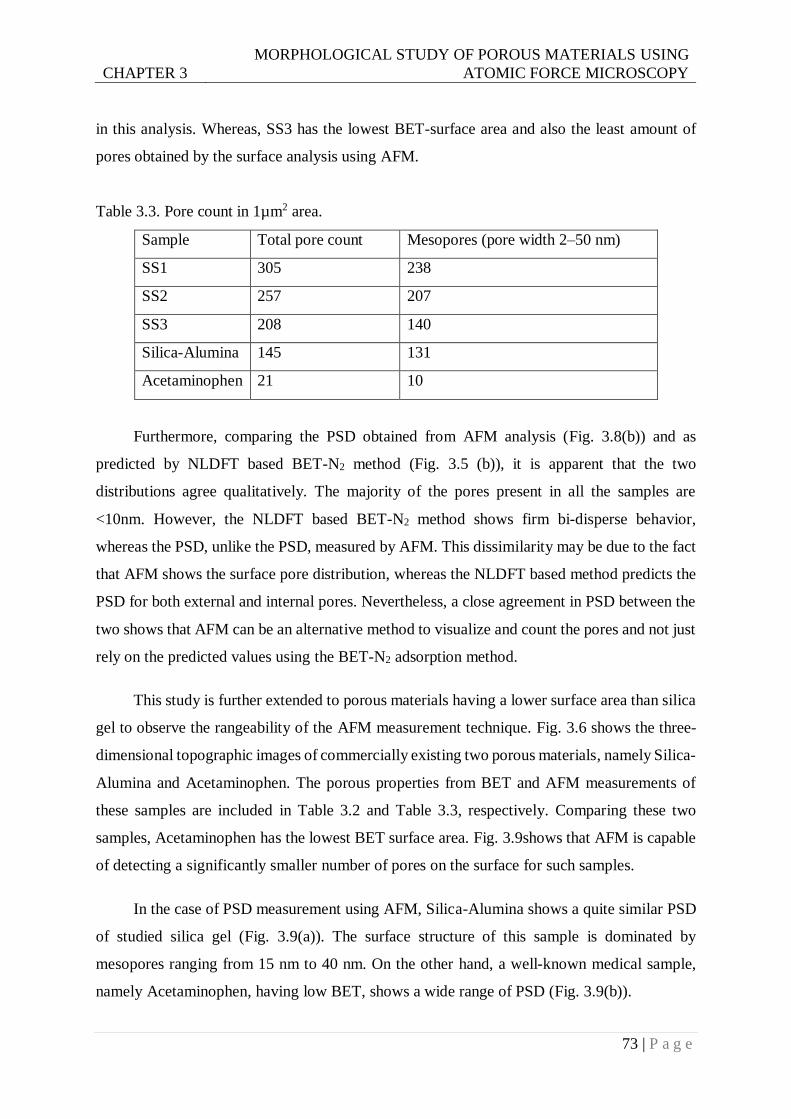
CHAPTER 3
MORPHOLOGICAL STUDY OF POROUS MATERIALS USING
ATOMIC FORCE MICROSCOPY
73 | P a g e
in this analysis. Whereas, SS3 has the lowest BET-surface area and also the least amount of
pores obtained by the surface analysis using AFM.
Table 3.3. Pore count in 1µm2 area.
Sample Total pore count Mesopores (pore width 2–50 nm)
SS1 305 238
SS2 257 207
SS3 208 140
Silica-Alumina 145 131
Acetaminophen 21 10
Furthermore, comparing the PSD obtained from AFM analysis (Fig. 3.8(b)) and as
predicted by NLDFT based BET-N2 method (Fig. 3.5 (b)), it is apparent that the two
distributions agree qualitatively. The majority of the pores present in all the samples are
<10nm. However, the NLDFT based BET-N2 method shows firm bi-disperse behavior,
whereas the PSD, unlike the PSD, measured by AFM. This dissimilarity may be due to the fact
that AFM shows the surface pore distribution, whereas the NLDFT based method predicts the
PSD for both external and internal pores. Nevertheless, a close agreement in PSD between the
two shows that AFM can be an alternative method to visualize and count the pores and not just
rely on the predicted values using the BET-N2 adsorption method.
This study is further extended to porous materials having a lower surface area than silica
gel to observe the rangeability of the AFM measurement technique. Fig. 3.6 shows the three-
dimensional topographic images of commercially existing two porous materials, namely Silica-
Alumina and Acetaminophen. The porous properties from BET and AFM measurements of
these samples are included in Table 3.2 and Table 3.3, respectively. Comparing these two
samples, Acetaminophen has the lowest BET surface area. Fig. 3.9shows that AFM is capable
of detecting a significantly smaller number of pores on the surface for such samples.
In the case of PSD measurement using AFM, Silica-Alumina shows a quite similar PSD
of studied silica gel (Fig. 3.9(a)). The surface structure of this sample is dominated by
mesopores ranging from 15 nm to 40 nm. On the other hand, a well-known medical sample,
namely Acetaminophen, having low BET, shows a wide range of PSD (Fig. 3.9(b)).
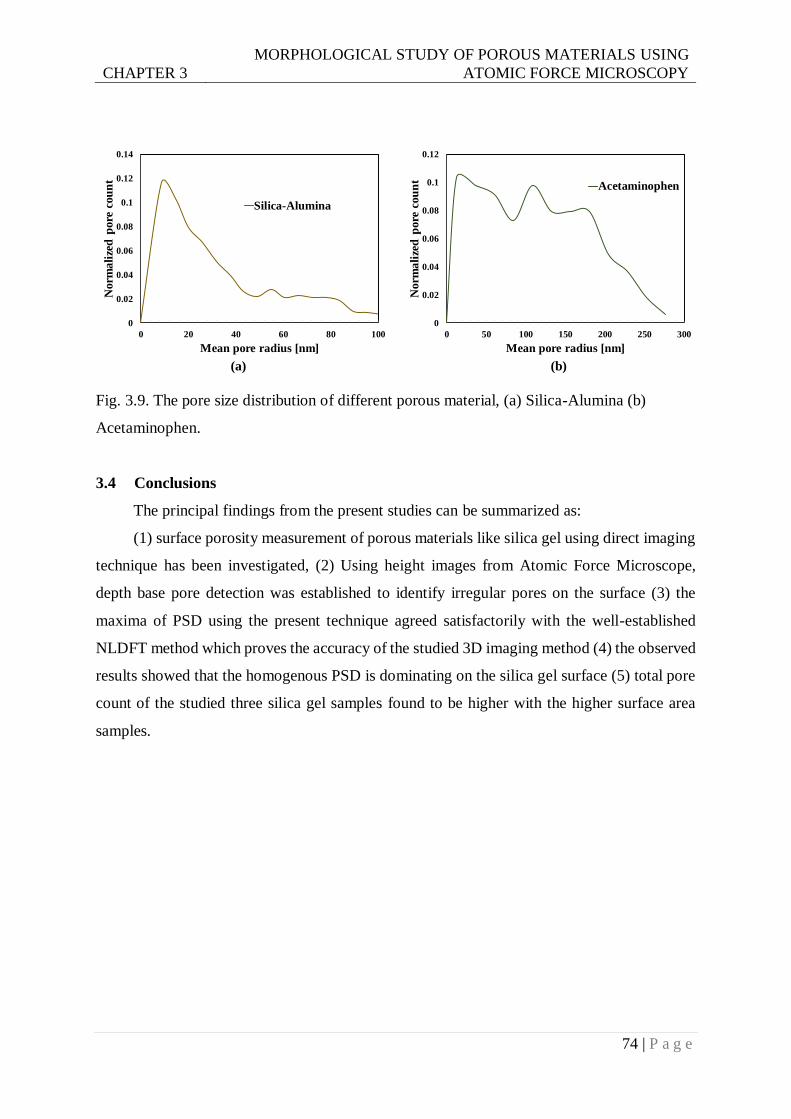
CHAPTER 3
MORPHOLOGICAL STUDY OF POROUS MATERIALS USING
ATOMIC FORCE MICROSCOPY
74 | P a g e
Fig. 3.9. The pore size distribution of different porous material, (a) Silica-Alumina (b)
Acetaminophen.
3.4 Conclusions
The principal findings from the present studies can be summarized as:
(1) surface porosity measurement of porous materials like silica gel using direct imaging
technique has been investigated, (2) Using height images from Atomic Force Microscope,
depth base pore detection was established to identify irregular pores on the surface (3) the
maxima of PSD using the present technique agreed satisfactorily with the well-established
NLDFT method which proves the accuracy of the studied 3D imaging method (4) the observed
results showed that the homogenous PSD is dominating on the silica gel surface (5) total pore
count of the studied three silica gel samples found to be higher with the higher surface area
samples.
(a) (b)
0
0.02
0.04
0.06
0.08
0.1
0.12
0.14
0 20 40 60 80 100
Norm
ali
zed
pore
cou
nt
Mean pore radius [nm]
Silica-Alumina
0
0.02
0.04
0.06
0.08
0.1
0.12
0 50 100 150 200 250 300
Norm
ali
zed
pore
cou
nt
Mean pore radius [nm]
Acetaminophen
75 | P a g e
Chapter 4
Surface Energy Characterisation of
Different Porous adsorbents by Inverse Gas
Chromatography Equation Chapter 4 Section 1
Porous silica gels are the well-established adsorbent materials used in adsorption cooling,
dehumidification, gas separation, and desalination applications. To understand the adsorption
characteristics, morphological characterization of the adsorbent is widely used. However, the
surface activities of the adsorbent material, which are the most influential parameters for the
adsorption process, is still unknown. To determine the surface activities, surface energy
analysis has been performed for four commercially available silica gels (RD granular silica gel,
Chromatorex, Home silica gel and B-type silica gel) using inverse gas chromatography
technique. The experiment is conducted at infinite dilution (0.008 to 0.1 coverage) with a fixed
flowrate (30 sccm) of helium gas. The result shows that RD silica gel has the highest value of
total surface energy for all the coverages. Several comparative studies with relevant insights
are also presented to reveal the possible field of improvement.
4.1 Introduction
Adsorption technologies hold great potential in energy conservation and conversion in
accordance with gas storage and heat transfer applications. Consequently, a considerable
number of researches has been conducted in this field in the past decade. As a result,
multifarious types of adsorbents are introduced with distinctive properties, such as silica gel,
activated carbon, zeolite, etc. Among these adsorbents, silica-gel exhibits excellent features
like high water adsorption capacity [110] along with long-time cycle stability [111], which
enabled silica-gel/water adsorption pair to be frequently used in commercial applications like
adsorption cooling [112,113], dehumidification [114,115], desalination [116–118], and gas
separation [119,120]. As solid-gas adsorption is a surface phenomenon, the characterization of
the surface properties of the adsorbent materials is vital to understand the performance before
applying in all the fields of applications. Morphological characterizations such as BET surface
area, pore size distribution, pore volume, etc. are the well-established methods of
CHAPTER 4
SURFACE ENERGY CHARACTERISATION OF DIFFERENT
POROUS ADSORBENTS BY INVERSE GAS CHROMATOGRAPHY
76 | P a g e
characterizing an adsorbent using nitrogen adsorption and mercury intrusion porosimetry.
However, these characterizations are simply the geometric parameters that do not provide any
information about surface activity; thus, they cannot truly explain the adsorption process. The
surface properties of the adsorbents are the crucial parameters that are mainly responsible for
any adsorbent’s affinity towards a particular adsorbate. For this reason, silica-gels are good
adsorbent for moisture adsorption while activated carbons are not. The fundamental knowledge
of the interaction between the adsorbent’s surface and the adsorbate molecules is vital for
further development of the functional porous materials. Therefore, the estimation of surface
chemistry is essential to understand the adsorption characteristics properly.
The surface activities can be estimated using surface energy measurement, which
provides information about dispersive and specific (acid-base) interactions between the
adsorbate molecule and the adsorbent surface. For example, surfaces having a higher value of
surface energy is more likely to become wet than the lower one [121]. In addition, the surface
energy is higher in the lower coverage region, indicating the possibility of high energy
dissipation during the adsorption process. There are many articles available that have explained
the fundamentals of physical adsorption using the heat of adsorption; however, there is hardly
any literature found that provides meaningful insights regarding the sources of this energy
dissipation in the form of released heat [122,123]. In this case, surface energy could provide
the different component associated with the energy dissipation. For instance, dispersive surface
energy is related to van der Waals attraction, whereas specific energy is to acid-base attraction
[64]. In carbon-based adsorbents, the dispersive surface energy is higher than specific surface
energy, indicating that in the adsorption process, the heat of adsorption is generated from the
van der Waals attraction between the probe and the adsorbent’s surface molecules [66].
Additionally, in adsorption related applications, the shape of the isotherms plays a vital role,
like as S-shaped isotherms are more suitable for adsorption heat pump applications [124]. A
universal model has recently been proposed to relate the shape of the isotherms with the surface
energy distribution, indicating the importance of the measurement of surface energy [77].
There are several methods used to measure the surface energy, such as Sessile Drop (SD),
Atomic Force Microscopy (AFM), Wilhelmy Plate (WP), Inverse Gas Chromatography (IGC),
etc. Among them, the IGC method is used for particulate samples and widely accepted
technique suitable for measuring surface energy component of the porous adsorbents
[125,126]. In this technique the adsorbent is kept in the stationary phase and several polar and
non-polar solvents are used to measure the surface energy components. Recently, IGC
CHAPTER 4
SURFACE ENERGY CHARACTERISATION OF DIFFERENT
POROUS ADSORBENTS BY INVERSE GAS CHROMATOGRAPHY
77 | P a g e
techniques are employed successfully to measure the surface properties of various modified
silicates [67,97,127].
The aim of the present work is to investigate the surface energy characteristics of various
silica gels with different porous properties. For this purpose, five polar and three non-polar
probes have been used for the measurement. The Dorris-Gray method is applied to determine
the dispersive component of the surface energy, and the polarization method is used for
determining the specific Gibbs free energy. Furthermore, a rigorous comparative analysis with
different carbon-based adsorbent has been presented to understand the surface energy variation
due to the change of adsorbent types.
4.2 Theory
Surface energy measurement was performed in infinite dilution, where the minimum
concentration of the probe molecule was injected. In infinite dilution, it is considered that the
interaction between adsorbate is negligible, and the adsorption process takes place in Henry’s
region [128]. The experimental results of IGC provide chromatographic data, which is then
used to calculate the surface energy components. The total surface energy has two components:
dispersive and specific. The dispersive component is calculated for Schultz or Dorris-Gray
method, whereas a specific component is calculated using the polarization method. The
necessary equations related to the calculation are presented in this section.
From the IGC experiment, the chromatograph results contain the information of retention
time (tR), which indicates the time required to generate a peak resulting from an interaction
between molecules and sample surface. However, this time includes the non-interaction time
of the probe molecules while residing inside the column. To measure the non-interaction time
period (t0), methane is purged through the column. Finally, the actual retention time can be
written as tR-t0. Using this time interval, retention volume VN can be measured. The retention
volume is the volume of carrier gas required to elude the probe gases from the sample. The
flow rate ( CF ) of the carrier gas has a direct relationship with retention time and volume.
Carrier gas flow rate, 0
NC
R
VF
t t
(4.1)
Or simply, 0( )N C RV F t t (4.2)
A correction factor known as the James-martin correction factor (j) is used to mitigate the
variation of VN due to the pressure drop and packing density.
CHAPTER 4
SURFACE ENERGY CHARACTERISATION OF DIFFERENT
POROUS ADSORBENTS BY INVERSE GAS CHROMATOGRAPHY
78 | P a g e
Where,
2
3
( ) 13
2( ) 1
IN
OUT
IN
OUT
P
Pj
P
P
(4.3)
here, INP and OUTP are the inlet and outlet pressure of the probe gases, respectively.
So, 0( )N C RV j F t t (4.4)
Sometimes, the retention volume can be written as the form of specific retention volume 0
gV
(ml.g-1) at 273.5K.
0
0
273.15( ) ( )g C R
s
jV F t t
m K (4.5)
According to thermodynamic, the interaction between adsorbate and adsorbent can be written as
follows:
0 0 lnads des NG G RT V C (4.6)
where, 0
adsG and 0
desG are the changes of molar gas free energy for adsorption and desorption
process, R is the gas constant (8.314 J K-1), and T is the absolute temperature (K). The constant C
represents the constant due to the differences of reference states. The two components of surface
energies (Dispersive and Specific) constitute the Gibbs free energy of adsorption ( 0
adsG ) [129].
Therefore, 0 D SP
ads ads adsG G G (4.7)
When only alkanes are used, it is assumed that there is no significant interaction due to specific
components,
so, 0 D
ads adsG G ( SP
adsG =0) (4.8)
In this case, the quantity of Gibbs free energy depends on the number of carbon molecules that
existed in the alkane probe molecule [126]. So, the free energy of adsorption can be written as:
0
ads A cross AG N a W (4.9)
where AN represents the Avogadro’s number (mol-1), crossa is the cross-sectional area of the
alkane probe molecule (m2) and AW is the work of adhesion (mJ.m-2). The work of adhesion has an
explicit relationship with the surface energy, especially with the dispersive surface energies of the
interacting surfaces[130].
2 D D
A S lW (4.10)
Where, D
S is the dispersive surface energy (mJ.m-2) of solid and D
l is the dispersive surface
energy (mJ.m-2) of probe molecules. Using Eq. (4.6), Eq. (4.9) and Eq. (4.10) it can be written as
follows:
CHAPTER 4
SURFACE ENERGY CHARACTERISATION OF DIFFERENT
POROUS ADSORBENTS BY INVERSE GAS CHROMATOGRAPHY
79 | P a g e
ln 2 D D
N A cross S lR T V N a C (4.11)
The equation (4.11) represents the relationship with experimentally found retention volume ( NV
) with the surface energy components. In classical thermodynamics, the reference state is three
dimensional, whereas the adsorption process is a surface-based phenomenon which is two dimensional.
The constant C represents the state difference constant, which is eliminated by taking the differences
between successive adsorption of alkanes. The slope of the plot . .ln NR T V as a function of D
la a
series of alkanes provides the quantitative value of dispersive surface energy ( D
S ) of the solid samples
kept in the stationary phase. The plot is also known as alkane line; it is further used for determining the
specific component of the surface energy (Schultz method) [131]. When the polar probe is used, the
points of the Gibbs free energy of these probes do not lie on the alkane lines. The vertical distance
between these points with the alkane line indicates the specific component of the surface energy.
Another method of measuring surface energy is the Dorris-Gray method, which is based on the
fact that the free energy of alkanes varies in a linear way with the number of carbon atom[132]. Here,
the slope of a plot between Gibbs free energy with carbon number provides the free energy component
of one methyl molecule, and it is assumed that the Gibbs free energy of desorption of each methylene
group is equal to the work of adhesion between the solid phase and mobile phase (hydrocarbon).
Hence, 1 2 4
2
2 2
( )
( ). .ln
n n
n n
C HCH Nads C H
N
VG K T
V
(4.12)
And the equation (4.10) can be written as, 2 2
2 D D
CH S CHW (4.13)
Similar to the equation (4.9) it can be presented as follows:
2 2
0
CH A CH AG N a W (4.14)
Finally, the dispersive surface energy of the stationary phase (solid) can be written as:
2
2 2
0
21.( )
4 .
CHD
S D
CH A CH
G
N a
(4.15)
The specific component can be measured from the Schultz method using the Von Oss, Chaudhury
and Good (vOCG) approach, where the specific free energy of two monopolar probes is used. The
equation of calculating the specific surface energy is as follows:
. .2( )S
A cross l s l sG N a (4.16)
The base and acidic parameters are measured respectively from the SG values of two different
monopolar polar probes. The equation (4.16) is reduced by Owens and Wendt by taking the two
distinguish monopolar acidic (dichloromethane) and basic (ethyl acetate) [133].
CHAPTER 4
SURFACE ENERGY CHARACTERISATION OF DIFFERENT
POROUS ADSORBENTS BY INVERSE GAS CHROMATOGRAPHY
80 | P a g e
2. .SP
s s s
(4.17)
However, the specific surface energy of the stationary is sensitive in selecting the reference
polarity. In the vOCG approach, the reference used is water, where : ratio becomes equal to unity
because of the amphoteric nature of water. This leads to the cause of “basicity catastrophe” [134]. To
mitigate the problem, Della Volpe and Shiboni et al. [135] suggested a new scale considering water as
acidic rather than amphoteric. Therefore, the scale of acidity to basicity creates a problem of identifying
the mono-polarity of the probes, which leads the measurement of specific surface energy to only use in
comparison rather than quantifying.
From the Dorris-Gray method, it is not possible to measure the specific surface energy; for this
purpose, the polarization method is used [136]. The polarizability ( ) of a molecule is a microscopic
phenomenon, which has two components; (i) electronic polarizability ( e ) and (ii) atomic polarizability
( a ). The atomic polarizability is comparatively very small, which is often neglected in that case
e , which has a relationship with macroscopic molar deformation polarization ( DP , cm3.mol-1).
Here,
2
2
4 1
3 2D e
n MP N
n
(4.18)
where M and n are the molar mass (g.mol-1), the molar volume (cm3g-1) and the refractive
index, respectively. These values are measurable and identical for a particular probe. For example,
corresponding values of M, and n for n-heptane are 100.21 g mol-1, 0.6838 cm3 g-1 and 1.3876,
respectively [136]. The molar deformation polarization ( DP ) can be related with the RT.ln (VN) with
the following equation:
1 2ln ( )SP
N Dl DSRT V C C P P G (4.19)
where C1 and C2 are two constants relating to similar reference states and DlP DSP are the molar
deformation polarization of probe and the stationary phase, respectively. If the alkanes are used for
analysis, the specific attraction ( SPG ) is negligible. In that case, the equation (4.19) can be written as:
1 2ln N Dl DSRT V C C P P (4.20)
The plot ln NRT V as a function of DlP forms a straight line and the slope of the plot is equal to
2 DSC P which is proportional to the alkane lines presented in the equation (4.11). In the case of polar
probes, the values ln NRT V result from both the dispersive and specific interactions. Therefore, the
vertical distance between the ln NRT V point to the straight line indicates the specific component of the
Gibbs free energy due to the interaction between the polar probe and the stationary phase.
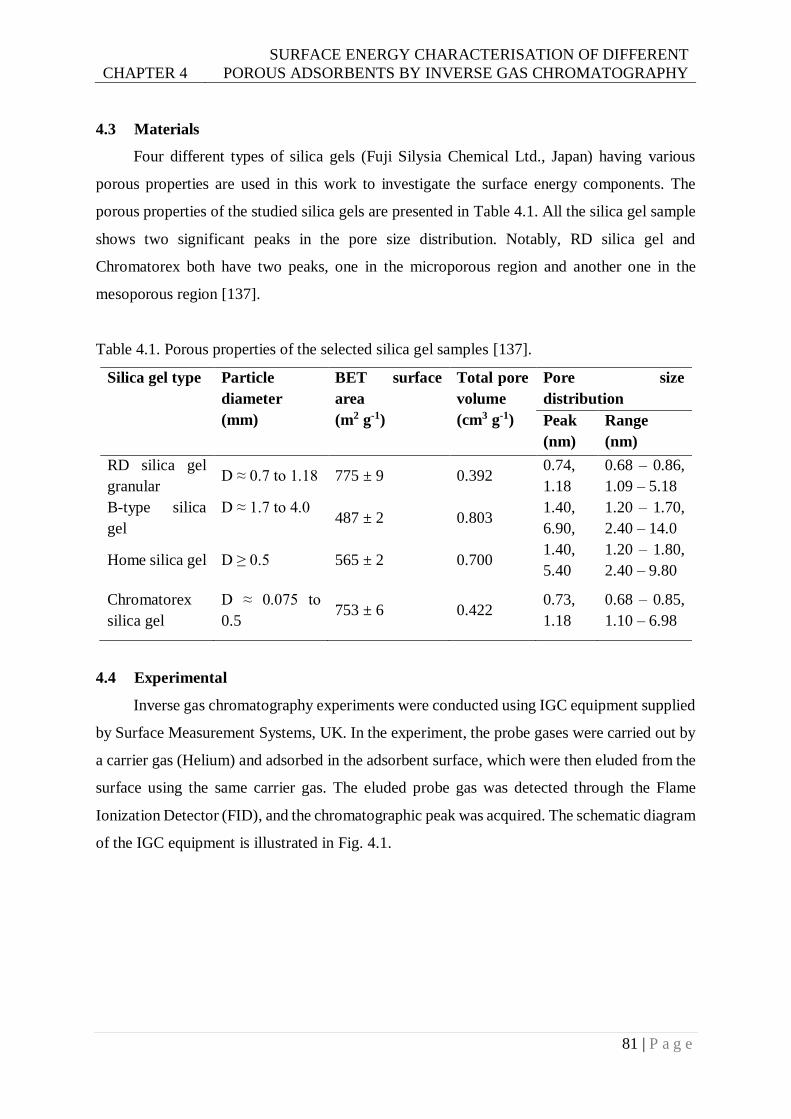
CHAPTER 4
SURFACE ENERGY CHARACTERISATION OF DIFFERENT
POROUS ADSORBENTS BY INVERSE GAS CHROMATOGRAPHY
81 | P a g e
4.3 Materials
Four different types of silica gels (Fuji Silysia Chemical Ltd., Japan) having various
porous properties are used in this work to investigate the surface energy components. The
porous properties of the studied silica gels are presented in Table 4.1. All the silica gel sample
shows two significant peaks in the pore size distribution. Notably, RD silica gel and
Chromatorex both have two peaks, one in the microporous region and another one in the
mesoporous region [137].
Table 4.1. Porous properties of the selected silica gel samples [137].
Silica gel type Particle
diameter
(mm)
BET surface
area
(m2 g-1)
Total pore
volume
(cm3 g-1)
Pore size
distribution
Peak
(nm)
Range
(nm)
RD silica gel
granular D ≈ 0.7 to 1.18 775 ± 9 0.392
0.74,
1.18
0.68 – 0.86,
1.09 – 5.18
B-type silica
gel
D ≈ 1.7 to 4.0 487 ± 2 0.803
1.40,
6.90,
1.20 – 1.70,
2.40 – 14.0
Home silica gel D ≥ 0.5 565 ± 2 0.700 1.40,
5.40
1.20 – 1.80,
2.40 – 9.80
Chromatorex
silica gel
D ≈ 0.075 to
0.5 753 ± 6 0.422
0.73,
1.18
0.68 – 0.85,
1.10 – 6.98
4.4 Experimental
Inverse gas chromatography experiments were conducted using IGC equipment supplied
by Surface Measurement Systems, UK. In the experiment, the probe gases were carried out by
a carrier gas (Helium) and adsorbed in the adsorbent surface, which were then eluded from the
surface using the same carrier gas. The eluded probe gas was detected through the Flame
Ionization Detector (FID), and the chromatographic peak was acquired. The schematic diagram
of the IGC equipment is illustrated in Fig. 4.1.
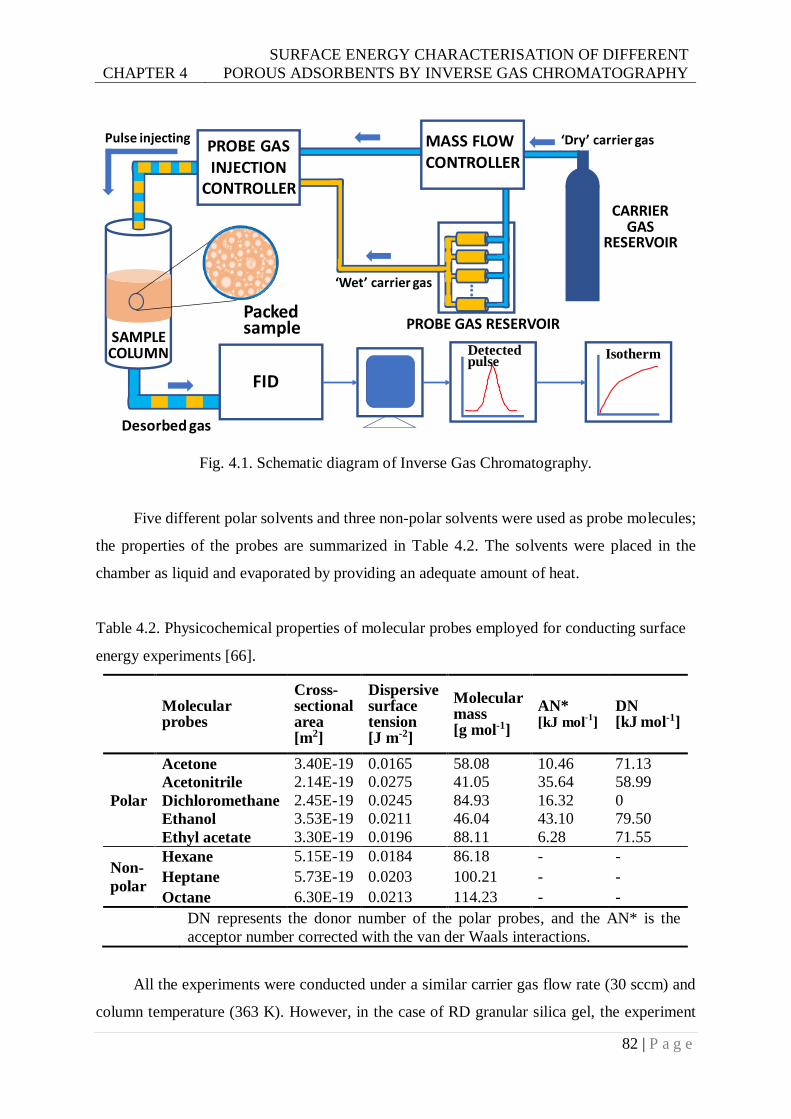
CHAPTER 4
SURFACE ENERGY CHARACTERISATION OF DIFFERENT
POROUS ADSORBENTS BY INVERSE GAS CHROMATOGRAPHY
82 | P a g e
Fig. 4.1. Schematic diagram of Inverse Gas Chromatography.
Five different polar solvents and three non-polar solvents were used as probe molecules;
the properties of the probes are summarized in Table 4.2. The solvents were placed in the
chamber as liquid and evaporated by providing an adequate amount of heat.
Table 4.2. Physicochemical properties of molecular probes employed for conducting surface
energy experiments [66].
Molecular probes
Cross-sectional area [m2]
Dispersive surface tension [J m-2]
Molecular mass [g mol-1]
AN* [kJ mol
-1]
DN [kJ mol-1]
Polar
Acetone 3.40E-19 0.0165 58.08 10.46 71.13
Acetonitrile 2.14E-19 0.0275 41.05 35.64 58.99
Dichloromethane 2.45E-19 0.0245 84.93 16.32 0
Ethanol 3.53E-19 0.0211 46.04 43.10 79.50
Ethyl acetate 3.30E-19 0.0196 88.11 6.28 71.55
Non-
polar
Hexane 5.15E-19 0.0184 86.18 - -
Heptane 5.73E-19 0.0203 100.21 - -
Octane 6.30E-19 0.0213 114.23 - -
DN represents the donor number of the polar probes, and the AN* is the
acceptor number corrected with the van der Waals interactions.
All the experiments were conducted under a similar carrier gas flow rate (30 sccm) and
column temperature (363 K). However, in the case of RD granular silica gel, the experiment
MASS FLOW CONTROLLER
PROBE GAS INJECTION
CONTROLLER
‘Dry’ carrier gas
‘Wet’ carrier gas
Pulse injecting
FID
Detected pulse
Isotherm
Desorbed gas
Packed sample
SAMPLECOLUMN
PROBE GAS RESERVOIR
CARRIER GAS
RESERVOIR
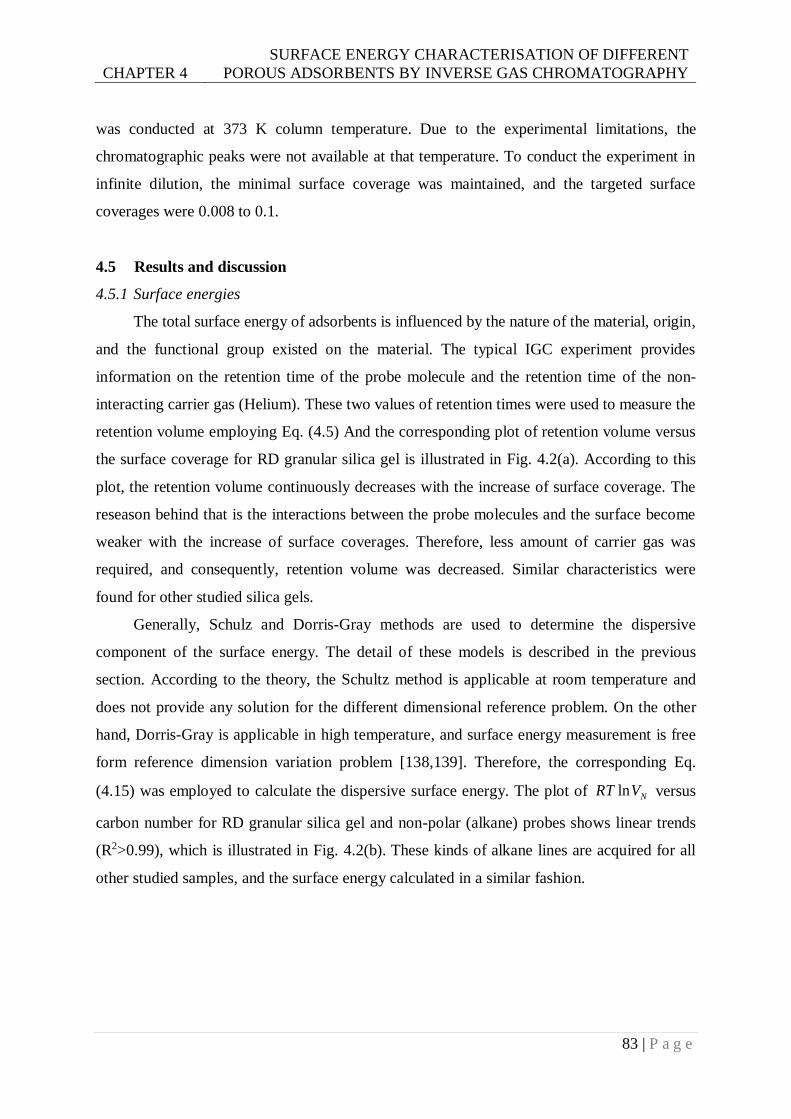
CHAPTER 4
SURFACE ENERGY CHARACTERISATION OF DIFFERENT
POROUS ADSORBENTS BY INVERSE GAS CHROMATOGRAPHY
83 | P a g e
was conducted at 373 K column temperature. Due to the experimental limitations, the
chromatographic peaks were not available at that temperature. To conduct the experiment in
infinite dilution, the minimal surface coverage was maintained, and the targeted surface
coverages were 0.008 to 0.1.
4.5 Results and discussion
4.5.1 Surface energies
The total surface energy of adsorbents is influenced by the nature of the material, origin,
and the functional group existed on the material. The typical IGC experiment provides
information on the retention time of the probe molecule and the retention time of the non-
interacting carrier gas (Helium). These two values of retention times were used to measure the
retention volume employing Eq. (4.5) And the corresponding plot of retention volume versus
the surface coverage for RD granular silica gel is illustrated in Fig. 4.2(a). According to this
plot, the retention volume continuously decreases with the increase of surface coverage. The
reseason behind that is the interactions between the probe molecules and the surface become
weaker with the increase of surface coverages. Therefore, less amount of carrier gas was
required, and consequently, retention volume was decreased. Similar characteristics were
found for other studied silica gels.
Generally, Schulz and Dorris-Gray methods are used to determine the dispersive
component of the surface energy. The detail of these models is described in the previous
section. According to the theory, the Schultz method is applicable at room temperature and
does not provide any solution for the different dimensional reference problem. On the other
hand, Dorris-Gray is applicable in high temperature, and surface energy measurement is free
form reference dimension variation problem [138,139]. Therefore, the corresponding Eq.
(4.15) was employed to calculate the dispersive surface energy. The plot of ln NRT V versus
carbon number for RD granular silica gel and non-polar (alkane) probes shows linear trends
(R2>0.99), which is illustrated in Fig. 4.2(b). These kinds of alkane lines are acquired for all
other studied samples, and the surface energy calculated in a similar fashion.
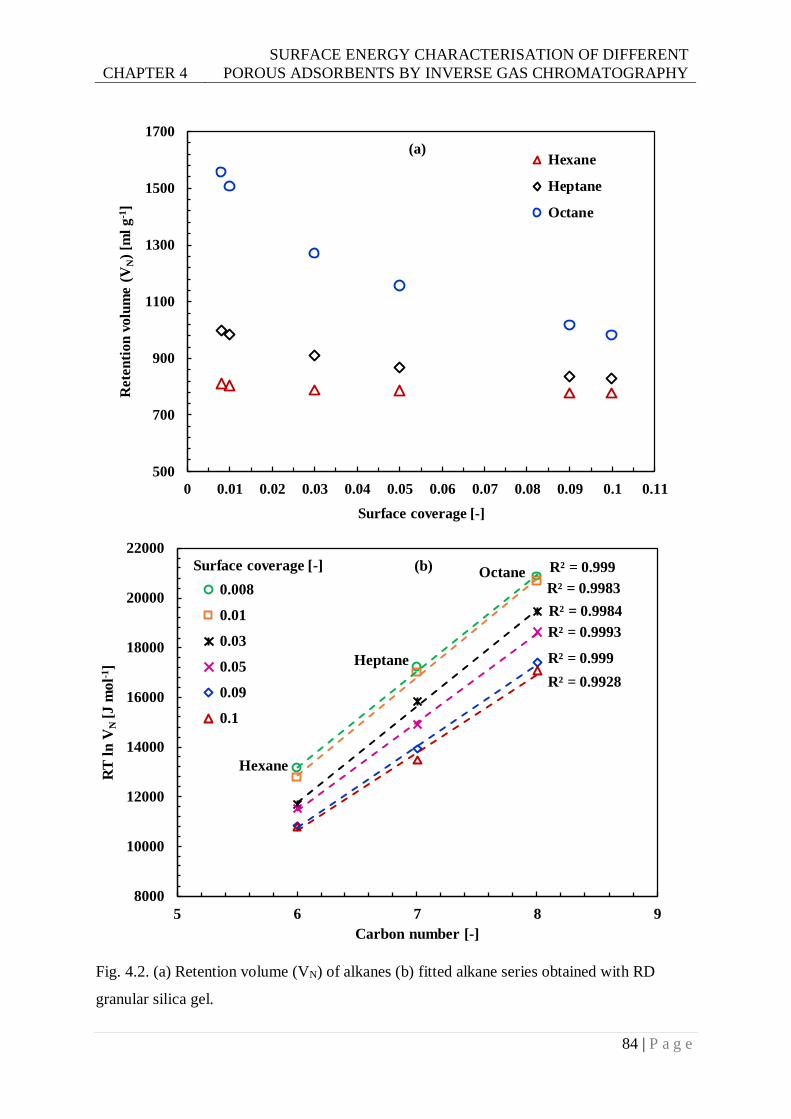
CHAPTER 4
SURFACE ENERGY CHARACTERISATION OF DIFFERENT
POROUS ADSORBENTS BY INVERSE GAS CHROMATOGRAPHY
84 | P a g e
Fig. 4.2. (a) Retention volume (VN) of alkanes (b) fitted alkane series obtained with RD
granular silica gel.
500
700
900
1100
1300
1500
1700
0 0.01 0.02 0.03 0.04 0.05 0.06 0.07 0.08 0.09 0.1 0.11
Rete
nti
on
volu
me (
VN
) [m
l g
-1]
Surface coverage [-]
Hexane
Heptane
Octane
(a)
R² = 0.999
R² = 0.9983
R² = 0.9984
R² = 0.9993
R² = 0.999
R² = 0.9928
8000
10000
12000
14000
16000
18000
20000
22000
5 6 7 8 9
RT
ln
VN
[J m
ol-1
]
Carbon number [-]
0.008
0.01
0.03
0.05
0.09
0.1
Surface coverage [-]
Hexane
Heptane
Octane(b)
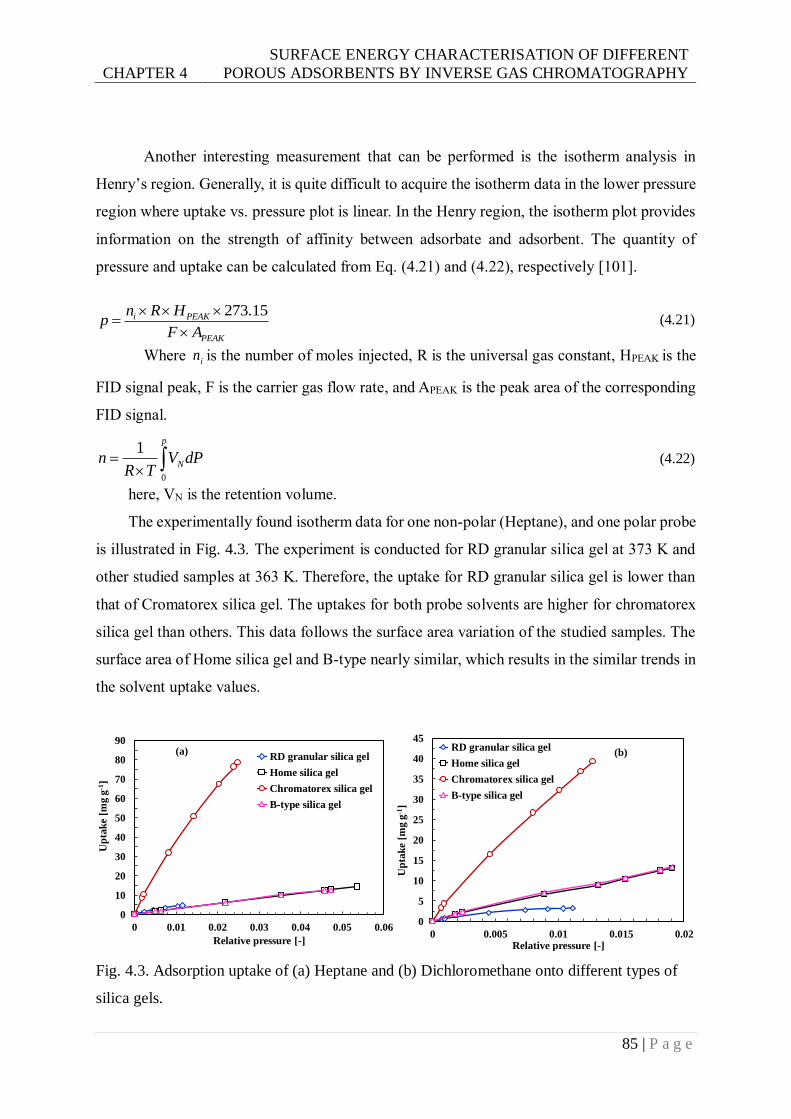
CHAPTER 4
SURFACE ENERGY CHARACTERISATION OF DIFFERENT
POROUS ADSORBENTS BY INVERSE GAS CHROMATOGRAPHY
85 | P a g e
Another interesting measurement that can be performed is the isotherm analysis in
Henry’s region. Generally, it is quite difficult to acquire the isotherm data in the lower pressure
region where uptake vs. pressure plot is linear. In the Henry region, the isotherm plot provides
information on the strength of affinity between adsorbate and adsorbent. The quantity of
pressure and uptake can be calculated from Eq. (4.21) and (4.22), respectively [101].
273.15i PEAK
PEAK
n R Hp
F A
(4.21)
Where in is the number of moles injected, R is the universal gas constant, HPEAK is the
FID signal peak, F is the carrier gas flow rate, and APEAK is the peak area of the corresponding
FID signal.
0
1p
Nn V dPR T
(4.22)
here, VN is the retention volume.
The experimentally found isotherm data for one non-polar (Heptane), and one polar probe
is illustrated in Fig. 4.3. The experiment is conducted for RD granular silica gel at 373 K and
other studied samples at 363 K. Therefore, the uptake for RD granular silica gel is lower than
that of Cromatorex silica gel. The uptakes for both probe solvents are higher for chromatorex
silica gel than others. This data follows the surface area variation of the studied samples. The
surface area of Home silica gel and B-type nearly similar, which results in the similar trends in
the solvent uptake values.
Fig. 4.3. Adsorption uptake of (a) Heptane and (b) Dichloromethane onto different types of
silica gels.
0
10
20
30
40
50
60
70
80
90
0 0.01 0.02 0.03 0.04 0.05 0.06
Up
tak
e [m
g g
-1]
Relative pressure [-]
RD granular silica gel
Home silica gel
Chromatorex silica gel
B-type silica gel
0
5
10
15
20
25
30
35
40
45
0 0.005 0.01 0.015 0.02
Up
tak
e [m
g g
-1]
Relative pressure [-]
RD granular silica gel
Home silica gel
Chromatorex silica gel
B-type silica gel
(b)(a)
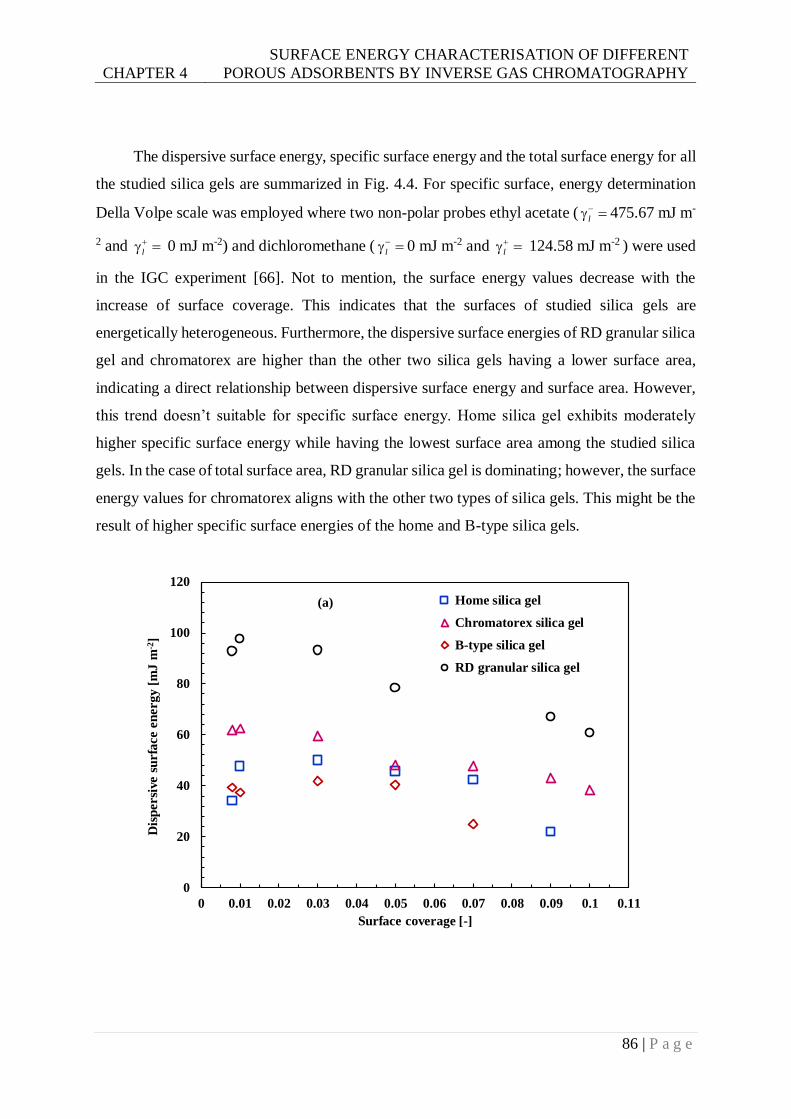
CHAPTER 4
SURFACE ENERGY CHARACTERISATION OF DIFFERENT
POROUS ADSORBENTS BY INVERSE GAS CHROMATOGRAPHY
86 | P a g e
The dispersive surface energy, specific surface energy and the total surface energy for all
the studied silica gels are summarized in Fig. 4.4. For specific surface, energy determination
Della Volpe scale was employed where two non-polar probes ethyl acetate (l
475.67 mJ m-
2 and l
0 mJ m-2) and dichloromethane (l
0 mJ m-2 and l
124.58 mJ m-2 ) were used
in the IGC experiment [66]. Not to mention, the surface energy values decrease with the
increase of surface coverage. This indicates that the surfaces of studied silica gels are
energetically heterogeneous. Furthermore, the dispersive surface energies of RD granular silica
gel and chromatorex are higher than the other two silica gels having a lower surface area,
indicating a direct relationship between dispersive surface energy and surface area. However,
this trend doesn’t suitable for specific surface energy. Home silica gel exhibits moderately
higher specific surface energy while having the lowest surface area among the studied silica
gels. In the case of total surface area, RD granular silica gel is dominating; however, the surface
energy values for chromatorex aligns with the other two types of silica gels. This might be the
result of higher specific surface energies of the home and B-type silica gels.
0
20
40
60
80
100
120
0 0.01 0.02 0.03 0.04 0.05 0.06 0.07 0.08 0.09 0.1 0.11
Dis
persi
ve s
urfa
ce e
nergy [
mJ m
-2]
Surface coverage [-]
Home silica gel
Chromatorex silica gel
B-type silica gel
RD granular silica gel
(a)
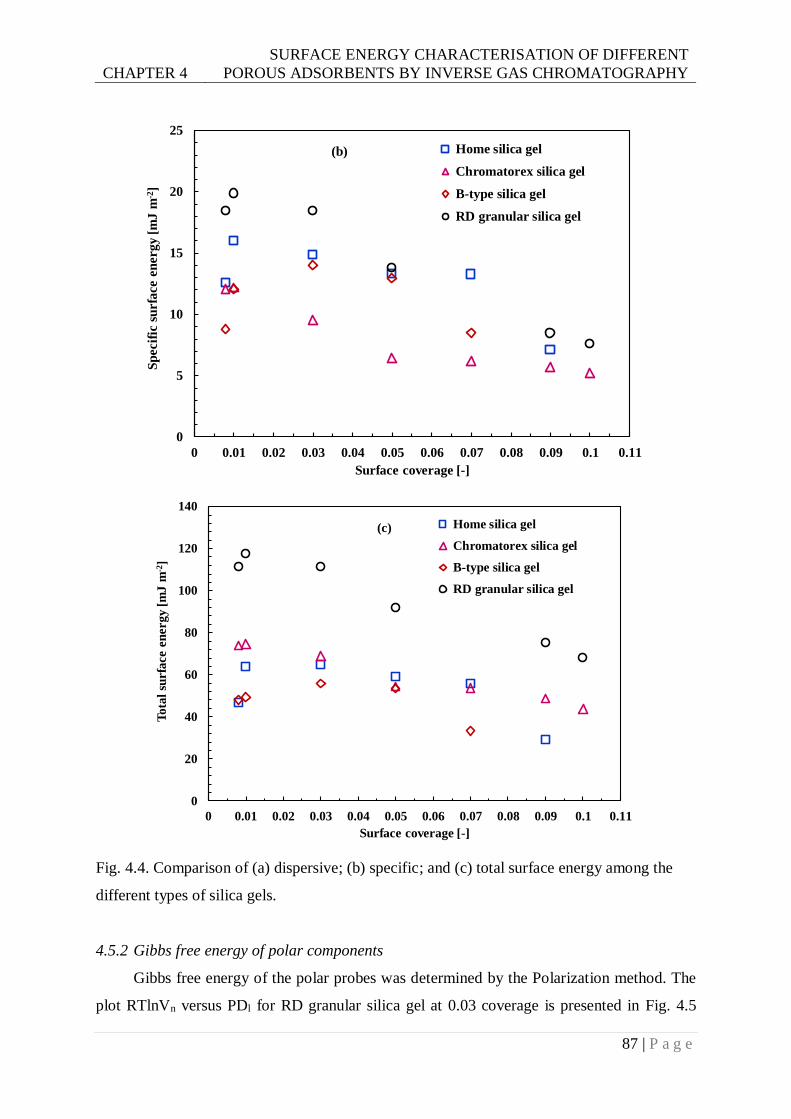
CHAPTER 4
SURFACE ENERGY CHARACTERISATION OF DIFFERENT
POROUS ADSORBENTS BY INVERSE GAS CHROMATOGRAPHY
87 | P a g e
Fig. 4.4. Comparison of (a) dispersive; (b) specific; and (c) total surface energy among the
different types of silica gels.
4.5.2 Gibbs free energy of polar components
Gibbs free energy of the polar probes was determined by the Polarization method. The
plot RTlnVn versus PDl for RD granular silica gel at 0.03 coverage is presented in Fig. 4.5
0
5
10
15
20
25
0 0.01 0.02 0.03 0.04 0.05 0.06 0.07 0.08 0.09 0.1 0.11
Sp
ecif
ic s
urfa
ce e
nergy [
mJ m
-2]
Surface coverage [-]
Home silica gel
Chromatorex silica gel
B-type silica gel
RD granular silica gel
(b)
0
20
40
60
80
100
120
140
0 0.01 0.02 0.03 0.04 0.05 0.06 0.07 0.08 0.09 0.1 0.11
To
tal
surfa
ce e
nerg
y [
mJ
m-2
]
Surface coverage [-]
Home silica gel
Chromatorex silica gel
B-type silica gel
RD granular silica gel
(c)
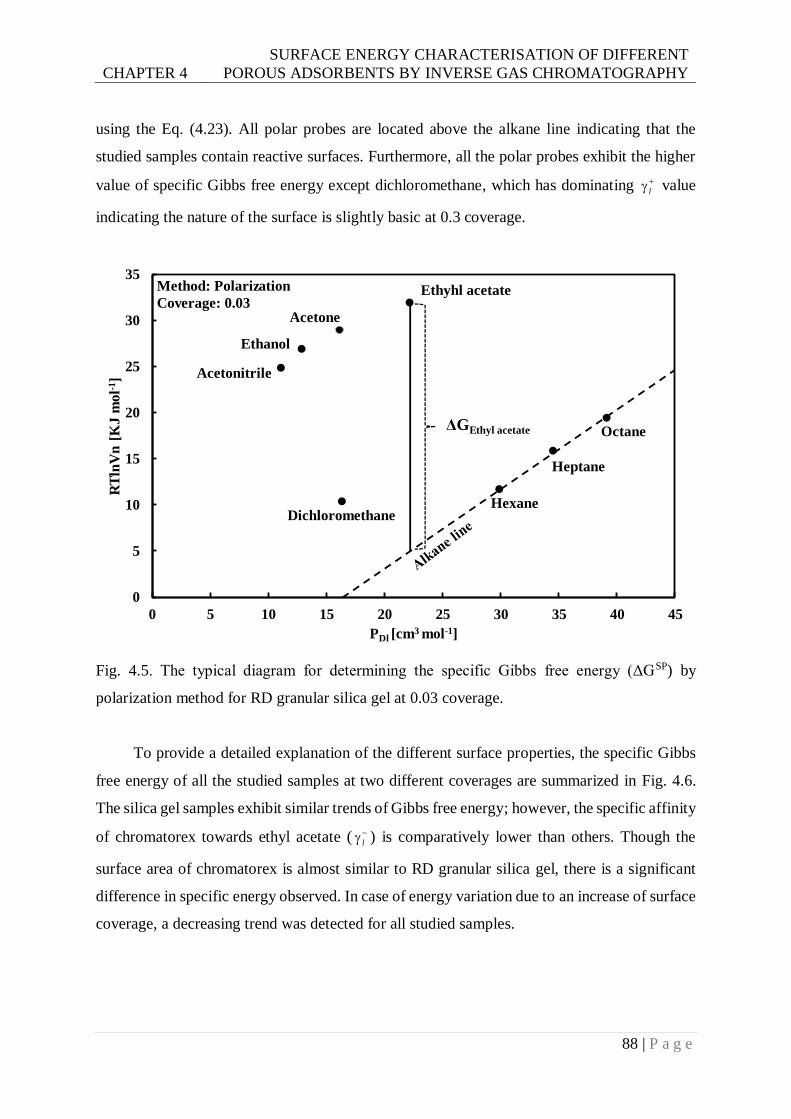
CHAPTER 4
SURFACE ENERGY CHARACTERISATION OF DIFFERENT
POROUS ADSORBENTS BY INVERSE GAS CHROMATOGRAPHY
88 | P a g e
using the Eq. (4.23). All polar probes are located above the alkane line indicating that the
studied samples contain reactive surfaces. Furthermore, all the polar probes exhibit the higher
value of specific Gibbs free energy except dichloromethane, which has dominating l
value
indicating the nature of the surface is slightly basic at 0.3 coverage.
Fig. 4.5. The typical diagram for determining the specific Gibbs free energy (ΔGSP) by
polarization method for RD granular silica gel at 0.03 coverage.
To provide a detailed explanation of the different surface properties, the specific Gibbs
free energy of all the studied samples at two different coverages are summarized in Fig. 4.6.
The silica gel samples exhibit similar trends of Gibbs free energy; however, the specific affinity
of chromatorex towards ethyl acetate ( l
) is comparatively lower than others. Though the
surface area of chromatorex is almost similar to RD granular silica gel, there is a significant
difference in specific energy observed. In case of energy variation due to an increase of surface
coverage, a decreasing trend was detected for all studied samples.
0
5
10
15
20
25
30
35
0 5 10 15 20 25 30 35 40 45
RT
lnV
n [
KJ m
ol-1
]
PDl [cm3 mol-1]
ΔGEthyl acetate
Hexane
Heptane
Octane
Dichloromethane
Acetonitrile
Ethanol
Acetone
Ethyhl acetateMethod: Polarization
Coverage: 0.03
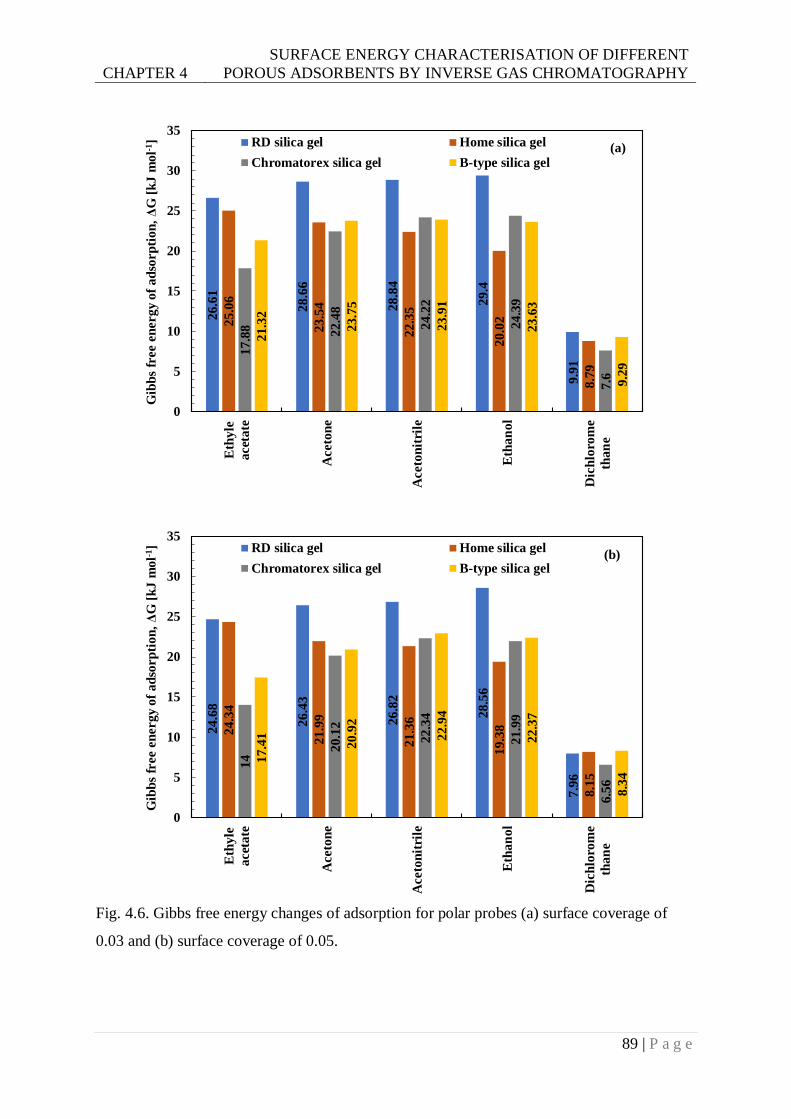
CHAPTER 4
SURFACE ENERGY CHARACTERISATION OF DIFFERENT
POROUS ADSORBENTS BY INVERSE GAS CHROMATOGRAPHY
89 | P a g e
Fig. 4.6. Gibbs free energy changes of adsorption for polar probes (a) surface coverage of
0.03 and (b) surface coverage of 0.05.
26.6
1
28
.66
28
.84
29
.4
9.9
1
25
.06
23.5
4
22.3
5
20.0
2
8.7
9
17.8
8 22.4
8
24
.22
24.3
9
7.6
21.3
2
23.7
5
23
.91
23.6
3
9.2
9
0
5
10
15
20
25
30
35
Eth
yle
acet
ate
Aceto
ne
Aceto
nit
rile
Eth
an
ol
Dic
hlo
rom
e
than
e
Gib
bs
free e
nergy o
f ad
sorp
tion
, Δ
G [
kJ m
ol-1
] RD silica gel Home silica gel
Chromatorex silica gel B-type silica gel(a)
24
.68
26.4
3
26.8
2
28.5
6
7.9
6
24.3
4
21.9
9
21.3
6
19.3
8
8.1
5
14
20
.12
22.3
4
21.9
9
6.5
6
17
.41
20.9
2
22
.94
22.3
7
8.3
4
0
5
10
15
20
25
30
35
Eth
yle
acet
ate
Aceto
ne
Aceto
nit
rile
Eth
an
ol
Dic
hlo
rom
e
than
e
Gib
bs
free e
nergy o
f ad
sorp
tion
, Δ
G [
kJ m
ol-1
] RD silica gel Home silica gel
Chromatorex silica gel B-type silica gel(b)
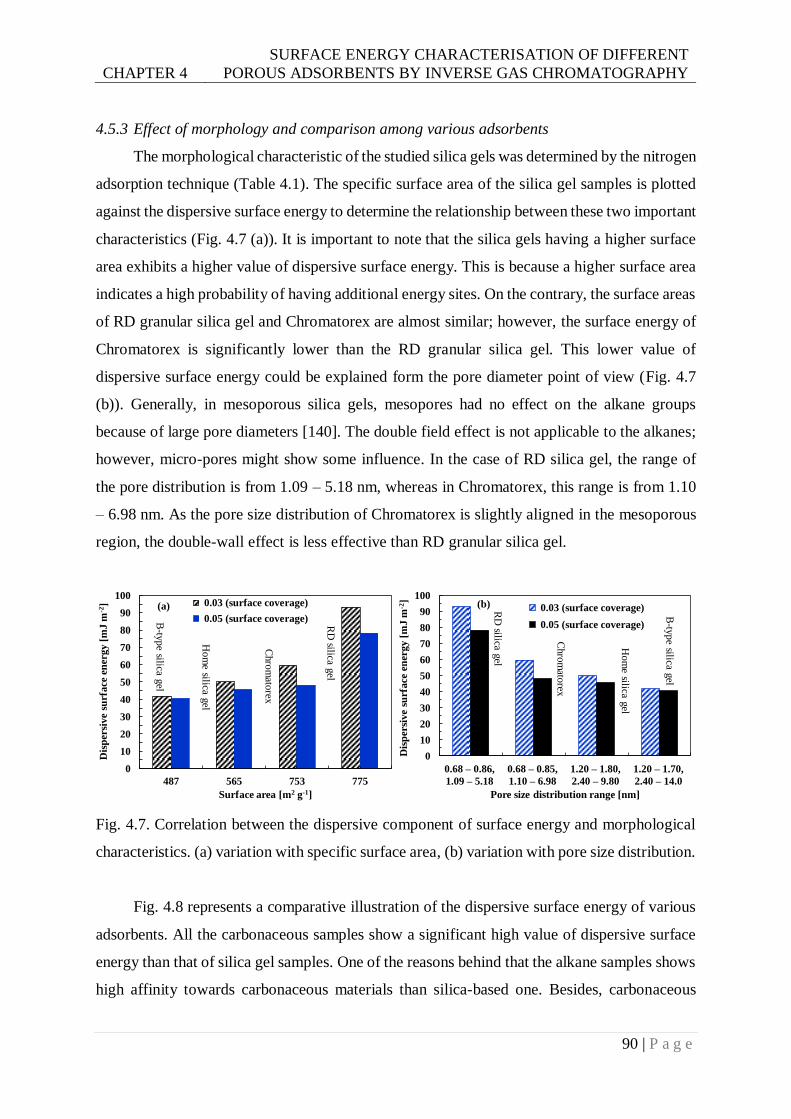
CHAPTER 4
SURFACE ENERGY CHARACTERISATION OF DIFFERENT
POROUS ADSORBENTS BY INVERSE GAS CHROMATOGRAPHY
90 | P a g e
4.5.3 Effect of morphology and comparison among various adsorbents
The morphological characteristic of the studied silica gels was determined by the nitrogen
adsorption technique (Table 4.1). The specific surface area of the silica gel samples is plotted
against the dispersive surface energy to determine the relationship between these two important
characteristics (Fig. 4.7 (a)). It is important to note that the silica gels having a higher surface
area exhibits a higher value of dispersive surface energy. This is because a higher surface area
indicates a high probability of having additional energy sites. On the contrary, the surface areas
of RD granular silica gel and Chromatorex are almost similar; however, the surface energy of
Chromatorex is significantly lower than the RD granular silica gel. This lower value of
dispersive surface energy could be explained form the pore diameter point of view (Fig. 4.7
(b)). Generally, in mesoporous silica gels, mesopores had no effect on the alkane groups
because of large pore diameters [140]. The double field effect is not applicable to the alkanes;
however, micro-pores might show some influence. In the case of RD silica gel, the range of
the pore distribution is from 1.09 – 5.18 nm, whereas in Chromatorex, this range is from 1.10
– 6.98 nm. As the pore size distribution of Chromatorex is slightly aligned in the mesoporous
region, the double-wall effect is less effective than RD granular silica gel.
Fig. 4.7. Correlation between the dispersive component of surface energy and morphological
characteristics. (a) variation with specific surface area, (b) variation with pore size distribution.
Fig. 4.8 represents a comparative illustration of the dispersive surface energy of various
adsorbents. All the carbonaceous samples show a significant high value of dispersive surface
energy than that of silica gel samples. One of the reasons behind that the alkane samples shows
high affinity towards carbonaceous materials than silica-based one. Besides, carbonaceous
0
10
20
30
40
50
60
70
80
90
100
487 565 753 775
Dis
per
siv
e su
rfa
ce e
ner
gy [
mJ
m-2
]
Surface area [m2 g-1]
0.03 (surface coverage)
0.05 (surface coverage) RD
silica gel
Chro
mato
rex
B-ty
pe silica g
el
Ho
me silica g
el
(a)
0
10
20
30
40
50
60
70
80
90
100
0.68 – 0.86,
1.09 – 5.18
0.68 – 0.85,
1.10 – 6.98
1.20 – 1.80,
2.40 – 9.80
1.20 – 1.70,
2.40 – 14.0
Dis
per
siv
e su
rfa
ce e
ner
gy [
mJ
m-2
]
Pore size distribution range [nm]
0.03 (surface coverage)
0.05 (surface coverage)
RD
silica gel
Chro
mato
rex
Ho
me silica g
el
B-ty
pe silica g
el
(b)
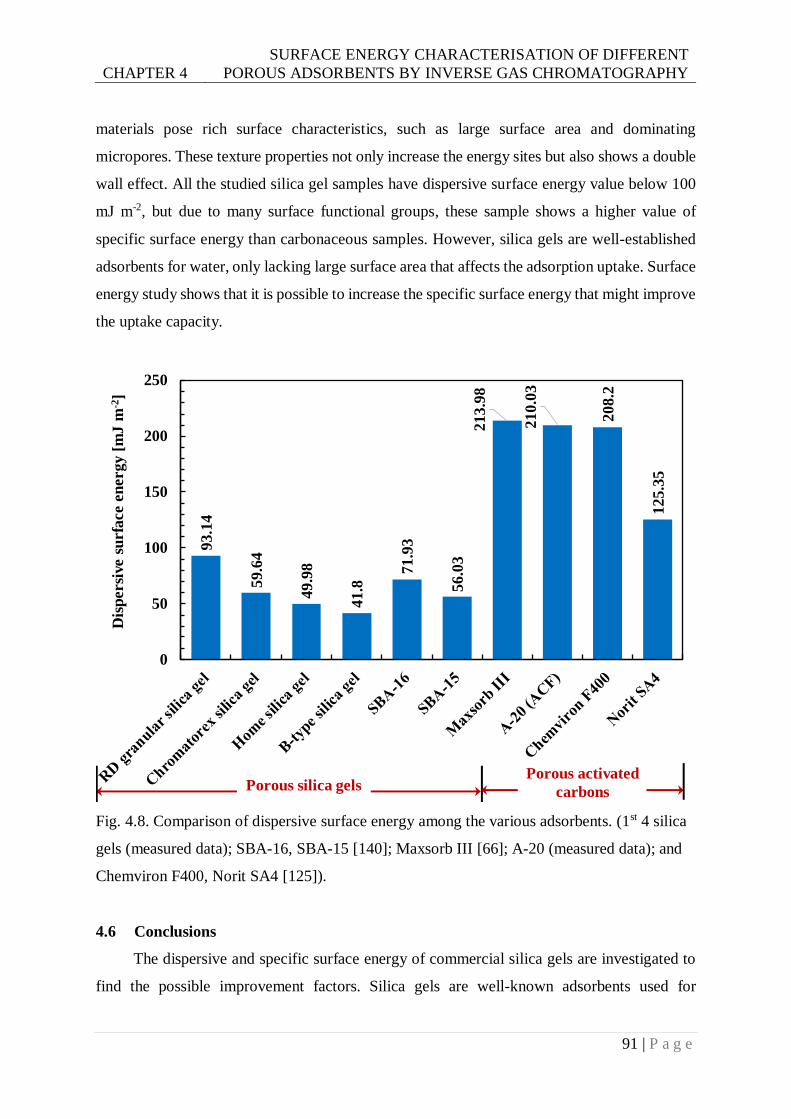
CHAPTER 4
SURFACE ENERGY CHARACTERISATION OF DIFFERENT
POROUS ADSORBENTS BY INVERSE GAS CHROMATOGRAPHY
91 | P a g e
materials pose rich surface characteristics, such as large surface area and dominating
micropores. These texture properties not only increase the energy sites but also shows a double
wall effect. All the studied silica gel samples have dispersive surface energy value below 100
mJ m-2, but due to many surface functional groups, these sample shows a higher value of
specific surface energy than carbonaceous samples. However, silica gels are well-established
adsorbents for water, only lacking large surface area that affects the adsorption uptake. Surface
energy study shows that it is possible to increase the specific surface energy that might improve
the uptake capacity.
Fig. 4.8. Comparison of dispersive surface energy among the various adsorbents. (1st 4 silica
gels (measured data); SBA-16, SBA-15 [140]; Maxsorb III [66]; A-20 (measured data); and
Chemviron F400, Norit SA4 [125]).
4.6 Conclusions
The dispersive and specific surface energy of commercial silica gels are investigated to
find the possible improvement factors. Silica gels are well-known adsorbents used for
93
.14
59.6
4
49
.98
41
.8
71
.93
56.0
3
213
.98
21
0.0
3
20
8.2
12
5.3
50
50
100
150
200
250
Dis
persi
ve s
urfa
ce e
nerg
y [
mJ
m-2
]
Porous silica gelsPorous activated
carbons
CHAPTER 4
SURFACE ENERGY CHARACTERISATION OF DIFFERENT
POROUS ADSORBENTS BY INVERSE GAS CHROMATOGRAPHY
92 | P a g e
multifarious applications; however, due to moderate surface area, adsorption uptake is not
good. This study shows that the dispersive component of the surface energy is implicitly
correlated to texture properties like surface area and pore size distribution. RD silica gel has a
higher value of surface energy components. However, chromatorex, while having a similar
surface texture of RD silica gel, shows significantly lower values of surface components. A
possible explanation of the lower surface energy is the domination of mesoporous pores in
chromatorex rather than that of RD silica gel. In this study, the additional adsorption isotherms
at Henry region are presented to find the molecular affinity between the adsorbate and
adsorbent molecules. The specific Gibbs free energy for all studied silica gel also presented to
determine the surface activities. The specific Gibbs free energies for all the probe solvents have
almost similar trends for all studied silica gels where the dispersive surface energy varies
significantly. This finding reveals the crucial information to improve the surface characteristics
of silica gel for further development. It is expected that by increasing the specific surface
energy, it is possible to improve the adsorption uptake where there is a limitation of increasing
the specific surface area.
93 | P a g e
Chapter 5
Experimental Investigation of Adsorption
Isotherms and Heat of Adsorption at Henry
Region for Activated Carbon/Ethanol Pairs Equation Chapter 5 Section 1
This chapter presents a thermodynamic formulation to capture the relationship between
the adsorption interaction energy and adsorbent-morphological property, which can be further
extended into surface coverage. Employing the inverse gas chromatography method, the
adsorbate uptakes are measured in Henry’s law region, from which the energetic behaviors of
a single component adsorbate-adsorbent system are calculated in terms of the enthalpy and the
entropy of adsorbed phase in very low pressures. A thermodynamic trend is established
between the specific entropy and Henry’s law constant, including the pore volume of
adsorbents, and one can predict the isosteric heats and adsorbent’s pore size for activated
carbon + ethanol system by extending the proposed linear trend. These findings could
significantly contribute to tailoring the adsorbent materials for the design of an adsorption bed
with a minimal or maximum driving force depending on the types of heat transformation
applications.
5.1 Introduction
Isosteric heat at Henry region provides the necessary information about the optimum pore
size to which the adsorbate molecules adsorb most strongly [122]. At the Henry region, the
partial pressure of the adsorbate is very low, which results in a low concentration of adsorbate
molecules. As there are fewer adsorbate molecules, the adsorbate-adsorbate interaction can be
considered negligible when compared with the adsorbent/adsorbate interaction. Moreover,
every adsorbate molecule gets an equal opportunity to explore the adsorbent surface without
any effect of its surroundings before adsorbing onto one of the high energy sites [141].
Therefore, the isotherm in the Henry region shows a linear relationship between the adsorption
uptake and the partial pressure of the adsorbate gas, where the slope of the line is defined as
the Henry constant [142]. In other words, Henry constant is the fundamental parameter that
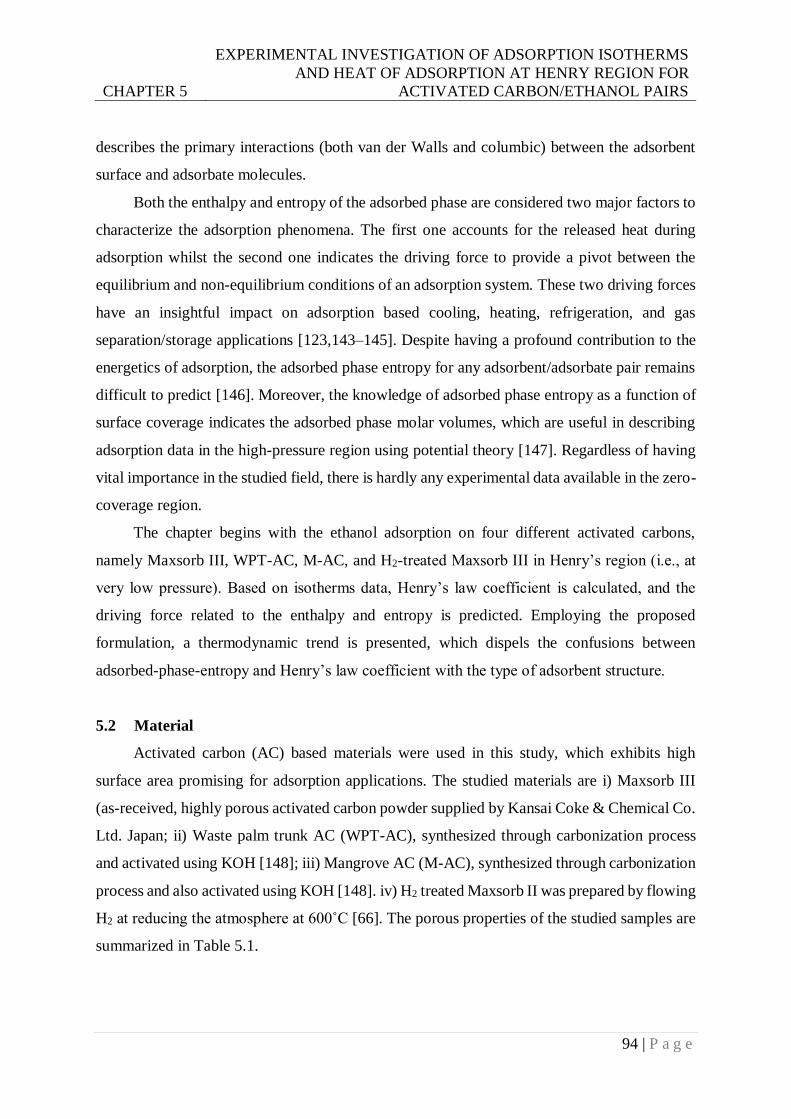
CHAPTER 5
EXPERIMENTAL INVESTIGATION OF ADSORPTION ISOTHERMS
AND HEAT OF ADSORPTION AT HENRY REGION FOR
ACTIVATED CARBON/ETHANOL PAIRS
94 | P a g e
describes the primary interactions (both van der Walls and columbic) between the adsorbent
surface and adsorbate molecules.
Both the enthalpy and entropy of the adsorbed phase are considered two major factors to
characterize the adsorption phenomena. The first one accounts for the released heat during
adsorption whilst the second one indicates the driving force to provide a pivot between the
equilibrium and non-equilibrium conditions of an adsorption system. These two driving forces
have an insightful impact on adsorption based cooling, heating, refrigeration, and gas
separation/storage applications [123,143–145]. Despite having a profound contribution to the
energetics of adsorption, the adsorbed phase entropy for any adsorbent/adsorbate pair remains
difficult to predict [146]. Moreover, the knowledge of adsorbed phase entropy as a function of
surface coverage indicates the adsorbed phase molar volumes, which are useful in describing
adsorption data in the high-pressure region using potential theory [147]. Regardless of having
vital importance in the studied field, there is hardly any experimental data available in the zero-
coverage region.
The chapter begins with the ethanol adsorption on four different activated carbons,
namely Maxsorb III, WPT-AC, M-AC, and H2-treated Maxsorb III in Henry’s region (i.e., at
very low pressure). Based on isotherms data, Henry’s law coefficient is calculated, and the
driving force related to the enthalpy and entropy is predicted. Employing the proposed
formulation, a thermodynamic trend is presented, which dispels the confusions between
adsorbed-phase-entropy and Henry’s law coefficient with the type of adsorbent structure.
5.2 Material
Activated carbon (AC) based materials were used in this study, which exhibits high
surface area promising for adsorption applications. The studied materials are i) Maxsorb III
(as-received, highly porous activated carbon powder supplied by Kansai Coke & Chemical Co.
Ltd. Japan; ii) Waste palm trunk AC (WPT-AC), synthesized through carbonization process
and activated using KOH [148]; iii) Mangrove AC (M-AC), synthesized through carbonization
process and also activated using KOH [148]. iv) H2 treated Maxsorb II was prepared by flowing
H2 at reducing the atmosphere at 600˚C [66]. The porous properties of the studied samples are
summarized in Table 5.1.
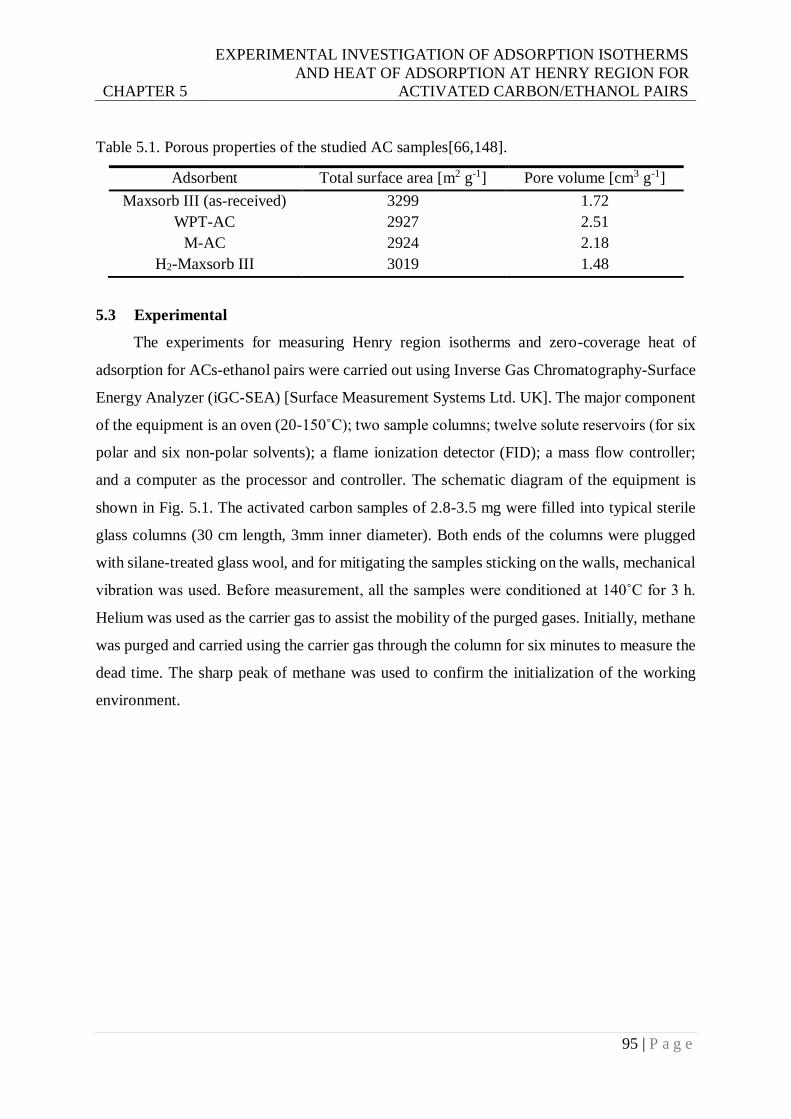
CHAPTER 5
EXPERIMENTAL INVESTIGATION OF ADSORPTION ISOTHERMS
AND HEAT OF ADSORPTION AT HENRY REGION FOR
ACTIVATED CARBON/ETHANOL PAIRS
95 | P a g e
Table 5.1. Porous properties of the studied AC samples[66,148].
Adsorbent Total surface area [m2 g-1] Pore volume [cm3 g-1]
Maxsorb III (as-received) 3299 1.72
WPT-AC 2927 2.51
M-AC 2924 2.18
H2-Maxsorb III 3019 1.48
5.3 Experimental
The experiments for measuring Henry region isotherms and zero-coverage heat of
adsorption for ACs-ethanol pairs were carried out using Inverse Gas Chromatography-Surface
Energy Analyzer (iGC-SEA) [Surface Measurement Systems Ltd. UK]. The major component
of the equipment is an oven (20-150˚C); two sample columns; twelve solute reservoirs (for six
polar and six non-polar solvents); a flame ionization detector (FID); a mass flow controller;
and a computer as the processor and controller. The schematic diagram of the equipment is
shown in Fig. 5.1. The activated carbon samples of 2.8-3.5 mg were filled into typical sterile
glass columns (30 cm length, 3mm inner diameter). Both ends of the columns were plugged
with silane-treated glass wool, and for mitigating the samples sticking on the walls, mechanical
vibration was used. Before measurement, all the samples were conditioned at 140˚C for 3 h.
Helium was used as the carrier gas to assist the mobility of the purged gases. Initially, methane
was purged and carried using the carrier gas through the column for six minutes to measure the
dead time. The sharp peak of methane was used to confirm the initialization of the working
environment.
CHAPTER 5
EXPERIMENTAL INVESTIGATION OF ADSORPTION ISOTHERMS
AND HEAT OF ADSORPTION AT HENRY REGION FOR
ACTIVATED CARBON/ETHANOL PAIRS
96 | P a g e
Fig. 5.1. Schematic diagram of IGC-SEA equipment.
The measurement condition for Henry isotherms and zero coverage heat of adsorption is
different. For isotherms measurement, Ethanol is first evaporated from the polar probe chamber
and carried to the FID detector through the sample column. During this process, ethanol is
adsorbed in the activated carbon samples and eventually eluded by helium gas. The ethanol
adsorption for all the studied samples was conducted at 303 K to 343 K temperatures. The
fractional surface coverage ( n/nm= 0.001 to 0.055) was taken as lowest as possible to
determine the isotherms at the Henry region. The corresponding relative pressure (P/P0) ranged
from 0 to 0.015. In the case of the heat of adsorption measurement, ethanol adsorption was
conducted for various temperature conditions (303 K to 373 K) at a wide range of fractional
coverage ranges from (m/nm= 0.1 to 0.5).
5.4 Results and discussion
5.4.1 Isotherms at Henry region
In the IGC experiment, the measurement can be configured in two ways; i) frontal ii)
pulse experiment. In the frontal experiment, a probe molecule is added continuously to the
carrier gas, whereas in pulse experiment, a single injection of a certain amount of vapor is
added with the carrier gas. The vapor is then transported to the IGC column, where it adsorbed
MASS FLOW CONTROLLER
PROBE GAS INJECTION
CONTROLLER
‘Dry’ carrier gas
‘Wet’ carrier gas
Pulse injecting
FID
Detected pulse
Desorbed gas
Packed sample
SAMPLECOLUMN
PROBE GAS RESERVOIR
CARRIER GAS
RESERVOIR
ANALYSIS UNIT
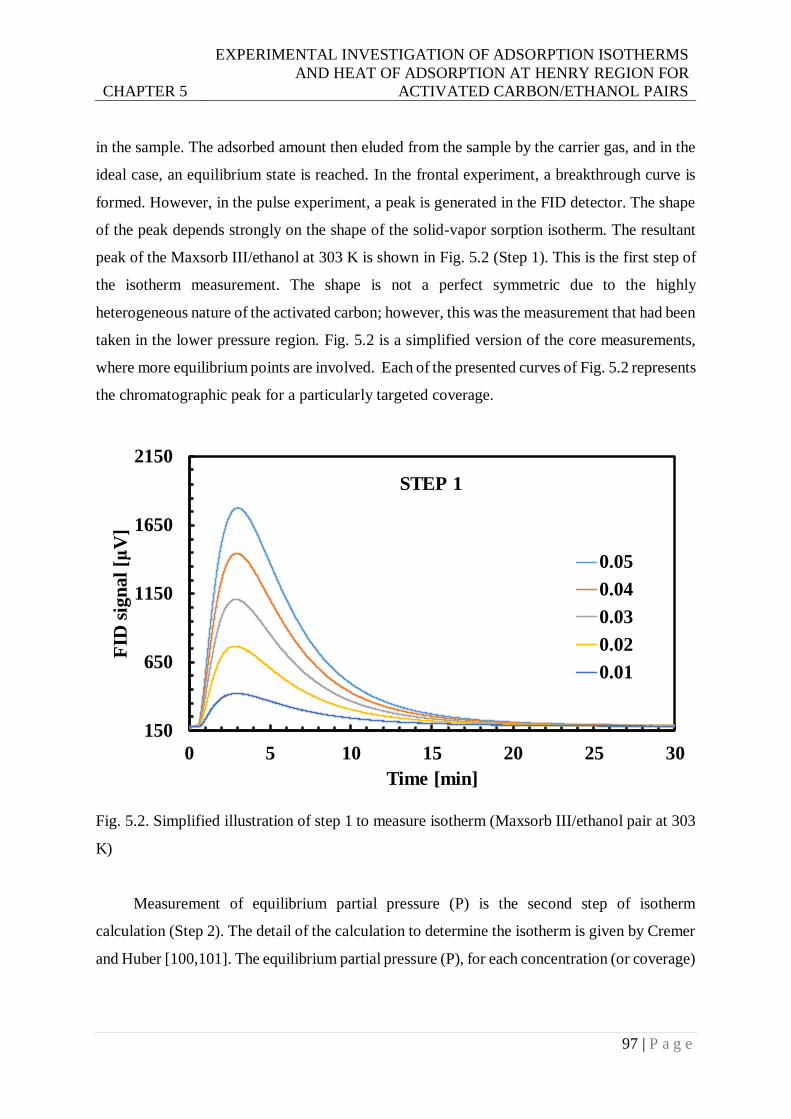
CHAPTER 5
EXPERIMENTAL INVESTIGATION OF ADSORPTION ISOTHERMS
AND HEAT OF ADSORPTION AT HENRY REGION FOR
ACTIVATED CARBON/ETHANOL PAIRS
97 | P a g e
in the sample. The adsorbed amount then eluded from the sample by the carrier gas, and in the
ideal case, an equilibrium state is reached. In the frontal experiment, a breakthrough curve is
formed. However, in the pulse experiment, a peak is generated in the FID detector. The shape
of the peak depends strongly on the shape of the solid-vapor sorption isotherm. The resultant
peak of the Maxsorb III/ethanol at 303 K is shown in Fig. 5.2 (Step 1). This is the first step of
the isotherm measurement. The shape is not a perfect symmetric due to the highly
heterogeneous nature of the activated carbon; however, this was the measurement that had been
taken in the lower pressure region. Fig. 5.2 is a simplified version of the core measurements,
where more equilibrium points are involved. Each of the presented curves of Fig. 5.2 represents
the chromatographic peak for a particularly targeted coverage.
Fig. 5.2. Simplified illustration of step 1 to measure isotherm (Maxsorb III/ethanol pair at 303
K)
Measurement of equilibrium partial pressure (P) is the second step of isotherm
calculation (Step 2). The detail of the calculation to determine the isotherm is given by Cremer
and Huber [100,101]. The equilibrium partial pressure (P), for each concentration (or coverage)
150
650
1150
1650
2150
0 5 10 15 20 25 30
FID
sig
na
l [μ
V]
Time [min]
0.05
0.04
0.03
0.02
0.01
STEP 1
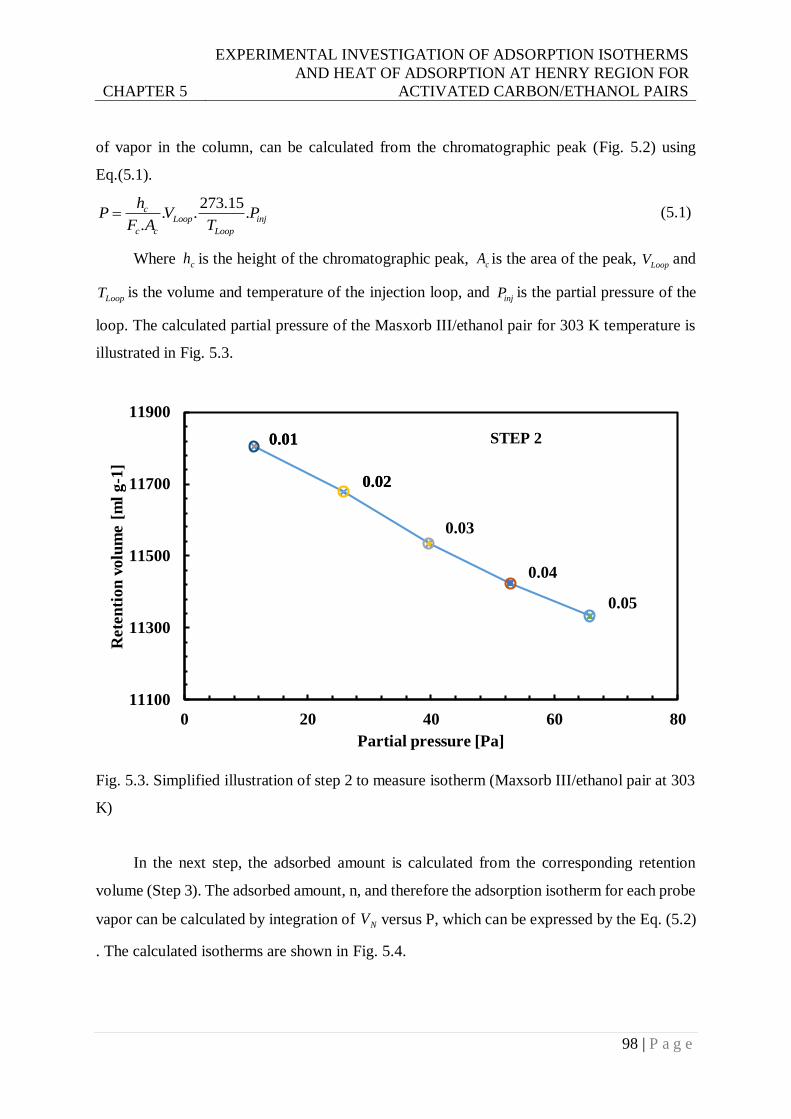
CHAPTER 5
EXPERIMENTAL INVESTIGATION OF ADSORPTION ISOTHERMS
AND HEAT OF ADSORPTION AT HENRY REGION FOR
ACTIVATED CARBON/ETHANOL PAIRS
98 | P a g e
of vapor in the column, can be calculated from the chromatographic peak (Fig. 5.2) using
Eq.(5.1).
273.15. . .
.
cLoop inj
c c Loop
hP V P
F A T (5.1)
Where ch is the height of the chromatographic peak, cA is the area of the peak, LoopV and
LoopT is the volume and temperature of the injection loop, and injP is the partial pressure of the
loop. The calculated partial pressure of the Masxorb III/ethanol pair for 303 K temperature is
illustrated in Fig. 5.3.
Fig. 5.3. Simplified illustration of step 2 to measure isotherm (Maxsorb III/ethanol pair at 303
K)
In the next step, the adsorbed amount is calculated from the corresponding retention
volume (Step 3). The adsorbed amount, n, and therefore the adsorption isotherm for each probe
vapor can be calculated by integration of NV versus P, which can be expressed by the Eq. (5.2)
. The calculated isotherms are shown in Fig. 5.4.
11100
11300
11500
11700
11900
0 20 40 60 80
Rete
nti
on
vo
lum
e [
ml
g-1
]
Partial pressure [Pa]
0.01
0.02
0.01
0.02
0.03
0.04
0.05
STEP 2
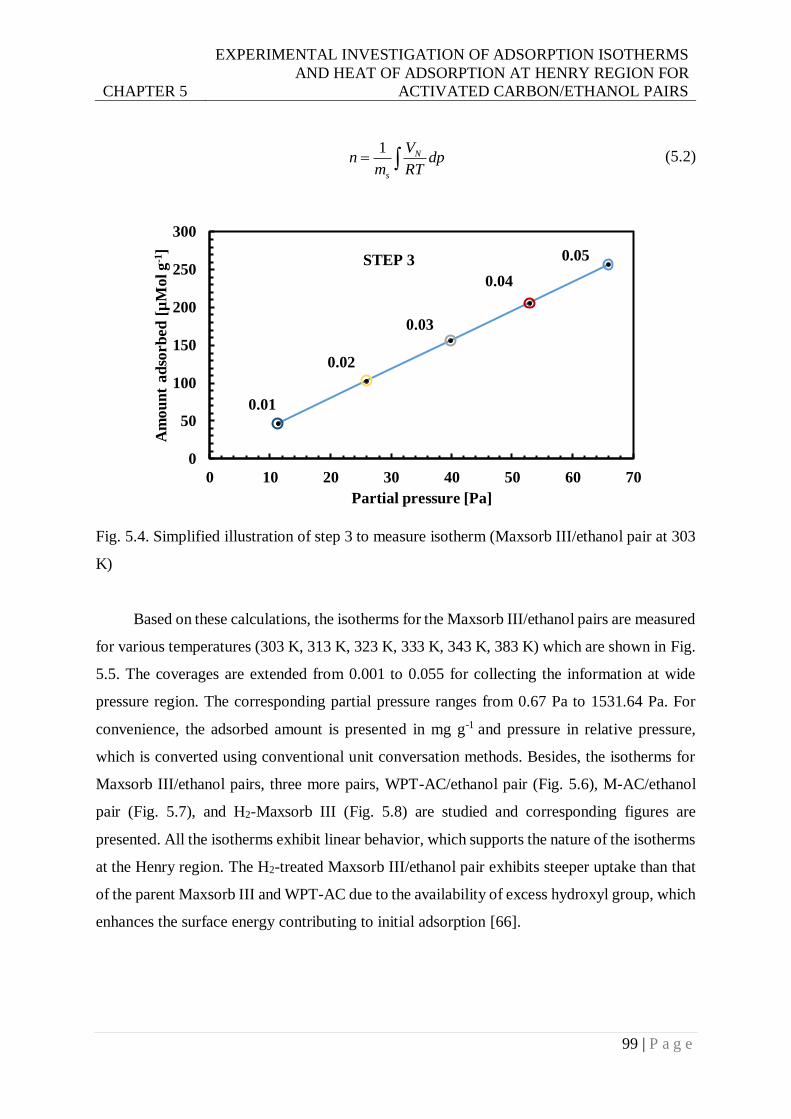
CHAPTER 5
EXPERIMENTAL INVESTIGATION OF ADSORPTION ISOTHERMS
AND HEAT OF ADSORPTION AT HENRY REGION FOR
ACTIVATED CARBON/ETHANOL PAIRS
99 | P a g e
1 N
s
Vn dp
m RT (5.2)
Fig. 5.4. Simplified illustration of step 3 to measure isotherm (Maxsorb III/ethanol pair at 303
K)
Based on these calculations, the isotherms for the Maxsorb III/ethanol pairs are measured
for various temperatures (303 K, 313 K, 323 K, 333 K, 343 K, 383 K) which are shown in Fig.
5.5. The coverages are extended from 0.001 to 0.055 for collecting the information at wide
pressure region. The corresponding partial pressure ranges from 0.67 Pa to 1531.64 Pa. For
convenience, the adsorbed amount is presented in mg g-1 and pressure in relative pressure,
which is converted using conventional unit conversation methods. Besides, the isotherms for
Maxsorb III/ethanol pairs, three more pairs, WPT-AC/ethanol pair (Fig. 5.6), M-AC/ethanol
pair (Fig. 5.7), and H2-Maxsorb III (Fig. 5.8) are studied and corresponding figures are
presented. All the isotherms exhibit linear behavior, which supports the nature of the isotherms
at the Henry region. The H2-treated Maxsorb III/ethanol pair exhibits steeper uptake than that
of the parent Maxsorb III and WPT-AC due to the availability of excess hydroxyl group, which
enhances the surface energy contributing to initial adsorption [66].
0
50
100
150
200
250
300
0 10 20 30 40 50 60 70
Am
ou
nt
ad
sorb
ed
[µ
Mol g
-1]
Partial pressure [Pa]
0.01
0.02
0.03
0.04
0.05STEP 3
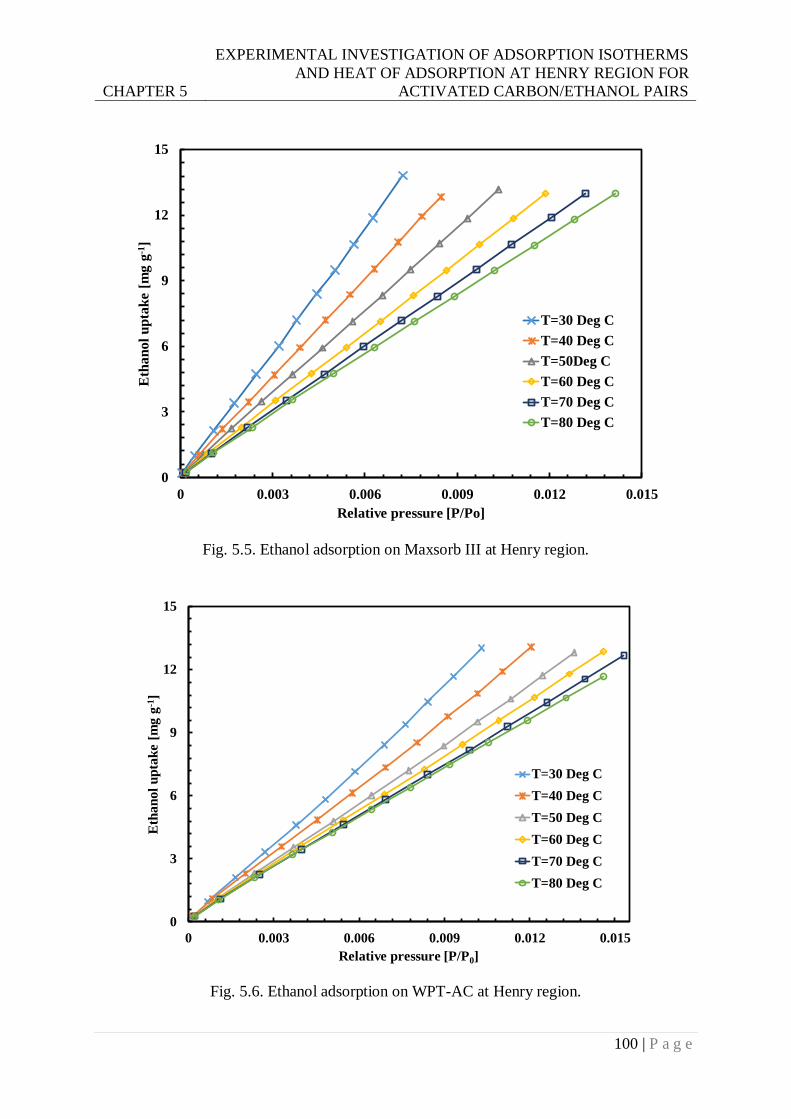
CHAPTER 5
EXPERIMENTAL INVESTIGATION OF ADSORPTION ISOTHERMS
AND HEAT OF ADSORPTION AT HENRY REGION FOR
ACTIVATED CARBON/ETHANOL PAIRS
100 | P a g e
Fig. 5.5. Ethanol adsorption on Maxsorb III at Henry region.
Fig. 5.6. Ethanol adsorption on WPT-AC at Henry region.
0
3
6
9
12
15
0 0.003 0.006 0.009 0.012 0.015
Eth
an
ol
up
tak
e [
mg g
-1]
Relative pressure [P/Po]
T=30 Deg C
T=40 Deg C
T=50Deg C
T=60 Deg C
T=70 Deg C
T=80 Deg C
0
3
6
9
12
15
0 0.003 0.006 0.009 0.012 0.015
Eth
an
ol
up
tak
e [
mg g
-1]
Relative pressure [P/P0]
T=30 Deg C
T=40 Deg C
T=50 Deg C
T=60 Deg C
T=70 Deg C
T=80 Deg C
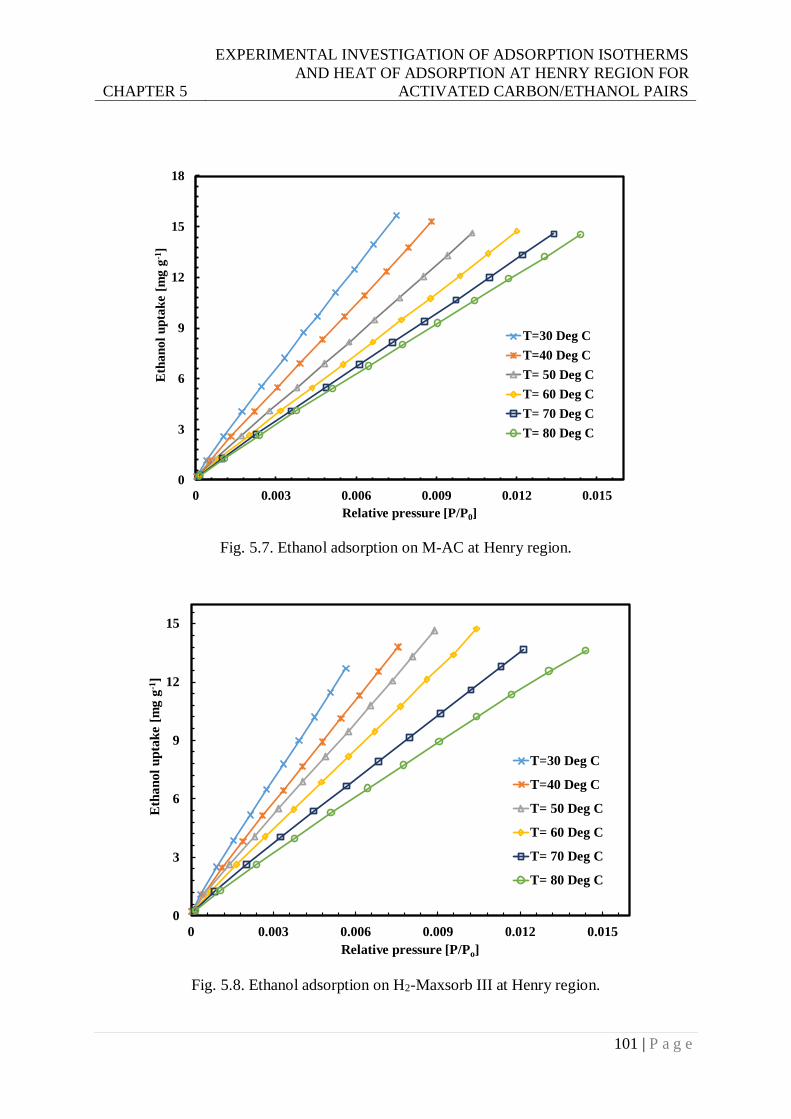
CHAPTER 5
EXPERIMENTAL INVESTIGATION OF ADSORPTION ISOTHERMS
AND HEAT OF ADSORPTION AT HENRY REGION FOR
ACTIVATED CARBON/ETHANOL PAIRS
101 | P a g e
Fig. 5.7. Ethanol adsorption on M-AC at Henry region.
Fig. 5.8. Ethanol adsorption on H2-Maxsorb III at Henry region.
0
3
6
9
12
15
18
0 0.003 0.006 0.009 0.012 0.015
Eth
an
ol
up
tak
e [
mg g
-1]
Relative pressure [P/P0]
T=30 Deg C
T=40 Deg C
T= 50 Deg C
T= 60 Deg C
T= 70 Deg C
T= 80 Deg C
0
3
6
9
12
15
0 0.003 0.006 0.009 0.012 0.015
Eth
an
ol
up
tak
e [
mg g
-1]
Relative pressure [P/Po]
T=30 Deg C
T=40 Deg C
T= 50 Deg C
T= 60 Deg C
T= 70 Deg C
T= 80 Deg C
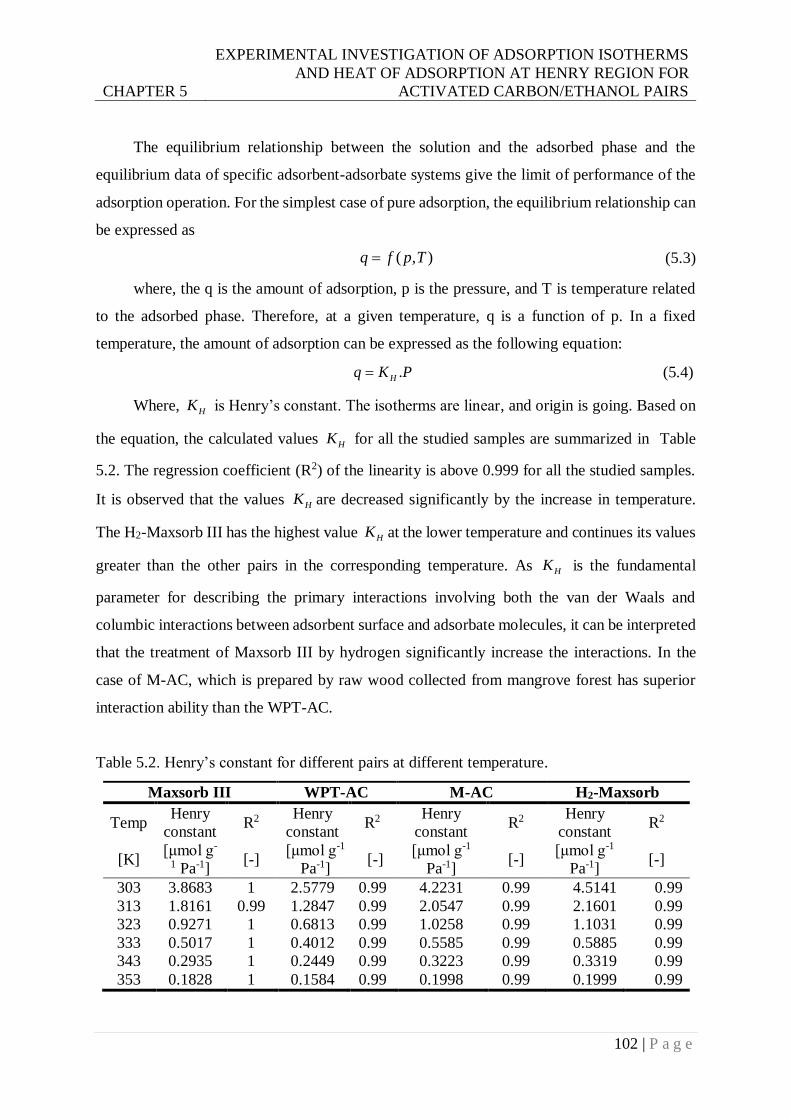
CHAPTER 5
EXPERIMENTAL INVESTIGATION OF ADSORPTION ISOTHERMS
AND HEAT OF ADSORPTION AT HENRY REGION FOR
ACTIVATED CARBON/ETHANOL PAIRS
102 | P a g e
The equilibrium relationship between the solution and the adsorbed phase and the
equilibrium data of specific adsorbent-adsorbate systems give the limit of performance of the
adsorption operation. For the simplest case of pure adsorption, the equilibrium relationship can
be expressed as
( , )q f p T (5.3)
where, the q is the amount of adsorption, p is the pressure, and T is temperature related
to the adsorbed phase. Therefore, at a given temperature, q is a function of p. In a fixed
temperature, the amount of adsorption can be expressed as the following equation:
.Hq K P (5.4)
Where, HK is Henry’s constant. The isotherms are linear, and origin is going. Based on
the equation, the calculated values HK for all the studied samples are summarized in Table
5.2. The regression coefficient (R2) of the linearity is above 0.999 for all the studied samples.
It is observed that the values HK are decreased significantly by the increase in temperature.
The H2-Maxsorb III has the highest value HK at the lower temperature and continues its values
greater than the other pairs in the corresponding temperature. As HK is the fundamental
parameter for describing the primary interactions involving both the van der Waals and
columbic interactions between adsorbent surface and adsorbate molecules, it can be interpreted
that the treatment of Maxsorb III by hydrogen significantly increase the interactions. In the
case of M-AC, which is prepared by raw wood collected from mangrove forest has superior
interaction ability than the WPT-AC.
Table 5.2. Henry’s constant for different pairs at different temperature.
Maxsorb III WPT-AC M-AC H2-Maxsorb
Temp Henry
constant R2
Henry
constant R2
Henry
constant R2
Henry
constant R2
[K] [μmol g-
1 Pa-1] [-]
[μmol g-1
Pa-1] [-]
[μmol g-1
Pa-1] [-]
[μmol g-1
Pa-1] [-]
303 3.8683 1 2.5779 0.99 4.2231 0.99 4.5141 0.99
313 1.8161 0.99 1.2847 0.99 2.0547 0.99 2.1601 0.99
323 0.9271 1 0.6813 0.99 1.0258 0.99 1.1031 0.99
333 0.5017 1 0.4012 0.99 0.5585 0.99 0.5885 0.99
343 0.2935 1 0.2449 0.99 0.3223 0.99 0.3319 0.99
353 0.1828 1 0.1584 0.99 0.1998 0.99 0.1999 0.99
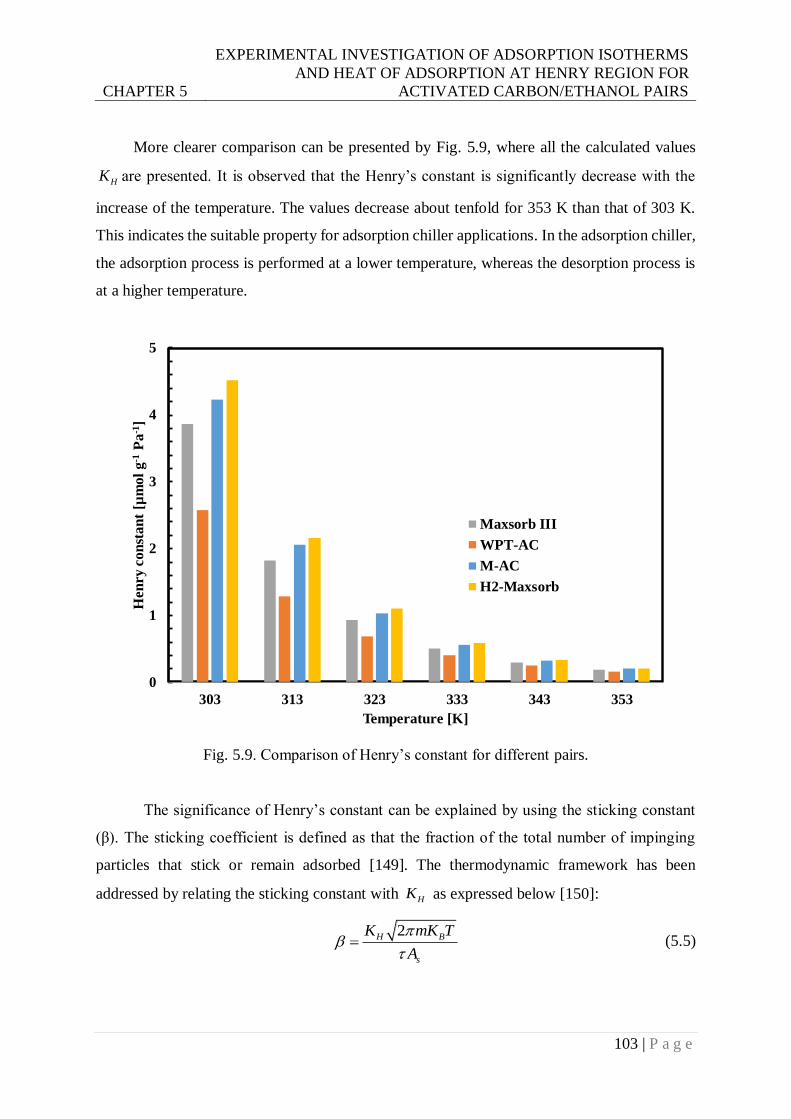
CHAPTER 5
EXPERIMENTAL INVESTIGATION OF ADSORPTION ISOTHERMS
AND HEAT OF ADSORPTION AT HENRY REGION FOR
ACTIVATED CARBON/ETHANOL PAIRS
103 | P a g e
More clearer comparison can be presented by Fig. 5.9, where all the calculated values
HK are presented. It is observed that the Henry’s constant is significantly decrease with the
increase of the temperature. The values decrease about tenfold for 353 K than that of 303 K.
This indicates the suitable property for adsorption chiller applications. In the adsorption chiller,
the adsorption process is performed at a lower temperature, whereas the desorption process is
at a higher temperature.
Fig. 5.9. Comparison of Henry’s constant for different pairs.
The significance of Henry’s constant can be explained by using the sticking constant
(β). The sticking coefficient is defined as that the fraction of the total number of impinging
particles that stick or remain adsorbed [149]. The thermodynamic framework has been
addressed by relating the sticking constant with HK as expressed below [150]:
2H B
s
K mK T
A
(5.5)
0
1
2
3
4
5
303 313 323 333 343 353
Hen
ry c
on
stan
t [µ
mol
g-1
Pa
-1]
Temperature [K]
Maxsorb III
WPT-AC
M-AC
H2-Maxsorb
CHAPTER 5
EXPERIMENTAL INVESTIGATION OF ADSORPTION ISOTHERMS
AND HEAT OF ADSORPTION AT HENRY REGION FOR
ACTIVATED CARBON/ETHANOL PAIRS
104 | P a g e
Where, m is the molecular mass of the adsorbate, is the average residence time of a
molecule on the adsorbent, sA is the specific surface area of the adsorbent, BK is the Boltzmann
constant and T is the corresponding temperature. From the Eq. (5.5), it is clearly understandable
that Henry’s constant influence the sticking constant or influences the adsorption process
significantly.
5.4.2 The heat of adsorption at zero coverage
The isosteric heats of adsorption of the components of a gas mixture are key
thermodynamic variables for the design of practical gas separation processes. It determines the
extents of adsorbent temperature changes within the adsorber during the adsorption
(exothermic) and desorption (endothermic) steps of the processes [151]. The adsorbent
temperature is a crucial variable in determining the local adsorption equilibria and kinetics on
the adsorbent, which ultimately governs the sorption performance of the processes. The
theoretical maximum of the isosteric heat of adsorption ( 0H ) is found in Henry’s region,
which is the characteristic parameter of a particular pair.
In the measurement 0H for the studied four pairs using the IGC method, several
isotherms are generated for each sample at the Henry region. Unlike the isotherm measurement
shown in the previous section, here for each pair, several isosteric lines were generated for
different coverage with varying the temperature. The measured isosteric lines are linear and
show decreasing trends with the increase of inverse of temperature. The Heat of adsorption
0H is then calculated using the Clausius-Clapeyron equation [Eq. (5.6)].
0 ln
1
H M P
R
T
(5.6)
Where, M is the molecular mass of the adsorbate, and R is the Universal gas constant.
The right side of the Eq. (5.6) Represent the slope of the isosteric lines shown in Fig. 5.10 for
Maxsorb III/ethanol pairs. The similar isosteric lines for WPT-AC/ethanol pair, M-AC/ethanol
pair, and H2-Maxsorb III are shown in Fig. 5.11, Fig. 5.12 and Fig. 5.13, respectively. The
data is measured twice to confirm the reproducibility, and all the data points coincide perfectly
(see Fig. 5.10).
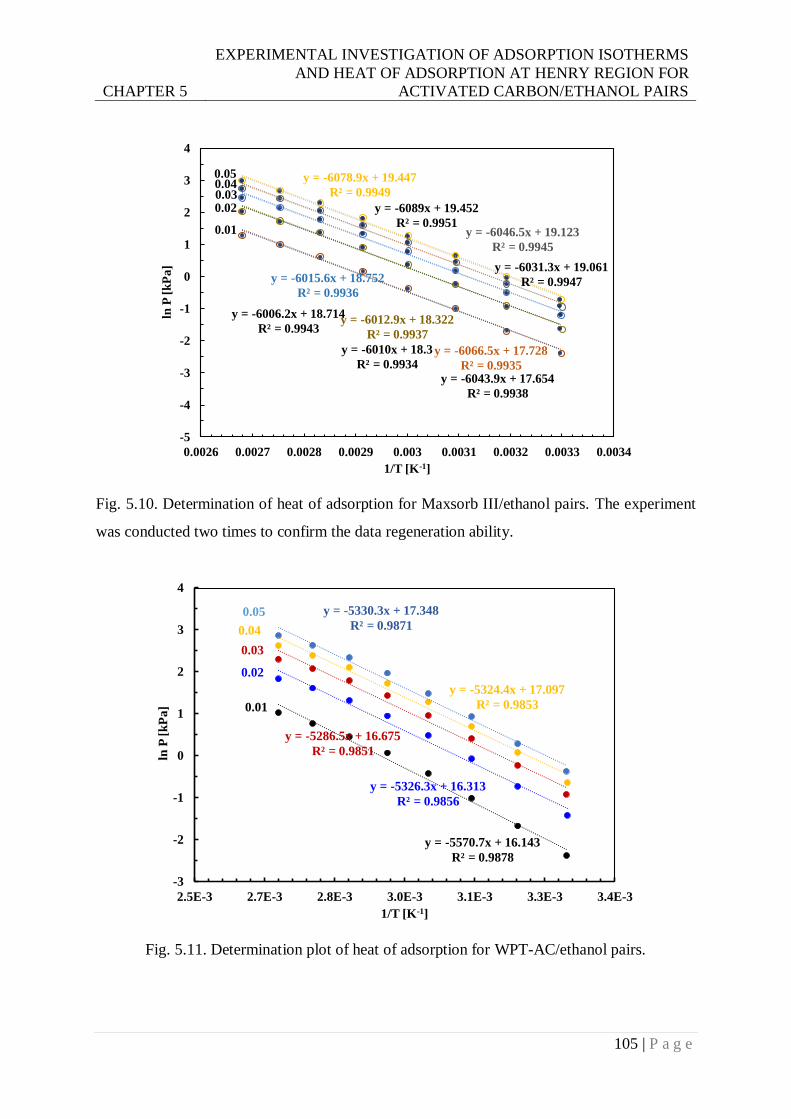
CHAPTER 5
EXPERIMENTAL INVESTIGATION OF ADSORPTION ISOTHERMS
AND HEAT OF ADSORPTION AT HENRY REGION FOR
ACTIVATED CARBON/ETHANOL PAIRS
105 | P a g e
Fig. 5.10. Determination of heat of adsorption for Maxsorb III/ethanol pairs. The experiment
was conducted two times to confirm the data regeneration ability.
Fig. 5.11. Determination plot of heat of adsorption for WPT-AC/ethanol pairs.
y = -6078.9x + 19.447
R² = 0.9949
y = -6015.6x + 18.752
R² = 0.9936
y = -6066.5x + 17.728
R² = 0.9935
y = -6046.5x + 19.123
R² = 0.9945
y = -6012.9x + 18.322
R² = 0.9937
y = -6043.9x + 17.654
R² = 0.9938
y = -6010x + 18.3
R² = 0.9934
y = -6006.2x + 18.714
R² = 0.9943
y = -6031.3x + 19.061
R² = 0.9947
y = -6089x + 19.452
R² = 0.9951
-5
-4
-3
-2
-1
0
1
2
3
4
0.0026 0.0027 0.0028 0.0029 0.003 0.0031 0.0032 0.0033 0.0034
ln P
[k
Pa]
1/T [K-1]
0.01
0.020.030.040.05
y = -5570.7x + 16.143
R² = 0.9878
y = -5326.3x + 16.313
R² = 0.9856
y = -5286.5x + 16.675
R² = 0.9851
y = -5324.4x + 17.097
R² = 0.9853
y = -5330.3x + 17.348
R² = 0.9871
-3
-2
-1
0
1
2
3
4
2.5E-3 2.7E-3 2.8E-3 3.0E-3 3.1E-3 3.3E-3 3.4E-3
ln P
[k
Pa
]
1/T [K-1]
0.01
0.02
0.03
0.04
0.05
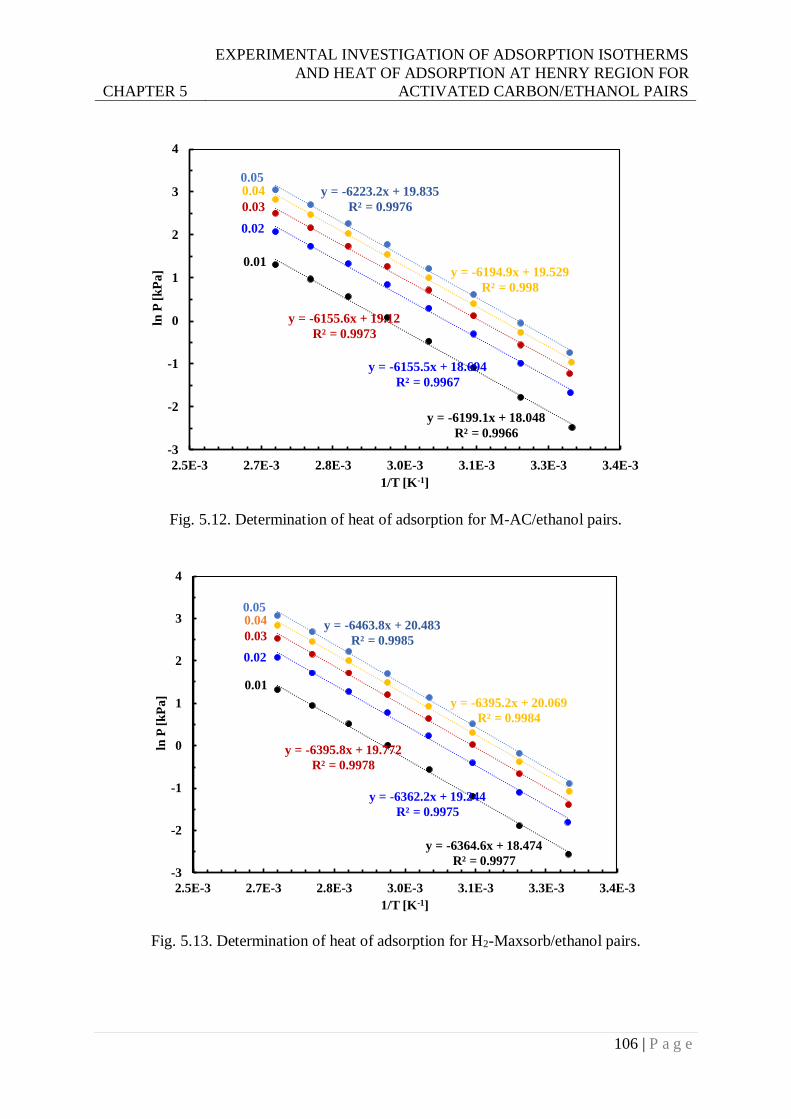
CHAPTER 5
EXPERIMENTAL INVESTIGATION OF ADSORPTION ISOTHERMS
AND HEAT OF ADSORPTION AT HENRY REGION FOR
ACTIVATED CARBON/ETHANOL PAIRS
106 | P a g e
Fig. 5.12. Determination of heat of adsorption for M-AC/ethanol pairs.
Fig. 5.13. Determination of heat of adsorption for H2-Maxsorb/ethanol pairs.
y = -6199.1x + 18.048
R² = 0.9966
y = -6155.5x + 18.694
R² = 0.9967
y = -6155.6x + 19.12
R² = 0.9973
y = -6194.9x + 19.529
R² = 0.998
y = -6223.2x + 19.835
R² = 0.9976
-3
-2
-1
0
1
2
3
4
2.5E-3 2.7E-3 2.8E-3 3.0E-3 3.1E-3 3.3E-3 3.4E-3
ln P
[k
Pa
]
1/T [K-1]
0.01
0.02
0.03
0.040.05
y = -6364.6x + 18.474
R² = 0.9977
y = -6362.2x + 19.244
R² = 0.9975
y = -6395.8x + 19.772
R² = 0.9978
y = -6395.2x + 20.069
R² = 0.9984
y = -6463.8x + 20.483
R² = 0.9985
-3
-2
-1
0
1
2
3
4
2.5E-3 2.7E-3 2.8E-3 3.0E-3 3.1E-3 3.3E-3 3.4E-3
ln P
[k
Pa
]
1/T [K-1]
0.01
0.02
0.03
0.040.05
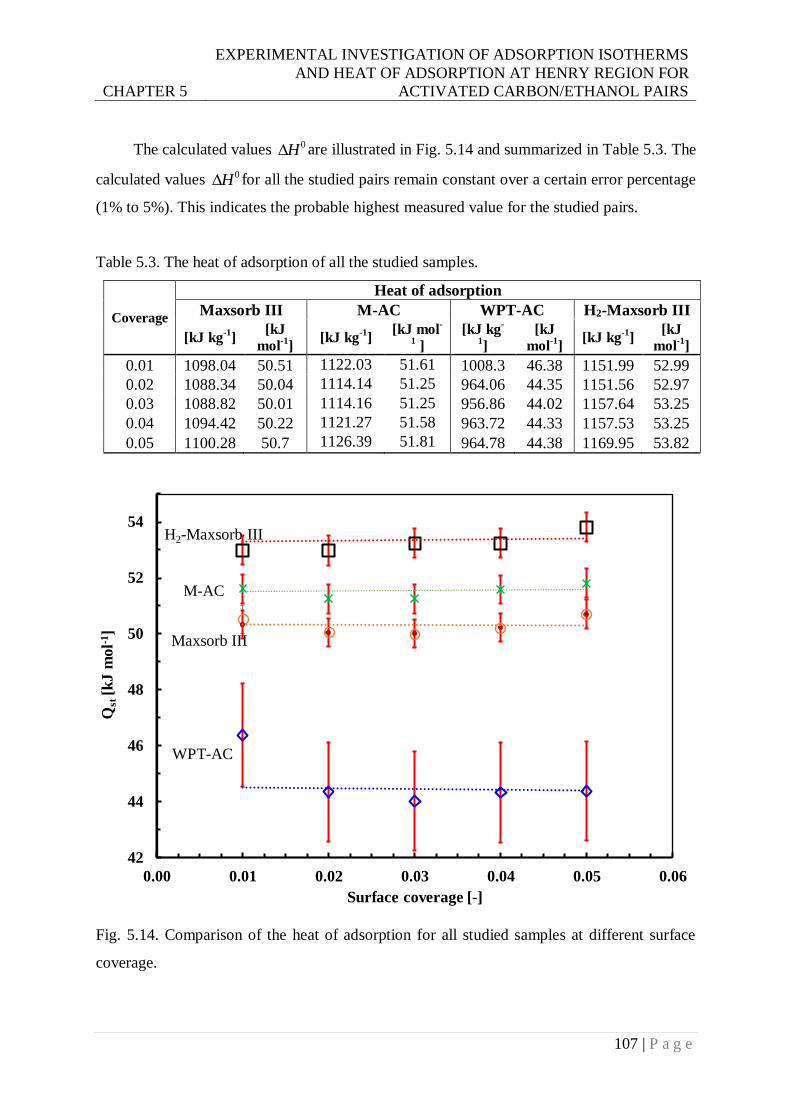
CHAPTER 5
EXPERIMENTAL INVESTIGATION OF ADSORPTION ISOTHERMS
AND HEAT OF ADSORPTION AT HENRY REGION FOR
ACTIVATED CARBON/ETHANOL PAIRS
107 | P a g e
The calculated values 0H are illustrated in Fig. 5.14 and summarized in Table 5.3. The
calculated values 0H for all the studied pairs remain constant over a certain error percentage
(1% to 5%). This indicates the probable highest measured value for the studied pairs.
Table 5.3. The heat of adsorption of all the studied samples.
Coverage
Heat of adsorption
Maxsorb III M-AC WPT-AC H2-Maxsorb III
[kJ kg-1
] [kJ
mol-1
] [kJ kg
-1]
[kJ mol-
1 ]
[kJ kg-
1]
[kJ
mol-1
] [kJ kg
-1]
[kJ
mol-1
]
0.01 1098.04 50.51 1122.03 51.61 1008.3 46.38 1151.99 52.99
0.02 1088.34 50.04 1114.14 51.25 964.06 44.35 1151.56 52.97
0.03 1088.82 50.01 1114.16 51.25 956.86 44.02 1157.64 53.25
0.04 1094.42 50.22 1121.27 51.58 963.72 44.33 1157.53 53.25
0.05 1100.28 50.7 1126.39 51.81 964.78 44.38 1169.95 53.82
Fig. 5.14. Comparison of the heat of adsorption for all studied samples at different surface
coverage.
42
44
46
48
50
52
54
0.00 0.01 0.02 0.03 0.04 0.05 0.06
Qst
[kJ m
ol-1
]
Surface coverage [-]
Maxsorb III
H2-Maxsorb III
WPT-AC
M-AC
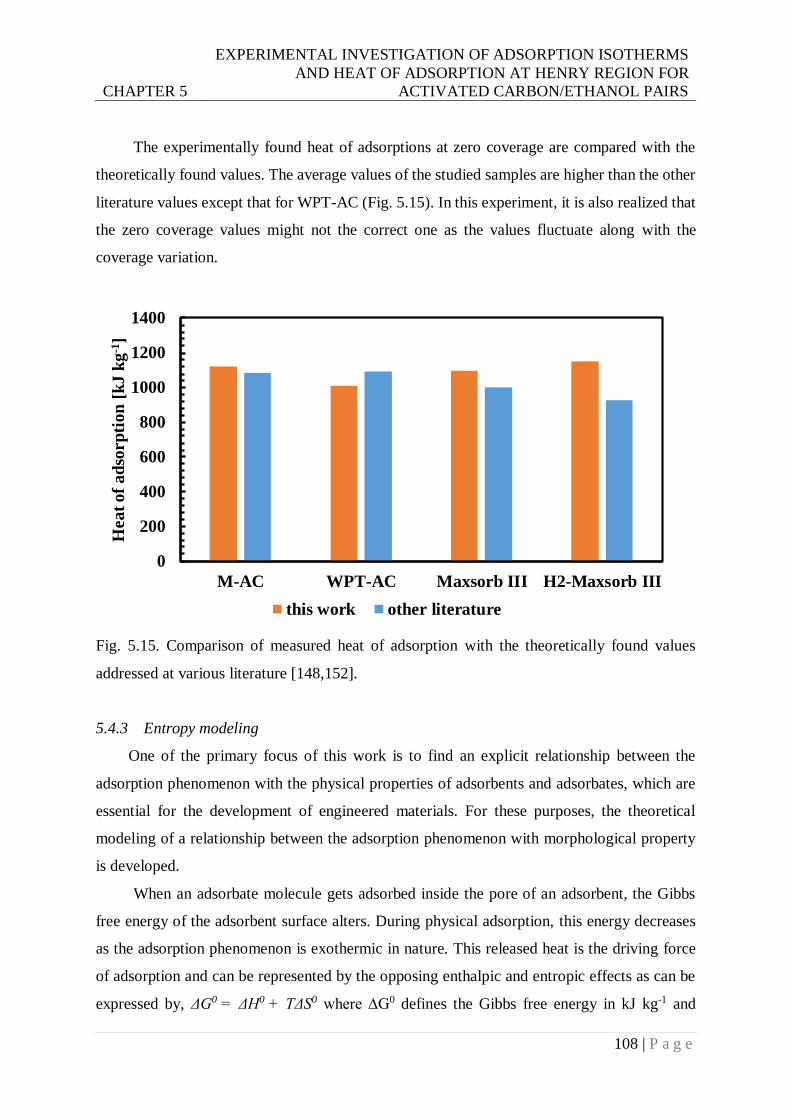
CHAPTER 5
EXPERIMENTAL INVESTIGATION OF ADSORPTION ISOTHERMS
AND HEAT OF ADSORPTION AT HENRY REGION FOR
ACTIVATED CARBON/ETHANOL PAIRS
108 | P a g e
The experimentally found heat of adsorptions at zero coverage are compared with the
theoretically found values. The average values of the studied samples are higher than the other
literature values except that for WPT-AC (Fig. 5.15). In this experiment, it is also realized that
the zero coverage values might not the correct one as the values fluctuate along with the
coverage variation.
Fig. 5.15. Comparison of measured heat of adsorption with the theoretically found values
addressed at various literature [148,152].
5.4.3 Entropy modeling
One of the primary focus of this work is to find an explicit relationship between the
adsorption phenomenon with the physical properties of adsorbents and adsorbates, which are
essential for the development of engineered materials. For these purposes, the theoretical
modeling of a relationship between the adsorption phenomenon with morphological property
is developed.
When an adsorbate molecule gets adsorbed inside the pore of an adsorbent, the Gibbs
free energy of the adsorbent surface alters. During physical adsorption, this energy decreases
as the adsorption phenomenon is exothermic in nature. This released heat is the driving force
of adsorption and can be represented by the opposing enthalpic and entropic effects as can be
expressed by, ΔG0 = ΔH0 + TΔS0 where ∆G0 defines the Gibbs free energy in kJ kg-1 and
0
200
400
600
800
1000
1200
1400
M-AC WPT-AC Maxsorb III H2-Maxsorb III
Heat
of
ad
sorp
tion
[k
J k
g-1
]
this work other literature
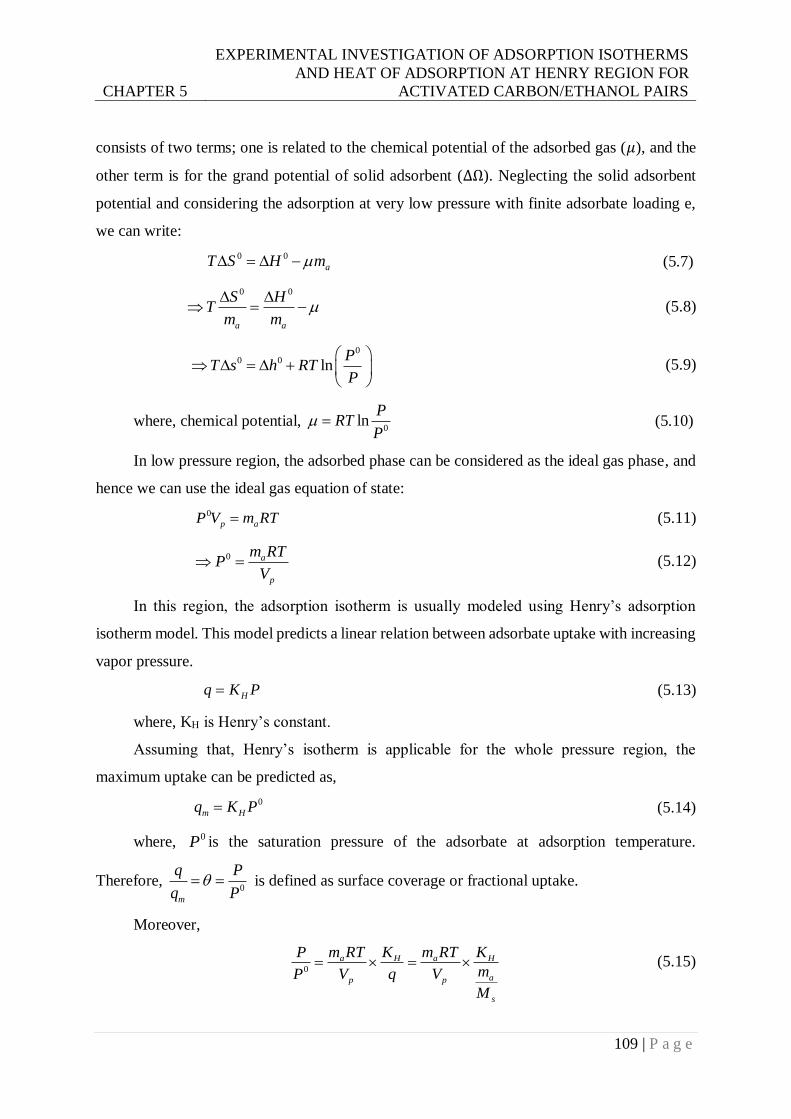
CHAPTER 5
EXPERIMENTAL INVESTIGATION OF ADSORPTION ISOTHERMS
AND HEAT OF ADSORPTION AT HENRY REGION FOR
ACTIVATED CARBON/ETHANOL PAIRS
109 | P a g e
consists of two terms; one is related to the chemical potential of the adsorbed gas (𝜇), and the
other term is for the grand potential of solid adsorbent (∆Ω). Neglecting the solid adsorbent
potential and considering the adsorption at very low pressure with finite adsorbate loading e,
we can write:
0 0
aT S H m (5.7)
0 0
a a
S HT
m m
(5.8)
0
0 0 lnP
T s h RTP
(5.9)
where, chemical potential, 0
lnP
RTP
(5.10)
In low pressure region, the adsorbed phase can be considered as the ideal gas phase, and
hence we can use the ideal gas equation of state:
0
p aP V m RT (5.11)
0 a
p
m RTP
V (5.12)
In this region, the adsorption isotherm is usually modeled using Henry’s adsorption
isotherm model. This model predicts a linear relation between adsorbate uptake with increasing
vapor pressure.
Hq K P (5.13)
where, KH is Henry’s constant.
Assuming that, Henry’s isotherm is applicable for the whole pressure region, the
maximum uptake can be predicted as,
0
m Hq K P (5.14)
where, 0P is the saturation pressure of the adsorbate at adsorption temperature.
Therefore, 0
m
q P
q P is defined as surface coverage or fractional uptake.
Moreover,
0
a H a H
ap p
s
P m RT K m RT K
mP V q V
M
(5.15)
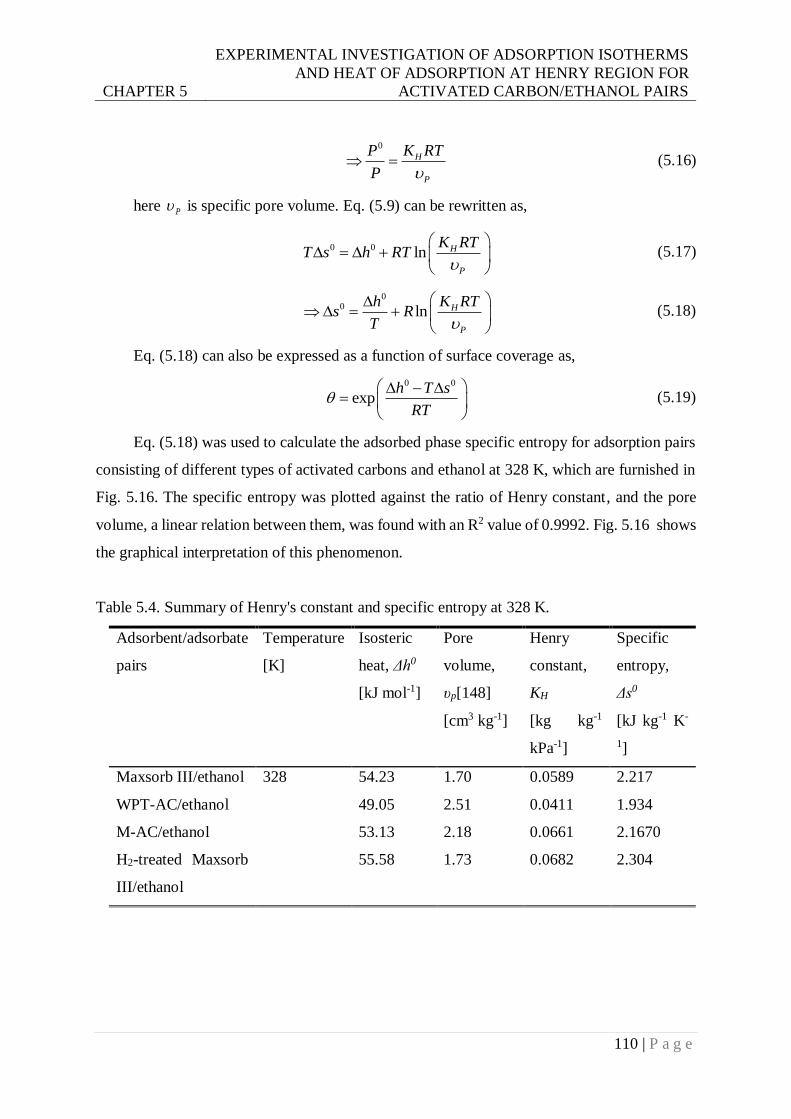
CHAPTER 5
EXPERIMENTAL INVESTIGATION OF ADSORPTION ISOTHERMS
AND HEAT OF ADSORPTION AT HENRY REGION FOR
ACTIVATED CARBON/ETHANOL PAIRS
110 | P a g e
0
H
P
P K RT
P (5.16)
here P is specific pore volume. Eq. (5.9) can be rewritten as,
0 0 ln H
P
K RTT s h RT
(5.17)
0
0 ln H
P
h K RTs R
T
(5.18)
Eq. (5.18) can also be expressed as a function of surface coverage as,
0 0
exph T s
RT
(5.19)
Eq. (5.18) was used to calculate the adsorbed phase specific entropy for adsorption pairs
consisting of different types of activated carbons and ethanol at 328 K, which are furnished in
Fig. 5.16. The specific entropy was plotted against the ratio of Henry constant, and the pore
volume, a linear relation between them, was found with an R2 value of 0.9992. Fig. 5.16 shows
the graphical interpretation of this phenomenon.
Table 5.4. Summary of Henry's constant and specific entropy at 328 K.
Adsorbent/adsorbate
pairs
Temperature
[K]
Isosteric
heat, Δh0
[kJ mol-1]
Pore
volume,
υp[148]
[cm3 kg-1]
Henry
constant,
KH
[kg kg-1
kPa-1]
Specific
entropy,
Δs0
[kJ kg-1 K-
1]
Maxsorb III/ethanol 328 54.23 1.70 0.0589 2.217
WPT-AC/ethanol 49.05 2.51 0.0411 1.934
M-AC/ethanol 53.13 2.18 0.0661 2.1670
H2-treated Maxsorb
III/ethanol
55.58 1.73 0.0682 2.304
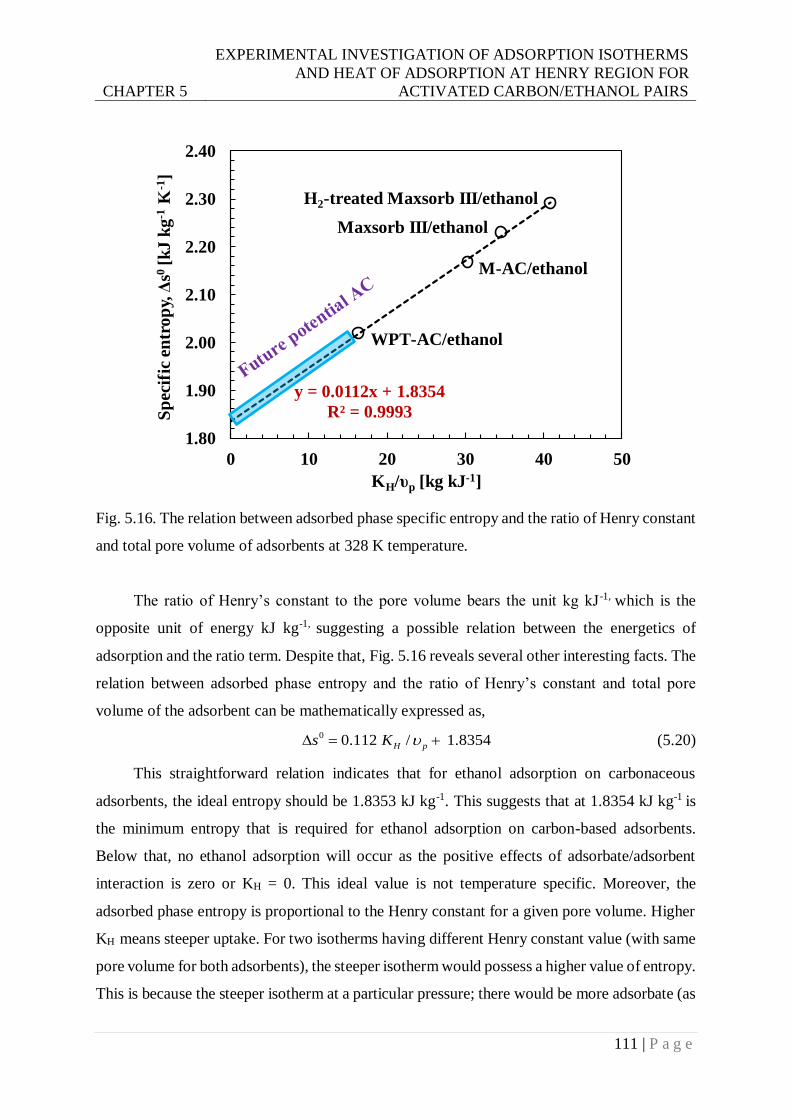
CHAPTER 5
EXPERIMENTAL INVESTIGATION OF ADSORPTION ISOTHERMS
AND HEAT OF ADSORPTION AT HENRY REGION FOR
ACTIVATED CARBON/ETHANOL PAIRS
111 | P a g e
Fig. 5.16. The relation between adsorbed phase specific entropy and the ratio of Henry constant
and total pore volume of adsorbents at 328 K temperature.
The ratio of Henry’s constant to the pore volume bears the unit kg kJ-1, which is the
opposite unit of energy kJ kg-1, suggesting a possible relation between the energetics of
adsorption and the ratio term. Despite that, Fig. 5.16 reveals several other interesting facts. The
relation between adsorbed phase entropy and the ratio of Henry’s constant and total pore
volume of the adsorbent can be mathematically expressed as,
0 0.112 / 1.8354H ps K (5.20)
This straightforward relation indicates that for ethanol adsorption on carbonaceous
adsorbents, the ideal entropy should be 1.8353 kJ kg-1. This suggests that at 1.8354 kJ kg-1 is
the minimum entropy that is required for ethanol adsorption on carbon-based adsorbents.
Below that, no ethanol adsorption will occur as the positive effects of adsorbate/adsorbent
interaction is zero or KH = 0. This ideal value is not temperature specific. Moreover, the
adsorbed phase entropy is proportional to the Henry constant for a given pore volume. Higher
KH means steeper uptake. For two isotherms having different Henry constant value (with same
pore volume for both adsorbents), the steeper isotherm would possess a higher value of entropy.
This is because the steeper isotherm at a particular pressure; there would be more adsorbate (as
y = 0.0112x + 1.8354
R² = 0.9993
1.80
1.90
2.00
2.10
2.20
2.30
2.40
0 10 20 30 40 50
Sp
ecif
ic e
ntr
op
y, Δ
s0 [
kJ
kg
-1K
-1]
KH/υp [kg kJ-1]
WPT-AC/ethanol
H2-treated Maxsorb III/ethanol
Maxsorb III/ethanol
M-AC/ethanol
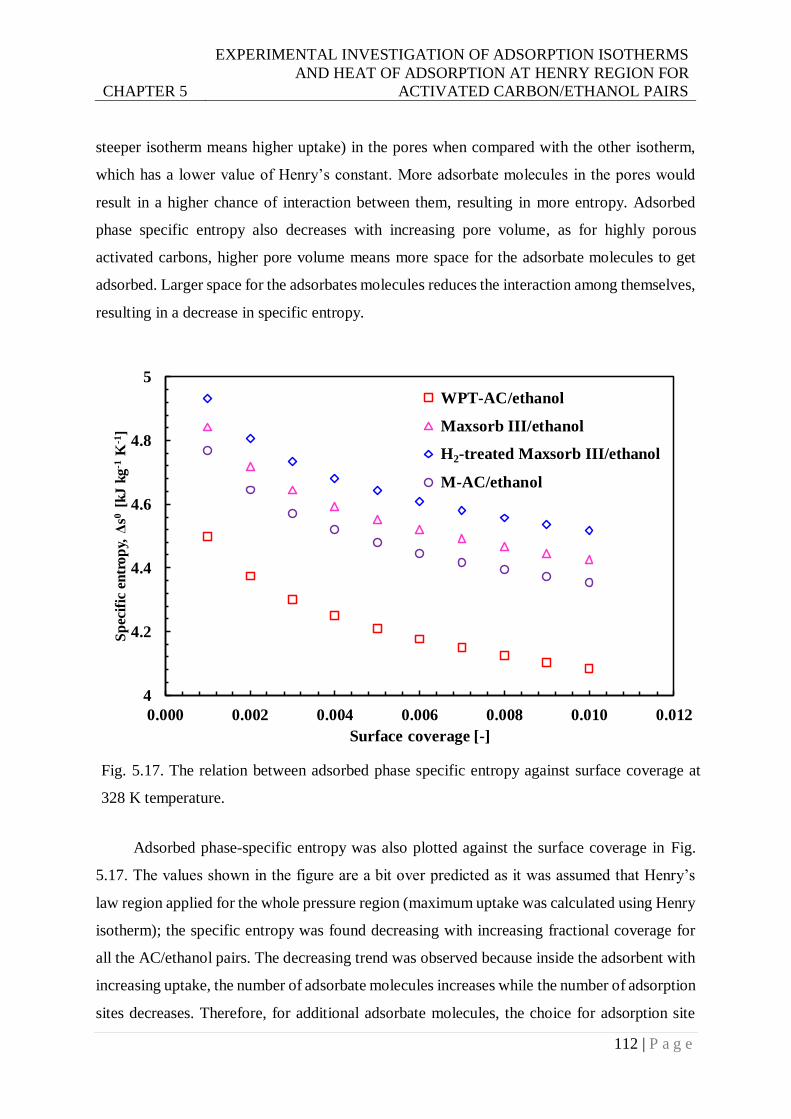
CHAPTER 5
EXPERIMENTAL INVESTIGATION OF ADSORPTION ISOTHERMS
AND HEAT OF ADSORPTION AT HENRY REGION FOR
ACTIVATED CARBON/ETHANOL PAIRS
112 | P a g e
steeper isotherm means higher uptake) in the pores when compared with the other isotherm,
which has a lower value of Henry’s constant. More adsorbate molecules in the pores would
result in a higher chance of interaction between them, resulting in more entropy. Adsorbed
phase specific entropy also decreases with increasing pore volume, as for highly porous
activated carbons, higher pore volume means more space for the adsorbate molecules to get
adsorbed. Larger space for the adsorbates molecules reduces the interaction among themselves,
resulting in a decrease in specific entropy.
Adsorbed phase-specific entropy was also plotted against the surface coverage in Fig.
5.17. The values shown in the figure are a bit over predicted as it was assumed that Henry’s
law region applied for the whole pressure region (maximum uptake was calculated using Henry
isotherm); the specific entropy was found decreasing with increasing fractional coverage for
all the AC/ethanol pairs. The decreasing trend was observed because inside the adsorbent with
increasing uptake, the number of adsorbate molecules increases while the number of adsorption
sites decreases. Therefore, for additional adsorbate molecules, the choice for adsorption site
4
4.2
4.4
4.6
4.8
5
0.000 0.002 0.004 0.006 0.008 0.010 0.012
Sp
ecif
ic e
ntr
op
y, Δ
s0 [k
J k
g-1
K-1
]
Surface coverage [-]
WPT-AC/ethanol
Maxsorb III/ethanol
Series3
M-AC/ethanol
H2-treated Maxsorb III/ethanol
Fig. 5.17. The relation between adsorbed phase specific entropy against surface coverage at
328 K temperature.
CHAPTER 5
EXPERIMENTAL INVESTIGATION OF ADSORPTION ISOTHERMS
AND HEAT OF ADSORPTION AT HENRY REGION FOR
ACTIVATED CARBON/ETHANOL PAIRS
113 | P a g e
becomes lesser and lesser (as some of the sites are already occupied by previous adsorbate
molecules.). As a result, the newly coming adsorbate molecules adsorption sites become more
and more predicted, and hence the chaotic nature of adsorption becomes more and more
predictable, causing the entropy to decrease.
5.5 Conclusions
In this chapter comprises of three major findings: i) study of adsorption isotherms at
henry region ii) study of zero coverage heat of adsorption and iii) modeling of relationships
between specific entropy with pore volume which concludes with a novel finding of
characteristics specific entropy for activated carbon/ethanol pairs.
i) Study of adsorption isotherms at the henry region: Using IGC, the measured isotherms
in lower pressure region (relative pressure < 0.015) are linear, indicating the successful
measurement in Henry region. The isotherms are highly temperature sensitive, which can be
found by analysis of Henry’s constant values. The highest Henry constant value was found for
H2-Maxsorb III (4.5141 μmol g-1 Pa-1) at 303 K temperature and the lowest one for WPT-AC
(2.5779 μmol g-1 Pa-1). Comparing to parent Maxsorb III the H2-Maxsorb III exhibits a higher
affinity towards ethanol at Henry region. Furthermore, Henry's constant values depend on the
raw materials for producing activated carbons, which is depicted form the variation of KH
among WPT-AC and M-AC.
ii) Study of zero coverage heat of adsorption: Zero coverage heat of adsorption of the
studied samples is measured using the Clausius-Clapeyron equation, by plotting
experimentally found lnP values against T-1 values. The slope of the plots at different
temperature indicates the zero coverage heat of adsorption (0H ) for the studied pairs. The
measured values of heat of adsorption at different coverages are nearly linear with minimal
error range (1%), except WPT-AC (5%). If the error range is acceptable, then the measured
0H for Maxsorb III, M-AC, WPT-AC and H2- Maxsorb III are 50.35 kJ mol-1, 51.5 kJ mol-1,
44.5 kJ mol-1 and 53.3 kJ mol-1, respectively.
iii) Measurement of characteristic specific entropy for activated carbons/ethanol pairs: It
is interestingly observed that all the plot of specific entropy against the KH/υP follows a linear
trend and cut in the vertical axis at for at 1.8354 kJ kg-1 indicating the values of ideal entropy

CHAPTER 5
EXPERIMENTAL INVESTIGATION OF ADSORPTION ISOTHERMS
AND HEAT OF ADSORPTION AT HENRY REGION FOR
ACTIVATED CARBON/ETHANOL PAIRS
114 | P a g e
of adsorption process for carbonadoes materials. Below that, no ethanol adsorption will occur
as the positive effects of adsorbate/adsorbent interaction is zero or KH = 0.
115 | P a g e
Chapter 6
Novel Technique for Improving Water
Adsorption Isotherms of Metal-organic
Frameworks Equation Chapter 6 Section 1
Thermally driven adsorption-driven chillers (ADCs) is the emerging technology for
reducing primary energy consumption and greenhouse gas emission by utilizing solar energy
and waste heat from various sources. The key element of these ADCs is the adsorbent materials;
the performance of the systems heavily depends upon the properties of the adsorbents. Metal-
organic frameworks (MOFs) are becoming the most promising adsorbent for having a high
surface area, tunability, and generating S-shaped isotherms while pairing with water. In this
study, MOF aluminum fumarate was synthesized using a novel environmental-friendly route
and doped with two different metallic ions (Co2+, Ni2+). Various material characterization
experiments were completed to check structural integrity. The idea of metallic doping is
influenced by the results of the previous chapters. It is assumed that the replacement of the
central metallic ion of parent MOF might impact on the change of specific surface energy due
to electrostatic variation. Additionally, a comparative investigation of water adsorption at 30˚C
and 60˚C were reported for commercial aluminum fumarate and three new synthesized
samples. The investigation shows a significant improvement of water uptake in the lower
relative pressure region (P/Po <0.3) for all the synthesized and doped samples.
6.1 Introduction
During the past years, the use of cooling systems is intensifying due to rapid urbanization
and global warming. This trend will increase in many folds, especially in the higher income
countries, as well as in the developing countries for intense industrialization [153]. The
conventional systems used to mitigate the demand for cooling are based on electrical
compressors, heavily depend on the hydrochlorofluorocarbons (HCFCs), and hydrogenated
CFCs as refrigerants. These refrigerants are toxic, flammable, and harmful to the environment
[154]. Additionally, the electrical compressors require electrical energy to operate, which
implicitly increases the use of fossil fuel-based energy production. On the other hand,
CHAPTER 6
NOVEL TECHNIQUE FOR IMPROVING WATER ADSORPTION
ISOTHERMS OF METAL-ORGANIC FRAMEWORKS
116 | P a g e
adsorption chillers, an alternative to conventional chillers, runs on thermal compressors where
waste heat is the primary source of driving energy, and the refrigerants for this system are
environmentally benign. These chillers have the ability to utilize low-grade waste heat, which
can be collected from various sources, such as industries, solar collectors, etc. [155]. Low-
grade waste is used in the regeneration cycle to elude the refrigerants from a porous material,
and the cooling effect is achieved by the refrigeration cycles. As a refrigerant, water is
promising because of having high evaporation enthalpy. Nevertheless, the commercially
available adsorbent materials like silica gel, zeolites exhibit low water uptake capacity and
higher desorption temperature [156,157].
A new class of crystalline porous material, metal-organic frameworks (MOFs), is
becoming promising for their extreme microporosity, tunable structural design, and
coexistence of hydrophobicity and hydrophilicity in the same structure [43]. At this moment,
MOF-based water-assisted adsorption chillers are gaining interest in the researchers. However,
these chillers have several pre-requisites to achieve enhanced performance. Firstly, high
surface area and microporosity are essential for maximizing the water uptake. Recently
addressed MOFs having a BET surface area more than 7000 m2 g-1 is an indication of the
potentiality of using MOFs in the adsorption cooling applications [43,158]. Secondly, water
stability is essential to ensure the prolonged exposure of water in the adsorption-desorption
cycles, especially for the gaseous phase [159]. Many MOFs are introduced, claiming that those
are highly stable during the presence of water at various phases, and even show strong cycle
stability for heat transfer applications [54,160]. Finally, sufficient pore hydrophilicity is
essential for pore filling and water nucleation below the relative pressure (P/Po) of 0.3 for
achieving the enhanced performance of adsorption cooling systems. A good number of MOFs
show S-shaped distinctive water sorption characteristics, which are advantageous for steep
water uptake in the lower pressure region [124,161,162]. However, it is challenging to
introduce all the mentioned features in a particular MOF. One way to introduce all the features
in one single MOF is by doping the addressed stable MOF with various dopants [163]. In-situ
doping of metal ions has possible advantages for their inherent affinity with water, which might
influence the pore hydrophilicity, hence the improvement of water uptake in the relative
pressure region. In addition, to ensure the extensive use of MOFs in real-life applications, it is
required to synthesis the MOF ecofriendly.
Therefore, in this work, we have synthesized aluminum fumarate, which is
hydrothermally stable, addressed by various researchers [159,164,165]. We have synthesized
CHAPTER 6
NOVEL TECHNIQUE FOR IMPROVING WATER ADSORPTION
ISOTHERMS OF METAL-ORGANIC FRAMEWORKS
117 | P a g e
aluminum fumarate (SMOF) without using hazardous material like DMF; instead, water is used
as an alternative. As Co2+ and Ni2+ have a moderate affinity with water, these metallic ions are
added during the synthesis to observe the influence in water adsorption. The synthesized
SMOFs are characterized by XRD, SEM, and N2 adsorption isotherm analysis. To evaluate the
doping effect on water adsorption behavior, the thermogravimetric experiment has been
performed.
6.2 Experimental
6.2.1 Material and synthesis
6.2.1.1 Materials
Aluminum sulfate octadecahydrate (Al2(SO4)3.18H2O, 57.5%, Waco Pure Chemical
Industries), fumaric acid (COOH CH═CH COOH, 98%, Waco Pure Chemical Industries) and
sodium hydroxide (NaOH, Sigma Aldrich co) were used for the synthesis of Aluminum
Fumarate. For doping of Ni2+ ion and Co2+ ion nickel chloride salt (NiCl2, 98%, Sigma Aldrich
co) and anhydrous cobalt chloride salt (CoCl2, 97%, Sigma Aldrich co) were used. Deionized
water was used as a solvent. All the reagents were of analytical grade and were used as it is
supplied without further purification. Commercial ALF is collected from Bry-Air Int., prepared
following the similar route used in BASOLITE A520 by BASF.
6.2.1.2 Synthesis
Synthesis of pure aluminum fumarate: Pure aluminum fumarate was synthesized
according to the process described by Leung et al. [166]. In a glass beaker, 7 gm of
Al2(SO4)3.18H2O (0.0105 mol) was dissolved in 30 ml of deionized water at room temperature
and heated to 60°C using an electric heater. Next, 2.63 gm of fumaric acid (0.0227 mol) and
2.73 gm of NaOH (0.0683 mol) were mixed in 39 ml of water and dissolved by stirring. NaOH
helps in the deprotonation of fumaric acid. The solution was heated to 60°C and was added to
the solution of fumaric acid dropwise with stirring at 250 rpm for 16 minutes. White milk like
the suspension was observed. The product was separated from the reaction mixture by
centrifugation at 5000 rpm for 20 minutes and washed with water three times to remove any
unreacted reagents. The product was collected in a glass petri dish and dried in a vacuum oven
at 100°C for 8 hours. The product was powdered using a mortar and pestle. Finally, the powder
was activated at 150°C in a vacuum oven for 8 hours. Visually, the powder is white.
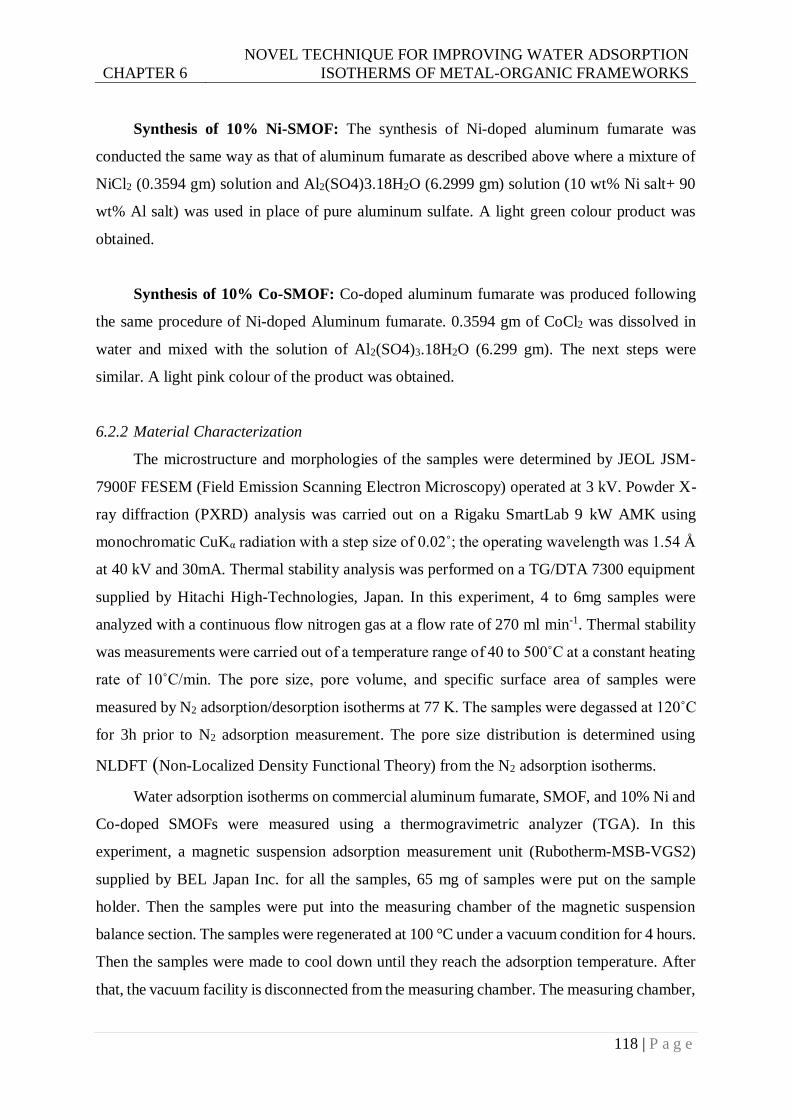
CHAPTER 6
NOVEL TECHNIQUE FOR IMPROVING WATER ADSORPTION
ISOTHERMS OF METAL-ORGANIC FRAMEWORKS
118 | P a g e
Synthesis of 10% Ni-SMOF: The synthesis of Ni-doped aluminum fumarate was
conducted the same way as that of aluminum fumarate as described above where a mixture of
NiCl2 (0.3594 gm) solution and Al2(SO4)3.18H2O (6.2999 gm) solution (10 wt% Ni salt+ 90
wt% Al salt) was used in place of pure aluminum sulfate. A light green colour product was
obtained.
Synthesis of 10% Co-SMOF: Co-doped aluminum fumarate was produced following
the same procedure of Ni-doped Aluminum fumarate. 0.3594 gm of CoCl2 was dissolved in
water and mixed with the solution of Al2(SO4)3.18H2O (6.299 gm). The next steps were
similar. A light pink colour of the product was obtained.
6.2.2 Material Characterization
The microstructure and morphologies of the samples were determined by JEOL JSM-
7900F FESEM (Field Emission Scanning Electron Microscopy) operated at 3 kV. Powder X-
ray diffraction (PXRD) analysis was carried out on a Rigaku SmartLab 9 kW AMK using
monochromatic CuKα radiation with a step size of 0.02˚; the operating wavelength was 1.54 Å
at 40 kV and 30mA. Thermal stability analysis was performed on a TG/DTA 7300 equipment
supplied by Hitachi High-Technologies, Japan. In this experiment, 4 to 6mg samples were
analyzed with a continuous flow nitrogen gas at a flow rate of 270 ml min-1. Thermal stability
was measurements were carried out of a temperature range of 40 to 500˚C at a constant heating
rate of 10˚C/min. The pore size, pore volume, and specific surface area of samples were
measured by N2 adsorption/desorption isotherms at 77 K. The samples were degassed at 120˚C
for 3h prior to N2 adsorption measurement. The pore size distribution is determined using
NLDFT (Non-Localized Density Functional Theory) from the N2 adsorption isotherms.
Water adsorption isotherms on commercial aluminum fumarate, SMOF, and 10% Ni and
Co-doped SMOFs were measured using a thermogravimetric analyzer (TGA). In this
experiment, a magnetic suspension adsorption measurement unit (Rubotherm-MSB-VGS2)
supplied by BEL Japan Inc. for all the samples, 65 mg of samples were put on the sample
holder. Then the samples were put into the measuring chamber of the magnetic suspension
balance section. The samples were regenerated at 100 °C under a vacuum condition for 4 hours.
Then the samples were made to cool down until they reach the adsorption temperature. After
that, the vacuum facility is disconnected from the measuring chamber. The measuring chamber,
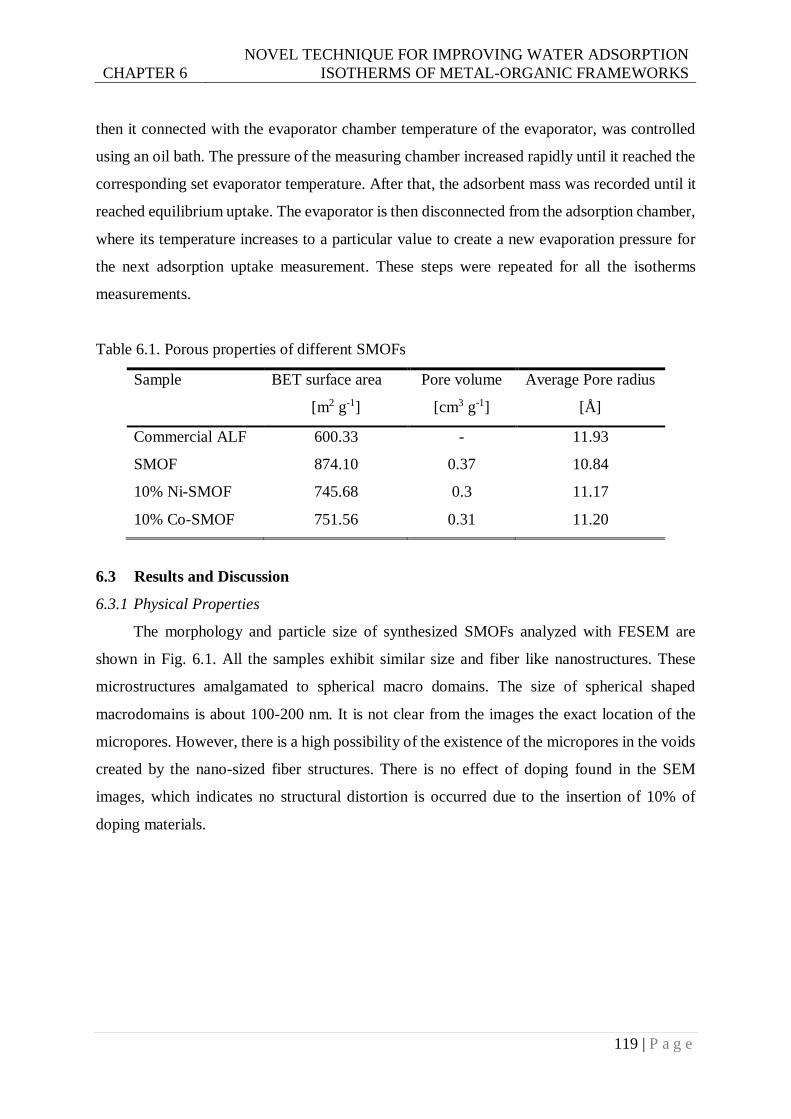
CHAPTER 6
NOVEL TECHNIQUE FOR IMPROVING WATER ADSORPTION
ISOTHERMS OF METAL-ORGANIC FRAMEWORKS
119 | P a g e
then it connected with the evaporator chamber temperature of the evaporator, was controlled
using an oil bath. The pressure of the measuring chamber increased rapidly until it reached the
corresponding set evaporator temperature. After that, the adsorbent mass was recorded until it
reached equilibrium uptake. The evaporator is then disconnected from the adsorption chamber,
where its temperature increases to a particular value to create a new evaporation pressure for
the next adsorption uptake measurement. These steps were repeated for all the isotherms
measurements.
Table 6.1. Porous properties of different SMOFs
Sample BET surface area
[m2 g-1]
Pore volume
[cm3 g-1]
Average Pore radius
[Å]
Commercial ALF 600.33 - 11.93
SMOF 874.10 0.37 10.84
10% Ni-SMOF 745.68 0.3 11.17
10% Co-SMOF 751.56 0.31 11.20
6.3 Results and Discussion
6.3.1 Physical Properties
The morphology and particle size of synthesized SMOFs analyzed with FESEM are
shown in Fig. 6.1. All the samples exhibit similar size and fiber like nanostructures. These
microstructures amalgamated to spherical macro domains. The size of spherical shaped
macrodomains is about 100-200 nm. It is not clear from the images the exact location of the
micropores. However, there is a high possibility of the existence of the micropores in the voids
created by the nano-sized fiber structures. There is no effect of doping found in the SEM
images, which indicates no structural distortion is occurred due to the insertion of 10% of
doping materials.
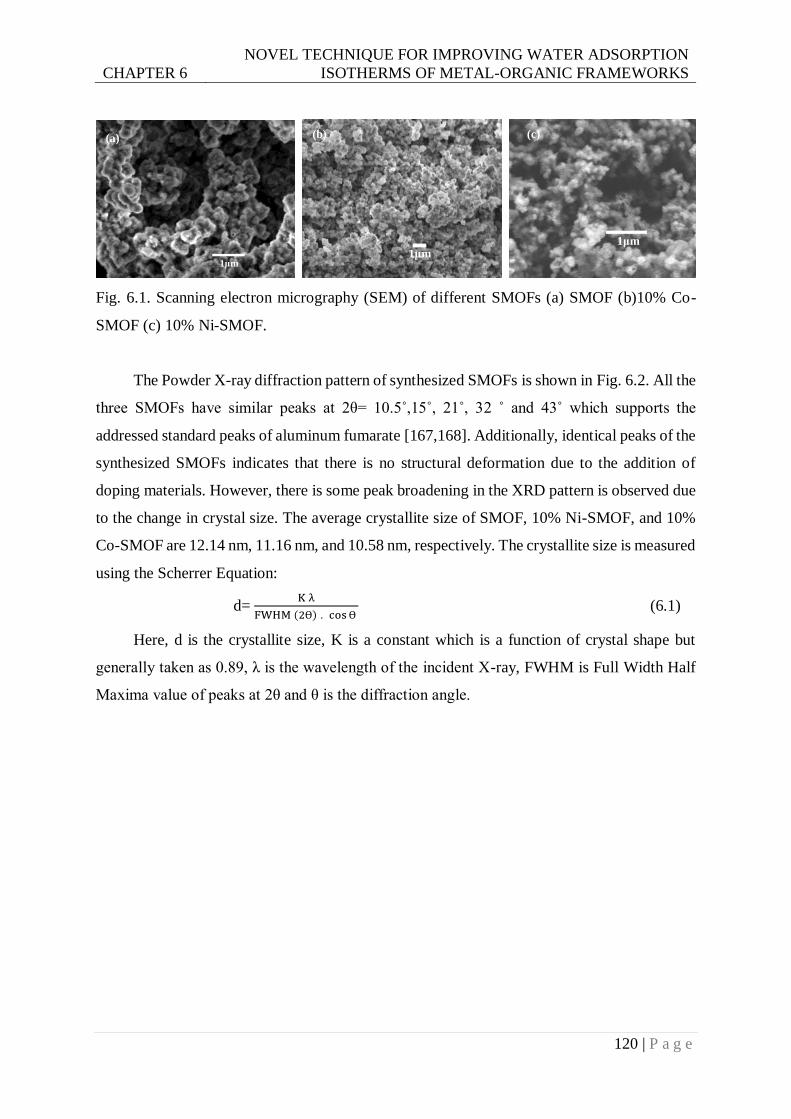
CHAPTER 6
NOVEL TECHNIQUE FOR IMPROVING WATER ADSORPTION
ISOTHERMS OF METAL-ORGANIC FRAMEWORKS
120 | P a g e
Fig. 6.1. Scanning electron micrography (SEM) of different SMOFs (a) SMOF (b)10% Co-
SMOF (c) 10% Ni-SMOF.
The Powder X-ray diffraction pattern of synthesized SMOFs is shown in Fig. 6.2. All the
three SMOFs have similar peaks at 2θ= 10.5˚,15˚, 21˚, 32 ˚ and 43˚ which supports the
addressed standard peaks of aluminum fumarate [167,168]. Additionally, identical peaks of the
synthesized SMOFs indicates that there is no structural deformation due to the addition of
doping materials. However, there is some peak broadening in the XRD pattern is observed due
to the change in crystal size. The average crystallite size of SMOF, 10% Ni-SMOF, and 10%
Co-SMOF are 12.14 nm, 11.16 nm, and 10.58 nm, respectively. The crystallite size is measured
using the Scherrer Equation:
d= K λ
FWHM (2ϴ) . cos ϴ (6.1)
Here, d is the crystallite size, K is a constant which is a function of crystal shape but
generally taken as 0.89, λ is the wavelength of the incident X-ray, FWHM is Full Width Half
Maxima value of peaks at 2θ and θ is the diffraction angle.
1μm
1μm 1μm
(a) (b) (c)
1μm
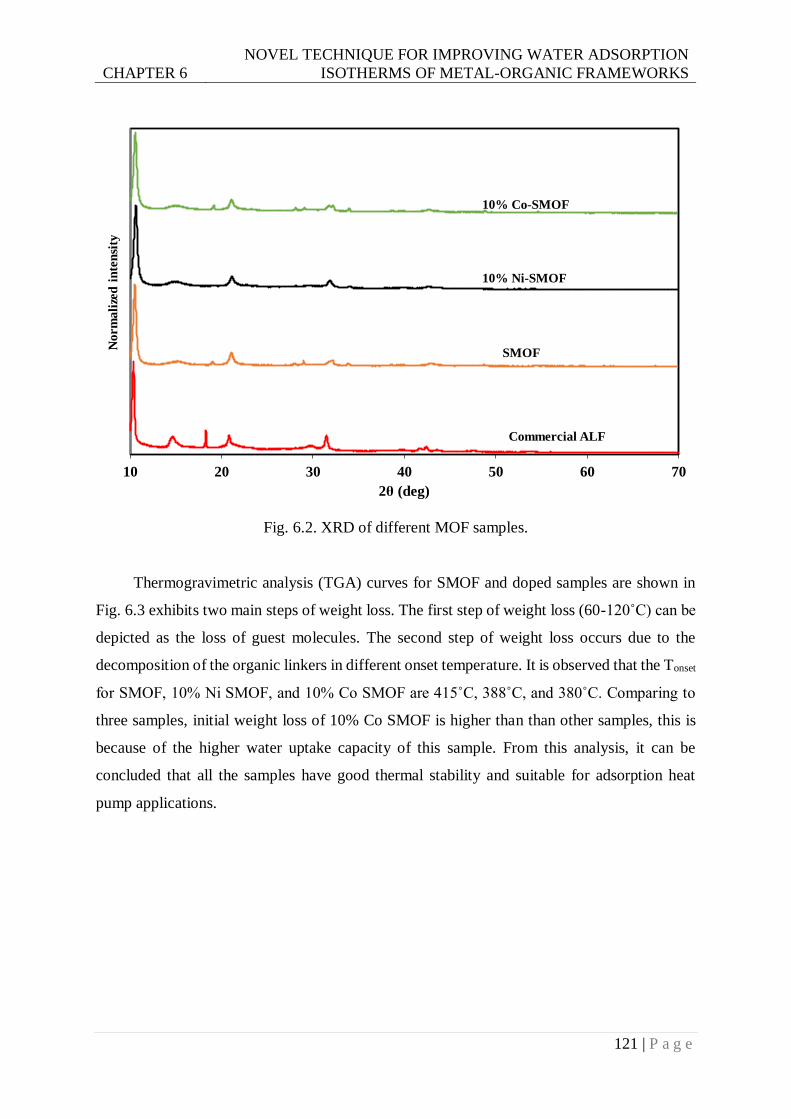
CHAPTER 6
NOVEL TECHNIQUE FOR IMPROVING WATER ADSORPTION
ISOTHERMS OF METAL-ORGANIC FRAMEWORKS
121 | P a g e
Fig. 6.2. XRD of different MOF samples.
Thermogravimetric analysis (TGA) curves for SMOF and doped samples are shown in
Fig. 6.3 exhibits two main steps of weight loss. The first step of weight loss (60-120˚C) can be
depicted as the loss of guest molecules. The second step of weight loss occurs due to the
decomposition of the organic linkers in different onset temperature. It is observed that the Tonset
for SMOF, 10% Ni SMOF, and 10% Co SMOF are 415˚C, 388˚C, and 380˚C. Comparing to
three samples, initial weight loss of 10% Co SMOF is higher than than other samples, this is
because of the higher water uptake capacity of this sample. From this analysis, it can be
concluded that all the samples have good thermal stability and suitable for adsorption heat
pump applications.
0
50000
100000
150000
200000
250000
300000
10 20 30 40 50 60 70
2θ (deg)
Norm
ali
zed
in
ten
sity
10% Co-SMOF
10% Ni-SMOF
SMOF
Commercial ALF
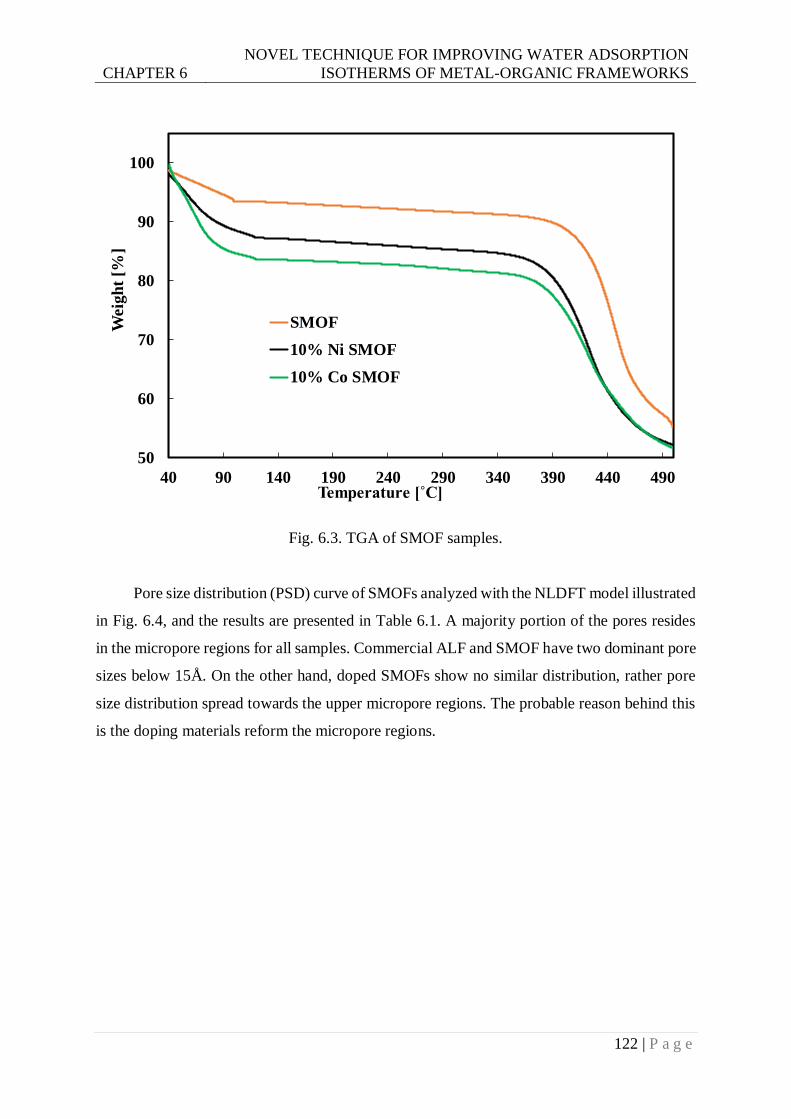
CHAPTER 6
NOVEL TECHNIQUE FOR IMPROVING WATER ADSORPTION
ISOTHERMS OF METAL-ORGANIC FRAMEWORKS
122 | P a g e
Fig. 6.3. TGA of SMOF samples.
Pore size distribution (PSD) curve of SMOFs analyzed with the NLDFT model illustrated
in Fig. 6.4, and the results are presented in Table 6.1. A majority portion of the pores resides
in the micropore regions for all samples. Commercial ALF and SMOF have two dominant pore
sizes below 15Å. On the other hand, doped SMOFs show no similar distribution, rather pore
size distribution spread towards the upper micropore regions. The probable reason behind this
is the doping materials reform the micropore regions.
50
60
70
80
90
100
40 90 140 190 240 290 340 390 440 490
Weig
ht
[%]
Temperature [˚C]
SMOF
10% Ni SMOF
10% Co SMOF
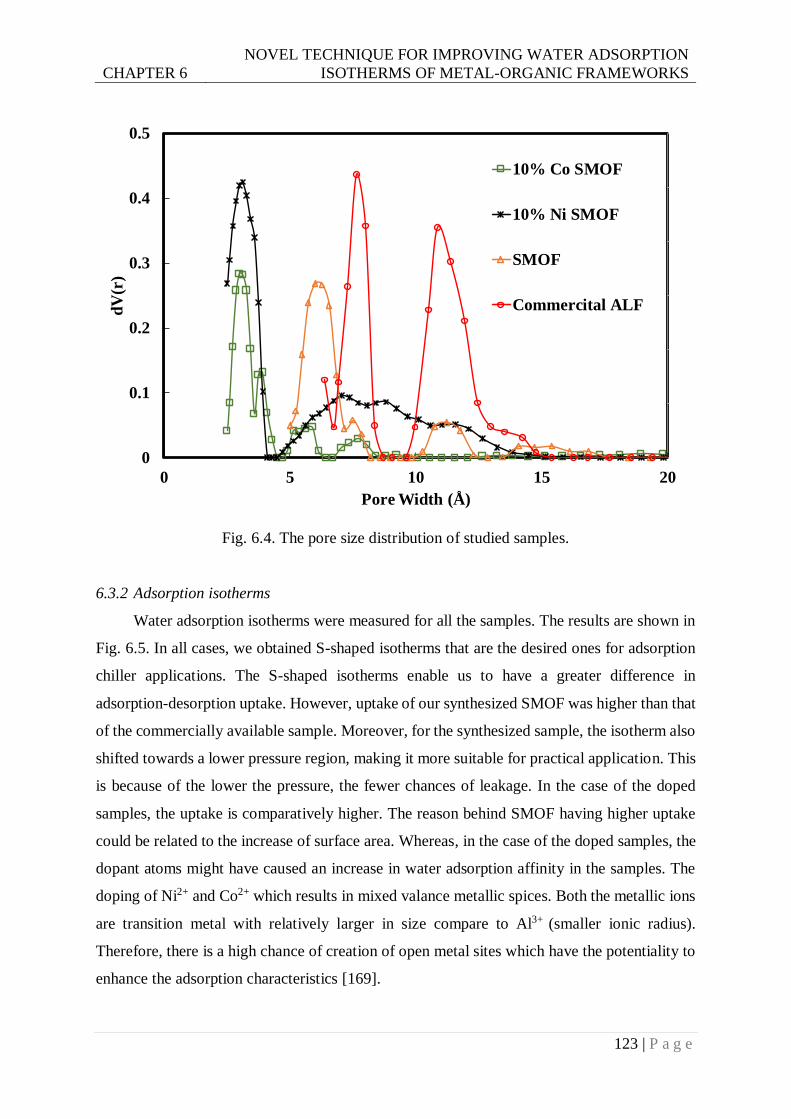
CHAPTER 6
NOVEL TECHNIQUE FOR IMPROVING WATER ADSORPTION
ISOTHERMS OF METAL-ORGANIC FRAMEWORKS
123 | P a g e
Fig. 6.4. The pore size distribution of studied samples.
6.3.2 Adsorption isotherms
Water adsorption isotherms were measured for all the samples. The results are shown in
Fig. 6.5. In all cases, we obtained S-shaped isotherms that are the desired ones for adsorption
chiller applications. The S-shaped isotherms enable us to have a greater difference in
adsorption-desorption uptake. However, uptake of our synthesized SMOF was higher than that
of the commercially available sample. Moreover, for the synthesized sample, the isotherm also
shifted towards a lower pressure region, making it more suitable for practical application. This
is because of the lower the pressure, the fewer chances of leakage. In the case of the doped
samples, the uptake is comparatively higher. The reason behind SMOF having higher uptake
could be related to the increase of surface area. Whereas, in the case of the doped samples, the
dopant atoms might have caused an increase in water adsorption affinity in the samples. The
doping of Ni2+ and Co2+ which results in mixed valance metallic spices. Both the metallic ions
are transition metal with relatively larger in size compare to Al3+ (smaller ionic radius).
Therefore, there is a high chance of creation of open metal sites which have the potentiality to
enhance the adsorption characteristics [169].
0
0.01
0.02
0.03
0.04
0.05
0.06
0
0.1
0.2
0.3
0.4
0.5
0 5 10 15 20
dV
(r)
Pore Width (Å)
10% Co SMOF
10% Ni SMOF
SMOF
Commercital ALF
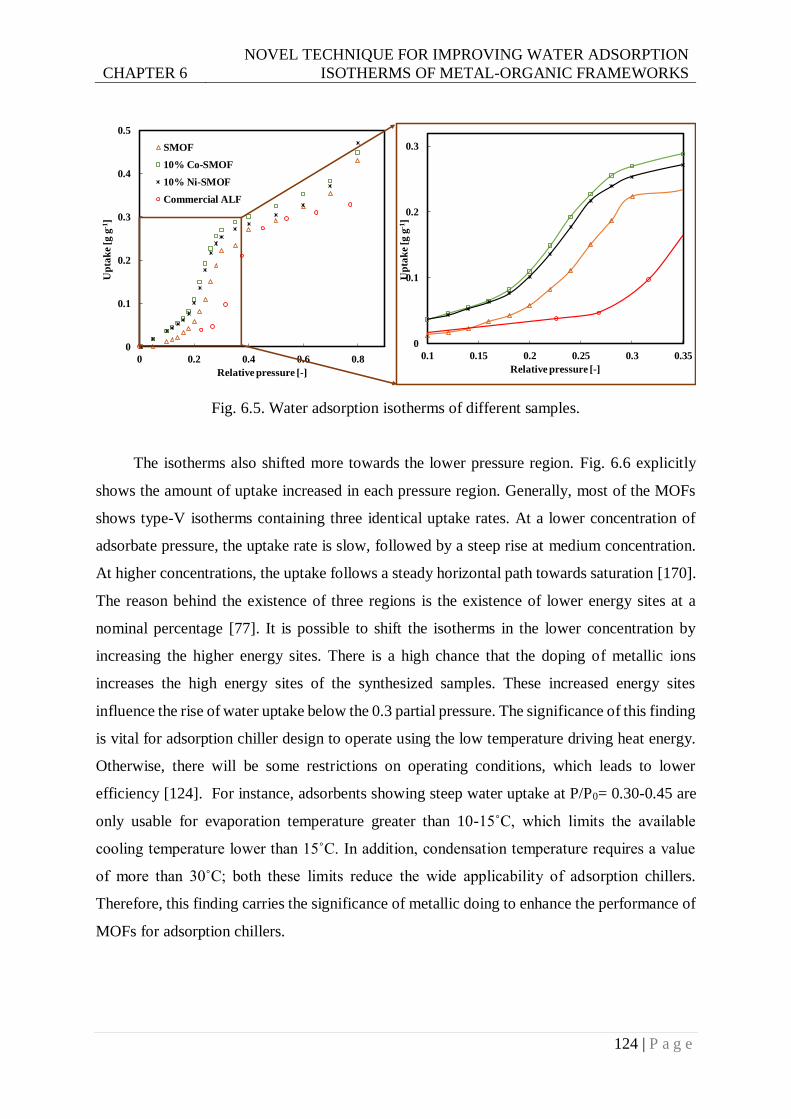
CHAPTER 6
NOVEL TECHNIQUE FOR IMPROVING WATER ADSORPTION
ISOTHERMS OF METAL-ORGANIC FRAMEWORKS
124 | P a g e
Fig. 6.5. Water adsorption isotherms of different samples.
The isotherms also shifted more towards the lower pressure region. Fig. 6.6 explicitly
shows the amount of uptake increased in each pressure region. Generally, most of the MOFs
shows type-V isotherms containing three identical uptake rates. At a lower concentration of
adsorbate pressure, the uptake rate is slow, followed by a steep rise at medium concentration.
At higher concentrations, the uptake follows a steady horizontal path towards saturation [170].
The reason behind the existence of three regions is the existence of lower energy sites at a
nominal percentage [77]. It is possible to shift the isotherms in the lower concentration by
increasing the higher energy sites. There is a high chance that the doping of metallic ions
increases the high energy sites of the synthesized samples. These increased energy sites
influence the rise of water uptake below the 0.3 partial pressure. The significance of this finding
is vital for adsorption chiller design to operate using the low temperature driving heat energy.
Otherwise, there will be some restrictions on operating conditions, which leads to lower
efficiency [124]. For instance, adsorbents showing steep water uptake at P/P0= 0.30-0.45 are
only usable for evaporation temperature greater than 10-15˚C, which limits the available
cooling temperature lower than 15˚C. In addition, condensation temperature requires a value
of more than 30˚C; both these limits reduce the wide applicability of adsorption chillers.
Therefore, this finding carries the significance of metallic doing to enhance the performance of
MOFs for adsorption chillers.
0
0.1
0.2
0.3
0.4
0.5
0 0.2 0.4 0.6 0.8
Up
tak
e [g
g-1
]
Relative pressure [-]
SMOF
10% Co-SMOF
10% Ni-SMOF
Commercial ALF
0
0.1
0.2
0.3
0.1 0.15 0.2 0.25 0.3 0.35
Up
tak
e [g
g-1
]
Relative pressure [-]
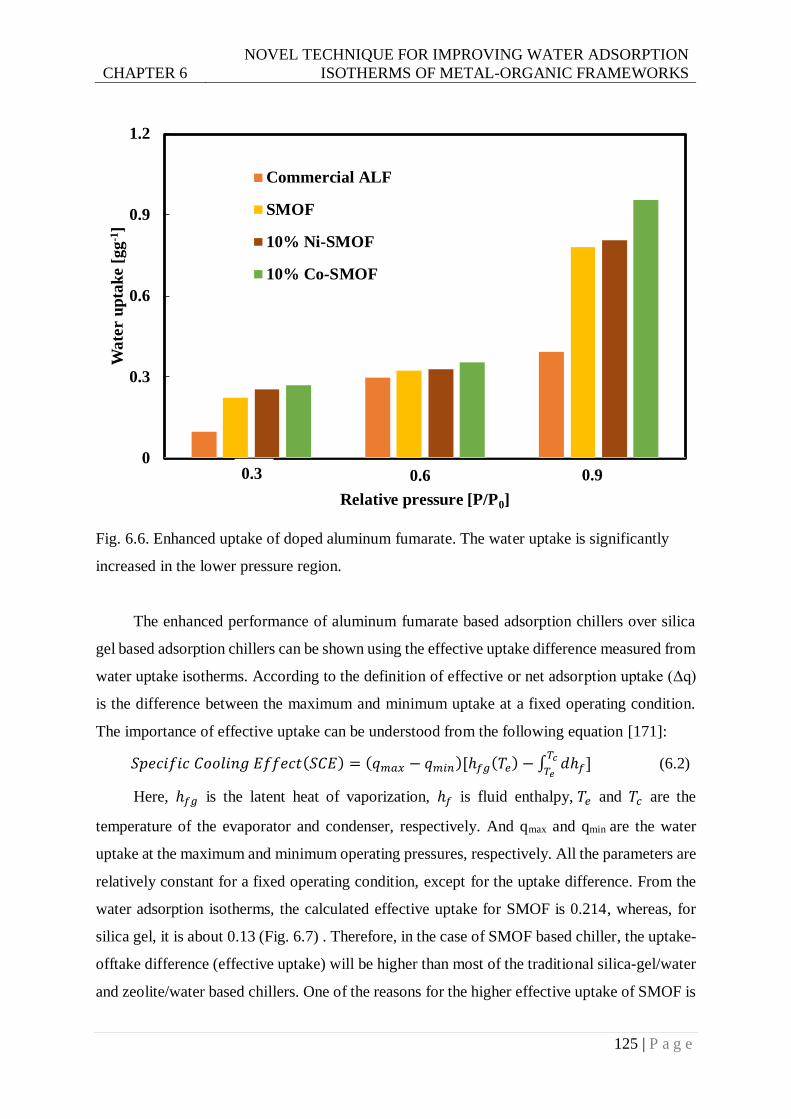
CHAPTER 6
NOVEL TECHNIQUE FOR IMPROVING WATER ADSORPTION
ISOTHERMS OF METAL-ORGANIC FRAMEWORKS
125 | P a g e
Fig. 6.6. Enhanced uptake of doped aluminum fumarate. The water uptake is significantly
increased in the lower pressure region.
The enhanced performance of aluminum fumarate based adsorption chillers over silica
gel based adsorption chillers can be shown using the effective uptake difference measured from
water uptake isotherms. According to the definition of effective or net adsorption uptake (Δq)
is the difference between the maximum and minimum uptake at a fixed operating condition.
The importance of effective uptake can be understood from the following equation [171]:
𝑆𝑝𝑒𝑐𝑖𝑓𝑖𝑐 𝐶𝑜𝑜𝑙𝑖𝑛𝑔 𝐸𝑓𝑓𝑒𝑐𝑡(𝑆𝐶𝐸) = (𝑞𝑚𝑎𝑥 − 𝑞𝑚𝑖𝑛)[ℎ𝑓𝑔(𝑇𝑒) − ∫ 𝑑ℎ𝑓𝑇𝑐
𝑇𝑒] (6.2)
Here, ℎ𝑓𝑔 is the latent heat of vaporization, ℎ𝑓 is fluid enthalpy, 𝑇𝑒 and 𝑇𝑐 are the
temperature of the evaporator and condenser, respectively. And qmax and qmin are the water
uptake at the maximum and minimum operating pressures, respectively. All the parameters are
relatively constant for a fixed operating condition, except for the uptake difference. From the
water adsorption isotherms, the calculated effective uptake for SMOF is 0.214, whereas, for
silica gel, it is about 0.13 (Fig. 6.7) . Therefore, in the case of SMOF based chiller, the uptake-
offtake difference (effective uptake) will be higher than most of the traditional silica-gel/water
and zeolite/water based chillers. One of the reasons for the higher effective uptake of SMOF is
0
0.3
0.6
0.9
1.2
1 2 3
Wate
r u
pta
ke [
gg
-1]
Relative pressure [P/P0]
Commercial ALF
SMOF
10% Ni-SMOF
10% Co-SMOF
0.3 0.6 0.9
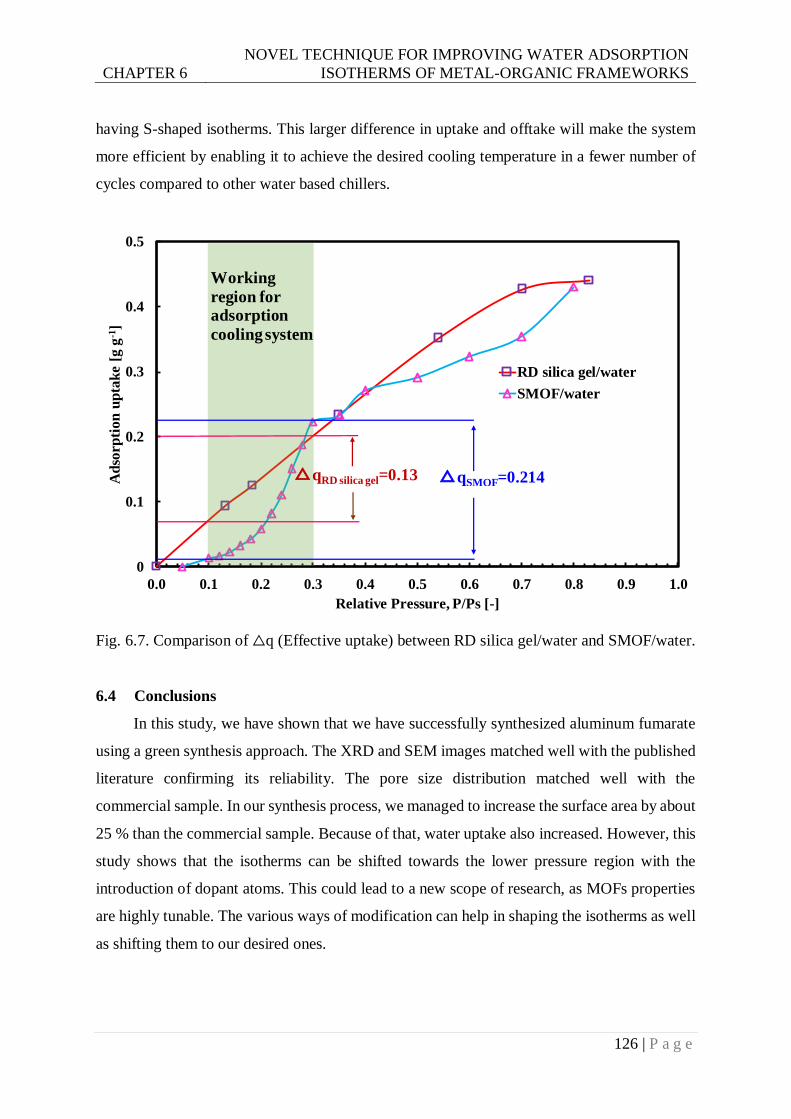
CHAPTER 6
NOVEL TECHNIQUE FOR IMPROVING WATER ADSORPTION
ISOTHERMS OF METAL-ORGANIC FRAMEWORKS
126 | P a g e
having S-shaped isotherms. This larger difference in uptake and offtake will make the system
more efficient by enabling it to achieve the desired cooling temperature in a fewer number of
cycles compared to other water based chillers.
Fig. 6.7. Comparison of △q (Effective uptake) between RD silica gel/water and SMOF/water.
6.4 Conclusions
In this study, we have shown that we have successfully synthesized aluminum fumarate
using a green synthesis approach. The XRD and SEM images matched well with the published
literature confirming its reliability. The pore size distribution matched well with the
commercial sample. In our synthesis process, we managed to increase the surface area by about
25 % than the commercial sample. Because of that, water uptake also increased. However, this
study shows that the isotherms can be shifted towards the lower pressure region with the
introduction of dopant atoms. This could lead to a new scope of research, as MOFs properties
are highly tunable. The various ways of modification can help in shaping the isotherms as well
as shifting them to our desired ones.
0
0.1
0.2
0.3
0.4
0.5
0.0 0.1 0.2 0.3 0.4 0.5 0.6 0.7 0.8 0.9 1.0
Ad
sorp
tion
up
tak
e [
g g
-1]
Relative Pressure, P/Ps [-]
RD silica gel/water
SMOF/water
Working
region for adsorption
cooling system
△qSMOF=0.214△qRD silica gel=0.13
127 | P a g e
Chapter 7
Study on Surface Activities of Improved
Metal-doped Metal-organic Frameworks Equation Chapter 7 Section 1
The concept of this chapter is inspired by the results obtained from the surface energy
analysis (Chapter 4) and the improved water uptake characteristic of SMOFs (Chapter 6). It is
found that the incorporation of different metallic ions into SMOFs improves the water uptake
capacity and shifts the water adsorption isotherms towards hydrophilic regions, which are
significant findings for adsorption related applications. The incorporation of the metallic ions
inspired by chapter 4, targeting to improve the specific surface energy that might influence
water uptake capacity. The assumption was correct, and that leads to analyzing the
corresponding surface energy of the improved SMOFs. This chapter thus provides a rigorous
analysis of surface energy components of the doped SMOFs with an additional comparison
with other promising adsorbents. Furthermore, the study of the work of adhesions is also
included to understand the affinity variation due to doping.
7.1 Materials synthesis and preparation
All the studied samples are synthesized using a hydrothermal process, and the detailed
process is described in chapter 6. For the doping process, the following concentration of the
NiCl2 and CoCl2 salt were used:
Table 7.1. The doping concentration of the doped SMOFs.
Sample name Al2(SO4)3.18H2O CoCl2 NiCl2
10% Co-SMOF 6.2999 g 0.3594 g -
20% Co-SMOF 5.599 g 0.7188 -
10% Ni-SMOF 6.299 g - 0.3594 g
20% Ni-SMOF 5.599 g - 0.7188
The samples were preserved in a sealed container to mitigate the adsorption of water
vapor from the environment. However, all the samples were degassed at 120˚C before
CHAPTER 7
STUDY ON SURFACE ACTIVITIES OF IMPROVED METAL-
DOPED METAL-ORGANIC FRAMEWORKS
128 | P a g e
performing characterization processes. To evaporate, most of the vapor content from the
samples degassing process was performed in a closed chamber having pressure below 1 MPa.
7.2 Experimental procedure
The pore size, pore volume, and specific surface area of samples were measured by N2
adsorption/desorption isotherms at 77 K. The samples were degassed at 120˚C for 3h prior to
N2 adsorption measurement. The pore size distribution is determined using NLDFT (Non-
Localized Density Functional Theory) from the N2 adsorption isotherms.
Water adsorption isotherms on SMOF samples were measured using a thermogravimetric
analyzer (TGA). In this experiment, a magnetic suspension adsorption measurement unit
(Rubotherm-MSB-VGS2) supplied by BEL Japan Inc. for all the samples, 65 mg of samples
were put on the sample holder. Then the samples were put into the measuring chamber of the
magnetic suspension balance section. The samples were regenerated at 100 °C under a vacuum
condition for 4 hours. Then the samples were made to cool down until they reach the adsorption
temperature. After that, the vacuum facility is disconnected from the measuring chamber. The
measuring chamber, then it connected with the evaporator chamber temperature of the
evaporator, was controlled using an oil bath. The pressure of the measuring chamber rapidly
increased until it reached the corresponding set evaporator temperature. After that, the
adsorbent mass was recorded until it reached equilibrium uptake. The evaporator is then
disconnected from the adsorption chamber, where its temperature increases to a particular value
to create a new evaporation pressure for the next adsorption uptake measurement. These steps
were repeated for all the isotherms measurements.
The IGC experiment was performed by pulse or frontal technique in infinite dilution. In
the pulse experiment, a small concentration of the probe molecule is injected, and the amount
is controlled using the targeted surface coverage. In this experiment, targeted surface coverage
was considerably small compared to the total surface coverage to maintain the experiment in
zero coverage/ infinite dilution. The pulse was then transported by the mobile phase (helium
gas) to the column containing SMOFs in the stationary phase. The columns were made of glass,
sterilized, and used only once for one sample to avoid contamination. Columns were filled with
3-5 mg of samples packed with glass wools at the top and bottom of the samples that the mobile
phase can pass through the column without any kind of adsorption in the glass wools. Before
conducting the pulse experiment, the samples are conditioned for 3 hours at 423 K with a
CHAPTER 7
STUDY ON SURFACE ACTIVITIES OF IMPROVED METAL-
DOPED METAL-ORGANIC FRAMEWORKS
129 | P a g e
helium carrier gas flow rate of 30 sccm to remove pre-adsorbed vapor contents. Afterward,
methane is purged through the column twice for 3 minutes each to measure the dead retention
time (t0). The targeted surface coverages were from 0.005 to 0.01, which were theoretically
measured from the monolayer coverage theorem [60]. The schematic of the experimental setup
is presented in Fig. 2.11. The interactions were measured using non-polar (hexane, heptane,
and octane) and polar probes (ethanol, dichloromethane, acetone, acetonitrile, and ethyl
acetate) by pulse injection through the column at 413 K temperature and helium flow rate of
30 sccm. The desorbed probe molecules were detected as chromatographic peak using a flame
ionization detector.
7.3 Results and discussion
7.3.1 Morphological characterization
BET surface area is the fundamental morphological feature that provides the estimation
of the possible area for available energy sites. It was also used in the IGC experiments to
calculate the target coverage area. The measured surface area is presented in Table 7.2. Among
the studied samples, SMOF exhibits the highest surface area, and it continuously decreases
with the increase of doping concentration. It was observed that, for the 10% increase of the
doping concentration, there were about 50 m2 g-1 reductions of surface area from the parent
SMOF and the trend was continued for 20% doping concentration.
Table 7.2. Porous properties of the studied samples
Material Surface area
[m2 g-1]
Pore size
[Å]
Pore volume
[cm3 g-1]
SMOF 874.10 10.84 0.371
SMOF 10% Co 751.56 11.2 0.307
SMOF 20% Co 705.384 10.80 0.305
SMOF 10 % Ni 745.68 11.17 0.302
SMOF 20 % Ni 696.97 - -
7.3.2 Water Adsorption isotherms
Water adsorption isotherm was measured for all the SMOF samples. This chapter is
considering only the desorption isotherms at 303 K and 343 K to correlate these with the surface
energy components. The desorption isotherms are more suitable to compare as the IGC
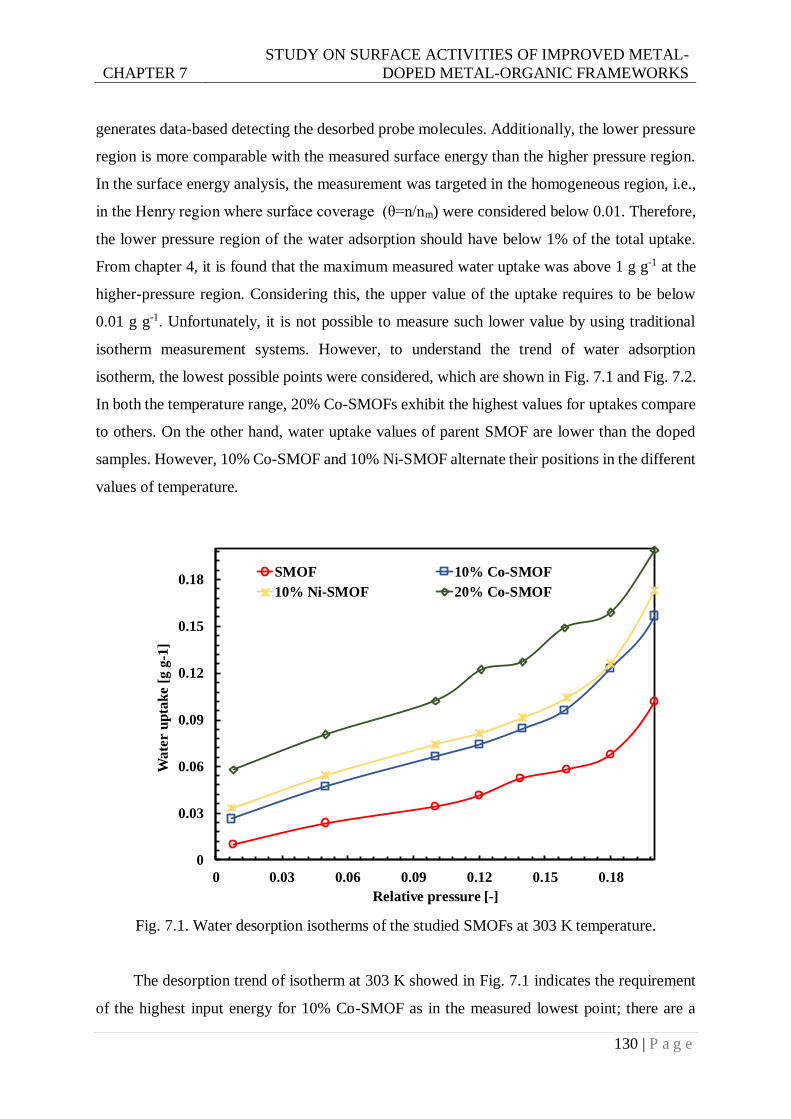
CHAPTER 7
STUDY ON SURFACE ACTIVITIES OF IMPROVED METAL-
DOPED METAL-ORGANIC FRAMEWORKS
130 | P a g e
generates data-based detecting the desorbed probe molecules. Additionally, the lower pressure
region is more comparable with the measured surface energy than the higher pressure region.
In the surface energy analysis, the measurement was targeted in the homogeneous region, i.e.,
in the Henry region where surface coverage (θ=n/nm) were considered below 0.01. Therefore,
the lower pressure region of the water adsorption should have below 1% of the total uptake.
From chapter 4, it is found that the maximum measured water uptake was above 1 g g-1 at the
higher-pressure region. Considering this, the upper value of the uptake requires to be below
0.01 g g-1. Unfortunately, it is not possible to measure such lower value by using traditional
isotherm measurement systems. However, to understand the trend of water adsorption
isotherm, the lowest possible points were considered, which are shown in Fig. 7.1 and Fig. 7.2.
In both the temperature range, 20% Co-SMOFs exhibit the highest values for uptakes compare
to others. On the other hand, water uptake values of parent SMOF are lower than the doped
samples. However, 10% Co-SMOF and 10% Ni-SMOF alternate their positions in the different
values of temperature.
Fig. 7.1. Water desorption isotherms of the studied SMOFs at 303 K temperature.
The desorption trend of isotherm at 303 K showed in Fig. 7.1 indicates the requirement
of the highest input energy for 10% Co-SMOF as in the measured lowest point; there are a
0
0.03
0.06
0.09
0.12
0.15
0.18
0 0.03 0.06 0.09 0.12 0.15 0.18
Wa
ter u
pta
ke [
g g
-1]
Relative pressure [-]
SMOF 10% Co-SMOF
10% Ni-SMOF 20% Co-SMOF
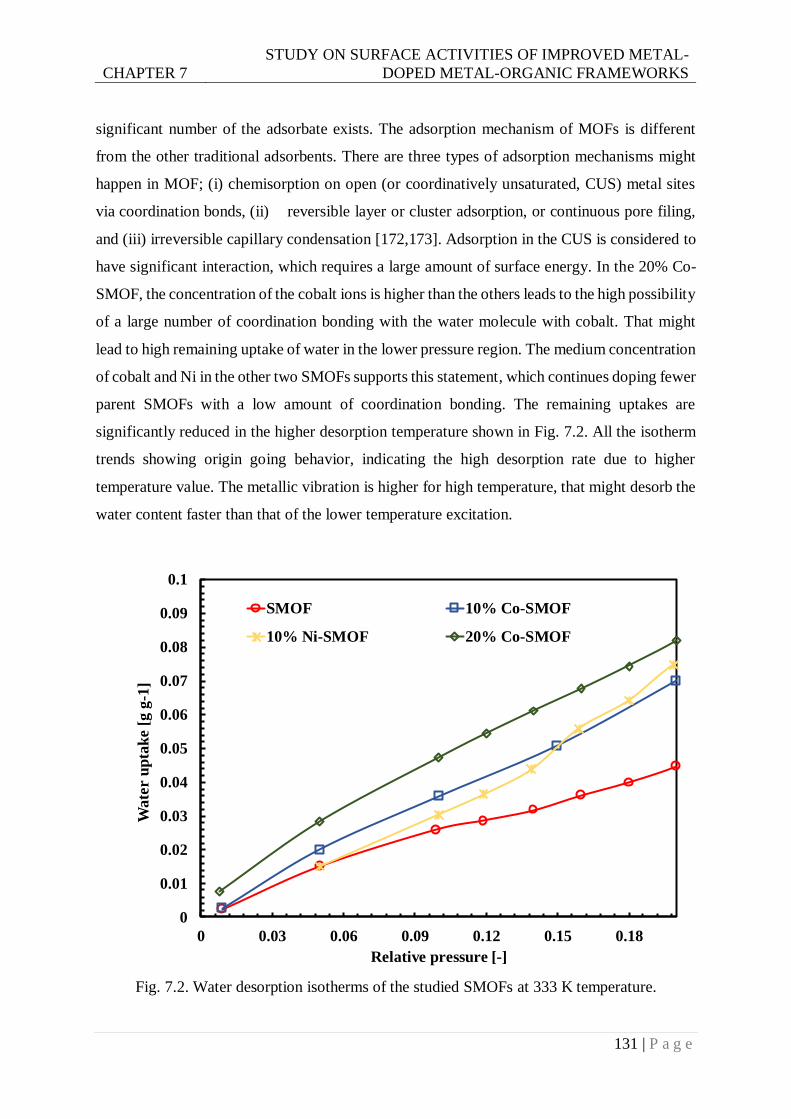
CHAPTER 7
STUDY ON SURFACE ACTIVITIES OF IMPROVED METAL-
DOPED METAL-ORGANIC FRAMEWORKS
131 | P a g e
significant number of the adsorbate exists. The adsorption mechanism of MOFs is different
from the other traditional adsorbents. There are three types of adsorption mechanisms might
happen in MOF; (i) chemisorption on open (or coordinatively unsaturated, CUS) metal sites
via coordination bonds, (ii) reversible layer or cluster adsorption, or continuous pore filing,
and (iii) irreversible capillary condensation [172,173]. Adsorption in the CUS is considered to
have significant interaction, which requires a large amount of surface energy. In the 20% Co-
SMOF, the concentration of the cobalt ions is higher than the others leads to the high possibility
of a large number of coordination bonding with the water molecule with cobalt. That might
lead to high remaining uptake of water in the lower pressure region. The medium concentration
of cobalt and Ni in the other two SMOFs supports this statement, which continues doping fewer
parent SMOFs with a low amount of coordination bonding. The remaining uptakes are
significantly reduced in the higher desorption temperature shown in Fig. 7.2. All the isotherm
trends showing origin going behavior, indicating the high desorption rate due to higher
temperature value. The metallic vibration is higher for high temperature, that might desorb the
water content faster than that of the lower temperature excitation.
Fig. 7.2. Water desorption isotherms of the studied SMOFs at 333 K temperature.
0
0.01
0.02
0.03
0.04
0.05
0.06
0.07
0.08
0.09
0.1
0 0.03 0.06 0.09 0.12 0.15 0.18
Wate
r u
pta
ke [
g g
-1]
Relative pressure [-]
SMOF 10% Co-SMOF
10% Ni-SMOF 20% Co-SMOF
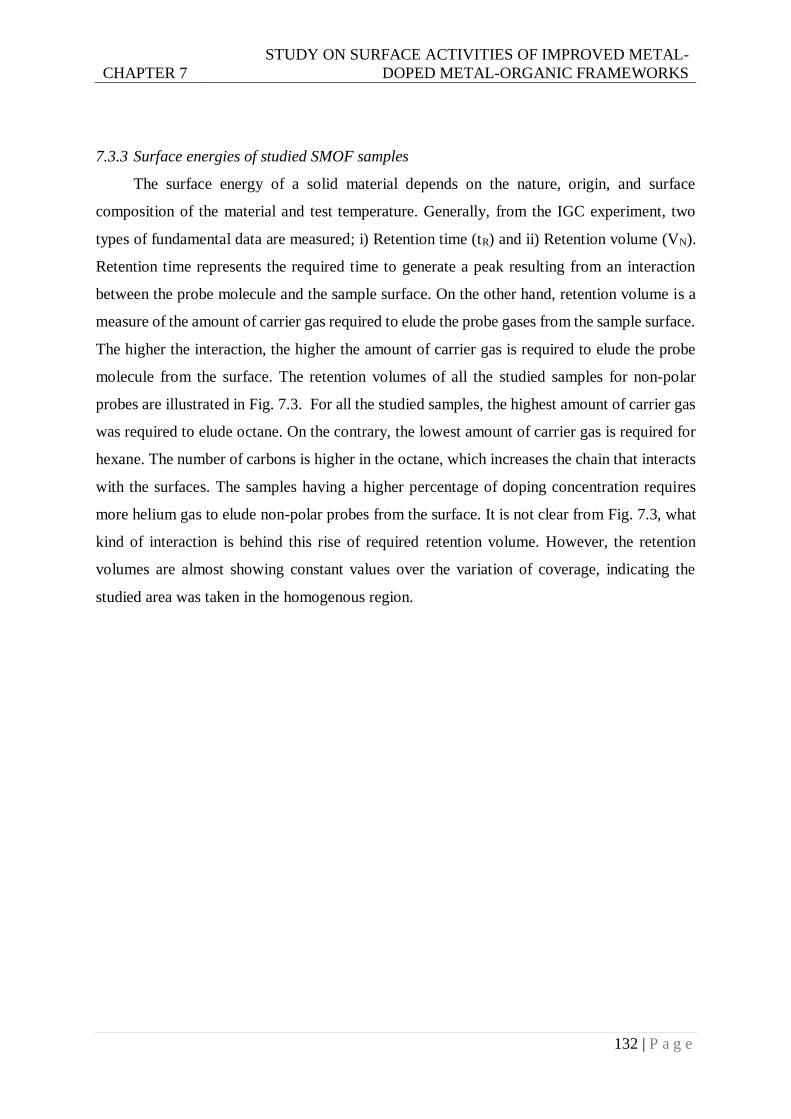
CHAPTER 7
STUDY ON SURFACE ACTIVITIES OF IMPROVED METAL-
DOPED METAL-ORGANIC FRAMEWORKS
132 | P a g e
7.3.3 Surface energies of studied SMOF samples
The surface energy of a solid material depends on the nature, origin, and surface
composition of the material and test temperature. Generally, from the IGC experiment, two
types of fundamental data are measured; i) Retention time (tR) and ii) Retention volume (VN).
Retention time represents the required time to generate a peak resulting from an interaction
between the probe molecule and the sample surface. On the other hand, retention volume is a
measure of the amount of carrier gas required to elude the probe gases from the sample surface.
The higher the interaction, the higher the amount of carrier gas is required to elude the probe
molecule from the surface. The retention volumes of all the studied samples for non-polar
probes are illustrated in Fig. 7.3. For all the studied samples, the highest amount of carrier gas
was required to elude octane. On the contrary, the lowest amount of carrier gas is required for
hexane. The number of carbons is higher in the octane, which increases the chain that interacts
with the surfaces. The samples having a higher percentage of doping concentration requires
more helium gas to elude non-polar probes from the surface. It is not clear from Fig. 7.3, what
kind of interaction is behind this rise of required retention volume. However, the retention
volumes are almost showing constant values over the variation of coverage, indicating the
studied area was taken in the homogenous region.
CHAPTER 7
STUDY ON SURFACE ACTIVITIES OF IMPROVED METAL-
DOPED METAL-ORGANIC FRAMEWORKS
133 | P a g e
Fig. 7.3. Retention volume vs. coverage for alkanes of all the studied samples.
In the pulse method, it is possible to measure the adsorption isotherms at the Henry region
because of the uptake measurement techniques. Unlike the conventional techniques where
volume or mass of the adsorbed phase are directly measured. Due to the significant variance in
the amount of the adsorbed phase molecules with the adsorbent, the accurate measure of the
adsorbate is not possible in the Henry region. However, in IGC, the adsorbed amount is
measured using the FID detector, where the desorbed molecules are detected after ionizing.
The resolution for the counting is possible to take in the nano-scale. In IGC to measure the
isotherm, at first, the equilibrium partial pressure, P, for each concentration of probe molecule
in the column can be calculated from the chromatographic shape via the Eq. (7.1) [174].
273.15
. . ..
cLoop inj
c c Loop
hP V P
F A T (7.1)
0.0E+0
1.0E+4
2.0E+4
3.0E+4
4.0E+4
5.0E+4
6.0E+4
0.004 0.005 0.006 0.007 0.008 0.009 0.01 0.011
Rete
nti
on
Volu
me (
Vn
) [m
l g
-1]
Surface Coverage [-]
SMOF
Hexane
Heptane
Octane
0.0E+0
5.0E+4
1.0E+5
1.5E+5
2.0E+5
2.5E+5
0.004 0.005 0.006 0.007 0.008 0.009 0.01 0.011
Rete
nti
on
Volu
me (
Vn)
[ml
g-1
]
Surface Coverage [-]
SMOF 10% Co
Hexane
Heptane
Octane
0.0E+0
5.0E+4
1.0E+5
1.5E+5
2.0E+5
2.5E+5
3.0E+5
3.5E+5
4.0E+5
4.5E+5
0.004 0.005 0.006 0.007 0.008 0.009 0.01 0.011
Rete
nti
on
Volu
me (
Vn)
[ml
g-1
]
Surface Coverage [-]
SMOF 20% Co
Hexane
Heptane
Octane
0.0E+0
1.0E+4
2.0E+4
3.0E+4
4.0E+4
5.0E+4
6.0E+4
0.004 0.005 0.006 0.007 0.008 0.009 0.01 0.011
Rete
nti
on
Volu
me (
Vn)
[ml
g-1
]
Surface Coverage [-]
SMOF 10% Ni
Hexane
Heptane
Octane
0.0E+0
2.0E+4
4.0E+4
6.0E+4
8.0E+4
1.0E+5
1.2E+5
1.4E+5
0.004 0.005 0.006 0.007 0.008 0.009 0.01 0.011
Rete
nti
on
Volu
me (
Vn)
[ml
g-1
]
Surface Coverage [-]
SMOF 20% Ni
Hexane
Heptane
Octane
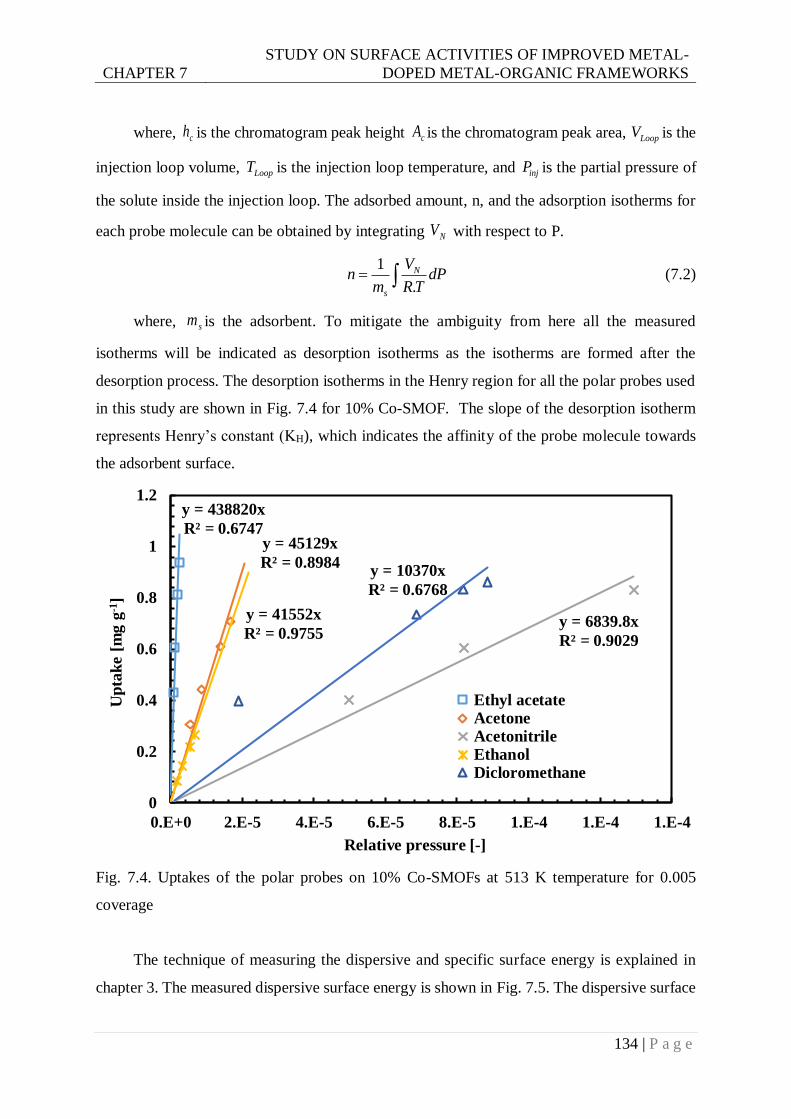
CHAPTER 7
STUDY ON SURFACE ACTIVITIES OF IMPROVED METAL-
DOPED METAL-ORGANIC FRAMEWORKS
134 | P a g e
where, ch is the chromatogram peak height cA is the chromatogram peak area, LoopV is the
injection loop volume, LoopT is the injection loop temperature, and injP is the partial pressure of
the solute inside the injection loop. The adsorbed amount, n, and the adsorption isotherms for
each probe molecule can be obtained by integrating NV with respect to P.
1
.
N
s
Vn dP
m R T (7.2)
where, sm is the adsorbent. To mitigate the ambiguity from here all the measured
isotherms will be indicated as desorption isotherms as the isotherms are formed after the
desorption process. The desorption isotherms in the Henry region for all the polar probes used
in this study are shown in Fig. 7.4 for 10% Co-SMOF. The slope of the desorption isotherm
represents Henry’s constant (KH), which indicates the affinity of the probe molecule towards
the adsorbent surface.
Fig. 7.4. Uptakes of the polar probes on 10% Co-SMOFs at 513 K temperature for 0.005
coverage
The technique of measuring the dispersive and specific surface energy is explained in
chapter 3. The measured dispersive surface energy is shown in Fig. 7.5. The dispersive surface
y = 438820x
R² = 0.6747y = 45129x
R² = 0.8984
y = 6839.8x
R² = 0.9029
y = 41552x
R² = 0.9755
y = 10370x
R² = 0.6768
0
0.2
0.4
0.6
0.8
1
1.2
0.E+0 2.E-5 4.E-5 6.E-5 8.E-5 1.E-4 1.E-4 1.E-4
Up
tak
e [
mg
g-1
]
Relative pressure [-]
Ethyl acetateAcetoneAcetonitrileEthanolDicloromethane
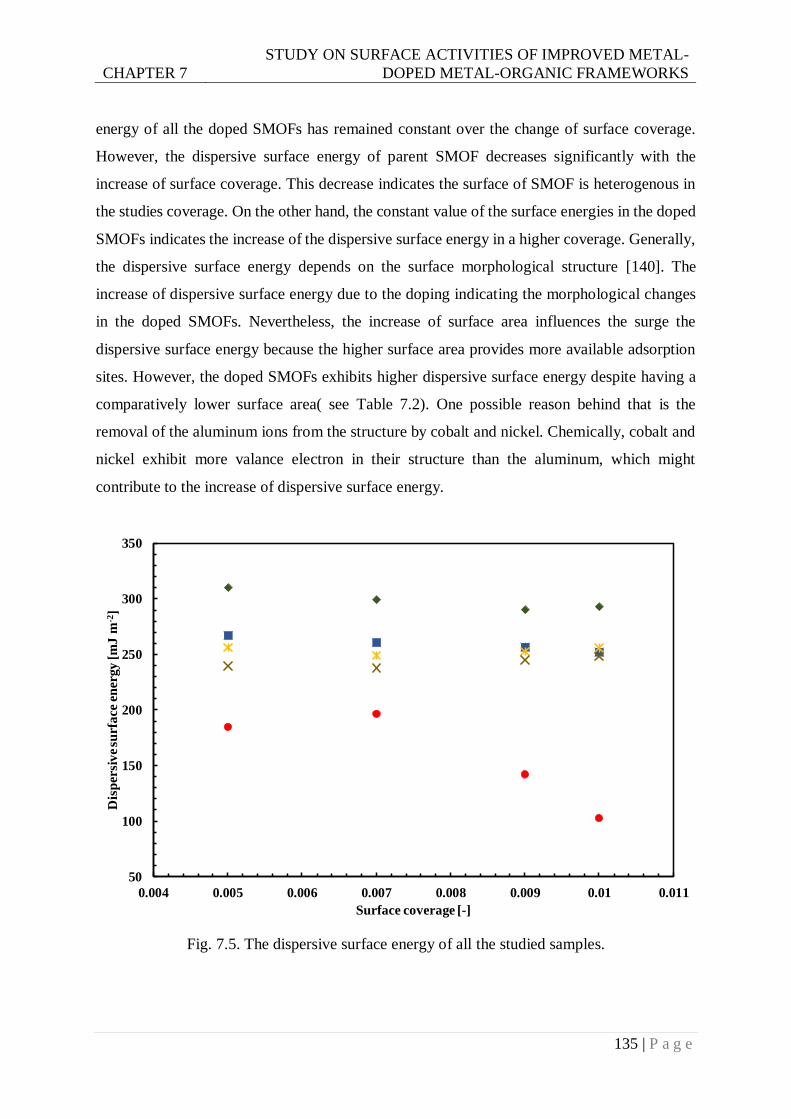
CHAPTER 7
STUDY ON SURFACE ACTIVITIES OF IMPROVED METAL-
DOPED METAL-ORGANIC FRAMEWORKS
135 | P a g e
energy of all the doped SMOFs has remained constant over the change of surface coverage.
However, the dispersive surface energy of parent SMOF decreases significantly with the
increase of surface coverage. This decrease indicates the surface of SMOF is heterogenous in
the studies coverage. On the other hand, the constant value of the surface energies in the doped
SMOFs indicates the increase of the dispersive surface energy in a higher coverage. Generally,
the dispersive surface energy depends on the surface morphological structure [140]. The
increase of dispersive surface energy due to the doping indicating the morphological changes
in the doped SMOFs. Nevertheless, the increase of surface area influences the surge the
dispersive surface energy because the higher surface area provides more available adsorption
sites. However, the doped SMOFs exhibits higher dispersive surface energy despite having a
comparatively lower surface area( see Table 7.2). One possible reason behind that is the
removal of the aluminum ions from the structure by cobalt and nickel. Chemically, cobalt and
nickel exhibit more valance electron in their structure than the aluminum, which might
contribute to the increase of dispersive surface energy.
Fig. 7.5. The dispersive surface energy of all the studied samples.
50
100
150
200
250
300
350
0.004 0.005 0.006 0.007 0.008 0.009 0.01 0.011
Dis
per
siv
e su
rfa
ce e
ner
gy [
mJ
m-2
]
Surface coverage [-]
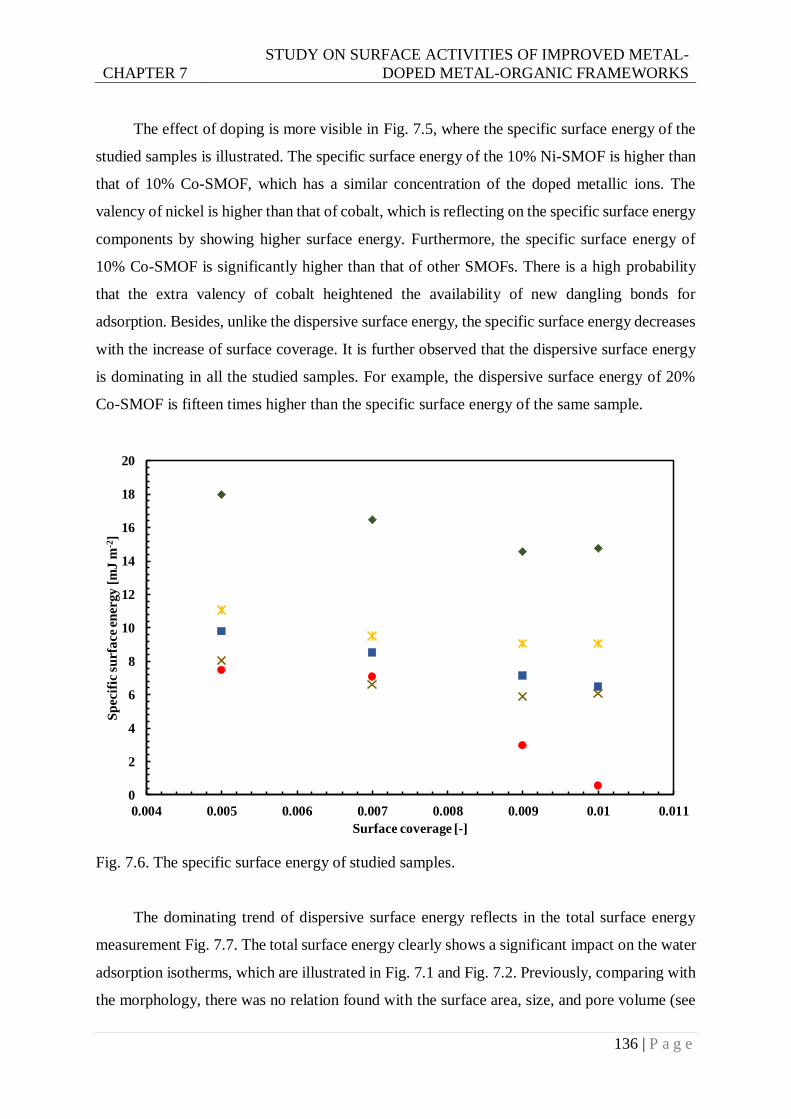
CHAPTER 7
STUDY ON SURFACE ACTIVITIES OF IMPROVED METAL-
DOPED METAL-ORGANIC FRAMEWORKS
136 | P a g e
The effect of doping is more visible in Fig. 7.5, where the specific surface energy of the
studied samples is illustrated. The specific surface energy of the 10% Ni-SMOF is higher than
that of 10% Co-SMOF, which has a similar concentration of the doped metallic ions. The
valency of nickel is higher than that of cobalt, which is reflecting on the specific surface energy
components by showing higher surface energy. Furthermore, the specific surface energy of
10% Co-SMOF is significantly higher than that of other SMOFs. There is a high probability
that the extra valency of cobalt heightened the availability of new dangling bonds for
adsorption. Besides, unlike the dispersive surface energy, the specific surface energy decreases
with the increase of surface coverage. It is further observed that the dispersive surface energy
is dominating in all the studied samples. For example, the dispersive surface energy of 20%
Co-SMOF is fifteen times higher than the specific surface energy of the same sample.
Fig. 7.6. The specific surface energy of studied samples.
The dominating trend of dispersive surface energy reflects in the total surface energy
measurement Fig. 7.7. The total surface energy clearly shows a significant impact on the water
adsorption isotherms, which are illustrated in Fig. 7.1 and Fig. 7.2. Previously, comparing with
the morphology, there was no relation found with the surface area, size, and pore volume (see
0
2
4
6
8
10
12
14
16
18
20
0.004 0.005 0.006 0.007 0.008 0.009 0.01 0.011
Sp
ecif
ic s
urf
ace
en
ergy [
mJ
m-2
]
Surface coverage [-]
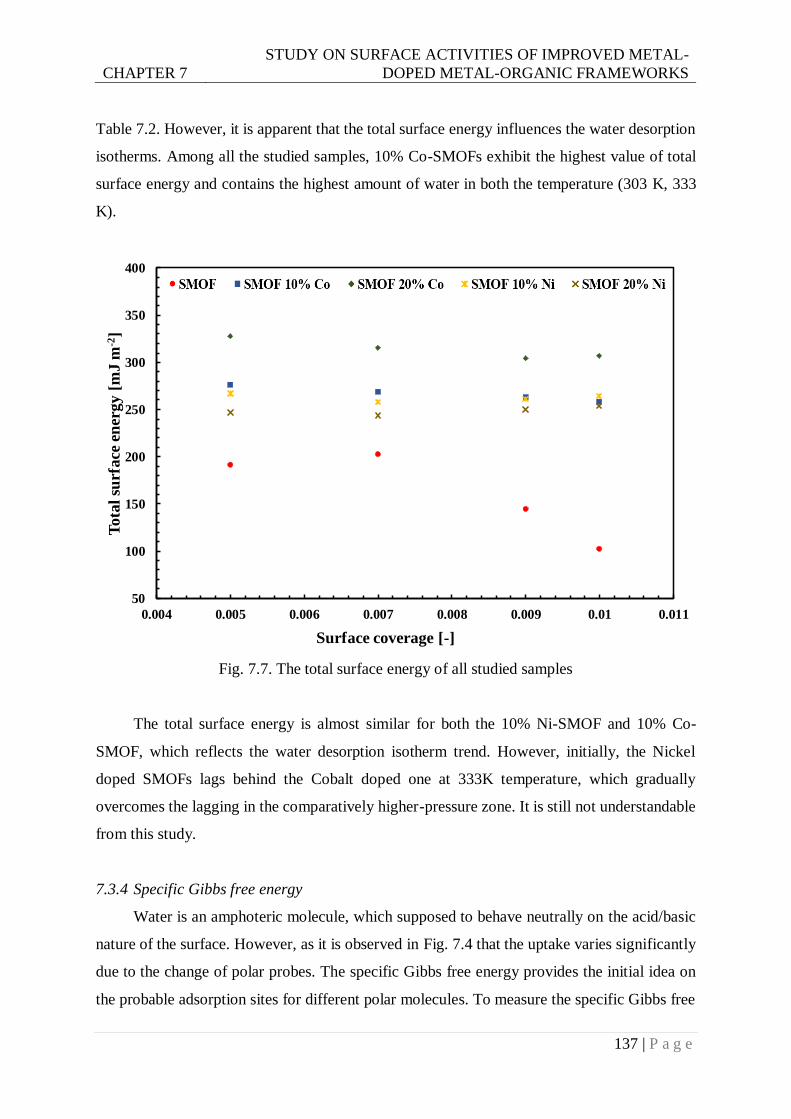
CHAPTER 7
STUDY ON SURFACE ACTIVITIES OF IMPROVED METAL-
DOPED METAL-ORGANIC FRAMEWORKS
137 | P a g e
Table 7.2. However, it is apparent that the total surface energy influences the water desorption
isotherms. Among all the studied samples, 10% Co-SMOFs exhibit the highest value of total
surface energy and contains the highest amount of water in both the temperature (303 K, 333
K).
Fig. 7.7. The total surface energy of all studied samples
The total surface energy is almost similar for both the 10% Ni-SMOF and 10% Co-
SMOF, which reflects the water desorption isotherm trend. However, initially, the Nickel
doped SMOFs lags behind the Cobalt doped one at 333K temperature, which gradually
overcomes the lagging in the comparatively higher-pressure zone. It is still not understandable
from this study.
7.3.4 Specific Gibbs free energy
Water is an amphoteric molecule, which supposed to behave neutrally on the acid/basic
nature of the surface. However, as it is observed in Fig. 7.4 that the uptake varies significantly
due to the change of polar probes. The specific Gibbs free energy provides the initial idea on
the probable adsorption sites for different polar molecules. To measure the specific Gibbs free
50
100
150
200
250
300
350
400
0.004 0.005 0.006 0.007 0.008 0.009 0.01 0.011
To
tal
surf
ace
en
erg
y [
mJ
m-2
]
Surface coverage [-]
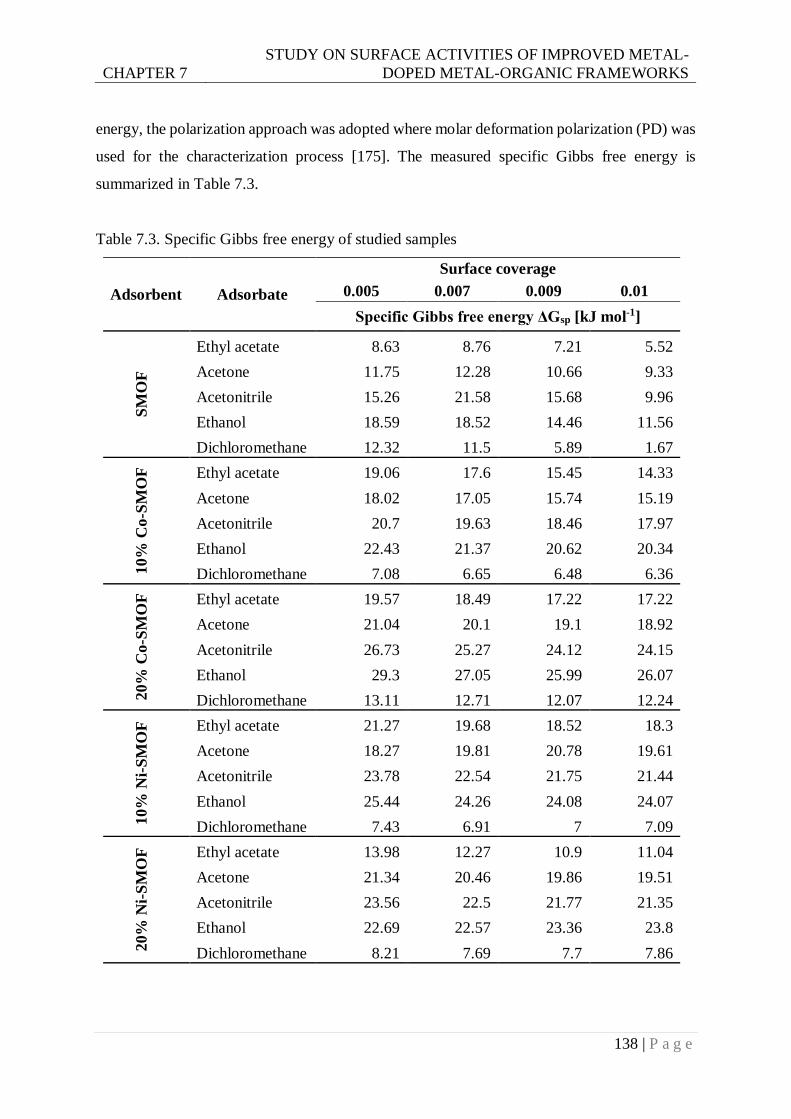
CHAPTER 7
STUDY ON SURFACE ACTIVITIES OF IMPROVED METAL-
DOPED METAL-ORGANIC FRAMEWORKS
138 | P a g e
energy, the polarization approach was adopted where molar deformation polarization (PD) was
used for the characterization process [175]. The measured specific Gibbs free energy is
summarized in Table 7.3.
Table 7.3. Specific Gibbs free energy of studied samples
Adsorbent Adsorbate
Surface coverage
0.005 0.007 0.009 0.01
Specific Gibbs free energy ΔGsp [kJ mol-1]
SM
OF
Ethyl acetate 8.63 8.76 7.21 5.52
Acetone 11.75 12.28 10.66 9.33
Acetonitrile 15.26 21.58 15.68 9.96
Ethanol 18.59 18.52 14.46 11.56
Dichloromethane 12.32 11.5 5.89 1.67
10%
Co-S
MO
F
Ethyl acetate 19.06 17.6 15.45 14.33
Acetone 18.02 17.05 15.74 15.19
Acetonitrile 20.7 19.63 18.46 17.97
Ethanol 22.43 21.37 20.62 20.34
Dichloromethane 7.08 6.65 6.48 6.36
20%
Co-S
MO
F
Ethyl acetate 19.57 18.49 17.22 17.22
Acetone 21.04 20.1 19.1 18.92
Acetonitrile 26.73 25.27 24.12 24.15
Ethanol 29.3 27.05 25.99 26.07
Dichloromethane 13.11 12.71 12.07 12.24
10%
Ni-
SM
OF
Ethyl acetate 21.27 19.68 18.52 18.3
Acetone 18.27 19.81 20.78 19.61
Acetonitrile 23.78 22.54 21.75 21.44
Ethanol 25.44 24.26 24.08 24.07
Dichloromethane 7.43 6.91 7 7.09
20%
Ni-
SM
OF
Ethyl acetate 13.98 12.27 10.9 11.04
Acetone 21.34 20.46 19.86 19.51
Acetonitrile 23.56 22.5 21.77 21.35
Ethanol 22.69 22.57 23.36 23.8
Dichloromethane 8.21 7.69 7.7 7.86
CHAPTER 7
STUDY ON SURFACE ACTIVITIES OF IMPROVED METAL-
DOPED METAL-ORGANIC FRAMEWORKS
139 | P a g e
Gibbs free energy is a measure of available surface energy that may contribute to the
adsorption process. The specific Gibbs free energy indicates the identical free energy for a
particular pair. It is observed that this free energy decreases with the increase in surface
coverage. It doesn’t directly depend on the surface area; rather, it depends on the amount and
type of functional group existed on the adsorbent/adsorbate pair. As a result, the doped SMOFs
exhibits a larger quantity of the Gibbs free energy than the parent SMOF. In the case of ethanol,
the amount is highest among all the studied samples. It is not confirmed how it is influenced
by the ethanol adsorption. However, it might be concluded in a manner that there is a high
possibility of this extra energy might contribute to increasing heat of adsorption for doped
SMOF/ethanol pairs.
7.4 Comparative analysis
The thermodynamic work of cohesion (particle-particle) and work of adhesion (particle-
liquid) is an important measure to understand the adsorption process. The higher surface energy
leads to greater cohesive forces, which influence the agglomeration and decreased load transfer
mechanism [176]. On the other hand, the work of adhesion with water measures the wettability
of the adsorbent. Therefore, the higher the value of work of adhesion creates a better
opportunity for water adsorption. The measured values are summarized in Table 7.4. Both the
works are the contribution of the dispersive and specific components. The ration of the work
of adhesion and cohesion shows the possibility of the wettability; higher is better. This ratio is
highest for SMOF, but the water uptake shown in this work is significantly lower compared to
others. The reason behind that the total work of adhesion is lower compare to others. In this
case, 20% of Co-SMOF exhibits the highest amount of work of adhesion for all the
experimented coverages. This reflects in the water adsorption isotherms. Furthermore, for all
the doped SMOFs, the ratio is almost similar; only the comparable parameter is the work of
adhesion. It is also observed that the work of cohesion is dominated by the dispersive
component, whereas for all the doped SMOFs, the work of adhesion comprises of both
components.
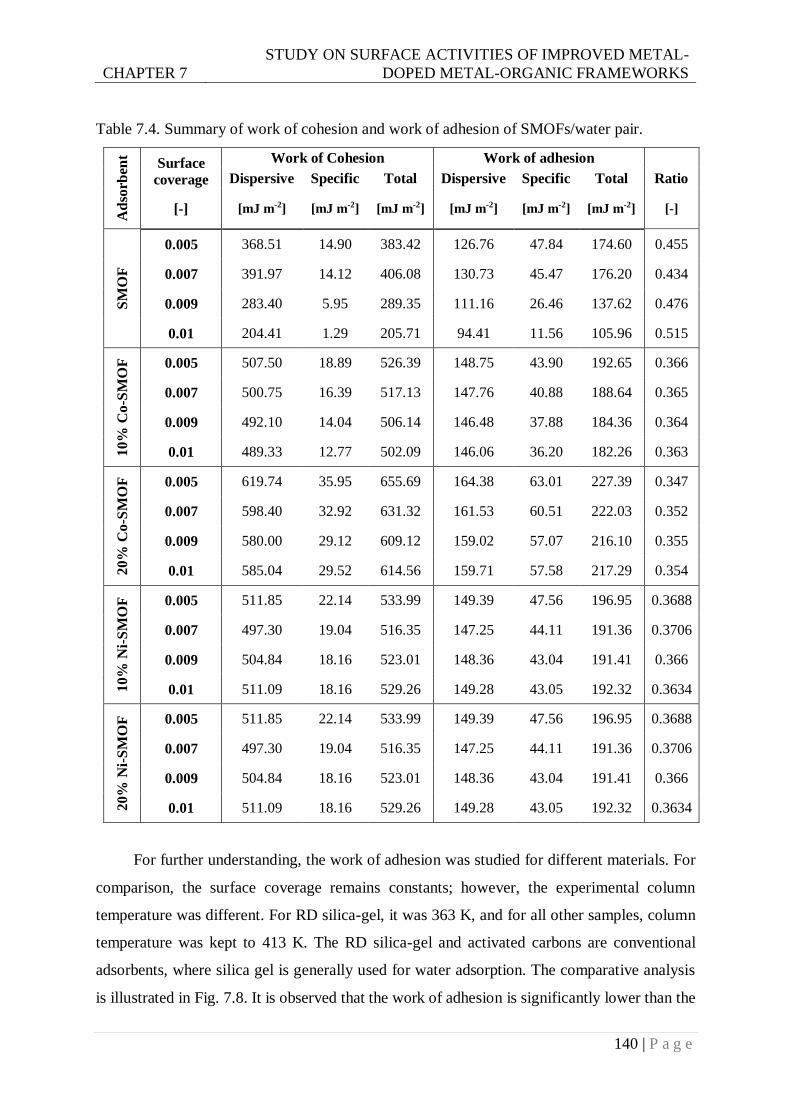
CHAPTER 7
STUDY ON SURFACE ACTIVITIES OF IMPROVED METAL-
DOPED METAL-ORGANIC FRAMEWORKS
140 | P a g e
Table 7.4. Summary of work of cohesion and work of adhesion of SMOFs/water pair. A
dso
rben
t
Surface
coverage
Work of Cohesion Work of adhesion
Dispersive Specific Total Dispersive Specific Total Ratio
[-] [mJ m-2] [mJ m-2] [mJ m-2] [mJ m-2] [mJ m-2] [mJ m-2] [-]
SM
OF
0.005 368.51 14.90 383.42 126.76 47.84 174.60 0.455
0.007 391.97 14.12 406.08 130.73 45.47 176.20 0.434
0.009 283.40 5.95 289.35 111.16 26.46 137.62 0.476
0.01 204.41 1.29 205.71 94.41 11.56 105.96 0.515
10%
Co
-SM
OF
0.005 507.50 18.89 526.39 148.75 43.90 192.65 0.366
0.007 500.75 16.39 517.13 147.76 40.88 188.64 0.365
0.009 492.10 14.04 506.14 146.48 37.88 184.36 0.364
0.01 489.33 12.77 502.09 146.06 36.20 182.26 0.363
20%
Co
-SM
OF
0.005 619.74 35.95 655.69 164.38 63.01 227.39 0.347
0.007 598.40 32.92 631.32 161.53 60.51 222.03 0.352
0.009 580.00 29.12 609.12 159.02 57.07 216.10 0.355
0.01 585.04 29.52 614.56 159.71 57.58 217.29 0.354
10%
Ni-
SM
OF
0.005 511.85 22.14 533.99 149.39 47.56 196.95 0.3688
0.007 497.30 19.04 516.35 147.25 44.11 191.36 0.3706
0.009 504.84 18.16 523.01 148.36 43.04 191.41 0.366
0.01 511.09 18.16 529.26 149.28 43.05 192.32 0.3634
20
% N
i-S
MO
F
0.005 511.85 22.14 533.99 149.39 47.56 196.95 0.3688
0.007 497.30 19.04 516.35 147.25 44.11 191.36 0.3706
0.009 504.84 18.16 523.01 148.36 43.04 191.41 0.366
0.01 511.09 18.16 529.26 149.28 43.05 192.32 0.3634
For further understanding, the work of adhesion was studied for different materials. For
comparison, the surface coverage remains constants; however, the experimental column
temperature was different. For RD silica-gel, it was 363 K, and for all other samples, column
temperature was kept to 413 K. The RD silica-gel and activated carbons are conventional
adsorbents, where silica gel is generally used for water adsorption. The comparative analysis
is illustrated in Fig. 7.8. It is observed that the work of adhesion is significantly lower than the
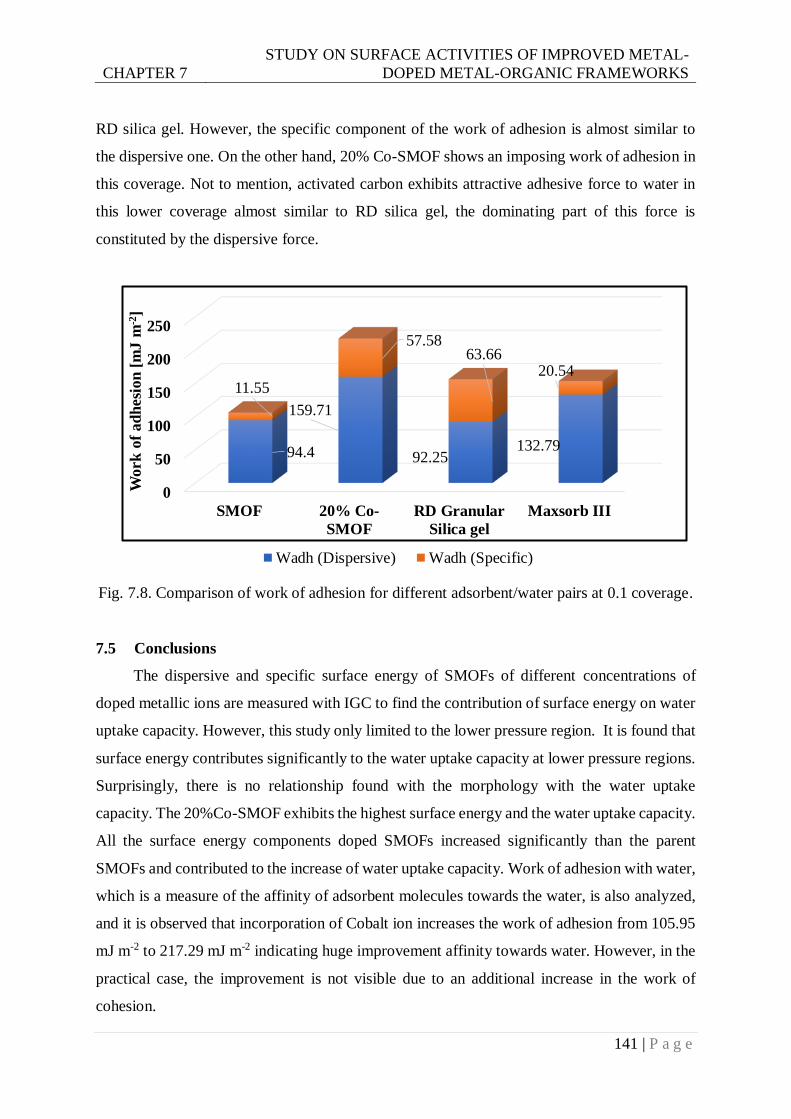
CHAPTER 7
STUDY ON SURFACE ACTIVITIES OF IMPROVED METAL-
DOPED METAL-ORGANIC FRAMEWORKS
141 | P a g e
RD silica gel. However, the specific component of the work of adhesion is almost similar to
the dispersive one. On the other hand, 20% Co-SMOF shows an imposing work of adhesion in
this coverage. Not to mention, activated carbon exhibits attractive adhesive force to water in
this lower coverage almost similar to RD silica gel, the dominating part of this force is
constituted by the dispersive force.
Fig. 7.8. Comparison of work of adhesion for different adsorbent/water pairs at 0.1 coverage.
7.5 Conclusions
The dispersive and specific surface energy of SMOFs of different concentrations of
doped metallic ions are measured with IGC to find the contribution of surface energy on water
uptake capacity. However, this study only limited to the lower pressure region. It is found that
surface energy contributes significantly to the water uptake capacity at lower pressure regions.
Surprisingly, there is no relationship found with the morphology with the water uptake
capacity. The 20%Co-SMOF exhibits the highest surface energy and the water uptake capacity.
All the surface energy components doped SMOFs increased significantly than the parent
SMOFs and contributed to the increase of water uptake capacity. Work of adhesion with water,
which is a measure of the affinity of adsorbent molecules towards the water, is also analyzed,
and it is observed that incorporation of Cobalt ion increases the work of adhesion from 105.95
mJ m-2 to 217.29 mJ m-2 indicating huge improvement affinity towards water. However, in the
practical case, the improvement is not visible due to an additional increase in the work of
cohesion.
0
50
100
150
200
250
SMOF 20% Co-
SMOF
RD Granular
Silica gel
Maxsorb III
94.4
159.71
92.25132.79
11.55
57.5863.66
20.54
Work
of
ad
hesi
on
[m
J m
-2]
Wadh (Dispersive) Wadh (Specific)
142 | P a g e
Chapter 8
Overall conclusions and recommendations Equation Chapter 8 Section 1
8.1 Overall conclusions
The principal objective of this thesis is to mitigate the gap between material synthesis
and the application in applied thermal engineering. For this purpose, from the beginning of the
thesis, the target was to find the additional characterization techniques which are hardly
available in the literature. The idea of using non-conventional but promising techniques are
used to find properties of adsorbents and pairs that might reveal intermediate information to
develop new materials for heat transfer applications like as adsorption chillers. It is observed
that surface energy is the key component of material characterization, which might be useful
for developing new functional materials. The overall findings and realization are concisely
described as follows, where findings are the interpretation of the results, and realization is the
motivation for doing further studies:
Morphological study using Atomic Force Microscopy:
Research gap: i) Direct analysis of surface porosity is hardly found in the literature,
ii) three-dimensional morphological information of the adsorbent surfaces are not
commonly available.
Studied materials: Silica gel, Acetaminophen, Silica-alumina, Maxsorb III.
Target of the study: i) conventional morphological study adopts indirect
techniques, does not provide an explicit understanding of adsorbent surfaces. Therefore,
the principal target was to study the surfaces of adsorbents directly using atomic force
microscopy, ii) Direct counting of pore size distribution, iii) visualization, and
quantitative analysis of adsorbent surfaces.
Obstacles: i) atomic force microscopy generally used for a surface having low
roughness (below 100 nm), the surface of the conventional adsorbents exhibits
moderately high surface roughness (above 500 nm), ii) identification of pores are
complicated because of having irregular shapes.
Findings: i) height images carry both the qualitative and quantitative information
of the surfaces, ii) Optimum adjustment of the operational parameters of AFM allows to
take height image data of the highly rough surface of the adsorbents, iii) Image
CHAPTER 8 OVERALL CONCLUSIONS AND RECOMMENDATIONS
143 | P a g e
processing and 2D image filtration are useful for detecting irregular shape pores, iv)
overall porosity and the surface porosity follows the similar trends.
Surface energy analysis of adsorbents:
Research gap: i) surface energy data is not commonly available for porous
adsorbents, ii) to find a relation between surface energy and adsorption, it is required to
analyze the surface energy of various adsorbents.
Target of the Study: i) to observe the variation of surface energy components
(dispersive and specific) on different adsorbents, ii) to observe the relationship between
surface energy and surface morphology.
Studied materials: RD granular silica gel, Chromatorex silica gel, Home silica gel,
B-type silica gel, Activated carbon fiber (A-20), Maxsorb III.
Obstacles: i) A similar study is hardly found in the literature, countless trial and
error analysis are required to perform before finding the optimum operation condition,
ii) porous adsorbents used in real applications comprises of large surface area which leads
to time-consuming measurement procedure for IGC experiments.
Findings: i) both the dispersive and specific surface energy are dominating in silica
gel, ii) surface area shows a direct impact on dispersive surface energy; however, no
relationship found with the specific surface energy, ii) carbonaceous materials exhibit
high dispersive surface energy.
Realization: ii) changing of morphology such as surface area, porosity has no
significant impact on specific surface energy, ii) structural modification might lead to
electrostatic variation and influence the specific surface energy, iii) Gibbs free energy on
different polar solvents are vital for preparing adsorbents for selective adsorption, iv),
unlike the carbonaceous materials, the surface of silica gel materials contains ionic
structures like as zeolites, which might be the primary source of the electrostatic
contribution of specific surface energy on adsorbing polar adsorbates.
Henry region characterization of activated carbon/ethanol pairs:
Research gap: i) experimentally found isotherms and heat of adsorption at Henry
region are not commonly available due to the limitation of conventional measurement
techniques, ii) the contribution of morphological parameters on entropy is unknown.
CHAPTER 8 OVERALL CONCLUSIONS AND RECOMMENDATIONS
144 | P a g e
Target of the study: i) to measure the Henry region isotherms and Henry constant
experimentally, ii) to measure the zero-coverage heat of adsorption experimentally, iii)
to develop a model relating the entropy and
Studied materials: Maxsorb III/ethanol pair, WPT-AC/ethanol pair, M-AC/ethanol
pair, and H2-Maxsorb III/ethanol pair.
Obstacles: i) requires finding the suitable coverage range where the homogeneous
distribution of the surface energy exists, ii) requires establishing a modeling to relate the
energetic behavior with surface morphology.
Findings: i) the experimentally isotherms of the studied samples show linear nature
(R2>0.99) indicating that the measured data is in Henry region, ii) The Henry constant
ranges from 0.1584 μmol g-1 Pa-1 to 4.5141 μmol g-1 Pa-1 at various temperatures, iii) the
highest Henry constant value was found for H2-Maxsorb III (4.5141 μmol g-1 Pa-1)
temperature and the lowest on for WPT-AC (2.5779 μmol g-1 Pa-1) at 303 K, iv) zero
coverage heat of adsorption of the studied samples are measured using Clausius-
Clapeyron equation, by plotting experimentally found lnP values against T-1 values,
v) the experimentally measured zero coverage 0H for Maxsorb III, M-AC, WPT-AC,
and H2- Maxsorb III are 50.35 kJ mol-1, 51.5 kJ mol-1, 44.5 kJ mol-1, and 53.3 kJ mol-1,
respectively, vi) the plot of the specific entropy with the KH/υP shows a linear trend and
cut in the vertical axis at for at 1.8354 kJ kg-1 indicating the values of ideal entropy of
adsorption process for carbonadoes materials.
Realization: i) Henry region isotherms are the fundamental characterization
techniques that indicate the affinity between adsorbent and adsorbates; in this case, H2-
Maxsorbs exhibits the highest affinity towards ethanol. ii) the increase of affinity is
generated from the contribution of specific surface energy which was acquired by the
additional treatment of parent Maxsorb III using the flow of hydrogen at high
temperature, iii) the similar treatment is not possible for silica gel because of their lower
thermal stability, iv) new findings of the ideal entropy for carbonaceous might provide a
guide to develop new promising adsorbents; however, it is required to investigate the
adsorbents besides activated carbons.
CHAPTER 8 OVERALL CONCLUSIONS AND RECOMMENDATIONS
145 | P a g e
Modification of MOFs to improve adsorption characteristics:
Research gap: i) MOFs are promising adsorbents because of having high surface
area and tailoring capability, ii) MOFs comprises of a central metal structure which can
be replaced by other metallic ions that might influence the adsorption property.
Target of the study: i) to develop new MOF using green synthesis process, ii) to
study of hydrothermal synthesis process to adopt in-situ doping for developing novel
adsorbents, iii) to shifting of S-shape isotherms towards lower pressure region, iv) to
increase the uptake capacity of MOF/water pairs.
Studied materials: Commercial aluminum fumarate, SMOF, 10% Co-SMOF, 10%
Ni-SMOF. SMOFs are newly developed MOF in our laboratory.
Obstacles: i) DMF is used in the synthesis procedure, which is toxic and harmful
to the environment, ii) replacing DMF with water generates low yields.
Findings: i) yield is increased by dropwise addition of fumaric acid with stirring at
250 rpm for 16 minutes with 60°C solution temperature, ii) synthesized MOFs exhibits
fiber shape unit clustered in a spherical lump, and the surface area increased significantly
than the commercial one, ii) No significant change in the powder XRD analysis, iii)
addition of doping concentration reduce the surface area and increase the average pore
radius, iv) the water uptake is increased significantly at the lower pressure region, and
the measured highest uptake is observed for 10% Co-SMOF which is 0.3 g g-1, v) the
calculated effective uptake of SMOF is about 1.6 times higher than silica gel in the lower
pressure region.
Realization: i) in-situ doping of SMOFs significantly increases the water uptake in
the lower pressure region despite having lower surface area compare to parent SMOF, ii)
no suitable explanation can be made based on morphological change on the increase of
water uptake capacity in the lower pressure region.
Insights of the influence of in-situ doping on water uptake capacity of SMOFs:
Research gap: i) from the uptake analysis of SMOFs (explained in chapter 6), it is
observed that there is no relation of water uptake and isotherm shifting towards lower
pressure region with the morphological changes ii) study of surface energy might explain
the insight because of the ability to measure the surface activities rather than morphology.
CHAPTER 8 OVERALL CONCLUSIONS AND RECOMMENDATIONS
146 | P a g e
Target of the study: i) to study the surface energy components of the synthesized
SMOFs at the lower pressure region, ii) to conduct a comparative analysis with other
adsorbents, iii) to measure work of adhesion
Studied materials: SMOF, 10% Co-SMOF, 20% Co-SMOF, 10% Ni-SMOF, 20%
Ni-SMOF, Maxsorb III, RD granular silica gel.
Obstacles: i) measuring surface energy data in the homogeneous region, ii) SMOFs
having an interesting affinity with ethanol, which significantly increases the duration of
the experiment, iii) higher chained alkanes generates dual peaks in the FID signal plot.
Findings: i) the surface energy contributes significantly to the water uptake
capacity at lower pressure regions ii) concentration of doping increases the total surface
energy, ii) 20%Co-SMOF exhibits the highest surface energy and the water uptake
capacity, despite having lowest surface area, iii) incorporation of Cobalt ion increases the
work of adhesion from 105.95 mJ.m-2 to 217.29 mJ.m-2 indicating huge improvement
affinity towards the water; however, the increase of work cohesion reduces the uptake
capacity, iv) the work of adhesion of RD granular silica gel and Maxsorb III is almost
similar, regardless of having significant differences in surface area, v) both the dispersive
and specific part of work of adhesion is dominating in RD granular silica gel, comparing
to SMOF and 20% SMOFs.
Realization: i) surface energy plays an essential role in the adsorption process, ii)
the measurements are conducted in infinite dilution; therefore, large coverage area has
not been studied, which might contain interesting information. ii) if it is possible to
improve the work of adhesion without the increase of work of cohesion might
significantly increase the adsorbate uptake.
8.2 Recommendations
The following recommendations are made by the author for further related topics covered
in this thesis:
a) AFM is a versatile tool for analyzing surfaces of porous adsorbents at ambient
temperature; it can be used at different humidity conditions that can be used to understand the
variation of surface properties due to the introduction of vapor.
b) Analysis of surface energy in the infinite dilution provides the fundamental
information of the surface activities; however, analysis at finite dilution will reveal much
interesting information.
CHAPTER 8 OVERALL CONCLUSIONS AND RECOMMENDATIONS
147 | P a g e
c) The incorporation of metallic ions contributes to the increase of surface energy at
lower coverage where the homogeneous distribution of energy is considered. Therefore to get
a clear idea of the overall influence of surface energy on the adsorption process, finite dilution
analysis can be a good option.
d) It is not still clear the contribution of surface energy sites on the adsorption process.
For example, the contribution of surface energy sites on water adsorption can be measured by
IGC. The idea is the experiments can be conducted in various humid conditions, differences of
the humid and dry conditions might reveal the contribution of energy sites on water adsorption.
In that case, adsorbents having low surface area might be a convenient option for the
measurement as high surface area leads to a heterogeneous region in the very lower pressure
region.
e) The capture of volatile organic compounds (VOCs) is becoming essentials day by day.
The challenge is the low concentration of VOCs at the environments, which leads to the
requirement of very steep uptake in the lower pressure region. IGC might become a good option
for finding suitable adsorbents for capturing VOCs.
f) MOFs are becoming the promising materials for adsorption systems, tailoring of MOFs
having extreme surface area will be a good option for developing adsorbents for heat transfer
applications.
148 | P a g e
References
[1] P.O. FANGER, Thermal comfort. Analysis and applications in environmental
engineering., Danish Technical Press, 1970.
[2] Y. Fan, L. Luo, B. Souyri, Review of solar sorption refrigeration technologies:
Development and applications, Renew. Sustain. Energy Rev. 11 (2007) 1758–1775.
doi:10.1016/J.RSER.2006.01.007.
[3] W. Pridasawas, Solar-Driven Refrigeration Systems with Focus on the Ejector Cycle,
Royal Institiute of Technology, KTH, Denmark, 2006.
[4] J. Henley, World set to use more energy for cooling than heating, (2015).
https://www.theguardian.com/environment/2015/oct/26/cold-economy-cop21-global-
warming-carbon-emissions (accessed February 13, 2018).
[5] A.M. Qenawy, A.A. Mohamad, Current Technologies and Future Perspectives in Solar
Powered Adsorption Systems, in: Can. Sol. Build. Conf., 2004.
[6] D.X. Wang, A.N. Bao, W. Kunc, W. Liss, Coal power plant flue gas waste heat and
water recovery, Appl. Energy. (2012). doi:DOI 10.1016/j.apenergy.2011.10.003.
[7] K.R. Ullah, R. Saidur, H.W. Ping, R.K. Akikur, N.H. Shuvo, A review of solar thermal
refrigeration and cooling methods, Renew. Sustain. Energy Rev. 24 (2013) 499–513.
doi:10.1016/J.RSER.2013.03.024.
[8] M.A. Alghoul, M.Y. Sulaiman, B.Z. Azmi, M.A. Wahab, Advances on multi-purpose
solar adsorption systems for domestic refrigeration and water heating, Appl. Therm.
Eng. 27 (2007) 813–822. doi:10.1016/J.APPLTHERMALENG.2006.09.008.
[9] Y. Aristov, Concept of adsorbent optimal for adsorptive cooling/heating, Appl. Therm.
Eng. 72 (2014) 166–175. doi:https://doi.org/10.1016/j.applthermaleng.2014.04.077.
[10] D. Do Duong, Adsorption Analysis: Equilibria and Kinetics, World Scientific, 1998.
[11] R.C. Bansal, M. Goyal, Activated carbon adsorption, CRC Press, Boca Raton, 2005.
[12] F. Schüth, K.S.W. Sing, J. Weitkamp, Handbook of porous solids, Wiley-VCH, 2002.
http://hdl.handle.net/2324/1842737 (accessed January 22, 2018).
[13] D.W. Bruce, D. O’Hare, R.I. Walton, Porous materials, Wiley, 2011.
http://hdl.handle.net/2324/1848600 (accessed February 18, 2018).
[14] I.I. El-Sharkawy, A. Pal, T. Miyazaki, B.B. Saha, S. Koyama, A study on consolidated
composite adsorbents for cooling application, Appl. Therm. Eng. 98 (2016) 1214–1220.
doi:10.1016/J.APPLTHERMALENG.2015.12.105.
REFERENCES
149 | P a g e
[15] R.K. Iler, The chemistry of silica : solubility, polymerization, colloid and surface
properties, and biochemistry / Ralph K. Iler, Wiley, 1979.
http://hdl.handle.net/2324/1000468809 (accessed February 18, 2018).
[16] Y.I. Aristov, M.M. Tokarev, A. Freni, I.S. Glaznev, G. Restuccia, Kinetics of water
adsorption on silica Fuji Davison RD, Microporous Mesoporous Mater. 96 (2006) 65–
71. doi:10.1016/J.MICROMESO.2006.06.008.
[17] K.C. Ng, H.T. Chua, C.Y. Chung, C.H. Loke, T. Kashiwagi, A. Akisawa, B.B. Saha,
Experimental investigation of the silica gel–water adsorption isotherm characteristics,
Appl. Therm. Eng. 21 (2001) 1631–1642. doi:10.1016/S1359-4311(01)00039-4.
[18] B.B. Saha, A. Akisawa, T. Kashiwagi, Silica gel water advanced adsorption refrigeration
cycle, Energy. 22 (1997) 437–447. doi:10.1016/S0360-5442(96)00102-8.
[19] S.S. Kistler, Coherent Expanded Aerogels, Rubber Chem. Technol. (1932).
doi:10.5254/1.3539386.
[20] J.S. Beck, J.C. Vartuli, W.J. Roth, M.E. Leonowicz, C.T. Kresge, K.D. Schmitt, C.T.W.
Chu, D.H. Olson, E.W. Sheppard, S.B. McCullen, J.B. Higgins, J.L. Schlenker, A new
family of mesoporous molecular sieves prepared with liquid crystal templates, J. Am.
Chem. Soc. 114 (1992) 10834–10843. doi:10.1021/ja00053a020.
[21] V. Meynen, P. Cool, E.F. Vansant, Verified syntheses of mesoporous materials,
Microporous Mesoporous Mater. 125 (2009) 170–223.
doi:10.1016/J.MICROMESO.2009.03.046.
[22] I. Glaznev, I. Ponomarenko, S. Kirik, Y. Aristov, Composites CaCl2/SBA-15 for
adsorptive transformation of low temperature heat: Pore size effect, Int. J. Refrig. 34
(2011) 1244–1250. doi:10.1016/J.IJREFRIG.2011.02.007.
[23] I.A. Simonova, A. Freni, G. Restuccia, Y.I. Aristov, Water sorption on composite “silica
modified by calcium nitrate,” Microporous Mesoporous Mater. 122 (2009) 223–228.
doi:10.1016/J.MICROMESO.2009.02.034.
[24] Y.. Aristov, G. Restuccia, G. Cacciola, V.. Parmon, A family of new working materials
for solid sorption air conditioning systems, Appl. Therm. Eng. 22 (2002) 191–204.
doi:10.1016/S1359-4311(01)00072-2.
[25] A. Pal, I.I. El-Sharkawy, B.B. Saha, S. Jribi, T. Miyazaki, S. Koyama, Experimental
investigation of CO2adsorption onto a carbon based consolidated composite adsorbent
for adsorption cooling application, Appl. Therm. Eng. (2016).
doi:10.1016/j.applthermaleng.2016.08.031.
[26] International Zeolite Association, (n.d.). http://www.iza-online.org/ (accessed February
REFERENCES
150 | P a g e
19, 2018).
[27] T.J. Barton, L.M. Bull, W.G. Klemperer, D.A. Loy, B. McEnaney, M. Misono, P.A.
Monson, G. Pez, G.W. Scherer, J.C. Vartuli, O.M. Yaghi, Tailored Porous Materials,
Chem. Mater. 11 (1999) 2633–2656. doi:10.1021/cm9805929.
[28] R. Xu, Chemistry of zeolites and related porous materials : synthesis and structure, John
Wiley & Sons (Asia), 2007. http://hdl.handle.net/2324/1837049 (accessed February 19,
2018).
[29] J. Jänchen, D. Ackermann, H. Stach, W. Brösicke, Studies of the water adsorption on
Zeolites and modified mesoporous materials for seasonal storage of solar heat, Sol.
Energy. 76 (2004) 339–344. doi:10.1016/J.SOLENER.2003.07.036.
[30] R.E. Critoph, Y. Zhong, Review of trends in solid sorption refrigeration and heat
pumping technology, Proc. Inst. Mech. Eng. Part E J. Process Mech. Eng. (2005).
doi:10.1243/095440805X6982.
[31] M. Pons, F. Meunier, G. Cacciola, R.. Critoph, M. Groll, L. Puigjaner, B. Spinner, F.
Ziegler, Thermodynamic based comparison of sorption systems for cooling and heat
pumping: Comparaison des performances thermodynamique des systèmes de pompes à
chaleur à sorption dans des applications de refroidissement et de chauffage, Int. J. Refrig.
22 (1999) 5–17. doi:10.1016/S0140-7007(98)00048-6.
[32] M.A. Lambert, B.J. Jones, Review of Regenerative Adsorption Heat Pumps, J.
Thermophys. Heat Transf. 19 (2005) 471–485. doi:10.2514/1.8075.
[33] N. Douss, F. Meunier, Effect of operating temperatures on the coefficient of
performance of active carbon-methanol systems, Heat Recover. Syst. CHP. 8 (1988)
383–392. doi:10.1016/0890-4332(88)90042-7.
[34] S. Follin, V. Goetz, A. Guillot, Influence of Microporous Characteristics of Activated
Carbons on the Performance of an Adsorption Cycle for Refrigeration, Ind. Eng. Chem.
Res. 35 (1996) 2632–2639. doi:10.1021/ie950638x.
[35] Z. Tamainot-Telto, S.J. Metcalf, R.E. Critoph, Y. Zhong, R. Thorpe, Carbon–ammonia
pairs for adsorption refrigeration applications: ice making, air conditioning and heat
pumping, Int. J. Refrig. 32 (2009) 1212–1229. doi:10.1016/J.IJREFRIG.2009.01.008.
[36] J. Miyawaki, H. Kil, K. Hata, K. Ideta, T. Ohba, H. Kanoh, I. Mochida, K. Nakabayashi,
S.-H. Yoon, Development of innovative activated carbons for adsorption heat pumps,
in: Innov. Mater. Process. Energy Systerms, Midori Printing CO. LTD., Sicily, 2016:
pp. 11–14.
[37] H. Li, M. Eddaoudi, M. O’Keeffe, O.M. Yaghi, Design and synthesis of an exceptionally
REFERENCES
151 | P a g e
stable and highly porous metal-organic framework, Nature. 402 (1999) 276.
http://dx.doi.org/10.1038/46248.
[38] O.M. Yaghi, M. O’Keeffe, N.W. Ockwig, H.K. Chae, M. Eddaoudi, J. Kim, Reticular
synthesis and the design of new materials, Nature. 423 (2003) 705.
http://dx.doi.org/10.1038/nature01650.
[39] G. Férey, C. Mellot-Draznieks, C. Serre, F. Millange, J. Dutour, S. Surblé, I. Margiolaki,
A Chromium Terephthalate-Based Solid with Unusually Large Pore Volumes and
Surface Area, Science (80-. ). 309 (2005) 2040 LP – 2042.
http://science.sciencemag.org/content/309/5743/2040.abstract.
[40] R.J. Kuppler, D.J. Timmons, Q.R. Fang, J.R. Li, T.A. Makal, M.D. Young, D. Yuan, D.
Zhao, W. Zhuang, H.C. Zhou, Potential applications of metal-organic frameworks,
Coord. Chem. Rev. 253 (2009) 3042–3066. doi:10.1016/j.ccr.2009.05.019.
[41] S. Kitagawa, S. Natarajan, Targeted Fabrication of MOFs for Hybrid Functionality (Eur.
J. Inorg. Chem. 24/2010), Eur. J. Inorg. Chem. 2010 (2010) 3685–3685.
doi:10.1002/ejic.201090071.
[42] D. Tanaka, K. Nakagawa, M. Higuchi, S. Horike, Y. Kubota, T.C. Kobayashi, M.
Takata, S. Kitagawa, Kinetic Gate-Opening Process in a Flexible Porous Coordination
Polymer, Angew. Chemie. 120 (2008) 3978–3982. doi:10.1002/ange.200705822.
[43] O.K. Farha, I. Eryazici, N.C. Jeong, B.G. Hauser, C.E. Wilmer, A.A. Sarjeant, R.Q.
Snurr, S.T. Nguyen, A.Ö. Yazaydın, J.T. Hupp, Metal–Organic Framework Materials
with Ultrahigh Surface Areas: Is the Sky the Limit?, J. Am. Chem. Soc. 134 (2012)
15016–15021. doi:10.1021/ja3055639.
[44] H. Furukawa, K.E. Cordova, M. O’Keeffe, O.M. Yaghi, The Chemistry and
Applications of Metal-Organic Frameworks, Science (80-. ). 341 (2013).
http://science.sciencemag.org/content/341/6149/1230444.abstract.
[45] A. Vishnyakov, P.I. Ravikovitch, A. V Neimark, M. Bülow, Q.M. Wang, Nanopore
Structure and Sorption Properties of Cu−BTC Metal−Organic Framework, Nano Lett. 3
(2003) 713–718. doi:10.1021/nl0341281.
[46] S.K. Henninger, F.P. Schmidt, H.-M. Henning, Characterisation and improvement of
sorption materials with molecular modeling for the use in heat transformation
applications, Adsorption. 17 (2011) 833–843. doi:10.1007/s10450-011-9342-6.
[47] L. Grajciar, O. Bludský, P. Nachtigall, Water Adsorption on Coordinatively Unsaturated
Sites in CuBTC MOF, J. Phys. Chem. Lett. 1 (2010) 3354–3359.
doi:10.1021/jz101378z.
REFERENCES
152 | P a g e
[48] P. Küsgens, M. Rose, I. Senkovska, H. Fröde, A. Henschel, S. Siegle, S. Kaskel,
Characterization of metal-organic frameworks by water adsorption, Microporous
Mesoporous Mater. 120 (2009) 325–330. doi:10.1016/J.MICROMESO.2008.11.020.
[49] K. Schlichte, T. Kratzke, S. Kaskel, Improved synthesis, thermal stability and catalytic
properties of the metal-organic framework compound Cu3(BTC)2, Microporous
Mesoporous Mater. 73 (2004) 81–88. doi:10.1016/J.MICROMESO.2003.12.027.
[50] J. Ehrenmann, S.K. Henninger, C. Janiak, Water Adsorption Characteristics of MIL-101
for Heat-Transformation Applications of MOFs, Eur. J. Inorg. Chem. 2011 (2011) 471–
474. doi:10.1002/ejic.201001156.
[51] G. Akiyama, R. Matsuda, S. Kitagawa, Highly Porous and Stable Coordination
Polymers as Water Sorption Materials, Chem. Lett. 39 (2010) 360–361.
doi:10.1246/cl.2010.360.
[52] S. Bourrelly, B. Moulin, A. Rivera, G. Maurin, S. Devautour-Vinot, C. Serre, T. Devic,
P. Horcajada, A. Vimont, G. Clet, M. Daturi, J.-C. Lavalley, S. Loera-Serna, R. Denoyel,
P.L. Llewellyn, G. Férey, Explanation of the Adsorption of Polar Vapors in the Highly
Flexible Metal Organic Framework MIL-53(Cr), J. Am. Chem. Soc. 132 (2010) 9488–
9498. doi:10.1021/ja1023282.
[53] D.S. Coombes, F. Corà, C. Mellot-Draznieks, R.G. Bell, Sorption-Induced Breathing in
the Flexible Metal Organic Framework CrMIL-53: Force-Field Simulations and
Electronic Structure Analysis, J. Phys. Chem. C. 113 (2009) 544–552.
doi:10.1021/jp809408x.
[54] D. Fröhlich, E. Pantatosaki, P.D. Kolokathis, K. Markey, H. Reinsch, M. Baumgartner,
M.A. van der Veen, D.E. De Vos, N. Stock, G.K. Papadopoulos, S.K. Henninger, C.
Janiak, Water adsorption behaviour of CAU-10-H: a thorough investigation of its
structure–property relationships, J. Mater. Chem. A. 4 (2016) 11859–11869.
doi:10.1039/C6TA01757F.
[55] H.W.B. Teo, A. Chakraborty, Water Adsorption on Various Metal Organic Framework,
IOP Conf. Ser. Mater. Sci. Eng. 272 (2017) 012019. doi:10.1088/1757-
899X/272/1/012019.
[56] B.B. Saha, A. Akisawa, T. Kashiwagi, Solar/waste heat driven two-stage adsorption
chiller: The prototype, Renew. Energy. (2001). doi:10.1016/S0960-1481(00)00107-5.
[57] K. Kaneko, C. Ishii, M. Ruike, H. kuwabara, Origin of superhigh surface area and
microcrystalline graphitic structures of activated carbons, Carbon N. Y. 30 (1992) 1075–
1088. doi:10.1016/0008-6223(92)90139-N.
REFERENCES
153 | P a g e
[58] H.D. Do, D.D. Do, Effect of pore size distribution on the surface diffusivity in activated
carbon: Hybrid Dubinin-Langmuir isotherm, Adsorption. (1995).
doi:10.1007/BF00707352.
[59] J. Landers, G.Y. Gor, A. V. Neimark, Density functional theory methods for
characterization of porous materials, Colloids Surfaces A Physicochem. Eng. Asp. 437
(2013) 3–32. doi:10.1016/j.colsurfa.2013.01.007.
[60] M. Naderi, Surface Area: Brunauer-Emmett-Teller (BET), in: Prog. Filtr. Sep., 2014.
doi:10.1016/B978-0-12-384746-1.00014-8.
[61] Z.L. Wang, New Developments in Transmission Electron Microscopy for
Nanotechnology, Adv. Mater. 15 (2003) 1497–1514. doi:10.1002/adma.200300384.
[62] W. Vanderlinde, Scanning Electron Microscopy, Scan. Electron Microsc. (2011).
doi:10.1159/000265104.
[63] J.. Paredes, A. Martınez-Alonso, J.M.. Tascón, Application of scanning tunneling and
atomic force microscopies to the characterization of microporous and mesoporous
materials, Microporous Mesoporous Mater. 65 (2003) 93–126.
doi:10.1016/j.micromeso.2003.07.001.
[64] F. Thielmann, Introduction into the characterisation of porous materials by inverse gas
chromatography, J. Chromatogr. A. 1037 (2004) 115–123.
doi:10.1016/j.chroma.2004.03.060.
[65] Inverse gas chromatography (IGC) as a tool for an energetic characterisation of porous
materials, Microporous Mesoporous Mater. 209 (2015) 99–104.
doi:10.1016/J.MICROMESO.2014.08.053.
[66] A. Pal, A. Kondor, S. Mitra, K. Thu, S. Harish, B.B. Saha, On surface energy and acid–
base properties of highly porous parent and surface treated activated carbons using
inverse gas chromatography, J. Ind. Eng. Chem. (2018).
doi:10.1016/J.JIEC.2018.09.046.
[67] H. Grajek, J. Paciura-Zadrożna, Z. Witkiewicz, Chromatographic characterisation of
ordered mesoporous silicas: Part I. Surface free energy of adsorption, J. Chromatogr. A.
1217 (2010) 3105–3115. doi:https://doi.org/10.1016/j.chroma.2010.02.028.
[68] O.M.M. Eltom, A.A.M. Sayigh, A simple method to enhance thermal conductivity of
charcoal using some additives, Renew. Energy. 4 (1994) 113–118. doi:10.1016/0960-
1481(94)90072-8.
[69] T.-H. Eun, H.-K. Song, J.H. Han, K.-H. Lee, J.-N. Kim, Enhancement of heat and mass
transfer in silica-expanded graphite composite blocks for adsorption heat pumps. Part II.
REFERENCES
154 | P a g e
Cooling system using the composite blocks, Int. J. Refrig. 23 (2000) 74–81.
doi:10.1016/S0140-7007(99)00036-5.
[70] F. Jeremias, S.K. Henninger, C. Janiak, High performance metal-organic-framework
coatings obtained via thermal gradient synthesis, Chem. Commun. 48 (2012) 9708–
9710. doi:10.1039/C2CC34782B.
[71] B.B. Saha, A. Chakraborty, S. Koyama, J.B. Lee, J. He, K.C. Ng, Adsorption
characteristics of parent and copper-sputtered RD silica gels, Philos. Mag. (2007).
doi:10.1080/14786430601032386.
[72] J.J. Guilleminot, A. Choisier, J.B. Chalfen, S. Nicolas, J.L. Reymoney, Heat transfer
intensification in fixed bed adsorbers, Heat Recover. Syst. CHP. 13 (1993) 297–300.
doi:10.1016/0890-4332(93)90052-W.
[73] A.A. Askalany, M. Salem, I.M. Ismael, A.H.H. Ali, M.G. Morsy, B.B. Saha, An
overview on adsorption pairs for cooling, Renew. Sustain. Energy Rev. 19 (2013) 565–
572. doi:10.1016/J.RSER.2012.11.037.
[74] M.M. Younes, I.I. El-Sharkawy, A.E. Kabeel, B.B. Saha, A review on adsorbent-
adsorbate pairs for cooling applications, Appl. Therm. Eng. 114 (2017) 394–414.
doi:10.1016/J.APPLTHERMALENG.2016.11.138.
[75] B.B. Saha, S. Jribi, S. Koyama, I.I. El-Sharkawy, Carbon Dioxide Adsorption Isotherms
on Activated Carbons, J. Chem. Eng. Data. 56 (2011) 1974–1981.
doi:10.1021/je100973t.
[76] H.-S. Kil, T. Kim, K. Hata, K. Ideta, T. Ohba, H. Kanoh, I. Mochida, S.-H. Yoon, J.
Miyawaki, Influence of surface functionalities on ethanol adsorption characteristics in
activated carbons for adsorption heat pumps, Appl. Therm. Eng. 72 (2014) 160–165.
doi:10.1016/J.APPLTHERMALENG.2014.06.018.
[77] K.C. Ng, M. Burhan, M.W. Shahzad, A. Bin Ismail, A Universal Isotherm Model to
Capture Adsorption Uptake and Energy Distribution of Porous Heterogeneous Surface,
Sci. Rep. 7 (2017) 10634. doi:10.1038/s41598-017-11156-6.
[78] D.M. Ruthven, Principles of adsorption & adsorption processes, 1st ed., John Wiley &
Sons, Inc., 1984.
[79] M. Thommes, K. Kaneko, A. V Neimark, J.P. Olivier, F. Rodriguez-Reinoso, J.
Rouquerol, K.S.W. Sing, Physisorption of gases, with special reference to the evaluation
of surface area and pore size distribution (IUPAC Technical Report), Pure Appl. Chem.
87 (2015) 1051–1069. doi:https://doi.org/10.1515/pac-2014-1117.
[80] G. Binning, C.F. Quate, Atomic Force Microscope, Phys. Rev. Lett. (1986).
REFERENCES
155 | P a g e
doi:10.1103/PhysRevLett.56.930.
[81] A. Ruf, M. Abraham, M. Lacher, K. Mayr, T. Zetterer, A Miniaturised Fabry Perot AFM
Sensor, in: Solid-State Sensors Actuators, 1995 Eurosensors IX.. Transducers ’95. 8th
Int. Conf., 1995: pp. 660–663. doi:10.1109/SENSOR.1995.717316.
[82] Z. Peng, P. West, Crystal sensor for microscopy applications, Appl. Phys. Lett. (2005).
doi:10.1063/1.1846156.
[83] M.-S. Kim, J.-H. Choi, Y.-K. Park, J.-H. Kim, Atomic force microscope cantilever
calibration device for quantified force metrology at micro- or nano-scale regime: the
nano force calibrator (NFC), Metrologia. (2006). doi:10.1088/0026-1394/43/5/008.
[84] Y. Zhang, Y. Fang, X. Zhou, X. Dong, Image-based hysteresis modeling and
compensation for an AFM piezo-scanner, Asian J. Control. (2009). doi:10.1002/asjc.92.
[85] Shimadzu, Scanning Probe Microscope SPM-9700 Hardware Instruction Manual,
Kyoto, 2011.
[86] F. Marinello, P. Bariani, L. De Chiffre, E. Savio, Fast technique for AFM vertical drift
compensation, Meas. Sci. Technol. 18 (2007) 689–696. doi:10.1088/0957-
0233/18/3/019.
[87] J.I. Paredes, A. Martínez-Alonso, P.X. Hou, T. Kyotani, J.M.D. Tascón, Imaging the
structure and porosity of active carbons by scanning tunneling microscopy, Carbon N.
Y. 44 (2006) 2469–2478. doi:10.1016/j.carbon.2006.04.040.
[88] D.-W. Kim, H.-S. Kil, K. Nakabayashi, S.-H. Yoon, J. Miyawaki, Structural elucidation
of physical and chemical activation mechanisms based on the microdomain structure
model, Carbon N. Y. 114 (2017) 98–105. doi:10.1016/j.carbon.2016.11.082.
[89] E. Papirer, E. Brendlé, H. Balard, J. Dentzer, Variation of the surface properties of nickel
oxide upon heat treatment evidenced by temperature programmed desorption and
inverse gas chromatography studies, J. Mater. Sci. 35 (2000) 3573–3577.
doi:10.1023/A:1004813629876.
[90] L.J. Jallo, Y. Chen, J. Bowen, F. Etzler, R. Dave, Prediction of Inter-particle Adhesion
Force from Surface Energy and Surface Roughness, J. Adhes. Sci. Technol. 25 (2011)
367–384. doi:10.1163/016942410X525623.
[91] O. Planinšek, J. Zadnik, Š. Rozman, M. Kunaver, R. Dreu, S. Srčič, Influence of inverse
gas chromatography measurement conditions on surface energy parameters of lactose
monohydrate, Int. J. Pharm. 256 (2003) 17–23. doi:https://doi.org/10.1016/S0378-
5173(03)00058-9.
[92] J. Stapley, G. Buckton, D. Merrifield, Investigation to find a suitable reference material
REFERENCES
156 | P a g e
for use as an inverse gas chromatography system suitability test, Int. J. Pharm. 318
(2006) 22–27. doi:https://doi.org/10.1016/j.ijpharm.2006.03.011.
[93] A. Voelkel, Chapter 20 - Physicochemical Measurements (Inverse Gas
Chromatography), in: C.F.B.T.-G.C. Poole (Ed.), Elsevier, Amsterdam, 2012: pp. 477–
494. doi:https://doi.org/10.1016/B978-0-12-385540-4.00020-1.
[94] H.E. Newell, G. Buckton, D.A. Butler, F. Thielmann, D.R. Williams, The Use of Inverse
Phase Gas Chromatography to Measure the Surface Energy of Crystalline, Amorphous,
and Recently Milled Lactose, Pharm. Res. 18 (2001) 662–666.
doi:10.1023/A:1011089511959.
[95] W. Wang, Q. Hua, Y. Sha, D. Wu, S. Zheng, B. Liu, Surface properties of solid materials
measured by modified inverse gas chromatography, Talanta. 112 (2013) 69–72.
doi:https://doi.org/10.1016/j.talanta.2013.03.040.
[96] F. Thielmann, D.A. Butler, D.R. Williams, E. Baumgarten, Characterisation of
microporous materials by dynamic sorption methods, in: A. Sayari, M.B.T.-S. in S.S.
and C. Jaroniec (Eds.), Nanoporous Mater. II, Elsevier, 2000: pp. 633–638.
doi:https://doi.org/10.1016/S0167-2991(00)80266-9.
[97] P.P. Ylä-Mäihäniemi, J.Y.Y. Heng, F. Thielmann, D.R. Williams, Inverse gas
chromatographic method for measuring the dispersive surface energy distribution for
particulates, Langmuir. 24 (2008) 9551–9557. doi:10.1021/la801676n.
[98] P. Mukhopadhyay, H.P. Schreiber, Aspects of acid-base interactions and use of inverse
gas chromatography, Colloids Surfaces A Physicochem. Eng. Asp. 100 (1995) 47–71.
doi:https://doi.org/10.1016/0927-7757(95)03137-3.
[99] J. Jagiełło, G. Ligner, E. Papirer, Characterization of silicas by inverse gas
chromatography at finite concentration: Determination of the adsorption energy
distribution function, J. Colloid Interface Sci. 137 (1990) 128–136.
doi:https://doi.org/10.1016/0021-9797(90)90049-T.
[100] E. Cremer, H. Huber, Measurement of adsorption isotherms by means of high
temperature elution gas chromatography, in: Proc. Int. Symp. Gas Chromatogr., 1962:
p. 169.
[101] E. Cremer, H. Huber, Messung von Adsorptionsisothermen an Katalysatoren bei hohen
Temperaturen mit Hilfe der Gas-Festkörper-Eluierungschromatographie, Angew.
Chemie. 73 (1961) 461–465. doi:10.1002/ange.19610731303.
[102] T.I. Bakaeva, C.G. Pantano, C.E. Loope, V.A. Bakaev, Heterogeneity of the Glass Fiber
Surface from Inverse Gas Chromatography, J. Phys. Chem. B. 104 (2000) 8518–8526.
REFERENCES
157 | P a g e
doi:10.1021/jp0013457.
[103] S. Xie, X. He, Y. Yang, Effects on growth and feed utilization of Chinese longsnout
catfish Leiocassis longirostris Günther of replacement of dietary fishmeal by soybean
cake, Aquac. Nutr. 4 (1998) 187–192. doi:10.1046/j.1365-2095.1998.00069.x.
[104] B. Voigtlander, NanoScience and Technology, Springer-Verlag, 2015. doi:10.1007/978-
3-662-45240-0_14.
[105] Gwyddion [Computer Software]. 2017 Retrieved from http://gwyddion.net/, (n.d.).
[106] T. Vuong, P.A. Monson, Surface Roughness Effects in Molecular Models of Adsorption
in Heterogeneous Porous Solids, Langmuir. 14 (1998) 4880–4886.
doi:10.1021/la980033g.
[107] B. Sun, A. Chakraborty, Thermodynamic formalism of water uptakes on solid porous
adsorbents for adsorption cooling applications, Appl. Phys. Lett. 104 (2014) 201901.
doi:10.1063/1.4876922.
[108] Rafael C. Gonzalez, Richard E. Woods, Digital Image Processing, 2002.
doi:10.1017/CBO9781107415324.004.
[109] P. Klapetek, I. Ohlidal, D. Franta, A. Montaigne-Ramil, A. Bonanni, D. Stifter, H. Sitter,
Atomic force microscopy characterization of ZnTe epitaxial films, Acta Phys. Slovaca.
53 (2003) 223–230. doi:10.1143/JJAP.42.4706.
[110] H.T. Chua, K.C. Ng, A. Chakraborty, N.M. Oo, M.A. Othman, Adsorption
Characteristics of Silica Gel + Water Systems, J. Chem. Eng. Data. 47 (2002) 1177–
1181. doi:10.1021/je0255067.
[111] D.C. Wang, Z.Z. Xia, J.Y. Wu, R.Z. Wang, H. Zhai, W.D. Dou, Study of a novel silica
gel–water adsorption chiller. Part I. Design and performance prediction, Int. J. Refrig.
28 (2005) 1073–1083. doi:10.1016/J.IJREFRIG.2005.03.001.
[112] B. Choudhury, B.B. Saha, P.K. Chatterjee, J.P. Sarkar, An overview of developments in
adsorption refrigeration systems towards a sustainable way of cooling, Appl. Energy.
104 (2013) 554–567. doi:10.1016/J.APENERGY.2012.11.042.
[113] A. SAKODA, M. SUZUKI, FUNDAMENTAL STUDY ON SOLAR POWERED
ADSORPTION COOLING SYSTEM, J. Chem. Eng. Japan. 17 (1984) 52–57.
doi:10.1252/jcej.17.52.
[114] K. CHIHARA, M. SUZUKI, AIR DRYING BY PRESSURE SWING ADSORPTION,
J. Chem. Eng. Japan. 16 (1983) 293–299. doi:10.1252/jcej.16.293.
[115] A. Myat, K. Thu, N.K. Choon, The experimental investigation on the performance of a
low temperature waste heat-driven multi-bed desiccant dehumidifier (MBDD) and
REFERENCES
158 | P a g e
minimization of entropy generation, Appl. Therm. Eng. 39 (2012) 70–77.
doi:https://doi.org/10.1016/j.applthermaleng.2012.01.041.
[116] S. Mitra, P. Kumar, K. Srinivasan, P. Dutta, Development and performance studies of
an air cooled two-stage multi-bed silica-gel + water adsorption system, Int. J. Refrig. 67
(2016) 174–189. doi:https://doi.org/10.1016/j.ijrefrig.2015.10.028.
[117] K.C. Ng, K. Thu, Y. Kim, A. Chakraborty, G. Amy, Adsorption desalination: An
emerging low-cost thermal desalination method, Desalination. 308 (2013) 161–179.
doi:https://doi.org/10.1016/j.desal.2012.07.030.
[118] K. Thu, K.C. Ng, B.B. Saha, A. Chakraborty, S. Koyama, Operational strategy of
adsorption desalination systems, Int. J. Heat Mass Transf. 52 (2009) 1811–1816.
doi:https://doi.org/10.1016/j.ijheatmasstransfer.2008.10.012.
[119] S. Mokhatab, W.A. Poe, J.Y. Mak, Chapter 9 - Natural Gas Dehydration and Mercaptans
Removal, in: S. Mokhatab, W.A. Poe, J.Y.B.T.-H. of N.G.T. and P. (Fourth E. Mak
(Eds.), Gulf Professional Publishing, 2019: pp. 307–348.
doi:https://doi.org/10.1016/B978-0-12-815817-3.00009-5.
[120] H.F. Qureshi, R. Besselink, J.E. ten Elshof, A. Nijmeijer, L. Winnubst, Doped
microporous hybrid silica membranes for gas separation, J. Sol-Gel Sci. Technol. 75
(2015) 180–188. doi:10.1007/s10971-015-3687-3.
[121] K. Benzarti, C. Perruchot, M.M. Chehimi, Surface energetics of cementitious materials
and their wettability by an epoxy adhesive, Colloids Surfaces A Physicochem. Eng. Asp.
286 (2006) 78–91. doi:https://doi.org/10.1016/j.colsurfa.2006.03.007.
[122] W. Fan, A. Chakraborty, Isosteric heat of adsorption at zero coverage for AQSOA-
Z01/Z02/Z05 zeolites and water systems, Microporous Mesoporous Mater. 260 (2018)
201–207. doi:10.1016/j.micromeso.2017.10.039.
[123] A. Chakraborty, K.C. Leong, K. Thu, B.B. Saha, K.C. Ng, Theoretical insight of
adsorption cooling, Appl. Phys. Lett. 98 (2011) 221910. doi:10.1063/1.3592260.
[124] Y.I. Aristov, Challenging offers of material science for adsorption heat transformation:
A review, Appl. Therm. Eng. 50 (2013) 1610–1618.
doi:10.1016/J.APPLTHERMALENG.2011.09.003.
[125] F. Thielmann, S. Reutenauer, G. Fowler, Determination of Energy Parameters of Highly
Microporous Activated Carbons by Inverse Gas Chromatography, n.d.
[126] A. Voelkel, Chapter 2.5 Inverse gas chromatography in the examination of acid-base
and some other properties of solid materials, in: A. Dąbrowski, V.A.B.T.-S. in S.S. and
C. Tertykh (Eds.), Adsorpt. New Modif. Inorg. Sorbents, Elsevier, 1996: pp. 465–477.
REFERENCES
159 | P a g e
doi:https://doi.org/10.1016/S0167-2991(06)81031-1.
[127] M. Rückriem, D. Enke, T. Hahn, Inverse gas chromatography (IGC) as a tool for an
energetic characterisation of porous materials, Microporous Mesoporous Mater. 209
(2015) 99–104. doi:10.1016/J.MICROMESO.2014.08.053.
[128] A. Legras, A. Kondor, M. Alcock, M.T. Heitzmann, R.W. Truss, Inverse gas
chromatography for natural fibre characterisation: dispersive and acid-base distribution
profiles of the surface energy, Cellulose. 24 (2017) 4691–4700. doi:10.1007/s10570-
017-1443-2.
[129] H. Balard, E. Brendle, E. Papirer, Determination of the acid-base properties of solid
surfaces using inverse gas chromatography: Advantages and limitations, Acid-Base
Interact. Relev. to Adhes. Sci. Technol. 2 (2000) 299–316.
[130] F.M. Fowkes, ATTRACTIVE FORCES AT INTERFACES, Ind. Eng. Chem. 56 (1964)
40–52. doi:10.1021/ie50660a008.
[131] J. Schultz, L. Lavielle, C. Martin, The Role of the Interface in Carbon Fibre-Epoxy
Composites, J. Adhes. 23 (1987) 45–60. doi:10.1080/00218468708080469.
[132] G.M. Dorris, D.G. Gray, Adsorption of n-alkanes at zero surface coverage on cellulose
paper and wood fibers, J. Colloid Interface Sci. 77 (1980) 353–362.
doi:https://doi.org/10.1016/0021-9797(80)90304-5.
[133] D.K. Owens, R.C. Wendt, Estimation of the surface free energy of polymers, J. Appl.
Polym. Sci. 13 (1969) 1741–1747.
[134] C. Della Volpe, D. Maniglio, S. Siboni, M. Morra, Recent theoretical and experimental
advancements in the application of van Oss–Chaudury–Good acid–base theory to the
analysis of polymer surfaces I. General aspects, J. Adhes. Sci. Technol. 17 (2003) 1477–
1505. doi:10.1163/156856103769207365.
[135] C.D. Volpe, S. Siboni, Some Reflections on Acid–Base Solid Surface Free Energy
Theories, J. Colloid Interface Sci. 195 (1997) 121–136.
doi:https://doi.org/10.1006/jcis.1997.5124.
[136] S. Dong, M. Brendlé, J.B. Donnet, Study of solid surface polarity by inverse gas
chromatography at infinite dilution, Chromatographia. 28 (1989) 469–472.
doi:10.1007/BF02261062.
[137] M.A. Islam, A. Pal, B.B. Saha, Experimental study on thermophysical and porous
properties of silica gels, Int. J. Refrig. 110 (2020) 277–285.
doi:10.1016/j.ijrefrig.2019.10.027.
[138] A. Kondor, C. Quellet, A. Dallos, Surface characterization of standard cotton fibres and
REFERENCES
160 | P a g e
determination of adsorption isotherms of fragrances by IGC, Surf. Interface Anal. 47
(2015) 1040–1050. doi:10.1002/sia.5811.
[139] B. Shi, Y. Wang, L. Jia, Comparison of Dorris–Gray and Schultz methods for the
calculation of surface dispersive free energy by inverse gas chromatography, J.
Chromatogr. A. 1218 (2011) 860–862.
doi:https://doi.org/10.1016/j.chroma.2010.12.050.
[140] M. Rückriem, A. Inayat, D. Enke, R. Gläser, W.-D. Einicke, R. Rockmann, Inverse gas
chromatography for determining the dispersive surface energy of porous silica, Colloids
Surfaces A Physicochem. Eng. Asp. 357 (2010) 21–26.
doi:10.1016/J.COLSURFA.2009.12.001.
[141] A. Chakraborty, B.B. Saha, S. Koyama, K.C. Ng, On the thermodynamic modeling of
the isosteric heat of adsorption and comparison with experiments, Appl. Phys. Lett. 89
(2006) 171901. doi:10.1063/1.2360925.
[142] L. Prasetyo, D.D. Do, D. Nicholson, A coherent definition of Henry constant and
isosteric heat at zero loading for adsorption in solids – An absolute accessible volume,
Chem. Eng. J. 334 (2018) 143–152. doi:10.1016/j.cej.2017.10.022.
[143] B.B. Saha, A. Chakraborty, S. Koyama, K. Srinivasan, K.C. Ng, T. Kashiwagi, P. Dutta,
Thermodynamic formalism of minimum heat source temperature for driving advanced
adsorption cooling device, Appl. Phys. Lett. 91 (2007) 111902. doi:10.1063/1.2780117.
[144] A.K. Meena, G.K. Mishra, P.K. Rai, C. Rajagopal, P.N. Nagar, Removal of heavy metal
ions from aqueous solutions using carbon aerogel as an adsorbent, J. Hazard. Mater. 122
(2005) 161–170. doi:https://doi.org/10.1016/j.jhazmat.2005.03.024.
[145] L. Deschênes, J. Lyklema, C. Danis, F. Saint-Germain, Phase transitions in polymer
monolayers: Application of the Clapeyron equation to PEO in PPO–PEO Langmuir
films, Adv. Colloid Interface Sci. 222 (2015) 199–214.
doi:https://doi.org/10.1016/j.cis.2014.11.002.
[146] P.J. Dauenhauer, O.A. Abdelrahman, A Universal Descriptor for the Entropy of
Adsorbed Molecules in Confined Spaces, ACS Cent. Sci. 4 (2018) 1235–1243.
doi:10.1021/acscentsci.8b00419.
[147] R.K. Agarwal, K.A.G. Amankwah, J.A. Schwarz, Analysis of adsorption entropies of
high pressure gas adsorption data on activated carbon, Carbon N. Y. 28 (1990) 169–174.
doi:10.1016/0008-6223(90)90110-K.
[148] A. Pal, K. Thu, S. Mitra, I.I. El-Sharkawy, B.B. Saha, H.-S. Kil, S.-H. Yoon, J.
Miyawaki, Study on biomass derived activated carbons for adsorptive heat pump
REFERENCES
161 | P a g e
application, Int. J. Heat Mass Transf. 110 (2017) 7–19.
doi:https://doi.org/10.1016/j.ijheatmasstransfer.2017.02.081.
[149] T. Smith, Effect of Surface Coverage and Temperature on the Sticking Coefficient, J.
Chem. Phys. 40 (1964) 1805–1812. doi:10.1063/1.1725409.
[150] A. Chakraborty, B.B. Saha, K.C. Ng, S. Koyama, K. Srinivasan, Theoretical Insight of
Physical Adsorption for a Single-Component Adsorbent + Adsorbate System: I.
Thermodynamic Property Surfaces, Langmuir. 25 (2009) 2204–2211.
doi:10.1021/la803289p.
[151] S. Sircar, R. Mohr, C. Ristic, M.B. Rao, Isosteric Heat of Adsorption: Theory and
Experiment, J. Phys. Chem. B. 103 (1999) 6539–6546. doi:10.1021/jp9903817.
[152] K. Uddin, I.I. El-Sharkawy, T. Miyazaki, S. Koyama, H.-S. Kil, J. Miyawaki, S.-H.
Yoon, Adsorption characteristics of ethanol onto functional activated carbons with
controlled oxygen content, Appl. Therm. Eng. 72 (2014) 211–218.
doi:10.1016/J.APPLTHERMALENG.2014.03.062.
[153] M. Sivak, Potential energy demand for cooling in the 50 largest metropolitan areas of
the world: Implications for developing countries, Energy Policy. 37 (2009) 1382–1384.
doi:https://doi.org/10.1016/j.enpol.2008.11.031.
[154] K.-H. Kim, Z.-H. Shon, H.T. Nguyen, E.-C. Jeon, A review of major
chlorofluorocarbons and their halocarbon alternatives in the air, Atmos. Environ. 45
(2011) 1369–1382. doi:https://doi.org/10.1016/j.atmosenv.2010.12.029.
[155] B.B. Saha, K.C. Ng, Advances in adsorption technology, Nova Science Publishers,
2010. http://hdl.handle.net/2324/1001434433 (accessed January 22, 2018).
[156] K.C. Ng, H.T. Chua, C.Y. Chung, C.H. Loke, T. Kashiwagi, A. Akisawa, B.B. Saha,
Experimental investigation of the silica gel–water adsorption isotherm characteristics,
Appl. Therm. Eng. 21 (2001) 1631–1642. doi:10.1016/S1359-4311(01)00039-4.
[157] S. Kayal, S. Baichuan, B.B. Saha, Adsorption characteristics of AQSOA zeolites and
water for adsorption chillers, Int. J. Heat Mass Transf. 92 (2016) 1120–1127.
doi:10.1016/J.IJHEATMASSTRANSFER.2015.09.060.
[158] J. Sahu, A. Aijaz, Q. Xu, P.K. Bharadwaj, A three-dimensional pillared-layer metal-
organic framework: Synthesis, structure and gas adsorption studies, Inorganica Chim.
Acta. 430 (2015) 193–198. doi:https://doi.org/10.1016/j.ica.2015.03.011.
[159] N.C. Burtch, H. Jasuja, K.S. Walton, Water Stability and Adsorption in Metal–Organic
Frameworks, Chem. Rev. 114 (2014) 10575–10612. doi:10.1021/cr5002589.
[160] N. Tannert, S.-J. Ernst, C. Jansen, H.-J. Bart, S.K. Henninger, C. Janiak, Evaluation of
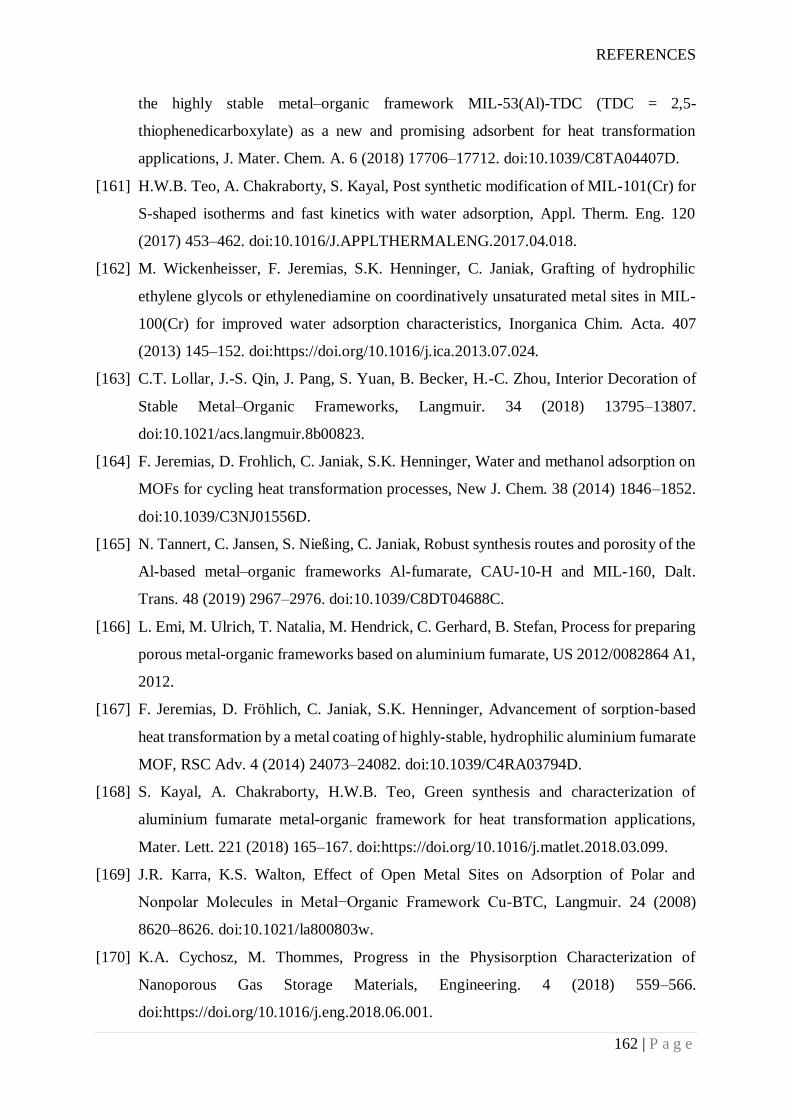
REFERENCES
162 | P a g e
the highly stable metal–organic framework MIL-53(Al)-TDC (TDC = 2,5-
thiophenedicarboxylate) as a new and promising adsorbent for heat transformation
applications, J. Mater. Chem. A. 6 (2018) 17706–17712. doi:10.1039/C8TA04407D.
[161] H.W.B. Teo, A. Chakraborty, S. Kayal, Post synthetic modification of MIL-101(Cr) for
S-shaped isotherms and fast kinetics with water adsorption, Appl. Therm. Eng. 120
(2017) 453–462. doi:10.1016/J.APPLTHERMALENG.2017.04.018.
[162] M. Wickenheisser, F. Jeremias, S.K. Henninger, C. Janiak, Grafting of hydrophilic
ethylene glycols or ethylenediamine on coordinatively unsaturated metal sites in MIL-
100(Cr) for improved water adsorption characteristics, Inorganica Chim. Acta. 407
(2013) 145–152. doi:https://doi.org/10.1016/j.ica.2013.07.024.
[163] C.T. Lollar, J.-S. Qin, J. Pang, S. Yuan, B. Becker, H.-C. Zhou, Interior Decoration of
Stable Metal–Organic Frameworks, Langmuir. 34 (2018) 13795–13807.
doi:10.1021/acs.langmuir.8b00823.
[164] F. Jeremias, D. Frohlich, C. Janiak, S.K. Henninger, Water and methanol adsorption on
MOFs for cycling heat transformation processes, New J. Chem. 38 (2014) 1846–1852.
doi:10.1039/C3NJ01556D.
[165] N. Tannert, C. Jansen, S. Nießing, C. Janiak, Robust synthesis routes and porosity of the
Al-based metal–organic frameworks Al-fumarate, CAU-10-H and MIL-160, Dalt.
Trans. 48 (2019) 2967–2976. doi:10.1039/C8DT04688C.
[166] L. Emi, M. Ulrich, T. Natalia, M. Hendrick, C. Gerhard, B. Stefan, Process for preparing
porous metal-organic frameworks based on aluminium fumarate, US 2012/0082864 A1,
2012.
[167] F. Jeremias, D. Fröhlich, C. Janiak, S.K. Henninger, Advancement of sorption-based
heat transformation by a metal coating of highly-stable, hydrophilic aluminium fumarate
MOF, RSC Adv. 4 (2014) 24073–24082. doi:10.1039/C4RA03794D.
[168] S. Kayal, A. Chakraborty, H.W.B. Teo, Green synthesis and characterization of
aluminium fumarate metal-organic framework for heat transformation applications,
Mater. Lett. 221 (2018) 165–167. doi:https://doi.org/10.1016/j.matlet.2018.03.099.
[169] J.R. Karra, K.S. Walton, Effect of Open Metal Sites on Adsorption of Polar and
Nonpolar Molecules in Metal−Organic Framework Cu-BTC, Langmuir. 24 (2008)
8620–8626. doi:10.1021/la800803w.
[170] K.A. Cychosz, M. Thommes, Progress in the Physisorption Characterization of
Nanoporous Gas Storage Materials, Engineering. 4 (2018) 559–566.
doi:https://doi.org/10.1016/j.eng.2018.06.001.
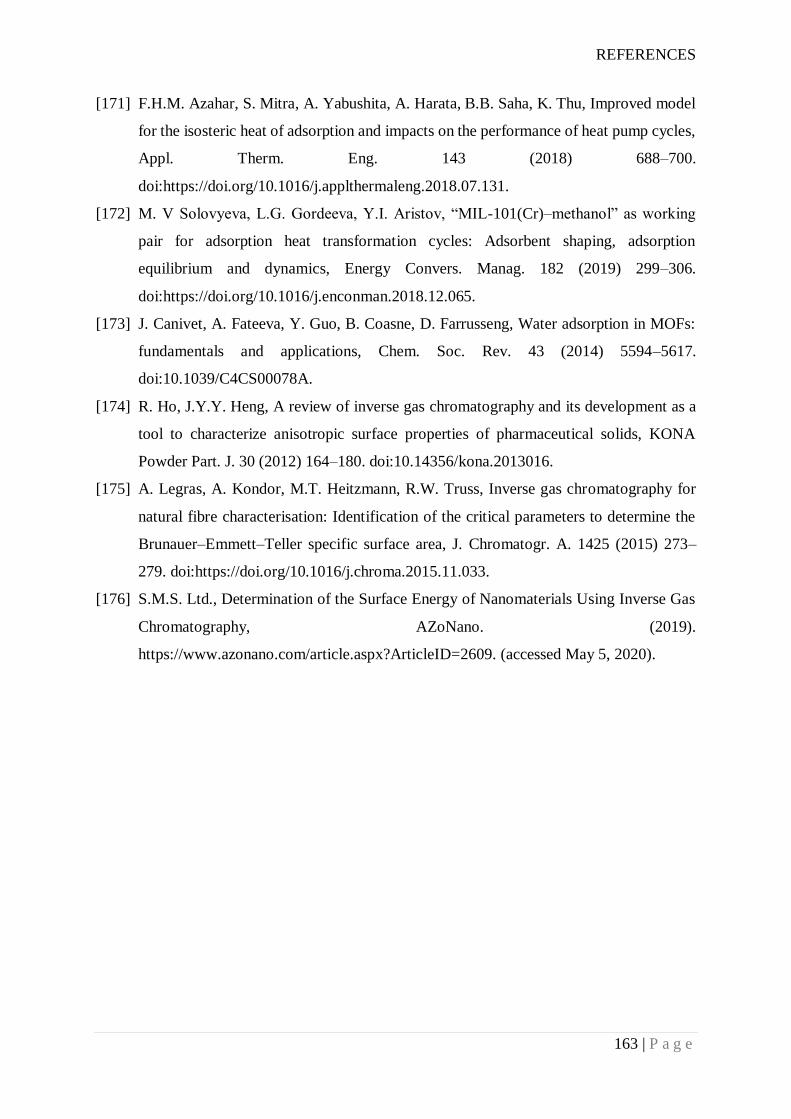
REFERENCES
163 | P a g e
[171] F.H.M. Azahar, S. Mitra, A. Yabushita, A. Harata, B.B. Saha, K. Thu, Improved model
for the isosteric heat of adsorption and impacts on the performance of heat pump cycles,
Appl. Therm. Eng. 143 (2018) 688–700.
doi:https://doi.org/10.1016/j.applthermaleng.2018.07.131.
[172] M. V Solovyeva, L.G. Gordeeva, Y.I. Aristov, “MIL-101(Cr)–methanol” as working
pair for adsorption heat transformation cycles: Adsorbent shaping, adsorption
equilibrium and dynamics, Energy Convers. Manag. 182 (2019) 299–306.
doi:https://doi.org/10.1016/j.enconman.2018.12.065.
[173] J. Canivet, A. Fateeva, Y. Guo, B. Coasne, D. Farrusseng, Water adsorption in MOFs:
fundamentals and applications, Chem. Soc. Rev. 43 (2014) 5594–5617.
doi:10.1039/C4CS00078A.
[174] R. Ho, J.Y.Y. Heng, A review of inverse gas chromatography and its development as a
tool to characterize anisotropic surface properties of pharmaceutical solids, KONA
Powder Part. J. 30 (2012) 164–180. doi:10.14356/kona.2013016.
[175] A. Legras, A. Kondor, M.T. Heitzmann, R.W. Truss, Inverse gas chromatography for
natural fibre characterisation: Identification of the critical parameters to determine the
Brunauer–Emmett–Teller specific surface area, J. Chromatogr. A. 1425 (2015) 273–
279. doi:https://doi.org/10.1016/j.chroma.2015.11.033.
[176] S.M.S. Ltd., Determination of the Surface Energy of Nanomaterials Using Inverse Gas
Chromatography, AZoNano. (2019).
https://www.azonano.com/article.aspx?ArticleID=2609. (accessed May 5, 2020).
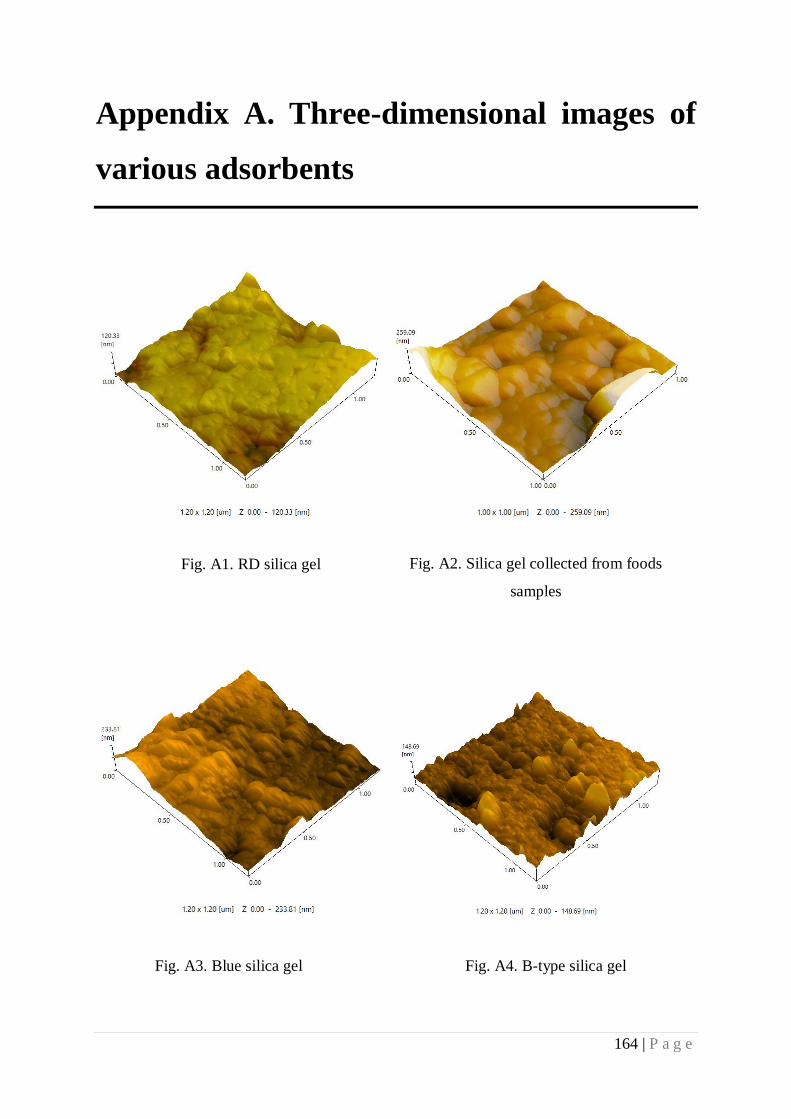
164 | P a g e
Appendix A. Three-dimensional images of
various adsorbents
Fig. A1. RD silica gel Fig. A2. Silica gel collected from foods
samples
Fig. A3. Blue silica gel Fig. A4. B-type silica gel
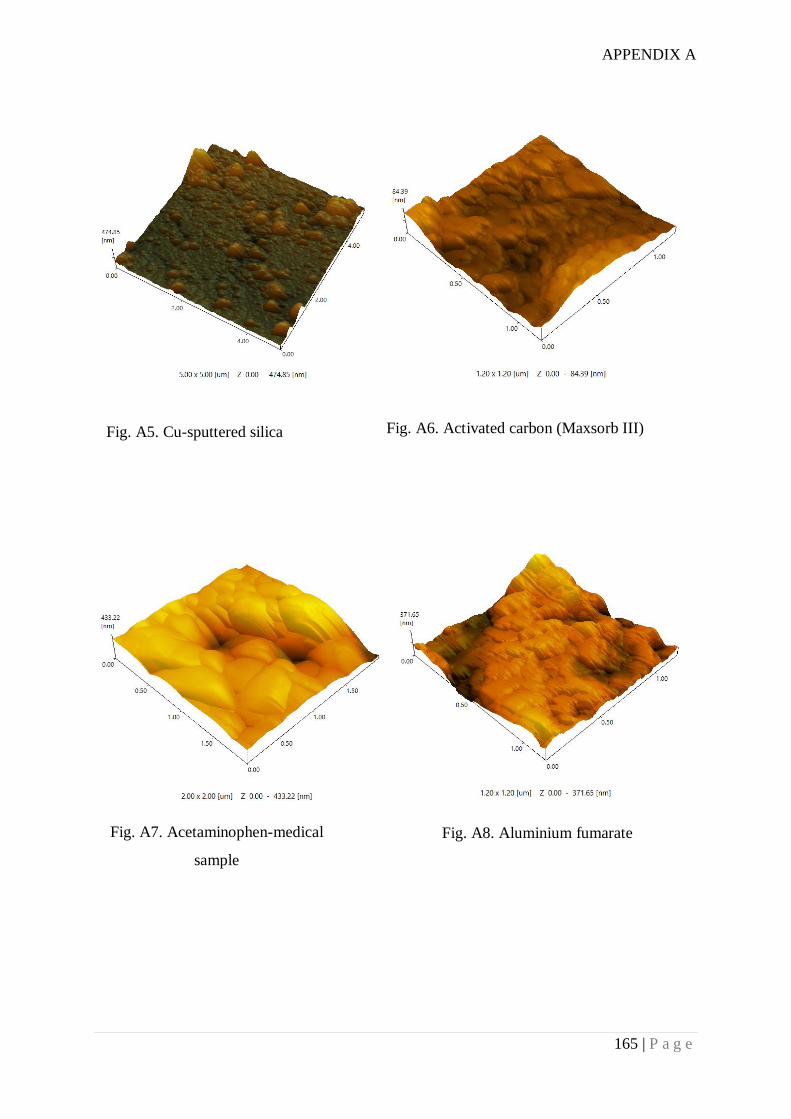
APPENDIX A
165 | P a g e
Fig. A5. Cu-sputtered silica
gel
Fig. A6. Activated carbon (Maxsorb III)
Fig. A7. Acetaminophen-medical
sample
Fig. A8. Aluminium fumarate
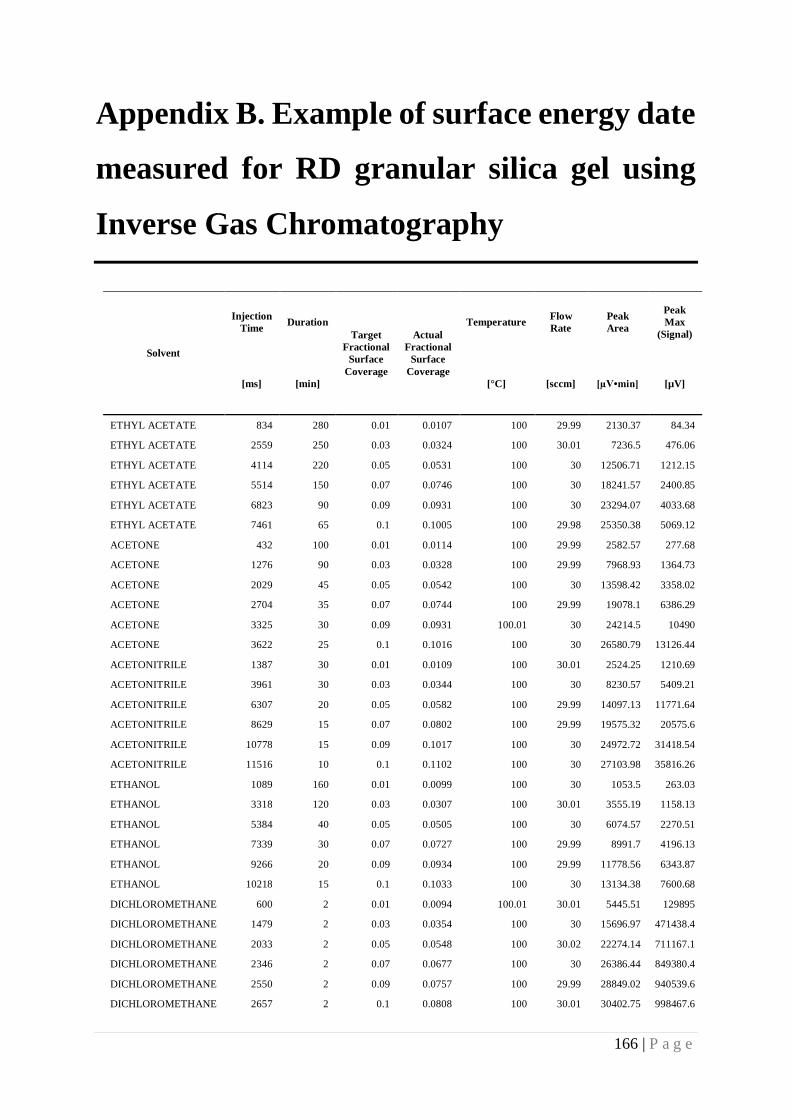
166 | P a g e
Appendix B. Example of surface energy date
measured for RD granular silica gel using
Inverse Gas Chromatography
Solvent
Injection
Time Duration
Target
Fractional
Surface
Coverage
Actual
Fractional
Surface
Coverage
Temperature Flow
Rate
Peak
Area
Peak
Max
(Signal)
[ms] [min] [°C] [sccm] [µV•min] [µV]
ETHYL ACETATE 834 280 0.01 0.0107 100 29.99 2130.37 84.34
ETHYL ACETATE 2559 250 0.03 0.0324 100 30.01 7236.5 476.06
ETHYL ACETATE 4114 220 0.05 0.0531 100 30 12506.71 1212.15
ETHYL ACETATE 5514 150 0.07 0.0746 100 30 18241.57 2400.85
ETHYL ACETATE 6823 90 0.09 0.0931 100 30 23294.07 4033.68
ETHYL ACETATE 7461 65 0.1 0.1005 100 29.98 25350.38 5069.12
ACETONE 432 100 0.01 0.0114 100 29.99 2582.57 277.68
ACETONE 1276 90 0.03 0.0328 100 29.99 7968.93 1364.73
ACETONE 2029 45 0.05 0.0542 100 30 13598.42 3358.02
ACETONE 2704 35 0.07 0.0744 100 29.99 19078.1 6386.29
ACETONE 3325 30 0.09 0.0931 100.01 30 24214.5 10490
ACETONE 3622 25 0.1 0.1016 100 30 26580.79 13126.44
ACETONITRILE 1387 30 0.01 0.0109 100 30.01 2524.25 1210.69
ACETONITRILE 3961 30 0.03 0.0344 100 30 8230.57 5409.21
ACETONITRILE 6307 20 0.05 0.0582 100 29.99 14097.13 11771.64
ACETONITRILE 8629 15 0.07 0.0802 100 29.99 19575.32 20575.6
ACETONITRILE 10778 15 0.09 0.1017 100 30 24972.72 31418.54
ACETONITRILE 11516 10 0.1 0.1102 100 30 27103.98 35816.26
ETHANOL 1089 160 0.01 0.0099 100 30 1053.5 263.03
ETHANOL 3318 120 0.03 0.0307 100 30.01 3555.19 1158.13
ETHANOL 5384 40 0.05 0.0505 100 30 6074.57 2270.51
ETHANOL 7339 30 0.07 0.0727 100 29.99 8991.7 4196.13
ETHANOL 9266 20 0.09 0.0934 100 29.99 11778.56 6343.87
ETHANOL 10218 15 0.1 0.1033 100 30 13134.38 7600.68
DICHLOROMETHANE 600 2 0.01 0.0094 100.01 30.01 5445.51 129895
DICHLOROMETHANE 1479 2 0.03 0.0354 100 30 15696.97 471438.4
DICHLOROMETHANE 2033 2 0.05 0.0548 100 30.02 22274.14 711167.1
DICHLOROMETHANE 2346 2 0.07 0.0677 100 30 26386.44 849380.4
DICHLOROMETHANE 2550 2 0.09 0.0757 100 29.99 28849.02 940539.6
DICHLOROMETHANE 2657 2 0.1 0.0808 100 30.01 30402.75 998467.6
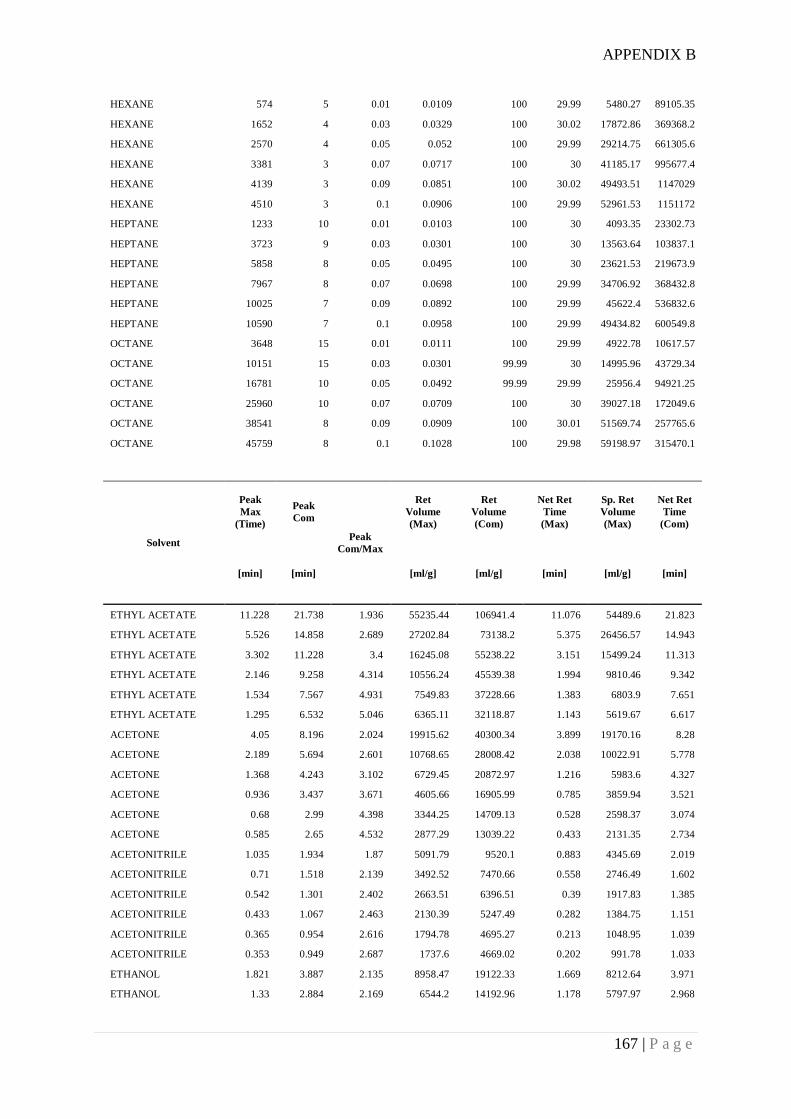
APPENDIX B
167 | P a g e
HEXANE 574 5 0.01 0.0109 100 29.99 5480.27 89105.35
HEXANE 1652 4 0.03 0.0329 100 30.02 17872.86 369368.2
HEXANE 2570 4 0.05 0.052 100 29.99 29214.75 661305.6
HEXANE 3381 3 0.07 0.0717 100 30 41185.17 995677.4
HEXANE 4139 3 0.09 0.0851 100 30.02 49493.51 1147029
HEXANE 4510 3 0.1 0.0906 100 29.99 52961.53 1151172
HEPTANE 1233 10 0.01 0.0103 100 30 4093.35 23302.73
HEPTANE 3723 9 0.03 0.0301 100 30 13563.64 103837.1
HEPTANE 5858 8 0.05 0.0495 100 30 23621.53 219673.9
HEPTANE 7967 8 0.07 0.0698 100 29.99 34706.92 368432.8
HEPTANE 10025 7 0.09 0.0892 100 29.99 45622.4 536832.6
HEPTANE 10590 7 0.1 0.0958 100 29.99 49434.82 600549.8
OCTANE 3648 15 0.01 0.0111 100 29.99 4922.78 10617.57
OCTANE 10151 15 0.03 0.0301 99.99 30 14995.96 43729.34
OCTANE 16781 10 0.05 0.0492 99.99 29.99 25956.4 94921.25
OCTANE 25960 10 0.07 0.0709 100 30 39027.18 172049.6
OCTANE 38541 8 0.09 0.0909 100 30.01 51569.74 257765.6
OCTANE 45759 8 0.1 0.1028 100 29.98 59198.97 315470.1
Solvent
Peak
Max
(Time)
Peak
Com
Peak
Com/Max
Ret
Volume
(Max)
Ret
Volume
(Com)
Net Ret
Time
(Max)
Sp. Ret
Volume
(Max)
Net Ret
Time
(Com)
[min] [min] [ml/g] [ml/g] [min] [ml/g] [min]
ETHYL ACETATE 11.228 21.738 1.936 55235.44 106941.4 11.076 54489.6 21.823
ETHYL ACETATE 5.526 14.858 2.689 27202.84 73138.2 5.375 26456.57 14.943
ETHYL ACETATE 3.302 11.228 3.4 16245.08 55238.22 3.151 15499.24 11.313
ETHYL ACETATE 2.146 9.258 4.314 10556.24 45539.38 1.994 9810.46 9.342
ETHYL ACETATE 1.534 7.567 4.931 7549.83 37228.66 1.383 6803.9 7.651
ETHYL ACETATE 1.295 6.532 5.046 6365.11 32118.87 1.143 5619.67 6.617
ACETONE 4.05 8.196 2.024 19915.62 40300.34 3.899 19170.16 8.28
ACETONE 2.189 5.694 2.601 10768.65 28008.42 2.038 10022.91 5.778
ACETONE 1.368 4.243 3.102 6729.45 20872.97 1.216 5983.6 4.327
ACETONE 0.936 3.437 3.671 4605.66 16905.99 0.785 3859.94 3.521
ACETONE 0.68 2.99 4.398 3344.25 14709.13 0.528 2598.37 3.074
ACETONE 0.585 2.65 4.532 2877.29 13039.22 0.433 2131.35 2.734
ACETONITRILE 1.035 1.934 1.87 5091.79 9520.1 0.883 4345.69 2.019
ACETONITRILE 0.71 1.518 2.139 3492.52 7470.66 0.558 2746.49 1.602
ACETONITRILE 0.542 1.301 2.402 2663.51 6396.51 0.39 1917.83 1.385
ACETONITRILE 0.433 1.067 2.463 2130.39 5247.49 0.282 1384.75 1.151
ACETONITRILE 0.365 0.954 2.616 1794.78 4695.27 0.213 1048.95 1.039
ACETONITRILE 0.353 0.949 2.687 1737.6 4669.02 0.202 991.78 1.033
ETHANOL 1.821 3.887 2.135 8958.47 19122.33 1.669 8212.64 3.971
ETHANOL 1.33 2.884 2.169 6544.2 14192.96 1.178 5797.97 2.968
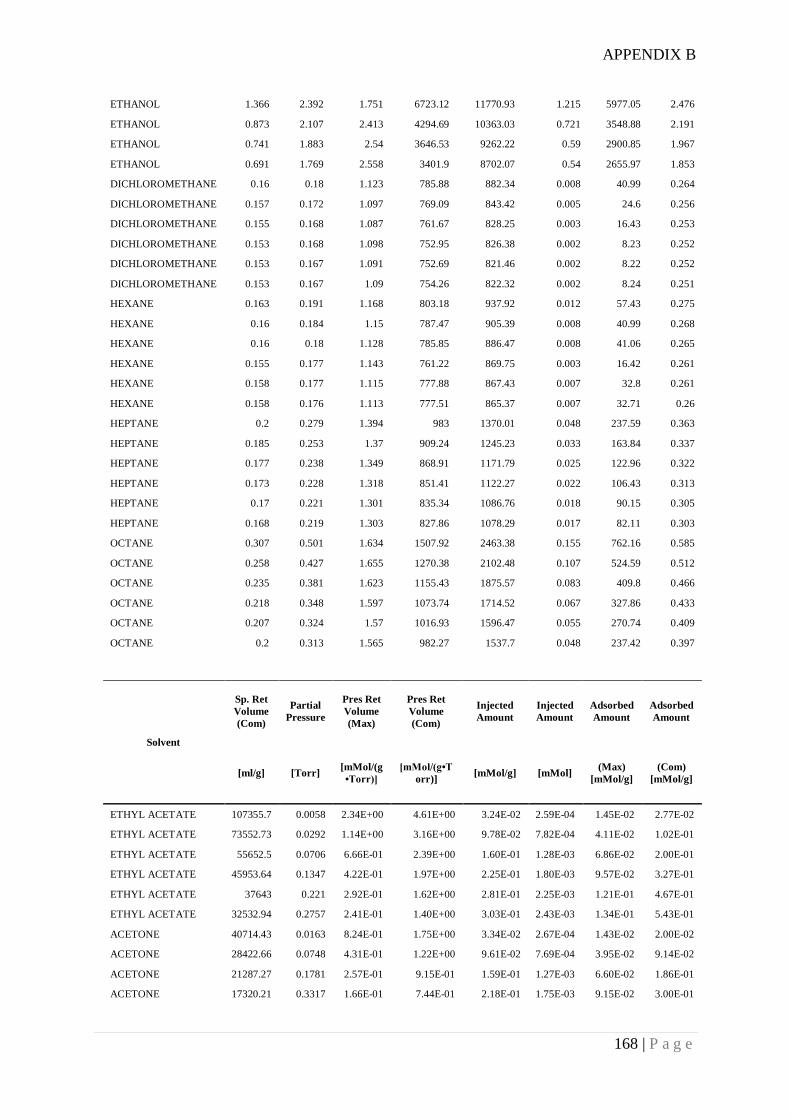
APPENDIX B
168 | P a g e
ETHANOL 1.366 2.392 1.751 6723.12 11770.93 1.215 5977.05 2.476
ETHANOL 0.873 2.107 2.413 4294.69 10363.03 0.721 3548.88 2.191
ETHANOL 0.741 1.883 2.54 3646.53 9262.22 0.59 2900.85 1.967
ETHANOL 0.691 1.769 2.558 3401.9 8702.07 0.54 2655.97 1.853
DICHLOROMETHANE 0.16 0.18 1.123 785.88 882.34 0.008 40.99 0.264
DICHLOROMETHANE 0.157 0.172 1.097 769.09 843.42 0.005 24.6 0.256
DICHLOROMETHANE 0.155 0.168 1.087 761.67 828.25 0.003 16.43 0.253
DICHLOROMETHANE 0.153 0.168 1.098 752.95 826.38 0.002 8.23 0.252
DICHLOROMETHANE 0.153 0.167 1.091 752.69 821.46 0.002 8.22 0.252
DICHLOROMETHANE 0.153 0.167 1.09 754.26 822.32 0.002 8.24 0.251
HEXANE 0.163 0.191 1.168 803.18 937.92 0.012 57.43 0.275
HEXANE 0.16 0.184 1.15 787.47 905.39 0.008 40.99 0.268
HEXANE 0.16 0.18 1.128 785.85 886.47 0.008 41.06 0.265
HEXANE 0.155 0.177 1.143 761.22 869.75 0.003 16.42 0.261
HEXANE 0.158 0.177 1.115 777.88 867.43 0.007 32.8 0.261
HEXANE 0.158 0.176 1.113 777.51 865.37 0.007 32.71 0.26
HEPTANE 0.2 0.279 1.394 983 1370.01 0.048 237.59 0.363
HEPTANE 0.185 0.253 1.37 909.24 1245.23 0.033 163.84 0.337
HEPTANE 0.177 0.238 1.349 868.91 1171.79 0.025 122.96 0.322
HEPTANE 0.173 0.228 1.318 851.41 1122.27 0.022 106.43 0.313
HEPTANE 0.17 0.221 1.301 835.34 1086.76 0.018 90.15 0.305
HEPTANE 0.168 0.219 1.303 827.86 1078.29 0.017 82.11 0.303
OCTANE 0.307 0.501 1.634 1507.92 2463.38 0.155 762.16 0.585
OCTANE 0.258 0.427 1.655 1270.38 2102.48 0.107 524.59 0.512
OCTANE 0.235 0.381 1.623 1155.43 1875.57 0.083 409.8 0.466
OCTANE 0.218 0.348 1.597 1073.74 1714.52 0.067 327.86 0.433
OCTANE 0.207 0.324 1.57 1016.93 1596.47 0.055 270.74 0.409
OCTANE 0.2 0.313 1.565 982.27 1537.7 0.048 237.42 0.397
Solvent
Sp. Ret
Volume
(Com)
Partial
Pressure
Pres Ret
Volume
(Max)
Pres Ret
Volume
(Com)
Injected
Amount
Injected
Amount
Adsorbed
Amount
Adsorbed
Amount
[ml/g] [Torr] [mMol/(g
•Torr)]
[mMol/(g•T
orr)] [mMol/g] [mMol]
(Max)
[mMol/g]
(Com)
[mMol/g]
ETHYL ACETATE 107355.7 0.0058 2.34E+00 4.61E+00 3.24E-02 2.59E-04 1.45E-02 2.77E-02
ETHYL ACETATE 73552.73 0.0292 1.14E+00 3.16E+00 9.78E-02 7.82E-04 4.11E-02 1.02E-01
ETHYL ACETATE 55652.5 0.0706 6.66E-01 2.39E+00 1.60E-01 1.28E-03 6.86E-02 2.00E-01
ETHYL ACETATE 45953.64 0.1347 4.22E-01 1.97E+00 2.25E-01 1.80E-03 9.57E-02 3.27E-01
ETHYL ACETATE 37643 0.221 2.92E-01 1.62E+00 2.81E-01 2.25E-03 1.21E-01 4.67E-01
ETHYL ACETATE 32532.94 0.2757 2.41E-01 1.40E+00 3.03E-01 2.43E-03 1.34E-01 5.43E-01
ACETONE 40714.43 0.0163 8.24E-01 1.75E+00 3.34E-02 2.67E-04 1.43E-02 2.00E-02
ACETONE 28422.66 0.0748 4.31E-01 1.22E+00 9.61E-02 7.69E-04 3.95E-02 9.14E-02
ACETONE 21287.27 0.1781 2.57E-01 9.15E-01 1.59E-01 1.27E-03 6.60E-02 1.86E-01
ACETONE 17320.21 0.3317 1.66E-01 7.44E-01 2.18E-01 1.75E-03 9.15E-02 3.00E-01
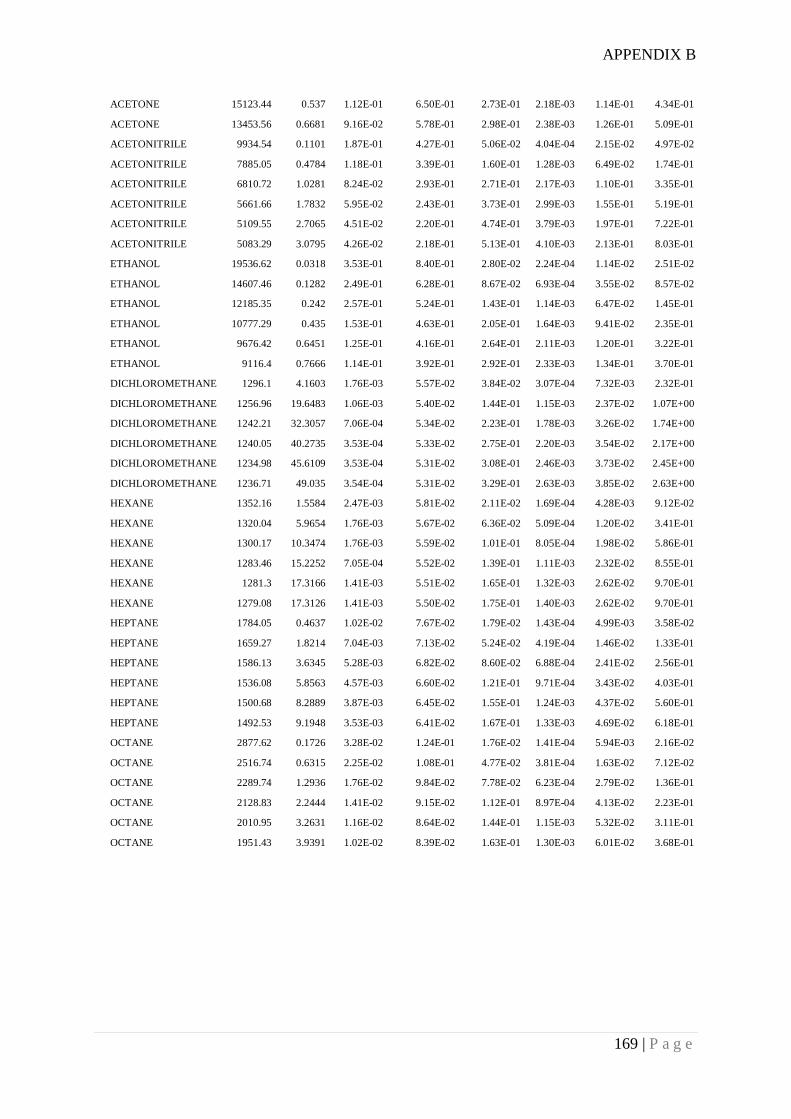
APPENDIX B
169 | P a g e
ACETONE 15123.44 0.537 1.12E-01 6.50E-01 2.73E-01 2.18E-03 1.14E-01 4.34E-01
ACETONE 13453.56 0.6681 9.16E-02 5.78E-01 2.98E-01 2.38E-03 1.26E-01 5.09E-01
ACETONITRILE 9934.54 0.1101 1.87E-01 4.27E-01 5.06E-02 4.04E-04 2.15E-02 4.97E-02
ACETONITRILE 7885.05 0.4784 1.18E-01 3.39E-01 1.60E-01 1.28E-03 6.49E-02 1.74E-01
ACETONITRILE 6810.72 1.0281 8.24E-02 2.93E-01 2.71E-01 2.17E-03 1.10E-01 3.35E-01
ACETONITRILE 5661.66 1.7832 5.95E-02 2.43E-01 3.73E-01 2.99E-03 1.55E-01 5.19E-01
ACETONITRILE 5109.55 2.7065 4.51E-02 2.20E-01 4.74E-01 3.79E-03 1.97E-01 7.22E-01
ACETONITRILE 5083.29 3.0795 4.26E-02 2.18E-01 5.13E-01 4.10E-03 2.13E-01 8.03E-01
ETHANOL 19536.62 0.0318 3.53E-01 8.40E-01 2.80E-02 2.24E-04 1.14E-02 2.51E-02
ETHANOL 14607.46 0.1282 2.49E-01 6.28E-01 8.67E-02 6.93E-04 3.55E-02 8.57E-02
ETHANOL 12185.35 0.242 2.57E-01 5.24E-01 1.43E-01 1.14E-03 6.47E-02 1.45E-01
ETHANOL 10777.29 0.435 1.53E-01 4.63E-01 2.05E-01 1.64E-03 9.41E-02 2.35E-01
ETHANOL 9676.42 0.6451 1.25E-01 4.16E-01 2.64E-01 2.11E-03 1.20E-01 3.22E-01
ETHANOL 9116.4 0.7666 1.14E-01 3.92E-01 2.92E-01 2.33E-03 1.34E-01 3.70E-01
DICHLOROMETHANE 1296.1 4.1603 1.76E-03 5.57E-02 3.84E-02 3.07E-04 7.32E-03 2.32E-01
DICHLOROMETHANE 1256.96 19.6483 1.06E-03 5.40E-02 1.44E-01 1.15E-03 2.37E-02 1.07E+00
DICHLOROMETHANE 1242.21 32.3057 7.06E-04 5.34E-02 2.23E-01 1.78E-03 3.26E-02 1.74E+00
DICHLOROMETHANE 1240.05 40.2735 3.53E-04 5.33E-02 2.75E-01 2.20E-03 3.54E-02 2.17E+00
DICHLOROMETHANE 1234.98 45.6109 3.53E-04 5.31E-02 3.08E-01 2.46E-03 3.73E-02 2.45E+00
DICHLOROMETHANE 1236.71 49.035 3.54E-04 5.31E-02 3.29E-01 2.63E-03 3.85E-02 2.63E+00
HEXANE 1352.16 1.5584 2.47E-03 5.81E-02 2.11E-02 1.69E-04 4.28E-03 9.12E-02
HEXANE 1320.04 5.9654 1.76E-03 5.67E-02 6.36E-02 5.09E-04 1.20E-02 3.41E-01
HEXANE 1300.17 10.3474 1.76E-03 5.59E-02 1.01E-01 8.05E-04 1.98E-02 5.86E-01
HEXANE 1283.46 15.2252 7.05E-04 5.52E-02 1.39E-01 1.11E-03 2.32E-02 8.55E-01
HEXANE 1281.3 17.3166 1.41E-03 5.51E-02 1.65E-01 1.32E-03 2.62E-02 9.70E-01
HEXANE 1279.08 17.3126 1.41E-03 5.50E-02 1.75E-01 1.40E-03 2.62E-02 9.70E-01
HEPTANE 1784.05 0.4637 1.02E-02 7.67E-02 1.79E-02 1.43E-04 4.99E-03 3.58E-02
HEPTANE 1659.27 1.8214 7.04E-03 7.13E-02 5.24E-02 4.19E-04 1.46E-02 1.33E-01
HEPTANE 1586.13 3.6345 5.28E-03 6.82E-02 8.60E-02 6.88E-04 2.41E-02 2.56E-01
HEPTANE 1536.08 5.8563 4.57E-03 6.60E-02 1.21E-01 9.71E-04 3.43E-02 4.03E-01
HEPTANE 1500.68 8.2889 3.87E-03 6.45E-02 1.55E-01 1.24E-03 4.37E-02 5.60E-01
HEPTANE 1492.53 9.1948 3.53E-03 6.41E-02 1.67E-01 1.33E-03 4.69E-02 6.18E-01
OCTANE 2877.62 0.1726 3.28E-02 1.24E-01 1.76E-02 1.41E-04 5.94E-03 2.16E-02
OCTANE 2516.74 0.6315 2.25E-02 1.08E-01 4.77E-02 3.81E-04 1.63E-02 7.12E-02
OCTANE 2289.74 1.2936 1.76E-02 9.84E-02 7.78E-02 6.23E-04 2.79E-02 1.36E-01
OCTANE 2128.83 2.2444 1.41E-02 9.15E-02 1.12E-01 8.97E-04 4.13E-02 2.23E-01
OCTANE 2010.95 3.2631 1.16E-02 8.64E-02 1.44E-01 1.15E-03 5.32E-02 3.11E-01
OCTANE 1951.43 3.9391 1.02E-02 8.39E-02 1.63E-01 1.30E-03 6.01E-02 3.68E-01
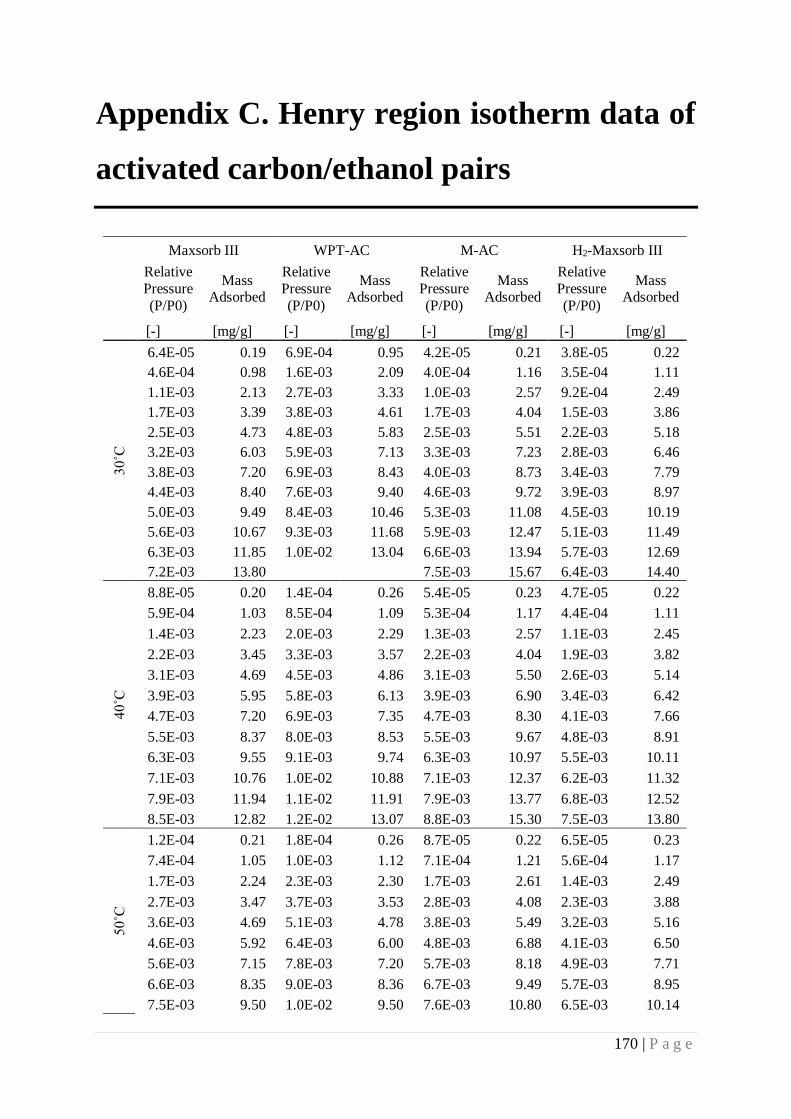
170 | P a g e
Appendix C. Henry region isotherm data of
activated carbon/ethanol pairs
Maxsorb III WPT-AC M-AC H2-Maxsorb III
Relative
Pressure
(P/P0)
Mass Adsorbed
Relative
Pressure
(P/P0)
Mass Adsorbed
Relative
Pressure
(P/P0)
Mass Adsorbed
Relative
Pressure
(P/P0)
Mass Adsorbed
[-] [mg/g] [-] [mg/g] [-] [mg/g] [-] [mg/g]
30˚C
6.4E-05 0.19 6.9E-04 0.95 4.2E-05 0.21 3.8E-05 0.22
4.6E-04 0.98 1.6E-03 2.09 4.0E-04 1.16 3.5E-04 1.11
1.1E-03 2.13 2.7E-03 3.33 1.0E-03 2.57 9.2E-04 2.49
1.7E-03 3.39 3.8E-03 4.61 1.7E-03 4.04 1.5E-03 3.86
2.5E-03 4.73 4.8E-03 5.83 2.5E-03 5.51 2.2E-03 5.18
3.2E-03 6.03 5.9E-03 7.13 3.3E-03 7.23 2.8E-03 6.46
3.8E-03 7.20 6.9E-03 8.43 4.0E-03 8.73 3.4E-03 7.79
4.4E-03 8.40 7.6E-03 9.40 4.6E-03 9.72 3.9E-03 8.97
5.0E-03 9.49 8.4E-03 10.46 5.3E-03 11.08 4.5E-03 10.19
5.6E-03 10.67 9.3E-03 11.68 5.9E-03 12.47 5.1E-03 11.49
6.3E-03 11.85 1.0E-02 13.04 6.6E-03 13.94 5.7E-03 12.69
7.2E-03 13.80 7.5E-03 15.67 6.4E-03 14.40
40˚C
8.8E-05 0.20 1.4E-04 0.26 5.4E-05 0.23 4.7E-05 0.22
5.9E-04 1.03 8.5E-04 1.09 5.3E-04 1.17 4.4E-04 1.11
1.4E-03 2.23 2.0E-03 2.29 1.3E-03 2.57 1.1E-03 2.45
2.2E-03 3.45 3.3E-03 3.57 2.2E-03 4.04 1.9E-03 3.82
3.1E-03 4.69 4.5E-03 4.86 3.1E-03 5.50 2.6E-03 5.14
3.9E-03 5.95 5.8E-03 6.13 3.9E-03 6.90 3.4E-03 6.42
4.7E-03 7.20 6.9E-03 7.35 4.7E-03 8.30 4.1E-03 7.66
5.5E-03 8.37 8.0E-03 8.53 5.5E-03 9.67 4.8E-03 8.91
6.3E-03 9.55 9.1E-03 9.74 6.3E-03 10.97 5.5E-03 10.11
7.1E-03 10.76 1.0E-02 10.88 7.1E-03 12.37 6.2E-03 11.32
7.9E-03 11.94 1.1E-02 11.91 7.9E-03 13.77 6.8E-03 12.52
8.5E-03 12.82 1.2E-02 13.07 8.8E-03 15.30 7.5E-03 13.80
50
˚C
1.2E-04 0.21 1.8E-04 0.26 8.7E-05 0.22 6.5E-05 0.23
7.4E-04 1.05 1.0E-03 1.12 7.1E-04 1.21 5.6E-04 1.17
1.7E-03 2.24 2.3E-03 2.30 1.7E-03 2.61 1.4E-03 2.49
2.7E-03 3.47 3.7E-03 3.53 2.8E-03 4.08 2.3E-03 3.88
3.6E-03 4.69 5.1E-03 4.78 3.8E-03 5.49 3.2E-03 5.16
4.6E-03 5.92 6.4E-03 6.00 4.8E-03 6.88 4.1E-03 6.50
5.6E-03 7.15 7.8E-03 7.20 5.7E-03 8.18 4.9E-03 7.71
6.6E-03 8.35 9.0E-03 8.36 6.7E-03 9.49 5.7E-03 8.95
7.5E-03 9.50 1.0E-02 9.50 7.6E-03 10.80 6.5E-03 10.14
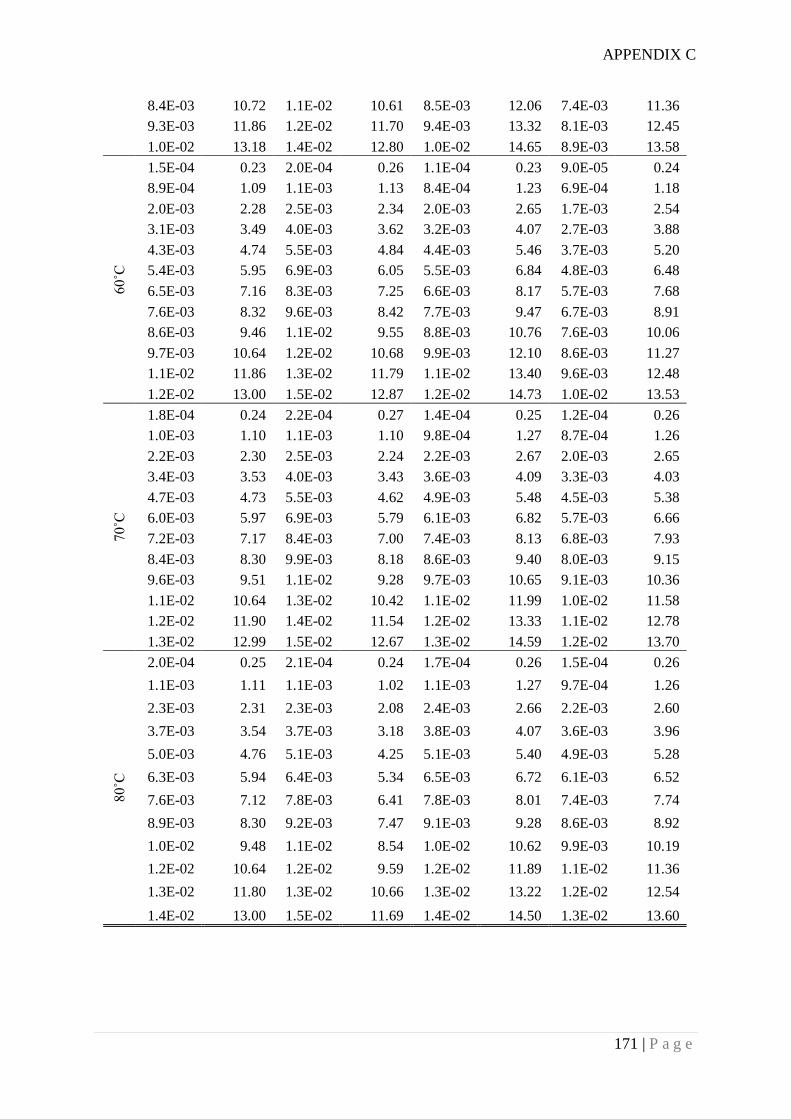
APPENDIX C
171 | P a g e
8.4E-03 10.72 1.1E-02 10.61 8.5E-03 12.06 7.4E-03 11.36
9.3E-03 11.86 1.2E-02 11.70 9.4E-03 13.32 8.1E-03 12.45
1.0E-02 13.18 1.4E-02 12.80 1.0E-02 14.65 8.9E-03 13.58
60
˚C
1.5E-04 0.23 2.0E-04 0.26 1.1E-04 0.23 9.0E-05 0.24
8.9E-04 1.09 1.1E-03 1.13 8.4E-04 1.23 6.9E-04 1.18
2.0E-03 2.28 2.5E-03 2.34 2.0E-03 2.65 1.7E-03 2.54
3.1E-03 3.49 4.0E-03 3.62 3.2E-03 4.07 2.7E-03 3.88
4.3E-03 4.74 5.5E-03 4.84 4.4E-03 5.46 3.7E-03 5.20
5.4E-03 5.95 6.9E-03 6.05 5.5E-03 6.84 4.8E-03 6.48
6.5E-03 7.16 8.3E-03 7.25 6.6E-03 8.17 5.7E-03 7.68
7.6E-03 8.32 9.6E-03 8.42 7.7E-03 9.47 6.7E-03 8.91
8.6E-03 9.46 1.1E-02 9.55 8.8E-03 10.76 7.6E-03 10.06
9.7E-03 10.64 1.2E-02 10.68 9.9E-03 12.10 8.6E-03 11.27
1.1E-02 11.86 1.3E-02 11.79 1.1E-02 13.40 9.6E-03 12.48
1.2E-02 13.00 1.5E-02 12.87 1.2E-02 14.73 1.0E-02 13.53
70˚C
1.8E-04 0.24 2.2E-04 0.27 1.4E-04 0.25 1.2E-04 0.26
1.0E-03 1.10 1.1E-03 1.10 9.8E-04 1.27 8.7E-04 1.26
2.2E-03 2.30 2.5E-03 2.24 2.2E-03 2.67 2.0E-03 2.65
3.4E-03 3.53 4.0E-03 3.43 3.6E-03 4.09 3.3E-03 4.03
4.7E-03 4.73 5.5E-03 4.62 4.9E-03 5.48 4.5E-03 5.38
6.0E-03 5.97 6.9E-03 5.79 6.1E-03 6.82 5.7E-03 6.66
7.2E-03 7.17 8.4E-03 7.00 7.4E-03 8.13 6.8E-03 7.93
8.4E-03 8.30 9.9E-03 8.18 8.6E-03 9.40 8.0E-03 9.15
9.6E-03 9.51 1.1E-02 9.28 9.7E-03 10.65 9.1E-03 10.36
1.1E-02 10.64 1.3E-02 10.42 1.1E-02 11.99 1.0E-02 11.58
1.2E-02 11.90 1.4E-02 11.54 1.2E-02 13.33 1.1E-02 12.78
1.3E-02 12.99 1.5E-02 12.67 1.3E-02 14.59 1.2E-02 13.70
80
˚C
2.0E-04 0.25 2.1E-04 0.24 1.7E-04 0.26 1.5E-04 0.26
1.1E-03 1.11 1.1E-03 1.02 1.1E-03 1.27 9.7E-04 1.26
2.3E-03 2.31 2.3E-03 2.08 2.4E-03 2.66 2.2E-03 2.60
3.7E-03 3.54 3.7E-03 3.18 3.8E-03 4.07 3.6E-03 3.96
5.0E-03 4.76 5.1E-03 4.25 5.1E-03 5.40 4.9E-03 5.28
6.3E-03 5.94 6.4E-03 5.34 6.5E-03 6.72 6.1E-03 6.52
7.6E-03 7.12 7.8E-03 6.41 7.8E-03 8.01 7.4E-03 7.74
8.9E-03 8.30 9.2E-03 7.47 9.1E-03 9.28 8.6E-03 8.92
1.0E-02 9.48 1.1E-02 8.54 1.0E-02 10.62 9.9E-03 10.19
1.2E-02 10.64 1.2E-02 9.59 1.2E-02 11.89 1.1E-02 11.36
1.3E-02 11.80 1.3E-02 10.66 1.3E-02 13.22 1.2E-02 12.54
1.4E-02 13.00 1.5E-02 11.69 1.4E-02 14.50 1.3E-02 13.60
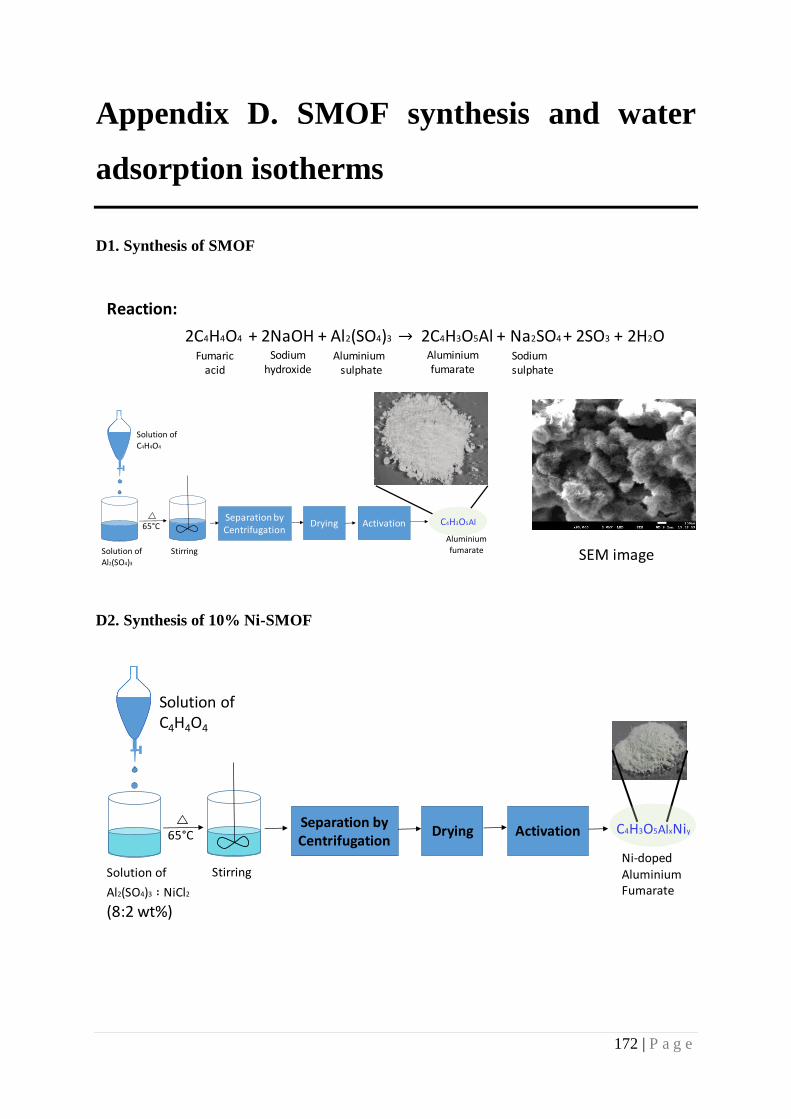
172 | P a g e
Appendix D. SMOF synthesis and water
adsorption isotherms
D1. Synthesis of SMOF
D2. Synthesis of 10% Ni-SMOF
2C4H4O4 + 2NaOH + Al2(SO4)3 2C4H3O5Al + Na2SO4 + 2SO3 + 2H2O Fumaric
acidSodium
hydroxideAluminium
sulphate
Aluminiumfumarate
Sodium sulphate
Reaction:
C4H3O5AlSeparation by Centrifugation
Drying Activation 65°C
Solution of Al2(SO4)3
Solution of C4H4O4
AluminiumfumarateStirring SEM image
Ni-doped Aluminium Fumarate
C4H3O5AlxNiySeparation by Centrifugation
Drying Activation65°C
Solution of
Al2(SO4)3 NiCl2
(8:2 wt%)
Solution of C4H4O4
Stirring
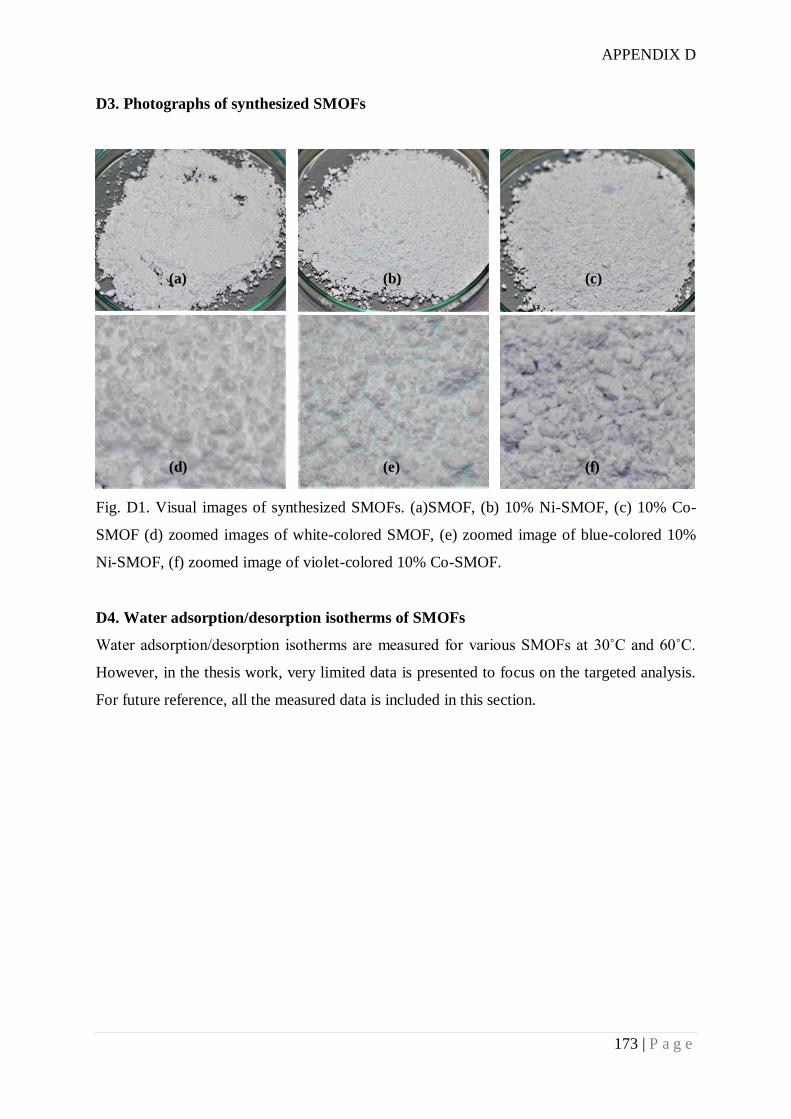
APPENDIX D
173 | P a g e
D3. Photographs of synthesized SMOFs
Fig. D1. Visual images of synthesized SMOFs. (a)SMOF, (b) 10% Ni-SMOF, (c) 10% Co-
SMOF (d) zoomed images of white-colored SMOF, (e) zoomed image of blue-colored 10%
Ni-SMOF, (f) zoomed image of violet-colored 10% Co-SMOF.
D4. Water adsorption/desorption isotherms of SMOFs
Water adsorption/desorption isotherms are measured for various SMOFs at 30˚C and 60˚C.
However, in the thesis work, very limited data is presented to focus on the targeted analysis.
For future reference, all the measured data is included in this section.
(a) (b) (c)
(d) (e) (f)
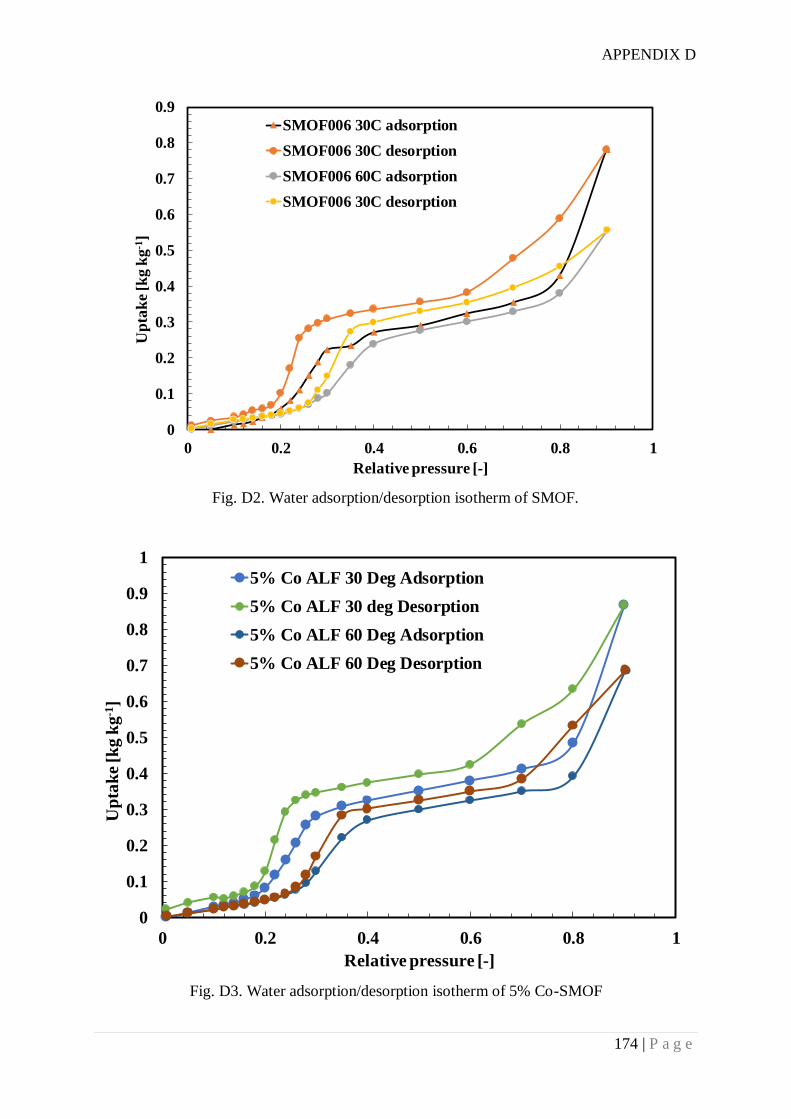
APPENDIX D
174 | P a g e
Fig. D2. Water adsorption/desorption isotherm of SMOF.
Fig. D3. Water adsorption/desorption isotherm of 5% Co-SMOF
0
0.1
0.2
0.3
0.4
0.5
0.6
0.7
0.8
0.9
0 0.2 0.4 0.6 0.8 1
Up
tak
e [k
g k
g-1
]
Relative pressure [-]
SMOF006 30C adsorption
SMOF006 30C desorption
SMOF006 60C adsorption
SMOF006 30C desorption
0
0.1
0.2
0.3
0.4
0.5
0.6
0.7
0.8
0.9
1
0 0.2 0.4 0.6 0.8 1
Up
tak
e [k
g k
g-1
]
Relative pressure [-]
5% Co ALF 30 Deg Adsorption
5% Co ALF 30 deg Desorption
5% Co ALF 60 Deg Adsorption
5% Co ALF 60 Deg Desorption
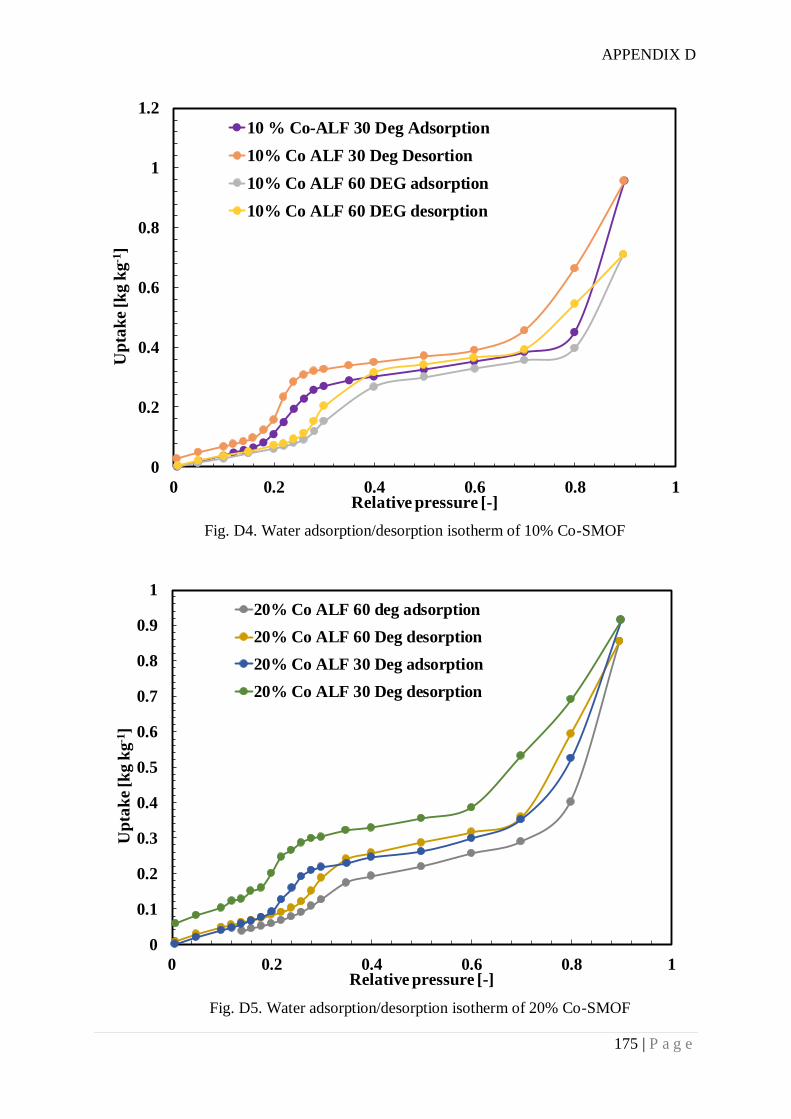
APPENDIX D
175 | P a g e
Fig. D4. Water adsorption/desorption isotherm of 10% Co-SMOF
Fig. D5. Water adsorption/desorption isotherm of 20% Co-SMOF
0
0.2
0.4
0.6
0.8
1
1.2
0 0.2 0.4 0.6 0.8 1
Up
tak
e [k
g k
g-1
]
Relative pressure [-]
10 % Co-ALF 30 Deg Adsorption
10% Co ALF 30 Deg Desortion
10% Co ALF 60 DEG adsorption
10% Co ALF 60 DEG desorption
0
0.1
0.2
0.3
0.4
0.5
0.6
0.7
0.8
0.9
1
0 0.2 0.4 0.6 0.8 1
Up
tak
e [k
g k
g-1
]
Relative pressure [-]
20% Co ALF 60 deg adsorption
20% Co ALF 60 Deg desorption
20% Co ALF 30 Deg adsorption
20% Co ALF 30 Deg desorption
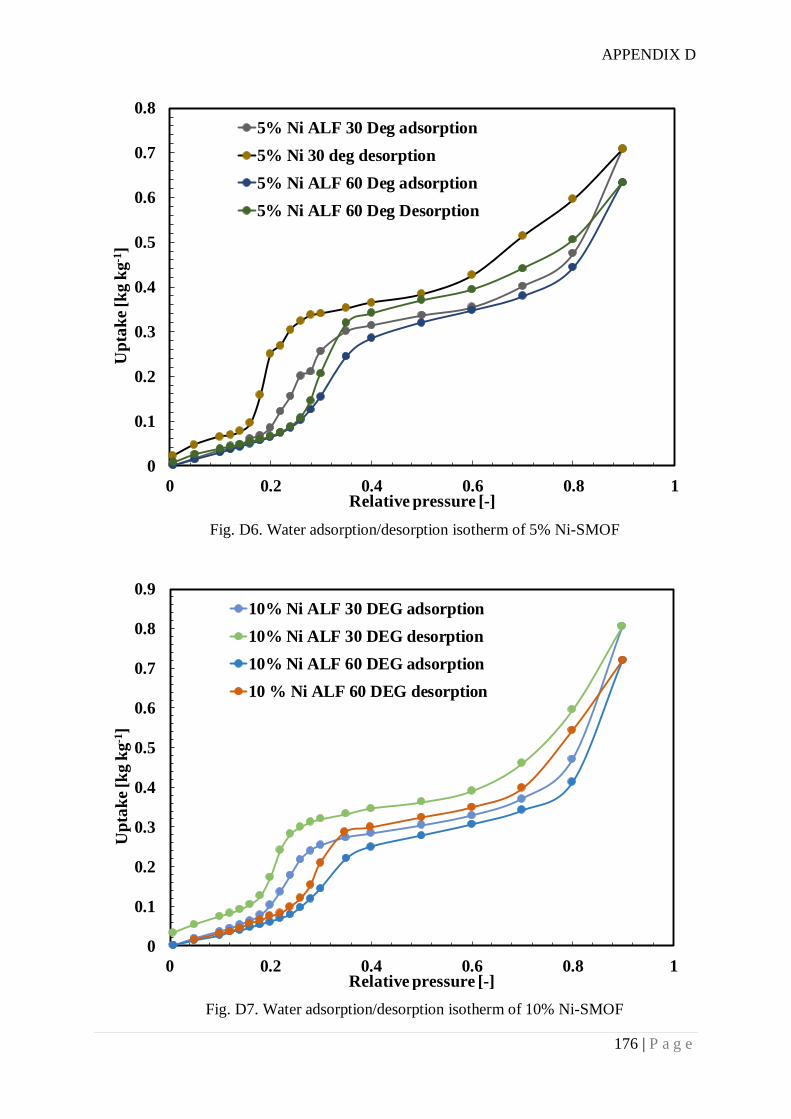
APPENDIX D
176 | P a g e
Fig. D6. Water adsorption/desorption isotherm of 5% Ni-SMOF
Fig. D7. Water adsorption/desorption isotherm of 10% Ni-SMOF
0
0.1
0.2
0.3
0.4
0.5
0.6
0.7
0.8
0 0.2 0.4 0.6 0.8 1
Up
tak
e [k
g k
g-1
]
Relative pressure [-]
5% Ni ALF 30 Deg adsorption
5% Ni 30 deg desorption
5% Ni ALF 60 Deg adsorption
5% Ni ALF 60 Deg Desorption
0
0.1
0.2
0.3
0.4
0.5
0.6
0.7
0.8
0.9
0 0.2 0.4 0.6 0.8 1
Up
tak
e [k
g k
g-1
]
Relative pressure [-]
10% Ni ALF 30 DEG adsorption
10% Ni ALF 30 DEG desorption
10% Ni ALF 60 DEG adsorption
10 % Ni ALF 60 DEG desorption