Embed Size (px)
Citation preview

Study on Market
Availability for
Organic Produce
NABARD CONSULTANCY SERVICES (P) LTD. (NABCONS)
24, Rajendra Place, 1st Floor, NABARD Building, New Delhi – 110 008.
Tel No. 011-25818733, Fax: 011-25753410, 41539187.


Study on Market Availability for Organic Produce
i
Contents
List of Tables .................................................................................................................................... iii
List of Figures ................................................................................................................................... iv
Abbreviations .................................................................................................................................. vi
Chapter 1: Introduction .............................................................................................................. 1
1.1 Organic farming ................................................................................................................ 1
1.2 Organic food products ...................................................................................................... 2
1.3 Present status ................................................................................................................... 2
1.4 Need for organic products ................................................................................................ 3
Chapter 2: Study Objectives ....................................................................................................... 4
Chapter 3: Methodology ............................................................................................................ 5
3.1 Study coverage ................................................................................................................. 5
3.2 Secondary data sources .................................................................................................... 5
3.3 Primary research .............................................................................................................. 5
3.4 Tools and techniques for data analysis ............................................................................ 6
Chapter 4: Global Scenario ......................................................................................................... 7
Chapter 5: India Scenario ......................................................................................................... 13
5.1 Area ................................................................................................................................ 13
5.2 Production ...................................................................................................................... 16
5.3 Export ............................................................................................................................. 18
5.4 Broad product portfolio.................................................................................................. 22
Chapter 6: Karnataka State Scenario ........................................................................................ 24
6.1 Area and Production ....................................................................................................... 24
6.2 State initiatives ............................................................................................................... 29
6.3 Organic produce marketing ............................................................................................ 31
Chapter 7: Study Findings ......................................................................................................... 32
7.1 Retail outlets................................................................................................................... 32
7.2 Consumers ...................................................................................................................... 36
7.3 Organic farmers .............................................................................................................. 40
7.4 Organic products pricing ................................................................................................ 41
Chapter 8: Potential of Organic Products................................................................................. 43
8.1 Market Potential ............................................................................................................. 43
8.2 Growth drivers ................................................................................................................ 44
8.3 Risks & possible risk mitigation plan .............................................................................. 45
Chapter 9: Organic Certification ............................................................................................... 47
Study on Market Availability for Organic Produce
ii
9.1 Introduction ................................................................................................................... 47
9.2 The certification process ................................................................................................ 49
9.3 Product Labelling………………………………………………………………………………………………………52
9.4 Status of organic certification in Karnataka ................................................................... 53
9.5 Organic certification Charges ......................................................................................... 53
Chapter 10: Government Initiatives to Promote Organic Farming in India ............................... 55
10.1 National Project on Organic Farming ......................................................................... 55
10.2 Capital Investment Subsidy for Setting up of Organic Inputs Production ................. 55
10.3 National Project on Management of Soil Health and Fertility (NPMSF) .................... 55
10.4 Paramparagat Krishi Vikas Yojana .............................................................................. 56
10.5 National Horticulture Mission .................................................................................... 56
10.6 Rashtriya Krishi Vikas Yojna ....................................................................................... 56
10.7 Network Project on Organic Farming by ICAR ........................................................... 56
Chapter 11: Suggestions / Recommendations ........................................................................... 57
Annexure ........................................................................................................................................ 60
Annexure 1: State wise area under organic farming ................................................................. 61
Annexure 2: Schedule – Retail outlets ....................................................................................... 62
Annexure 3: Schedule – consumers ........................................................................................... 65

Study on Market Availability for Organic Produce
iii
List of Tables
Table No.
Title of the Table Page No
5.1 Year wise area of organic farming, wild collection and total
organic area from 2004-05 to 2015-16
13
5.2 Year wise export in volume and value generation 19
7.1 Break-up of samples covered under the study 32
7.2 Comparison of average organic produces vis-à-vis non-organic
produces
41
8.1 Risk and possible risk mitigation plan 45
9.1 List of organic certification agencies in India 50
9.2 Summary of the average tariff charged by certification agency 54

Study on Market Availability for Organic Produce
iv
List of Figures
Figure No.
Title of the figure Page No.
4.1 Year wise number of countries with data on organic agriculture 7
4.2 Share of continents in global organic area and organic producers 8
4.3 Continent map with area under organic agriculture and wild
collection
8
4.4 Continent wise area from 2006 to 2014 9
4.5 Growth in organic agriculture area and organic producers 10
4.6 Global top 10 countries with organic area and organic producers 11
4.7 Organic retail sales of major countries 12
5.1 Area of organic farming, wild collection and total organic area from
2004-05 to 2015-16
14
5.2 Growth trend in the organic area in India 15
5.3 Share of states in total organic area (wild collection and organic
farming)
15
5.4 Share of states in organic farming (excluding wild collection) 16
5.5 Year wise production of Indian organic produce 17
5.6 Share of states in the total country production (Wild collection and
organic farming)
17
5.7 Share of crop categories in the total production 18
5.8 CAGR of export volume and export value realization from 2001-13 to
2015-16
20
5.9 Year wise export in volume and value generation 20
5.10 Share of India’s organic export by volume and value 21
5.11 Share of Indian organic products import by volume and value 22
5.12 Broad category of organic products available in India 23
6.1 Area and production of organic crops and wild collection 24
6.2 Share of crop categories in overall crop area under organic farming 25

Study on Market Availability for Organic Produce
v
6.3 Share of crop categories in state’s total organic production 26
6.4 Productivity of organic crop categories 26
6.5 Share of major crops in each of the categories of organic field crops 28
6.6 Share of major crops in each of the categories of organic
horticulture crops
29
7.1 Sample outlets dealing with various categories of food products 33
7.2 Procurement channel of sample outlets 34
7.3 Share of customers 35
7.4 Sample consumers’ sex ration and age profile 36
7.5 Educational and occupational profile of sample consumers 37
7.6 Purchasing point and frequency of shopping of organic products 38
7.7 Organic shopping history of consumers 38
7.8 Preferred organic products by sample consumers 39
7.9 Consumer perception of organic products 40
8.1 Organic products growth drivers 44
9.1 Different Organic Logos 48
9.2 Sample of organic labels 53

Study on Market Availability for Organic Produce
vi
Abbreviations
IFOAM International Federation of organic Agriculture Movements
USDA United States Department of Agriculture
IANPP International Association of Natural Products Producers
CAGR Compound Annual Growth Rate
FGDs Focused Group Discussions
FiBL Research Institute of Organic Agriculture/ Forschungsinstitut für
Biologischen Landbau
APEDA Agricultural and Processed Food Products Export Development Authority
NPOF National Project on Organic Farming
NCOF National Centre of Organic Farming
NPMSF National Project on Management of Soil Health and Fertility
SHM Soil Health Management
NMSA National Mission of Sustainable Agriculture
PGS Participatory Guarantee System
HDPE High-Density Polyethylene
RKVY Rashtriya Krishi Vikas Yojna
ICAR Indian Council of Agricultural Research
SAUs State Agricultural Universities
NGOs Non-Governmental Organisation
KSSOCA Karnataka State Seed and organic Certification Agency
PKVY Paramparagat Krishi Vikas Yojana
KSDA Karnataka State Department of Agriculture
FDIs Foreign Direct Investment
ITC-HS Indian Trade Clarification based on Harmonized System of Coding
GMO Genetically modified organism
HOPCOMS Horticultural Producers' Cooperative Marketing and Processing Society
Study on Market Availability for Organic Produce
1
Chapter 1: Introduction
1.1 Organic farming
Organic Farming is a method of farming system which primarily aimed at cultivating the
land and raising crops in such a way, as to keep the soil alive and in good health by use
of organic wastes (crop, animal and farm waste) and other biological materials along
with beneficial microbes to release nutrients to crops for increased sustainable
production in an eco-friendly, pollution free environment.
International Federation of organic Agriculture Movements (IFOAM), an international
organization established in 1972 for organic farming organizations defines goal of
organic farming as “Organic agriculture is a production system that sustains the health
of soils, ecosystems and people. It relies on ecological processes, biodiversity and cycles
adapted to local conditions, rather than the use of inputs with adverse effects. Organic
agriculture combines tradition, innovation and science to benefit the shared
environment and promote fair relationships and a good quality of life for all involved…”
Organic production is not simply the avoidance of conventional chemical inputs, nor is it
the substitution of natural inputs for synthetic ones. Organic farmers apply techniques
first used thousands of years ago, such as crop rotations and the use of composted
animal manures and green manure crops, in ways that are economically sustainable in
today's world. In organic production, overall system health is emphasized, and the
interaction of management practices is the primary concern. Organic producers
implement a wide range of strategies to develop and maintain biological diversity and
replenish soil fertility (Organic Agriculture Overview, USDA)
For the vast majority of history, agriculture can be described as having been organic;
only from the early 20th century agriculture deviated from organic farming and started
using chemical inputs. The organic farming movement started in the 1940s in response
to the industrialization of agriculture.
In 1939, Lord Northbourne coined the term” organic farming” in his book” Look to the
Land’ (1940), out of his conception of "the farm as organism," to describe a holistic,
ecologically balanced approach to farming—in contrast to what he called chemical

Study on Market Availability for Organic Produce
2
farming, which relied on "imported fertility" and "cannot be self-sufficient nor an
organic whole”.
Organic farming is based on the four as advocated by International Federation of
Agriculture Movement (IFOAM).
It should be based on living ecological system and cycles, work with them,
emulate them and help sustain them.
It should build on relationships that ensure fairness with regard to the common
environment and life opportunities.
It should be managed in a precautionary and responsible manner to protect the
health and well-being of current and future generations and environment.
Organic agriculture should sustain and enhance the health of soil, plant, animal,
human and planet as one and indivisible.
1.2 Organic food products
Organic food products refer to food items that are produced, manufactured and handled
using organic means defined by certifying bodies or governing bodies under its set
standards/ rules and regulations.
Closely related to the organic products are natural foods. Which are generally referred
to food items that are not altered chemically or synthesized in any form. Stringent
standards do not exist for natural food products. The International Association of
Natural Products Producers (IANPP) is trying to get the definitions for natural food into
solid place.
1.3 Present status
Globally, organic products are gaining more and more importance due to increasing
health conscious and disposable income. As of 2014, a total area of 43.7 million Ha has
been reported under organic cultivation with an estimated 2.3 million producers across
the globe. India ranks first in number of organic producers and ranks 15th w.r.t. land
under organic cultivation. India had tremendous growth in organic agriculture / organic
products in last decade. India’s organic area has increased by 122.12 per cent from 25.72

Study on Market Availability for Organic Produce
3
million Ha in 2004-05 was to 57.13 million Ha in 2015-16. Within this, area under organic
farming has increased by more than 7 times i.e., from 1.86 million Ha in 2004-05 to
14.90 million Ha in 2015-16. Area under organic wild collection has increased from 23.86
million Ha in 2004-05 to 42.20 million Ha in 2015-16. Export of organic produce from
India has been growing at a CAGR of 34.50 per cent from 4161 MT in 2002-03 to 263687
MT in 2015-16.
1.4 Need for organic products
Chemical fertilizers have played a significant role in Indian agriculture, facilitating green
revolution and making the country self-reliant in food production. However, it disturbs
the soil health, leading to acidification, micro-nutrient depletion, soil degradation, food
crop health and lower crop yield and quality. Besides, use of chemical fertilizers may
contribute to environmental risks like increase in global warming, ground and surface
water pollution etc. In view of this, it is desirable that we may return to practices which
is eco-friendly and meets the nutrient depletion and sustains quality food production
nutrient depletion. The only answer to these problems is organic farming that provides
eco-technological stability, sustainable agriculture and better pest and nutrient
management.

Study on Market Availability for Organic Produce
4
Chapter 2: Study Objectives
The board objectives/ scope of work of the study are as under:
• Study the exclusive Organic Market outlets in and around Bangalore and also in
other major cities such as Hyderabad, Mumbai, Kolkata, Delhi to assess the
source of organic produce / products for procurement and status of certification
of the produce/products procured by these outlets.
• Study the Major organic produce /products of the state being marketed.
• Analyze the handling and distribution process of organic produce / products.
• Source of organic produce / products for procurement and status of certification
of the produce / products procured by corporate outlets in Bangalore and other
major cities of the state having exclusive shelves for organic products.
• Assess the trend of pricing of organic produce / products and estimate the
financial turnover of organic produce / products market in the state.
• Major organic produce marketers in state / country and their organic produce
requirement.
• Assess likely consumption pattern and preference for the organic commodities.
• Analyze the market availability of organic produce in National / International or
Export market.
• Keeping in view the likely demand for organic products, analyze the possibilities
of value addition and processing of organic produce through organic processing
industries.
• Study the potential of market developments.
• Suggest a clear road map of improving the market for organic produce of the
state.

Study on Market Availability for Organic Produce
5
Chapter 3: Methodology
Study is based on both primary and secondary data. Status of organic farming and
products in global, national and state are derived from the secondary data. Primary
research was conducted to get to know about the ground realities of organic retail
outlets, consumer preferences and organic farmers.
3.1 Study coverage
Primary study was conducted in four of the metro cities of the nation viz. Bangalore,
New Delhi, Mumbai and Hyderabad. Product categories like cereals, pulses, millets,
fruits, vegetables, spices, commercial crops, processed products, etc., were covered in
the study. Organic farmers were also covered under primary study, to understand
backward linkage. Secondary data is mainly derived from government department
websites, published reports, etc.
3.2 Secondary data sources
Most of the data used in the study are of secondary nature and have been collected
from concerned government departments or related agencies. Some of the data have
also been taken from the official websites of the concerned agencies. Apart from these,
information about present organic market data and future estimations are taken from
the published reports from government and private bodies.
3.3 Primary research
Field survey has be carried out for seeking information to meet the aforementioned
scope of work of the study. Various stakeholders like organic farmers, farmer’s
federations, organic retail outlets, organic restaurants, processors, exporters, various
government officials were covered under the study. Study was conducted using various
research instrument/s and tool/s like structured questionnaires, FGDs, in depth personal
interviews etc. A total of 27 organic retail outlets were covered in four of the metro
cities viz., Bangalore, Hyderabad, Mumbai and Delhi. Retail assess where covered to
understand their procurement pattern, turnover, categories of products handled,

Study on Market Availability for Organic Produce
6
certification process, etc. On the other hand, to know the demand side aspects of the
organic produces, 39 organic consumers were covered under the study. From the
organic consumers, profile of organic consumers, their shopping pattern, their
expectations, etc., were assessed. For the better understanding of backward linkage of
the organic produces, organic farmers were interacted in two district of the state viz.,
Mandya and Bagalkote. These districts were covered keeping in view of geographical
spread.
3.4 Tools and techniques for data analysis
The data received from various sources / websites were tabulated and analyzed using
standard statistical tools like averages, proportions, etc. The data trends and
information past history was used to arrive at various conclusions and are discussed in
respective chapters in the report.

Study on Market Availability for Organic Produce
7
Chapter 4: Global Scenario
As an impact of the organic movement internationally, and ensuring of consumer
confidence through a credible and standardized certification system, the global area
under organic cultivation indicating market supply, has been increasing rapidly at a
CAGR of 10 per cent from 15.2 million ha in 1999 to 43.7 million ha in 2013-14 (as per
Organic World 2015. FiBL & IFOAM).
As per FiBL‐IFOAM‐SOEL‐Surveys 1999-2007, Countries with data on organic agriculture
has more than doubled from 77 in 1999 to 172 in 2014. Year wise number of countries
with data on organic agriculture is given in Figure 4.1. Growing demand for organic
farming as well as premium for organic produces has enticed cultivars across globe to
practice organic farming. This has caught attention of policymakers of respective
countries. As a result, more and more countries are following organic standards and
giving more importance to the data keeping w.r.t. organic farming.
Fig 4.1: Year wise number of countries with data on organic agriculture
(Source: Organic Agriculture Worldwide 2016, FiBL-IFOAM Report)
In 2014, the global area under organic agriculture was estimated at 43.7 million ha. The
organic agriculture land accounts for just 1 per cent of total global agriculture land.
Continent wise, 40 per cent of the global organic agricultural land is in Oceania (17.3
million hectares), followed by Europe (27%; 11.6 million hectares) and Latin America
(15%; 6.8 million hectares). The global organic producers’ number was estimated at 2.3
million in 2014. Asia houses largest number of organic producers, accounting almost 40

Study on Market Availability for Organic Produce
8
per cent of the global organic producers followed by Africa (26%) and Europe (17%).
Share of continents in global organic area and organic producers in given in Figure 4.2.
Fig 4.2: Share of continents in global organic area and organic producers
(Source: Organic Agriculture Worldwide 2016, FiBL-IFOAM Report)
In addition to the 43.7 million ha of organic agriculture land, wild collection classified
area comprises another 35 million ha. Along with wild collection area, the total global
organic area was around 78 million ha. More than 45 per cent of wild collection area is
accounted by Europe with 16.3 million ha followed by Africa (34%, 11.8 million ha) and
Asia (18%, 6.3 million ha). Along with wild collection area, Europe is the largest
continent with area under organic (27.9 million ha) followed by Oceania (17.3).
Continent map with area under organic agriculture and wild collection is given in Figure
4.3.
Fig 4.3: Continent map with area under organic agriculture and wild collection

Study on Market Availability for Organic Produce
9
(Source: Organic Agriculture Worldwide 2016, FiBL-IFOAM Report)
During the past eight years (2006-2014), Africa has highest growth rate for area under
organic agriculture with 85 per cent. Africa’s rapid growth is mainly due to lower base.
Africa is followed by North America with 72 per cent growth rate, Europe (60%), Oceania
(40%) and South America (37%). Asia has a lowest growth rate with just 19 per cent in
the same eight years. Continent wise area from 2006 to 2014 is depicted in Figure 4.4.
Fig 4.4: Continent wise area from 2006 to 2014
(Source: Organic Agriculture Worldwide 2016, FiBL-IFOAM Report)
Global area under organic agriculture has almost tripled in 15 years i.e. from 15.2 m ha
in 1999 to 43.7 m ha in 2014. Global organic agriculture area is growing with a CAGR of
10 per cent. Growth in organic agriculture area was rapid in initial five years (1999-2004)
with doubling area in just five years. From 2004 to 2014, area has grown by just 50 per
cent. In the same period organic producers’ number has increased by more than 10

Study on Market Availability for Organic Produce
10
times i.e. from 0.20 million in 1999 to 2.3 million in 2014. Growth in organic agriculture
area and organic producers from 1999 to 2014 is depicted in Figure 4.5.
Fig 4.5: Growth in organic agriculture area and organic producers
(Source: Organic Agriculture Worldwide 2016, FiBL-IFOAM Report)
Among the countries, Australia has the highest area under organic agriculture (17.2 m
ha), followed by Argentina (3.1 m ha) and USA (2.2 m ha). Australia alone accounts for
around 40 per cent of global area under organic agriculture. India with 0.57 million ha is
placed at 15th among the countries with largest area under organic agriculture.

Study on Market Availability for Organic Produce
11
India is the country with largest number of organic producers with 6.50 Lakh farmers,
followed by Uganda (1.91 Lakh) and Mexico (1.70 Lakh). India accounts for more than 28
per cent of global organic producers. Global top 10 countries with organic area and
organic producers is depicted in Figure 4.6.
Fig 4.6: Global top 10 countries with organic area and organic producers
(Source: Organic Agriculture Worldwide 2016, FiBL-IFOAM Report)
The global organic food market which is estimated at USD 90 billion in 2015 has been
growing at a CAGR of around 12 per cent for last 14 years. Europe and North America
together generate about 90 per cent of the global organic food sales. Within Europe,
Germany and France accounts for more than 50 per cent of the market. The organic
packaged food and beverage products category occupies around 40-50 per cent of the
total global organic food market with an estimated market size of around USD 38-40
billion in 2015. Of this, organic packaged food category accounts for USD 32-34 billion,
while organic packaged beverages account for USD 4-6 billion. Dairy and dairy products,
bakery/confectionery products, ready meals and baby food are the largest categories in
the organic packaged food market globally accounting for around 50 per cent of the
total organic packaged food market. Dairy sector accounts for close to 25 per cent of the

Study on Market Availability for Organic Produce
12
packaged food products followed by bakery confectionery products (18%), ready meals
(8%) and baby food (6%).
The United States is the leading market with 24.3 billion Euros, followed by Germany
(7.8 billion Euros), France (4.4 billion Euros), and China (2.4 billion Euros). As per the
data India’s organic retail sales is 130 million Euros. The highest per capita spending on
organic produce was in Switzerland (273 Euros) followed by Denmark (212 Euros)
Luxembourg (2044 Euros). Organic retail sales of major countries are given in Figure 4.7.
Fig 4.7: Organic retail sales of major countries
(Source: Organic Agriculture Worldwide 2016, FiBL-IFOAM Report)
Study on Market Availability for Organic Produce
13
Chapter 5: India Scenario
India ranks 15th in terms of World’s Organic Agricultural land as per 2013 data (Source
FIBL & IFOAM Year Book 2015). The total area under organic in India was 57.1 Lakh Ha in
2015-16, with a production of 13.5 Lakh MT. Of this total area, 26 per cent is under
organic farming and the rest 74 per cent is under wild collection. India’s organic food
sector is estimated at Rs.2700 Crores (approximately USD 415 million) which stands at
less than one percent of the global organic food market. Export accounts for more than
70 per cent of the total Indian organic market. However, there is no concrete data about
Indian domestic market size and valuation. The organic food market in India is estimated
to be growing at a 25-30 per cent, mainly due to lower base.
5.1 Area
The total area under organic certification is 57.1 Lakh Ha in 2015-16. This includes 26 per
cent organic farming area with 14.9 Lakh Ha and rest 74 per cent (42.2 Lakh Ha) is forest
and wild area. India’s total organic area in 2004-05 was 25.7 Lakh Ha and in the last 11
years it has more than doubled to 57.1 Lakh Ha in 2015-16. However, area under
certified organic farming has grown almost eight fold in last 11 years (1.86 Lakh Ha in
2004-05 to 14.9 Lakh Ha in 2015-16). In the same duration, area under organic wild
collection has shown just 76 per cent growth. From 2004-05 to 2015-16, total organic
area has grown with a CAGR of 8.30 per cent. During the same time, area under organic
farming has grown with a CAGR of 23.14 per cent and are under wild collection has
grown at a CAGR of 5.87 per cent. Year wise area of organic farming, wild collection and
total organic area from 2004-05 to 2015-16 is tabulated in Table 5.1 and same is
depicted in Figure 5.1. Growth trend in the organic area in India is depicted in Figure 5.2.
Table 5.1: Year wise area of organic farming, wild collection and total organic area from
2004-05 to 2015-16 (In Lakh Ha)
Sr. No. Year Organic farming Wild collection Total
1 2004-05 1.86 23.86 25.72
2 2005-06 4.32 23.86 28.18

Study on Market Availability for Organic Produce
14
Sr. No. Year Organic farming Wild collection Total
3 2006-07 10.30 17.70 28.00
4 2007-08 10.18 27.82 38.00
5 2008-09 11.80 33.60 45.40
6 2009-10 7.80 36.50 44.30
7 2010-11 10.84 44.78 55.62
8 2011-12 5.00 47.00 52.00
9 2012-13 5.10 51.80 56.90
10 2013-14 7.23 39.90 47.13
11 2014-15 11.80 37.20 49.00
12 2015-16 14.90 42.20 57.10
(Source FIBL-AMI Organic data network survey)
Fig 5.1: Area of organic farming, wild collection and total organic area from 2004-05 to
2015-16
(Source FIBL-AMI Organic data network survey)

Study on Market Availability for Organic Produce
15
Fig 5.2: Growth trend in the organic area in India
(Source FIBL-AMI Organic data network survey)
Uttar Pradesh accounts for almost half of the total area under total organic area
followed by Himachal Pradesh, Madhya Pradesh and Chhattisgarh. Share of states in
total organic area is depicted din Figure 5.3.
Fig 5.3: Share of states in total organic area (wild collection and organic farming)
(Source: National Project on Organic Farming Annual Report 2012-2013)

Study on Market Availability for Organic Produce
16
As per 2013-14 APEDA data, Madhya Pradesh is the state with largest area under organic
certified farming with 2.33 Lakh Ha. Madhya Pradesh accounts for 32 per cent of total
country’s organic farming area, followed by Maharashtra (12%, 0.86 Lakh Ha), Rajasthan
(9%, 0.66 Lakh Ha) and Sikkim (8%, 0.61 Lakh Ha). Karnataka with 0.31 Lakh Ha is the
sixth largest organic farming state and it accounts for around 4 per cent of the total
countries are. Share of states in organic farming is depicted in Figure 5.4. State wise area
under Organic farming in given in Annexure 1.
Fig 5.4: Share of states in organic farming (excluding wild collection)
(Source: APEDA 2013-14)
5.2 Production
As per APEDA, India has produced around 1.35 million MT of certified organic product
during 2015-16. Over a past five years (2009-10 to 2013-14), Indian organic production
has shown erratic growth pattern with exponential growth in 2010-11 followed by
drastic deduction in the later years. Year wise production of Indian organic produce is
given in Figure 5.5.

Study on Market Availability for Organic Produce
17
Fig 5.5: Year wise production of Indian organic produce
(Source: Lok Sabha Unstarred Question No.3130 dated 11-02-2014)
The latest state wise production data available is for 2011-12. As per it, Madhya Pradesh
is the largest organic producing state with a contribution of around 31 per cent of total
production, followed by Maharashtra (18%). Madhya Pradesh and Maharashtra
accounts for almost half of the countries organic farming production. Other major
organic produce production states are Uttar Pradesh, Rajasthan Karnataka and Gujarat.
Share of states in the total country production is given in Figure 5.6.
Fig 5.6: Share of states in the total country production (Wild collection and organic
farming)
(Source: National Project on Organic Farming Annual Report 2012-2013)

Study on Market Availability for Organic Produce
18
Among the various categories of agricultural crops sugar crops is the major category in
India with 30.90 per cent, followed by oilseeds (20.8%), fiber crops (19.1%) and cereals
and millets (14.6%). Share of crop categories in the total production is depicted in Figure
5.7.
Fig 5.7: Share of crop categories in the total production
(Source: India Organic Sector Vision 2025 white paper in collaboration with APEDA)
5.3 Export
The increasing demand for organic produce has created new export opportunities and
many developing countries including India have started to tap lucrative export markets
for organic produce. As per APEDA, the total volume of export of organic produce during
2015-16 was 2.64 Lakh MT which is around 20 per cent of total organic production of the
country. The value of export in 2015-16 was estimated at around 298 million USD.
India exports about 300- 400 products, mostly non value added commodities at the
bottom of the value chain. Of these the major share is of low value bulk commodities
like oil seeds, cereals and millets. Organic products are exported to European Union, US,
Canada, Switzerland, Korea, Australia, New Zealand, South East Asian countries, Middle
East, South Africa etc. There are more than 350 registered exporters in India
During the last 13 years (2002-03 to 2015-16), organic produce export has increased
from 4161 MT to 263687 MT. Export volume has increased by more than 60 times in
these period. During the same period, export value has increased by only 2 times i.e.
Study on Market Availability for Organic Produce
19
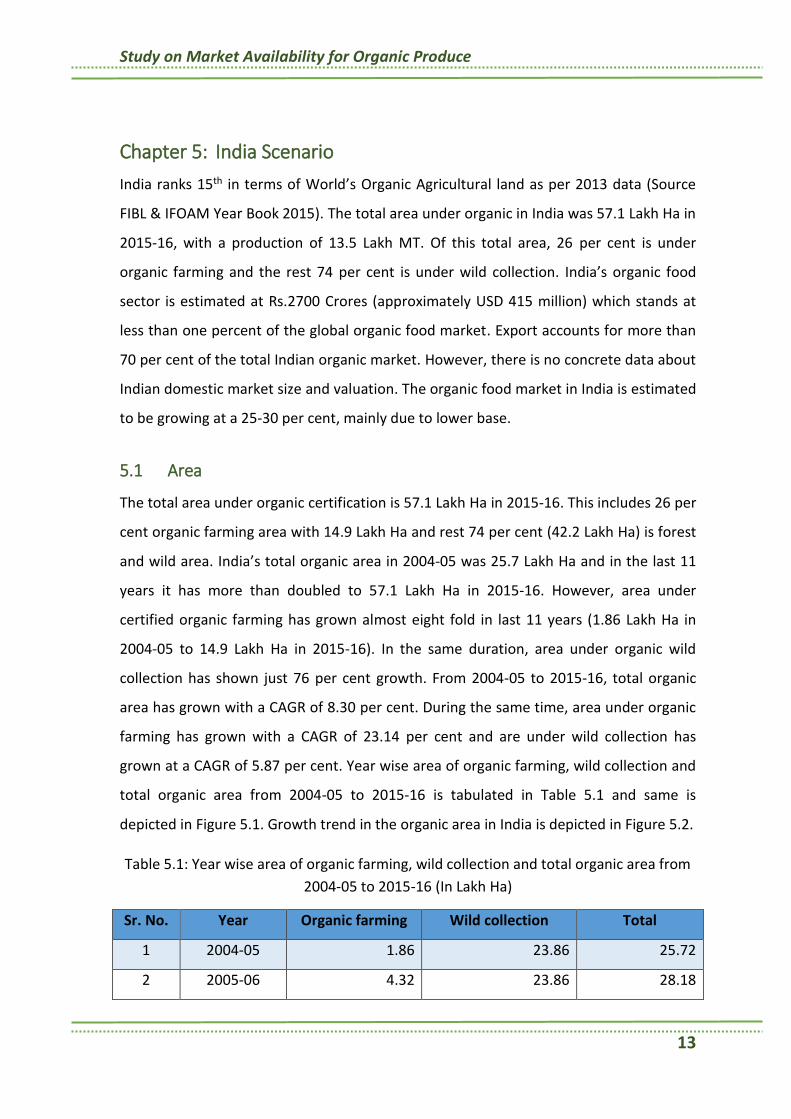
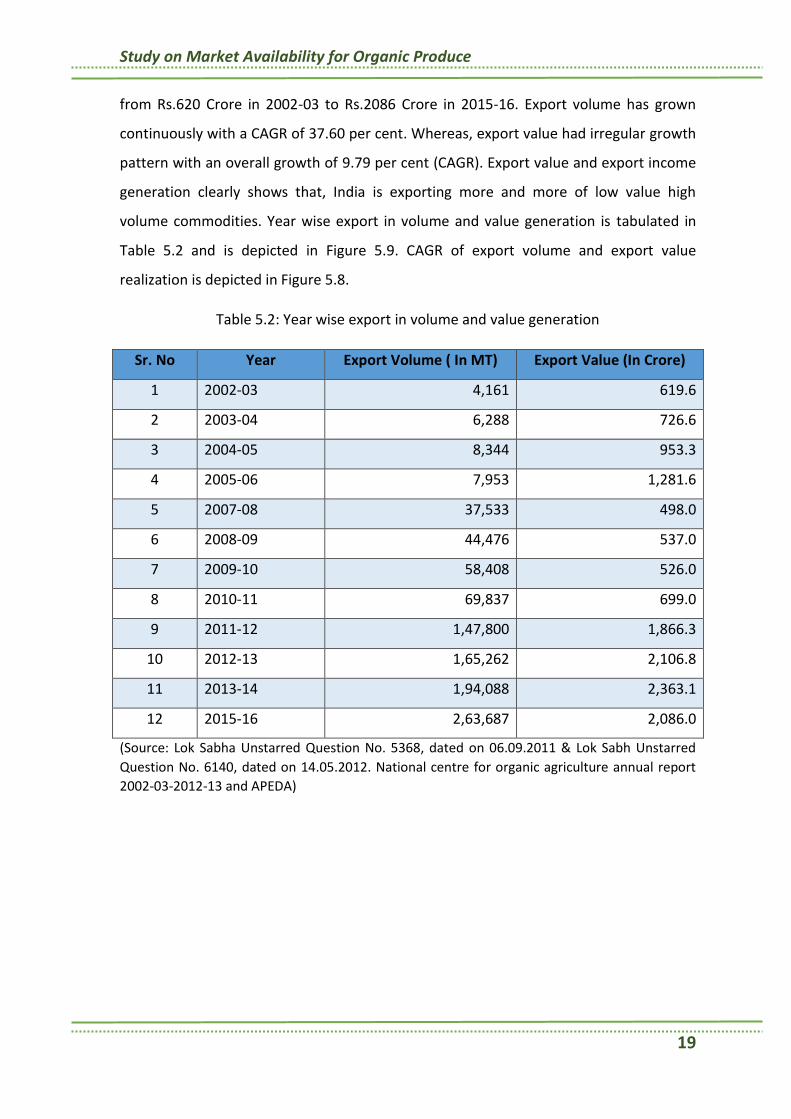
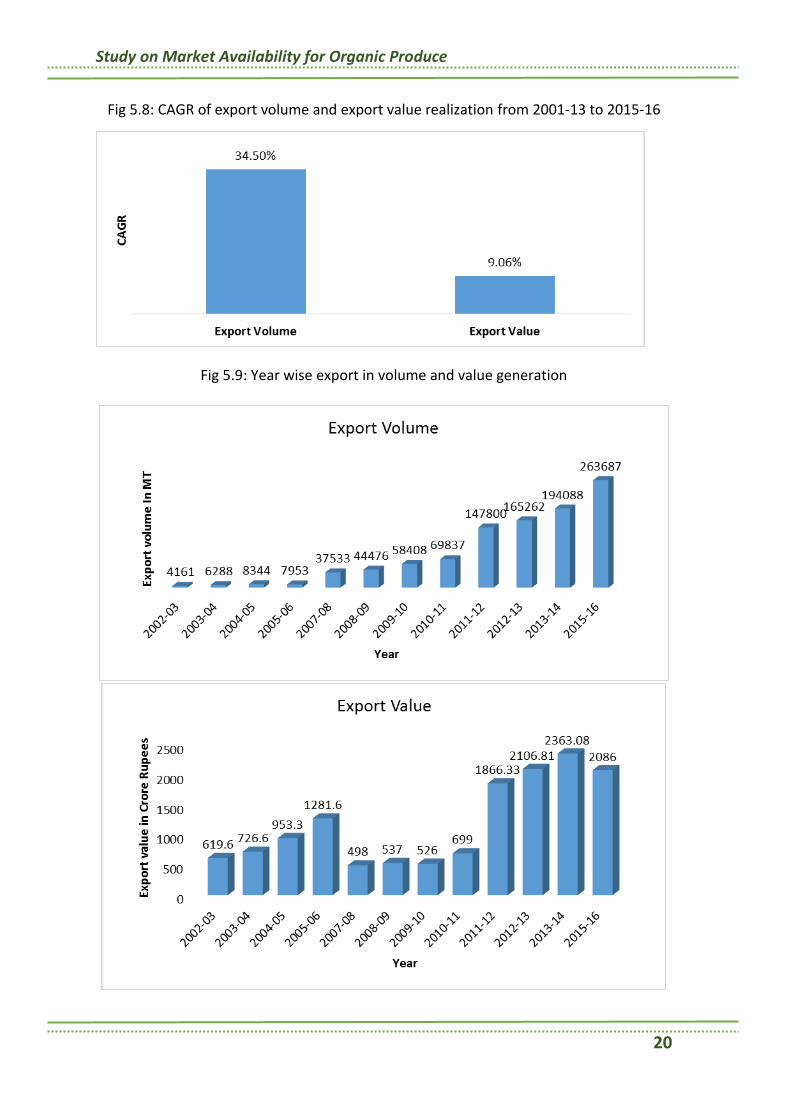
from Rs.620 Crore in 2002-03 to Rs.2086 Crore in 2015-16. Export volume has grown
continuously with a CAGR of 37.60 per cent. Whereas, export value had irregular growth
pattern with an overall growth of 9.79 per cent (CAGR). Export value and export income
generation clearly shows that, India is exporting more and more of low value high
volume commodities. Year wise export in volume and value generation is tabulated in
Table 5.2 and is depicted in Figure 5.9. CAGR of export volume and export value
realization is depicted in Figure 5.8.
Table 5.2: Year wise export in volume and value generation
Sr. No Year Export Volume ( In MT) Export Value (In Crore)
1 2002-03 4,161 619.6
2 2003-04 6,288 726.6
3 2004-05 8,344 953.3
4 2005-06 7,953 1,281.6
5 2007-08 37,533 498.0
6 2008-09 44,476 537.0
7 2009-10 58,408 526.0
8 2010-11 69,837 699.0
9 2011-12 1,47,800 1,866.3
10 2012-13 1,65,262 2,106.8
11 2013-14 1,94,088 2,363.1
12 2015-16 2,63,687 2,086.0
(Source: Lok Sabha Unstarred Question No. 5368, dated on 06.09.2011 & Lok Sabh Unstarred
Question No. 6140, dated on 14.05.2012. National centre for organic agriculture annual report
2002-03-2012-13 and APEDA)
Study on Market Availability for Organic Produce
20
Fig 5.8: CAGR of export volume and export value realization from 2001-13 to 2015-16
Fig 5.9: Year wise export in volume and value generation
Study on Market Availability for Organic Produce
21
(Source: Lok Sabha Unstarred Question No. 5368, dated on 06.09.2011 & Lok Sabh Unstarred
Question No. 6140, dated on 14.05.2012. National centre for organic agriculture annual report
2002-03-2012-13 and APEDA)
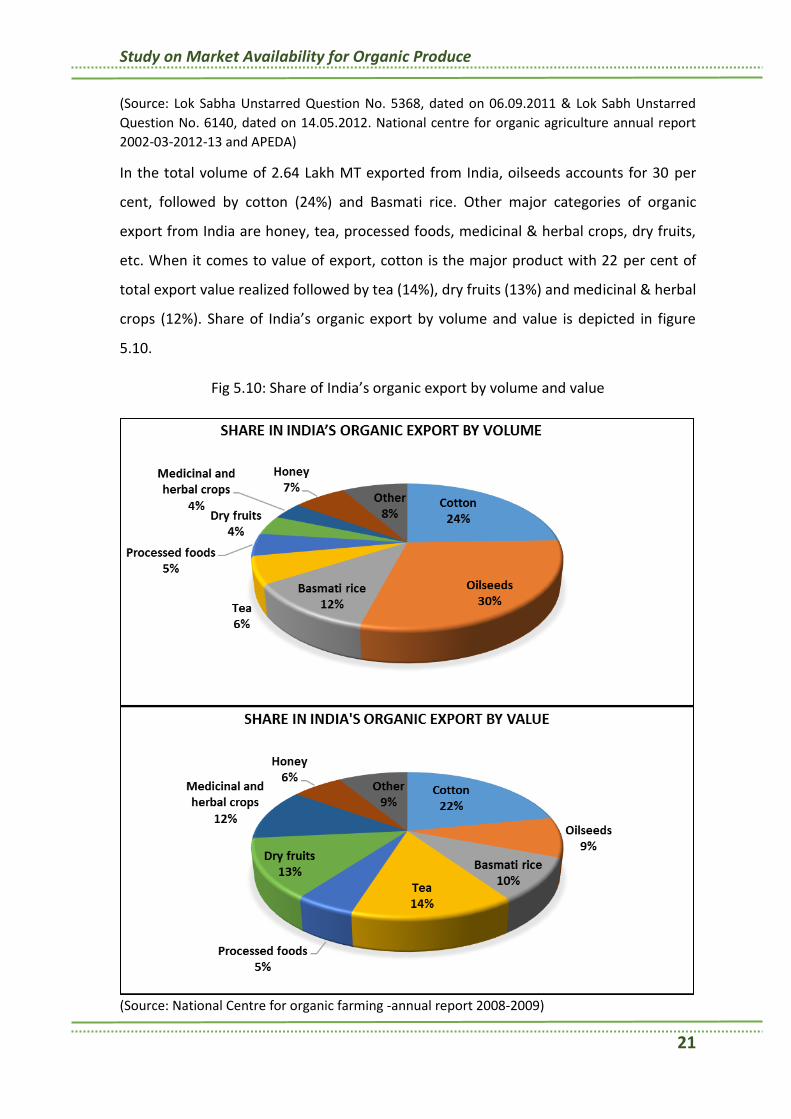
In the total volume of 2.64 Lakh MT exported from India, oilseeds accounts for 30 per
cent, followed by cotton (24%) and Basmati rice. Other major categories of organic
export from India are honey, tea, processed foods, medicinal & herbal crops, dry fruits,
etc. When it comes to value of export, cotton is the major product with 22 per cent of
total export value realized followed by tea (14%), dry fruits (13%) and medicinal & herbal
crops (12%). Share of India’s organic export by volume and value is depicted in figure
5.10.
Fig 5.10: Share of India’s organic export by volume and value
(Source: National Centre for organic farming -annual report 2008-2009)

Study on Market Availability for Organic Produce
22
The major importers of Indian organic products by volume is USA with 42 per cent of
total countries export followed by European Union (34%) and Canada (22%). In terms of
value, European Union is the major importer with 43 per cent followed by USA (37%)
and Canada (14%). Share of Indian organic products import by volume and value is given
in Figure 5.11.
Fig 5.11: Share of Indian organic products import by volume and value
(Source: Loksabha Unstarred Question No 2393 Dated on 25/07/2014)
5.4 Broad product portfolio
The broad categories of products available in the country are field crops, horticulture
crops, animal and livestock products, processed products and non-food products. Sub-
categories among these categories are given in Figure 5.12.

Study on Market Availability for Organic Produce
23
Fig: 5.12: Broad category of organic products available in
India

Study on Market Availability for Organic Produce
24
Chapter 6: Karnataka State Scenario
Area and production of organic crops in the state as per latest data available, state
initiatives in promoting organic farming and present market scenario of organic produce
market in Karnataka is dealt in this chapter.
6.1 Area and Production
During 2011-12, Karnataka stood 9th in terms of area under organic cultivation with a
total area of 1.19 Lakh Ha. This include both organic farming and wild collection. From
2009-10 to 2011-12, growth in area was almost flat however, production has more than
doubled from 0.45 Lakh MT in 2009-10 to 1.03 Lakh MT in 2011-12. With 1.03 Lakh MT
production, Karnataka ranks fifth in terms of production of organic crops and wild
collection. Area and production of organic crops and wild collection from 2009-10 to
2011-12 in Karnataka is given in Figure 6.1.
As per 2012-13 APEDA data, Karnataka stood 7th in terms of area under organic farming
(excluding wild collection). The present situation with respect to area and production of
organic crops in Karnataka may drastically vary from the 2012-13 (latest data available
year), mainly due to the various state government incentives to promote organic
farming. In the absence of published data on recent area and production, study team
has provided state position as per data prior to 2012-13.
Fig 6.1: Area and production of organic crops and wild collection

Study on Market Availability for Organic Produce
25
In the absence of published data on crop wise organic farming, share of crops in overall
area has been arrived by recent organic certification data collected during field visits. As
per recent organic certification data, cereals and millets accounts for almost half of the
area under organic farming in the state. With 14 per cent of total area under organic
farming, plantation crops are the second largest category followed by pulses and
commercial crops (9% each) and oil seeds (8%). Crop category wise. Share of various
crop categories in overall crop area under organic farming in the state is depicted in
Figure 6.2.
Fig 6.2: Share of crop categories in overall crop area under organic farming
(Source: Data collected from organic certifying agencies in Karnataka)
In terms of organic crop production, plantation crops accounts for 43 per cent of state’s
total organic production followed by, commercial crops (34%) and cereals (12%). Share
of various crop categories in state’s total organic production is depicted in Figure 6.3.

Study on Market Availability for Organic Produce
26
Fig 6.3: Share of crop categories in state’s total organic production
(Source: Data collected from organic certifying agencies in Karnataka)
Higher share in production among commercial and plantation crops despite lower share
in area is due to high productivity. Commercial crops have a highest productivity with
41.79 MT/Ha followed by plantation crops (34.29 MT/Ha). Lowest productivity is found
among field crops like pulses (1.95 MT/Ha), oilseeds (2.67 MT/Ha) and cereals and
millets (2.71 MT/Ha). Comparison of productivity of various crop category is depicted in
Figure 6.4.
Fig 6.4: Productivity of organic crop categories
(Source: Data collected from organic certifying agencies in Karnataka)
Ragi is the major organic crop grown in the state accounting for almost 20 per cent of
the total organic farming area. Other major organic crops are maize (13%), Paddy

Study on Market Availability for Organic Produce
27
(12.37%), arecanut (6.84%), sugarcane (6%) and groundnut (5%). Ragi is the major
organic cereals and millets crop with 39 per cent of area under the category followed by
maize (26%) and paddy (25%). Among organic pulses, red gram is the major crop with 30
per cent of area followed by, horse gram (22%) and green gram (18%). Almost 60 per
cent of area under organic oilseeds is covered by groundnut followed by soya bean
(25%) and sunflower (13%). Sugarcane is the major organic commercial crop cultivated
in the state with more than two-third of area under organic commercial crops, followed
by cotton (22%). Share of major crops in each of the categories of organic field crops is
given in Figure 6.5.

Study on Market Availability for Organic Produce
28
Fig 6.5: Share of major crops in each of the categories of organic field crops
(Source: Data collected from organic certifying agencies in Karnataka)
Among the organic horticultural crops, plantation crops accounts for almost two-third of
area; rest one-third area is occupied by fruits and vegetables. Arecanut is the major
organic plantation crop grown in the state accounting almost half of the area under
organic plantation, followed by coconut (32%) and coffee (17%). Among organic fruits,
mango and banana accounts for more than 90 per cent of area. Onion is the major
organic vegetable cultivated in the state. It accounts for almost one-third of area under

Study on Market Availability for Organic Produce
29
organic vegetables, it is followed by tomato (17%) and chili (10%). Among organic spices,
black pepper, turmeric and ginger are the major in the state. Share of major crops in
each of the categories of organic horticulture crops is given in Figure 6.6.
Fig 6.6: Share of major crops in each of the categories of organic horticulture crops
(Source: Data collected from organic certifying agencies in Karnataka)
6.2 State initiatives
Government of Karnataka has brought out a unique policy in 2004 to promote organic
farming in Karnataka by adopting holistic approch. Since then, several schemes and
programmes of the State and Central Governments have been implemented in the State
to promote organic farming. On account of this, awareness has perculated down the line
and more than 1 Lakh hectares of agricultural land has been converted from

Study on Market Availability for Organic Produce
30
conventional farming to organic farming. Now, organic farmers have started approching
Government in various forums for providing market linkages to their produce.
Simultaneously, the demand for organic produce has also started increasing
tremendously from the consumer side.
The Hon’ble Chief Minister of Karnataka in the budget speech of 2015-16, has made a
mention that the Government would facilitate formation of organic farmer associations
in the state to provide marketting linkages.Further, in the high level meeting chaired by
Honarable Minister for Agriculture, Government of Karnataka it has been decided to
forn 14 Regional federations in the state. At present, regional federations are operating
in the initial years. Particiaption of organic farmers in these regional federations is
encouraging and promising. Total area under certified organic production from 14
federations is around 0.47 Lakh Ha and there are more than 45,000 farmers registered
under these federations. In future, these federations are expected to play pivotal role in
promotion of organic farming and organic produce market in the state.
Savayava Bhagya Project
Savayava Bhagya Project, an ambitious project of the Karnataka government, is being
implemented at Hobli/ block level in coordination with NGOs selected transparently
through e-tendering since 2013-14. The selected NGO is given the task of adopting 100
hectares of area in each Hobli/ block. Currently, this project is under implementation in
566 Hoblis and an area of 63,677 hectares involving 53,829 farmers has been brought
under the project. The project area has been brought under group certification through
Karnataka State Seed and organic Certification Agency (KSSOCA). An amount of Rs.4657
Lakh has been reserved for the project during the year 2016-17.
Paramparagat Krishi Vikas Yojana (PKVY)
In addition to Savayava Bhagya, the centre sponsored Paramparagat Krishi Vikas Yojana
(PKVY) is being implemented in all districts and taluks of Karnataka in clusters of 50 acres
since 2015-16. In each taluk, three clusters have been chosen in a total area of 27,250
Study on Market Availability for Organic Produce
31
acres in State and 25,968 farmers are benefiting from this project. A sum of Rs.2,630
Lakhs has been reserved for this project during the year 2016-17
Organic Millet Mela
Karnataka State Department of Agriculture (KSDA) has been conducting annual organic
millet Mela in the state capital Bangalore. This year KSDA has organised ‘Organics and
Millets 2017,’ a three-day national trade fair from April 28 at Palace Grounds in
Bengaluru with an aim of promoting organic food and millets. This Mela acted as forum
for organic farmers and companies for selling organic food products and to interact with
one another and market their products. Major retail players like Big Bazaar, Reliance,
Metro, ITC and SPAR Hypermarket had taken part in the fair. Mela had received very
good response from organic farmers, institutional buyers and consumers.
6.3 Organic produce marketing
Organic produce is growing rapidly in the state mainly in the state capital, Bengaluru.
Due to highest consumption of organic produce, Bengaluru is being treated as organic
capital of the country. Growth rate of organic market in the state is expected to
outperform the national growth of 25-30 per cent. However, there is no published data
on the state’s organic produce market size and growth. There are more than 25
corporate companies which are processing, packing and selling the organic food
products to various retail stores in Bangalore and across the country and major
corporates including 24/7 Mantra, Pro-Nature, Tattva, Green Path, Namadhari etc. Along
with these corporate companies there are more than 200 retail outlets dealing with
organic produce in Bengaluru. Organic restaurants are also gaining importance in the
recent times.

Study on Market Availability for Organic Produce
32
Chapter 7: Study Findings
Primary study has been conducted covering retail outlets, organic consumers and
farmers. A total of 78 samples were covered under the primary study. Data /
information collected by these samples is analyzed and presented in this chapter.
Break-up of samples covered under the study is tabulated in Table 7.1.
Table 7.1: Break-up of samples covered under the study
Sr.
No.
Location Retail outlets Organic
consumers
Organic
farmers
Total
1 Bengaluru 12 11 12 35
2 Hyderabad 5 5 0 10
3 New Delhi 5 18 0 23
4 Mumbai 5 5 0 10
Total 27 39 12 78
7.1 Retail outlets
A total of 27 organic retail outlets were covered in four of the metro cities of the
country, 5 each in Hyderabad, New Delhi & Mumbai and 12 outlets in Bengaluru.
Information required for the study has been elicited from the sample organic outlets as
per the schedule enclosed in Annexure 2. Findings of the information collected from
sample organic outlets is given below:
Organic exclusive outlets are old concept in the metro cities, however the
number of these outlet has increased rapidly in the recent years. Competition
among the organic retail outlets is getting intense every year.
On an average sample organic outlets are operating from last three years. It
indicates that most of the shops are new and the number of new shops are
increasing in the recent years. One can infer from increasing organic retail outlets
that, the overall organic products market is growing in these metro cities.

Study on Market Availability for Organic Produce
33
Most of the organic retail outlets were exclusive organic shops. Among the
sample outlets, only three outlets were operating with mixed products (both
organic and non-organic products). All these three mixed products outlets are
dealing with packed products, which have details of organic certification upfront.
Further, these units were also planning to convert into exclusive organic shops in
the future. As per outlets, it is very difficult to maintain trust among customers
with mixed products, especially in non-packed products like fruit and vegetables.
The average footfall per day across the metro cities in the country is 65 persons
per day. It can increase to more than 100 persons per day in the weekends and
holidays. As per sample outlets, more than 80 per cent of the people visiting
outlets purchase some products; showing better conversion rate compare to
normal retail outlets.
Cereals, pulses, millets, spices and oils are the most common items sold in the
organic outlets. Almost all sample outlets dealt with these products. Many of the
retail outlets don’t keep fruit and vegetables, dairy products and chicken and
meat due to the perishability of the products and lack of sustained timely supply.
Some outlets opined that the inability of keeping perishable products like fruit
and vegetables will result in losing customers, as most of the customers like to
shop for their complete products requirement from one place. Sample outlets
dealing with various categories of food products is depicted in Figure 8.1.
Fig 7.1: Sample outlets dealing with various categories of food products

Study on Market Availability for Organic Produce
34
About two-third of the sample outlets were not able to sell the entire stock. It is
found that the average wastage of organic produce in storage is around 14 per
cent. Majority of these wastage is contributed by fresh fruit and vegetables.
Wastage among non-perishable products is very less. The main reason for
wastage among fruits and vegetable is perishability and among non-perishable
products it is expiry of the products.
Most of the outlets were hesitant to provide their annual turnover. Based on the
few outlets who have revealed, the average annual turnover per shop is a round
Rs.90 Lakh per year.
The common channel for procuring raw material by sample retail outlet is
purchasing directly from farmers followed by selling corporate brands and home
brands. Higher percentage of direct procurement of raw material shows the least
involvement of middlemen. Further, retail outlets prefer direct procurement
from farmers to middlemen; due to trust issue. With the existing supply chain,
one may think of educating organic farmers about primary processing of produce
and strengthen organic federations for better price realization by farmers.
Procurement channel of sample outlet is given in Figure 7.2.
Fig 7.2: Procurement channel of sample outlets

Study on Market Availability for Organic Produce
35
In retail outlets opinion, health consciousness is the major reason behind
increasing number of people buying organic products.
On an average, the premium charged for the organic products over non-organic
products is around 30 per cent. Premium charged for major organic products is
discussed in details in the later part of this chapter.
In the recent years’ demand for cereals, pulses & millets, spices, fruits and vegetables
are increasing rapidly compared to other categories of food items. Dairy and meat
segments are showing very little growth.
Majority of the retail outlets are not satisfied with the organic raw material quality. In
the recent years, quality of field crops like cereals, pulses and millets are increasing due
to branding at corporate level and primary processing at lower level. However, quality of
perishable commodities like fruit and vegetables are below expectations. As per retail
outlets, there is enormous scope to increase the quality of organic produces by
strengthening supply chain.
As per retail outlets, 69 per cent of existing customers are retained customers
and the remaining 31 per cent are fresh customers. This shows good customer
retention as well as interest from new customers. Share of customers is shown in
Figure 7.3.
Fig 7.3: Share of customers

Study on Market Availability for Organic Produce
36
7.2 Consumers
A total of 39 organic consumers were covered in four of the metro cities of the country,
5 each in Hyderabad & Mumbai, 18 in New Delhi and 11 outlets in Bengaluru.
Information required for the study has been elicited from the sample consumers as per
the schedule enclosed in Annexure 3. Findings of the information collected from sample
consumers is given below:
Sample consumers were equally selected across the gender. More than half of
the sample consumers were below the age of 40. It indicated, more and more
young population is showing interest in organic products. And it is a good
indication for organic market for the long run. Sample consumers sex ration and
age profile is depicted in Figure 7.4.
Fig 7.4: Sample consumers’ sex ration and age profile
• As per sample consumers’ education profile, most of the organic produce
consumers are graduate or above; indicating better awareness about organic
products among educated people. More than half of the consumers were house
maker. Hence, one has to primarily target house makers for promotion of organic
products for better result. It is also found that the most of the consumers are
from upper middle income and high income group. Increasing population with
higher income is a boost for organic market. Educational and occupational profile
of sample consumers in given in Figure 7.5.

Study on Market Availability for Organic Produce
37
Fig 7.5: Educational and occupational profile of sample consumers
The Most preferred purchase point of the organic products is retail outlets,
followed by modern retails and super market. Most of consumers’ shop for
organic products occasionally to regularly. Purchasing point and frequency of
shopping of organic products is directed in Figure 7.6.

Study on Market Availability for Organic Produce
38
Fig 7.6: Purchasing point and frequency of shopping of organic products
From the Figure 7.7, it can be observed that most of the consumers are using
organic products for more than three years; indicating better retention. Also,
number of new organic consumers among the sample is encouraging.
Fig 7.7: Organic shopping history of consumers
The most preferred product category among organic products is cereals, pulses
and millets followed by vegetables and fruits. Most of the consumers were
satisfied with the organic product range available at the retail outlets, except for
fruits and vegetables. As per consumers, availability of fruits and vegetables is
very limited to major crops like onion, tomato, chilli, mango and banana. As per
many consumers as well as retail outlets, non-availability of complete range of

Study on Market Availability for Organic Produce
39
fruits and vegetables is the major concern for organic produce marketing. Few
opined that, consuming few organic products along with non-organic fruits and
vegetables in their diet may not have a desired outcome. Preferred organic
products by sample consumers is given in Figure 7.8.
Fig 7.8: Preferred organic products by sample consumers
• On an average consumers are willing to pay a premium of up to 20 per cent for
the organic products. According to consumers, premium charged for products
like honey, jaggary and ghee are very high. Still, they are purchasing these
products mainly due to quality and non-adulteration guarantee.
• As per consumers, increasing health conscious among the high income younger
population is the major driving force for organic markets.
• In order to understand the perception of organic products among consumers,
various parameters were ranked in terms of extremely important, important and
neutral. As per consumers, healthy and safe for consumption of organic produce
is extremely important followed by trust in certification and good nutrition value.
Organic product positing, easy availability, environment friendly are important
for consumers. Consumer perception about organic products is given in Figure
7.9.

Study on Market Availability for Organic Produce
40
Fig 7.9: Consumer perception of organic products
7.3 Organic farmers
Organic farmers were interacted during the primary study to understand back ward
linkage of the organic market. A total of 12 farmers from two district viz., Bagalkote and
Mandya were covered through FGDs. Some of the key outcome of the FGDs are:
Most of the organic farmers were motivated and hand hold by NGOs or
concerned departments or local influential people. Guidance support to the
farmers during the initial years of organic farming is very essential for promoting
organic farming.
Prior to adopting organic farming, all the farmers were aware about organic
farming but didn’t know know-about of organic farming. Required information
about organic farming is mainly provided by promoting / hand holding agency or
person. According to sample farmers, still many more farmers in their locality
are interested to adopt organic farming. Most of them are waiting for proper
guidance, hand holding and assured market linkage.
Most of the sample farmers are having access to marketing channel through
direct contact with retail outlets, own selling or through agents. On an average
farmers are getting premium in a range of 10-15 per cent for organic products.

Study on Market Availability for Organic Produce
41
Present organic certification is on higher side. Same may be reduced, at least in
the initial years of the certification.
Awareness about primary processing of organic crops needs to be created among
organic farmers.
Post-harvest management and storage infrastructures is presently lacking at the
ground level
7.4 Organic products pricing
Sample organic farmers expects to earn at least 15-20 per cent premium for the organic
produces. At present, most of the farmers are getting premium in these range. Still,
forward market linkage of organic produces, especially perishable produces, is still a
major issue as per farmers. On the other hand, most of the sample consumers are of the
opinion that the consumption of the organic produces will increase drastically if the
premium charged for organic will be in the range of 20-30 per cent. Large portion of the
population is willing to pay premium in this range.
For analyzing the premium paid on the organic produces by the consumers, prices of
selected commodities were collected from the sample outlets. Average price of these
commodities has been compared with average price non-organic produces. It is found
that the consumers are paying premium in the range of 27 per cent to 95 per cent.
Premium is lower in the day-to-day consumption commodities like cereals, pulses,
millets, onions and tomatoes. Majority of the outlets charge premium above 75 per cent
in the commodities like honey, ghee, cooking oil and jaggary. Comparison of average
organic produces vis-à-vis non-organic produces is given in the Table 7.2.
Table 7.2: Comparison of average organic produces vis-à-vis non-organic produces
Sr.
No.
Products Non-organic
commodity
price per Kg
Organic price
commodity
per Kg
Premium in
Rs./ Kg
Premium in
per cent
1 Rice 57 76 19 33.33%
2 Tur Dal 117 157 40 34.19%
3 Millets 100 136 36 36.00%

Study on Market Availability for Organic Produce
42
Sr.
No.
Products Non-organic
commodity
price per Kg
Organic price
commodity
per Kg
Premium in
Rs./ Kg
Premium in
per cent
4 Honey 264 468 204 77.27%
5 Ghee 470 862 392 83.40%
6 Cooking oil 135 263 128 94.81%
7 Onion 43 55 12 27.91%
8 Tomato 33 45 12 36.36%
9 Jaggary 65 125 60 92.31%
Most of the retail outlets are aiming to bring down the premium for organic produces to
around 30-40 per cent. However, higher premium charged by middlemen, lack of
sustained supply chain, high losses in perishable commodities, high inventory in non-
perishable commodities, etc., are the major aspects which escalates the operational cost
of the retail outlets. Strengthening of backward linkages will bring down the premium
markup of the organic produces.

Study on Market Availability for Organic Produce
43
Chapter 8: Potential of Organic Products
8.1 Market Potential
The global organic food market is presently estimated at USD 90 billion and it is
expected to reach close to USD 230-280 billion by 2025 at the current growth levels. The
Indian organic sector at USD 415 million (Rs.2700 Cr) is not even 0.5 per cent of it,
constituting both negligible domestic component and exports (Indian Organic Sector
Vision 2025- A White Paper). As per a study, the domestic organic food market of India
would touch the USD 1.36 billion mark by 2020 (Economic times). Further, Indian
domestic market is expected to reach Rs.25,000 Crores mark by 2025 as per IBEF.
At present there is no published data on the Indian domestic organic market. Most of
the data available are estimates are guess. As per a study, the organized domestic
certified organic market is estimated to be between Rs.250 to Rs.300 Crores.
Guesstimates put the other part of the irregular unregulated domestic 'unorganized-
uncertified-unmonitored' organic market size range between Rs.300 to Rs.500 Crores.
Total domestic market estimates range widely from Rs.500 Crores to Rs.1000 Crores as
no reliable estimation exercise was ever undertaken (Indian Organic Sector Vision 2025-
A White Paper).
Organic products market in India, currently is predominantly metro based. It is
estimated that around 95 per cent of the organic brands market exists in the top 10
metros e.g., Delhi (NCR), Kolkata, Mumbai, Pune, Chennai, Bengaluru and the other Tier
II cities – e.g. Indore, Nasik, and Nagpur. In future, organic market is expected to expand
rapidly with penetration to other cities of the country.
In addition to the domestic market, exports are forecast to continue to be the growth
driver for the Indian organic products industry. India majorly exports organic processed
food products, organic rice, beverages and other cereals and millets to the USA, Canada,
Europe, and select South East Asian countries. Global organic market is expected to
triple in the next decade. With the increasing demand for organic produce globally,
Indian organic export is expected to grow with a healthy rate.

Study on Market Availability for Organic Produce
44
8.2 Growth drivers
In the recent times, more and more people are showing interest in organic food
products. As per recent estimation, the Indian organic sector is pegged at USD 415
million (Rs.2700 Cr). There is huge untapped market potential for organic products in
domestic as well as in international market. Some of the major growth drivers for the
organic products are increasing domestic demand, export potential and strong policy
support. Factors fueling these growth drivers are given in Figure 8.1.
Fig 8.1: Organic products growth drivers

Study on Market Availability for Organic Produce
45
8.3 Risks & possible risk mitigation plan
Table 8.1: Risk and possible risk mitigation plan
Aspect Obstacle Solutions
Price Price of organic
produce is too high
Focus should be given to reduce the cost of
organic crop production and increase the land
under organic production. Marketing platform
should be formed to bring producers and retails
closer and thereby reduce the middlemen.
Quality Low consistency of
quality and have
contamination issues
The quality must be consistent. For this reason,
higher quality standards must be enforced to
develop and maintain a good reputation. Post-
harvest management of organic production
should be improved.
Availability Lack of availability of
complete range of
products
Better understanding of the demands of buyers.
Proper planning for making available of complete
range of products especially perishable produces
like fruits, vegetables and dairy products.
Logistics Slow shipment both
in domestic and
export
The logistics must be better coordinated from
place of production to consumption. Post-
harvest infrastructure has to be enhanced to
guarantee quality. For export purpose, duty ports
must reduce the time taken to complete the
process.
Certification Lack of trust on
certificates
More awareness about organic certification has
to be created among the consumers.
Government may think of providing addition
certificate for organic produce after thorough
inspection during production and stringent
residual testing
Organic
farmers
• Lack of
quality seed
materials
• Lack of
required
infrastructure
• Lack of
marketing
• Government may make arrangements
for supplying quality local seed materials at
an affordable price.
• Strengthen organic farmers’ groups or
federation with common infrastructure
required for organic farming
• Training of farmers’ w.r.t. marketing
of organic produces. Linking farmers/ farmers
Study on Market Availability for Organic Produce
46
facilities
• Low
return during
conversion
period
group/ federations with retail outlets /
corporate buyers.
• Incentivize farmers during the initial
three years / conversion period
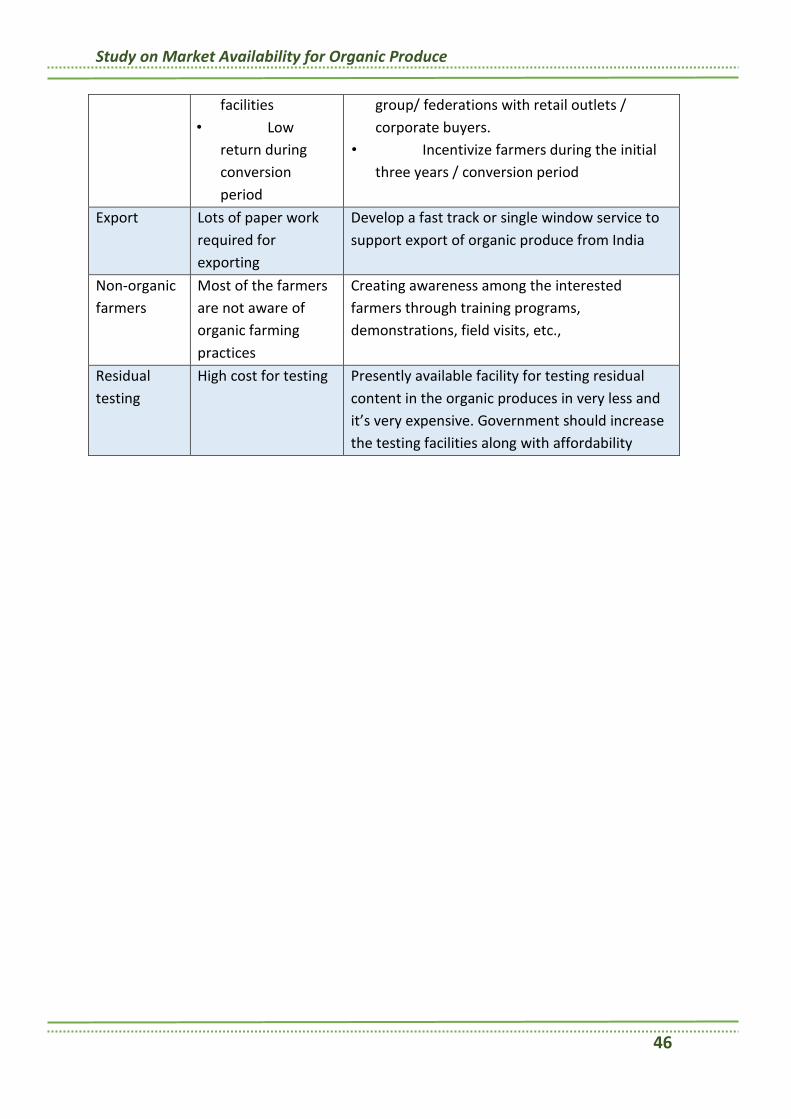
Export Lots of paper work
required for
exporting
Develop a fast track or single window service to
support export of organic produce from India
Non-organic
farmers
Most of the farmers
are not aware of
organic farming
practices
Creating awareness among the interested
farmers through training programs,
demonstrations, field visits, etc.,
Residual
testing
High cost for testing Presently available facility for testing residual
content in the organic produces in very less and
it’s very expensive. Government should increase
the testing facilities along with affordability

Study on Market Availability for Organic Produce
47
Chapter 9: Organic Certification
9.1 Introduction
Organic certification is a certification process for producers of organic food and other
organic agricultural products. In general, any activity / business directly involved in food
production can be certified, including cultivation, various agricultural input
suppliers, food processors, retailers, restaurant, etc. At present, there are about 65
countries with formal government standards, regulations for organic certification. In
addition to these, there are another 17 countries with regulation under development.
Certification criteria varies from country to country however, it generally includes set of
production standards for cultivation / growing, processing, packaging and shipping.
Some of the common features of the standards across countries are:
Avoidance of synthetic chemical inputs like fertilizers, pesticides, herbicides,
growth hormones, etc.
Avoidance of genetically modified deed / seedling materials.
Cultivation land needs to be free from chemical usage for certain years (often 3
years)
Complete documentation of all the activities.
Strict separation from non-organic products and
Periodic on-site inspections by authorized certification bodies / agencies.
In India, APEDA regulates the certification of organic products as per National Standards
for Organic Production. "The NPOP standards for production and accreditation system
have been recognized by European Commission and Switzerland as equivalent to their
country standards. Similarly, USDA has recognized NPOP conformity assessment
procedures of accreditation as equivalent to that of US. With these recognitions, Indian
organic products duly certified by the accredited certification bodies of India are
accepted by the importing countries”. Organic food products manufactured and
exported from India are marked with the “India Organic” certification mark issued by the
APEDA. Organic standards in India are in effect since 2000 however, India Organic logo

Study on Market Availability for Organic Produce
48
was introduced in 2002. Certification marks of India and other major countries are given
in Figure 9.1.
Fig 9.1: Different Organic Logos
India
USA
European Union
Canada
Australia
Switzerland
Germany
France
Japan
(Source: Respective websites)

Study on Market Availability for Organic Produce
49
9.2 The certification process
In order to certify a farm, the farmer is typically required to engage in a number of new
activities, in addition to normal farming operations:
Study the organic standards, which cover in specific detail what is and is not
allowed for every aspect of farming, including storage, transport and sale.
Compliance - farm facilities and production methods must comply with the
standards, which may involve modifying facilities, sourcing and changing
suppliers, etc.
Documentation - extensive paperwork is required, detailing farm history and
current set-up, and usually including results of soil and water tests.
Planning - a written annual production plan must be submitted, detailing
everything from seed to sale: seed sources, field and crop locations, fertilization
and pest control activities, harvest methods, storage locations, etc.
Inspection - annual on-farm inspections are required, with a physical tour,
examination of records, and an oral interview.
Fee – A fee is to be paid by the grower to the certification body for annual
surveillance and for facilitating a mark which is acceptable in the market as
symbol of quality.
Record-keeping - written, day-to-day farming and marketing records, covering all
activities, must be available for inspection at any time. In addition, short-notice
or surprise inspections can be made, and specific tests (e.g. soil, water, plant
tissue) may be requested. For first-time farm certification, the soil must meet
basic requirements of being free from use of prohibited substances (synthetic
chemicals, etc.) for a number of years. A conventional farm must adhere to
organic standards for this period, often, three years. This is known as being in
transition. Transitional crops are not considered fully organic. A farm already
growing without chemicals may be certified without this delay.
Certification for operations other than farms is similar. The focus is on ingredients and
other inputs, and processing and handling conditions. A transport company would be
required to detail the use and maintenance of its vehicles, storage facilities, containers,

Study on Market Availability for Organic Produce
50
and so forth. A restaurant would have its premises inspected and its suppliers verified as
certified organic.
Certification bodies in India
As per APEDA website, at present there are 28 organic certification agencies in India. List
of certification agencies are given in Table 9.1
Table 9.1: List of organic certification agencies in India
Bureau Veritas Certification India
(BVCI) Pvt. Ltd.,
ECOCERT India Pvt. Ltd.,
IMO Control Pvt. Ltd.,
Indian Organic Certification Agency
(INDOCERT)
Lacon Quality Certification Pvt. Ltd.,
Thiruvalla
OneCert Asia Agri Certification (P) Ltd
SGS India Pvt. Ltd.
Control Union Certifications, Mumbai
Uttarakhand State Organic
Certification Agency (USOCA)
APOF Organic Certification Agency
(AOCA)
Rajasthan Organic Certification Agency
(ROCA)
Vedic Organic Certification Agency
Indian Society for Certification of
Organic Products
Food Cert India Pvt. Ltd
Aditi Organic Certifications Pvt. Ltd
Chhattisgarh Certification Society,
India (CGCERT)
Tamil Nadu Organic Certification
Department (TNOCD)
Intertek India Pvt. Ltd.
Madhya Pradesh State Organic
Certification Agency
Odisha State Organic Certification
Agency
Natural Organic Certification Agro Pvt.
Ltd.
FairCert Certification Services Pvt. Ltd.
Gujarat Organic Products Certification
Agency
Uttar Pradesh State Organic
Certification Agency
Karnataka State Organic Certification
Agency (KSOCA)
Sikkim State Organic Certification
Agency (SSOCA)
Global Certification Society
Greencert Biosolutions Pvt. Ltd

Study on Market Availability for Organic Produce
51
Study on Market Availability for Organic Produce
52
9.3 Product labelling
Being able to put the word "organic" on a food product is a valuable marketing
advantage in today's consumer market. Certification is intended to protect consumers
from misuse of the term, and make buying organics easy. However, the organic labelling
made possible by certification itself usually requires explanation. In many countries
organic legislation defines three levels of organics. Products made entirely with certified
organic ingredients and methods can be labelled "100% organic". Products with 95%
organic ingredients can use the word "organic". Both may also display organic seal. A
third category, containing a minimum of 70% organic ingredients, can be labelled "made
with organic ingredients". In addition, products may also display the logo of the
certification body that approved them. Products made with less than 70% organic
ingredients cannot advertise this information to consumers and can only mention this
fact in the product's ingredient statement.
During the field study, it was observed that almost all the organic products in the sample
stores had clear label and logo of the certifying agency. However, many of the products
didn’t had “Organic India” label. This may be due to procurement of raw material from
under conversion or small farmers, product manufactured with less than 90 per cent of
certified organic products, lack of certification at processing stage, etc. In case of
perishable products like fresh fruit and vegetables, display of label / logo was completely
absent as they are mostly sold without packing. Sample of organic labels is provided
below.

Study on Market Availability for Organic Produce
53
Fig 9.2: Sample of organic labels
9.4 Status of organic certification in Karnataka
In Karnataka, group certification of organic farms is undertaken by certified agencies
recognized by APEDA, GoI, in coordination with Karnataka State Organic Certification
Agency. Organic certification in the state is mainly done by three agencies viz., Karnataka
State Organic Certification Agency (KSOCA), APOF Organic Certification Agency (AOCA)
and Aditi Organic Certifications Pvt. Ltd. A total of 63,677 hectares of land from 53,829
farmers has been covered under Savayava Bhagya. These are having been brought under
certification through Karnataka State Organic Certification Agency. The second year
certification process (IC-2) is currently underway
9.5 Organic certification Charges
Certification bodies charges for organic certification on man-days basis. Certification
bodies have set different tariffs for different category of farmers/ processors/ traders.
To understand the tariffs charged by certification bodies, tariff structure of six agencies
has been collected and the average tariff of these six agencies has been worked out.
Summary of the average tariff charged by certification agency is presented in the Table
9.2.

Study on Market Availability for Organic Produce
54
Table 9.2: Summary of the average tariff charged by certification agency
Sr. No. Inspection Inspection (In Rs.) Certification (In Rs.)
1 Small holder groups 11,400 14,300
2 Growing groups 11,000 13,800
3 Individual farmers 9,400 11,800
4 Small processors 11,800 14,800
5 Estates 13,600 17,000
6 Medium size processors 14,600 18,300
7 Manufactures/
Exporters / Importers
15,700 19,700
8 Travel time fee 5,400 6,800
9 Travel cost As per actual
(Source: Data collected from organic certifying agencies in Karnataka)

Study on Market Availability for Organic Produce
55
Chapter 10: Government Initiatives to Promote Organic
Farming in India
10.1 National Project on Organic Farming
The National Project on Organic Farming (NPOF) is a Central Sector Scheme
implemented on pilot basis during the Tenth Five Year Plan with an outlay of Rs.57.04
Crore. The scheme was subsequently expanded in the Eleventh Five Year Plan with an
outlay of Rs.101 Crore and is continued during present twelfth Five Year Plan also. NPOF
is being implemented by National Centre of Organic Farming (NCOF) located at
Ghaziabad along with its eight Regional Centres viz., Bangalore, Bhubaneshwar,
Panchkula, Ghaziabad, Imphal, Jabalpur, Nagpur and Patna The primary objective of the
NPOF Scheme is to encourage the production of food organically, and promote
manufacture and usage of organic and biological inputs, such as bio-fertilizers, organic
manure, bio-pesticides and bio-control agents.
10.2 Capital Investment Subsidy for Setting up of Organic Inputs Production
The NPOF provides financial assistance for fruits and vegetables waste compost units by
providing for 33 per cent of the capital cost of the project, subject to a ceiling of Rs.63
Lakh. Further, NPOF provides subsidy for the construction of bio fertilizer or bio
pesticide production unit to an extent of 25 per cent of the capital cost of the project
subject to a ceiling of Rs.40 Lakh. The remaining cost is envisaged as credit support from
financial institutions and margin money. The subsidy is credit linked and back-ended and
mobilised through NABARD.
10.3 National Project on Management of Soil Health and Fertility (NPMSF)
The National Project on Management of Soil Health and Fertility (NPMSF) was
implemented during the Eleventh Five Year Plan period with an outlay of Rs.429.85
Crore, to promote the balanced and judicious use of fertilizers and organic manure on
soil test basis. This Scheme provides financial assistance at Rs.500 per ha for promoting
the use of organic manure.

Study on Market Availability for Organic Produce
56
10.4 Paramparagat Krishi Vikas Yojana
It is an elaborated component of Soil Health Management (SHM) of major project
National Mission of Sustainable Agriculture (NMSA). Under PKVY Organic farming is
promoted through adoption of organic village by cluster approach and PGS certification.
Scheme has two major components viz. Adoption of Participatory Guarantee System
(PGS) certification through cluster approach and Adoption of organic village for manure
management and biological nitrogen harvesting through cluster approach. Government
has made budgetary allocation of Rs.300 Crores for the same in the Union Budget 2015-
16.
10.5 National Horticulture Mission
This is a Centrally Sponsored Scheme; launched in 2005-06, the Scheme aims at
strengthening the growth of the horticulture sector comprising of fruits, vegetables,
roots and tuber crops, mushroom, spices, flowers, aromatic plants, cashew and cocoa.
NHM provides financial assistance for establishing vermi compost units and HDPE vermi
beds. Assistance is also being provided under the Mission for organic certification of Rs.5
Lakh for a group of farmers covering an area of 50 hectares.
10.6 Rashtriya Krishi Vikas Yojna
Assistance for decentralized production and marketing of organic fertilizers is available
under Rashtriya Krishi Vikas Yojna (RKVY) for projects formulated and approved by the
State Level Sanctioning Committee.
10.7 Network Project on Organic Farming by ICAR
The Network Project on Organic Farming initiated by the ICAR in the Tenth Five Year
Plan at the Project Directorate for Farming Systems Research, Modipuram, Uttar
Pradesh, involves developing package of practices for different crops and farming
systems under organic farming in different agro-ecological regions of the country. The
project has been running at 13 centres including State Agricultural Universities (SAUs),
spread across 12 States. The crops for which package of practices for organic farming
have been developed include basmati rice, rain fed wheat, maize, red gram, chickpea,
soybean, groundnut, mustard, isabgol, black pepper, ginger, tomato, cabbage and
cauliflower
Study on Market Availability for Organic Produce
57
Chapter 11: Suggestions / Recommendations
General
• Presently, data maintains regarding organic produces is in dismal condition in
state as well as in country. Government should give more focus for collecting and
maintaining basic data like area, production, yield, etc. This will assist in scientific
planning for promotion of organic produces as well as in assessment of growth in
the sector.
• Government needs to give focus to produce more of high value low volume
crops. Presently state as well as country is mainly producing/ exporting low value
high volume crops.
• APEDA may think of implementing Indian Trade Clarification based
on Harmonized System of Coding (ITC-HS Codes) for organic products. The
Harmonized Commodity Description and Coding System, also known as the
Harmonized System of tariff nomenclature is an internationally standardized
system of names and numbers to classify traded products. Indian Trade ITC-HS
Codes is adopted in India for import-export operations.
• Government may enhance the incentives for export of organic products from
India. Export incentives for organic products has to be more than the incentives
provided to the export of non-organic agricultural products.
Production aspects
• Organic Seed banks and organic input supply stores may be established to
promote natural and organic indigenous seeds varieties in place of GMO &
hybrid seeds
• Agricultural Universities, Research Institutions have to come forward to develop
an organic farming methods with low cost model (crop specific) to ensure lower
cost of cultivation and increased optimal yield year by year. Such demonstrations
may be carried out in different locations of state and on main commercial crops

Study on Market Availability for Organic Produce
58
• Local cow breeds may be promoted in place of other international cow breeds
for better quality milk production and quality manure which brings sustainability
to organic farmer
• The cost of certification needs to be reduced drastically or a government
certifying agency or outsourced certifying agency may be put in place with
affordable fee structure
Marketing aspects
• Government has to establish more number of chemical and pesticide residue
testing labs and has to ensure testing in time with nominal fee
• Processing or value addition of organic produce has to be given utmost priority in
order to get the full benefit of organic farming.
• Collection centers, storage facilities, Grading, Cleaning, Processing, Packaging &
labelling centers has to be established in each district to ensure timely
procurement of organic produce, process and distribute to retail outlets,
wholesalers, food chains and supermarket which brings sustainability in the
supply chain. Cluster based approach may be adopted for effective
implementation. The 14 organic federations farmed in the state may be assisted
in this direction.
• Government has to empower Organic Federations for timely procurement,
process, packing, labelling of food products and regular supply to different food
chains, retailers etc. So that the quality produce reaches consumers in better
quality and affordable prices
• Hi tech and scientific cold storage has to be established for storing of perishable
food produce to minimize the losses
• Government may make arrangements for selling certified organic products
through outlets like HOPCOMS or establish outlet chain on the model of
HOPCOMS

Study on Market Availability for Organic Produce
59
• Government may create a platform for direct marketing of produce between
corporates/ retailers/ wholesalers/ other marketers and farmer / farmers’
associations/ groups/ federations, etc.
• Government may establish crop specific organic export hub to enhance the
export of organic products from state
• Government has to develop strict policy to ensure organic shops to sale pure
organic food products with proper information on the labels and only licensed
retailers / wholesalers/corporate should market organic products
• State government may come up with Karnataka state specific label in line with
“Organic India” label provided by APEDA. This will assist in enhancing confidence
among consumers and also keep local organic market in check
• Awareness creation programs for publics about organic products, its benefits
importance of certification, etc., needs to conducted
• Adequate training has to be provided to the staff involved at various level.

Study on Market Availability for Organic Produce
60
Annexure

Study on Market Availability for Organic Produce
61
Annexure 1: State wise area under organic farming
Sr. No. State Name Organic Area (in Ha)
1 Andaman & Nicobar Islands 321.28
2 Andhra Pradesh 12325.03
3 Arunachal Pradesh 71.49
4 Assam 2828.26
5 Bihar 180.6
6 Chhattisgarh 4113.25
7 Delhi 0.83
8 Goa 12853.94
9 Gujarat 46863.89
10 Haryana 3835.78
11 Himachal Pradesh 4686.05
12 Jammu & Kashmir 10035.38
13 Jharkhand 762.3
14 Karnataka 30716.21
15 Kerala 15020.23
16 Lakshadweep 895.91
17 Madhya Pradesh 232887.36
18 Maharashtra 85536.66
19 Manipur 0
20 Meghalaya 373.13
21 Mizoram 0
22 Nagaland 5168.16
23 Odisha 49813.51
24 Pondicherry 2.84
25 Punjab 1534.39
26 Rajasthan 66020.35
27 Sikkim 60843.51
28 Tamil Nadu 3640.07
29 Tripura 203.56
30 Uttar Pradesh 44670.1
31 Uttaranchal 24739.46
32 West Bengal 2095.51
Total 723039
Source: APEDA (2013-14)

Study on Market Availability for Organic Produce
62
Annexure 2: Schedule – Retail outlets
1. Shop Name
2. Shop Address
3. Contact person Name
4. Contact Number 5. Shop establishment
year 6. Average per day
footfall at your shop 7.
Shop Type Organic Natural/Herbal Mix
8. If mix, are you willing to completely switch over to organic products? Yes / No
9. If mix, do customer trust organic products
10.
Category of products handled
Fruit and vegetables
Cereals, millets & pulses
Spices Oils Herbal extracts
Processed food items
Milk & other dairy products
Chicken & meat products
Others
11. Major two Products in each category specified in Q 10.
Quantity handled (per month)
Organic - Price (Rs.kg)
Conventional - Price (Rs.kg)
Source of procurement

Study on Market Availability for Organic Produce
63
12. Are you able to sell the entire produce in a season? Yes / No
13.
If No, what is the percentage of wastage, If any
14.
If No, specify the reasons for the unsold stock.
1. Lack of information on availability and certification 2. High Price 3. Slow shipment / logistics problem 4. Raw material quality issue 5. Perishability 6. Grading aspects (Variation in size, variation of boiling
quality in cereals) 7. Others
15. Do you export organic produces
16. If yes, quantity exported, products and countries
17. Share of export and domestic market (%age) Export Domestic
18.
Raw material procurement channel
1. Mandi 2. Farmers 3. Agents/wholesalers 4. Organic federation 5. Contract farming 6. Other brands/Corporates 7. Own / home brands 8. Own cultivation
19. According to you, which segment buys the organic produce the most?
1. Lifestyle 2. Health conscious 3. Recommended by doctors 4. Others
20. Percentage of customer repeat purchase
21.
PROJECTION OF DEMAND - Major organic products for which growing demand is anticipated
Rank (1-9) (Rank 1 is with highest growth and 9 with least)
1. Fruit and vegetables 2. Cereals, millets & pulses 3. Spices 4. Cooking oils 5. Herbal extracts 6. Processed food items 7. Ready To Eat (RTE)

Study on Market Availability for Organic Produce
64
8. Milk & other dairy products
9. Chicken & meat products 10. Others
22. Are you satisfied with the quality of raw material
23. If no, reasons 24. Number of organic
stores in the locality 25. Do you have
certificate for selling organic produce
26. Name of the certifying bodies
27. Cost of certification 28. Any inspection
undertaken at your shop to verify organic produce
29. Parameters (Tick any one)
Very important
Important Neutral Not important
Least important
Organic certificate Traceability Labelling Packing Price Product availability
30. Perishable products lead time
31. Any suggestions to improving overall supply chain/quality?
32. Any suggestions to improve the market for organic foods?

Study on Market Availability for Organic Produce
65
Annexure 3: Schedule – consumers
1. Name
2. Contact
3. Address
4. Gender? □ Male □ Female
5. Age?
□ 11-20 □ 21-30 □ 31-40 □ 41-50 □ 51-60 □ 60+
6. Education
□ Illiterate □ Up to 10th /SSC/HSC □ Graduate □ Post Graduate
7. Occupation
□ Government employee □ IT/ Doctor □ Other employee □ Self-
employed
□ House maker □ Farmer
□ Other (Please specify :__________________)
8. Which of the following is your main source of weekly food shopping?
□ Supermarket (D-Mart, Safal, Easyday, More, Big Bazaar, HyperCity,
Spencers’, Bangalore Central)
□ Modern retail (Fabindia, Reliance Fresh)
□ Retail outlet
□ Online (Amazon grocery, BigBasket, Grofers, etc.)
□ Other (Specify) _____________________________________
9. Do you find organic food there? □ Yes □ No
10. Do you ever buy organic food or beverage products? □ Yes □ No
11. If Yes, how often?
□ Regularly (Weekly)
□ Occasionally (Fortnightly)
□ Once in while
□ Never
12. Share(%age) of Organic and non-organic food products:
13. How did you first hear about organic foods?
o Newspaper…………………………
o Magazine……………………………..
o Internet………………………..
o Friends/relatives…………..
o Television
o Doctor Prescription
o Social Media
14. How long have you been buying organic foods?
□ One year

Study on Market Availability for Organic Produce
66
□ Two years
□ Three years
□ More than three years
15. What types of organic food do you purchase?
□ Vegetable □ Fruit □ Herbs □ Honey □ Nuts
□ Cereals and cereal products □ Bakery products
□ Milk/Dairy products □ Eggs □ Beverages □ Meat
products □ Fish □ Baby foods
□ Stimulants (sweets, coffee, tea, etc.)
□ Other (Please, specify __________________________________)
16. Do you ever buy organic non-food products?
□ Detergents and washing agents
□ Natural products and natural cosmetic products
□ Other (Please, specify ______________________________)
17. What are the factors which motivate you to purchase organic food?
Parameters Not Important
Neutral Important Extremely Important
Organic products are healthy and safe for consumption
Good nutrition value
Organic products are environment friendly
Ready to pay premium price Trust in Organic food Certification
Labelling/ Packing
Organic food products are easily available
Positive image and trendy (lifestyle)
18. How far is nearest organic shop from your house?
19. Do you find all the products required by you in the nearest shop? Yes
No
20. Issues hindering your organic food produce purchase?
□ It’s too expensive
□ Not many varieties
□ Not available where I shop
□ Don’t like the labelling/packaging
□ Don’t like the taste
□ Don’t trust the origin
□ Other (Please, state) _____________
21. Are you willing to pay extra for organic food?
o Yes □No
22. If yes, then how much premium when compared to the price of regular
products? (in %age terms)
23. Would you buy more organic products if they were less expensive?

Study on Market Availability for Organic Produce
67
□ Yes □ No □ Maybe
24. Would you buy more organic products if they are certified by a government
agency / recognizable label?
□ Yes □ No □ Maybe