Embed Size (px)
Citation preview
Study on Health Effects of Study on Health Effects of Indoor Air Pollution in ChinaIndoor Air Pollution in China
Presented by Pan Xiao-chuan et al.Presented by Pan Xiao-chuan et al.
Dept. of Occupational and Environmental Dept. of Occupational and Environmental HealthHealth
Peking University School of Public Health Peking University School of Public Health
Workshop in Oslo, Oct.17-19, 2004 Workshop in Oslo, Oct.17-19, 2004
Introduction Introduction
The indoor air quality is concerned more The indoor air quality is concerned more and more by the government and the and more by the government and the public in China nowadays and the health public in China nowadays and the health effects of indoor air pollution are becoming effects of indoor air pollution are becoming a serious challenge in both urban and rural a serious challenge in both urban and rural areas of China. In order to further study areas of China. In order to further study the health effects of indoor air pollution the health effects of indoor air pollution and population exposure to them, it is very and population exposure to them, it is very important for us to know clearly what the important for us to know clearly what the key pollutants is in the urban and rural key pollutants is in the urban and rural areas of China. areas of China.
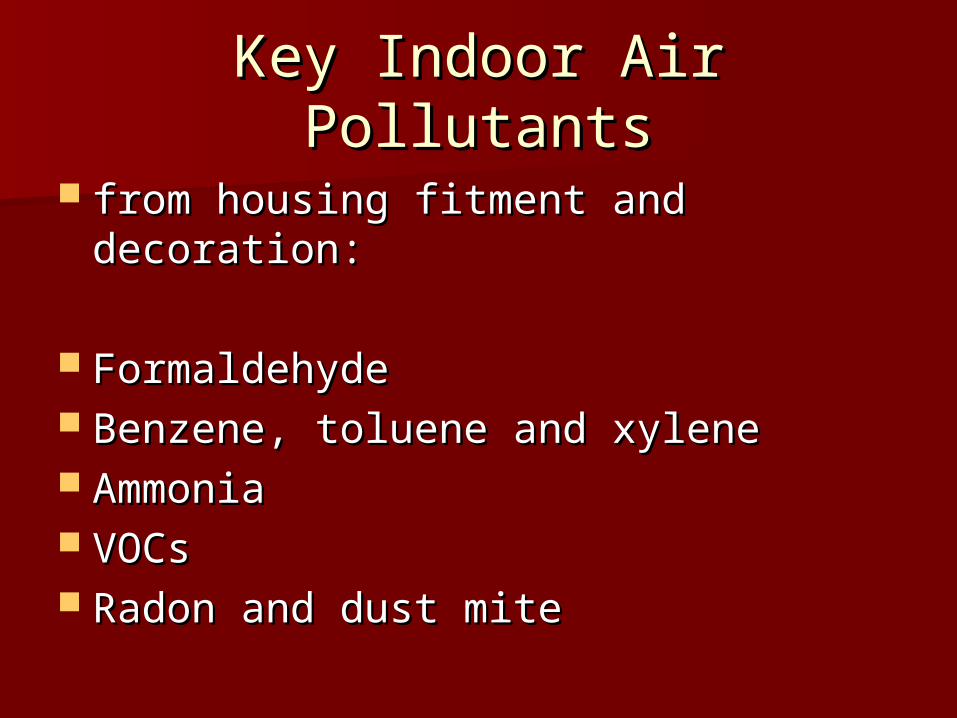
Key Indoor Air PollutantsKey Indoor Air Pollutants
from housing fitment and decoration:from housing fitment and decoration:
Formaldehyde Formaldehyde Benzene, toluene and xylene Benzene, toluene and xylene AmmoniaAmmonia VOCsVOCs Radon and dust mite Radon and dust mite
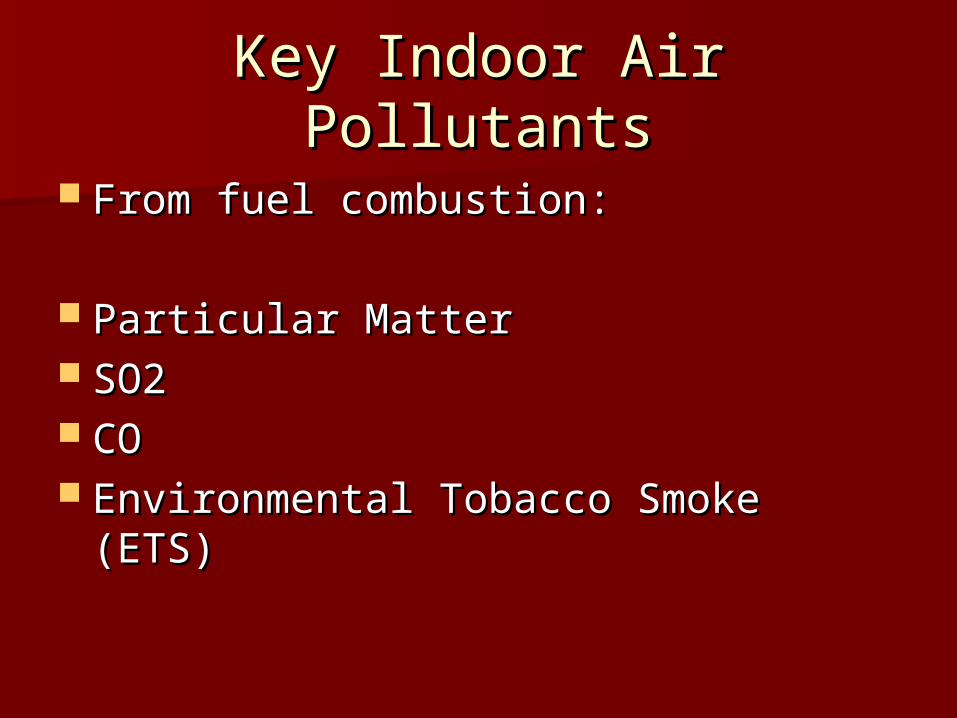
Key Indoor Air PollutantsKey Indoor Air Pollutants
From fuel combustion:From fuel combustion:
Particular Matter Particular Matter SO2SO2 COCO Environmental Tobacco Smoke (ETS) Environmental Tobacco Smoke (ETS)
Part one: The Indoor Air Part one: The Indoor Air Quality and Health Effects Quality and Health Effects
from Housing from Housing Fitment/Decoration in ChinaFitment/Decoration in China
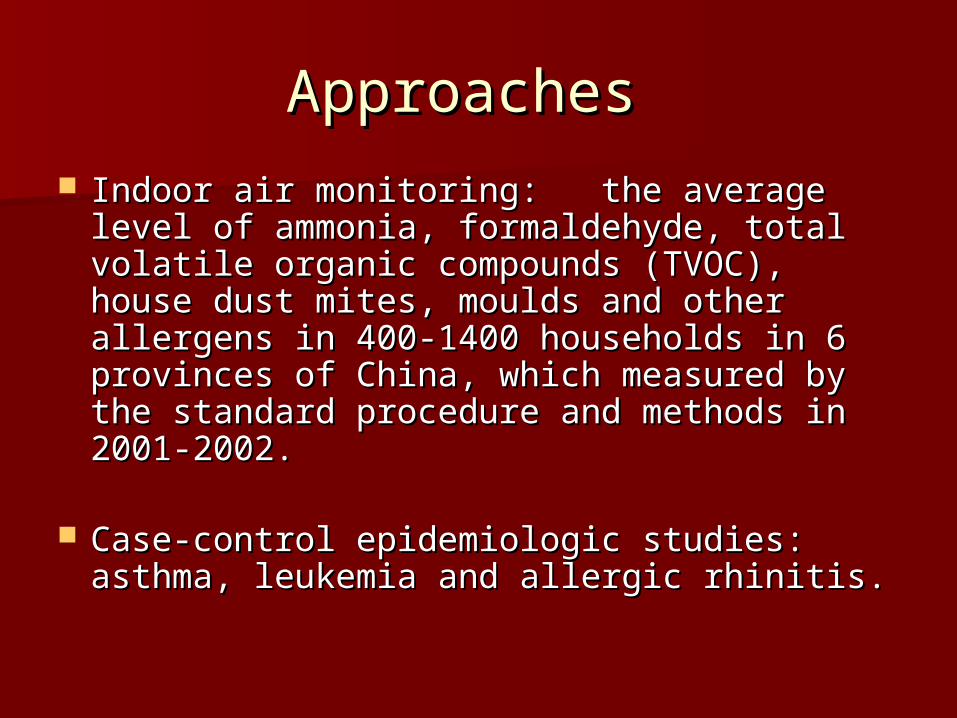
Approaches Approaches
Indoor air monitoring: the average level Indoor air monitoring: the average level of ammonia, formaldehyde, total volatile of ammonia, formaldehyde, total volatile organic compounds (TVOC), house dust organic compounds (TVOC), house dust mites, moulds and other allergens in 400-mites, moulds and other allergens in 400-1400 households in 6 provinces of China, 1400 households in 6 provinces of China, which measured by the standard which measured by the standard procedure and methods in 2001-2002. procedure and methods in 2001-2002.
Case-control epidemiologic studies: Case-control epidemiologic studies: asthma, leukemia andasthma, leukemia and allergic rhinitis.allergic rhinitis.

Results Results
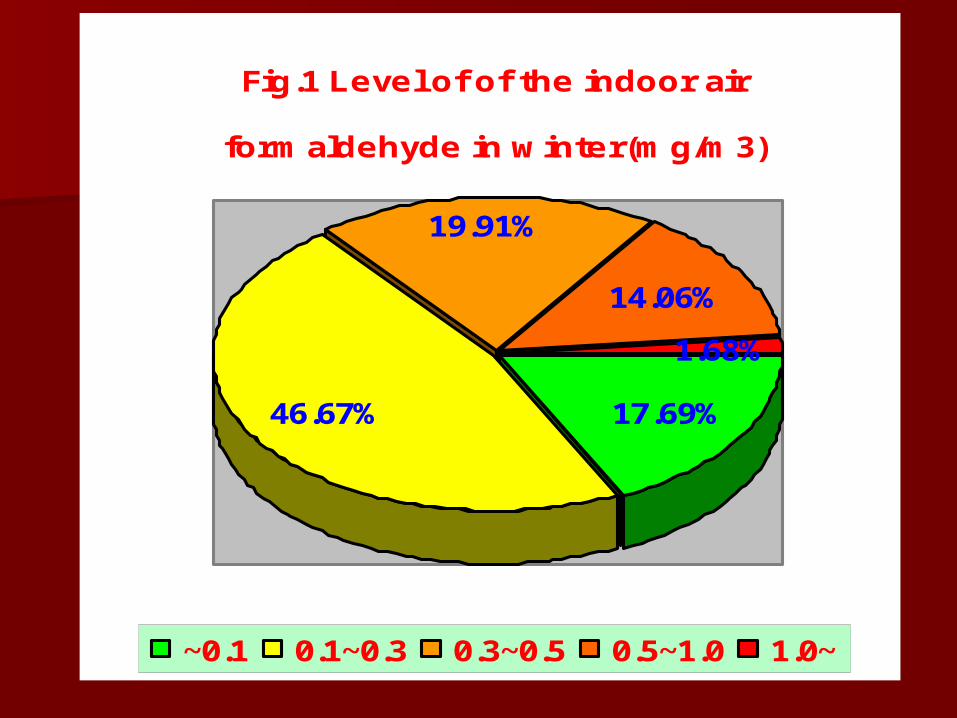
Fig.1 Level of of the indoor air
formaldehyde in winter(mg/m3)
17.69%46.67%
19.91%
14.06%
1.68%
~0.1 0.1~0.3 0.3~0.5 0.5~1.0 1.0~
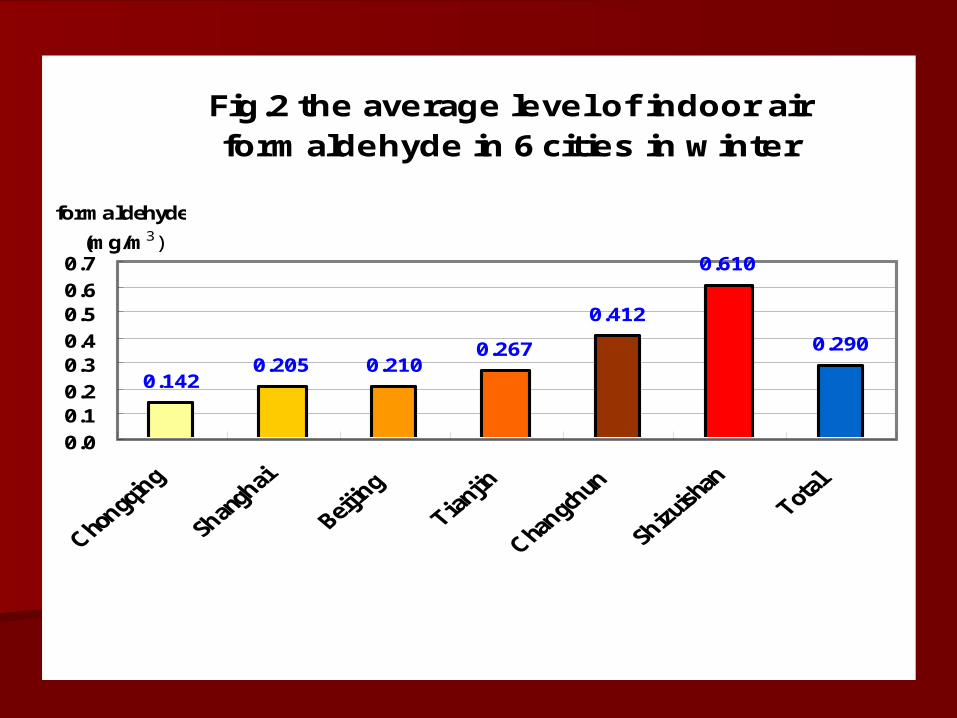
Fig.2 the average level of indoor airformaldehyde in 6 cities in winter
0.1420.205 0.210
0.267
0.412
0.610
0.290
0.0
0.10.2
0.30.4
0.50.6
0.7
formaldehyde
(mg/m3)
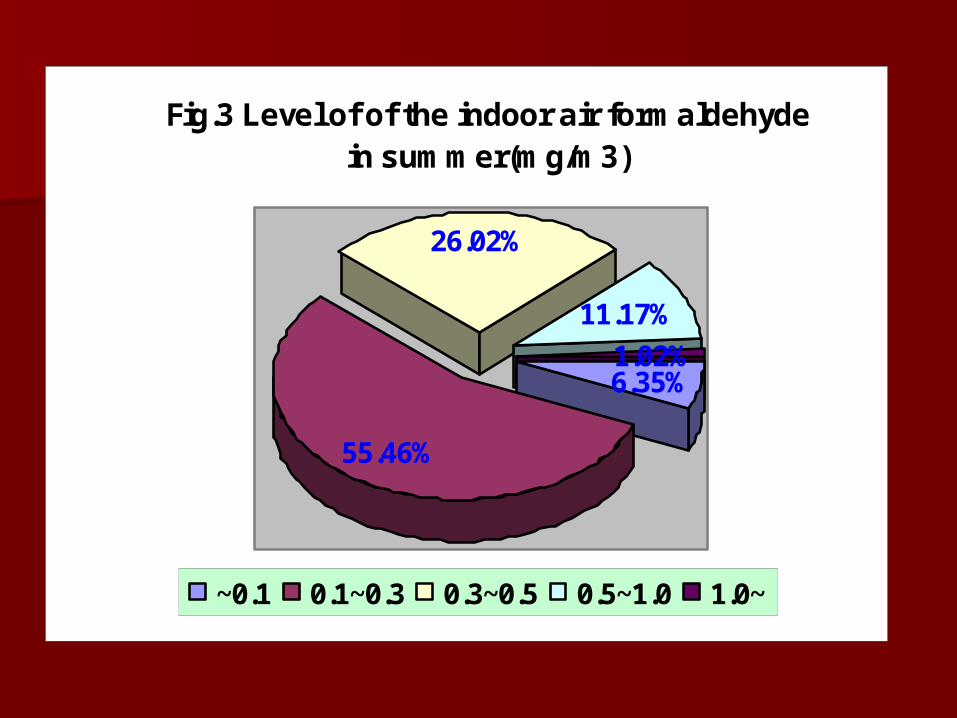
Fig.3 Level of of the indoor air formaldehydein summer(mg/m3)
6.35%
55.46%
26.02%
11.17%
1.02%
~0.1 0.1~0.3 0.3~0.5 0.5~1.0 1.0~
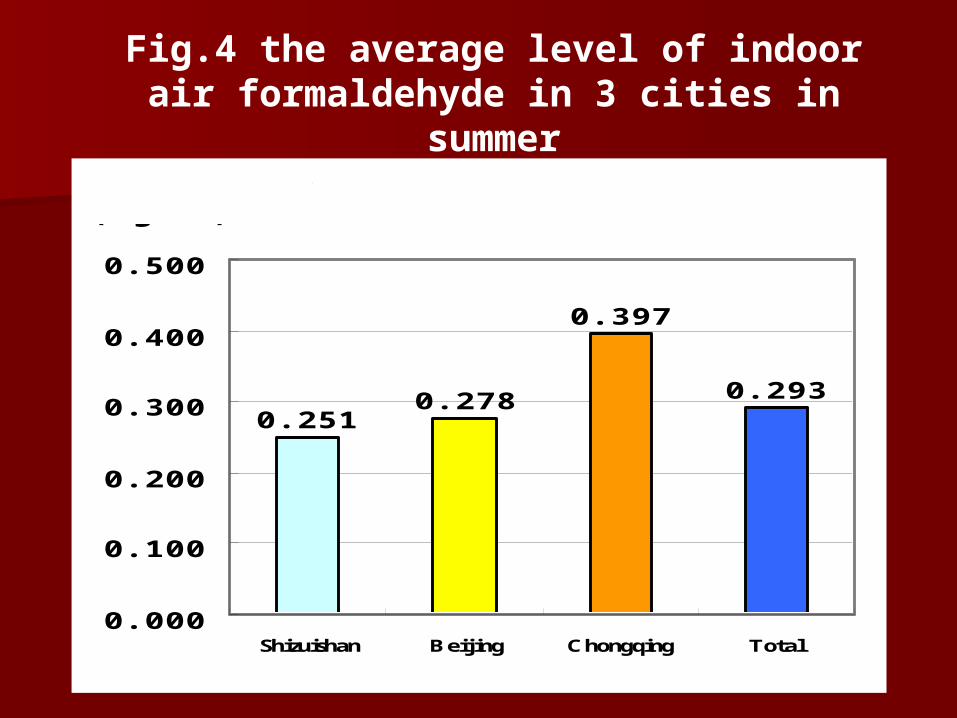
0. 2510. 278
0. 397
0. 293
0. 000
0. 100
0. 200
0. 300
0. 400
0. 500
Shizuishan Beijing Chongqing Total
formaldehyde(mg/m3)
Fig.4 the average level of indoor air formaldehyde in 3 cities in summer
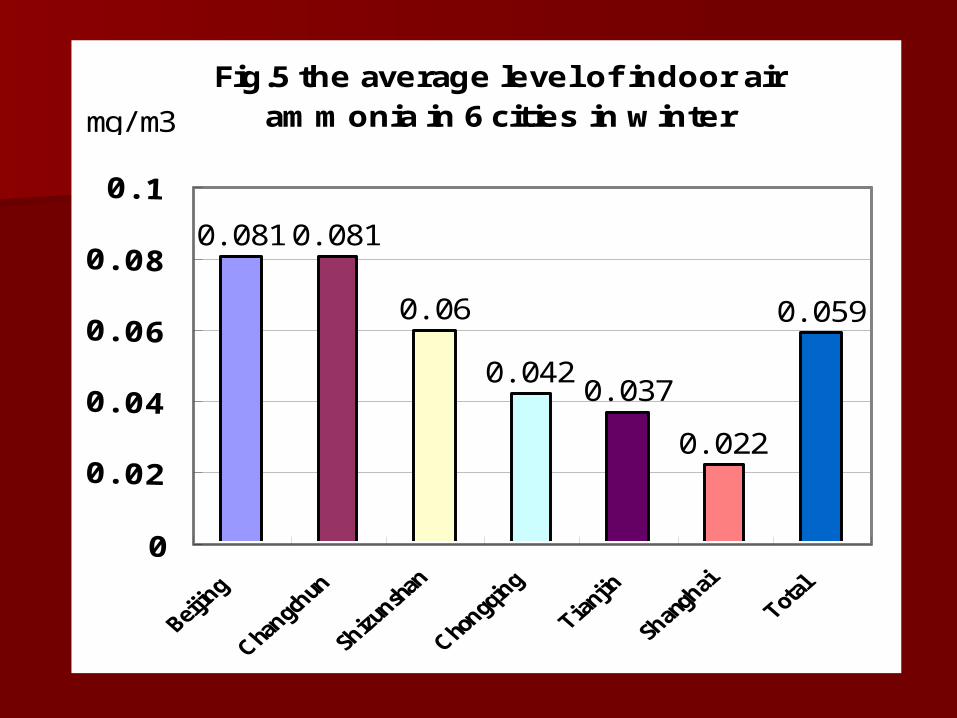
Fig.5 the average level of indoor airammonia in 6 cities in winter
0. 0810. 081
0. 06
0. 0420. 037
0. 022
0. 059
mg/ m3
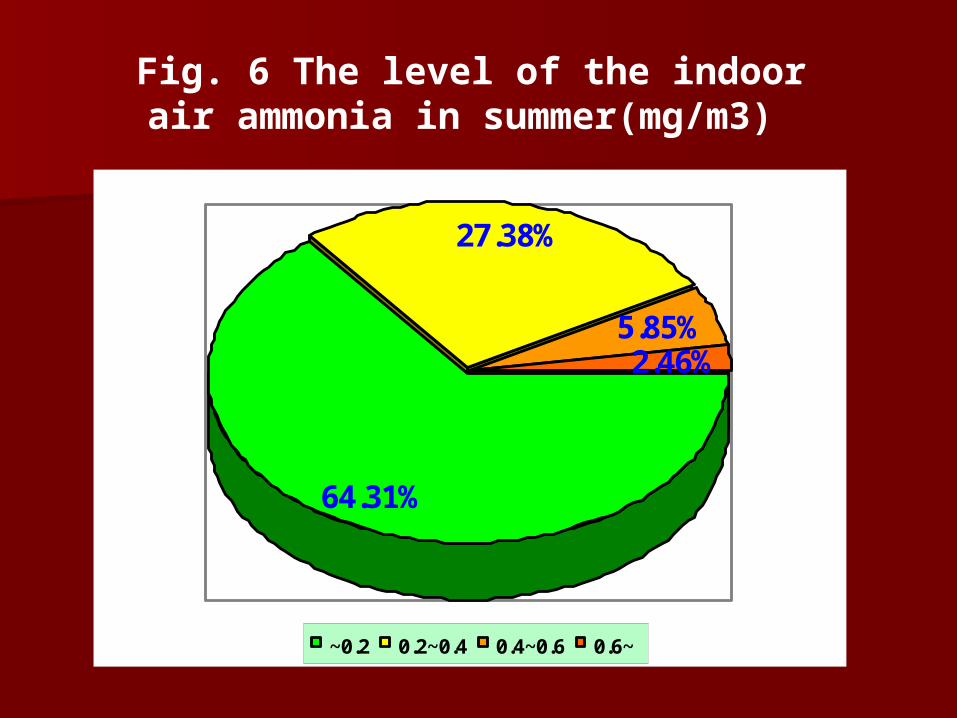
64.31%
27.38%
5.85%2.46%
~0.2 0.2~0.4 0.4~0.6 0.6~
Fig. 6 The level of the indoor air ammonia in summer(mg/m3)
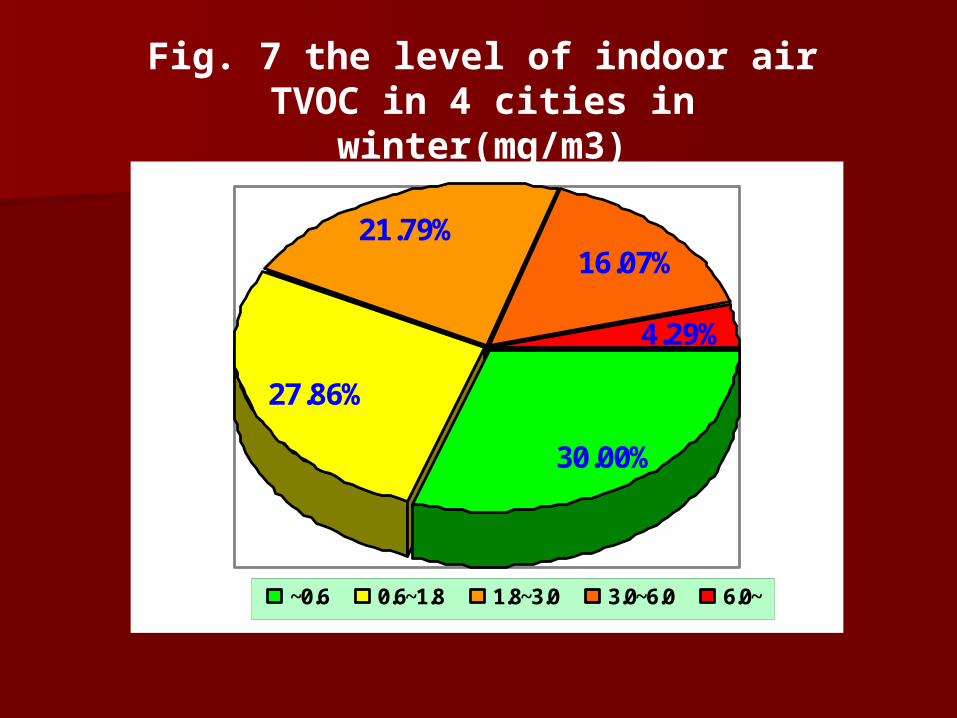
Fig. 7 the level of indoor air TVOC in 4 cities in
winter(mg/m3)
30.00%
27.86%
21.79%16.07%
4.29%
~0.6 0.6~1.8 1.8~3.0 3.0~6.0 6.0~
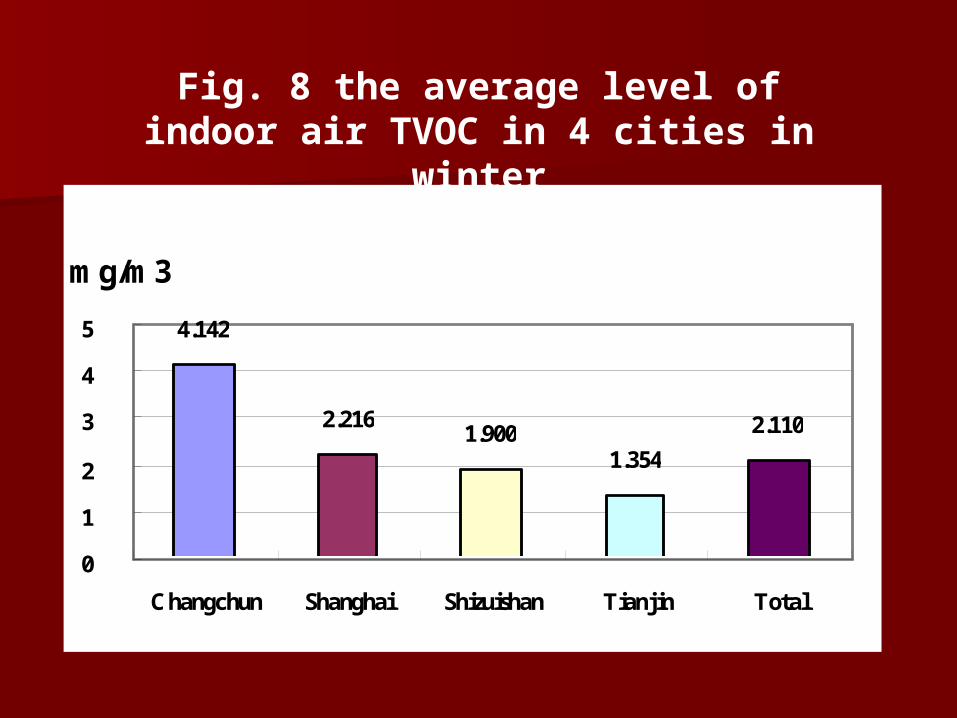
4.142
2.2161.900
1.354
2.110
0
1
2
3
4
5
Changchun Shanghai Shizuishan Tianjin Total
mg/m3
Fig. 8 the average level of indoor air TVOC in 4 cities in winter
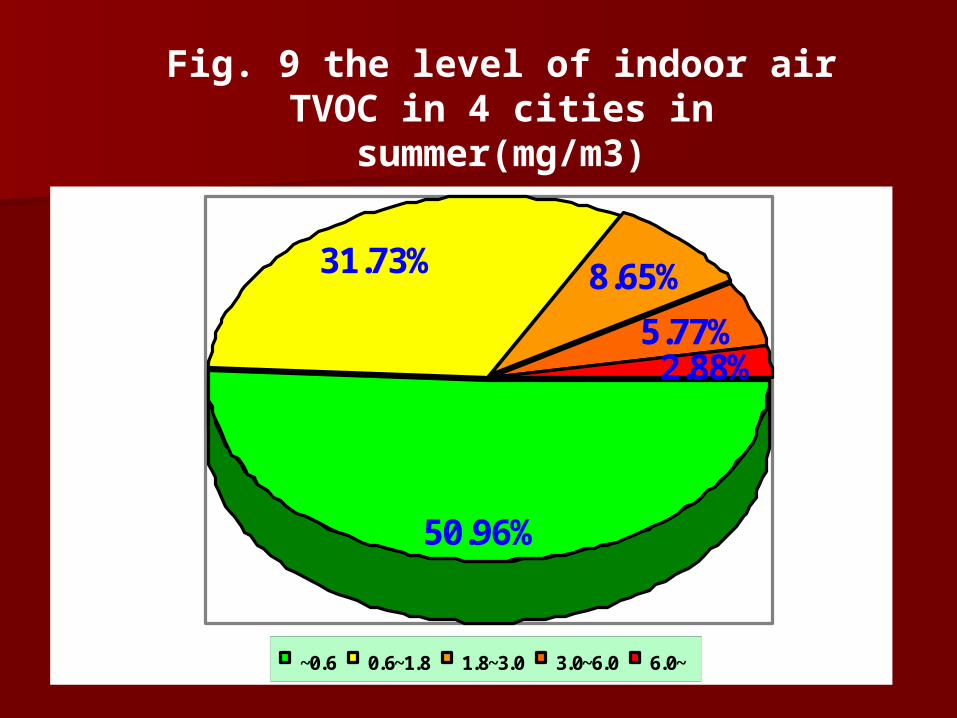
50.96%
31.73% 8.65%
5.77%2.88%
~0.6 0.6~1.8 1.8~3.0 3.0~6.0 6.0~
Fig. 9 the level of indoor air TVOC in 4 cities in summer(mg/m3)
0
0.1
0.2
0.3
0.4
0.5
mg/m3
summer wi nter
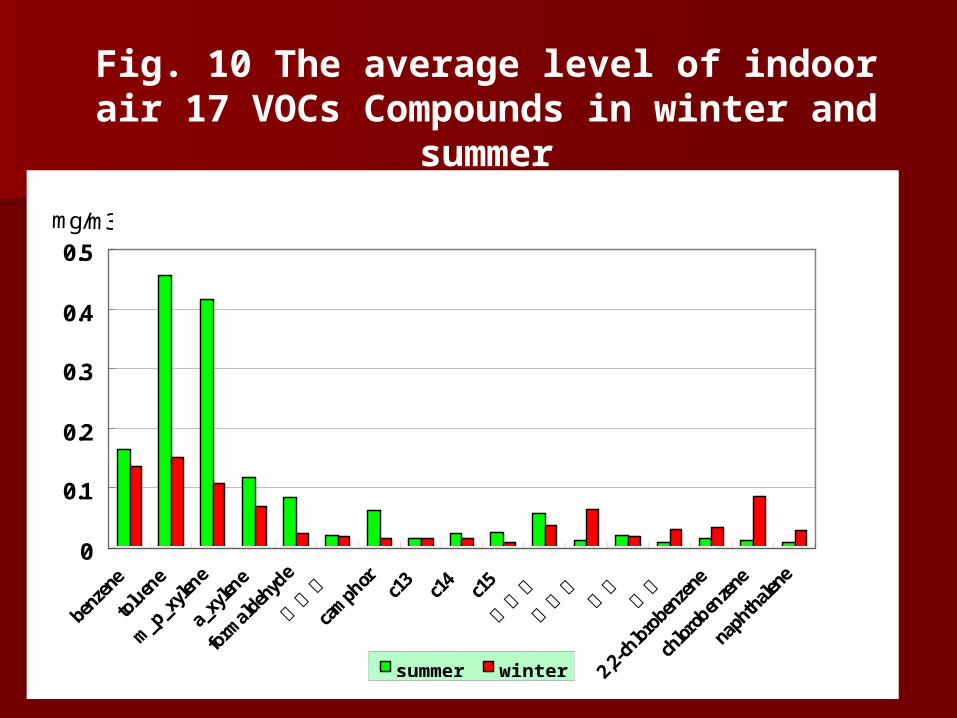
Fig. 10 The average level of indoor air 17 VOCs Compounds in winter and
summer
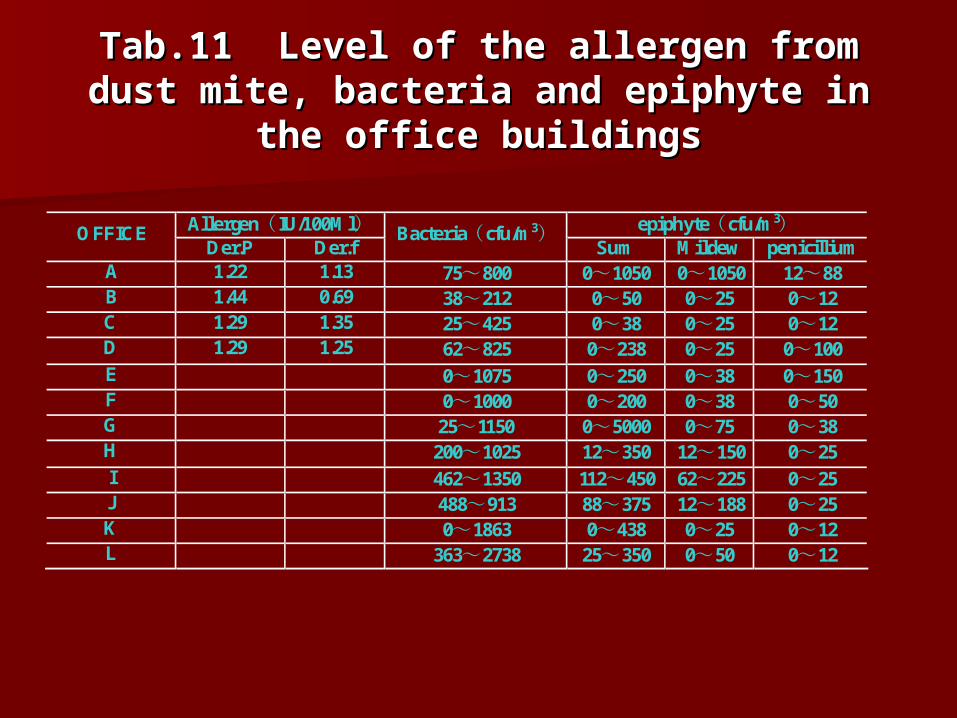
Tab.11 Level of the allergen from dust mite, Tab.11 Level of the allergen from dust mite, bacteria and epiphyte in the office buildingsbacteria and epiphyte in the office buildings
Allergen(IU/100Ml) epiphyte(cfu/m3) OFFICE Der.P Der.f
Bacteria(cfu/m3) Sum Mildew penicillium
A 1.22 1.13 75~800 0~1050 0~1050 12~88 B 1.44 0.69 38~212 0~50 0~25 0~12 C 1.29 1.35 25~425 0~38 0~25 0~12 D 1.29 1.25 62~825 0~238 0~25 0~100 E 0~1075 0~250 0~38 0~150 F 0~1000 0~200 0~38 0~50 G 25~1150 0~5000 0~75 0~38 H 200~1025 12~350 12~150 0~25 I 462~1350 112~450 62~225 0~25 J 488~913 88~375 12~188 0~25 K 0~1863 0~438 0~25 0~12 L 363~2738 25~350 0~50 0~12

epidemiological studyepidemiological study
Indoor environmental risk factors Indoor environmental risk factors for allergic asthma in adults for allergic asthma in adults
— a case-control study— a case-control study
Yue Wei, Pan Xiao-chuan et al.Yue Wei, Pan Xiao-chuan et al.Peking University School of Public healtPeking University School of Public healt
hh
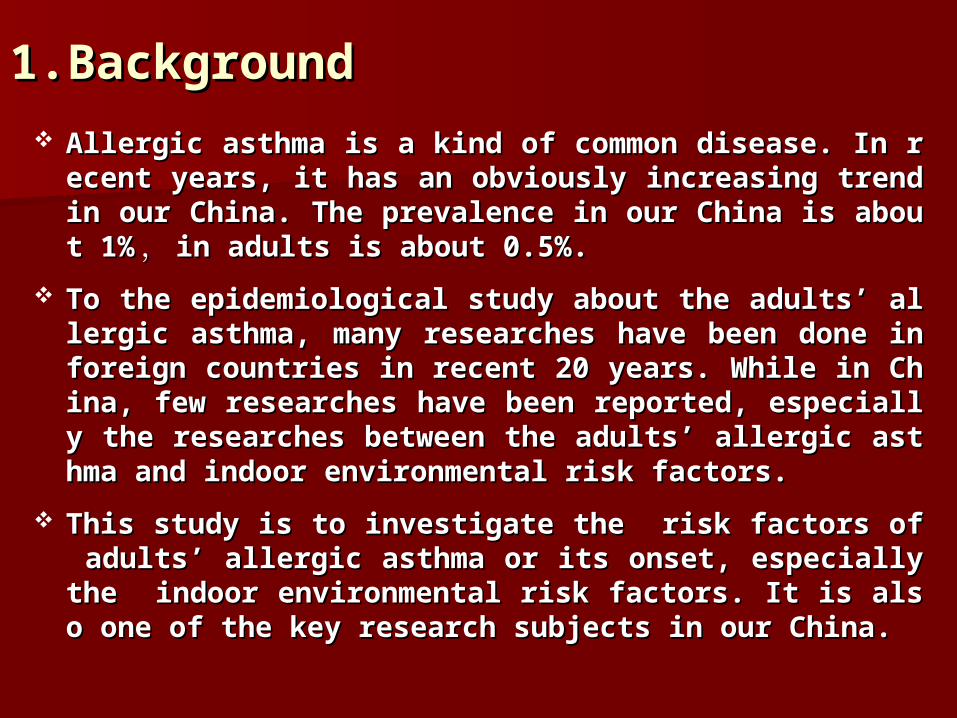
1.Background1.Background
Allergic asthma is a kind of common disease. In recent yeAllergic asthma is a kind of common disease. In recent years, it has an obviously increasing trend in our China. The ars, it has an obviously increasing trend in our China. The prevalence in our China is about 1%prevalence in our China is about 1% ,, in adults is about 0.in adults is about 0.5%.5%.
To the epidemiological study about the adults’ allergic astTo the epidemiological study about the adults’ allergic asthma, many researches have been done in foreign countriehma, many researches have been done in foreign countries in recent 20 years. While in China, few researches have s in recent 20 years. While in China, few researches have been reported, especially the researches between the adulbeen reported, especially the researches between the adults’ allergic asthma and indoor environmental risk factors.ts’ allergic asthma and indoor environmental risk factors.
This study is to investigate the risk factors of adults’ alleThis study is to investigate the risk factors of adults’ allergic asthma or its onset, especially the indoor environmergic asthma or its onset, especially the indoor environmental risk factors. It is also one of the key research subjects ntal risk factors. It is also one of the key research subjects in our China.in our China.
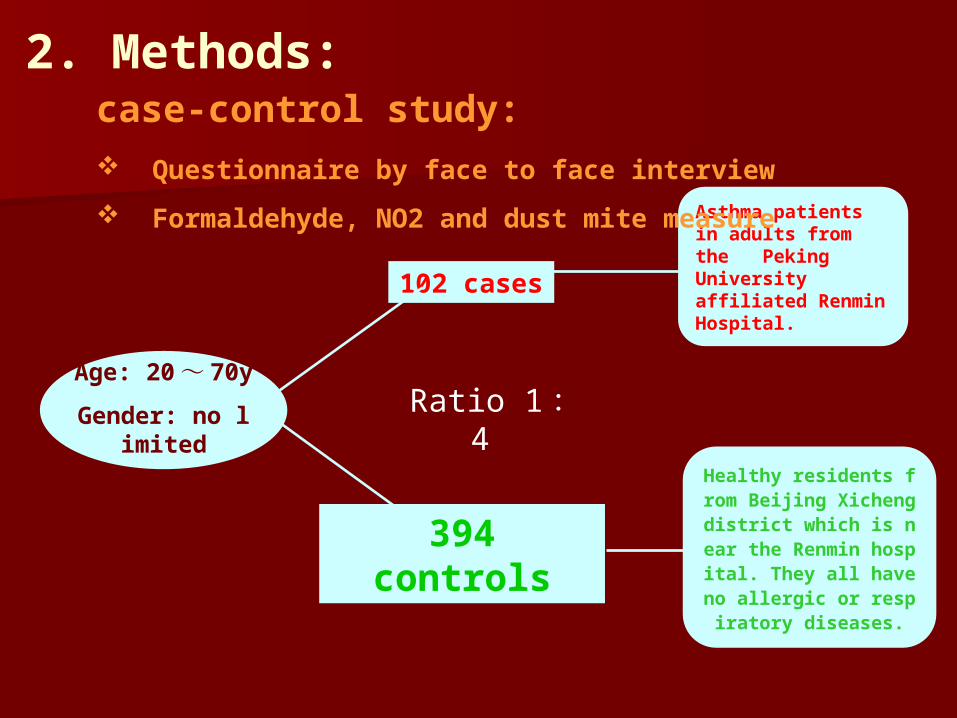
2. Methods:
102 cases
394 controls
Asthma patients in adults from the Peking University affiliated Renmin Hospital.
Age: 20~ 70y
Gender: no limited
Healthy residents from Beijing Xicheng district which is near the Renmin hospital. They all have no allergic or respirator
y diseases.
Ratio 1 : 4
case-control study:
Questionnaire by face to face interview
Formaldehyde, NO2 and dust mite measure
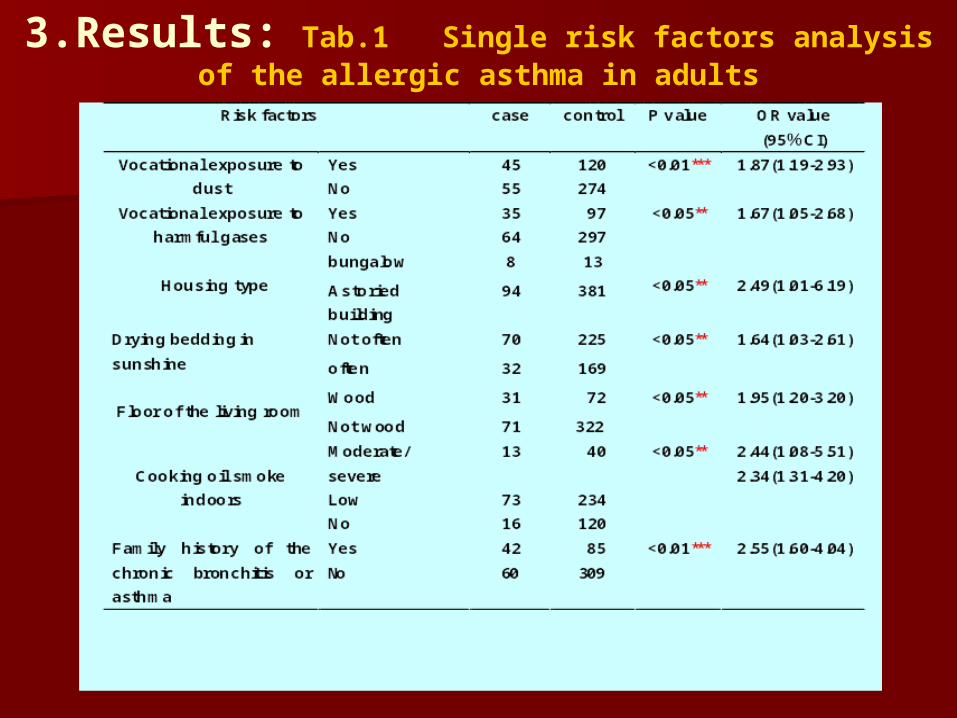
3.Results: Tab.1 Single risk factors analysis of the allergic asthma in adults
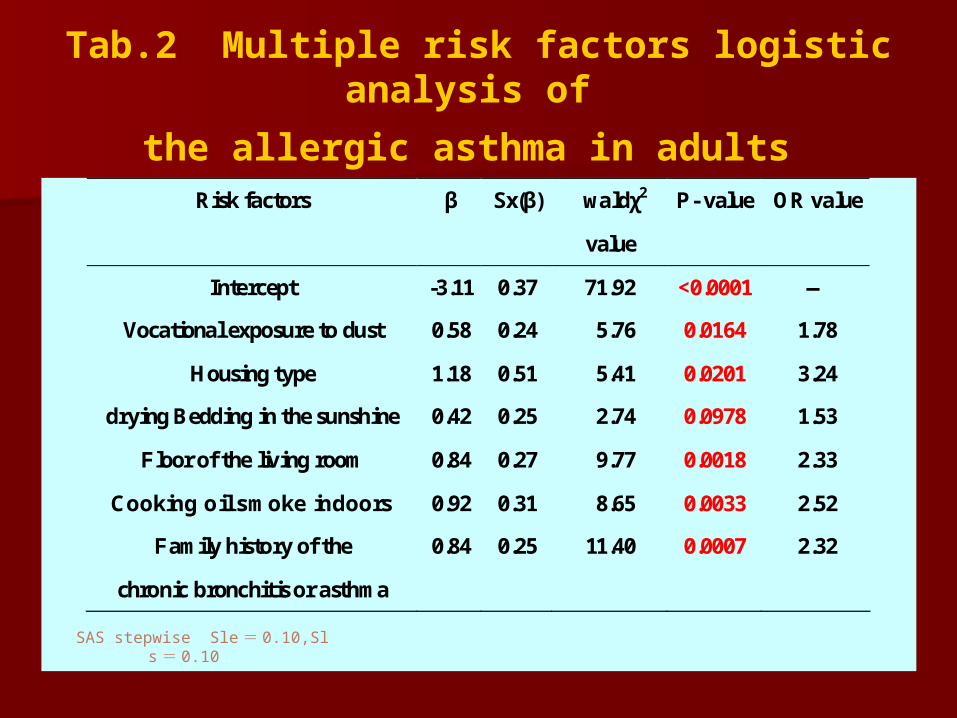
Tab.2 Multiple risk factors logistic analysis of
the allergic asthma in adults
Risk factors β Sx(β) waldχ2
value
P- value OR value
Intercept -3.11 0.37 71.92 <0.0001 —
Vocational exposure to dust 0.58 0.24 5.76 0.0164 1.78
Housing type 1.18 0.51 5.41 0.0201 3.24
drying Bedding in the sunshine 0.42 0.25 2.74 0.0978 1.53
Floor of the living room 0.84 0.27 9.77 0.0018 2.33
Cooking oil smoke indoors 0.92 0.31 8.65 0.0033 2.52
Family history of the
chronic bronchitis or asthma
0.84 0.25 11.40 0.0007 2.32
SAS stepwise Sle = 0.10,Sls = 0.10.
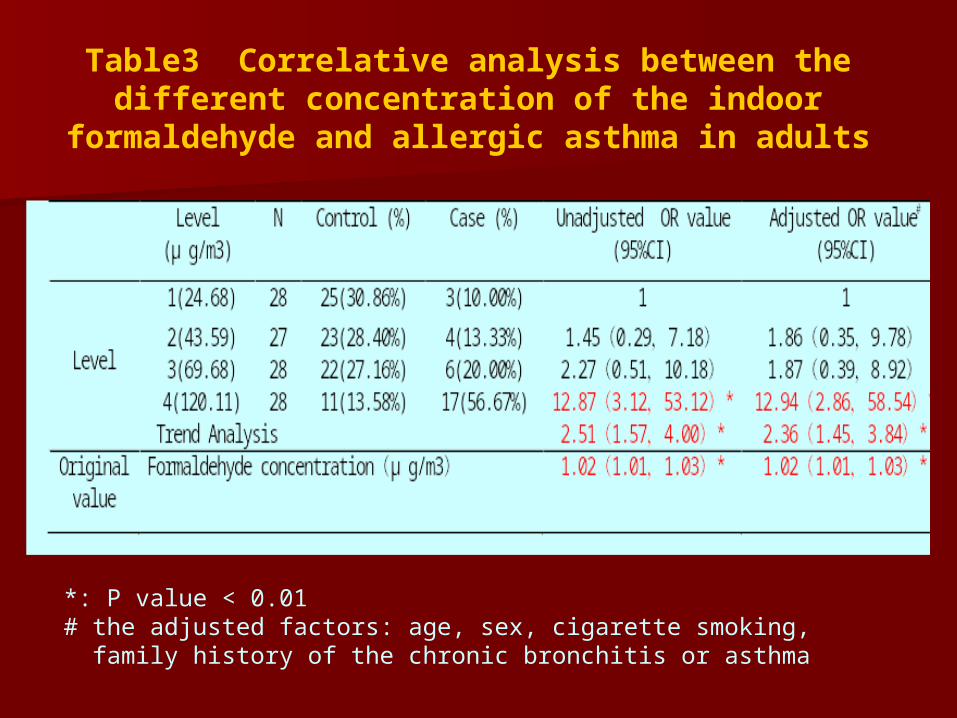
Table3 Correlative analysis between the different concentration of the indoor
formaldehyde and allergic asthma in adults
*: P value < 0.01# the adjusted factors: age, sex, cigarette smoking, family history of the chronic bronchitis or asthma
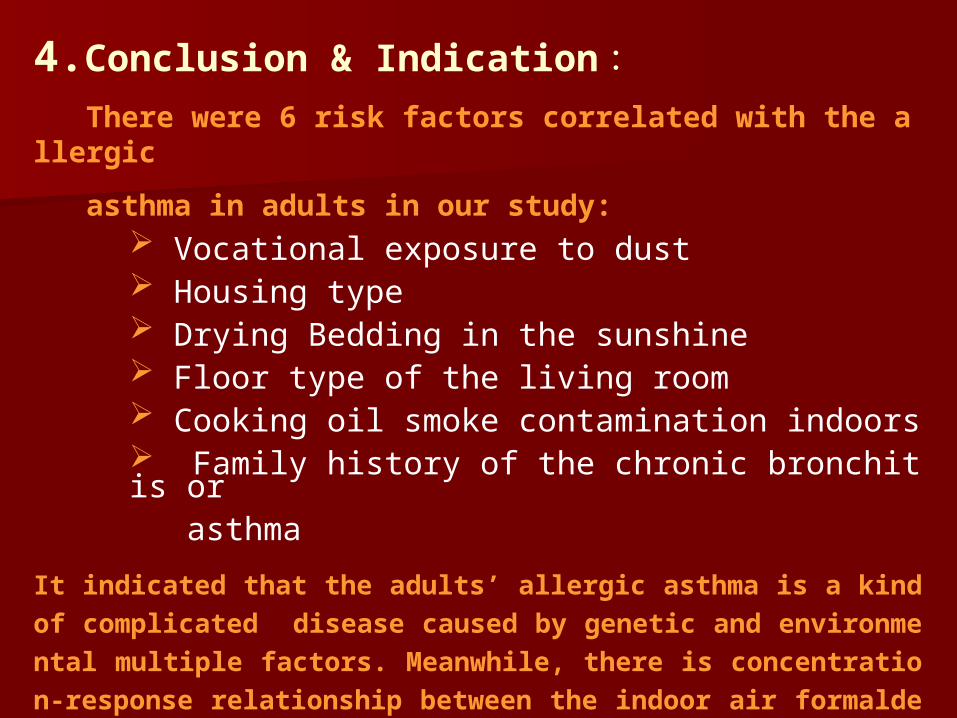
4.Conclusion & Indication : There were 6 risk factors correlated with the allergic
asthma in adults in our study: Vocational exposure to dust Housing type Drying Bedding in the sunshine Floor type of the living room Cooking oil smoke contamination indoors Family history of the chronic bronchitis or asthma
It indicated that the adults’ allergic asthma is a kind of complicated disease caused by genetic and environmental multiple factors. Meanwhile, there is concentration-response relationship between the indoor air formaldehyde level and the adults’ allergic asthma.

A A case-control study of the risk case-control study of the risk factors for adult leukemiafactors for adult leukemia
DING Wen-qing, BAO li , HUANG xiao-jun, PAN XiaDING Wen-qing, BAO li , HUANG xiao-jun, PAN Xiao-chuan.o-chuan.
Peaking University School of Public Health and Peaking University School of Public Health and Second Hospital Second Hospital
IntroductionIntroduction
With the increasing of the living standards of With the increasing of the living standards of the residents, the problems caused by the the residents, the problems caused by the indoor air pollution have been the hotspot in indoor air pollution have been the hotspot in China recently. In recent years, the incidence China recently. In recent years, the incidence of leukemia has the increasing tendency , of leukemia has the increasing tendency , some reports says it is probably related with some reports says it is probably related with the indoor decoration of the house. The the indoor decoration of the house. The purpose of this study was to ascertain purpose of this study was to ascertain primarily the relationship between the indoor primarily the relationship between the indoor decoration and other suspicious risk factors decoration and other suspicious risk factors related with adult leukemia.related with adult leukemia.
MethodsMethods A total of 127 cases (age 15-75 years old) A total of 127 cases (age 15-75 years old) of Adult leukemia survivors were of Adult leukemia survivors were interviewed with health questionnaire by interviewed with health questionnaire by face to face,which included general face to face,which included general conditions, living environment, harmful conditions, living environment, harmful materials contact, living style, disease and materials contact, living style, disease and family history ,etc. The conditional Logistic family history ,etc. The conditional Logistic regression model in univariate and regression model in univariate and multivariate analysis were used to seek multivariate analysis were used to seek the key risk factors, specially for adult the key risk factors, specially for adult leukemia.leukemia.

ResultResult In the single factor In the single factor
analysis,14 of 98 indexes analysis,14 of 98 indexes were obviously were obviously
significant<0.05)significant<0.05)
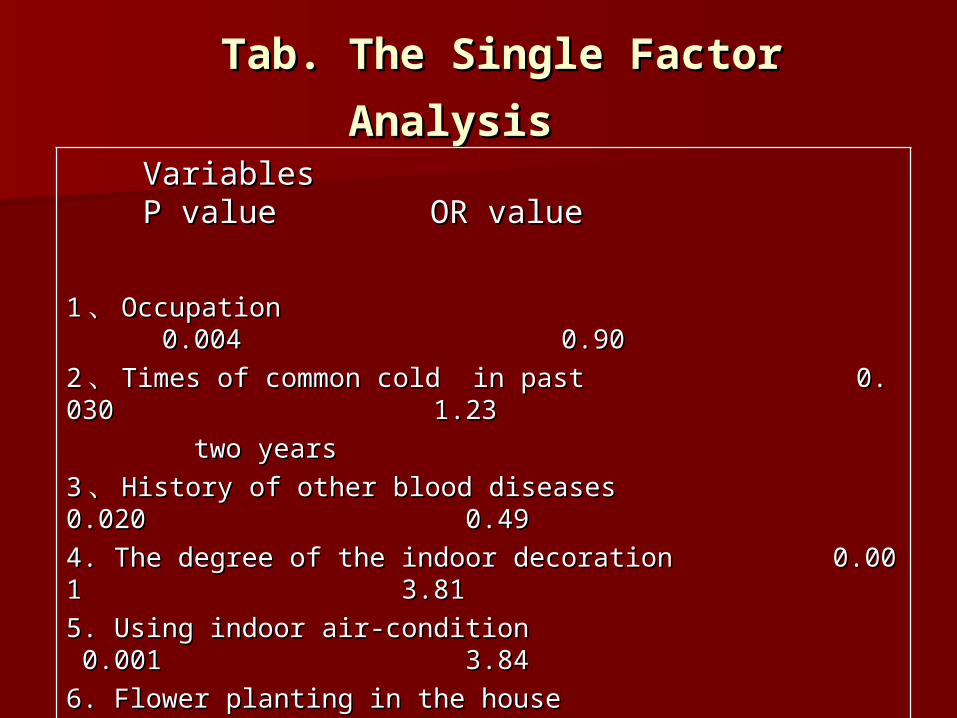
Tab. The Single Factor AnalysisTab. The Single Factor Analysis Variables P value OR value Variables P value OR value 11 、、 Occupation 0.004 0.90Occupation 0.004 0.9022 、、 Times of common cold in past 0.030 1.23Times of common cold in past 0.030 1.23 two years two years 33 、、 History of other blood diseases 0.020 0.49History of other blood diseases 0.020 0.494. The degree of the indoor decoration 0.001 3.81 4. The degree of the indoor decoration 0.001 3.81 5. Using indoor air-condition 0.001 3.845. Using indoor air-condition 0.001 3.846. Flower planting in the house 0.009 3.406. Flower planting in the house 0.009 3.407. Frequently using pesticides 0.018 12.567. Frequently using pesticides 0.018 12.56
for flower at homefor flower at home
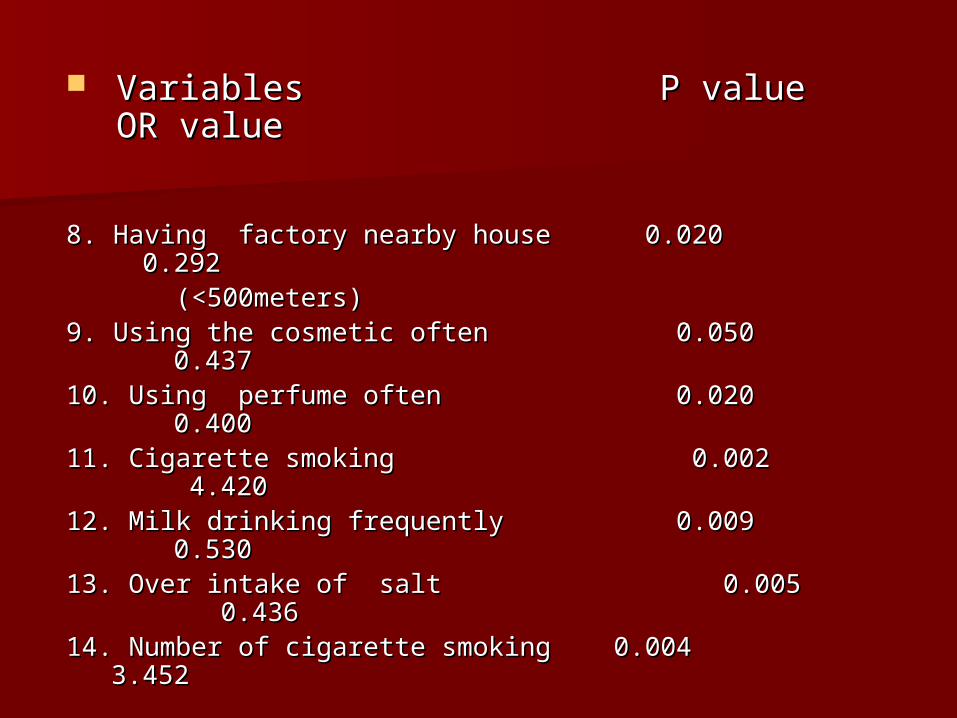
Variables P value OR valueVariables P value OR value
8. Having factory nearby house 0.020 0.2928. Having factory nearby house 0.020 0.292 (<500meters) (<500meters) 9. Using the cosmetic often 0.050 0.4379. Using the cosmetic often 0.050 0.43710. Using perfume often 0.020 0.40010. Using perfume often 0.020 0.40011. Cigarette smoking 0.002 4.42011. Cigarette smoking 0.002 4.42012. Milk drinking frequently 0.009 0.53012. Milk drinking frequently 0.009 0.53013. Over intake of salt 0.005 0.43613. Over intake of salt 0.005 0.43614. Number of cigarette smoking 0.004 3.45214. Number of cigarette smoking 0.004 3.452
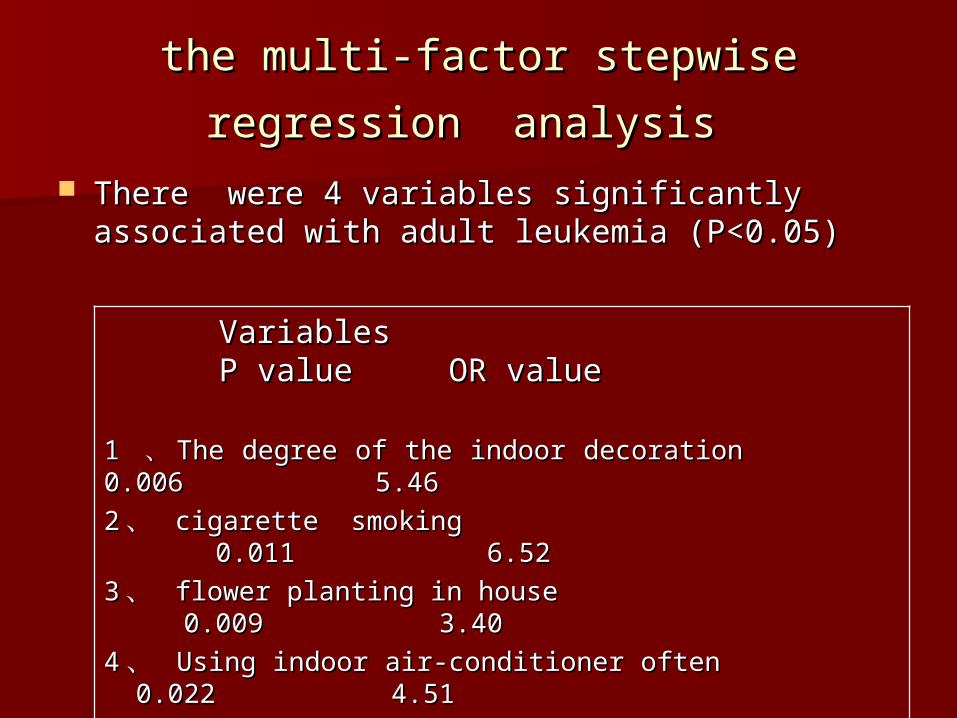
the multi-factor stepwise regression the multi-factor stepwise regression
analysisanalysis There were 4 variables significantly associated There were 4 variables significantly associated
with adult leukemia (P<0.05)with adult leukemia (P<0.05)
Variables P value OR valueVariables P value OR value
1 1 、、 The degree of the indoor decoration 0.006 5.46The degree of the indoor decoration 0.006 5.4622 、 、 cigarette smoking 0.011 6.52cigarette smoking 0.011 6.5233 、 、 flower planting in house 0.009 3.40flower planting in house 0.009 3.4044 、 、 Using indoor air-conditioner often 0.022 4.51Using indoor air-conditioner often 0.022 4.51

ConclusionConclusion
It is suggested that the degree of It is suggested that the degree of the indoor decoration might be the indoor decoration might be one of risk factors for adult one of risk factors for adult leukemia.leukemia.
The Correlative relations The Correlative relations between Indoor Air pollution between Indoor Air pollution
and allergic rhinitisand allergic rhinitis
--a pilot case-control study--a pilot case-control study
Liu Ying, Pan Xiao-chuan et al.
Peking University School of public health

MethodsMethods
we chose 95 patients and 45 controls to we chose 95 patients and 45 controls to perform case-control study. Patients were perform case-control study. Patients were selected from Peking University affiliated selected from Peking University affiliated hospitals, where they had been diagnosed hospitals, where they had been diagnosed as allergic rhinitis. Controls are patients as allergic rhinitis. Controls are patients from the same hospital but not suffer from from the same hospital but not suffer from allergic rhinitis. Block-paired design of allergic rhinitis. Block-paired design of Logistic regression was utilized to conduct Logistic regression was utilized to conduct multi-factor analysis. We use SPSS 11.0 to multi-factor analysis. We use SPSS 11.0 to do the statistics. do the statistics.

resultsresults
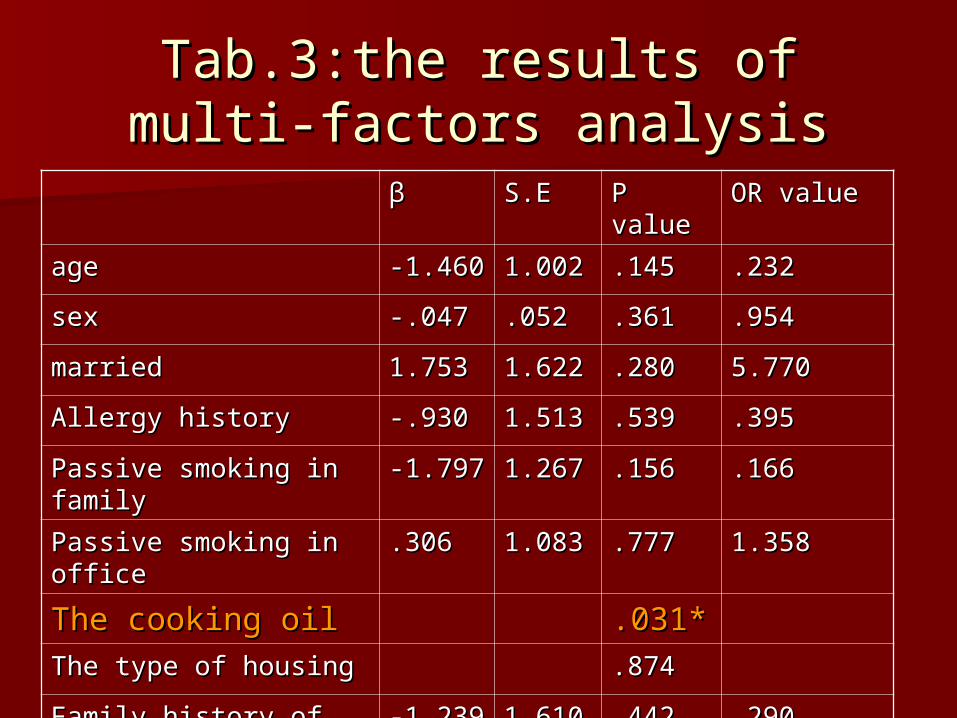
Tab.3:the results of multi-Tab.3:the results of multi-factors analysisfactors analysis
ββ S.ES.E P valueP value OR valueOR value
ageage -1.460-1.460 1.0021.002 .145.145 .232.232
sexsex -.047-.047 .052.052 .361.361 .954.954
marriedmarried 1.7531.753 1.6221.622 .280.280 5.7705.770
Allergy historyAllergy history -.930-.930 1.5131.513 .539.539 .395.395
Passive smoking in Passive smoking in familyfamily
-1.797-1.797 1.2671.267 .156.156 .166.166
Passive smoking in Passive smoking in officeoffice
.306.306 1.0831.083 .777.777 1.3581.358
The cooking oilThe cooking oil .031*.031*The type of housingThe type of housing .874.874
Family history of Family history of allergyallergy
-1.239-1.239 1.6101.610 .442.442 .290.290
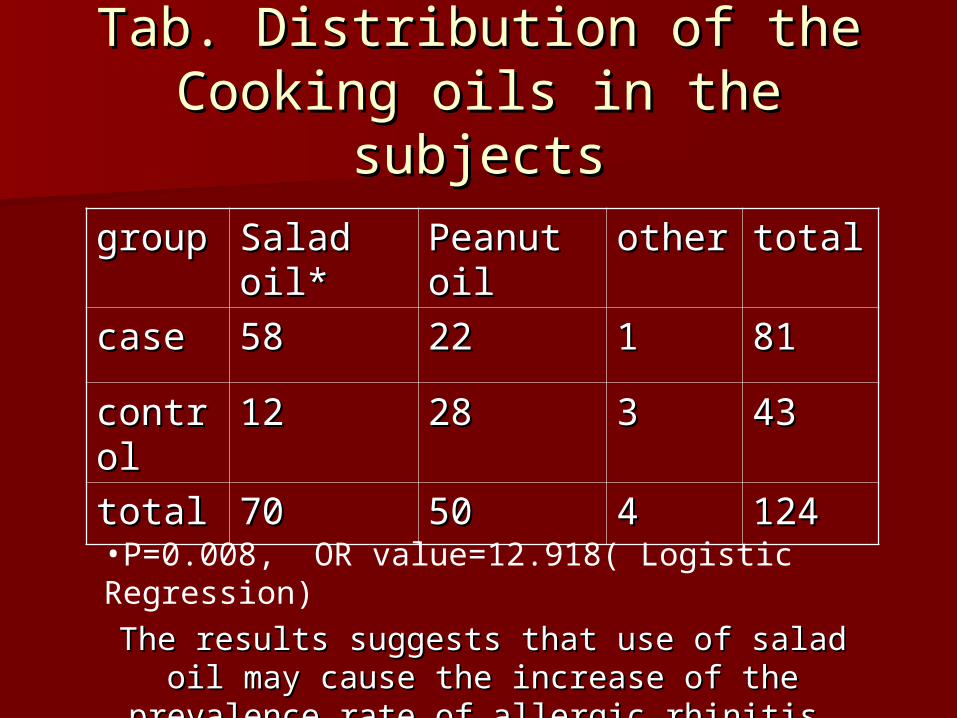
Tab. Distribution of the Tab. Distribution of the Cooking oils in the subjectsCooking oils in the subjects
groupgroup Salad Salad oil*oil*
Peanut Peanut oiloil
otherother totaltotal
casecase 5858 2222 11 8181
controcontroll
1212 2828 33 4343
totaltotal 7070 5050 44 124124
•P=0.008, OR value=12.918( Logistic Regression)
The results suggests that use of salad oil may The results suggests that use of salad oil may cause the increase of the prevalence rate of cause the increase of the prevalence rate of
allergic rhinitis.allergic rhinitis.
The Indoor Air Quality and The Indoor Air Quality and Health Effects from Fuel Health Effects from Fuel
Combustion in ChinaCombustion in China
1999-2004
INDOOR AIR POLLUTION AND INDOOR AIR POLLUTION AND RESPIRATORY HEALTH OF THE RESPIRATORY HEALTH OF THE
PEOPLES IN BEIJING:PEOPLES IN BEIJING: A COMMUNITY-BASED STUDYA COMMUNITY-BASED STUDY
Dept. of Occupational and Environmental Dept. of Occupational and Environmental Health, Peking University School of Public Health, Peking University School of Public
Health, Health,
Beijing 100083, P.R. ChinaBeijing 100083, P.R. China
Xiao-chuan Pan, et.al.Xiao-chuan Pan, et.al.
INTRODUCTIONINTRODUCTION In recent years the housing of Beijing In recent years the housing of Beijing
peoples have been improved peoples have been improved enormously with the fast development enormously with the fast development of the economy as well as living level. A of the economy as well as living level. A lot of the new fitments, soft furnishings, lot of the new fitments, soft furnishings, fitted carpets and mechanical air fitted carpets and mechanical air ventilation systems are now introduced ventilation systems are now introduced into more and more households in into more and more households in Beijing, especially in urban areas.Beijing, especially in urban areas.
How about indoor air quality caused by How about indoor air quality caused by them?them?
METHODSMETHODS Participants:Participants: About 270 households, living in 3 comm About 270 households, living in 3 comm
unities of urban area were selected randomly for indounities of urban area were selected randomly for indoor air monitoring, about 3000 individuals aged from 1or air monitoring, about 3000 individuals aged from 18 – 65 yr. from the study households and their neighbo8 – 65 yr. from the study households and their neighbors were interviewed by questionnaire for their respiratrs were interviewed by questionnaire for their respiratory health. ory health.
The mass concentration of particles smaller than 10The mass concentration of particles smaller than 10μμm/2.5m/2.5μμm in diameterm in diameter (( PMPM1010/PM/PM2.52.5 )) and sulphur dioxand sulphur dioxide (SOide (SO22) was measured in the bedroom and kitchen of ) was measured in the bedroom and kitchen of the study households in real time twice a day for two the study households in real time twice a day for two weeks, respectively in winter and summer. weeks, respectively in winter and summer.
METHODS 2METHODS 2 Health:Health: The health questionnaire was The health questionnaire was
based on that of the British Medical based on that of the British Medical Respiratory Committee and revised Respiratory Committee and revised according to the different status in Beijing. according to the different status in Beijing. It consisted of age, gender, education, It consisted of age, gender, education, occupation, and general health status, occupation, and general health status, living habits, exposure to indoor living habits, exposure to indoor microenvironment factors, cooking, and microenvironment factors, cooking, and smoking, respiratory symptoms and other smoking, respiratory symptoms and other daily activities. The trained students of a daily activities. The trained students of a medical college conducted the health medical college conducted the health survey with the questionnaire by face-to-survey with the questionnaire by face-to-face interview. face interview.
METHODS 3METHODS 3 Determination and Data analysis: Determination and Data analysis: The The
determination of levels of PMdetermination of levels of PM1010, PM, PM2.52.5 and SO and SO22 was taken with standardized procedures.was taken with standardized procedures. The The t-test t-test and and X-square testX-square test were used for were used for estimates of variances of the pollutants level. estimates of variances of the pollutants level. Effect size of various factors for respiratory Effect size of various factors for respiratory symptoms and lung function were estimated symptoms and lung function were estimated with two models. First, is a linear model with with two models. First, is a linear model with an ordinary least-squares regression of an ordinary least-squares regression of symptoms rates. We accounted for clustering symptoms rates. We accounted for clustering of observations in units of Household. Second, of observations in units of Household. Second, we used a logistic probability model y=we used a logistic probability model y=F F ((XX×β×β++uu): ): yy, , XX, and, andββare defined as in the linear are defined as in the linear model; model; FF=cumulative logistic distribution, =cumulative logistic distribution, FF ((zz)=exp ()=exp (zz) divided by [1+exp () divided by [1+exp (zz)]. )].

RESULTSRESULTS
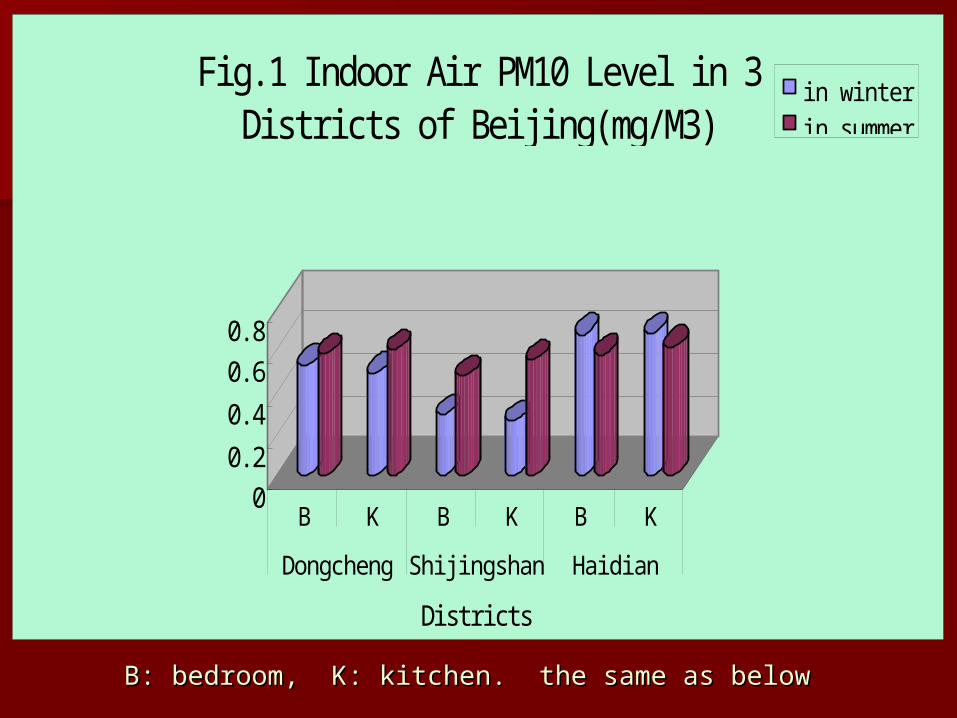
B: bedroom, K: kitchen. the same as belowB: bedroom, K: kitchen. the same as below
00. 2
0. 4
0. 60. 8
B K B K B K
Dongcheng Shi j i ngshan Hai di an
Di stri cts
Fi g. 1 I ndoor Ai r PM10 Level i n 3Di stri cts of Bei j i ng(mg/ M3)
i n wi nteri n summer
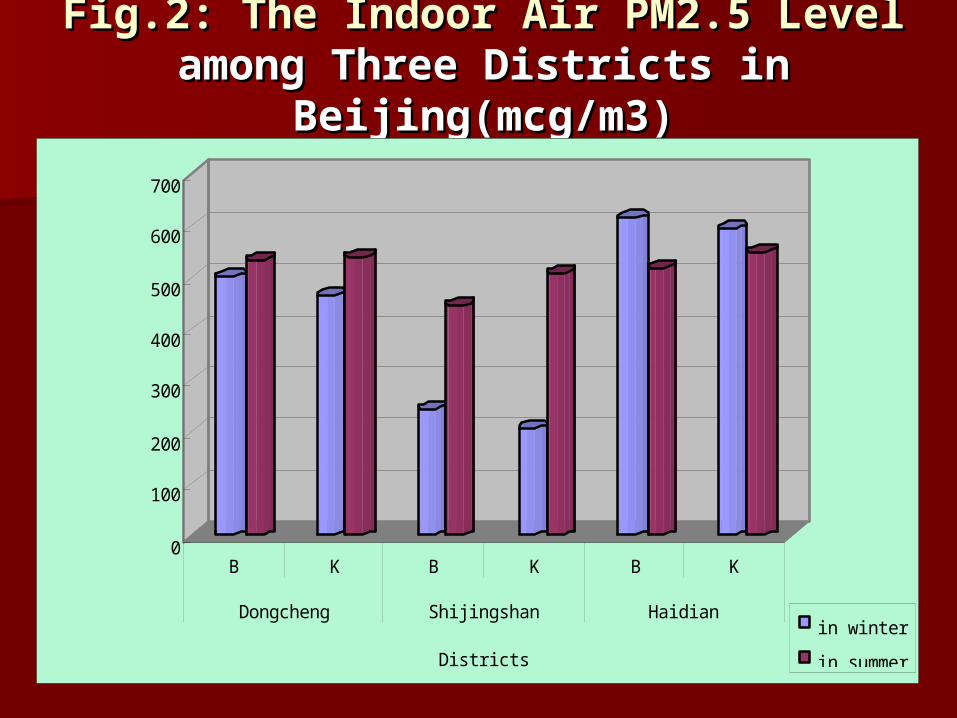
Fig.2: The Indoor Air PM2.5 Level Fig.2: The Indoor Air PM2.5 Level among Three Districts in among Three Districts in
Beijing(mcg/m3)Beijing(mcg/m3)
0
100
200
300
400
500
600
700
B K B K B K
Dongcheng Shi j i ngshan Hai di an
Di st r i ct s
i n wi nt er
i n summer
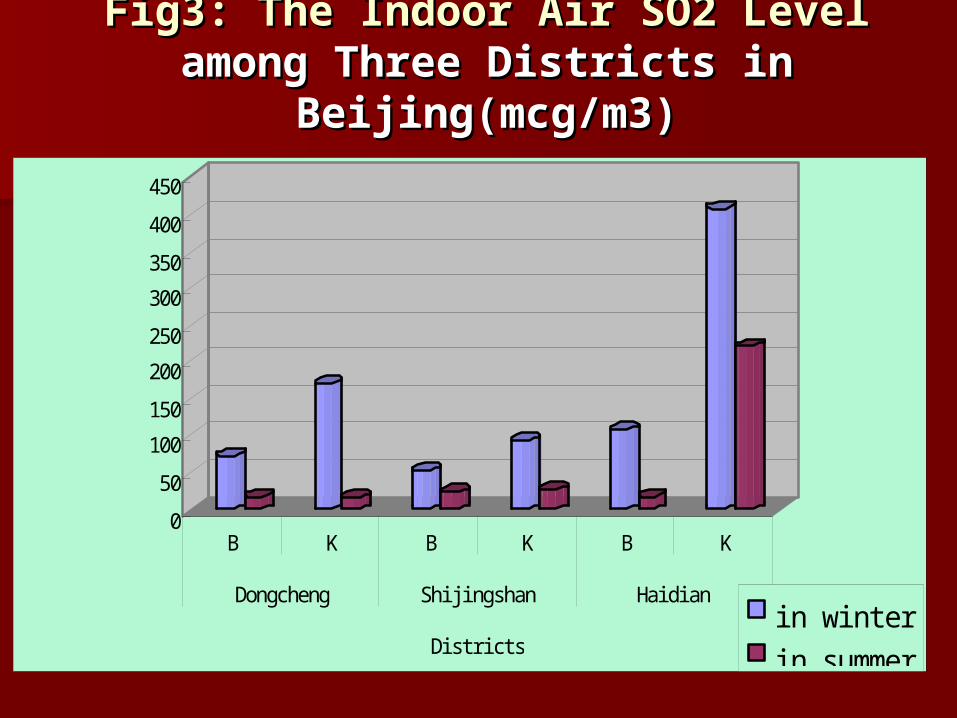
Fig3: The Indoor Air SO2 Level Fig3: The Indoor Air SO2 Level among Three Districts in among Three Districts in
Beijing(mcg/m3)Beijing(mcg/m3)
0
50
100
150
200
250
300
350
400
450
B K B K B K
Dongcheng Shi j i ngshan Hai di an
Di stri ctsi n wi nteri n summer
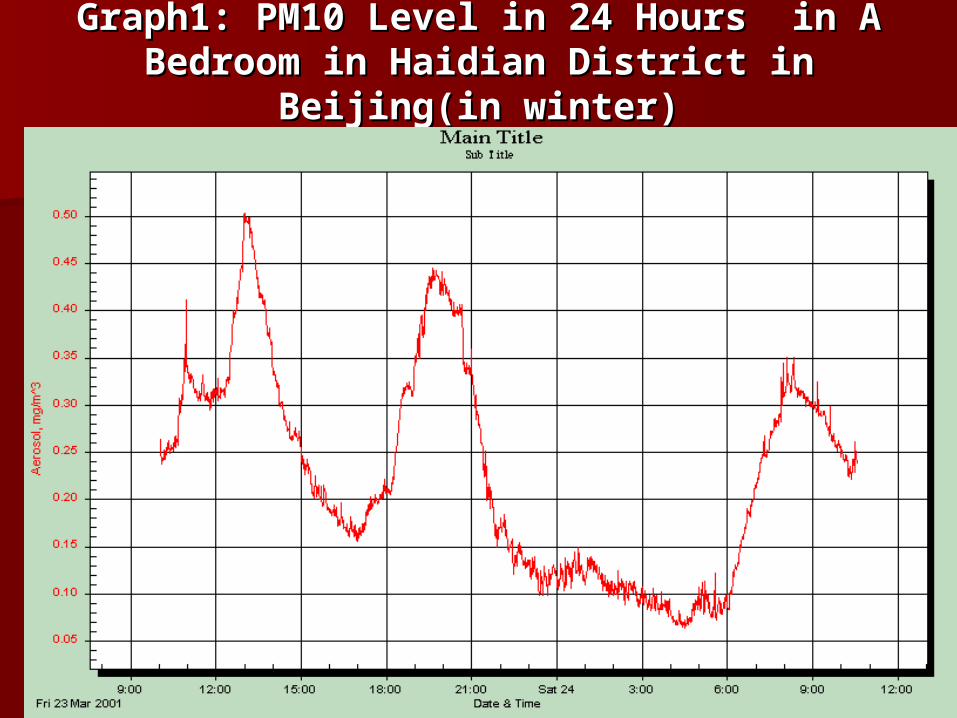
Graph1: PM10 Level in 24 Hours in A Graph1: PM10 Level in 24 Hours in A Bedroom in Haidian District in Beijing(in Bedroom in Haidian District in Beijing(in
winter)winter)
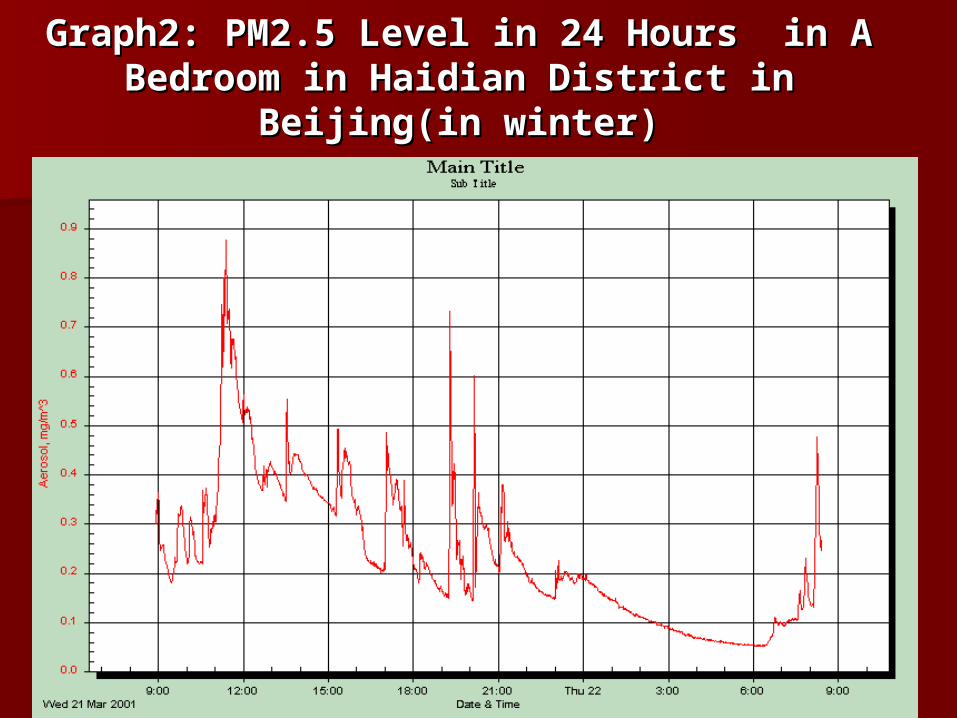
Graph2: PM2.5 Level in 24 Hours in A Graph2: PM2.5 Level in 24 Hours in A Bedroom in Haidian District in Beijing(in Bedroom in Haidian District in Beijing(in
winter)winter)
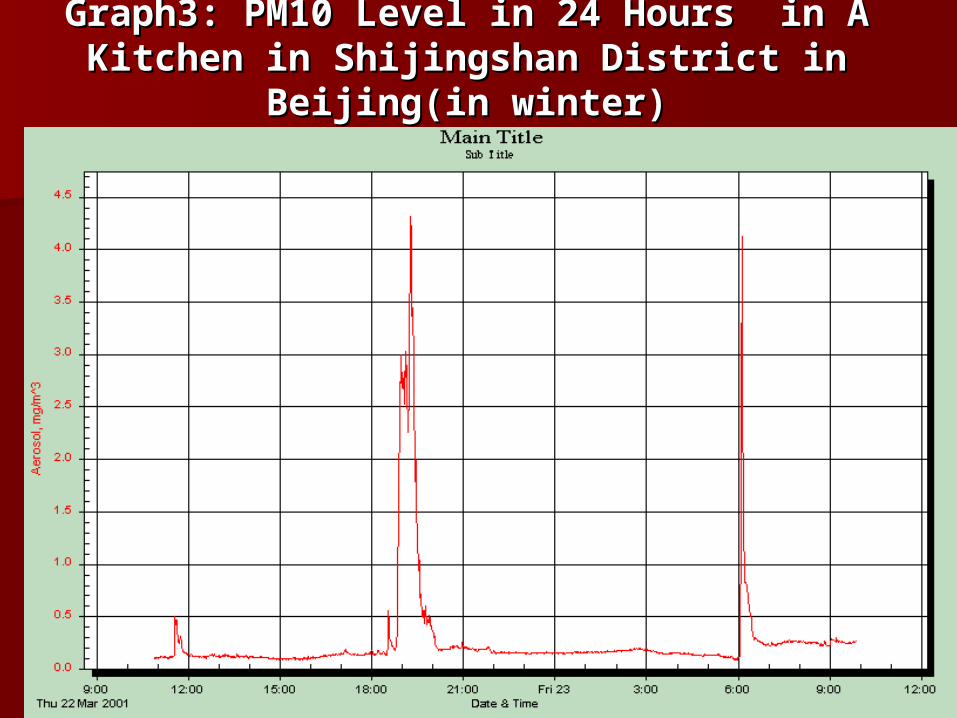
Graph3: PM10 Level in 24 Hours in A Graph3: PM10 Level in 24 Hours in A Kitchen in Shijingshan District in Kitchen in Shijingshan District in
Beijing(in winter)Beijing(in winter)
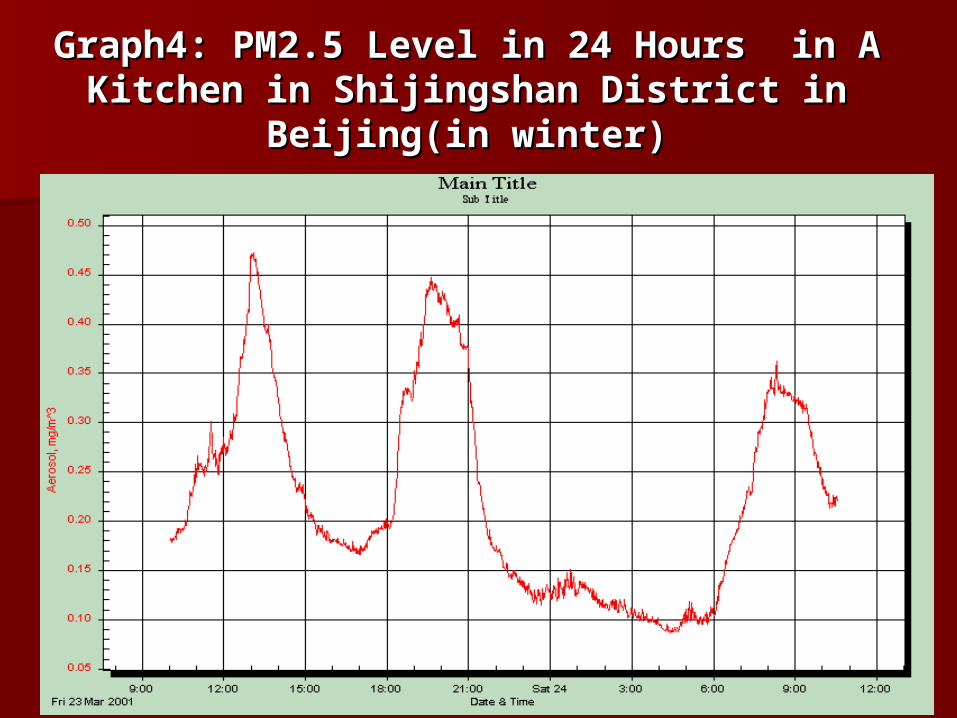
Graph4: PM2.5 Level in 24 Hours in A Graph4: PM2.5 Level in 24 Hours in A Kitchen in Shijingshan District in Kitchen in Shijingshan District in
Beijing(in winter)Beijing(in winter)
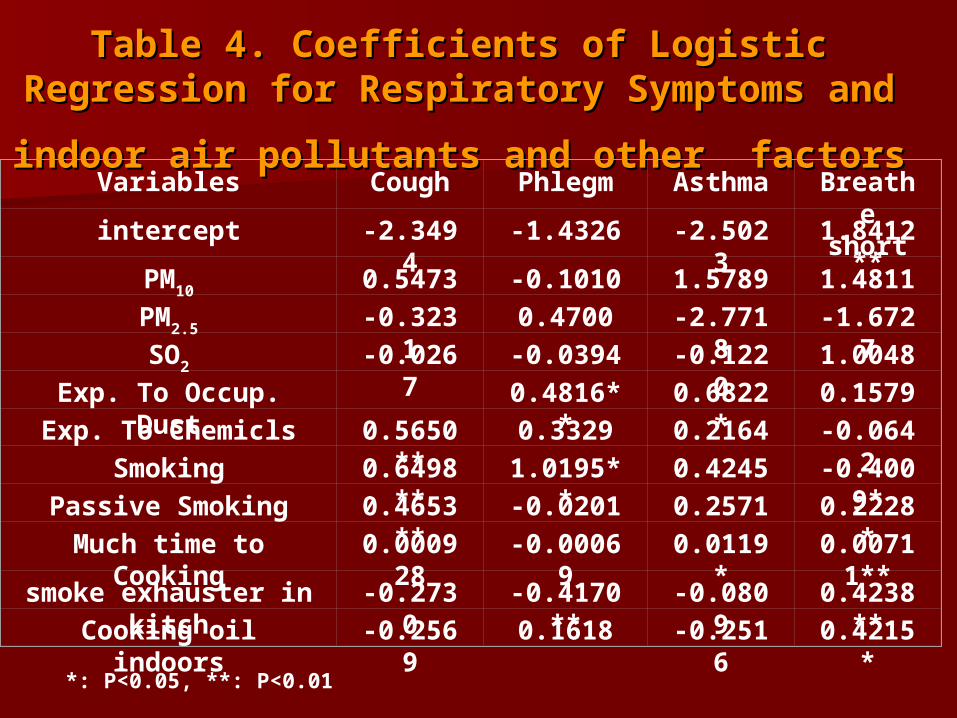
Table 4. Coefficients of Logistic Table 4. Coefficients of Logistic Regression for Respiratory Symptoms and Regression for Respiratory Symptoms and
indoor air pollutants and other factorsindoor air pollutants and other factors Variables Cough Phlegm Asthma Breathe
shortintercept -2.3494 -1.4326 -2.5023 1.8412**
PM10 0.5473 -0.1010 1.5789 1.4811
PM2.5 -0.3231 0.4700 -2.7718 -1.6727
SO2 -0.0267 -0.0394 -0.1220 1.0048
Exp. To Occup. Dust 0.4816** 0.6822* 0.1579
Exp. To Chemicls 0.5650** 0.3329 0.2164 -0.0642
Smoking 0.6498** 1.0195** 0.4245 -0.4009*
Passive Smoking 0.4653** -0.0201 0.2571 0.2228*
Much time to Cooking 0.000928 -0.00069 0.0119* 0.00711**
smoke exhauster in kitch -0.2730 -0.4170** -0.0809 0.4238**
Cooking oil indoors -0.2569 0.1618 -0.2516 0.4215*
*: P<0.05, **: P<0.01
An Evaluation Of The Indoor Air An Evaluation Of The Indoor Air Pollution And Respiratory Pollution And Respiratory
Health Of Farmers in Anhui Health Of Farmers in Anhui Province, ChinaProvince, China
Cooperated with Harvard University of Cooperated with Harvard University of USAUSA
and World Bankand World Bank
INTRODUCTIONINTRODUCTION more and more people living in urban armore and more people living in urban ar
eas of China spend the greater part of theas of China spend the greater part of their time indoors, where concentrations oeir time indoors, where concentrations of many air pollutants aref many air pollutants are higher than outhigher than outdoors, and the health effects maybe the doors, and the health effects maybe the same as that in the urban areas. same as that in the urban areas.
But sBut similar imilar studies in China have scarcelstudies in China have scarcely counted indoor air pollution in rural ary counted indoor air pollution in rural areas and their adverse health effects. eas and their adverse health effects.
INTRODUCTIONINTRODUCTION Now, more than 70 percent of China’s Now, more than 70 percent of China’s
populations also live in rural areas and some of populations also live in rural areas and some of them have quite poor living conditions, where them have quite poor living conditions, where respiratory diseases are also the leading cause respiratory diseases are also the leading cause of death. of death.
Nowadays the research on health effects of Nowadays the research on health effects of indoor air pollution in developing countries has indoor air pollution in developing countries has been hindered by lack of detailed data about been hindered by lack of detailed data about human exposure and adverse outcomes. The human exposure and adverse outcomes. The basic study should be conducted first.basic study should be conducted first.
In the present study we measured the level of In the present study we measured the level of indoor air pollution and examined primarily the indoor air pollution and examined primarily the related health effects (respiratory symptoms) in related health effects (respiratory symptoms) in rural areas of southeast China. rural areas of southeast China.
MethodsMethods
ParticipantsParticipants The study field covered more than 30 small towns The study field covered more than 30 small towns
of 4 counties, consisting of lake, plain, hill and of 4 counties, consisting of lake, plain, hill and mountain areas in Anhui province of China. 189 mountain areas in Anhui province of China. 189 households (62 from the lake area, 74 from the households (62 from the lake area, 74 from the plains and 53 from the mountain area) were plains and 53 from the mountain area) were selected randomly to represent various geographic selected randomly to represent various geographic and socioeconomic background of this area. They and socioeconomic background of this area. They had similar tribal backgrounds, living habits, and had similar tribal backgrounds, living habits, and diet. diet.
At the same time, about 500 individuals aged from At the same time, about 500 individuals aged from 15 – 65 yr. from the study households were 15 – 65 yr. from the study households were interviewed by questionnaire for their respiratory interviewed by questionnaire for their respiratory health conditions.health conditions.
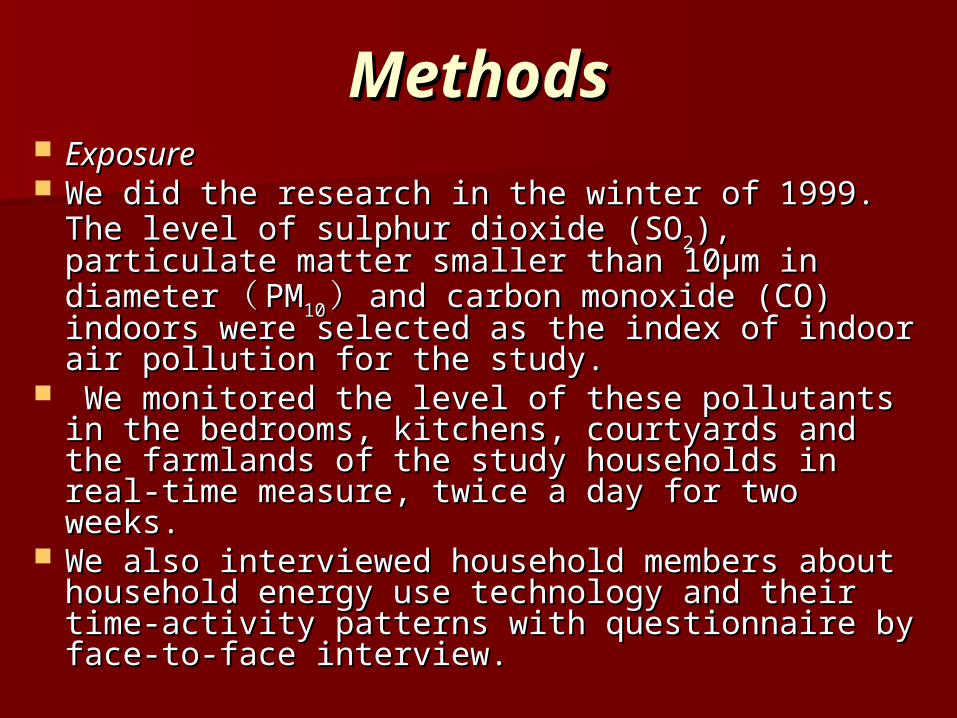
MethodsMethods Exposure Exposure We did the research in the winter of 1999. The We did the research in the winter of 1999. The
level of sulphur dioxide (SOlevel of sulphur dioxide (SO22), particulate ), particulate matter smaller than 10matter smaller than 10μμm in m in diameterdiameter (( PMPM1010 )) and carbon monoxide (CO) and carbon monoxide (CO) indoors were selected as the index of indoor air indoors were selected as the index of indoor air pollution for the study.pollution for the study.
We monitored the level of these pollutants in We monitored the level of these pollutants in the bedrooms, kitchens, courtyards and the the bedrooms, kitchens, courtyards and the farmlands of the study households in real-time farmlands of the study households in real-time measure, twice a day for two weeks. measure, twice a day for two weeks.
We also interviewed household members about We also interviewed household members about household energy use technology and their household energy use technology and their time-activity patterns with questionnaire by time-activity patterns with questionnaire by face-to-face interview. face-to-face interview.

RESULTS RESULTS
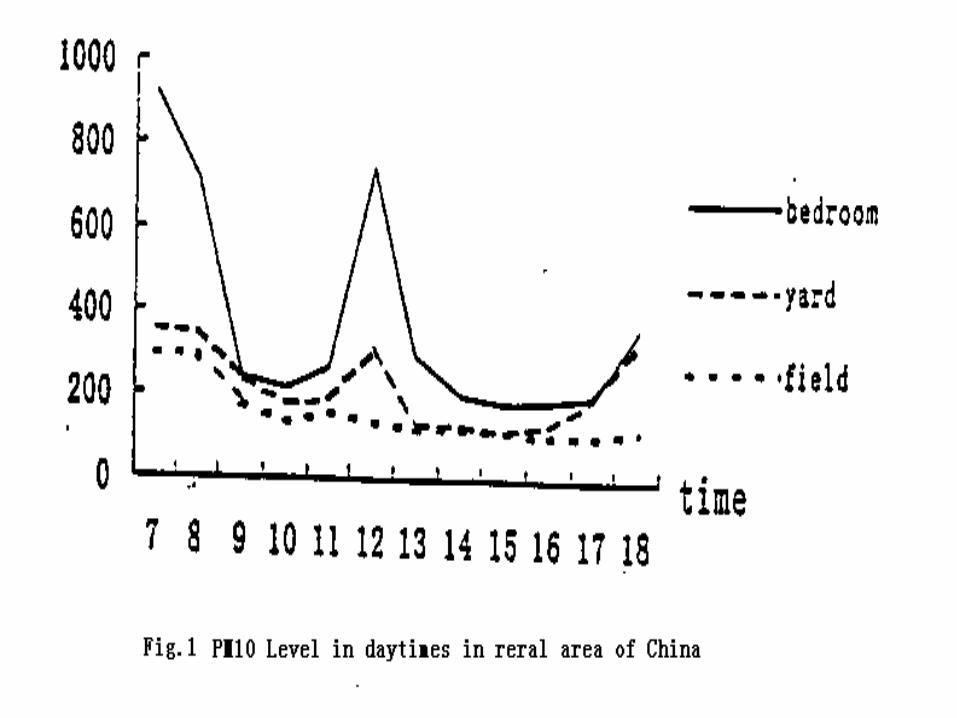
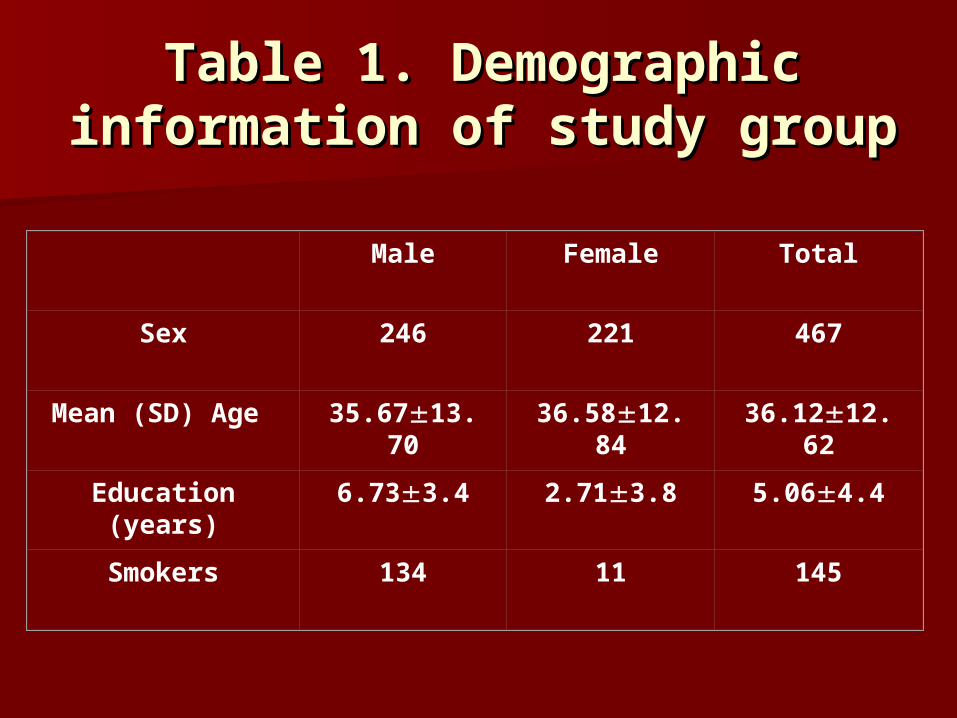
Table 1. Demographic Table 1. Demographic information of study groupinformation of study group
Male Female Total
Sex 246 221 467
Mean (SD) Age 35.6713.70 36.5812.84 36.1212.62
Education (years) 6.733.4 2.713.8 5.064.4
Smokers 134 11 145
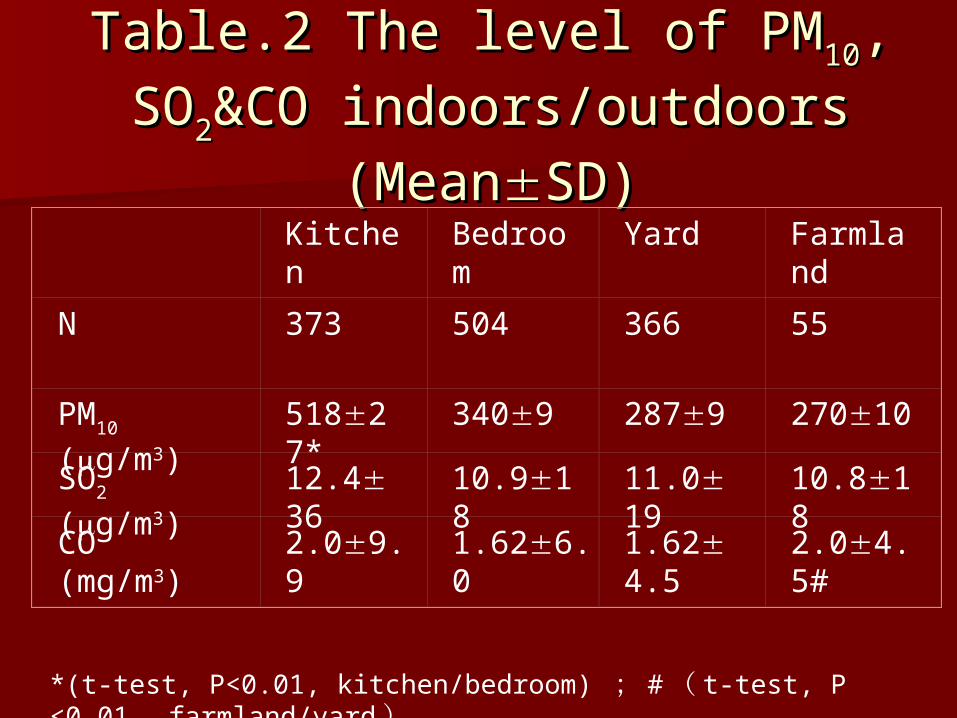
Table.2 The level of PMTable.2 The level of PM1010, ,
SOSO22&CO indoors/outdoors &CO indoors/outdoors
(Mean(MeanSD)SD) Kitchen Bedroom Yard Farmland
N 373 504 366 55
PM10 (g/m3) 51827*
3409 2879 27010
SO2 (g/m3) 12.436 10.918 11.019 10.818
CO (mg/m3) 2.09.9 1.626.0 1.624.5
2.04.5#
*(t-test, P<0.01, kitchen/bedroom) ; # ( t-test, P<0.01 , farmland/yard )
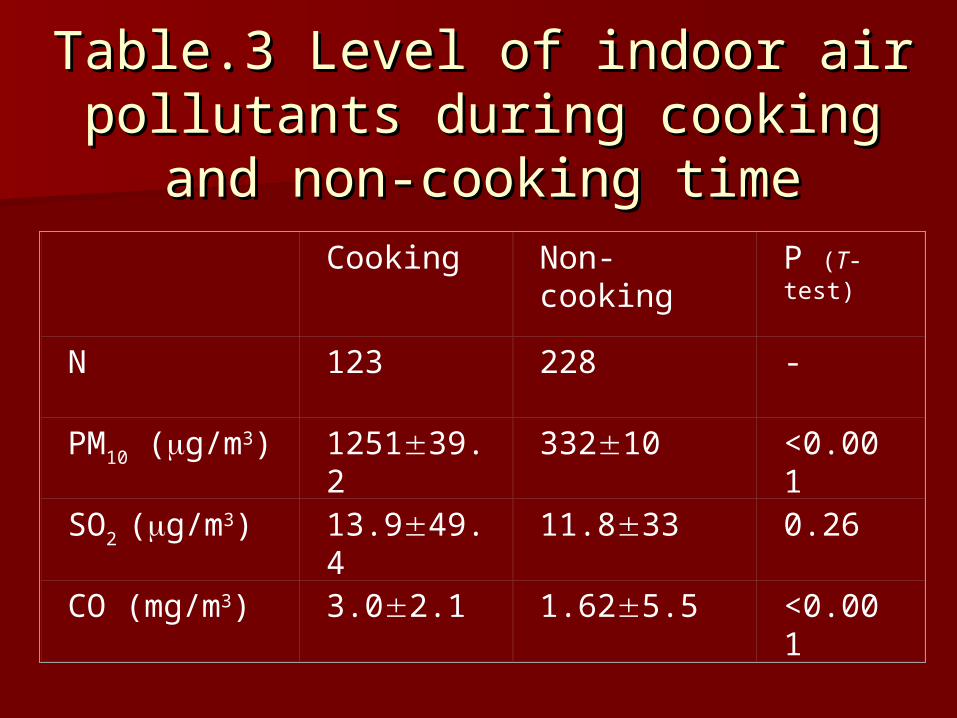
Table.3Table.3 Level of indoor air Level of indoor air pollutants during cooking and pollutants during cooking and
non-cooking timenon-cooking time Cooking Non-cooking P (T-test)
N 123 228 -
PM10 (g/m3) 125139.2 33210 <0.001
SO2 (g/m3) 13.949.4 11.833 0.26
CO (mg/m3) 3.02.1 1.625.5 <0.001
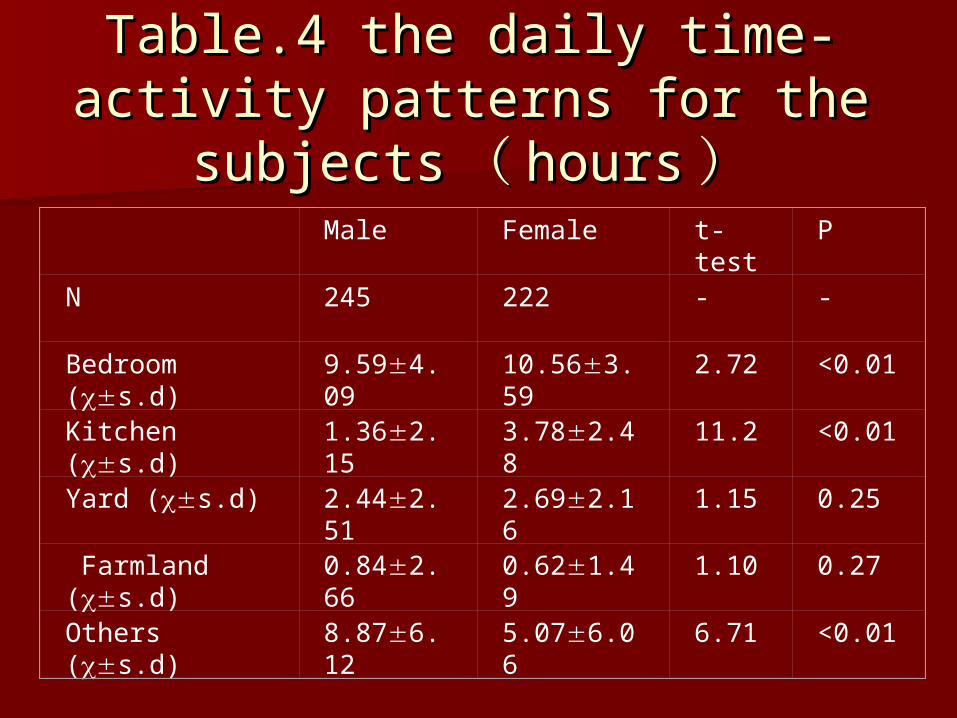
Table.4Table.4 the daily time-activity the daily time-activity patterns for the patterns for the
subjectssubjects (( hourshours )) Male Female t-test P
N 245 222 - -
Bedroom (s.d) 9.594.09 10.563.59 2.72 <0.01
Kitchen (s.d) 1.362.15 3.782.48 11.2 <0.01
Yard (s.d) 2.442.51 2.692.16 1.15 0.25
Farmland (s.d) 0.842.66 0.621.49 1.10 0.27
Others (s.d) 8.876.12 5.076.06 6.71 <0.01
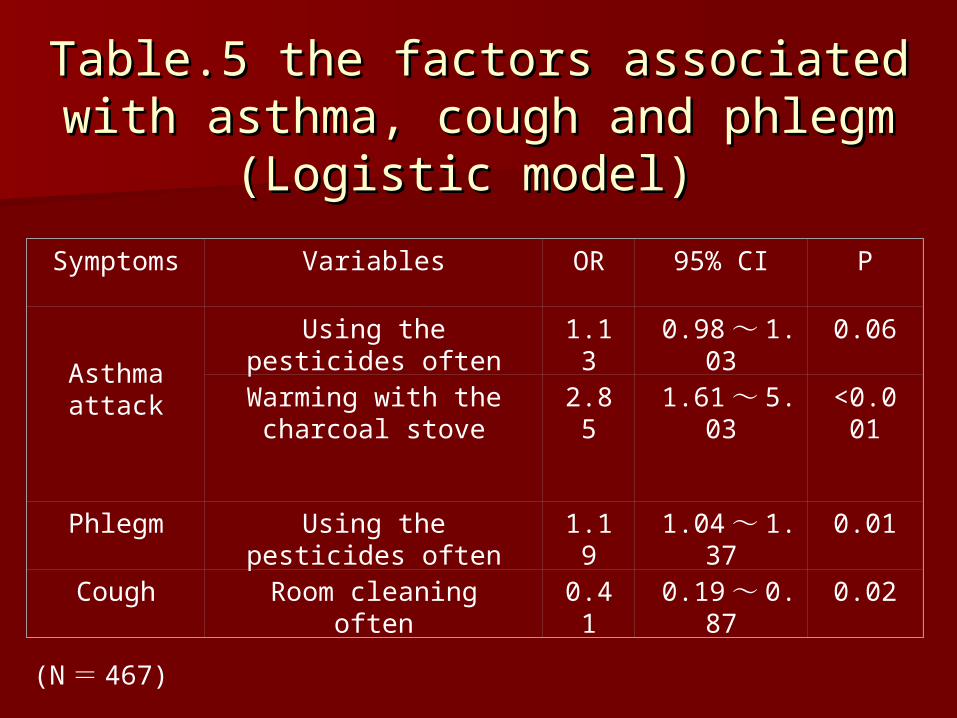
Table.5 the factors associated with Table.5 the factors associated with asthma, cough and phlegm (Logistic asthma, cough and phlegm (Logistic
model) model)
Symptoms Variables OR 95% CI P
Asthma attack
Using the pesticides often 1.13 0.98 ~ 1.03
0.06
Warming with the charcoal stove
2.85 1.61 ~ 5.03
<0.001
Phlegm Using the pesticides often 1.19 1.04 ~ 1.37
0.01
Cough Room cleaning often 0.41 0.19 ~ 0.87
0.02
(N = 467)
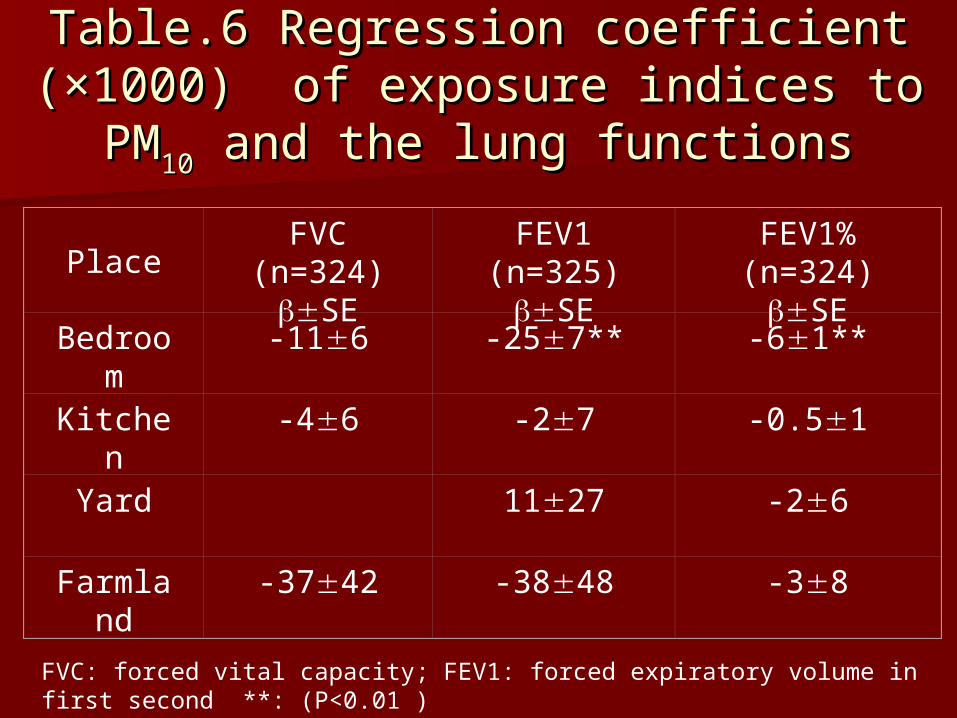
Table.6 Regression coefficient (Table.6 Regression coefficient (××1000) 1000) of exposure indices to PM of exposure indices to PM1010 and the and the
lung functionslung functions
PlaceFVC (n=324)
SEFEV1 (n=325)
SEFEV1% (n=324)
SE
Bedroom -116 -257** -61**
Kitchen -46 -27 -0.51
Yard 1127 -26
Farmland -3742 -3848 -38
FVC: forced vital capacity; FEV1: forced expiratory volume in first second **: (P<0.01 )FEV1%: percentage of forced expiratory volume in first second to forced vital capacity

CONCLUSIONCONCLUSION
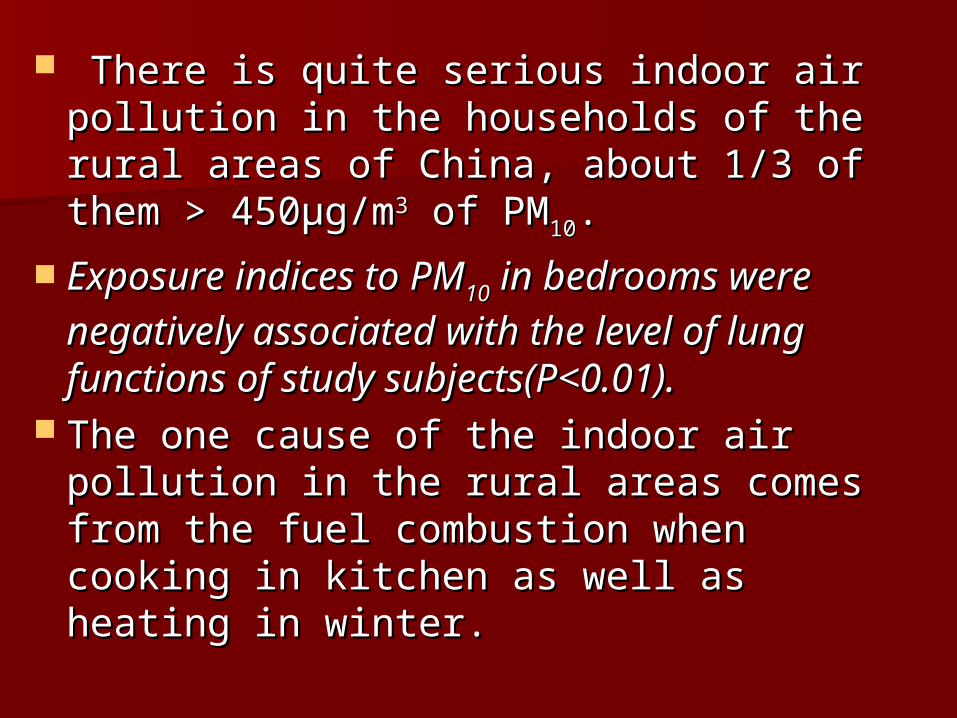
There is quite serious indoor air There is quite serious indoor air pollution in the households of the rural pollution in the households of the rural areas of China, about 1/3 of them > areas of China, about 1/3 of them > 450450μμg/mg/m33 of PM of PM1010. .
Exposure indices to PMExposure indices to PM1010 in bedrooms in bedrooms
were negatively associated with the were negatively associated with the level of lung functions of study level of lung functions of study subjects(P<0.01).subjects(P<0.01).
The one cause of the indoor air pollution The one cause of the indoor air pollution in the rural areas comes from the fuel in the rural areas comes from the fuel combustion when cooking in kitchen as combustion when cooking in kitchen as well as heating in winter. well as heating in winter.
Household fuel Structure Household fuel Structure and Effect on Indoor Air and Effect on Indoor Air Quality in Rural North Quality in Rural North
Sichuan ProvinceSichuan Province
Cooperated with China Agriculture
University in Beijing
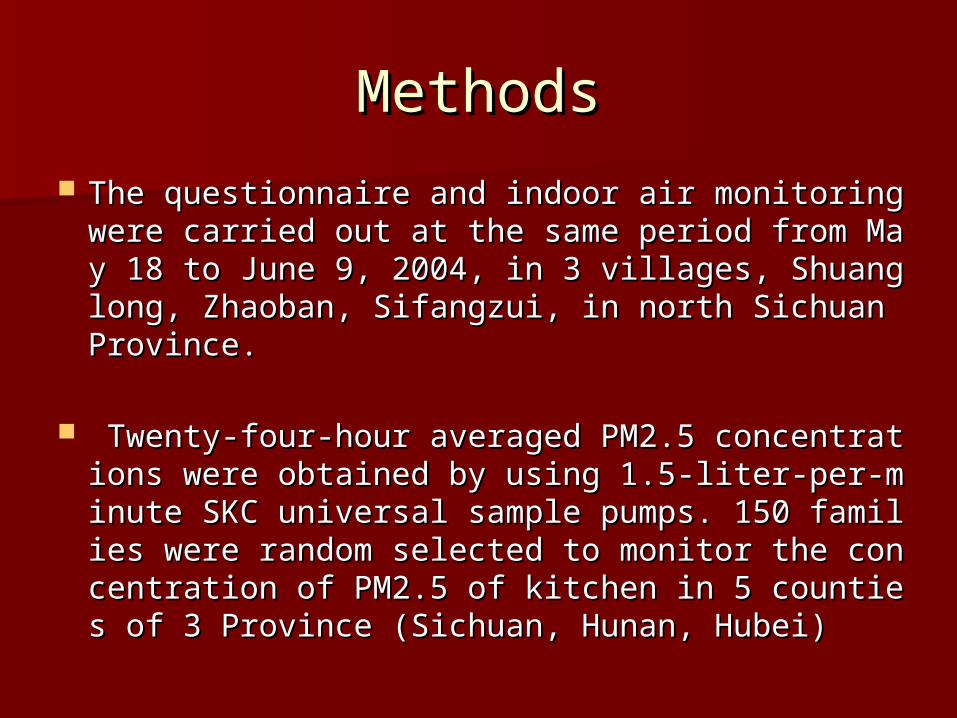
MethodsMethods
The questionnaire and indoor air monitoring wThe questionnaire and indoor air monitoring were carried out at the same period from May 18 ere carried out at the same period from May 18 to June 9, 2004, in 3 villages, Shuanglong, Zhaoto June 9, 2004, in 3 villages, Shuanglong, Zhaoban, Sifangzui, in north Sichuan Province. ban, Sifangzui, in north Sichuan Province.
Twenty-four-hour averaged PM2.5 concentratiTwenty-four-hour averaged PM2.5 concentrations were obtained by using 1.5-liter-per-minutons were obtained by using 1.5-liter-per-minute SKC universal sample pumps. 150 families wee SKC universal sample pumps. 150 families were random selected to monitor the concentratire random selected to monitor the concentration of PM2.5 of kitchen in 5 counties of 3 Provinon of PM2.5 of kitchen in 5 counties of 3 Province (Sichuan, Hunan, Hubei)ce (Sichuan, Hunan, Hubei)
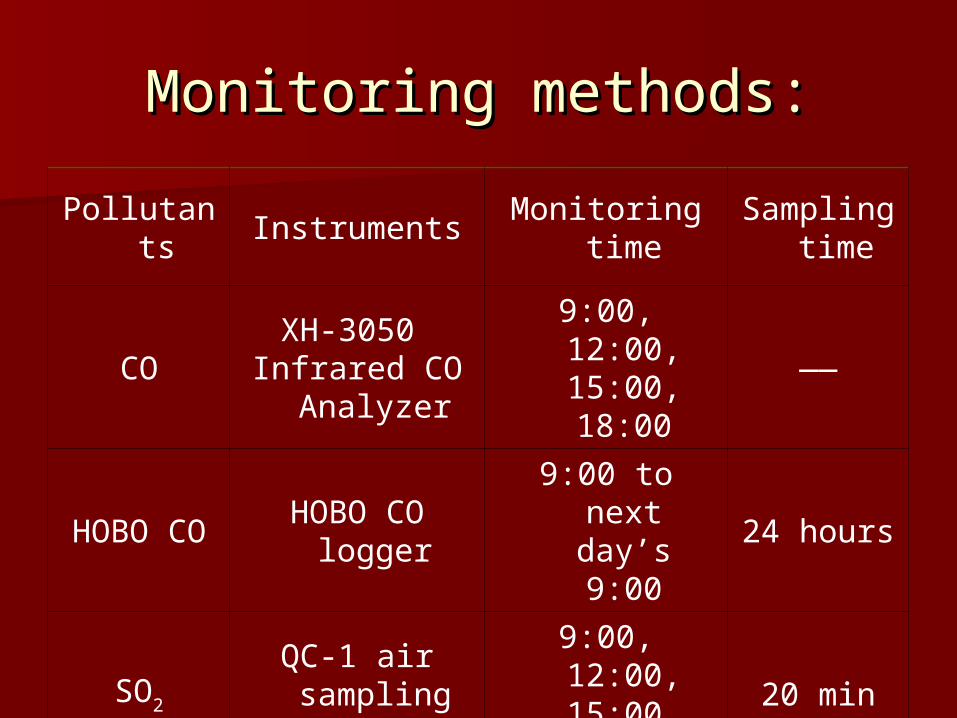
Monitoring methods:Monitoring methods:
Pollutants Instruments Monitoring timeSampling
time
COXH-3050
Infrared CO Analyzer
9:00, 12:00, 15:00, 18:00
――
HOBO COHOBO CO
logger9:00 to next
day’s 9:0024 hours
SO2
QC-1 air sampling
instrument
9:00, 12:00, 15:00. 18:00
20 min
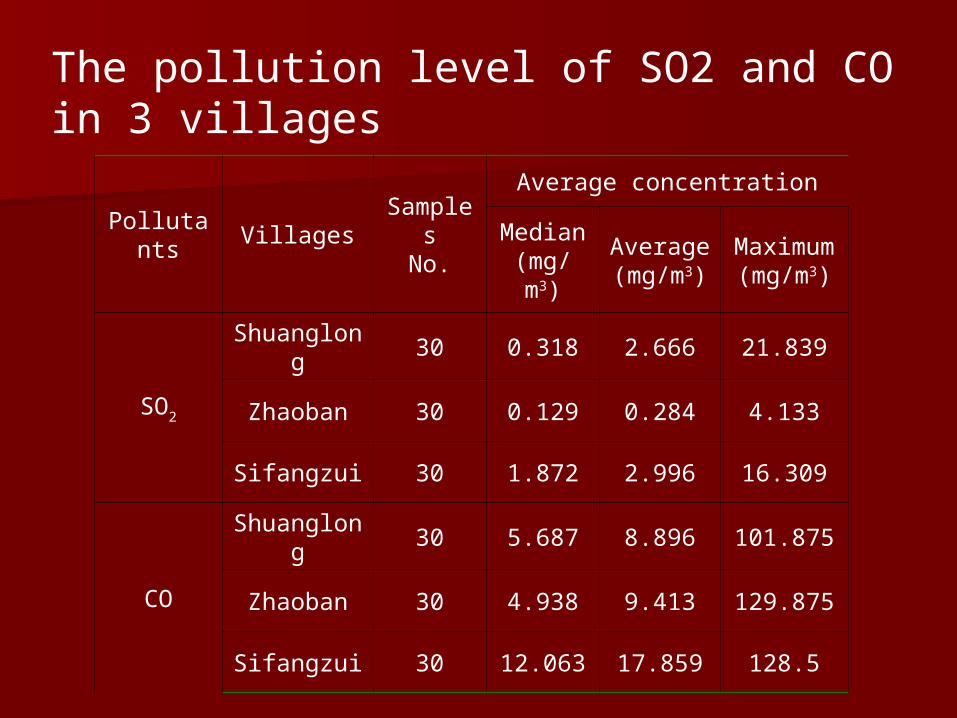
Pollutants VillagesSamples
No.
Average concentration
Median(mg/m3)
Average(mg/m3)
Maximum(mg/m3)
SO2
Shuanglong 30 0.318 2.666 21.839
Zhaoban 30 0.129 0.284 4.133
Sifangzui 30 1.872 2.996 16.309
CO
Shuanglong 30 5.687 8.896 101.875
Zhaoban 30 4.938 9.413 129.875
Sifangzui 30 12.063 17.859 128.5
The pollution level of SO2 and CO in 3 villages
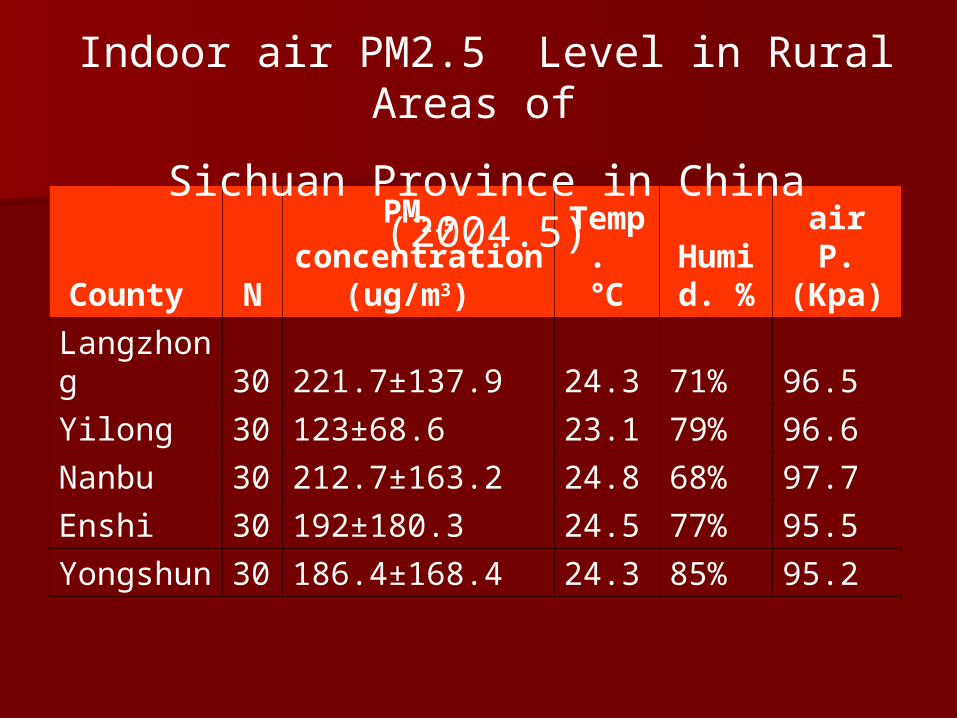
County N
PM2.5
concentration (ug/m3)
Temp. ℃
Humid. %
air P.(Kpa)
Langzhong 30 221.7±137.9 24.3 71% 96.5
Yilong 30 123±68.6 23.1 79% 96.6
Nanbu 30 212.7±163.2 24.8 68% 97.7
Enshi 30 192±180.3 24.5 77% 95.5
Yongshun 30 186.4±168.4 24.3 85% 95.2
Indoor air PM2.5 Level in Rural Areas of
Sichuan Province in China (2004.5)
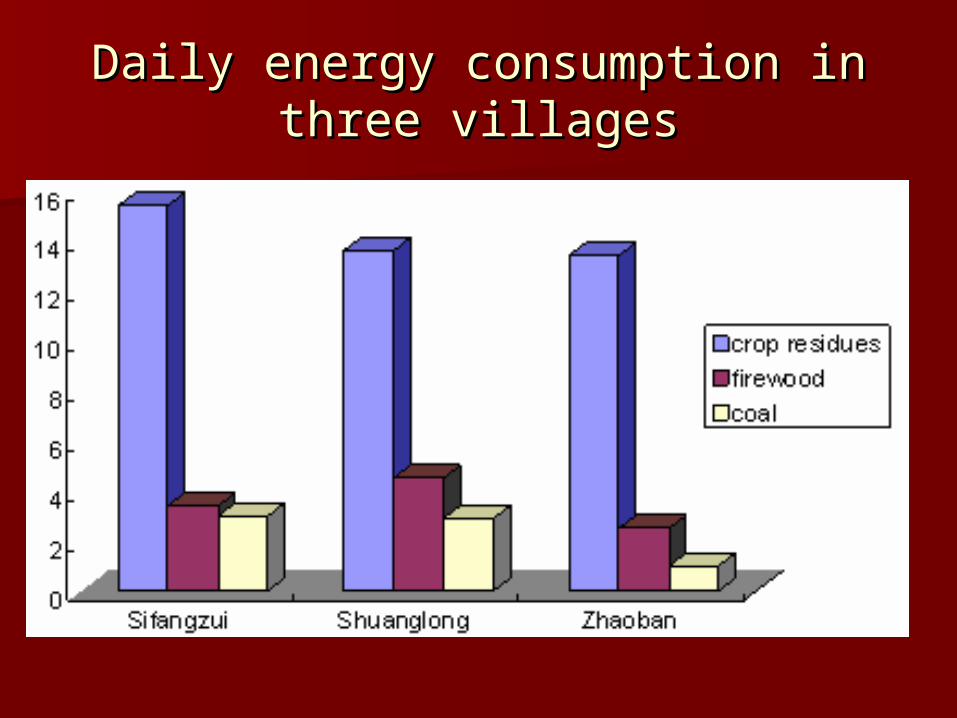
Daily energy consumption in three Daily energy consumption in three villagesvillages
Discussion Discussion Health effects of indoor air pollution should Health effects of indoor air pollution should
be considered as a factor in evaluation of be considered as a factor in evaluation of environmental cost model. environmental cost model.
Exposure-response relations: the population Exposure-response relations: the population study on health effects of indoor air pollution study on health effects of indoor air pollution remains in primary stage now and there is remains in primary stage now and there is few on quantitative evaluation for it in China. few on quantitative evaluation for it in China.
the pollutants and microenvironment the pollutants and microenvironment indoors are very complicated, so the health indoors are very complicated, so the health effects should be the integrated results effects should be the integrated results caused by both pollutants and caused by both pollutants and microclimates. microclimates.

Thanks for your Thanks for your attention !attention !