Embed Size (px)
Citation preview

STUDY ON FATIGUE LIFE AND FRACTURE TOUGHNESS
OF SHEET METAL AFTER LASER FORMING
By
JUN ZHANG
A thesis submitted in partial fulfillment of the requirements for the degree of
MASTER OF SCIENCE IN MECHANICAL ENGINEERING
WASHINGTON STATE UNIVERSITY School of Mechanical and Materials Engineering
DECEMBER 2003

ii
To the Faculty of Washington State University:
The members of the Committee appointed to examine the thesis of
JUN ZHANG find it satisfactory and recommend that it be accepted.
Chair

iii
ACKNOWLEDGEMENTS
I would like to express my thanks to Dr. Gary J. Cheng, for his patience and guidance
during my study at Washington State University. Many thanks to Mr. Muhammad
Daniel Pirzada for providing me SEM pictures. Dr. Jow-Lian Ding and Dr. M. Grant
Norton are appreciated for serving as committee member.
Finally, I wish to acknowledge the support from my husband, Dr. Xiaoxi Wu.

iv
STUDY ON FATIGUE LIFE AND FRACTURE TOUGHNESS
OF SHEET METAL AFTER LASER FORMING
Abstract
by Jun Zhang, M.S. Washington State University
December 2003
Chair: Gary J. Cheng
Laser forming (LF) is a highly flexible rapid prototyping and low-volume manufacturing
process, which uses laser-induced thermal distortion to shape sheet metal parts without
hard tooling or external forces. Analysis of LF process has been focused on geometry
change, microstructure change and yield strength in the past. For LF to become a
practical rapid prototyping tool, it is critical to study materials’ mechanical properties
after laser forming. This project studies fatigue life and fracture toughness of sheet
metal after LF. Laser forming differs from other manufacturing processes in that
significantly high heating and cooling rates are involved. The results are
inhomogeneous microstructure instead of homogeneous microstructure, and at the same
time, residual stresses and residual strains are left in the material due to the large thermal
gradient through the thickness. These will influence materials’ fatigue life and fracture
toughness.

v
However, the current models cannot predict the fatigue life after LF accurately because of
differences in assumptions. This work presents a model to predict fatigue life of sheet
metal after LF. Results from microstructure integrated finite element modeling of LF
are incorporated in the fatigue life model. Low carbon steel is used in this work to
validate the model. It is shown that the proposed model can predict the fatigue life of
sheet metal after LF with good accuracy. The predictions from the model are consistent
with experimental results. Effects of LF conditions on fatigue life of sheet metal are
under investigation.
After the study on fatigue life, an integrated model to study fracture toughness of sheet
metal after LF will be presented. Microstructure, distribution of residual stresses and
geometry of sheet metal specimen are considered in the model. Results of residual
stress from microstructure integrated finite element modeling of LF are incorporated in
the model. The results from the fracture toughness study are found consistent with
microstructure analysis.

vi
TABLE OF CONTENTS page
ACKNOWLEDGEMENTS························································································iii
ABSTRACT················································································································ iv
LIST OF TABLES ······································································································ ix
LIST OF FIGURES ······································································································x
CHAPTER
1. INTRODUCTION ································································································· 1
1.1 Introduction to laser forming (LF) ·································································· 1
1.2 Literature Review ···························································································· 2
1.3 Systematic modeling approach········································································ 5
1.4 Current problems and objectives of the thesis················································· 6
2. FATIGUE LIFE PREDICTION AFTER LASER FORMING ···························· 10
2.1 Introduction ··································································································· 10
2.2 A fatigue life model for laser forming··························································· 12
2.3 Experiments and simulation conditions ························································ 15
2.4 Result and discussion ···················································································· 17
2.4.1 Modeling of fatigue after laser forming··············································· 17
2.4.1.1 Strategy of modeling································································· 17
2.4.1.2 Mean stress and mean strain ····················································· 18
2.4.1.3 Analytical fatigue life································································ 19

vii
2.4.2 Validation of fatigue life modeling ······················································ 20
2.4.2.1 Comparison with fatigue testing ··············································· 20
2.4.2.2 Microstructure analysis ····························································· 21
2.4.3 Prediction of fatigue life under different laser heating conditions ··· 23
2.4.4 Enhancement of fatigue life after laser forming ······························· 25
2.5 Conclusions ··································································································· 25
3. EXPERIMENTAL STUDY AND COMPUTER SIMULATION ON FRACTURE
TOUGHNESS OF SHEET METAL AFTER LASER FORMING ····················· 39
3.1 Introduction ··································································································· 39
3.2 Background and fracture toughness model ··························································· 41
3.2.1 Basic theories ···················································································· 41
3.2.2 Fracture toughness model for sheet material without residual
stresses ······························································································ 42
3.2.3 Fracture toughness model for sheet material with residual stresses ·43
3.3 Experiment and simulation conditions ···················································· 44
3.4 Results and discussion············································································· 46
3.4.1 Overall strategy················································································· 46
3.4.2 The stress intensity of sheet metal due to residual stress
after laser forming············································································· 47
3.4.3 The critical stress intensity of sheet metal due to applied load ········ 49
3.4.4 Fracture toughness of laser forming material, Kc ··························· 50

viii
3.5 Conclusions ····························································································· 51
4. CONCLUSIONS·································································································· 63
REFERENCE············································································································· 65

ix
LIST OF TABLES
1. Table 2.1. Coefficients used in the fatigue model ·············································· 27
2. Table 2.2 Fatigue testing results compared with prediction results···················· 27
3. Table 3.1 Measured Kapply values at room temperature 293 K ························· 52

x
LIST OF FIGURE
1. Figure 1.1 Schematic of the laser forming process ··············································· 8
2. Figure 1.2 Metal plane after laser forming ··························································· 8
3. Figure 1.3 Schematics of the proposed modeling approach ································· 9
4. Figure 2.1. Schematic view of (a) Geometry of work piece and coordinate system (b) Dimension of fatigue testing specimen ··········································· 28
5. Figure 2.2. Superposition of cooling time history of laser forming from FEM results on CCT curve of AISI 1012 steel ···················································· 28
6. Figure 2.3 Residual stress distribution on the Y-Z cross section of the specimen (P=800W, v=0.05 m/s) (a) Residual stress contour, and (b) residual stress distribution in Y direction on the top surface············································· 29
7. Figure 2.4 Residual strain distribution on the Y-Z cross section of the specimen (P=800W, v=0.05m/s) (a) Residual strain contour (b) Residual strain distribution in Y direction on the laser-forming surface. ··························· 30
8. Figure 2.5 Fatigue life distribution on Y-Z cross section (P=800W, v=0.05m/s) (a) Fatigue life contour, and (b) Fatigue life distribution in Y-axis direction on the top surface······································································· 31
9. Figure 2.6 a) Schematic of typical regions on the Y-Z cross section of AISI1010 steel sheet after laser forming, and b) SEM micrograph on the Y-Z cross section, perpendicular to the scanning path, showing the heat affected zone, non-heat affected zone and the boundary of HAZ and non-HAZ·············· 32
10. Figure 2.7 SEM micrographs of cracks on the surface of laser formed AISI1010 steel sheet after fatigue testing. a) Crack on the heat-affected zone, and b) the end of the crack and a second crack, showing the crack is initiated around the boundary of HAZ and propagates towards the center of the sample ·················································································································· 33
11. Figure 2.8. SME micrographs of cross section of laser formed AISI1010 steel sheet after fatigue testing. (a) Dark zone is heat-affected-zone, and (b) White region is the region where the material broken last ·································· 34
12. Figure 2.9 SME micrographs of laser forming AISI1010 steel sheet after fatigue testing. a) heat-affected-zone, b) interface of heat-affected-zone and non-heat-affected-zone, and c) non-heat-affected zone······································· 35
13. Figure 2.10 SME micrograph shows the details around the boundary of heat-affected-zone on the cross section of laser formed AISI sheet steel after

xi
fatigue testing, showing the crack is initiated around the boundary of heat affected zone. ······································································································· 36
14. Figure 2.11 Fatigue life of AISI1010 sheet after laser forming vs. laser scanning velocity under difference laser heating power levels···························· 37
15. Figure 2.12 Fatigue life of AISI1010 sheet after laser forming vs. laser heating power under different laser scanning velocities······································ 37
16. Figure 2.13 Fatigue life of AISI1010 sheet after laser forming vs. laser line energy··················································································································· 38
17. Figure 3.1 Relationship between Kc and thickness of plates. With the increasing of the thickness, Kc increases first, and then decreases. Finally, Kc equals to Kic , and does not change with thickness ·············································· 54
18. Figure 3.2 Dimensions of the notch specimen. There are two notch points. One is at the center of the laser-scanning path. The other is at the boundary of the laser HAZ.·································································································· 55
19. Figure 3.3 Straight-line laser-forming scheme laser forming in X direction ······ 56
20. Figure 3.4 Load-load line displacement plot ······················································ 56
21. Figure 3.5 Distribution of residual stress on Y-Z cross section (P=800W, v=0.05m/s) a) Contour of residual stress on Y-Z cross section, b) Stress distribution in Y direction on top surface (Z=0.89mm)······································· 57
22. Figure 3.6 Contour of Kres on Y-Z cross section after the laser forming with laser heating power of 800 W and scanning velocity of 0.05 m/s ······················· 58
23. Figure 3.7 Prediction of Kres-A changes with the crack length when laser power keep same, P=800W·················································································· 58
24. Figure 3.8 Prediction of Kres-A changes with the crack length, at scanning velocity v=0.065m/s and different laser heating powers······································ 59
25. Figure 3.9 Prediction of Kres-B changes with the crack length at laser heating power of 800W and different scanning velocities··································· 59
26. Figure 3.10 Prediction of Kres-B changes with the crack length at laser heating power of 800W and different scanning velocities··································· 60
27. Figure 3.11 Prediction of residual Kres-B change with laser forming parameters, power and velocity ··········································································· 60
28. Figure 3.12 Prediction of residual Kres-B change with laser forming line energy··················································································································· 61

xii
29. Figure 3.13 SEM micrograph of the cross section of AISI 1012 steel sheet perpendicular to the scanning path, showing the hardened (dark-colored, no melting involved) zone, and refined grain zone near top surface, under the condition of P=400 W, v=25 mm/s ······································································ 61
30. Figure 3.14 Detailed SEM micrographs of AISI 1012 steel after laser forming under the condition of P=800 W, and v=50 mm/s; (a) microstructure around the boundary of HAZ, (b) microstructure within non-HAZ, (c) refined grain structure near the top surface, (d) microstructure near the top surface ·················································································································· 62

1
CHAPTER ONE
INTRODUCTION
1.1 Introduction to Laser Forming
Laser forming (LF) is a highly flexible rapid prototyping and low-volume manufacturing
process, which uses laser-induced thermal distortion to shape sheet metal parts without
hard tooling or external forces. A schematic of the laser forming process is shown in
Figure 1.1. After laser forming, the shape of the sheet material will be changed, as shown
in Figure 1.2.
Compared with traditional metal forming technologies, laser forming has many
advantages:
1 > No tooling. The cost of the forming process is greatly reduced because no tools
or external forces are involved in the process. The technique is good for small batches
and a variety of sheet metal components. With the flexibility in the laser beam’s
delivering and power regulating systems, it is easy to incorporate laser forming into an
automatic flexible manufacturing system.
2 > No contact. Because this process is a non-contact forming process, precise
deformation can be produced in inaccessible areas.
3 > Easy to control. The size and power of the laser beam can be precisely

2
manipulated, enabling accurate control of the forming process and improving
reproducibility.
4 > Energy efficient. Laser forming uses localized heating to induce controlled
deformation instead of tradition entire work piece heated. Therefore it has the
advantage of energy efficiency.
5 > Variety of applications. Laser forming offers more applications than
conventional mechanical forming, such as adjusting and aligning sheet metal
components.
6 > Forming hard-to-formed materials. Laser forming is suitable for materials that
are difficult to form by mechanical approaches, such as silicon, ceramic, titanium and
other high-performance alloys. Because in typical laser forming processes, metal
degradation is limited to a very thin layer of the irradiated surface due to short interaction
time, laser forming is suitable for materials that are sensitive to high temperature. The
microstructure of the heat-affected zone of laser formed parts can be improved when
proper process parameters are used.
Therefore, it has potential applications in aerospace, shipbuilding, microelectronics,
automotive industries, etc. The rapid, flexible and low-cost metal forming can improve
the competitiveness of these industries (Magee et al, 1998; Frackiewicz, 1996; Arnet and
Vollertsen, 1995).
1.2 Literature Review

3
Laser forming technology began in the 1980s, and in that time, the development of
laser-forming technology was more concentrated on experimental studies (Namba, 1986;
Scully, 1987). From 1990s, more work has concentrated on analytical simulation
combined with experimental studies.
One of most popular topics in laser forming is forming parameters, because controlling
laser forming parameters can achieve high working accuracy. The most important
parameters in laser forming processes are laser power and scanning velocity. Within a
certain range, bend angle increase with laser beam power, even a linear relationship was
found between the bend angle and laser power (Hennige et al, 1997). This is because
higher laser energy input makes the temperature of the heat-affected zone along the
scanning path increase so that flow stress decreases and thermal induced deformation is
reduced. Hu et al (2001) using the finite element code ANSYS simulated laser forming
process, and got a serial of relationship between laser forming parameters and forming
angle. Chen and Xu (2001) extended it in micro blending, focusing the laser beam to
tens of micrometers to produce precision micro level blending angle. They built a fully
3D finite element model to simulate low power laser process thin stainless steel sheet,
which contributes to micro machining. With laser forming velocity increasing, the
bending angle will decrease. Because the energy absorbed by steel reduce with increasing
scanning velocity, v, and that flow stress of the samples increases as strain rate increases.
Vollertsen (1994) showed that the bend angle is directly proportional to v-0.63 for steel

4
planes; later Magee (1997) showed that the angle is directly proportional to v-0.54 for
aluminum. Lawrence et al (2001) published same results under multi scan condition.
Scully (1987) is one of the earliest explorers investigated multi scan laser forming. He
developed curves revealing the relationship between bending angle (α) and number of
irradiations (n). Later, Sprenger et al (1994) showed that the decrease of absorption
coefficient, the increase of the sheet thickness, and work hardening of the material affect
the degressive courses of bending angle with increasing number of irradiation.
Lawrence’s works (2001) showed laser bending angle was only linearly proportional to
the number of irradiations when the latter was small. It is believed that the absence of
linearity observed when the number of irradiations was high is due to local material
thickening along the bend edge. More recently, Cheng and Yao (2002) built model for
multi scan laser to predict the mechanical properties and geometry change of formed
parts.
Cooling and heating rate study began from Ashby and Easterling (1984). They
presented a kinetic model that considers the rapid heating and cooling rate effects on
metallurgy of steel. Combining the solutions to the heat flow and the kinetic models
they predicted the near surface structure and hardness after laser treatment. Cheng and
Yao (2001) used theirs model to detail studying cooling effect in multi scan and single
scan laser forming. They found that cooling significantly reduces the total forming time

5
in multi scan laser forming, and cooling only moderately decreases material ductility
even after multi scan since the repeated work hardening is offset by repeated softening.
Their results help predict such effects on final dimensional accuracy and mechanical
properties.
Microstructure characterization study helps to reveal the reasons the materials’ properties
changed. Merklein et al (2001) demonstrated the changes in microstructure and
mechanical properties of some aluminum alloy by laser forming. They showed that the
resulting structures, grain structure and microstructure were analyzed both quantitatively
and qualitatively by optical and electron microscopy in order to examine the kind of
existing structure zone and their extent. Iordanova et al (2002) showed the
microstructure of cold-rolled low-carbon rimming steel changed after laser treatment, and
found that the texture becomes weaker and more scattered, which is due to the reversible
phase transformations occurring in the near surface region. Ramos (1997) showed that
microhardness of AlCuMg alloy drops after laser forming and nature aging time affects
the hardness. Laser forming processes of steel are often accompanied by recovery,
recrystallization and phase transformation (Cheng and Yao, 2002).
1.3 Systematic modeling approach
In this project, the systematic modeling approach will be based on interdisciplinary
applied sciences including heat transfer, materials science, and engineering mechanics.

6
As shown in Figure 1.3, the modeling approach combined five sub-models: a thermal
model, a microstructure model, a material property model, and a residual stress model, a
fatigue prediction model, and a fracture toughness model. The integrated model will be
developed based on existing codes (Cheng and Yao, 2002), such as integrated prediction
of microstructure and material property in heat-affected zone (HAZ) and incorporation of
the effects of phase transformations into flow stress prediction, this work will develop
fatigue life model and fracture toughness model.
1.4 Current problems and objectives of the thesis
With the research and development in laser forming growing fast, mechanical properties
of materials after laser forming has become more and more important. However, so far,
analysis of laser forming has been focused on prediction of geometry change, yield
strength, and microstructure change. Numerical and experimental investigations have
been carried out to understand laser forming process mechanisms and the effects of
process parameters on dimension and mechanical properties of the formed parts (Hsiao et
al, 1997; Magee et al, 1998; Bao and Yao, 1999). Recently, efforts have been put in
temperature and strain-rate dependent material properties for laser forming processes (Li
and Yao, 2000), convex laser bending based on buckling mechanism (Li and Yao, 2001),
and microstructure integrated modeling of laser forming (Cheng and Yao, 2002).
Therefore, it is crucial to study the mechanical properties of materials after laser forming,
such as fatigue life, fracture toughness, texture, etc.

7
The purpose of this work is to studying and predicting materials fatigue life and fracture
toughness after laser forming. This work serves for design of laser forming process
where fatigue life and fracture toughness of product has to be considered.
In chapter 2, a fatigue life model is built to better predict the fatigue life of laser formed
materials. Both mean stresses and mean strains are considered in the model.
Distribution of residual stresses and residual strains are simulated using a microstructure
integrated FEM model. The predicted results are validated though several experiments.
The fatigue life model is then applied to a series of laser heating conditions to see the
effects of process parameters on fatigue life. Finally, suggestions are made to improve
fatigue life after laser forming process.
In chapter 3, fracture toughness of sheet metal after laser forming is studied by numerical
analysis and experiment. Stress intensity due to residual stress is calculated based on a
microstructure integrated FEM model. The fracture toughness of sheet metal is
predicted based on experimental results and numeral analysis. Finally, microstructure
analysis is conduct to explain the findings.

8
Laser scanning direction
Laser beam
Figure 1.2 Metal plane after laser forming
Figure 1.1 Schematic of the laser forming process
Bend angle

9
Figure 1.3 Schematics of the proposed modeling approach
Initial and boundary conditions
Thermal model
Thermal field
Microstructure model grain growth
phase transformation
Material properties (constitutive equations, flow stress and hardness model)
Stress field
Fracture toughness model Fatigue life model
Microstructure (grain size and phase volume fraction)
Structural model

10
CHAPTER TWO
Fatigue Life Prediction after Laser Forming
2.1 Introduction
Laser forming, a hot working process that allows the bending of material without hard
tooling, has been attracting more attention recently since it can be utilized for complex
geometric shapes and hard-to-deformed materials. Laser forming process has been
investigated in applications of many materials, such as mild steel (Thomson and Pridham,
2001), stainless steels (Chen et al, 1998), aluminum and aluminum alloys (Merklein et al,
2001), Titanium and its alloys (Maher, 1998), silicon (Fruhauf et al, 1999 a, b), ceramics
(Chen et al, 1998), etc.
With the research and development in laser forming growing fast, it is crucial to study
mechanical properties of materials after laser forming. However, previous research of
laser forming has been focused on prediction of geometry change, yield strength, and
microstructure change. For laser forming to become a practical process, predicting
mechanical properties of materials after laser forming becomes more and more important.
This chapter will focus on prediction of fatigue life of sheet metal after laser forming.
The fundamentals of fatigue life are well established. Generally speaking, there are

11
stress-based and strain-based approaches. For the stress-based approach, Basquin's
model (Basquin, 1910) is most widely used. To account for mean stress effects on
fatigue, there have been the modified Goodman relation (Goodman, 1930), the Soderberg
relation (Soderberg, 1930), and the Morrow relation (Morrow, 1965) proposed. These
three models are mainly used in industries for the design of components that should not
fail by fatigue. According to these three models, the allowable alternating stress to have
infinite fatigue life with increasing tensile mean stress. The most popular strain-based
approach uses the Basquin-Coffin-Manson equation to predict fatigue life from strain
amplitude. This equation combines the Basquin model, which describes the relationship
between the elastic strain amplitude and the fatigue life, and the Coffin (Tavernelli and
Coffin, 1962) and Manson (1962) model, which considers the relationship between the
plastic strain amplitude and the fatigue life. This complicated strain-life equation,
although difficult to use, has been widely adopted for design of parts with finite
lives. The most common way to take into account of mean stress effects in strain-based
approach is the Smith-Watson-Topper method (Smith et al, 1970) which assumes that it is
the product of the maximum stress and the strain amplitude, rather than simply the strain
amplitude, that is the driving force for fatigue failure. This model however neglects the
potential effects of mean strain on fatigue life. Gong and Norton (1999) built three
models taking into account the effect of the stresses relaxation. Gong’s models
succeeded in predicting fatigue life under larger strain amplitude.

12
Laser forming differs from other working processes in that significantly higher heating
and cooling rates are involved. First of all, phase transformation, work hardening and
dynamic softening processes characterize laser forming like other hot working processes.
They have been considered in the FEM simulation of laser forming process of low carbon
steels (Cheng and Yao, 2002). Secondly, residual stresses and residual strains come with
the microstructure change. Both can be shown to be important in affecting fatigue life
with mean stresses contribute mainly to the elastic part and mean strains contribute
mainly to the plastic part. Hence, neither mean-stress nor mean-strain model is enough
to predict the fatigue life after laser forming.
In this chapter, a fatigue life model is built to better predict the fatigue life of laser formed
materials. Both mean stresses and mean strains are considered in the model.
Distribution of residual stresses and residual strains are simulated using a microstructure
integrated FEM model. The predicted results are validated though several experiments.
The fatigue life model is then applied to a series of laser heating conditions to see the
effects of process parameters on fatigue life. Finally, suggestions are made to improve
fatigue life after laser forming process.
2.2 A fatigue life model for laser forming
In general, tensile stresses are detrimental and compressive stresses are beneficial to
fatigue life. The first fatigue life models with mean stress effects considered mainly

13
focused on the detrimental effects of tensile mean stresses. Modified Goodman
relation, Soderberg relation, and Morrow relation are the three well-known models for
stress-based approach.
Modified Goodman relation: 1=+u
m
f
a
σσ
σσ
(2.1)
Soderberg relation: 1=+y
m
f
a
σσ
σσ
(2.2)
Morrow relation: 1=+f
m
f
a
Sσ
σσ
(2.3)
Where σa is alternating stress in the presence of mean stress; σm is mean stress; σf is fully
reversed fatigue limit; σu is ultimate stress; σy is tensile yield strength; and Sf is true
fracture stress.
Goodman model matches experimental observations quite closely for brittle metals where
σu is close to Sf, and Morrow model is similar to Goodman model in this case. And the
Morrow model is linear and easier to use. For ductile materials, Soderberg model
matches experimental better than others.
From these three models, it can be derived that for a specified fatigue life the allowable
alternating stress, sa, decreases as tensile mean stress, sm, increases. They have been
widely used in fatigue design of various manufacturing process. But none of these three
models is suitable for laser forming because of the presence of residual strains, of which
the effects are not taken into account. Both tensile and compressive mean stress exist
during and after laser forming.

14
Basquin model and Coffin-Manson model considered effects of elastic strain and plastic
strain amplitude on fatigue life respectively.
Basquin equation: bf
fe NE
)2('
2σε
=∆
(2.4)
Coffin-Manson equation: cff
p N )2('2
εε
=∆
(2.5)
Since total strain amplitude is the sum of elastic strain amplitude and plastic strain
amplitude, the relationship between total strain amplitude and fatigue life, which is called
as Basquin-Coffin-Manson model, can be obtained from equation 2.4 and 2.5. It is called
Basquin-Coffin-Manson model:
cff
bf
fpe NNE
)2(')2('
222ε
σεεε+=
∆+
∆=
∆ (2.6)
Where 2
eε∆ is elastic strain amplitude; 2
pε∆ is plastic strain amplitude; σf’ is fatigue
strength coefficient; εf’ is fatigue ductility coefficient; E is modulus of elasticity; b is
fatigue strength exponent; c is fatigue ductility exponent; and Nf is fatigue life.
Equations 2.4, 2.5, and 2.6 were derived for fully reversed loading conditions, where
effects of mean stress and mean strain were not present. However, after laser forming,
significant residual stresses and residual strains exist in sheet metal. Therefore, equation
2.6 has to be modified to consider mean stress and mean strain in the fatigue life
prediction of laser forming.
Laser forming differs from other shaping technique in principles. Both residual elastic
strain and residual plastic strain are developed after experiencing extremely high heating

15
and cooling rates. From the Basquin model and Coffin-Manson model, it is known that
mean stress mainly affects elastic part and mean strain mainly affects plastic part. We
propose here that both mean stress and mean strain effects can be considered by
modifying the Basquine-Coffin-Manson model. The total strain amplitude is the sum of
elastic strain amplitude and plastic strain amplitude.
The assumptions of this model are: First, the material’s fatigue strength coefficient
changes with mean stresses. Hence, σf’ is replaced with σf’-σm. This model considers
both tensile stress and compressive mean stress. Mean stress, σm, is positive for tensile
value and negative for compressive value. Secondly, mean strain, εm, reduce fatigue life
by exhausting some of the fatigue ductility, εf’, resulting in the remaining ductility as
εf’-εm. The absolute value of mean strain can reduce the fatigue life. Thus the model
that can be used in laser forming process is:
cfmf
bf
mfpe NNE
)2)('()2('
222εε
σσεεε−+
−=
∆+
∆=
∆ (2.7)
The first item is elastic part, which is decided by mean stress. The second item is plastic
part, which is decided by mean strain. Mean stresses relaxation is not considered since
insignificant mean stress relaxation occurred when strain amplitude is less than 1 %. In
this paper, strain amplitude is only 0.2 %. Gong’s experiment (1999) also proved that in
this range, the influence of mean stress relaxation is insignificant.
2.3 Experiments and simulation conditions
Carbon dioxide laser (CO2 laser) is used in the laser forming. The wavelength is 10.6

16
micron, and the beam diameter is 4 mm. The straight-line laser-forming scheme with
nature cooling is shown in Figure 2.1a. The scanning path is along the X-axis and the
direction perpendicular to the scanning path within the plate is defined as Y-axis. The
material is low carbon steel, AISI1010, and 80 mm by 80mm by 0.89mm in size. To
enhance laser absorption by the work piece, graphite coating is applied to the surface
exposed to laser. There is no melting involved in laser forming under the conditions in
this paper.
Fatigue life test specimens are cut by CNC along the scanning path in X direction. The
dimension of the specimen is shown in Figure 2.1b. The tests were arranged according
to three groups : P = 800W and v = 65mm/s laser forming; P = 692 W and v = 50mm/s
laser forming; basic material without laser forming. P and v refer to laser heating power
and scanning velocity respectively.
All the fatigue tests were performed on a closed-loop servo hydraulic materials testing
machine. Uniaxial loading was applied on the specimens at room temperature (295 K).
The testing frequency was 10 Hz. Failure was defined as the breaking of the specimen.
The cycle’s number was recorded as the fatigue life. In this paper, strain amplitude of
0.2% was applied to all specimens. The testings were conducted in an arbitrary order
within each group to eliminating the system error.
A commercial FEM code, ABAQUS, is used to solve the heat transfer and structural
problem similar to what has been reported by Cheng and Yao (2002). The modules on
recovery / recrystallization and phase transformation were implemented through

17
ABAQUS subroutines. Since the heat transfer and deformation are symmetric about the
vertical plane containing the scanning path, only half of the plate is modeled in the
numerical simulation. The symmetric plane is assumed to be adiabatic. The same
mesh model is used for the heat transfer analysis and structural analysis. Two adjacent
points in the middle of the symmetric plane are fixed in order to remove the rigid body
motion. All other points within the symmetric plane are assumed to move only within
the symmetric plane throughout the deformation process. In structural analysis, the
twenty-node element has no shear locking, no hourglass effect, and is thus suitable for a
bending-deformation-dominated process such as laser forming. In order to remain
compatible with the structural analysis, the same twenty-node element is used in heat
transfer analysis. The boundary conditions used include that all surfaces are cooled
through free convection with atmosphere. Surface heat flux follows q = q (x, t), surface
convection q = h (T - T0), where h = h (x, t) is the film coefficient, and T0 = T0 (x, t) the
surrounding temperature, and radiation q = A ((T-Tz)4-(T0-Tz)4), where A is the radiation
constant and Tz the absolute zero on the temperature scale used. A user-defined
FORTRAN program was used to model the heat flux due to the moving heating source.
2.4 Result and discussion
2.4.1 Modeling of fatigue after laser forming
2.4.1.1 Strategy of Modeling
The overall strategy is to develop a module on thermal/mechanical model of laser
forming, a module on phase transformation, and interface them with a fatigue analytical
life prediction model. The FEM model, which has been reported previously (Cheng and

18
Yao, 2002), computes thermal and mechanical variables (e.g., temperature, strain, and
strain rate). Residual stress and residual strain are also obtained. Given temperature
history, the phase transformation module determines volume fractions of different phases
depending on whether it is heating or cooling. For cooling stage, a continuous cooling
transformation (CCT) diagram together with semi-empirical models is used to determine
volume fractions of different phases. Figure 2.2 shows the superposition of cooling time
history of laser forming on CCT curve of AISI 1012 steel. It is obvious that near the top
surface, austenite will transform to martensite due to extremely high cooling rate
(~104K/s). There is no phase transformation taking place near bottom surface. The
phase structure from the microstructure module will be used to decide the constants that
are used in the fatigue life model. Finally, the residual stress and residual strain, and the
materials constants will be applied into the fatigue life model of laser forming discussed
in section 2.4.1.3.
2.4.1.2 Mean Stress and Mean strain
After laser forming, residual stress and residual strain are equivalent to mean stress and
mean strain respectively in the fatigue life model. The residual stresses and residual
strains have three normal components in three directions, X, Y, Z. During laser forming
process, thermal expansion take places mainly in X and Y direction. It is found that
residual stress and residual strain in thickness direction is negligible. When specimens
are cut from the plane, the residual stresses and residual strains in Y direction are released
and turn to zero. Hence, in this project, residual stress in X direction, S11, is mean stress,
and residual strain in the same direction E11, is mean strain.

19
Figure 2.3 and figure 2.4 show the distribution of mean stresses and the mean strains on
the Y-Z cross section after laser forming with laser heating power of 800W and scanning
velocity of 0.05m/s. Figure 2.3a is the contour picture of the stresses on the Y-Z cross
section. Figure 2.3b plot the residual stress change in Y direction on the top surface. It
shows that the highest tensile residual stress appears at the center of laser scanning path
(Y=0). The tensor residual stress gradually decreases to zero and then transit to
compressive stress in a very short distance. Compressive residual stress dominates
beyond the heat-affected-zone (HAZ), approximately 4 mm from the center of the laser
scanning path, and gradually decreases to zero near the edge of the plate.
Figure 2.4a shows the contour of the residual strain on the Y-Z cross section under the
same condition as in Figure 2.3. Figure 2.4b plot the residual strain change in Y
direction on the top surface. It shows that there is a very large compressive residual
strain at the center of laser scanning path (Y=0). The compressive residual strain
decreases to zero rapidly and then transit to tensile residual strain near the boundary of
heat-affected-zone. Tensile residual strain dominates beyond the heat-affected-zone.
2.4.1.3 Analytical fatigue life
Fatigue life of every node in the sheet metal can be obtained according to fatigue life
predicting model (Equation 2.7, and coefficients listed in table 2.1). Figure 2.5a shows
contour of fatigue life on Y-Z cross section with laser heating power of 800W and
scanning velocity of 0.05m/s. Figure 2.5b plots the fatigue change in width (Y)
direction on the top surface. As shown, laser scan center have the highest fatigue life,
then fatigue life decreases to minimum near the boundary of HAZ (figure 2.6).

20
Fatigue life increases gradually beyond heat-affected-zone to the value of fatigue life
without laser forming. Fatigue life is longest at the center of laser scanning path
because the largest compressive residual strain exists. The fatigue life model considers
both mean stress and mean strain. Mean strains mainly influence the plastic part, while
mean stresses mainly influence the elastic part. At the center of laser scanning path,
although mean stress is tensile, the fatigue life is mainly decided by the large compressive
mean strain. It is obvious that large compressive mean strain increases fatigue life
significantly. Microstructure is also considered in the fatigue life model. At the
heat-affected-zone, microstructure changes from austenite to martensite for high cooling
rate. It shows in figure 2.2. That is, martensite dominates in the heat-affected-zone.
This degrades material’s fatigue life because martensite is a kind of brittle phase and does
not have long fatigue life generally. Therefore, once the large residual compressive
strain is released, the fatigue life of materials in heat-affected-zone will be lower than that
in non-heat-affected-zone. It shows in both figure 2.5a and 2.5b that the weakest place
is around the boundary of heat affected zone. This is because residual strain transits
from compressive to tensile. Mean strain still dominates near the boundary of
heat-affected-zone where plastic strain dominates. Another reason is that near the
boundary of heat-affected-zone, phase structure changes across the boundary from
austenite/martensite to ferrite/pearlite (Cheng and Yao, 2002). This non-homogeneous
microstructure will be the crack initiation place when materials experience cyclic load.
2.4.2 Validation of fatigue life modeling
2.4.2.1 Comparison with fatigue testing

21
There are two conditions laser forming are used to test: P = 692 W, v = 0.05 m/s and P
= 800 W, v = 0.065 m/s. The average fatigue life of the first group, P = 692W, v = 0.05
m/s, is 28926, while the simulation result is 29018. The average fatigue life of the
second group, P = 800W, v = 0.065 m/s, is 27683, and the simulation result is 28906.
The comparing results are shown in table 2.2.
It is evident that simulation results are close to the experiment results. Considering the
errors, the model can give the correct fatigue life prediction.
2.4.2.2 Microstructure analysis
Figure 2.7 shows the SEM pictures on the surface of a sample after cycled 20,000 times
by fatigue testing machine. The sample was not broken by the fatigue test. Figure 2.7a
shows a crack on the surface of the sample. This crack lies within the heat-affected
zone. Figure 2.7b is a magnified picture shows the end of the crack, which gives the
second crack directions. Figure 2.7b shows that the crack initiates around the boundary of
heat-affected-zone and propagates toward the center of the sample. This is consistent
with the results from modeling that fatigue life around the boundary of heat-affected-zone
is the lowest. The reason why the crack will propagate toward the center instead of the
edge is that the high compressive residual strain is released after crack initiates.
Therefore, the factor for the long fatigue life in the center of heat-affected-zone
disappears. Generally, microstructure of heat-affected-zone dominated by martensite has
lower fatigue life than that of ferrite/pearlite.
To reveal relative fatigue life in different regions, SEM pictures were taken on cross

22
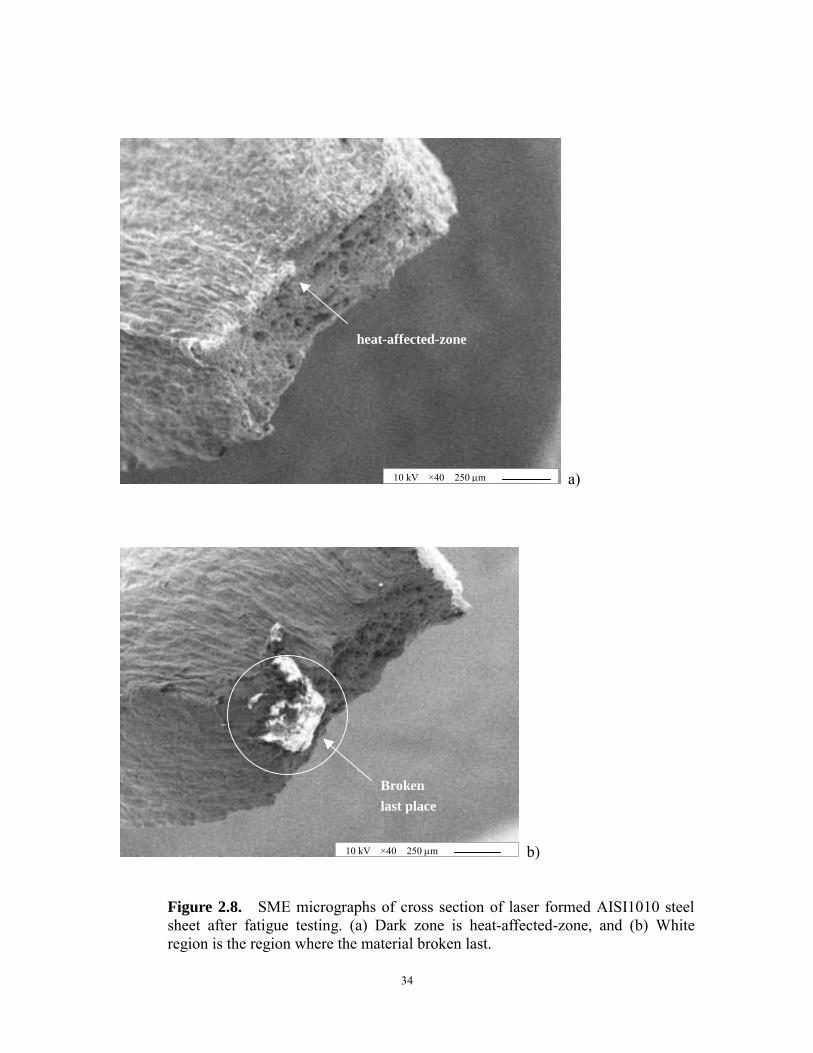
section after fatigue testing. Figure 2.8 shows the SEM micrographs of testing sample
on the Y-Z cross section after broken by fatigue testing. It is seen that there are lots of
dimples appearing in the heat-affected-zone, while the non-heat-affected-zone does not
have dimples. This is because crack initiates from the boundary of HAZ and propagates
through the HAZ. The materials in non-HAZ show more ductile property. It also
shows in figure 2.8b that the relatively white region where the materials broke last is
within non-HAZ.
To further reveal the relationship between the microstructure and fatigue life, SEM
pictures were taken after fatigue testing in heat-affected-zone (figure 2.9a), boundary of
heat-affected-zone (figure 2.9b), and non-heat-affected-zone (figure 2.9c). We know
that in ductile materials, the crack moves slowly and is accompanied by a large amount of
plastic deformation. Stresses release mainly by plastic deformation. The cracks will
usually not extend unless an increased stress is applied. On the other hand, in brittle
fracture, cracks spread very rapidly with little or no plastic deformation. Stress release
only by crack extension. The cracks that propagate in a brittle material will continue to
grow and increase in magnitude once they are initiated. It is seen from figure 2.9a that
there are lots of dimples in heat-affected-zone. And only parts are plastic deformation,
which different from that showed in Figure 2.9 c. That is, the cracks will quick extend
when stress applied in heat-affected-zone. Figure 2.9c shows the microstructure of the
non-heat-affected-zone, with lots of fatigue striations, which are generated by plastic
deformation. That is, at the non-heat-affected-zone, the materials are ductile. When
stresses are applied, the plastic deformation will release a majority of load. And the
cracks will extend slowly. Figure 2.9b shows the microstructure around the boundary of

23
heat-affected-zone. There is a clear interface between the heat-affected-zone and
non-heat-affected-zone. It is obvious that the materials within HAZ contain lots of
brittle dimples, while the materials in non-HAZ contain ductile striations.
To reveal where crack initiates, another SEM picture (figure 2.10) was taken around the
boundary of HAZ. It is evident that there is a crack initiate right in the boundary of
HAZ. This crack propagates along the boundary. Microstructure analysis also shows
that the presented model can predict relative fatigue life in the laser formed sample, and
explain where crack initiates and propagates during fatigue testing.
2.4.3 Prediction of fatigue life under different laser heating conditions
Figure 2.11 shows the prediction of fatigue life of AISI 1010 steel after laser forming
with increasing scanning velocity at two constant laser heating power levels ( P = 600W
and 800W). It is seen that fatigue life increases with increasing laser-scanning velocity.
After laser heating power of 600W and scanning velocity of 0.065 m/s is applied, the
fatigue life of the sheet metal is about 32600 cycles. Fatigue life drops to about 30300
cycles with laser scanning velocity of 0.05 m/s and the same laser heating power. This
is because laser-heating intensity increases with lower laser scanning velocity. It will
generate higher thermal gradient and higher tensile residual stresses across the boundary
of heat-affected-zone. As discussed in the analytical fatigue life, the tensile residual
stress around the boundary of heat-affected-zone is one of the most important reasons for
degrading of fatigue life after laser forming. In the meantime, with higher heating
intensity and higher thermal gradient, the volume of brittle phase, such as martensite in
the heat-affected-zone, also increases. The microstructure around the boundary of

24
heat-affected-zone is more non-homogenous, which results in lower fatigue life.
Figure 2.12 shows the prediction of fatigue life after laser forming with increasing
laser-heating power at two constant scanning velocities ( v =0.05m/s and 0.065m/s). It
shows that at the same laser scanning velocity, fatigue life decreases with increasing
laser-heating power. After laser scanning velocity of 0.05 m/s velocity and heating
power of 600 W, the fatigue life of plane steel is about 30300 cycles. Fatigue life drops
to 28000 cycles with lower heating power of 800W at the same laser forming velocity.
With increasing laser-forming velocity, the difference in fatigue life with laser heating
power of 600 W and 800 W becomes more significant. At scanning velocity of 0.08m/s,
the difference in fatigue life is about 3000 cycles, while the difference widens to about
2300 cycles in 0.05 m/s. At the same scanning velocity, laser-heating intensity increases
with higher laser heating power. This will generate higher thermal gradient and higher
tensile residual stresses and larger volume of inhomogeneous microstructure across the
boundary of heat-affected-zone, which degrades materials fatigue life after laser forming.
In order to integral analyze the energy effect in laser forming process, the conceptions of
line energy is introduced in (Li et al, 2003). Line energy is defined as P/v (P is the laser
power, v is scanning speed), which represents the laser energy input per unit length along
the scanning path (Li and Yao, 2001). Figure 2.13 shows the prediction of fatigue life
after laser forming decreasing with laser line energy increasing. It shows that with
increasing of laser energy input, the material’s fatigue life will be degraded, because
higher thermal gradient will be generated with higher laser energy input.

25
2.4.4 Enhancement of fatigue life after laser forming
From the analysis of fatigue behaviors of laser formed low carbon steel, two most
important reasons that degrades the fatigue life is tensile residual stress around the
boundary of heat-affected-zone, and non-homogenous microstructure including brittle
and ductile materials cross the boundary of heat-affected-zone.
To reduce the tensile residual stress and strain, annealing could be applied after laser
forming. Laser forming conditions could be manipulated such that tensile strain around
the boundary of heat-affected-zone is minimized. To reduce the negative effects of
non-homogenous microstructure, additional tempering could be applied after laser
forming to form tempered martensite with increased fatigue life. Alloying could be
another method to prevent martensite or other brittle phased from forming. Martensite
is formed because the extremely high cooling rate (~104) force the cooling curves falling
into the martensite region in CCT diagram. Therefore, cooling curve could be
manipulated by applying a dual laser beam coming after the primary laser beam to heat
the just scanned region, however reduce the cooling rate such that cooling curve do not
fall into martensite. This dual laser beam could also serve as annealing tool.
2.5 Conclusions
An integrated fatigue life modeling for the laser forming process of low carbon steel has
been presented in this chapter. Incorporated with FEM, mean stress, mean strain, and
microstructure of material after laser forming has been considered in this model.
Application of the present model in the prediction of fatigue life has validated through

26
fatigue testing and microstructure analysis. SEM analysis also reveals some reasons
why laser formed low carbon steel has lower fatigue life than before laser forming. The
tensile residual strain and non-homogenous microstructure around the boundary of
heat-affected-zone are two most important reasons why the fatigue life of low carbon
steel after laser forming reduces. Parametric study has been completed to predict the
fatigue life based on the present model under various laser-heating conditions.
Suggestions to enhance the fatigue life after laser forming have been made based on the
several reasons that degrade the fatigue life. The present model serves as an enabler for
design of laser forming process, where fatigue life of product has to be considered.

27
Table 2.1. Coefficients used in fatigue model
Low carbon steel AISI1010
Dual phase after laser forming
Fatigue strength coefficient σf’ 607 MPa 752MPa
Fatigue ductility coefficient εf’ 0.1493 0.2417 Fatigue strength exponent b -0.1128 -0.0701 Fatigue ductility exponent c -0.4359 -0.5221 Modulus of elasticity E 200 G 200 G
Table 2.2. Fatigue testing results compared with prediction results
Condition Prediction results Test results Error
P=800 W v=0.065 m/s 28906 cycle 27683 cycle 4.4 %
P=692 W v=0.05 m/s 29018 cycle 28926 cycle 0.3 %
Without laser forming 37343 cycle 36223 cycle 3%

28
1E-3 0.01 0.1 1 10 100 1000 200 400 600 800
1000 1200 1400 1600 1800 2000
CCT [Boyer and Gray, 1977]
Laser forming (bottom surface) P=800W V=50mm/s
equilibrium eutectic temp.
70K/s
30K/s
20K/s
168K/s 10K/s
Laser forming (top surface) P=800W V=50mm/s
P F M B
A Temp. (K)
Time (s) Figure 2.2. Superposition of cooling time history of laser forming from
FEM results on CCT curve of AISI 1012 steel (Boyer and Gray, 1977)
4.2 mm
80mm
80mm
X
Laser scanning path
Z
Y
Y
0.89mm
0
0
x
7.5mm
Laser scanning path
2 mm 4.8mm
29.2mm
(a) (b)
Figure 2.1. Schematic view of (a) Geometry of workpiece and coordinate system (b) Dimension of fatigue testing specimen

29
-1E8
-6.01E7
-1.98E7
2.04E7
6.06E71.01E8
1.41E81.81E8
2.21E82.62E8
3.01E83.42E8
3.82E84.22E8
4.62E85.02E8
7.3E4
7.3E4
7.3E4
7.3E4
7.3E4
5.8E4-4.8E4
-6.4E4
-1.1E5
-1.1E5
-1.1E5
-1.1E5
-1.1E5
-1.1E5
-1.1E5
-1.1E5
-1E5
-8.7E4
-8.7E4
-8E4
0 3 6 90.0
0.2
0.4
0.6
0.8
Z ax
is p
ositi
on (m
m)
Y axis position (mm)
0 10 20 30 40
0.0
2.0x10²
4.0x10²
6.0x10²
P=800W V=0.05m/s
Res
idua
l Stre
ss (M
Pa)
Y axis position (mm)
(b)
Figure 2.3 Residual stress distribution on the Y-Z cross section of the specimen (P=800W, v=0.05 m/s) (a) Residual stress contour, and (b) residual stress distribution in Y direction on the top surface

30
-5.3E-4
-4.1E-4-3E-4
-1.8E-4
-1.8E-4
-6.8E-5
0 3 6 90.0
0.1
0.2
0.3
0.4
0.5
0.6
0.7
0.8
0.9
1.6E-44.6E-5
Z ax
is p
ositi
on (m
m)
Y axis position (mm)
(a)
0 10 20 30 40
-0.0012
-0.0008
-0.0004
0.0000
0.0004
0.0008
P=800W V=0.05m/s
Res
idua
l stra
in
Y axis position (mm) (b)
Figure 2.4 Residual strain distribution on the Y-Z cross section of the specimen (P=800W, v=0.05m/s) (a) Residual strain contour (b) Residual strain distribution in Y direction on the laser-forming surface.

31
0.000 0.0050.0000
0.0002
0.0004
0.0006
0.0008
1E55E51E6
6E63E6
1.6E72.6E7
3.3E4
3.3E4
1E7
3.2E4
2.7E4
Z ax
is p
ositi
on (m
)
Y axis position (m)
(a)
0.00 0.01 0.02 0.03 0.0410000
100000
1000000
1E7
P=800W V=0.05m/s
Fatig
ue li
fe o
n to
p su
rface
Y axis position
(b) Figure 2.5 Fatigue life distribution on Y-Z cross section (P=800W, v=0.05m/s) (a) Fatigue life contour, and (b) Fatigue life distribution in Y-axis direction on the top surface

32
(a)
(b)
Figure 2.6 a) Schematic of typical regions on the Y-Z cross section of AISI1010 steel sheet after laser forming, and b) SEM micrograph on the Y-Z cross section, perpendicular to the scanning path, showing the heat affected zone, non-heat affected zone and the boundary of HAZ and non-HAZ.
Laser trace low carbon steel
1
2
3
Heat affected zone (HAZ)
Boundary of HAZ
Non- HAZ

33
a)
b)
Figure 2.7 SEM micrographs of cracks on the surface of laser formed AISI1010 steel sheet after fatigue testing. a) Crack on the heat-affected zone, and b) the end of the crack and a second crack, showing the crack is initiated around the boundary of HAZ and propagates towards the center of the sample.
Edge
crack
Edge
2.0 kV ×200 50 µm
34
a)
b) Figure 2.8. SME micrographs of cross section of laser formed AISI1010 steel sheet after fatigue testing. (a) Dark zone is heat-affected-zone, and (b) White region is the region where the material broken last.
heat-affected-zone
Broken last place
10 kV ×40 250 µm
10 kV ×40 250 µm

35
a)
b)
c) Figure 2.9 SME micrographs of laser forming AISI1010 steel sheet after fatigue testing. a) heat-affected-zone b) interface of heat-affected-zone and non-heat-affected-zone c) non-heat-affected zone.
2.0 kV ×1000 10 µm
2.0 kV ×1000 10 µm
2.0 kV ×1000 10 µm

36
Figure 2.10 SME micrograph shows the details around the boundary of heat-affected-zone on the cross section of laser formed AISI sheet steel after fatigue testing, showing the crack is initiated around the boundary of heat affected zone.
Crack propagates direction
crack initial
2.0 kV ×1000 5 µm

37
0.050 0.055 0.060 0.065 0.070 0.075 0.08027000
28000
29000
30000
31000
32000
33000
34000
P=600W P=800W
Fatig
ue li
fe
Laser Scanning Velocity (m/s)
Figure 2.11 Fatigue life of AISI1010 sheet after laser forming vs. laser scanning velocity
under difference laser heating power levels
600 650 700 750 800
28000
29000
30000
31000
32000
33000 V=0.05m/s V=0.065m/s
Fatig
ue L
ife
Laser Heating Power (W)
Figure 2.12 Fatigue life of AISI1010 sheet after laser forming vs. laser heating power
under different laser scanning velocities.

38
27000
28000
29000
30000
31000
32000
33000
34000
0 5000 10000 15000 20000
line energy ( J /m )
fatigue life
Figure 2.13 Fatigue life of AISI1010 sheet after laser forming vs. laser line energy

39
CHAPTER THREE
Experimental Study and Computer Simulation on
Fracture Toughness of Sheet Metal after Laser Forming
3.1 Introduction
In recent years, there have been considerable interests in the applications of laser forming
in industries, such as aerospace, automobile, shipbuilding, semiconductor industries, etc.
With the interests in laser forming growing fast, mechanical properties of materials after
laser forming have to be considered seriously in the design of laser forming process.
This chapter will focus on fracture toughness of sheet metal after laser forming.
The fundamental of fracture toughness of metals has been well established for more than
one century. The most widely used models to describe materials’ fracture toughness are
based on stress intensity model. However investigations on the fracture toughness of
sheet metal only started three decades ago because engineering materials with thinner
sections had not been considered as load bearing structural parts for a long time. Liu
and his co-workers (Liu and Kuo, 1978; Liu, 1981; Liu and Ke, 1997) first suggested
some guidelines to assess fracture criteria for thin plates of structural materials. In the
last five years, many efforts have been made to understand the fracture toughness of
homogenous sheet materials. For instance, Koval et al (1997) tested the fracture
toughness of molybdenum sheet in temperature range –196oC-300oC. It was found that
there is no monotonous temperature dependence of fracture toughness of molybdenum

40
sheet because of the change in cleavage crack nucleation mechanism. Singhal et al
(1999) tested the fracture toughness of Ti-62222 alloy sheet, which was exposed in high
temperature long time. He found that the fracture toughness of this sheet does not
degrade after exposure to high temperature for a long time. Rogers and Hancock (2001)
reported the fracture resistance properties of G550 sheet steel that are loaded in tension.
They built FEM models to get the relationships between applied stress and crack length,
applied stress and material transverse thickness, applied stress and crack geometry shape,
applied stress and the number of cracks. Kulkarni et al (2002) presented a simple
experimental technique to obtain fracture criteria of extra deep-drawn (EDD) steel sheets.
They also examined the effects of thickness of steel sheets on their fracture criteria.
Chabanet and his co-workers (2003) studied on 2024 aluminum sheet. They applied
CTN-model and CZM-model to get the ductile crack growth parameters under monotonic
loading. They optimized the fracture properties of 2024 aluminum sheet based on the
crack growth parameters of various geometries.
Although many methodologies have been built to describe the facture toughness of
various sheet metals, they could not be adopted for the fracture toughness of sheet metal
after laser forming because of the uniqueness of laser forming process. Laser forming
differs from other manufacturing processes in that significantly high heating and cooling
rates are involved. First of all, microstructure of sheet metal after laser forming is no
longer homogeneous. Laser forming is characterized as phase transformation, work
hardening and dynamic softening processes. They have been considered in the FEM
simulation of laser forming process of low carbon steels (Rogers and Hancock, 2001).
Secondly, residual stresses and residual strains are significant due to the large thermal

41
gradient in thickness direction. The large residual stress changes the stress intensity
inside sheet metal significantly and has to be taken into account in fracture toughness.
In this chapter, fracture toughness of sheet metal after laser forming is studied by
numerical analysis and experiment. Stress intensity due to residual stress is calculated
based on a microstructure integrated FEM model. The fracture toughness of sheet metal
is predicted based on experimental results and numeral analysis. Finally, microstructure
analysis is conduct to explain the findings.
3.2 Background and fracture toughness model
3.2.1 Basic theories
According fracture Mode I, stress intensity factor K can be expressed as (Courtney,
1990):
K= σ (π c)1/2 f(c/a) (3.1)
Where σ is nominal stress applied to the specimen, c is the crack length, and f(c/a) is a
function of the geometry of the specimen, which can be obtained via mechanics analysis
for a large number of presumed crack geometries and are readily available in
fracture-mechanics reference material. Stress intensity factor changes with stress and
geometry of the specimen. However, stress intensity factor, K, cannot grow to a value
larger than the critical stress intensity factor, Kc. When applied stress reaches to its
maximal, the stress intensity factor approaches critical stress intensity factor, Kc, which is
expressed as (Courtney, 1990):
Kc= σmax (π c)1/2 f(c/a) (3.2)

42
When the applied nominal stress reaches the maximum, the critical stress intensity factor
changes only with the geometry parameter of the specimen. Usually in thin sections,
where plane-stress conditions prevail, crack extension requires more energy in the form
of plastic work and thus Kc is higher; whereas with the thickness of the specimen
increasing, plane strain conditions emerge, where it is more difficult for plastic
deformation to occur ahead of the tip of the crack and thus Kc is lower (Rogers and
Hancock, 2001). As showing in Fig 3.1 (Shi and Jin, 1998), Kc increases first then
decreases with the thickness of the specimen increasing. Kc is closer to Kic with
thickness of materials increasing. Kic, which will not change with the thickness
increasing, is one of critical physical properties of material independent on geometry.
In this chapter, since sheet material is to be investigated, it is Kc not Kic that is to be
evaluated. The presented model will consider not only the maximum nominal stress,
which includes residual stresses and applied stresses, but also the geometry parameters of
the specimen, for example, the thickness of sheet metal and crack’s length.
3.2.2 Fracture toughness model for sheet material without residual stresses
According to equation 3.2, Kc changes with the applied max nominal stress σmax and
geometry parameters. At the same time, according to the specimen and the test method
of this project, the function f(c/a) can be expressed as (Courtney, 1990) :
])(9.638)(1017)(7.655)(5.1856.29[1)/( 432
ac
ac
ac
acacf +−+−=
π (3.3)
Substituting equation 3.3 into equation 3.2, we have:

43
])(9.638)(1017)(7.655)(5.1856.29[ 432max a
cac
ac
accK c +−+−=σ (3.4)
Where σmax is the max stress load on the specimen, a is the specimen width, and c is the
crack length. The dimension of the specimen is shown in figure 3.2.
3.2.3 Fracture toughness model for sheet material with residual stresses
Residual stresses are significant due to large thermal gradient exists along thickness
direction. The residual stresses can be considered as stresses loading on the specimen in
advance. Hence, the maximum stresses, σmax, which the material can sustain can be
divided into two parts: one is residual stress, σres, and the other is applied stress, σapply.
That is:
σmax= σres + σapply (3.5)
Substitute equation 3.5 into the equation 3.2:
Kc= (σres + σapply) (π c)1/2 f(c/a)= σres (π c)1/2 f(c/a)+ σapply (π c)1/2 f(c/a) (3.6)
Where the function f(c/a) is also expressed in equation 3.3. In equation 3.6, the first part
can be express as Kres, which is the stress intensity factor decided by residual stress:
Kres=σres (π c)1/2 f(c/a) (3.7.1)
The second part, σapply(πc)1/2 f(c/a), can be express as Kapply, which is the stress intensity
factor decided by applied force.
Kapply=σapply (π c)1/2 f(c/a) (3.7.2)
Hence, sheet metals’ fracture toughness, Kc , can be derived by the following relationship:
Kc=Kres+ Kapply (3.8.1)
If the Kres equal to zone, equation 3.8.1 can be simplified to the following expression for

44
sheet metals without residual stresses.
Kc= Kapply (3.8.2)
The function f(c/a) can also be expresses by equation 3.3. Substituting equation 3.3 into
equation 3.7.1 and 3.7.2 respectively, we get:
])(9.638)(1017)(7.655)(5.1856.29[ 432
ac
ac
ac
accK resres +−+−= σ (3.9.1)
])(9.638)(1017)(7.655)(5.1856.29[ 432
ac
ac
ac
accK appliedapplied +−+−= σ
(3.9.2)
3.3 Experiment and simulation conditions
Carbon dioxide laser (CO2 laser) is used in the laser forming. The wavelength is 10.6
micron, and the beam diameter is 4 mm. The straight-line laser-forming scheme is
shown in Fig 3.3. The scanning path is along the X-axis and the direction perpendicular
to the scanning path within the plate is defined as Y-axis. The material is low carbon
steel, AISI1010, and 80 mm by 80mm by 0.89mm in size. To enhance laser absorption
by the work piece, graphite coating is applied to the surface expensed to laser. There is
no melting involved in laser forming under the conditions in this project.
The test specimens were machined on CNC to the size shown in Figure 3.2, with a notch
placed in one side. There are three groups of specimens. Group A are the samples
with the notch in the center of the laser scanning path; group B are the samples with the
notch around the boundary of heat-affected-zone on top surface; Group C are the samples

45
with the notch in the materials without laser forming. The fracture crack of every
specimen was made in fatigue machine by applying 30% of the yield strength. The
crack length was then measured under microscope. Test specimens were cut with only
one notch because of the difficulty in accurately machining a notch of identical
dimensions on either side of the specimen and the difficulty in developing fatigue cracks
of identical length on both sides. The details of dimensions of the notch specimen are
showed in figure 3.2. The gripped end of each test specimen was 25 mm. According
Rogers and Hancock (2001), the sample should in following range: L/b>=2.0 and
c/a<=0.6. The specimens used in this research satisfy these requirements. Here,
L/b=1.5 and c/a=0.3~0.4.
The basic test procedure can be found in ASTM E338 and E339. Tensile testing for the
fracture toughness of sheet metal was completed in an Instron material testing system.
The specimen was loaded to broken with a head-moving rate of 0.1mm/sec. The load vs.
deflection was plotted to obtain the maximum load P, which is the maximum load before
the linear relationship between load and deflection ends. Load-deflection plot is called
load-load line displacement plot (Kulkarni et al, 2002). Figure 3.4 schematically gives a
load-deflection plot of a specimen after laser forming. P is then used to determine Kapply
(Srawley and Brown ,1975).
)/( acfaB
PapplyK = (3.10)
where B is the thickness of the specimen, 0.89mm, P is maximum load, c is the crack
length, a is the width of the specimen, 20 mm, and f(c/a) is the function of the geometry

46
of the specimen.
3.4 Results and discussion
3.4.1 Overall strategy
The overall strategy is to derive the fracture toughness of sheet metal based on the
fracture toughness model with residual stresses discussed in section 3.2.3. First, the
stress intensity, Kres, is obtained based on the residual stress from thermal/mechanical
simulation of laser forming. The FEM model, which has been reported previously
(Rogers and Hancock, 2001), computes thermal and mechanical variables (e.g.,
temperature, strain, and strain rate). Residual stress and residual strain are also obtained.
Secondly, fracture toughness testing of sheet metal is conduct to measure stress intensity
at fracture due to applied stress, Kapply. The details of the testing have been described in
section 3.3. Finally, fracture toughness of sheet metal without residual stress, Kc, is
obtained by sum of the two stress intensity: Kapply and Kres. This stress intensity is the
fracture toughness only considering the microstructure after laser forming.
Because the residual stress is non-homogenous throughout the sheet metal, a contour of
Kres, will be plotted. However, Kapply could only be measured point by point. Thus two
points will be selected to measure Kapply, where the residual tensile stress and residual
compressive stress are maximum respectively. By analyzing the Kc of these two points,
fracture toughness of the sheet metal will be evaluated.

47
3.4.2 The stress intensity of sheet metal due to residual stress after laser forming
Residual stresses under different laser forming parameters (power and scan velocity) can
be obtained. The residual stresses and residual strains have three normal components in
three directions, X, Y, Z. During laser forming process, thermal expansion take places
mainly in X and Y direction. It is found that residual stress and residual strain in
thickness direction is negligible. When specimens are cut from the plane, the residual
stresses and residual strains in Y direction are released and turn to zero. Hence, in this
project, residual stress in X direction, S11, is taken as residual stress.
Figure 3.5a and 3.5b gives distribution of residual stress distribution on Y-Z cross section
after the laser forming with laser heating power (P) of 800 W and scanning velocity (v) of
0.05 m/s. Figure 3.5a is the contour of the stresses on the Y-Z cross section. Figure
3.5b plot the residual stress change in Y direction on the top surface. It shows that the
maximum tensile residual stress appears at the center of laser scanning path (Y=0). The
tensor residual stress gradually decreases to zero and then transit to compressive stress in
a very short distance. Compressive residual stress dominates beyond the
heat-affected-zone and gradually decreases to zero near the edge of the plate.
Given a crack length (6mm) and laser forming parameters (P = 800W, and v = 0.05 m/s),
residual stress intensity factor of every point in the sheet metal can be obtained. Figure
3.6 shows the contour of Kres on the Y-Z cross section based on the residual stress and
stress intensity model (equation 3.7.1). It is seen that at the center of laser scanning path
(Y=0, Z=0.89mm), the Kres is positive maximum, while the Kres is negative maximum
near the edge of heat-affected-zone on top surface. Therefore, the center of laser
48
scanning path, point A, is selected as one of the two points for analyzing Kc because its
maximum tensile residual stress and highest positive Kres. The other point, B, near the
edge of heat-affected-zone on top surface, is selected because it’s maximum compressive
residual stress and highest negative Kres.
For the residual intensity factor of point A, the relationship between the crack length and
residual intensity factor, Kres-A, is shown in the Figures 3.7. Points A is selected for the
maximum tensile residual stress, which degrades its Kapply because the result of Kres-A is
positive. It is shown in figure 3.7 that under the same laser scanning velocity, Kres-A
increases as the crack increases. This is because with the crack length increasing, stress
intensity increase and the material at the notch become more fragile. At the same crack
length, Kres-A decreases with scanning velocity increasing. This is because laser heating
intensity and thermal gradient decrease with scanning velocity increasing. Thus less
residual tensile stress exists after laser forming. Similarly, the relationship of crack and
residual intensity factor is plotted in figure 3.8 with different laser heating power levels.
At the same crack length, the residual Kres increase with laser heating power increasing.
This is because laser heating intensity and thermal gradient increases with laser heating
power increasing. Therefore, larger residual tensile stress is developed after laser
forming.
For the residual intensity factor of point B, the relationship between the crack length and
residual intensity factor, Kres-B, is shown in the Figures 3.9 and 3.10. The point B is
different from the point A in that maximum compressive residual stress instead of
maximum tensile residual stresses (see figure 3.5b) exists. Therefore, the result of Kres-B

49
is negative instead. This will enhance the Kapply at point B. Figure 3.9 shows under same
laser forming power, absolute value of Kres-B increases with crack length increasing.
This is also because with increasing crack length, stress intensity increases and the
material at the notch becomes more fragile. Figure 3.10 shows under same laser
scanning velocity, absolute value of Kres-B increases with crack length increasing. At the
same crack length, absolute value Kres-B increases with laser forming power increasing.
This because increasing crack length, stress intensity increase and the material at the
notch becomes more fragile. Figure 3.11 summarize how Kres-B changes with laser
forming parameters with crack length constant. It shows that the absolute value of Kres-B
increases with laser forming velocity decreasing, and laser heating power increasing.
This is because laser heating intensity and thermal gradient increases with laser heating
power increasing and scanning velocity decreasing. Therefore, larger residual
compressive stress is developed after laser forming. Figure 3.12 shows that absolute
value of Kres-B increases with laser forming line energy increasing. This is because
laser-heating intensity increases with laser energy input, then higher compressive residual
stresses are left in sheet metal after laser forming.
3.4.3 The critical stress intensity of sheet metal due to applied load
The critical stress intensity factor due to applied load, Kapply, can be derived from equation
3.3. Table 3.1 shows the test results with the crack length 6.5mm, laser heating power
700W and scanning velocity 0.065 m/s.
It is evident that the Kapply at point A after laser forming is higher that before laser
forming, while Kapply at point B decreases after laser forming. Therefore, after laser

50
forming point B is a weak point where the fracture toughness is the lowest when the sheet
metal are applied with impact load. This is because although the residual stress is
compressive and is beneficial to Kapply, the non-homogenous microstructure around the
boundary of heat affected zone result in significant stress concentration when
experiencing impact load. In the center of laser scanning path, although the residual
stress is tensile and is detrimental to Kapply, after laser forming the recrystallized fine grain
and tempered martensite / banite strengthen the material and enhance the fracture
toughness around the center of laser scanning path. The fracture toughness due to the
microstructure after laser forming will be discussed in detail in the next section.
3.4.4 Fracture toughness of laser forming material, Kc
It should be noted that Kc is material’s real resistance to fracture and is independent of
residual stress and applied load. Kc only depends on the microstructure and geometry of
the testing sample. It was measured that the sheet metal’s Kapply is equal to 140 MPa m1/2
before laser forming. Assuming the residual stress level in the material before laser
forming is very low compared to that after laser forming, Kc is also equal to 140 MPa
m1/2 according to equation 3.8.2.
Because of non-homogenous microstructure after laser forming due to the large thermal
gradient, the fracture toughness of sheet metal is also non-uniform. According to the
analysis in section 3.4.1 and 3.4.2, points A and B are selected representing the fracture
toughness of sheet metal after laser forming. At point A, the center of laser scanning
path, Kc= Kapply+Kres= 145+492.3 = 637.3 MPa m1/2. Therefore, fracture toughness at
point A is much greater than that before laser forming, 140 MPa m1/2. At point B, the

51
boundary of heat effected zone on top surface, Kc= Kapply+Kres= 122.7-51.1 = 71.6 MPa
m1/2. Therefore, fracture toughness at point B is much lower than that without laser
forming, 140 MPa m1/2.
Microstructure analysis is conducted to show why point B has low fracture toughness and
point A has high fracture toughness. Figure 3.13 shows the cross section of AISI steel
sheet after laser forming with laser power of 400W and scanning velocity of 25mm/s. It
is seen that there is a clear boundary around heat-affected-zone (HAZ). It was shown in
a magnified SEM micrograph (figure 3.14a) that the microstructure is non-homogenous
around the boundary of HAZ. The region inside of HAZ is characterized mainly by
martensitem (Cheng and Yao, 2002), while the region beyond HAZ ferrite and pearlite (as
shown in figure 3.14b). This non-homogenous microstructure results in significant
stress concentration when experiencing impact load. Therefore, point B has low
fracture toughness. However, on the top surface the grain structure is refined after laser
forming because dynamic recovery and/or recrystallyzation take place during laser
forming (Rogers and Hancock, 2001). Figure 3.14c shows the magnified SEM
micrograph of grain structure on top surface. Another reason why top surface has
higher fracture toughness is that the phase structure on top surface is characterized by
tempered martensite/banite as shown in a magnified SEM micrograph, figure 3.14d.
Therefore, both refined grain stricture and tempered phase enhance the fracture toughness
around the center of laser scanning path.
3.5 Conclusions
Fracture toughness of sheet metal after laser forming has been investigated by numerical
52
analysis and experiment. A fracture toughness model for sheet metal after laser forming
considering residual stress has been developed. The stress intensity due to residual
stress is calculated based on a microstructure integrated FEM model. Effects of laser
forming conditions on the stress intensity due to residual stress have been investigated.
The stress intensity factor due to applied force at fracture is obtained by tensile testing
results. Combing the stress intensity due to residual stress and the stress intensity factor
due to applied force at fracture, fracture toughness of sheet metal at two critical points is
obtained respectively. It is found that the fracture toughness at the center of laser
scanning path is highest, while the fracture toughness near the boundary of heat-effected
zone is lowest. Finally, microstructure analysis has been conduct and found consistent
with the results from fracture toughness analysis.

53
Table 3.1 measured Kapply values at room temperature 293 K (thickness=0.89 mm)
Conditions P, maximum load (N) Kapply (MPa m1/2) Deviation (%)
Laser forming material (point A) 2998.8 145 0.0098
Laser forming material (point B) 2538.2 122.7 0.01
Basic material 2895.9 140 0.012

54
Thickness of material
Kc
Kic
Figure 3.1 Relationship between Kc and thickness of plates. With the increasing of the thickness, Kc increases first, and then decreases. Finally, Kc equals to Kic , and does not change with thickness.

55
Figure 3.2 Dimensions of the notch specimen There are two notch points. One is at the center of the laser-scanning path. The other is at the boundary of the laser HAZ.
c
c
60 mm
Point B: boundary of HAZ
Point A: Laser scanning center
Scanning path
Fracture crack
Notch
Grip length 25 mm
Grip length25 mm
a=20 mm
L

56
Figure 3.3 Straight-line laser-forming scheme Laser forming in X direction
80mm
80mm
x
Scanning path
z
y
y
0.89mm 0
0
load-deflection plot P
Load
Load Line Displacement
Figure 3.4 Load-load line displacement plot

57
-2E7
6E7
1.4E8
2.2E8
3E8
3.8E8
4.6E8
0.000 0.002 0.004 0.006 0.008 0.010 0.012 0.0140.0000
0.0001
0.0002
0.0003
0.0004
0.0005
0.0006
0.0007
0.0008
0.0009
Y ax
is T
itle
X axis Title
0.00 0.01 0.02 0.03 0.04-2x10⁸
-1x10⁸
0
1x10⁸
2x10⁸
3x10⁸
4x10⁸
5x10⁸
6x10⁸
Res
idua
l Stre
ss o
n To
p S
urfa
ce (P
a)
Y axis position (m)
(a)
(b)
Figure 3.5 Distribution of residual stress on Y-Z cross section (P=800W, v=0.05m/s) a) Contour of residual stress on Y-Z cross section, b) Stress distribution in Y direction on top surface (Z=0.89mm)

58
-60
-24
12
49
85
1.2E2
1.6E2
1.9E2
2.3E2
2.7E2
3E2
3.4E2
3.8E2
0.000 0.002 0.004 0.006 0.008 0.010 0.012 0.0140.0000
0.0002
0.0004
0.0006
0.0008
-50
-24
-40Z
axis
pos
ition
(m)
Y axis position (m)
0 2 4 6 8 10 12200
400
600
800
1000
1200
P=800W
V=0.05m/s V=0.065m/s V=0.08m/s
K res
(MP
a.m
1/2 )
Crack Length (mm)
Figure 3.6 Contour of Kres on Y-Z cross section after the laser forming with laser heating power of 800 W and scanning velocity of 0.05 m/s
Figure 3.7 Prediction of Kres-A changes with the crack length when laser power keep same, P=800W.

59
0 2 4 6 8 10 12200
400
600
800
1000
1200
V=0.065m/s P=600W P=700W P=800W
Kre
s (M
Pa.m
1/2 )
Crack Length (mm)
0 2 4 6 8 10 12-200
-160
-120
-80
-40
0P=800W
V=0.050m/s V=0.065m/s V=0.080m/s
K res
(MP
a.m
1/2 )
Crack Length (mm)
Figure 3.8 Prediction of Kres-A changes with the crack length, at scanning velocity v=0.065m/s and different laser heating powers
Figure 3.9 Prediction of Kres-B changes with the crack length at laser heating power of 800W and different scanning velocities

60
0 2 4 6 8 10 12
-120
-100
-80
-60
-40
-20
0V=0.065m/s
P=600W P=750W P=800W
K res
(MP
a.m
1/2 )
Crack length (mm)
Figure 3.10 Prediction of Kres-B changes with the crack length at laser heating power of 800W and different scanning velocities
600 650 700 750 800
-80
-60
-40
-20
0
V=0.050mm/s V=0.065mm/s V=0.080mm/s
K res
Laser heating power (W)
Figure 3.11 Prediction of residual Kres-B change with laser forming parameters, power and velocity

61
-90
-80
-70
-60
-50
-40
-30
-20
-10
0
0 5000 10000 15000 20000
line energy (J / m)
Kres (M Pa.m1/2)
Figure 3.13 SEM micrograph of the cross section of AISI 1012 steel sheetperpendicular to the scanning path, showing the hardened (dark-colored, no melting involved) zone, and refined grain zone near top surface, under the condition of P = 400 W, v = 25 mm/s
Figure 3.12 Prediction of residual Kres-B change with laser forming line energy

62
Figure 3.14 Detailed SEM micrographs of AISI 1012 steel after laser forming under thecondition of P = 800 W, and v = 50 mm/s ;
(a) microstructure around the boundary of HAZ (b) microstructure within non-HAZ (c) refined grain structure near the top surface (d) microstructure near the top surface
(a) (b)
(c) (d)

63
CHAPTER FOUR
CONCLUSIONS
Predicting and studying mechanical properties is very important for laser forming
research. In this work, numerical and experimental investigations have been carried out
to understand materials’ fatigue life and fracture toughness after laser forming. Major
findings and contributions are briefly summarized below.
An integrated fatigue life modeling for the laser forming process of low carbon steel has
been presented in chapter 2. Incorporated with FEM, mean stress, mean strain, and
microstructure of material after laser forming has been considered in this model.
Application of the present model in the prediction of fatigue life has validated through
fatigue testing and microstructure analysis. SEM analysis also reveals some reasons
why laser formed low carbon steel has lower fatigue life than before laser forming. The
tensile residual strain and non-homogenous microstructure around the boundary of
heat-affected-zone are two most important reasons why the fatigue life of low carbon
steel after laser forming reduces. Parametric study has been completed to predict the
fatigue life based on the present model under various laser forming conditions.
Suggestions to enhance the fatigue life after laser forming have been made based on the
several reasons that degrade the fatigue life at the end of chapter 2.
In chapter 3, fracture toughness of sheet metal after laser forming has been investigated
by numerical analysis and experiment. A fracture toughness model for sheet metal after

64
laser forming considering residual stress has been developed. The stress intensity due to
residual stress is calculated based on a microstructure integrated FEM model. Effects of
laser forming conditions on the stress intensity due to residual stress have been
investigated. The stress intensity factor due to applied force at fracture is obtained by
tensile testing results. Combing the stress intensity due to residual stress and the stress
intensity factor due to applied force at fracture, fracture toughness of sheet metal at two
critical points is obtained respectively. It is found that the fracture toughness at the
center of laser scanning path is highest, while the fracture toughness near the boundary of
heat-effected zone is lowest. Finally, microstructure analysis has been conduct and
found consistent with the results from fracture toughness analysis.
These present models serve as an enabler for design of laser forming process, where
fatigue life and fracture toughness of product has to be considered.

65
REFERENCES
Arnet, H. and Vollertsen, F.,1995. Extending Laser Bending for the Generation of Convex Shapes. ImechE Part B, Journal of Engineering Manufacture. Vol. 209; pp: 433–442.
Ashby, M.F. and Easterling, K.E., 1984. Transformation Hardening of Steel Surfaces by Laser Beams---Part I. Hypo-eutectoid Steels. Acta Metallurgica. Vol. 32(11); pp:1935-1948.
Bao, J. and Yao,Y.L., 1999. Study of Edge Effects in Laser Bending. Proc. ASME Imece 1999, Symposium on Advanced in Metal Forming Nashville, TN. Vol. Med-10; pp:941-948.
Basquin, O.H., 1910. The Exponential Law of Endurance Tests. Proc. ASTM. Vol. 10; pp: 625.
Boyer, H.E. and Gray, A.G., 1977. Atlas of Isothermal Transformation and Cooling Transformation Diagrams. American Society for Metals
Chabanet, O., Steglich, D., Besson, J., Heitmann, V., Hellmann, D. and Brocks, W., 2003. Predicting Crack Growth Resistance of Aluminium Sheets. Computational Materials Science. Vol. 26; pp:1-12.
Chen, G.F., Xu, X.F., Poon, C.C., and Tan, A.C., 1998. Laser-assisted Microscale Deformation of Stainless Steels and Ceramics. Optical Engineering. Vol. 37(10); pp: 2837-2842.
Chen, G.F. and Xu X.F., 2001. Experimental and 3D Finite Element Studies of CW Laser Forming of Thin Stainless Steel Sheets. Journal of Manufacturing Science and Engineering. Vol. 123; pp.66-74.
Cheng, J. and Yao, Y.L., 2001. Cooling Effects in Multiscan Laser Forming. Journal of Manufacturing Process. Vol. 3(1); pp:60-72.
Cheng, J. and Yao, Y., 2002. Micorstructure Integrated Modeling of Multiscan Laser Forming. Journal of Manufacturing Science and Engineering. Vol. 124; pp. 379-387.
Courtney, T.H., 1990. Mechanical Behavior of Materials. McGraw-Hill, Inc. pp:

66
456-458.
Frackiewicz, H., 1996. High-technology Metal Forming. Industrial Laser Review. October ; pp: 15–17.
Fruhauf, J., Gartner, E. and Jansch, E., 1999 (a). Silicon as a Plastic Material. J. Micromech Microeng. Vol. 9; pp: 305-312.
Fruhauf, J., Gartner, E., and Jansch, E., 1999 (b). New Aspects of the Plastic Deformation of Silicon—prerequisites for the Reshaping of Silicon Microelements. Applied Physics A. Vol. 68; pp: 673-679.
Gong, Y. and Norton, M., 1999. Cyclic Response and Fatigue of Steels Subjected to Strain Control with Non-Zero means. Journal of Testing and Evaluation, JTEVA. Vol. 27; pp: 15-30.
Goodman, J., 1930. Mechanics Applied to Engineering. Longmans, London, Vol. 1, 9th edition; pp:634.
Hennige, T.D., Holzer, S., Vollertsen, F., and Geiger, M., 1997. On the Working Accuracy of Laser Bending. Journal of Materials Processing Technology. Vol. 71; pp: 422-432.
Hsiao, Y.C., Shimizu, H., Firth, L., Maher, W., and Masubuchi, K., 1997. Finite Element Modeling of Laser Forming. Proceedings of ICALEO’97, Section A; pp: 31-40.
Hu, Z., Labudovic, M., Wang,H., and Kovacevic, R., 2001. Computer Simulation and Experimental Investigation of Sheet Metal Bending Using Laser Beam Scanning. International Journal of Machine Tools & Manufacture. Vol. 41; pp:589–607.
Iordanova, I., Antonov, V., and Gurkovsky, S., 2002. Changes of Microstructure and Mechanical Properties of Cool-rolled Low Carbon Steel Due to Its Surface Treatment by Nd:glass Pulsed Laser. Surface and Coatings Technology. Vol. 153; pp:267-275.
Koval, A.Y., Vasilev, A.D. and Firstov, S.A., 1997. Fracture Toughness of Molybdenum Sheet under Brittle-ductile Transition. International Journal of Refractory Metals & Hard Materials. Vol. 15; pp: 223-226.
Kulkarni, D.M., Prakash, R., and Kumar, A.N., 2002. Experimental and Finite Element Analysis of Fracture Criterion in General Yielding Fracture Mechanics.

67
Sadhana-Academy Proceedings in Engineering Sciences. Vol. 27; pp: 631-642.
Lawrence, J., Schmidt, M.J.J., and Li L., 2001. The Forming of Mild Steel Plates with a 2.5 kW High Power Diode Laser. International Journal of Machine Tools & Manufacture. Vol. 41; pp: 967–977.
Lessels, J. M., 1954. Strength and Resistance of Matals. Wiley, New York.
Li, L.Q., Chen, Y.B., and Feng, X.S., 2003. Characteristic of energy input for laser forming sheet metal. Chinese Optics Letters. Vol.1;pp:606-608.
Li, W. and Yao, Y.L., 2001. Laser Bending of Tubes: Mechanism, Analysis and Prediction. ASEM J. Manuf. Sci. Eng. Vol. 123; pp:674-681.
Li, W. and Yao Y.L., 2000. Numerical and Experimental Study of Strain Rate Effects in Laser Forming. ASEM J. Manuf. Sci. Eng. Vol. 122; pp.445-451.
Li, W.C. and Yao, L. 2001. Laser Forming with Constant Line Energy. Int. J. Adv. Manuf. Technol. Vol. 17; pp:196-203
Liu, H.W. and Kuo, A.S., 1978. Fracture Toughness of Thin and Tough Plates. Int. J. Fracture. Vol. 14; pp:R109–R112.
Liu, H. W., 1981. Fracture Mechanics of Ductile and Tough Materials and Its Aplications to Related Structures. The Hague: Martinus Nijhoff . pp:189–198.
Liu, H.W. and Ke, J.S., 1997. Thickness Effect on Crack Tip Deformation of Fracture. Eng. Fracture. Vol. 8; pp: 425–436.
Magee, J., Watkins, K.G., and Steen, W.M., 1997. Edge Effects in Laser Forming. Laser Assisted Net Shape Engineering 2, Proceedings of LANE’97, Meisenbach Bamberg. pp:399-406.
Magee, J., Watkins, K.G., and Steen, W.M., 1998. Advances in Laser Forming. Journal of Laser Application. Vol. 10 ; pp:235–246.
Maher, W. 1998. Laser Forming of Titanium and Other Materials is Useable within Metallurgical Constraints. Proceedings of ICALEL’98, Section E, pp:121-129.
Manson, S.S., 1962. Discussion of Experimental Support for Generalized Equation Predicting Low Cycle Fatigue. Trans. ASME, J. Basic Eng. Vol. 84; pp: 537.

68
Merklein, M., Hennige, T., and Geiger, M., 2001. Laser Forming of Aluminium and Aluminium Alloys—microstructural Investigation. Journal of Materials Processing Technology. Vol. 115; pp: 159-165.
Morrow, J.D., 1965. ASTM STP 378 (American Society for Testing and Materials). pp:45.
Namba, Y., 1986. Laser Forming in Space, in: C.P. Wang (Ed.). Proceedings of the International Conference on Lasers’85, Osaka, Japan. Pp: 403–407.
Ramos, J., 1997. Characterization of Laser Formed Aluminum Alloy 2024-T3. M.Sc.(Eng) thesis-Materials Engineering with Laser, University of Liverpool
Rogers, C.A. and Hancock, G.J., 2001. Fracture Toughness of G550 Sheet Steels Subjected to Tension. Journal of Constructional Steel Research. Vol. 57; pp:71-89.
Scully, K., 1987. Laser Line Heating. Journal of Ship Production. Vol. 3; pp: 237–246.
Shi D.K. and Jin Z. H., 1998. Material Mechanics Property. Shan Wu, China. pp:80-100.
Singhal, S., Tucker, J., and Saxena, A., 1999. Effect of Long-term Stress and Temperature Exposure on the Fracture Toughness of Ti-62222 Alloy. Engineering Fracture. Vol. 64; pp: 799-803.
Smith, K.N., Watson, P., Topper, T.H., 1970. Stress- strain Function for the Fatigue of Metals. J. Mater. Vol. 5; pp: 767-778.
Soderberg, C. R., 1930. Factor of Safety and Working Stress. Trans. Am. Soc. Test Matls. Vol. 52;pp:146
Sprenger, A., Vollertsen, F., Steen, W.M., and Watkins, K., 1994. Influence of Strain Hardening on Laser Bending. Laser Assisted Net Shape Engineering, Proceeding of the LANE'94. Vol.1; pp:361-370.
Srawley, J.E. and Brown W.F.,1975. Fracture Toughness Testing and Its Applications. ASTM STP. Philadelphia, PA. Vol. 381; pp.133-198.
Tavernelli, J.F. and Coffin, L.F. Jr., 1962. Experimental Support for Generalized Equation Predicting Low Cycle Fatigue. Trans. ASME, J. Basic Eng. Vol. 84; pp: 533.
69
Thomson, G., and Pridham, M., 2001. Material Property Changes Associated with Laser Forming of Mild Steel Components. Journal of Materials Processing Technology. Vol. 118; pp: 40-44.
Vollertsen, F., 1994. Mechanisms and Models for Laser Forming. Lasaer Assisted Net Shape Engineering Proceedings of the LANE’94. Vol.1; pp: 345-360