Embed Size (px)
Citation preview
foods
Article
Study on Extra Virgin Olive Oil: Quality Evaluation byAnti-Radical Activity, Color Analysis, and PolyphenolicHPLC-DAD Analysis
Francesco Cairone , Stefania Petralito, Luigi Scipione and Stefania Cesa *
�����������������
Citation: Cairone, F.; Petralito, S.;
Scipione, L.; Cesa, S. Study on Extra
Virgin Olive Oil: Quality Evaluation
by Anti-Radical Activity, Color
Analysis, and Polyphenolic
HPLC-DAD Analysis. Foods 2021, 10,
1808. https://doi.org/10.3390/
foods10081808
Academic Editor:
Theodoros Varzakas
Received: 6 July 2021
Accepted: 30 July 2021
Published: 5 August 2021
Publisher’s Note: MDPI stays neutral
with regard to jurisdictional claims in
published maps and institutional affil-
iations.
Copyright: © 2021 by the authors.
Licensee MDPI, Basel, Switzerland.
This article is an open access article
distributed under the terms and
conditions of the Creative Commons
Attribution (CC BY) license (https://
creativecommons.org/licenses/by/
4.0/).
Department of Drug Chemistry and Technology, “La Sapienza” University of Rome, Piazzale Aldo Moro, 5,00185 Rome, Italy; [email protected] (F.C.); [email protected] (S.P.);[email protected] (L.S.)* Correspondence: [email protected]; Tel.: +39-06-4991-3198
Abstract: This study aimed to evaluate the quality of oils available on the Italian market andpurchased directly from the mill or in the supermarket and labelled as extra virgin olive oils (EVOOs).As one of the most relevant foods of the Mediterranean diet and recognized as a functional food ifregularly consumed, the quality of EVOO needs to be continuously monitored. Different analyticalprotocols were applied. The spectrophotometric parameters used to classify the extra virgin oliveoils—a CIEL*a*b*color analysis and the quali-quantitative analysis of bioactive molecules by HPLC-DAD detection and the anti-radical activity, by the DPPH method, were evaluated and comparedamong the samples. This study confirmed a very high variation in terms of quality, both in oilspurchased directly from mills throughout Italy, but also in oils labeled as “100% of Italian origin”. Dueto the high variability reconfirmed in the monitored samples, it is necessary to carry out a capillarycontrol, not limited only to the parameters indexed by law. A useful complementary method couldbe represented by reflectance colorimetric analysis.
Keywords: extra virgin olive oils; polyphenols; carotenoids; HPLC-DAD analysis; spectrophotomet-ric analysis; reflectance colorimetry; quality evaluation
1. Introduction
The prevention of cardiovascular diseases, hypertension, diabetes, inflammation, ox-idative stress, gut microbiota alteration, and liver disease exerted by the traditional Mediter-ranean diet, enriched with further integration of extra virgin olive oils (EVOOs), nuts, andpistachios, is well-known and recognized by the whole scientific community [1–4].
The multiple protective effects exerted by EVOO, the main fat source of the Mediter-ranean diet and commonly recognized as a functional food, are widely reported andgenerally attributed to its high content of minor components. The phenyl alcohols tyrosoland hydroxytyrosol (p-(hydroxyphenyl)ethanol and 3,4-(dihydroxyphenyl)ethanol), thesecoiridoid oleuropein, flavonols, and lignans, all belonging to the polyphenolic fraction,as well as the balance among monounsaturated, saturated, and polyunsaturated fatty acidsand the antioxidant potential exerted by tocopherols and carotenoids, can contribute to thehealth benefits associated with EVOO consumption [5–9].
The CEE Regulation n. 2568/91 [10], completed and revised by the EU Regulation1604/2019 [11], defines all the parameters required to classify an extra virgin olive oil. Be-sides belonging to this class, extra virgin olive oils could present many different charactersin terms of color, bioactive content, antioxidant properties, and retail price. Moreover, theEU Regulation 432/2012 [12] defines the health claims for olive oil polyphenols indicatingthat “olive oil polyphenols contribute to the protection of blood lipids from oxidativestress”, but also specifies that “the claim may be used only for olive oil which containsat least 5 mg of hydroxytyrosol and its derivatives per 20 g of olive oil” and that “thebeneficial effect is obtained with a daily intake of 20 g of olive oil”.
Foods 2021, 10, 1808. https://doi.org/10.3390/foods10081808 https://www.mdpi.com/journal/foods
Foods 2021, 10, 1808 2 of 12
Color analysis, and more specifically CIEL*a*b* analysis, of extra virgin olive oil wasperformed by several authors, in combination with other analytical methods to evaluatethe designation of protected designation origin (PDO) products. Becerra-Herrera et al. [13]evaluated the color character and the phenolic profile of nine Spanish extra virgin olive oilsbelonging to the new cv. “Serrana de Espadan”, concluding that tyrosol, hydroxytyrosol,and their derivatives, together with the lignin pinoresinol and the total polyphenol content(TPC) were the most important parameters to take into account for the quality evaluation.Kosma et al. [14] studied a large number of Greek oils, belonging to less-known Greekcultivars. Combining data, relative to quality parameters, fatty acid composition, andcolor analyses, they evidenced significant and statistically relevant differences among thevarious considered cultivars.
The phenolic content, as well as the tocopherol, carotenoid, and secoiridoid contentof PDO and monovarietal oils of Italian origin, were detected and evaluated in differentstudies, from which it was possible to extrapolate median values for all these characterizingparameters and obtain a preliminary overview of the quality exerted by extra virgin oliveoils, generally recognized as the golden standard for the olive production [15,16]. Fromthe reported data, it was possible to observe an average content of phenols covering therange 250–610 µg/g oil, among which decarboxymethyl elenolic acid linked to hydrox-ytyrosol (3,4-DHPEA-EDA) was the most represented molecule. Remarkable quantitiesof α-tocopherol (160–235 µg/g oil) and carotenoids (β-carotene and lutein, 4–10 µg/g oil)were also reported [15,16].
As is well known, an important relationship exists between agricultural practices,procedural technological steps, and high quality of final products, as explained in differ-ent papers that show the correlation between applied systems and the expressed phy-tocomplex contents. In the review by Lanza et al. [17], a series of intensive proceduresrelated to EVO oil production and their effects on the secoiridoid and phenol contentwere presented. In particular, a significant loss of natural antioxidants was reported afterpasteurization and during storage since the heat treatment impacts primarily on secoiri-doids. Antonini et al. [18] conducted a study on 28 extra virgin olive oils, comparing twodifferent oil extraction methods. One involved the use of a two-way decanter and theother a conventional three-way decanter. The 14 oils produced with the two-way decanterrevealed the presence of higher contents of secoridoids, lignans, and tyrosols.
On the basis of these findings, the current work aimed to evaluate the quality of oilsavailable on the Italian market and purchased directly from the mill or in supermarkets,and labeled as extra virgin olive oils (EVOOs), by applying different analytical protocols.The spectrophotometric parameters of the UV region, required to classify extra virgin oliveoils [11], the color measure by reflectance analysis, the quali-quantitative analysis of themost important bioactive molecules, and the overall anti-radical capacity of the suppliedoil samples were measured. The resulting data were compared to obtain a picture of thecurrent situation in Italy, confirming a very high variation in terms of quality.
Moreover, it was evaluated if, and to which extent, the color analysis, based on asimple, quick, and economic procedure and directly executable in the field by unskilledpersonnel, could return a quality evaluation of such a precious food commodity.
2. Materials and Methods2.1. Materials
A total of 54 samples of extra virgin oil were analyzed. Of these, 28 were purchaseddirectly by mills located in nine Italian regions Abruzzo (A1), Basilicata (B1), Campania(C1–C3), Lazio (L1–L13), Molise (M1), Puglia (P1–P5), Sicily (S1), Tuscany, (T1 and T2), andUmbria (U1), and were designed as the MILL series; 13 oils (Ar, Au, Ca, Cc, Ce, Cp, Ct,Cv, Ds, Fb, Ma, Pa, and Sa) which came from large retailers and were labelled as “100%Italian origin”, were designed as the ITA series and 13 oils (Aa, Ac, Ai, Be, Cf, Cm, Co, Cr,Dc, Dn, Gi, Lr, and Sp), which came from large retailers and were labelled as “olive oils by
Foods 2021, 10, 1808 3 of 12
the European Union”, were designed as EUR series (Table S1). All samples were stored inthe dark at room temperature until the analyses were performed.
Bidistilled water, methanol, acetone, acetic acid, acetonitrile, n-hexane, and referencecompounds (gallic acid, hydroxytyrosol, ferulic acid, oleuropein, and 1,1-diphenyl-2-picrylhydrazyl (DPPH)) for HPLC were purchased from Merck life Science s.r.l. (Mi-lan, Italy).
2.2. Spectrophotometric Analysis2.2.1. K232, K270 and ∆K Parameter Analysis
Fifty milligrams of oil were solubilized in 5 mL of n-hexane and analyzed by UV/VISLambda 25 spectrophotometer (Perkin Elmer, Waltham, MA, USA) in the ultravioletrange. Parameters K232, K270, and ∆K, quality indicators according to Regulation (EEC)No 2568/91 [10], were determined at wavelengths of 232 nm and 270 nm, respectively. ∆Kcorresponds to the value given by the following operation: K268 − (K262 + K274/2).
2.2.2. Carotenoid and Chlorophyll Analysis
One hundred milligrams of sample were solubilized with 5 mL of n-hexane andanalyzed by UV/VIS Lambda 25 spectrophotometer (Perkin Elmer Waltham, MA, USA),in the visible range (400–700 nm). Absorbance values, at 470 and 670 nm, were recordedaccording to Minguez-Mosquera et al. [19].
2.2.3. DPPH (2,2-diphenyl-1-picryl-hydrazyl) Assay
According to Cioffi et al. [20], with slight modifications, 7.0 mg of DPPH were sol-ubilized in 100 mL of propan-2-ol. Then, 2 mL of this solution were added to 1 mL ofpropan-2-ol, stored in the darkness, and monitored by UV/VIS Lambda 25 spectrophotome-ter (Perkin Elmer Waltham, MA, USA), at the wavelength of 515 nm, until the absorbancevalue was stable. The value of the maximum absorption expressed by the radical was readafter 20′. Then, 37.5 mg of oil were weighed, solubilized in 1 mL of propan-2-ol, and addedto the cuvette along with 2 mL of the same DPPH solution. The absorbance at 515 nm wasdetermined, following the same conditions described above and the reduction of DPPHabsorbance after 20′ was evaluated. Finally, a calibration curve was constructed to quantifythe antioxidant activity by adding 1 mL of gallic acid (from 0.23 to 8.28 µg/mL), at differentconcentrations, to 2 mL of the DPPH solution following the previous described conditions.A calibration curve was constructed (y =−0.276 ln(x) + 0.6143) and the antioxidant capacityexerted by the tested oil samples was expressed as gallic acid equivalents.
2.3. Colorimetric Analysis
The extra virgin olive oil samples were analyzed for their color character, with anX-Rite SP-62 colorimeter (X-Rite Europe GmbH, Regensdorf, Switzerland), set with a D65illuminant and a 10◦ observer angle, as previously described [21]. Each experiment wasperformed four times and the results are expressed as the mean value± standard deviation(SD). Cylindrical coordinates C*ab and hab were calculated from a* and b* as in [22].
2.4. Solid-Phase Extraction and HPLC-DAD Analysis of Polyphenols
Extra virgin olive oil samples were subjected to solid-phase extraction using aDiscovery® DSC-18 SPE Tube column (Merck Life Science, S.r.l., Milan, Italy), according toMateos et al. [23], with substantial modifications. The column was previously conditionedwith n-hexane. About 4.0 g of oil was dissolved in 10 mL of n-hexane and loaded intothe column. The column was washed with 6 mL of n-hexane and 6 mL of acetonitrilewhich were discarded, and 6 mL of methanol for the extraction of the polyphenoliccontent. The obtained methanol fractions were concentrated under reduced pressure, at acontrolled temperature of 40 ◦C, with a rotary evaporator, weighed, and stored at 4 ◦Cuntil HPLC-DAD analyses were performed.
Foods 2021, 10, 1808 4 of 12
The obtained extracts were solubilized in methanol. The chromatographic analyseswere performed on a Luna Phenyl-Hexyl column (150 × 4.6 mm, 5 µm) using an HPLC(Perkin Elmer Waltham, MA, USA) apparatus consisting of a Series 200 LC pump, a Series200 DAD, and a Series 200 autosampler, including a Totalchrom Perkin Elmer software forthe data acquisition. The mobile phase consisted of a mixture of 1:1 methanol/acetonitrile(solvent A) and water acidified with 5% acetic acid (solvent B) in solvent gradient, from 5%to 70% of solvent A in 55′, at a flow rate of 1 mL/min. Analyses were conducted at 280 nmfor the identification of phenolic acids and secoiridoids and at 360 nm for the identificationof flavonoids. Calibration curves were constructed for hydroxytyrosol (R2 = 0.9983), ferulicacid (R2 = 0.9974), oleuropein (R2 = 0.9979), and quercetin-3-D-galactoside (R2 = 0.9999)which were quantified.
2.5. Liquid–Liquid Extraction and HPLC-DAD Analysis of Carotenoids
Four selected extra virgin olive oil samples Au (ITA), Cf (EUR), A1, and L13 (MILL,Abruzzo and Lazio) were subjected to liquid–liquid extraction according to Minguez-Mosquera et al. [24], with modifications. First, 2.0 g of oil was dissolved in 20 mL ofn-hexane, loaded in a separating funnel, and extracted with 20 mL of acetonitrile threetimes. The acetonitrile fractions were concentrated under reduced pressure, at a controlledtemperature of 40 ◦C, with a rotary evaporator, weighed and stored at 4 ◦C until HPLC-DAD analyses were performed.
Organic extracts enriched in carotenoids were weighed and solubilized in methanol.The analyses were performed according to Patsilinakos et al. [25]. Chromatographywas performed on Luna C18 column (150 × 4.60 mm, 3 µm) at 450 nm using an HPLCPerkin Elmer apparatus, as described above. The mobile phase consisted of a mixture of95:5 methanol/water acidified by 5% acetic acid (solvent A) and acetone (solvent B) at 90%of solvent A, in isocratic mode, at a flow rate of 1 mL/min.
2.6. Statistical Analysis
All the performed analyses were reproduced in quadruplicate. The data obtainedwere statistically validated using the system (ANOVA) with attached standard deviation.Principal component analysis (PCA) was performed using XLSTAT 2020 version (AddinsoftInc, New York, NY, USA) software.
3. Results and Discussion3.1. Spectrophotometric Analyses
The 54 samples of extra virgin olive oils (sample legend in Table S1), purchased fromthe Italian market were classified into three clusters on the basis of their provenance (bymill, cluster MILL) and label (by supermarket, “100% of Italian origin”, cluster ITA; or“blend of oils coming from the European Union”, cluster EUR). The 28 samples classifiedas “MILL” came from nine different Italian regions and showed visibly different colors andgrades of turbidity, whereas the 26 samples from supermarket, 13 labelled as “of Italianorigin” and 13 labelled as “of European Union origin” appeared similar for color and clarity.To these classes, different prizes were associated. The oils purchased from Italian millswere, on average, as expensive as the ITA cluster, whereas the EUR cluster were 20–25%(or more) less expensive.
Spectrophotometric analyses were performed on samples at two different concentra-tions, aiming to evaluate the absorption value in the UV region (K232, K270, and ∆K) andthe visible zone of the spectrum for carotenoids (about 470 nm) and chlorophylls (about670 nm). All data, reported in Table S2, show that some samples of each cluster wereout of the accepted regulatory range, but nevertheless labeled as EVOO. Some sampleswith spectrophotometric values of K232 and K270 significantly out of range were identified.L11, P4, and P5 showed a K232 > 3.17, whereas Pa, Ma, and T2 showed a K232 > 2.78 (vs.a Regulation Limit of 2.5). Among these, the samples L11, P4, P5, T2, and Pa also hadK270 > 0.26 (vs. a Regulation Limit of 0.22). The EUR sample Dc, despite a low K232 value,
Foods 2021, 10, 1808 5 of 12
showed an exceptionally high K270 value of 1.46 and a ∆K of 0.032 (Regulation Limit of0.01). The K270 of the other seven samples ranged between 0.25 and 0.32 and the ∆K of theother three samples ranged between 0.031 and 0.053.
Many papers are reported in literature in which spectrophotometric analysis in theUV region was used to evaluate the quality of extra virgin olive oil, but these generallyrefer to the control of a small number of samples and/or to selected cultivars, or to theevaluation of the shelf-life [26,27]. In other studies, the extinction coefficient was correlatedwith other quality parameters such as the metal content [28], the anti-radical capacity, andthe polyphenol content during ripening [29], or with the peroxide value [30].
With respect to the carotenoid and chlorophyll absorption regions, MILL samplesshowed very different absorption values at 470 nm, ranging between 0.002 and 0.115. Inaddition, the ITA and EUR samples ranged, in a narrower region, between 0.015 and 0.040and between 0.013 and 0.037, respectively. Similarly, absorption values at 670 nm rangedbetween 0.001 and 0.099 in MILL, in a narrower range of 0.009 and 0.046 in ITA, and in aneven narrower range of 0.010 and 0.032 in EUR samples. Usually, higher absorption valuesat 670 nm correspond to a higher carotenoid contents read at 470 nm.
The chlorophyll absorption of <0.015 corresponded to the carotenoid absorption of,on average, 0.018 (22 samples); the chlorophyll absorption of <0.030 corresponded tothe carotenoid absorption of, on average, 0.025 (23 samples); and the last group had acarotenoid mean of 0.046 (9 samples). In two MILL samples (C1 and B1), an exceptionallylow chlorophyll content was revealed (<0.002) with respect to a mean minimum valueof 0.004. In addition, in L13 and L2 an exceptionally high value (>0.070) with respect toa mean maximum value of 0.020 was shown. In conclusion, in relation to the pigmentcontent, the MILL samples, although presenting a mean pigment content (0.047 ± 0.041)comparable to that of ITA samples (0.049± 0.013) and higher with respect to the EUR series(0.020 ± 0.006), were exceptionally dispersed, as furtherly confirmed by the colorimetricparameters.
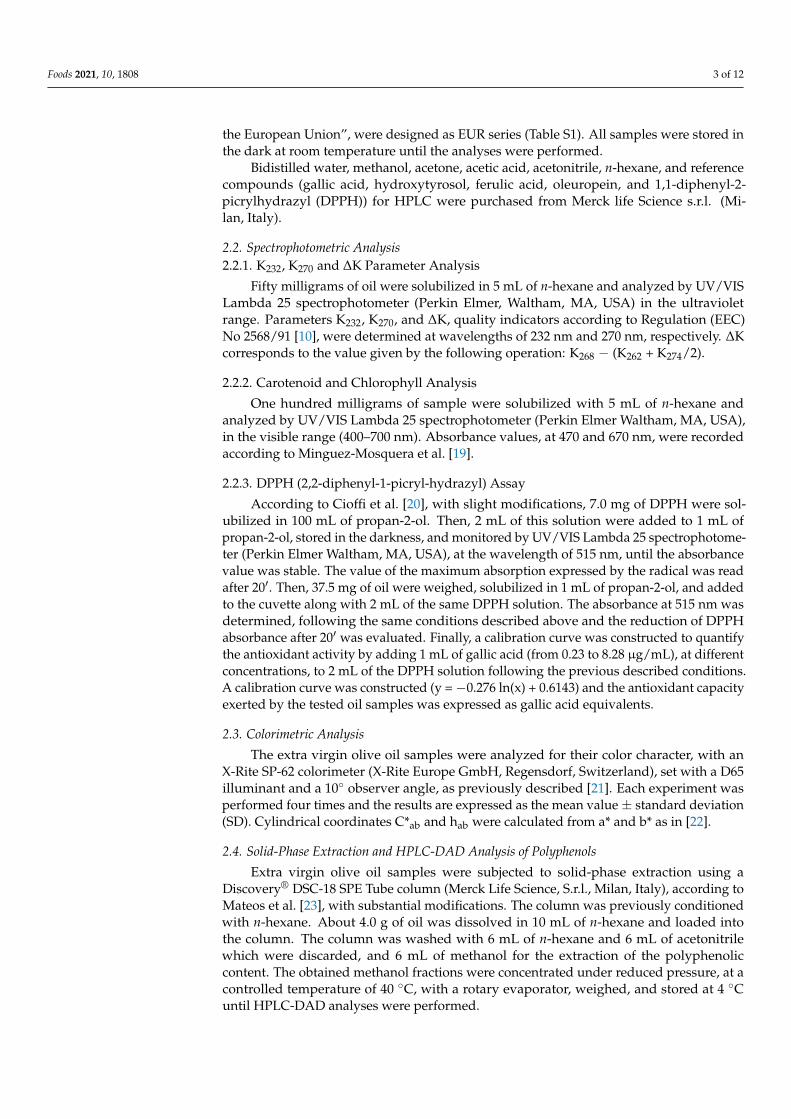
Spectrophotometric analyses were also performed to evaluate the anti-radical potentialof the oil samples by using DPPH assay. Opportune DPPH solutions were monitored for20′, in the darkness at controlled temperature, until stable absorbance values were readat 515 nm. Known oil amounts were then added and their scavenging activity againstthis radical was monitored in the same operative conditions. Finally, a calibration curvewith gallic acid was constructed and results were expressed as µg equivalents of gallicacid/g oil (Table S2). Results are reported in Figure 1, panel A, as mean values of thethree different clusters. The ITA cluster presented the highest DPPH value, but this wasdue to five samples which showed values higher than 200, as well as another six samplespresenting very low values, ranging between 13 and 26 µg equivalents of gallic acid/g oil,thus denoting a very high sample dispersion. For this reason, results were also reported(Figure 2, Panel B) selecting four different groups on the basis of the different DPPH value.In each group, the following clusters were represented: low DPPH value, 13 samples,among which there were 5 MILL, 6 ITA, and 2 EUR; mean DPPH value, 18 samples, amongwhich there were 9 MILL, one ITA, and eight EUR; high DPPH value, 16 samples, amongwhich there were 13 MILL, 1 ITA, and 2 EUR; very high DPPH value, 7 samples, amongwhich there were1 MILL, 5 ITA, and 1 EUR. This demonstrated that the anti-radical capacityof the analyzed samples was not correlated with the cluster to which they belonged.
Foods 2021, 10, 1808 6 of 12
Figure 1. Comparison of anti-radical capacity reported as mean values of the three selected clusters (Panel A) and as meanvalues of four different classes selected by DPPH content (Panel B).
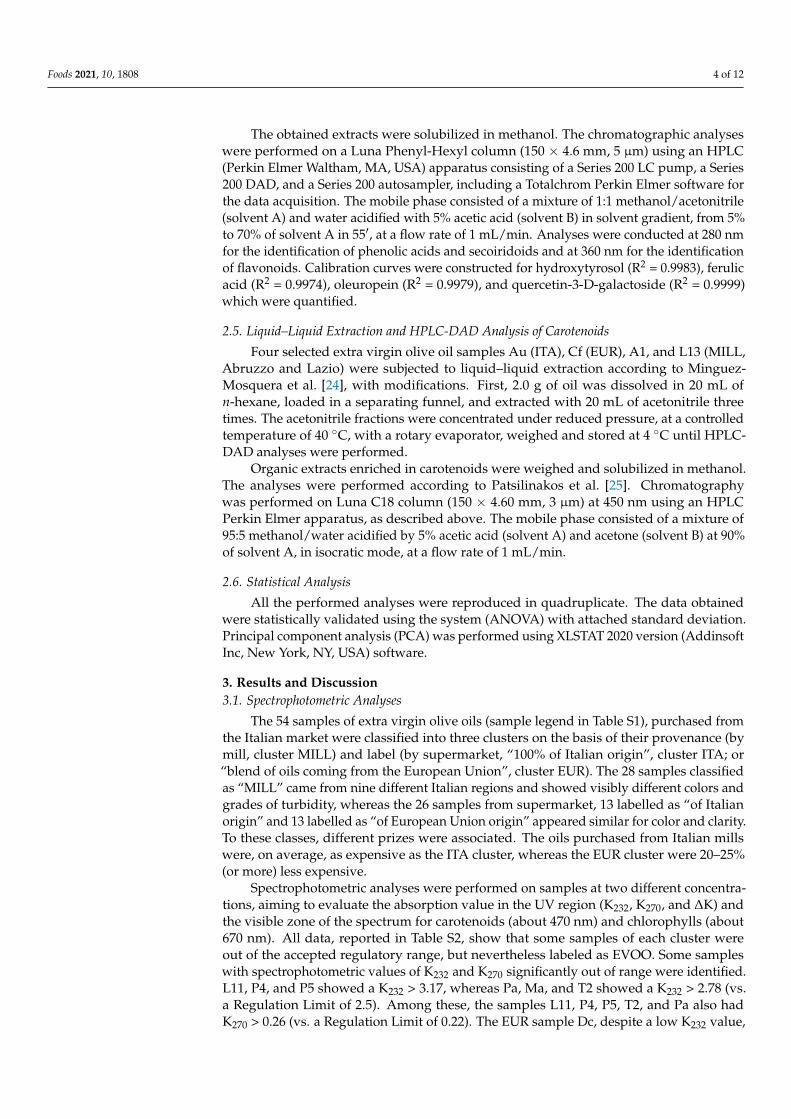
Figure 2. Reflectance curves of selected samples on the basis of carotenoid and chlorophyll content.
3.2. Color Analysis
The oils were analyzed as such, not filtered or clarified, by colorimetric CIEL*a*b*analysis, and the data are reported in Table S3. Data showed a high dispersion for theL* (luminance) values of cluster MILL (between 36 and 56). On the contrary, a similarnarrow region was shown by the other two classes (46–55 for cluster ITA and 44–53 forcluster EUR). The character a* of color, green for negative and red for positive values, wasvery near to 0 value, denoting a grey region and the almost total absence of this kind ofpigments, even if some samples seemed yellow-greenish, for the presence of chlorophylls.On the contrary, the positive, and often quite relevant b* value denoted a yellow characterwhich assumed highly different values among samples, ranging between 6 and 52. Oil frommills, and those of 100% Italian origin (ITA) had higher variabilities with values rangingbetween 6 and 50 and 9 and 52, respectively, as well as b* values for the EUR oils rangingbetween 31 and 52, in a definitely narrower region of the color space.
A valuable method to deepen the character of color differences among samples wasrepresented by the principal components analysis (PCA). This was carried out on all thedata collected. The values were processed through XLSTAT 2020 software, building a biplotwith 98.13% of correlation related to CIEL*a*b parameters as shown in Figure S1. The
Foods 2021, 10, 1808 7 of 12
principal components analysis (PCA) confirmed the high dispersion of MILL samples withrespect to the little and almost overlapping regions of ITA and EUR samples. PCA analysisallowed us to identify samples that largely deviated from the reference clusters. B1, C3,L10, Cf, and Fb showed L* > 54 with respect to a mean value of 49.31 ± 4.60; Cf and Fb alsoshowed b* > 50 with respect to a mean value of 37.84 ± 11.27; and B1, C3, and L10 showeda hab > 89 with respect to a mean value of 85.66 ± 2.02. In conclusion, the reflectancecurves were plotted as cluster mean values, after discarding these five samples and theseven samples previously evidenced as they were out of range for the spectrophotometricparameters (L11, P4, P5, T2, Ma, Pa, and Dc).
Reflectance curves (Figure S2) denoted only small differences, not supported bystatistical significance between classes, with an intermediate profile of the ITA samples,with respect to the inferior curve of MILL comprehending slightly darker samples, and thesuperior curve of EUR involving slightly lighter samples. The differences among the threeidentified classes were not significant as the standard deviations were particularly high,especially for MILL samples, but also for ITA samples. On the contrary, EUR samples werehighly defined in a restricted color region, which probably accounts for a slightly higherimpact during the manufacturing [31].
The MILL samples were furtherly divided into subclasses on the basis of chlorophylland carotenoid content after discarding the out-of-range samples (C1, L2, L13). As expected(Figure 2), the cluster with “high pigment content” (HPC MILL) was characterized bya lower reflectance curve (Abs470 + Abs670 between 0.05 and 0.21), corresponding to adarker color as well as a “low pigment content” (LPC MILL) (Abs470 + Abs670 between 0.01and 0.04) showing a reflectance curve overlapping with those from ITA samples havingslightly higher pigment content (Abs470 + Abs670 between 0.03 to 0.07). Higher carotenoidcontents were generally aligned with higher chlorophyll content. Kosma et al. [14] reportedL* values between 66 and 72, b* values between 70 and 98, and more negative a* valuesbetween −5 and −9. Conversely, Piscopo et al. [32] and Sicari et al. [33], investigating theeffect of storage on EVO oils, found CIEL*a*b parameters in line with our results. Despitethe fact that, through the study of color, it could be possible to differentiate oils by cultivarand geographical origin [13,14], there are no studies in which a correlation of the expressedcolor with the oil quality has been attempted.
We attempted a correlation to understand if the content of pigments (carotenoidsand chlorophylls), and thus the shown color, could be associated with a higher or lowerquality of oil, in terms of contribution to health. Four clusters were identified in relation totheir pigment content and the relative reflectance curves were evaluated as mean values(Figure 2). No one evident correlation was shown among these clusters, with the expressedvalue of bioactive molecules, or with the anti-radical capacity. The presence of a highercarotenoid content, accompanied to a higher content of chlorophylls, manifested as a lowerreflectance curve, is not correlated to a higher antioxidant protective role. Chlorophylls,generally denoting a less impactive production technology, could even play an adverserole, in terms of protection from the autoxidation process.
The mill samples C1 and B1 showed an exceptionally low carotenoid and chlorophyllcontent, which maybe denotes an impacting process. The highest values were foundin five MILL samples, which came from the Lazio region, are maybe ascribable to thegeographic origin.
3.3. Polyphenolic and Carotenoid HPLC-DAD Analyses
Two different methods for the selective extraction of the minor components repre-sented by the polyphenolic and carotenoid content were adopted. The selective extractionof the polyphenolics (phenolic acids, secoiridoids, and flavonols) was performed accordingto Mateos et al. 2001 [23], by using solid-phase extraction on reverse phase RP18, withsome modification, allowing us to obtain extraction yields ranging from 0.5 to 5% in themajority (80%) of the samples analyzed.
Foods 2021, 10, 1808 8 of 12
The obtained extracts, analyzed by HPLC-DAD analyses, gave a characteristic profile(Supplementary Figure S3), by which some molecules, such as oleuropein, quercetin, andkaempferol derivatives were identified by comparison with literature data [19,34]. Tyrosol,hydroxytyrosol, oleuropein, quercetin, and ferulic acid also could be quantified on the basisof the calibration curves. The recorded chromatograms showed the typical polyphenolicpattern of olive oil [35], in which hydroxytyrosol (1), ferulic acid (3), and oleuropein (4)with absorption at 280 nm, and quercetin-3-galactoside (6) with absorption at 360 nmwere identified by external standard as the main peaks. Comparing the chromatogramswith those in the literature, it was possible to identify other peaks—tyrosol (2), oleuropeinderivative (5), quercetin derivative (7), and kaempferol derivatives (8) [23]. Peaks 7 and 8were quantified and expressed as quercetin-3 D-galactoside equivalents (Figure S3, PanelA, B).
Data obtained by the analyses of all the treated samples are reported in Table S4.The content was expressed as µg/g oil. Hydroxytyrosol ranged between 1.27 and 35.6,tyrosol between 1.45 and 39.1, ferulic acid between 0.28 e 4.09, oleuropein and derivativesbetween 0.82 and 70.40, and flavonols between 0.03 and 1.33. These data are only partiallyconfirmed in literature, in which hydroxytyrosol was found in a narrower range between20.6 and 34.6, tyrosol between 0.54 and 7.93, ferulic acid between 0.13 and 0.68, oleuropeinand derivatives between 19.90 and 140.00, and quercetin and derivatives between 0.27 and17.40 [15,16,19,34].
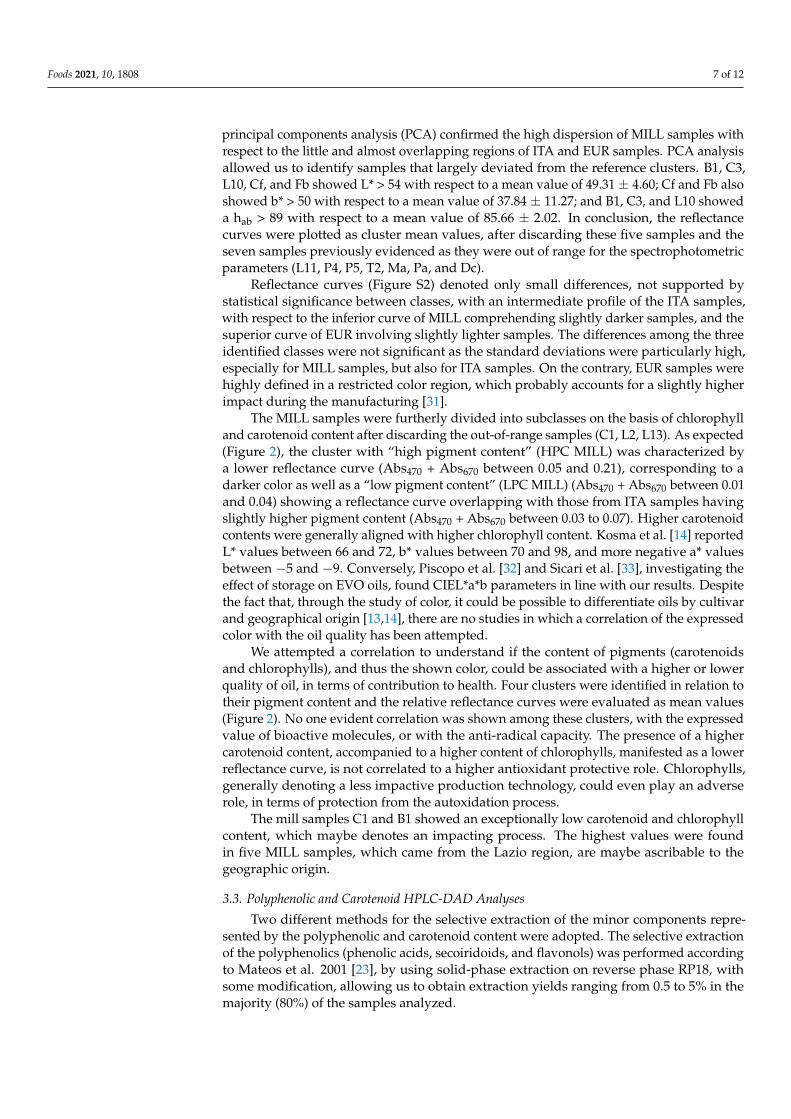
The content of the polyphenols in the three different clusters, generally recognizedas a quality marker, is reported in Figure 3. A decreased incidence of cardiovasculardiseases, obesity, and cancer is particularly correlated with the recognized health propertiesof tyrosol, quercetin, and oleuropein derivatives and with their antioxidant preventiveeffects [17,18,36].
Figure 3. Average values of the main polyphenolic components in the three main clusters (MILL,ITA, and EUR).
Foods 2021, 10, 1808 9 of 12
By this comparison, it was shown that all the three classes had similar mean values ofhydroxytyrosol, tyrosol, and quercetin. The ITA samples also showed much higher levelsof secoridoids and ferulic acid. Quercetin was more represented both in the ITA and inthe EUR samples with respect to the MILL samples. Overall, a higher content of tyrosols,secoridoids, and flavonols was furtherly associated with higher anti-radical activity, withsome exceptions for the samples Fb (ITA), Cm (EUR), and L6 and L10 (MILL), where thehigh anti-radical capacity could depend on the possible presence of other active molecules.
Based on what is reported in literature [16,23,37,38], the typical carotenoid EVOOpattern mainly consists of β-carotene and lutein. To confirm this profile, some of oursamples were selected. These were submitted to a purification step in order to obtain aselective extraction of the carotenoid components. According to the method optimizedby Minguez-Mosquera et al. [23], four samples (A1, L13, Au, and Cf), selected from thethree different clusters on the basis of the different absorbances expressed at 415 nm,were submitted to a liquid–liquid extraction, whose performance was based on the abilityof acetonitrile to selectively extract the slightly less lipophilic carotenoid content by theoily phase dissolved in n-hexane The so-obtained purified extracts were analyzed byHPLC-DAD following the procedure described by Patsilinakos et al. [25] and the relativechromatograms are reported in Figure S3, Panel C. The adopted extraction method allowedus to obtain only the less lipophilic carotenoid moiety, represented by xanthophylls, whilethe residue carotenes could be remained in the n-hexane phase. Despite the highly differentabsolute carotenoid content, the four analyzed samples showed the same xanthophyllprofile, in which more than 90% of peak areas was represented by lutein, confirming theoverall data shown by literature.
3.4. Statistical Analysis
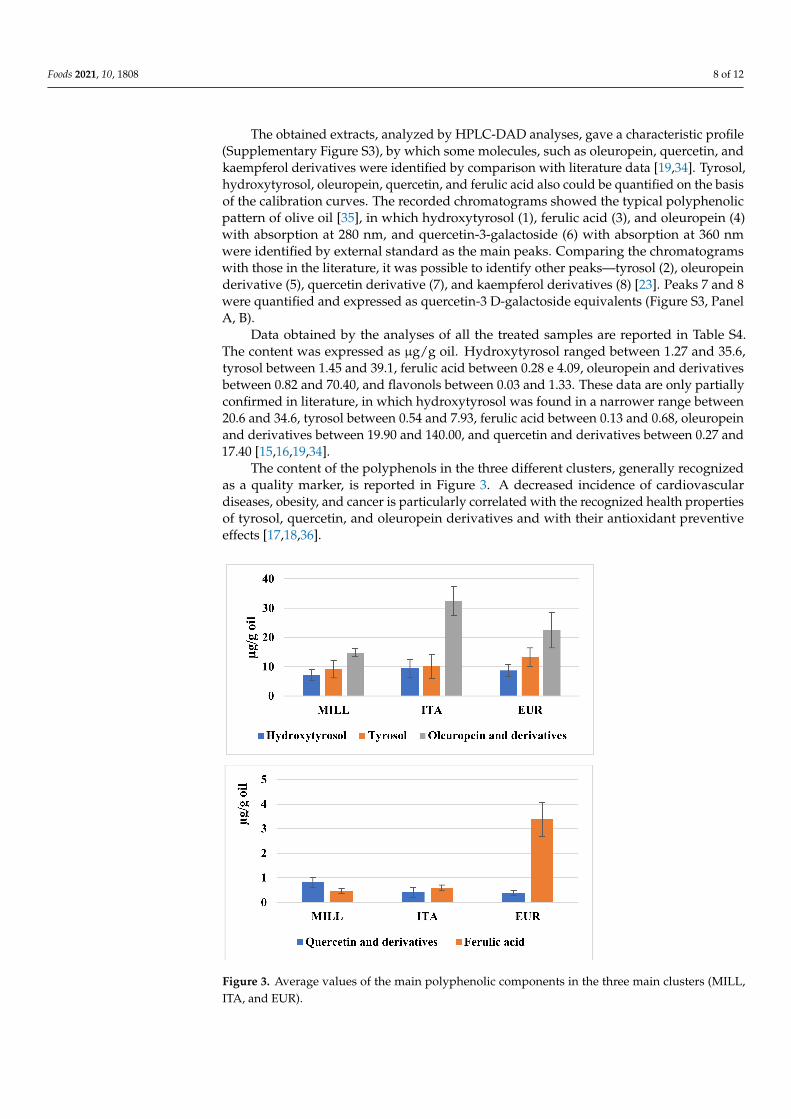
Data evaluation and PCA analysis of the monitored variables allowed us to build aquality rank, by which it was possible determine the five best samples (in the red trianglein Figure 4), the ITA samples, Ds, Cp, Ca, and Ce and the MILL L8, selected for the highestsum value (DPPH + HPLC data considered as sum) between 218 and 338 and the five worstsamples (in the blue triangle), the MILL samples P2, M1, L11, U1, and L10, selected forthe lowest sum value, ranging between 9 and 18 (very high values of polyphenol contentand DPPH scavenging activity were also found for ITA sample Sa, but this was discardedfor its out-of-range ∆K value). In the three circles (violet, green, and red), the regionscorresponding to increasing values of quality are evidenced and it is possible to showthat the three clusters are represented in each region. The three discarded samples Fb,L6, and Cm denoted an exceptionally high ratio between DPPH value and HPLC content,in part related to the very low HPLC content, which could denote a possible presence ofactive molecules coming from compounds of a different nature and maybe index of someadulteration. The attempt to correlate the parameter for each color to the other detectedvalues did not afford the expected results, but it was possible partially correlate the lowestoil quality with the highest hab values (Supplementary Figure S4). Finally, selecting all theoutsider samples with respect to the others (in agreement with the regulatory limits andpresenting mean values for all the evaluated parameters) and plotting the correspondingreflectance curves, low reflectance values at 670 nm were finally associated with best oilquality (Supplementary Figure S5).
Foods 2021, 10, 1808 10 of 12
Figure 4. Principal component analysis (PCA) of the all analyzed samples related to monitored variables.
4. Conclusions
Several of the analyzed samples, all purchased in the Italian market or directly fromthe producing mills, as well as those labelled as extra virgin olive oils, were out of rangewith respect to the spectrophotometric parameters indexed by law. Significant differencesamong samples were evidenced with respect to the carotenoid and chlorophyll content.The pigment content, other than related to the olive origin, cultivar, geographic, andagronomic parameters, could also be deeply influenced by the applied treatments. Thiswas particularly evident in the MILL samples, where a lack of standardization was reflectedin a higher dispersion.
A very high variability was also found in terms of bioactive molecules and expressedanti-radical capacity; these two parameters did not seem correlated. On the contrary,most samples with the lower biomolecule content (<20 µg/g) were also out of range forspectrophotometric parameters. An exceptionally high ratio between DPPH value andHPLC content could denote a possible presence of active molecules coming from differentmatrices. The highest hab values correlated only in part with some of the worst samples.In addition, lower values of reflectance at 670 nm were partially correlated with samplesof the best quality. On the whole, even if not predictive, the color analysis allowed usto identify a narrower range of parameters associated with the best quality samples anddeserves to be further investigated.
Samples labelled as “oils of European origin” were more standardized with respectto the all analyzed parameters and characterized, as a cluster, by the lowest standarddeviations.
Belonging to the three identified classes (purchased by mill, of Italian origin, or ofEuropean origin) did not justify the significant differences found in terms of prizes awarded,which were not sustained by quality parameters. These are, in fact, exceptionally dispersed
Foods 2021, 10, 1808 11 of 12
in the samples from mills and “of Italian origin” and more homogeneous in the samples“of European origin” which showed intermediate quality parameters.
Reflectance colorimetry, which is quick, simple, economic and does not require ex-perts, could be considered a valid method for a preliminary screening of quality, allowingsamples with too high L* and b* values to be discarded, but many experiments shouldstill be performed with the aim of identifying a reflectance curve to use as fingerprint ofquality EVOOs.
Supplementary Materials: The following are available online at https://www.mdpi.com/article/10.3390/foods10081808/s1, Table S1: Legend of analyzed oil samples, Table S2: Spectrophotometricdata of all analyzed samples; Table S3: Colorimetric data of the analyzed samples; Figure S1: Principalcomponent analysis (PCA) of all analyzed samples; Figure S2: Reflectance curves of selected samples;Table S4: HPLC-DAD analysis of the analyzed samples; Figure S3: Example chromatograms of aselected sample; Figure S4: Principal component analysis (PCA) correlating quality variables with hab.Figure S5: Reflectance curves of the two individuated clusters, associated to best or worst oil quality.
Author Contributions: Conceptualization, S.C. and F.C.; methodology, F.C., L.S., and S.P.; software,F.C.; data curation, S.P. and L.S.; writing—original draft preparation, S.C. and F.C.; writing—reviewand editing, S.P. and L.S.; funding acquisition, S.C. All authors have read and agreed to the publishedversion of the manuscript.
Funding: This work was financially supported by funding from the “Sapienza” University of Rome,Ateneo 2018, RP1181643691A145.
Data Availability Statement: The datasets generated for this study are available on request to thecorresponding author.
Conflicts of Interest: The authors declare no conflict of interest.
References1. Estruch, R.; Ros, E.; Salas-Salvadó, J.; Covas, M.-I.; Corella, D.; Arós, F.; Gómez-Gracia, E.; Ruiz-Gutiérrez, V.; Fiol, M.; Lapetra, J.;
et al. Primary Prevention of Cardiovascular Disease with a Mediterranean Diet Supplemented with Extra-Virgin Olive Oil orNuts. N. Engl. J. Med. 2018, 378, e34. [CrossRef]
2. Assaf-Balut, C.; De La Torre, N.G.; Durán, A.; Fuentes, M.; Bordiú, E.; Del Valle, L.; Familiar, C.; Ortolá, A.; Jiménez, I.; Herraiz,M.A.; et al. A Mediterranean diet with additional extra virgin olive oil and pistachios reduces the incidence of gestational diabetesmellitus (GDM): A randomized controlled trial: The St. Carlos GDM prevention study. PLoS ONE 2017, 12, e0185873. [CrossRef]
3. Storniolo, C.E.; Casillas, R.; Bulló, M.; Castañer, O.; Ros, E.; Sáez, G.; Toledo, E.; Estruch, R.; Ruiz-Gutiérrez, V.; Fitó, M.; et al. AMediterranean diet supplemented with extra virgin olive oil or nuts improves endothelial markers involved in blood pressurecontrol in hypertensive women. Eur. J. Nutr. 2015, 56, 89–97. [CrossRef] [PubMed]
4. Luisi, M.L.E.; Lucarini, L.; Biffi, B.; Rafanelli, E.; Pietramellara, G.; Durante, M.; Vidali, S.; Provensi, G.; Madiai, S.; Gheri, C.F.;et al. Effect of Mediterranean Diet Enriched in High Quality Extra Virgin Olive Oil on Oxidative Stress, Inflammation and GutMicrobiota in Obese and Normal Weight Adult Subjects. Front. Pharmacol. 2019, 10, 1366. [CrossRef]
5. Mazzocchi, A.; Leone, L.; Agostoni, C.; Pali-Schöll, I. The Secrets of the Mediterranean Diet. Does [Only] Olive Oil Matter?Nutrients 2019, 11, 2941. [CrossRef]
6. Menendez, J.A.; Joven, J.; Aragones, G.; Barrajón-Catalán, E.; Beltrán-Debón, R.; Borras-Linares, I.; Segura-Carretero, A.Xenohormetic and anti-aging activity of secoiridoid polyphenols present in extra virgin olive oil: A new family of gero-suppressantagents. Cell Cycle 2013, 12, 555–578. [CrossRef]
7. Lozano-Castellón, J.; López-Yerena, A.; De Alvarenga, J.F.R.; Del Castillo-Alba, J.R.; Vallverdú-Queralt, A.; Escribano-Ferrer, E.;Lamuela-Raventós, R.M. Health-promoting properties of oleocanthal and oleacein: Two secoiridoids from extra-virgin olive oil.Crit. Rev. Food Sci. Nutr. 2020, 60, 2532–2548. [CrossRef]
8. Celano, R.; Piccinelli, A.L.; Pugliese, A.; Carabetta, S.; Di Sanzo, R.; Rastrelli, L.; Russo, M. Insights into the Analysis of PhenolicSecoiridoids in Extra Virgin Olive Oil. J. Agric. Food Chem. 2018, 66, 6053–6063. [CrossRef]
9. Klimova, B.; Novotný, M.; Kuca, K.; Valis, M. Effect of An Extra-Virgin Olive Oil Intake on the Delay of Cognitive Decline: Roleof Secoiridoid Oleuropein? Neuropsychiatr. Dis. Treat. 2019, 15, 3033–3040. [CrossRef] [PubMed]
10. EEC. Commission Regulation (EEC) No. 2568/91 on the Characteristics of Olive Oil and Olive-Residue Oil and on the Relevant Methods ofAnalysis; EEC: Brussels, Belgium, 1991.
11. EU. Commission Implementing Regulation (EU) 2019/1604 of 27 September 2019 Amending Regulation (EEC) No 2568/91 on theCharacteristics of Olive Oil and Olive-Residue Oil and on the Relevant Methods of Analysis; EU: Brussels, Belgium, 2019.
12. EU. Commission Regulation (EU) No 432/2012 of 16 May 2012 Establishing a List of Permitted Health Claims Made on Foods, Other ThanThose Referring to the Reduction of Disease Risk and to Children’s Development and Health; EU: Brussels, Belgium, 2012.
Foods 2021, 10, 1808 12 of 12
13. Becerra-Herrera, M.; Martín, A.V.; Ramos-Merchante, A.; Richter, P.; Beltrán, R.; Sayago, A. Characterization and evaluation ofphenolic profiles and color as potential discriminating features among Spanish extra virgin olive oils with protected designationof origin. Food Chem. 2018, 241, 328–337. [CrossRef] [PubMed]
14. Kosma, I.; Vavoura, M.; Kontakos, S.; Karabagias, I.; Kontominas, M.; Apostolos, K.; Badeka, A. Characterization and Classificationof Extra Virgin Olive Oil from Five Less Well-Known Greek Olive Cultivars. J. Am. Oil Chem. Soc. 2016, 93, 837–848. [CrossRef]
15. Antonini, E.; Farina, A.; Leone, A.; Mazzara, E.; Urbani, S.; Selvaggini, R.; Servili, M.; Ninfali, P. Phenolic compounds and qualityparameters of family farming versus protected designation of origin (PDO) extra-virgin olive oils. J. Food Compos. Anal. 2015, 43,75–81. [CrossRef]
16. Ambra, R.; Natella, F.; Lucchetti, S.; Forte, V.; Pastore, G. α-Tocopherol, β-carotene, lutein, squalene and secoiridoids in sevenmonocultivar Italian extra-virgin olive oils. Int. J. Food Sci. Nutr. 2016, 68, 538–545. [CrossRef]
17. Lanza, B.; Ninfali, P. Antioxidants in Extra Virgin Olive Oil and Table Olives: Connections between Agriculture and Processingfor Health Choices. Antioxidants 2020, 9, 41. [CrossRef]
18. Antonini, E.; Farina, A.; Scarpa, E.; Frati, A.; Ninfali, P. Quantity and quality of secoiridoids and lignans in extra virgin oliveoils: The effect of two- and three-way decanters on Leccino and Raggiola olive cultivars. Int. J. Food Sci. Nutr. 2016, 67, 9–15.[CrossRef]
19. Minguez-Mosquera, I.M.; Rejano-Navarro, L.; Gandul-Rojas, B.; SanchezGomez, A.H.; Garrido-Fernandez, J. Color-pigmentcorrelation in virgin olive oil. J. Am. Oil Chem. Soc. 1991, 68, 332–336. [CrossRef]
20. Cioffi, G.; Pesca, M.S.; De Caprariis, P.; Braca, A.; Severino, L.; De Tommasi, N. Phenolic compounds in olive oil and olive pomacefrom Cilento (Campania, Italy) and their antioxidant activity. Food Chem. 2010, 121, 105–111. [CrossRef]
21. Carradori, S.; Cairone, F.; Garzoli, S.; Fabrizi, G.; Iazzetti, A.; Giusti, A.M.; Menghini, L.; Uysal, S.; Ak, G.; Zengin, G.; et al.Phytocomplex Characterization and Biological Evaluation of Powdered Fruits and Leaves from Elaeagnus angustifolia. Molecules2020, 25, 2021. [CrossRef]
22. Cairone, F.; Carradori, S.; Locatelli, M.; Casadei, M.A.; Cesa, S. Reflectance colorimetry: A mirror for food quality—A mini review.Eur. Food Res. Technol. 2020, 246, 259–272. [CrossRef]
23. Mateos, R.; Espartero, J.L.; Trujillo, M.; Ríos, J.J.; León-Camacho, M.; Alcudia, F.; Cert, A. Determination of Phenols, Flavones,and Lignans in Virgin Olive Oils by Solid-Phase Extraction and High-Performance Liquid Chromatography with Diode ArrayUltraviolet Detection. J. Agric. Food Chem. 2001, 49, 2185–2192. [CrossRef] [PubMed]
24. Minguez-Mosquera, M.I.; Gandul-Rojas, B.; Gallardo-Guerrero, M.L. Rapid method of quantification of chlorophylls andcarotenoids in virgin olive oil by high-performance liquid chromatography. J. Agric. Food Chem. 1992, 40, 60–63. [CrossRef]
25. Patsilinakos, A.; Ragno, R.; Carradori, S.; Petralito, S.; Cesa, S. Carotenoid content of Goji berries: CIELAB, HPLC-DAD analysesand quantitative correlation. Food Chem. 2018, 268, 49–56. [CrossRef]
26. Rotich, V.; Al Riza, D.F.; Giametta, F.; Suzuki, T.; Ogawa, Y.; Kondo, N. Thermal oxidation assessment of Italian extra virgin oliveoil using an UltraViolet (UV) induced fluorescence imaging system. Spectrochim. Acta Part A Mol. Biomol. Spectrosc. 2020, 237,118373. [CrossRef] [PubMed]
27. Conte, L.; Milani, A.; Calligaris, S.; Rovellini, P.; Lucci, P.; Nicoli, M.C. Temperature Dependence of Oxidation Kinetics of ExtraVirgin Olive Oil (EVOO) and Shelf-Life Prediction. Foods 2020, 9, 295. [CrossRef] [PubMed]
28. Wali, A.; Damak, F.; Kawada, K.; Isoda, H.; Tamura, K.; Ksibi, M. The effects of geographic region and cultivar on oxidativestability and elemental analysis of Tunisian extra virgin olive oil. Eur. Food Res. Technol. 2021, 247, 1401–1409. [CrossRef]
29. Rotondi, A.; Bendini, A.; Cerretani, L.; Mari, M.; Lercker, G.; Toschi, T.G. Effect of Olive Ripening Degree on the Oxidative Stabilityand Organoleptic Properties of Cv. Nostrana di Brisighella Extra Virgin Olive Oil. J. Agric. Food Chem. 2004, 52, 3649–3654.[CrossRef] [PubMed]
30. Grigoriadou, D.; Tsimidou, M.Z. Quality control and storage studies of virgin olive oil: Exploiting UV spectrophotometrypotential. Eur. J. Lipid Sci. Technol. 2006, 108, 61–69. [CrossRef]
31. Gordillo, B.; Ciaccheri, L.; Mignani, A.G.; González-Miret, M.L.; Heredia, F.J. Influence of Turbidity Grade on Color andAppearance of Virgin Olive Oil. J. Am. Oil Chem. Soc. 2011, 88, 1317–1327. [CrossRef]
32. Piscopo, A.; De Bruno, A.; Zappia, A.; Gioffre, G.; Grillone, N.; Mafrica, R.; Poiana, M.M. Effect of olive storage temperature onthe quality of Carolea and Ottobratica oils. Emir. J. Food Agric. 2018, 30, 563–572.
33. Sicari, V.; Leporini, M.; Giuffré, A.M.; Aiello, F.; Falco, T.; Pagliuso, M.T.; Loizzo, M.R. Quality parameters, chemical composi-tions and antioxidant activities of Calabrian (Italy) monovarietal extra virgin olive oils from autochthonous (Ottobratica) andallochthonous (Coratina, Leccino, and Nocellara Del Belice) varieties. J. Food Meas. Charact. 2021, 15, 363–375. [CrossRef]
34. Chira, M.; Rigane, G.; Calas-Blanchard, C.; Rouillon, R.; Salem, R.B. Phenolic, tocopherols and squalene profiles (HPLC-UV) ofchemicali-SFAX olive oil according to extraction procedure. Rev. Roum. Chim. 2020, 65, 179–190. [CrossRef]
35. Serreli, G.; Deiana, M. Biological Relevance of Extra Virgin Olive Oil Polyphenols Metabolites. Antioxidants 2018, 7, 170. [CrossRef][PubMed]
36. Arslan, D.; Ok, S. Characterization of Turkish Olive Oils in Details. Food Rev. Int. 2019, 36, 168–192. [CrossRef]37. Mateos, R.; García-Mesa, J.A. Rapid and quantitative extraction method for the determination of chlorophylls and carotenoids in
olive oil by high-performance liquid chromatography. Anal. Bioanal. Chem. 2006, 385, 1247–1254. [CrossRef] [PubMed]38. Gandul-Rojas, B.; Minguez-Mosquera, M.I. Chlorophyll and Carotenoid Composition in Virgin Olive Oils from Various Spanish
Olive Varieties. J. Sci. Food Agric. 1996, 72, 31–39. [CrossRef]


![[flavouring] Extra Virgin Olive Oil - Delizio · [flavouring] Extra Virgin Olive Oil Naturally obtained from the fi rst pressing of the olive by mechanical means, Extra Virgin olive](https://img.pdfslide.us/doc/110x75/5f0ba1707e708231d43173ba/flavouring-extra-virgin-olive-oil-delizio-flavouring-extra-virgin-olive-oil.jpg)