Embed Size (px)
Citation preview
Study on employment and working conditions in air transport and airports
DG MOVE, European
Commission
Final Report
October 2015
Our ref: 22757901
Client ref: MOVE/E1/2014-92-2

Steer Davies Gleave has prepared this material for DG MOVE, European Commission. This material may
only be used within the context and scope for which Steer Davies Gleave has prepared it and may not be
relied upon in part or whole by any third party or be used for any other purpose. Any person choosing to
use any part of this material without the express and written permission of Steer Davies Gleave shall be
deemed to confirm their agreement to indemnify Steer Davies Gleave for all loss or damage resulting
therefrom. Steer Davies Gleave has prepared this material using professional practices and procedures
using information available to it at the time and as such any new information could alter the validity of
the results and conclusions made.
The information and views set out in this report are those of the authors and do not necessarily reflect
the official opinion of the European Commission. The content herein should therefore not be relied
upon as a statement of the Commission's or the Directorate-General for Mobility and Transport's views.
The European Commission does not accept responsibility for any use made thereof.
Study on employment and working conditions in air transport and airports
DG MOVE, European
Commission
Final Report
October 2015
Our ref: 22757901
Client ref: MOVE/E1/2014-92-2
Prepared by:
Prepared for:
Steer Davies Gleave 28-32 Upper Ground London SE1 9PD
DG MOVE, European Commission E4 - Internal Market & Airports Rue de Mot 24 B-1049 Brussels Belgium
+44 20 7910 5000 www.steerdaviesgleave.com
October 2015 | 4
Contents
Acknowledgements .................................................................................................................... 12
Executive Summary .................................................................................................................... 13
1 Introduction ..................................................................................................................... 24
Background and the need for this study .................................................................................... 24
This report .................................................................................................................................. 25
2 Methodology.................................................................................................................... 26
Data Collection ........................................................................................................................... 26
Stakeholder engagement............................................................................................................ 26
Quantitative analysis: Data collection ........................................................................................ 27
Data classification and reporting of direct effects ..................................................................... 30
Approach to estimating air transport cluster's direct employment and GVA ............................ 30
Employment data classification and reporting ........................................................................... 31
Labour status definitions ............................................................................................................ 33
Indirect effects methodology ..................................................................................................... 34
3 Setting the scene: traffic trends ........................................................................................ 38
The air transport market: traffic ................................................................................................. 38
4 Direct employment and GVA in the air transport cluster and at airports ............................ 44
Introduction ................................................................................................................................ 44
Direct employment in air transport and airports ....................................................................... 44
Air transport cluster: direct employment and GVA .................................................................... 48
Air transport ............................................................................................................................... 53
Airport operation and handling .................................................................................................. 60
Building and repairing of aircraft ................................................................................................ 65
Renting and leasing of aircraft .................................................................................................... 69
Travel agencies and tour operators ............................................................................................ 72
Regulatory administration .......................................................................................................... 75
Activities of extraterritorial organisations and bodies ............................................................... 77
Operation of flying schools ......................................................................................................... 79
Airport-related activities cluster: direct employment and GVA ................................................. 81
Estimating direct employment in airport-related activities ....................................................... 81
October 2015 | 5
Air transport activities inside airports (sub-cluster (b)): direct employment and GVA .............. 85
Other airport-related activities (sub-cluster (c)): direct employment and GVA ........................ 86
Summary ..................................................................................................................................... 88
5 Indirect employment ........................................................................................................ 91
Introduction ................................................................................................................................ 91
Methodology .............................................................................................................................. 91
Results ......................................................................................................................................... 92
Summary ..................................................................................................................................... 98
6 Direct employment patterns ............................................................................................ 100
Introduction .............................................................................................................................. 100
Employment profile trends ....................................................................................................... 100
Labour cost and income developments ................................................................................... 117
Air Traffic Management Cost-Effectiveness (ACE) case study .................................................. 121
Productivity and value added ................................................................................................... 123
Health and safety ...................................................................................................................... 129
Employee perceptions of working conditions .......................................................................... 131
7 Working conditions ......................................................................................................... 132
Introduction .............................................................................................................................. 132
Types of employment arrangements ....................................................................................... 133
Incomes and training opportunities ......................................................................................... 159
Union membership and other social dialogue issues ............................................................... 163
Health and safety at work ......................................................................................................... 175
Outsourcing .............................................................................................................................. 181
Multiplication of operational bases .......................................................................................... 189
Competition and growth .......................................................................................................... 202
Case study overviews................................................................................................................ 204
8 Conclusions ..................................................................................................................... 211
Main findings ............................................................................................................................ 211
Recommendations .................................................................................................................... 215
October 2015 | 6
Appendices
A Data collection & classification
B Employment and GVA tables
C Airport case studies
D Airline case studies
E List of abbreviations
Figures
Figure 2.1: Summary of Stakeholder Participation ..................................................................... 27
Figure 2.2: Approach to determining in-scope employment (using NACE classification levels) 30
Figure 2.3: Air transport cluster and airport related activities ................................................... 32
Figure 2.4: Input-Output Table processing – illustration ............................................................ 35
Figure 3.1: Passenger processed at EU airports, EU28 ............................................................... 38
Figure 3.2: Freight traffic, EU28 .................................................................................................. 39
Figure 3.3: Market share on intra-EU routes, 2005-2013 .......................................................... 40
Figure 3.4: Market share on Extra-EU routes, 2005-2013 .......................................................... 42
Figure 3.5: Numbers of scheduled airlines 2005-2013 ............................................................... 43
Figure 4.1: Direct employment in air transport and airports, EU28, 2013* ............................... 46
Figure 4.2: Direct employment in air transport and airports, EU28, 2008* ............................... 47
Figure 4.3: Direct employment (persons employed) in the air transport cluster, EU28, 2000-
2013 ............................................................................................................................................ 49
Figure 4.4: Direct employment index (persons employed) in the air transport cluster,
transportation and storage and the economy as a whole, EU28, 2000-2013 ............................ 50
Figure 4.5: Direct GVA in the air transport cluster, EU28, 2000-2013 ....................................... 51
Figure 4.6: Direct GVA in the air transport cluster, transportation and storage and the
economy as a whole, EU28, 2000-2011...................................................................................... 52
Figure 4.7: Direct passenger and freight air transport employment (persons employed, NACE
51), 2000-2013 ............................................................................................................................ 54
Figure 4.8: Direct passenger air transport employment (persons employed, NACE 51.1) by
Member State, 2008 and 2013 ................................................................................................... 55
Figure 4.9: Direct freight air transport employment (persons employed, NACE 51.21) by
Member State, 2008 and 2013 ................................................................................................... 57
October 2015 | 7
Figure 4.10: Direct GVA air transport (NACE 51), 2000-2013 ..................................................... 58
Figure 4.11: Direct GVA air transport (NACE 51), by Member State, 2011 ................................ 59
Figure 4.12: Direct airport operation and handling employment (persons employed, NACE
52.23), EU28, 2000-2013 ............................................................................................................ 61
Figure 4.13: Direct airport operation and handling employment (persons employed, NACE
52.23) by Member State, 2008 and 2013 ................................................................................... 62
Figure 4.14: Direct GVA airport operation and handling (NACE 52.23), 2000-2013 .................. 63
Figure 4.15: Direct GVA airport operation and handling (NACE 52.23), by Member State, 2011
.................................................................................................................................................... 64
Figure 4.16: Direct building and repairing of aircraft employment (persons employed, NACE
30.3 & 33.16), 2000-2013 ........................................................................................................... 67
Figure 4.17: Direct GVA Building and repairing of aircraft (NACE 30.3 & 33.16), 2000-2013 .... 68
Figure 4.18: Direct building and repairing of aircraft employment (persons employed, NACE
77.35), 2000-2013 ....................................................................................................................... 70
Figure 4.19: Direct GVA Renting and leasing of aircraft (NACE 77.35), 2000-2013 ................... 71
Figure 4.20: Direct travel agencies and tour operators employment (persons employed, NACE
79.1), EU28, 2000-2013 .............................................................................................................. 73
Figure 4.21: Direct regulatory administration employment (persons employed, NACE 84.13),
EU28, 2000-2013 ........................................................................................................................ 76
Figure 4.22: Direct extraterritorial organisation employment (persons employed, NACE 99.00)
EU28, 2000-2013 ........................................................................................................................ 78
Figure 4.23: Direct operation of flying schools employment (persons employed, NACE 85),
2000-2013 ................................................................................................................................... 80
Figure 4.24: Direct employment other airport-related activities employment (persons
employed), 2000-2013................................................................................................................ 87
Figure 4.25: Direct employment in air transport and airports, EU28, 2013 ............................... 88
Figure 4.26: Direct employment in air transport and airports, EU28, 2008 ............................... 89
Figure 5.1: Indirect employment estimates (2011) .................................................................... 93
Figure 5.2: Indirect (domestic) employment and employment sourced from outside as a
proportion of direct employment in the air transport cluster, EU27 and Belgium, 2011 .......... 95
Figure 5.3: Employment estimates including employment sourced from outside the EU (2011)
.................................................................................................................................................... 96
Figure 6.1: Passenger air transport (NACE 51.1) % persons directly employed by gender, EU28,
2008-2013 ................................................................................................................................. 101
Figure 6.2: Passenger air transport (NACE 51.1) % persons directly employed by age, EU28,
2008-2013 ................................................................................................................................. 101
October 2015 | 8
Figure 6.3: Freight air transport (NACE 51.21) % persons directly employed by gender, EU28,
2008-2013 ................................................................................................................................. 103
Figure 6.4: Freight air transport (NACE 51.21) % persons directly employed by age, EU28, 2008-
2013 .......................................................................................................................................... 103
Figure 6.5: Airport operation and handling (NACE 52.23) persons directly employed by gender,
EU28, 2008-2013 ...................................................................................................................... 104
Figure 6.6: Airport operation and handling (NACE 52.23) persons directly employed by age,
EU28, 2008-2013 ...................................................................................................................... 105
Figure 6.7: Number of pilots, 000s, EU28, 2012-2013 .............................................................. 106
Figure 6.8: Number of travel attendants and stewards (i.e. cabin crew), 000s, EU28, 2012-2013
.................................................................................................................................................. 107
Figure 6.9: Persons employed by airlines, EU28, 2013 ............................................................. 107
Figure 6.10: Ground-handling by occupation, 000s, EU28, 2013 ............................................. 108
Figure 6.11: Fixed term contracts in air transport (percentage of persons employed, NACE 51)
EU28, 2008-2013 ...................................................................................................................... 109
Figure 6.12: Fixed term contracts in air operation and handling (percentage of persons
employed, NACE 52.23) EU28, 2008-2013 ............................................................................... 110
Figure 6.13: Part-time employment in air transport (percentage of persons employed, NACE
51) EU28, 2008-2013 ................................................................................................................ 111
Figure 6.14: Part-time employment in airport operation and handling (percentage of persons
employed, NACE 52.23) EU28, 2008-2013 ............................................................................... 111
Figure 6.15: Atypical working hours (percentage of persons employed) EU28, 2008-2013 .... 112
Figure 6.16: Self-employment (persons employed, 000s) EU28, 2008-2013 ........................... 113
Figure 6.17: Temporary agency workers (persons employed, 000s) EU28, 2008-2013 ........... 114
Figure 6.18: Types of relation with current airline amongst pilots .......................................... 115
Figure 6.19: Types of direct employment contracts amongst pilots ........................................ 115
Figure 6.20: Skill level of persons employed in air transport (NACE 51) EU28, 2000-2013 ..... 116
Figure 6.21: Skill level of persons employed in airport operation and handling (NACE 52.23)
EU28, 2000-2013 ...................................................................................................................... 117
Figure 6.22: Labour cost per employee, EU28, 2000-2013 ...................................................... 118
Figure 6.23: Average income by sector, € nominal, EU28, 2005-2013..................................... 119
Figure 6.24: Income by sector, EU28, 2010 .............................................................................. 120
Figure 6.25: Airline labour costs per person employed, € nominal, 2008-2013 ...................... 121
Figure 6.26: Persons employed in air traffic control, 000s, EU28, 2002-2012 ......................... 121
Figure 6.27: Average employment cost per employee for ATCOs, €000s nominal, EU28, 2002-
2012 .......................................................................................................................................... 122
October 2015 | 9
Figure 6.28: Traffic growth (EU airline passengers and flights) vs. direct employment and GVA
for air transport ........................................................................................................................ 124
Figure 6.29: GVA per person employed for overall economy and transportation and storage,
2000-2011 (index 2000=100) .................................................................................................... 125
Figure 6.30: Productivity drivers estimate: employment in air transport 2000-2013 ............. 126
Figure 6.31: Traffic growth (total passengers and flights) vs. direct employment and GVA for
airport operation and handling ................................................................................................ 127
Figure 6.32: Traffic growth (total passengers and flights) vs. direct employment and GVA for
the air transport cluster ............................................................................................................ 128
Figure 6.33: Health and safety information at work, 1995-2010 ............................................. 130
Figure 6.34: Trends in employee health, 2005-2013 ................................................................ 130
Figure 6.35: Employees perceptions of working conditions, 1995-2010 ................................. 131
Figure 7.1: Relationship between airline and self-employed pilots engaged via a temporary
agency ....................................................................................................................................... 134
Figure 7.2: Airport stakeholder responses: perceived trend in employment arrangements from
2005 to 2014. ............................................................................................................................ 145
Figure 7.3: Airport stakeholder responses: perceived trend in employment arrangements from
2005 to 2014 amongst terminal staff. ...................................................................................... 146
Figure 7.4: Airport stakeholder responses: expected trend in employment arrangements over
next 5 years. .............................................................................................................................. 146
Figure 7.5: Airline stakeholder responses: perceived trend in employment arrangements from
2005 to 2014 amongst flight crew. ........................................................................................... 149
Figure 7.6: Airline stakeholder responses: perceived trend in employment arrangements from
2005 to 2014 amongst cabin crew. .......................................................................................... 150
Figure 7.7: Stakeholder responses: perceived trend in wages and remuneration by profession
from 2005 to 2014. ................................................................................................................... 159
Figure 7.8: Stakeholder responses: perceived trend in wages and remuneration by worker
profile from 2005 to 2014. ....................................................................................................... 160
Figure 7.9: Stakeholder responses: perceived trend in training opportunities by profession
from 2005 to 2014. ................................................................................................................... 160
Figure 7.10: Airport stakeholder responses: coverage of collective labour agreements amongst
staff in 2014. ............................................................................................................................. 166
Figure 7.11: Airport stakeholder responses: level of collective agreements in 2014. ............. 167
Figure 7.12: Airport stakeholder responses: unionisation amongst staff by profession in 2014.
.................................................................................................................................................. 167
Figure 7.13: Airport stakeholder responses: perceived trend in unionisation from 2005 to 2014.
.................................................................................................................................................. 168
October 2015 | 10
Figure 7.14: Airline stakeholder responses: unionisation amongst staff by profession in 2014.
.................................................................................................................................................. 169
Figure 7.15: Airline stakeholder responses: perceived trend in unionisation from 2005 to 2014.
.................................................................................................................................................. 170
Figure 7.16: Airline stakeholder responses: level of collective agreements in 2014. .............. 171
Figure 7.17: Stakeholder responses: perceived trend in accidents and incidents from 2005 to
2014. ......................................................................................................................................... 176
Figure 7.18: Airport stakeholder responses: perceived trend in accidents and incidents by
employment arrangement in 2014. .......................................................................................... 176
Figure 7.19: Airport stakeholder responses: perceived trend in health and safety training by
employment arrangement in 2014. .......................................................................................... 177
Figure 7.20: Airline stakeholder responses: perceived trend in accidents and incidents by
employment arrangement in 2014. .......................................................................................... 178
Figure 7.21: Airline stakeholder responses: perceived trend in health and safety training by
employment arrangement in 2014. .......................................................................................... 178
Figure 7.22: Stakeholder responses: perceived trend in outsourcing from 2005 to 2014. ...... 183
Figure 7.23: Stakeholder responses: expected trend in outsourcing over next 5 years. ......... 183
Figure 7.24: Stakeholder responses: perceived difference in aspects of employment between
Member States in 2014. ........................................................................................................... 198
Figure 8.1: Direct employment in air transport and airports, EU28, 2013 ............................... 212
Figure 8.2: Indirect employment estimates (2011) .................................................................. 214
Tables
Table 4.1: Eurostat cross-checks................................................................................................. 84
Table 4.2: Direct employment in air transport cluster activities inside airports (sub-cluster (b)),
EU28, 2013 .................................................................................................................................. 85
Table 4.3: Direct GVA in air transport cluster activities inside airports (sub-cluster (b)), EU28,
2013 ............................................................................................................................................ 86
Table 4.4: Direct employment in other airport related activities (sub-cluster (c)), EU28, 2013 87
Table 4.5: Direct GVA in other airport-related activities (sub-cluster (c)), EU28, 2013 ............. 88
Table 4.6: Summary of direct employment in air transport and airports, 2000-2013 ............... 90
Table 5.1: Employment and output multipliers .......................................................................... 92
Table 5.2: Employment sensitivity of non-aviation sectors........................................................ 93
Table 5.3: Comparison of indirect output multipliers ................................................................ 94
October 2015 | 11
Table 5.4: Summary of employment estimates 2008 - 2011 (air-transport cluster) .................. 97
Table 5.5: Summary of employment estimates 2008 - 2011 (other airport-related services) ... 97
Table 5.6: Direct and indirect employment and GVA in the air transport cluster, 2013 ........... 99
Table 5.7: Direct and indirect employment and GVA in the other airport-related activities, 2013
.................................................................................................................................................... 99

October 2015 | 12
Acknowledgements
We would like to acknowledge with appreciation all those who have contributed to this
study, including all stakeholders who we engaged with and those that took part in the
surveys. We would particularly like to thank the airports, airlines, workers representative and
temporary work agency that participated in the case studies. In particular we extend our
thanks to ACI Europe for facilitating our engagement with airports, as well as to Eurostat,
Eurofound and the National Bank of Belgium for the data and support provided.
October 2015 | 13
Executive Summary
Background
Since the progressive implementation of the single aviation market began in 1992, the air
transport market in Europe has undergone many significant changes. Passenger traffic has
grown rapidly, stimulated by new airline business models, a wider choice of air services, and
lower air fares. The industry has also been changed by transnational alliances and mergers,
and the bankruptcies of a number of carriers, including Malev and Spanair.
The European Commission has appointed Steer Davies Gleave to update and extend a
previous study conducted in 2012; the "Study on the effects of the implementation of the EU
aviation common market on employment and working conditions in the Air Transport Sector
over the period 1997/2010". This is in the context of the 2011 White Paper, where the
Commission undertook to promote quality jobs and good working conditions and a desire to
see 'a socially responsible aviation sector'.
Methodology
Data relevant to the study was collected via an extensive stakeholder consultation, and
through publically available data sources. The information that the study draws on is grouped
into four categories:
1. Primary data sources: extractions from Eurostat databases;
2. Supplementary data sources: data collected from other sources and desktop research;
3. Survey data: data provided by stakeholders in response to the quantitative and
qualitative surveys; and
4. Other information: publications, annual reports, other publicly available information, as
well as any internal reports and material provided by stakeholders.
The purpose of the stakeholder consultation component of the study was both to gather
detailed employment data across the air transport sector and also to gain an understanding
of the issues of the stakeholders of the industry. In agreement with the Commission we
defined a programme of stakeholder interaction that involved the following organisations:
Airports & airport associations;
Airlines & airline associations;
Civil aviation administrations;
EUROCONTROL & CANSO;
Freight associations;
Ground-handlers & ground-handling associations;
Maintenance representatives;
Temporary work agencies;
Worker associations; and
Computerised Reservations Systems organisations.
Employment data classification and reporting
The quantitative part of the study aims to measure the direct and indirect effects on the
economy and employment of air transport and related industries, including aircraft
manufacturing, air-related tourism (with respect to travel agencies and tour operators), flying
schools, local land transport facilities and catering and hotel activities within airports.
October 2015 | 14
As set out in the Terms of Reference, all economic activities related to air transport and those
established within airports are included in the calculation of direct employment and value
added (GVA). The methodology has been standardised as far as possible, to enable the
analysis to be easily replicable in future updates, and relies on the widely recognised NACE1
Rev.2 classification of economic activities.
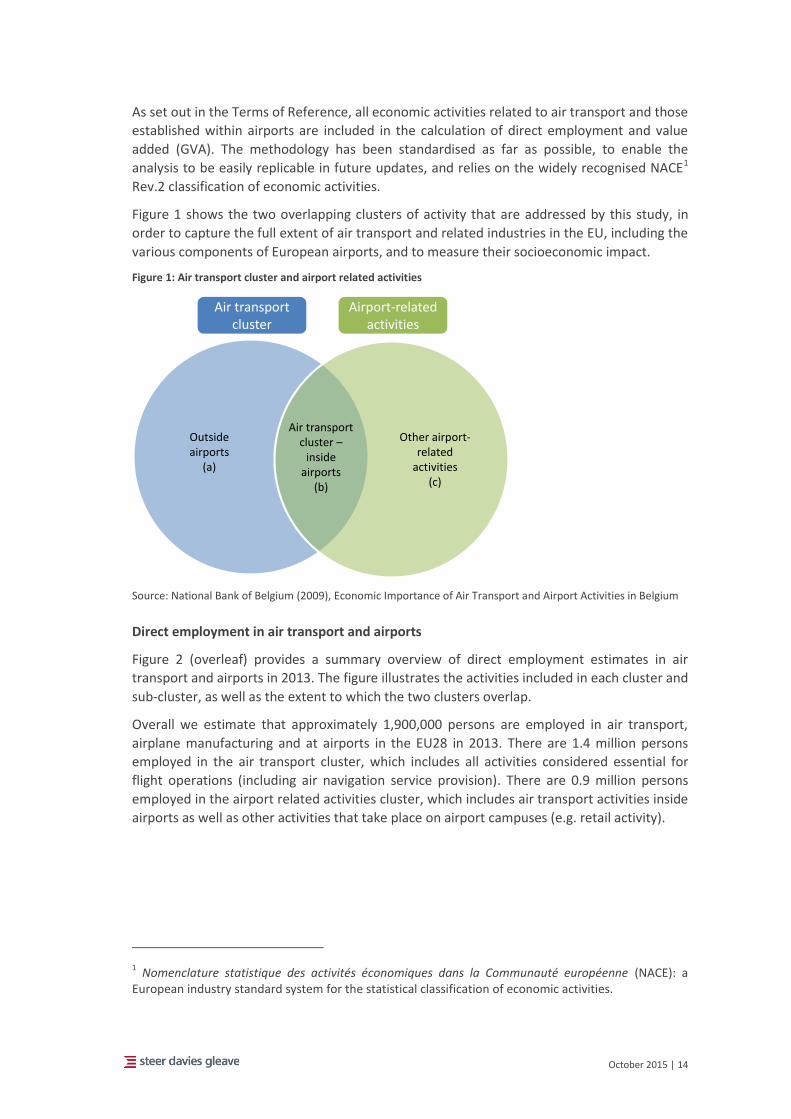
Figure 1 shows the two overlapping clusters of activity that are addressed by this study, in
order to capture the full extent of air transport and related industries in the EU, including the
various components of European airports, and to measure their socioeconomic impact.
Figure 1: Air transport cluster and airport related activities
Source: National Bank of Belgium (2009), Economic Importance of Air Transport and Airport Activities in Belgium
Direct employment in air transport and airports
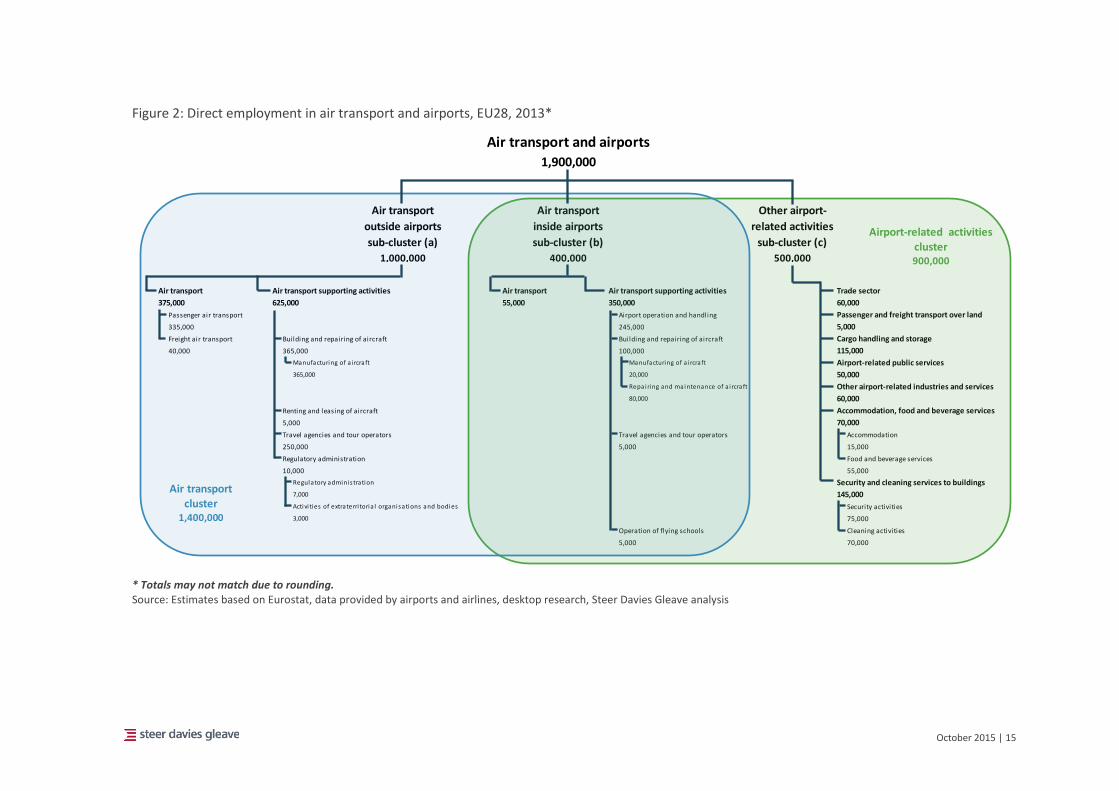
Figure 2 (overleaf) provides a summary overview of direct employment estimates in air
transport and airports in 2013. The figure illustrates the activities included in each cluster and
sub-cluster, as well as the extent to which the two clusters overlap.
Overall we estimate that approximately 1,900,000 persons are employed in air transport,
airplane manufacturing and at airports in the EU28 in 2013. There are 1.4 million persons
employed in the air transport cluster, which includes all activities considered essential for
flight operations (including air navigation service provision). There are 0.9 million persons
employed in the airport related activities cluster, which includes air transport activities inside
airports as well as other activities that take place on airport campuses (e.g. retail activity).
1 Nomenclature statistique des activités économiques dans la Communauté européenne (NACE): a
European industry standard system for the statistical classification of economic activities.
Air transport cluster
Airport-related activities
Outside airports
(a)
Air transport cluster –
inside airports
(b)
Other airport-related
activities(c)
October 2015 | 15
Figure 2: Direct employment in air transport and airports, EU28, 2013*
* Totals may not match due to rounding. Source: Estimates based on Eurostat, data provided by airports and airlines, desktop research, Steer Davies Gleave analysis
Air transport and airports
1,900,000
Air transport
outside airports
sub-cluster (a)
Air transport
inside airports
sub-cluster (b)
Other airport-
related activities
sub-cluster (c)
1,000,000 400,000 500,000
Air transport Air transport supporting activities Air transport Air transport supporting activities Trade sector
375,000 625,000 55,000 350,000 60,000
Passenger air transport Airport operation and handling Passenger and freight transport over land
335,000 245,000 5,000
Freight air transport Building and repairing of aircraft Building and repairing of aircraft Cargo handling and storage
40,000 365,000 100,000 115,000
Manufacturing of a i rcraft Manufacturing of a i rcraft Airport-related public services
365,000 20,000 50,000
Repairing and maintenance of a i rcraft Other airport-related industries and services
80,000 60,000
Renting and leasing of aircraft Accommodation, food and beverage services
5,000 70,000
Travel agencies and tour operators Travel agencies and tour operators Accommodation
250,000 5,000 15,000
Regulatory administration Food and beverage services
10,000 55,000
Regulatory adminis tration Security and cleaning services to buildings
7,000 145,000
Activi ties of extraterri toria l organisations and bodies Security activities
3,000 75,000
Operation of flying schools Cleaning activities
5,000 70,000
Air transportcluster
1,400,000
Airport-related activities cluster900,000
October 2015 | 16
The air transport cluster and airport-related activities cluster overlap, so the sum of the
clusters is greater than the total. Three sub-clusters are then defined by the overlap:
Sub-cluster (a): Air transport activities outside airports, 1.0 million persons employed
Sub-cluster (b): Air transport activities inside airports, 0.4 million persons employed
Sub-cluster (c): Other airport-related activities, 0.5 million persons employed.
Indirect employment
Indirect employment is the employment generated upstream, on the supplier side, by the
activities in the air transport cluster and airport-related activities. In order to produce
estimates of the indirect employment generated by the activities of the "Air transport
cluster" and "Other airport-related activities" we have undertaken analysis of Input-Output
tables (IOTs), which record macroeconomic activity as a system of interrelated goods and
services and show how the parts of the system can be affected by a change in one particular
sector.
The approach that we have followed uses a standard analytical technique for estimating
indirect employment that is in line with the widely applied input-output model (or Leontief
methodology). First we quantify the direct economic output generated by the air transport
cluster and other airport-related activities. Secondly, we examine the catalytic effect that the
clusters’ services and products have in boosting activity elsewhere in the economy via the
supply chain.
This study is focused upon producing estimates of indirect employment at the EU level.
Therefore we consider it appropriate to make use of the EU28 Input-Output table from 2011.
We note that the EU28 IOT treats all the “leakages” (imports and exports) to other EU
Member State economies as domestic, thus internalising them. As a result this generates
higher multipliers compared to a bottom up approach whereby national estimates (which
exclude any import/export effects between countries) are added up.
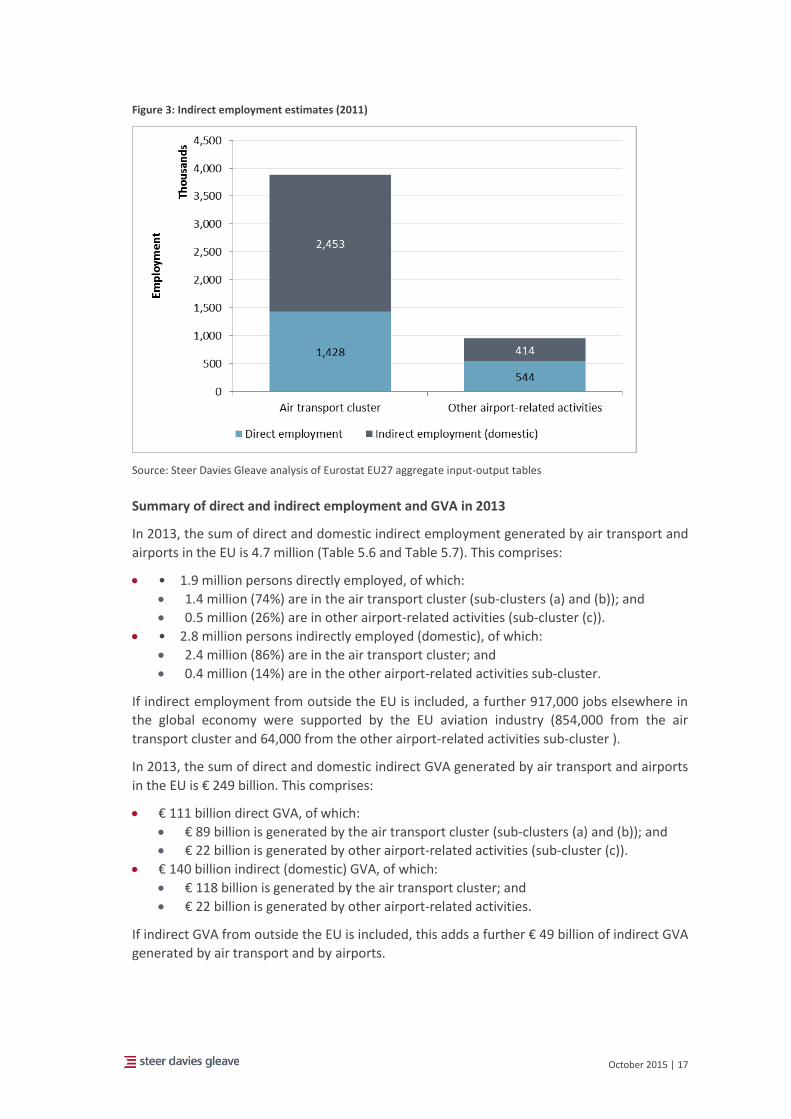
As shown in Figure 3, over 2.87 million indirect jobs are supported by the air transport and
other airport-related activities clusters. Of these, 2.45 million relate to the air transport
cluster, and 0.41 million are supported by other airport-related activities.
October 2015 | 17
Figure 3: Indirect employment estimates (2011)
Source: Steer Davies Gleave analysis of Eurostat EU27 aggregate input-output tables
Summary of direct and indirect employment and GVA in 2013
In 2013, the sum of direct and domestic indirect employment generated by air transport and
airports in the EU is 4.7 million (Table 5.6 and Table 5.7). This comprises:
• 1.9 million persons directly employed, of which:
1.4 million (74%) are in the air transport cluster (sub-clusters (a) and (b)); and
0.5 million (26%) are in other airport-related activities (sub-cluster (c)).
• 2.8 million persons indirectly employed (domestic), of which:
2.4 million (86%) are in the air transport cluster; and
0.4 million (14%) are in the other airport-related activities sub-cluster.
If indirect employment from outside the EU is included, a further 917,000 jobs elsewhere in
the global economy were supported by the EU aviation industry (854,000 from the air
transport cluster and 64,000 from the other airport-related activities sub-cluster ).
In 2013, the sum of direct and domestic indirect GVA generated by air transport and airports
in the EU is € 249 billion. This comprises:
€ 111 billion direct GVA, of which:
€ 89 billion is generated by the air transport cluster (sub-clusters (a) and (b)); and
€ 22 billion is generated by other airport-related activities (sub-cluster (c)).
€ 140 billion indirect (domestic) GVA, of which:
€ 118 billion is generated by the air transport cluster; and
€ 22 billion is generated by other airport-related activities.
If indirect GVA from outside the EU is included, this adds a further € 49 billion of indirect GVA
generated by air transport and by airports.
October 2015 | 18
Direct employment patterns
A number of social trends in direct employment in air transport and airport operations and
handling were analysed.
Employment trends by gender and age
In passenger air transport in 2013 the percentage of total male persons employed was 60%.
The proportion of male persons employed in passenger air transport is slightly higher than
the overall economy, and lower (by 15-20 percentage points) than that for the transportation
and storage sector. The age profile of persons employed in passenger air transport is higher
overall (by approximately 5-10 percentage points) than those employed in transportation
and storage more generally, and the overall economy.
The proportion of males employed in freight air transport activities (77% in 2013) is higher
than that seen in passenger air transport employment. This may be due to a number of
reasons: while passenger air transport employment includes a large number of cabin crew
staff, a significant proportion of which are female, freight air transport may include a higher
relative proportion of manual labour activities which are traditionally undertaken by more
males than females.
The proportion of males employed in airport operation and handling activities is closer to
that seen in freight air transport activities rather than passenger air transport activities. In
this sector the proportion of males employed is only slightly lower than that of the
transportation and storage sector more generally, and significantly higher than that observed
in the overall economy.
Across all three areas (passenger air transport, freight air transport and airport operation and
handling), a clear decline can be seen in the proportion of 15-29 year olds employed. This
indicates a stagnation or reduction in employment opportunities in the air transport sector
for this group. It should also be noted that this age group would also be most impacted by
changes in employment and working conditions. Employees entering the workforce are more
likely to belong to this age group and to be employed by the new subsidiaries or employee
groups that have been set up with revised employment and working conditions, which only
apply to new recruits and not retrospectively to existing employees (for example the British
Airways Mixed Fleet cabin crew, as described in the British Airways case study in Appendix C).
Older staff would be more likely to be included in the legacy groups of employees with higher
wages and better conditions, with the newer arrangements offered to older staff starting
new jobs and any 15-29 year olds entering the workforce.
Employment trends by type of employment arrangement
From 2008 to 2013, between 6% and 8% of persons in air transport were employed on fixed
term contracts. The proportion of fixed term contracts in air transport is consistently lower
than that seen in the overall economy (by between 2 and 6 percentage points), and also the
transportation and storage sector, albeit by a smaller amount. As for air transport, the
proportion of fixed term contracts in airport operation and handling is consistently lower
than that seen in the overall economy (by between 1 and 2 percentage points), but is in line
with or slightly higher than the proportions observed in the transportation and storage
sector.
The proportion of persons employed part-time in air transport has remained relatively stable
at approximately 16% between 2008-2012, and rose to 18% in 2013. There are substantially
October 2015 | 19
higher rates of part-time employment amongst women working in air transport: from 2008
and 2012, between 25% and 30% of women were employed part-time, rising to 34% in 2013.
These figures are significantly higher than those seen for both the transportation and storage
sector and the overall economy. Under 10% of men are employed part-time, rates which are
lower than those observed in the transportation and storage sector and the overall economy.
In 2013, around 10,000 people were self-employed in airport operation and handling, or
around 4% of all persons employed. This is significantly less than transportation and storage
(approximately 11% in 2013) and the overall economy (approximately 15%). There were
approximately 5,000 self-employed persons employed in passenger and freight air transport
combined, approximately 1% of all persons employed in the activity. More people are self-
employed in passenger air transport than freight air transport.
Between 2008 and 2010, temporary agency workers in passenger air transport declined by
two thirds. The likely reason for this is that during the recession, it was easier for airlines to
cut temporary agency workers rather than permanent staff due to the more flexible labour
agreements in place. According to the recently published study on Atypical Employment in
Aviation by the University of Ghent2, 79.3% of the 6,633 pilots that responded to their
questionnaire stated they had a direct employment contract with the airline they currently
work for. The remaining 16.1% (excluding the 5% of data which is missing) are believed to
work atypically, including 5% who are self-employed and 5% who are engaged through a
temporary work agency.
Labour cost and income developments
On average over 2000-2013, labour costs per employee in air transport have been +32%
higher than costs in airport operation and handling. Employee costs in both categories have
been relatively flat in real terms, with almost no growth observed between 2008 and 2013 in
air transport and only modest growth (+0.6 compounded annually) in airport operations and
handling.
Productivity and value added
Despite significant growth in the number of passengers transported by EU airlines,
employment at EU airlines has reduced since 2000. This indicates that significant productivity
increases were achieved. However, part of this increase can be explained by:
the fact that passengers per aircraft have increased and flights (by EU airlines) appear to
have become slightly shorter on average, both of which will reduce the employee per-
passenger numbers; and
outsourcing, particularly of ground handling, reducing the number of airline employees
per passenger.
If productivity growth is calculated on the basis of EU airline passengers per person
employed, there was a 43% increase between 2000 and 2013, or 4.3% per year. However 4%
of this is accounted for by the fact that journey lengths reduced on average. A further 24% of
this accounted for by more passengers being transported on the aircraft, due to higher load
factors and seating densities, and possibly the use of larger aircraft. Productivity growth
2 Y. Jorens, D. Gillis, L. Valcke & J. De Coninck, Atypical Forms of Employment in the Aviation Sector,
European Social Dialogue, European Commission, 2015.
October 2015 | 20
measured on the basis of persons employed per flight-kilometre was 15% between 2000 and
2013, or 1.3% per year. Over this period, there was a large move towards outsourcing
ground-handling by airlines. This move represents a further 3% of the productivity increases3.
If productivity growth was measured in terms of airline and ground-handling employees per
flight-kilometre, it would be approximately 13%.
Despite significant growth in the number of passengers processed at EU airports,
employment in airport operation and handling has reduced over the period. This indicates
that significant productivity increases were achieved in terms of persons employed per
passenger (36%). However, employment at airports is also linked to the number of flights
handled. Growth in flights was lower than the growth in passengers (a result of more
passengers per flight and shorter journey lengths, as explained in the air transport analysis
above). Smaller productivity increases were then realised in terms of persons employed per
flight (12%). As also described above, there was a large move towards outsourcing ground-
handling by airlines between 2000 and 2013, and that in large part this move resulted in the
transfer of persons employed in air transport to persons employed in airport operation and
handling. Given this, the productivity increases (per flight) might be more significant than
apparent from our analysis.
In comparison, analysis of GVA per person employed for the overall economy, and for the
transportation and storage sector (NACE H) over 2000-2011 (GVA data is not available for
2012 and 2013), indicates that productivity in the overall economy increased by a net +11.6%
over 2000-2011, with transportation and storage productivity over 2000-2011 increasing by a
net +8.3%. In air transport, GVA productivity has increased by +24.3% over the period,
however the impact of economic cycles is felt more strongly here than it is for the broader
economy and transportation and storage sector.
Employment and working conditions
Qualitative developments in employment and working conditions are reported across a
number of issues. Developments are based primarily on stakeholder inputs, and some
supporting legal background is also provided for a number of areas.
A range of stakeholders across the air transport sector were approached to participate in the
study, including representatives of various types of employers and employees. However the
views of stakeholders provided in the questionnaire or interview responses is limited by the
number and balance of the respondents.
Types of employment arrangements
Across the air transport sector, a consistent increase in part-time employment has been
reported. There is some evidence of increased fixed term contracts, particularly within
airports, but the prevalence is more varied. This is also the case for atypical working hours.
3 Ground-handling employment forms a major part of employment in airport operations and handling.
It also forms the largely variable part of airport operations and handling over the period 2000-2013, as other activities included here (e.g. air traffic control and fire prevention) have not been as variable and are not as directly linked to traffic. The changes seen in airport operation and handling employment are assumed then to be (in large part) reflective of the changes in ground-handling employment over 2000-2013.
October 2015 | 21
Self-employment is not common in the sector, although as reported in the Ghent University
Study on atypical employment, self-employment for flight crew is used by a number of
airlines.
The reasons for utilising these types of employment arrangement are generally common
across the industry: they enable increased flexibility, reduction in costs and support business
growth.
Temporary agency employment occurs throughout the sector: instances of temporary agency
employees engaged as flight crew, cabin crew, ground-handlers, terminal staff and in back-
office functions have all been cited. The prevalence, however, varies. Low cost carriers tend
to use temporary agency workers across all functions (flight crew, cabin crew, and ground-
handling), but this is not the case in all instances, and many network carriers also now
engage these types of employees, generally in terminal or ground-handling functions, but
one network carrier also uses temporary agency employees consistently for cabin crew
functions. Temporary agency workers may be employed by the agency and provided to the
airline, or they may be self-employed and engaged by the agency to provide services for the
airline. One agency made specific comments on pilot self-employment, stating that Ireland
and the UK are the only two jurisdictions where they will offer the self-employment
arrangement (i.e. engagement of self-employed pilots through temporary agencies) as well
as temporary employment arrangements. Some airports do engage temporary agency staff,
although the proportions are not high.
The primary challenge with respect to temporary agency workers, as reported by the
respondents was ensuring that the correct tax and social security arrangements are applied,
as compliance is considered a fundamental moral requirement for the company’s operation.
Incomes and training opportunities
The stakeholder responses regarding the trend in incomes differ by type of stakeholder:
whilst airlines and airports generally reported increases either in line with or above inflation,
worker representatives suggest that there has been a decrease in real terms. It must be
noted that worker representatives would be commenting for all persons employed (including
those in outsourced functions or employed by temporary agencies) whereas the airlines
above would be referring to incomes only within their organisations.
Some distinction in the trends in salaries by professions also emerged. Whilst increases have
generally been perceived for pilots and terminal staff, there is a more mixed impression in
the salary trend for cabin crew and ground-handlers.
Training opportunities are broadly considered by the industry to have increased across all
professions by all stakeholders except the worker representatives who consider there to be
fewer opportunities amongst cabin crew, ground-handlers and terminal staff. Pay-to-fly is
acknowledged in published literature (e.g. Atypical employment study, Ghent University) as
an issue however stakeholders did not specifically comment in this area.
There was no discernible difference in salary or training trends between gender and age
groups for the stakeholders that responded.
Union membership and other social dialogue issues
Collective labour agreements are common in the air transport sector as the majority of
persons employed by airports and airlines are covered by these agreements. The forms of
the agreements do vary by location and employer: Collective labour agreements (CLAs) tend
October 2015 | 22
to cover employee groups within the organisation and, whilst national company agreements
tend to be reasonably prevalent, collective labour agreements can be negotiated at different
levels depending on the issue. Stakeholders were in agreement that collective labour
agreements do not apply to a workforce distributed across a number of bases.
The level of unionisation varies across the sector. Flight crew are very highly unionised, with
airline respondents providing estimates of over 70% as members of unions. Some employee
representative organisations consider that representation is a challenge, particularly in some
low cost carrier airlines which, they state, have no dialogue with unions. Unions have
significant presences amongst cabin crew and air traffic controllers also. The picture of
unionisation for ground-handling staff and airport terminal staff is more mixed, but these
professions are generally considered to have lower levels of unionisation. Although the
evidence is limited, temporary agency workers appear to have lower levels of unionisation
than permanent employees. Coverage by collective labour agreements also appears
marginally lower.
Stakeholders reported that air crews are represented by European works councils and
elected work councils under national legislation. Airport employees tend to be represented
by either elected works councils or other arrangements, such as an information and
consultation body provided for under national rules. Across the industry though, employees
are consulted about key changes to company structure and working conditions. However,
whilst airports and airlines believe this works well, several employee representative
organisations believe this does not.
Health and safety at work
Health and safety is broadly considered across the air transport industry to have improved
over the last ten years, as the number of accidents and incidents is believed to have reduced.
According to the data presented in Chapter 6, persons employed in air transport directly
generally feel well informed about health and safety in the workplace, however, there are
lower satisfaction rates among people employed in transport support activities.
The number of accidents and completion of health and safety training is generally not
thought to differ between employees with different employment arrangements. Some
airports and airlines have suggested that there are lower numbers of accidents and incidents
amongst part-time employees and employees with fixed-term contracts, but the broader
trend indicates not noticeable difference.
A consensus emerged that different worker profiles (in terms of gender and age) had no
impact on health and safety performance.
Outsourcing
Across the air transport sector, outsourcing has increased over the last ten years, and it is
anticipated that this trend will continue over the coming five years. The functions outsourced
vary depending on the sector, but specialist functions such as ground-handling, security,
cleaning and administrative positions are most commonly outsourced. Some low-cost
carriers also outsource flight and cabin crew, and we are aware of one network carrier that
has recently outsourced cabin crew activities to Asia for two routes.
The reasons for outsourcing are similar across the sector: cost efficiency, flexibility and access
to resources (both low and high skilled) are regularly cited as the drivers for outsourcing.
October 2015 | 23
Whilst the exact impact of outsourcing on employees working condition is unclear, given that
many respondents were not aware of whether there were any differences, there seems a
common consensus that social security is lower for employees working in outsourced
functions. We have also seen evidence that outsourced cabin crew functions are paid lower
wages. These concerns are particularly acute amongst the worker representatives, who also
indicate lower wages, training and holiday entitlement.
Multiplication of operational bases
A number of airlines operate from multiple bases across the EU, in accordance with their
operating needs and providing a high level of air connectivity and a broader range of
destinations for passengers. Whilst this can have operational and cost benefits for the
employers and respond to workers' needs to work freely across Europe, the significant
differences in taxation, social security and employment between Member States may cause
significant complications for employees, particularly if they are working from a base in a
different country to where they live. These differences can be especially difficult for
temporary agency workers to negotiate as often resolution to any uncertain circumstances is
not made until after the fixed-term contract is over.
Employees are generally aware of the differences between regulations at different
operational bases and this can cause significant problems. Employees are generally aware if
their wages and labour conditions are worse than colleagues, and this can lead to tensions
and, as reported by one temporary agency, employees are not willing to work in certain
locations.
Case studies
A number of case studies have been developed as follows:
3 airports: Athens, Dublin, and Liège, to illustrate outsourcing practices at airports along
with other employment arrangements.
6 airlines: Air France, British Airways, easyJet, FedEx, Finnair, and Ryanair, to illustrate
outsourcing practices at airlines, challenges associated with multiplication of operational
bases with respect to employment and working conditions, and other interesting issues
identified.
1 temporary work agency: CAE Parc aviation, to illustrate the operations of, and
challenges faced by, temporary work agencies.
October 2015 | 24
1 Introduction Background and the need for this study
1.1 Since the gradual implementation of the single aviation market began in 1992, the air
transport market in Europe has undergone many significant changes. Passenger traffic has
grown rapidly, stimulated by new airline business models, a wider choice of air services, and
lower air fares. The industry has also been changed by transnational alliances and mergers,
and the bankruptcies of a number of carriers, including Malev and Spanair.
1.2 The European Commission has appointed Steer Davies Gleave to update and extend a
previous study conducted by Steer Davies Gleave in 2012; the "Study on the effects of the
implementation of the EU aviation common market on employment and working conditions
in the Air Transport Sector over the period 1997/2010". This is in the context of the 2011
White Paper, where the Commission undertook to promote quality jobs and good working
conditions and a desire to see 'a socially responsible aviation sector'.
1.3 Employment and working conditions in the air transport sector is becoming increasingly high
profile, as is social dialogue at a European Union (EU) level, which was mentioned in
Juncker’s Opening Statement in the European Parliament Plenary Session in July 20144. There
is active social dialogue in civil aviation and DG MOVE is working with EU social partners to
identify social and employment issues in air transport.
1.4 The 2012 study covered the situation until 2010, and there have been a number of
developments in the EU air transport industry since then. The current study has been
commissioned in order to update and expand upon the previous analysis. The scope of the
current study has also been expanded, to capture the full extent of air transport and related
industries in the EU. A number of new categories are included, including manufacturing of
aircraft, renting and leasing of aircraft, travel agencies and tour operators and all ‘airport
related activities’ (i.e. all activities undertaken within the perimeter of each airport, not only
airport operation and handling activities).
1.5 The study comprises both quantitative and qualitative components. The quantitative
component measures direct and indirect effects on the economy and employment of air
transport and related industries. The scope of activities has been widened as compared to
2012 study, and the methodology standardised, with employment classified using standard
industry definitions of economic activities (consistent with Eurostat). The qualitative
component of the study includes an analysis of developments and trends regarding
employment relationships, quality, and working conditions in the air transport sector. These
4 See http://www.eesc.europa.eu/resources/docs/jean-claude-juncker---political-guidelines.pdf.
October 2015 | 25
trends have been illustrated by a number of concrete examples from the sector (case studies
on airlines (including a temporary employment agency), and airports).
This report
1.6 This is the final report for the study. The document is structured as follows:
Chapter 2 describes the overall methodology, including the approach to the stakeholder
engagement and data collection, to estimating employment in air transport and airports,
and explains how data is presented in the report;
Chapter 3 provides a brief overview of developments in the air transport market in the
EU, with regard to overall traffic, and changes to the structure of the market following
liberalisation;
Chapter 4 provides the first part of the quantitative analysis, presenting an estimate of
direct employment and Gross Value Added (GVA) in air transport and airports in the EU;
Chapter 5 features the second part of the quantitative analysis and provides an estimate
of the indirect employment effects of air transport and airports in the EU, including the
methodology for this estimation;
Chapter 6 presents the first part of the qualitative analysis and focuses on employment
patterns in air transport and airport operations and handling, including themes such as
worker profiles, labour cost and income, productivity and value added, and health and
safety;
Chapter 7 presents the second part of the qualitative analysis and reports on working
conditions as expressed by stakeholders, including an overview of some of the legal
challenges in each area; and
Chapter 8 presents the conclusions and main findings, including a number of
recommendations for further research.
1.7 There are five appendices:
Appendix A: methodology detail, including data collection and classification;
Appendix B: employment and GVA data tables;
Appendix C: airport case studies;
Appendix D: airline and temporary work agency case studies; and
Appendix E: list of abbreviations.
October 2015 | 26
2 Methodology
Data Collection
Stakeholder engagement
2.1 The purpose of the stakeholder consultation component of the study was both to gather
detailed employment data across the air transport sector and also to gain an understanding
of the issues of the stakeholders of the industry. In agreement with the Commission a
programme of stakeholder interaction was designed that involved the following
organisations:
Airports;
Airport associations;
Airlines & airline associations;
Civil aviation administrations;
EUROCONTROL;
Freight associations;
Ground-handlers & ground-handling associations;
Maintenance representatives;
Temporary work agencies;
Worker associations; and
Computerised Reservations Systems organisations.
2.2 The final list of stakeholders consulted was determined in agreement with the European
Commission.
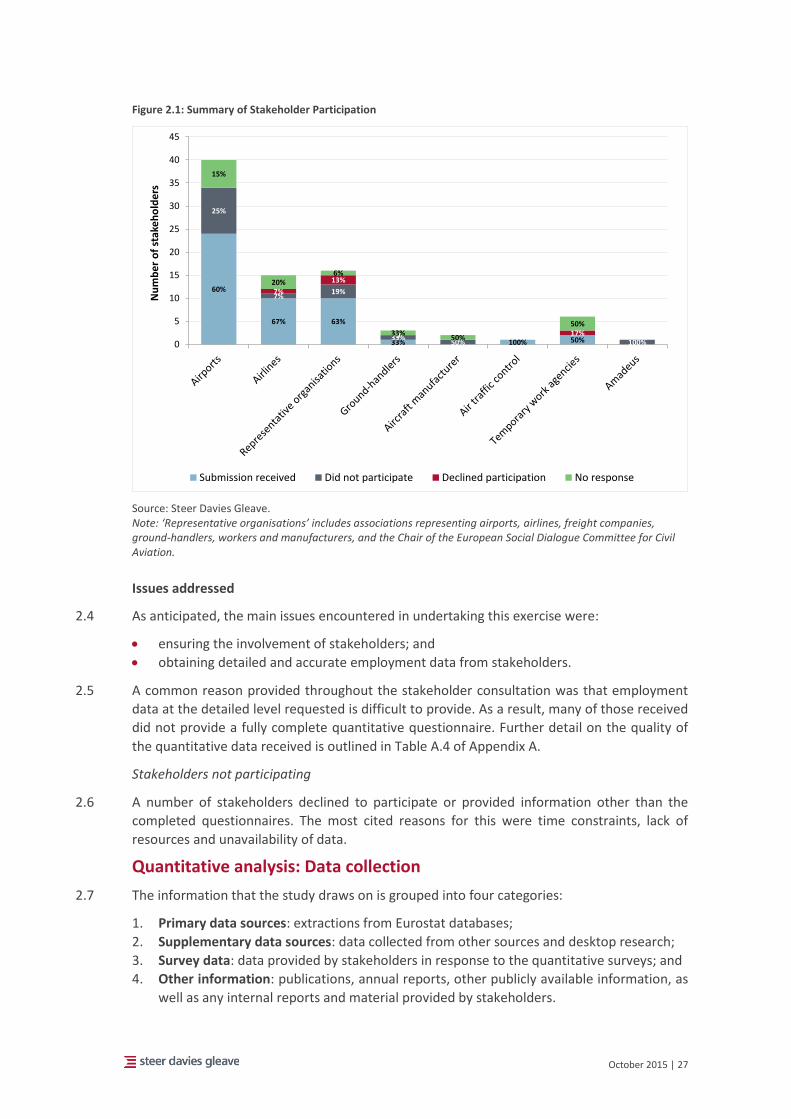
2.3 Figure 2.1 provides a summary of participation by stakeholder group. An explanation of the
status categories is as follows:
Submission received: completed questionnaires were received or other information,
such as annual reports, was provided.
Did not participate: stakeholder originally agreed to participate in the study, but
provided no submission.
Declined participation: stakeholder declined to participate in any capacity.
No response: stakeholder did not respond to any communication.
October 2015 | 27
Figure 2.1: Summary of Stakeholder Participation
Source: Steer Davies Gleave. Note: ‘Representative organisations’ includes associations representing airports, airlines, freight companies, ground-handlers, workers and manufacturers, and the Chair of the European Social Dialogue Committee for Civil Aviation.
Issues addressed
2.4 As anticipated, the main issues encountered in undertaking this exercise were:
ensuring the involvement of stakeholders; and
obtaining detailed and accurate employment data from stakeholders.
2.5 A common reason provided throughout the stakeholder consultation was that employment
data at the detailed level requested is difficult to provide. As a result, many of those received
did not provide a fully complete quantitative questionnaire. Further detail on the quality of
the quantitative data received is outlined in Table A.4 of Appendix A.
Stakeholders not participating
2.6 A number of stakeholders declined to participate or provided information other than the
completed questionnaires. The most cited reasons for this were time constraints, lack of
resources and unavailability of data.
Quantitative analysis: Data collection
2.7 The information that the study draws on is grouped into four categories:
1. Primary data sources: extractions from Eurostat databases;
2. Supplementary data sources: data collected from other sources and desktop research;
3. Survey data: data provided by stakeholders in response to the quantitative surveys; and
4. Other information: publications, annual reports, other publicly available information, as
well as any internal reports and material provided by stakeholders.
60%
67% 63%
33% 100% 50%
25%
7%19%
33%50% 100%
7%
13%
0 17%
15%
20%6%
33%50%
50%
0
5
10
15
20
25
30
35
40
45
Nu
mb
er
of
stak
eh
old
ers
Submission received Did not participate Declined participation No response
October 2015 | 28
Primary data sources
2.8 Employment, GVA and labour cost data was extracted from the Eurostat databases (see
Table A.3 of Appendix A), based on the widely recognised NACE5 Rev.2 (here “NACE” unless
otherwise specified) classification of economic activities. Eurostat air transport data on air
passengers and freight was also collected.
2.9 NACE data is classified at four levels of increasing detail:
Letter level or Level 1 (L1) – the broadest level e.g. H: Transportation and Storage
Two-digit level or Level 2 (L2) – e.g. 51: Air Transport
Three-digit level or Level 3 (L3) – e.g. 51.2: Freight air transport and space
transport
Four-digit level or Level 4 (L4) – e.g. 51.21: Freight air transport
2.10 Eurostat data was downloaded from the organisation’s website, with the exception of the
Labour Force Survey (LFS) data for which detailed extractions were prepared for this study
and were provided to via the Commission.
2.11 The extractions for NACE (51) air transport and NACE (52.2) support activities for
transportation included data on age, gender, employment contracts (permanent/temporary),
working arrangements (full-time/part-time, typical/atypical) and skill level of persons
employed.
2.12 Further information on all data sources used can be found in Appendix A.
Issues addressed
2.13 Issues addressed in collecting data for the study involved:
Achieving a balance between the level of detail required in the analysis and the
combined size of the data extractions for the twenty-eight Member States, particularly
with respect to computing infrastructure processing-power requirements.
The availability and completeness of data for the required NACE classifications of
economic activity across the databases and how these might be drawn together
effectively.
Where data for NACE classifications was not available at the required level of detail,
identifying alternative inputs for estimating in-scope employment for those activities,
while striking a balance between the additional research needed and the materiality of
employment for the given economic activity in relation to overall in-scope employment.
2.14 Further, whilst important data was gathered during the course of the desktop review, a
significant proportion of the market information needed in order to gain sufficient insight
into the industry and the effects of changes in the air transport market on employment and
working conditions can only be provided by stakeholders.
2.15 The stakeholders have provided some market information, but the depth and quality of this
information is variable both across and within stakeholder groups. Employment data has
therefore been supplemented with data available publically, such as airline and airport
5 Nomenclature statistique des activités économiques dans la Communauté européenne (NACE): a
European industry standard system for the statistical classification of economic activities.

October 2015 | 29
annual reports. In particular, airport annual reports were reviewed for airports that it was
not anticipated that data would be received from. Airports noted as “no data available” are
airports from which a submission was expected, but which was not received.
2.16 The sample of airports selected to form the airports panel cover approximately 73% of EU
passenger traffic in 2013. Airports from which data was collected cover approximately 53% of
EU passenger traffic in 2013 (or 72% of the planned sample). The data collected also covers a
mix of different types of airports, with large hub airports, smaller airports and cargo-focussed
airports included.
2.17 Confidentiality conditions attached to the data collected have been adhered to. Confidential
information is omitted from tables and charts.
October 2015 | 30
Data classification and reporting of direct effects
2.18 This section outlines the approach to the classification and reporting of the employment and
GVA data that has been collected/estimated for the study.
Approach to estimating air transport cluster's direct employment and GVA
2.19 Direct employment and GVA data presented in this report have been estimated using a range
of sources, as outlined above and in Appendix A. Explanatory notes on the sources used for
each sector have been included, along with comments on the strengths and weaknesses of
the information provided.
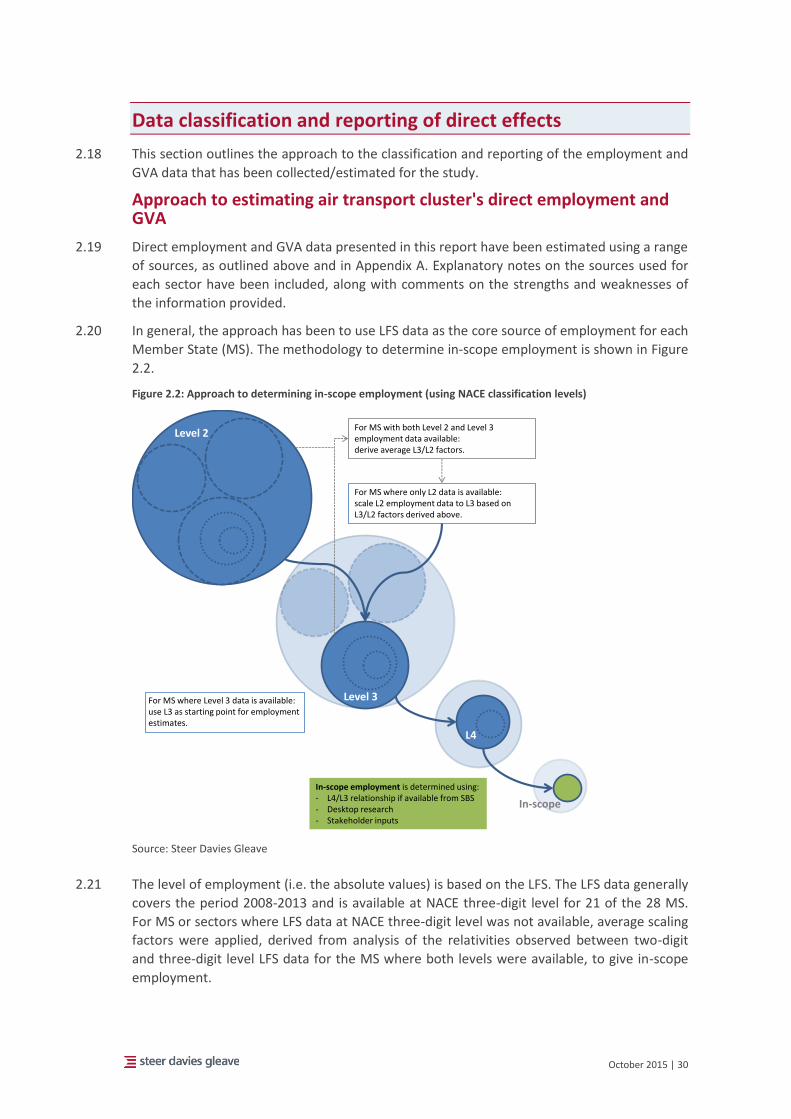
2.20 In general, the approach has been to use LFS data as the core source of employment for each
Member State (MS). The methodology to determine in-scope employment is shown in Figure
2.2.
Figure 2.2: Approach to determining in-scope employment (using NACE classification levels)
Source: Steer Davies Gleave
2.21 The level of employment (i.e. the absolute values) is based on the LFS. The LFS data generally
covers the period 2008-2013 and is available at NACE three-digit level for 21 of the 28 MS.
For MS or sectors where LFS data at NACE three-digit level was not available, average scaling
factors were applied, derived from analysis of the relativities observed between two-digit
and three-digit level LFS data for the MS where both levels were available, to give in-scope
employment.
Level 2
Level 3
L4
In-scope
For MS where only L2 data is available:scale L2 employment data to L3 based on L3/L2 factors derived above.
For MS with both Level 2 and Level 3 employment data available:derive average L3/L2 factors.
For MS where Level 3 data is available: use L3 as starting point for employment estimates.
In-scope employment is determined using:- L4/L3 relationship if available from SBS- Desktop research- Stakeholder inputs
October 2015 | 31
2.22 The longer term trends in employment, generally covering the period 2000-2007, are derived
from the trends seen in data from National Accounts (NA) at NACE two-digit level and are
applied to the LFS employment above to build a coherent time series covering 2000-2013.
Where NA data was not available, or where the two-digit level parent sector was considered
too broad/diverse relative to the in-scope employment, the trends used were informed by
supplementary information as detailed in Chapter 4.
2.23 Estimates of employment for key sectors best presented at the NACE four-digit level (e.g.
airport operation and handling) were developed by drawing on Structural Business Statistics
(SBS) data. The relative share observed between employment at the three-digit and four-
digit level within SBS were applied to the LFS three-digit data. This was done in order to
maintain an internally consistent/coherent LFS-based dataset.
2.24 GVA data was sourced at the NACE two-digit level from NA. In general, the in-scope
estimates were derived by scaling the two-digit level GVA using the relationship between
employment at the two-digit level and the in-scope employment from the analysis above.
Complete GVA data for 2012 and 2013 is not available in NA. For these years, the GVA
estimates that are presented in Chapter 4 have been estimated by extrapolating from 2011
based on the estimates for employment in 2012 and in 2013.
Employment data classification and reporting
2.25 The quantitative part of the study aims to measure the direct and indirect effects on the
economy and employment of air transport and related industries, including aircraft
manufacturing, air-related tourism (with respect to travel agencies and tour operators), flying
schools, local land transport facilities and catering and hotel activities within airports.
2.26 As set out in the Terms of Reference, all economic activities related to air transport and those
established within airports are included in the calculation of direct employment and value
added. The methodology has been standardised as far as possible, to enable the analysis to
be easily replicable in future updates, and relies on the widely recognised NACE Rev.2
classification of economic activities.6 The study draws on employment and value added data
from relevant Eurostat databases, detailed in the Data collection section above, as well as
survey data from a panel of airports and other stakeholders.
2.27 Figure 2.3 shows the two overlapping clusters of activity that are addressed by this study, in
order to capture the full extent of air transport and related industries in the EU, including the
various components of European airports, and to measure their socioeconomic impact.
6 Nomenclature statistique des activités économiques dans la Communauté européenne (NACE): a
European industry standard system for the statistical classification of economic activities. http://ec.europa.eu/eurostat/documents/3859598/5902521/KS-RA-07-015-EN.PDF
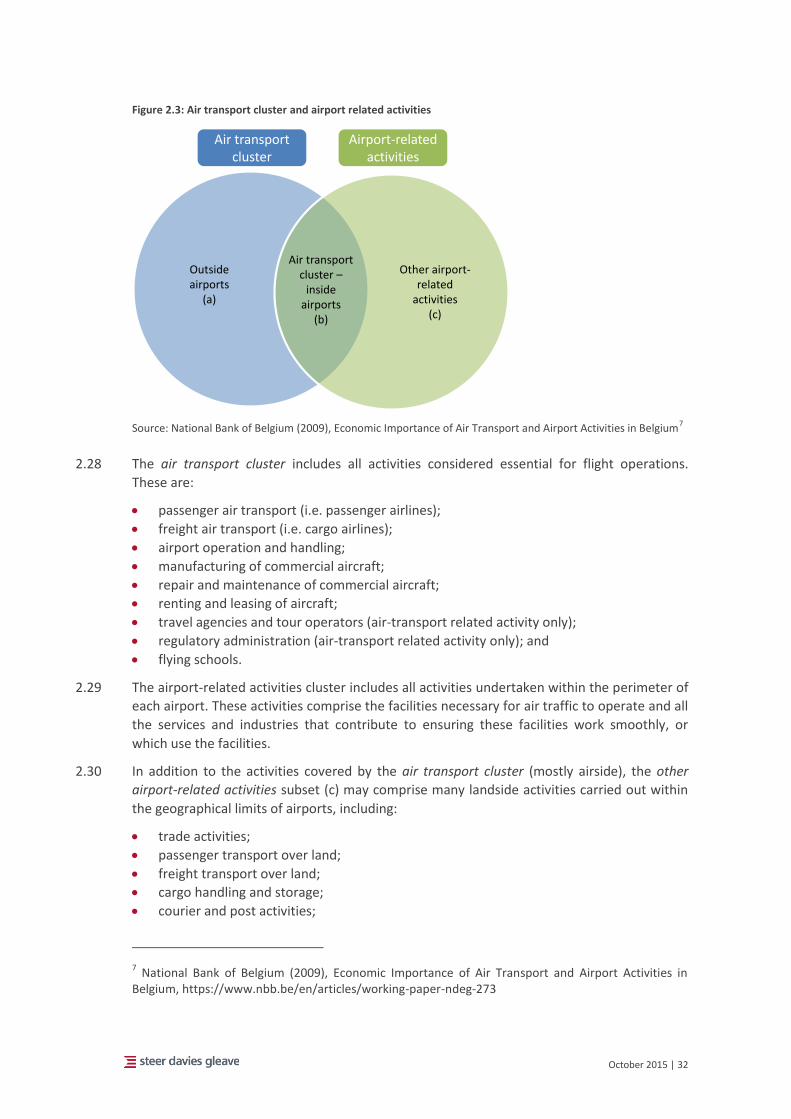
October 2015 | 32
Figure 2.3: Air transport cluster and airport related activities
Source: National Bank of Belgium (2009), Economic Importance of Air Transport and Airport Activities in Belgium7
2.28 The air transport cluster includes all activities considered essential for flight operations.
These are:
passenger air transport (i.e. passenger airlines);
freight air transport (i.e. cargo airlines);
airport operation and handling;
manufacturing of commercial aircraft;
repair and maintenance of commercial aircraft;
renting and leasing of aircraft;
travel agencies and tour operators (air-transport related activity only);
regulatory administration (air-transport related activity only); and
flying schools.
2.29 The airport-related activities cluster includes all activities undertaken within the perimeter of
each airport. These activities comprise the facilities necessary for air traffic to operate and all
the services and industries that contribute to ensuring these facilities work smoothly, or
which use the facilities.
2.30 In addition to the activities covered by the air transport cluster (mostly airside), the other
airport-related activities subset (c) may comprise many landside activities carried out within
the geographical limits of airports, including:
trade activities;
passenger transport over land;
freight transport over land;
cargo handling and storage;
courier and post activities;
7 National Bank of Belgium (2009), Economic Importance of Air Transport and Airport Activities in
Belgium, https://www.nbb.be/en/articles/working-paper-ndeg-273
Air transport cluster
Airport-related activities
Outside airports
(a)
Air transport cluster –
inside airports
(b)
Other airport-related
activities(c)
October 2015 | 33
accommodation, food and beverage services;
security and cleaning services for buildings;
airport-related public services; and
other airport-related industries and services.
2.31 An example of activities in subset (b) is airport operation and handling, which comprises
most ground-handling activities as defined in the Annex to Council Directive 96/67/EC of 15
October 1996 on access to the ground-handling market at Community airports.
Labour status definitions
2.32 To ensure comparability across different data sources, definitions for labour status have been
consistently applied across the study.
2.33 It was agreed with DG MOVE and DG EMPL that Eurostat definitions should form the basis of
the study definitions as the main statistical pillar for data for the study is Eurostat.
2.34 It is noted that the definitions/categories below are not exhaustive. The LFS includes other
definitions that are not of significant relevance to the study. In addition, definitions can
overlap. For example, an employee could be both part time and a temporary agency worker.
2.35 For the purposes of this analysis, the following definitions apply:
Persons employed: the sum of salary-earning employees and self-employed workers.
Employees: persons who perform work for and under the control of a legal or natural
person for remuneration.
Self-employed: A self-employed person is the sole or joint owner of the unincorporated
enterprise in which he/she works, unless they are also in paid employment which is their
main activity (in that case, they are considered to be employees). Self-employed people
also include: unpaid family workers; outworkers (who work outside the usual workplace,
such as at home); and workers engaged in production done entirely for their own final
use or own capital formation, either individually or collectively.
Temporary agency worker: an employee who is employed and paid by a temporary-
work agency and assigned to a user company to work there under the supervision and
direction of that company (a triangular relationship).
Full time employee: an employed person whose normal hours of work correspond to
the standard number of hours considered as full-time employment in the national
system.
Part-time employee: an employed person whose normal hours of work are less than
those of comparable full-time employees.
Atypical working hours: an employee working evenings or nights, Saturdays or Sundays,
or shift work. Note that this definition is not the same as that defined by the 2015
Atypical Employment in Aviation study, which defines atypical employment as “every
form of employment other than an open-ended employment contract”.8
Permanent employment contract: employees with an open-ended and continuous
employment contract with their employer.
8 Y. Jorens, D. Gillis, L. Valcke & J. De Coninck, Atypical Forms of Employment in the Aviation Sector,
European Social Dialogue, European Commission, 2015. http://www.europarl.europa.eu/meetdocs/2014_2019/documents/tran/dv/report_atypicalemploymentinaviation_/Report_AtypicalEmploymentInAviation_en.pdf
October 2015 | 34
Fixed-term employment contract: employees having an employment contract whose
end is determined by objective conditions such as reaching a specific date, completing a
specific task, or the occurrence of a specific event.
2.36 Stakeholders were asked a number of scaled questions in the questionnaires. For the
purpose of this study, the following definitions apply.
Slight change: small observable change; and
Significant change: major/large observable change.
Indirect effects methodology
Data selection
2.37 The input-output framework as used by the European System of National and Regional
Accounts (ESA2010) consists of two types of tables: Supply and Use tables (SUT) and
symmetric Input-Output tables (IOT). Tables normally report domestic and imports/exports
values separately.
2.38 IOT are published at the national level by most Member States in the EU. While SUT are
produced annually, symmetric IOT that consolidate both supply and use volumes (by product
and by industry) are only produced every five years. The latest available year for most
Member States is 2010. Industries are classified according to the most recent European
industrial activity classification (NACE Rev.2) and usually reported at the 2-digit (division)
level.
2.39 Eurostat also publishes an aggregate symmetric IOT for the EU, which treats intra-EU trade
flows as domestic inputs and therefore only treats imports/exports as those inputs/outputs
to and from extra-EU countries. The consolidated EU27 IOT also makes use of some
confidential data which is not otherwise available to the general public. The most recent year
for which the EU27 IOT is available is 2011.
2.40 This study is focused upon producing estimates of indirect employment at the EU level.
Therefore it is considered appropriate to make use of the EU279 IOT from 2011. Following
discussion with both Eurostat and the Commission, this approach is considered to be more
appropriate than the next-best alternative which would involve estimating indirect
employment for a sample of 3 Member States and infer EU-wide results from those.
2.41 Using the EU27 IOT avoids the need to make assumptions about aggregating the results from
the analysis of a sample of Member States. In addition, this approach has the advantage of
having being compiled more recently and makes a clearer distinction between intra-EU and
extra-EU trade flows. However it should be noted that the treatment of intra-EU trade flows
as domestic inputs necessarily leads to a higher estimate of indirect impacts than would be
case should all trade flows be treated as non-domestic (as would be the case if individual
Member State IOT were aggregated together).
9 This table necessarily excludes Croatia, which joined the EU in 2013. We will make an ad-hoc
adjustment to include Croatia in the final estimates.
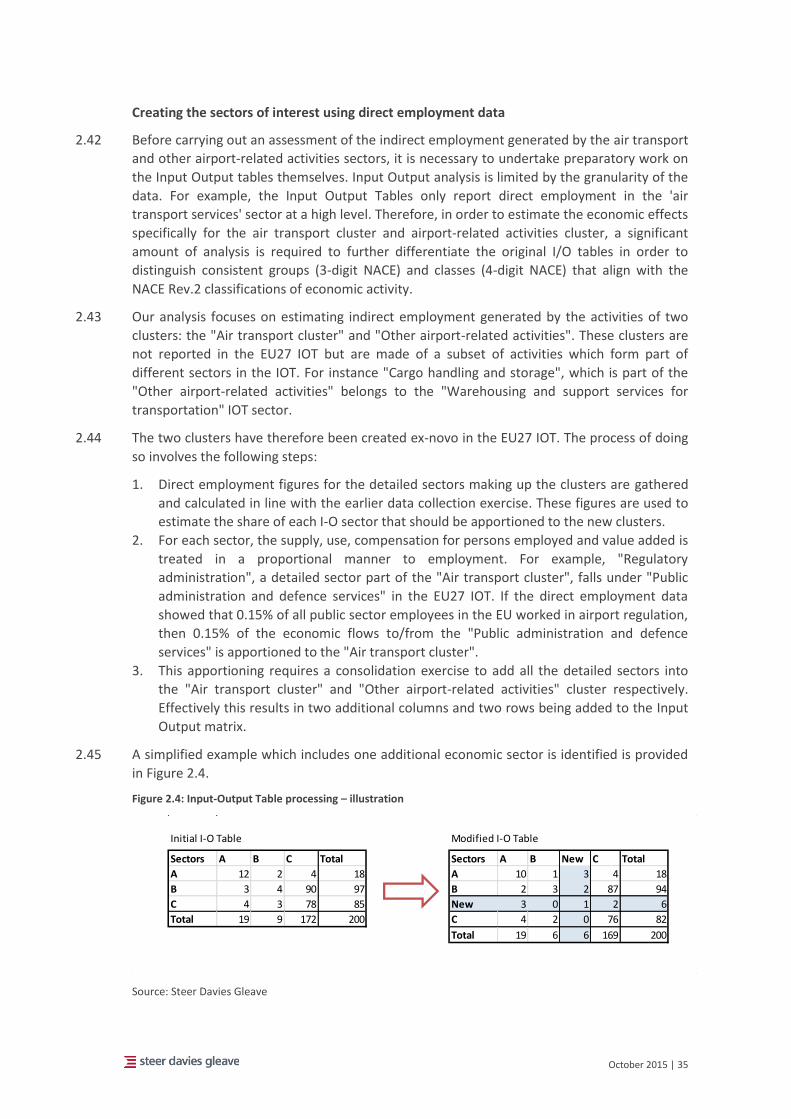
October 2015 | 35
Creating the sectors of interest using direct employment data
2.42 Before carrying out an assessment of the indirect employment generated by the air transport
and other airport-related activities sectors, it is necessary to undertake preparatory work on
the Input Output tables themselves. Input Output analysis is limited by the granularity of the
data. For example, the Input Output Tables only report direct employment in the 'air
transport services' sector at a high level. Therefore, in order to estimate the economic effects
specifically for the air transport cluster and airport-related activities cluster, a significant
amount of analysis is required to further differentiate the original I/O tables in order to
distinguish consistent groups (3-digit NACE) and classes (4-digit NACE) that align with the
NACE Rev.2 classifications of economic activity.
2.43 Our analysis focuses on estimating indirect employment generated by the activities of two
clusters: the "Air transport cluster" and "Other airport-related activities". These clusters are
not reported in the EU27 IOT but are made of a subset of activities which form part of
different sectors in the IOT. For instance "Cargo handling and storage", which is part of the
"Other airport-related activities" belongs to the "Warehousing and support services for
transportation" IOT sector.
2.44 The two clusters have therefore been created ex-novo in the EU27 IOT. The process of doing
so involves the following steps:
1. Direct employment figures for the detailed sectors making up the clusters are gathered
and calculated in line with the earlier data collection exercise. These figures are used to
estimate the share of each I-O sector that should be apportioned to the new clusters.
2. For each sector, the supply, use, compensation for persons employed and value added is
treated in a proportional manner to employment. For example, "Regulatory
administration", a detailed sector part of the "Air transport cluster", falls under "Public
administration and defence services" in the EU27 IOT. If the direct employment data
showed that 0.15% of all public sector employees in the EU worked in airport regulation,
then 0.15% of the economic flows to/from the "Public administration and defence
services" is apportioned to the "Air transport cluster".
3. This apportioning requires a consolidation exercise to add all the detailed sectors into
the "Air transport cluster" and "Other airport-related activities" cluster respectively.
Effectively this results in two additional columns and two rows being added to the Input
Output matrix.
2.45 A simplified example which includes one additional economic sector is identified is provided
in Figure 2.4.
Figure 2.4: Input-Output Table processing – illustration
Source: Steer Davies Gleave
Initial I-O Table Modified I-O Table
Sectors A B C Total Sectors A B New C Total
A 12 2 4 18 A 10 1 3 4 18
B 3 4 90 97 B 2 3 2 87 94
C 4 3 78 85 New 3 0 1 2 6
Total 19 9 172 200 C 4 2 0 76 82
Total 19 6 6 169 200
October 2015 | 36
Calculating the Wider Economic Impacts
2.46 To understand how the aviation industry combines inputs (and therefore how many jobs it
supports through its supply chain) a classic Input Output analysis is undertaken. An Input
Output model gives a snapshot of an economy at any point in time. The model shows the
major spending flows from “final demand” (incorporating consumer spending, government
spending, investment, and exports to the rest of the world); intermediate spending patterns
(the purchases that each sector makes from every other sector i.e. the supply chain); how
much of that spending stays within the economy; and the distribution of income between
employment incomes and other income (mainly profits). In essence an Input Output model is
a table which shows who buys what from whom in the economy.
2.47 Manipulation of the Input Output table allows the estimation of the indirect effects of the
economic activity of a certain industry (e.g. the 'air transport' branch) on output and
employment over the whole supply chain. For example, in order to provide air transport
services an airline needs inputs from other sectors such as energy, consulting, financial
services, food and beverage services and many more. In turn, the energy sector will require a
range of inputs including the extraction of crude petroleum and gas, manufacture of coke
and refined petroleum products and a range of other services.
2.48 The relationship between the air services sector and the range of upstream sectors required
to generate air services can be quantified by applying a Leontief manipulation (often referred
to as the Leontief inverse) to the EU27 Input Output table. In the first stage of our analysis,
the economic effects of interrelations between the air services sector and its direct suppliers
from different sectors is estimated. Next, the direct supply interrelations of the first-stage
supplying sectors e.g. the energy sector is calculated. In theory this process would run
infinitely, to reflect the cyclic nature of the economy, which would result in an infinite
number of calculations. Instead, the "Leontief inverse" provides a mathematical
approximation of the output of the infinite process.
2.49 The output of these manipulations is a matrix in which the values represent the individual
cross-multipliers for each industry, showing the impact on each producing industry (row) of
an increase in 1 unit of output in a consuming industry (column). The total multiplier for each
consuming industry is the sum of the multipliers in the relevant column. In other words, the
total multiplier for each industry represents the strength of its supply chain.
2.50 Finally, the calculation of the Leontief inverse multipliers has been augmented with an
assessment of labour intensities. Labour intensity is defined as the relative proportion of
number of persons employed compared to value added or production output.
Limitations
2.51 Input-Output analysis is well established and recognised as a reliable model of the economy
at any point in time. Each IOT captures the actual flows between economic sectors and these
represent the most accurate available record of economic interactions at the national /
European level. As a consequence, this part of the analysis requires certain assumptions that
are implicit in the Input Output methodology, including:
Factor supplies meet demand: the basic version of I/O analysis assumes that the supply
of factors of production (e.g. labour) does not constrain the production of output, and
hence the supply of output of a sector will increase to match demand. This assumption
may be unrealistic in periods of very high demand, which might cause labour shortage.
However, the economy usually operates at the natural rate of employment, which is
October 2015 | 37
below the full employment rate; hence, it is reasonable that the increases in the output
of sectors, if modest, will not be hindered by a lack of resources.
Relative prices remain constant: the analysis assumes that the relative prices of sector
inputs remain constant.
Factor proportions remain the same. The I/O tables used in the analysis do not take into
account changes in production processes and technologies that might occur in the
economy following the introduction of a new policy, and hence, are static in nature. This
assumption is reasonable in the short run, since production technologies for most
products do not change significantly over a period of a few years.
2.52 Since Input Output tables only report flows between a limited number of economic sectors, it
is necessary to estimate the size of two separate economic sectors as described above. This
activity will necessarily require some assumptions, including:
Employment figures are used as a proxy for apportioning supply and use (measured in
Euros); the analysis assumes equal productivity of labour across the aviation sector;
Each subsector (e.g. "Cargo handling and storage") will be assumed to have the same
relationship with the rest of the economy as the larger sector they belong to (e.g.
"Warehousing and support services for transportation").
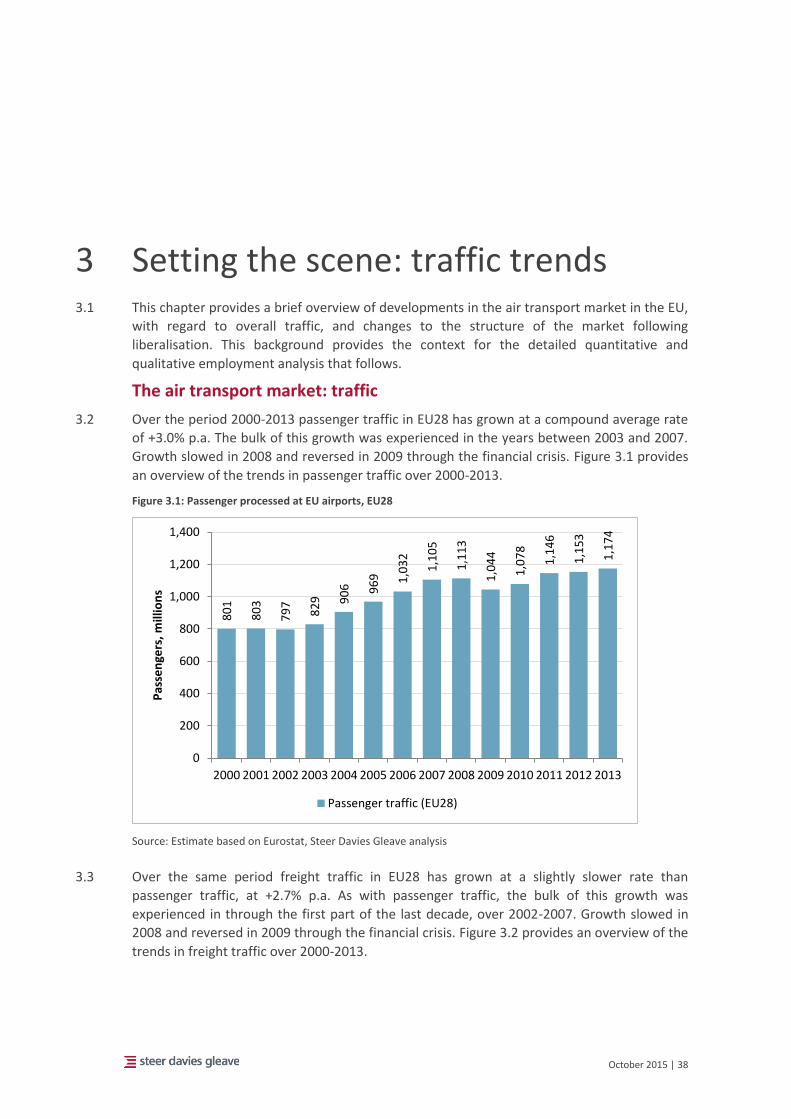
October 2015 | 38
3 Setting the scene: traffic trends 3.1 This chapter provides a brief overview of developments in the air transport market in the EU,
with regard to overall traffic, and changes to the structure of the market following
liberalisation. This background provides the context for the detailed quantitative and
qualitative employment analysis that follows.
The air transport market: traffic
3.2 Over the period 2000-2013 passenger traffic in EU28 has grown at a compound average rate
of +3.0% p.a. The bulk of this growth was experienced in the years between 2003 and 2007.
Growth slowed in 2008 and reversed in 2009 through the financial crisis. Figure 3.1 provides
an overview of the trends in passenger traffic over 2000-2013.
Figure 3.1: Passenger processed at EU airports, EU28
Source: Estimate based on Eurostat, Steer Davies Gleave analysis
3.3 Over the same period freight traffic in EU28 has grown at a slightly slower rate than
passenger traffic, at +2.7% p.a. As with passenger traffic, the bulk of this growth was
experienced in through the first part of the last decade, over 2002-2007. Growth slowed in
2008 and reversed in 2009 through the financial crisis. Figure 3.2 provides an overview of the
trends in freight traffic over 2000-2013.
80
1
80
3
79
7
82
9 90
6 96
9 1,0
32
1,1
05
1,1
13
1,0
44
1,0
78
1,1
46
1,1
53
1,1
74
0
200
400
600
800
1,000
1,200
1,400
2000 2001 2002 2003 2004 2005 2006 2007 2008 2009 2010 2011 2012 2013
Pas
sen
gers
, mill
ion
s
Passenger traffic (EU28)
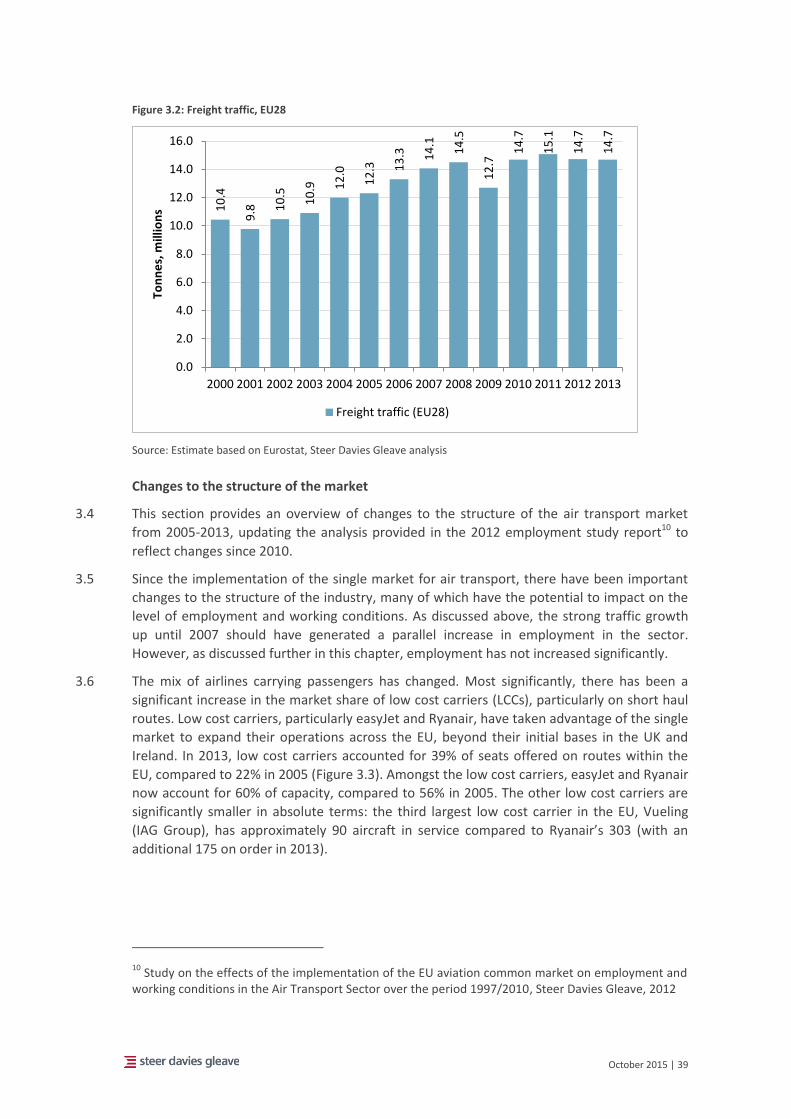
October 2015 | 39
Figure 3.2: Freight traffic, EU28
Source: Estimate based on Eurostat, Steer Davies Gleave analysis
Changes to the structure of the market
3.4 This section provides an overview of changes to the structure of the air transport market
from 2005-2013, updating the analysis provided in the 2012 employment study report10 to
reflect changes since 2010.
3.5 Since the implementation of the single market for air transport, there have been important
changes to the structure of the industry, many of which have the potential to impact on the
level of employment and working conditions. As discussed above, the strong traffic growth
up until 2007 should have generated a parallel increase in employment in the sector.
However, as discussed further in this chapter, employment has not increased significantly.
3.6 The mix of airlines carrying passengers has changed. Most significantly, there has been a
significant increase in the market share of low cost carriers (LCCs), particularly on short haul
routes. Low cost carriers, particularly easyJet and Ryanair, have taken advantage of the single
market to expand their operations across the EU, beyond their initial bases in the UK and
Ireland. In 2013, low cost carriers accounted for 39% of seats offered on routes within the
EU, compared to 22% in 2005 (Figure 3.3). Amongst the low cost carriers, easyJet and Ryanair
now account for 60% of capacity, compared to 56% in 2005. The other low cost carriers are
significantly smaller in absolute terms: the third largest low cost carrier in the EU, Vueling
(IAG Group), has approximately 90 aircraft in service compared to Ryanair’s 303 (with an
additional 175 on order in 2013).
10 Study on the effects of the implementation of the EU aviation common market on employment and
working conditions in the Air Transport Sector over the period 1997/2010, Steer Davies Gleave, 2012
10
.4
9.8 1
0.5
10
.9 12
.0
12
.3 13
.3 14
.1
14
.5
12
.7
14
.7
15
.1
14
.7
14
.7
0.0
2.0
4.0
6.0
8.0
10.0
12.0
14.0
16.0
2000 2001 2002 2003 2004 2005 2006 2007 2008 2009 2010 2011 2012 2013
Ton
ne
s, m
illio
ns
Freight traffic (EU28)
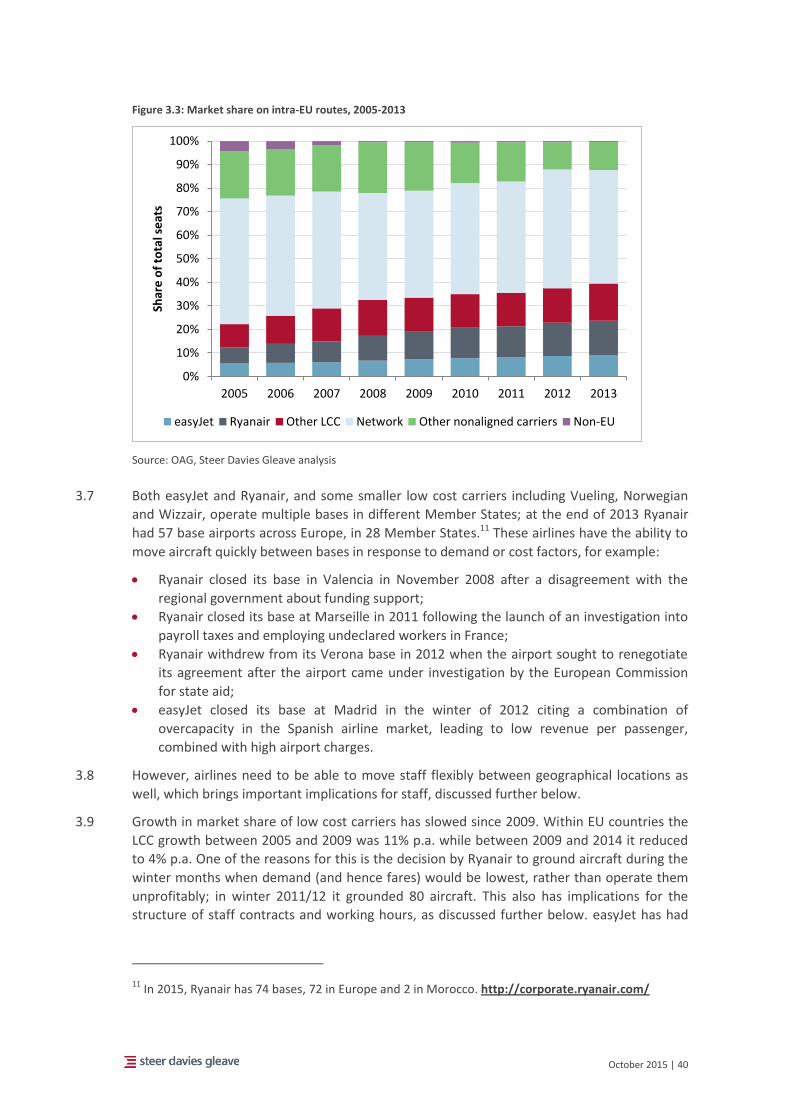
October 2015 | 40
Figure 3.3: Market share on intra-EU routes, 2005-2013
Source: OAG, Steer Davies Gleave analysis
3.7 Both easyJet and Ryanair, and some smaller low cost carriers including Vueling, Norwegian
and Wizzair, operate multiple bases in different Member States; at the end of 2013 Ryanair
had 57 base airports across Europe, in 28 Member States.11 These airlines have the ability to
move aircraft quickly between bases in response to demand or cost factors, for example:
Ryanair closed its base in Valencia in November 2008 after a disagreement with the
regional government about funding support;
Ryanair closed its base at Marseille in 2011 following the launch of an investigation into
payroll taxes and employing undeclared workers in France;
Ryanair withdrew from its Verona base in 2012 when the airport sought to renegotiate
its agreement after the airport came under investigation by the European Commission
for state aid;
easyJet closed its base at Madrid in the winter of 2012 citing a combination of
overcapacity in the Spanish airline market, leading to low revenue per passenger,
combined with high airport charges.
3.8 However, airlines need to be able to move staff flexibly between geographical locations as
well, which brings important implications for staff, discussed further below.
3.9 Growth in market share of low cost carriers has slowed since 2009. Within EU countries the
LCC growth between 2005 and 2009 was 11% p.a. while between 2009 and 2014 it reduced
to 4% p.a. One of the reasons for this is the decision by Ryanair to ground aircraft during the
winter months when demand (and hence fares) would be lowest, rather than operate them
unprofitably; in winter 2011/12 it grounded 80 aircraft. This also has implications for the
structure of staff contracts and working hours, as discussed further below. easyJet has had
11 In 2015, Ryanair has 74 bases, 72 in Europe and 2 in Morocco. http://corporate.ryanair.com/
0%
10%
20%
30%
40%
50%
60%
70%
80%
90%
100%
2005 2006 2007 2008 2009 2010 2011 2012 2013
Shar
e o
f to
tal s
eat
s
easyJet Ryanair Other LCC Network Other nonaligned carriers Non-EU
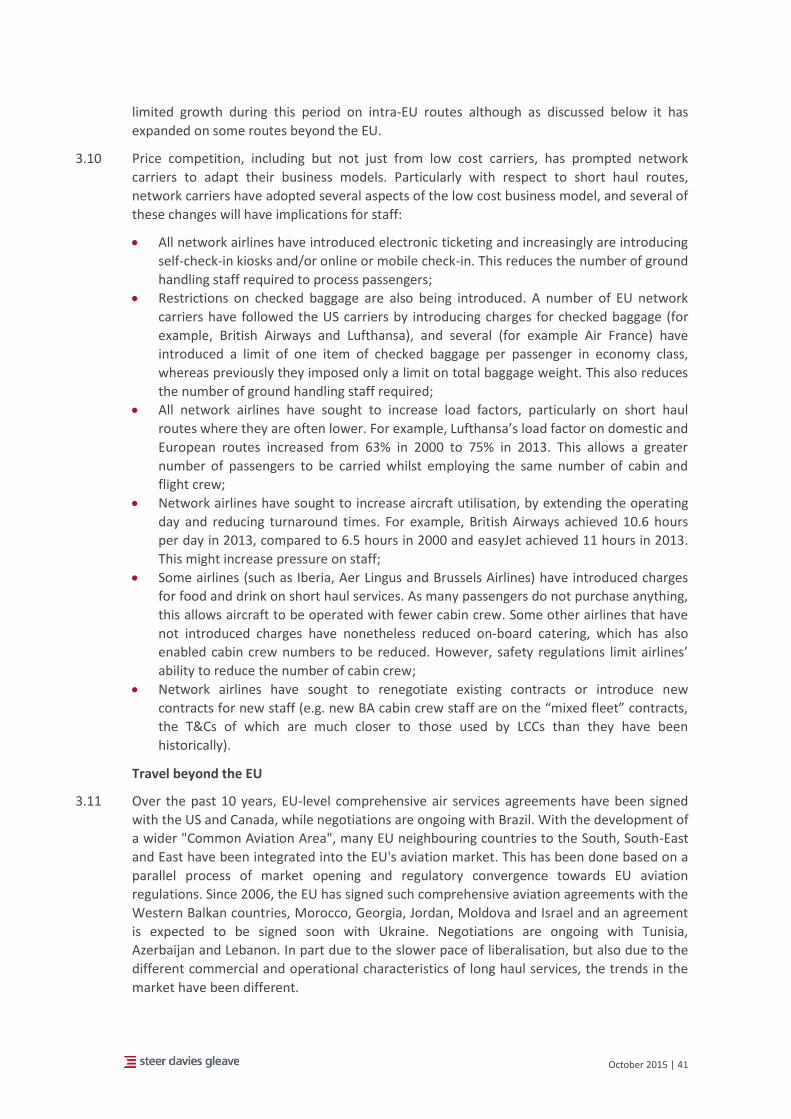
October 2015 | 41
limited growth during this period on intra-EU routes although as discussed below it has
expanded on some routes beyond the EU.
3.10 Price competition, including but not just from low cost carriers, has prompted network
carriers to adapt their business models. Particularly with respect to short haul routes,
network carriers have adopted several aspects of the low cost business model, and several of
these changes will have implications for staff:
All network airlines have introduced electronic ticketing and increasingly are introducing
self-check-in kiosks and/or online or mobile check-in. This reduces the number of ground
handling staff required to process passengers;
Restrictions on checked baggage are also being introduced. A number of EU network
carriers have followed the US carriers by introducing charges for checked baggage (for
example, British Airways and Lufthansa), and several (for example Air France) have
introduced a limit of one item of checked baggage per passenger in economy class,
whereas previously they imposed only a limit on total baggage weight. This also reduces
the number of ground handling staff required;
All network airlines have sought to increase load factors, particularly on short haul
routes where they are often lower. For example, Lufthansa’s load factor on domestic and
European routes increased from 63% in 2000 to 75% in 2013. This allows a greater
number of passengers to be carried whilst employing the same number of cabin and
flight crew;
Network airlines have sought to increase aircraft utilisation, by extending the operating
day and reducing turnaround times. For example, British Airways achieved 10.6 hours
per day in 2013, compared to 6.5 hours in 2000 and easyJet achieved 11 hours in 2013.
This might increase pressure on staff;
Some airlines (such as Iberia, Aer Lingus and Brussels Airlines) have introduced charges
for food and drink on short haul services. As many passengers do not purchase anything,
this allows aircraft to be operated with fewer cabin crew. Some other airlines that have
not introduced charges have nonetheless reduced on-board catering, which has also
enabled cabin crew numbers to be reduced. However, safety regulations limit airlines’
ability to reduce the number of cabin crew;
Network airlines have sought to renegotiate existing contracts or introduce new
contracts for new staff (e.g. new BA cabin crew staff are on the “mixed fleet” contracts,
the T&Cs of which are much closer to those used by LCCs than they have been
historically).
Travel beyond the EU
3.11 Over the past 10 years, EU-level comprehensive air services agreements have been signed
with the US and Canada, while negotiations are ongoing with Brazil. With the development of
a wider "Common Aviation Area", many EU neighbouring countries to the South, South-East
and East have been integrated into the EU's aviation market. This has been done based on a
parallel process of market opening and regulatory convergence towards EU aviation
regulations. Since 2006, the EU has signed such comprehensive aviation agreements with the
Western Balkan countries, Morocco, Georgia, Jordan, Moldova and Israel and an agreement
is expected to be signed soon with Ukraine. Negotiations are ongoing with Tunisia,
Azerbaijan and Lebanon. In part due to the slower pace of liberalisation, but also due to the
different commercial and operational characteristics of long haul services, the trends in the
market have been different.
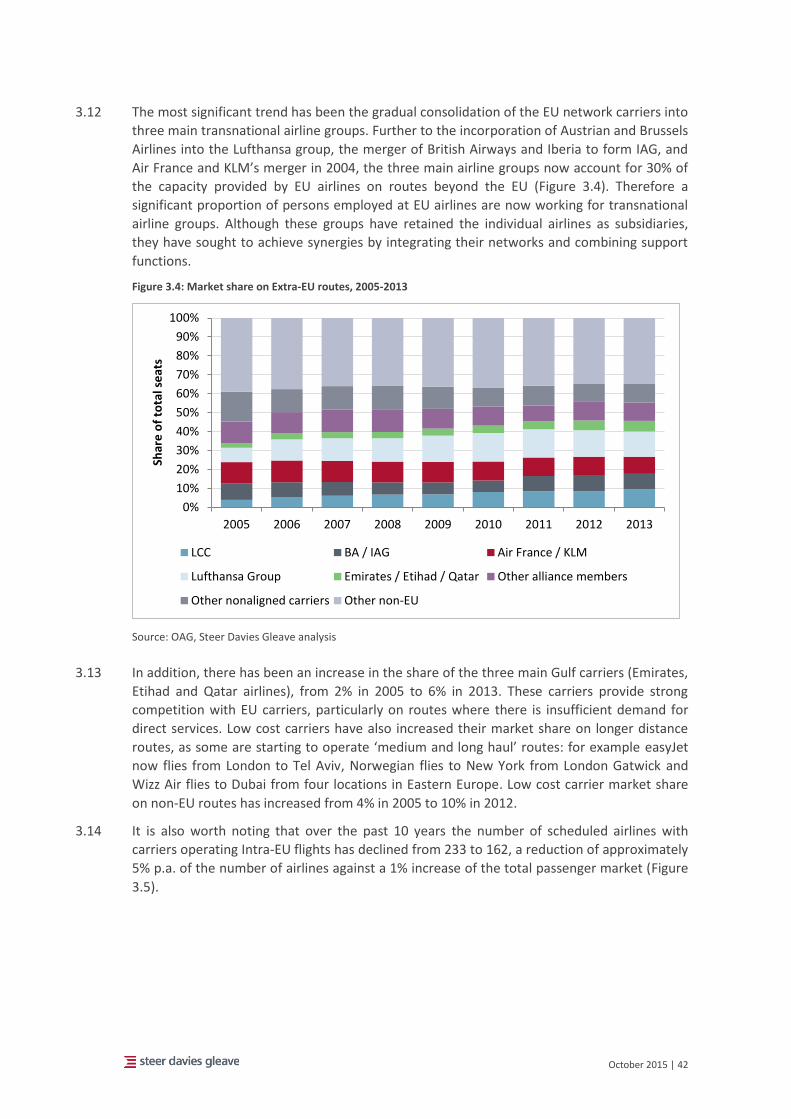
October 2015 | 42
3.12 The most significant trend has been the gradual consolidation of the EU network carriers into
three main transnational airline groups. Further to the incorporation of Austrian and Brussels
Airlines into the Lufthansa group, the merger of British Airways and Iberia to form IAG, and
Air France and KLM’s merger in 2004, the three main airline groups now account for 30% of
the capacity provided by EU airlines on routes beyond the EU (Figure 3.4). Therefore a
significant proportion of persons employed at EU airlines are now working for transnational
airline groups. Although these groups have retained the individual airlines as subsidiaries,
they have sought to achieve synergies by integrating their networks and combining support
functions.
Figure 3.4: Market share on Extra-EU routes, 2005-2013
Source: OAG, Steer Davies Gleave analysis
3.13 In addition, there has been an increase in the share of the three main Gulf carriers (Emirates,
Etihad and Qatar airlines), from 2% in 2005 to 6% in 2013. These carriers provide strong
competition with EU carriers, particularly on routes where there is insufficient demand for
direct services. Low cost carriers have also increased their market share on longer distance
routes, as some are starting to operate ‘medium and long haul’ routes: for example easyJet
now flies from London to Tel Aviv, Norwegian flies to New York from London Gatwick and
Wizz Air flies to Dubai from four locations in Eastern Europe. Low cost carrier market share
on non-EU routes has increased from 4% in 2005 to 10% in 2012.
3.14 It is also worth noting that over the past 10 years the number of scheduled airlines with
carriers operating Intra-EU flights has declined from 233 to 162, a reduction of approximately
5% p.a. of the number of airlines against a 1% increase of the total passenger market (Figure
3.5).
0%
10%
20%
30%
40%
50%
60%
70%
80%
90%
100%
2005 2006 2007 2008 2009 2010 2011 2012 2013
Shar
e o
f to
tal s
eat
s
LCC BA / IAG Air France / KLM
Lufthansa Group Emirates / Etihad / Qatar Other alliance members
Other nonaligned carriers Other non-EU
October 2015 | 43
Figure 3.5: Numbers of scheduled airlines 2005-2013
Source: OAG, Steer Davies Gleave analysis
3.15 These market changes have all led to increased competitive pressure on EU airlines to
minimise operational costs, including staff costs. Where air carriers have a choice of supplier
(for example with respect to ground handling), this has led to an equivalent pressure on their
suppliers to reduce costs. However, two of the key suppliers to air carriers do not operate in
competitive markets and there has not been the same degree of change in these markets:
Air Navigation Service Providers (ANSPs): Air navigation services are traditionally
provided by a single State-owned organisation. Whilst a number of these organisations
have been privatised (e.g. NATS in the UK), there is limited competition within the
market. There can be competition for the market, rather than in it, but in practice this
only exists for terminal services and at a small (yet increasing) number of airports.
Reflecting their status as natural monopolies, ANSPs are usually State owned and/or
subject to economic regulation (the Single European Sky Performance Scheme);
Airports: Major hub airports also tend to operate in an environment with limited or no
competition for services, and as a result are also often subject to economic regulation.
However, there can be strong competition between secondary and regional airports to
win business from airlines, particularly low cost carriers.
0
50
100
150
200
250
300
350
2005 2006 2007 2008 2009 2010 2011 2012 2013
No
. of
airl
ine
s
Intra EU Extra EU
October 2015 | 44
4 Direct employment and GVA in the air transport cluster and at airports Introduction
4.1 This section presents an estimate of direct employment and GVA in air transport and airports
in the EU.
4.2 Employment data is presented by category. Each section provides an overview of overall
trends with use of graphics where appropriate. Tables with detailed annual data are provided
in Appendix B, and referenced throughout this chapter where relevant.
4.3 Data for employment and GVA in the air transport cluster and airport-related activities
cluster is presented. This chapter includes the following sections:
Employment and GVA in:
The air transport cluster (Air transport (passenger and freight) and Air transport
supporting activities); and
The ‘airport-related activities’ cluster.
Direct employment in air transport and airports
4.4 Figure 4.1 and Figure 4.2 below provide a summary overview of direct employment estimates
in air transport and airports in 2013 and 2008 respectively. They illustrate the activities
included in each cluster and sub-cluster, as well as the extent to which the two clusters
overlap.
4.5 Employment in the air transport cluster (i.e. including sub-clusters (a) and (b) in Figure 2.3) in
2013 was estimated to be 1.4 million, comprising 0.4 million persons employed in air
transport and 1.0 million in supporting activities. Employment in this cluster has reduced by a
compound average rate of -0.6% p.a. over 2000-2013, driven by a -1.2% p.a. reduction in air
transport employment and a more modest -0.2% p.a. reduction in employment in supporting
activities. Decreases in employment continue to the end of the period shown, with
employment in this cluster reducing at an average rate of -1.3% compounded annually over
2008-2013, including a decline of -5.8% observed between 2012 and 2013. Overall,
employment in the cluster has gone down by approximately 100,000 over the period. Direct
October 2015 | 45
employment estimates for other airport-related activities (sub-cluster (c)) for EU28 in 2013
amount to 501,000 persons employed.12
4.6 The sections that follow below detail the employment estimates for each of the activities in
scope, as well as the approach used in developing these.
12 These totals differ from those developed in the 2012 study, due to the different methodology
applied and significantly broader scope. See paragraph A.52 in Appendix A.
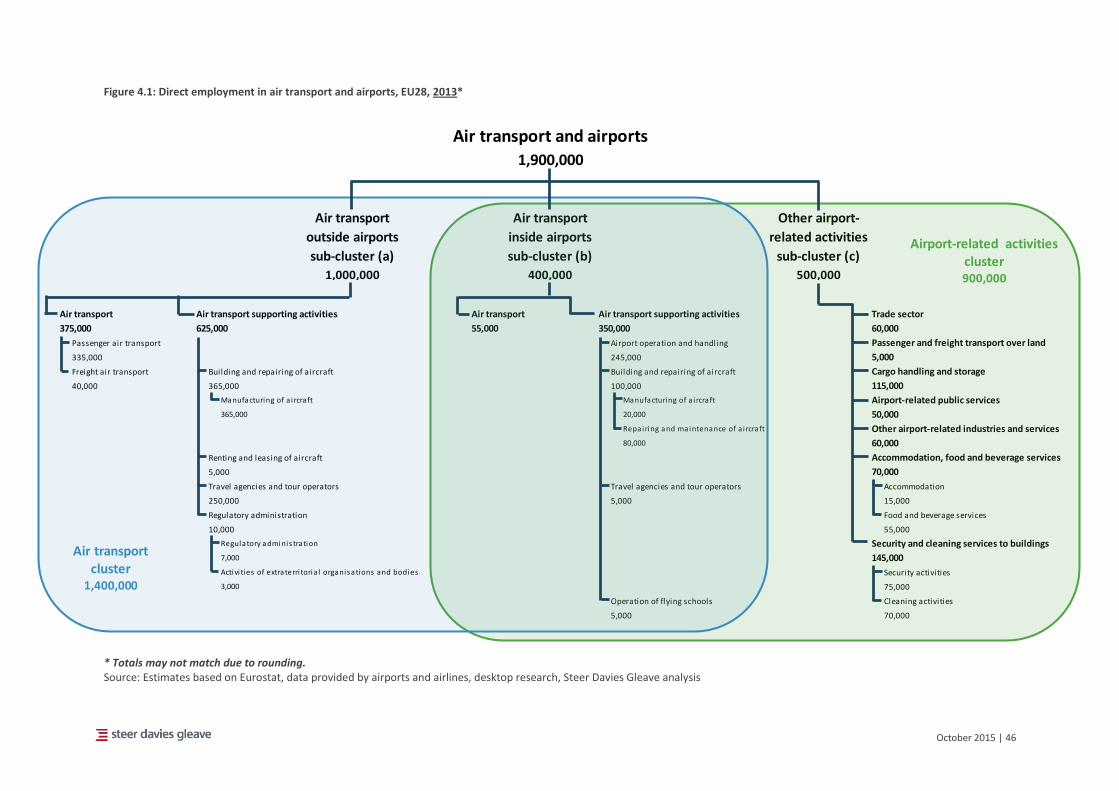
October 2015 | 46
Figure 4.1: Direct employment in air transport and airports, EU28, 2013*
* Totals may not match due to rounding. Source: Estimates based on Eurostat, data provided by airports and airlines, desktop research, Steer Davies Gleave analysis
Air transport and airports
1,900,000
Air transport
outside airports
sub-cluster (a)
Air transport
inside airports
sub-cluster (b)
Other airport-
related activities
sub-cluster (c)
1,000,000 400,000 500,000
Air transport Air transport supporting activities Air transport Air transport supporting activities Trade sector
375,000 625,000 55,000 350,000 60,000
Passenger air transport Airport operation and handling Passenger and freight transport over land
335,000 245,000 5,000
Freight air transport Building and repairing of aircraft Building and repairing of aircraft Cargo handling and storage
40,000 365,000 100,000 115,000
Manufacturing of a i rcraft Manufacturing of a i rcraft Airport-related public services
365,000 20,000 50,000
Repairing and maintenance of a i rcraft Other airport-related industries and services
80,000 60,000
Renting and leasing of aircraft Accommodation, food and beverage services
5,000 70,000
Travel agencies and tour operators Travel agencies and tour operators Accommodation
250,000 5,000 15,000
Regulatory administration Food and beverage services
10,000 55,000
Regulatory adminis tration Security and cleaning services to buildings
7,000 145,000
Activi ties of extraterri toria l organisations and bodies Security activities
3,000 75,000
Operation of flying schools Cleaning activities
5,000 70,000
Air transportcluster
1,400,000
Airport-related activities cluster900,000
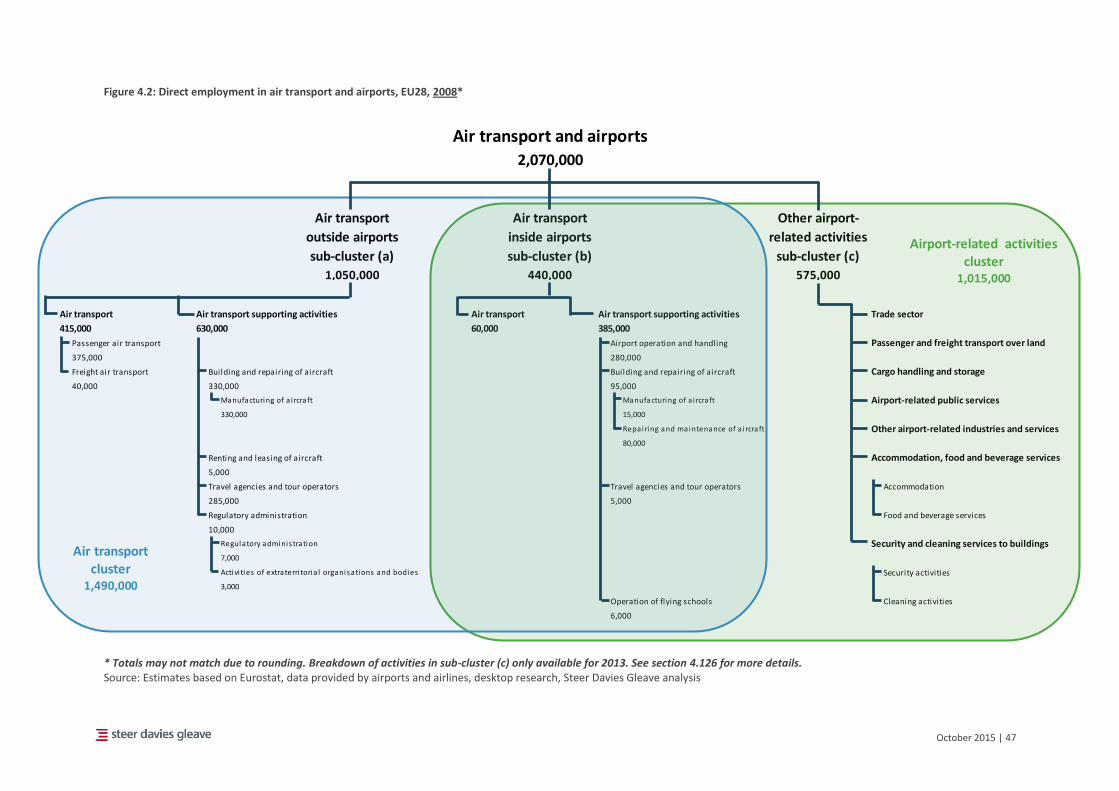
October 2015 | 47
Figure 4.2: Direct employment in air transport and airports, EU28, 2008*
* Totals may not match due to rounding. Breakdown of activities in sub-cluster (c) only available for 2013. See section 4.126 for more details. Source: Estimates based on Eurostat, data provided by airports and airlines, desktop research, Steer Davies Gleave analysis
Air transport and airports
2,070,000
Air transport
outside airports
sub-cluster (a)
Air transport
inside airports
sub-cluster (b)
Other airport-
related activities
sub-cluster (c)
1,050,000 440,000 575,000
Air transport Air transport supporting activities Air transport Air transport supporting activities Trade sector
415,000 630,000 60,000 385,000
Passenger air transport Airport operation and handling Passenger and freight transport over land
375,000 280,000
Freight air transport Building and repairing of aircraft Building and repairing of aircraft Cargo handling and storage
40,000 330,000 95,000
Manufacturing of a i rcraft Manufacturing of a i rcraft Airport-related public services
330,000 15,000
Repairing and maintenance of a i rcraft Other airport-related industries and services
80,000
Renting and leasing of aircraft Accommodation, food and beverage services
5,000
Travel agencies and tour operators Travel agencies and tour operators Accommodation
285,000 5,000
Regulatory administration Food and beverage services
10,000
Regulatory adminis tration Security and cleaning services to buildings
7,000
Activi ties of extraterri toria l organisations and bodies Security activities
3,000
Operation of flying schools Cleaning activities
6,000
Air transportcluster
1,490,000
Airport-related activities cluster
1,015,000
October 2015 | 48
Air transport cluster: direct employment and GVA
Direct employment air transport cluster
4.7 As described in the Chapter 2, direct employment in the air transport cluster includes all
activities considered essential for flight operations. These are:
Air transport:
passenger air transport (i.e. passenger airlines) – this class includes:
- transport of passengers by air over regular routes and on regular schedules
- charter flights for passengers
- scenic and sightseeing flights
- renting of air transport equipment with operator for the purpose of passenger
transportation
- general aviation activities, such as transport of passengers by aero clubs for
instruction or pleasure;
freight air transport (i.e. cargo airlines) – this class includes:
- transport freight by air over regular routes and on regular schedules
- non-scheduled transport of freight by air
- renting of air transport equipment with operator for the purpose of freight
transportation;
Air transport supporting activities:
airport operation and handling – this class includes:
- activities related to air transport of passengers, animals or freight
- operation of terminal facilities such as airway terminals etc.
- airport and air-traffic-control activities
ground service activities on airfields etc.
- firefighting and fire-prevention services at airports;
building and repairing of aircraft – this class includes:
- manufacturing of commercial aircraft:
manufacture of airplanes for the transport of goods or passengers
manufacture of helicopters
manufacture of parts and accessories of the aircraft of this class
major assemblies such as fuselages, wings, doors, control surfaces, landing
gear, fuel tanks, nacelles etc.
airscrews, helicopter rotors and propelled rotor blades
motors and engines of a kind typically found on aircraft
parts of turbojets and turboprops for aircraft
manufacture of ground flying trainers
overhaul and conversion of aircraft;
- repair and maintenance of commercial aircraft :
repair and maintenance of aircraft (except factory conversion, factory
overhaul, factory rebuilding)
repair and maintenance of aircraft engines;
renting and leasing of aircraft – this class includes:
- renting and operational leasing of air transport equipment without operator;
travel agencies and tour operators (air-transport related activity only) – this group
includes the activities of agencies, primarily engaged in selling travel, tour,
transportation and accommodation services to the general public and commercial
Air transport cluster
Airport-related activities
Outside airports
(a)
Air transport cluster –
inside airports
(b)
Other airport-related
activities(c)
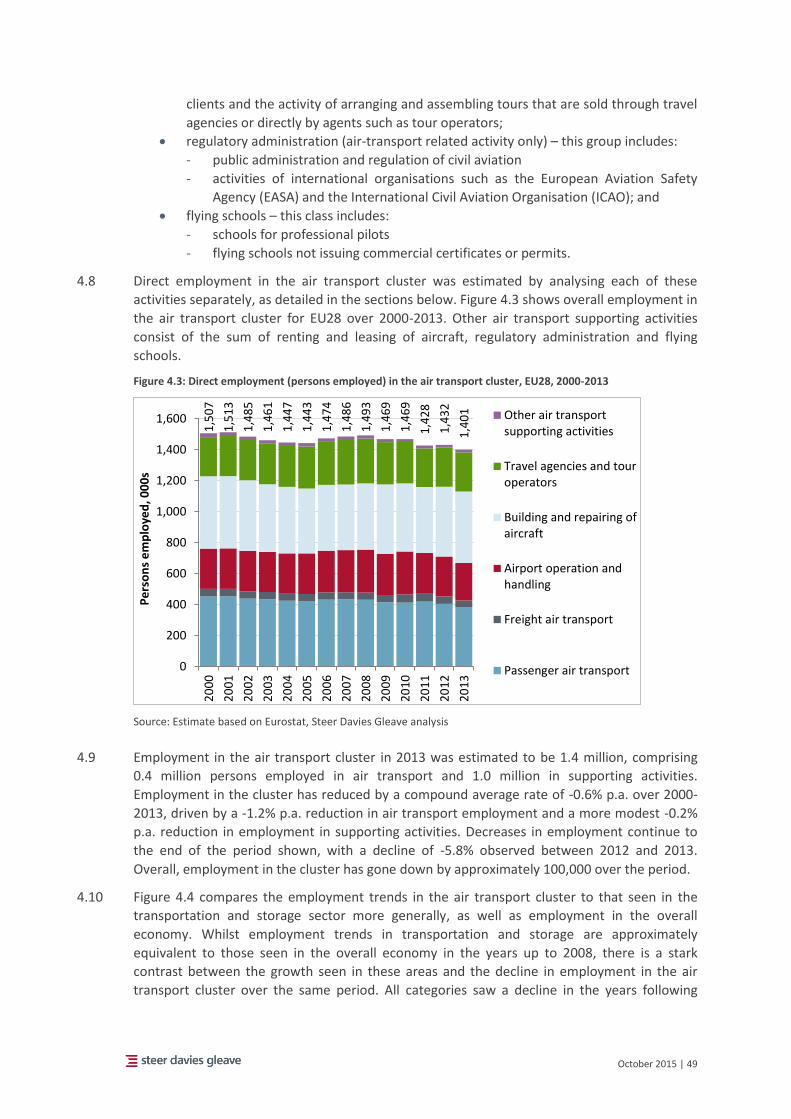
October 2015 | 49
clients and the activity of arranging and assembling tours that are sold through travel
agencies or directly by agents such as tour operators;
regulatory administration (air-transport related activity only) – this group includes:
- public administration and regulation of civil aviation
- activities of international organisations such as the European Aviation Safety
Agency (EASA) and the International Civil Aviation Organisation (ICAO); and
flying schools – this class includes:
- schools for professional pilots
- flying schools not issuing commercial certificates or permits.
4.8 Direct employment in the air transport cluster was estimated by analysing each of these
activities separately, as detailed in the sections below. Figure 4.3 shows overall employment in
the air transport cluster for EU28 over 2000-2013. Other air transport supporting activities
consist of the sum of renting and leasing of aircraft, regulatory administration and flying
schools.
Figure 4.3: Direct employment (persons employed) in the air transport cluster, EU28, 2000-2013
Source: Estimate based on Eurostat, Steer Davies Gleave analysis
4.9 Employment in the air transport cluster in 2013 was estimated to be 1.4 million, comprising
0.4 million persons employed in air transport and 1.0 million in supporting activities.
Employment in the cluster has reduced by a compound average rate of -0.6% p.a. over 2000-
2013, driven by a -1.2% p.a. reduction in air transport employment and a more modest -0.2%
p.a. reduction in employment in supporting activities. Decreases in employment continue to
the end of the period shown, with a decline of -5.8% observed between 2012 and 2013.
Overall, employment in the cluster has gone down by approximately 100,000 over the period.
4.10 Figure 4.4 compares the employment trends in the air transport cluster to that seen in the
transportation and storage sector more generally, as well as employment in the overall
economy. Whilst employment trends in transportation and storage are approximately
equivalent to those seen in the overall economy in the years up to 2008, there is a stark
contrast between the growth seen in these areas and the decline in employment in the air
transport cluster over the same period. All categories saw a decline in the years following
1,5
07
1,5
13
1,4
85
1,4
61
1,4
47
1,4
43
1,4
74
1,4
86
1,4
93
1,4
69
1,4
69
1,4
28
1,4
32
1,4
01
0
200
400
600
800
1,000
1,200
1,400
1,600
20
00
20
01
20
02
20
03
20
04
20
05
20
06
20
07
20
08
20
09
20
10
20
11
20
12
20
13
Pe
rso
ns
em
plo
yed
, 00
0s
Other air transportsupporting activities
Travel agencies and touroperators
Building and repairing ofaircraft
Airport operation andhandling
Freight air transport
Passenger air transport
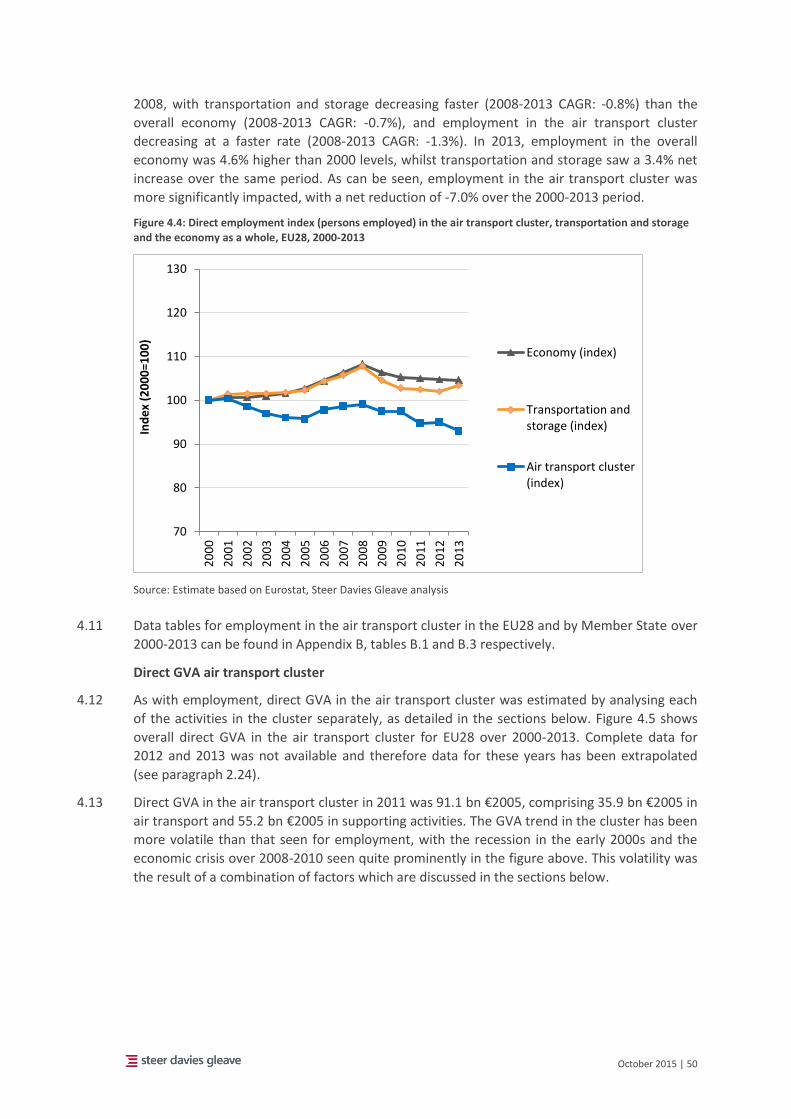
October 2015 | 50
2008, with transportation and storage decreasing faster (2008-2013 CAGR: -0.8%) than the
overall economy (2008-2013 CAGR: -0.7%), and employment in the air transport cluster
decreasing at a faster rate (2008-2013 CAGR: -1.3%). In 2013, employment in the overall
economy was 4.6% higher than 2000 levels, whilst transportation and storage saw a 3.4% net
increase over the same period. As can be seen, employment in the air transport cluster was
more significantly impacted, with a net reduction of -7.0% over the 2000-2013 period.
Figure 4.4: Direct employment index (persons employed) in the air transport cluster, transportation and storage and the economy as a whole, EU28, 2000-2013
Source: Estimate based on Eurostat, Steer Davies Gleave analysis
4.11 Data tables for employment in the air transport cluster in the EU28 and by Member State over
2000-2013 can be found in Appendix B, tables B.1 and B.3 respectively.
Direct GVA air transport cluster
4.12 As with employment, direct GVA in the air transport cluster was estimated by analysing each
of the activities in the cluster separately, as detailed in the sections below. Figure 4.5 shows
overall direct GVA in the air transport cluster for EU28 over 2000-2013. Complete data for
2012 and 2013 was not available and therefore data for these years has been extrapolated
(see paragraph 2.24).
4.13 Direct GVA in the air transport cluster in 2011 was 91.1 bn €2005, comprising 35.9 bn €2005 in
air transport and 55.2 bn €2005 in supporting activities. The GVA trend in the cluster has been
more volatile than that seen for employment, with the recession in the early 2000s and the
economic crisis over 2008-2010 seen quite prominently in the figure above. This volatility was
the result of a combination of factors which are discussed in the sections below.
70
80
90
100
110
120
130
20
00
20
01
20
02
20
03
20
04
20
05
20
06
20
07
20
08
20
09
20
10
20
11
20
12
20
13
Ind
ex
(20
00
=10
0)
Economy (index)
Transportation andstorage (index)
Air transport cluster(index)
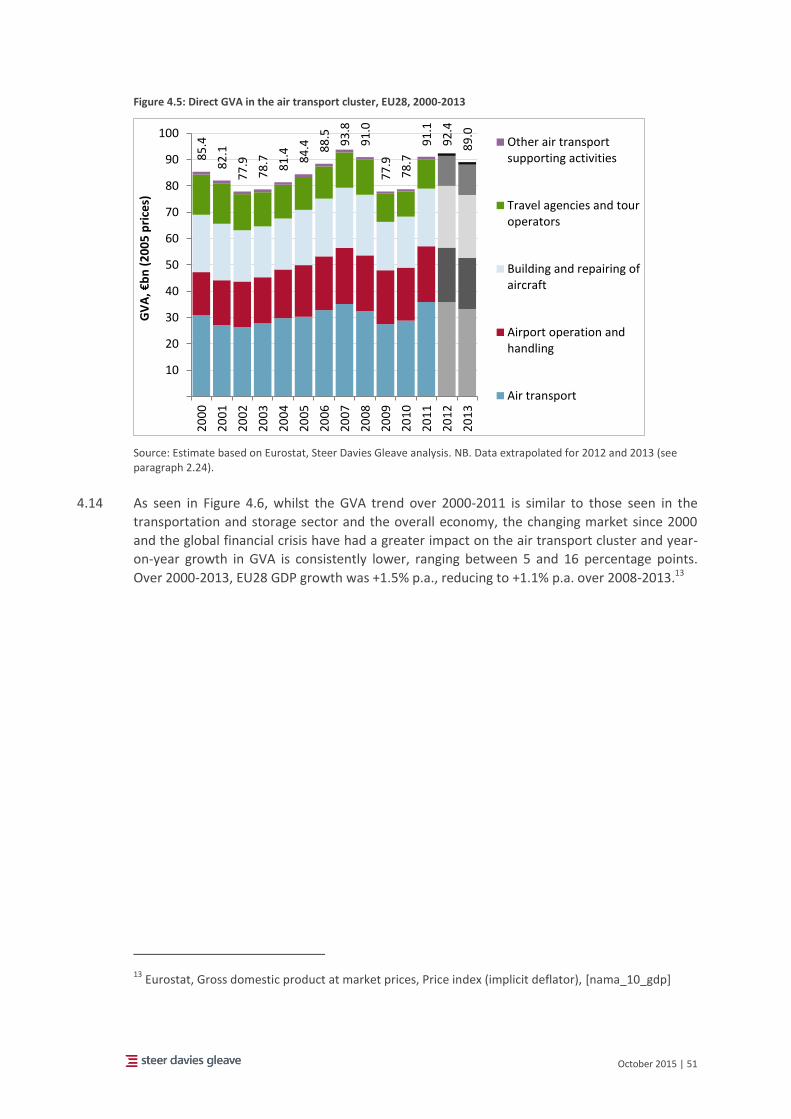
October 2015 | 51
Figure 4.5: Direct GVA in the air transport cluster, EU28, 2000-2013
Source: Estimate based on Eurostat, Steer Davies Gleave analysis. NB. Data extrapolated for 2012 and 2013 (see paragraph 2.24).
4.14 As seen in Figure 4.6, whilst the GVA trend over 2000-2011 is similar to those seen in the
transportation and storage sector and the overall economy, the changing market since 2000
and the global financial crisis have had a greater impact on the air transport cluster and year-
on-year growth in GVA is consistently lower, ranging between 5 and 16 percentage points.
Over 2000-2013, EU28 GDP growth was +1.5% p.a., reducing to +1.1% p.a. over 2008-2013.13
13 Eurostat, Gross domestic product at market prices, Price index (implicit deflator), [nama_10_gdp]
85
.4
82
.1
77
.9
78
.7 81
.4 84
.4 88
.5
93
.8
91
.0
77
.9
78
.7
91
.1
92
.4
89
.0
10
20
30
40
50
60
70
80
90
100
20
00
20
01
20
02
20
03
20
04
20
05
20
06
20
07
20
08
20
09
20
10
20
11
20
12
20
13
GV
A, €
bn
(2
00
5 p
rice
s)Other air transportsupporting activities
Travel agencies and touroperators
Building and repairing ofaircraft
Airport operation andhandling
Air transport
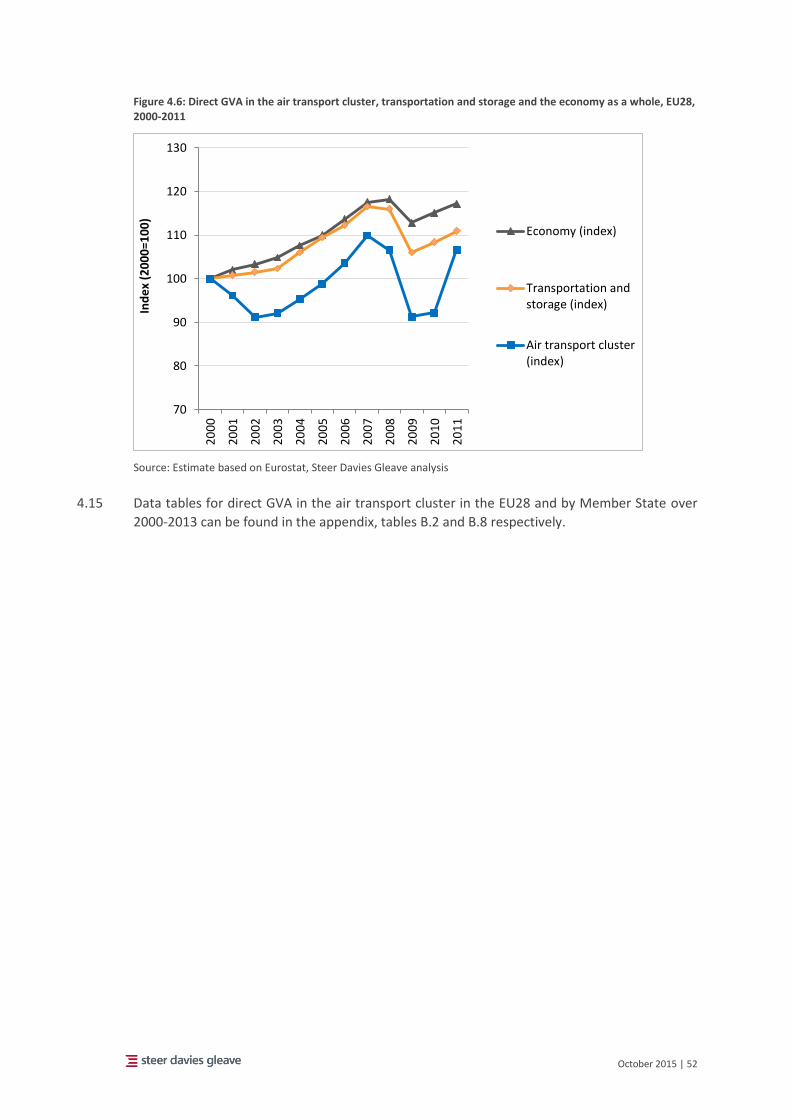
October 2015 | 52
Figure 4.6: Direct GVA in the air transport cluster, transportation and storage and the economy as a whole, EU28, 2000-2011
Source: Estimate based on Eurostat, Steer Davies Gleave analysis
4.15 Data tables for direct GVA in the air transport cluster in the EU28 and by Member State over
2000-2013 can be found in the appendix, tables B.2 and B.8 respectively.
70
80
90
100
110
120
130
20
00
20
01
20
02
20
03
20
04
20
05
20
06
20
07
20
08
20
09
20
10
20
11
Ind
ex
(20
00
=10
0)
Economy (index)
Transportation andstorage (index)
Air transport cluster(index)
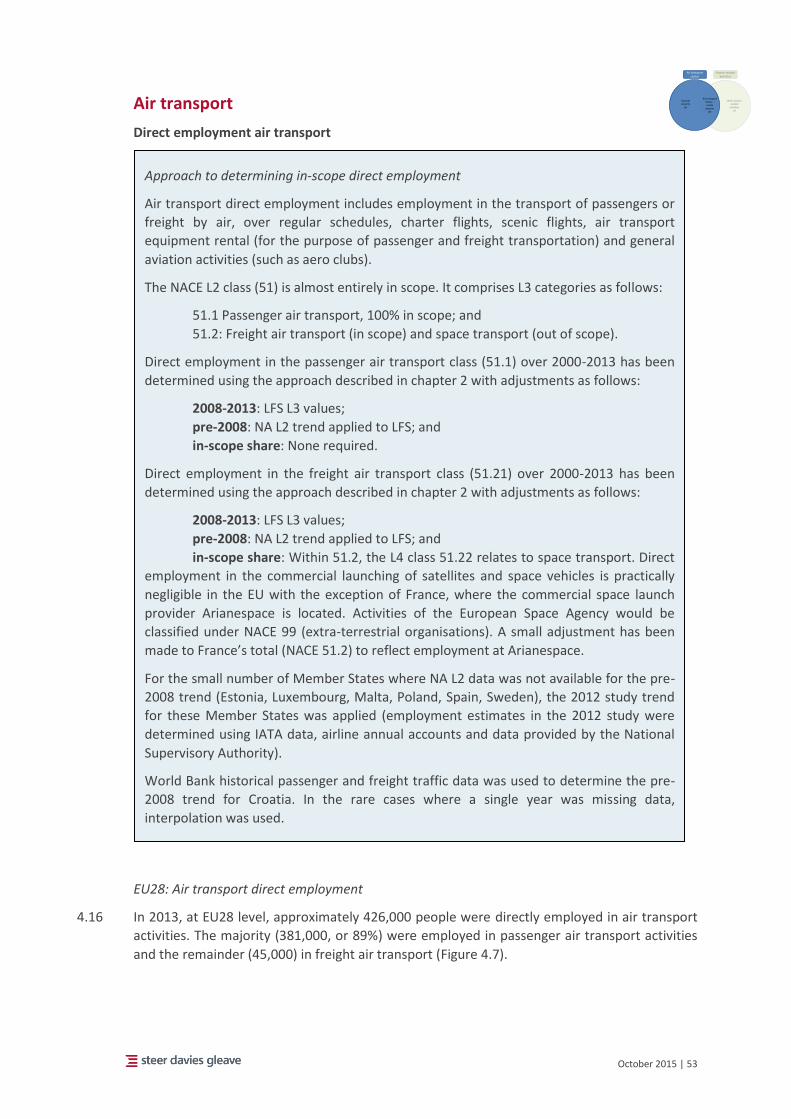
October 2015 | 53
Air transport
Direct employment air transport
EU28: Air transport direct employment
4.16 In 2013, at EU28 level, approximately 426,000 people were directly employed in air transport
activities. The majority (381,000, or 89%) were employed in passenger air transport activities
and the remainder (45,000) in freight air transport (Figure 4.7).
Approach to determining in-scope direct employment
Air transport direct employment includes employment in the transport of passengers or
freight by air, over regular schedules, charter flights, scenic flights, air transport
equipment rental (for the purpose of passenger and freight transportation) and general
aviation activities (such as aero clubs).
The NACE L2 class (51) is almost entirely in scope. It comprises L3 categories as follows:
51.1 Passenger air transport, 100% in scope; and
51.2: Freight air transport (in scope) and space transport (out of scope).
Direct employment in the passenger air transport class (51.1) over 2000-2013 has been
determined using the approach described in chapter 2 with adjustments as follows:
2008-2013: LFS L3 values;
pre-2008: NA L2 trend applied to LFS; and
in-scope share: None required.
Direct employment in the freight air transport class (51.21) over 2000-2013 has been
determined using the approach described in chapter 2 with adjustments as follows:
2008-2013: LFS L3 values;
pre-2008: NA L2 trend applied to LFS; and
in-scope share: Within 51.2, the L4 class 51.22 relates to space transport. Direct
employment in the commercial launching of satellites and space vehicles is practically
negligible in the EU with the exception of France, where the commercial space launch
provider Arianespace is located. Activities of the European Space Agency would be
classified under NACE 99 (extra-terrestrial organisations). A small adjustment has been
made to France’s total (NACE 51.2) to reflect employment at Arianespace.
For the small number of Member States where NA L2 data was not available for the pre-
2008 trend (Estonia, Luxembourg, Malta, Poland, Spain, Sweden), the 2012 study trend
for these Member States was applied (employment estimates in the 2012 study were
determined using IATA data, airline annual accounts and data provided by the National
Supervisory Authority).
World Bank historical passenger and freight traffic data was used to determine the pre-
2008 trend for Croatia. In the rare cases where a single year was missing data,
interpolation was used.
Air transport cluster
Airport-related activities
Outside airports
(a)
Air transport cluster –
inside airports
(b)
Other airport-related
activities(c)
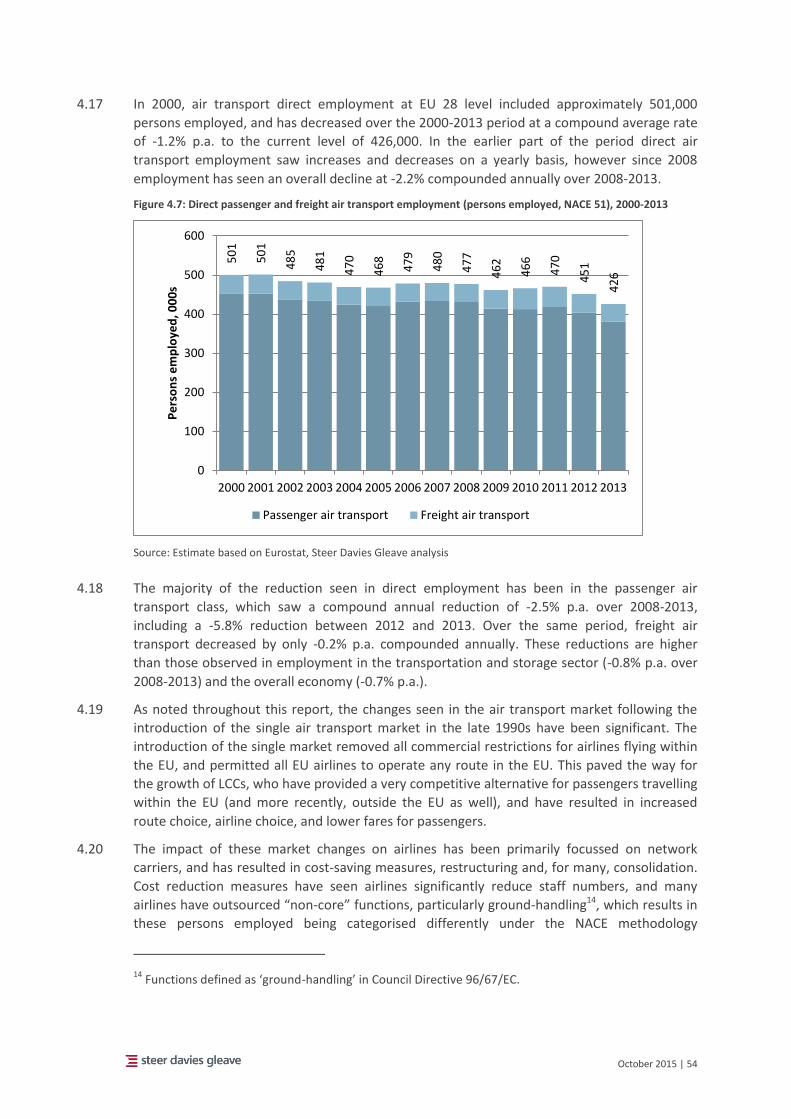
October 2015 | 54
4.17 In 2000, air transport direct employment at EU 28 level included approximately 501,000
persons employed, and has decreased over the 2000-2013 period at a compound average rate
of -1.2% p.a. to the current level of 426,000. In the earlier part of the period direct air
transport employment saw increases and decreases on a yearly basis, however since 2008
employment has seen an overall decline at -2.2% compounded annually over 2008-2013.
Figure 4.7: Direct passenger and freight air transport employment (persons employed, NACE 51), 2000-2013
Source: Estimate based on Eurostat, Steer Davies Gleave analysis
4.18 The majority of the reduction seen in direct employment has been in the passenger air
transport class, which saw a compound annual reduction of -2.5% p.a. over 2008-2013,
including a -5.8% reduction between 2012 and 2013. Over the same period, freight air
transport decreased by only -0.2% p.a. compounded annually. These reductions are higher
than those observed in employment in the transportation and storage sector (-0.8% p.a. over
2008-2013) and the overall economy (-0.7% p.a.).
4.19 As noted throughout this report, the changes seen in the air transport market following the
introduction of the single air transport market in the late 1990s have been significant. The
introduction of the single market removed all commercial restrictions for airlines flying within
the EU, and permitted all EU airlines to operate any route in the EU. This paved the way for
the growth of LCCs, who have provided a very competitive alternative for passengers travelling
within the EU (and more recently, outside the EU as well), and have resulted in increased
route choice, airline choice, and lower fares for passengers.
4.20 The impact of these market changes on airlines has been primarily focussed on network
carriers, and has resulted in cost-saving measures, restructuring and, for many, consolidation.
Cost reduction measures have seen airlines significantly reduce staff numbers, and many
airlines have outsourced “non-core” functions, particularly ground-handling14, which results in
these persons employed being categorised differently under the NACE methodology
14 Functions defined as ‘ground-handling’ in Council Directive 96/67/EC.
50
1
50
1
48
5
48
1
47
0
46
8
47
9
48
0
47
7
46
2
46
6
47
0
45
1
42
6
0
100
200
300
400
500
600
2000 2001 2002 2003 2004 2005 2006 2007 2008 2009 2010 2011 2012 2013
Pe
rso
ns
em
plo
yed
, 00
0s
Passenger air transport Freight air transport
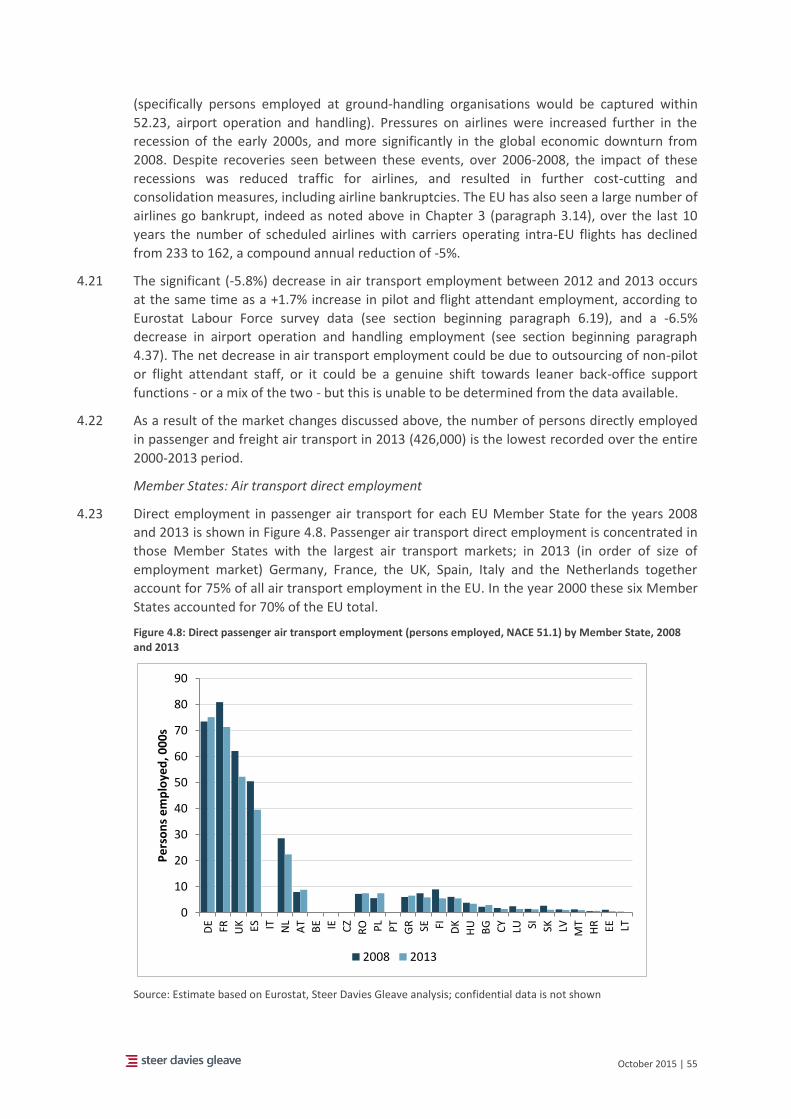
October 2015 | 55
(specifically persons employed at ground-handling organisations would be captured within
52.23, airport operation and handling). Pressures on airlines were increased further in the
recession of the early 2000s, and more significantly in the global economic downturn from
2008. Despite recoveries seen between these events, over 2006-2008, the impact of these
recessions was reduced traffic for airlines, and resulted in further cost-cutting and
consolidation measures, including airline bankruptcies. The EU has also seen a large number of
airlines go bankrupt, indeed as noted above in Chapter 3 (paragraph 3.14), over the last 10
years the number of scheduled airlines with carriers operating intra-EU flights has declined
from 233 to 162, a compound annual reduction of -5%.
4.21 The significant (-5.8%) decrease in air transport employment between 2012 and 2013 occurs
at the same time as a +1.7% increase in pilot and flight attendant employment, according to
Eurostat Labour Force survey data (see section beginning paragraph 6.19), and a -6.5%
decrease in airport operation and handling employment (see section beginning paragraph
4.37). The net decrease in air transport employment could be due to outsourcing of non-pilot
or flight attendant staff, or it could be a genuine shift towards leaner back-office support
functions - or a mix of the two - but this is unable to be determined from the data available.
4.22 As a result of the market changes discussed above, the number of persons directly employed
in passenger and freight air transport in 2013 (426,000) is the lowest recorded over the entire
2000-2013 period.
Member States: Air transport direct employment
4.23 Direct employment in passenger air transport for each EU Member State for the years 2008
and 2013 is shown in Figure 4.8. Passenger air transport direct employment is concentrated in
those Member States with the largest air transport markets; in 2013 (in order of size of
employment market) Germany, France, the UK, Spain, Italy and the Netherlands together
account for 75% of all air transport employment in the EU. In the year 2000 these six Member
States accounted for 70% of the EU total.
Figure 4.8: Direct passenger air transport employment (persons employed, NACE 51.1) by Member State, 2008 and 2013
Source: Estimate based on Eurostat, Steer Davies Gleave analysis; confidential data is not shown
0
10
20
30
40
50
60
70
80
90
DE
FR UK ES IT NL
AT
BE IE CZ
RO PL
PT
GR SE FI DK
HU
BG CY
LU SI SK LV MT
HR EE LT
Pe
rso
ns
em
plo
yed
, 00
0s
2008 2013
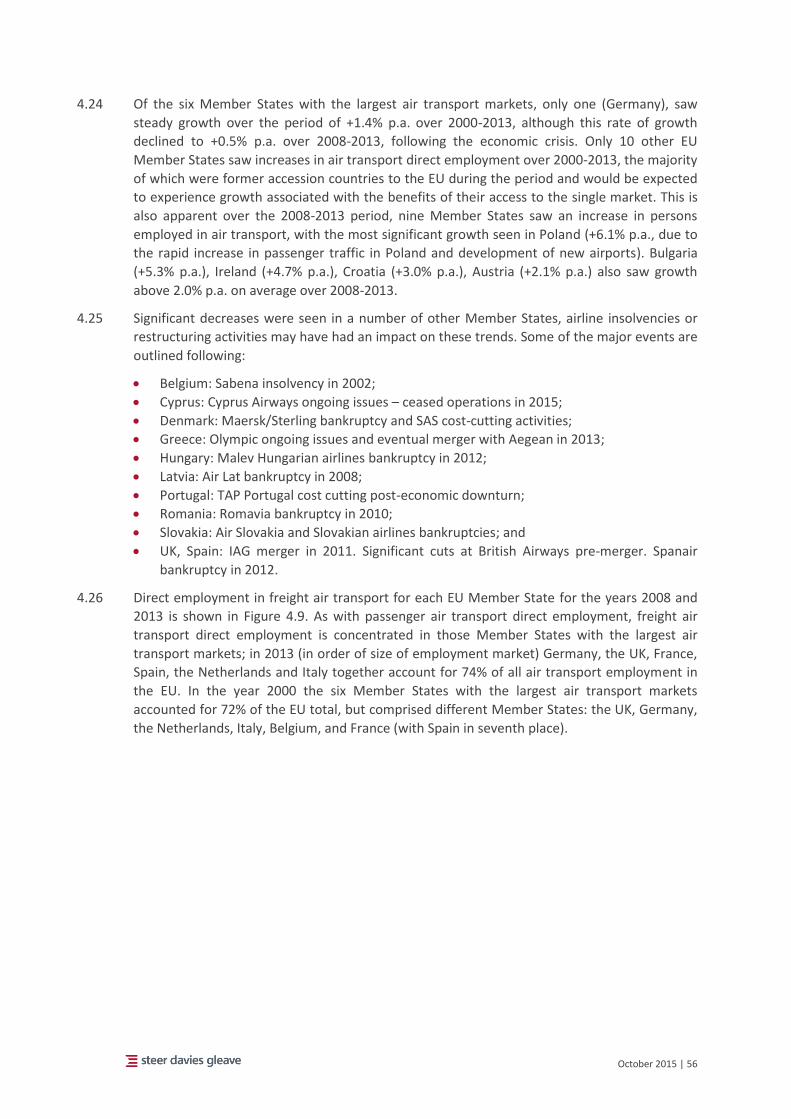
October 2015 | 56
4.24 Of the six Member States with the largest air transport markets, only one (Germany), saw
steady growth over the period of +1.4% p.a. over 2000-2013, although this rate of growth
declined to +0.5% p.a. over 2008-2013, following the economic crisis. Only 10 other EU
Member States saw increases in air transport direct employment over 2000-2013, the majority
of which were former accession countries to the EU during the period and would be expected
to experience growth associated with the benefits of their access to the single market. This is
also apparent over the 2008-2013 period, nine Member States saw an increase in persons
employed in air transport, with the most significant growth seen in Poland (+6.1% p.a., due to
the rapid increase in passenger traffic in Poland and development of new airports). Bulgaria
(+5.3% p.a.), Ireland (+4.7% p.a.), Croatia (+3.0% p.a.), Austria (+2.1% p.a.) also saw growth
above 2.0% p.a. on average over 2008-2013.
4.25 Significant decreases were seen in a number of other Member States, airline insolvencies or
restructuring activities may have had an impact on these trends. Some of the major events are
outlined following:
Belgium: Sabena insolvency in 2002;
Cyprus: Cyprus Airways ongoing issues – ceased operations in 2015;
Denmark: Maersk/Sterling bankruptcy and SAS cost-cutting activities;
Greece: Olympic ongoing issues and eventual merger with Aegean in 2013;
Hungary: Malev Hungarian airlines bankruptcy in 2012;
Latvia: Air Lat bankruptcy in 2008;
Portugal: TAP Portugal cost cutting post-economic downturn;
Romania: Romavia bankruptcy in 2010;
Slovakia: Air Slovakia and Slovakian airlines bankruptcies; and
UK, Spain: IAG merger in 2011. Significant cuts at British Airways pre-merger. Spanair
bankruptcy in 2012.
4.26 Direct employment in freight air transport for each EU Member State for the years 2008 and
2013 is shown in Figure 4.9. As with passenger air transport direct employment, freight air
transport direct employment is concentrated in those Member States with the largest air
transport markets; in 2013 (in order of size of employment market) Germany, the UK, France,
Spain, the Netherlands and Italy together account for 74% of all air transport employment in
the EU. In the year 2000 the six Member States with the largest air transport markets
accounted for 72% of the EU total, but comprised different Member States: the UK, Germany,
the Netherlands, Italy, Belgium, and France (with Spain in seventh place).
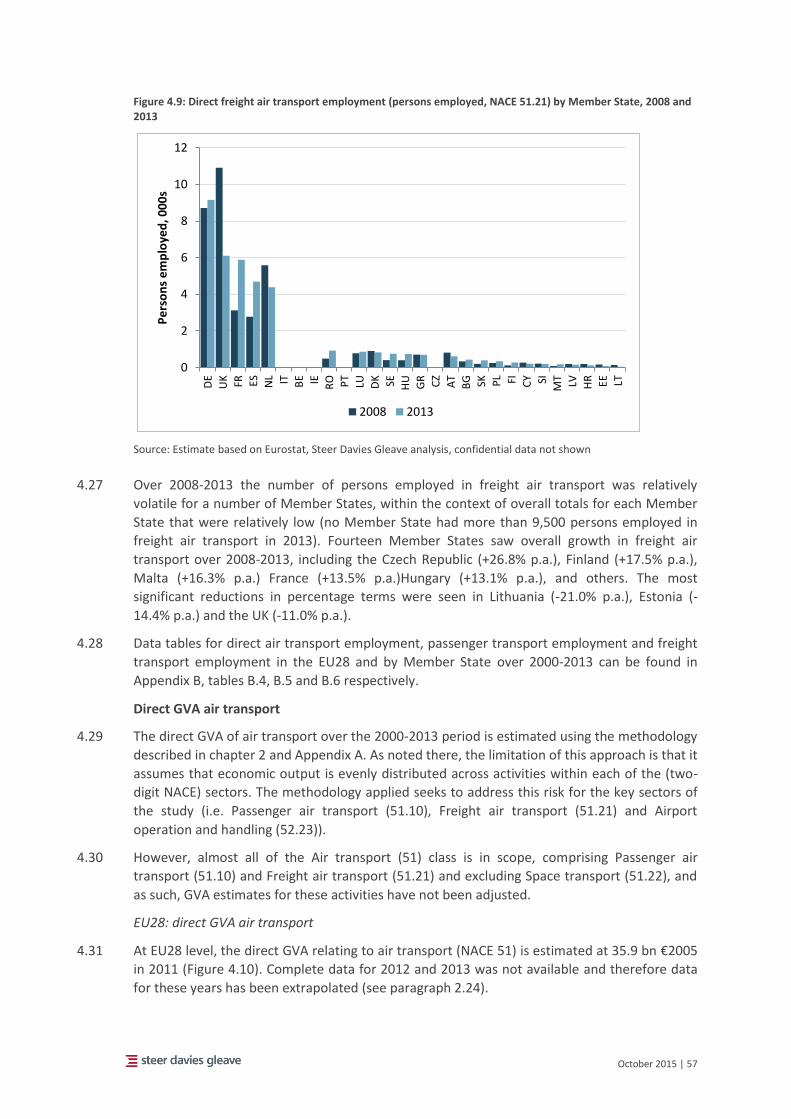
October 2015 | 57
Figure 4.9: Direct freight air transport employment (persons employed, NACE 51.21) by Member State, 2008 and 2013
Source: Estimate based on Eurostat, Steer Davies Gleave analysis, confidential data not shown
4.27 Over 2008-2013 the number of persons employed in freight air transport was relatively
volatile for a number of Member States, within the context of overall totals for each Member
State that were relatively low (no Member State had more than 9,500 persons employed in
freight air transport in 2013). Fourteen Member States saw overall growth in freight air
transport over 2008-2013, including the Czech Republic (+26.8% p.a.), Finland (+17.5% p.a.),
Malta (+16.3% p.a.) France (+13.5% p.a.)Hungary (+13.1% p.a.), and others. The most
significant reductions in percentage terms were seen in Lithuania (-21.0% p.a.), Estonia (-
14.4% p.a.) and the UK (-11.0% p.a.).
4.28 Data tables for direct air transport employment, passenger transport employment and freight
transport employment in the EU28 and by Member State over 2000-2013 can be found in
Appendix B, tables B.4, B.5 and B.6 respectively.
Direct GVA air transport
4.29 The direct GVA of air transport over the 2000-2013 period is estimated using the methodology
described in chapter 2 and Appendix A. As noted there, the limitation of this approach is that it
assumes that economic output is evenly distributed across activities within each of the (two-
digit NACE) sectors. The methodology applied seeks to address this risk for the key sectors of
the study (i.e. Passenger air transport (51.10), Freight air transport (51.21) and Airport
operation and handling (52.23)).
4.30 However, almost all of the Air transport (51) class is in scope, comprising Passenger air
transport (51.10) and Freight air transport (51.21) and excluding Space transport (51.22), and
as such, GVA estimates for these activities have not been adjusted.
EU28: direct GVA air transport
4.31 At EU28 level, the direct GVA relating to air transport (NACE 51) is estimated at 35.9 bn €2005
in 2011 (Figure 4.10). Complete data for 2012 and 2013 was not available and therefore data
for these years has been extrapolated (see paragraph 2.24).
0
2
4
6
8
10
12
DE
UK FR ES NL IT BE IE RO PT
LU DK SE HU
GR CZ
AT
BG SK PL FI CY SI
MT LV HR EE LT
Pe
rso
ns
em
plo
yed
, 00
0s
2008 2013
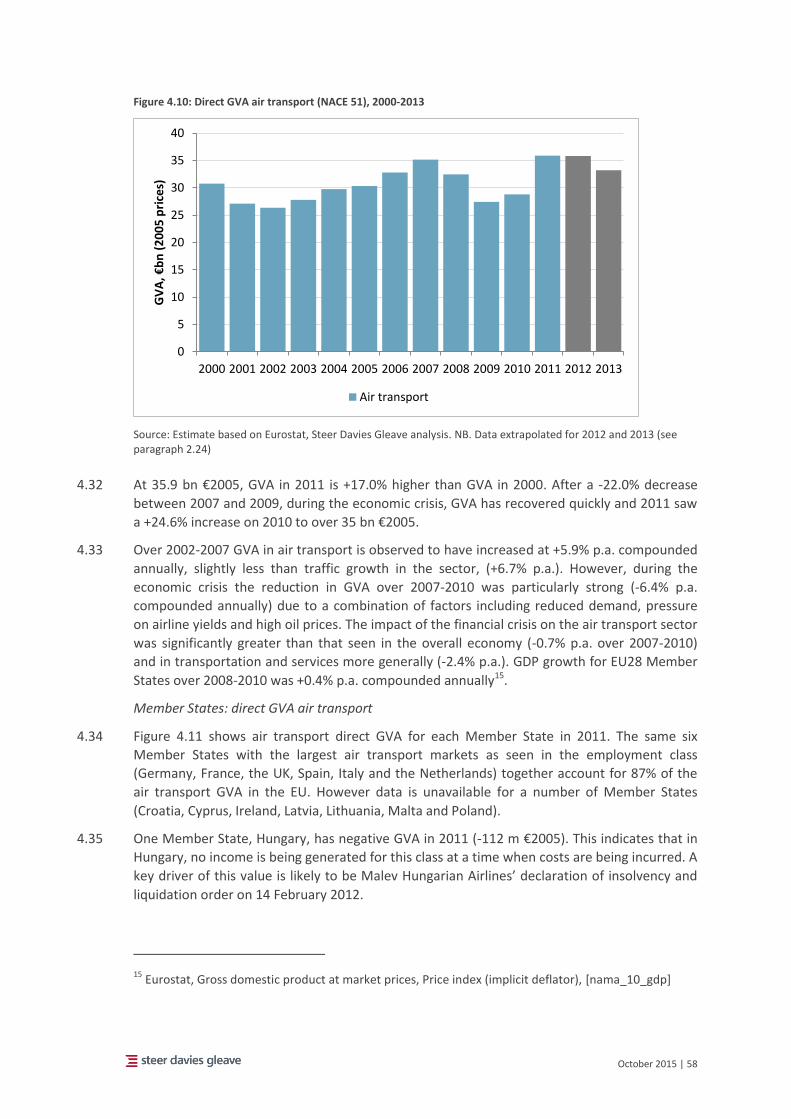
October 2015 | 58
Figure 4.10: Direct GVA air transport (NACE 51), 2000-2013
Source: Estimate based on Eurostat, Steer Davies Gleave analysis. NB. Data extrapolated for 2012 and 2013 (see paragraph 2.24)
4.32 At 35.9 bn €2005, GVA in 2011 is +17.0% higher than GVA in 2000. After a -22.0% decrease
between 2007 and 2009, during the economic crisis, GVA has recovered quickly and 2011 saw
a +24.6% increase on 2010 to over 35 bn €2005.
4.33 Over 2002-2007 GVA in air transport is observed to have increased at +5.9% p.a. compounded
annually, slightly less than traffic growth in the sector, (+6.7% p.a.). However, during the
economic crisis the reduction in GVA over 2007-2010 was particularly strong (-6.4% p.a.
compounded annually) due to a combination of factors including reduced demand, pressure
on airline yields and high oil prices. The impact of the financial crisis on the air transport sector
was significantly greater than that seen in the overall economy (-0.7% p.a. over 2007-2010)
and in transportation and services more generally (-2.4% p.a.). GDP growth for EU28 Member
States over 2008-2010 was +0.4% p.a. compounded annually15.
Member States: direct GVA air transport
4.34 Figure 4.11 shows air transport direct GVA for each Member State in 2011. The same six
Member States with the largest air transport markets as seen in the employment class
(Germany, France, the UK, Spain, Italy and the Netherlands) together account for 87% of the
air transport GVA in the EU. However data is unavailable for a number of Member States
(Croatia, Cyprus, Ireland, Latvia, Lithuania, Malta and Poland).
4.35 One Member State, Hungary, has negative GVA in 2011 (-112 m €2005). This indicates that in
Hungary, no income is being generated for this class at a time when costs are being incurred. A
key driver of this value is likely to be Malev Hungarian Airlines’ declaration of insolvency and
liquidation order on 14 February 2012.
15 Eurostat, Gross domestic product at market prices, Price index (implicit deflator), [nama_10_gdp]
0
5
10
15
20
25
30
35
40
2000 2001 2002 2003 2004 2005 2006 2007 2008 2009 2010 2011 2012 2013
GV
A, €
bn
(2
00
5 p
rice
s)
Air transport
October 2015 | 59
Figure 4.11: Direct GVA air transport (NACE 51), by Member State, 2011
Source: Estimate based on Eurostat, Steer Davies Gleave analysis
4.36 Data tables for air transport GVA in the EU28 and by Member State over 2000-2013 can be
found in table B.9 of Appendix B.
-2
0
2
4
6
8
10
12
DE
UK FR IT NL
ES PT SE DK
AT
BE
GR FI CZ
RO EE SI LT SK BG
HR CY IE LV LU MT PL
HU
GV
A, 2
01
1,
€b
n (
20
05
pri
ces)
GVA in Air Transport
October 2015 | 60
Airport operation and handling
Direct employment airport operation and handling
EU28: Airport operation and handling direct employment
4.37 Figure 4.12 shows direct employment in airport operation and handling activities over the
period 2000-2013. Over the period shown, direct employment in this class has declined from
260,000 in 2000 to 243,000 in 2013, a compound annual reduction of -0.5% p.a.
Approach to determining in-scope direct employment
Direct airport operating and handling employment includes employment in activities
relating to air transport of passengers, animals or freight, and includes:
operation of terminal facilities such as airway terminals etc.;
airport and air-traffic-control activities;
ground service activities on airfields etc.; and
firefighting and fire-prevention services at airports.
The in-scope NACE class for this category is NACE L4 (52.23) Service activities incidental
to air transportation. This class sits within NACE L3 (52.2) Support activities for
transportation and this is within NACE L2 (52) Warehousing and support activities for
transportation. Therefore the L2 and L3 parent NACE classes include employment for
out-of-scope activities (e.g. service activities for land and water transportation).
Direct airport operating and handling employment has been determined using NACE L4
data (52.23) Service activities incidental to air transportation. Employment over 2000-
2013 has been determined using the approach described in chapter 2 with adjustments
as follows:
2008-2013: The relativity of SBS L4 (52.23) to SBS L3 (52.2) was applied to the LFS L3
data. Where 2013 data is not available, the air transport employment trend for that
year has been applied;
pre-2008: NA L2 trend applied to LFS; and
in-scope share: None required.
Air transport cluster
Airport-related activities
Outside airports
(a)
Air transport cluster –
inside airports
(b)
Other airport-related
activities(c)
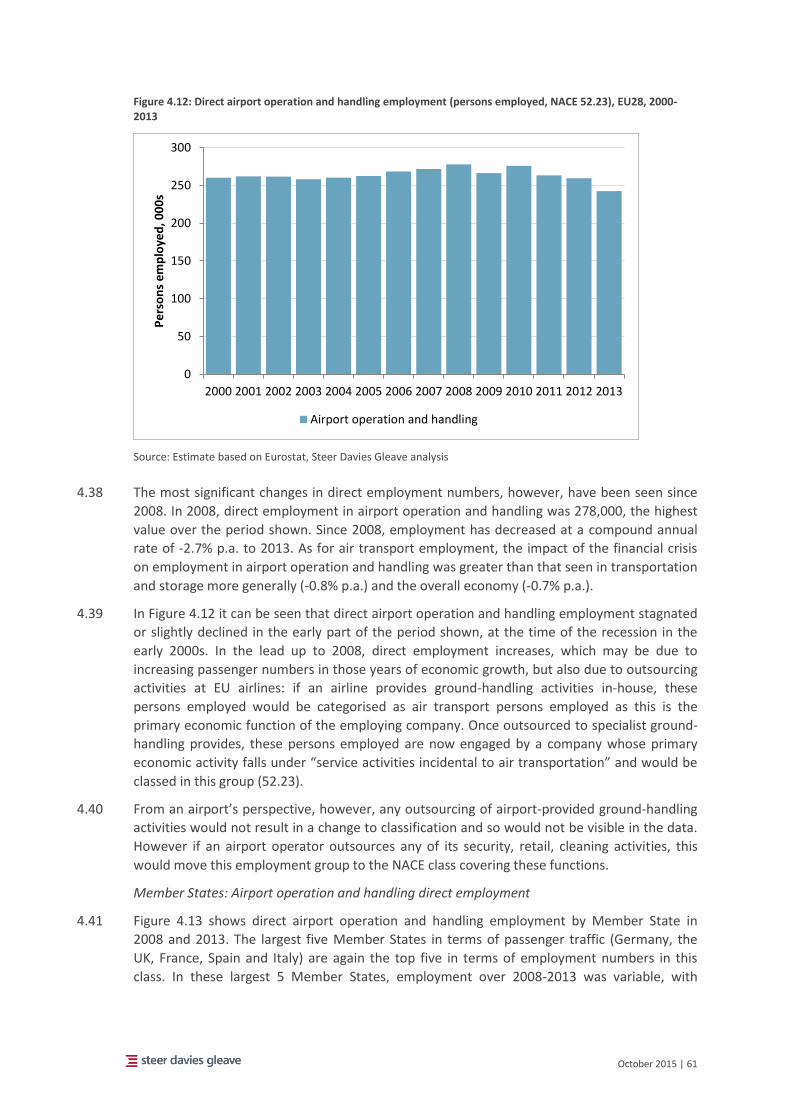
October 2015 | 61
Figure 4.12: Direct airport operation and handling employment (persons employed, NACE 52.23), EU28, 2000-2013
Source: Estimate based on Eurostat, Steer Davies Gleave analysis
4.38 The most significant changes in direct employment numbers, however, have been seen since
2008. In 2008, direct employment in airport operation and handling was 278,000, the highest
value over the period shown. Since 2008, employment has decreased at a compound annual
rate of -2.7% p.a. to 2013. As for air transport employment, the impact of the financial crisis
on employment in airport operation and handling was greater than that seen in transportation
and storage more generally (-0.8% p.a.) and the overall economy (-0.7% p.a.).
4.39 In Figure 4.12 it can be seen that direct airport operation and handling employment stagnated
or slightly declined in the early part of the period shown, at the time of the recession in the
early 2000s. In the lead up to 2008, direct employment increases, which may be due to
increasing passenger numbers in those years of economic growth, but also due to outsourcing
activities at EU airlines: if an airline provides ground-handling activities in-house, these
persons employed would be categorised as air transport persons employed as this is the
primary economic function of the employing company. Once outsourced to specialist ground-
handling provides, these persons employed are now engaged by a company whose primary
economic activity falls under “service activities incidental to air transportation” and would be
classed in this group (52.23).
4.40 From an airport’s perspective, however, any outsourcing of airport-provided ground-handling
activities would not result in a change to classification and so would not be visible in the data.
However if an airport operator outsources any of its security, retail, cleaning activities, this
would move this employment group to the NACE class covering these functions.
Member States: Airport operation and handling direct employment
4.41 Figure 4.13 shows direct airport operation and handling employment by Member State in
2008 and 2013. The largest five Member States in terms of passenger traffic (Germany, the
UK, France, Spain and Italy) are again the top five in terms of employment numbers in this
class. In these largest 5 Member States, employment over 2008-2013 was variable, with
0
50
100
150
200
250
300
2000 2001 2002 2003 2004 2005 2006 2007 2008 2009 2010 2011 2012 2013
Pe
rso
ns
em
plo
yed
, 00
0s
Airport operation and handling
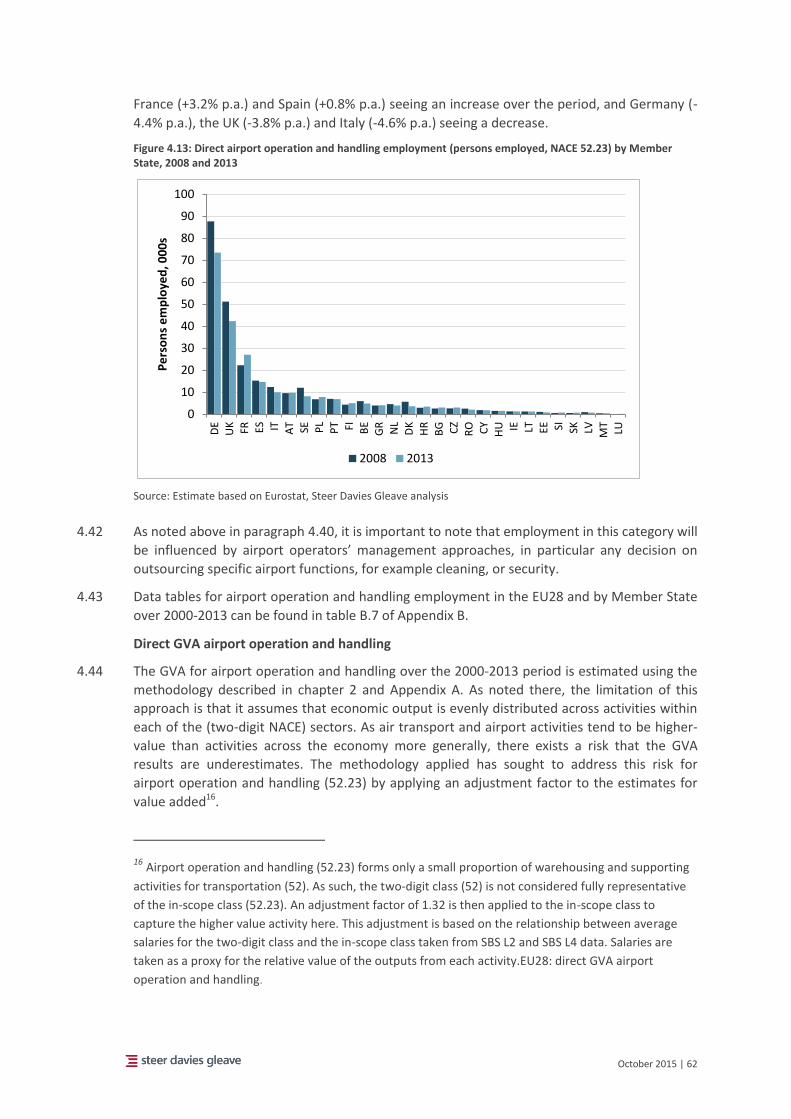
October 2015 | 62
France (+3.2% p.a.) and Spain (+0.8% p.a.) seeing an increase over the period, and Germany (-
4.4% p.a.), the UK (-3.8% p.a.) and Italy (-4.6% p.a.) seeing a decrease.
Figure 4.13: Direct airport operation and handling employment (persons employed, NACE 52.23) by Member State, 2008 and 2013
Source: Estimate based on Eurostat, Steer Davies Gleave analysis
4.42 As noted above in paragraph 4.40, it is important to note that employment in this category will
be influenced by airport operators’ management approaches, in particular any decision on
outsourcing specific airport functions, for example cleaning, or security.
4.43 Data tables for airport operation and handling employment in the EU28 and by Member State
over 2000-2013 can be found in table B.7 of Appendix B.
Direct GVA airport operation and handling
4.44 The GVA for airport operation and handling over the 2000-2013 period is estimated using the
methodology described in chapter 2 and Appendix A. As noted there, the limitation of this
approach is that it assumes that economic output is evenly distributed across activities within
each of the (two-digit NACE) sectors. As air transport and airport activities tend to be higher-
value than activities across the economy more generally, there exists a risk that the GVA
results are underestimates. The methodology applied has sought to address this risk for
airport operation and handling (52.23) by applying an adjustment factor to the estimates for
value added16.
16 Airport operation and handling (52.23) forms only a small proportion of warehousing and supporting
activities for transportation (52). As such, the two-digit class (52) is not considered fully representative
of the in-scope class (52.23). An adjustment factor of 1.32 is then applied to the in-scope class to
capture the higher value activity here. This adjustment is based on the relationship between average
salaries for the two-digit class and the in-scope class taken from SBS L2 and SBS L4 data. Salaries are
taken as a proxy for the relative value of the outputs from each activity.EU28: direct GVA airport
operation and handling.
0
10
20
30
40
50
60
70
80
90
100
DE
UK FR ES IT AT SE PL
PT FI BE
GR
NL
DK
HR
BG CZ
RO CY
HU IE LT EE SI SK LV MT
LU
Pe
rso
ns
em
plo
yed
, 00
0s
2008 2013
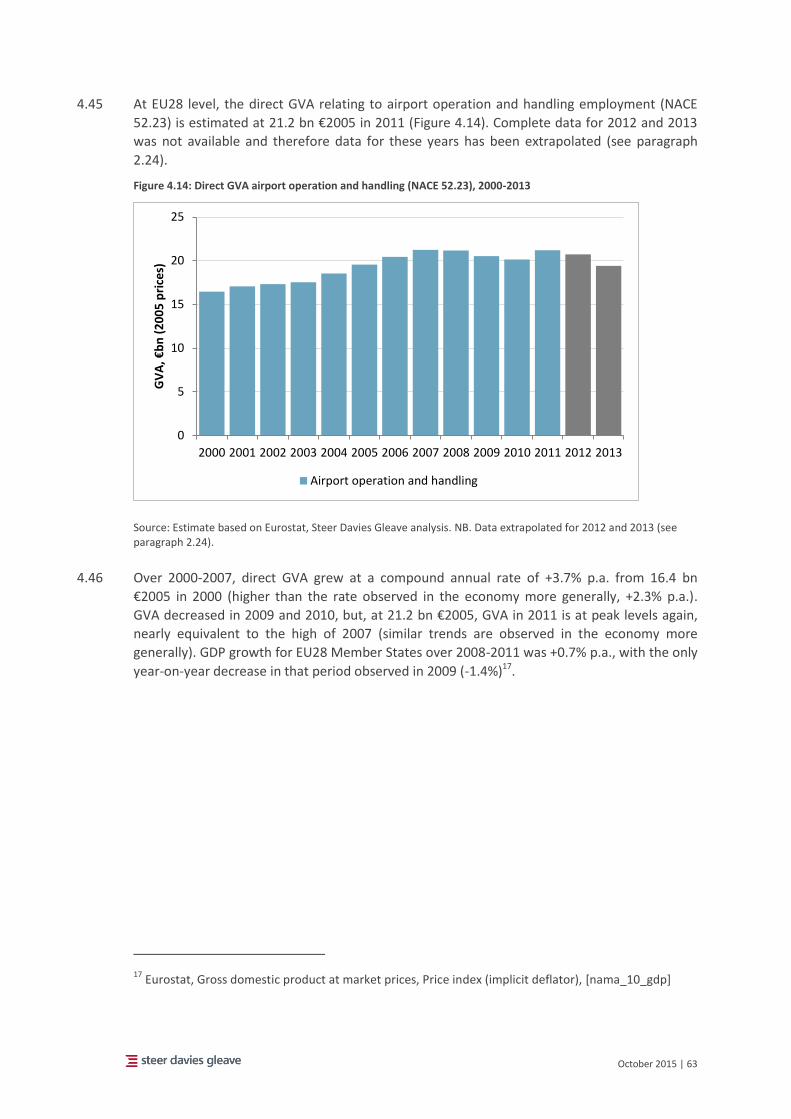
October 2015 | 63
4.45 At EU28 level, the direct GVA relating to airport operation and handling employment (NACE
52.23) is estimated at 21.2 bn €2005 in 2011 (Figure 4.14). Complete data for 2012 and 2013
was not available and therefore data for these years has been extrapolated (see paragraph
2.24).
Figure 4.14: Direct GVA airport operation and handling (NACE 52.23), 2000-2013
Source: Estimate based on Eurostat, Steer Davies Gleave analysis. NB. Data extrapolated for 2012 and 2013 (see paragraph 2.24).
4.46 Over 2000-2007, direct GVA grew at a compound annual rate of +3.7% p.a. from 16.4 bn
€2005 in 2000 (higher than the rate observed in the economy more generally, +2.3% p.a.).
GVA decreased in 2009 and 2010, but, at 21.2 bn €2005, GVA in 2011 is at peak levels again,
nearly equivalent to the high of 2007 (similar trends are observed in the economy more
generally). GDP growth for EU28 Member States over 2008-2011 was +0.7% p.a., with the only
year-on-year decrease in that period observed in 2009 (-1.4%)17.
17 Eurostat, Gross domestic product at market prices, Price index (implicit deflator), [nama_10_gdp]
0
5
10
15
20
25
2000 2001 2002 2003 2004 2005 2006 2007 2008 2009 2010 2011 2012 2013
GV
A, €
bn
(2
00
5 p
rice
s)
Airport operation and handling
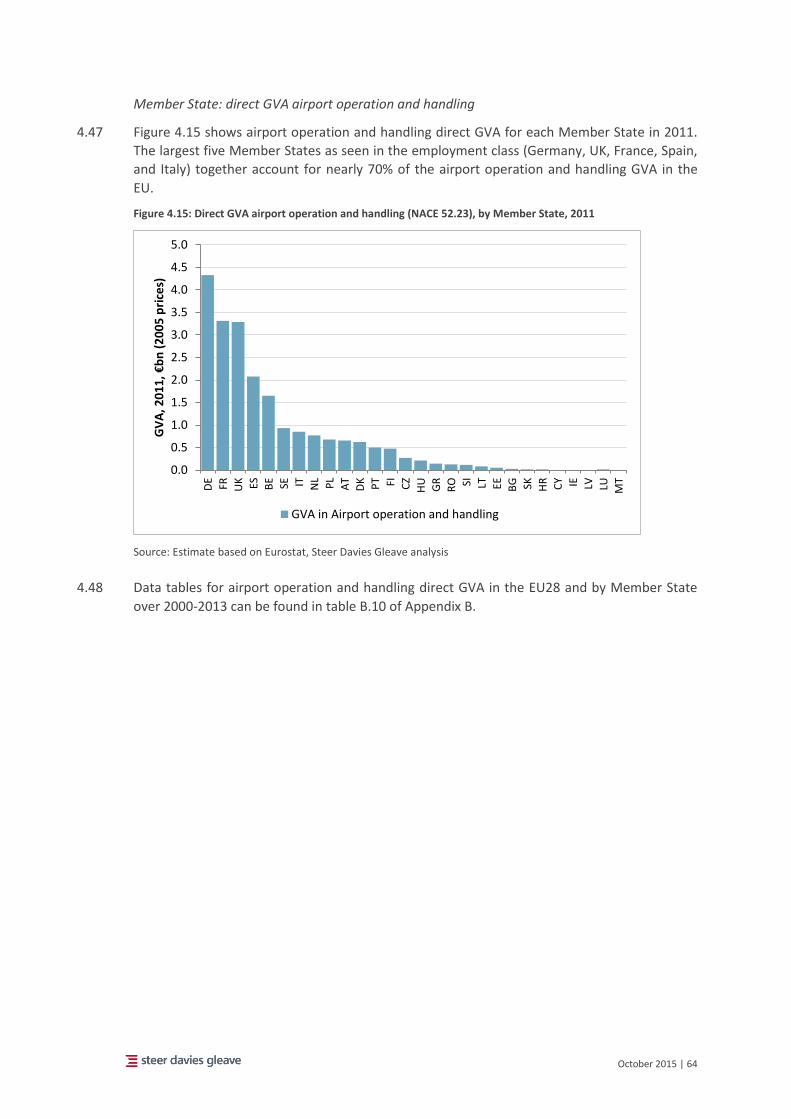
October 2015 | 64
Member State: direct GVA airport operation and handling
4.47 Figure 4.15 shows airport operation and handling direct GVA for each Member State in 2011.
The largest five Member States as seen in the employment class (Germany, UK, France, Spain,
and Italy) together account for nearly 70% of the airport operation and handling GVA in the
EU.
Figure 4.15: Direct GVA airport operation and handling (NACE 52.23), by Member State, 2011
Source: Estimate based on Eurostat, Steer Davies Gleave analysis
4.48 Data tables for airport operation and handling direct GVA in the EU28 and by Member State
over 2000-2013 can be found in table B.10 of Appendix B.
0.0
0.5
1.0
1.5
2.0
2.5
3.0
3.5
4.0
4.5
5.0
DE
FR UK ES BE SE IT NL
PL
AT
DK PT FI CZ
HU
GR
RO SI LT EE BG SK HR CY IE LV LU MT
GV
A, 2
01
1,
€b
n (
20
05
pri
ces)
GVA in Airport operation and handling
October 2015 | 65
Building and repairing of aircraft
Direct employment building and repairing of aircraft
civil activities in the Group (72.2%)18
, using, available for Belgium (95.2% 19
) 97.5%20
).
18 Airbus Defence and Space, http://airbusdefenceandspace.com/newsroom/news-and-
features/airbus-defence-and-space-provides-uk-mod-with-satellite-airtime-for-location-of-military-assets/, last visited 19 July 2015
19 Data provided by National Bank of Belgium
Approach to determining in-scope direct employment
Direct employment in building and repairing of aircraft includes employment in the
manufacture of civil aircraft, their parts and accessories, overhaul activities, as well as
employment in the repair and maintenance of aircraft and aircraft engines.
The in-scope NACE class for this category are the civil aviation parts of:
NACE L3/L4 (30.30) Manufacture of air and spacecraft and related machinery. This
sits within NACE L2 (30) Manufacture of other transport equipment.
NACE L4 (33.16) Repair and maintenance of aircraft and spacecraft. This sits within
NACE L3 (33.1) Repair of fabricated metal products, machinery and equipment,
which in turn belongs under NACE L2 (33) Repair and installation of machinery and
equipment.
Out-of-scope activities are then included at all NACE levels for both categories, and
require adjustments to be made. Strictly, in-scope activities are only those relating to the
building and repairing of aircraft used for (intra- and extra-) European operations.
Adjustments for this operational/geographical scope will be informed by consultation
with manufacturers and have not been made at this stage.
Direct aircraft manufacturing employment has been determined using NACE L3/L4 data
(30.30) Manufacture of air and spacecraft and related machinery. Employment over
2000-2013 has been determined using the approach described in chapter 2 with
adjustments as follows:
2008-2013: LFS L3/L4 (30.30) data
pre-2008: NA L2 trend applied to LFS; and
in-scope share: employment in civil aviation activities. EU-wide industry figures are
not available to exclude the share of defence and space activities from the category.
The approach differentiates between MS with large manufacturing bases and those
without. For MS with large Airbus Group (EADS) bases (France, Germany, Italy, Spain
and UK), employment has been scaled by the share of civil activities in the Group
(72.2%9), to exclude defence and space activities. For Member States with negligible
or very small defence and space activities, the share of these activities in the
category has been estimated using information available for Belgium (95.2%10) and
Austria (97.5%11) and applying their average (96.5%).
Air transport cluster
Airport-related activities
Outside airports
(a)
Air transport cluster –
inside airports
(b)
Other airport-related
activities(c)
October 2015 | 66
EU28: building and repairing of aircraft direct employment
4.49 In 2013, at EU28 level, approximately 461,000 people were directly employed in building and
repairing of aircraft activities. The majority (381,000, or 83%) were employed in manufacturing
of aircraft and the remainder (79,000) in their repair and maintenance (Figure 4.16).
4.50 In 2000, building and repairing of aircraft direct employment at EU 28 level included
approximately 468,000 persons employed, and has decreased over the 2000-2013 period at an
compound annual rate of -0.1% p.a. to the current level of 462,000. In the earlier part of the
period, employment saw decreases on a yearly basis, however since 2005 employment has
seen an overall growth at +1.2% compounded annually over 2005-2013. However, this period
also included a contraction in employment in the sector over 2010 and 2011 followed by a
sharp rebound in the two subsequent years.
20 Estimate based on Federal Ministry for Transport, Innovation and Technology, Austria, publication
and RUAG Space GmbH revenue
For Bulgaria, where L3 data was not available, direct in-scope L3 employment was
estimated from the L2 data by applying the shares between L2 and L3 seen in Hungary,
as opposed to the average L2 to L3 relativities approach described in Chapter 2.
For a small number of Member States where NA L2 data was not available for the pre-
2008 trend (Estonia, Croatia, Spain, Sweden), trends from comparable MS were applied.
In the case of Malta and Cyprus, the materiality of the volumes was limited so the 2000-
2007 trend was fixed at the average employment from the 2008-2013 period for which
data was available.
Direct employment in the repair and maintenance of aircraft has been determined using
NACE L3 data (33.1) Repair of fabricated metal products and machinery. Employment
over 2000-2013 has been determined using the approach described in Chapter 2 with
adjustments as follows:
2008-2013: LFS L3 (33.1) data
pre-2008: NA L2 trend applied to LFS; and
in-scope share: an estimate for the adjustments that should be applied to the L3
data was made by combining information from SBS L4 (33.16) Repair and
maintenance of aircraft and spacecraft with data provided by airports in response to
the surveys. In general it has been found that many repair and maintenance
activities (excluding overhaul, which is included above) are often performed by
operators or manufacturers, and would be captured under air transport or
manufacturing above.
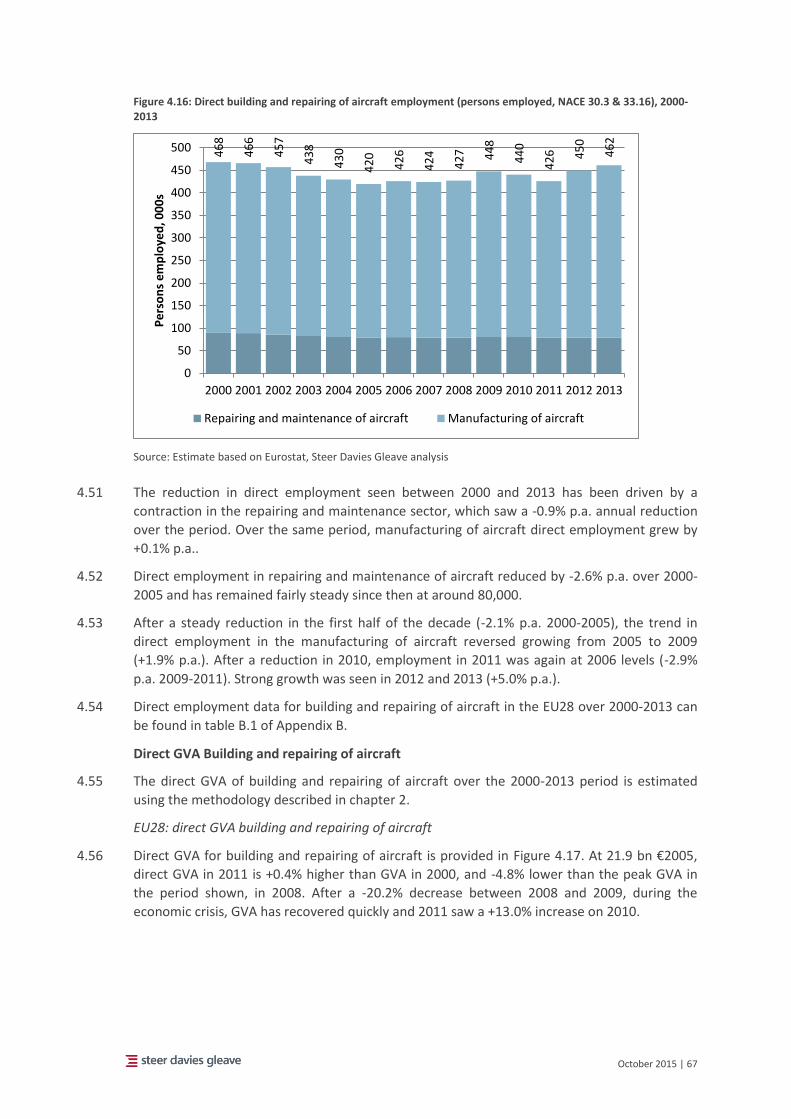
October 2015 | 67
Figure 4.16: Direct building and repairing of aircraft employment (persons employed, NACE 30.3 & 33.16), 2000-2013
Source: Estimate based on Eurostat, Steer Davies Gleave analysis
4.51 The reduction in direct employment seen between 2000 and 2013 has been driven by a
contraction in the repairing and maintenance sector, which saw a -0.9% p.a. annual reduction
over the period. Over the same period, manufacturing of aircraft direct employment grew by
+0.1% p.a..
4.52 Direct employment in repairing and maintenance of aircraft reduced by -2.6% p.a. over 2000-
2005 and has remained fairly steady since then at around 80,000.
4.53 After a steady reduction in the first half of the decade (-2.1% p.a. 2000-2005), the trend in
direct employment in the manufacturing of aircraft reversed growing from 2005 to 2009
(+1.9% p.a.). After a reduction in 2010, employment in 2011 was again at 2006 levels (-2.9%
p.a. 2009-2011). Strong growth was seen in 2012 and 2013 (+5.0% p.a.).
4.54 Direct employment data for building and repairing of aircraft in the EU28 over 2000-2013 can
be found in table B.1 of Appendix B.
Direct GVA Building and repairing of aircraft
4.55 The direct GVA of building and repairing of aircraft over the 2000-2013 period is estimated
using the methodology described in chapter 2.
EU28: direct GVA building and repairing of aircraft
4.56 Direct GVA for building and repairing of aircraft is provided in Figure 4.17. At 21.9 bn €2005,
direct GVA in 2011 is +0.4% higher than GVA in 2000, and -4.8% lower than the peak GVA in
the period shown, in 2008. After a -20.2% decrease between 2008 and 2009, during the
economic crisis, GVA has recovered quickly and 2011 saw a +13.0% increase on 2010.
46
8
46
6
45
7
43
8
43
0
42
0
42
6
42
4
42
7 44
8
44
0
42
6 45
0
46
2
0
50
100
150
200
250
300
350
400
450
500
2000 2001 2002 2003 2004 2005 2006 2007 2008 2009 2010 2011 2012 2013
Pe
rso
ns
em
plo
yed
, 00
0s
Repairing and maintenance of aircraft Manufacturing of aircraft
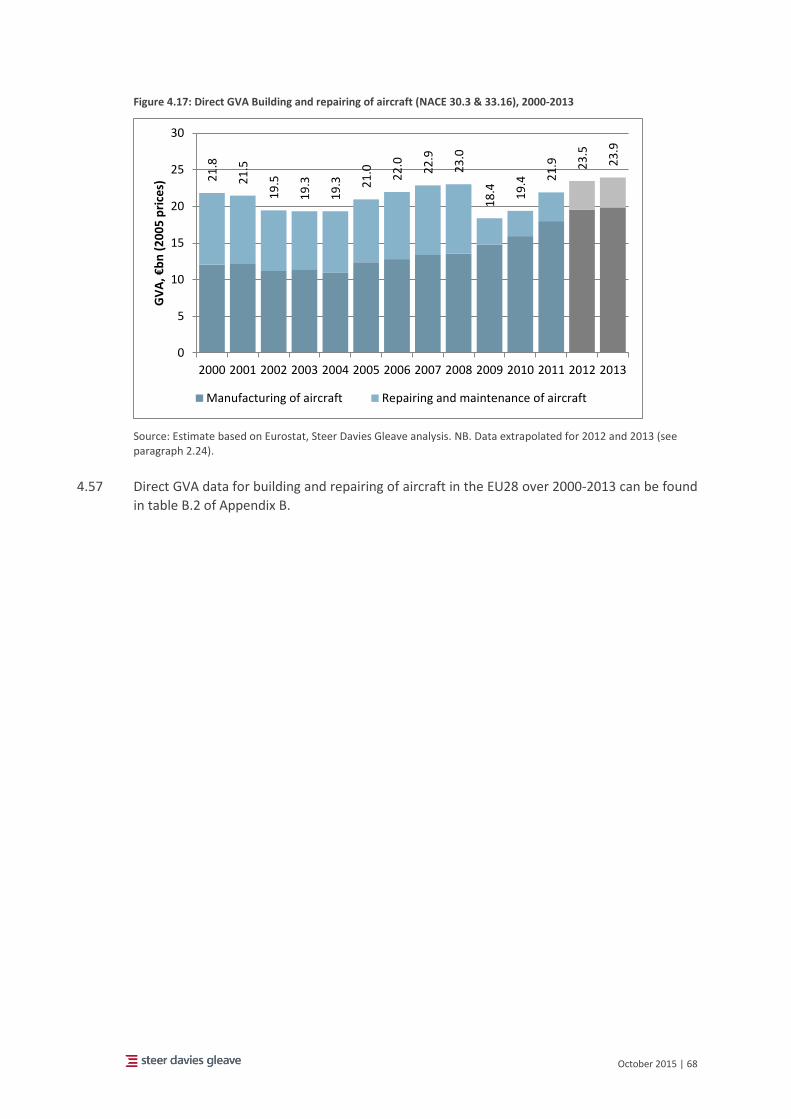
October 2015 | 68
Figure 4.17: Direct GVA Building and repairing of aircraft (NACE 30.3 & 33.16), 2000-2013
Source: Estimate based on Eurostat, Steer Davies Gleave analysis. NB. Data extrapolated for 2012 and 2013 (see paragraph 2.24).
4.57 Direct GVA data for building and repairing of aircraft in the EU28 over 2000-2013 can be found
in table B.2 of Appendix B.
21
.8
21
.5
19
.5
19
.3
19
.3 21
.0 22
.0
22
.9
23
.0
18
.4 19
.4 21
.9 23
.5
23
.9
0
5
10
15
20
25
30
2000 2001 2002 2003 2004 2005 2006 2007 2008 2009 2010 2011 2012 2013
GV
A, €
bn
(2
00
5 p
rice
s)
Manufacturing of aircraft Repairing and maintenance of aircraft
October 2015 | 69
Renting and leasing of aircraft
Direct employment Renting and leasing of aircraft
Approach to determining in-scope direct employment
This sector includes direct employment in the renting and operational leasing of aircraft
without an operator; known as dry leasing.
The in-scope NACE class for this category is L4 (77.35) Renting and leasing of air
transport equipment. This sits within NACE L3 (77.3) Renting and leasing of other
machinery, equipment and tangible goods, which in turn belongs to NACE L2 (77) Rental
and leasing activities.
The availability of data for the in-scope direct employment in this sector is very limited,
but the analysis detailed below provides an indicative view of its size. Renting and
leasing of aircraft employment has been estimated using NACE L4 data (77.35) Renting
and leasing of air transport equipment. Employment over 2000-2013 has been
determined using the following approach:
2012: SBS L4 (77.35) data
Employment in 2012 was estimated by taking the average employment over
2008-2012 recorded in SBS. The average was taken in order to account for data
gaps in the time series.
Employment in the sector for Spain was assumed to be equivalent to that
observed in Italy.
SBS data was not available for Ireland, where this sector is known to be
particularly active. Employment in Ireland was determined ‘bottom-up’ using
desktop research.
2008-2013: LFS L3 trend, based on the 2012 data; and
pre-2008: NA L2 trend applied to LFS.
For Member States where LFS L3 data was not available, the pre-2012 trend has been
based on the NA L2 trend (in line with the approach generally used for the pre-2008
trends throughout this analysis). Employment in 2013 was based on the trend in air
transport employment (Belgium, Bulgaria, Cyprus, Latvia, Slovenia; Italy pre-2011).
For Denmark, employment in 2011 and 2013 was based on the trend in air transport
employment because of data availability. The NA L2 trend was applied to the 2011 data
to estimate direct employment over 2000-2010.
For Member States where NA L2 data was not available, the pre-2008 trend was based
on the trend in air transport employment (Estonia, Ireland, Luxembourg, Poland, Spain,
and Sweden).
For Member States where LFS L3 data was not available, the pre-2012 trend has been
based on the NA L2 trend. Employment in 2013 was based on the trend in air transport
employment (Belgium, Bulgaria, Cyprus, Latvia, Slovenia; Italy pre-2011).
Air transport cluster
Airport-related activities
Outside airports
(a)
Air transport cluster –
inside airports
(b)
Other airport-related
activities(c)
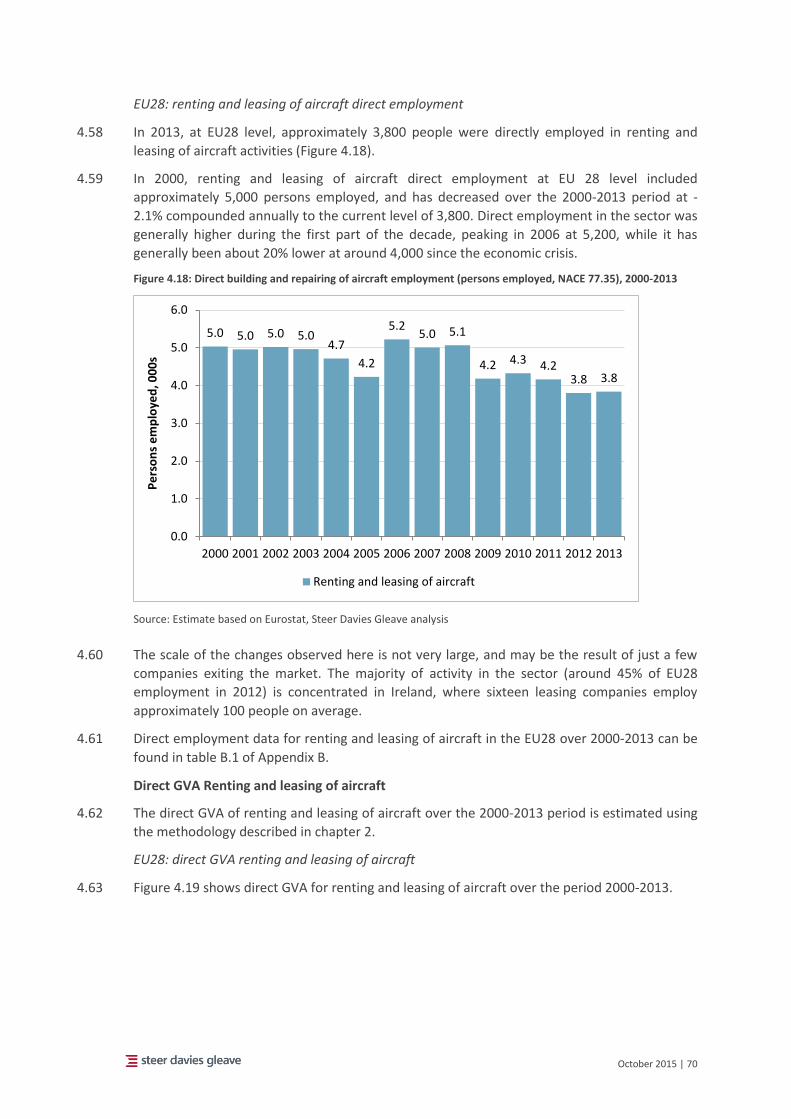
October 2015 | 70
EU28: renting and leasing of aircraft direct employment
4.58 In 2013, at EU28 level, approximately 3,800 people were directly employed in renting and
leasing of aircraft activities (Figure 4.18).
4.59 In 2000, renting and leasing of aircraft direct employment at EU 28 level included
approximately 5,000 persons employed, and has decreased over the 2000-2013 period at -
2.1% compounded annually to the current level of 3,800. Direct employment in the sector was
generally higher during the first part of the decade, peaking in 2006 at 5,200, while it has
generally been about 20% lower at around 4,000 since the economic crisis.
Figure 4.18: Direct building and repairing of aircraft employment (persons employed, NACE 77.35), 2000-2013
Source: Estimate based on Eurostat, Steer Davies Gleave analysis
4.60 The scale of the changes observed here is not very large, and may be the result of just a few
companies exiting the market. The majority of activity in the sector (around 45% of EU28
employment in 2012) is concentrated in Ireland, where sixteen leasing companies employ
approximately 100 people on average.
4.61 Direct employment data for renting and leasing of aircraft in the EU28 over 2000-2013 can be
found in table B.1 of Appendix B.
Direct GVA Renting and leasing of aircraft
4.62 The direct GVA of renting and leasing of aircraft over the 2000-2013 period is estimated using
the methodology described in chapter 2.
EU28: direct GVA renting and leasing of aircraft
4.63 Figure 4.19 shows direct GVA for renting and leasing of aircraft over the period 2000-2013.
5.0 5.0 5.0 5.04.7
4.2
5.25.0 5.1
4.2 4.3 4.23.8 3.8
0.0
1.0
2.0
3.0
4.0
5.0
6.0
2000 2001 2002 2003 2004 2005 2006 2007 2008 2009 2010 2011 2012 2013
Pe
rso
ns
em
plo
yed
, 00
0s
Renting and leasing of aircraft
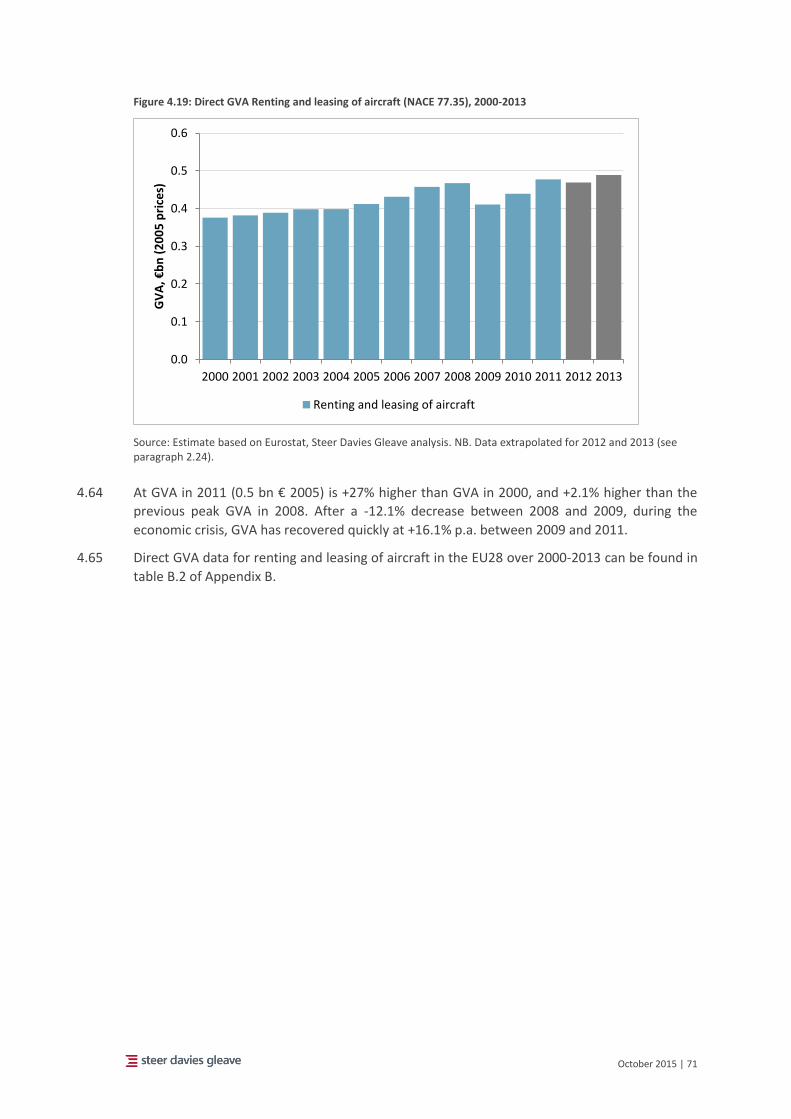
October 2015 | 71
Figure 4.19: Direct GVA Renting and leasing of aircraft (NACE 77.35), 2000-2013
Source: Estimate based on Eurostat, Steer Davies Gleave analysis. NB. Data extrapolated for 2012 and 2013 (see paragraph 2.24).
4.64 At GVA in 2011 (0.5 bn € 2005) is +27% higher than GVA in 2000, and +2.1% higher than the
previous peak GVA in 2008. After a -12.1% decrease between 2008 and 2009, during the
economic crisis, GVA has recovered quickly at +16.1% p.a. between 2009 and 2011.
4.65 Direct GVA data for renting and leasing of aircraft in the EU28 over 2000-2013 can be found in
table B.2 of Appendix B.
0.0
0.1
0.2
0.3
0.4
0.5
0.6
2000 2001 2002 2003 2004 2005 2006 2007 2008 2009 2010 2011 2012 2013
GV
A, €
bn
(2
00
5 p
rice
s)
Renting and leasing of aircraft
October 2015 | 72
Travel agencies and tour operators
Direct employment travel agencies and tour operators
Belgium (74.4%)21 Amadeus statistics22 and industry press23
21 National Bank of Belgium, Working Paper 273, "Economic importance of air transport and airport
activities in Belgium – Report 2012", see https://www.nbb.be/doc/ts/publications/wp/wp273en.pdf
Approach to determining in-scope direct employment
1.1 The travel agencies and tour operators category includes the activities of agencies
primarily engaged in selling and/or arranging travel, tour, transportation and
accommodation services. The in-scope NACE classes for this category are as follows:
NACE L4 (79.11) Travel agency activities; and
NACE L4 (79.12) Tour operator activities.
1.2 Both of these classes sit within NACE L3 (79.1) Travel agency and tour operators
activities, which in turn sits within NACE L2 (79) Travel agency, tour operator and other
reservation service and related activities.
It has not been possible to determine a split between Travel agency activities and Tour
operator activities as L4 data is unavailable within the Labour Force Survey or Structural
Business Statistics. Therefore, it is proposed that employment and GVA data is reported
at the parent NACE L3 class Travel agency and tour operator activities. The two NACE L4
classes listed above are the only classes within the L3 class, meaning that, by reporting
data at L3, additional out-of-scope information is not included.
Despite the fact the L3 class only contains the relevant L4 classes, not all of the data
within this class is in scope. For the purposes of this study, only direct employment
associated with travel agency and tour operator activities directly involving air transport
is included.
Travel agency and tour operator employment has been determined from the NACE L3
data (79.1) Travel agency and tour operators activities. Direct employment over 2000-
2013 has been determined using the approach described in chapter 2 with adjustments
as follows:
2008-2013: LFS L3 (79.1) data;
pre-2008: NA L2 trend; and
in-scope share: employment in travel agency and tour operator activities directly
involving air transport. A factor based on the modal share of overnight trips from
Eurostat tourism data (Number of trips by mode of transport [tour_dem_tttr]) has
been applied to the NACE (L3) employment data for each Member State. These
factors have been estimated for each Member State by using the modal share for air
taken from the data, and adjusting them all in a uniform way, so that the factor
calibrates against the share of travel agencies’ and tour operators’ air transport
activities in Belgium (74.4%)21 and cross checked against Amadeus statistics22 and
reports from industry press23.
Air transport cluster
Airport-related activities
Outside airports
(a)
Air transport cluster –
inside airports
(b)
Other airport-related
activities(c)
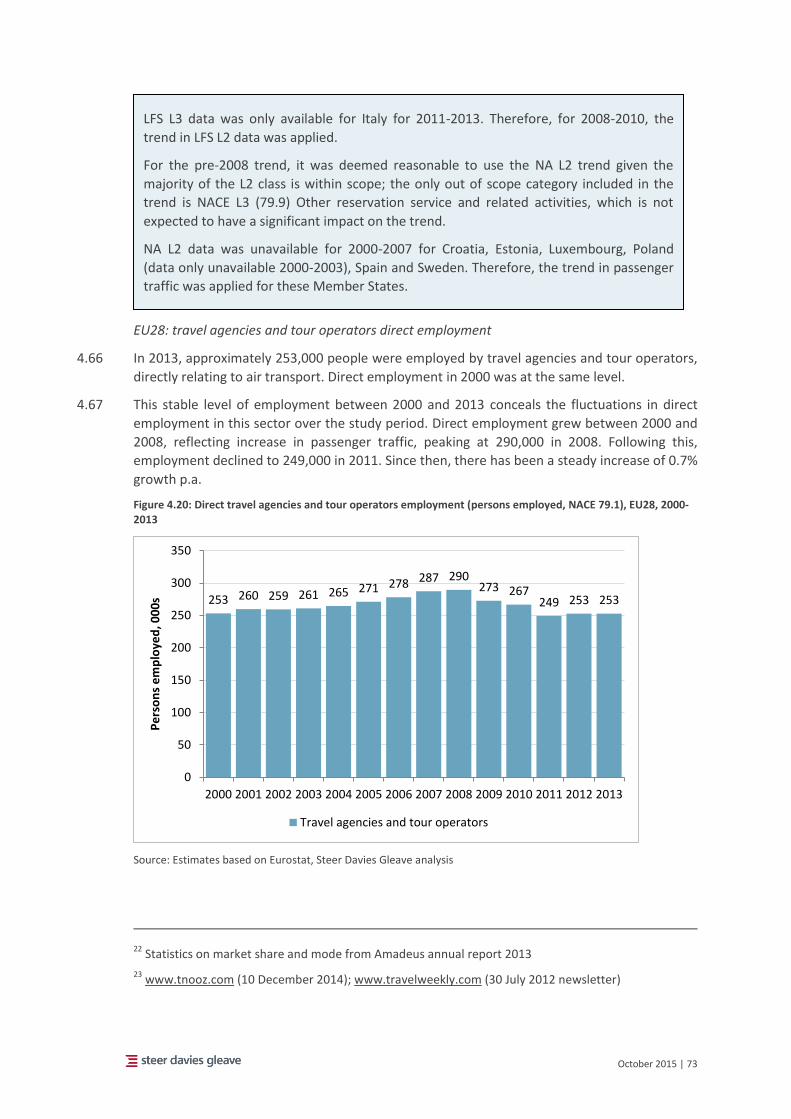
October 2015 | 73
EU28: travel agencies and tour operators direct employment
4.66 In 2013, approximately 253,000 people were employed by travel agencies and tour operators,
directly relating to air transport. Direct employment in 2000 was at the same level.
4.67 This stable level of employment between 2000 and 2013 conceals the fluctuations in direct
employment in this sector over the study period. Direct employment grew between 2000 and
2008, reflecting increase in passenger traffic, peaking at 290,000 in 2008. Following this,
employment declined to 249,000 in 2011. Since then, there has been a steady increase of 0.7%
growth p.a.
Figure 4.20: Direct travel agencies and tour operators employment (persons employed, NACE 79.1), EU28, 2000-2013
Source: Estimates based on Eurostat, Steer Davies Gleave analysis
22 Statistics on market share and mode from Amadeus annual report 2013
23 www.tnooz.com (10 December 2014); www.travelweekly.com (30 July 2012 newsletter)
253 260 259 261 265 271 278 287 290273 267
249 253 253
0
50
100
150
200
250
300
350
2000 2001 2002 2003 2004 2005 2006 2007 2008 2009 2010 2011 2012 2013
Pe
rso
ns
em
plo
yed
, 00
0s
Travel agencies and tour operators
LFS L3 data was only available for Italy for 2011-2013. Therefore, for 2008-2010, the
trend in LFS L2 data was applied.
For the pre-2008 trend, it was deemed reasonable to use the NA L2 trend given the
majority of the L2 class is within scope; the only out of scope category included in the
trend is NACE L3 (79.9) Other reservation service and related activities, which is not
expected to have a significant impact on the trend.
NA L2 data was unavailable for 2000-2007 for Croatia, Estonia, Luxembourg, Poland
(data only unavailable 2000-2003), Spain and Sweden. Therefore, the trend in passenger
traffic was applied for these Member States.
October 2015 | 74
4.68 Direct employment declined from 2008-2011 during the economic crisis, as passenger volumes
also decreased. In more recent years (2012-2013), the gradual recovery in national economies
and increased passenger traffic has been reflected in the slight increase in employment in this
sector.
4.69 The reduction in direct travel agency and tour operator employment has also been a likely
consequence of changes in the travel agency market. In recent years, there has been a decline
in the use of Computer Reservation Systems (CRS), which travel agents use to book airline
tickets for customers. Low cost carriers largely do not use CRS to advertise their fares due to
the cost of registration with the system (although Ryanair announced their partnership with
Amadeus in October 2014). Consequently, with the growth of low cost carriers in the air
transport market, there has been a subsequent decline in the use of CRS by travel agencies.
Instead, a large proportion of travellers (notably in the leisure market) book their travel
independently using the internet, reducing the need for travel agencies24.
4.70 Direct employment data for travel agencies and tour operators (relating to air transport) in the
EU28 over 2000-2013 can be found in table B.1 of Appendix B.
Direct GVA travel agencies and tour operators
4.71 The direct GVA of travel agencies and tour operators employed in air transport over the 2000-
2013 period is estimated using the methodology described in chapter 2.
4.72 In 2011 (the latest year for which data is available across Member States), the direct GVA of
travel agencies and tour operators directly involved in air transport was 14.9 bn €2005. This is
25% lower than the peak of 19.8bn €2005 in 2001. Overall, direct GVA has declined in this
sector during the study period, with GVA lowest during the recession (12.8 bn €2005 in 2010).
However, the higher value in 2011 suggests a slight recovery in the sector.
4.73 Direct GVA data for travel agencies and tour operators (relating to air transport) in the EU28
over 2000-2013 can be found in table B.2 of Appendix B.
24 Steer Davies Gleave (2012) - Mid-term evaluation of Regulation 80/2009 on a code of conduct for
computerised reservation systems and repealing Council Regulation 2299/89 – Final Report
October 2015 | 75
Regulatory administration
Direct employment Regulatory administration
2012 employment study25
EU28: regulatory administration and technical testing direct employment
4.74 In 2013, at EU28 level, approximately 7,000 people were directly employed in aviation
regulatory administration activities (Figure 4.21). This level has reduced from nearly 12,000 in
2000, a reduction of over 40%. However the use of estimates involved in generating these
25 Steer Davies Gleave (2012) - Study on the effects of the implementation of the EU aviation common
market on employment and working conditions in the Air Transport Sector over the period 1997/2010.
Approach to determining in-scope direct employment
Regulatory administration direct employment includes the following activities:
public administration and regulation for a range of different economic sectors
(including transport);
administration of research and development policies and associated funds to
improve economic performance;
administration of general labour affairs; and
implementation of regional development policy measures, e.g. to reduce
unemployment.
The in-scope NACE class for this category are the civil aviation parts of NACE L4 (84.13)
Regulation of and contribution to more efficiency operation of business. This sits within
NACE L3 (84.1) Administration of the State and the economic and social policy of the
community, which in turn sits within NACE L2 (84) Public administration and defence;
compulsory social security.
Out-of-scope activities are included in the NACE L4 class; indeed with the category
including public administration and regulation of eleven economic sectors, the majority
of this class is out-of-scope. Therefore, the on data collected in the 2012 employment
study16 has been drawn upon for the estimates.
Data on employment in regulatory administrative activities was provided by a number of
National Supervisory Authorities for the 2012 study. For those Member States that
provided data, actual employment in regulatory activities was compared to employment
numbers in the parent NACE class (LFS L2). From this comparison the in-scope
percentage of the LFS L2 data for each year was estimated and applied for each Member
State.
Employment over 2000-2013 has been determined using the approach described above
with adjustments as follows:
2008-2013: Application of the relativity of 2012 study data (0.1% of public
administration sector) to LFS L2 (84);
pre-2008: NA L2 trend; and
in-scope share: None required.
Air transport cluster
Airport-related activities
Outside airports
(a)
Air transport cluster –
inside airports
(b)
Other airport-related
activities(c)
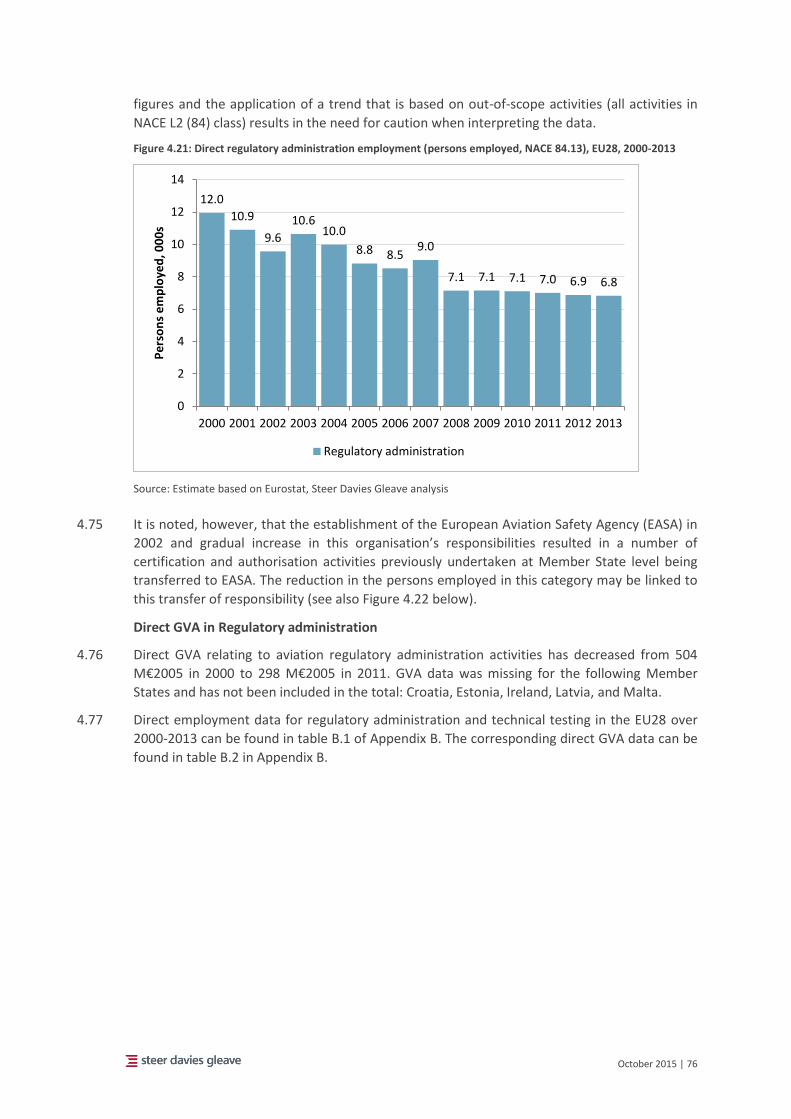
October 2015 | 76
figures and the application of a trend that is based on out-of-scope activities (all activities in
NACE L2 (84) class) results in the need for caution when interpreting the data.
Figure 4.21: Direct regulatory administration employment (persons employed, NACE 84.13), EU28, 2000-2013
Source: Estimate based on Eurostat, Steer Davies Gleave analysis
4.75 It is noted, however, that the establishment of the European Aviation Safety Agency (EASA) in
2002 and gradual increase in this organisation’s responsibilities resulted in a number of
certification and authorisation activities previously undertaken at Member State level being
transferred to EASA. The reduction in the persons employed in this category may be linked to
this transfer of responsibility (see also Figure 4.22 below).
Direct GVA in Regulatory administration
4.76 Direct GVA relating to aviation regulatory administration activities has decreased from 504
M€2005 in 2000 to 298 M€2005 in 2011. GVA data was missing for the following Member
States and has not been included in the total: Croatia, Estonia, Ireland, Latvia, and Malta.
4.77 Direct employment data for regulatory administration and technical testing in the EU28 over
2000-2013 can be found in table B.1 of Appendix B. The corresponding direct GVA data can be
found in table B.2 in Appendix B.
12.0
10.9
9.6
10.610.0
8.8 8.59.0
7.1 7.1 7.1 7.0 6.9 6.8
0
2
4
6
8
10
12
14
2000 2001 2002 2003 2004 2005 2006 2007 2008 2009 2010 2011 2012 2013
Pe
rso
ns
em
plo
yed
, 00
0s
Regulatory administration
October 2015 | 77
Activities of extraterritorial organisations and bodies
Direct employment Activities of extraterritorial organisations and bodies
EU28: aviation extraterritorial organisations and bodies direct employment
4.78 Figure 4.22 shows direct employment in civil aviation extraterritorial organisations in the EU.
Due to the small number of Member States with employment in this category, employment
has been shown by Member State. EUROCONTROL employment can be seen in Belgium,
Luxembourg, the Netherlands and France. EASA employees are based in Germany.
4.79 Employment at EU28 level has grown from approximately 2,100 in 2000 to 2,500 in 2013. At
EUROCONTROL, total employment has reduced over the 2000 - 2013 period, by -20.4%. Since
its establishment in 2002, employment at EASA has steadily grown over the years to
approximately 650 employees in 2013.
4.80 EASA’s responsibilities include the following activities26:
Rulemaking: drafting aviation safety legislation and providing technical advice to the
European Commission and to the Member States;
26 EASA, www.easa.europa.eu, accessed 22 April 2015.
Approach to determining in-scope direct employment
Direct extraterritorial employment includes activities of international organisations (e.g.
the United Nations) and the specialised agencies of the United Nations system, regional
bodies, the International Monetary Fund, the World Bank, the Organisation for Economic
Co-operation and Development, the European Communities, the European Free Trade
Association, etc.
The in-scope NACE class for this category are the civil aviation parts of NACE L2/L3/L4
(99.00) Activities of extraterritorial organisations and bodies.
Out-of-scope activities are included in the NACE L2 class; indeed, due to the small
number of in-scope activities relevant to civil aviation, this employment category was
estimated using a bottom up approach. There are two main extraterritorial organisations
with a civil aviation focus in the EU: the European Organisation for the Safety of Air
Navigation (EUROCONTROL) and the European Aviation Safety Agency (EASA).
EUROCONTROL’s main office is in Brussels, Belgium, and the organisation has three
additional sites: a research centre just outside of Paris, France, the Maastricht Upper Air
Control centre in the Netherlands, and a small training centre in Luxembourg. EASA is
based in Cologne, Germany.
Direct employment over 2000-2013 has been determined by reviewing employee data
provided in the annual reports of EUROCONTROL (including separate reports on EEA, the
research centre in France) and EASA. The number of MUAC employees has been
estimated using Air Traffic Management Cost-Effectiveness (ACE) data provided by
EUROCONTROL.
Air transport cluster
Airport-related activities
Outside airports
(a)
Air transport cluster –
inside airports
(b)
Other airport-related
activities(c)
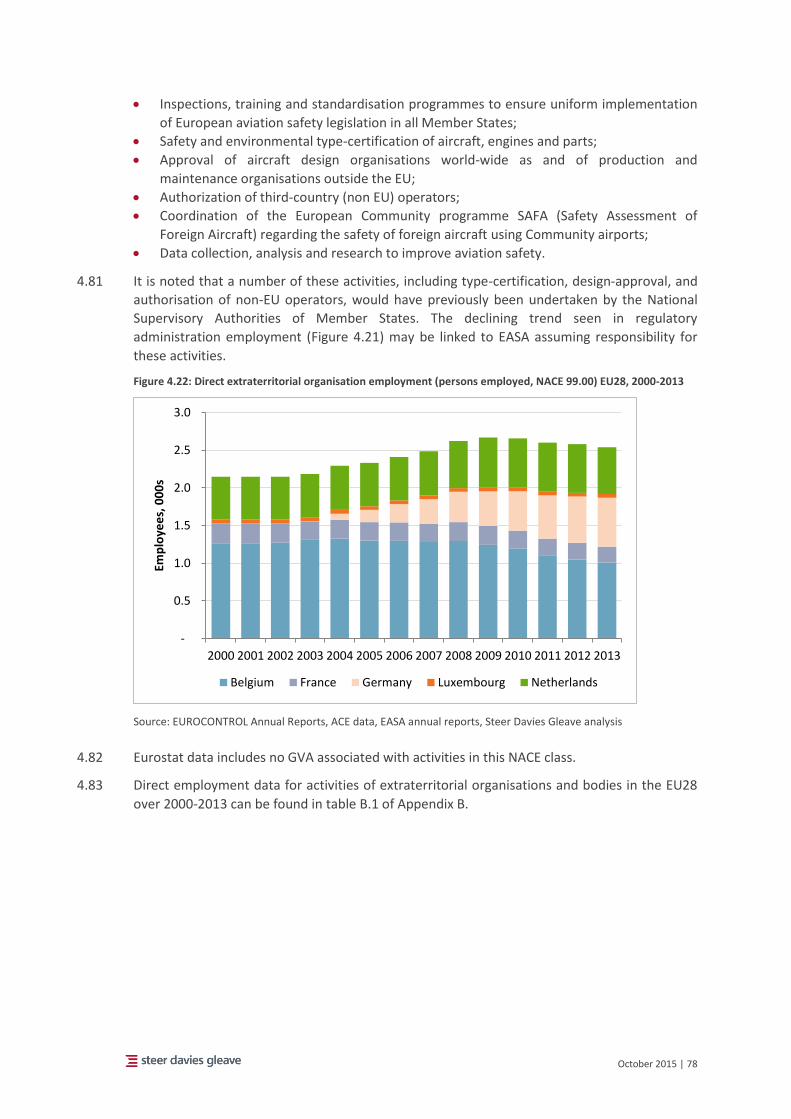
October 2015 | 78
Inspections, training and standardisation programmes to ensure uniform implementation
of European aviation safety legislation in all Member States;
Safety and environmental type-certification of aircraft, engines and parts;
Approval of aircraft design organisations world-wide as and of production and
maintenance organisations outside the EU;
Authorization of third-country (non EU) operators;
Coordination of the European Community programme SAFA (Safety Assessment of
Foreign Aircraft) regarding the safety of foreign aircraft using Community airports;
Data collection, analysis and research to improve aviation safety.
4.81 It is noted that a number of these activities, including type-certification, design-approval, and
authorisation of non-EU operators, would have previously been undertaken by the National
Supervisory Authorities of Member States. The declining trend seen in regulatory
administration employment (Figure 4.21) may be linked to EASA assuming responsibility for
these activities.
Figure 4.22: Direct extraterritorial organisation employment (persons employed, NACE 99.00) EU28, 2000-2013
Source: EUROCONTROL Annual Reports, ACE data, EASA annual reports, Steer Davies Gleave analysis
4.82 Eurostat data includes no GVA associated with activities in this NACE class.
4.83 Direct employment data for activities of extraterritorial organisations and bodies in the EU28
over 2000-2013 can be found in table B.1 of Appendix B.
-
0.5
1.0
1.5
2.0
2.5
3.0
2000 2001 2002 2003 2004 2005 2006 2007 2008 2009 2010 2011 2012 2013
Emp
loye
es,
00
0s
Belgium France Germany Luxembourg Netherlands
October 2015 | 79
Operation of flying schools
Direct employment Operation of flying schools
EU28: operation of flying schools direct employment
4.84 In 2013, at EU28 level, approximately 4,700 people were directly employed in flying school
activities (Figure 4.23). This level has reduced from nearly 5,300 in 2000, a reduction of -12%,
and is down from over 6,400 at its peak in 2007. However, the use of estimates involved in
generating these figures and the application of a trend that is based on out-of-scope activities
(all activities in NACE L2 (85) class) results in the need for caution when interpreting the data.
Approach to determining in-scope direct employment
Direct flying school employment is classified alongside a wide range of educational
activities (NACE L2 (85) Education). In-scope direct employment for this category can be
found under two NACE classes:
Flying parts of NACE L4 (85.32) Technical and vocational secondary education, within
NACE L3 (85.3) Secondary education; and
Flying parts of NACE L4 (85.53) Driving school activities, within NACE L3 (85.5) Other
education.
Out-of-scope activities are included in the NACE L4 classes; indeed with the categories
including vocational training across all industries and driving instruction across all
transport modes, the majority of both classes is out of scope. Therefore data collected in
the 2012 employment study and desktop research of flying instructor licensing was
drawn upon for the estimates.
Data on direct employment in flying schools was provided by a number of National
Supervisory Authorities for the 2012 study. For those Member States that provided data,
actual employment in regulatory activities was compared to employment numbers in the
parent NACE class (LFS L2). From this comparison the in-scope percentage of the LFS L2
data for each year was estimated and applied for each Member State. This was cross-
checked against the number of flying instructor ratings issued or renewed by the UK CAA
in recent years.
Employment over 2000-2013 has been determined using the approach described above
with adjustments as follows:
2008-2013: Application of the relativity of 2012 study data (0.04% of education
sector) to LFS L2 (85);
pre-2008: NA L2 trend; and
in-scope share: None required.
Air transport cluster
Airport-related activities
Outside airports
(a)
Air transport cluster –
inside airports
(b)
Other airport-related
activities(c)
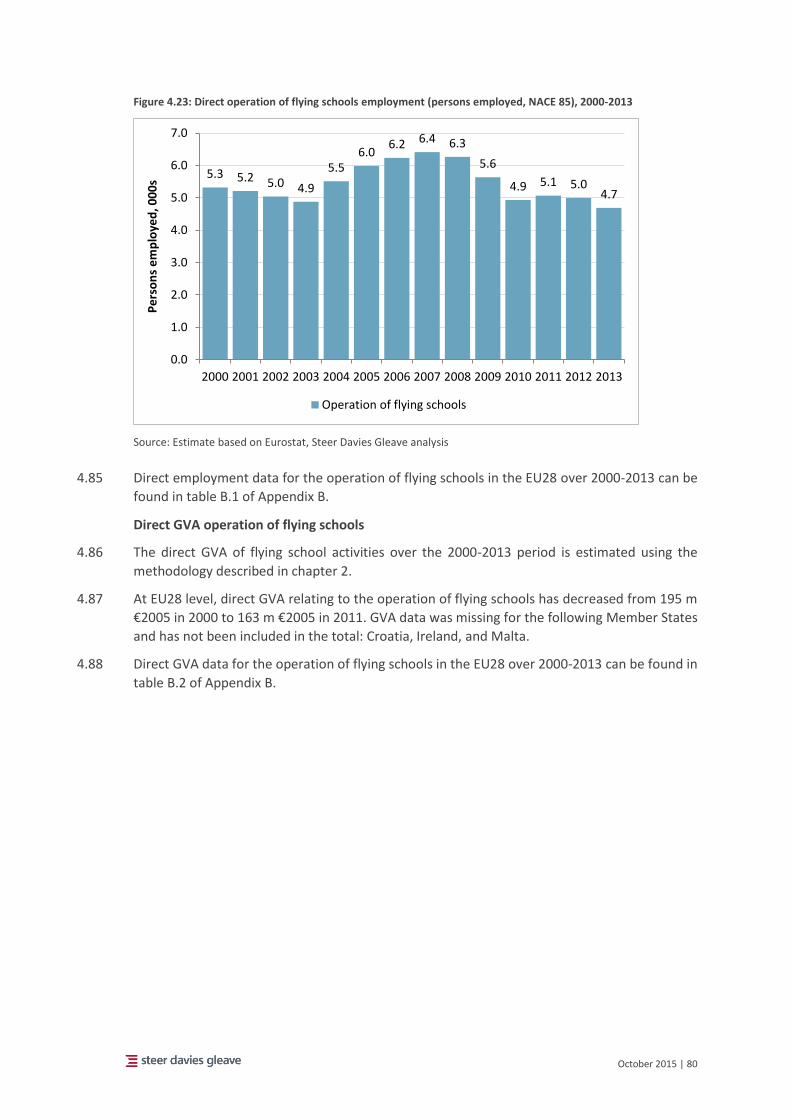
October 2015 | 80
Figure 4.23: Direct operation of flying schools employment (persons employed, NACE 85), 2000-2013
Source: Estimate based on Eurostat, Steer Davies Gleave analysis
4.85 Direct employment data for the operation of flying schools in the EU28 over 2000-2013 can be
found in table B.1 of Appendix B.
Direct GVA operation of flying schools
4.86 The direct GVA of flying school activities over the 2000-2013 period is estimated using the
methodology described in chapter 2.
4.87 At EU28 level, direct GVA relating to the operation of flying schools has decreased from 195 m
€2005 in 2000 to 163 m €2005 in 2011. GVA data was missing for the following Member States
and has not been included in the total: Croatia, Ireland, and Malta.
4.88 Direct GVA data for the operation of flying schools in the EU28 over 2000-2013 can be found in
table B.2 of Appendix B.
5.3 5.2 5.0 4.9
5.56.0
6.2 6.4 6.3
5.6
4.9 5.1 5.04.7
0.0
1.0
2.0
3.0
4.0
5.0
6.0
7.0
2000 2001 2002 2003 2004 2005 2006 2007 2008 2009 2010 2011 2012 2013
Pe
rso
ns
em
plo
yed
, 00
0s
Operation of flying schools
October 2015 | 81
Airport-related activities cluster: direct employment and GVA
4.89 As described in the Chapter 2, direct employment in the airport-related cluster includes all
activities undertaken within the perimeter of each airport. These activities comprise the
facilities necessary for air traffic to operate and all the services and industries that contribute
to ensuring these facilities work smoothly, or which use the facilities.
4.90 In addition to the activities covered by the air transport cluster (mostly airside), the other
airport-related activities sub-cluster (c) may comprise many landside activities carried out
within the geographical limits of airports, including:
trade activities;
passenger and freight transport over land;
cargo handling and storage;
accommodation, food and beverage services;
security and cleaning services for buildings;
airport-related public services; and
other airport-related industries and services.
Direct employment airport related-activities cluster
4.91 Direct employment in the airport-related activities cluster at EU-wide level is estimated for
2013 and amounts to approximately 1.26 million persons employed, based on the analysis of
data collected from airports and airlines, as detailed in the sections below.
Direct GVA airport related-activities cluster
4.92 Estimates for the associated GVA for the cluster are developed separately for air transport
activities inside airports (sub-cluster (b)) and other airport-related activities (sub-cluster (c))
using the NACE-based approach described in chapter 2 and Appendix A. The definition of sub-
clusters (b) and (c) is described in the sections below. Value added in the airport-related
activities cluster at EU-wide level is estimated for 2013 and amounts to approximately 66.8
bn €2005.
Estimating direct employment in airport-related activities
Inputs
4.93 This analysis relies on inputs for direct employment on airport campuses which have been
sourced in the following ways:
Airport responses to the quantitative questionnaire part of the stakeholder consultation;
Other materials provided by airports (e.g. their own employment surveys or reports, data
provided to the Airports Council International (ACI) study);
Desktop research (primarily airport annual reports); and
Airline responses to the quantitative questionnaire.
Availability of data
4.94 The study aimed to assemble a representative panel of 40 airports across the EU, which would
contribute to quantifying direct employment at airports across the EU.
16 airports provided responses to the questionnaire;
4 airports provided alternative materials, three of which provided the data previously
given for the ACI study;
Air transport cluster
Airport-related activities
Outside airports
(a)
Air transport cluster –
inside airports
(b)
Other airport-related
activities(c)
Air transport cluster
Airport-related activities
Outside airports
(a)
Air transport cluster –
inside airports
(b)
Other airport-related
activities(c)
October 2015 | 82
Data for 10 airports was collected through desktop research; and
7 major airlines also contributed data on employment.
4.95 The airport data available covers 20 out of the 28 Member States. The sample of airports
selected to form the airports panel covers approximately 73% of EU passenger traffic in 2013.
Airports from which data was collected cover approximately 53% of EU passenger traffic in
2013 (or 72% of the planned sample). The data collected also covers a mix of different types of
airports, with large hub airports, smaller airports and cargo-focussed airports included.
Quality of data
4.96 There exists large variation in the completeness of the data made available for this study. The
main limitations include the extent to which the data provides:
A breakdown across activities in the airport campus, and within that the detail around
ground-handling activities; and
Coverage of third party employment at the airport, in addition to direct employment
relating to the airport company.
4.97 Mostly complete data was received from Athens, Brussels, Barcelona and Madrid airports
only.
Analysis for developing the direct employment estimates for airport-related activities
4.98 The aim of this analysis is to estimate direct employment at airports at a EU-wide level and
provide the breakdown across the relevant in-scope activities.
4.99 At a high level, the approach follows a four-step process:
1. Extrapolating direct employment from airport(s)-level to total direct employment for the
Member State across all its airports.
2. Estimating direct employment at Member State level for States where no airport data is
available.
3. Adjusting direct employment for third parties at Member State level where third parties
are not included in the base data.
4. Assigning direct employment to the relevant airport-related activities.
Step 1: Extrapolating direct employment from airport(s)-level to total direct employment for
the Member State across all its airports
4.100 The airport data collected generally covers Member States’ main airport(s). The extrapolation
of employment then seeks to take employment at one or two main airports in a MS and
extends it to cover all airports in that MS.
4.101 Smaller airports will tend to be less efficient than larger airports in terms of their persons
employed-to-passenger ratio (i.e. this ratio will be higher for smaller airports than larger ones),
as economies of scale will not be realised as readily at smaller airports and minimum levels of
staffing set a fixed base level of employment for providing airport services.
4.102 Total employment from airport(s) for which data is available is extrapolated to Member State-
level based on the relationship between passenger traffic at the airport(s) and overall for the
State. This relationship is adjusted by a multiplier of 1.1 for the remaining (smaller) airports, to
account for the higher persons employed-to-passenger ratio at these smaller airports.
October 2015 | 83
4.103 The value of the multiplier applied to the extrapolation has been estimated based on analysis
of countries where employment data for more than one airport is available. This analysis
provides a multiplier range between 1.0 and 1.3.
Step 2: Estimating direct employment at Member State-level for States where no airport data
is available
4.104 For Member States where airport-level data is not available, direct employment has been
estimated at country-level based on the average passengers per persons employed ratio
derived from Step 1 results for States (6) with more reliable data.
4.105 The ratio applied is 1.24 thousand passengers per persons employed (including third party
employment). This is applied to the total passengers for the State to estimate total persons
employed in airports for that State.
Step 3: Adjusting direct employment for third parties at Member State-level where these are
not included in the base data
4.106 An adjustment is applied to the direct employment estimates for Member States where the
analysis does not include persons employed in airports by third party organisations because it
is not available in the data collected. The adjustment is based on the range of third party
employment as a share total airport employment (80%) from States (4) with more reliable
data.
4.107 The results at this step provide an estimate for EU-wide total direct employment for the
airport-related activities cluster. This amounts to approximately 900,000 persons employed at
airports in the EU.
Step 4: Assigning direct employment to the relevant airport-related activities
4.108 It is necessary to estimate the breakdown of direct employment across the relevant airport-
related activities for three reasons:
Separate estimates of direct employment for sub-clusters (b) and (c) are required, and
hence the extent to which the air transport cluster and the airport-related activities
cluster overlap;
To provide estimates for the breakdown of ground handling activities, as requested in the
ToR (see Chapter 6: Figure 6.10); and
To facilitate the calculation of indirect employment in the related sectors.
4.109 The EU-level total direct employment estimate given in Step 3 above, is assigned across the
different activities based on the average distribution of employment at airports taken from
States (5) where airports provided complete or near-complete employment data.
4.110 The analysis is supplemented by the responses provided by the airlines. The data on ground
handling activities that are in-sourced at airlines facilitates the estimation of direct
employment in sub-cluster (b) (i.e. air transport cluster activities inside airports). Data
provided by the airlines responding to the quantitative questionnaire suggests that ground
handling activities account for between 0% (fully outsourced) and 20% of persons employed
by airlines.
Checks
4.111 There are a limited number of checks that can be undertaken on these results.
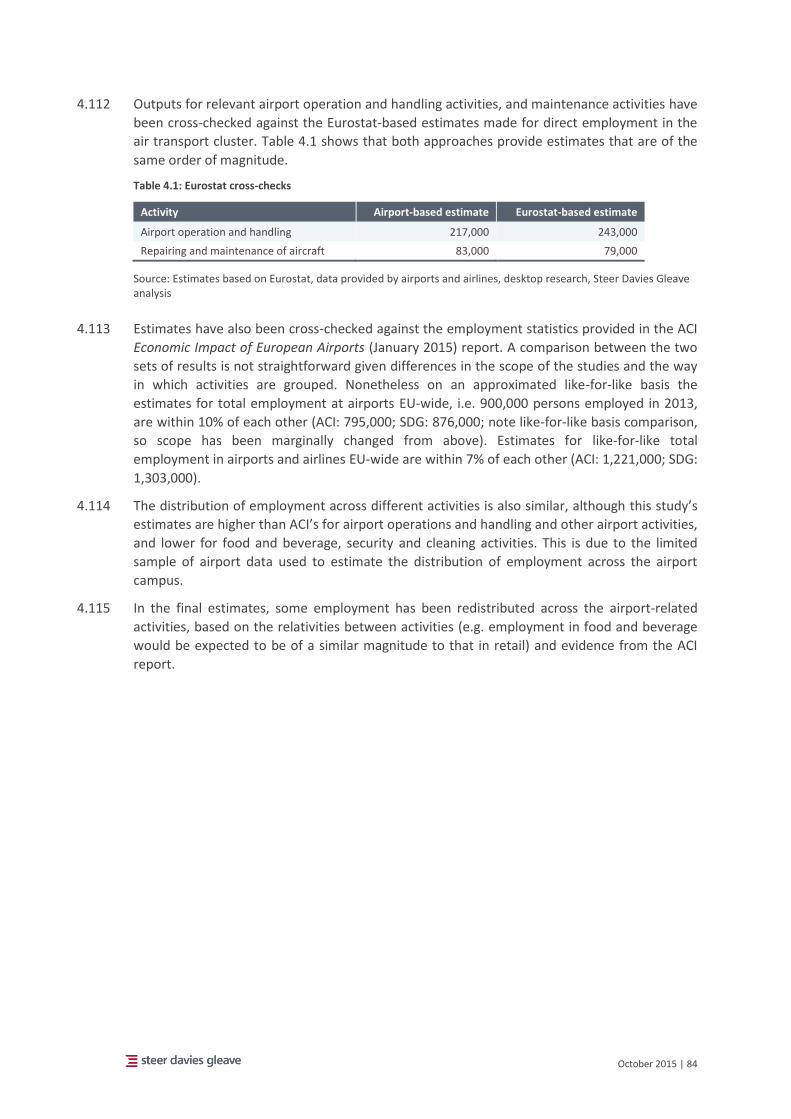
October 2015 | 84
4.112 Outputs for relevant airport operation and handling activities, and maintenance activities have
been cross-checked against the Eurostat-based estimates made for direct employment in the
air transport cluster. Table 4.1 shows that both approaches provide estimates that are of the
same order of magnitude.
Table 4.1: Eurostat cross-checks
Activity Airport-based estimate Eurostat-based estimate
Airport operation and handling 217,000 243,000
Repairing and maintenance of aircraft 83,000 79,000
Source: Estimates based on Eurostat, data provided by airports and airlines, desktop research, Steer Davies Gleave analysis
4.113 Estimates have also been cross-checked against the employment statistics provided in the ACI
Economic Impact of European Airports (January 2015) report. A comparison between the two
sets of results is not straightforward given differences in the scope of the studies and the way
in which activities are grouped. Nonetheless on an approximated like-for-like basis the
estimates for total employment at airports EU-wide, i.e. 900,000 persons employed in 2013,
are within 10% of each other (ACI: 795,000; SDG: 876,000; note like-for-like basis comparison,
so scope has been marginally changed from above). Estimates for like-for-like total
employment in airports and airlines EU-wide are within 7% of each other (ACI: 1,221,000; SDG:
1,303,000).
4.114 The distribution of employment across different activities is also similar, although this study’s
estimates are higher than ACI’s for airport operations and handling and other airport activities,
and lower for food and beverage, security and cleaning activities. This is due to the limited
sample of airport data used to estimate the distribution of employment across the airport
campus.
4.115 In the final estimates, some employment has been redistributed across the airport-related
activities, based on the relativities between activities (e.g. employment in food and beverage
would be expected to be of a similar magnitude to that in retail) and evidence from the ACI
report.
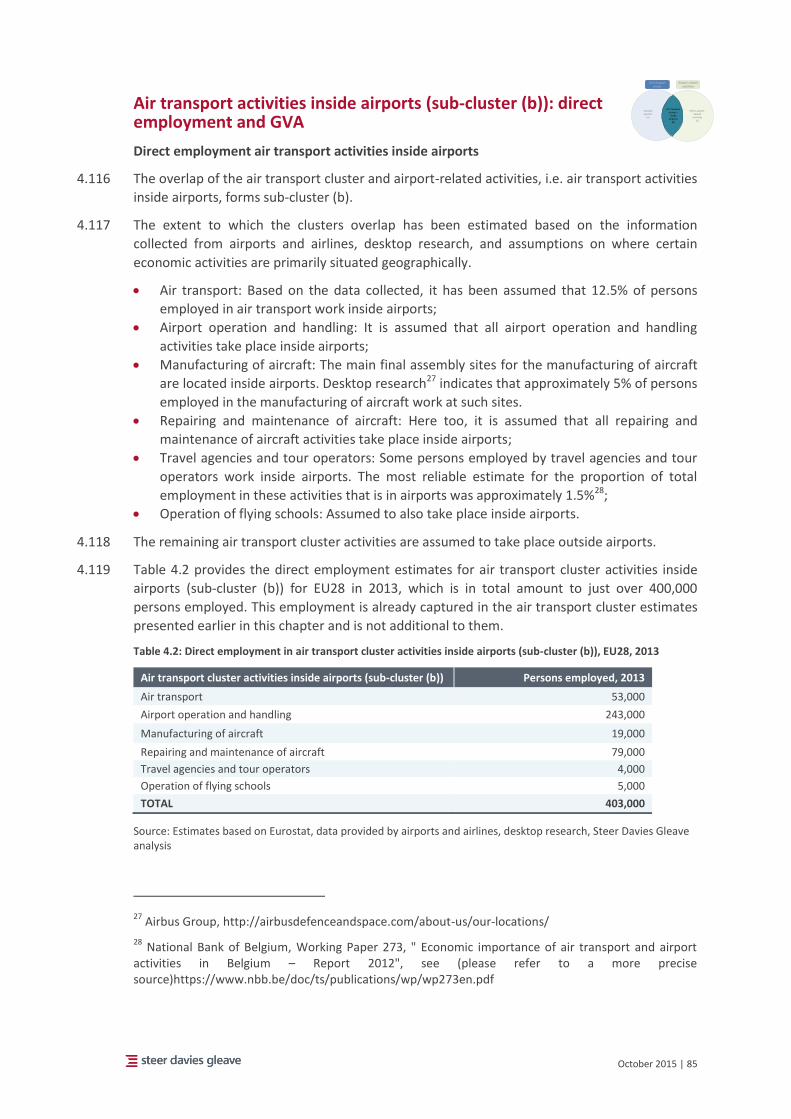
October 2015 | 85
Air transport activities inside airports (sub-cluster (b)): direct employment and GVA
Direct employment air transport activities inside airports
4.116 The overlap of the air transport cluster and airport-related activities, i.e. air transport activities
inside airports, forms sub-cluster (b).
4.117 The extent to which the clusters overlap has been estimated based on the information
collected from airports and airlines, desktop research, and assumptions on where certain
economic activities are primarily situated geographically.
Air transport: Based on the data collected, it has been assumed that 12.5% of persons
employed in air transport work inside airports;
Airport operation and handling: It is assumed that all airport operation and handling
activities take place inside airports;
Manufacturing of aircraft: The main final assembly sites for the manufacturing of aircraft
are located inside airports. Desktop research27 indicates that approximately 5% of persons
employed in the manufacturing of aircraft work at such sites.
Repairing and maintenance of aircraft: Here too, it is assumed that all repairing and
maintenance of aircraft activities take place inside airports;
Travel agencies and tour operators: Some persons employed by travel agencies and tour
operators work inside airports. The most reliable estimate for the proportion of total
employment in these activities that is in airports was approximately 1.5%28;
Operation of flying schools: Assumed to also take place inside airports.
4.118 The remaining air transport cluster activities are assumed to take place outside airports.
4.119 Table 4.2 provides the direct employment estimates for air transport cluster activities inside
airports (sub-cluster (b)) for EU28 in 2013, which is in total amount to just over 400,000
persons employed. This employment is already captured in the air transport cluster estimates
presented earlier in this chapter and is not additional to them.
Table 4.2: Direct employment in air transport cluster activities inside airports (sub-cluster (b)), EU28, 2013
Air transport cluster activities inside airports (sub-cluster (b)) Persons employed, 2013
Air transport 53,000
Airport operation and handling 243,000
Manufacturing of aircraft 19,000
Repairing and maintenance of aircraft 79,000
Travel agencies and tour operators 4,000
Operation of flying schools 5,000
TOTAL 403,000
Source: Estimates based on Eurostat, data provided by airports and airlines, desktop research, Steer Davies Gleave analysis
27 Airbus Group, http://airbusdefenceandspace.com/about-us/our-locations/
28 National Bank of Belgium, Working Paper 273, " Economic importance of air transport and airport
activities in Belgium – Report 2012", see (please refer to a more precise source)https://www.nbb.be/doc/ts/publications/wp/wp273en.pdf
Air transport cluster
Airport-related activities
Outside airports
(a)
Other airport-related
activities(c)
Air transport cluster –
inside airports
(b)
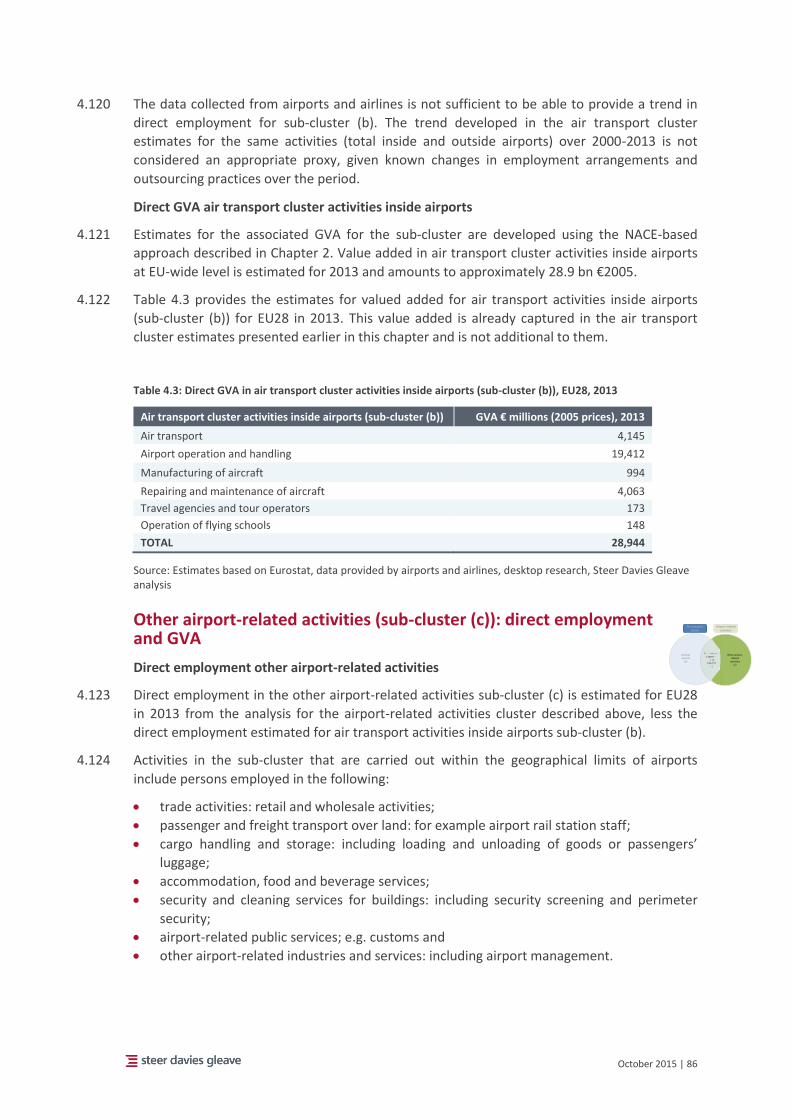
October 2015 | 86
4.120 The data collected from airports and airlines is not sufficient to be able to provide a trend in
direct employment for sub-cluster (b). The trend developed in the air transport cluster
estimates for the same activities (total inside and outside airports) over 2000-2013 is not
considered an appropriate proxy, given known changes in employment arrangements and
outsourcing practices over the period.
Direct GVA air transport cluster activities inside airports
4.121 Estimates for the associated GVA for the sub-cluster are developed using the NACE-based
approach described in Chapter 2. Value added in air transport cluster activities inside airports
at EU-wide level is estimated for 2013 and amounts to approximately 28.9 bn €2005.
4.122 Table 4.3 provides the estimates for valued added for air transport activities inside airports
(sub-cluster (b)) for EU28 in 2013. This value added is already captured in the air transport
cluster estimates presented earlier in this chapter and is not additional to them.
Table 4.3: Direct GVA in air transport cluster activities inside airports (sub-cluster (b)), EU28, 2013
Air transport cluster activities inside airports (sub-cluster (b)) GVA € millions (2005 prices), 2013
Air transport 4,145
Airport operation and handling 19,412
Manufacturing of aircraft 994
Repairing and maintenance of aircraft 4,063
Travel agencies and tour operators 173
Operation of flying schools 148
TOTAL 28,944
Source: Estimates based on Eurostat, data provided by airports and airlines, desktop research, Steer Davies Gleave analysis
Other airport-related activities (sub-cluster (c)): direct employment and GVA
Direct employment other airport-related activities
4.123 Direct employment in the other airport-related activities sub-cluster (c) is estimated for EU28
in 2013 from the analysis for the airport-related activities cluster described above, less the
direct employment estimated for air transport activities inside airports sub-cluster (b).
4.124 Activities in the sub-cluster that are carried out within the geographical limits of airports
include persons employed in the following:
trade activities: retail and wholesale activities;
passenger and freight transport over land: for example airport rail station staff;
cargo handling and storage: including loading and unloading of goods or passengers’
luggage;
accommodation, food and beverage services;
security and cleaning services for buildings: including security screening and perimeter
security;
airport-related public services; e.g. customs and
other airport-related industries and services: including airport management.
Air transport cluster
Airport-related activities
Outside airports
(a)
Other airport-related
activities(c)
Air transport cluster –
inside airports
(b)
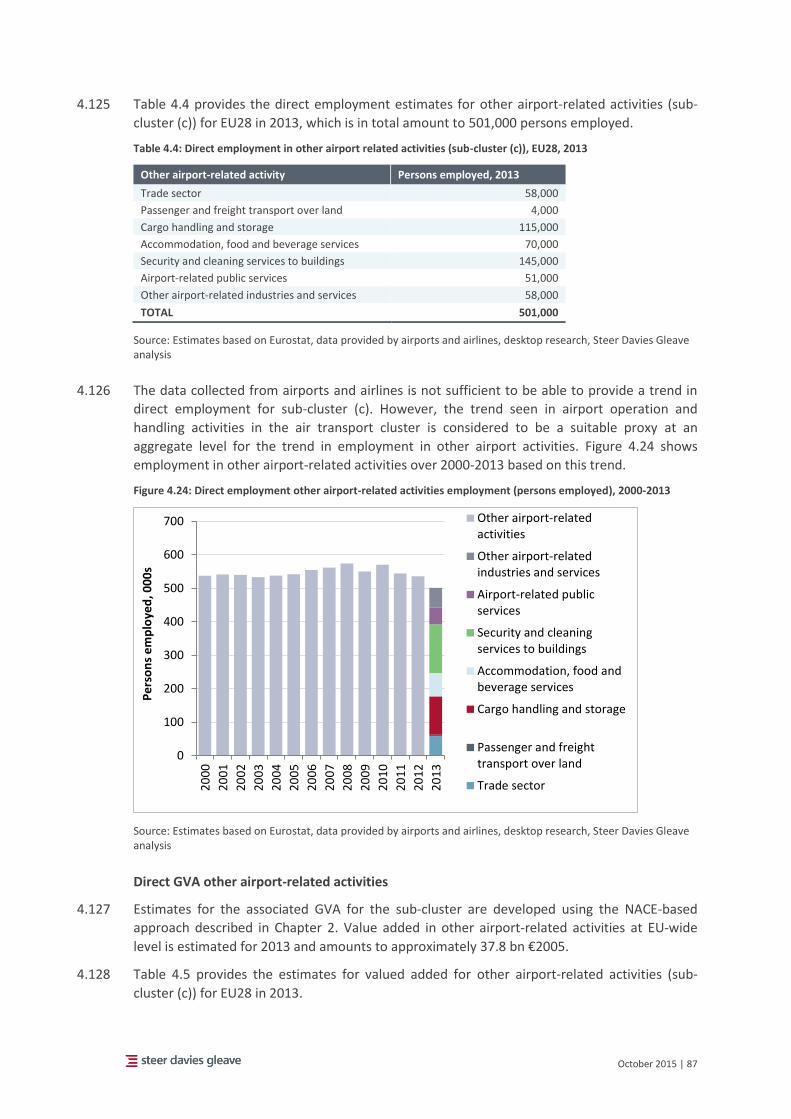
October 2015 | 87
4.125 Table 4.4 provides the direct employment estimates for other airport-related activities (sub-
cluster (c)) for EU28 in 2013, which is in total amount to 501,000 persons employed.
Table 4.4: Direct employment in other airport related activities (sub-cluster (c)), EU28, 2013
Other airport-related activity Persons employed, 2013
Trade sector 58,000
Passenger and freight transport over land 4,000
Cargo handling and storage 115,000
Accommodation, food and beverage services 70,000
Security and cleaning services to buildings 145,000
Airport-related public services 51,000
Other airport-related industries and services 58,000
TOTAL 501,000
Source: Estimates based on Eurostat, data provided by airports and airlines, desktop research, Steer Davies Gleave analysis
4.126 The data collected from airports and airlines is not sufficient to be able to provide a trend in
direct employment for sub-cluster (c). However, the trend seen in airport operation and
handling activities in the air transport cluster is considered to be a suitable proxy at an
aggregate level for the trend in employment in other airport activities. Figure 4.24 shows
employment in other airport-related activities over 2000-2013 based on this trend.
Figure 4.24: Direct employment other airport-related activities employment (persons employed), 2000-2013
Source: Estimates based on Eurostat, data provided by airports and airlines, desktop research, Steer Davies Gleave analysis
Direct GVA other airport-related activities
4.127 Estimates for the associated GVA for the sub-cluster are developed using the NACE-based
approach described in Chapter 2. Value added in other airport-related activities at EU-wide
level is estimated for 2013 and amounts to approximately 37.8 bn €2005.
4.128 Table 4.5 provides the estimates for valued added for other airport-related activities (sub-
cluster (c)) for EU28 in 2013.
0
100
200
300
400
500
600
700
20
00
20
01
20
02
20
03
20
04
20
05
20
06
20
07
20
08
20
09
20
10
20
11
20
12
20
13
Pe
rso
ns
em
plo
yed
, 00
0s
Other airport-relatedactivities
Other airport-relatedindustries and services
Airport-related publicservices
Security and cleaningservices to buildings
Accommodation, food andbeverage services
Cargo handling and storage
Passenger and freighttransport over land
Trade sector
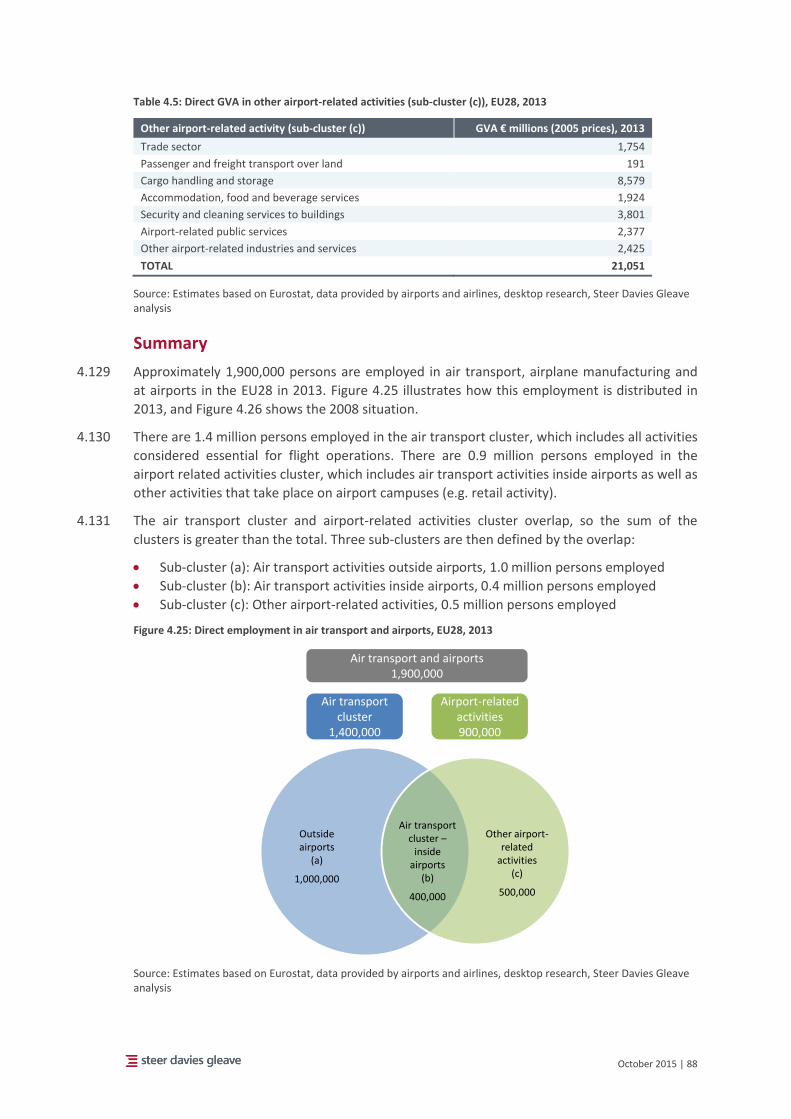
October 2015 | 88
Table 4.5: Direct GVA in other airport-related activities (sub-cluster (c)), EU28, 2013
Other airport-related activity (sub-cluster (c)) GVA € millions (2005 prices), 2013
Trade sector 1,754
Passenger and freight transport over land 191
Cargo handling and storage 8,579
Accommodation, food and beverage services 1,924
Security and cleaning services to buildings 3,801
Airport-related public services 2,377
Other airport-related industries and services 2,425
TOTAL 21,051
Source: Estimates based on Eurostat, data provided by airports and airlines, desktop research, Steer Davies Gleave analysis
Summary
4.129 Approximately 1,900,000 persons are employed in air transport, airplane manufacturing and
at airports in the EU28 in 2013. Figure 4.25 illustrates how this employment is distributed in
2013, and Figure 4.26 shows the 2008 situation.
4.130 There are 1.4 million persons employed in the air transport cluster, which includes all activities
considered essential for flight operations. There are 0.9 million persons employed in the
airport related activities cluster, which includes air transport activities inside airports as well as
other activities that take place on airport campuses (e.g. retail activity).
4.131 The air transport cluster and airport-related activities cluster overlap, so the sum of the
clusters is greater than the total. Three sub-clusters are then defined by the overlap:
Sub-cluster (a): Air transport activities outside airports, 1.0 million persons employed
Sub-cluster (b): Air transport activities inside airports, 0.4 million persons employed
Sub-cluster (c): Other airport-related activities, 0.5 million persons employed
Figure 4.25: Direct employment in air transport and airports, EU28, 2013
Source: Estimates based on Eurostat, data provided by airports and airlines, desktop research, Steer Davies Gleave analysis
Air transport cluster
1,400,000
Airport-related activities900,000
Outside airports
(a)
1,000,000
Air transport cluster –
inside airports
(b)
400,000
Other airport-related
activities(c)
500,000
Air transport and airports1,900,000
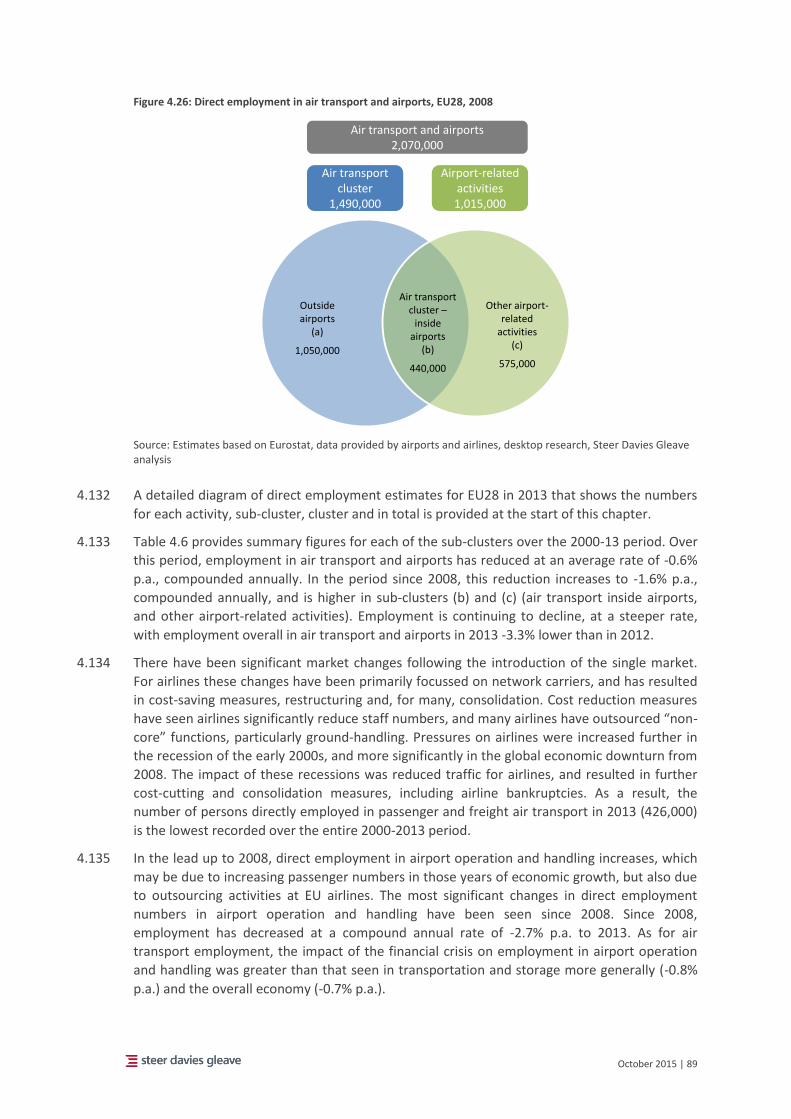
October 2015 | 89
Figure 4.26: Direct employment in air transport and airports, EU28, 2008
Source: Estimates based on Eurostat, data provided by airports and airlines, desktop research, Steer Davies Gleave analysis
4.132 A detailed diagram of direct employment estimates for EU28 in 2013 that shows the numbers
for each activity, sub-cluster, cluster and in total is provided at the start of this chapter.
4.133 Table 4.6 provides summary figures for each of the sub-clusters over the 2000-13 period. Over
this period, employment in air transport and airports has reduced at an average rate of -0.6%
p.a., compounded annually. In the period since 2008, this reduction increases to -1.6% p.a.,
compounded annually, and is higher in sub-clusters (b) and (c) (air transport inside airports,
and other airport-related activities). Employment is continuing to decline, at a steeper rate,
with employment overall in air transport and airports in 2013 -3.3% lower than in 2012.
4.134 There have been significant market changes following the introduction of the single market.
For airlines these changes have been primarily focussed on network carriers, and has resulted
in cost-saving measures, restructuring and, for many, consolidation. Cost reduction measures
have seen airlines significantly reduce staff numbers, and many airlines have outsourced “non-
core” functions, particularly ground-handling. Pressures on airlines were increased further in
the recession of the early 2000s, and more significantly in the global economic downturn from
2008. The impact of these recessions was reduced traffic for airlines, and resulted in further
cost-cutting and consolidation measures, including airline bankruptcies. As a result, the
number of persons directly employed in passenger and freight air transport in 2013 (426,000)
is the lowest recorded over the entire 2000-2013 period.
4.135 In the lead up to 2008, direct employment in airport operation and handling increases, which
may be due to increasing passenger numbers in those years of economic growth, but also due
to outsourcing activities at EU airlines. The most significant changes in direct employment
numbers in airport operation and handling have been seen since 2008. Since 2008,
employment has decreased at a compound annual rate of -2.7% p.a. to 2013. As for air
transport employment, the impact of the financial crisis on employment in airport operation
and handling was greater than that seen in transportation and storage more generally (-0.8%
p.a.) and the overall economy (-0.7% p.a.).
Air transport cluster
1,490,000
Airport-related activities1,015,000
Outside airports
(a)
1,050,000
Air transport cluster –
inside airports
(b)
440,000
Other airport-related
activities(c)
575,000
Air transport and airports2,070,000
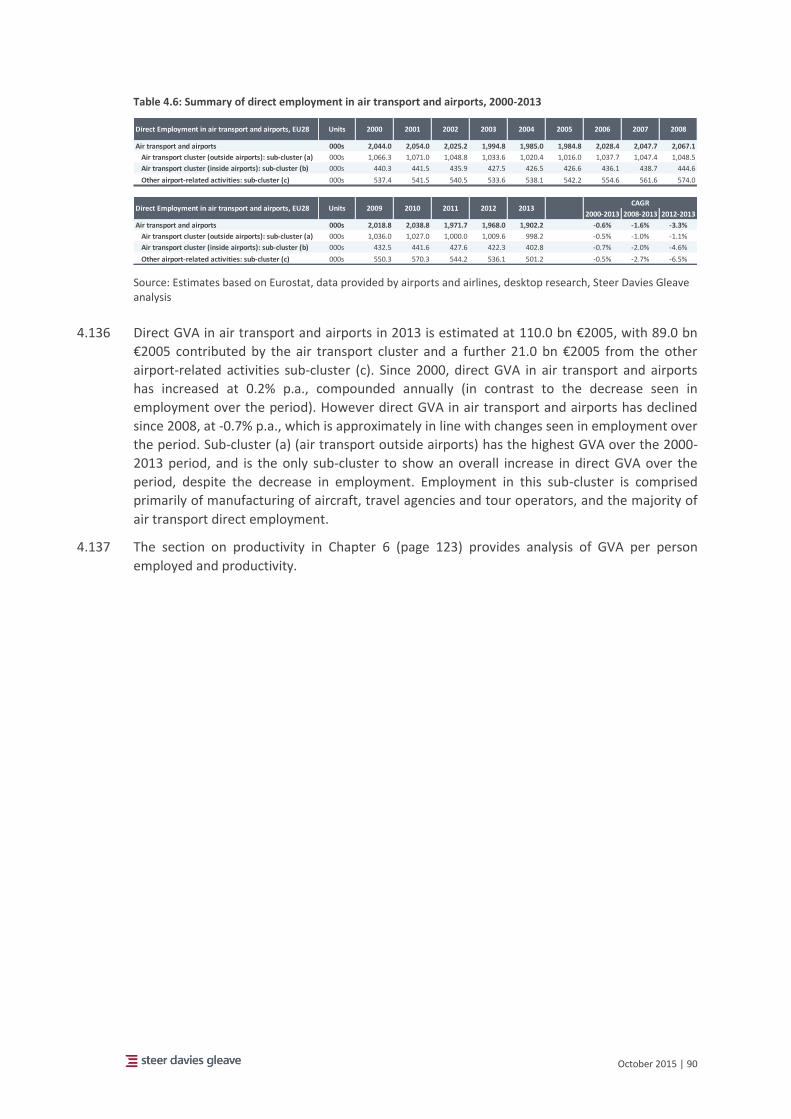
October 2015 | 90
Table 4.6: Summary of direct employment in air transport and airports, 2000-2013
Source: Estimates based on Eurostat, data provided by airports and airlines, desktop research, Steer Davies Gleave analysis
4.136 Direct GVA in air transport and airports in 2013 is estimated at 110.0 bn €2005, with 89.0 bn
€2005 contributed by the air transport cluster and a further 21.0 bn €2005 from the other
airport-related activities sub-cluster (c). Since 2000, direct GVA in air transport and airports
has increased at 0.2% p.a., compounded annually (in contrast to the decrease seen in
employment over the period). However direct GVA in air transport and airports has declined
since 2008, at -0.7% p.a., which is approximately in line with changes seen in employment over
the period. Sub-cluster (a) (air transport outside airports) has the highest GVA over the 2000-
2013 period, and is the only sub-cluster to show an overall increase in direct GVA over the
period, despite the decrease in employment. Employment in this sub-cluster is comprised
primarily of manufacturing of aircraft, travel agencies and tour operators, and the majority of
air transport direct employment.
4.137 The section on productivity in Chapter 6 (page 123) provides analysis of GVA per person
employed and productivity.
Air transport and airports 000s 2,044.0 2,054.0 2,025.2 1,994.8 1,985.0 1,984.8 2,028.4 2,047.7 2,067.1
Air transport cluster (outside airports): sub-cluster (a) 000s 1,066.3 1,071.0 1,048.8 1,033.6 1,020.4 1,016.0 1,037.7 1,047.4 1,048.5
Air transport cluster (inside airports): sub-cluster (b) 000s 440.3 441.5 435.9 427.5 426.5 426.6 436.1 438.7 444.6
Other airport-related activities: sub-cluster (c) 000s 537.4 541.5 540.5 533.6 538.1 542.2 554.6 561.6 574.0
2000-2013 2008-2013 2012-2013
Air transport and airports 000s 2,018.8 2,038.8 1,971.7 1,968.0 1,902.2 -0.6% -1.6% -3.3%
Air transport cluster (outside airports): sub-cluster (a) 000s 1,036.0 1,027.0 1,000.0 1,009.6 998.2 -0.5% -1.0% -1.1%
Air transport cluster (inside airports): sub-cluster (b) 000s 432.5 441.6 427.6 422.3 402.8 -0.7% -2.0% -4.6%
Other airport-related activities: sub-cluster (c) 000s 550.3 570.3 544.2 536.1 501.2 -0.5% -2.7% -6.5%
CAGRDirect Employment in air transport and airports, EU28 Units 2009 2010 2011 2012 2013
Direct Employment in air transport and airports, EU28 Units 2000 2001 2007 20082002 2003 2004 2005 2006
October 2015 | 91
5 Indirect employment Introduction
5.1 Indirect employment is the employment generated upstream, on the supplier side, by the
activities in the air transport cluster and airport-related activities. In order to produce
estimates of the indirect employment generated by the activities of the "Air transport cluster"
and "Other airport-related activities", an analysis of Input-Output tables (I/O tables) has been
undertaken, which record macroeconomic activity as a system of interrelated goods and
services and show how the parts of the system can be affected by a change in one particular
sector.
5.2 The approach followed uses a standard analytical technique for estimating indirect
employment that is in line with the Leontief methodology (explained below). This is similar to
the approach applied in the 2012 Study on the effects of the implementation of the EU aviation
common market on employment and working conditions in the Air Transport Sector. First the
direct economic output generated by the air transport cluster and other airport-related
activities is quantified. Second, the catalytic effect that the clusters’ services and products
have in boosting activity elsewhere in the economy via the supply chain is examined.
5.3 The remainder of this section describes in detail our methodology for the estimation of
indirect employment effects of air transport using I/O tables provided by the statistical offices
of Member States. It covers:
The selection of Input Output data tables;
The use of supplementary data to identify the sectors of interest;
The static open Leontief estimation methodology;
Anticipated issues and limitations;
Potential analytical extensions; and
The extrapolation of results and benchmarking.
Methodology
5.4 To understand how the aviation industry combines inputs (and therefore how many jobs it
supports through its supply chain) a classic Input Output analysis is undertaken. An Input
Output model gives a snapshot of an economy at any point in time. The model shows the
major spending flows from "final demand" (incorporating consumer spending, government
spending, investment, and exports to the rest of the world); intermediate spending patterns
(the purchases that each sector makes from every other sector i.e. the supply chain); how
much of that spending stays within the economy; and the distribution of income between
employment incomes and other income (mainly profits). In essence an Input Output model is a
table which shows who buys what from whom in the economy.
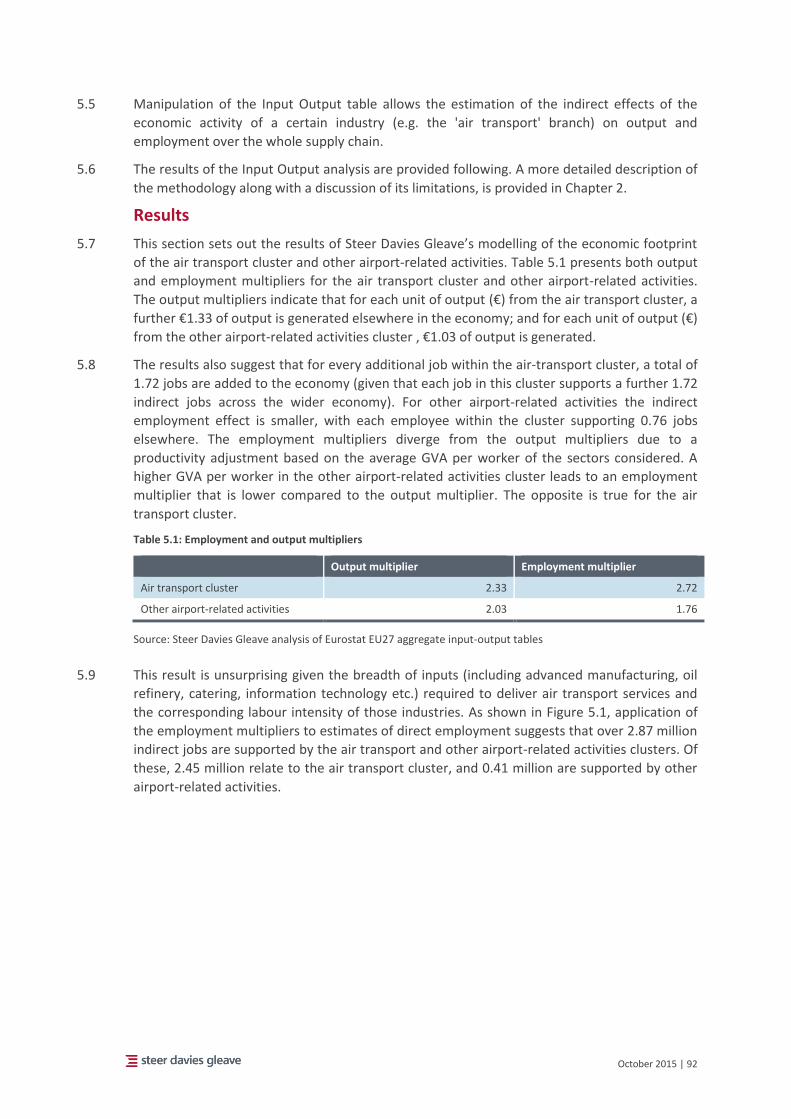
October 2015 | 92
5.5 Manipulation of the Input Output table allows the estimation of the indirect effects of the
economic activity of a certain industry (e.g. the 'air transport' branch) on output and
employment over the whole supply chain.
5.6 The results of the Input Output analysis are provided following. A more detailed description of
the methodology along with a discussion of its limitations, is provided in Chapter 2.
Results
5.7 This section sets out the results of Steer Davies Gleave’s modelling of the economic footprint
of the air transport cluster and other airport-related activities. Table 5.1 presents both output
and employment multipliers for the air transport cluster and other airport-related activities.
The output multipliers indicate that for each unit of output (€) from the air transport cluster, a
further €1.33 of output is generated elsewhere in the economy; and for each unit of output (€)
from the other airport-related activities cluster , €1.03 of output is generated.
5.8 The results also suggest that for every additional job within the air-transport cluster, a total of
1.72 jobs are added to the economy (given that each job in this cluster supports a further 1.72
indirect jobs across the wider economy). For other airport-related activities the indirect
employment effect is smaller, with each employee within the cluster supporting 0.76 jobs
elsewhere. The employment multipliers diverge from the output multipliers due to a
productivity adjustment based on the average GVA per worker of the sectors considered. A
higher GVA per worker in the other airport-related activities cluster leads to an employment
multiplier that is lower compared to the output multiplier. The opposite is true for the air
transport cluster.
Table 5.1: Employment and output multipliers
Output multiplier Employment multiplier
Air transport cluster 2.33 2.72
Other airport-related activities 2.03 1.76
Source: Steer Davies Gleave analysis of Eurostat EU27 aggregate input-output tables
5.9 This result is unsurprising given the breadth of inputs (including advanced manufacturing, oil
refinery, catering, information technology etc.) required to deliver air transport services and
the corresponding labour intensity of those industries. As shown in Figure 5.1, application of
the employment multipliers to estimates of direct employment suggests that over 2.87 million
indirect jobs are supported by the air transport and other airport-related activities clusters. Of
these, 2.45 million relate to the air transport cluster, and 0.41 million are supported by other
airport-related activities.
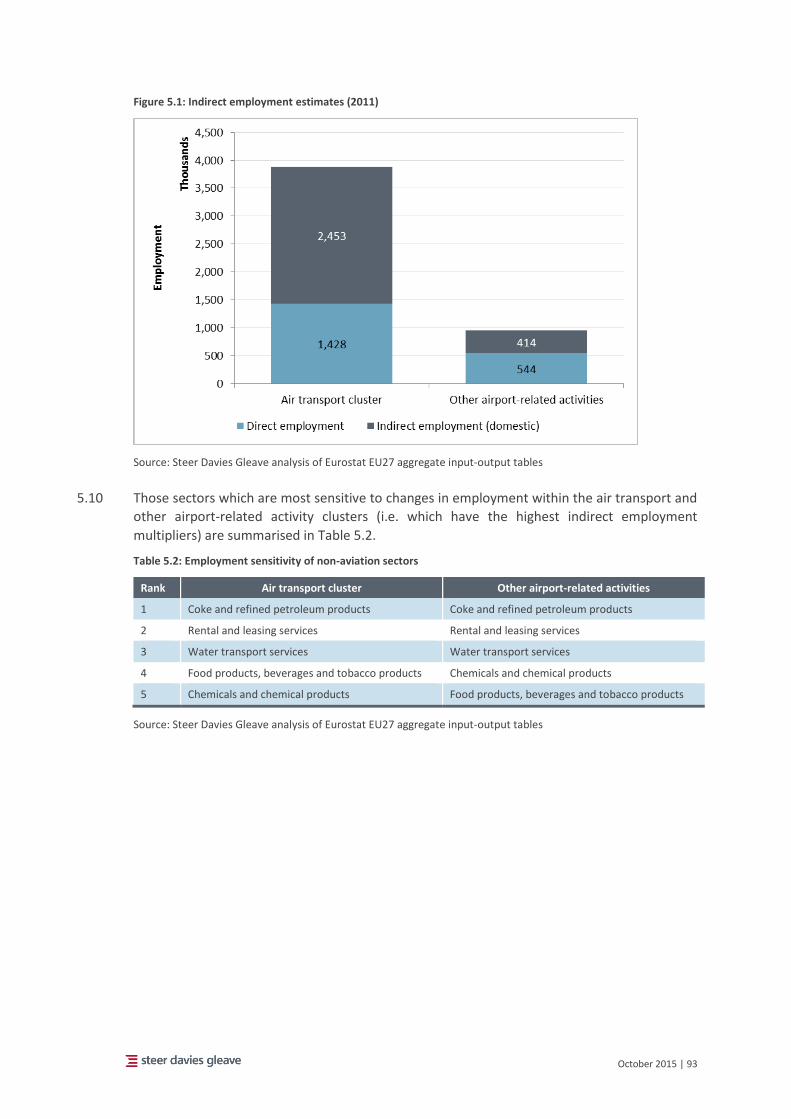
October 2015 | 93
Figure 5.1: Indirect employment estimates (2011)
Source: Steer Davies Gleave analysis of Eurostat EU27 aggregate input-output tables
5.10 Those sectors which are most sensitive to changes in employment within the air transport and
other airport-related activity clusters (i.e. which have the highest indirect employment
multipliers) are summarised in Table 5.2.
Table 5.2: Employment sensitivity of non-aviation sectors
Rank Air transport cluster Other airport-related activities
1 Coke and refined petroleum products Coke and refined petroleum products
2 Rental and leasing services Rental and leasing services
3 Water transport services Water transport services
4 Food products, beverages and tobacco products Chemicals and chemical products
5 Chemicals and chemical products Food products, beverages and tobacco products
Source: Steer Davies Gleave analysis of Eurostat EU27 aggregate input-output tables
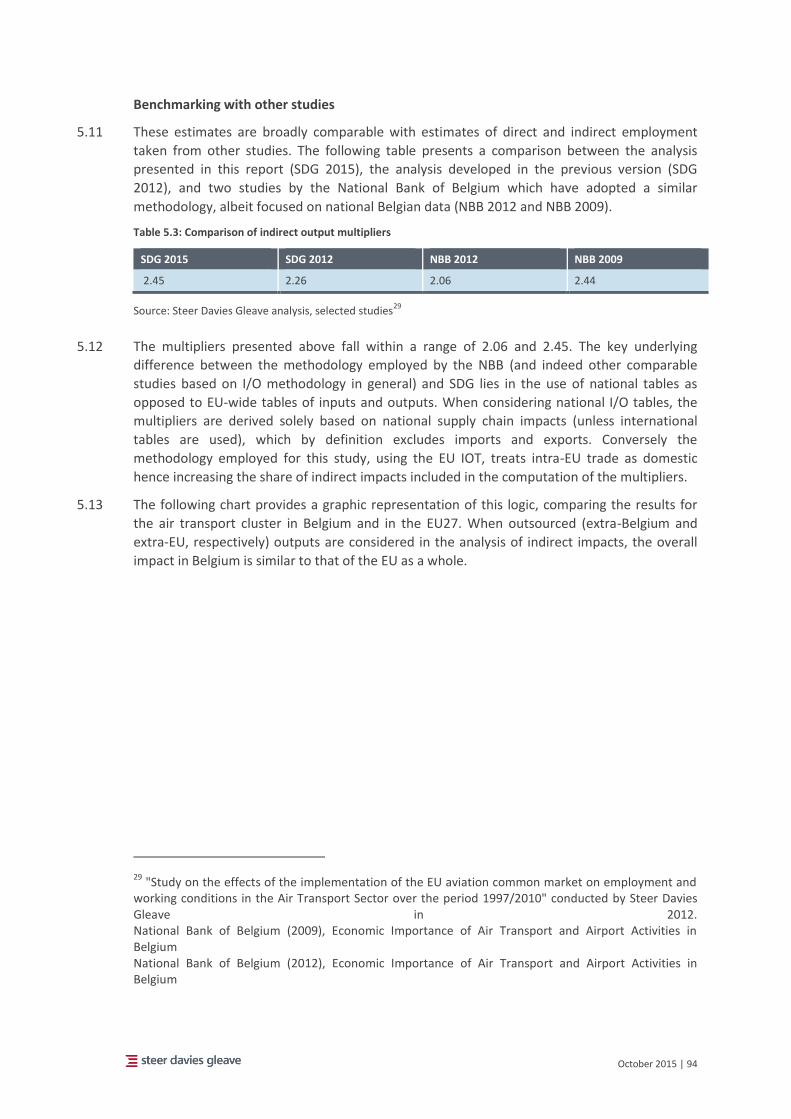
October 2015 | 94
Benchmarking with other studies
5.11 These estimates are broadly comparable with estimates of direct and indirect employment
taken from other studies. The following table presents a comparison between the analysis
presented in this report (SDG 2015), the analysis developed in the previous version (SDG
2012), and two studies by the National Bank of Belgium which have adopted a similar
methodology, albeit focused on national Belgian data (NBB 2012 and NBB 2009).
Table 5.3: Comparison of indirect output multipliers
SDG 2015 SDG 2012 NBB 2012 NBB 2009
2.45 2.26 2.06 2.44
Source: Steer Davies Gleave analysis, selected studies29
5.12 The multipliers presented above fall within a range of 2.06 and 2.45. The key underlying
difference between the methodology employed by the NBB (and indeed other comparable
studies based on I/O methodology in general) and SDG lies in the use of national tables as
opposed to EU-wide tables of inputs and outputs. When considering national I/O tables, the
multipliers are derived solely based on national supply chain impacts (unless international
tables are used), which by definition excludes imports and exports. Conversely the
methodology employed for this study, using the EU IOT, treats intra-EU trade as domestic
hence increasing the share of indirect impacts included in the computation of the multipliers.
5.13 The following chart provides a graphic representation of this logic, comparing the results for
the air transport cluster in Belgium and in the EU27. When outsourced (extra-Belgium and
extra-EU, respectively) outputs are considered in the analysis of indirect impacts, the overall
impact in Belgium is similar to that of the EU as a whole.
29 "Study on the effects of the implementation of the EU aviation common market on employment and
working conditions in the Air Transport Sector over the period 1997/2010" conducted by Steer Davies Gleave in 2012. National Bank of Belgium (2009), Economic Importance of Air Transport and Airport Activities in Belgium National Bank of Belgium (2012), Economic Importance of Air Transport and Airport Activities in Belgium
October 2015 | 95
Figure 5.2: Indirect (domestic) employment and employment sourced from outside as a proportion of direct employment in the air transport cluster, EU27 and Belgium, 2011
Source: Steer Davies Gleave analysis of Eurostat EU27 aggregate input-output tables and Belgian national input-output tables
5.14 Among other recently published studies, the InterVISTAS report prepared for ACI Europe to
quantify the economic impacts of airports in January 2015 deserves a special mention. The
Appendix to this report explains that induced impacts are estimated as the difference between
a Closed I/O Model and the Open I/O Model. The Closed Model does not have any leakages
from the system, and captures the consumption-induced effects as well as the production-
induced effects. The leakages accounted for in the Open Model consist instead of payments
for imports and primary inputs. Therefore the multipliers obtained in the present study should
be compared to the range of direct and induced impacts from the ACI Europe study. This
range, between 2.21 and 2.62, is in line with the estimates presented above.
5.15 A separate comparison can be made between the absolute number of jobs estimated in
different studies. The 2012 Steer Davies Gleave study for the European Commission estimated
the following figures for indirect employment in 2010:
Indirect employment: 1,580 ,000, comprising:
Indirect employment for airlines: 1,328,000
Indirect employment for airports: 343,000
5.16 Our previous study used a narrower definition of direct employment and therefore its
estimates of indirect employment are smaller. However, the relationship between multipliers
for airlines (broadly equivalent to the air transport cluster) and airports (broadly equivalent to
other airport-related activities) is consistent with the findings from this study i.e. indirect
employment in airport-related activities is roughly 20-25% of total indirect employment.
5.17 In addition, the 2012 study produced a comparison with another study published by the Air
Transport Action Group (ATAG) Benefits Beyond Borders. ATAG's report estimated the number

October 2015 | 96
of indirect jobs at over 4 million. However this figure includes jobs in the wider European
region, including Russia and Turkey for example. The InterVISTAS study presents a total of 4.45
million jobs as the total estimate of employment at European airports in 2013.
Trends in use of employment outside the EU
5.18 The use of EU-wide Input Output Tables allows us develop high-level insights regarding the
extent of, and trends in, sourcing of labour outside the EU. By comparing the Input Output
Tables recording domestic inputs with the equivalent ’total’ tables which also capture net
imports/exports, the proportion of inputs (including labour) sourced from outside the EU can
be analysed. This offers some insights into the reliance of the EU aviation sector on using
labour that is sourced from outside the European Union.
5.19 Figure 5.3 indicates that in 2011, approximately 870,000 jobs elsewhere in the global economy
were supported by the EU aviation industry. This includes both direct employment that is
outsourced to locations outside the EU, and the subsequent indirect employment that is also
supported. As a proportion of the total, the air transport cluster supported considerably more
jobs (direct and indirect) from outside the EU (18.3%) when compared with the other airport-
related activities cluster (6.7%).
Figure 5.3: Employment estimates including employment sourced from outside the EU (2011)
Source: Steer Davies Gleave analysis of Eurostat EU27 aggregate input-output tables
5.20 Undertaking similar analysis using 2008 Input Output tables suggests that the overall quantity
of jobs supported outside the European Union changed very little in the period between 2008
to 2011, with about 860,000 direct and indirect jobs supported by the air-transport cluster and
about 70,000 jobs supported by the provision of other airport-related activities in 2008. As a
proportion of the total, however, the prominence of sourcing outside the EU has grown as
employment in the wider aviation sector has fallen between 2008-2011.
5.21 Table 5.4 and Table 5.5 provide a summary of employment estimates for 2008 and 2011 for
each of the air transport cluster and other airport-related activities cluster.
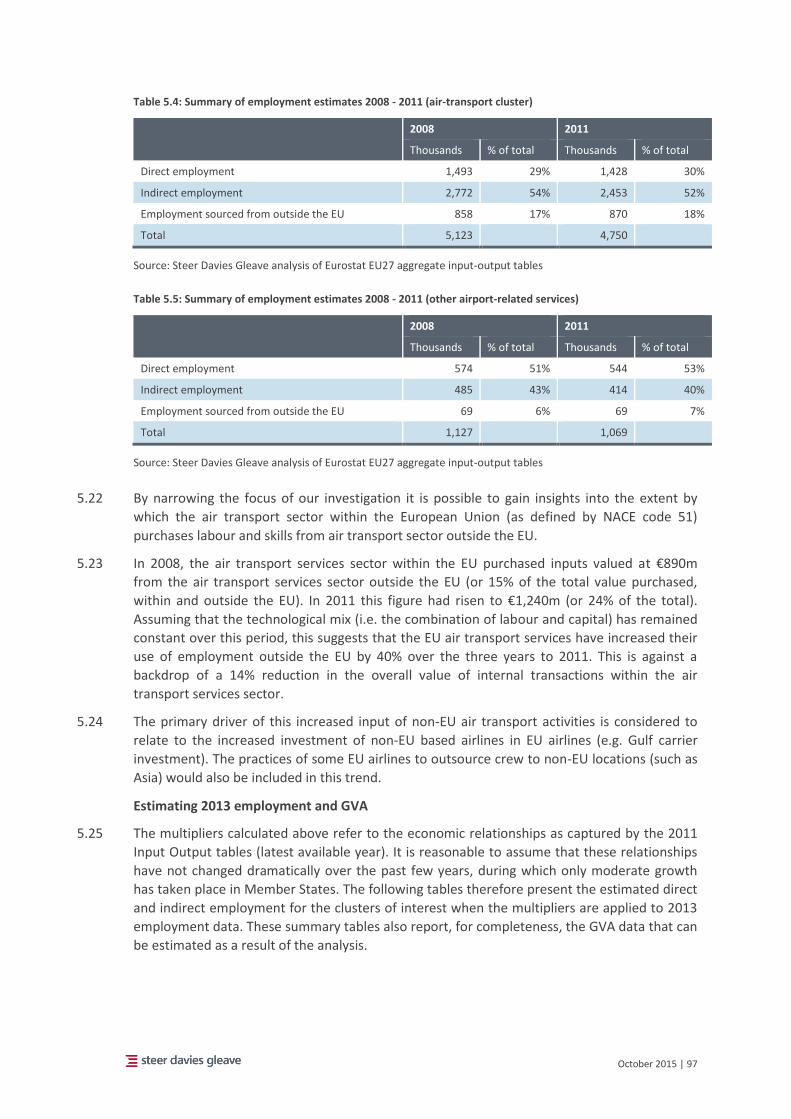
October 2015 | 97
Table 5.4: Summary of employment estimates 2008 - 2011 (air-transport cluster)
2008 2011
Thousands % of total Thousands % of total
Direct employment 1,493 29% 1,428 30%
Indirect employment 2,772 54% 2,453 52%
Employment sourced from outside the EU 858 17% 870 18%
Total 5,123 4,750
Source: Steer Davies Gleave analysis of Eurostat EU27 aggregate input-output tables
Table 5.5: Summary of employment estimates 2008 - 2011 (other airport-related services)
2008 2011
Thousands % of total Thousands % of total
Direct employment 574 51% 544 53%
Indirect employment 485 43% 414 40%
Employment sourced from outside the EU 69 6% 69 7%
Total 1,127 1,069
Source: Steer Davies Gleave analysis of Eurostat EU27 aggregate input-output tables
5.22 By narrowing the focus of our investigation it is possible to gain insights into the extent by
which the air transport sector within the European Union (as defined by NACE code 51)
purchases labour and skills from air transport sector outside the EU.
5.23 In 2008, the air transport services sector within the EU purchased inputs valued at €890m
from the air transport services sector outside the EU (or 15% of the total value purchased,
within and outside the EU). In 2011 this figure had risen to €1,240m (or 24% of the total).
Assuming that the technological mix (i.e. the combination of labour and capital) has remained
constant over this period, this suggests that the EU air transport services have increased their
use of employment outside the EU by 40% over the three years to 2011. This is against a
backdrop of a 14% reduction in the overall value of internal transactions within the air
transport services sector.
5.24 The primary driver of this increased input of non-EU air transport activities is considered to
relate to the increased investment of non-EU based airlines in EU airlines (e.g. Gulf carrier
investment). The practices of some EU airlines to outsource crew to non-EU locations (such as
Asia) would also be included in this trend.
Estimating 2013 employment and GVA
5.25 The multipliers calculated above refer to the economic relationships as captured by the 2011
Input Output tables (latest available year). It is reasonable to assume that these relationships
have not changed dramatically over the past few years, during which only moderate growth
has taken place in Member States. The following tables therefore present the estimated direct
and indirect employment for the clusters of interest when the multipliers are applied to 2013
employment data. These summary tables also report, for completeness, the GVA data that can
be estimated as a result of the analysis.
October 2015 | 98
Summary
5.26 In 2013, the sum of direct and domestic indirect employment generated by air transport and
airports in the EU is 4.7 million (Table 5.6 and Table 5.7). This comprises:
1.9 million persons directly employed, of which:
1.4 million (74%) are in the air transport cluster (sub-clusters (a) and (b)); and
0.5 million (26%) are in other airport-related activities (sub-cluster (c)).
2.8 million persons indirectly employed (domestic), of which:
2.4 million (86%) are in the air transport cluster; and
0.4 million (14%) are in the other airport-related activities sub-cluster.
5.27 If indirect employment from outside the EU is included, a further 917,000 jobs elsewhere in
the global economy were supported by the EU aviation industry (854,000 from the air
transport cluster and 64,000 from the other airport-related activities sub-cluster30).
5.28 In 2013, the sum of direct and domestic indirect GVA generated by air transport and airports
in the EU is € 249 billion. This comprises:
€ 111 billion direct GVA, of which:
€ 89 billion is generated by the air transport cluster (sub-clusters (a) and (b)); and
€ 22 billion is generated by other airport-related activities (sub-cluster (c)).
€ 140 billion indirect (domestic) GVA, of which:
€ 118 billion is generated by the air transport cluster; and
€ 22 billion is generated by other airport-related activities.
5.29 If indirect GVA from outside the EU is included, this adds a further € 49 billion of indirect GVA
generated by air transport and by airports.
30 Numbers may not sum due to rounding errors.
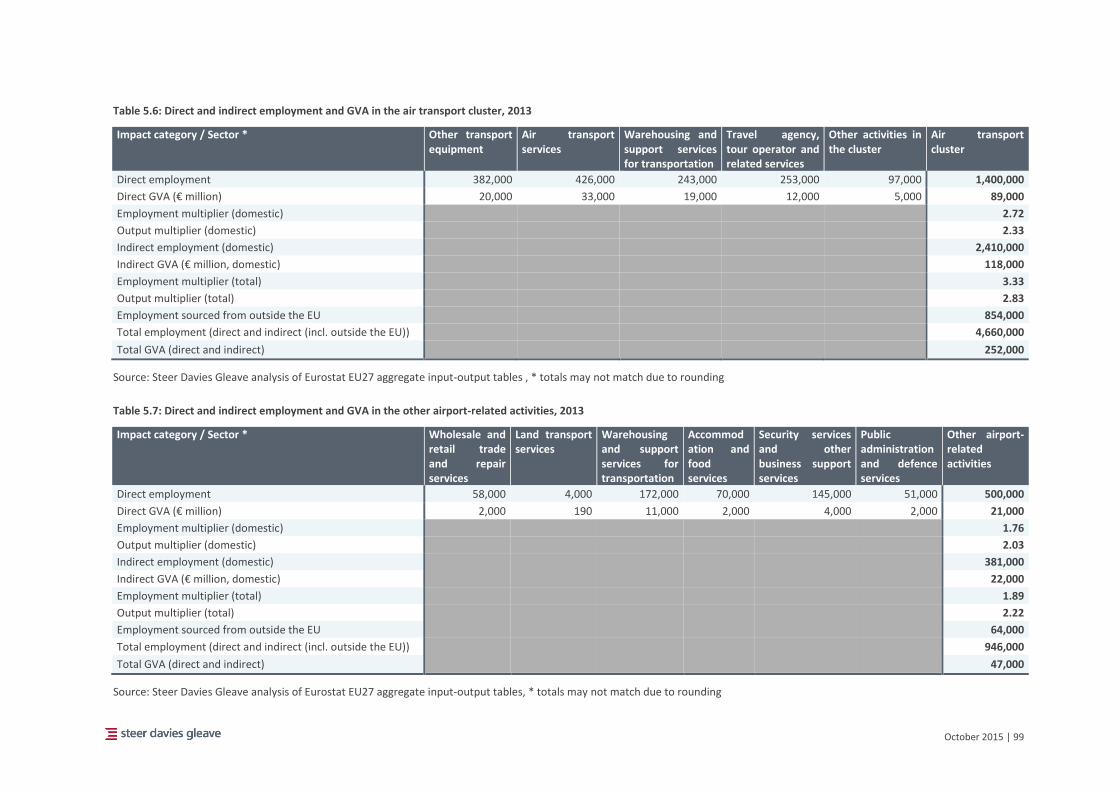
October 2015 | 99
Table 5.6: Direct and indirect employment and GVA in the air transport cluster, 2013
Impact category / Sector * Other transport equipment
Air transport services
Warehousing and support services for transportation
Travel agency, tour operator and related services
Other activities in the cluster
Air transport cluster
Direct employment 382,000 426,000 243,000 253,000 97,000 1,400,000
Direct GVA (€ million) 20,000 33,000 19,000 12,000 5,000 89,000
Employment multiplier (domestic)
2.72
Output multiplier (domestic) 2.33
Indirect employment (domestic) 2,410,000
Indirect GVA (€ million, domestic) 118,000
Employment multiplier (total) 3.33
Output multiplier (total) 2.83
Employment sourced from outside the EU 854,000
Total employment (direct and indirect (incl. outside the EU)) 4,660,000
Total GVA (direct and indirect) 252,000
Source: Steer Davies Gleave analysis of Eurostat EU27 aggregate input-output tables , * totals may not match due to rounding
Table 5.7: Direct and indirect employment and GVA in the other airport-related activities, 2013
Impact category / Sector * Wholesale and retail trade and repair services
Land transport services
Warehousing and support services for transportation
Accommodation and food services
Security services and other business support services
Public administration and defence services
Other airport-related activities
Direct employment 58,000 4,000 172,000 70,000 145,000 51,000 500,000
Direct GVA (€ million) 2,000 190 11,000 2,000 4,000 2,000 21,000
Employment multiplier (domestic) 1.76
Output multiplier (domestic) 2.03
Indirect employment (domestic) 381,000
Indirect GVA (€ million, domestic) 22,000
Employment multiplier (total) 1.89
Output multiplier (total) 2.22
Employment sourced from outside the EU 64,000
Total employment (direct and indirect (incl. outside the EU)) 946,000
Total GVA (direct and indirect) 47,000
Source: Steer Davies Gleave analysis of Eurostat EU27 aggregate input-output tables, * totals may not match due to rounding
October 2015 | 100
6 Direct employment patterns Introduction
6.1 This chapter focuses on social trends in direct employment in air transport and airport
operations and handling. Using available data, trends are presented under the following
themes:
employment profile, including gender, age, occupation, type of employment arrangement
and skill level;
labour cost and income;
productivity and value added;
health and safety; and
employees’ perceptions of working conditions.
6.2 A short ‘case study’ on air traffic control employment and costs is also included, using Air
Traffic Management Cost-Effectiveness data collected by EUROCONTROL.
Employment profile trends
Employment trends by gender and age
6.3 Throughout this section, the charts present data for 2008 to 2013. Data prior to 2008 is not
presented as the disaggregated data was not available. Therefore, only the detail of the
financial crisis is shown.
Passenger Air Transport trends by gender and age
6.4 Figure 6.1 and Figure 6.2 show the percentage split of persons employed in passenger air
transport in the EU28 by gender and age respectively. Data is also shown for both
transportation and storage more generally, and the overall economy.
6.5 For both genders, proportions remain approximately level prior to 2010, with men
representing 58% of total persons employed and women 42%. However in 2010 the
percentage of total male persons employed decreased to 55%, which may reflect the fact that
the staff reductions associated with the economic downturn adversely affected male staff. The
share has rebounded, and in 2013 the percentage of total male persons employed was 60%,
the highest of the period shown. The proportion of male persons employed in passenger air
transport is slightly higher than the overall economy, and lower (by 15-20 percentage points)
than that for the transportation and storage sector.
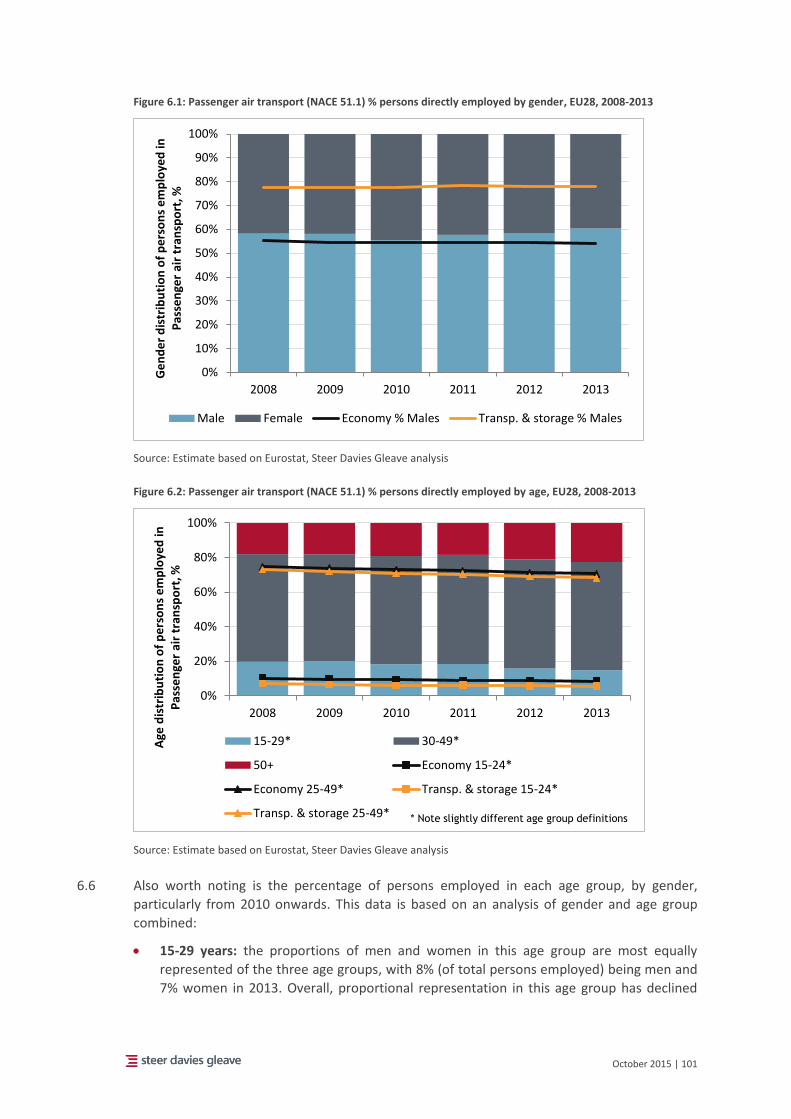
October 2015 | 101
Figure 6.1: Passenger air transport (NACE 51.1) % persons directly employed by gender, EU28, 2008-2013
Source: Estimate based on Eurostat, Steer Davies Gleave analysis
Figure 6.2: Passenger air transport (NACE 51.1) % persons directly employed by age, EU28, 2008-2013
Source: Estimate based on Eurostat, Steer Davies Gleave analysis
6.6 Also worth noting is the percentage of persons employed in each age group, by gender,
particularly from 2010 onwards. This data is based on an analysis of gender and age group
combined:
15-29 years: the proportions of men and women in this age group are most equally
represented of the three age groups, with 8% (of total persons employed) being men and
7% women in 2013. Overall, proportional representation in this age group has declined
0%
10%
20%
30%
40%
50%
60%
70%
80%
90%
100%
2008 2009 2010 2011 2012 2013
Ge
nd
er
dis
trib
uti
on
of
pe
rso
ns
em
plo
yed
in
Pas
sen
ger
air
tran
spo
rt, %
Male Female Economy % Males Transp. & storage % Males
0%
20%
40%
60%
80%
100%
2008 2009 2010 2011 2012 2013
Age
dis
trib
uti
on
of
pe
rso
ns
em
plo
yed
inP
asse
nge
r ai
r tr
ansp
ort
, %
15-29* 30-49*
50+ Economy 15-24*
Economy 25-49* Transp. & storage 15-24*
Transp. & storage 25-49* * Note slightly different age group definitions
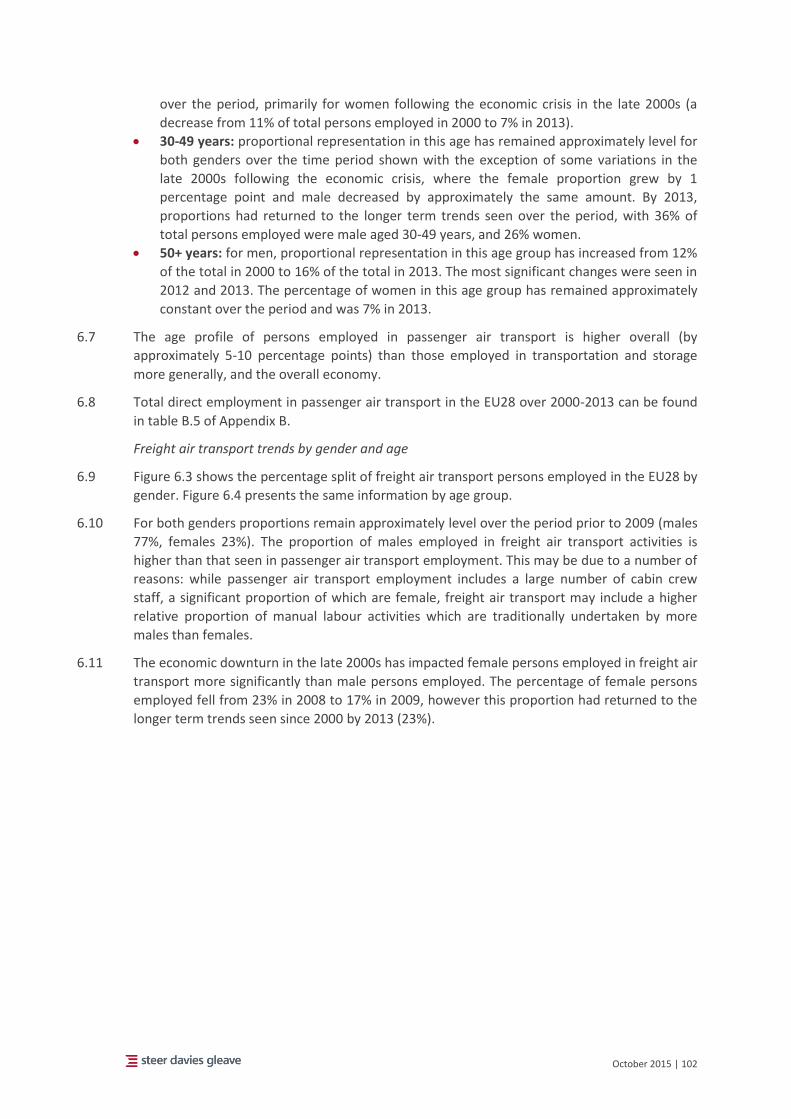
October 2015 | 102
over the period, primarily for women following the economic crisis in the late 2000s (a
decrease from 11% of total persons employed in 2000 to 7% in 2013).
30-49 years: proportional representation in this age has remained approximately level for
both genders over the time period shown with the exception of some variations in the
late 2000s following the economic crisis, where the female proportion grew by 1
percentage point and male decreased by approximately the same amount. By 2013,
proportions had returned to the longer term trends seen over the period, with 36% of
total persons employed were male aged 30-49 years, and 26% women.
50+ years: for men, proportional representation in this age group has increased from 12%
of the total in 2000 to 16% of the total in 2013. The most significant changes were seen in
2012 and 2013. The percentage of women in this age group has remained approximately
constant over the period and was 7% in 2013.
6.7 The age profile of persons employed in passenger air transport is higher overall (by
approximately 5-10 percentage points) than those employed in transportation and storage
more generally, and the overall economy.
6.8 Total direct employment in passenger air transport in the EU28 over 2000-2013 can be found
in table B.5 of Appendix B.
Freight air transport trends by gender and age
6.9 Figure 6.3 shows the percentage split of freight air transport persons employed in the EU28 by
gender. Figure 6.4 presents the same information by age group.
6.10 For both genders proportions remain approximately level over the period prior to 2009 (males
77%, females 23%). The proportion of males employed in freight air transport activities is
higher than that seen in passenger air transport employment. This may be due to a number of
reasons: while passenger air transport employment includes a large number of cabin crew
staff, a significant proportion of which are female, freight air transport may include a higher
relative proportion of manual labour activities which are traditionally undertaken by more
males than females.
6.11 The economic downturn in the late 2000s has impacted female persons employed in freight air
transport more significantly than male persons employed. The percentage of female persons
employed fell from 23% in 2008 to 17% in 2009, however this proportion had returned to the
longer term trends seen since 2000 by 2013 (23%).
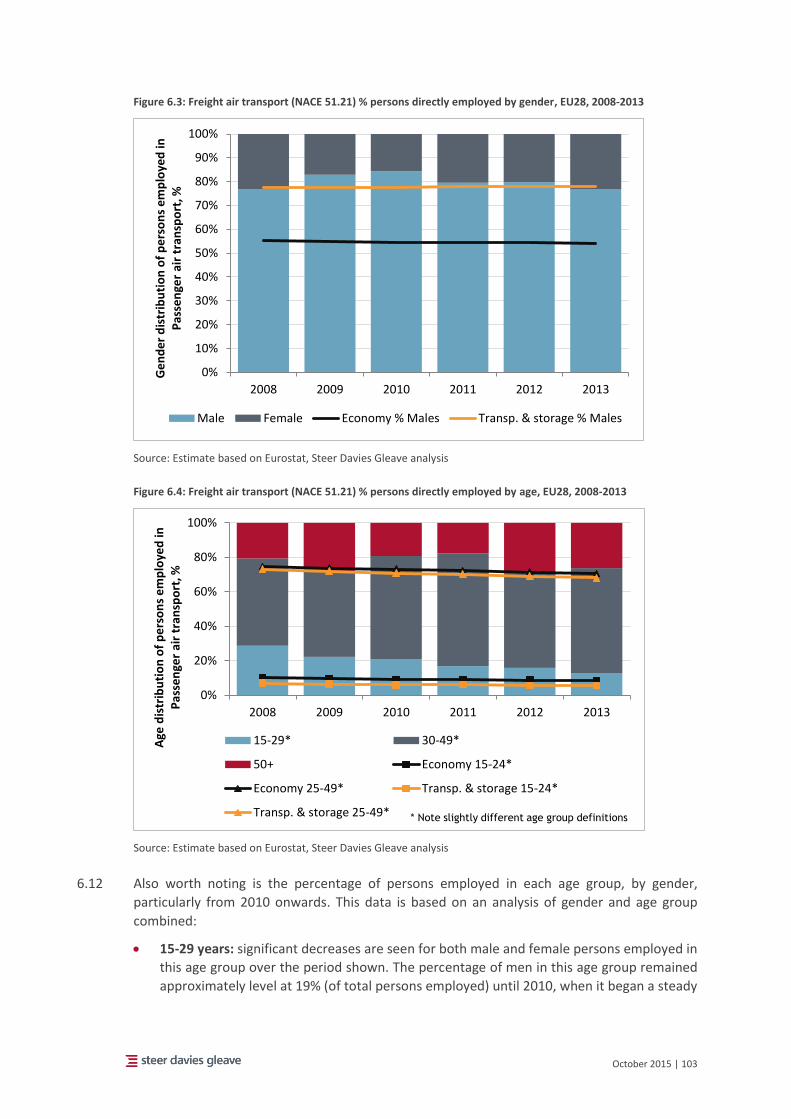
October 2015 | 103
Figure 6.3: Freight air transport (NACE 51.21) % persons directly employed by gender, EU28, 2008-2013
Source: Estimate based on Eurostat, Steer Davies Gleave analysis
Figure 6.4: Freight air transport (NACE 51.21) % persons directly employed by age, EU28, 2008-2013
Source: Estimate based on Eurostat, Steer Davies Gleave analysis
6.12 Also worth noting is the percentage of persons employed in each age group, by gender,
particularly from 2010 onwards. This data is based on an analysis of gender and age group
combined:
15-29 years: significant decreases are seen for both male and female persons employed in
this age group over the period shown. The percentage of men in this age group remained
approximately level at 19% (of total persons employed) until 2010, when it began a steady
0%
10%
20%
30%
40%
50%
60%
70%
80%
90%
100%
2008 2009 2010 2011 2012 2013
Ge
nd
er
dis
trib
uti
on
of
pe
rso
ns
em
plo
yed
in
Pas
sen
ger
air
tran
spo
rt, %
Male Female Economy % Males Transp. & storage % Males
0%
20%
40%
60%
80%
100%
2008 2009 2010 2011 2012 2013
Age
dis
trib
uti
on
of
pe
rso
ns
em
plo
yed
inP
asse
nge
r ai
r tr
ansp
ort
, %
15-29* 30-49*
50+ Economy 15-24*
Economy 25-49* Transp. & storage 15-24*
Transp. & storage 25-49* * Note slightly different age group definitions
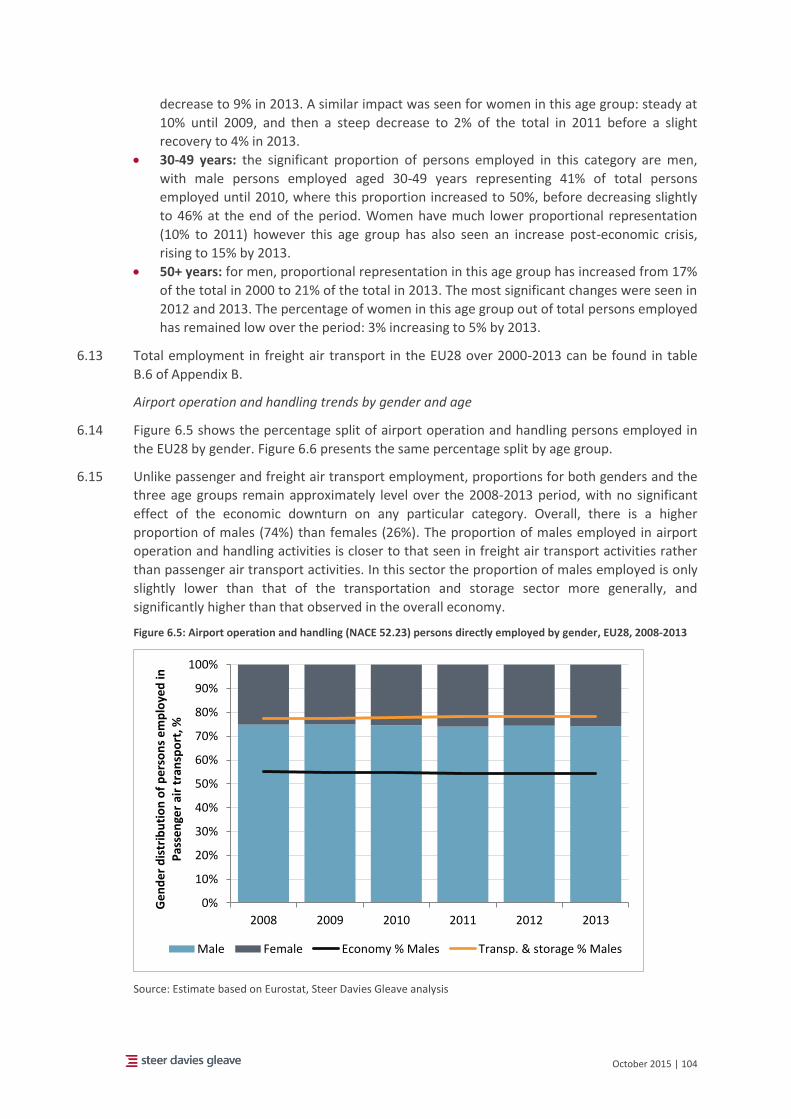
October 2015 | 104
decrease to 9% in 2013. A similar impact was seen for women in this age group: steady at
10% until 2009, and then a steep decrease to 2% of the total in 2011 before a slight
recovery to 4% in 2013.
30-49 years: the significant proportion of persons employed in this category are men,
with male persons employed aged 30-49 years representing 41% of total persons
employed until 2010, where this proportion increased to 50%, before decreasing slightly
to 46% at the end of the period. Women have much lower proportional representation
(10% to 2011) however this age group has also seen an increase post-economic crisis,
rising to 15% by 2013.
50+ years: for men, proportional representation in this age group has increased from 17%
of the total in 2000 to 21% of the total in 2013. The most significant changes were seen in
2012 and 2013. The percentage of women in this age group out of total persons employed
has remained low over the period: 3% increasing to 5% by 2013.
6.13 Total employment in freight air transport in the EU28 over 2000-2013 can be found in table
B.6 of Appendix B.
Airport operation and handling trends by gender and age
6.14 Figure 6.5 shows the percentage split of airport operation and handling persons employed in
the EU28 by gender. Figure 6.6 presents the same percentage split by age group.
6.15 Unlike passenger and freight air transport employment, proportions for both genders and the
three age groups remain approximately level over the 2008-2013 period, with no significant
effect of the economic downturn on any particular category. Overall, there is a higher
proportion of males (74%) than females (26%). The proportion of males employed in airport
operation and handling activities is closer to that seen in freight air transport activities rather
than passenger air transport activities. In this sector the proportion of males employed is only
slightly lower than that of the transportation and storage sector more generally, and
significantly higher than that observed in the overall economy.
Figure 6.5: Airport operation and handling (NACE 52.23) persons directly employed by gender, EU28, 2008-2013
Source: Estimate based on Eurostat, Steer Davies Gleave analysis
0%
10%
20%
30%
40%
50%
60%
70%
80%
90%
100%
2008 2009 2010 2011 2012 2013
Ge
nd
er
dis
trib
uti
on
of
pe
rso
ns
em
plo
yed
in
Pas
sen
ger
air
tran
spo
rt, %
Male Female Economy % Males Transp. & storage % Males
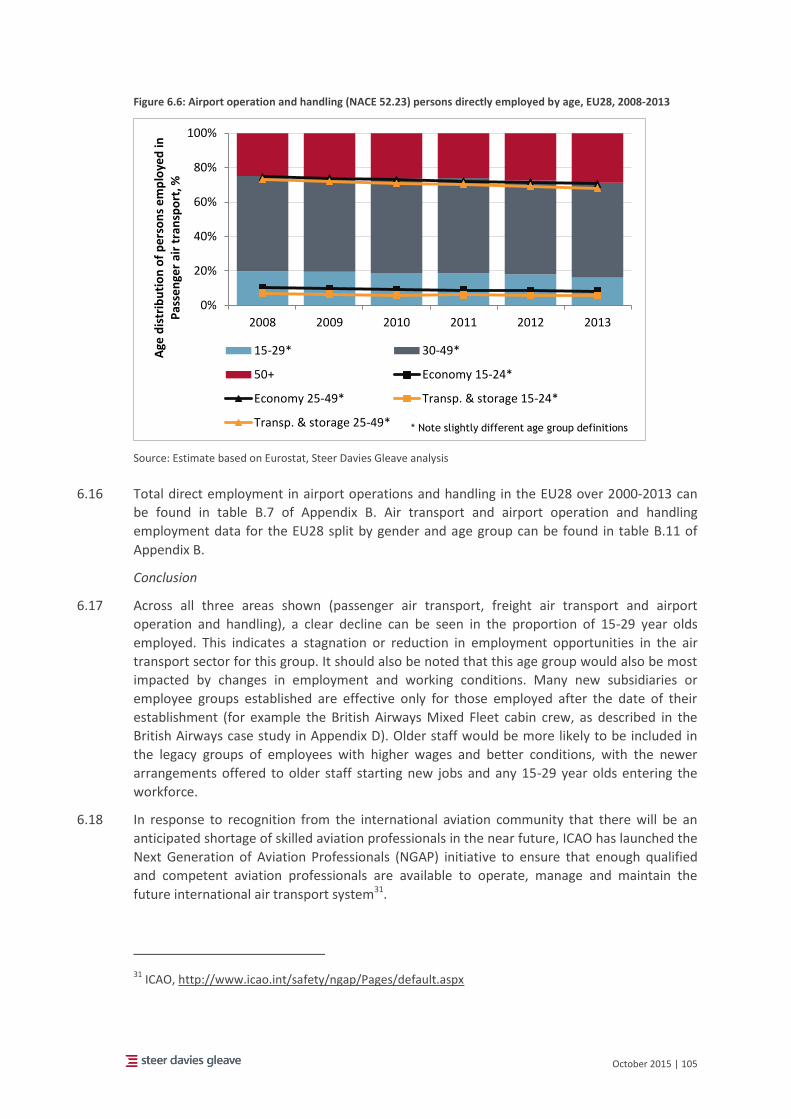
October 2015 | 105
Figure 6.6: Airport operation and handling (NACE 52.23) persons directly employed by age, EU28, 2008-2013
Source: Estimate based on Eurostat, Steer Davies Gleave analysis
6.16 Total direct employment in airport operations and handling in the EU28 over 2000-2013 can
be found in table B.7 of Appendix B. Air transport and airport operation and handling
employment data for the EU28 split by gender and age group can be found in table B.11 of
Appendix B.
Conclusion
6.17 Across all three areas shown (passenger air transport, freight air transport and airport
operation and handling), a clear decline can be seen in the proportion of 15-29 year olds
employed. This indicates a stagnation or reduction in employment opportunities in the air
transport sector for this group. It should also be noted that this age group would also be most
impacted by changes in employment and working conditions. Many new subsidiaries or
employee groups established are effective only for those employed after the date of their
establishment (for example the British Airways Mixed Fleet cabin crew, as described in the
British Airways case study in Appendix D). Older staff would be more likely to be included in
the legacy groups of employees with higher wages and better conditions, with the newer
arrangements offered to older staff starting new jobs and any 15-29 year olds entering the
workforce.
6.18 In response to recognition from the international aviation community that there will be an
anticipated shortage of skilled aviation professionals in the near future, ICAO has launched the
Next Generation of Aviation Professionals (NGAP) initiative to ensure that enough qualified
and competent aviation professionals are available to operate, manage and maintain the
future international air transport system31.
31 ICAO, http://www.icao.int/safety/ngap/Pages/default.aspx
0%
20%
40%
60%
80%
100%
2008 2009 2010 2011 2012 2013
Age
dis
trib
uti
on
of
pe
rso
ns
em
plo
yed
inP
asse
nge
r ai
r tr
ansp
ort
, %
15-29* 30-49*
50+ Economy 15-24*
Economy 25-49* Transp. & storage 15-24*
Transp. & storage 25-49* * Note slightly different age group definitions
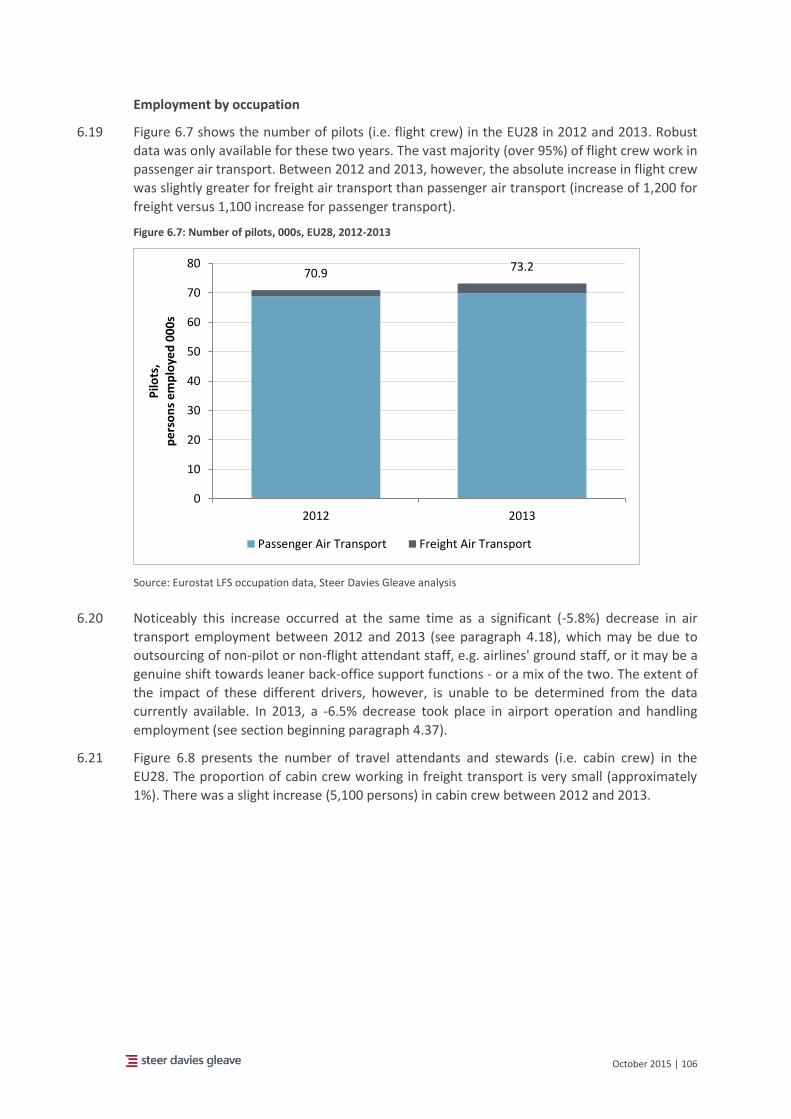
October 2015 | 106
Employment by occupation
6.19 Figure 6.7 shows the number of pilots (i.e. flight crew) in the EU28 in 2012 and 2013. Robust
data was only available for these two years. The vast majority (over 95%) of flight crew work in
passenger air transport. Between 2012 and 2013, however, the absolute increase in flight crew
was slightly greater for freight air transport than passenger air transport (increase of 1,200 for
freight versus 1,100 increase for passenger transport).
Figure 6.7: Number of pilots, 000s, EU28, 2012-2013
Source: Eurostat LFS occupation data, Steer Davies Gleave analysis
6.20 Noticeably this increase occurred at the same time as a significant (-5.8%) decrease in air
transport employment between 2012 and 2013 (see paragraph 4.18), which may be due to
outsourcing of non-pilot or non-flight attendant staff, e.g. airlines' ground staff, or it may be a
genuine shift towards leaner back-office support functions - or a mix of the two. The extent of
the impact of these different drivers, however, is unable to be determined from the data
currently available. In 2013, a -6.5% decrease took place in airport operation and handling
employment (see section beginning paragraph 4.37).
6.21 Figure 6.8 presents the number of travel attendants and stewards (i.e. cabin crew) in the
EU28. The proportion of cabin crew working in freight transport is very small (approximately
1%). There was a slight increase (5,100 persons) in cabin crew between 2012 and 2013.
70.973.2
0
10
20
30
40
50
60
70
80
2012 2013
Pilo
ts,
pe
rso
ns
em
plo
yed
00
0s
Passenger Air Transport Freight Air Transport
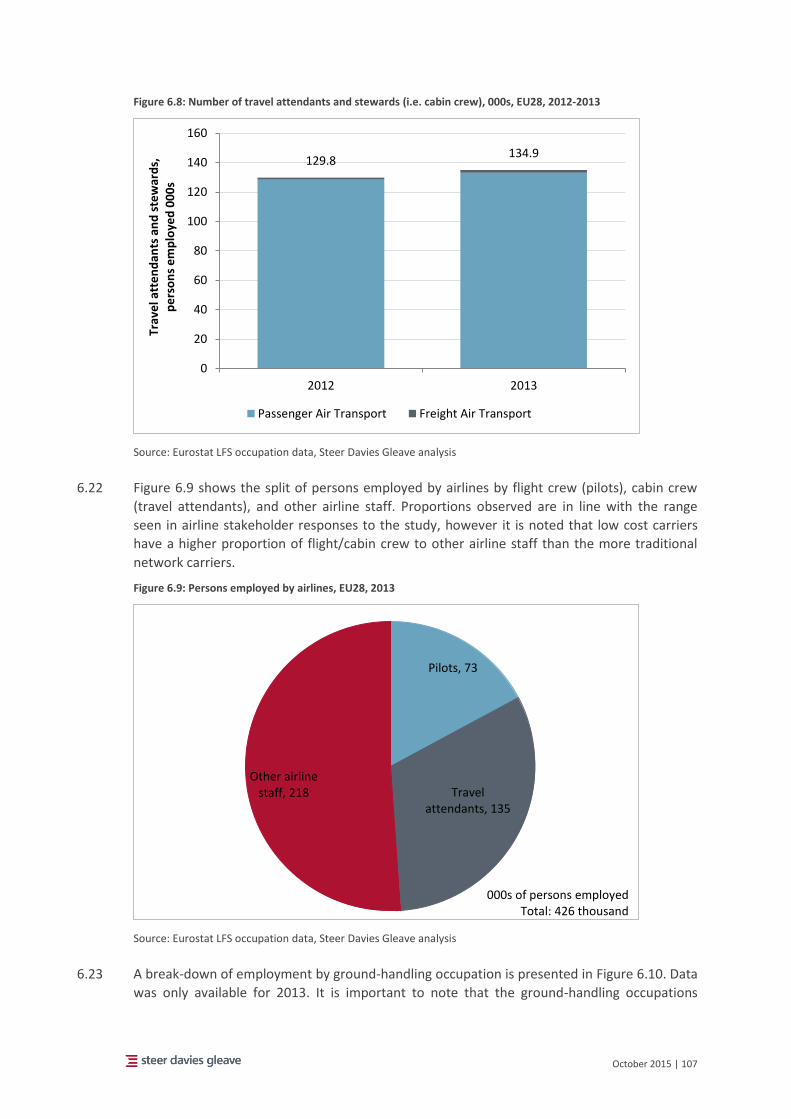
October 2015 | 107
Figure 6.8: Number of travel attendants and stewards (i.e. cabin crew), 000s, EU28, 2012-2013
Source: Eurostat LFS occupation data, Steer Davies Gleave analysis
6.22 Figure 6.9 shows the split of persons employed by airlines by flight crew (pilots), cabin crew
(travel attendants), and other airline staff. Proportions observed are in line with the range
seen in airline stakeholder responses to the study, however it is noted that low cost carriers
have a higher proportion of flight/cabin crew to other airline staff than the more traditional
network carriers.
Figure 6.9: Persons employed by airlines, EU28, 2013
Source: Eurostat LFS occupation data, Steer Davies Gleave analysis
6.23 A break-down of employment by ground-handling occupation is presented in Figure 6.10. Data
was only available for 2013. It is important to note that the ground-handling occupations
129.8134.9
0
20
40
60
80
100
120
140
160
2012 2013
Trav
el a
tte
nd
ants
an
d s
tew
ard
s,p
ers
on
s e
mp
loye
d 0
00
s
Passenger Air Transport Freight Air Transport
Pilots, 73
Travel attendants, 135
Other airline staff, 218
000s of persons employedTotal: 426 thousand
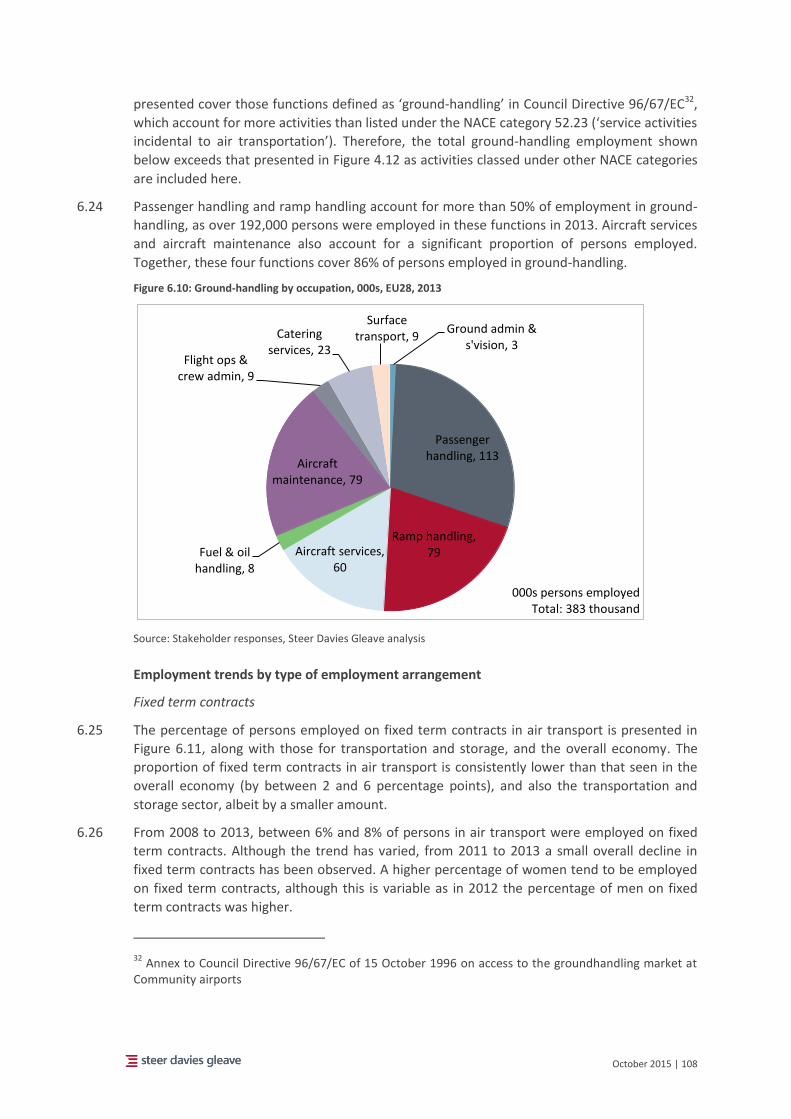
October 2015 | 108
presented cover those functions defined as ‘ground-handling’ in Council Directive 96/67/EC32,
which account for more activities than listed under the NACE category 52.23 (‘service activities
incidental to air transportation’). Therefore, the total ground-handling employment shown
below exceeds that presented in Figure 4.12 as activities classed under other NACE categories
are included here.
6.24 Passenger handling and ramp handling account for more than 50% of employment in ground-
handling, as over 192,000 persons were employed in these functions in 2013. Aircraft services
and aircraft maintenance also account for a significant proportion of persons employed.
Together, these four functions cover 86% of persons employed in ground-handling.
Figure 6.10: Ground-handling by occupation, 000s, EU28, 2013
Source: Stakeholder responses, Steer Davies Gleave analysis
Employment trends by type of employment arrangement
Fixed term contracts
6.25 The percentage of persons employed on fixed term contracts in air transport is presented in
Figure 6.11, along with those for transportation and storage, and the overall economy. The
proportion of fixed term contracts in air transport is consistently lower than that seen in the
overall economy (by between 2 and 6 percentage points), and also the transportation and
storage sector, albeit by a smaller amount.
6.26 From 2008 to 2013, between 6% and 8% of persons in air transport were employed on fixed
term contracts. Although the trend has varied, from 2011 to 2013 a small overall decline in
fixed term contracts has been observed. A higher percentage of women tend to be employed
on fixed term contracts, although this is variable as in 2012 the percentage of men on fixed
term contracts was higher.
32 Annex to Council Directive 96/67/EC of 15 October 1996 on access to the groundhandling market at
Community airports
Ground admin & s'vision, 3
Passenger handling, 113
Ramp handling, 79Aircraft services,
60Fuel & oil
handling, 8
Aircraft maintenance, 79
Flight ops & crew admin, 9
Catering services, 23
Surface transport, 9
000s persons employedTotal: 383 thousand
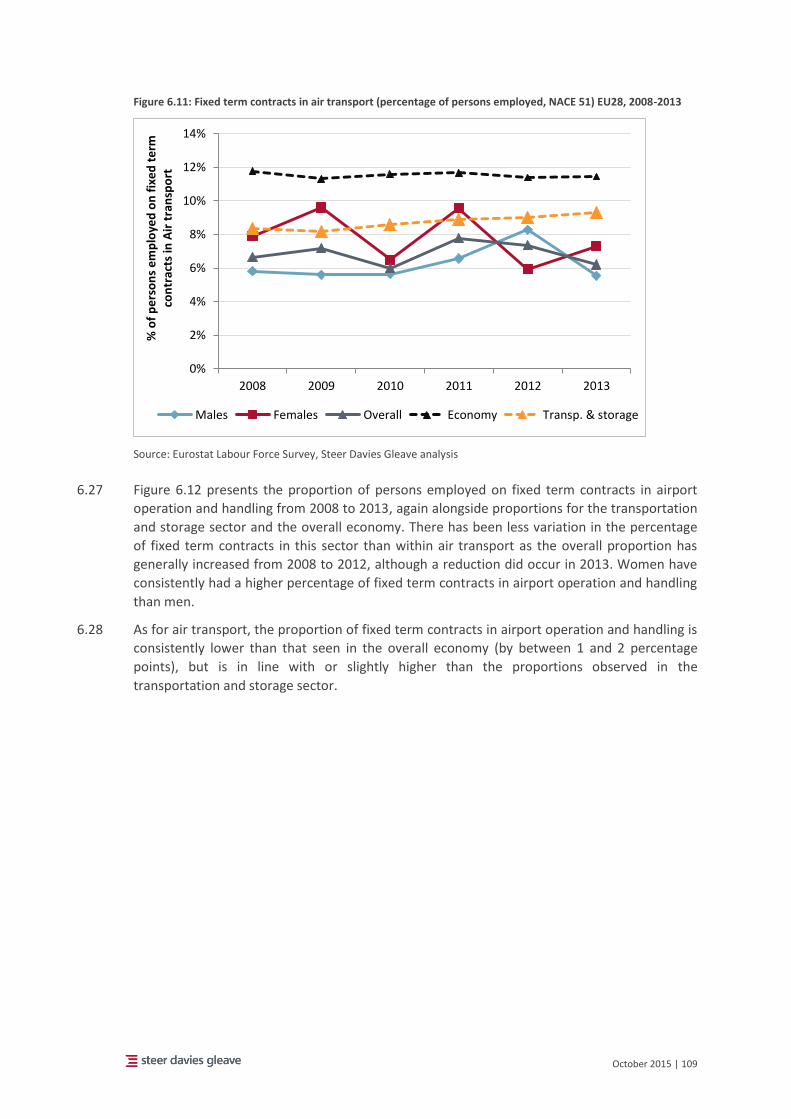
October 2015 | 109
Figure 6.11: Fixed term contracts in air transport (percentage of persons employed, NACE 51) EU28, 2008-2013
Source: Eurostat Labour Force Survey, Steer Davies Gleave analysis
6.27 Figure 6.12 presents the proportion of persons employed on fixed term contracts in airport
operation and handling from 2008 to 2013, again alongside proportions for the transportation
and storage sector and the overall economy. There has been less variation in the percentage
of fixed term contracts in this sector than within air transport as the overall proportion has
generally increased from 2008 to 2012, although a reduction did occur in 2013. Women have
consistently had a higher percentage of fixed term contracts in airport operation and handling
than men.
6.28 As for air transport, the proportion of fixed term contracts in airport operation and handling is
consistently lower than that seen in the overall economy (by between 1 and 2 percentage
points), but is in line with or slightly higher than the proportions observed in the
transportation and storage sector.
0%
2%
4%
6%
8%
10%
12%
14%
2008 2009 2010 2011 2012 2013
% o
f p
ers
on
s e
mp
loye
d o
n f
ixe
d t
erm
co
ntr
acts
in A
ir t
ran
spo
rt
Males Females Overall Economy Transp. & storage
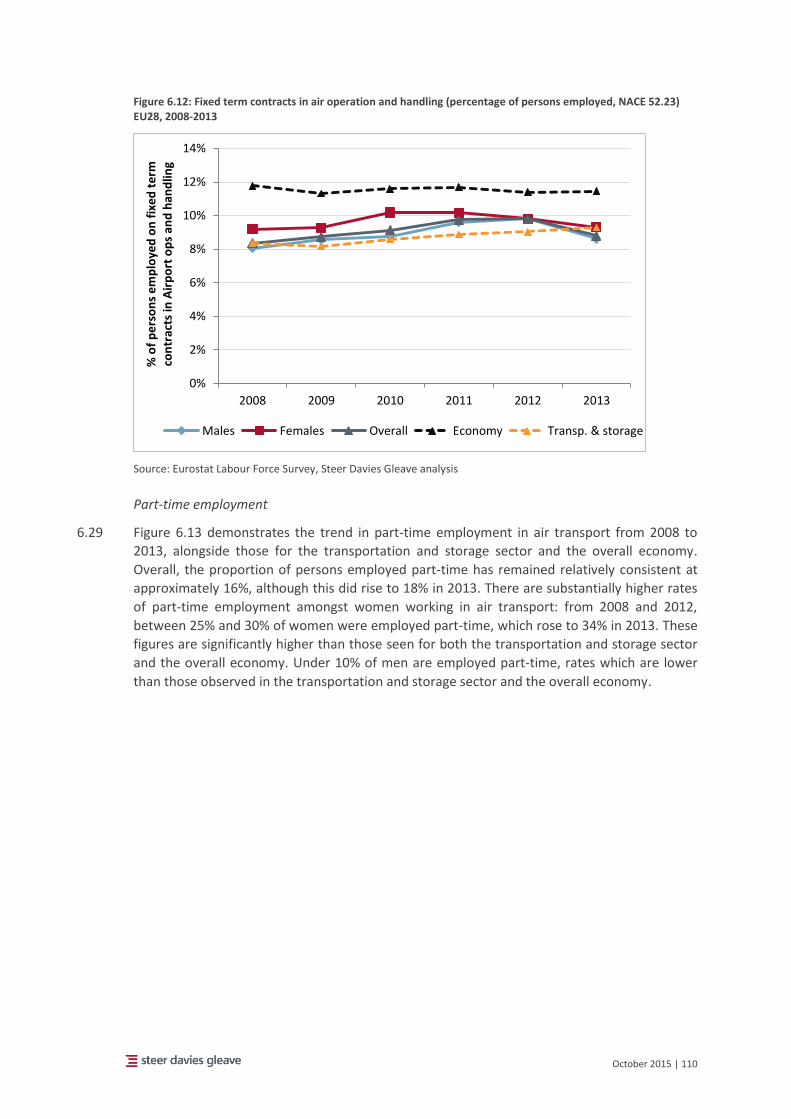
October 2015 | 110
Figure 6.12: Fixed term contracts in air operation and handling (percentage of persons employed, NACE 52.23) EU28, 2008-2013
Source: Eurostat Labour Force Survey, Steer Davies Gleave analysis
Part-time employment
6.29 Figure 6.13 demonstrates the trend in part-time employment in air transport from 2008 to
2013, alongside those for the transportation and storage sector and the overall economy.
Overall, the proportion of persons employed part-time has remained relatively consistent at
approximately 16%, although this did rise to 18% in 2013. There are substantially higher rates
of part-time employment amongst women working in air transport: from 2008 and 2012,
between 25% and 30% of women were employed part-time, which rose to 34% in 2013. These
figures are significantly higher than those seen for both the transportation and storage sector
and the overall economy. Under 10% of men are employed part-time, rates which are lower
than those observed in the transportation and storage sector and the overall economy.
0%
2%
4%
6%
8%
10%
12%
14%
2008 2009 2010 2011 2012 2013
% o
f p
ers
on
s e
mp
loye
d o
n f
ixe
d t
erm
co
ntr
acts
in A
irp
ort
op
s an
d h
and
ling
Males Females Overall Economy Transp. & storage
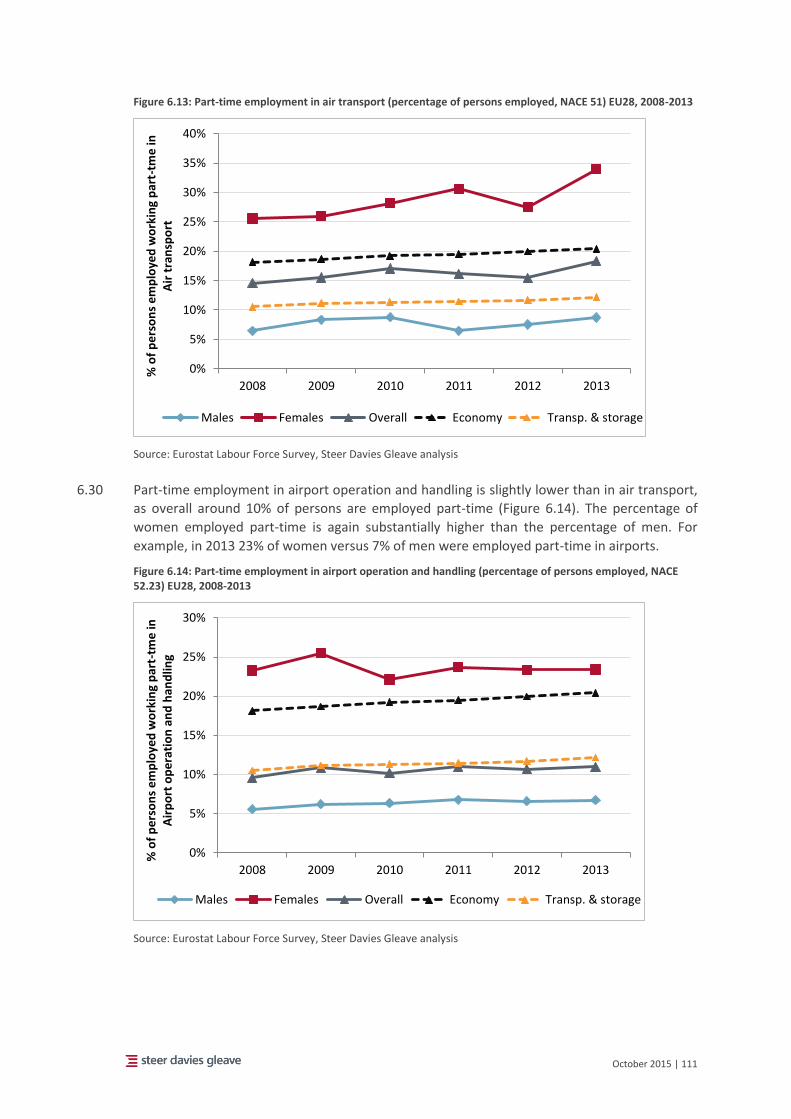
October 2015 | 111
Figure 6.13: Part-time employment in air transport (percentage of persons employed, NACE 51) EU28, 2008-2013
Source: Eurostat Labour Force Survey, Steer Davies Gleave analysis
6.30 Part-time employment in airport operation and handling is slightly lower than in air transport,
as overall around 10% of persons are employed part-time (Figure 6.14). The percentage of
women employed part-time is again substantially higher than the percentage of men. For
example, in 2013 23% of women versus 7% of men were employed part-time in airports.
Figure 6.14: Part-time employment in airport operation and handling (percentage of persons employed, NACE 52.23) EU28, 2008-2013
Source: Eurostat Labour Force Survey, Steer Davies Gleave analysis
0%
5%
10%
15%
20%
25%
30%
35%
40%
2008 2009 2010 2011 2012 2013
% o
f p
ers
on
s e
mp
loye
d w
ork
ing
par
t-tm
e in
A
ir t
ran
spo
rt
Males Females Overall Economy Transp. & storage
0%
5%
10%
15%
20%
25%
30%
2008 2009 2010 2011 2012 2013
% o
f p
ers
on
s e
mp
loye
d w
ork
ing
par
t-tm
e in
A
irp
ort
op
era
tio
n a
nd
han
dlin
g
Males Females Overall Economy Transp. & storage
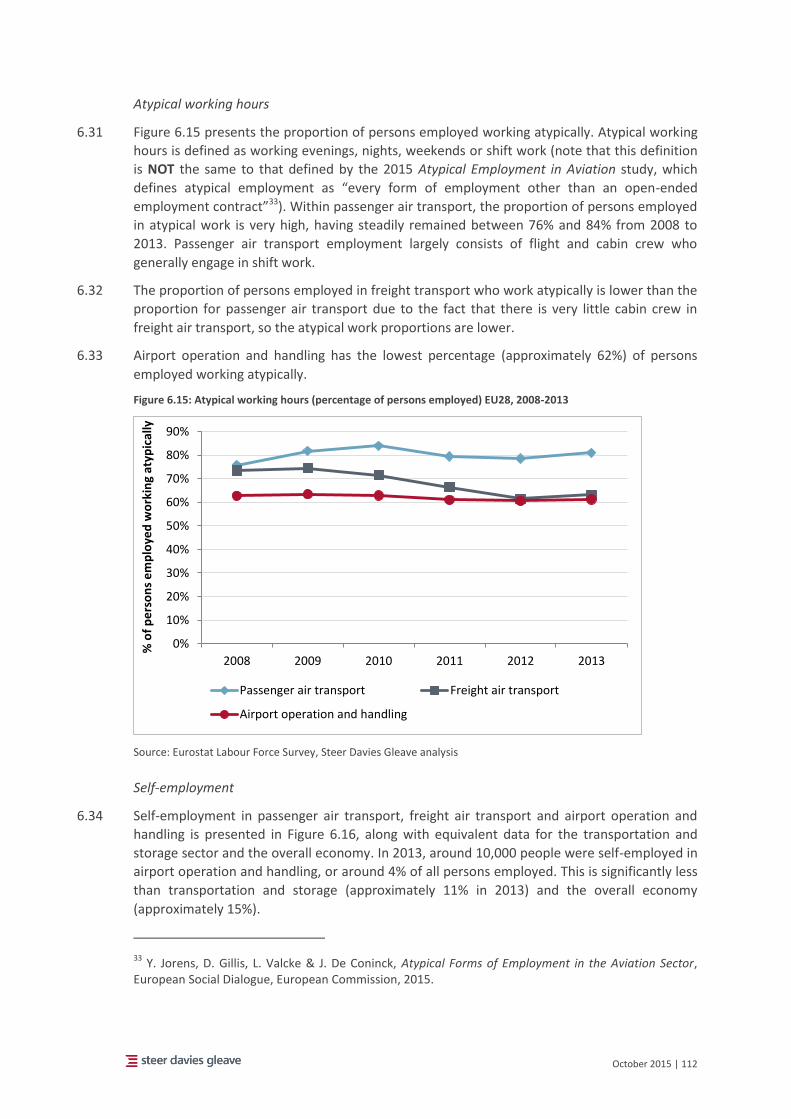
October 2015 | 112
Atypical working hours
6.31 Figure 6.15 presents the proportion of persons employed working atypically. Atypical working
hours is defined as working evenings, nights, weekends or shift work (note that this definition
is NOT the same to that defined by the 2015 Atypical Employment in Aviation study, which
defines atypical employment as “every form of employment other than an open-ended
employment contract”33). Within passenger air transport, the proportion of persons employed
in atypical work is very high, having steadily remained between 76% and 84% from 2008 to
2013. Passenger air transport employment largely consists of flight and cabin crew who
generally engage in shift work.
6.32 The proportion of persons employed in freight transport who work atypically is lower than the
proportion for passenger air transport due to the fact that there is very little cabin crew in
freight air transport, so the atypical work proportions are lower.
6.33 Airport operation and handling has the lowest percentage (approximately 62%) of persons
employed working atypically.
Figure 6.15: Atypical working hours (percentage of persons employed) EU28, 2008-2013
Source: Eurostat Labour Force Survey, Steer Davies Gleave analysis
Self-employment
6.34 Self-employment in passenger air transport, freight air transport and airport operation and
handling is presented in Figure 6.16, along with equivalent data for the transportation and
storage sector and the overall economy. In 2013, around 10,000 people were self-employed in
airport operation and handling, or around 4% of all persons employed. This is significantly less
than transportation and storage (approximately 11% in 2013) and the overall economy
(approximately 15%).
33 Y. Jorens, D. Gillis, L. Valcke & J. De Coninck, Atypical Forms of Employment in the Aviation Sector,
European Social Dialogue, European Commission, 2015.
0%
10%
20%
30%
40%
50%
60%
70%
80%
90%
2008 2009 2010 2011 2012 2013
% o
f p
ers
on
s e
mp
loye
d w
ork
ing
atyp
ical
ly
Passenger air transport Freight air transport
Airport operation and handling
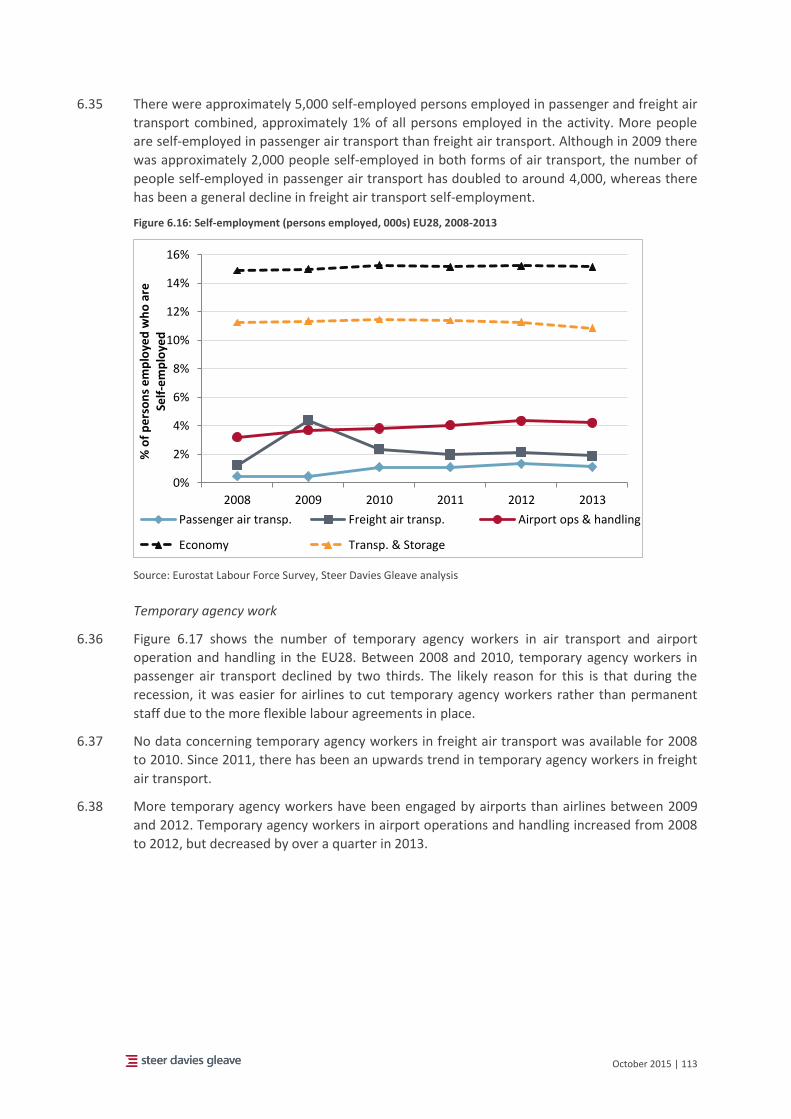
October 2015 | 113
6.35 There were approximately 5,000 self-employed persons employed in passenger and freight air
transport combined, approximately 1% of all persons employed in the activity. More people
are self-employed in passenger air transport than freight air transport. Although in 2009 there
was approximately 2,000 people self-employed in both forms of air transport, the number of
people self-employed in passenger air transport has doubled to around 4,000, whereas there
has been a general decline in freight air transport self-employment.
Figure 6.16: Self-employment (persons employed, 000s) EU28, 2008-2013
Source: Eurostat Labour Force Survey, Steer Davies Gleave analysis
Temporary agency work
6.36 Figure 6.17 shows the number of temporary agency workers in air transport and airport
operation and handling in the EU28. Between 2008 and 2010, temporary agency workers in
passenger air transport declined by two thirds. The likely reason for this is that during the
recession, it was easier for airlines to cut temporary agency workers rather than permanent
staff due to the more flexible labour agreements in place.
6.37 No data concerning temporary agency workers in freight air transport was available for 2008
to 2010. Since 2011, there has been an upwards trend in temporary agency workers in freight
air transport.
6.38 More temporary agency workers have been engaged by airports than airlines between 2009
and 2012. Temporary agency workers in airport operations and handling increased from 2008
to 2012, but decreased by over a quarter in 2013.
0%
2%
4%
6%
8%
10%
12%
14%
16%
2008 2009 2010 2011 2012 2013
% o
f p
ers
on
s e
mp
loye
d w
ho
are
Self
-em
plo
yed
Passenger air transp. Freight air transp. Airport ops & handling
Economy Transp. & Storage
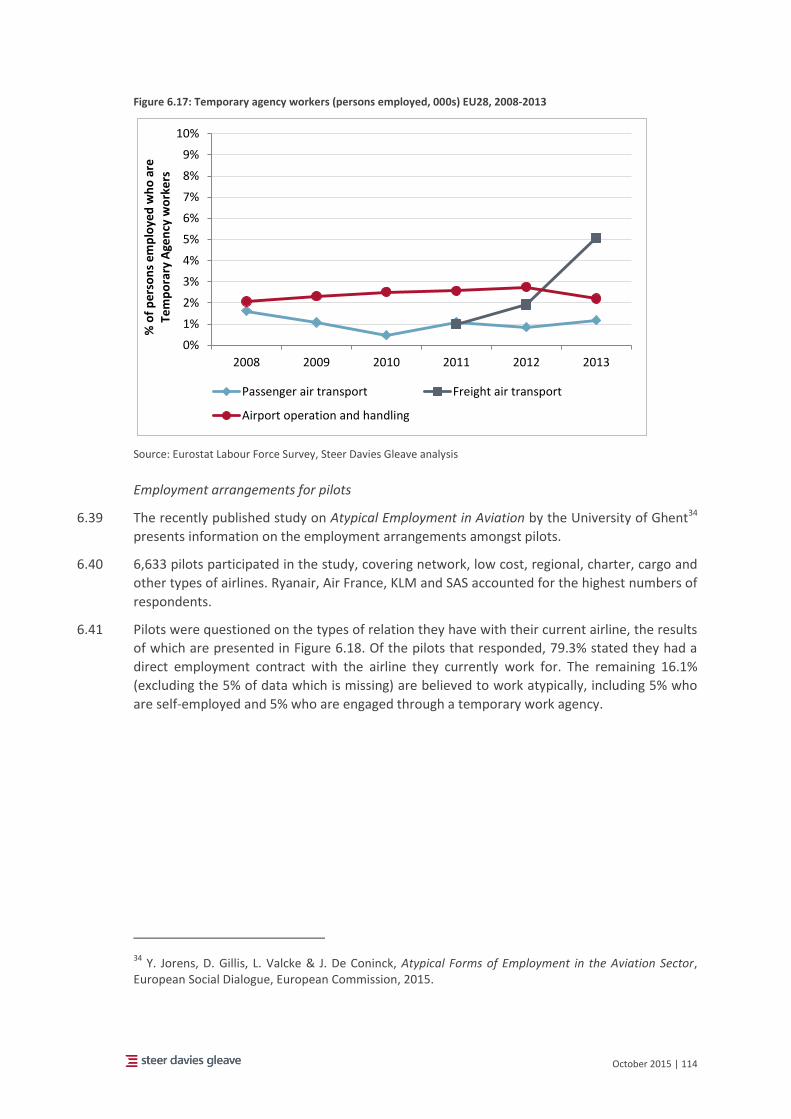
October 2015 | 114
Figure 6.17: Temporary agency workers (persons employed, 000s) EU28, 2008-2013
Source: Eurostat Labour Force Survey, Steer Davies Gleave analysis
Employment arrangements for pilots
6.39 The recently published study on Atypical Employment in Aviation by the University of Ghent34
presents information on the employment arrangements amongst pilots.
6.40 6,633 pilots participated in the study, covering network, low cost, regional, charter, cargo and
other types of airlines. Ryanair, Air France, KLM and SAS accounted for the highest numbers of
respondents.
6.41 Pilots were questioned on the types of relation they have with their current airline, the results
of which are presented in Figure 6.18. Of the pilots that responded, 79.3% stated they had a
direct employment contract with the airline they currently work for. The remaining 16.1%
(excluding the 5% of data which is missing) are believed to work atypically, including 5% who
are self-employed and 5% who are engaged through a temporary work agency.
34 Y. Jorens, D. Gillis, L. Valcke & J. De Coninck, Atypical Forms of Employment in the Aviation Sector,
European Social Dialogue, European Commission, 2015.
0%
1%
2%
3%
4%
5%
6%
7%
8%
9%
10%
2008 2009 2010 2011 2012 2013
% o
f p
ers
on
s e
mp
loye
d w
ho
are
Tem
po
rary
Age
ncy
wo
rke
rs
Passenger air transport Freight air transport
Airport operation and handling
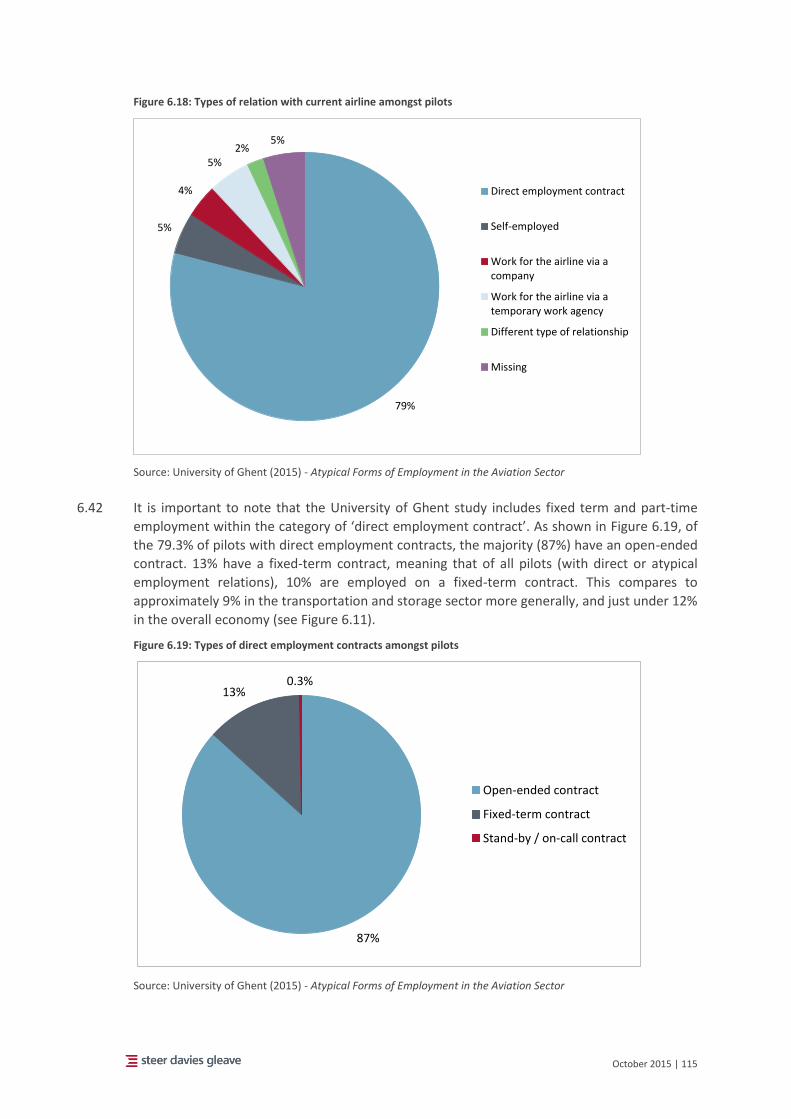
October 2015 | 115
Figure 6.18: Types of relation with current airline amongst pilots
Source: University of Ghent (2015) - Atypical Forms of Employment in the Aviation Sector
6.42 It is important to note that the University of Ghent study includes fixed term and part-time
employment within the category of ‘direct employment contract’. As shown in Figure 6.19, of
the 79.3% of pilots with direct employment contracts, the majority (87%) have an open-ended
contract. 13% have a fixed-term contract, meaning that of all pilots (with direct or atypical
employment relations), 10% are employed on a fixed-term contract. This compares to
approximately 9% in the transportation and storage sector more generally, and just under 12%
in the overall economy (see Figure 6.11).
Figure 6.19: Types of direct employment contracts amongst pilots
Source: University of Ghent (2015) - Atypical Forms of Employment in the Aviation Sector
79%
5%
4%
5%2%
5%
Direct employment contract
Self-employed
Work for the airline via acompany
Work for the airline via atemporary work agency
Different type of relationship
Missing
87%
13%0.3%
Open-ended contract
Fixed-term contract
Stand-by / on-call contract
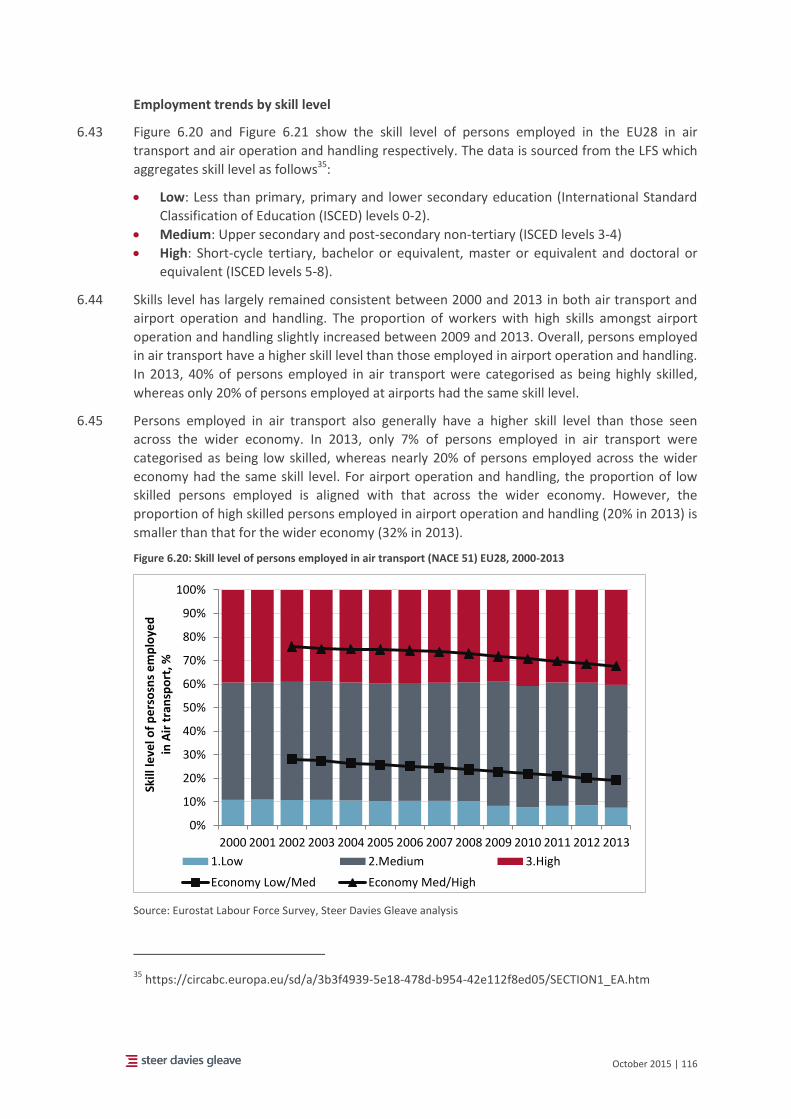
October 2015 | 116
Employment trends by skill level
6.43 Figure 6.20 and Figure 6.21 show the skill level of persons employed in the EU28 in air
transport and air operation and handling respectively. The data is sourced from the LFS which
aggregates skill level as follows35:
Low: Less than primary, primary and lower secondary education (International Standard
Classification of Education (ISCED) levels 0-2).
Medium: Upper secondary and post-secondary non-tertiary (ISCED levels 3-4)
High: Short-cycle tertiary, bachelor or equivalent, master or equivalent and doctoral or
equivalent (ISCED levels 5-8).
6.44 Skills level has largely remained consistent between 2000 and 2013 in both air transport and
airport operation and handling. The proportion of workers with high skills amongst airport
operation and handling slightly increased between 2009 and 2013. Overall, persons employed
in air transport have a higher skill level than those employed in airport operation and handling.
In 2013, 40% of persons employed in air transport were categorised as being highly skilled,
whereas only 20% of persons employed at airports had the same skill level.
6.45 Persons employed in air transport also generally have a higher skill level than those seen
across the wider economy. In 2013, only 7% of persons employed in air transport were
categorised as being low skilled, whereas nearly 20% of persons employed across the wider
economy had the same skill level. For airport operation and handling, the proportion of low
skilled persons employed is aligned with that across the wider economy. However, the
proportion of high skilled persons employed in airport operation and handling (20% in 2013) is
smaller than that for the wider economy (32% in 2013).
Figure 6.20: Skill level of persons employed in air transport (NACE 51) EU28, 2000-2013
Source: Eurostat Labour Force Survey, Steer Davies Gleave analysis
35 https://circabc.europa.eu/sd/a/3b3f4939-5e18-478d-b954-42e112f8ed05/SECTION1_EA.htm
0%
10%
20%
30%
40%
50%
60%
70%
80%
90%
100%
2000 2001 2002 2003 2004 2005 2006 2007 2008 2009 2010 2011 2012 2013
Skill
leve
l of
pe
rso
sns
em
plo
yed
in A
ir t
ran
spo
rt, %
1.Low 2.Medium 3.High
Economy Low/Med Economy Med/High
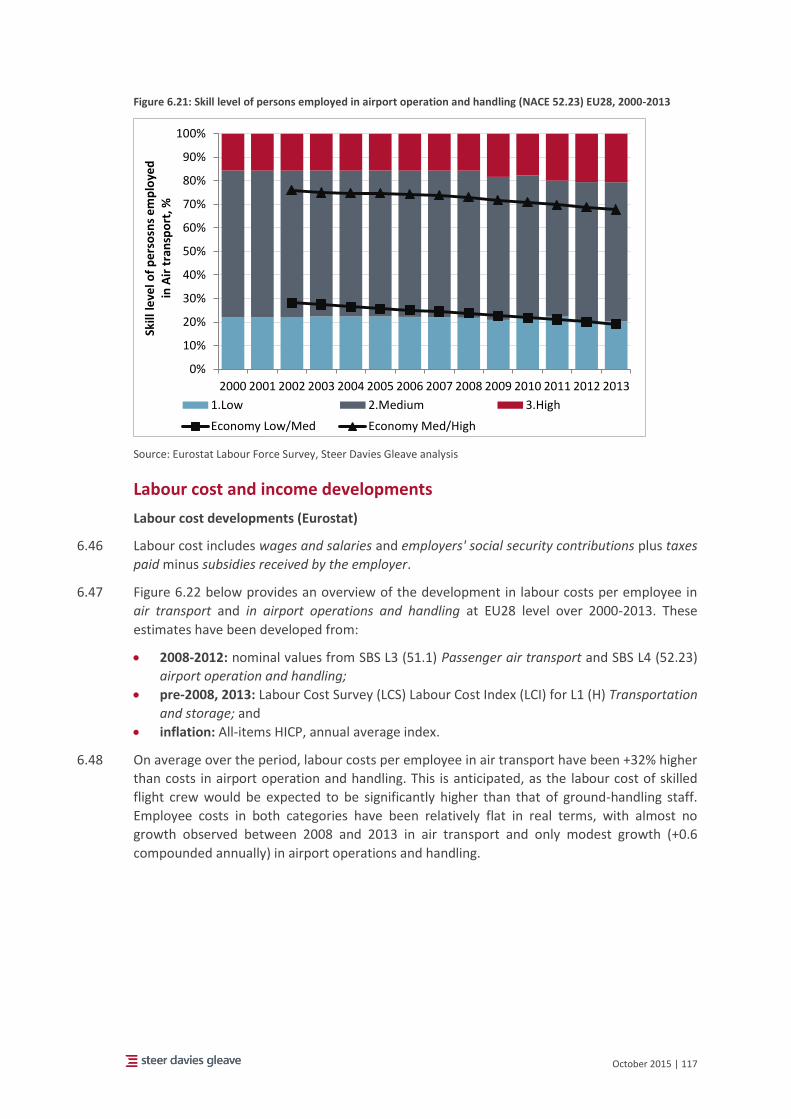
October 2015 | 117
Figure 6.21: Skill level of persons employed in airport operation and handling (NACE 52.23) EU28, 2000-2013
Source: Eurostat Labour Force Survey, Steer Davies Gleave analysis
Labour cost and income developments
Labour cost developments (Eurostat)
6.46 Labour cost includes wages and salaries and employers' social security contributions plus taxes
paid minus subsidies received by the employer.
6.47 Figure 6.22 below provides an overview of the development in labour costs per employee in
air transport and in airport operations and handling at EU28 level over 2000-2013. These
estimates have been developed from:
2008-2012: nominal values from SBS L3 (51.1) Passenger air transport and SBS L4 (52.23)
airport operation and handling;
pre-2008, 2013: Labour Cost Survey (LCS) Labour Cost Index (LCI) for L1 (H) Transportation
and storage; and
inflation: All-items HICP, annual average index.
6.48 On average over the period, labour costs per employee in air transport have been +32% higher
than costs in airport operation and handling. This is anticipated, as the labour cost of skilled
flight crew would be expected to be significantly higher than that of ground-handling staff.
Employee costs in both categories have been relatively flat in real terms, with almost no
growth observed between 2008 and 2013 in air transport and only modest growth (+0.6
compounded annually) in airport operations and handling.
0%
10%
20%
30%
40%
50%
60%
70%
80%
90%
100%
2000 2001 2002 2003 2004 2005 2006 2007 2008 2009 2010 2011 2012 2013
Skill
leve
l of
pe
rso
sns
em
plo
yed
in A
ir t
ran
spo
rt, %
1.Low 2.Medium 3.High
Economy Low/Med Economy Med/High
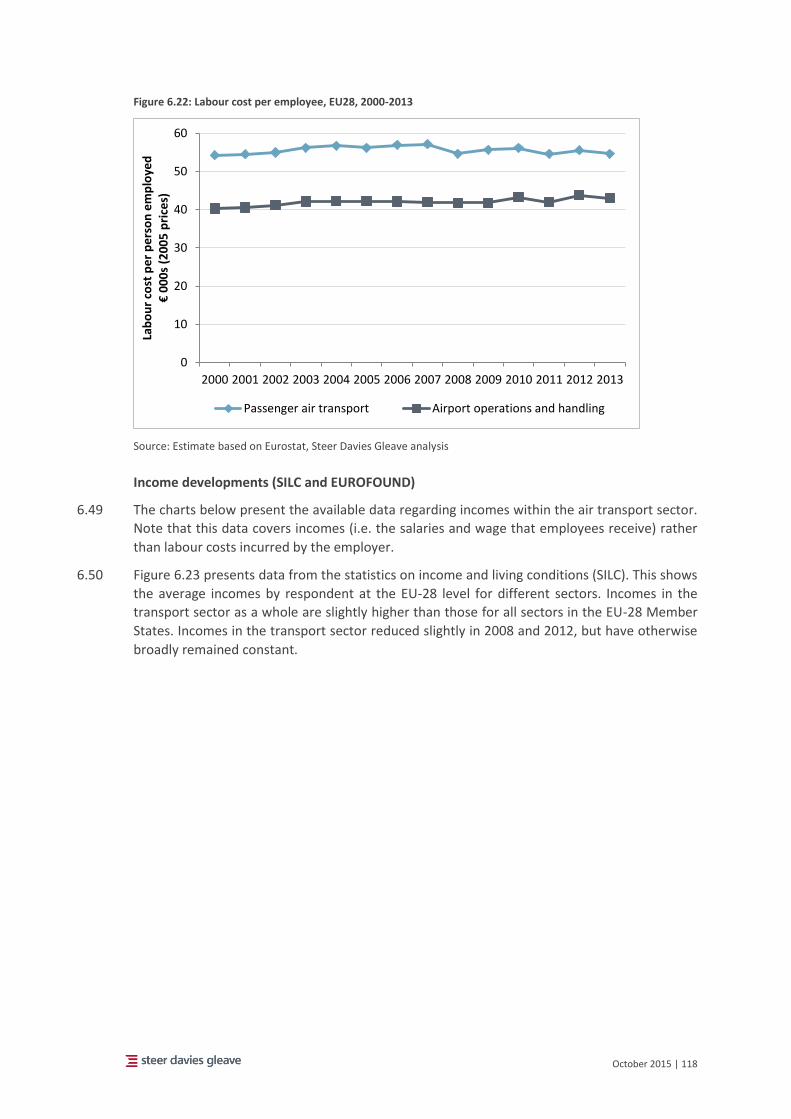
October 2015 | 118
Figure 6.22: Labour cost per employee, EU28, 2000-2013
Source: Estimate based on Eurostat, Steer Davies Gleave analysis
Income developments (SILC and EUROFOUND)
6.49 The charts below present the available data regarding incomes within the air transport sector.
Note that this data covers incomes (i.e. the salaries and wage that employees receive) rather
than labour costs incurred by the employer.
6.50 Figure 6.23 presents data from the statistics on income and living conditions (SILC). This shows
the average incomes by respondent at the EU-28 level for different sectors. Incomes in the
transport sector as a whole are slightly higher than those for all sectors in the EU-28 Member
States. Incomes in the transport sector reduced slightly in 2008 and 2012, but have otherwise
broadly remained constant.
0
10
20
30
40
50
60
2000 2001 2002 2003 2004 2005 2006 2007 2008 2009 2010 2011 2012 2013
Lab
ou
r co
st p
er
pe
rso
n e
mp
loye
d€
00
0s
(20
05
pri
ces)
Passenger air transport Airport operations and handling
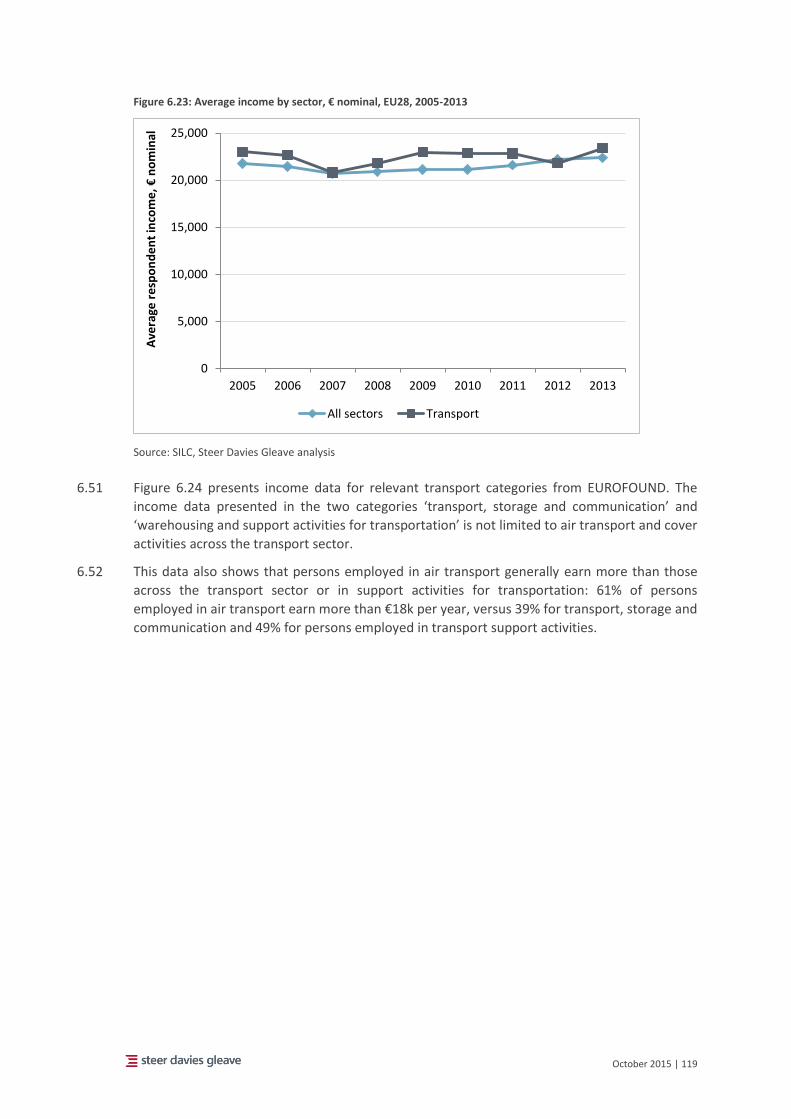
October 2015 | 119
Figure 6.23: Average income by sector, € nominal, EU28, 2005-2013
Source: SILC, Steer Davies Gleave analysis
6.51 Figure 6.24 presents income data for relevant transport categories from EUROFOUND. The
income data presented in the two categories ‘transport, storage and communication’ and
‘warehousing and support activities for transportation’ is not limited to air transport and cover
activities across the transport sector.
6.52 This data also shows that persons employed in air transport generally earn more than those
across the transport sector or in support activities for transportation: 61% of persons
employed in air transport earn more than €18k per year, versus 39% for transport, storage and
communication and 49% for persons employed in transport support activities.
0
5,000
10,000
15,000
20,000
25,000
2005 2006 2007 2008 2009 2010 2011 2012 2013
Ave
rage
re
spo
nd
en
t in
com
e, €
no
min
al
All sectors Transport
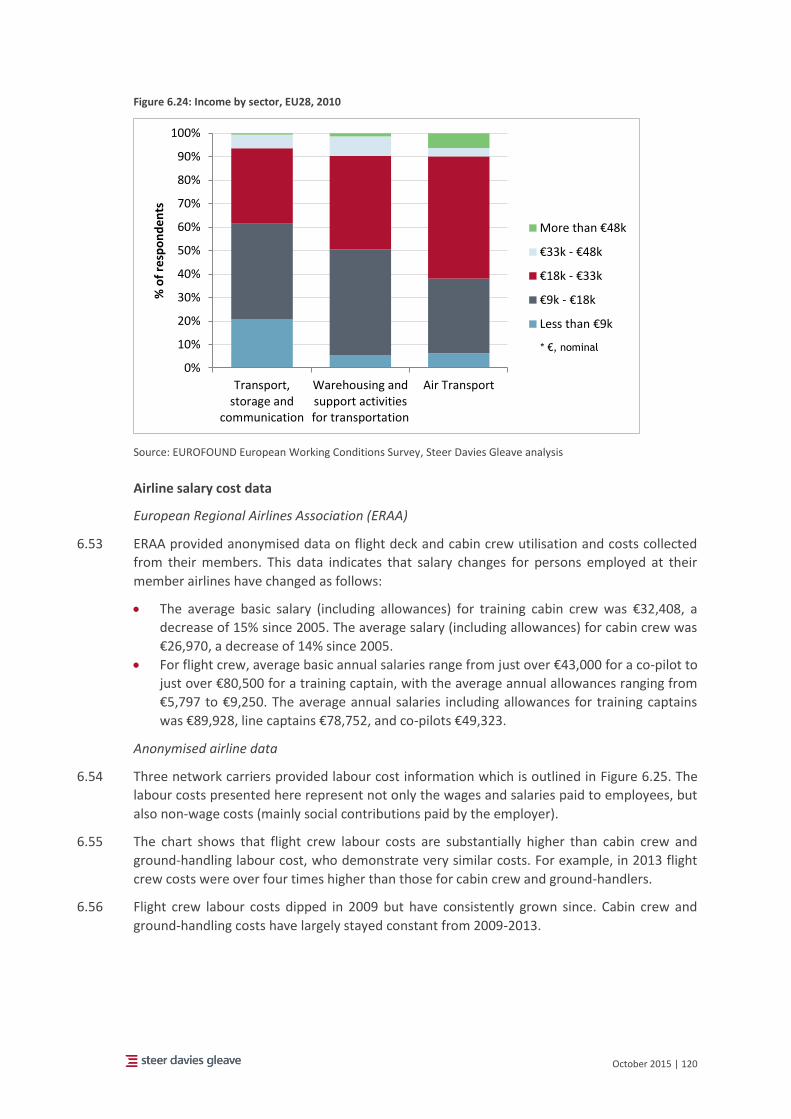
October 2015 | 120
Figure 6.24: Income by sector, EU28, 2010
Source: EUROFOUND European Working Conditions Survey, Steer Davies Gleave analysis
Airline salary cost data
European Regional Airlines Association (ERAA)
6.53 ERAA provided anonymised data on flight deck and cabin crew utilisation and costs collected
from their members. This data indicates that salary changes for persons employed at their
member airlines have changed as follows:
The average basic salary (including allowances) for training cabin crew was €32,408, a
decrease of 15% since 2005. The average salary (including allowances) for cabin crew was
€26,970, a decrease of 14% since 2005.
For flight crew, average basic annual salaries range from just over €43,000 for a co-pilot to
just over €80,500 for a training captain, with the average annual allowances ranging from
€5,797 to €9,250. The average annual salaries including allowances for training captains
was €89,928, line captains €78,752, and co-pilots €49,323.
Anonymised airline data
6.54 Three network carriers provided labour cost information which is outlined in Figure 6.25. The
labour costs presented here represent not only the wages and salaries paid to employees, but
also non-wage costs (mainly social contributions paid by the employer).
6.55 The chart shows that flight crew labour costs are substantially higher than cabin crew and
ground-handling labour cost, who demonstrate very similar costs. For example, in 2013 flight
crew costs were over four times higher than those for cabin crew and ground-handlers.
6.56 Flight crew labour costs dipped in 2009 but have consistently grown since. Cabin crew and
ground-handling costs have largely stayed constant from 2009-2013.
0%
10%
20%
30%
40%
50%
60%
70%
80%
90%
100%
Transport,storage and
communication
Warehousing andsupport activitiesfor transportation
Air Transport
% o
f re
spo
nd
en
ts
More than €48k
€33k - €48k
€18k - €33k
€9k - €18k
Less than €9k
* €, nominal
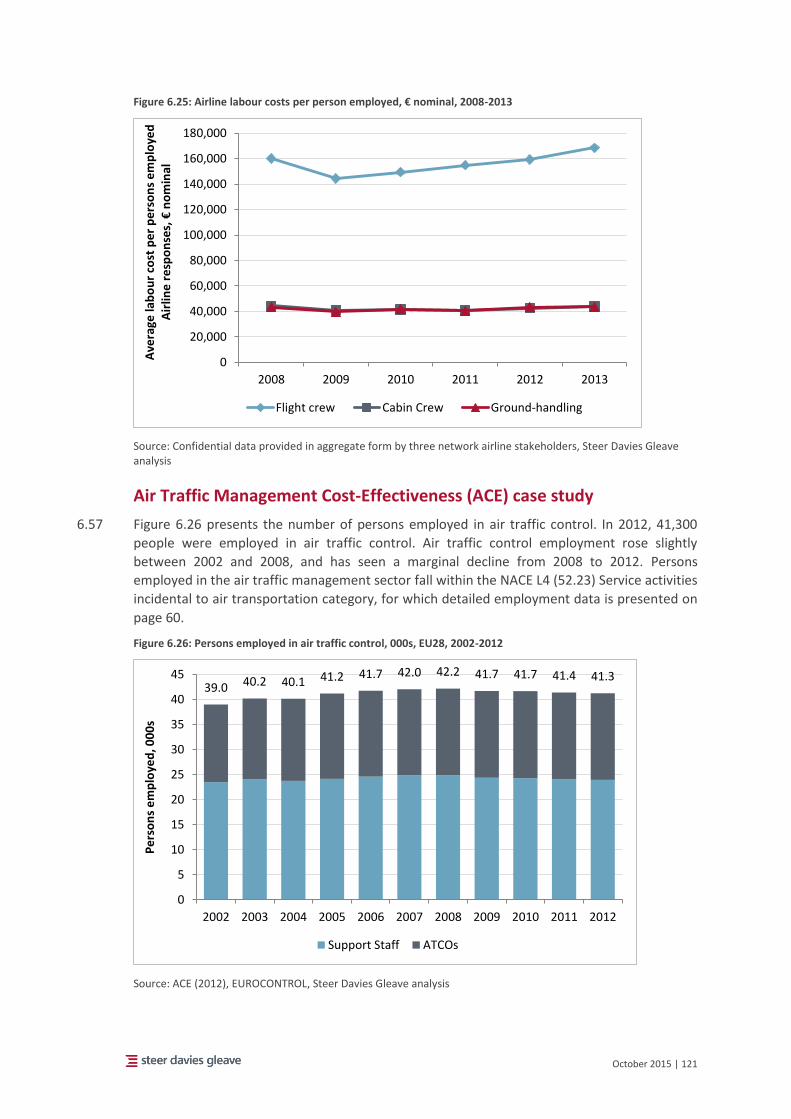
October 2015 | 121
Figure 6.25: Airline labour costs per person employed, € nominal, 2008-2013
Source: Confidential data provided in aggregate form by three network airline stakeholders, Steer Davies Gleave analysis
Air Traffic Management Cost-Effectiveness (ACE) case study
6.57 Figure 6.26 presents the number of persons employed in air traffic control. In 2012, 41,300
people were employed in air traffic control. Air traffic control employment rose slightly
between 2002 and 2008, and has seen a marginal decline from 2008 to 2012. Persons
employed in the air traffic management sector fall within the NACE L4 (52.23) Service activities
incidental to air transportation category, for which detailed employment data is presented on
page 60.
Figure 6.26: Persons employed in air traffic control, 000s, EU28, 2002-2012
Source: ACE (2012), EUROCONTROL, Steer Davies Gleave analysis
0
20,000
40,000
60,000
80,000
100,000
120,000
140,000
160,000
180,000
2008 2009 2010 2011 2012 2013
Ave
rage
lab
ou
r co
st p
er
pe
rso
ns
em
plo
yed
Air
line
re
spo
nse
s, €
no
min
al
Flight crew Cabin Crew Ground-handling
39.0 40.2 40.1 41.2 41.7 42.0 42.2 41.7 41.7 41.4 41.3
0
5
10
15
20
25
30
35
40
45
2002 2003 2004 2005 2006 2007 2008 2009 2010 2011 2012
Pe
rso
ns
em
plo
yed
, 00
0s
Support Staff ATCOs
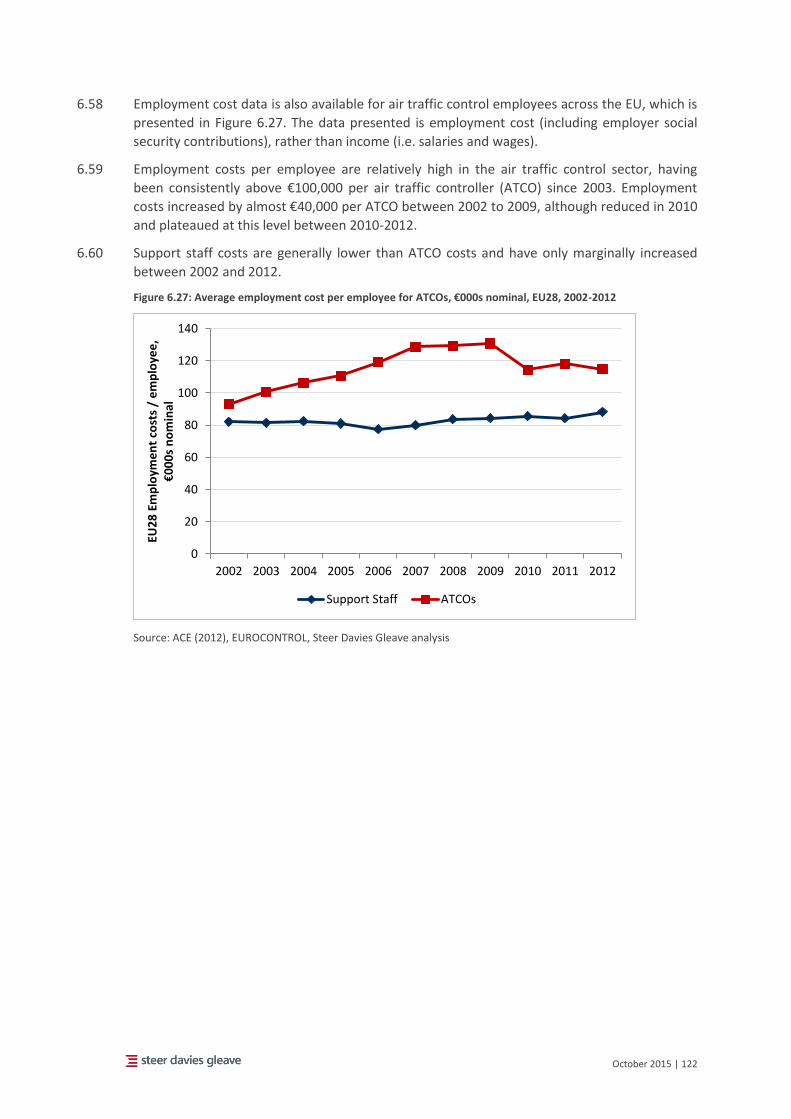
October 2015 | 122
6.58 Employment cost data is also available for air traffic control employees across the EU, which is
presented in Figure 6.27. The data presented is employment cost (including employer social
security contributions), rather than income (i.e. salaries and wages).
6.59 Employment costs per employee are relatively high in the air traffic control sector, having
been consistently above €100,000 per air traffic controller (ATCO) since 2003. Employment
costs increased by almost €40,000 per ATCO between 2002 to 2009, although reduced in 2010
and plateaued at this level between 2010-2012.
6.60 Support staff costs are generally lower than ATCO costs and have only marginally increased
between 2002 and 2012.
Figure 6.27: Average employment cost per employee for ATCOs, €000s nominal, EU28, 2002-2012
Source: ACE (2012), EUROCONTROL, Steer Davies Gleave analysis
0
20
40
60
80
100
120
140
2002 2003 2004 2005 2006 2007 2008 2009 2010 2011 2012
EU2
8 E
mp
loym
en
t co
sts
/ e
mp
loye
e,
€0
00
s n
om
inal
Support Staff ATCOs
October 2015 | 123
Productivity and value added
6.61 This section presents a comparative analysis of trends in employment, value added and traffic
for the following activities and (sub-)clusters:
Air transport;
Airport operation and handling;
The Air transport cluster (sub-clusters (a) and (b)); and
Other airport-related activities (sub-cluster (c)).
6.62 An assessment of developments in labour productivity is made for the first two activities,
along with an estimate for the growth in jobs due to increased traffic. This section builds on
the productivity analysis included in the 2012 study36.
Productivity and other factors influencing direct employment
6.63 All other things being equal, increased traffic volumes should lead to increased employment in
the sector. However, in practice, increases to labour productivity and changes in the nature of
the services airlines provide can offset this effect.
6.64 This section summarises the factors which have influenced the development of air transport
and airport employment in the EU over the period 2000-2013. The historical relationship
between employment, traffic and other growth drivers are examined, and to the extent
possible, the factors impacting employment in air transport and airports in the EU are
identified.
Historical relationship between traffic and employment
6.65 An understanding of the historical relationship between different traffic measurements and
employment in the air transport sector is needed in order to estimate productivity gains.
Passenger data and flights data have been compared with the estimates of employment in air
transport and at airports in order to evaluate the extent to which additional traffic has led to
additional employment, and what productivity gains have been made.
6.66 The traffic metrics that are the main factors impacting employment in air transport and
airports in the EU and that are most representative as a driver of employment growth have
been identified. In particular:
In air transport, employment of different types of staff is driven by different factors. For
example, the need for pilots is mostly determined by aircraft flight hours, for which flight
kilometres is the best available proxy as data for flight hours is usually not available. The
long term trend towards use of aircraft with more seats, and higher load factors, is likely
to have reduced employment per passenger carried.
At airports, employment is more directly related to passengers handled but can be also
influenced by the number of air transport movements. There will also be a minimum
number of employees needed to run a terminal and airfield facilities, irrespective of the
level of traffic using the airport.
36 "Study on the effects of the implementation of the EU aviation common market on employment and
working conditions in the Air Transport Sector over the period 1997/2010" conducted by Steer Davies Gleave in 2012.
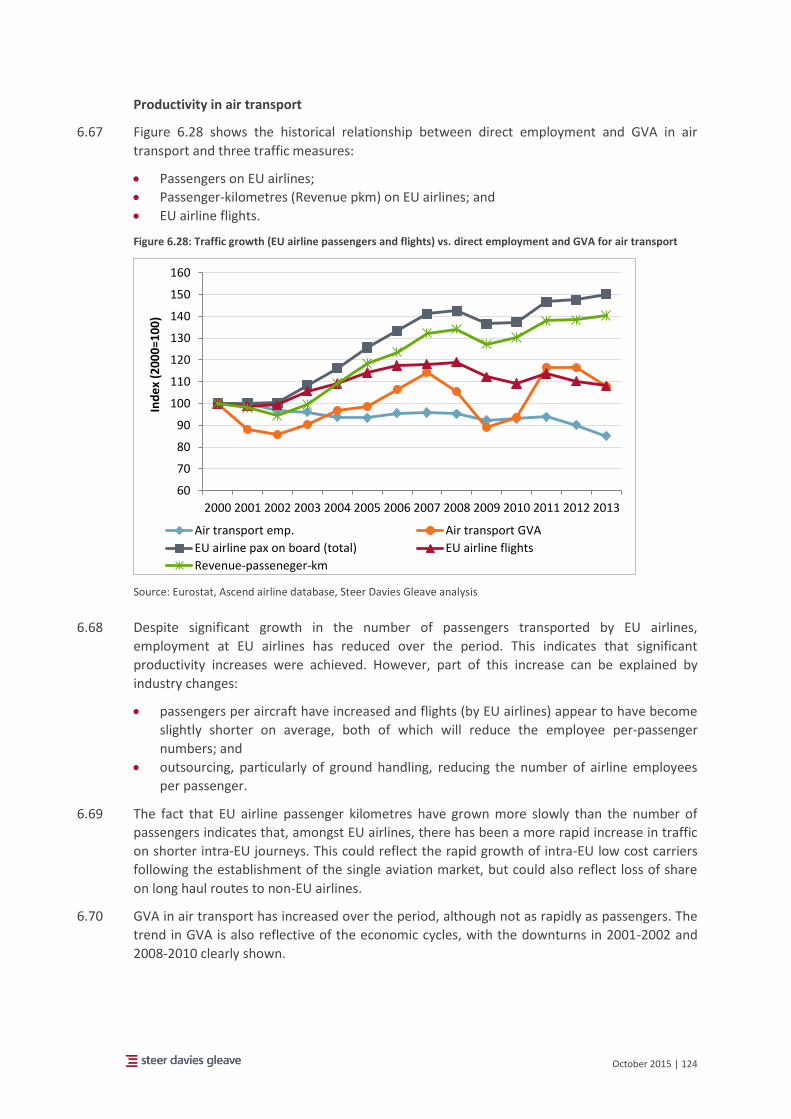
October 2015 | 124
Productivity in air transport
6.67 Figure 6.28 shows the historical relationship between direct employment and GVA in air
transport and three traffic measures:
Passengers on EU airlines;
Passenger-kilometres (Revenue pkm) on EU airlines; and
EU airline flights.
Figure 6.28: Traffic growth (EU airline passengers and flights) vs. direct employment and GVA for air transport
Source: Eurostat, Ascend airline database, Steer Davies Gleave analysis
6.68 Despite significant growth in the number of passengers transported by EU airlines,
employment at EU airlines has reduced over the period. This indicates that significant
productivity increases were achieved. However, part of this increase can be explained by
industry changes:
passengers per aircraft have increased and flights (by EU airlines) appear to have become
slightly shorter on average, both of which will reduce the employee per-passenger
numbers; and
outsourcing, particularly of ground handling, reducing the number of airline employees
per passenger.
6.69 The fact that EU airline passenger kilometres have grown more slowly than the number of
passengers indicates that, amongst EU airlines, there has been a more rapid increase in traffic
on shorter intra-EU journeys. This could reflect the rapid growth of intra-EU low cost carriers
following the establishment of the single aviation market, but could also reflect loss of share
on long haul routes to non-EU airlines.
6.70 GVA in air transport has increased over the period, although not as rapidly as passengers. The
trend in GVA is also reflective of the economic cycles, with the downturns in 2001-2002 and
2008-2010 clearly shown.
60
70
80
90
100
110
120
130
140
150
160
2000 2001 2002 2003 2004 2005 2006 2007 2008 2009 2010 2011 2012 2013
Ind
ex
(20
00
=10
0)
Air transport emp. Air transport GVA
EU airline pax on board (total) EU airline flights
Revenue-passeneger-km
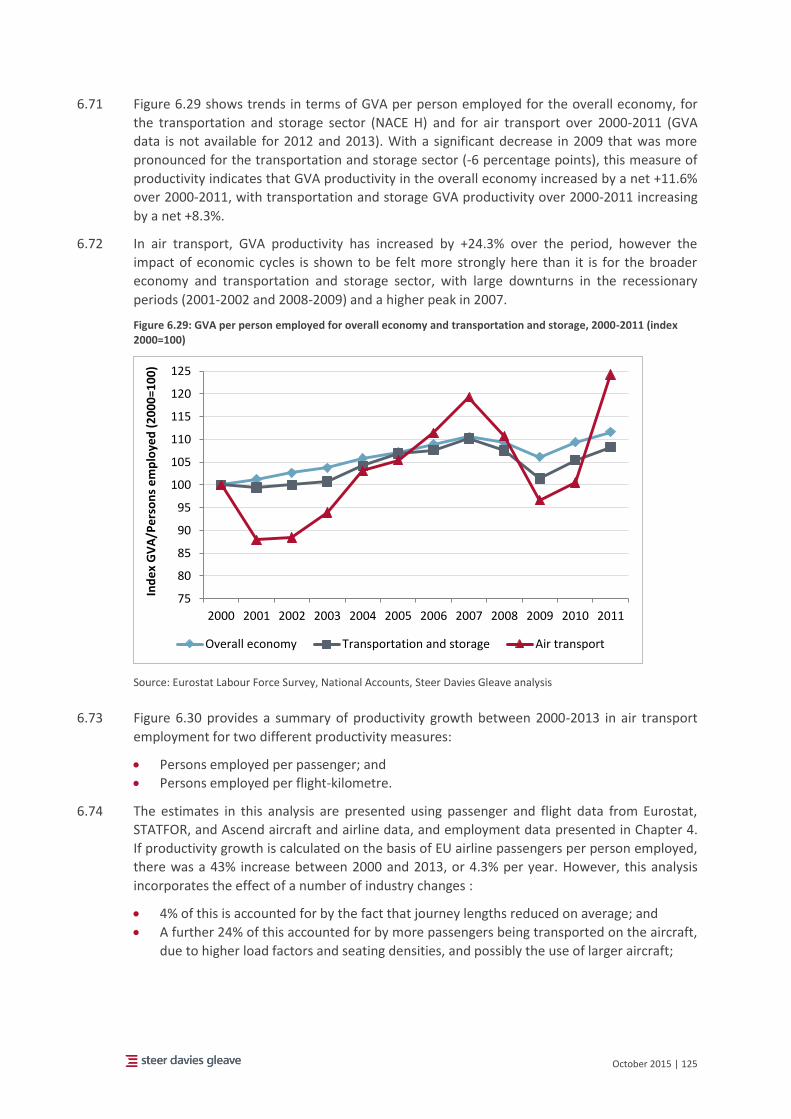
October 2015 | 125
6.71 Figure 6.29 shows trends in terms of GVA per person employed for the overall economy, for
the transportation and storage sector (NACE H) and for air transport over 2000-2011 (GVA
data is not available for 2012 and 2013). With a significant decrease in 2009 that was more
pronounced for the transportation and storage sector (-6 percentage points), this measure of
productivity indicates that GVA productivity in the overall economy increased by a net +11.6%
over 2000-2011, with transportation and storage GVA productivity over 2000-2011 increasing
by a net +8.3%.
6.72 In air transport, GVA productivity has increased by +24.3% over the period, however the
impact of economic cycles is shown to be felt more strongly here than it is for the broader
economy and transportation and storage sector, with large downturns in the recessionary
periods (2001-2002 and 2008-2009) and a higher peak in 2007.
Figure 6.29: GVA per person employed for overall economy and transportation and storage, 2000-2011 (index 2000=100)
Source: Eurostat Labour Force Survey, National Accounts, Steer Davies Gleave analysis
6.73 Figure 6.30 provides a summary of productivity growth between 2000-2013 in air transport
employment for two different productivity measures:
Persons employed per passenger; and
Persons employed per flight-kilometre.
6.74 The estimates in this analysis are presented using passenger and flight data from Eurostat,
STATFOR, and Ascend aircraft and airline data, and employment data presented in Chapter 4.
If productivity growth is calculated on the basis of EU airline passengers per person employed,
there was a 43% increase between 2000 and 2013, or 4.3% per year. However, this analysis
incorporates the effect of a number of industry changes :
4% of this is accounted for by the fact that journey lengths reduced on average; and
A further 24% of this accounted for by more passengers being transported on the aircraft,
due to higher load factors and seating densities, and possibly the use of larger aircraft;
75
80
85
90
95
100
105
110
115
120
125
2000 2001 2002 2003 2004 2005 2006 2007 2008 2009 2010 2011
Ind
ex
GV
A/P
ers
on
s e
mp
loye
d (
20
00
=10
0)
Overall economy Transportation and storage Air transport
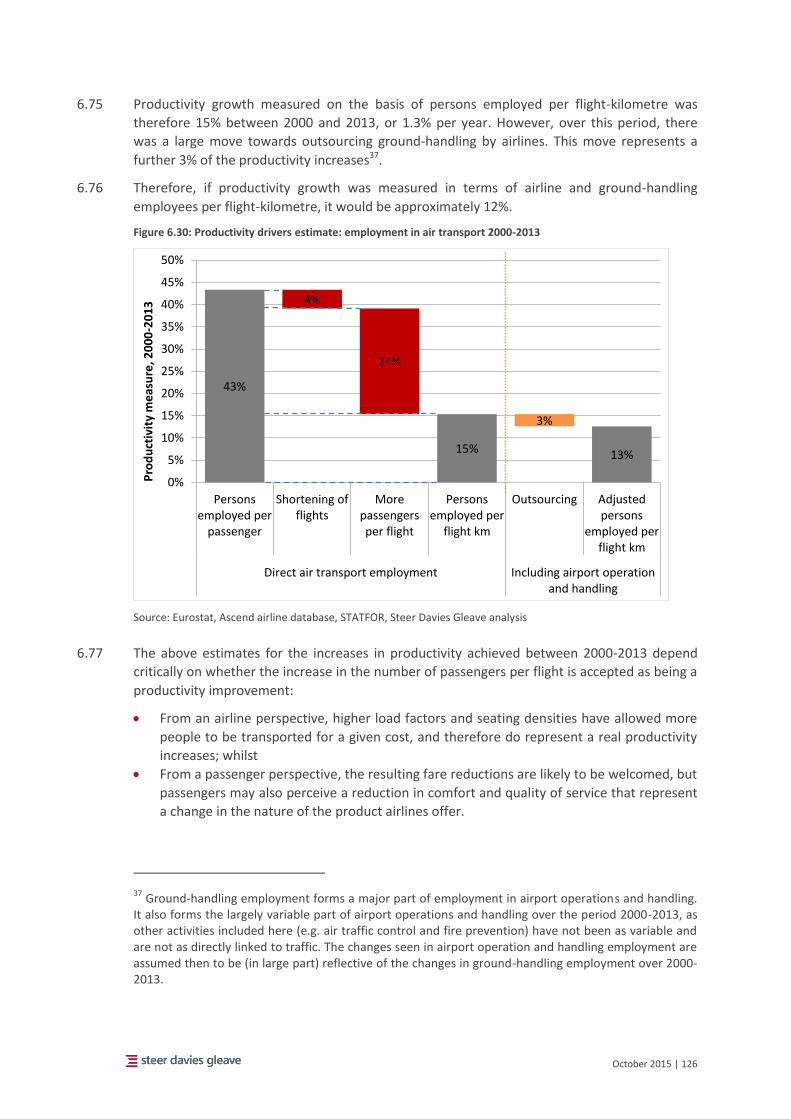
October 2015 | 126
6.75 Productivity growth measured on the basis of persons employed per flight-kilometre was
therefore 15% between 2000 and 2013, or 1.3% per year. However, over this period, there
was a large move towards outsourcing ground-handling by airlines. This move represents a
further 3% of the productivity increases37.
6.76 Therefore, if productivity growth was measured in terms of airline and ground-handling
employees per flight-kilometre, it would be approximately 12%.
Figure 6.30: Productivity drivers estimate: employment in air transport 2000-2013
Source: Eurostat, Ascend airline database, STATFOR, Steer Davies Gleave analysis
6.77 The above estimates for the increases in productivity achieved between 2000-2013 depend
critically on whether the increase in the number of passengers per flight is accepted as being a
productivity improvement:
From an airline perspective, higher load factors and seating densities have allowed more
people to be transported for a given cost, and therefore do represent a real productivity
increases; whilst
From a passenger perspective, the resulting fare reductions are likely to be welcomed, but
passengers may also perceive a reduction in comfort and quality of service that represent
a change in the nature of the product airlines offer.
37 Ground-handling employment forms a major part of employment in airport operations and handling.
It also forms the largely variable part of airport operations and handling over the period 2000-2013, as other activities included here (e.g. air traffic control and fire prevention) have not been as variable and are not as directly linked to traffic. The changes seen in airport operation and handling employment are assumed then to be (in large part) reflective of the changes in ground-handling employment over 2000-2013.
43%
4%
24%
15%
3%
13%
0%
5%
10%
15%
20%
25%
30%
35%
40%
45%
50%
Personsemployed per
passenger
Shortening offlights
Morepassengersper flight
Personsemployed per
flight km
Outsourcing Adjustedpersons
employed perflight km
Direct air transport employment Including airport operationand handling
Pro
du
ctiv
ity
me
asu
re, 2
00
0-2
01
3
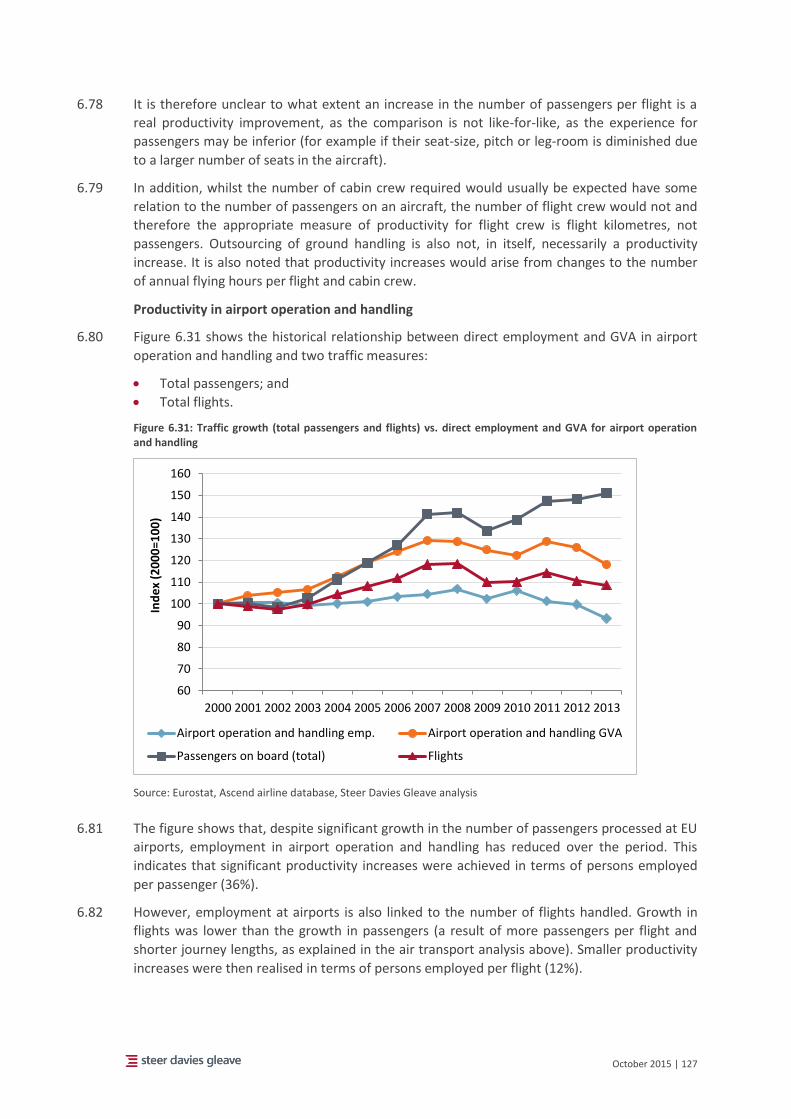
October 2015 | 127
6.78 It is therefore unclear to what extent an increase in the number of passengers per flight is a
real productivity improvement, as the comparison is not like-for-like, as the experience for
passengers may be inferior (for example if their seat-size, pitch or leg-room is diminished due
to a larger number of seats in the aircraft).
6.79 In addition, whilst the number of cabin crew required would usually be expected have some
relation to the number of passengers on an aircraft, the number of flight crew would not and
therefore the appropriate measure of productivity for flight crew is flight kilometres, not
passengers. Outsourcing of ground handling is also not, in itself, necessarily a productivity
increase. It is also noted that productivity increases would arise from changes to the number
of annual flying hours per flight and cabin crew.
Productivity in airport operation and handling
6.80 Figure 6.31 shows the historical relationship between direct employment and GVA in airport
operation and handling and two traffic measures:
Total passengers; and
Total flights.
Figure 6.31: Traffic growth (total passengers and flights) vs. direct employment and GVA for airport operation and handling
Source: Eurostat, Ascend airline database, Steer Davies Gleave analysis
6.81 The figure shows that, despite significant growth in the number of passengers processed at EU
airports, employment in airport operation and handling has reduced over the period. This
indicates that significant productivity increases were achieved in terms of persons employed
per passenger (36%).
6.82 However, employment at airports is also linked to the number of flights handled. Growth in
flights was lower than the growth in passengers (a result of more passengers per flight and
shorter journey lengths, as explained in the air transport analysis above). Smaller productivity
increases were then realised in terms of persons employed per flight (12%).
60
70
80
90
100
110
120
130
140
150
160
2000 2001 2002 2003 2004 2005 2006 2007 2008 2009 2010 2011 2012 2013
Ind
ex
(20
00
=10
0)
Airport operation and handling emp. Airport operation and handling GVA
Passengers on board (total) Flights
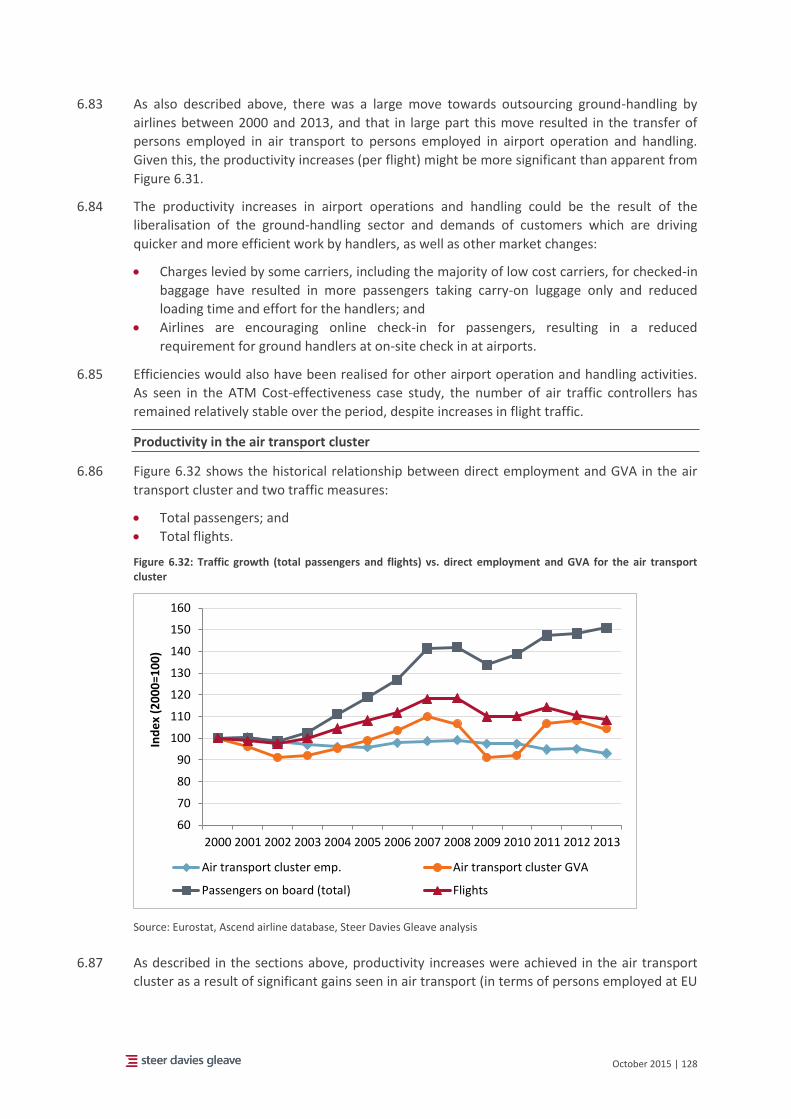
October 2015 | 128
6.83 As also described above, there was a large move towards outsourcing ground-handling by
airlines between 2000 and 2013, and that in large part this move resulted in the transfer of
persons employed in air transport to persons employed in airport operation and handling.
Given this, the productivity increases (per flight) might be more significant than apparent from
Figure 6.31.
6.84 The productivity increases in airport operations and handling could be the result of the
liberalisation of the ground-handling sector and demands of customers which are driving
quicker and more efficient work by handlers, as well as other market changes:
Charges levied by some carriers, including the majority of low cost carriers, for checked-in
baggage have resulted in more passengers taking carry-on luggage only and reduced
loading time and effort for the handlers; and
Airlines are encouraging online check-in for passengers, resulting in a reduced
requirement for ground handlers at on-site check in at airports.
6.85 Efficiencies would also have been realised for other airport operation and handling activities.
As seen in the ATM Cost-effectiveness case study, the number of air traffic controllers has
remained relatively stable over the period, despite increases in flight traffic.
Productivity in the air transport cluster
6.86 Figure 6.32 shows the historical relationship between direct employment and GVA in the air
transport cluster and two traffic measures:
Total passengers; and
Total flights.
Figure 6.32: Traffic growth (total passengers and flights) vs. direct employment and GVA for the air transport cluster
Source: Eurostat, Ascend airline database, Steer Davies Gleave analysis
6.87 As described in the sections above, productivity increases were achieved in the air transport
cluster as a result of significant gains seen in air transport (in terms of persons employed at EU
60
70
80
90
100
110
120
130
140
150
160
2000 2001 2002 2003 2004 2005 2006 2007 2008 2009 2010 2011 2012 2013
Ind
ex
(20
00
=10
0)
Air transport cluster emp. Air transport cluster GVA
Passengers on board (total) Flights
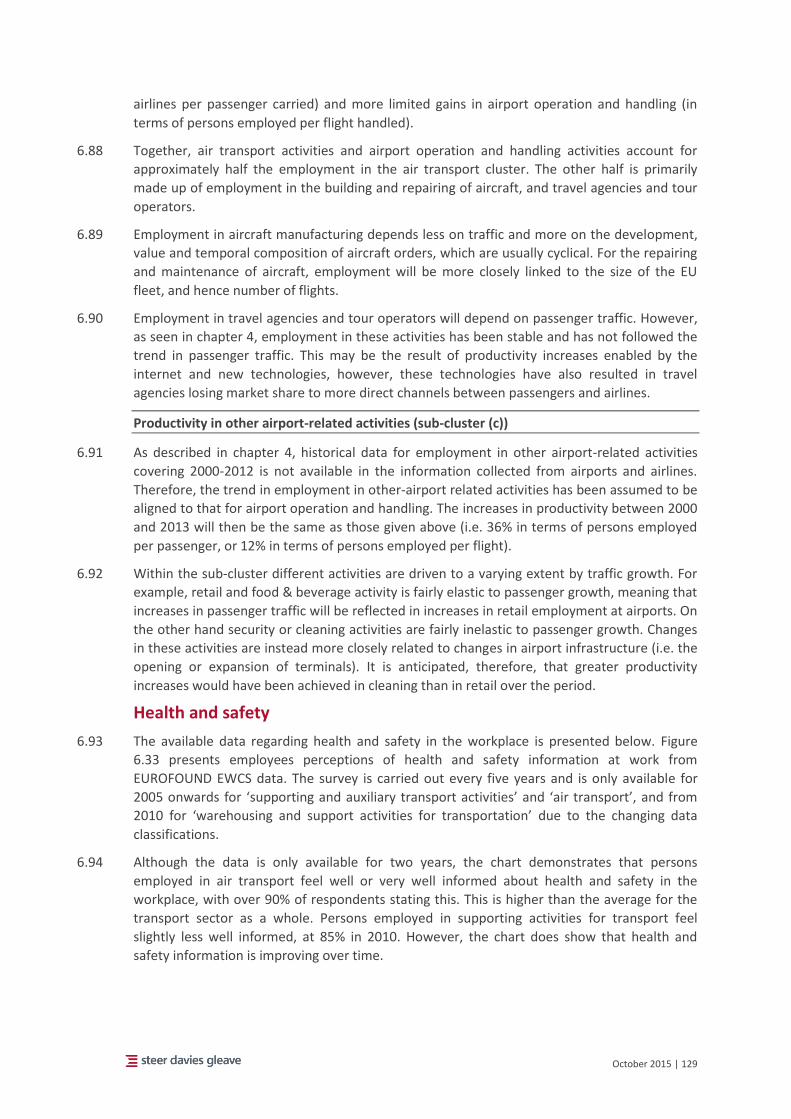
October 2015 | 129
airlines per passenger carried) and more limited gains in airport operation and handling (in
terms of persons employed per flight handled).
6.88 Together, air transport activities and airport operation and handling activities account for
approximately half the employment in the air transport cluster. The other half is primarily
made up of employment in the building and repairing of aircraft, and travel agencies and tour
operators.
6.89 Employment in aircraft manufacturing depends less on traffic and more on the development,
value and temporal composition of aircraft orders, which are usually cyclical. For the repairing
and maintenance of aircraft, employment will be more closely linked to the size of the EU
fleet, and hence number of flights.
6.90 Employment in travel agencies and tour operators will depend on passenger traffic. However,
as seen in chapter 4, employment in these activities has been stable and has not followed the
trend in passenger traffic. This may be the result of productivity increases enabled by the
internet and new technologies, however, these technologies have also resulted in travel
agencies losing market share to more direct channels between passengers and airlines.
Productivity in other airport-related activities (sub-cluster (c))
6.91 As described in chapter 4, historical data for employment in other airport-related activities
covering 2000-2012 is not available in the information collected from airports and airlines.
Therefore, the trend in employment in other-airport related activities has been assumed to be
aligned to that for airport operation and handling. The increases in productivity between 2000
and 2013 will then be the same as those given above (i.e. 36% in terms of persons employed
per passenger, or 12% in terms of persons employed per flight).
6.92 Within the sub-cluster different activities are driven to a varying extent by traffic growth. For
example, retail and food & beverage activity is fairly elastic to passenger growth, meaning that
increases in passenger traffic will be reflected in increases in retail employment at airports. On
the other hand security or cleaning activities are fairly inelastic to passenger growth. Changes
in these activities are instead more closely related to changes in airport infrastructure (i.e. the
opening or expansion of terminals). It is anticipated, therefore, that greater productivity
increases would have been achieved in cleaning than in retail over the period.
Health and safety
6.93 The available data regarding health and safety in the workplace is presented below. Figure
6.33 presents employees perceptions of health and safety information at work from
EUROFOUND EWCS data. The survey is carried out every five years and is only available for
2005 onwards for ‘supporting and auxiliary transport activities’ and ‘air transport’, and from
2010 for ‘warehousing and support activities for transportation’ due to the changing data
classifications.
6.94 Although the data is only available for two years, the chart demonstrates that persons
employed in air transport feel well or very well informed about health and safety in the
workplace, with over 90% of respondents stating this. This is higher than the average for the
transport sector as a whole. Persons employed in supporting activities for transport feel
slightly less well informed, at 85% in 2010. However, the chart does show that health and
safety information is improving over time.
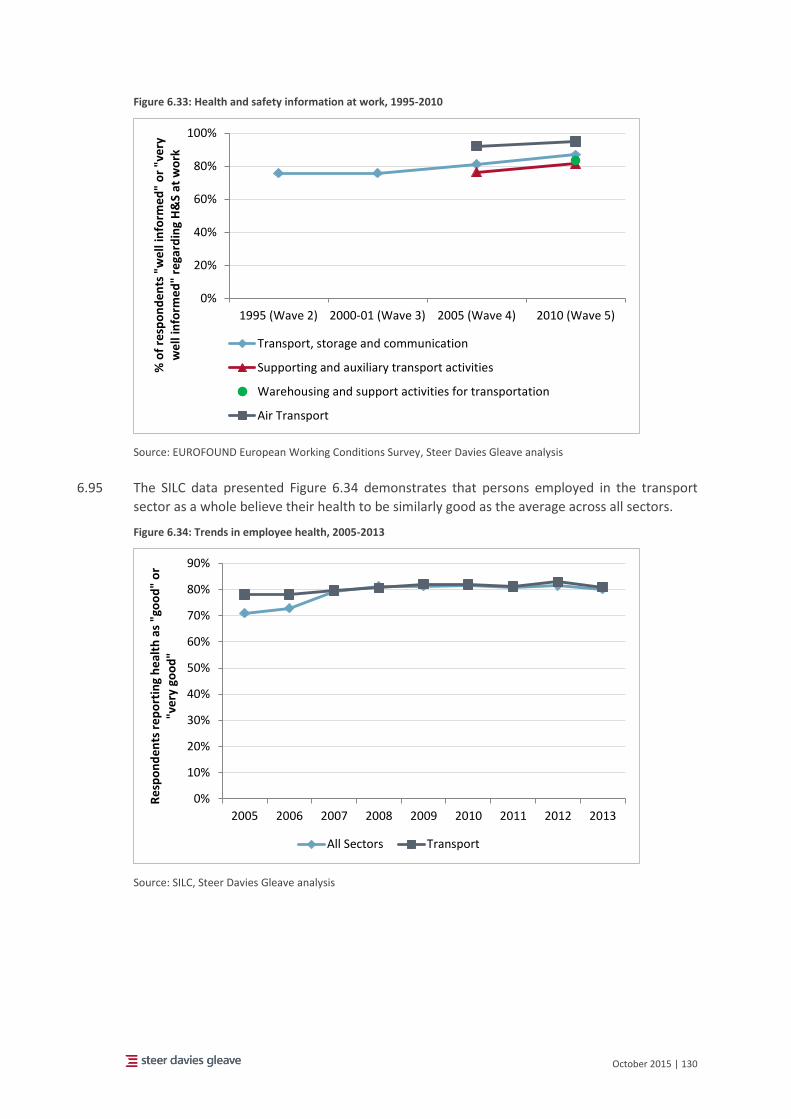
October 2015 | 130
Figure 6.33: Health and safety information at work, 1995-2010
Source: EUROFOUND European Working Conditions Survey, Steer Davies Gleave analysis
6.95 The SILC data presented Figure 6.34 demonstrates that persons employed in the transport
sector as a whole believe their health to be similarly good as the average across all sectors.
Figure 6.34: Trends in employee health, 2005-2013
Source: SILC, Steer Davies Gleave analysis
0%
20%
40%
60%
80%
100%
1995 (Wave 2) 2000-01 (Wave 3) 2005 (Wave 4) 2010 (Wave 5)
% o
f re
spo
nd
en
ts "
we
ll in
form
ed
" o
r "v
ery
w
ell
info
rme
d"
rega
rdin
g H
&S
at w
ork
Transport, storage and communication
Supporting and auxiliary transport activities
Warehousing and support activities for transportation
Air Transport
0%
10%
20%
30%
40%
50%
60%
70%
80%
90%
2005 2006 2007 2008 2009 2010 2011 2012 2013
Re
spo
nd
en
ts r
ep
ort
ing
he
alth
as
"go
od
" o
r "v
ery
go
od
"
All Sectors Transport
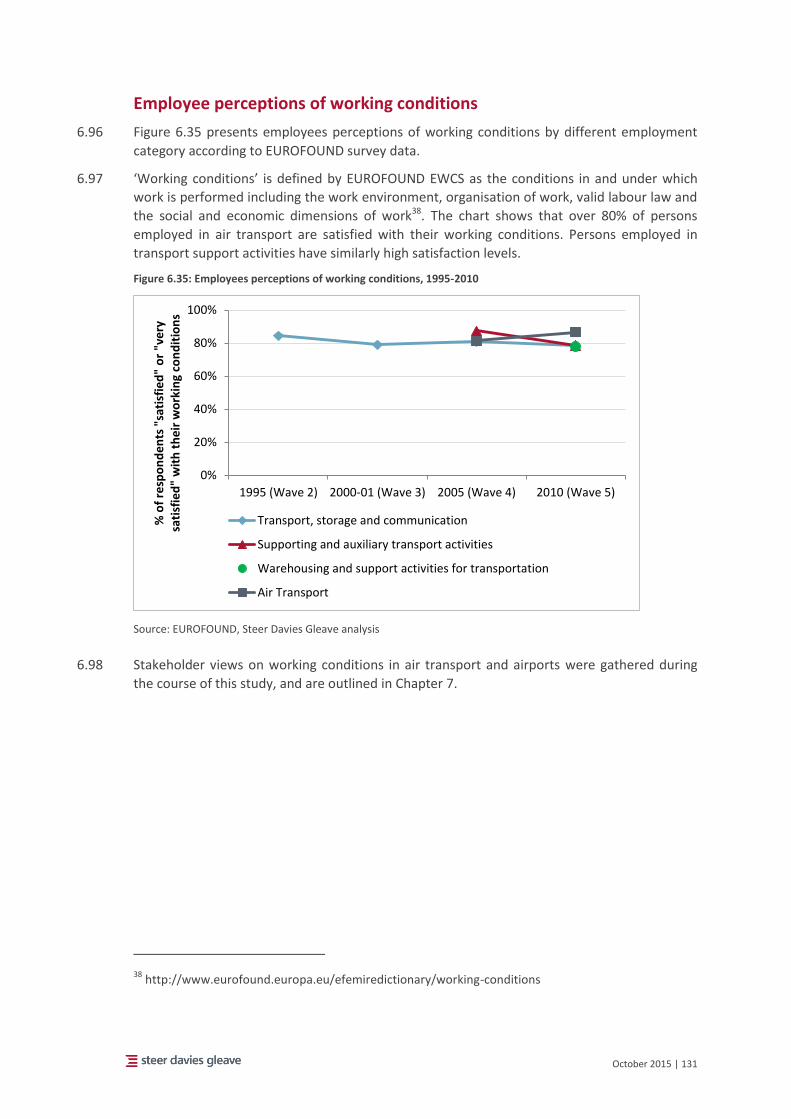
October 2015 | 131
Employee perceptions of working conditions
6.96 Figure 6.35 presents employees perceptions of working conditions by different employment
category according to EUROFOUND survey data.
6.97 ‘Working conditions’ is defined by EUROFOUND EWCS as the conditions in and under which
work is performed including the work environment, organisation of work, valid labour law and
the social and economic dimensions of work38. The chart shows that over 80% of persons
employed in air transport are satisfied with their working conditions. Persons employed in
transport support activities have similarly high satisfaction levels.
Figure 6.35: Employees perceptions of working conditions, 1995-2010
Source: EUROFOUND, Steer Davies Gleave analysis
6.98 Stakeholder views on working conditions in air transport and airports were gathered during
the course of this study, and are outlined in Chapter 7.
38 http://www.eurofound.europa.eu/efemiredictionary/working-conditions
0%
20%
40%
60%
80%
100%
1995 (Wave 2) 2000-01 (Wave 3) 2005 (Wave 4) 2010 (Wave 5)
% o
f re
spo
nd
en
ts "
sati
sfie
d"
or
"ve
ry
sati
sfie
d"
wit
h t
he
ir w
ork
ing
con
dit
ion
s
Transport, storage and communication
Supporting and auxiliary transport activities
Warehousing and support activities for transportation
Air Transport
October 2015 | 132
7 Working conditions Introduction
7.1 This chapter reports on the qualitative developments in employment and working conditions
on the following topics:
types of employment arrangements;
incomes and training opportunities;
union membership and other social dialogue issues;
health and safety at work;
outsourcing; and
multiplication of operational bases.
7.2 Each topic follows a similar structure. The topic is introduced, and where relevant a brief
analysis of the legal background for each area is included. This legal background is provided by
Clyde & Co LLP, and includes an overview of the legal perspective and highlights a number of
relevant cases. Where data is available (types of employment arrangements and labour cost
developments), trends are provided. Where appropriate and relevant for the topics,
information provided in the 2012 study39 has been built upon.
7.3 The responses of the stakeholder questionnaires and interviews are reported by stakeholder
type, which are split into the following groups:
airports;
airlines;
representative organisations (including worker and employer representatives);
temporary work agencies; and
other.
7.4 The overview of views of stakeholders provided in the questionnaire or interview responses is
limited by the number and balance of the respondents. A range of stakeholders across the air
transport sector were approached to participate in the study, including representatives of
various types of employers and employees. A summary of the number of stakeholders
approached and the participation status by type of stakeholder is presented in Chapter 2,
Figure 2.1.
7.5 The chapter also refers to a number of case studies on airlines and airports, covering
employment relationships, outsourcing and arrangements with respect to multiplication of
39 "Study on the effects of the implementation of the EU aviation common market on employment and
working conditions in the Air Transport Sector over the period 1997/2010", Steer Davies Gleave, 2012
October 2015 | 133
operational bases. These case studies are provided in full in Appendices C and D and
referenced in this chapter.
Types of employment arrangements
Overview
7.6 In this section the responses from stakeholders regarding changes in the types of employment
arrangement that are taking place in the air transport sector are summarised. The key changes
that have occurred and the impact that this may have on employment and working conditions
are outlined. In particular, this focuses on:
Fixed-term contracts: Employees with an employment contract whose end is determined
by objective conditions such as reaching a specific date, completing a specific task, or the
occurrence of a specific event.
Part-time work: Employees whose normal hours of work are less than those of
comparable full-time employees. Part time workers may be engaged on fixed term or
indefinite contracts either directly by an air transport organisation, or placed in a position
at an organisation by an employment agency.
Atypical working hours: Employees who work evenings or nights, Saturdays or Sundays,
or shift work.
Self-employment: A self-employed person is the sole or joint owner of the
unincorporated enterprise in which he/she works, unless they are also in paid
employment which is their main activity (in that case, they are considered to be
employees). Self-employed people also include: unpaid family workers; outworkers (who
work outside the usual workplace, such as at home); and workers engaged in production
done entirely for their own final use or own capital formation, either individually or
collectively.
7.7 This section also discusses the use of temporary agency work in the air transport sector; an
explanation of this type of worker is provided in the following paragraphs for context.
7.8 A temporary agency worker is an employee who is employed and paid by a temporary-work
agency and assigned to a user company to work there under the supervision and direction of
that company (a triangular relationship). Temporary agency work tends by nature to be
associated with fixed-term contract work. Reasons for using temporary agency workers
include:
a short term requirement for a specific set of skills or experience;
providing additional resources during peak periods;
illness of a permanent staff member requiring immediate coverage; and
any other short-term staff shortages.
7.9 A worker in temporary agency employment is employed by the temporary work agency and
then hired out to perform his/her work at the user company, under the supervision of the user
company. The employment relationship is between the worker and the agency; there is no
employment relationship between the worker and the user company (although the user
company has some legal obligations to the worker, such as health and safety) and the worker
must follow the rules of the airline.
7.10 Temporary work agencies may also engage self-employed individuals (rather than employing
them directly). This predominantly occurs for airline employment, in particular for flight crew
(cabin crew may also be engaged via a temporary agency but through an employment contract
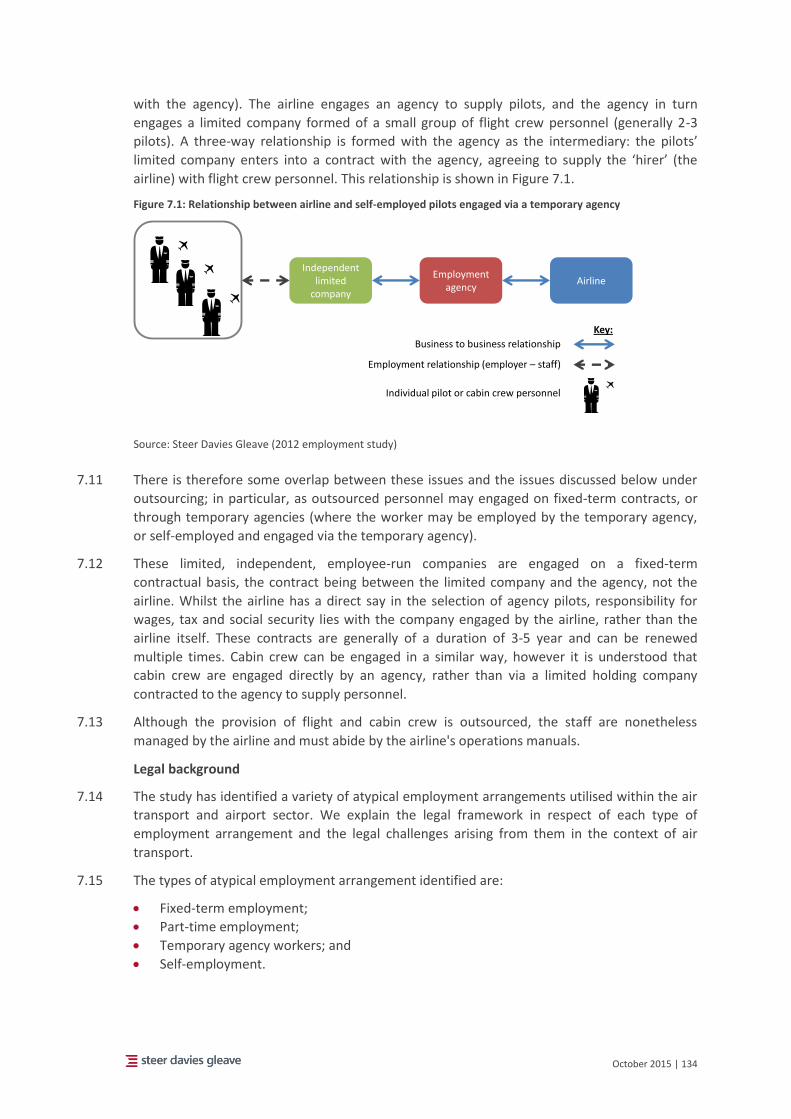
October 2015 | 134
with the agency). The airline engages an agency to supply pilots, and the agency in turn
engages a limited company formed of a small group of flight crew personnel (generally 2-3
pilots). A three-way relationship is formed with the agency as the intermediary: the pilots’
limited company enters into a contract with the agency, agreeing to supply the ‘hirer’ (the
airline) with flight crew personnel. This relationship is shown in Figure 7.1.
Figure 7.1: Relationship between airline and self-employed pilots engaged via a temporary agency
Source: Steer Davies Gleave (2012 employment study)
7.11 There is therefore some overlap between these issues and the issues discussed below under
outsourcing; in particular, as outsourced personnel may engaged on fixed-term contracts, or
through temporary agencies (where the worker may be employed by the temporary agency,
or self-employed and engaged via the temporary agency).
7.12 These limited, independent, employee-run companies are engaged on a fixed-term
contractual basis, the contract being between the limited company and the agency, not the
airline. Whilst the airline has a direct say in the selection of agency pilots, responsibility for
wages, tax and social security lies with the company engaged by the airline, rather than the
airline itself. These contracts are generally of a duration of 3-5 year and can be renewed
multiple times. Cabin crew can be engaged in a similar way, however it is understood that
cabin crew are engaged directly by an agency, rather than via a limited holding company
contracted to the agency to supply personnel.
7.13 Although the provision of flight and cabin crew is outsourced, the staff are nonetheless
managed by the airline and must abide by the airline's operations manuals.
Legal background
7.14 The study has identified a variety of atypical employment arrangements utilised within the air
transport and airport sector. We explain the legal framework in respect of each type of
employment arrangement and the legal challenges arising from them in the context of air
transport.
7.15 The types of atypical employment arrangement identified are:
Fixed-term employment;
Part-time employment;
Temporary agency workers; and
Self-employment.
Independent limited
company
Employment agency
Airline
Individual pilot or cabin crew personnel
Key:
Employment relationship (employer – staff)
Business to business relationship
October 2015 | 135
7.16 Furthermore, there also appears to be reference in the study to the use of so-called "zero
hours contracts" and posted workers. Therefore these have been included in the categories
below.
a) Temporary agency workers
7.17 European law provides for equal treatment of temporary agency workers, acknowledges
temporary agencies as employers and their contribution to the creation of jobs and to the
development of flexible forms of working. (Directive 2008/104/EC)40.
7.18 A "temporary agency worker" is defined as:
"a worker with a contract of employment or an employment relationship with a temporary-
work agency with a view to being assigned to a user undertaking to work temporarily under its
supervision and direction ".
7.19 Article 5 states that:
"the basic working and employment conditions of temporary workers shall be, for the
duration of their assignment at a user undertaking, at least those that would apply if they had
been recruited directly by the undertaking to occupy the same job".
7.20 "Basic working and employment conditions" are defined as:
"working and employment conditions laid down by legislation, regulations, administrative
provisions, collective agreements and/or other binding general provisions in force in the user
undertaking relating to the duration of working time, overtime, breaks, rest period, night work,
holidays, public holidays and pay".
7.21 The user undertaking must also ensure that legislation, regulations, administrative provisions,
collective agreement, or other general provisions, relating to the following, must be complied
with:
Protection of children, young people and pregnant women; and
Equal treatment based on sex, race, ethnic origin, religion, beliefs, disabilities, age or
sexual orientation.
7.22 Article 6 adds additional protections for temporary workers, including being informed of any
vacant posts in the user undertaking to give them the same opportunity as other workers in
that undertaking to find permanent employment. In this regard, Member States shall take any
action required to ensure that any clauses prohibiting or having the effect of preventing the
conclusion of a contract of employment or an employment relationship between the user
undertaking and the temporary agency worker after his assignment are null and void.
7.23 Temporary-work agencies also cannot charge workers any fees in exchange for arranging for
them to be recruited by a user undertaking, or for concluding a contract of employment or an
employment relationship with a user undertaking after carrying out an assignment in that
undertaking. Temporary agency workers shall be given access to the amenities or collective
facilities in the user undertaking, in particular any canteen, child-care facilities and transport
services, under the same conditions as workers employed directly by the undertaking, unless
40 Directive 2008/104/EC of the European Parliament and of the Council of 19 November 2008 on
temporary agency work
October 2015 | 136
the difference in treatment is justified by objective reasons. Member States shall take suitable
measures in order to improve temporary agency workers' access to training and to child-care
facilities in the temporary-work agencies, even in the periods between their assignments, in
order to enhance their career development and employability, and improve temporary agency
workers' access to training for user undertakings' workers.
7.24 The Directive foresees the possibility for Member States to apply, under strict conditions,
derogations to the principle of equal treatment and some Member States have provided for
that41.
The legal challenges arising from temporary agency arrangements
7.25 Temporary work agencies engage workers in a number of ways. The most common is by
employing the agency worker. In this arrangement, the worker is entitled to the employee
protections laid down in the Agency Workers' Directive.
7.26 It is also possible for the temporary work agency to engage workers as self-employed
contractors either directly via a contract between the agency and the worker or through a
personal service company set up by the worker and through which the worker provides
services to the personal service company and in turn the personal service company provides
services to the agency and ultimately to the end user. In this arrangement, the worker is "self-
employed" and therefore is not covered by the protection of the Agency Workers' Directive
and may not be entitled to the various elements of employment protection provided for by
national legislation to employees (although see further below on the distinction between
"employee", "worker" and "self-employed").
7.27 This type of arrangement was identified in the UK case of Brookfield Aviation International
Limited v Robertus Johannes Willhelmus Van Boekel42. The case involved a pilot providing
services to a temporary work agency (Brookfield). The pilot was a Dutch national living in
Holland. He contracted via a personal service company registered in the Republic of Ireland (of
which he was the sole director, shareholder and, for the purposes of tax treatment, an
employee) with Brookfield (a UK registered company) under a contract governed by English
law and jurisdiction. Between 2009 and 2011 he provided pilot services to Ryanair from a base
in Belgium. The subject matter of the case was an alleged breach of contract relating to a
clause in the contract which provided for an obligation to pay EUR5,000 to Brookfield if the
contract was terminated without sufficient notice. In this case, the pilot sought to take "off
days" during the notice period. The contract provided that the agency could deny any leave
once notice was given. Therefore, if leave were taken during that period, the obligation to pay
EUR5,000 was incurred. The applicable UK County Court considered, under English law,
whether there was a breach of contract by the pilot and/or the personal service company and
in particular whether it was a penalty clause (rather than a genuine preestimate of loss) which
is unenforceable under English contract law. The Court decided that the requirement to pay
EUR5,000 was a penalty clause and therefore unenforceable.
41 Report from the Commission to the European Parliament, The Council, The European Economic and
Social Committee and the Committee of the Regions on the application of Directive 2008/104/EC on temporary agency work (SWD(2014) 108 final)
42 1IR65128, Central London County Court, 4 April 2013
October 2015 | 137
7.28 Given the internationally mobile nature of the air transport sector, several Member States
may be involved in any working arrangement. This could be the Member State where the
worker resides, the Member State where the user undertaking is established, the Member
State where the temporary work agency is established, the Member States where the worker
is based and/or operates, and/or the Member State which is named in the contracts as having
the applicable law and jurisdiction. In some cases, a temporary agency worker engaged by a
temporary work agency in one Member State may be assigned to a user undertaking in
another Member State, or several user undertakings in several different Member States. In
those circumstances, questions of applicable law and jurisdiction come into play, which is
explored in more detail in Section 5. Moreover, in those circumstances, the worker does not
benefit from the protection of the Temporary Agency Work Directive but from the Directive
96/71/EC on Posting of Workers (see further below). As European law provides protections for
employees in determining applicable law and jurisdiction, there can be some uncertainty for
agencies and end users in terms of which law and jurisdiction, and which tax and social
security obligations, will apply, not least because each Member State may have implemented
the Directives providing protection to temporary agency employees slightly differently.
7.29 Where the temporary work agency is located outside the European Union, further complexity
is overlaid in terms of the parties understanding applicable law and jurisdiction, as well as the
immigration implications for workers engaged from outside the European Union to carry out
work within it. This issue could be the subject of a separate analysis.
b) Fixed term employment
7.30 European law provides for equal treatment of fixed term employees (Directive 1999/70/EC)43.
The purpose of Directive 1999/70/EC is to ensure non-discrimination in respect of fixed-term
employees, and to prevent abuse arising from the use of successive fixed-term employment
contracts. It sets out the minimum requirements for protection which Member States must
then implement.
7.31 Clause 4 of Annex 1 of Directive 1999/70/EC states that:
"fixed term workers shall not be treated in a less favourable manner than comparable
permanent workers solely because they have a fixed term contract or relation unless different
treatment is justified on objective grounds. "
7.32 Clause 5 deals with the prevention of abuse and states that:
"where there are no equivalent legal measures to prevent abuse, [Member States shall]
introduce in a manner which takes account of the need of specific sectors and/or categories of
workers, one or more of the following measures: (a) objective reasons justifying the renewal of
such contracts or relationships; (b) the maximum total duration of successive fixed-term
employment contracts or relationships; (c) the number of renewals of such contracts or
relationships. "
7.33 Clause 6 also states that:
43 Council Directive 1999/70/EC of 28 June 1999 concerning the framework agreement on fixed-term
work concluded by ETUC, UNICE and CEEP
October 2015 | 138
"employers shall inform fixed-term workers about vacancies which become available in the
undertaking or establishment to ensure that they have the same opportunity to secure
permanent positions as other workers [and] as far as possible, employers should facilitate
access by fixed term workers to appropriate training opportunities to enhance their skills,
career development and occupational mobility. "
7.34 Member States have brought this protection into law in differing ways. For example, the law
relating to the length of successive fixed-term contracts in the Czech Republic provides for a
maximum of 3 years, whereas Estonia provides for 5 years and the UK and the Republic of
Ireland for 4 years44.
7.35 Less favourable treatment can be objectively justified under the Directive so that the right is
not absolute. This ability to justify inequality will be subject to different interpretation in the
legislation and Courts of different Member States. Under UK law, some examples of justified
inequality might include:
Withholding sick pay from a fixed term employee engaged to cover a short term urgent
project; or
The cost of administering pensions to very short fixed term employees.
c) Part-time employment
7.36 European law provides for equal treatment of part time employees (Directive 1997/81/EC)45.
The key purpose of Directive 1997/81/EC is to prevent discrimination against part-time
employees and to allow for flexible working suitable to the employer and employee.
7.37 Clause 4 states that
"part-time workers shall not be treated in a less favourable manner than comparable full-time
workers solely because they work part time unless different treatment is justified on objective
grounds. "
7.38 In the same way as fixed term employee protection, Member States are likely to have
implemented this protection in varying ways and with varying levels of protection46.
d) Zero hours contracts
7.39 Zero hours contracts are contracts under which the individual undertakes to do work or
perform services conditionally on the employer making work or services available to the
worker and where there is no certainty that such work or services will be made available to
the worker. Where they exist, such contracts are typically used to manage seasonal or periodic
fluctuations in the level of work available but can be used more broadly for a variety of
reasons.
44 Commission Staff Working Document, National Legislation Transposing Directive 1999/70/EC on Fixed
Term Work in the EU 10 (Brussels, 17/09/2008, SEC(2008) 2485)
45 Council Directive 97/81/EC of 15 December 1997 concerning the Framework Agreement on part¬-
time work concluded by UNICE, CEEP and the ETUC - Annex : Framework agreement on part-time work
46 Report by the Commission’s Services on the Implementation of Council Directive 97/81/EC of 1997
concerning the Framework Agreement on Part-Time Work concluded by Unice, CEEP and the ETUC (21/01/2003)
October 2015 | 139
7.40 This has become a hot topic in the UK leading to legislation recently enacted to prevent
exclusivity clauses in such contracts. Such clauses seek to prohibit the worker from taking
other work or requiring the worker to seek consent before doing so. Such clauses are now
unenforceable in the UK.
e) Posted workers
7.41 Directive 96/71/EC47 on the posting of workers aims to reconcile the exercise of the freedom
to provide cross border services by companies under Article 49 EC, on the one hand, with the
appropriate protection of the rights of workers temporarily posted abroad to provide them, on
the other. In order to do that it identifies the mandatory rules of general interest at EU level
that must be applied to posted workers in the host country. The Directive establishes a hard
core of clearly defined terms and conditions of work and employment for minimum protection
of workers that must be complied with by the service provider in the host country. The Posted
Workers Directive (PWD) states that where employment rights exist in a Member State, these
must be made available to posted workers even if they are only working temporarily in that
country, in so far as they relate to maximum working periods, minimum rest, minimum paid
holidays, minimum rates of pay, health and safety and hygiene, protective measures regarding
pregnancy and non-discrimination.
7.42 Hence where a Member State has certain minimum terms and conditions of employment in
the areas mentioned above, these must also apply to workers posted to that State. However,
the employer is free to apply working conditions which are more favourable to workers such
as, for instance, those of the sending member State (that is, where the employee usually
works).
7.43 Article 2(1) of the PWD, defines a posted worker as "a worker who, for a limited period, carries
out his work in the territory of a Member State other than the State in which he normally
works".
7.44 Article 1(3) states that the Directive shall apply in the following situations:
post workers to the territory of a Member State on their account and under their
direction, under a contract concluded between the undertaking making the posting and
the party for whom the services are intended, operating in that Member State, provided
there is an employment relationship between the undertaking making the posting and the
worker during the period of posting; or
post workers to an establishment or to an undertaking owned by the group in the
territory of a Member State, provided there is an employment relationship between the
undertaking making the posting and the worker during the period of posting; or
being a temporary employment undertaking or placement agency, hire out a worker to a
user undertaking established or operating in the territory of a Member State, provided
there is an employment relationship between the temporary employment undertaking or
placement agency and the worker during the period of posting.
7.45 Article 6 states that:
47 Directive 96/71/EC of the European Parliament and of the Council of 16 December 1996 concerning
the posting of workers in the framework of the provision of services
October 2015 | 140
"in order to enforce the right to the terms and conditions of employment guaranteed in Article
3, judicial proceedings may be instituted in the Member State in whose territory the worker is
or was posted, without prejudice, where applicable, to the right, under existing international
conventions on jurisdiction, to institute proceedings in another State. "
e) Employment vs self-employment
The challenge of defining "employee", "worker" and "self-employed"
7.46 EU labour law Directives48 do not provide a definition of "employee/worker49 " but refer to the
national legislation.
7.47 Given that in a few Member States, national legislation affords different protection to
"employees" and "workers", the question arises to what extent each Directive is in those
Member States applicable to only "employees" or to a broader category including "workers".
7.48 The CJEU gave an indication to the national courts how to assess whether a person could be
considered a worker or not:
"the term 'employee' for the purpose of EU law must itself be defined according to objective
criteria that characterise the employment relationship, taking into consideration the rights and
responsibilities of the persons concerned. In that connection, it is settled case-law that the
essential feature of that relationship is that for a certain period of time one person performs
services for and under the direction of another person in return for which he receives
remuneration". 50
"objectively defined, a 'worker' is a person who is obliged to provide services to another in
return for monetary reward and who is subject to the direction or control of the other person
as regards the way in which the work is done". 51
7.49 The definition above is taken from a decision involving competition law where the question
arose whether a collective labour agreement involving self-employed persons is excluded from
competition law. Whilst the case dealt with competition issues, the judge in that case made
some interesting observations as follows:
"In the contemporary economy, it is not always easy to establish the status of some self-
employed contractors as "undertakings"... A service provider could lose his status of an
independent trader, and hence of an undertaking if he did not determine independently his
own conduct on the market, but instead was entirely dependent on his principal, because he
did not bear any of the financial or commercial risks arising out of the latter's activity and
operated as an auxiliary within the principal's undertaking." (Confederacion Espanola de
Empresarios de Estanciones de Servicio v Compania Espanola de Petroleos SA (C-217/05)
followed)
48 With the exception of the Working Time Directive
49 The terms "worker" and "employee" are used interchangeably in EU legislation as well as in the
legislation of several Member States
50 FNV Kunsten Informatie en Media v Staat der Nederlanden, C-413/13, [34]
51 n.47[14]
October 2015 | 141
"The classification of a "self-employed person" under national law did not prevent that person
being classified as an employee within the meaning of EU law if his Independence was merely
notional, thereby disguising an employment relationship. Accordingly, the status of "worker"
within the meaning of EU law was not affected by the fact that a person had been hired as a
self-employed person under national law, for tax, administrative or organizational reasons, as
long as that person acted under the direction of his employer as regards, in particular, his
freedom to choose the time, place and content of his work, did not share in the employer's
commercial risks, and, for the duration of that relationship, formed an integral part of that
employer's undertaking, so forming an economic unit with that undertaking." (Allonby v
Accrington and Rossendale College (C-256/01); R v Ministry of Agriculture, Fisheries and Food
ex p. Agegate Ltd (C-3/873); Becu, Criminal Proceedings against (C-22/98) followed)
7.50 There have been a number of attempts over the years to try to agree a Community wide
definition of "employee" to gain some clarity over the extent of the Community protections
for "employees" and "workers"52. However, for a variety of reasons, that has not been
possible. This means that there is a lack of clarity on who is entitled to the protection foreseen
in EU legislation in those Member States whose national legislations distinguish between
"employees" and "workers". In this regard, cf. below the case study on the UK.
The relevance of the "self-employed" worker in the EU
7.51 This position may vary between Member States. Whilst they often follow similar themes, there
will be important distinctions in the areas of tax and social security obligations.
7.52 Where a self-employment relationship is utilised, there is always a risk that the arrangement
disguises a true employment or worker relationship. In the air transport sector, factors
pointing towards an employment relationship under the UK rules might include working solely
for one airline, taking direction and control from the airline including disciplinary issues, being
obliged to attend for work and other factors which imply treatment similar to employed staff
of the airline. On the other hand, factors indicating a self-employed relationship might be
working for a variety of airlines, taking on an element of the financial risk in the relationship,
provision of own equipment such as uniform and the cost of training, and being able to
provide a substitute if the individual is unavailable. In any one case, any combination of factors
can create a different result. This makes the labelling of relationships an imprecise process.
7.53 As the self-employed do not enjoy the same level of legal protection as the employed, it will
be important to ensure the relationship is correctly labelled. Conversely, a loss of tax revenue
is a cause for concern for tax authorities across the European Union where disguised
employment exists.
7.54 For the purposes of employment and worker rights, the legal mechanisms are already in place
for individuals to challenge the way the relationship has been labelled, through claims to the
relevant Member State Court system. The relevant Member State tax authority also has the
ability to challenge the tax treatment applied by the employing or engaging entity and the
individual.
7.55 Apart from the areas where Union legislation includes the test for determining employee
status (e.g. Regulation 1215/2012 and Regulation 893/2008), Member States will each have
52 Mikkelsen v Danmols Inventar A/S (C105/84) [1986] 1 C.M.L.R. 316
October 2015 | 142
different tests for determining employee status for the purposes of employment rights, social
security and tax treatment. Given the internationally mobile nature of the air transport sector,
several Member States may be involved in any working arrangement and, in those
circumstances, whilst the main connecting factor for determining law and jurisdiction is the
place where the employee habitually carries out his work and there is caselaw at European
level giving guidance on what this means (as explored further in Section 5 below), it may
naturally be confusing for the parties (both airline and individual worker) -when looking to
determine the correct status for the relationship according to the various legal tests and for
the parties to know which Member States' law and/or jurisdiction should apply to determine
disputes, and to account for appropriate tax and social security contributions.
7.56 It should be noted that, whilst there are less employment protections in place for the self-
employed, they do tend to enjoy beneficial tax treatment and can, therefore, prefer that
arrangement both for tax reasons and for increased flexibility. This is usually the case where
the individual's skills are in high demand or are specialised. However, it may not in every
situation be the choice of the individual as to which type of relationship is chosen. Whilst the
mechanisms are in place to challenge the categorisation of the relationship, the risk for any
self-employed individual challenging their employment status in the Courts is that this may
lead to the increased liability to tax which is associated with employment status, both in terms
of future liability and potentially past liabilities.
Case study - Employment vs self-employment in the UK
7.57 Since reference should be made to national legislation when it comes to defining terms such
as "worker" or "employee", it is proposed to analyse the relevant legislation and case law of
the UK as an example.
a) The concepts of "employee" and "worker" under UK law and case law
7.58 Taking the UK position as an example, significant statutory protection is in place for
employees. This includes:
Unfair dismissal;
Redundancy payments;
Request to work flexibly;
Family leave and pay; and
All of the rights enjoyed by workers as outlined below.
7.59 Lesser protection is available to an additional category: "workers". The key rights are:
Equal pay discrimination;
Not to suffer a detriment on the grounds related to union membership or activities / non-
membership of a trade union;
Family pay (but not leave);
To receive at least the national minimum wage;
Paid holiday leave and rest breaks;
Statutory sick pay;
Protection against a detriment due to making a protected disclosure;
To be automatically enrolled in a pension scheme; and
Not to be treated less favourably when working part-time.
October 2015 | 143
7.60 Given the distinction in rights, the respective definitions are important. Within the UK,
"employees" are defined through legislation and case law. However, there is no precise
definition and Court decisions will be fact specific. Case law has established that the key tests
are:
personal service owed by the employee to the employer;
mutuality of obligation between employer and employee;
control exercised by the employer over the employee; and
other factors (which can include provision of materials / tools, whether the individual
engages help to carry out the work, the degree of financial risk adopted, the degree of
investment in and management of the business, whether the individual has the
opportunity to profit from their own good performance, whether the person is paid a
fixed wage or salary, and whether the person is paid when absence on holiday or sick, the
level of general integration into the business and the nature and length of the
engagement).
7.61 It should be noted that the Courts in the UK will look to the true nature of the relationship
rather than at the labels the parties use to describe the relationship. Lord Clarke, sitting at the
Supreme Court, in Autoclenz Limited v Belcher and others, stated that "... if two parties
conspire to misrepresent their true contract to a third party, the court is free to disregard the
false arrangement. " 53
7.62 In the UK, there is no single statutory definition of a "worker". In most legislation, a worker is
either an employee or someone who works under a contract to provide services personally
(unless the party for whom the services are performed is a client or customer of the worker's
business or profession). This has the effect of excluding the genuinely self- employed. For
example, for the purposes of Employment Rights Act 1996 a worker is defined by section
230(3) as an individual who has entered into, works or has worked under:
A contract of employment (section 230(3)(a), ERA 1996); or
Any other contract, whether express or implied and (if it is express) whether oral or in
writing, whereby the individual undertakes to do or perform personally any work or
services for another party to the contract whose status is not by virtue of the contract
that of a client or customer of any profession or business undertaking carried on by the
individual (section 230(3)(b), ERA 1996).
b) The relevance of the "self-employed" in the UK
7.63 Whilst it is commonly understood that a self-employed person is not an employee, EU
legislation (as well as the law in many Member States including the UK) does not clearly define
the nature and scope of a self-employed individual.
7.64 In the UK, Cooke J in Market Investigations Ltd v Minister of Pensions and Social Security
stated that the test for being self-employed rests on whether the person is "in business on his
own account" and takes account of factors such as:
7.65 The provision of own equipment;
Hiring helpers;
53 Autoclenz Limited v Belcher and others [2011] UKSC 41 [23]
October 2015 | 144
Degree of financial risk taken;
Degree of responsibility for investment and management; and
Opportunity for profiting from sound management54.
7.66 Taking an example, in a self-employed relationship in the UK, there will be no payment of
holiday or sick pay as the self-employed person is deemed to be paid solely for the work
carried out. Payment of holiday or sick pay would indicate an employee or worker
relationship.
7.67 Whilst employers will have an obligation to withhold tax and social security contributions from
employees and to account to the tax authorities for employer social security contributions in
respect of employees, employers do not have such obligations in respect of the self-employed.
Those who are truly self-employed have to account for their own tax and social security
contributions. In the UK, they generally benefit from more favourable tax treatment as they
are able to offset their tax liability against their expenses.
Data trends
7.68 Quantitative analysis of Eurostat data trends on employment types is provided in chapter 6
(page 108).
Overview of stakeholder responses
Airports
7.69 The majority of airport respondents reported that there had either been an increase or no
noticeable change in fixed-term contracts, part-time employment and atypical working hours
overall in the air transport sector. There was overwhelming consensus that self-employment
was not changing or was not applicable to airports, but no clear consensus regarding trends in
temporary agency work, which implies a large variety of arrangements across EU airports.
ACI’s high-level view correlates with these results. These results are presented in Figure 7.2.
54 Market Investigations Ltd v Minister of Pensions and Social Security [1969] 2 QB 173
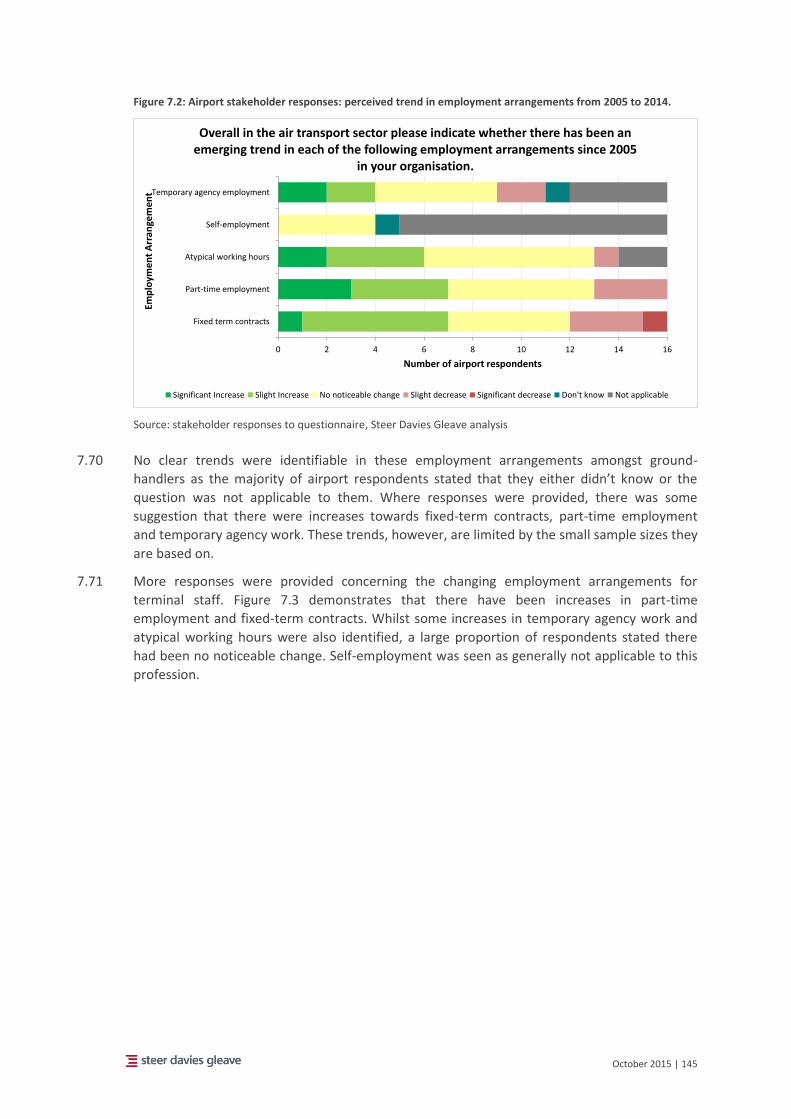
October 2015 | 145
Figure 7.2: Airport stakeholder responses: perceived trend in employment arrangements from 2005 to 2014.
Source: stakeholder responses to questionnaire, Steer Davies Gleave analysis
7.70 No clear trends were identifiable in these employment arrangements amongst ground-
handlers as the majority of airport respondents stated that they either didn’t know or the
question was not applicable to them. Where responses were provided, there was some
suggestion that there were increases towards fixed-term contracts, part-time employment
and temporary agency work. These trends, however, are limited by the small sample sizes they
are based on.
7.71 More responses were provided concerning the changing employment arrangements for
terminal staff. Figure 7.3 demonstrates that there have been increases in part-time
employment and fixed-term contracts. Whilst some increases in temporary agency work and
atypical working hours were also identified, a large proportion of respondents stated there
had been no noticeable change. Self-employment was seen as generally not applicable to this
profession.
0 2 4 6 8 10 12 14 16
Fixed term contracts
Part-time employment
Atypical working hours
Self-employment
Temporary agency employment
Number of airport respondents
Emp
loym
en
t A
rran
gem
en
tOverall in the air transport sector please indicate whether there has been an
emerging trend in each of the following employment arrangements since 2005 in your organisation.
Significant Increase Slight Increase No noticeable change Slight decrease Significant decrease Don't know Not applicable
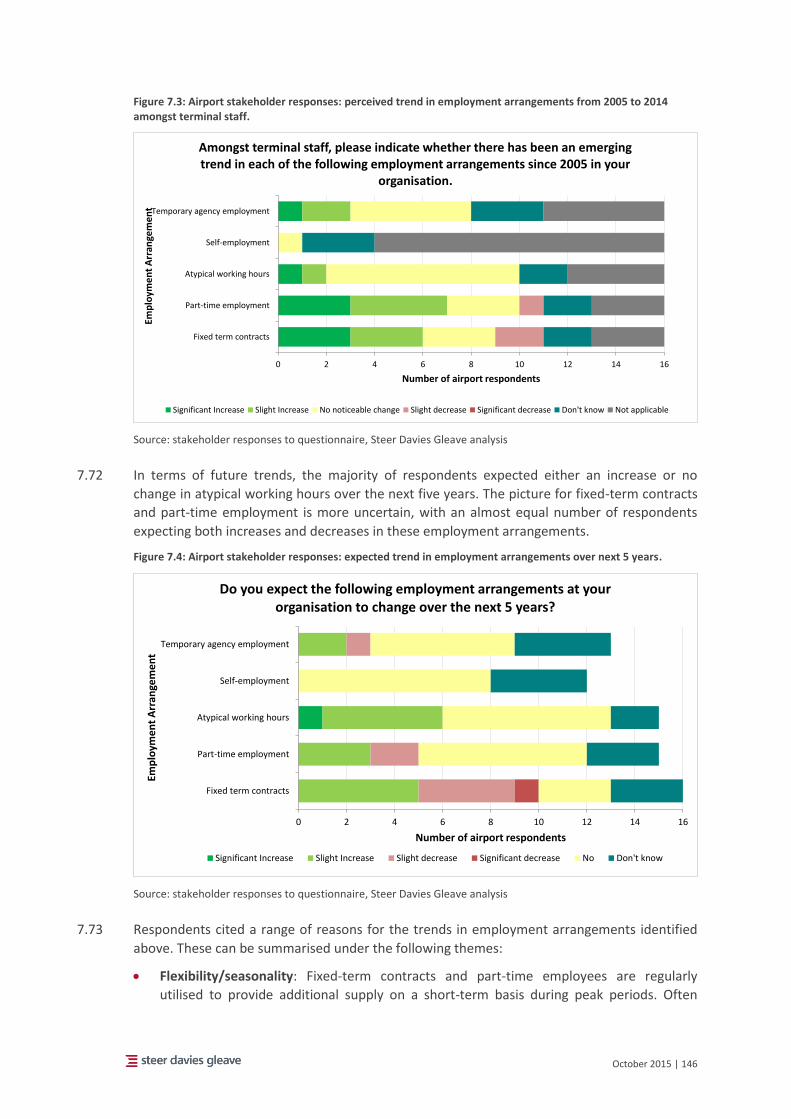
October 2015 | 146
Figure 7.3: Airport stakeholder responses: perceived trend in employment arrangements from 2005 to 2014 amongst terminal staff.
Source: stakeholder responses to questionnaire, Steer Davies Gleave analysis
7.72 In terms of future trends, the majority of respondents expected either an increase or no
change in atypical working hours over the next five years. The picture for fixed-term contracts
and part-time employment is more uncertain, with an almost equal number of respondents
expecting both increases and decreases in these employment arrangements.
Figure 7.4: Airport stakeholder responses: expected trend in employment arrangements over next 5 years.
Source: stakeholder responses to questionnaire, Steer Davies Gleave analysis
7.73 Respondents cited a range of reasons for the trends in employment arrangements identified
above. These can be summarised under the following themes:
Flexibility/seasonality: Fixed-term contracts and part-time employees are regularly
utilised to provide additional supply on a short-term basis during peak periods. Often
0 2 4 6 8 10 12 14 16
Fixed term contracts
Part-time employment
Atypical working hours
Self-employment
Temporary agency employment
Number of airport respondents
Emp
loym
en
t A
rran
gem
en
tAmongst terminal staff, please indicate whether there has been an emerging trend in each of the following employment arrangements since 2005 in your
organisation.
Significant Increase Slight Increase No noticeable change Slight decrease Significant decrease Don't know Not applicable
0 2 4 6 8 10 12 14 16
Fixed term contracts
Part-time employment
Atypical working hours
Self-employment
Temporary agency employment
Number of airport respondents
Emp
loym
en
t A
rran
gem
en
t
Do you expect the following employment arrangements at your organisation to change over the next 5 years?
Significant Increase Slight Increase Slight decrease Significant decrease No Don't know
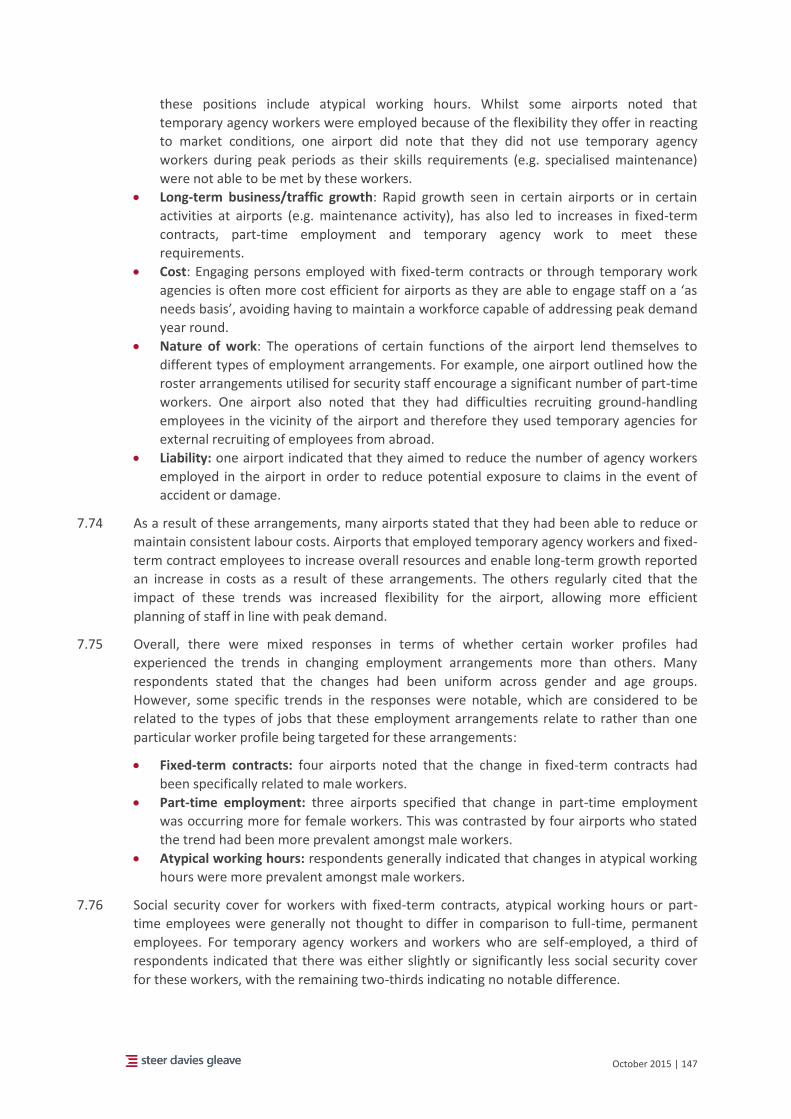
October 2015 | 147
these positions include atypical working hours. Whilst some airports noted that
temporary agency workers were employed because of the flexibility they offer in reacting
to market conditions, one airport did note that they did not use temporary agency
workers during peak periods as their skills requirements (e.g. specialised maintenance)
were not able to be met by these workers.
Long-term business/traffic growth: Rapid growth seen in certain airports or in certain
activities at airports (e.g. maintenance activity), has also led to increases in fixed-term
contracts, part-time employment and temporary agency work to meet these
requirements.
Cost: Engaging persons employed with fixed-term contracts or through temporary work
agencies is often more cost efficient for airports as they are able to engage staff on a ‘as
needs basis’, avoiding having to maintain a workforce capable of addressing peak demand
year round.
Nature of work: The operations of certain functions of the airport lend themselves to
different types of employment arrangements. For example, one airport outlined how the
roster arrangements utilised for security staff encourage a significant number of part-time
workers. One airport also noted that they had difficulties recruiting ground-handling
employees in the vicinity of the airport and therefore they used temporary agencies for
external recruiting of employees from abroad.
Liability: one airport indicated that they aimed to reduce the number of agency workers
employed in the airport in order to reduce potential exposure to claims in the event of
accident or damage.
7.74 As a result of these arrangements, many airports stated that they had been able to reduce or
maintain consistent labour costs. Airports that employed temporary agency workers and fixed-
term contract employees to increase overall resources and enable long-term growth reported
an increase in costs as a result of these arrangements. The others regularly cited that the
impact of these trends was increased flexibility for the airport, allowing more efficient
planning of staff in line with peak demand.
7.75 Overall, there were mixed responses in terms of whether certain worker profiles had
experienced the trends in changing employment arrangements more than others. Many
respondents stated that the changes had been uniform across gender and age groups.
However, some specific trends in the responses were notable, which are considered to be
related to the types of jobs that these employment arrangements relate to rather than one
particular worker profile being targeted for these arrangements:
Fixed-term contracts: four airports noted that the change in fixed-term contracts had
been specifically related to male workers.
Part-time employment: three airports specified that change in part-time employment
was occurring more for female workers. This was contrasted by four airports who stated
the trend had been more prevalent amongst male workers.
Atypical working hours: respondents generally indicated that changes in atypical working
hours were more prevalent amongst male workers.
7.76 Social security cover for workers with fixed-term contracts, atypical working hours or part-
time employees were generally not thought to differ in comparison to full-time, permanent
employees. For temporary agency workers and workers who are self-employed, a third of
respondents indicated that there was either slightly or significantly less social security cover
for these workers, with the remaining two-thirds indicating no notable difference.
October 2015 | 148
Temporary agency work
7.77 Turning specifically to temporary agency work within airports, half of the respondents stated
that they engage temporary agency staff. Of those, temporary agency workers were generally
considered to account for 5% or less of the total workforce, although one airport did report
that 15% of the workforce are temporary agency workers due to a scarcity of the required
workers in the area surrounding the airport.
7.78 There was generally little evidence of increased use of temporary agency workers during peak
periods, with the majority of respondents indicating the same percentage of temporary
agency workers during peaks as the average percentage during a year. ACI’s high-level view,
however, is that that temporary agency work at airports is primarily to cover for peak periods
One anomaly was an airport which indicated only 1.9% of the workforce are generally
temporary agency workers, but during peak periods this rises significantly.
7.79 Temporary agency workers are generally employed in airports as terminal staff or in ground-
handling functions, but some airports did report that they are used for back-office functions
such as IT. Generally, similar proportions of ground-handlers and terminal staff are temporary
agency workers (1-10%), in line with the overall proportions indicated above. One airport did
indicate a slightly higher proportion of ground-handlers (11-20%).
7.80 The types of relationships airports indicated with temporary work agencies were almost
equally split between those who have ad-hoc arrangements with agencies to provide staff
when required and those airports who have a regular, on-going agreement with agencies to
provide a certain number of staff or skills.
7.81 Airports indicated a tendency for renewal of a person’s temporary agency contract, although
the prevalence of this varied: three airports stated that under 20% of contracts were renewed,
three airports stated 20-50% of contracts were renewed, whilst a further three stated over
50% are renewed. The number of times a contract is extended or renewed also varied: three
airports stated that contracts are generally renewed twice, whilst two stated that contracts
tend to be renewed more than twice.
7.82 A third of respondents stated that there had been instances where temporary agency workers
transferred to become direct permanent employees of the airport. The prevalence of this
practice differed significantly between airports: two airports stated that only 1-10% of TAWs
become permanent employees, whilst a further two airports said the proportion was 41-50%.
One airport indicated as many as 81-90% of TAWs transferred to directly employed persons.
This may indicate an established hiring process; it is understood from the Liège Airport case
study (see Appendix C) that a ground-handler at the airport hires all staff through temporary
agencies initially, and assuming both parties consent the person employed then moves to a
fixed-term contract before finally being permanently employed with the organisation.
7.83 In terms of working conditions amongst temporary agency workers, the majority of airports
suggested that either there was no noticeable difference in comparison with permanent
employees, or they didn’t know. Some trends were perceptible suggesting poorer working
conditions amongst temporary agency workers, but it should be noted that these are limited
by the small sample size:
Atypical working hours: two respondents noted slightly higher prevalence towards
atypical working hours for temporary agency workers.
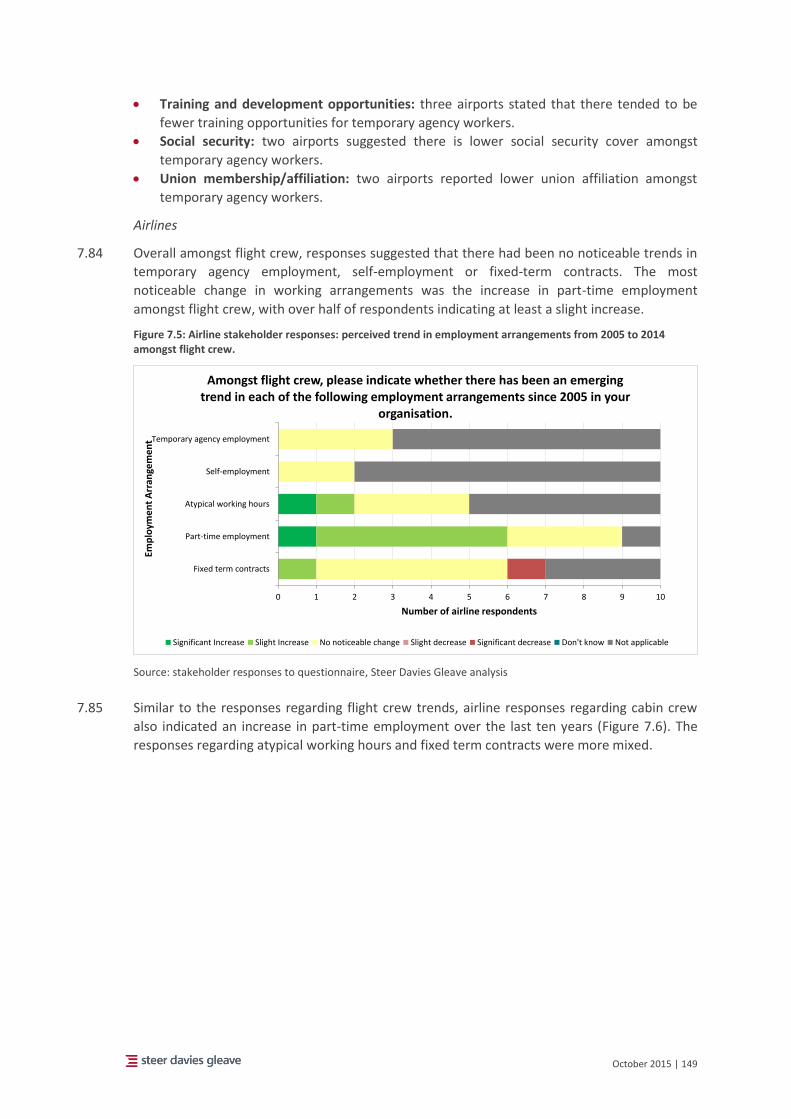
October 2015 | 149
Training and development opportunities: three airports stated that there tended to be
fewer training opportunities for temporary agency workers.
Social security: two airports suggested there is lower social security cover amongst
temporary agency workers.
Union membership/affiliation: two airports reported lower union affiliation amongst
temporary agency workers.
Airlines
7.84 Overall amongst flight crew, responses suggested that there had been no noticeable trends in
temporary agency employment, self-employment or fixed-term contracts. The most
noticeable change in working arrangements was the increase in part-time employment
amongst flight crew, with over half of respondents indicating at least a slight increase.
Figure 7.5: Airline stakeholder responses: perceived trend in employment arrangements from 2005 to 2014 amongst flight crew.
Source: stakeholder responses to questionnaire, Steer Davies Gleave analysis
7.85 Similar to the responses regarding flight crew trends, airline responses regarding cabin crew
also indicated an increase in part-time employment over the last ten years (Figure 7.6). The
responses regarding atypical working hours and fixed term contracts were more mixed.
0 1 2 3 4 5 6 7 8 9 10
Fixed term contracts
Part-time employment
Atypical working hours
Self-employment
Temporary agency employment
Number of airline respondents
Emp
loym
en
t A
rran
gem
en
t
Amongst flight crew, please indicate whether there has been an emerging trend in each of the following employment arrangements since 2005 in your
organisation.
Significant Increase Slight Increase No noticeable change Slight decrease Significant decrease Don't know Not applicable
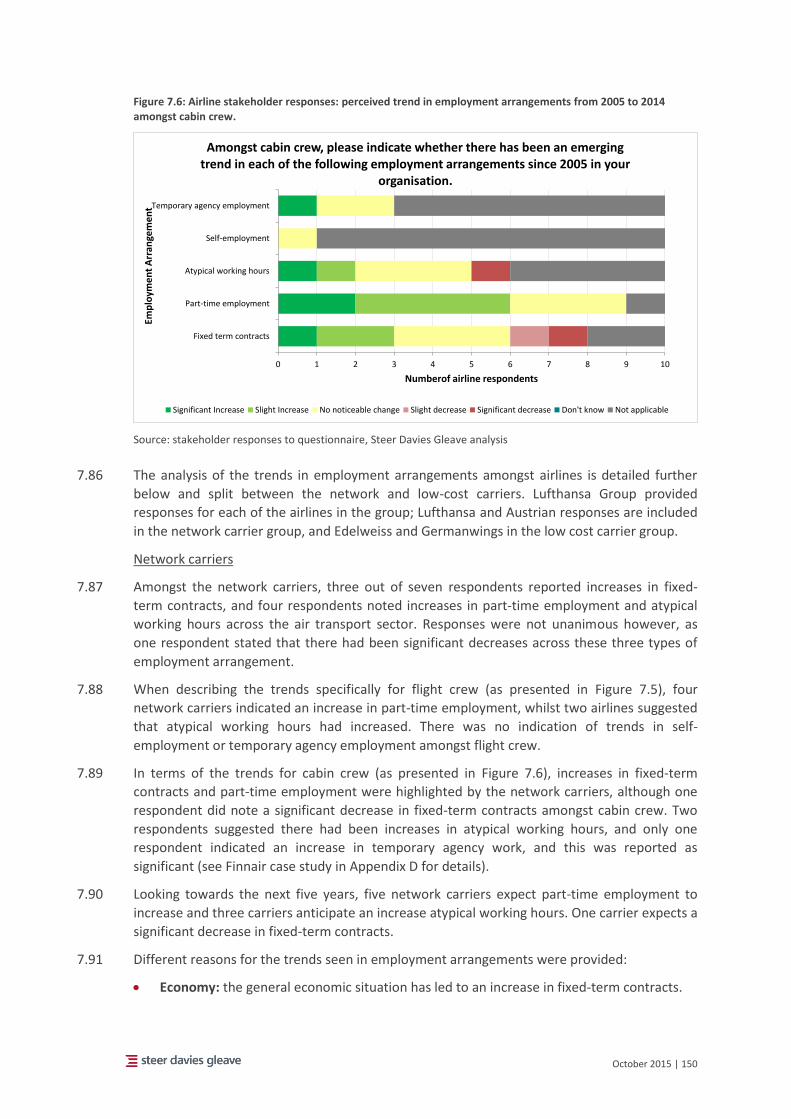
October 2015 | 150
Figure 7.6: Airline stakeholder responses: perceived trend in employment arrangements from 2005 to 2014 amongst cabin crew.
Source: stakeholder responses to questionnaire, Steer Davies Gleave analysis
7.86 The analysis of the trends in employment arrangements amongst airlines is detailed further
below and split between the network and low-cost carriers. Lufthansa Group provided
responses for each of the airlines in the group; Lufthansa and Austrian responses are included
in the network carrier group, and Edelweiss and Germanwings in the low cost carrier group.
Network carriers
7.87 Amongst the network carriers, three out of seven respondents reported increases in fixed-
term contracts, and four respondents noted increases in part-time employment and atypical
working hours across the air transport sector. Responses were not unanimous however, as
one respondent stated that there had been significant decreases across these three types of
employment arrangement.
7.88 When describing the trends specifically for flight crew (as presented in Figure 7.5), four
network carriers indicated an increase in part-time employment, whilst two airlines suggested
that atypical working hours had increased. There was no indication of trends in self-
employment or temporary agency employment amongst flight crew.
7.89 In terms of the trends for cabin crew (as presented in Figure 7.6), increases in fixed-term
contracts and part-time employment were highlighted by the network carriers, although one
respondent did note a significant decrease in fixed-term contracts amongst cabin crew. Two
respondents suggested there had been increases in atypical working hours, and only one
respondent indicated an increase in temporary agency work, and this was reported as
significant (see Finnair case study in Appendix D for details).
7.90 Looking towards the next five years, five network carriers expect part-time employment to
increase and three carriers anticipate an increase atypical working hours. One carrier expects a
significant decrease in fixed-term contracts.
7.91 Different reasons for the trends seen in employment arrangements were provided:
Economy: the general economic situation has led to an increase in fixed-term contracts.
0 1 2 3 4 5 6 7 8 9 10
Fixed term contracts
Part-time employment
Atypical working hours
Self-employment
Temporary agency employment
Numberof airline respondents
Emp
loym
en
t A
rran
gem
en
tAmongst cabin crew, please indicate whether there has been an emerging
trend in each of the following employment arrangements since 2005 in your organisation.
Significant Increase Slight Increase No noticeable change Slight decrease Significant decrease Don't know Not applicable
October 2015 | 151
Flexibility: there was been an increased requirement for flexibility in the industry. For
instance, the need to meet demand peaks means that part-time employment has
increased.
Business growth: Certain airlines have used these alternative (i.e. non-permanent)
employment arrangements to increase their flight and cabin crew workforce.
Individual fit: Fixed term contracts have also been used to determine whether an
employee fits into the company before committing to a permanent contract of
employment.
Social changes: Part-time employment has increased due to the rise in parental part-time
leave (for men as well as women) and employees combining work with study.
7.92 Some trends were due to circumstances specific to a particular network carrier:
Decreases in fixed-term contracts at two network carriers resulted from the overall
reduction in staff due to restructuring.
One network carrier reported that the inflexibility of the terms of collective labour
agreements and the reactions of the unions drove the airline towards outsourcing models.
7.93 The results of these trends has been lower costs of employment in the early part of an
employee’s career, and the airline having greater overall control over employee costs.
7.94 There was no clear consensus as to whether the changes in employment arrangements have
been particularly prevalent for particular age groups or genders. Increases in fixed term
contracts are more prominent in the 30-49 age group at one airline and the 15-29 age group at
another. Part-time and atypical work is more prevalent for the 15-49 age group. One airline
noted that atypical working hours are more common amongst men, whereas another
identified that temporary agency work was particularly prevalent for women. One airline
reports that trends are occurring uniformly across gender and age groups. It is considered that
trends by gender and age group relate primarily to the specific function being performed by
the employee.
7.95 Respondents stated that either that fixed-term, part-time and atypical working hours provided
no noticeable difference in social security cover when compared to full-time permanent
employees, or that they didn’t know. One airline stated that part-time employees had slightly
less social security cover.
Low cost carriers
7.96 Amongst the LCCs, no noticeable change in all employment categories was generally
identified, although two respondents indicated increases in part-time employment for flight
and cabin crew. One airline believed these increases to have been most prevalent amongst
workers over 30, stating that the lifestyle requirements of employees change with age. Part-
time employment was also stated to enable increased flexibility, although a slight cost
increase was highlighted with increased part-time employment.
7.97 One LCC also noted a slight decrease in fixed term contracts for cabin crew, although no
reason for this was provided. It is understood that this airline uses a low number of fixed-term
contracts for cabin crew.
7.98 Two LCC respondents reported their expectations that there will be no change in current
employment arrangements over the next 5 years. One airline expected the trends in part-time
employment to continue, predicting a significant increase in this form of employment, and
also expected a slight increase in fixed term contracts.
October 2015 | 152
7.99 All respondents reported no noticeable differences in social security cover for fixed, part-time
and atypical employment arrangements when compared to full-time, permanent employees.
Temporary agency workers
7.100 Of the network carriers, two airlines responded to state that their organisations engage
temporary agency workers. These workers represent less than 5% of total staff and are
engaged in ground-handling and other (unspecified) activities. The reasons for using these
workers include a need for flexibility and for a different or lower level of skilled support, as
well as providing cover for long-term absences.
7.101 Contracts of under 6 months and 6-12 months in duration may be extended in less than 20%
of cases by network carriers, and generally only once rather than repetitively, although
contracts of over 12 months are generally renewed twice. Agency workers at these network
carriers are occasionally transferred to direct permanent employee status, but only in under
10% of cases.
7.102 Two low cost carriers stated that they use temporary agency workers.
7.103 One LCC engages temporary agency workers across a number of functions, including flight
crew, cabin crew, and ground-handling activities, under a regular, on-going arrangement to
provide staff and skills to the airline to cover both peak periods and sick leave. The other LCC
respondent only uses temporary agency workers in ground-handling, and account for a very
small proportion of their ground-handlers (1%). These are employed either through a regular,
on-going arrangement or an ad-hoc arrangement to provide increased flexibility and provide
cover for peak periods and sick leave.
7.104 Views on the trend in temporary agency workers since 2005 differed between the two
respondents. One noted a slight increase in the use of temporary agency workers amongst
flight and cabin crew, whilst the other only noted a slight increase amongst ground-handlers.
7.105 There were also notable differences in the extension and renewal of contracts. One
respondent reported that over 50% of contracts in 2013 were renewed or extended, and on
average contracts are renewed more than twice. However, the other respondent renews less
than 20% of contracts, and then are usually only renewed once.
7.106 Both LCC respondents indicated a tendency for temporary agency workers to transfer to direct
permanent employees, although the prevalence of this varied. One respondent stated 21-30%
of temporary agency workers become permanent employees, whilst the percentage at the
other respondent was significantly higher (61-70%).
7.107 There was considered to be no noticeable difference in wages, training, social security,
atypical working hours and union membership between temporary agency workers and full
time employees.
Representative organisations
Worker representatives
7.108 The European Transport Workers Federation (ETF) identified a significant increase in atypical
working hours and self-employment across flight crew, cabin crew (except self-employment
which they consider to only have slightly increased amongst cabin crew) and ground-handling
staff. They also noted that there have been slight increases in fixed-term contracts and part-
time employment. ETF anticipated that these trends will increase over the next 5 years.
October 2015 | 153
7.109 These reports correlate with those received from the European Cockpit Association (ECA) and
Unionen in Sweden on employment arrangements for flight and cabin crew. The Finnish Cabin
Crew Union (SLSY) have observed significant increases in temporary agency employment only,
and limitations of Finnish law, which restricts fixed-term contracts, and Finnair collective
agreements, which limit part-time work to 10% of the workforce is the reason why increases in
fixed-term contract and part-time work have not also been observed.
7.110 A respondent noted that atypical working hours are not uncommon for crew members, and
that these would increase if an airline increases its long-haul flight operations.
7.111 In terms of temporary agency work, ETF report that airlines and airports engage approximately
21-30% of their workforce through temporary work agencies. This is particularly valid for cabin
crew and ground-handlers, where there has been a significant increase in temporary agency
workers. They noted that temporary agency work is less prevalent amongst flight crews,
where they estimate only 1-10% of staff are temporary agency workers. Responses from ECA,
Unionen and SLSY are in line with this proportion.
7.112 Regarding the use of temporary agencies to employ pilots, the ECA considers this
phenomenon to be relatively new; it was anecdotal in the 1990s however by 2015 it is well
established. The ECA notes that it is predominantly used by LCCs although it is now not
uncommon in the network carriers. The ECA has no data on the duration of contracts but
considers that a quarter of its members (pilots) have changed employer more than 8 times
(compared to half its members who have not worked for more than one airline in their
career). Whilst some pilots are able to transfer to direct permanent employee status, the ECA
notes that pilots are staying longer on temporary contracts as permanent positions are not
available. One exception was noted; easyJet now offer pilots permanent positions after a one
year stint in a temporary training position.
7.113 As noted in paragraph 7.7, temporary agency work is traditionally associated with exclusively
short-term needs (including specific skills/experience, additional resources, illness, staff
shortages). However, the ETF note that temporary work agencies are not only used in
European aviation for “short term staff shortages” but also for more permanent employment
solutions.
7.114 Regarding pilot self-employment (discussed further in paragraph 7.138 below), the ECA
believes that, by the criteria set down in both the UK and Ireland, agency pilots would be
properly categorised as employees, given the direct control exercised over the working
arrangements.
7.115 SLSY noted that whilst Finnair have significantly expanded their operations in the past 7 years,
during that time they have not hired any crew member from within Finland; the majority of
new crew has been hired outside Finland, primarily from Asia, through employment agencies.
The only crew hired from within Finland during this time has been summer workers, also
engaged through an agency. SLSY stated that none of these temporary agency workers
transfer to direct permanent employee status with the airline. Whilst some of the Asian crew
are required for customer service reasons (language skills), SLSY considers the main reason for
this activity is cost-savings. This practice, along with Finnair’s perspective, is described further
in the Finnair case study in Appendix D.
7.116 ETF, ECA, and Unionen all stated that the increases in fixed-term contracts and temporary
agency employment are considered to have particularly impacted younger workers, primarily
those in the 15-29 age bracket. Whilst SLSY sees the trend in increasing fixed-term contracts
October 2015 | 154
and temporary agency employment as something affecting primarily young females, this is
considered to be due to the prevalence of females in cabin crew employment. The key issue
was noted to be the increasing trend in employing crew from “cheaper” European countries,
or from outside the EU.
7.117 Workers representatives believe these trends, whilst enabling some flexibility amongst the
labour force, are largely intended to circumvent workers’ protection, particularly where strict
labour laws exist. They indicate that temporary agency workers often do not enjoy the same
rights as direct employees, and also suffer lower wages, social security and less training
opportunities.
7.118 A further impact, identified by SLSY, is the potential coverage of unemployment benefits,
depending on the source of these payments. If unemployment benefits are paid or partly paid
by unions or private unemployment funds (as is the case in Finland), the benefit may only be
available after a certain duration or volume of work, which would be impacted by an
increasing prevalence in the use of fixed-term or part-time contracts.
7.119 The ECA noted that continuity is one of the key requisites for effective social security, meaning
that “any employment contract which differs from permanent, even if theoretically covered by
the same social security level, implies a disadvantage for the worker”.
7.120 The ETF also highlight the practice of companies creating ‘fictive’ headquarters in countries
with more relaxed labour laws in order to base their operations there. In ETF’s opinion, these
practices have caused a dramatic deterioration in employees’ working conditions.
7.121 The University of Ghent’s study on Atypical Employment in Aviation identifies issues and
similar reasoning to those identified by the ETF. They state that some employers within the air
transport sector go ‘legislation shopping’ by seeking to engage individuals from Member
States which have poorer mandatory labour law provisions.55
Employer representatives
7.122 ACI estimates that there is almost no self-employment at airports, and some limited
temporary agency employment, primarily to cover peaks during the summer months. The
majority of airport employees have permanent contracts of employment.
7.123 Where airports provide ground-handling, staff are generally permanently employed, however
ACI are observing an increase in fixed term employment. This tends to happen more whilst
airports are deciding whether to outsource ground-handling activities - fixed-term contracts
helps maintain flexibility when plans are liable to change. Where airports employ retail staff
ACI estimate these staff to be on fixed term contracts and part time employment. Security and
cleaning functions are mostly outsourced by airports, and it would be likely to see fixed term
and part time employment but ACI have no evidence of this.
7.124 ACI considers that these changes in employment arrangements are due to the liberalisation of
the air transport market, the resultant increase in competition between airlines and the
subsequent impact on airports. Airports are now working as businesses and are in competition
with each other, so they have to be more cost-conscious and efficient than before. ACI
considers that the way airports were 10—15 years ago is very different to where it is now,
55 University of Ghent (2015) – Atypical Employment in Aviation
October 2015 | 155
which is part of the wider transformation seen in the air transport sector, moving towards
more flexible and more cost efficient arrangements.
7.125 If a temporary agency worker is engaged by an airport, ACI considers these workers are more
likely to be engaged in cleaning activities, and some ground-handling tasks, as these activities
require less training. The training requirements for security staff limit the practicality of using
temporary agency workers, and workers need background checks which takes time. These
requirements result in more stability in security employment overall. Whilst temporary agency
workers provide flexibility for the airport, if special access is needed, background checks are
required, which takes more time. This implies that there could be less employment volatility in
restricted areas vs non-restricted areas.
7.126 Whilst the overall trend to use temporary agency workers is increasing, ACI considers that
currently the main use is to support at peak times. More and more airports request instant
feedback from passengers (sometimes as required by regulators), and up-staffing to provide
additional support through peak periods also helps maintain levels of positive feedback from
passengers. It is even helpful to up-staff for specific days in the peak (e.g. Saturdays in July) as
the temporary workers provide a noticeable increase in support and airports will pay a
premium for these very short-term hires. ACI considers that overall, temporary agency
workers experience the same (lower) differences in wages, training and development as for
outsourcing.
7.127 The Civil Air Navigation Services Organisation (CANSO) noted that there has been a significant
increase in fixed-term contracts since 2005, particularly for younger workers (15-29 age
bracket). They also noted a slight increase in atypical working hours, and expect these trends
in both types of working arrangements to continue over the coming five years.
7.128 Although CANSO did not indicate any trend towards temporary agency work, they did note
that this type of work is more prevalent amongst women and younger employees (15-29 age
bracket) within the industry.
7.129 VDF (the Association of Service Providers at German Airports) noted that there has been a
slight increase in fixed-term contracts and part-time employment amongst its members, but
that there has been no noticeable change in temporary agency employment or atypical
working hours.
7.130 VDF stated that the increased use of fixed-term contacts and part-time employment is due to
the need for employers to have increased flexibility, despite the fact that there are some
increased costs associated with these activities. VDF does not expect the current situation to
change over the next five years.
7.131 VDS estimated that between 5-10% of the total workforce amongst its members was engaged
through a temporary employment agency throughout 2013, increasing to 10% during peak
periods (e.g. summer). Temporary agency employment is used across all ground-handling
activities, with the trend in usage ranging between no noticeable change and slight increase
since 2005.
7.132 ELFAA noted that there has been an increase in the use of temporary agency employment in
order to maintain flexible and efficient operations in the post-liberalisation air market. They
state that temporary agency workers are not unduly disadvantaged as these workers are
protected by the EU Temporary and Agency Workers Directive (2008/104/EC) and are subject
to the same working hour limitations as other staff.
October 2015 | 156
Temporary work agencies
7.133 Two temporary work agencies responded to the questionnaires. The temporary work agencies
have regular, on-going arrangements with airlines to provide a certain number of staff, usually
to provide additional support in peak periods and cover sick leave. Temporary agency workers
are also engaged to provide particular skills, specifically relating to trainers: simulator
instructors, type rating instructors and type rating examiners.
7.134 Both report an increase in fixed-term contracts and temporary agency employment across the
air transport sector since 2005, which was particularly notable amongst flight and cabin crew
(notably in contrast to many airline responses, which reported no change). These trends are
expected to continue over the next five years as the development of air carriers continues and
new European markets are opened up, requiring further changes to maintain and enhance
cost effectiveness and employment flexibility.
7.135 No noticeable change in atypical working hours was reported. In terms of part-time
employment, one agency reported a slight increase whilst the other noted a significant
decrease (stating this was thought to be due to the high levels of demand at the moment).
These contrasting responses were also given for the change in self-employment. They
anticipate that these trends in part-time employment will continue over the next 5 years.
7.136 The reasons for these trends are largely attributed to cost saving drivers. The increase in low
cost travel and competition amongst European airlines has driven airlines to reduce costs and
require greater flexibility from their workforce, particularly during high season. Temporary
agency workers are able to provide airlines with that flexibility.
7.137 One agency reported that, as a temporary work agency, they have a direct responsibility to
ensure that all pilots they engage have social security and tax arrangements as applicable to
EU law and the local law of their home base state. As an organisation, they ensure workers are
treated the same as permanent workers as required by the Temporary Agency Work Directive
2008/104/EC, and always offer temporary agency pilots the same pay and conditions as the
permanent pilots of the airline. Similarly, all pilots are trained to the same standards. The
agency stated that the lack of clarity around local laws, and the potential for conflicting
decisions regarding the correct application of these laws from the Member States concerned
mean that a significant amount of time and effort (and cost) is expended in ensuring the
employee is contracted correctly in each location.
7.138 One agency made specific comments on pilot self-employment, stating that it will offer this
model to airlines and pilots only if this is permitted by the agency’s internal compliance
operational rules, which are based on their understanding of local regulations. The agency
stated that Ireland and the UK are the only two jurisdictions where they will offer the self-
employment arrangement (i.e. engagement of self-employed pilots through temporary
agencies) as well as temporary employment arrangements. All other Member States are
offered placements only on a temporary employment basis (a legal investigation into the
specific laws on pilot self-employment in each Member State was beyond the scope of this
study). The agency estimates only 10% of all their pilots are on a self-employment contractual
arrangement. The agency did however report anecdotally that it had heard of self-
employment practices offered elsewhere on continental Europe. When asked how this was
possible if the law did not allow it, the agency response was that organisations will “do it and
wait to see if they are told not to”. It is not the leasing entity (i.e. the airline) that takes
October 2015 | 157
responsibility for engaging pilots in this way, local regulations are always open to some form of
interpretation, and indeed do not always keep up with changes in industry.
7.139 Some instances of temporary agency workers receiving renewed contracts are reported by the
two agencies. This is particularly prevalent amongst workers whose original contract was over
one year, and would typically get renewed once following completion of the first contract. It is
also reported by one agency that a significant proportion (61-70%) of temporary agency flight
crew transfer to becoming direct employees of the airline.
7.140 Both agencies reported no noticeable difference in the wages, working hours, training
opportunities or social security of agency workers when compared to permanent employees.
The primary challenge as reported by the respondents was ensuring that the correct tax and
social security arrangements are applied, as compliance is considered a fundamental moral
requirement for the company’s operation. In terms of union affiliation, one agency noted a
slightly higher union membership amongst agency workers (when compared to permanent
staff), whilst the other believe it to be slightly lower.
Other
7.141 The head of the European Committee for Sectoral Dialogue (Civil Aviation) (CSDCA) expects a
slight increase in the prevalence of fixed-term contracts and part-time employment in the next
5 years. The CSDCA goes on to state that whilst there is no noticeable difference in social
security cover for temporary agency workers and those on fixed-term part-time contracts,
there is significantly less social security cover for those working atypical hours and the self-
employed (as the self-employed must cover themselves, which would require cost-cutting).
7.142 The CSDCA estimates that between 1-10% of airline employees are engaged via temporary
work agencies, primarily to provide additional support during peak periods and to cover sick
leave. The CSDCA considers there is no noticeable difference in wages and training and
development opportunities for staff engaged via temporary agencies.
Summary
7.143 Across the air transport sector, a consistent increase in part-time employment has been
reported. There is some evidence of increased fixed term contracts, particularly within
airports, but the prevalence is more varied. This is also the case for atypical working hours.
Self-employment is not common in the sector, although as reported in the Ghent University
Study on atypical employment, self-employment for flight crew is used by a number of airlines.
7.144 The reasons for utilising these types of employment arrangement are generally common
across the industry: they enable increased flexibility, reduction in costs and support business
growth.
7.145 Temporary agency employment occurs throughout the sector: instances of temporary agency
employees engaged as flight crew, cabin crew, ground-handlers, terminal staff and in back-
office functions have all been cited. The prevalence, however, varies. Low cost carriers tend to
use temporary agency workers across all functions (flight crew, cabin crew, and ground-
handling), but this is not the case in all instances, and many network carriers also now engage
these types of employees, generally in terminal or ground-handling functions, but one
network carrier also uses temporary agency employees consistently for cabin crew functions.
Temporary agency workers may be employed by the agency and provided to the airline, or
they may be self-employed and engaged by the agency to provide services for the airline. One
respondent offers this type of self-employment arrangement (i.e. engagement of self-

October 2015 | 158
employed pilots through a temporary agency) only in the UK and Ireland, however the
respondent was aware of anecdotal evidence linking these practices to other EU MS. Some
airports do engage temporary agency staff, although the proportions are not high.
7.146 The primary challenge with respect to temporary agency workers, as reported by the
respondents was ensuring that the correct tax and social security arrangements are applied, as
compliance is considered a fundamental moral requirement for the company’s operation.
7.147 There is evidence across the industry of temporary agency contracts being renewed,
sometimes multiple times, but again, the prevalence of this differs between profession and
employer. It is also not uncommon for temporary agency employees to become direct,
permanent employees.
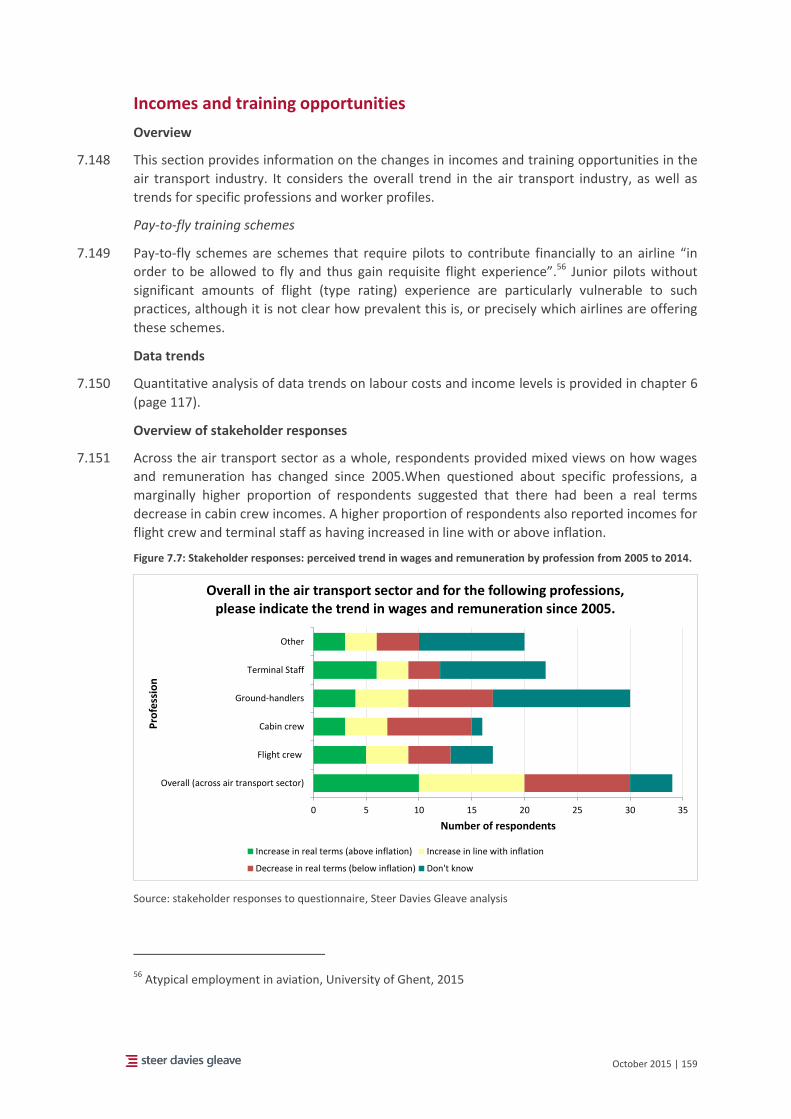
October 2015 | 159
Incomes and training opportunities
Overview
7.148 This section provides information on the changes in incomes and training opportunities in the
air transport industry. It considers the overall trend in the air transport industry, as well as
trends for specific professions and worker profiles.
Pay-to-fly training schemes
7.149 Pay-to-fly schemes are schemes that require pilots to contribute financially to an airline “in
order to be allowed to fly and thus gain requisite flight experience”.56 Junior pilots without
significant amounts of flight (type rating) experience are particularly vulnerable to such
practices, although it is not clear how prevalent this is, or precisely which airlines are offering
these schemes.
Data trends
7.150 Quantitative analysis of data trends on labour costs and income levels is provided in chapter 6
(page 117).
Overview of stakeholder responses
7.151 Across the air transport sector as a whole, respondents provided mixed views on how wages
and remuneration has changed since 2005.When questioned about specific professions, a
marginally higher proportion of respondents suggested that there had been a real terms
decrease in cabin crew incomes. A higher proportion of respondents also reported incomes for
flight crew and terminal staff as having increased in line with or above inflation.
Figure 7.7: Stakeholder responses: perceived trend in wages and remuneration by profession from 2005 to 2014.
Source: stakeholder responses to questionnaire, Steer Davies Gleave analysis
56 Atypical employment in aviation, University of Ghent, 2015
0 5 10 15 20 25 30 35
Overall (across air transport sector)
Flight crew
Cabin crew
Ground-handlers
Terminal Staff
Other
Number of respondents
Pro
fess
ion
Overall in the air transport sector and for the following professions, please indicate the trend in wages and remuneration since 2005.
Increase in real terms (above inflation) Increase in line with inflation
Decrease in real terms (below inflation) Don't know

October 2015 | 160
7.152 There was no distinction in the changes in wages and remuneration between different worker
profiles, as shown in Figure 7.8.
Figure 7.8: Stakeholder responses: perceived trend in wages and remuneration by worker profile from 2005 to 2014.
Source: stakeholder responses to questionnaire, Steer Davies Gleave analysis
7.153 Training opportunities were reported to have increased across the air transport sector: over
half of respondents suggested there had been an increase, and a third suggested this had been
significant. There was no indication of differing training opportunities between worker
profiles.
Figure 7.9: Stakeholder responses: perceived trend in training opportunities by profession from 2005 to 2014.
Source: stakeholder responses to questionnaire, Steer Davies Gleave analysis
0 5 10 15 20 25 30 35
Male
Female
Workers aged 15-29
Workers aged 30-49
Workers aged 50 or more
Number of respondents
Wo
rke
r P
rofi
le
For the following worker profiles, please indicate the trend in wages and remuneration since 2005.
Increase in real terms (above inflation) Increase in line with inflation
Decrease in real terms (below inflation) Don't know
0 5 10 15 20 25 30 35
Overall (across air transport sector)
Flight crew
Cabin crew
Ground-handlers
Terminal Staff
Other
Number of respondents
Pro
fess
ion
Overall in the air transport sector and for the following professions, please indicate the trend in training opportunities since 2005.
Significantly more training opportunities Slightly more training opportunities No noticeable difference
Slightly fewer training opportunities Significantly fewer training opportunities Don't know
Not applicable
October 2015 | 161
Airports
7.154 Over half the airport respondents believed that overall in the air transport sector wages had
increased either at or above the rate of inflation since 2005. This is in line with the Eurostat
data provided in chapter 6 (page 117). Where an airport noted this trend, in most cases they
also reported it specifically for terminal staff and ground-handling functions. A few airports
noted decreasing wages in the sector, but for one of these airports this was due to overall
recessionary impacts, which may apply to the other airports as well.
7.155 Two-thirds of airport respondents indicated that there had been an increase in training
opportunities. Increases in training or no change was also noted by airports with regards to
ground-handling and terminal staff.
Airlines
Network carriers
7.156 All network carriers except one indicated that flight crew wages and remuneration has
increased either at or above the rate of inflation since 2005. This is approximately in line with
the Eurostat data provided in chapter 6 (page 117), however the Eurostat labour cost data
indicates that wages have decreased in real terms for this category of workers, overall, since
2008. Opinions differed on cabin crew wages with only one respondent stating these had
increased above inflation (which is understood to be linked to requirements in the collective
labour agreements (CLA)), three stating they had increased in line with inflation, and a further
three stating that wages had decreased in real terms. The message on ground-handling
salaries was similarly mixed, with responses covering real terms increases and decreases, and
increases in line with inflation.
7.157 Network carriers generally indicated that there had either been increased training
opportunities since 2005, or no noticeable change. Only one carrier suggested there were
slightly fewer training opportunities for ground-handlers, and another carrier suggested the
same trend for cabin crew.
7.158 The British Airways case study in Appendix D provides an overview of their training and
apprentice schemes.
Low cost carriers
7.159 Two of the three low cost carriers stated that flight crew and cabin crew employees had seen
increases in wages and remuneration since 2005 that were above inflation. No difference
between gender or age group was noted.
7.160 Regarding training opportunities, one LCC considered that there were slightly more training
opportunities available to all worker profiles and working arrangement types since 2005,
whilst another indicated there had been no noticeable difference.
7.161 The easyJet case study provided in Appendix D includes details of their pilot cadetship scheme,
with junior pilots engaged through temporary agencies CTC Wings and CAE Parc and eligible to
apply for a permanent position with easyJet at the end of the 12 month scheme.
October 2015 | 162
Representative organisations
Worker representatives
7.162 The ETF indicated that across flight crews, cabin crews and ground-handlers, there has been a
real terms decrease in incomes since 2005. This trend is identified across all age and gender
profiles. This view is aligned with responses from Unionen and SLSY (for cabin crew) and the
ECA (flight crew), and for the period since 2008, this view is in line with the Eurostat labour
cost data provided in chapter 6 (page 117). The ECA considers that the flight crew impacted
most by these decreases are those under 29 years of age, stating that a number of pilots have
seen their salaries frozen or reduced, and listing SAS, Flybe, and Iberia as example airlines
where this has occurred. It must be noted that worker representatives would be commenting
for all persons employed (including those in outsourced functions or employed by temporary
agencies) whereas the airlines above would be referring to incomes only within their
organisations.
7.163 The ECA considered that the flight crew impacted most significantly by these decreases are
those under 29 years of age. Wage increases for workers 30 and over have been estimated to
be in line with inflation.
7.164 They also reported that there have been significantly fewer training opportunities for ground-
handlers and terminal staff, with slightly fewer training opportunities for cabin crews
(correlated by responses from Unionen and SLSY). However, they indicated that there have
not been any changes in training for flight crews. The ETF stated that the overall reduction in
training opportunities results from cost-cutting, as employers perceive training as a cost rather
than an investment in their workforce.
7.165 The ECA differed from the ETF’s response on training, stating that flight crews have
significantly fewer training opportunities, particularly those aged less than 29 years.
Employer representatives
7.166 Overall ACI observe a decreasing trend in wages, particularly for ground-handling and terminal
staff.
7.167 ACI reports that the very strong competition in ground-handling market has resulted in long
term training and development issues for persons employed in this sector, which is an area of
concern for them. If provision contracts are renewed every 7 years this limits the continuity
available for employees to develop and grow into their roles. ACI adds that beyond basic
training requirements, ground-handling organisations are not obliged to train staff. Some
ground-handling organisations are “good” in this regard but others don't offer as much
training, which is reflected in the price. This issue is less of a problem for security staff where
contractors are obliged to train security guards at airports to minimum standards, as there are
strict regulations on training standards that must be adhered to.
7.168 In the ground-handling sector in Germany, VDF stated that wages and remuneration for all
worker profiles have increased in line with inflation, and that there are slightly more training
opportunities.
Temporary work agencies
7.169 According to one temporary work agency, there has been a real terms decrease in wages for
pilots across Europe, with no particular differentiation between pilots with different working
arrangements. This reduction in payments is not thought to have been dramatic.
October 2015 | 163
7.170 The other temporary work agency reported that wages for flight and cabin crew had increased
at the rate of inflation. This was noted as being particularly true of workers with fixed term
contracts and temporary agency workers.
Summary
7.171 The stakeholder responses regarding the trend in incomes differ by type of stakeholder: whilst
airlines and airports generally reported increases either in line with or above inflation, worker
representatives suggest that there has been a decrease in real terms. It must be noted that
worker representatives would be commenting for all persons employed (including those in
outsourced functions or employed by temporary agencies) whereas the airlines above would
be referring to incomes only within their organisations.
7.172 Some distinction in the trends in salaries by professions also emerged. Whilst increases have
generally been perceived for pilots and terminal staff, there is a more mixed impression in the
salary trend for cabin crew and ground-handlers.
7.173 Training opportunities are broadly considered by the industry to have increased across all
professions by all stakeholders except the worker representatives who consider there to be
fewer opportunities amongst cabin crew, ground-handlers and terminal staff. Pay-to-fly is
acknowledged in published literature (e.g. Atypical employment study, Ghent University) as an
issue however stakeholders did not specifically comment in this area.
7.174 There was no discernible difference in salary or training trends between gender and age
groups.
Union membership and other social dialogue issues
Overview
7.175 This sections analyses union membership and social dialogue issues within the airport
transport sector. The following issues are considered:
the prevalence and form of collective labour agreements;
trends in union membership; and
the representation of persons employed when changes are proposed by employers.
7.176 The level of unionisation and the approach to collective bargaining is impacted by differences
in national labour law. In some MS, union membership is automatic (e.g. Belgium) whereas in
others, it is not (e.g. UK).
Legal background
7.177 At EU level, an individual's right to join a trade union is enshrined in Article 12 of the Charter of
Fundamental Rights of the European Union where it states that:
"Everyone has the right to freedom of peaceful assembly and to freedom of association at all
levels, in particular in political, trade union and civic matters, which implies the right of
everyone to form and to join trade unions for the protection of his or her interests."
7.178 Member States have a variety of legal rules and restrictions on union activity, as well as
protections in place for union members.
7.179 Collective bargaining agreements (CBAs) are those that are negotiated between an employer
or employers' association and a trade union or employee representative body. Generally
speaking collective agreements are only binding on the contracting parties. However, in some
October 2015 | 164
Member States national and sectoral CBAs can be extended so that they apply to parties who
did not sign the agreement. One of the few Member States which do not provide for this is the
UK. Member States have differing regimes governing social dialogue with either national,
regional, industry and company level agreements. In many Member States, these are very
much a part of working relationships, whereas in a few Member States notably the UK, Ireland
and some Central and Eastern European states, industry, regional and national level bargaining
is not prevalent.
7.180 Challenges arise in the air transport sector where there are multiple jurisdictions involved in
the working relationship. Collective bargaining agreements and the legality and effect of them
on the working relationship will differ between Member States. Therefore, where several
jurisdictions are involved in a working relationship, it will be difficult for the parties to
understand which CBA should apply, if at all, and which law and jurisdiction should apply to
any dispute (as explored further in the section on multiplication of operational bases, on page
189).
7.181 Where there is restructuring within an air transport business, this can have an effect on
applicable CBAs. EU derived laws are in place to protect the terms laid down in collective
agreements in transfer situations (which are explained further below in section 4). The case of
Österreichischer Gewerkschaftsbund v Wirtschaftskammer Osterreich - Fachverband Autobus-,
Luftfahrt- un Schifffahrtsunternehmungen57 is a relevant case from the aviation sector. In this
Austrian case, the relevant transportation union had negotiated a collective bargaining
agreement for the main undertaking in an airline group. A different, less advantageous,
collective bargaining agreement was in place for a subsidiary in the group. The airline decided
to transfer employees into the subsidiary. It was noted in that case that the EU law does not
establish "a uniform level of protection throughout the Community on the basis of common
criteria". The judge noted that the relevant Directive is not in place to maintain the application
of a collective bargaining agreement upon transfer, but the "terms and conditions" put into
place by such an agreement.
7.182 Whether CBAs cover agency workers, part-time and fixed-term workers may differ between
Member States and between individual CBAs, while the truly self-employed are unlikely to be
covered by CBAs.
7.183 At European level, there are Directives providing for information and consultation obligations
on employers including for the purposes of redundancies and transfers of undertakings585960.
The Commission has reviewed the effectiveness of the various information and consultation
57 Case C-328/13
58 Directive 2002/14/EC of 11 March 2002 establishing a general framework for informing and
consulting employees in the European Community
59 Directive 98/59/EC of 20 July 1998 on the approximation of laws of the Member States relating to
collective redundancies
60 Directive 2001/23/EC of 12 March 2001 on the approximation of the laws of the Member States
relating to the safeguarding of employees’ rights in the event of transfers of undertakings, businesses or parts of undertakings or businesses
October 2015 | 165
obligations under EU Directives including in respect of the transfer of undertakings and
collective redundancies61 (dealt with further from page 181).
The role of social dialogue
7.184 The Civil Aviation Social Dialogue Committee was established in 2000. It is one of the 43
European sectoral social dialogue committees, recognised pursuant to Commission Decision of
20 May 1998. Its main aim is to encourage and develop the social dialogue in the meaning of
the European Treaties (namely Articles 152, 154 and 155 of TFEU) in order to improve
employment and good working conditions in the Civil Aviation sector and to strengthen the
economic and competitive position of the Community's civil aviation both within the European
Union and in the international context.
7.185 The Committee is composed of employer and worker representatives:
employer representatives: Association of European Airlines (AEA), the International Air
Carrier Association (IACA), the European Regions Airline Association (ERA), the Airport
Services Association (ASA Europe), the Airport Council International Europe (ACI Europe),
and the Civil Air Navigation Services Organisation (CANSO)
workers representatives: the European Transport Workers' Federation (ETF) and the
European Cockpit Association (ECA), as well as the Air Traffic Controllers European Union
Coordination (ATCEUC) in the ATM field
7.186 The work of the Civil Aviation committee is organised in three working groups: air crew,
ground-handling and air traffic management (ATM).
7.187 The work of the committee is taking place in a context where the industry is facing major
challenges such as the absence of a global level playing field, the strong impact of the
economic crisis, high fuel prices, an increasingly competitive environment, structural changes
(for instance the development of the low cost model and the development of transnational
employment) and the implementation of the Single European Sky initiative.
7.188 The dialogue in the sector covers a range of issues including training and lifelong learning,
working time and health and safety.
7.189 The main achievements of the Civil Aviation Social Dialogue Committee include Agreements
(e.g. European agreement on the organization of working time of mobile staff in civil aviation -
air crew WG; Council Directive 2000/79/EC, 2000-); Joint opinions (e.g. Joint Declaration
against EU-based Flags of Convenience in Aviation -air crew WG, 2014-; Statement of ATCEUC,
CANSO and ETF on the Commission proposal on the SES II+ package (2013); Joint Position on
the Social Security Regime applicable to Air Crews (air crew WG; 2011) and Tools (e.g. ATM
European social partners recommendations on mobility of workers within the ATM sector
(2013)).
7.190 A plenary meeting of the entire Committee is held once a year.
61 “Fitness Check” on EU law in the area of Information and Consultation of Workers SWD (2013) 293
final
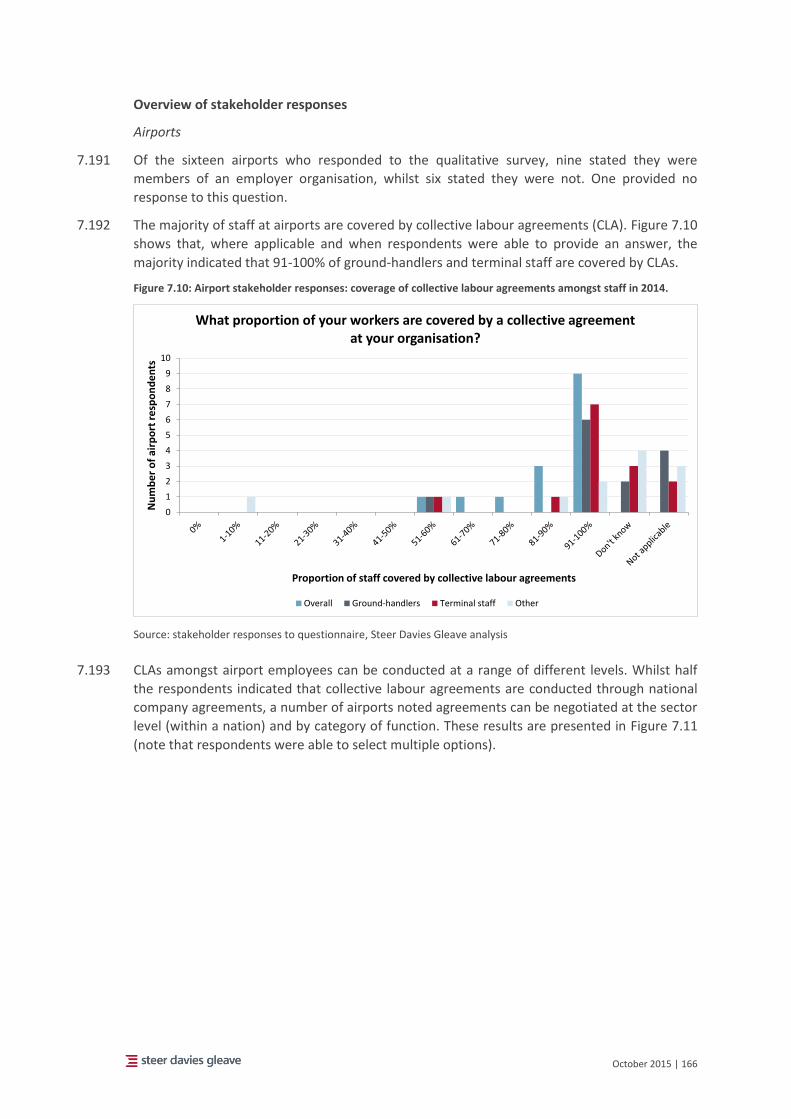
October 2015 | 166
Overview of stakeholder responses
Airports
7.191 Of the sixteen airports who responded to the qualitative survey, nine stated they were
members of an employer organisation, whilst six stated they were not. One provided no
response to this question.
7.192 The majority of staff at airports are covered by collective labour agreements (CLA). Figure 7.10
shows that, where applicable and when respondents were able to provide an answer, the
majority indicated that 91-100% of ground-handlers and terminal staff are covered by CLAs.
Figure 7.10: Airport stakeholder responses: coverage of collective labour agreements amongst staff in 2014.
Source: stakeholder responses to questionnaire, Steer Davies Gleave analysis
7.193 CLAs amongst airport employees can be conducted at a range of different levels. Whilst half
the respondents indicated that collective labour agreements are conducted through national
company agreements, a number of airports noted agreements can be negotiated at the sector
level (within a nation) and by category of function. These results are presented in Figure 7.11
(note that respondents were able to select multiple options).
0
1
2
3
4
5
6
7
8
9
10
Nu
mb
er
of
airp
ort
re
spo
nd
en
ts
Proportion of staff covered by collective labour agreements
What proportion of your workers are covered by a collective agreement at your organisation?
Overall Ground-handlers Terminal staff Other
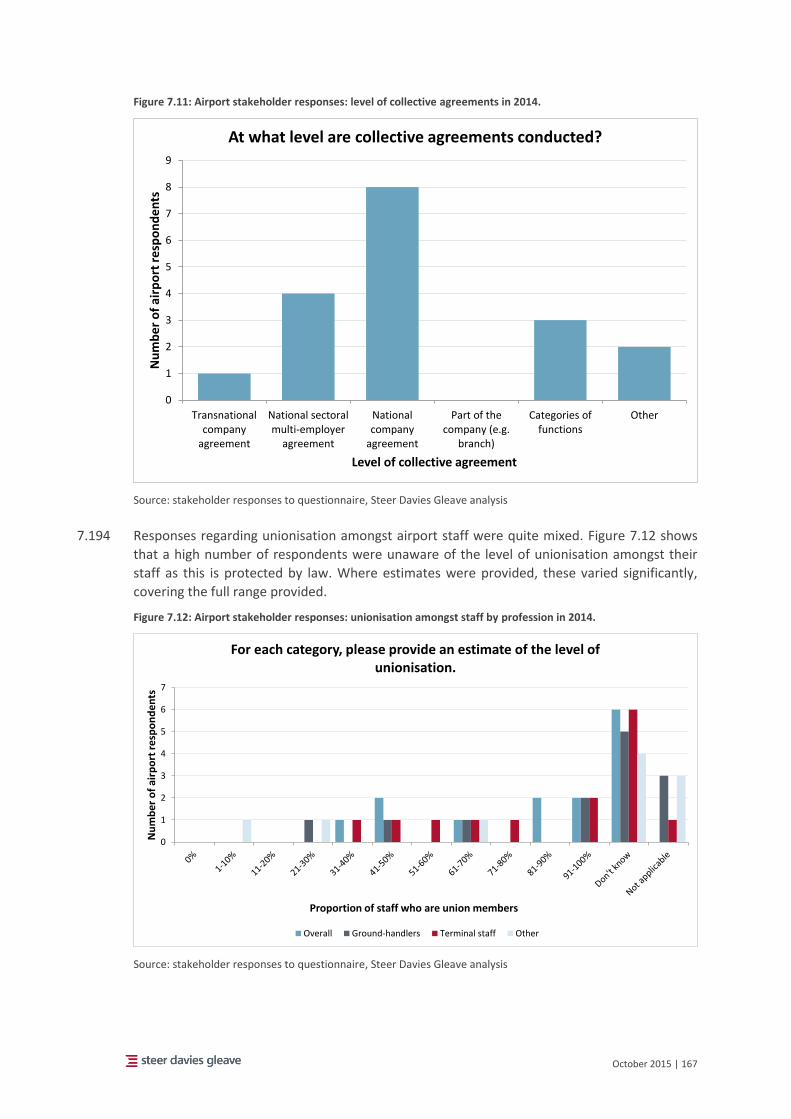
October 2015 | 167
Figure 7.11: Airport stakeholder responses: level of collective agreements in 2014.
Source: stakeholder responses to questionnaire, Steer Davies Gleave analysis
7.194 Responses regarding unionisation amongst airport staff were quite mixed. Figure 7.12 shows
that a high number of respondents were unaware of the level of unionisation amongst their
staff as this is protected by law. Where estimates were provided, these varied significantly,
covering the full range provided.
Figure 7.12: Airport stakeholder responses: unionisation amongst staff by profession in 2014.
Source: stakeholder responses to questionnaire, Steer Davies Gleave analysis
0
1
2
3
4
5
6
7
8
9
Transnationalcompany
agreement
National sectoralmulti-employer
agreement
Nationalcompany
agreement
Part of thecompany (e.g.
branch)
Categories offunctions
Other
Nu
mb
er
of
airp
ort
re
spo
nd
en
ts
Level of collective agreement
At what level are collective agreements conducted?
0
1
2
3
4
5
6
7
Nu
mb
er
of
airp
ort
re
spo
nd
en
ts
Proportion of staff who are union members
For each category, please provide an estimate of the level of unionisation.
Overall Ground-handlers Terminal staff Other
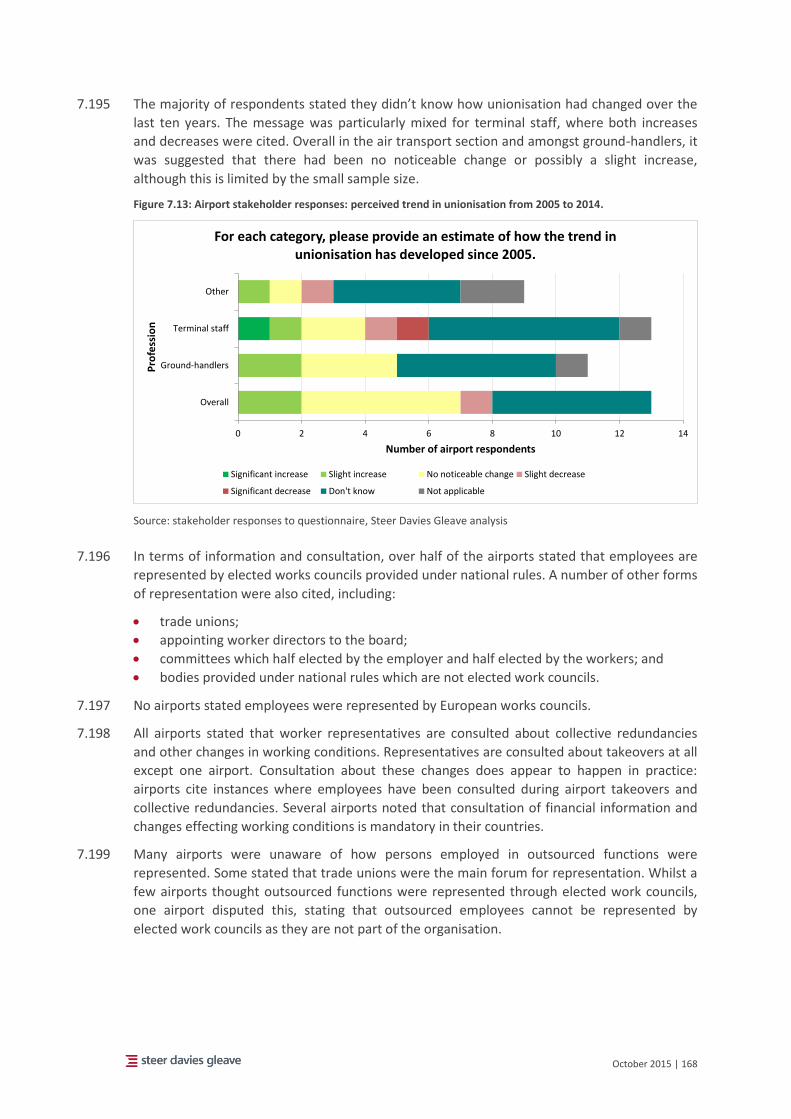
October 2015 | 168
7.195 The majority of respondents stated they didn’t know how unionisation had changed over the
last ten years. The message was particularly mixed for terminal staff, where both increases
and decreases were cited. Overall in the air transport section and amongst ground-handlers, it
was suggested that there had been no noticeable change or possibly a slight increase,
although this is limited by the small sample size.
Figure 7.13: Airport stakeholder responses: perceived trend in unionisation from 2005 to 2014.
Source: stakeholder responses to questionnaire, Steer Davies Gleave analysis
7.196 In terms of information and consultation, over half of the airports stated that employees are
represented by elected works councils provided under national rules. A number of other forms
of representation were also cited, including:
trade unions;
appointing worker directors to the board;
committees which half elected by the employer and half elected by the workers; and
bodies provided under national rules which are not elected work councils.
7.197 No airports stated employees were represented by European works councils.
7.198 All airports stated that worker representatives are consulted about collective redundancies
and other changes in working conditions. Representatives are consulted about takeovers at all
except one airport. Consultation about these changes does appear to happen in practice:
airports cite instances where employees have been consulted during airport takeovers and
collective redundancies. Several airports noted that consultation of financial information and
changes effecting working conditions is mandatory in their countries.
7.199 Many airports were unaware of how persons employed in outsourced functions were
represented. Some stated that trade unions were the main forum for representation. Whilst a
few airports thought outsourced functions were represented through elected work councils,
one airport disputed this, stating that outsourced employees cannot be represented by
elected work councils as they are not part of the organisation.
0 2 4 6 8 10 12 14
Overall
Ground-handlers
Terminal staff
Other
Number of airport respondents
Pro
fess
ion
For each category, please provide an estimate of how the trend in unionisation has developed since 2005.
Significant increase Slight increase No noticeable change Slight decrease
Significant decrease Don't know Not applicable
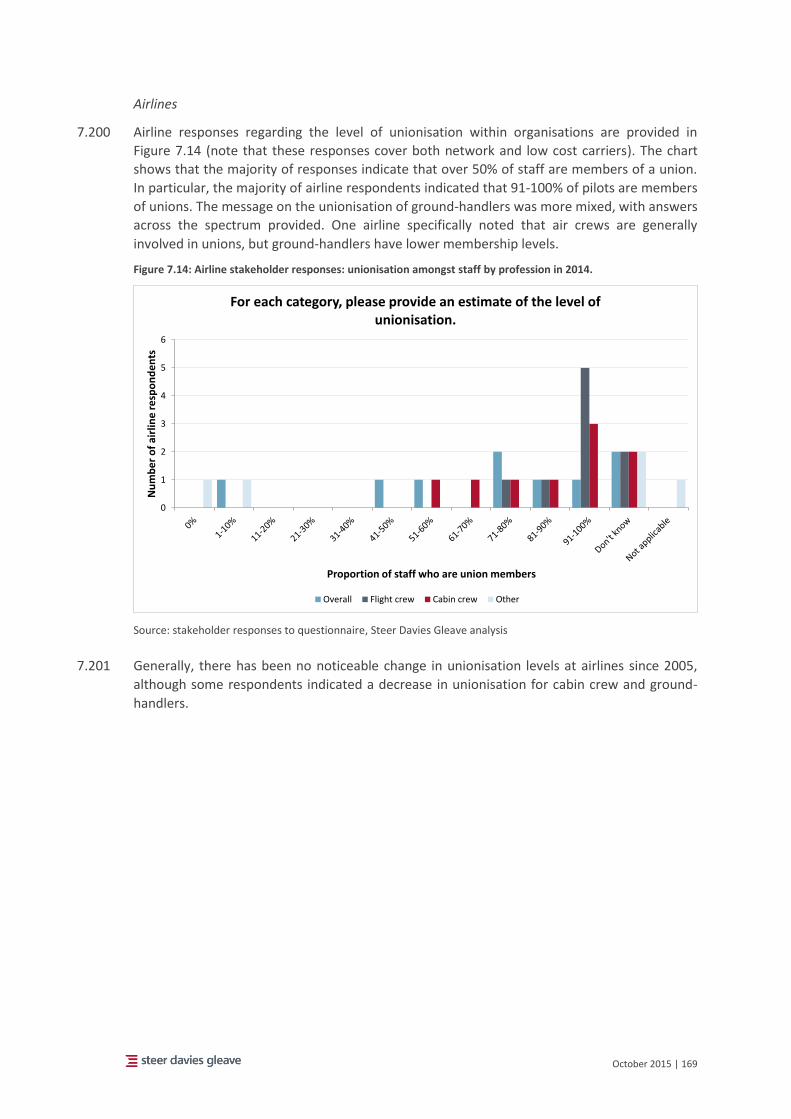
October 2015 | 169
Airlines
7.200 Airline responses regarding the level of unionisation within organisations are provided in
Figure 7.14 (note that these responses cover both network and low cost carriers). The chart
shows that the majority of responses indicate that over 50% of staff are members of a union.
In particular, the majority of airline respondents indicated that 91-100% of pilots are members
of unions. The message on the unionisation of ground-handlers was more mixed, with answers
across the spectrum provided. One airline specifically noted that air crews are generally
involved in unions, but ground-handlers have lower membership levels.
Figure 7.14: Airline stakeholder responses: unionisation amongst staff by profession in 2014.
Source: stakeholder responses to questionnaire, Steer Davies Gleave analysis
7.201 Generally, there has been no noticeable change in unionisation levels at airlines since 2005,
although some respondents indicated a decrease in unionisation for cabin crew and ground-
handlers.
0
1
2
3
4
5
6
Nu
mb
er
of
airl
ine
re
spo
nd
en
ts
Proportion of staff who are union members
For each category, please provide an estimate of the level of unionisation.
Overall Flight crew Cabin crew Other
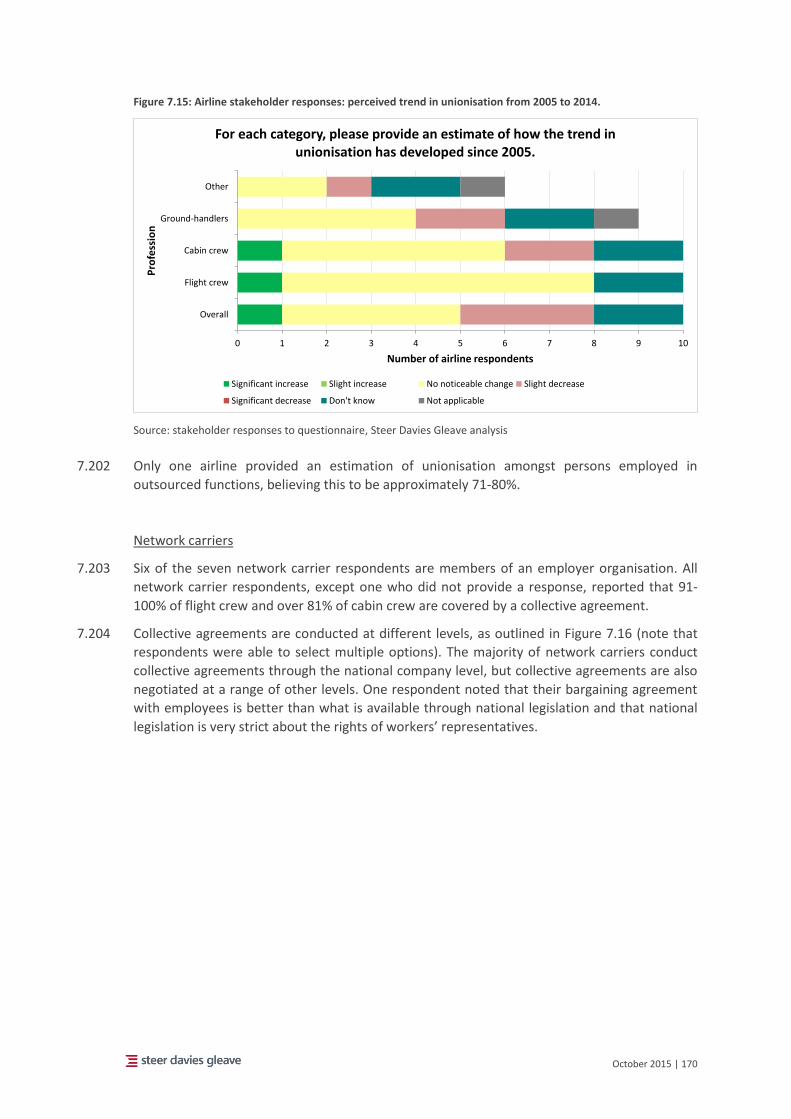
October 2015 | 170
Figure 7.15: Airline stakeholder responses: perceived trend in unionisation from 2005 to 2014.
Source: stakeholder responses to questionnaire, Steer Davies Gleave analysis
7.202 Only one airline provided an estimation of unionisation amongst persons employed in
outsourced functions, believing this to be approximately 71-80%.
Network carriers
7.203 Six of the seven network carrier respondents are members of an employer organisation. All
network carrier respondents, except one who did not provide a response, reported that 91-
100% of flight crew and over 81% of cabin crew are covered by a collective agreement.
7.204 Collective agreements are conducted at different levels, as outlined in Figure 7.16 (note that
respondents were able to select multiple options). The majority of network carriers conduct
collective agreements through the national company level, but collective agreements are also
negotiated at a range of other levels. One respondent noted that their bargaining agreement
with employees is better than what is available through national legislation and that national
legislation is very strict about the rights of workers’ representatives.
0 1 2 3 4 5 6 7 8 9 10
Overall
Flight crew
Cabin crew
Ground-handlers
Other
Number of airline respondents
Pro
fess
ion
For each category, please provide an estimate of how the trend in unionisation has developed since 2005.
Significant increase Slight increase No noticeable change Slight decrease
Significant decrease Don't know Not applicable
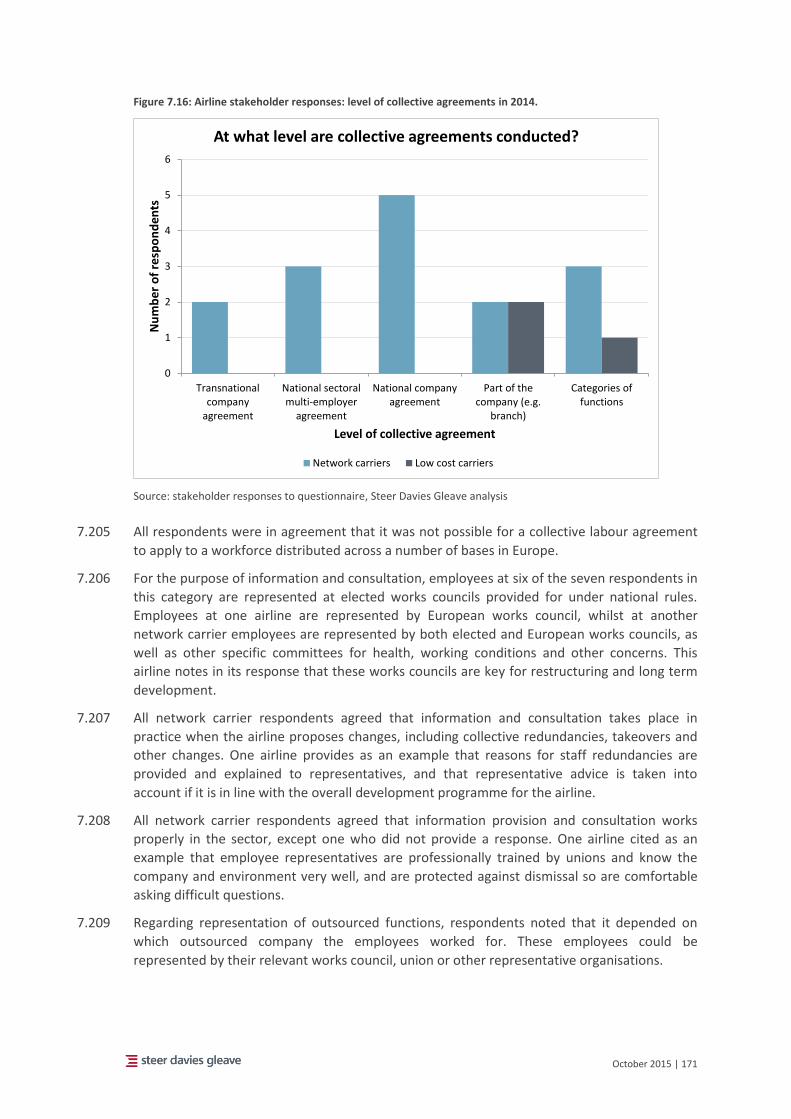
October 2015 | 171
Figure 7.16: Airline stakeholder responses: level of collective agreements in 2014.
Source: stakeholder responses to questionnaire, Steer Davies Gleave analysis
7.205 All respondents were in agreement that it was not possible for a collective labour agreement
to apply to a workforce distributed across a number of bases in Europe.
7.206 For the purpose of information and consultation, employees at six of the seven respondents in
this category are represented at elected works councils provided for under national rules.
Employees at one airline are represented by European works council, whilst at another
network carrier employees are represented by both elected and European works councils, as
well as other specific committees for health, working conditions and other concerns. This
airline notes in its response that these works councils are key for restructuring and long term
development.
7.207 All network carrier respondents agreed that information and consultation takes place in
practice when the airline proposes changes, including collective redundancies, takeovers and
other changes. One airline provides as an example that reasons for staff redundancies are
provided and explained to representatives, and that representative advice is taken into
account if it is in line with the overall development programme for the airline.
7.208 All network carrier respondents agreed that information provision and consultation works
properly in the sector, except one who did not provide a response. One airline cited as an
example that employee representatives are professionally trained by unions and know the
company and environment very well, and are protected against dismissal so are comfortable
asking difficult questions.
7.209 Regarding representation of outsourced functions, respondents noted that it depended on
which outsourced company the employees worked for. These employees could be
represented by their relevant works council, union or other representative organisations.
0
1
2
3
4
5
6
Transnationalcompany
agreement
National sectoralmulti-employer
agreement
National companyagreement
Part of thecompany (e.g.
branch)
Categories offunctions
Nu
mb
er
of
resp
on
den
ts
Level of collective agreement
At what level are collective agreements conducted?
Network carriers Low cost carriers
October 2015 | 172
Low cost carriers
7.210 All three respondents stated that over 81% of flight crew were covered by a collective
agreement. Amongst cabin crew, two airlines believed that 91-100% were covered by
collective agreements. The other respondent estimated the proportion as much lower, at 51-
60%.
7.211 All respondents were in agreement that it was not possible for a collective labour agreement
to apply to a workforce distributed across a number of bases in Europe. As demonstrated in
Figure 7.16 above, collective labour agreements are conducted at the branch level at two low
cost carriers, whereas they are conducted by category of function at the other airline.
7.212 For information and consultation purposes, arrangements differed by airline. Employees at
one airline are provided by elected works councils provided under national rules, whereas
employees at another airline are covered by a European work council. The final low cost
carrier respondent uses both of these arrangements.
7.213 The low cost carriers stated that employees of outsourced functions were either not
represented or they have their own representative organisations.
7.214 Two of the three airlines stated that consultation does take place in practice when the airline
proposes changes (the other stated they didn’t know). In particular, one airline noted that
consultation regarding changes proposed by the airline is accounted for under a national
works constitution act. All airlines reported that worker representatives are informed and
consulted when the employer proposes changes including collective redundancies, takeovers
and other changes in working conditions.
7.215 Two airlines agree with the statement that information provision and consultation works
properly in the sector. The other airline provided no response.
Representative organisations
Worker Representatives
7.216 Respondents are in agreement that it is not possible for a single collective labour agreement
to workforce distributed across a number of bases in Europe. The ECA noted that it is
theoretically possible, but it would require employers to have applicable transnational
agreements (which they currently do not). SLSY added that whilst the national binding
agreement must be followed by crew based within Finland, this does not apply to crew with a
home base outside Finland (“or at least, no one is willing to make a clear decision about it”).
7.217 The ETF report relatively low levels of unionisation within the air transport sector. Overall,
they estimate approximately 11-20% of staff are union members, proportions which have
slightly decreased since 2005. In contrast, amongst flight crew, a higher proportion of
unionisation is reported at 41-50% (the ECA estimates this proportion to be 61-70%). Persons
employed in outsourced functions are reported as having lower levels of unionisation with
only 1-10% being union members. The ECA also noted that union representation levels are
lower in Eastern Europe than Western Europe.
7.218 SLSY reported that union membership is approximately 51-60% of total cabin crew staff at
Finnair: whilst membership has not declined for crew based in Finland (it is approximately
95%), crew hired from outside the EU and in Spain are mostly not union members. There is
some unofficial cooperation between the Hong Kong union (HKFFC) and SLSY however there is
no official representation for employees in outsourced functions. The only information SLSY
October 2015 | 173
receives regarding employment contracts for outsourced staff (i.e. those employed in Asia or
Spain) is that provided by the employees themselves.
7.219 In Sweden, Unionen estimated that 81-90% of ground-handlers are union members, and 91-
100% of cabin crew.
7.220 The ETF considered that information and consultation does not work properly within the
sector. They indicate that often employees are not properly consulted within the appropriate
legal provisions when an airline makes changes.
7.221 SLSY agreed, stating that whilst the airline provides information regarding changes to working
conditions in compliance with Finnish law, there is “no place for negotiations and real
consultation”. Information is provided to union representatives, sometimes along with an
alternative option to the cost-cutting (generally outsourcing), which the union perceives as a
deterrent for employees.
7.222 Unionen SE stated that information provision and consultation works properly in the sector,
and takes place when the airline is bound to do it through collective bargaining agreements.
7.223 The ECA states that the provision of information and consultation varies significantly
depending whether network carriers or LCCs are involved. At network carriers, the ECA states
that information provision and consultation is still a common practice (even if decreasing)
however there are some LCCs where information provision is poor and consultation is not
presented as an option. The ECA also adds that some airlines have established “bogus”
consultation boards with company nominated worker representatives, but does not name any
airline in particular.
Employer Representatives
7.224 Amongst air traffic controllers, CANSO estimated that significant proportions of workers (71-
80%) are covered by collective labour agreements. Similarly, 71-80% are also believed to be
members of unions, a proportion which has slightly increased since 2005.
7.225 Limited information was provided by CANSO about information and consultation of workers
within the industry. Of the information received, it was stated that employees are generally
represented by staff associations, which act as an intermediary between authorities and staff
when changes to wage or working hour policies are proposed. CANSO cite the example of new
policies regarding Respect & Dignity in the Workplace and Whistleblowing being discussed
with staff representatives before being published company-wide.
7.226 In the ground-handling sector in Germany, VDF stated that collective agreements are
negotiated at national or company/branch level (i.e. there are no transnational company
agreements). Whilst unable to estimate the level of unionisation amongst employees of its
member organisations, due to the differing situations across its members, VDF stated that the
range was between 30-100% for its members, and noted that there had been a slight increase
in union membership since 2005.
7.227 Information and consultation for the ground-handling sector in Germany happens at national
level, and workers are represented by a number of unions (mainly Ver.di). In VDF’s view,
information provision and consultation works properly in the sector.
October 2015 | 174
Temporary work agencies
7.228 Amongst temporary agency workers, coverage by collective labour agreements appears to
vary. One temporary work agency stated that 71-80% of flight crew were covered by a
collective labour agreement, whilst the other estimated that only 31-40% of flight crew and 1-
10% of cabin crew were covered. One agency noted that in order for airlines to comply with
the Agencies Workers Agreement, all pilots (both permanent, direct employees and temporary
agency workers) must be covered by any collective bargaining agreements.
7.229 Collective labour agreements for temporary agency workers are usually conducted at
company level, or at other levels which were unspecified by the respondents.
7.230 Only one agency provided an indication of the level of unionisation amongst its workers,
believing that 41-50% of flight crew and 1-10% of cabin crew at the agency are members of
unions. This agency believed there has been a significant increase in flight crew unionisation
since 2005, and a slight increase in cabin crew unionisation.
7.231 With regards to information and consultation, one agency stated that temporary agency
workers would be represented by elected works councils provided under national rules. The
other agency reported that temporary agency workers receive the same level of
representation as permanent people employed at that base when it is legally required for a
temporary agency worker to have a representative.
7.232 Both agencies believe that temporary workers’ representatives are consulted when the
employer proposes changes, including collective redundancies, takeovers and other changes in
working conditions.
Other
7.233 The head of the CSDCA estimates that between 71-80% of flight crew and cabin crew are
union members and that this proportion is significantly lower (1-10%) for ground-handlers and
terminal staff, a similar level to that for employees of outsourced functions.
7.234 The CSDCA considers that information and consultation does take place when an airline
proposes substantial changes to working conditions or contractual relations.
Summary
7.235 Collective labour agreements are common in the air transport sector as the majority of
persons employed by airports and airlines are covered by these agreements. The forms of the
agreements do vary by location and employer: CLAs tend to cover employee groups within the
organisation and, whilst national company agreements tend to be reasonably prevalent,
collective labour agreements can be negotiated at different levels depending on the issue.
Stakeholders were in agreement that collective labour agreements do not apply to a
workforce distributed across a number of bases.
7.236 The level of unionisation varies across the sector. Flight crew are very highly unionised, with
estimates of 91-100% as members of unions. Unions have significant presences amongst cabin
crew and air traffic controllers also. The picture of unionisation for ground-handling staff and
terminal staff is more mixed, but these professions are generally considered to have lower
levels of unionisation. Although the evidence is limited, temporary agency workers appear to
have lower levels of unionisation than permanent employees. Coverage by collective labour
agreements also appears marginally lower.
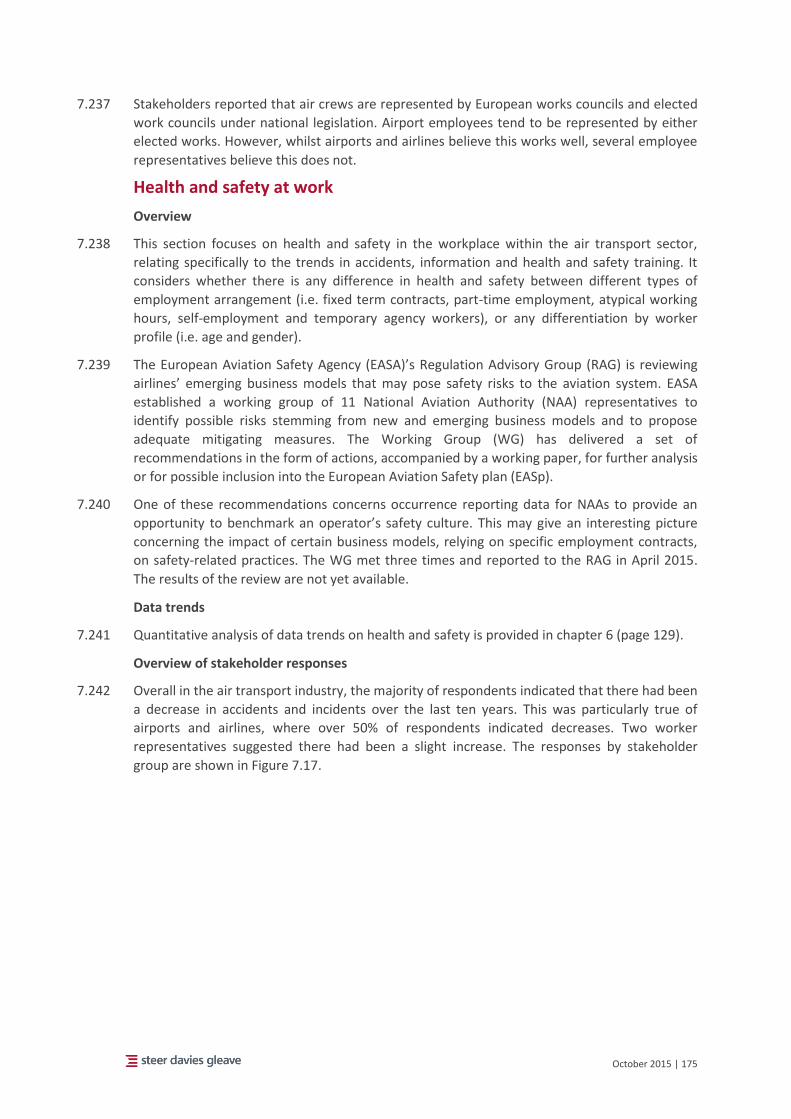
October 2015 | 175
7.237 Stakeholders reported that air crews are represented by European works councils and elected
work councils under national legislation. Airport employees tend to be represented by either
elected works. However, whilst airports and airlines believe this works well, several employee
representatives believe this does not.
Health and safety at work
Overview
7.238 This section focuses on health and safety in the workplace within the air transport sector,
relating specifically to the trends in accidents, information and health and safety training. It
considers whether there is any difference in health and safety between different types of
employment arrangement (i.e. fixed term contracts, part-time employment, atypical working
hours, self-employment and temporary agency workers), or any differentiation by worker
profile (i.e. age and gender).
7.239 The European Aviation Safety Agency (EASA)’s Regulation Advisory Group (RAG) is reviewing
airlines’ emerging business models that may pose safety risks to the aviation system. EASA
established a working group of 11 National Aviation Authority (NAA) representatives to
identify possible risks stemming from new and emerging business models and to propose
adequate mitigating measures. The Working Group (WG) has delivered a set of
recommendations in the form of actions, accompanied by a working paper, for further analysis
or for possible inclusion into the European Aviation Safety plan (EASp).
7.240 One of these recommendations concerns occurrence reporting data for NAAs to provide an
opportunity to benchmark an operator’s safety culture. This may give an interesting picture
concerning the impact of certain business models, relying on specific employment contracts,
on safety-related practices. The WG met three times and reported to the RAG in April 2015.
The results of the review are not yet available.
Data trends
7.241 Quantitative analysis of data trends on health and safety is provided in chapter 6 (page 129).
Overview of stakeholder responses
7.242 Overall in the air transport industry, the majority of respondents indicated that there had been
a decrease in accidents and incidents over the last ten years. This was particularly true of
airports and airlines, where over 50% of respondents indicated decreases. Two worker
representatives suggested there had been a slight increase. The responses by stakeholder
group are shown in Figure 7.17.
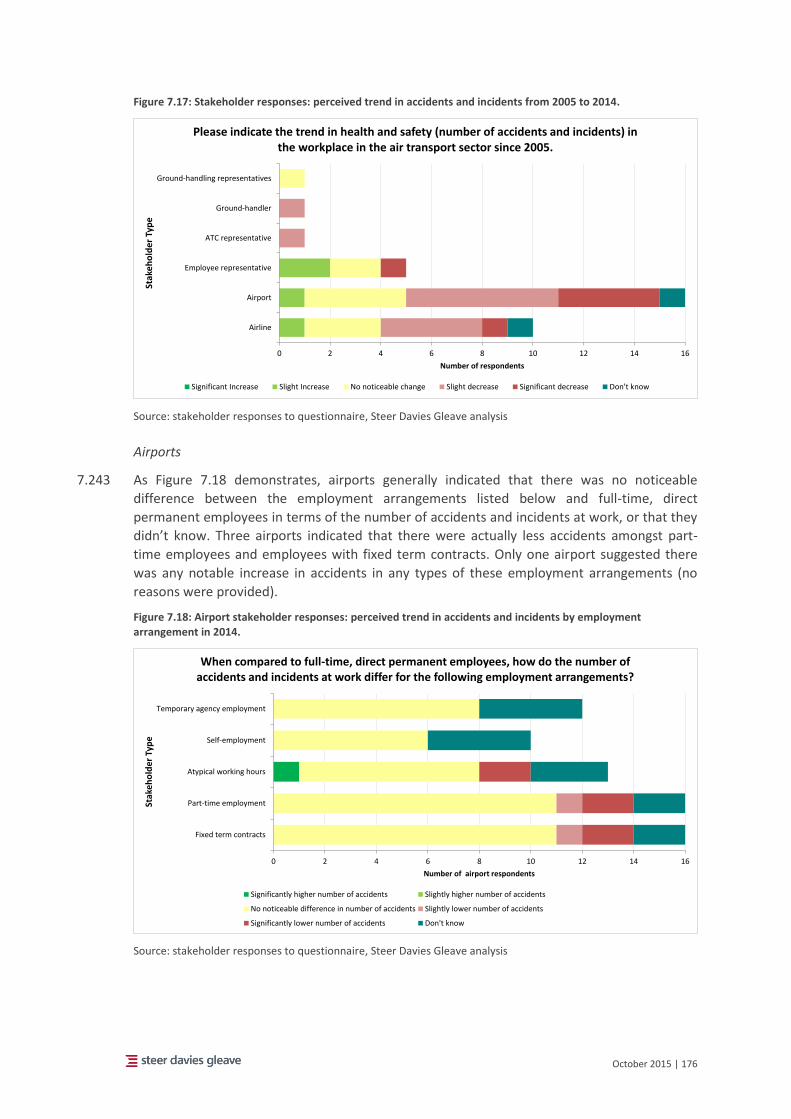
October 2015 | 176
Figure 7.17: Stakeholder responses: perceived trend in accidents and incidents from 2005 to 2014.
Source: stakeholder responses to questionnaire, Steer Davies Gleave analysis
Airports
7.243 As Figure 7.18 demonstrates, airports generally indicated that there was no noticeable
difference between the employment arrangements listed below and full-time, direct
permanent employees in terms of the number of accidents and incidents at work, or that they
didn’t know. Three airports indicated that there were actually less accidents amongst part-
time employees and employees with fixed term contracts. Only one airport suggested there
was any notable increase in accidents in any types of these employment arrangements (no
reasons were provided).
Figure 7.18: Airport stakeholder responses: perceived trend in accidents and incidents by employment arrangement in 2014.
Source: stakeholder responses to questionnaire, Steer Davies Gleave analysis
0 2 4 6 8 10 12 14 16
Airline
Airport
Employee representative
ATC representative
Ground-handler
Ground-handling representatives
Number of respondents
Stak
eh
old
er
Typ
e
Please indicate the trend in health and safety (number of accidents and incidents) in the workplace in the air transport sector since 2005.
Significant Increase Slight Increase No noticeable change Slight decrease Significant decrease Don't know
0 2 4 6 8 10 12 14 16
Fixed term contracts
Part-time employment
Atypical working hours
Self-employment
Temporary agency employment
Number of airport respondents
Stak
eh
old
er
Typ
e
When compared to full-time, direct permanent employees, how do the number of accidents and incidents at work differ for the following employment arrangements?
Significantly higher number of accidents Slightly higher number of accidents
No noticeable difference in number of accidents Slightly lower number of accidents
Significantly lower number of accidents Don't know
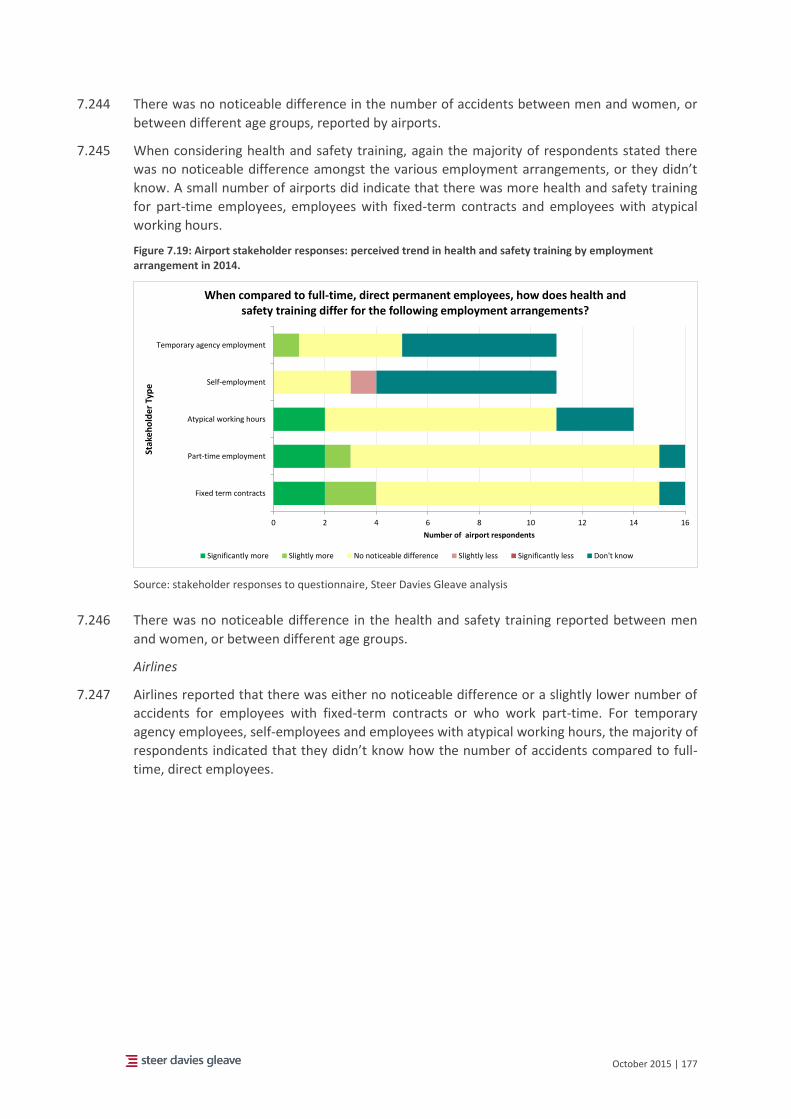
October 2015 | 177
7.244 There was no noticeable difference in the number of accidents between men and women, or
between different age groups, reported by airports.
7.245 When considering health and safety training, again the majority of respondents stated there
was no noticeable difference amongst the various employment arrangements, or they didn’t
know. A small number of airports did indicate that there was more health and safety training
for part-time employees, employees with fixed-term contracts and employees with atypical
working hours.
Figure 7.19: Airport stakeholder responses: perceived trend in health and safety training by employment arrangement in 2014.
Source: stakeholder responses to questionnaire, Steer Davies Gleave analysis
7.246 There was no noticeable difference in the health and safety training reported between men
and women, or between different age groups.
Airlines
7.247 Airlines reported that there was either no noticeable difference or a slightly lower number of
accidents for employees with fixed-term contracts or who work part-time. For temporary
agency employees, self-employees and employees with atypical working hours, the majority of
respondents indicated that they didn’t know how the number of accidents compared to full-
time, direct employees.
0 2 4 6 8 10 12 14 16
Fixed term contracts
Part-time employment
Atypical working hours
Self-employment
Temporary agency employment
Number of airport respondents
Stak
eh
old
er
Typ
e
When compared to full-time, direct permanent employees, how does health and safety training differ for the following employment arrangements?
Significantly more Slightly more No noticeable difference Slightly less Significantly less Don't know
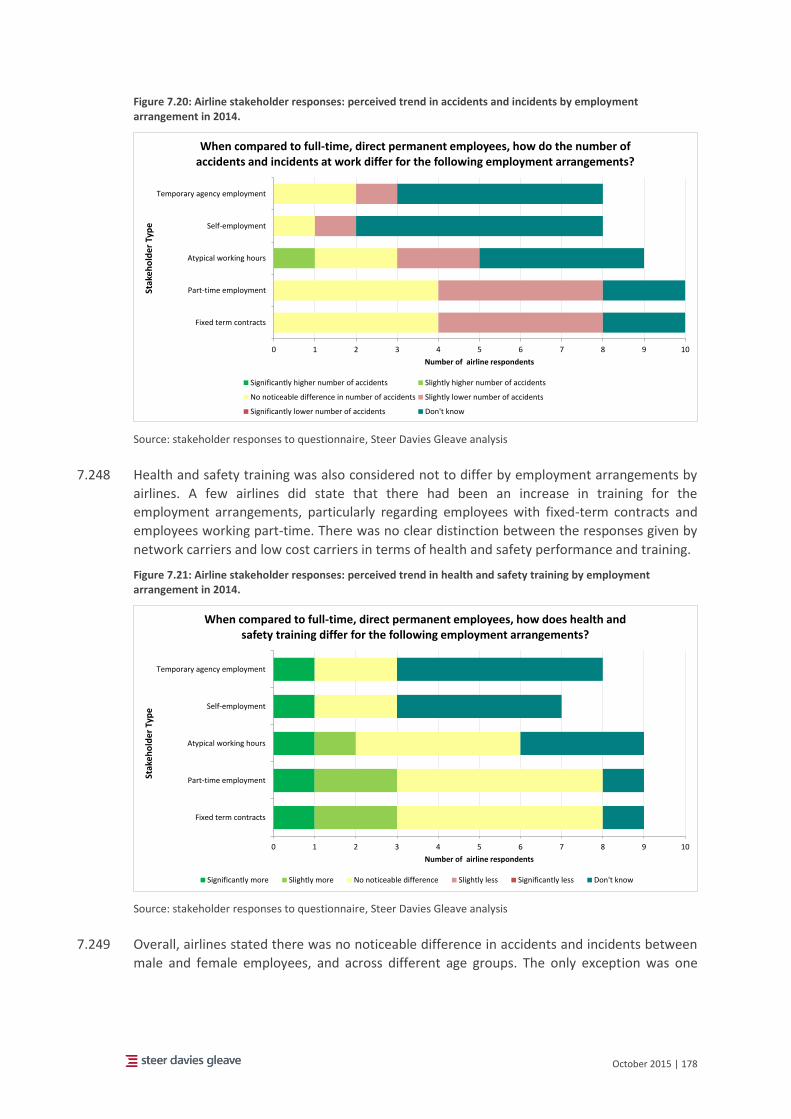
October 2015 | 178
Figure 7.20: Airline stakeholder responses: perceived trend in accidents and incidents by employment arrangement in 2014.
Source: stakeholder responses to questionnaire, Steer Davies Gleave analysis
7.248 Health and safety training was also considered not to differ by employment arrangements by
airlines. A few airlines did state that there had been an increase in training for the
employment arrangements, particularly regarding employees with fixed-term contracts and
employees working part-time. There was no clear distinction between the responses given by
network carriers and low cost carriers in terms of health and safety performance and training.
Figure 7.21: Airline stakeholder responses: perceived trend in health and safety training by employment arrangement in 2014.
Source: stakeholder responses to questionnaire, Steer Davies Gleave analysis
7.249 Overall, airlines stated there was no noticeable difference in accidents and incidents between
male and female employees, and across different age groups. The only exception was one
0 1 2 3 4 5 6 7 8 9 10
Fixed term contracts
Part-time employment
Atypical working hours
Self-employment
Temporary agency employment
Number of airline respondents
Stak
eh
old
er
Typ
eWhen compared to full-time, direct permanent employees, how do the number of
accidents and incidents at work differ for the following employment arrangements?
Significantly higher number of accidents Slightly higher number of accidents
No noticeable difference in number of accidents Slightly lower number of accidents
Significantly lower number of accidents Don't know
0 1 2 3 4 5 6 7 8 9 10
Fixed term contracts
Part-time employment
Atypical working hours
Self-employment
Temporary agency employment
Number of airline respondents
Stak
eh
old
er
Typ
e
When compared to full-time, direct permanent employees, how does health and safety training differ for the following employment arrangements?
Significantly more Slightly more No noticeable difference Slightly less Significantly less Don't know
October 2015 | 179
network airline who stated there was a slightly higher accident rate amongst male employees
and employees aged 50 or more.
7.250 One airline, indicated that workers aged 30 and over receive slightly more than average health
and safety training. No other airline indicated any difference amongst worker profiles.
Representative organisations
Worker representatives
7.251 Minimal information on health and safety at work has been reported by worker
representatives. The ETF reported that there has been a slight increase in accidents and
incidents in the workplace across the air transport sector over the last 10 years, although it is
not indicated whether this has primarily occurred amongst certain types of employment
arrangements.
7.252 The ETF also stated that there has been slightly less health and safety training across the
atypical employment arrangements, with significantly less for employees engaged through a
temporary work agency. Unionen also believed there was significantly less health and safety
training for temporary agency workers, as well as self-employed workers.
7.253 SLSY does not have health and safety information available for agency workers, and notes that
there has been a slight increase in health problems and long term sick leave for Finnish cabin
crew.
7.254 The ECA noted a significant decreasing trend in the number of accidents and incidents since
2005 for flight crew. They add that there is no clear relationship between atypical working
hours and accidents and incidents, but they have concerns about the impact of these new
employment models on safety culture, including the potential for workers’ ability to make
safety decisions independently from management.
Employer representatives
7.255 ACI report that in the ground-handling sector, there has been an increase in the number of
incidents (damage to property for example) but not accidents. Liberalisation and the opening
up of the sector has resulted in many more people on the apron and furthermore, in particular
if they are temporary agency workers, they are not so well trained. ACI notes that this issue
has been raised by EASA, which recognised this increase in incidents and possible drivers of
this. the potential for a direct rule regarding ground-handling training and standards on the
apron has been raised.
7.256 Within the air traffic management sector, CANSO stated that health and safety has marginally
improved since 2005, with a slight decrease in the number of accidents and incidents during
this time.
7.257 Generally there is no difference in health and safety observed by CANSO between different
employment arrangements, although it is noted that employees with fixed-term contracts
tend to have slightly more health and safety training. Similarly, more health and safety training
is undertaken by male employees and all workers aged 15-29, although no reasons were
provided for these differences between worker profiles.
7.258 VDF reported no noticeable change in the number of accidents and incidents between
different employment arrangements, and no difference in training opportunities either.
October 2015 | 180
Temporary work agencies
7.259 Both temporary work agencies report that there are no differences in the number of accidents
or levels of health and safety training between direct employees and temporary agency
workers at airlines. All pilots, whether agency workers or permanent employees, receive the
same levels of health and safety training.
Other
7.260 The Chair of the CSDCA states that there is no noticeable difference between permanent
employees and those engaged under different arrangements in the number of accidents and
incidents or in health and safety training.
Summary
7.261 Health and safety is broadly considered across the air transport industry to have improved
over the last ten years, as the number of accidents and incidents is believed to have reduced.
7.262 According to the data presented in Chapter 6 (Figure 6.33), persons employed in air transport
directly generally feel well informed about health and safety in the workplace, however, there
are lower satisfaction rates among people employed in transport support activities.
7.263 The number of accidents and completion of health and safety training is generally not thought
to differ between employees with different employment arrangements. Some airports and
airlines have suggested that there are lower numbers of accidents and incidents amongst part-
time employees and employees with fixed-term contracts, but the broader trend indicates not
noticeable difference.
7.264 A consensus emerged that different worker profiles (in terms of gender and age) had no
impact on health and safety performance.
October 2015 | 181
Outsourcing
Overview
7.265 Outsourcing involves the contracting of functions to a second, independent organisation. The
contracting organisation ceases to perform this function internally and instead purchases it as
a service. The reasons for outsourcing can include:
cost reduction;
flexibility (services are paid for only when required); and
a reduction in the need to hire and train specialised staff.
7.266 Liberalisation has resulted in an increasingly competitive environment and air carriers have
had to adapt in order to survive. In order to compete effectively, organisations require greater
flexibility and improved cost-effectiveness, and as a result outsourcing is being used
increasingly by air carriers, airports and ground-handlers. There is limited evidence available
on the use of outsourcing in other sectors such as aircraft maintenance and air navigation
service provision but it appears to be more limited. The rest of this section summarises the
evidence available on the trend in outsourcing in each part of the air transport market.
Legal background
7.267 Outsourcing can involve the transfer of employees through the sale / transfer of a business or
part of a business from one entity to another (including on an intra-group basis) (a “transfer of
undertakings”); as well as the outsourcing of services which a business currently undertakes to
a third party outsourced provider of that service on behalf of the business (a “service provision
change”).
7.268 The transfer of undertakings is dealt with at EU level under the Transfer of Undertakings
Directive (2001/23/EC)62, which applies to any transfer of an undertaking, business, or part of
an undertaking or business to another employer as a result of a legal transfer or merger. The
aim of the legislation is to protect the rights of employees when they are transferred to
another legal entity. This is normally in the case of a business sale but it can also apply to the
outsourcing of services where the circumstances of the service provision change falls within
the definition of a “relevant transfer” in the Directive.
7.269 Article 3, which is intended to safeguard employees' rights, states that the transferor's rights
and obligations arising from a contract of employment relationship existing on the date of a
transfer shall, by reason of such transfer, be transferred to the transferee.
7.270 Following the transfer, the transferee shall also continue to observe the terms and conditions
agreed in any collective agreement on the same terms applicable to the transferor under that
agreement, until the date of termination or expiry of the collective agreement or the entry
into force or application of another collective agreement.
7.271 Some Member States have gone further to make specific provision for the rights under the
Transfer of Undertakings Directive to be applied specifically to service provision changes as
well as transfers of undertakings. Inevitably the way Member State national courts have
applied the principles in the Transfer of Undertakings Directive differ. Authors understand that
"under French law, the service provision being transferred will only constitute an autonomous
62 Council Directive 2001/23/EC businesses or parts of undertakings or businesses
October 2015 | 182
economic entity if that part retains its identity, i.e. the same assets and personnel and
continues the same business, i.e., providing the same services in the same way, after the
transfer"63 while "Dutch labour courts concentrate mainly on whether the employees being
taken on by the new service provider are substantial in terms of number or expertise." 64
7.272 In the aviation industry, due to the cross-border nature of air transport activities, the facts and
circumstances of an outsourcing can be complicated by group structures and subsidiaries
located across jurisdictions. Where employees are employed by one group company but
posted to work for another group company on a permanent basis and the business of that
company is outsourced, the question arises whether the Transfer of Undertakings Directive
applies to that situation even where the employee does not have an employment contract
with the transferring entity. The question was dealt with by the ECJ in 201065 and it was found
that the Transfer of Undertakings Directive does apply where two employers exist side by side
within a group, and one has contractual relations with the employees of the group and the
other has non-contractual relations with them, the latter can also be qualified as a
“transferor” within the meaning of the Directive, despite the absence of any contractual
relationships with those employees.
7.273 Where a function has been outsourced to a third party provider, the ongoing obligations for
dealing with those employees who transfer will fall to the outsourced provider (save for some
obligations which remain with the old employer). This means that the airline as the end user
no longer has the liability for social security, terminations and other employee contributions as
they are no longer the employer. However, the employee retains protection as an employee of
the outsourced provider and if the Transfer of Undertakings Directive applies, their existing
rights will transfer with them to the outsourced provider.
7.274 Where roles can be located in any international jurisdiction, such as airline maintenance work,
airlines have been able to relocate these roles to lower cost jurisdictions such as Asia. This may
lead to the redundancy of employees carrying out the role in the original location. EU
Directives provide for information and consultation to take place with affected employees
under one or more of the information and consultation Directives. Depending on the original
Member State location, affected employees will be entitled to varying levels of protection in
terms of information and consultation as well as severance payments, subject to minimum
entitlements derived from European Directives.
7.275 Managing an outsourcing involving a number of jurisdictions can be challenging for the
employing entity and third party outsourcing provider as, whilst there is a minimum standard
set by the EU Directives, the requirements and procedures can vary across jurisdictions.
Overview of stakeholder responses
7.276 Across the industry, stakeholders generally reported a trend towards increased outsourcing
over the last ten years. The responses of stakeholders are presented in Figure 7.22.
63 Oliver Brettle, The EU Acquired Rights Directive and its Impact on Business Transfers, White & Case,
February 2008, [4]
64 n.54
65 ECJ 21 October 2010, Case number C-242/09)
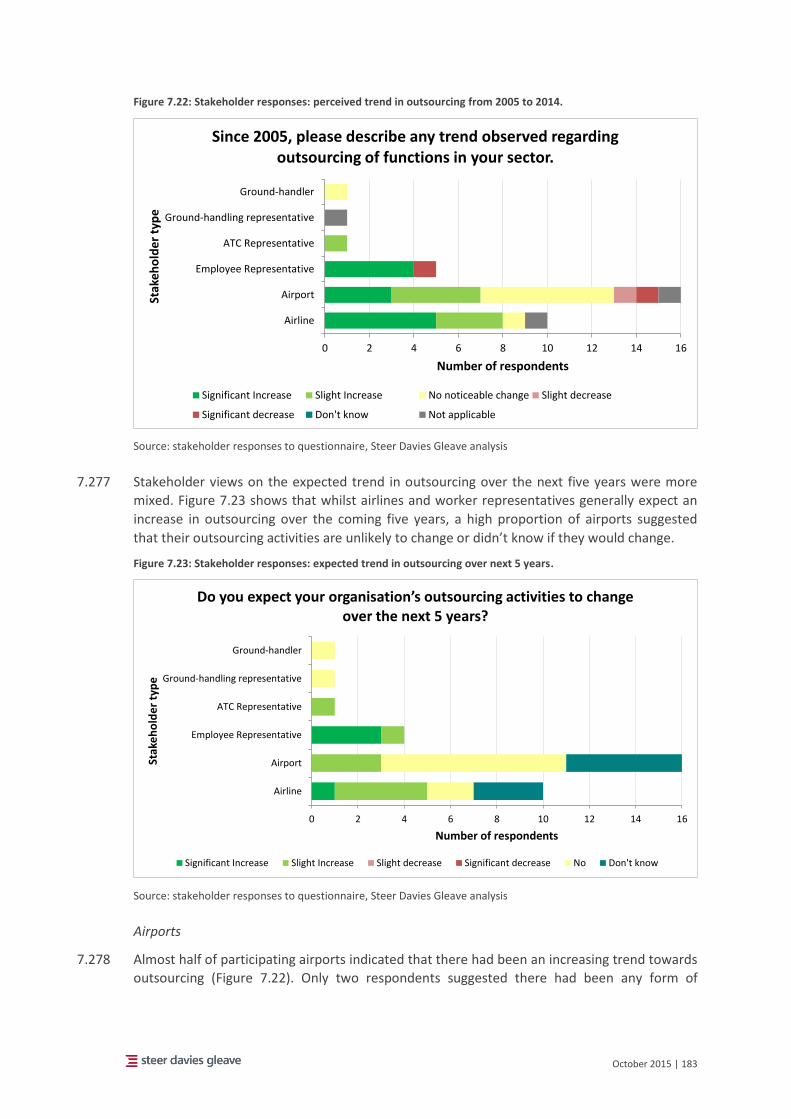
October 2015 | 183
Figure 7.22: Stakeholder responses: perceived trend in outsourcing from 2005 to 2014.
Source: stakeholder responses to questionnaire, Steer Davies Gleave analysis
7.277 Stakeholder views on the expected trend in outsourcing over the next five years were more
mixed. Figure 7.23 shows that whilst airlines and worker representatives generally expect an
increase in outsourcing over the coming five years, a high proportion of airports suggested
that their outsourcing activities are unlikely to change or didn’t know if they would change.
Figure 7.23: Stakeholder responses: expected trend in outsourcing over next 5 years.
Source: stakeholder responses to questionnaire, Steer Davies Gleave analysis
Airports
7.278 Almost half of participating airports indicated that there had been an increasing trend towards
outsourcing (Figure 7.22). Only two respondents suggested there had been any form of
0 2 4 6 8 10 12 14 16
Airline
Airport
Employee Representative
ATC Representative
Ground-handling representative
Ground-handler
Number of respondents
Stak
eh
old
er
typ
eSince 2005, please describe any trend observed regarding
outsourcing of functions in your sector.
Significant Increase Slight Increase No noticeable change Slight decrease
Significant decrease Don't know Not applicable
0 2 4 6 8 10 12 14 16
Airline
Airport
Employee Representative
ATC Representative
Ground-handling representative
Ground-handler
Number of respondents
Stak
eh
old
er
typ
e
Do you expect your organisation’s outsourcing activities to change over the next 5 years?
Significant Increase Slight Increase Slight decrease Significant decrease No Don't know
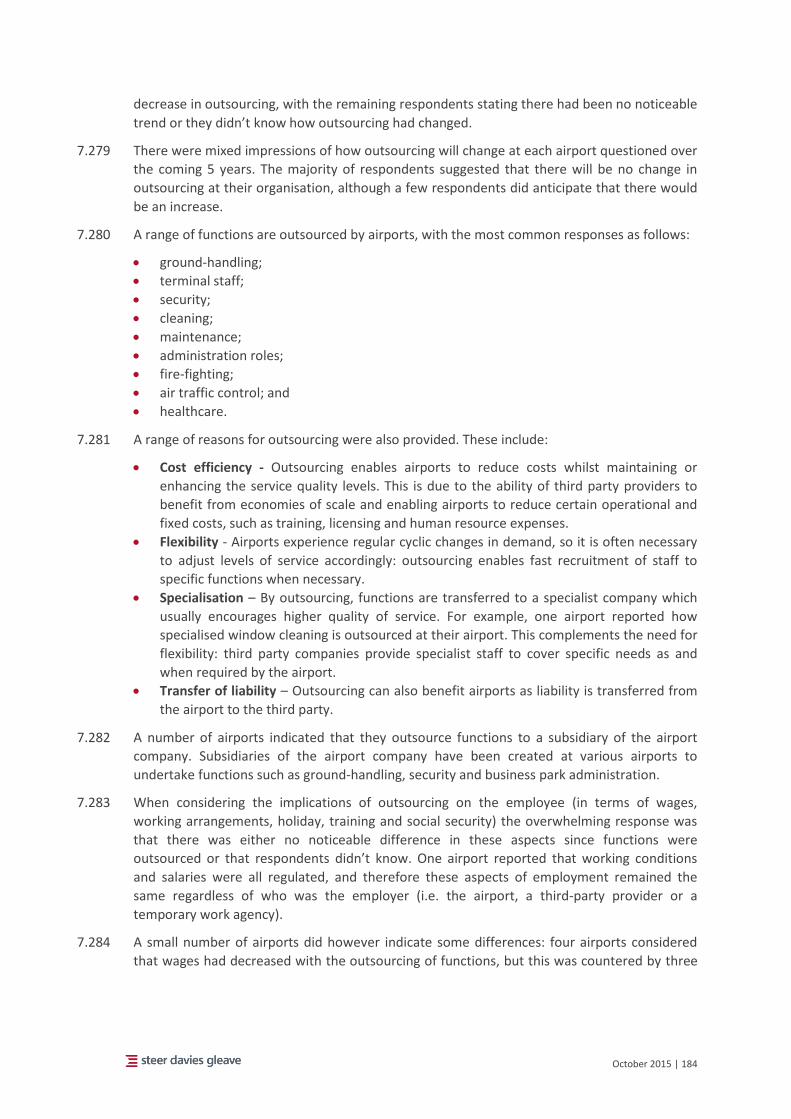
October 2015 | 184
decrease in outsourcing, with the remaining respondents stating there had been no noticeable
trend or they didn’t know how outsourcing had changed.
7.279 There were mixed impressions of how outsourcing will change at each airport questioned over
the coming 5 years. The majority of respondents suggested that there will be no change in
outsourcing at their organisation, although a few respondents did anticipate that there would
be an increase.
7.280 A range of functions are outsourced by airports, with the most common responses as follows:
ground-handling;
terminal staff;
security;
cleaning;
maintenance;
administration roles;
fire-fighting;
air traffic control; and
healthcare.
7.281 A range of reasons for outsourcing were also provided. These include:
Cost efficiency - Outsourcing enables airports to reduce costs whilst maintaining or
enhancing the service quality levels. This is due to the ability of third party providers to
benefit from economies of scale and enabling airports to reduce certain operational and
fixed costs, such as training, licensing and human resource expenses.
Flexibility - Airports experience regular cyclic changes in demand, so it is often necessary
to adjust levels of service accordingly: outsourcing enables fast recruitment of staff to
specific functions when necessary.
Specialisation – By outsourcing, functions are transferred to a specialist company which
usually encourages higher quality of service. For example, one airport reported how
specialised window cleaning is outsourced at their airport. This complements the need for
flexibility: third party companies provide specialist staff to cover specific needs as and
when required by the airport.
Transfer of liability – Outsourcing can also benefit airports as liability is transferred from
the airport to the third party.
7.282 A number of airports indicated that they outsource functions to a subsidiary of the airport
company. Subsidiaries of the airport company have been created at various airports to
undertake functions such as ground-handling, security and business park administration.
7.283 When considering the implications of outsourcing on the employee (in terms of wages,
working arrangements, holiday, training and social security) the overwhelming response was
that there was either no noticeable difference in these aspects since functions were
outsourced or that respondents didn’t know. One airport reported that working conditions
and salaries were all regulated, and therefore these aspects of employment remained the
same regardless of who was the employer (i.e. the airport, a third-party provider or a
temporary work agency).
7.284 A small number of airports did however indicate some differences: four airports considered
that wages had decreased with the outsourcing of functions, but this was countered by three
October 2015 | 185
airports who believed wages had slightly increased. It was also reported by others that social
security provisions for employees working in outsourced functions were lower.
7.285 Employees of outsourced functions were generally not thought to differentiate by age or
gender. Two airports did however indicate that workers aged 30-49 were slightly more
prevalent amongst outsourced employees.
Airlines
Network carriers
7.286 All network carrier respondents reported an increase in outsourcing activities since 2005, with
over half the respondents stating the increase had been significant. The majority also expected
that this trend will increase over the next 5 years.
7.287 A range of tasks are outsourced by the network carriers, including ground-handling, cabin
crew, maintenance, catering, accounting, IT, HR, procurement, and other back-office tasks.
7.288 The advantages of outsourcing provided include the benefits gained by specialisation (enabling
all parties to focus on core competencies), the standardisation of processes, synergies from
bundling tasks, and a reduction in costs. Two airlines noted that service suppliers are assumed
to be cheaper. It was noted by one airline that outsourcing helps to resolve two different
challenges experienced by the airline:
The difficulty of maintaining low-skilled positions within the airline (such as some ground-
handling activities) when the market permits subcontractors with lower wages; and
The difficulty of retaining higher-skilled employees who require high wages but are not
used consistently by the organisation (e.g. specialised IT workers).
7.289 One airline also noted that outsourcing had the advantages of avoiding non-flexible and costly
collective labour agreement terms. The Finnair case study in Appendix D provides details on
the airline’s recent decision to outsource cabin crew on two routes to OSM Aviation. This is a
complete outsource: rather than using crew engaged via temporary agencies, Finnair has
taken the decision to outsource two routes in entirety to a third party provider, which will be
responsible for uniforms, training, and all crew management.
7.290 A number of implications of outsourcing were highlighted. In terms of implications for the
airline, one respondent highlighted the risks associated with outsourcing include a loss of
experience and sometimes a reduction in the quality of the work provided. The concern was
raised that safety may be compromised if flight crew are outsourced and for this reason (along
with some others), the airline does not outsource pilot functionality at all.
7.291 In terms of implications for the employees, half of the network carrier respondents didn’t
know whether differences existed between the working and social conditions for employees of
outsourced functions as compared to staff working directly for the airline.
7.292 Of those who did provide an indication of trends (three airlines), it was considered that wages
for employees of outsourced tasks would decrease and that the prevalence of fixed-term,
part-time and temporary agency employment would increase, however the responses for
holiday entitlement and social security were mixed. Two airlines agreed that training and
development opportunities would be lower for employees of outsourced functions. The low
number of responses to these questions does, however, mean these trends should be treated
with caution.
October 2015 | 186
Low cost carriers
7.293 LCCs list the benefits of outsourcing as follows:
reduced administrative effort;
flexibility during growth;
enabling organisations to focus on the core business,
competitive labour costs;
ability to draw on local expertise; and
standardisation.
7.294 One LCC respondent stated that other airlines may use outsourcing to “avoid some of the
union and representation rights”.
7.295 The majority of the LCCs outsource some functions. Similar to the network carriers, the LCCs
outsource ground-handling and other, mainly administrative, tasks. In addition, it was stated
by one carrier that flight and cabin crew are also outsourced.
7.296 There was no consensus across the low cost carriers about how outsourcing will change over
the next 5 years, with one airline expecting no change and another anticipating a slight
increase.
7.297 Neither airline knew what changes to working conditions, if any, employees of outsourced
functions had experienced. Regarding social security cover for employees providing
outsourced tasks, it was considered by one airline there was no noticeable difference in cover
between in- and outsourced tasks.
Representative organisations
Worker representatives
7.298 The ECA, Unionen and SLSY all reported a significant increase in the outsourcing of functions in
the air transport sector. These organisations considered that whilst some outsourcing is
justifiable due to its associated flexibility benefits (as noted above by airlines), much of this
activity is associated with cost-reduction measures such as reduced payments for social
security, termination, and other employee contributions. These respondents, including the
ETF, also considered that increases in this area are also expected over the coming five years.
7.299 The impact of outsourcing was agreed to result in a significant decrease in wages, and a
decrease in other working conditions such as training and development opportunities and
holiday entitlement. In particular, it was noted by UNIONEN, VDF, the ECA and the ETF that
employees of outsourced functions have significantly less social security cover than employees
working directly for the airport. Increases were reported in the occurrence of fixed-term
contracts and temporary agency employment for employees of outsourced functions.
7.300 The ECA noted that whilst wages in some outsourcing situations may be comparable to
directly-employed flight crew, the comparison does not stand if other aspects such as social
contributions and taxation are considered. Pilots working for tax- and social-contribution free
wages may easily find themselves in a situation where they have limited or no health
coverage, no protection against loss of licence and lower pensions.
7.301 SLSY noted that whilst Finnair cabin crew were not moved from Finnair employment to an
outsourced function, since 2009 departing Finnair cabin crew (who were employed directly by
October 2015 | 187
Finnair) have been replaced with agency cabin crew, engaged through either Spain or Asia
(Hong Kong, Singapore, China, India, Thailand, Japan and South Korea).
7.302 ECA considered that younger staff (ages 15-29) have been more impacted by outsourcing than
other employee profiles.
7.303 ECA, Unionen and SLSY agree that staff of outsourced tasks have significantly less social
security cover.
Employer representatives
7.304 ACI comments that security, cleaning and PRM (passengers with reduced mobility) functions
are primarily outsourced by airports to third party specialists.
7.305 ACI estimates that 16% of ground-handling activity in the EU is provided by airports
themselves, with the remainder provided by a third party handler, a self-handler, or an airport
subsidiary. ACI notes that the opening of the ground-handling sector resulted in a
labour/social problem for airports, as airports that provide in-house ground-handling with
“protected” employees cannot compete with independent/ outsourced ground-handling
organisations. Even if an airport creates a subsidiary, socially the challenges associated with
the change are so significant that the subsidiary employees generally have the same status as
the airports. ACI considers it likely that ground-handling functions provided by airports directly
have more permanent contracts than those provided by independent ground-handling
organisations.
7.306 At an aggregate level (i.e. all their member airports), ACI have observed a unit cost decrease of
-12% between 2009-2012. ACI consider this reduction is a result of an overall shift from
personnel costs to contracted services costs, which implies that there is a shift to the cheaper
contracted services from personnel.
7.307 ACI considers that the impact of outsourcing has resulted in lower wages for PRM, security and
ground-handling staff, as the new companies providing the functions will have employees with
a different type of status, lower salaries, and part time employment. ACI also observe a
reduction on health, social security, holiday, protection, and wages for employees in these
newer companies (i.e. “unprotected” employees).
7.308 CANSO reported that there has been a slight increase towards outsourcing within the air
traffic control industry. This has largely been for training (Student Controllers to Entry Point
North programme) which they perceive to have been very beneficial: outsourcing has
provided cost advantages, increased efficient and savings on technology and infrastructure,
whilst also allowing experts to focus on core areas. It is also expected that outsourcing will
increase over the next 5 years.
7.309 ELFAA agree that outsourcing enables low fare airlines to quickly respond to market
conditions, particularly in a highly mobile industry. Ensuring flexible and efficient operations
partially requires outsourcing.
7.310 With specific regards to outsourced employees, it CANSO noted that there has been a slight
increase in fixed-term contracts and part-time employment. Likewise, social security and
training opportunities have also slightly increased amongst the outsourced workforce in the
sector.
October 2015 | 188
Other
7.311 The CSDCA comments are in line with other respondents regarding outsourcing: there has
been a significant increase and that increases are expected (albeit at a lower rate) over the
next five years. Staff of outsourced tasks have experienced a significant decrease in wages,
training and development opportunities, social security and there has been a slight increase in
the prevalence of fixed-contract and part-time employment amongst these staff. These
outsourced staff also have significantly less social security cover.
7.312 The benefits of outsourcing are stated to be primarily related to a reduced labour cost.
Summary
7.313 Across the air transport sector, outsourcing has increased over the last ten years, and it is
anticipated that this trend will continue over the coming five years. The functions outsourced
vary depending on the sector, but specialist functions such as ground-handling, security,
cleaning and administrative positions are most commonly outsourced. Some low-cost carriers
also outsource flight and cabin crew, and one network carrier has recently outsourced cabin
crew activities to Asia for two routes.
7.314 The reasons for outsourcing are similar across the sector: cost efficiency, flexibility and access
to resources (both low and high skilled) are regularly cited as the drivers for outsourcing.
There was also a suggestion by two stakeholders that outsourcing is a means to
circumnavigate unions and strict representation rules.
7.315 Whilst the exact impact of outsourcing on employees working condition is unclear, given that
many respondents were not aware of whether there were any differences, there seems a
common consensus that social security is lower for employees working in outsourced
functions. There is evidence that outsourced cabin crew functions are paid lower wages (see
Finnair case study in Appendix D). These concerns are particularly acute amongst the worker
representatives, who also indicate lower wages, training and holiday entitlement.
October 2015 | 189
Multiplication of operational bases
Overview
7.316 The international nature of the air transport industry means that airline operations, and
consequently workers, are spread across a number of operational bases, across a number of
Member States and third States.
7.317 This section considers what impacts these business models have on employers and employees,
with particular regard to taxation, social security, and applicable employment law, as well as
considering how the ‘home-base rule’ is applied in practice.
7.318 Case studies for British Airways, Air France, FedEx, easyJet, Ryanair and Finnair are provided in
Appendix D, and provide a sample of the range of operational models used by European
airlines with respect to operational bases and associated decisions concerning the
employment jurisdiction of their employees.
Legal background
7.319 When dealing with any employment issue, it is essential to establish the law applicable to the
dispute and to determine which country's courts will have jurisdiction to hear the dispute.
7.320 In the aviation sector, more than one country may be involved, such as the country of
residence of the employee, the airport location where the individual is usually based ("home
base"), the places to which the individual flies, the country in which the employing entity is
based and the law and jurisdiction chosen in the employment contract.
7.321 Where the airline has more than one operational base, this adds further complexity to the
legal situation, particularly where bases are located both within and outside the EU. The
implications span legal protection, tax and social security.
a) Applicable Law for contractual obligations in individual employment contracts
7.322 Regulation 593/2008 (Rome I)66 applies to contractual obligations in civil and commercial
matters and allows the parties to choose the law applicable to their contract (Article 3). It
should be noted that the Rome I Regulation only applies to private law matters, i.e.
contractual obligations between individual employees and employers.
7.323 As regards individual employment contracts, Article 8 applies. As under other EU law
instruments, the term "employee" is defined under national law meaning that the definition
and therefore the scope of the Regulation can vary.
7.324 Article 8(2) provides that if the parties do not choose the applicable law, it will be:
i. That of the Member State in which or from which the employee habitually carries out
his work in performance of the contract; or
ii. Where (i) cannot be determined, where the place of business through which the
employee was engaged is situated; or
iii. If it appears from all the circumstances that as a whole the contract is more closely
connected with another country, the law of that country shall apply.
66 Regulation (EC) No 593/2008 of the European Parliament and of the Council of 17 June 2008 on the
law applicable to contractual obligations (Rome I)
October 2015 | 190
7.325 The forum state may apply its overriding (internationally mandatory) rules where they have a
claim to apply. Such rules are those which are regarded:
"as crucial by a country for safeguarding its public interests, such as its political, social or
economic organisation, to such an extent that they are applicable to any situation falling
within their scope, irrespective of the law that, in the absence of choice, would have been
applicable. "
7.326 Such rules may therefore apply even where the law of the forum state is not designated by
either paragraph (1) or paragraph (2) of Article 8.
7.327 For example, in the UK, certain statutory rights tend to be treated as overriding rules.
Although their application requires a connection with the UK, those rules do not necessarily
concord with those of Article 8. In addition to this, for example, statutory employment rights
in the UK require certain conditions to be satisfied, including showing that the individual is an
'employee' or 'worker', or that they have worked for the respondent for a set period of time to
afford the benefit of the mandatory rule. As such, every Member States' mandatory provisions
will differ to a certain extent, in both substance and applicability.
7.328 In addition claims derived from EU law may be given additional protection, albeit this
approach has not been endorsed by the European Court. In Bleuse v MBT Transport67, the
German Claimant was employed by the UK based Respondent. He brought unfair dismissal,
unlawful deduction from wages and holiday pay claims in the UK. The first two claims are
derived from UK statute whereas the holiday pay claim derived from the Working Time
Directive 2003/88/EC. The Claimant argued the principles, applied by the UK Courts to
determine entitlement to these statutory UK laws should not apply with respect to directly
effective rights conferred by EU law (i.e. the holiday pay claim). The UK Employment Appeals
Tribunal found that the Working Time Regulations 1998 were derived from the directly
effective rights of Council Directive 2003/88/EC on working time and therefore should be
made available to those working within Europe. This principle serves to allow access to UK
mandatory laws to the extent those laws are directly effective rights derived from EU law.
b) Jurisdiction for employee claims
7.329 Under European law, the determination of in which jurisdiction a legal dispute shall be heard
was governed by Regulation 44/2001 ("Brussels I") until January 201568. It contains a special
regime applicable to individual contracts of employment and allows employees to bring claims
against employers in:
i. The place where the employee habitually carries out his work or the last place where
he did so; or
ii. If the employee does not habitually carry out his work in any one country, in the
place where the business which engaged the employee is or was situated.
67 [2008] IRLR 264 (EAT)
68 Council Regulation (EC) No 44/2001 of 22 December 2000 on jurisdiction and the recognition and
enforcement of judgments in civil and commercial matters amended by Regulation (EU) No 1215/2012 of the European Parliament and of the Council of 12 December 2012 on jurisdiction and the recognition and enforcement of judgments in civil and commercial matters
October 2015 | 191
7.330 By contrast, an employer may bring proceedings against an employee only in the Member
State in which the employee is domiciled69.
7.331 In addition, non-EU employers are deemed to be domiciled in a Member State where the non-
EU employer has a branch, agency or other establishment in a Member State and the dispute
arises out of the operations of the branch, agency or establishment.
7.332 Importantly, these jurisdiction rules may only be departed from by an agreement which is
entered into after the dispute has arisen or which allows the employee to bring proceedings in
courts other than those indicated above. 70
7.333 As of 10 January 2015, Brussels I was replaced by Regulation 1215/2012 ("Recast Brussels")71.
The provisions in respect of employees remain the same save for the following relevant
matters:
the provision relating to where the employee "habitually carries out his work" is amended
to "the place where or from where the employee habitually carries out his work or the
last place where he did so" (new element underlined). This modification does not
constitute a change on the substance but incorporates existing ECJ case law.
The jurisdiction rules at (i) and (ii) above are extended to employees of employers not
domiciled in a Member State (without the need for a branch, agency or establishment in
the EU). Thus, the recast Regulation now extends the jurisdiction of Member State courts
to employment disputes brought by the employee against an employer which is not
domiciled in the EU.
Finally, the recast Regulation allows now to sue several employers as co-defendants in the
place where one of them is domiciled (see Articles 20(1) and 8(1)).
Test for "habitually carries out work"
7.334 The crucial concept of "habitually carries out work", relevant to establishing both applicable
law and jurisdiction has been interpreted by the ECJ. It is particularly important in the air
transport sector. There is a parallelism of interpretation of this concept in both Regulations
(the Brussels I Regulation and Rome I Regulation).
7.335 In Voogsgeerd v Navimer SA72 the ECJ stated that the Member State in which the employee
habitually carries out his work in performance of his contract is where the "employee performs
the main part of his duties to his employer." The Court held that one must look at the factors
surrounding the employees' employment, including where the employee carries out his tasks,
where he receives instructions concerning his tasks and organises his work, and the place
where his work tools are to be found.73
69 n.67, Article 22
70 n.67, Article 23
71 n.67
72 Case C-384/10
73 n.72, [38]
October 2015 | 192
7.336 In Koelzsch v Etat du Grand-Duche de Luxembourg74 the employee was an international lorry
driver delivering flowers, who was domiciled in Germany but employed by a Luxembourg firm.
The ECJ stated that where an employee carries out their activities in more than one Member
State, "the country in which the employee habitually carries out his work in performance of the
contract, is that in which or from which, in the light of all the factors which characterise that
activity, the employee performs the greater part of his obligations towards his employer.75"
7.337 This latter point confirms the earlier judgment in Mulox v /SC (on the 1968 Brussels
Convention),76 where the ECJ held that the place of performance of the relevant obligation
refers to the place where the employee actually performs the work covered by the contract
with his employer and that where the employee performs his work in more than on Member
State, that place refers to the place where or from which the employee principally discharges
his obligations towards his employer77. Thus, Brussels I does not confer concurrent jurisdiction
on the courts of each Member State in whose territory the employee performed part of his
work.78
7.338 In Rutten v Cross Medical Ltd79 (on the 1968 Brussels Convention) the ECJ held that where a
contract of employment is performed in several Member States, the Brussels Convention must
be understood to refer to the place "where the employee has established the effective centre
of his working activities and where, or from which, he in fact performs the essential part of his
duties [for] his employer.80" This is the place where it is least expensive for the employee to
commence proceedings or to defend himself.81
7.339 In Weber v Universal Ogden Services82 (on the 1968 Brussels Convention) the ECJ held that
Brussels I means:
"where an employee performs the obligations arising under his contract of employment in
several [Member] States, the place where he habitually works, is the place where, or from
which, taking account of all the circumstances of the case, he in fact performs the essential
part of his duties [for] his employer. " 83
74 Case C-29/10
75 n.74 [50]
76 Case C-125/92
77 n.76 [20] and [26]
78 n.76 [21] and [23]
79 Case C-383/95
80 n.79 [23]
81 n.79 [24]
82 Case C-37/00
83 n.82 [58]
October 2015 | 193
7.340 Where the employee performs the same activities for his employer in more than one Member
State, "it is necessary to take account of the whole of the duration of the employment
relationship in order to identify the place where the employee habitually works".84
7.341 This test was applied to the air transport sector in a case of the Borgarting Court of Appeal in
Norway of Cocca v Ryanair85. The claimant, an Italian national based in Norway, was employed
by Crewlink Ireland Ltd and hired out to Ryanair as a Cabin Services Agent on 28 March 2012.
She was stationed at Moss Lufthavn Rygge in Norway and had a duty to live no further than
one hours' journey away from the Airport. The Court held that an Irish jurisdiction clause in
her employment contract was invalid as it would, amongst other things, be practically and
financially inconvenient for the claimant to institute proceedings in the Irish courts. The Court
reflected on the judgments in Koelzsch86 and Voogsgeerd87, where the Court stated that an
employee can institute proceedings against the employer "in the place in which or from which
the employee actually carries out his working activities". Ryanair argued that as they are
domiciled in Ireland; the company had no business located in Norway; the aircraft are
registered in Ireland; the flights to and from Norway are organised from Ireland and the
claimant received instructions from Ireland, the claimant should have brought a claim in
Ireland. The Court rejected this argument, stating that the claimant was operating out of her
"home base"; she was contractually required to live within an hour's journey from the airport;
she received instructions at the airport; checked in passengers and performed her stand-by at
the airport. The Court held that:
"it appears artificial to conclude that work on board aircraft on international flights by itself
establishes a link between the performance of the work and the country of registration [of the
aircraft]."
7.342 The Court's view of the legal position was that there is no requirement that the majority of the
working hours must be spent in one country:
"the central factor is whether any one place appears to be a centre of work activity. Even
though the majority of the work activities were carried out in international airspace, [the
claimant] had a certain volume of clearly defined work tasks on the ground [in Norway].
Test for "where business situated"
7.343 When determining the "place of business through which the employee was engaged",
pursuant to Article 8(3) of Rome I, the courts should only consider those factors "relating to
the procedure for concluding the contract, such as the place of business which published the
recruitment notice and that which carried out the recruitment interview, and it must
endeavour to determine the real location of that place of business. Such place of business must
have a "degree of permanence", not a mere "transitory presence."88
84 n.82
85 LB-2013-123040, Borgarting Court of Appeal
86 n.74
87 n.72
88 n.66
October 2015 | 194
Test for "closely connected"
7.344 In Schlecker v Boedeker89 the employee was a German national who had been relocated to the
Netherlands by her employer. Article 8(2) thus clearly designated Netherlands law as
applicable law. The dispute related to whether, by virtue of Article 8(3), German law had a
better claim to be applicable law, as the country of closest connection. The following factors
were noted as to why German law had a claim to govern the relationship: remuneration was
paid in German marks; the pension arrangements were made with a German pension
provider; the employee continued to reside in Germany, where she paid her social security
contributions; the employment contract referred to mandatory provisions of German law, and
the employer reimbursed the employee travel costs from Germany to the Netherlands.90
7.345 The Court also held that:
"account should be taken in particular of the country in which the employee pays taxes on the
income from his activity and the country in which he is covered by a social security scheme and
pension, sickness insurance and invalidity schemes."91
c) Social Security
7.346 EU law in the field of social security provides for the co-ordination but not the harmonisation
of the Member States' national social security systems. This means that each Member State is
free to determine the details of its own social security system, including which benefits shall
be provided, the conditions of eligibility, how these benefits are calculated and how many
contributions should be paid. The law of the European Union, in particular Regulations (EC)
Nos 883/200492 and 987/200993 on the coordination of social security systems, establishes
common rules and principles which must be observed by all national authorities when
applying national law. These rules ensure that the application of the different national regimes
respects the basic principles of equality of treatment and non-discrimination. By doing so, it is
ensured that the application of the different national regimes does not adversely affect
persons exercising their right to free movement within the European Union.
7.347 According to Article 11 of Regulation (EC) No 883/2004 a person can be subject to the
legislation of a single Member State only and that legislation would be determined in
accordance with Regulation (EC) 883/2004 and Regulation (EC) 987/2009.
7.348 In the case of employed and self-employed persons the legislation of the Member State where
the activity is carried out usually applies. This principle is referred to as lex loci laboris. Persons
89 Case C-64/12
90 n.89 [29]
91 n.89 [41]
92 Regulation (EC) No 883/2004 of the EP and of the Council of 29 April 2004 on the coordination of
social security systems, OJ L 166, 30.4.2004, p.1, corrigendum OJ L 200, 7.6.2004, p. 1, as last amended by Regulation (EU) No 465/2012, OJ L 149, 8.6.2012, p.4 (hereafter: Regulation 883/2004 and Regulation 465/2012).
93 Regulation (EC) No 987/2009 of the EP and of the Council of 16 September 2009 laying down the
procedure for implementing Regulation 883/2004, OJ L 284, 30.10.2009, p. 1, as last amended by Regulation (EU) No 465/2012, OJ L 149, 8.6.2012, p. 4 (hereafter: Regulation 987/2009).
October 2015 | 195
receiving certain short-term cash benefits based on their employment or self-employment are
also subject to the legislation of the Member State of activity. Any other person is subject to
the legislation of the Member State of residence (lex domicilii). However, in some very specific
situations, criteria other than the actual place of employment may be justified. Under Article
12 of that Regulation, a posted worker is subject to the social security rules of the sending
Member State, provided that the anticipated duration of such work does not exceed 24
months and no replacement takes place.
7.349 The same could apply for a person who is working in two or more Member States and certain
categories of workers such as civil servants. The determination of "residence" is of importance
in particular as regards non-active persons and in case of work pursued in two or more
Member States.
7.350 Regulation (EU) No 465/2012 added a provision that specifically addresses the "home base"
for air crew to the Regulation on the coordination of social security systems (Art. 11 of
Regulation 883/2004), a concept which was initially defined in the field of aviation safety94.
Home base was indeed an important factor in determining rest periods. It has also gradually
become a key element in determining the country where mobile workers should pay their
social security contributions and exert their rights in that area. This principle aims to guarantee
fairness in both aspects. It is defined in Annex III to Council Regulation 3922/91 as the place
(airport) from where the crew member normally starts and ends duty period or a series of
duty periods, and where, under normal conditions, the operator is not responsible for the
accommodation of the crew member concerned.
7.351 Under the current framework, an operator can only nominate one home base to a crew
member at one time. It could apply to a crew member directly employed by an airline or
employed temporarily through an employment agency. This applies in the vast majority of
cases. However, there could be specific cases where a crew member/pilot worked for two or
more airlines and where he or she could have more than one home base95.
7.352 Regulation 465/2012 does not immediately change the competent Member State for social
security of flight crew. There is a 10 year long transitional period for the current staff96,
providing that they can stay insured in the country currently responsible for their social
security and if they expressly do not request to be insured in the State where their home base
is located. The new rule on the determination of the applicable legislation for flight and cabin
crew however applies to all newly recruited staff after 28 June 2012.
7.353 Regulation 83/2014/EU amended Regulation 965/2012, laying down technical requirements
and administrative procedures related to air operations. The new Regulation did not change
the definition of "home base" in substance. It only replaced the word "nominated" by
94 Regulation 3922/91 harmonized technical requirements and administrative procedures in the field of
civil aviation and the definition of home base was presented in its annex – Subpart Q, EU-OPS on Flight and duty Time Limitations (FTL in short).
95 The Practical Guide elaborates further on the home base rule and provides example in Section 4a of
the Practical Guide clearly referred to Amending Regulation 465/2012 (which came into force in June 2012).
96 n.92
October 2015 | 196
"assigned". But it also provides that a single airport location would need to be assigned with a
high degree of permanence. The new provision will apply from 18 February 2016.
7.354 Although it helps determining the applicable social security regime, this Regulation, it merely
determines the single applicable social security legislation for persons normally working in two
or more Member States (like for example flight crew). Therefore, it does not impact on the
employment relationships which are subject to an employment contract and the national
labour law, or on the place where personal income tax should be paid.
7.355 In order to assist institutions, employers and EU citizens in determining which Member State's
legislation should apply in given circumstances, a Practical Guide97 was prepared and approved
by the Administrative Commission for the Coordination of Social Security Systems98
(representing delegations of all Member States). It provides guidance on the implementation
of the Regulations relating to the coordination of social security systems, especially as
concerns: posting, pursuit of activity in two or more Member States and determination of
residence.
d) Taxation
7.356 Taxation of pilots and crew members can be complex given the multitude of jurisdictions
involved in the working relationship. Employer airlines will need to ascertain whether they
have an obligation to deduct tax and social security contributions at source and in which
jurisdiction that obligation arises. The rules for tax treatment are different in each Member
State and therefore an airline will need to take advice in each potential jurisdiction to establish
the correct treatment. Where the employer is a temporary work agency, the task is even more
complex given employees may be assigned to an even greater variety of jurisdictions.
7.357 By way of example, where an employee and employer are resident in the UK, the employer is
required to deduct tax and social security contributions at source (known as Pay as You Earn).
Where a non-UK based employee works for a UK based employer, the latter should determine
whether there is a double taxation agreement with the employee's Member State.
7.358 Where a non-UK based employer employs a UK-based employee, the former will only have an
obligation to account for tax and social security contributions in the UK if it has a taxable
presence in the UK. It is accepted than any branch, agency or representative office in the UK
will constitute a tax presence for UK tax purposes.
7.359 Complications arise where, for example, a UK airline is provided with a temporary agency
worker. Where that individual is not self-employed and is considered a UK tax resident
(including duties associated with any part of a flight that starts or ends in the UK), HMRC will
expect the employer to deduct and account for tax and social security contributions. In Robson
97 Practical Guide on the applicable legislation in the European Union (EU), the European Economic Area
(EEA) and in Switzerland, December 2013, http://ec.europa.eu/social/BlobServlet?docId=11366&langId=en
98 In accordance with Article 72(a) of Regulation (EC) No 883/2004, the Administrative Commission for
the Coordination of Social Security Systems, which comprises delegates from all 28 Member States and is chaired by the Presidency, is responsible for dealing with all administrative questions or questions of interpretation arising from Regulations (EC) Nos 883/2004 and 987/2009.
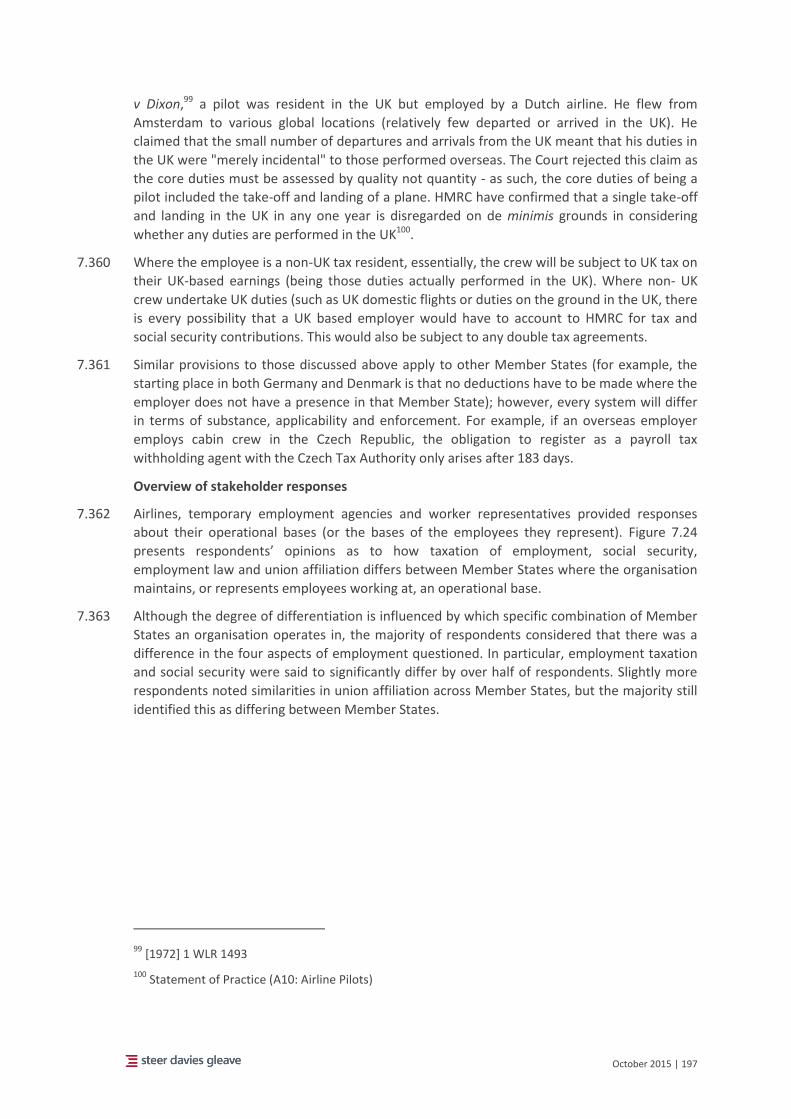
October 2015 | 197
v Dixon,99 a pilot was resident in the UK but employed by a Dutch airline. He flew from
Amsterdam to various global locations (relatively few departed or arrived in the UK). He
claimed that the small number of departures and arrivals from the UK meant that his duties in
the UK were "merely incidental" to those performed overseas. The Court rejected this claim as
the core duties must be assessed by quality not quantity - as such, the core duties of being a
pilot included the take-off and landing of a plane. HMRC have confirmed that a single take-off
and landing in the UK in any one year is disregarded on de minimis grounds in considering
whether any duties are performed in the UK100.
7.360 Where the employee is a non-UK tax resident, essentially, the crew will be subject to UK tax on
their UK-based earnings (being those duties actually performed in the UK). Where non- UK
crew undertake UK duties (such as UK domestic flights or duties on the ground in the UK, there
is every possibility that a UK based employer would have to account to HMRC for tax and
social security contributions. This would also be subject to any double tax agreements.
7.361 Similar provisions to those discussed above apply to other Member States (for example, the
starting place in both Germany and Denmark is that no deductions have to be made where the
employer does not have a presence in that Member State); however, every system will differ
in terms of substance, applicability and enforcement. For example, if an overseas employer
employs cabin crew in the Czech Republic, the obligation to register as a payroll tax
withholding agent with the Czech Tax Authority only arises after 183 days.
Overview of stakeholder responses
7.362 Airlines, temporary employment agencies and worker representatives provided responses
about their operational bases (or the bases of the employees they represent). Figure 7.24
presents respondents’ opinions as to how taxation of employment, social security,
employment law and union affiliation differs between Member States where the organisation
maintains, or represents employees working at, an operational base.
7.363 Although the degree of differentiation is influenced by which specific combination of Member
States an organisation operates in, the majority of respondents considered that there was a
difference in the four aspects of employment questioned. In particular, employment taxation
and social security were said to significantly differ by over half of respondents. Slightly more
respondents noted similarities in union affiliation across Member States, but the majority still
identified this as differing between Member States.
99 [1972] 1 WLR 1493
100 Statement of Practice (A10: Airline Pilots)
October 2015 | 198
Figure 7.24: Stakeholder responses: perceived difference in aspects of employment between Member States in 2014.
Source: stakeholder responses to questionnaire, Steer Davies Gleave analysis
Airlines
Network carriers
7.364 Of the seven network carriers who responded, three maintain multiple operational bases, one
maintains a single operational base and the remaining three did not provide information on
their operational base arrangements.
7.365 Of the three network carriers with multiple operational bases, one stated that there were
significant differences across all aspects questioned (union affiliation, employment law, social
security and employment taxation), one noted slight differences in all but employment law
which was thought to be “mostly similar”. The third carrier did not provide an indication,
stating that differences depend highly on the country and therefore they were unable to
generalise.
7.366 One airline noted that taxation rates are particularly different with respect to social security.
Whilst labour law is more “relaxed” in some countries than others, the airline stated that it
does not take advantage of these differences to avoid paying “normal” social contributions, in
order to maintain social cohesion.
7.367 Both airlines who noted differences stated that employees are aware of these differences and
that it causes significant problems. This is because they are aware of different cultures and
labour conditions, and that these practices can foster unfair competitive advantages, which
they do not want to support.
Regarding home bases, one airline noted that whilst it is understandable to envisage a
seasonal home base for a pilot (e.g. 3 continuous months per annum) for operations in the
summer months, it is less understandable to have a continuous series of home bases (4 per
year, or a change every 3 months). They stated that frequent changes of home bases involves
circumvention of the law.
0 2 4 6 8 10 12 14
Employment taxation
Social security
Employment law
Union affiliation
Number of respondents
For the Member States in which your organisation operates or represents employees, please indicate the degree of difference
between bases in the following areas.
Mostly similar Slightly different Significantly different Don't know Not applicable
October 2015 | 199
Low cost carriers
7.368 Two low cost carriers maintain multiple operational bases: one is present in twenty-one
countries, the other in eight MS. The third low cost carrier only has operational bases in one
country and therefore this section was not applicable to them.
7.369 Regarding the EU bases in which the two airlines operate in, both stated that there are
significant differences in employment taxation and social security between operational bases.
7.370 In terms of the law regarding employment contracts, one respondent states this is mostly
similar, although it is understood that this is because all employees of this LCC are employed in
one MS, whilst their social security arrangements are local, depending on their assigned home
base). The other LCC respondent notes slight differences.
7.371 Both LCCs noted that employees are aware of the differences between Member States. One
carrier states that awareness of these differences by employees does cause significant
problems, however, the other believed this causes no issues.
7.372 Case studies providing additional information on arrangements at LCCs Ryanair and easyJet
are provided in Appendix D.
Representative organisations
7.373 Significant differences in employment taxation, social security, employment law and union
affiliation across Member States is reported by the ETF, along with their assertion that airline
companies often exploit these differences when setting up bases (see 7.117). For example,
they suggest that differences in the combined taxation and social security payments that
employer must pay can range from approximately 20% in Croatia to over 60% in Italy.
7.374 Similarly, they note the differences in applicable labour laws between Ireland, which is
reported as “very poor” for workers, and Sweden, which is “very good”.
7.375 The ETF’s comments are supported by the ECA, SLSY, and Unionen. In all cases respondents
agree that employees are aware of these differences and that this causes significant problems.
For SLSY, the problems are due to differences between Finland and Spain, and in addition
between Finland and Asia. The cabin crew are aware that they all have the same role, but that
half are paid significantly more than the other half. SLSY reports that this creates tensions
when these crew are working side by side in the same aircraft.
7.376 ECA states that it is common for pilots to have an employment structure that involves two or
three countries (for example, if they are employed through an agency that is based in a
different Member State from their operational base and the airline), which can lead to the
pilots being unsure about which Member State’s social security and taxation laws apply.
Temporary work agencies
7.377 Both temporary work agencies reported differences in employment taxation between the
Member States where they operate. Often these differences are easy to negotiate: one agency
stated that when an agency worker is working in one country, it is relatively straight forward
to tax the worker in that country. However, with regards to pilots, taxation is often more
complicated, particularly where a pilot is working at bases in one (or more) Member State, but
living in another. The agency cited some cases where pilots are required to pay tax in as many
as three Member States, as the rules have not been effectively agreed by EU authorities,
meaning that often pilots are left with minimal salary post tax. The number of pilots wishing to
October 2015 | 200
work in certain Member States can often be severely reduced where double taxation treaties
are not in place.
7.378 The same agency also stated that there are significant differences in social security between
Member States, which can cause a range of problems. They report that when applications are
made for social security within a Member State, there are often significant delays (up to 24
months) in receiving social security payments as there are often disagreements as to where
payments should be made. This is particularly problematic for temporary agency workers as
the social security payments decision often occurs after the contract has finished.
Consequently, there is often a “knock-on effect” on the pilot being able to receive social
security benefits back in their home country. In addition, there are often inconsistencies in the
decisions made on social security payments by the same authorities for the same
circumstances.
7.379 There is also a lack of information for pilots about the nuances in social security cover
between Member States. For example, the agency cites that in Germany, earning over €54,900
entitles the employees to private health insurance, but many employees are not made aware
that this excludes them from any unemployment benefit.
7.380 The other agency reported a different picture: that social security is mostly similar in the
countries in which it operates. Whilst no explanation was provided about these similarities,
this agency operates in fewer countries than the one that cited significant differences, which
may be a possible reason for this comment.
7.381 One agency added its belief that the home base rule is not suitable. Despite the fact this
enables employees and employers to ensure their taxation and social security requirements
are met, employees are often unwilling to work in some locations within Europe and pay tax to
a country where they do not live. Consequently, competition with non-European airlines who
do not suffer this issue is reduced at some operational bases.
Other
7.382 Comments from the Chair of the CSDCA are in line with comments made by airlines and
representative organisations regarding the significantly different taxation, social security,
employment contact law and union affiliation levels between different EU Member States, and
that these differences cause significant problems.
Overview of principal place of business issues
Definitions
7.383 Regulation (EC) 1008/2008 defines the ‘principal place of business’ (PPB) as “the head office or
registered office of a Community air carrier in the Member State within which the principal
financial functions and operational control, including continued airworthiness management, of
the Community air carrier are exercised.” (see Article 2(26) of Regulation (EC) 1008/2008).
According to Article 4 of Regulation (EC) No 1008/2008, the same MS delivers the operating
licence and the Airline Operating Certificate which it supervises.
7.384 According to ICAO’s definition of PPB, evidence of PPB includes the following factors:
the airline is established and incorporated in the territory of the designating Party in
accordance with relevant national laws and regulations; and
the airline has a substantial amount of its operations and capital investment in physical
facilities in the territory of the designating Party, pays income tax, registers and bases its
October 2015 | 201
aircraft there, and employs a significant number of nationals in managerial, technical and
operational positions.
Social Dialogue Committee proposal
7.385 The Air Crew Working Group of the Sectoral Social Dialogue Committee have proposed a
change to the principal place of business rule, with an aim “to ensure that substantial aviation
activities, including a substantial number of flights, crews and bases, are operated in the
licencing country.”
7.386 Recital 9 of Regulation (EC) 1008/2008 states:
With respect to employees of a Community air carrier operating air services from an
operational base outside the territory of the Member State where that Community air carrier
has its principal place of business, Member States should ensure the proper application of
Community and national social legislation.
7.387 According to Article 4(a) of Regulation (EC) 1008/2008, one of the conditions for being granted
an operating licence from a Member State (MS) is that the airline has its PPB located on the
territory of the MS. The definition of PPB in Regulation (EC) 1008/2008 does not contain the
requirement for the carrier to have operational activities in the licensing Member State, and
the social partners propose that the carrier should be required to operate a substantial part of
their activities from/to the licensing Member State to avoid, in their view, the development of
so-called "flags of convenience". No precise thresholds to define “substantial” aviation
activities have been proposed by the social partners, although these may include measures
such as:
a percentage of operations; or
a percentage of air crew; or
a substantial number of bases in that MS.
7.388 The social partners also propose that the aviation authority who delivers the Airline Operating
Certificate is required to assess the effective base of the crew and undertakes regular checks.
Impact of PPB proposal
7.389 The practicalities of applying a definition of ‘substantial’ to the PPB principle are difficult.
7.390 Based on the proposed definition, the airline must have its PPB located on the territory of the
MS delivering the operating licence. Should these changes proposed by the social partners be
implemented, it is understood that, in practice, it means that an airline would have to have a
substantial part of its activities to/from whichever MS grants its operating licence, not just to
be granted the licence but also in order to maintain the licence.
7.391 Consequently, should the airline's place of substantial activities not comply with the proposed
definition, either because its activities are spread across the EU or because its activities may
change for operational reasons (for example due to the creation of new routes and/or new
operating bases) it would no longer be compliant with the proposed new PPB rules. The
ultimate sanction in such a case would be withdrawal of an EU operating licence for non-
respect of the condition to operate substantial activities, and associated with that any Bilateral
or EU level Air Service Agreement rights.
October 2015 | 202
7.392 The situation is also challenging with respect to air crew employees, who are highly mobile
and can be based in an airline's operational base located outside the territory where the
airline has its PPB.
7.393 A number of stakeholders contributing to this study have stated that rather than drafting new
legislation, enforcing the rules as they exist is key. Suggestions were made to render the
above-mentioned social Recital 9 binding. In this respect it also remains to be seen whether
National Aviation Authorities (NAAs) have the means or capacity to assess the effective base of
the crew and undertake regular checks. When determining the competent jurisdiction and
applicable law, a number of stakeholders have suggested that a stricter enforcement of
current legislation may be an appropriate first step in view of ensuring a more consistent
enforcement of Brussels I and Rome I Regulations.
7.394 With regard to the location of air crew members, the "home base" is the relevant concept for
consideration. It was originally developed to address safety issues (with respect to
determining rest periods) and is referred to in Regulation (EU) 465/2012 on the coordination
of social security systems. The “home base” is defined as:
"the location nominated by the operator to the crew member from where the crew member
normally starts and ends a duty period, or a series of duty periods, and where, under normal
conditions, the operator is not responsible for the accommodation of the crew member
concerned".
7.395 According to Regulation (EU) 465/2012, the home base principle is now also the criterion for
determining the applicable social security legislation for flight crew and cabin crew members
(see legal analysis from paragraph 7.319, on page 189 for more details).
Summary
7.396 A number of airlines operate from multiple bases across the EU, reflecting their operating
needs, which improves air connectivity and broadens the range of destinations for passengers.
Whilst this can have operational and cost benefits for the employers, and enable workers to
work freely across Europe, the significant differences in taxation, social security and
employment between Member States may cause significant complications for employees,
particularly if they are working from a base in a different country to where they live. These
differences can be especially difficult for temporary agency workers to negotiate as often
resolution to any uncertain circumstances is not made until after the fixed-term contract is
over.
7.397 Employees are generally aware of the differences between regulations at different operational
bases and if their wages and labour conditions are worse than colleagues. This can lead to
tensions and, as reported by one temporary agency, employees not willing to work in certain
locations.
Competition and growth
7.398 Within the stakeholder responses, a number of respondents commented on the link between
increased industry competition and the impact on working conditions, highlighting the
importance of a level playing field, competition-wise, in the air transport sector.
7.399 One airline and the European Committee for Social Dialogue for Civil Aviation noted its
concerns regarding the impact of different working conditions and unionisation rates on
competition, if an airline with working conditions and practices which are not legal in the
October 2015 | 203
country from or to which an air crew carries out their duties. The airline notes that
competition and a level playing field are key.
7.400 Unionen in Sweden also commented that unfair competition is becoming “rampant” in the
sector. They consider that aviation companies are benefitting from the mobile nature of their
operations by creating principal places of business in countries with more lenient labour laws
and reduced social charges (they cite an example of Primera Air Scandinavia, and Icelandic
owned company registered in Denmark and with a base in Sweden that recently opened a
base in Latvia and then requested that Swedish cabin crew reduce their employment costs to
Latvian levels. The final result was the closure of the base in Sweden with crews replaced by
Latvian self-employed crews).
7.401 One airport also noted the impact of competition on wages and living standards. As prices in
the air transport industry get cheaper (which they note as being positive for passengers) there
is a negative consequence for wages in the industry. This competition and wage pressure
influences the working places at airports. Regions surrounding airports are often have a high-
price level, meaning that it can be difficult to provide salaries to guarantee an adequate
standard of living for local employees.
7.402 ACI provided some insight into airport vs airline arrangements. Airports have fixed location
assets, with a lot of fixed costs (much of them relating to labour costs) with long term
investment. There are many rules and regulations regarding minimum coverage for security,
maintenance functions regardless of the airport size. As a result of the liberalisation of the air
transport market, airports are now more competitive, although not as intensely competitive as
the airline industry. Whilst employment at airports is not as volatile as at airlines which can
change and move bases in reaction to competition or other issues, the increased competition
has resulted in changes in employment and labour conditions.
7.403 Competition is more intense for smaller airports than larger ones. In particular, LCC pressure
on airport charges has resulted in a conflict between lower charges and protected status of
employment at airports. If an airport needs to cut costs, rather than making redundancies
departing employees are simply not replaced. ACI estimates that approximately 20% of the
jobs in major airports disappeared between 2010-11 by not replacing departing employees.
7.404 There is in addition to the wider issue of the structural profitability of the smaller airports,
which generally have been unprofitable.
7.405 The ETF perceived that the opening up of the air transport market has caused high growth, but
that this has not resulted in direct employment, instead forced increased productivity, social
dumping and a worsening of working conditions.
7.406 Conversely, ELFAA and one LCC noted that increased liberalisation has enhanced growth and
the number of employment opportunities and career progression, particularly within the
youth sector.
7.407 One network carrier also noted that airlines need to constantly be aware of how to operate as
the market develops, otherwise the market will change and traditional carriers will struggle
with their employees who wish to maintain the current status.
October 2015 | 204
Case study overviews
7.408 Case studies have been developed as follows:
3 airports: Athens, Dublin, and Liège, to illustrate outsourcing practices at airports along
with other employment arrangements.
6 airlines: Ryanair, easyJet, British Airways, Finnair, Air France and FedEx, to illustrate
outsourcing practices at airlines, challenges associated with multiplication of operational
bases with respect to employment and working conditions, and other interesting issues
identified.
1 temporary work agency: CAE Parc aviation, to illustrate the operations of, and
challenges faced by, temporary work agencies.
7.409 The following section provides a brief overview of the case studies and issues identified; the
full case studies can be found in Appendix C (airports) and Appendix D (airlines and temporary
work agency).
Airport case studies
Athens Airport
7.410 This case study has been developed using information provided by Athens International
Airport (AIA) during a telephone interview and information provided via email, and from the
airport's public website.
7.411 AIA operates as a PPP and from inception was able to decide and design a company strategy
regarding functions that should be provided by the airport company, and functions to be
outsourced. The decision was taken to outsource non-critical functions, such as cleaning and
commercial activities. By taking this approach AIA considered the airport would operate at its
most competitive, and ensure that relevant experts provided the services required.
7.412 Whilst AIA stated that there may be some differences in employment conditions between AIA
and other contactors at the airport, the most radical changes in wages and employment
conditions in recent years at the airport have been due to the financial crisis and changes in
national labour legislation, which has impacted persons employed in Greece more generally.
7.413 AIA do not see any benefit in employing temporary agency workers. Use of temporary agency
workers does not fit well with the skilled mix of in-house staff that AIA has - they consider a
temporary agency worker would not be hired on a short-term basis to undertake specialised
maintenance activities or terminal supervision. The services that AIA provides in-house have
permanent, on-going needs, so it is not logical to use temporary staff for these functions.
Dublin Airport
7.414 This case study has been developed using publically available data and information on Dublin
Airport.
7.415 At the time of opening the new Terminal 2 in 2010, the Dublin Airport Authority (daa) was
under considerable pressure from the economic recession, its main users and the Irish
Government to introduce a cost-effective way of operation.
7.416 Although they did not resort to widespread use of outsourcing, daa used the creation of
subsidiary companies ASC and DASL to enable 'new' employees in Terminal 2 and Terminal 1
to be employed under different conditions to those of 'legacy staff'. The salary levels were set
at benchmarks with other companies in the Irish economy and materially less than those paid

October 2015 | 205
to legacy workers. In addition greater flexibility in working conditions were agreed facilitating
rostering in areas such as security and cleaning to more closely match the airports operational
needs.
Liège Airport
7.417 This case study has been developed using information provided directly by Liège Airport and
Liège Air Cargo Handling Services (LACHS), and supplemented with information gathered from
the airport website
7.418 Liège Airport is a cargo-focussed airport that operates year-round, 24 hours a day. To address
the specific requirements of its primary customers (the cargo airlines), the airport has always
(since its inception 25 years ago) outsourced ground-handling and in addition does not restrict
the number of ground-handlers operating on the site. Ground-handling organisations
operating on site typically require access to a dedicated warehouse. There are currently no
capacity restrictions that might limit the number of ground-handling organisations operating
at the airport.
7.419 LACHS, a cargo handling company based at Liège Airport, handles general and specific cargo.
The organisation permanently employs 200 people at Liège Airport, 10% in the office and the
remainder in operational ground-handling roles. LACHS hires all employees through temporary
employment agencies in a three step process:
Workers are first engaged on a temporary bases through a temporary employment
agency;
If performance is good, workers are then offered fixed term contracts (CDD); and
Permanent employment (CDI) is offered to workers after a maximum of four CDD.
7.420 LACHS considers that this approach to hiring staff is the most beneficial to both themselves
and the workers involved, as it enables better integration into the organisation, better
understanding of the ways of working and a more comprehensive understanding of the
potential employee of the specific requirements and demands of working in an air cargo
handling operation.
7.421 Liège Airport's passenger activity relates primarily to charter airline trips in the summer
months. The airport therefore relies on temporary agency workers for three months each year
to accommodate the additional passenger demand.
Airline case studies
Air France
7.422 This case study has been developed using information provided by Air France during a
telephone interview in May 2015 and with information from the company’s website.
7.423 Air France have largely maintained a traditional approach to employment of its air crew. All air
crew are employed directly and they do not outsource any of these functions nor engage
temporary agency workers. However, their employment model has become more flexible and
cost-effective by engaging some Chinese air crew, but on the same terms and conditions as
French crew.
7.424 Amongst ground-handlers, whilst Air France do maintain some higher-skilled functions in
house and self-handle at a number of airports, increasingly these activities are being
outsourced in order to reduce costs. Where an activity is not a core function of the airline, and
October 2015 | 206
is either low-skilled (such as baggage handling) or very specialist (such as some high-skilled
maintenance), then outsourcing is seen as the logical and economic step.
7.425 Air France has been unaffected by the revision of the home-base rule in 2012. All its crew are
based in France, and therefore are taxed and subject to social payments there. In order to
enhance flexibility, all staff are based within the ‘Paris system’, allowing employees to be
based at either Paris airport (CDG or Orly) without contravening their employment contract
obligations.
7.426 Collective labour agreements cover all staff at Air France, and are disaggregated by employee
group when negotiating specific issues such as pay. Unions play a role in all negotiations,
although unionisation participation rates are not particularly high and agreements can be
reached without approval of all unions.
British Airways
7.427 This case study was drafted using information provided by British Airways during a telephone
call and its formal contribution to the study, supplemented with information gathered on the
British Airways website and in the annual reports for the airline and parent group, IAG.
7.428 Almost all BA staff are on permanent contracts with the airline. BA do not outsource flight
crew or cabin crew at all. In 2009, BA established a new cabin crew fleet, the Mixed Fleet (MF),
that flies to a combination of short and long haul destinations. Entry level salaries for a MF
role is £13,500, and MF employment conditions and salary are different (lower) than for
'Legacy' cabin crew staff, who were employed prior to the MF establishment in 2009. Average
legacy crew salary is £36,000 per annum.
7.429 For BA, which carefully tracks impacts and trends in customer satisfaction, the significant pay
back on their customer satisfaction scores is cabin crew and other customer facing staff
performance. As a result, most BA workers are directly employed, however some functions
have been outsourced, primarily ground-handling at non-UK airports. No activities have been
outsourced at LHR; all above and below the wing staff are in-house. This is partially due to the
potential industrial relations issues that would arise should BA take this route regarding their
ground-handling staff. For airports where BA has outsourced the ground-handling function,
there remains a duty manager at most of the airports where BA operates who is a BA
employee.
7.430 BA's use of temporary agency workers is very limited.
7.431 All BA flight crew and all BA employees working in UK are employed under a UK employment
contract. Whilst no flight crew are employed outside of the UK, BA has a number of
international cabin crew bases, where cabin crew are employed in a specific country to cover
specific needs. These crew are employed under local market rates, the Cairo base was cited as
an example where employees are hired under conditions equivalent to the MF terms and
conditions.
7.432 All BA staff in the UK, apart from the executive management grades, are covered by a
collective labour agreements (CLA). A large number (hundreds) of BA cabin crew commute to
their place of work in LHR from residences in Spain (Barcelona) or other locations. These staff
are employed on a UK employment contract but for individual tax purposes are not domiciled
in UK.
October 2015 | 207
7.433 BA's international cabin crew staff are generally covered by CLAs (e.g. Singapore, Japan, Hong
Kong based crew) however some groups (e.g. Cairo) are not.
7.434 BA estimates that 98% of flight crew are members of a union, and approximately 95% of cabin
crew. BA has relationships with a number of unions, including BALPA, Unite Union, and GMB
(General trade and manufacturers sections). The unions have stated that they wish to see a
transnational European works council for IAG, and the terms of this arrangement are currently
being negotiated.
easyJet
7.435 The information presented below draws on data and information provided in easyJet's 2014
annual report, a presentation on 5 June 2014 on employment issues to High-Level Conference
2015 "A Social Agenda for Transport", and information provided to Steer Davies Gleave during
a telephone call with easyJet.
7.436 With two exceptions, all of easyJet’s flight crew and cabin crew are engaged on permanent
contracts directly with the airline. These two exceptions are as follows:
A number of trainee pilots (approximately 100) are engaged through agencies on fixed-
term contracts for cadetship-type schemes; and
A small number of cabin crew are employed on temporary or seasonal contracts: most of
whom are then offered permanent employment.
7.437 No flight crew or cabin crew are self-employed. easyJet outsource ground-handling activities in
most airports apart from a number of Spanish airports, and their contact centre. There are a
number of airports in Spain, however, where easyJet have a self-handling licence. easyJet
engages some personnel through temporary agencies, primarily for IT support activities and
some management and administrative activities.
7.438 Whilst the ultimate decision making is in the UK (principal place of business), employees are
employed on local contracts in the Member State where they are employed, and subject to
the employment law and social security entitlements of the country where they are employed.
easyJet considers that its practice of employing staff under the national jurisdiction of the
Member State where they are based is a legal, ethical decision that also helps to present their
brand as an “EU airline” (rather than a British airline).
7.439 Collective Labour Agreements (CLAs) are in place for each country in which easyJet has staff,
for all staff types. The range of different CLAs for staff based in different Member States is due
to the different markets and national legislation that the staff are employed under.
7.440 easyJet is aware of the concerns of social partners but considers many of the issues would be
resolved by more rigid deployment of current legislation, rather than introducing additional
legislation which may further complicate the situation. France was cited as an example of a MS
where employment practices are challenged by the authorities and fines levied by court
judgements, whereas similar practices in other MS are not challenged, resulting in an
inconsistent application of the rules.
FedEx
7.441 The information included in this case study was provided by FedEx and gathered from
publically available sources.
October 2015 | 208
7.442 FedEx is a US-based airline with a small number of pilots based in CGN since 2011. The terms
and conditions of employment for FXE pilots are governed by a CLA between FXE and ALPA (in
the US and Canada), the employment terms and conditions of which are the same regardless
of the operational base to which the pilots are assigned. The CGN pilots are assigned to the
CGN operational base but do not regularly start or end their revenue flying for FXE in CDG or
CGN.
7.443 All FXE flights (including those conducted in Europe by FXE pilots assigned to the CGN base)
are dispatched and controlled from the FXE Global Operations Control Centre, located in
MEM. FXE implements the CGN arrangement in accordance with the Social Security
Agreement between the US and Germany, which allows for a US employee assigned by a US
employer to perform work for the employer in Germany, and who continues to be covered by
the US social security system during the assignment, to be exempt from participating in the
German social security system. This is on the agreement that this assignment is no longer than
five years in duration.
7.444 FXE’s interpretation of the home base rule is that it only applies if the pilot, who is a citizen of
an EU-member country, has a home base in the EU-member country where the pilot resides
(which itself is a different country than the pilot’s country of citizenship). They also understand
that this regulation does not apply if the pilot does not regularly begin revenue flying for his
airline in the country of his residence. FXE pilots assigned to the CGN base do not normally
begin revenue operations for FXE in CGN. As such, FXE understand that Regulation 465/2012 is
not applicable to the FXE pilots assigned to the CGN base.
Finnair
7.445 This case study has been developed using information provided by SLSY (the Finnish cabin
crew union) and by Finnair in their questionnaire responses, and Finnair's publically available
2014 Annual Report. Finnair did not respond to requests for a telephone interview to discuss
the information provided by SLSY, but provided written comments on the case study which
have been reflected.
7.446 Finnair has undergone challenging changes in recent years in order to improve its cost-
effectiveness and competitiveness. These have included negotiating new CLAs with both flight
and cabin crew, and the decision to outsource some cabin crew activities to Asia, where a
significant proportion of its operation is based (via a Norwegian employment agency).
7.447 According to the Finnish Cabin Crew Union SLSY, Finnair has hired all new cabin crew in the
past 7 years in either Spain or Asia, either directly or through agencies and all on local
employment contracts and conditions. Whilst there is a business driver for these practices, as
nearly half Finnair’s revenue is from Asia, the cost benefits to the airline are also clear, with
Asian crew engaged via an agency paid approximately half of what Finnish-based cabin crew
receive, according to information provided by SLSY.
7.448 Finnair state that recruitment has been limited due to the modest/negative business results
for several years (Finnair’s full-year operational result in 2014 was a loss of -€36.5 million). In
addition, the size of Finnair’s operated aircraft fleet has decreased in recent years, partially
due to the outsourcing in 2012 of one-third of short haul operations to FLyBe Finland, in which
Finnair had minority ownership at the time.
7.449 Finnair have consulted with employee groups regarding these changes, and the financial need
for cost-reduction is evident. It is also evident that moves by the airline towards outsourcing
October 2015 | 209
cabin crew resulted in a re-opening of negotiations (that had originally halted without
agreement) with the union and the reaching of a cost-savings agreement in return for a two-
year hold on any outsourcing practices.
7.450 SLSY reports that the legality of Finnair’s move to outsource Hong Kong crew operations
completely to OSM Aviation has been disputed by the Hong Kong employees. However, this
was unable to be confirmed beyond the reporting of delays in approval of work permits for
these staff from the Finnish Ministry of Labour.
7.451 Finnair states that it is now entering a new phase and preparing for growth, having completed
its cost-saving and restructuring program in 2014. The airline states that it is currently
recruiting both pilots (60) and cabin personnel (over 100) in Finland, and expects this trend to
continue in the coming years.
Ryanair
7.452 The information presented below draws on data and information provided in Ryanair's annual
reports (2011-2015), information provided to Steer Davies Gleave during a telephone call with
Ryanair, and other publically available information as referenced.
7.453 Ryanair's rapid expansion has provided for a significant number of new jobs as it has grown its
operations across Europe. In 2014, Ryanair employed 9,500 personnel, making extensive use
of agency arrangements for flight and cabin crew to fulfil the employment requirements of the
airline. As a result, there are established links between Ryanair and a number of temporary
work agencies. Agency staff receive the same pay and annual leave as permanent employees,
although some differences in other benefits exist. There is no formal procedure for enabling
temporary agency workers to become permanent employees, but if an employee is willing to
change base, opportunities are usually available.
7.454 Ryanair outsources the majority of their ground-handling functions, except at a small number
of airports. Aircraft operations and IT are not outsourced, however, temporary agency workers
are relied on to fulfil many of these roles.
7.455 Ryanair states that it has separate CLAs with flight and cabin crew at every one of its 72
operational bases. CLAs are negotiated with Ryanair's Employee Representation Committees
(ERCs) which represent groups of employees for pay, working conditions and other elements
of employment. ERCs and CLAs do not cover temporary agency workers. Ryanair has no
dialogue with unions and all engagement is through the ERCs.
7.456 All Ryanair crew in Ireland and continental Europe operate on Irish employment contracts;
some UK-based staff operate under UK employment contracts. The applicability of Irish
employment law and social insurance payments has been challenged by a number of
government agencies. Since the change to the home base rule in 2012, Ryanair pays social
insurance to employees in the country in which they are based. This has caused some
administrative difficulties, particularly where employees live in different countries to their
home base.
7.457 The level of social payments made by Ryanair to employees as a proportion of total
employment costs is low (5% in 2014). Ryanair employees are also eligible for some
productivity-based incentive payments.
October 2015 | 210
Temporary employment agency: CAE Parc Aviation
7.458 This case study has been developed using information provided by CAE Parc Aviation during a
telephone interview and information from the company's website.
7.459 CAE Parc Aviation work with airlines to engage pilots on a permanent or temporary, leasing
arrangement. Their primary function is to match available pilots with available positions,
subject to the requirements of the airline.
7.460 The international nature of pilots’ work causes difficulties in ensuring all pilots are compliant
with taxation and social security regulations. The current state of the regulations can cause a
number of issues for pilots, including paying tax in more than one country and being socially
secured in a different country to the one in which they live.
7.461 Where a temporary, leasing arrangement is in place, these issues can be particularly acute.
Parc Aviation manage these issues on behalf of pilots, but often experience significant delays
and inconsistencies in the responses they receive to their applications for pilots to access
social security in their own country. This means that a pilot may not be socially secured for
over a year from the start of their contract, by which time the contract may have terminated
and they are working elsewhere.
7.462 Parc believe that quicker processing of cases and consistency in application of the regulations
by authorities would improve the current situation. More transparent information on the
regulations would also be welcomed.
October 2015 | 211
8 Conclusions Main findings
8.1 This study has sought to update the European Commission on employment and working
conditions in air transport and airports. The 2012 study covered the situation until 2010, and
there have been a number of developments in the EU air transport industry since then. The
current study was commissioned in order to update and expand upon the previous analysis,
and is based on a revised methodology and increased scope.
8.2 In particular, the study has sought to update on both quantitative and qualitative
developments in the air transport sector. The following has been presented:
an estimate of direct employment and Gross Value Added (GVA) in air transport and
airports in the EU covering the period 2000-2013;
an overview of employment trends, in terms of worker profile, skill level, and occupation,
as well as labour cost developments and an assessment of productivity in the sector;
an estimate of indirect employment generated by activities in the air transport cluster and
other airport-related activities; and
a report on the qualitative developments in employment and working conditions in the air
transport sector.
8.3 The scope of the study has been expanded from the 2012 study, to capture the full extent of
air transport and related industries in the EU. A number of new categories are included,
including manufacturing of aircraft, renting and leasing of aircraft, travel agencies and tour
operators and all ‘airport related activities’ (i.e. all activities undertaken within the perimeter
of each airport, not only airport operation and handling activities).
8.4 This update has collected evidence that is in line with many of the observations in the 2012
study and further supports its conclusions. Passengers have benefitted significantly from the
implementation of the single market, with a wider choice of air services and lower fares.
However, these benefits have been linked to a more competitive environment, and EU air
carriers and airports have had to make significant changes to adapt to increased competition.
In order to compete effectively, organisations have required greater flexibility and improved
cost-effectiveness. To do this, they have changed some aspects of their business models to
reduce costs, including reducing staffing requirements, and have made substantial
productivity increases.
8.5 These changes can be observed in the estimates of employment in air transport and in
airports. Over 2000-2013, employment levels have stagnated or declined (at a compound
average rate of -0.6% p.a.) in the context of significantly increased traffic (at a compound
average rate of +3.0% p.a.). This is evidence of productivity increases but also broader trends
in EU air transport for shorter flights and more passengers per aircraft, particularly relating to
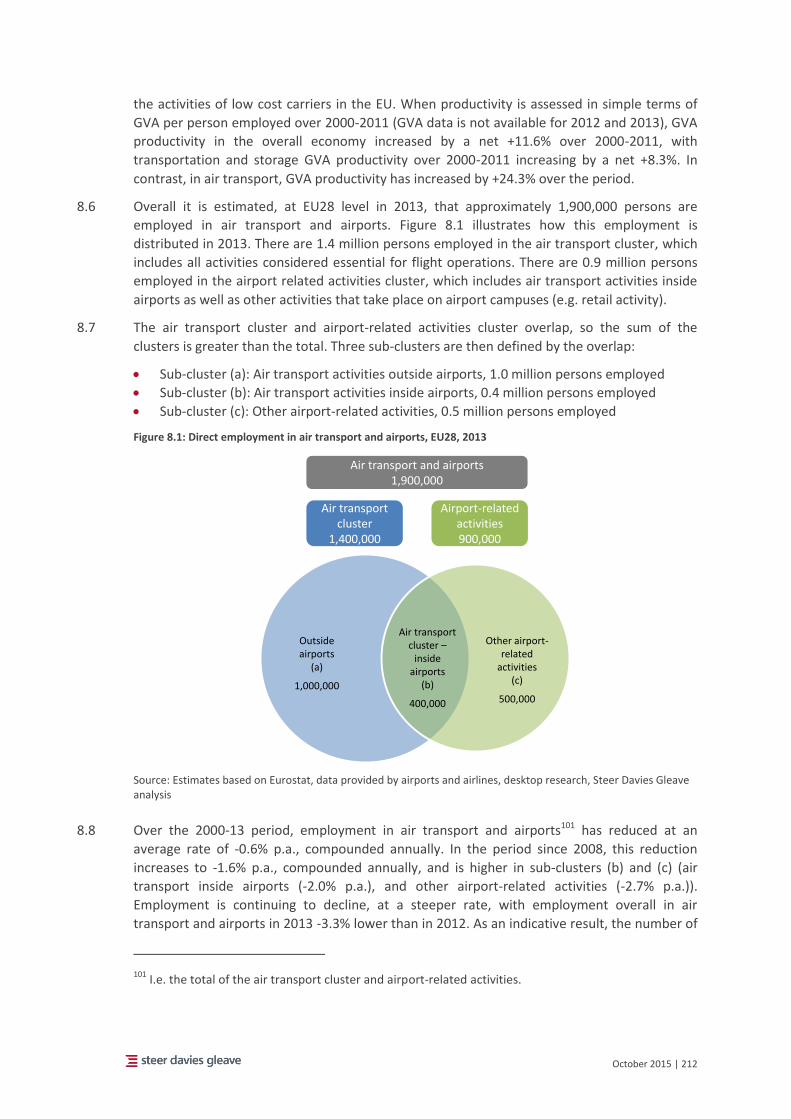
October 2015 | 212
the activities of low cost carriers in the EU. When productivity is assessed in simple terms of
GVA per person employed over 2000-2011 (GVA data is not available for 2012 and 2013), GVA
productivity in the overall economy increased by a net +11.6% over 2000-2011, with
transportation and storage GVA productivity over 2000-2011 increasing by a net +8.3%. In
contrast, in air transport, GVA productivity has increased by +24.3% over the period.
8.6 Overall it is estimated, at EU28 level in 2013, that approximately 1,900,000 persons are
employed in air transport and airports. Figure 8.1 illustrates how this employment is
distributed in 2013. There are 1.4 million persons employed in the air transport cluster, which
includes all activities considered essential for flight operations. There are 0.9 million persons
employed in the airport related activities cluster, which includes air transport activities inside
airports as well as other activities that take place on airport campuses (e.g. retail activity).
8.7 The air transport cluster and airport-related activities cluster overlap, so the sum of the
clusters is greater than the total. Three sub-clusters are then defined by the overlap:
Sub-cluster (a): Air transport activities outside airports, 1.0 million persons employed
Sub-cluster (b): Air transport activities inside airports, 0.4 million persons employed
Sub-cluster (c): Other airport-related activities, 0.5 million persons employed
Figure 8.1: Direct employment in air transport and airports, EU28, 2013
Source: Estimates based on Eurostat, data provided by airports and airlines, desktop research, Steer Davies Gleave analysis
8.8 Over the 2000-13 period, employment in air transport and airports101 has reduced at an
average rate of -0.6% p.a., compounded annually. In the period since 2008, this reduction
increases to -1.6% p.a., compounded annually, and is higher in sub-clusters (b) and (c) (air
transport inside airports (-2.0% p.a.), and other airport-related activities (-2.7% p.a.)).
Employment is continuing to decline, at a steeper rate, with employment overall in air
transport and airports in 2013 -3.3% lower than in 2012. As an indicative result, the number of
101 I.e. the total of the air transport cluster and airport-related activities.
Air transport cluster
1,400,000
Airport-related activities900,000
Outside airports
(a)
1,000,000
Air transport cluster –
inside airports
(b)
400,000
Other airport-related
activities(c)
500,000
Air transport and airports1,900,000
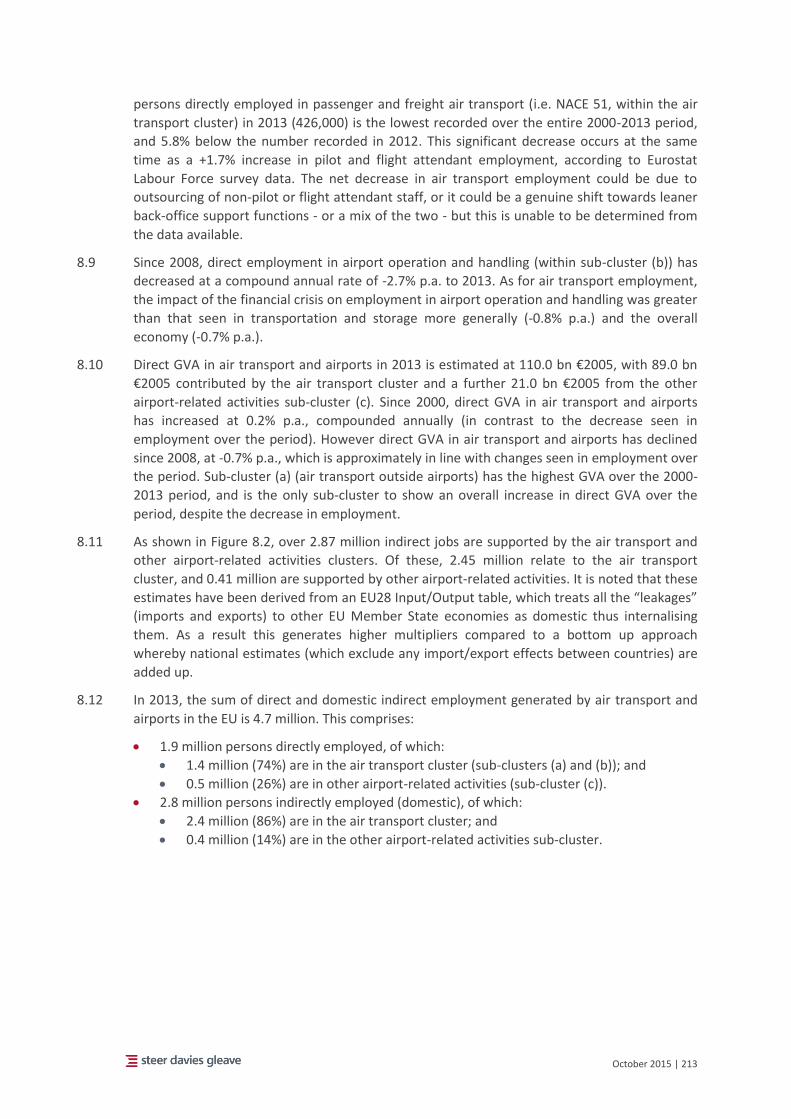
October 2015 | 213
persons directly employed in passenger and freight air transport (i.e. NACE 51, within the air
transport cluster) in 2013 (426,000) is the lowest recorded over the entire 2000-2013 period,
and 5.8% below the number recorded in 2012. This significant decrease occurs at the same
time as a +1.7% increase in pilot and flight attendant employment, according to Eurostat
Labour Force survey data. The net decrease in air transport employment could be due to
outsourcing of non-pilot or flight attendant staff, or it could be a genuine shift towards leaner
back-office support functions - or a mix of the two - but this is unable to be determined from
the data available.
8.9 Since 2008, direct employment in airport operation and handling (within sub-cluster (b)) has
decreased at a compound annual rate of -2.7% p.a. to 2013. As for air transport employment,
the impact of the financial crisis on employment in airport operation and handling was greater
than that seen in transportation and storage more generally (-0.8% p.a.) and the overall
economy (-0.7% p.a.).
8.10 Direct GVA in air transport and airports in 2013 is estimated at 110.0 bn €2005, with 89.0 bn
€2005 contributed by the air transport cluster and a further 21.0 bn €2005 from the other
airport-related activities sub-cluster (c). Since 2000, direct GVA in air transport and airports
has increased at 0.2% p.a., compounded annually (in contrast to the decrease seen in
employment over the period). However direct GVA in air transport and airports has declined
since 2008, at -0.7% p.a., which is approximately in line with changes seen in employment over
the period. Sub-cluster (a) (air transport outside airports) has the highest GVA over the 2000-
2013 period, and is the only sub-cluster to show an overall increase in direct GVA over the
period, despite the decrease in employment.
8.11 As shown in Figure 8.2, over 2.87 million indirect jobs are supported by the air transport and
other airport-related activities clusters. Of these, 2.45 million relate to the air transport
cluster, and 0.41 million are supported by other airport-related activities. It is noted that these
estimates have been derived from an EU28 Input/Output table, which treats all the “leakages”
(imports and exports) to other EU Member State economies as domestic thus internalising
them. As a result this generates higher multipliers compared to a bottom up approach
whereby national estimates (which exclude any import/export effects between countries) are
added up.
8.12 In 2013, the sum of direct and domestic indirect employment generated by air transport and
airports in the EU is 4.7 million. This comprises:
1.9 million persons directly employed, of which:
1.4 million (74%) are in the air transport cluster (sub-clusters (a) and (b)); and
0.5 million (26%) are in other airport-related activities (sub-cluster (c)).
2.8 million persons indirectly employed (domestic), of which:
2.4 million (86%) are in the air transport cluster; and
0.4 million (14%) are in the other airport-related activities sub-cluster.
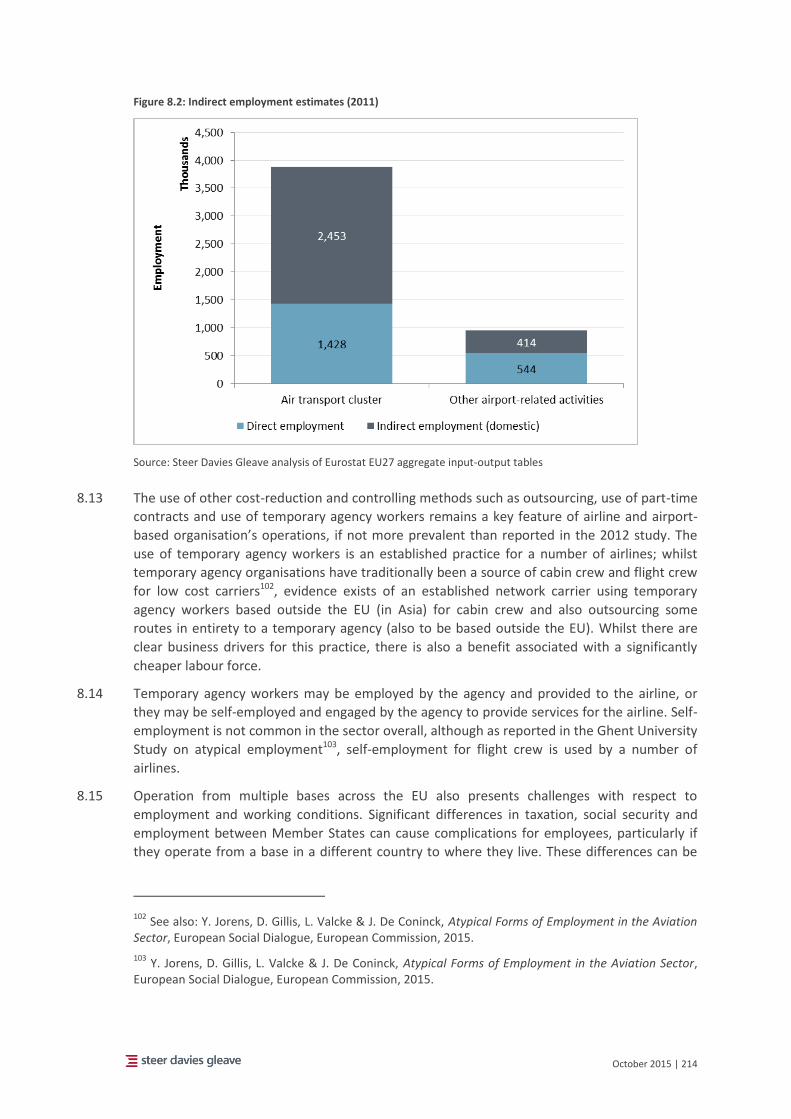
October 2015 | 214
Figure 8.2: Indirect employment estimates (2011)
Source: Steer Davies Gleave analysis of Eurostat EU27 aggregate input-output tables
8.13 The use of other cost-reduction and controlling methods such as outsourcing, use of part-time
contracts and use of temporary agency workers remains a key feature of airline and airport-
based organisation’s operations, if not more prevalent than reported in the 2012 study. The
use of temporary agency workers is an established practice for a number of airlines; whilst
temporary agency organisations have traditionally been a source of cabin crew and flight crew
for low cost carriers102, evidence exists of an established network carrier using temporary
agency workers based outside the EU (in Asia) for cabin crew and also outsourcing some
routes in entirety to a temporary agency (also to be based outside the EU). Whilst there are
clear business drivers for this practice, there is also a benefit associated with a significantly
cheaper labour force.
8.14 Temporary agency workers may be employed by the agency and provided to the airline, or
they may be self-employed and engaged by the agency to provide services for the airline. Self-
employment is not common in the sector overall, although as reported in the Ghent University
Study on atypical employment103, self-employment for flight crew is used by a number of
airlines.
8.15 Operation from multiple bases across the EU also presents challenges with respect to
employment and working conditions. Significant differences in taxation, social security and
employment between Member States can cause complications for employees, particularly if
they operate from a base in a different country to where they live. These differences can be
102 See also: Y. Jorens, D. Gillis, L. Valcke & J. De Coninck, Atypical Forms of Employment in the Aviation
Sector, European Social Dialogue, European Commission, 2015.
103 Y. Jorens, D. Gillis, L. Valcke & J. De Coninck, Atypical Forms of Employment in the Aviation Sector,
European Social Dialogue, European Commission, 2015.
October 2015 | 215
especially difficult for temporary agency workers to negotiate as often resolution to any
uncertain circumstances is not made until after the fixed-term contract is over. Ensuring that
the correct tax and social security arrangements are applied was noted as a key challenge
relating to the engagement of temporary agency workers as for each employee.
8.16 Persons employed by the same company but employed under different MS jurisdictions and
conditions between operational bases can cause significant problems. Employees are generally
aware if their wages and labour conditions are worse than colleagues, and this can lead to
tensions and, as reported by one temporary agency, employees not willing to work in certain
locations.
8.17 In some cases where organisations have not been able to outsource or use temporary
agencies (either through preference or due to union and other social pressures), subsidiaries
have been created, or separate employee groups that are hired under different, less generous
employment terms and conditions than their colleagues.
8.18 Levels of union membership in the air transport sector have reduced, particularly at airlines,
where low cost carriers and other newer market entrants have much lower union
representation than the network carriers, which report high levels of unionisation, particularly
amongst flight and cabin crew.
8.19 A clear decline can be seen in the proportion of 15-29 year olds employed, indicating a
stagnation or reduction in employment opportunities in the air transport sector for this group.
It should also be noted that this age group would also be most impacted by changes in
employment and working conditions, as those entering the workforce for the first time are
most likely to be engaged under some of the newer employment arrangements seen in the
sector. The proportion of employees engaged under the newer employment arrangements in
the sector will therefore continue to increase as others enter the industry. There have been
positive developments with respect to the development of skills and expertise, however, with
one airline working with two temporary agencies to provide graduating pilots with 12 month
cadetships, through which the pilots gain experience as type-rated first officers and receive a
salary. At the end of the cadetships all pilots on the scheme are eligible to apply for a
permanent position at the airline.
Recommendations
Data collection and stakeholder engagement
8.20 It is understood that the Commission intends to replicate the quantitative analysis in future
updates. The suggestions regarding these updates are as follows:
Direct employment (air transport cluster): Eurostat/LFS/SBS data is updated annually and
so by applying similar (or updated) methodologies to determine the in-scope data, this
would be possible to undertake each year.
Direct employment (other airport activities cluster): as discussed further below, making a
more limited data request of airports for employment in these activities is suggested.
GVA: it is noted that the methodology for calculating GVA has been revised, and there are
a number of States that have not yet begun providing GVA in line with the updated
methodology. There may be benefits therefore until waiting until all MS are providing
data in the required format.
October 2015 | 216
Indirect employment: Input Output tables are published once every three years. The next
EU 28 Input Output table is anticipated this year (2015), so it may be worth updating the
indirect employment estimate to reflect the latest data, and then again every three years.
8.21 The use of the methodology proposed by the Commission to present employment and GVA
data in line with internationally-used classifications of economic activity and drawing on
publically available data held by Eurostat, EUROFOUND, SILC and other sources was
supported. This provided a clear structure for the groupings of activities, and for those
activities data was available for the relevant in-scope portion, this data was an excellent
source for the study. The significant challenge for the study was the availability of data for
employment activities at airports that formed a very small in-scope portion of a larger activity
for which data was publically available. The proposed methodology for collecting this data
relied heavily on data provided by airports themselves, not only for persons employed by the
airport organisation but also covering all persons employed on the airport campus. Whilst the
significant proportion of airports consulted as part of the study responded positively, many of
them in practice do not have employment data readily available, particularly to the extent of
the detailed request which covered a large number of activities over a 12 year timeline. As a
result only a small number of airports were able to provide the data in the form requested,
although many others provided as much as they were able, either partial data or data in
alternative forms (such as other airport reports). For future efforts in capturing employment at
airports, therefore, the following are recommended:
requesting one year of data only; and
potentially streamlining the list of activities that employment is requested for, limiting to
key activities rather than every activity possibly undertaken on the campus.
8.22 Whilst in practice, similar barriers to provision of data may be encountered, a request of
reduced scope may appear less of a challenge for stakeholders to address.
8.23 Stakeholders have generally been relied on to provide insight and information on employment
and working conditions in the sector. A number of stakeholders commented that on the length
and depth of the questionnaire provided to them. Whilst response rates to the questionnaire
were good, it may be worth focussing any further studies on a smaller number of themes.
Further investigation
8.24 The link between this study and the Ghent University study on atypical employment at
airlines104 is interesting and complimentary. This Commission study has a broad scope,
covering all activities within the air transport sector, and primarily consulting with employers
(and representatives) and employee representatives. In contrast, the Ghent University study
provides an in-depth look into the situation for pilots employed in the EU, drawing on a large
number of contributions provided by the pilots themselves.
8.25 This highlights the potential for further scope for ‘deep dive’ studies in key areas, perhaps
using the ‘employee’ response method as well as employers. An investigation into temporary
agency practices in aviation across the EU may be interesting, as it is noted that despite
contacting eight temporary work agencies through the course of this study, only two
104 Y. Jorens, D. Gillis, L. Valcke & J. De Coninck, Atypical Forms of Employment in the Aviation Sector,
European Social Dialogue, European Commission, 2015.
October 2015 | 217
temporary agencies contributed. It is understood that behaviours and practices of temporary
agencies across the EU differ so it is not applicable to arrive at the same conclusion for all. It
would also be interesting to understand precisely which airlines in the EU are using these
temporary agencies, and how workers are engaged through these agencies. Again, the Ghent
University study provides a good insight into the use of temporary agencies for the
engagement of flight crew.
8.26 Another area of potential further investigation is a review of applicable employment law and
enforcement throughout the EU MS. A number of stakeholders noted the challenges
associated with different enforcement levels of employment law between MS, which enable
some practices in some MS but not others. As noted above, suggestions have been made to
render the social recital (No. 9) in Regulation (EC) 1008/2008 binding, while other stakeholders
have suggested that a stricter enforcement of current legislation may be an appropriate first
step (for example compliance with the 'home base' principle referred to in Regulation
465/2012 on the coordination of social security systems, or a more consistent enforcement of
Brussels I and Rome I Regulations). France was cited as an example of a MS where
employment practices are challenged by the authorities and fines levied by court judgements,
whereas similar practices in other MS are not challenged, resulting in an inconsistent
application of the rules.
8.27 With respect to the social partners' proposal to amend the Principal Place of Business' (PPB)
definition (Article 2(26) of the Regulation (EC) 1008/2008) and other proposals tabled by the
members of the European Sectorial Social Dialogue Committee for Civil Aviation, the
Commission has conducted discussions with national experts in civil aviation, some of whom
are members of a sub-group to the Expert Group on application of the legislation on access for
Community air carriers to intra-Community air routes, dedicated to social matters in civil
aviation.


October 2015 | 219
Appendices
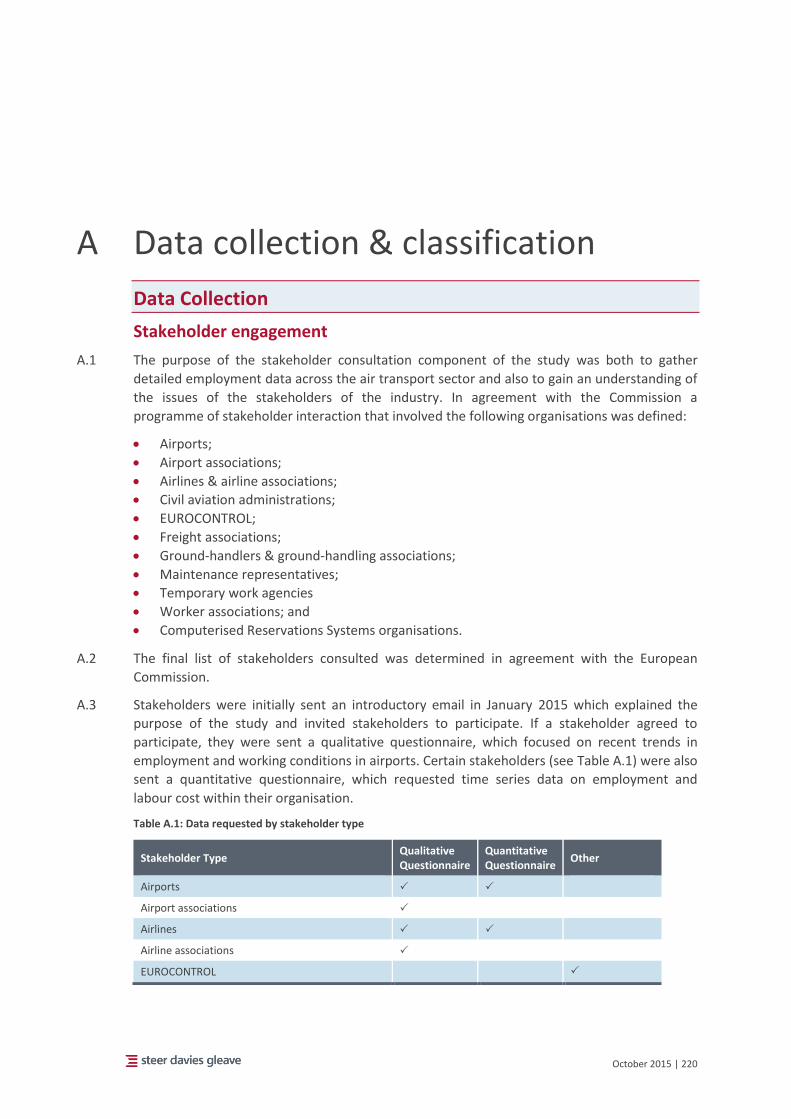
October 2015 | 220
A Data collection & classification
Data Collection
Stakeholder engagement
A.1 The purpose of the stakeholder consultation component of the study was both to gather
detailed employment data across the air transport sector and also to gain an understanding of
the issues of the stakeholders of the industry. In agreement with the Commission a
programme of stakeholder interaction that involved the following organisations was defined:
Airports;
Airport associations;
Airlines & airline associations;
Civil aviation administrations;
EUROCONTROL;
Freight associations;
Ground-handlers & ground-handling associations;
Maintenance representatives;
Temporary work agencies
Worker associations; and
Computerised Reservations Systems organisations.
A.2 The final list of stakeholders consulted was determined in agreement with the European
Commission.
A.3 Stakeholders were initially sent an introductory email in January 2015 which explained the
purpose of the study and invited stakeholders to participate. If a stakeholder agreed to
participate, they were sent a qualitative questionnaire, which focused on recent trends in
employment and working conditions in airports. Certain stakeholders (see Table A.1) were also
sent a quantitative questionnaire, which requested time series data on employment and
labour cost within their organisation.
Table A.1: Data requested by stakeholder type
Stakeholder Type Qualitative Questionnaire
Quantitative Questionnaire
Other
Airports
Airport associations
Airlines
Airline associations
EUROCONTROL
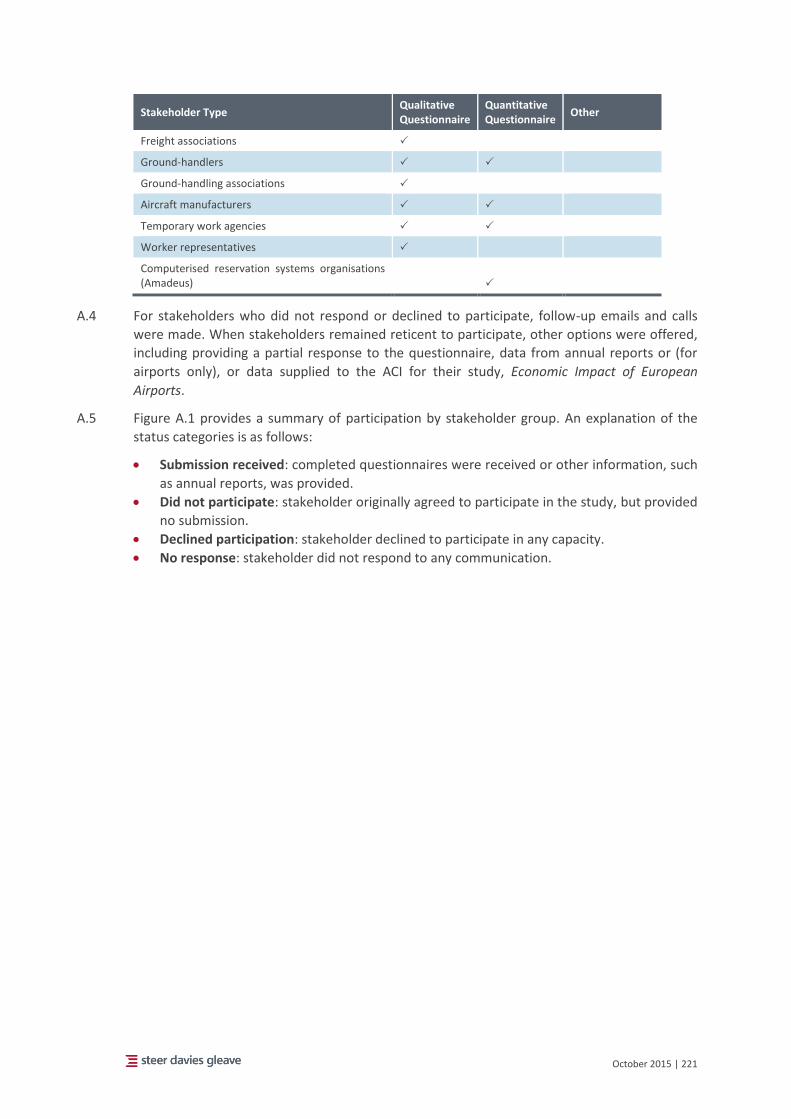
October 2015 | 221
Stakeholder Type Qualitative Questionnaire
Quantitative Questionnaire
Other
Freight associations
Ground-handlers
Ground-handling associations
Aircraft manufacturers
Temporary work agencies
Worker representatives
Computerised reservation systems organisations (Amadeus)
A.4 For stakeholders who did not respond or declined to participate, follow-up emails and calls
were made. When stakeholders remained reticent to participate, other options were offered,
including providing a partial response to the questionnaire, data from annual reports or (for
airports only), or data supplied to the ACI for their study, Economic Impact of European
Airports.
A.5 Figure A.1 provides a summary of participation by stakeholder group. An explanation of the
status categories is as follows:
Submission received: completed questionnaires were received or other information, such
as annual reports, was provided.
Did not participate: stakeholder originally agreed to participate in the study, but provided
no submission.
Declined participation: stakeholder declined to participate in any capacity.
No response: stakeholder did not respond to any communication.
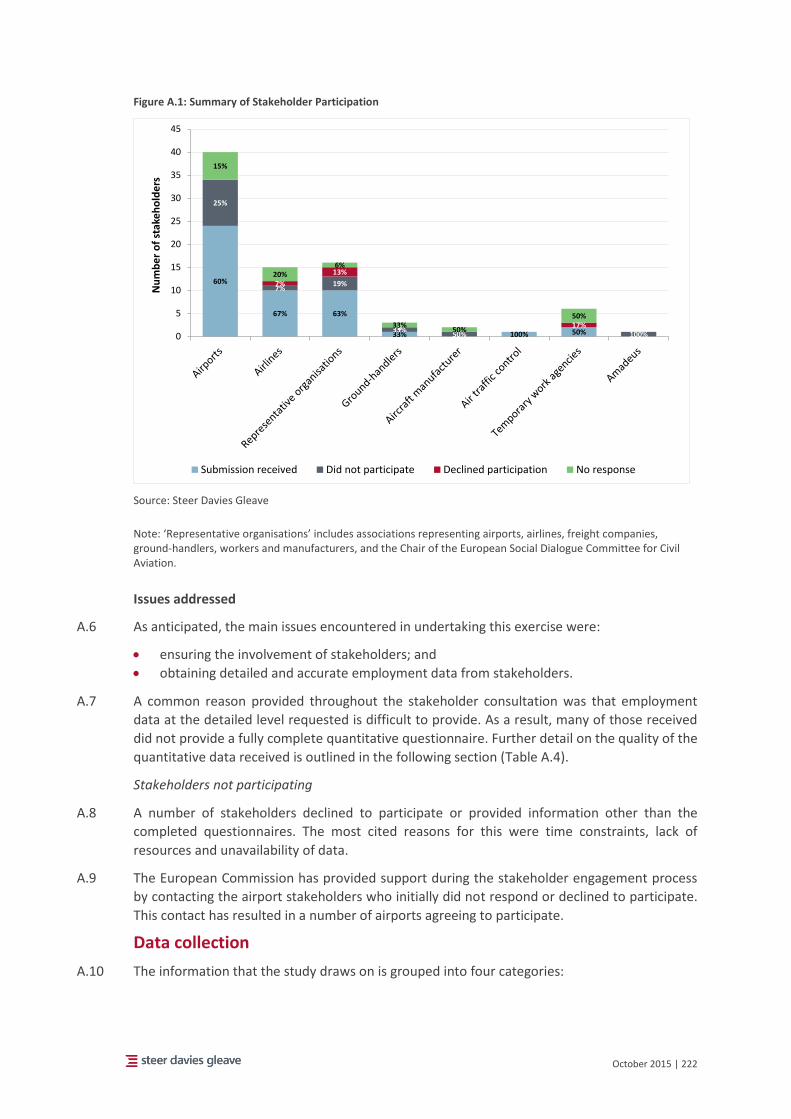
October 2015 | 222
Figure A.1: Summary of Stakeholder Participation
Source: Steer Davies Gleave
Note: ‘Representative organisations’ includes associations representing airports, airlines, freight companies, ground-handlers, workers and manufacturers, and the Chair of the European Social Dialogue Committee for Civil Aviation.
Issues addressed
A.6 As anticipated, the main issues encountered in undertaking this exercise were:
ensuring the involvement of stakeholders; and
obtaining detailed and accurate employment data from stakeholders.
A.7 A common reason provided throughout the stakeholder consultation was that employment
data at the detailed level requested is difficult to provide. As a result, many of those received
did not provide a fully complete quantitative questionnaire. Further detail on the quality of the
quantitative data received is outlined in the following section (Table A.4).
Stakeholders not participating
A.8 A number of stakeholders declined to participate or provided information other than the
completed questionnaires. The most cited reasons for this were time constraints, lack of
resources and unavailability of data.
A.9 The European Commission has provided support during the stakeholder engagement process
by contacting the airport stakeholders who initially did not respond or declined to participate.
This contact has resulted in a number of airports agreeing to participate.
Data collection
A.10 The information that the study draws on is grouped into four categories:
60%
67% 63%
33% 100% 50%
25%
7%19%
33%50% 100%
7%
13%
0 17%
15%
20%6%
33%50%
50%
0
5
10
15
20
25
30
35
40
45
Nu
mb
er
of
stak
eh
old
ers
Submission received Did not participate Declined participation No response
October 2015 | 223
1. Primary data sources: extractions from Eurostat databases;
2. Supplementary data sources: data collected from other sources and desktop research;
3. Survey data: data provided by stakeholders in response to the quantitative surveys; and
4. Other information: publications, annual reports, other publicly available information, as
well as any internal reports and material provided by stakeholders.
A.11 The tables in this section provide an outline of the quantitative data it was aimed to collect for
the study, its sources and status. The data status is indicated in the tables using the following
key:
MC: Of the stakeholders providing this data, data was mostly complete
PC: Of the stakeholders providing this data, data was partially complete
VLD: Of the stakeholders providing this data, very little data received
ALT: Stakeholders provided alternative data
ND: Did not receive any data from stakeholders
PUB: Collected from publicly available sources
A.12 The status of responses to the qualitative survey and other engagement with stakeholders
(e.g. interviews) is provided in the section above.
Primary data sources
A.13 Employment, Gross Value Added (GVA) and labour cost data was extracted from the Eurostat
databases indicated in Table A.3 below, based on the widely recognised NACE105 Rev.2 (here
“NACE” unless otherwise specified) classification of economic activities. Eurostat air transport
data on air passengers and freight was also collected.
A.14 NACE data is classified at four levels of increasing detail:
Letter level or Level 1 (L1) – the broadest level e.g. H: Transportation and Storage
Two-digit level or Level 2 (L2) – e.g. 51: Air Transport
Three-digit level or Level 3 (L3) – e.g. 51.2: Freight air transport and space
transport
Four-digit level or Level 4 (L4) – e.g. 51.21: Freight air transport
A.15 Eurostat data was downloaded from the organisation’s website, with the exception of the
Labour Force Survey data for which detailed extractions were prepared for this study and were
provided via the Commission.
A.16 The extractions for NACE (51) air transport and NACE (52.2) support activities for
transportation included data on age, gender, employment contracts (permanent/temporary),
working arrangements (full-time/part-time, typical/atypical) and skill level of persons
employed.
105 Nomenclature statistique des activités économiques dans la Communauté européenne (NACE): a
European industry standard system for the statistical classification of economic activities.
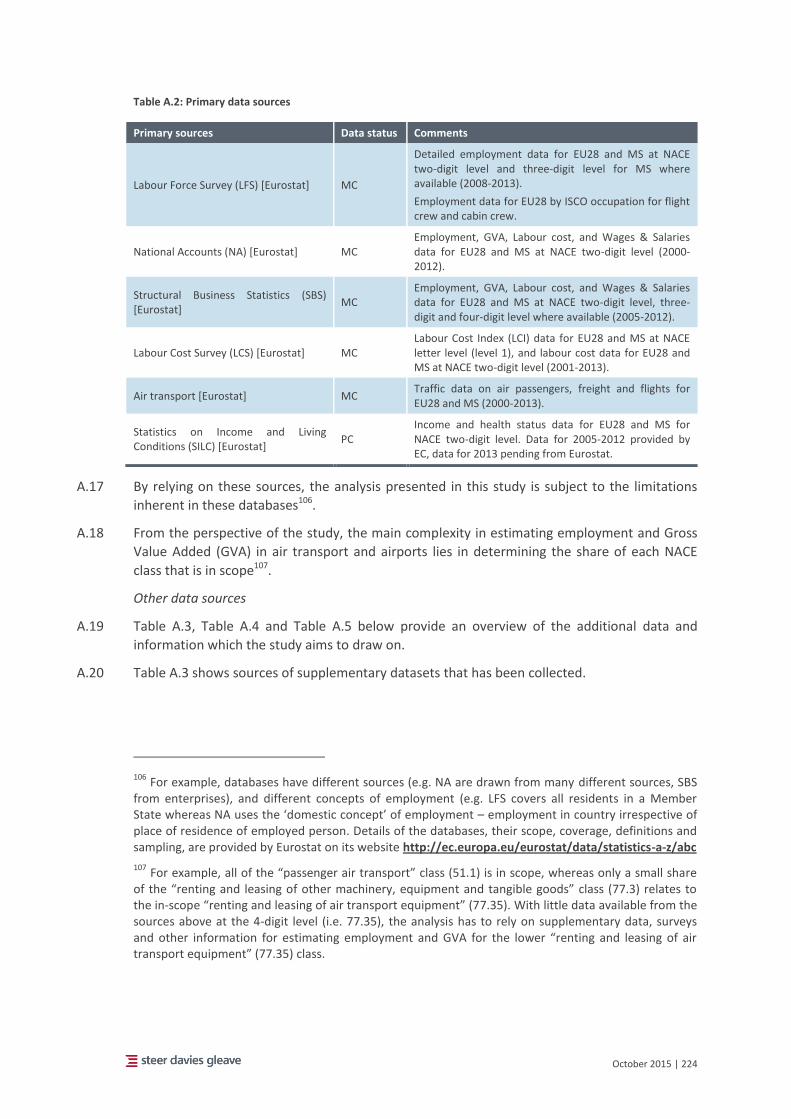
October 2015 | 224
Table A.2: Primary data sources
A.17 By relying on these sources, the analysis presented in this study is subject to the limitations
inherent in these databases106.
A.18 From the perspective of the study, the main complexity in estimating employment and Gross
Value Added (GVA) in air transport and airports lies in determining the share of each NACE
class that is in scope107.
Other data sources
A.19 Table A.3, Table A.4 and Table A.5 below provide an overview of the additional data and
information which the study aims to draw on.
A.20 Table A.3 shows sources of supplementary datasets that has been collected.
106 For example, databases have different sources (e.g. NA are drawn from many different sources, SBS
from enterprises), and different concepts of employment (e.g. LFS covers all residents in a Member State whereas NA uses the ‘domestic concept’ of employment – employment in country irrespective of place of residence of employed person. Details of the databases, their scope, coverage, definitions and sampling, are provided by Eurostat on its website http://ec.europa.eu/eurostat/data/statistics-a-z/abc
107 For example, all of the “passenger air transport” class (51.1) is in scope, whereas only a small share
of the “renting and leasing of other machinery, equipment and tangible goods” class (77.3) relates to the in-scope “renting and leasing of air transport equipment” (77.35). With little data available from the sources above at the 4-digit level (i.e. 77.35), the analysis has to rely on supplementary data, surveys and other information for estimating employment and GVA for the lower “renting and leasing of air transport equipment” (77.35) class.
Primary sources Data status Comments
Labour Force Survey (LFS) [Eurostat] MC
Detailed employment data for EU28 and MS at NACE two-digit level and three-digit level for MS where available (2008-2013).
Employment data for EU28 by ISCO occupation for flight crew and cabin crew.
National Accounts (NA) [Eurostat] MC Employment, GVA, Labour cost, and Wages & Salaries data for EU28 and MS at NACE two-digit level (2000-2012).
Structural Business Statistics (SBS) [Eurostat]
MC Employment, GVA, Labour cost, and Wages & Salaries data for EU28 and MS at NACE two-digit level, three-digit and four-digit level where available (2005-2012).
Labour Cost Survey (LCS) [Eurostat] MC Labour Cost Index (LCI) data for EU28 and MS at NACE letter level (level 1), and labour cost data for EU28 and MS at NACE two-digit level (2001-2013).
Air transport [Eurostat] MC Traffic data on air passengers, freight and flights for EU28 and MS (2000-2013).
Statistics on Income and Living Conditions (SILC) [Eurostat]
PC Income and health status data for EU28 and MS for NACE two-digit level. Data for 2005-2012 provided by EC, data for 2013 pending from Eurostat.
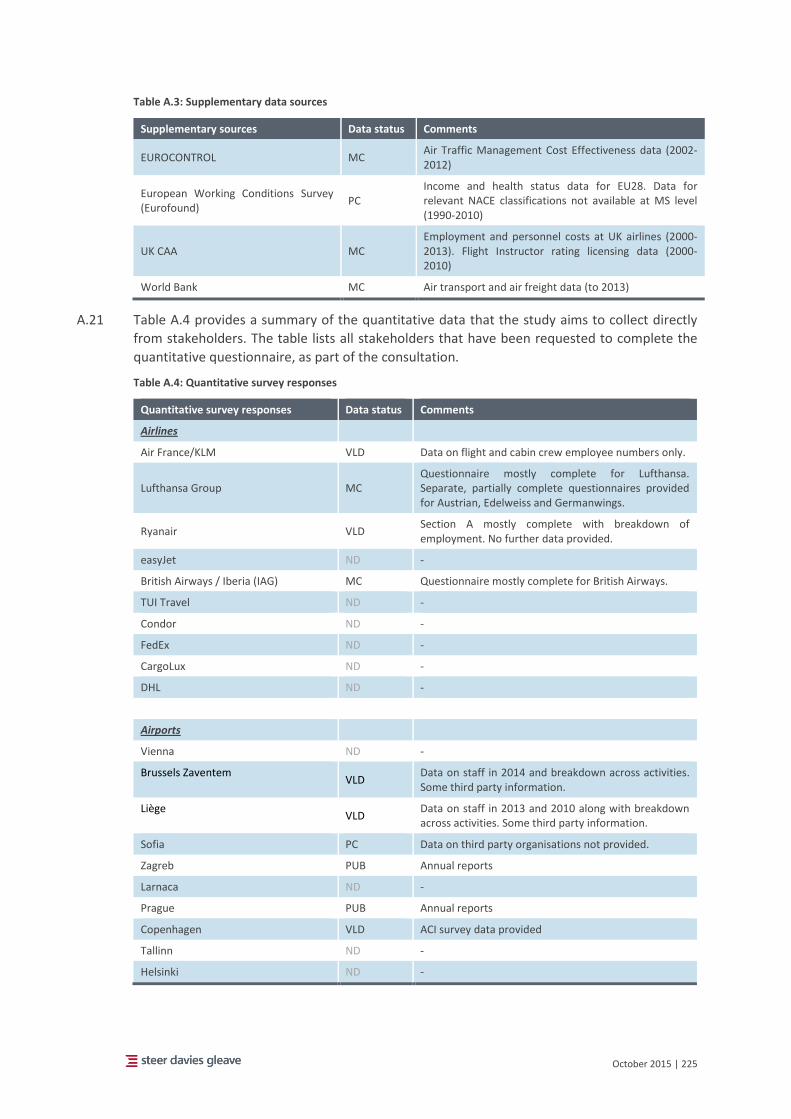
October 2015 | 225
Table A.3: Supplementary data sources
Supplementary sources Data status Comments
EUROCONTROL MC Air Traffic Management Cost Effectiveness data (2002-2012)
European Working Conditions Survey (Eurofound)
PC Income and health status data for EU28. Data for relevant NACE classifications not available at MS level (1990-2010)
UK CAA MC Employment and personnel costs at UK airlines (2000-2013). Flight Instructor rating licensing data (2000-2010)
World Bank MC Air transport and air freight data (to 2013)
A.21 Table A.4 provides a summary of the quantitative data that the study aims to collect directly
from stakeholders. The table lists all stakeholders that have been requested to complete the
quantitative questionnaire, as part of the consultation.
Table A.4: Quantitative survey responses
Quantitative survey responses Data status Comments
Airlines
Air France/KLM VLD Data on flight and cabin crew employee numbers only.
Lufthansa Group MC Questionnaire mostly complete for Lufthansa. Separate, partially complete questionnaires provided for Austrian, Edelweiss and Germanwings.
Ryanair VLD Section A mostly complete with breakdown of employment. No further data provided.
easyJet ND -
British Airways / Iberia (IAG) MC Questionnaire mostly complete for British Airways.
TUI Travel ND -
Condor ND -
FedEx ND -
CargoLux ND -
DHL ND -
Airports
Vienna ND -
Brussels Zaventem VLD
Data on staff in 2014 and breakdown across activities. Some third party information.
Liège VLD
Data on staff in 2013 and 2010 along with breakdown across activities. Some third party information.
Sofia PC Data on third party organisations not provided.
Zagreb PUB Annual reports
Larnaca ND -
Prague PUB Annual reports
Copenhagen VLD ACI survey data provided
Tallinn ND -
Helsinki ND -
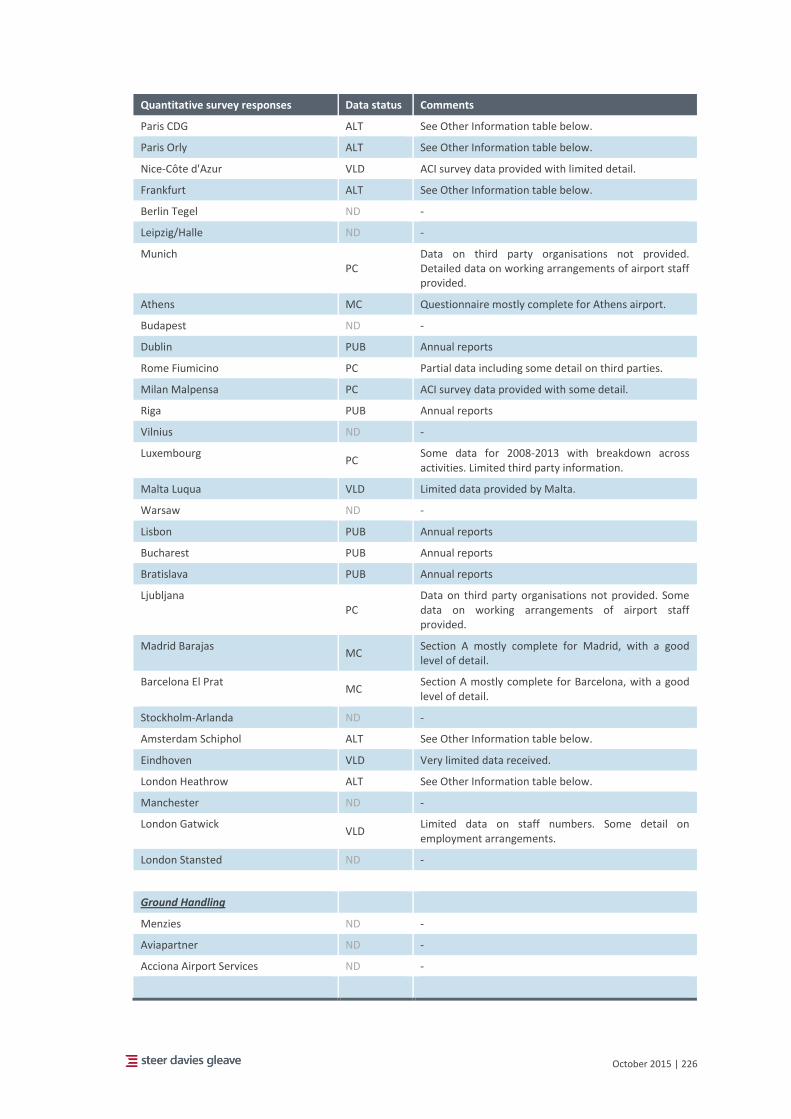
October 2015 | 226
Quantitative survey responses Data status Comments
Paris CDG ALT See Other Information table below.
Paris Orly ALT See Other Information table below.
Nice-Côte d'Azur VLD ACI survey data provided with limited detail.
Frankfurt ALT See Other Information table below.
Berlin Tegel ND -
Leipzig/Halle ND -
Munich PC
Data on third party organisations not provided. Detailed data on working arrangements of airport staff provided.
Athens MC Questionnaire mostly complete for Athens airport.
Budapest ND -
Dublin PUB Annual reports
Rome Fiumicino PC Partial data including some detail on third parties.
Milan Malpensa PC ACI survey data provided with some detail.
Riga PUB Annual reports
Vilnius ND -
Luxembourg PC
Some data for 2008-2013 with breakdown across activities. Limited third party information.
Malta Luqua VLD Limited data provided by Malta.
Warsaw ND -
Lisbon PUB Annual reports
Bucharest PUB Annual reports
Bratislava PUB Annual reports
Ljubljana PC
Data on third party organisations not provided. Some data on working arrangements of airport staff provided.
Madrid Barajas MC
Section A mostly complete for Madrid, with a good level of detail.
Barcelona El Prat MC
Section A mostly complete for Barcelona, with a good level of detail.
Stockholm-Arlanda ND -
Amsterdam Schiphol ALT See Other Information table below.
Eindhoven VLD Very limited data received.
London Heathrow ALT See Other Information table below.
Manchester ND -
London Gatwick VLD
Limited data on staff numbers. Some detail on employment arrangements.
London Stansted ND -
Ground Handling
Menzies ND -
Aviapartner ND -
Acciona Airport Services ND -
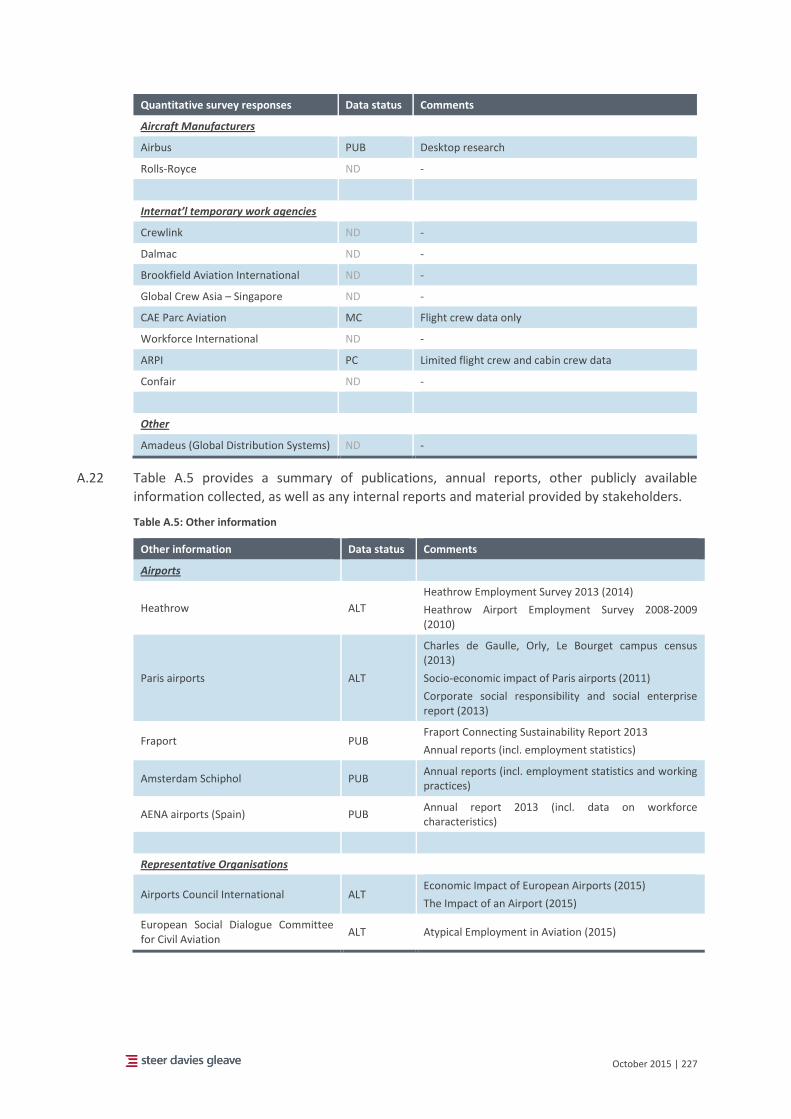
October 2015 | 227
Quantitative survey responses Data status Comments
Aircraft Manufacturers
Airbus PUB Desktop research
Rolls-Royce ND -
Internat’l temporary work agencies
Crewlink ND -
Dalmac ND -
Brookfield Aviation International ND -
Global Crew Asia – Singapore ND -
CAE Parc Aviation MC Flight crew data only
Workforce International ND -
ARPI PC Limited flight crew and cabin crew data
Confair ND -
Other
Amadeus (Global Distribution Systems) ND -
A.22 Table A.5 provides a summary of publications, annual reports, other publicly available
information collected, as well as any internal reports and material provided by stakeholders.
Table A.5: Other information
Other information Data status Comments
Airports
Heathrow ALT
Heathrow Employment Survey 2013 (2014)
Heathrow Airport Employment Survey 2008-2009 (2010)
Paris airports ALT
Charles de Gaulle, Orly, Le Bourget campus census (2013)
Socio-economic impact of Paris airports (2011)
Corporate social responsibility and social enterprise report (2013)
Fraport PUB Fraport Connecting Sustainability Report 2013
Annual reports (incl. employment statistics)
Amsterdam Schiphol PUB Annual reports (incl. employment statistics and working practices)
AENA airports (Spain) PUB Annual report 2013 (incl. data on workforce characteristics)
Representative Organisations
Airports Council International ALT Economic Impact of European Airports (2015)
The Impact of an Airport (2015)
European Social Dialogue Committee for Civil Aviation
ALT Atypical Employment in Aviation (2015)
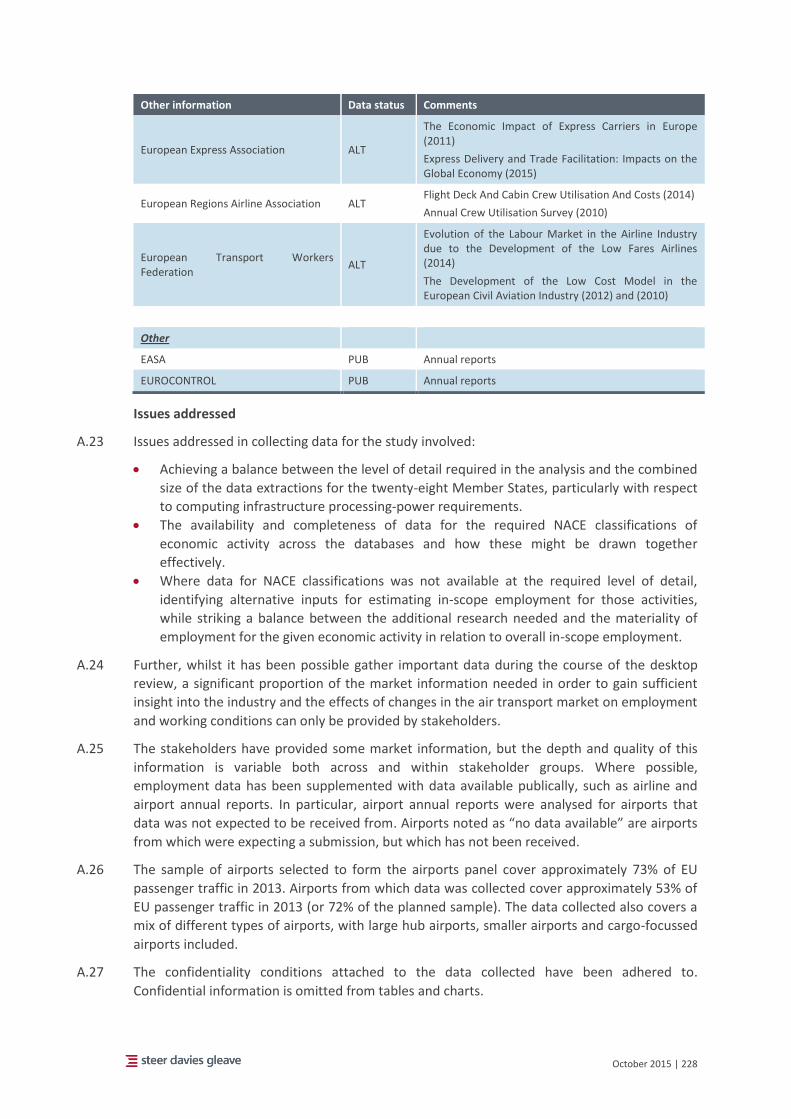
October 2015 | 228
Other information Data status Comments
European Express Association ALT
The Economic Impact of Express Carriers in Europe (2011)
Express Delivery and Trade Facilitation: Impacts on the Global Economy (2015)
European Regions Airline Association ALT Flight Deck And Cabin Crew Utilisation And Costs (2014)
Annual Crew Utilisation Survey (2010)
European Transport Workers Federation
ALT
Evolution of the Labour Market in the Airline Industry due to the Development of the Low Fares Airlines (2014)
The Development of the Low Cost Model in the European Civil Aviation Industry (2012) and (2010)
Other
EASA PUB Annual reports
EUROCONTROL PUB Annual reports
Issues addressed
A.23 Issues addressed in collecting data for the study involved:
Achieving a balance between the level of detail required in the analysis and the combined
size of the data extractions for the twenty-eight Member States, particularly with respect
to computing infrastructure processing-power requirements.
The availability and completeness of data for the required NACE classifications of
economic activity across the databases and how these might be drawn together
effectively.
Where data for NACE classifications was not available at the required level of detail,
identifying alternative inputs for estimating in-scope employment for those activities,
while striking a balance between the additional research needed and the materiality of
employment for the given economic activity in relation to overall in-scope employment.
A.24 Further, whilst it has been possible gather important data during the course of the desktop
review, a significant proportion of the market information needed in order to gain sufficient
insight into the industry and the effects of changes in the air transport market on employment
and working conditions can only be provided by stakeholders.
A.25 The stakeholders have provided some market information, but the depth and quality of this
information is variable both across and within stakeholder groups. Where possible,
employment data has been supplemented with data available publically, such as airline and
airport annual reports. In particular, airport annual reports were analysed for airports that
data was not expected to be received from. Airports noted as “no data available” are airports
from which were expecting a submission, but which has not been received.
A.26 The sample of airports selected to form the airports panel cover approximately 73% of EU
passenger traffic in 2013. Airports from which data was collected cover approximately 53% of
EU passenger traffic in 2013 (or 72% of the planned sample). The data collected also covers a
mix of different types of airports, with large hub airports, smaller airports and cargo-focussed
airports included.
A.27 The confidentiality conditions attached to the data collected have been adhered to.
Confidential information is omitted from tables and charts.
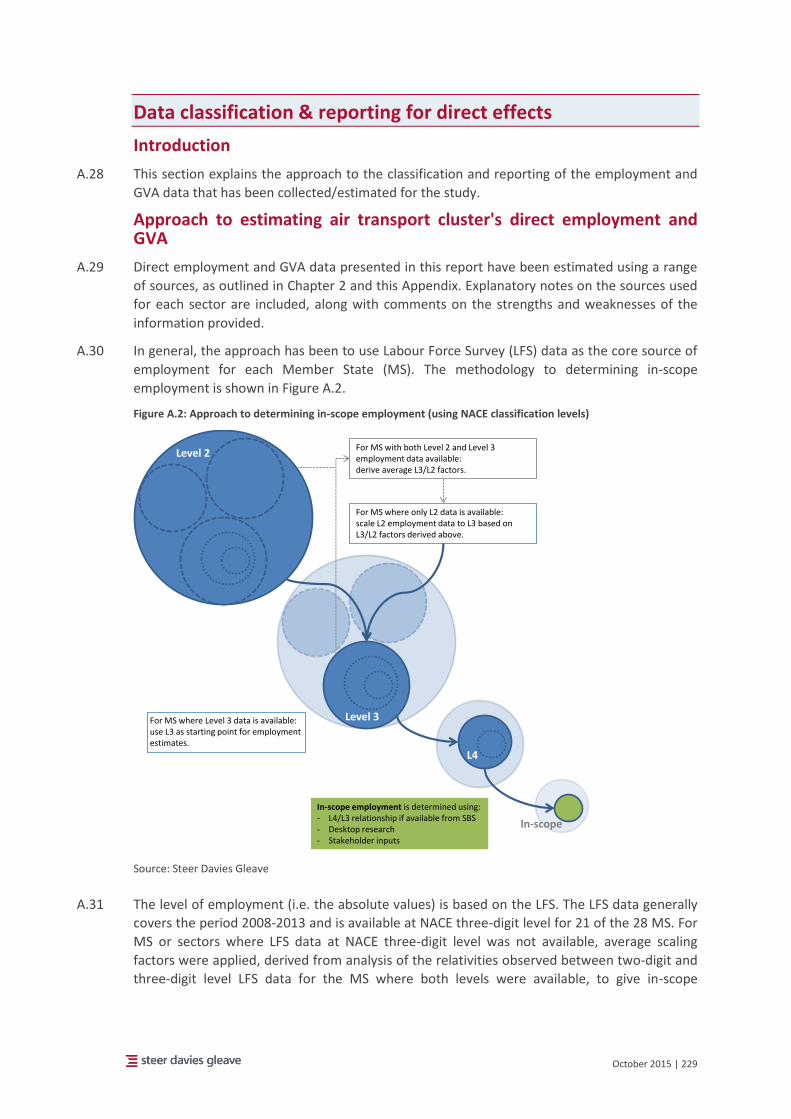
October 2015 | 229
Data classification & reporting for direct effects
Introduction
A.28 This section explains the approach to the classification and reporting of the employment and
GVA data that has been collected/estimated for the study.
Approach to estimating air transport cluster's direct employment and GVA
A.29 Direct employment and GVA data presented in this report have been estimated using a range
of sources, as outlined in Chapter 2 and this Appendix. Explanatory notes on the sources used
for each sector are included, along with comments on the strengths and weaknesses of the
information provided.
A.30 In general, the approach has been to use Labour Force Survey (LFS) data as the core source of
employment for each Member State (MS). The methodology to determining in-scope
employment is shown in Figure A.2.
Figure A.2: Approach to determining in-scope employment (using NACE classification levels)
Source: Steer Davies Gleave
A.31 The level of employment (i.e. the absolute values) is based on the LFS. The LFS data generally
covers the period 2008-2013 and is available at NACE three-digit level for 21 of the 28 MS. For
MS or sectors where LFS data at NACE three-digit level was not available, average scaling
factors were applied, derived from analysis of the relativities observed between two-digit and
three-digit level LFS data for the MS where both levels were available, to give in-scope
Level 2
Level 3
L4
In-scope
For MS where only L2 data is available:scale L2 employment data to L3 based on L3/L2 factors derived above.
For MS with both Level 2 and Level 3 employment data available:derive average L3/L2 factors.
For MS where Level 3 data is available: use L3 as starting point for employment estimates.
In-scope employment is determined using:- L4/L3 relationship if available from SBS- Desktop research- Stakeholder inputs
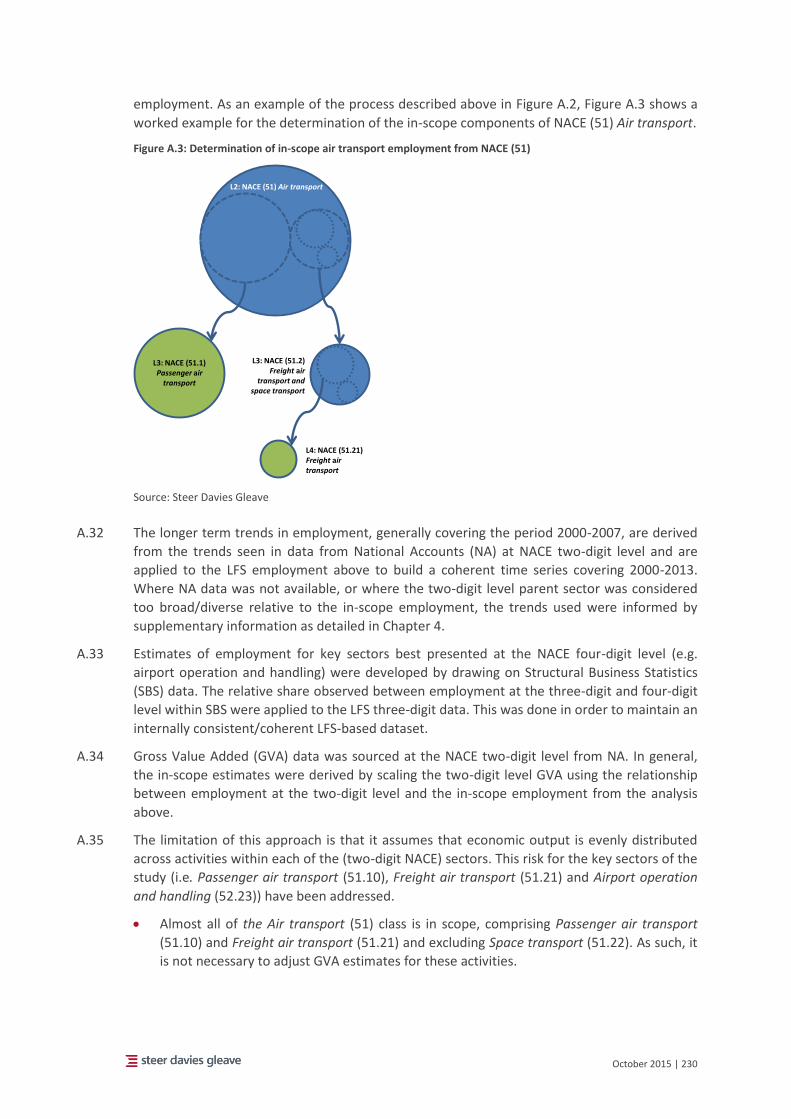
October 2015 | 230
employment. As an example of the process described above in Figure A.2, Figure A.3 shows a
worked example for the determination of the in-scope components of NACE (51) Air transport.
Figure A.3: Determination of in-scope air transport employment from NACE (51)
Source: Steer Davies Gleave
A.32 The longer term trends in employment, generally covering the period 2000-2007, are derived
from the trends seen in data from National Accounts (NA) at NACE two-digit level and are
applied to the LFS employment above to build a coherent time series covering 2000-2013.
Where NA data was not available, or where the two-digit level parent sector was considered
too broad/diverse relative to the in-scope employment, the trends used were informed by
supplementary information as detailed in Chapter 4.
A.33 Estimates of employment for key sectors best presented at the NACE four-digit level (e.g.
airport operation and handling) were developed by drawing on Structural Business Statistics
(SBS) data. The relative share observed between employment at the three-digit and four-digit
level within SBS were applied to the LFS three-digit data. This was done in order to maintain an
internally consistent/coherent LFS-based dataset.
A.34 Gross Value Added (GVA) data was sourced at the NACE two-digit level from NA. In general,
the in-scope estimates were derived by scaling the two-digit level GVA using the relationship
between employment at the two-digit level and the in-scope employment from the analysis
above.
A.35 The limitation of this approach is that it assumes that economic output is evenly distributed
across activities within each of the (two-digit NACE) sectors. This risk for the key sectors of the
study (i.e. Passenger air transport (51.10), Freight air transport (51.21) and Airport operation
and handling (52.23)) have been addressed.
Almost all of the Air transport (51) class is in scope, comprising Passenger air transport
(51.10) and Freight air transport (51.21) and excluding Space transport (51.22). As such, it
is not necessary to adjust GVA estimates for these activities.
L2: NACE (51) Air transport
L3: NACE (51.1) Passenger air
transport
L3: NACE (51.2) Freight air
transport and space transport
L4: NACE (51.21) Freight air transport
October 2015 | 231
Airport operation and handling (52.23) forms only a small proportion of Warehousing and
supporting activities for transportation (52). As such, the two-digit class (52) is not
considered fully representative of the in-scope class (52.23). An adjustment factor is then
applied to the in-scope class to capture the higher value activity here. This adjustment is
based on the relationship between average salaries for the two-digit class and the in-
scope class. Salaries are taken as a proxy for the relative value of the outputs from each
activity.
A.36 It has not been possible to apply similar adjustments for all activities relevant to this study, as
sufficiently disaggregated data for all the four-digit (or potentially narrower) classifications is
not available (e.g. data for retail activities at airports relative to retail activities in the wider
economy).
Employment data classification and reporting
A.37 The quantitative part of the study aims to measure the direct and indirect effects on the
economy and employment of air transport and related industries, including aircraft
manufacturing, air-related tourism (with respect to travel agencies and tour operators), flying
schools, local land transport facilities and catering and hotel activities within airports.
A.38 As set out in the Terms of Reference, all economic activities related to air transport and those
established within airports are included in the calculation of direct employment and value
added (GVA). The methodology has been standardised as far as possible, to enable the
analysis to be easily replicable in future updates, and relies on the widely recognised NACE
Rev.2 classification of economic activities108. The study draws on employment and value added
data from relevant Eurostat databases, detailed in the Data collection section above, as well as
survey data from a panel of airports and other stakeholders.
A.39 Figure A.4 shows the two overlapping clusters of activity that are addressed by this study, in
order to capture the full extent of air transport and related industries in the EU, including the
various components of European airports, and to measure their socioeconomic impact.
108 Nomenclature statistique des activités économiques dans la Communauté européenne. (NACE)
http://ec.europa.eu/eurostat/ramon/nomenclatures/index.cfm?TargetUrl=LST_NOM_DTL&StrNom=NACE_REV2,
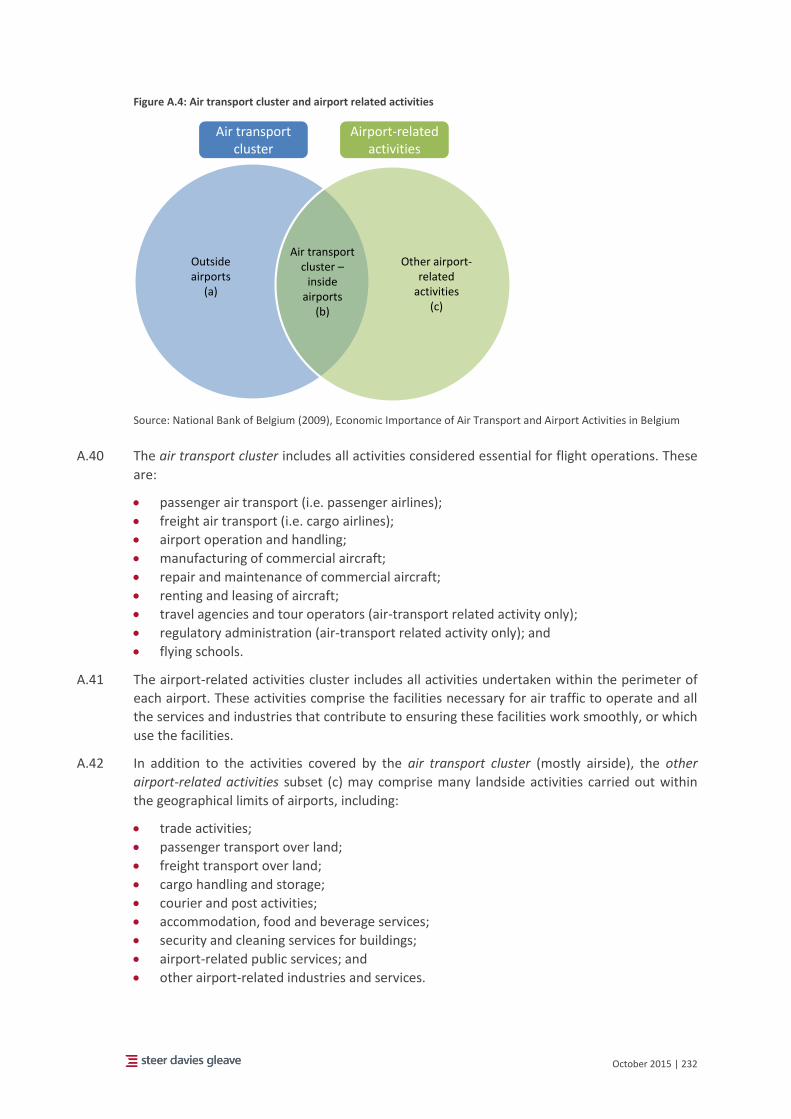
October 2015 | 232
Figure A.4: Air transport cluster and airport related activities
Source: National Bank of Belgium (2009), Economic Importance of Air Transport and Airport Activities in Belgium
A.40 The air transport cluster includes all activities considered essential for flight operations. These
are:
passenger air transport (i.e. passenger airlines);
freight air transport (i.e. cargo airlines);
airport operation and handling;
manufacturing of commercial aircraft;
repair and maintenance of commercial aircraft;
renting and leasing of aircraft;
travel agencies and tour operators (air-transport related activity only);
regulatory administration (air-transport related activity only); and
flying schools.
A.41 The airport-related activities cluster includes all activities undertaken within the perimeter of
each airport. These activities comprise the facilities necessary for air traffic to operate and all
the services and industries that contribute to ensuring these facilities work smoothly, or which
use the facilities.
A.42 In addition to the activities covered by the air transport cluster (mostly airside), the other
airport-related activities subset (c) may comprise many landside activities carried out within
the geographical limits of airports, including:
trade activities;
passenger transport over land;
freight transport over land;
cargo handling and storage;
courier and post activities;
accommodation, food and beverage services;
security and cleaning services for buildings;
airport-related public services; and
other airport-related industries and services.
Air transport cluster
Airport-related activities
Outside airports
(a)
Air transport cluster –
inside airports
(b)
Other airport-related
activities(c)
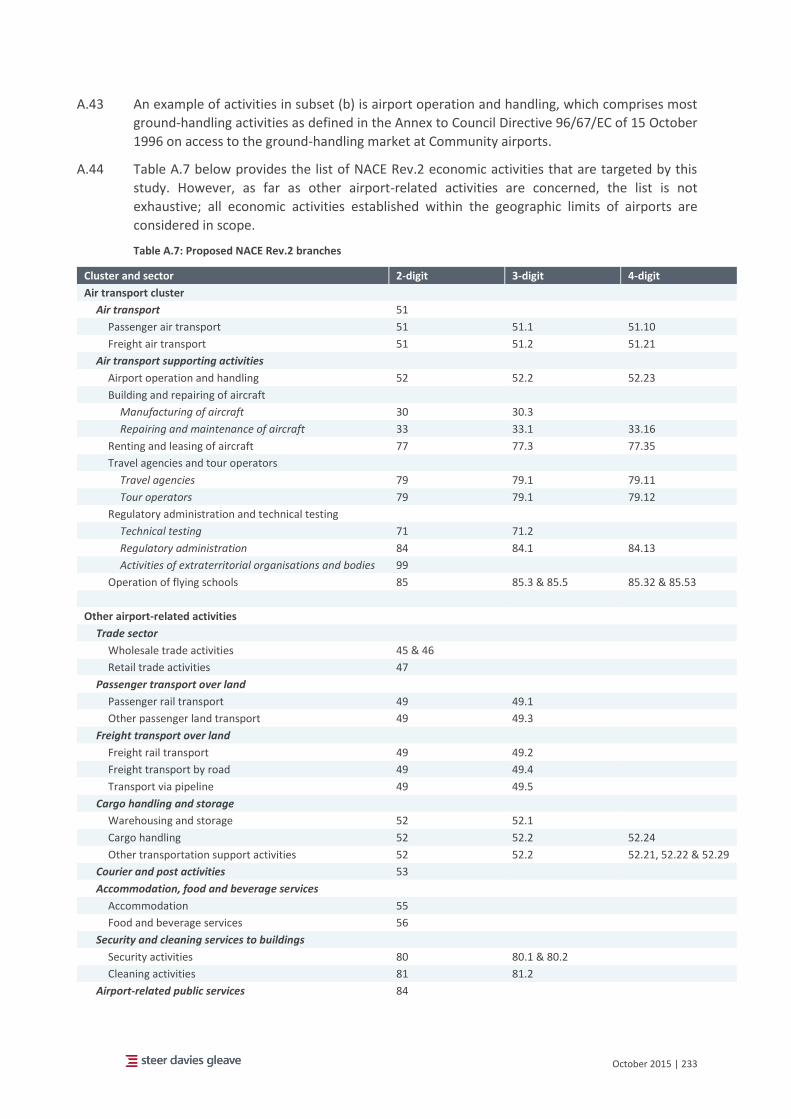
October 2015 | 233
A.43 An example of activities in subset (b) is airport operation and handling, which comprises most
ground-handling activities as defined in the Annex to Council Directive 96/67/EC of 15 October
1996 on access to the ground-handling market at Community airports.
A.44 Table A.7 below provides the list of NACE Rev.2 economic activities that are targeted by this
study. However, as far as other airport-related activities are concerned, the list is not
exhaustive; all economic activities established within the geographic limits of airports are
considered in scope.
Table A.7: Proposed NACE Rev.2 branches
Cluster and sector 2-digit 3-digit 4-digit
Air transport cluster
Air transport 51
Passenger air transport 51 51.1 51.10
Freight air transport 51 51.2 51.21
Air transport supporting activities
Airport operation and handling 52 52.2 52.23
Building and repairing of aircraft
Manufacturing of aircraft 30 30.3
Repairing and maintenance of aircraft 33 33.1 33.16
Renting and leasing of aircraft 77 77.3 77.35
Travel agencies and tour operators
Travel agencies 79 79.1 79.11
Tour operators 79 79.1 79.12
Regulatory administration and technical testing
Technical testing 71 71.2
Regulatory administration 84 84.1 84.13
Activities of extraterritorial organisations and bodies 99
Operation of flying schools 85 85.3 & 85.5 85.32 & 85.53
Other airport-related activities
Trade sector
Wholesale trade activities 45 & 46
Retail trade activities 47
Passenger transport over land
Passenger rail transport 49 49.1
Other passenger land transport 49 49.3
Freight transport over land
Freight rail transport 49 49.2
Freight transport by road 49 49.4
Transport via pipeline 49 49.5
Cargo handling and storage
Warehousing and storage 52 52.1
Cargo handling 52 52.2 52.24
Other transportation support activities 52 52.2 52.21, 52.22 & 52.29
Courier and post activities 53
Accommodation, food and beverage services
Accommodation 55
Food and beverage services 56
Security and cleaning services to buildings
Security activities 80 80.1 & 80.2
Cleaning activities 81 81.2
Airport-related public services 84
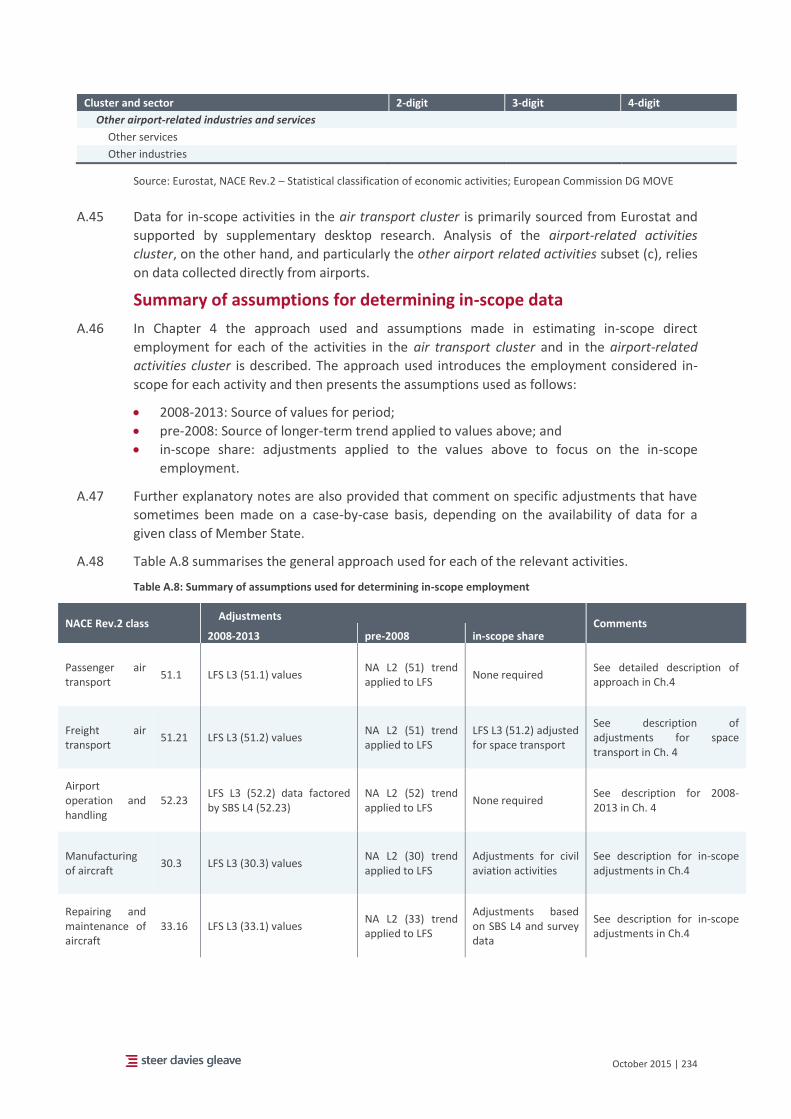
October 2015 | 234
Cluster and sector 2-digit 3-digit 4-digit
Other airport-related industries and services
Other services
Other industries
Source: Eurostat, NACE Rev.2 – Statistical classification of economic activities; European Commission DG MOVE
A.45 Data for in-scope activities in the air transport cluster is primarily sourced from Eurostat and
supported by supplementary desktop research. Analysis of the airport-related activities
cluster, on the other hand, and particularly the other airport related activities subset (c), relies
on data collected directly from airports.
Summary of assumptions for determining in-scope data
A.46 In Chapter 4 the approach used and assumptions made in estimating in-scope direct
employment for each of the activities in the air transport cluster and in the airport-related
activities cluster is described. The approach used introduces the employment considered in-
scope for each activity and then presents the assumptions used as follows:
2008-2013: Source of values for period;
pre-2008: Source of longer-term trend applied to values above; and
in-scope share: adjustments applied to the values above to focus on the in-scope
employment.
A.47 Further explanatory notes are also provided that comment on specific adjustments that have
sometimes been made on a case-by-case basis, depending on the availability of data for a
given class of Member State.
A.48 Table A.8 summarises the general approach used for each of the relevant activities.
Table A.8: Summary of assumptions used for determining in-scope employment
NACE Rev.2 class Adjustments
Comments 2008-2013 pre-2008 in-scope share
Passenger air transport
51.1 LFS L3 (51.1) values NA L2 (51) trend applied to LFS
None required See detailed description of approach in Ch.4
Freight air transport
51.21 LFS L3 (51.2) values NA L2 (51) trend applied to LFS
LFS L3 (51.2) adjusted for space transport
See description of adjustments for space transport in Ch. 4
Airport operation and handling
52.23 LFS L3 (52.2) data factored by SBS L4 (52.23)
NA L2 (52) trend applied to LFS
None required See description for 2008-2013 in Ch. 4
Manufacturing of aircraft
30.3 LFS L3 (30.3) values NA L2 (30) trend applied to LFS
Adjustments for civil aviation activities
See description for in-scope adjustments in Ch.4
Repairing and maintenance of aircraft
33.16 LFS L3 (33.1) values NA L2 (33) trend applied to LFS
Adjustments based on SBS L4 and survey data
See description for in-scope adjustments in Ch.4
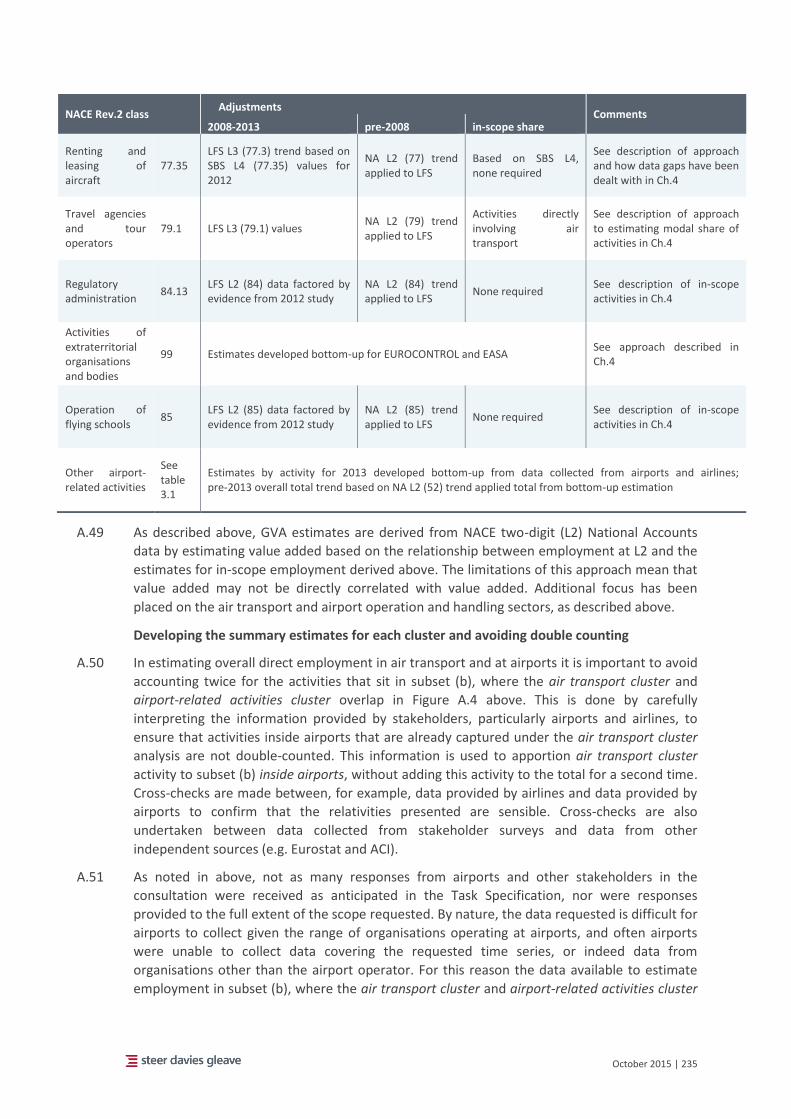
October 2015 | 235
NACE Rev.2 class Adjustments
Comments 2008-2013 pre-2008 in-scope share
Renting and leasing of aircraft
77.35 LFS L3 (77.3) trend based on SBS L4 (77.35) values for 2012
NA L2 (77) trend applied to LFS
Based on SBS L4, none required
See description of approach and how data gaps have been dealt with in Ch.4
Travel agencies and tour operators
79.1 LFS L3 (79.1) values NA L2 (79) trend applied to LFS
Activities directly involving air transport
See description of approach to estimating modal share of activities in Ch.4
Regulatory administration
84.13 LFS L2 (84) data factored by evidence from 2012 study
NA L2 (84) trend applied to LFS
None required See description of in-scope activities in Ch.4
Activities of extraterritorial organisations and bodies
99 Estimates developed bottom-up for EUROCONTROL and EASA See approach described in Ch.4
Operation of flying schools
85 LFS L2 (85) data factored by evidence from 2012 study
NA L2 (85) trend applied to LFS
None required See description of in-scope activities in Ch.4
Other airport-related activities
See table 3.1
Estimates by activity for 2013 developed bottom-up from data collected from airports and airlines; pre-2013 overall total trend based on NA L2 (52) trend applied total from bottom-up estimation
A.49 As described above, GVA estimates are derived from NACE two-digit (L2) National Accounts
data by estimating value added based on the relationship between employment at L2 and the
estimates for in-scope employment derived above. The limitations of this approach mean that
value added may not be directly correlated with value added. Additional focus has been
placed on the air transport and airport operation and handling sectors, as described above.
Developing the summary estimates for each cluster and avoiding double counting
A.50 In estimating overall direct employment in air transport and at airports it is important to avoid
accounting twice for the activities that sit in subset (b), where the air transport cluster and
airport-related activities cluster overlap in Figure A.4 above. This is done by carefully
interpreting the information provided by stakeholders, particularly airports and airlines, to
ensure that activities inside airports that are already captured under the air transport cluster
analysis are not double-counted. This information is used to apportion air transport cluster
activity to subset (b) inside airports, without adding this activity to the total for a second time.
Cross-checks are made between, for example, data provided by airlines and data provided by
airports to confirm that the relativities presented are sensible. Cross-checks are also
undertaken between data collected from stakeholder surveys and data from other
independent sources (e.g. Eurostat and ACI).
A.51 As noted in above, not as many responses from airports and other stakeholders in the
consultation were received as anticipated in the Task Specification, nor were responses
provided to the full extent of the scope requested. By nature, the data requested is difficult for
airports to collect given the range of organisations operating at airports, and often airports
were unable to collect data covering the requested time series, or indeed data from
organisations other than the airport operator. For this reason the data available to estimate
employment in subset (b), where the air transport cluster and airport-related activities cluster
October 2015 | 236
overlap, is not complete. Data received has been supplemented with publicly available
information from airports’ annual reports, manufacturers’ annual reports with reference to
their locations as well as equivalent information for travel agents and tour operators.
Assumptions based on the limited data available are required to determine the overall
allocations of on- and off-airport campus activities. These assumptions are identified in
Chapter 4.
Comparison with 2012 edition
A.52 As compared to the 2012 study, the scope of the current study has been expanded to capture
the full extent of air transport and related industries in the EU. A number of new categories
are included, including manufacturing of aircraft, renting and leasing of aircraft, travel
agencies and tour operators and all 'airport related activities' (i.e. all activities undertaken
within the perimeter of each airport, not only airport operation and handling activities).
A.53 Figure A.5 overleaf shows Figure 4.1 in the main body of the study, with the new activities
included in the current study highlighted. The newly covered activities account for the
following in 2013:
Building and repairing of aircraft: 465,000 persons employed;
Renting and leasing of aircraft: 5,000 persons employed;
Travel agencies and tour operators: 255,000 persons employed; and
Other 'airport related activities': 500,000 persons employed.
A.54 In total these new activities account for 1,225,000 jobs in 2013. The other activities (air
transport, regulatory administration, airport operation and handling, and operation of flying
schools) amount to an estimated 690,000 persons in 2013. These activities were also covered
in the 2012 analysis.
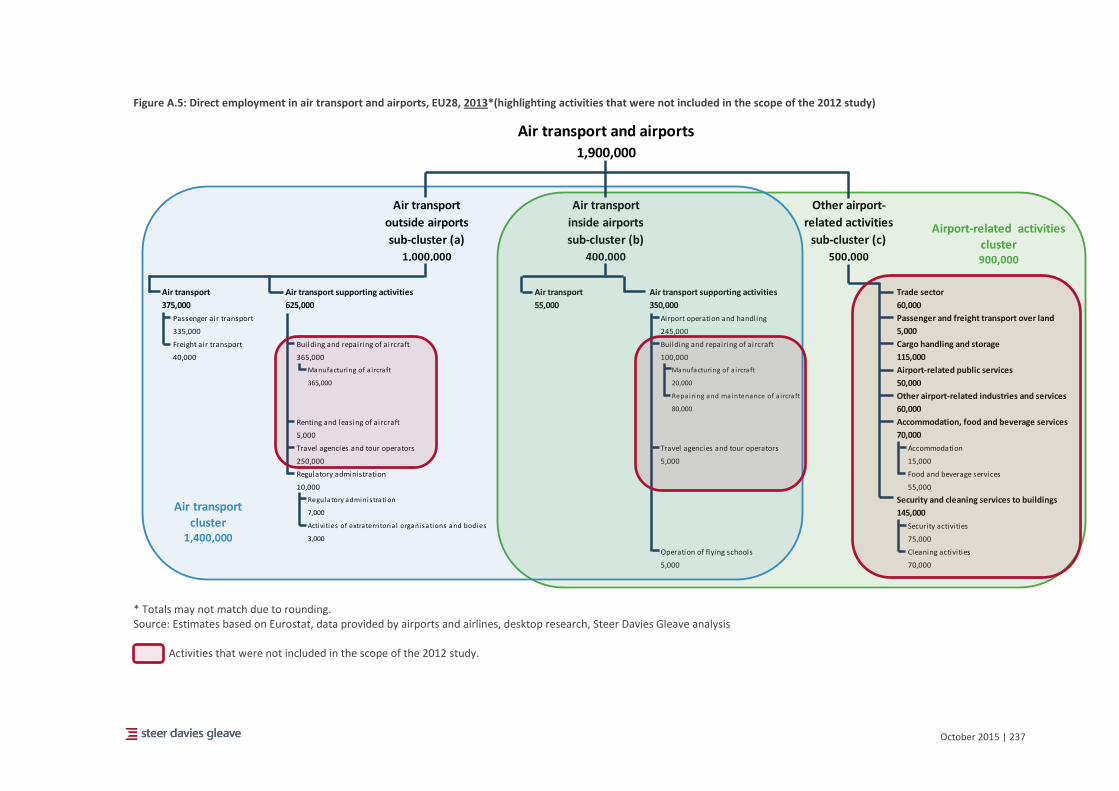
October 2015 | 237
Figure A.5: Direct employment in air transport and airports, EU28, 2013*(highlighting activities that were not included in the scope of the 2012 study)
* Totals may not match due to rounding. Source: Estimates based on Eurostat, data provided by airports and airlines, desktop research, Steer Davies Gleave analysis Activities that were not included in the scope of the 2012 study.
Air transport and airports
1,900,000
Air transport
outside airports
sub-cluster (a)
Air transport
inside airports
sub-cluster (b)
Other airport-
related activities
sub-cluster (c)
1,000,000 400,000 500,000
Air transport Air transport supporting activities Air transport Air transport supporting activities Trade sector
375,000 625,000 55,000 350,000 60,000
Passenger air transport Airport operation and handling Passenger and freight transport over land
335,000 245,000 5,000
Freight air transport Building and repairing of aircraft Building and repairing of aircraft Cargo handling and storage
40,000 365,000 100,000 115,000
Manufacturing of a i rcraft Manufacturing of a i rcraft Airport-related public services
365,000 20,000 50,000
Repairing and maintenance of a i rcraft Other airport-related industries and services
80,000 60,000
Renting and leasing of aircraft Accommodation, food and beverage services
5,000 70,000
Travel agencies and tour operators Travel agencies and tour operators Accommodation
250,000 5,000 15,000
Regulatory administration Food and beverage services
10,000 55,000
Regulatory adminis tration Security and cleaning services to buildings
7,000 145,000
Activi ties of extraterri toria l organisations and bodies Security activities
3,000 75,000
Operation of flying schools Cleaning activities
5,000 70,000
Air transportcluster
1,400,000
Airport-related activities cluster900,000
October 2015 | 238
Labour status definitions
A.55 To ensure comparability across different data sources, definitions for labour status have been
consistently applied across the study.
A.56 It was agreed with DG MOVE and DG EMPL that Eurostat definitions should form the basis of
the study definitions as the main statistical pillar for data for the study is Eurostat.
A.57 It is noted that the definitions/categories below are not exhaustive. The Labour Force Survey
(LFS) includes other definitions that are not of significant relevance to the study. In addition,
definitions can overlap. For example, an employee could be both part time and a temporary
agency worker.
A.58 For the purposes of this analysis, the following definitions apply:
Persons employed: the sum of salary-earning employees and self-employed workers.
Employees: persons who perform work for and under the control of a legal or natural
person for remuneration.
Self-employed: A self-employed person is the sole or joint owner of the unincorporated
enterprise in which he/she works, unless they are also in paid employment which is their
main activity (in that case, they are considered to be employees). Self-employed people
also include: unpaid family workers; outworkers (who work outside the usual workplace,
such as at home); and workers engaged in production done entirely for their own final use
or own capital formation, either individually or collectively.
Temporary agency worker: an employee who is employed and paid by a temporary-work
agency and assigned to a user company to work there under the supervision and direction
of that company (a triangular relationship).
Full time employee: an employed person whose normal hours of work correspond to the
standard number of hours considered as full-time employment in the national system.
Part-time employee: an employed person whose normal hours of work are less than
those of comparable full-time employees.
Atypical working hours: an employee working evenings or nights, Saturdays or Sundays,
or shift work. Note that this definition is NOT the same as that defined by the 2015
Atypical Employment in Aviation study, which defines atypical employment as “every form
of employment other than an open-ended employment contract”109
Permanent employment contract: employees with an open-ended and continuous
employment contract with their employer.
Fixed-term employment contract: employees having an employment contract whose end
is determined by objective conditions such as reaching a specific date, completing a
specific task, or the occurrence of a specific event.
A.59 Stakeholders were asked a number of scaled questions in the questionnaires. For the purpose
of this study, the following definitions apply.
Slight change: small observable change; and
Significant change: major/large observable change.
109 Y. Jorens, D. Gillis, L. Valcke & J. De Coninck, Atypical Forms of Employment in the Aviation Sector,
European Social Dialogue, European Commission, 2015.
October 2015 | 239
Indirect effects
Data selection
A.60 The input-output framework as used by the European System of National and Regional
Accounts (ESA2010) consists of two types of tables: Supply and Use tables (SUT) and
symmetric Input-Output tables (IOT). Tables normally report domestic and imports/exports
values separately.
A.61 IOT are published at the national level by most Member States in the EU. While SUT are
produced annually, symmetric IOT that consolidate both supply and use volumes (by product
and by industry) are only produced every five years. The latest available year for most
Member States is 2010. Industries are classified according to the most recent European
industrial activity classification (NACE Rev.2) and usually reported at the 2-digit (division) level.
A.62 Eurostat also publishes an aggregate symmetric IOT for the EU, which treats intra-EU trade
flows as domestic inputs and therefore only treats imports/exports as those inputs/outputs to
and from extra-EU countries. The consolidated EU27 IOT also makes use of some confidential
data which is not otherwise available to the general public. The most recent year for which the
EU27 IOT is available is 2011.
A.63 This study is focused upon producing estimates of indirect employment at the EU level.
Therefore it is considered appropriate to make use of the EU27110 IOT from 2011. Following
discussion with both Eurostat and the Commission, this approach is considered to be more
appropriate than the next-best alternative which would involve estimating indirect
employment for a sample of 3 Member States and infer EU-wide results from those.
A.64 Using the EU27 IOT avoids the need to make assumptions about aggregating the results from
the analysis of a sample of Member States. In addition, this approach has the advantage of
having being compiled more recently and makes a clearer distinction between intra-EU and
extra-EU trade flows. However it should be noted that the treatment of intra-EU trade flows as
domestic inputs necessarily leads to a higher estimate of indirect impacts than would be case
should all trade flows be treated as non-domestic (as would be the case if individual Member
State IOT were aggregated together).
Creating the sectors of interest using direct employment data
A.65 Before carrying out an assessment of the indirect employment generated by the air transport
and other airport-related activities sectors, it is necessary to undertake preparatory work on
the Input Output tables themselves. Input Output analysis is limited by the granularity of the
data. For example, the Input Output Tables only report direct employment in the 'air transport
services' sector at a high level. Therefore, in order to estimate the economic effects specifically
for the air transport cluster and airport-related activities cluster, a significant amount of
analysis is required to further differentiate the original I/O tables in order to distinguish
consistent groups (3-digit NACE) and classes (4-digit NACE) that align with the NACE Rev.2
classifications of economic activity.
110 This table necessarily excludes Croatia, which joined the EU in 2013. We will make an ad-hoc
adjustment to include Croatia in the final estimates.
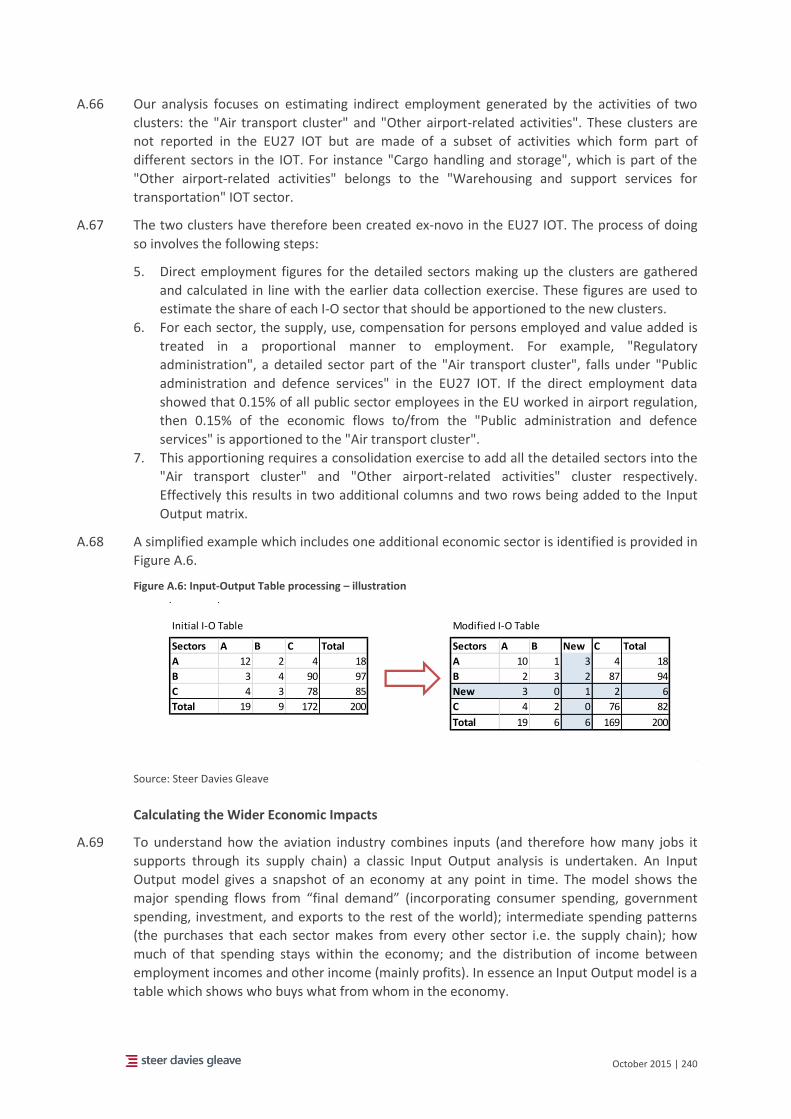
October 2015 | 240
A.66 Our analysis focuses on estimating indirect employment generated by the activities of two
clusters: the "Air transport cluster" and "Other airport-related activities". These clusters are
not reported in the EU27 IOT but are made of a subset of activities which form part of
different sectors in the IOT. For instance "Cargo handling and storage", which is part of the
"Other airport-related activities" belongs to the "Warehousing and support services for
transportation" IOT sector.
A.67 The two clusters have therefore been created ex-novo in the EU27 IOT. The process of doing
so involves the following steps:
5. Direct employment figures for the detailed sectors making up the clusters are gathered
and calculated in line with the earlier data collection exercise. These figures are used to
estimate the share of each I-O sector that should be apportioned to the new clusters.
6. For each sector, the supply, use, compensation for persons employed and value added is
treated in a proportional manner to employment. For example, "Regulatory
administration", a detailed sector part of the "Air transport cluster", falls under "Public
administration and defence services" in the EU27 IOT. If the direct employment data
showed that 0.15% of all public sector employees in the EU worked in airport regulation,
then 0.15% of the economic flows to/from the "Public administration and defence
services" is apportioned to the "Air transport cluster".
7. This apportioning requires a consolidation exercise to add all the detailed sectors into the
"Air transport cluster" and "Other airport-related activities" cluster respectively.
Effectively this results in two additional columns and two rows being added to the Input
Output matrix.
A.68 A simplified example which includes one additional economic sector is identified is provided in
Figure A.6.
Figure A.6: Input-Output Table processing – illustration
Source: Steer Davies Gleave
Calculating the Wider Economic Impacts
A.69 To understand how the aviation industry combines inputs (and therefore how many jobs it
supports through its supply chain) a classic Input Output analysis is undertaken. An Input
Output model gives a snapshot of an economy at any point in time. The model shows the
major spending flows from “final demand” (incorporating consumer spending, government
spending, investment, and exports to the rest of the world); intermediate spending patterns
(the purchases that each sector makes from every other sector i.e. the supply chain); how
much of that spending stays within the economy; and the distribution of income between
employment incomes and other income (mainly profits). In essence an Input Output model is a
table which shows who buys what from whom in the economy.
Initial I-O Table Modified I-O Table
Sectors A B C Total Sectors A B New C Total
A 12 2 4 18 A 10 1 3 4 18
B 3 4 90 97 B 2 3 2 87 94
C 4 3 78 85 New 3 0 1 2 6
Total 19 9 172 200 C 4 2 0 76 82
Total 19 6 6 169 200
October 2015 | 241
A.70 Manipulation of the Input Output table allows the estimation of the indirect effects of the
economic activity of a certain industry (e.g. the 'air transport' branch) on output and
employment over the whole supply chain. For example, in order to provide air transport
services an airline needs inputs from other sectors such as energy, consulting, financial
services, food and beverage services and many more. In turn, the energy sector will require a
range of inputs including the extraction of crude petroleum and gas, manufacture of coke and
refined petroleum products and a range of other services.
A.71 The relationship between the air services sector and the range of upstream sectors required to
generate air services can be quantified by applying a Leontief manipulation (often referred to
as the Leontief inverse) to the EU27 Input Output table. In the first stage of our analysis, the
economic effects of interrelations between the air services sector and its direct suppliers from
different sectors is estimated. Next, the direct supply interrelations of the first-stage supplying
sectors e.g. the energy sector is calculated. In theory this process would run infinitely, to
reflect the cyclic nature of the economy, which would result in an infinite number of
calculations. Instead, the "Leontief inverse" provides a mathematical approximation of the
output of the infinite process.
A.72 The output of these manipulations is a matrix in which the values represent the individual
cross-multipliers for each industry, showing the impact on each producing industry (row) of an
increase in 1 unit of output in a consuming industry (column). The total multiplier for each
consuming industry is the sum of the multipliers in the relevant column. In other words, the
total multiplier for each industry represents the strength of its supply chain.
A.73 Finally, the calculation of the Leontief inverse multipliers has been augmented with an
assessment of labour intensities. Labour intensity is defined as the relative proportion of
number of persons employed compared to value added or production output.
Limitations
A.74 Input-Output analysis is well established and recognised as a reliable model of the economy at
any point in time. Each IOT captures the actual flows between economic sectors and these
represent the most accurate available record of economic interactions at the national /
European level. As a consequence, this part of the analysis requires certain assumptions that
are implicit in the Input Output methodology, including:
Factor supplies meet demand: the basic version of I/O analysis assumes that the supply of
factors of production (e.g. labour) does not constrain the production of output, and hence
the supply of output of a sector will increase to match demand. This assumption may be
unrealistic in periods of very high demand, which might cause labour shortage. However,
the economy usually operates at the natural rate of employment, which is below the full
employment rate; hence, it is reasonable that the increases in the output of sectors, if
modest, will not be hindered by a lack of resources.
Relative prices remain constant: the analysis assumes that the relative prices of sector
inputs remain constant.
Factor proportions remain the same. The I/O tables used in the analysis do not take into
account changes in production processes and technologies that might occur in the
economy following the introduction of a new policy, and hence, are static in nature. This
assumption is reasonable in the short run, since production technologies for most
products do not change significantly over a period of a few years.
October 2015 | 242
A.75 Since Input Output tables only report flows between a limited number of economic sectors, it
is necessary to estimate the size of two separate economic sectors as described above. This
activity will necessarily require some assumptions, including:
Employment figures are used as a proxy for apportioning supply and use (measured in
Euros); the analysis assumes equal productivity of labour across the aviation sector;
Each subsector (e.g. "Cargo handling and storage") will be assumed to have the same
relationship with the rest of the economy as the larger sector they belong to (e.g.
"Warehousing and support services for transportation").
October 2015 | 243
B Employment and GVA tables Air transport cluster
B.1 Tables B.1 and B.2 in this section summarise employment and GVA for EU28 for all the items in
the air transport cluster (see chapter 4).
B.2 Tables B.3 to B.10 provide employment and GVA by Member State for:
the air transport cluster;
air transport;
- passenger air transport;
- freight air transport; and
airport operation and handling.
B.3 Table B.11 provides employment by gender and age group for EU28 for:
air transport;
- passenger air transport;
- freight air transport; and
airport operation and handling.
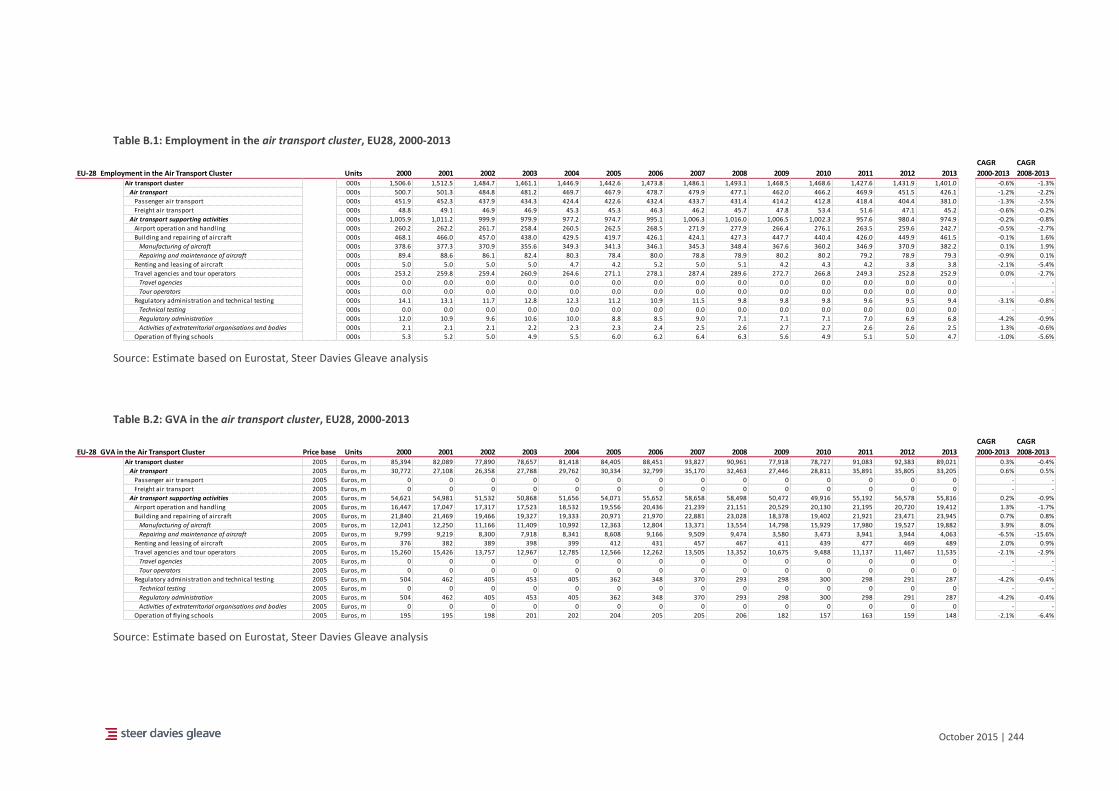
October 2015 | 244
Table B.1: Employment in the air transport cluster, EU28, 2000-2013
Source: Estimate based on Eurostat, Steer Davies Gleave analysis
Table B.2: GVA in the air transport cluster, EU28, 2000-2013
Source: Estimate based on Eurostat, Steer Davies Gleave analysis
CAGR CAGR
EU-28 Employment in the Air Transport Cluster Units 2000 2001 2002 2003 2004 2005 2006 2007 2008 2009 2010 2011 2012 2013 2000-2013 2008-2013Air transport cluster 000s 1,506.6 1,512.5 1,484.7 1,461.1 1,446.9 1,442.6 1,473.8 1,486.1 1,493.1 1,468.5 1,468.6 1,427.6 1,431.9 1,401.0 -0.6% -1.3%
Air transport 000s 500.7 501.3 484.8 481.2 469.7 467.9 478.7 479.9 477.1 462.0 466.2 469.9 451.5 426.1 -1.2% -2.2%
Passenger air transport 000s 451.9 452.3 437.9 434.3 424.4 422.6 432.4 433.7 431.4 414.2 412.8 418.4 404.4 381.0 -1.3% -2.5%
Freight air transport 000s 48.8 49.1 46.9 46.9 45.3 45.3 46.3 46.2 45.7 47.8 53.4 51.6 47.1 45.2 -0.6% -0.2%
Air transport supporting activities 000s 1,005.9 1,011.2 999.9 979.9 977.2 974.7 995.1 1,006.3 1,016.0 1,006.5 1,002.3 957.6 980.4 974.9 -0.2% -0.8%
Airport operation and handling 000s 260.2 262.2 261.7 258.4 260.5 262.5 268.5 271.9 277.9 266.4 276.1 263.5 259.6 242.7 -0.5% -2.7%
Building and repairing of aircraft 000s 468.1 466.0 457.0 438.0 429.5 419.7 426.1 424.1 427.3 447.7 440.4 426.0 449.9 461.5 -0.1% 1.6%
Manufacturing of aircraft 000s 378.6 377.3 370.9 355.6 349.3 341.3 346.1 345.3 348.4 367.6 360.2 346.9 370.9 382.2 0.1% 1.9%
Repairing and maintenance of aircraft 000s 89.4 88.6 86.1 82.4 80.3 78.4 80.0 78.8 78.9 80.2 80.2 79.2 78.9 79.3 -0.9% 0.1%
Renting and leasing of aircraft 000s 5.0 5.0 5.0 5.0 4.7 4.2 5.2 5.0 5.1 4.2 4.3 4.2 3.8 3.8 -2.1% -5.4%
Travel agencies and tour operators 000s 253.2 259.8 259.4 260.9 264.6 271.1 278.1 287.4 289.6 272.7 266.8 249.3 252.8 252.9 0.0% -2.7%
Travel agencies 000s 0.0 0.0 0.0 0.0 0.0 0.0 0.0 0.0 0.0 0.0 0.0 0.0 0.0 0.0 - -
Tour operators 000s 0.0 0.0 0.0 0.0 0.0 0.0 0.0 0.0 0.0 0.0 0.0 0.0 0.0 0.0 - -
Regulatory administration and technical testing 000s 14.1 13.1 11.7 12.8 12.3 11.2 10.9 11.5 9.8 9.8 9.8 9.6 9.5 9.4 -3.1% -0.8%
Technical testing 000s 0.0 0.0 0.0 0.0 0.0 0.0 0.0 0.0 0.0 0.0 0.0 0.0 0.0 0.0 - -
Regulatory administration 000s 12.0 10.9 9.6 10.6 10.0 8.8 8.5 9.0 7.1 7.1 7.1 7.0 6.9 6.8 -4.2% -0.9%
Activities of extraterritorial organisations and bodies 000s 2.1 2.1 2.1 2.2 2.3 2.3 2.4 2.5 2.6 2.7 2.7 2.6 2.6 2.5 1.3% -0.6%
Operation of flying schools 000s 5.3 5.2 5.0 4.9 5.5 6.0 6.2 6.4 6.3 5.6 4.9 5.1 5.0 4.7 -1.0% -5.6%
CAGR CAGR
EU-28 GVA in the Air Transport Cluster Price base Units 2000 2001 2002 2003 2004 2005 2006 2007 2008 2009 2010 2011 2012 2013 2000-2013 2008-2013Air transport cluster 2005 Euros, m 85,394 82,089 77,890 78,657 81,418 84,405 88,451 93,827 90,961 77,918 78,727 91,083 92,383 89,021 0.3% -0.4%
Air transport 2005 Euros, m 30,772 27,108 26,358 27,788 29,762 30,334 32,799 35,170 32,463 27,446 28,811 35,891 35,805 33,205 0.6% 0.5%
Passenger air transport 2005 Euros, m 0 0 0 0 0 0 0 0 0 0 0 0 0 0 - -
Freight air transport 2005 Euros, m 0 0 0 0 0 0 0 0 0 0 0 0 0 0 - -
Air transport supporting activities 2005 Euros, m 54,621 54,981 51,532 50,868 51,656 54,071 55,652 58,658 58,498 50,472 49,916 55,192 56,578 55,816 0.2% -0.9%
Airport operation and handling 2005 Euros, m 16,447 17,047 17,317 17,523 18,532 19,556 20,436 21,239 21,151 20,529 20,130 21,195 20,720 19,412 1.3% -1.7%
Building and repairing of aircraft 2005 Euros, m 21,840 21,469 19,466 19,327 19,333 20,971 21,970 22,881 23,028 18,378 19,402 21,921 23,471 23,945 0.7% 0.8%
Manufacturing of aircraft 2005 Euros, m 12,041 12,250 11,166 11,409 10,992 12,363 12,804 13,371 13,554 14,798 15,929 17,980 19,527 19,882 3.9% 8.0%
Repairing and maintenance of aircraft 2005 Euros, m 9,799 9,219 8,300 7,918 8,341 8,608 9,166 9,509 9,474 3,580 3,473 3,941 3,944 4,063 -6.5% -15.6%
Renting and leasing of aircraft 2005 Euros, m 376 382 389 398 399 412 431 457 467 411 439 477 469 489 2.0% 0.9%
Travel agencies and tour operators 2005 Euros, m 15,260 15,426 13,757 12,967 12,785 12,566 12,262 13,505 13,352 10,675 9,488 11,137 11,467 11,535 -2.1% -2.9%
Travel agencies 2005 Euros, m 0 0 0 0 0 0 0 0 0 0 0 0 0 0 - -
Tour operators 2005 Euros, m 0 0 0 0 0 0 0 0 0 0 0 0 0 0 - -
Regulatory administration and technical testing 2005 Euros, m 504 462 405 453 405 362 348 370 293 298 300 298 291 287 -4.2% -0.4%
Technical testing 2005 Euros, m 0 0 0 0 0 0 0 0 0 0 0 0 0 0 - -
Regulatory administration 2005 Euros, m 504 462 405 453 405 362 348 370 293 298 300 298 291 287 -4.2% -0.4%
Activities of extraterritorial organisations and bodies 2005 Euros, m 0 0 0 0 0 0 0 0 0 0 0 0 0 0 - -
Operation of flying schools 2005 Euros, m 195 195 198 201 202 204 205 205 206 182 157 163 159 148 -2.1% -6.4%
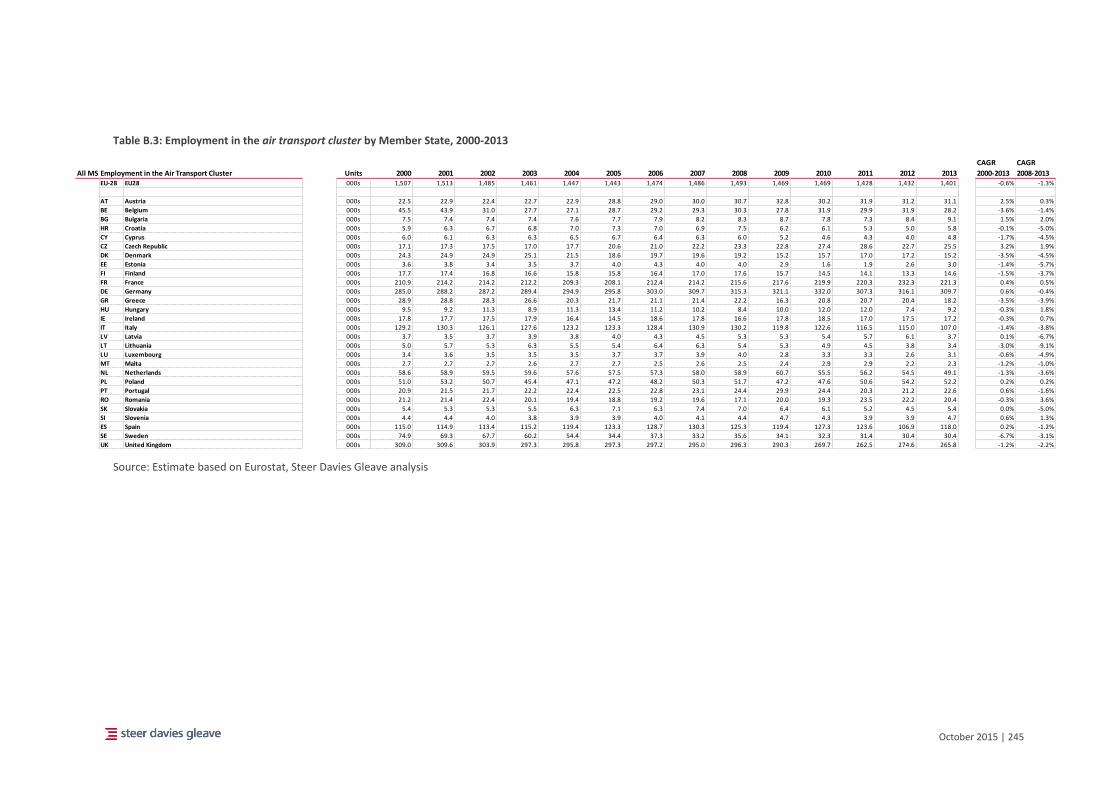
October 2015 | 245
Table B.3: Employment in the air transport cluster by Member State, 2000-2013
Source: Estimate based on Eurostat, Steer Davies Gleave analysis
CAGR CAGR
All MS Employment in the Air Transport Cluster Units 2000 2001 2002 2003 2004 2005 2006 2007 2008 2009 2010 2011 2012 2013 2000-2013 2008-2013EU-28 EU28 000s 1,507 1,513 1,485 1,461 1,447 1,443 1,474 1,486 1,493 1,469 1,469 1,428 1,432 1,401 -0.6% -1.3%
AT Austria 000s 22.5 22.9 22.4 22.7 22.9 28.8 29.0 30.0 30.7 32.8 30.2 31.9 31.2 31.1 2.5% 0.3%
BE Belgium 000s 45.5 43.9 31.0 27.7 27.1 28.7 29.2 29.3 30.3 27.8 31.9 29.9 31.9 28.2 -3.6% -1.4%
BG Bulgaria 000s 7.5 7.4 7.4 7.4 7.6 7.7 7.9 8.2 8.3 8.7 7.8 7.3 8.4 9.1 1.5% 2.0%
HR Croatia 000s 5.9 6.3 6.7 6.8 7.0 7.3 7.0 6.9 7.5 6.2 6.1 5.3 5.0 5.8 -0.1% -5.0%
CY Cyprus 000s 6.0 6.1 6.3 6.3 6.5 6.7 6.4 6.3 6.0 5.2 4.6 4.3 4.0 4.8 -1.7% -4.5%
CZ Czech Republic 000s 17.1 17.3 17.5 17.0 17.7 20.6 21.0 22.2 23.3 22.8 27.4 28.6 22.7 25.5 3.2% 1.9%
DK Denmark 000s 24.3 24.9 24.9 25.1 21.5 18.6 19.7 19.6 19.2 15.2 15.7 17.0 17.2 15.2 -3.5% -4.5%
EE Estonia 000s 3.6 3.8 3.4 3.5 3.7 4.0 4.3 4.0 4.0 2.9 1.6 1.9 2.6 3.0 -1.4% -5.7%
FI Finland 000s 17.7 17.4 16.8 16.6 15.8 15.8 16.4 17.0 17.6 15.7 14.5 14.1 13.3 14.6 -1.5% -3.7%
FR France 000s 210.9 214.2 214.2 212.2 209.3 208.1 212.4 214.2 215.6 217.6 219.9 220.3 232.3 221.3 0.4% 0.5%
DE Germany 000s 285.0 288.2 287.2 289.4 294.9 295.8 303.0 309.7 315.3 321.1 332.0 307.3 316.1 309.7 0.6% -0.4%
GR Greece 000s 28.9 28.8 28.3 26.6 20.3 21.7 21.1 21.4 22.2 16.3 20.8 20.7 20.4 18.2 -3.5% -3.9%
HU Hungary 000s 9.5 9.2 11.3 8.9 11.3 13.4 11.2 10.2 8.4 10.0 12.0 12.0 7.4 9.2 -0.3% 1.8%
IE Ireland 000s 17.8 17.7 17.5 17.9 16.4 14.5 18.6 17.8 16.6 17.8 18.5 17.0 17.5 17.2 -0.3% 0.7%
IT Italy 000s 129.2 130.3 126.1 127.6 123.2 123.3 128.4 130.9 130.2 119.8 122.6 116.5 115.0 107.0 -1.4% -3.8%
LV Latvia 000s 3.7 3.5 3.7 3.9 3.8 4.0 4.3 4.5 5.3 5.3 5.4 5.7 6.1 3.7 0.1% -6.7%
LT Lithuania 000s 5.0 5.7 5.3 6.3 5.5 5.4 6.4 6.3 5.4 5.3 4.9 4.5 3.8 3.4 -3.0% -9.1%
LU Luxembourg 000s 3.4 3.6 3.5 3.5 3.5 3.7 3.7 3.9 4.0 2.8 3.3 3.3 2.6 3.1 -0.6% -4.9%
MT Malta 000s 2.7 2.7 2.7 2.6 2.7 2.7 2.5 2.6 2.5 2.4 2.9 2.9 2.2 2.3 -1.2% -1.0%
NL Netherlands 000s 58.6 58.9 59.5 59.6 57.6 57.5 57.3 58.0 58.9 60.7 55.5 56.2 54.5 49.1 -1.3% -3.6%
PL Poland 000s 51.0 53.2 50.7 45.4 47.1 47.2 48.2 50.3 51.7 47.2 47.6 50.6 54.2 52.2 0.2% 0.2%
PT Portugal 000s 20.9 21.5 21.7 22.2 22.4 22.5 22.8 23.1 24.4 29.9 24.4 20.3 21.2 22.6 0.6% -1.6%
RO Romania 000s 21.2 21.4 22.4 20.1 19.4 18.8 19.2 19.6 17.1 20.0 19.3 23.5 22.2 20.4 -0.3% 3.6%
SK Slovakia 000s 5.4 5.3 5.3 5.5 6.3 7.1 6.3 7.4 7.0 6.4 6.1 5.2 4.5 5.4 0.0% -5.0%
SI Slovenia 000s 4.4 4.4 4.0 3.8 3.9 3.9 4.0 4.1 4.4 4.7 4.3 3.9 3.9 4.7 0.6% 1.3%
ES Spain 000s 115.0 114.9 113.4 115.2 119.4 123.3 128.7 130.3 125.3 119.4 127.3 123.6 106.9 118.0 0.2% -1.2%
SE Sweden 000s 74.9 69.3 67.7 60.2 54.4 34.4 37.3 33.2 35.6 34.1 32.3 31.4 30.4 30.4 -6.7% -3.1%
UK United Kingdom 000s 309.0 309.6 303.9 297.3 295.8 297.3 297.2 295.0 296.3 290.3 269.7 262.5 274.6 265.8 -1.2% -2.2%
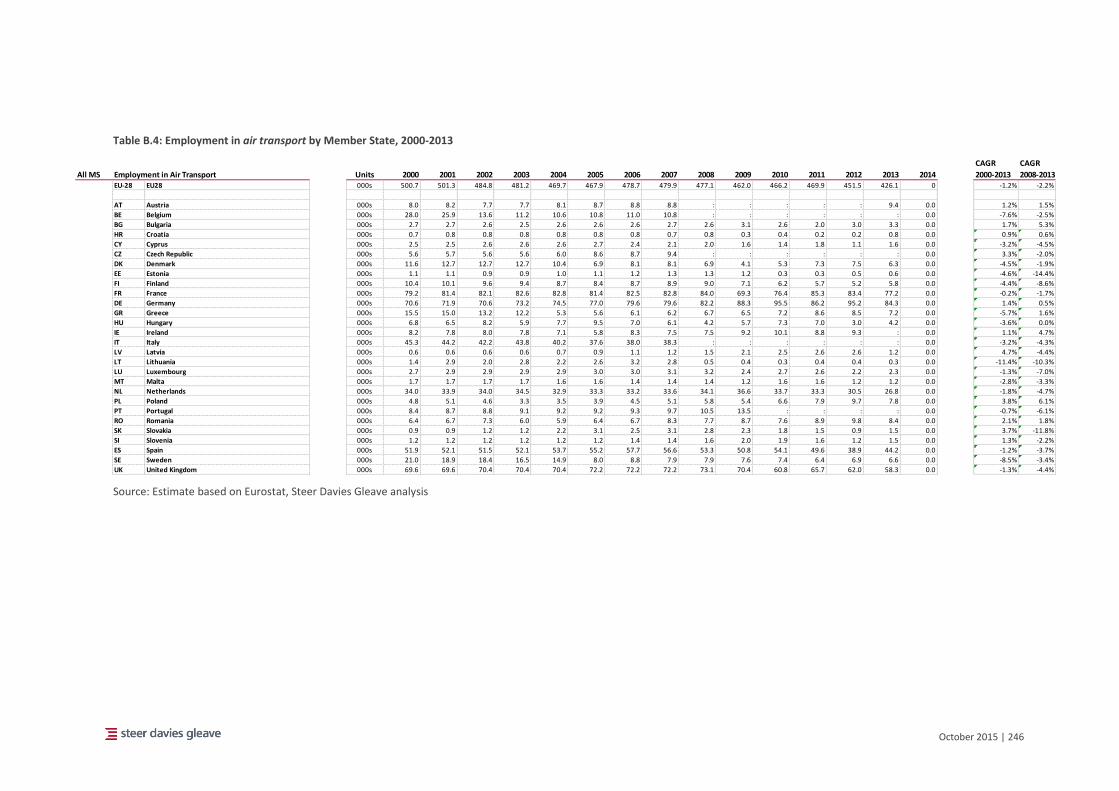
October 2015 | 246
Table B.4: Employment in air transport by Member State, 2000-2013
Source: Estimate based on Eurostat, Steer Davies Gleave analysis
CAGR CAGR
All MS Employment in Air Transport Units 2000 2001 2002 2003 2004 2005 2006 2007 2008 2009 2010 2011 2012 2013 2014 2000-2013 2008-2013EU-28 EU28 000s 500.7 501.3 484.8 481.2 469.7 467.9 478.7 479.9 477.1 462.0 466.2 469.9 451.5 426.1 0 -1.2% -2.2%
AT Austria 000s 8.0 8.2 7.7 7.7 8.1 8.7 8.8 8.8 : : : : : 9.4 0.0 1.2% 1.5%
BE Belgium 000s 28.0 25.9 13.6 11.2 10.6 10.8 11.0 10.8 : : : : : : 0.0 -7.6% -2.5%
BG Bulgaria 000s 2.7 2.7 2.6 2.5 2.6 2.6 2.6 2.7 2.6 3.1 2.6 2.0 3.0 3.3 0.0 1.7% 5.3%
HR Croatia 000s 0.7 0.8 0.8 0.8 0.8 0.8 0.8 0.7 0.8 0.3 0.4 0.2 0.2 0.8 0.0 0.9% 0.6%
CY Cyprus 000s 2.5 2.5 2.6 2.6 2.6 2.7 2.4 2.1 2.0 1.6 1.4 1.8 1.1 1.6 0.0 -3.2% -4.5%
CZ Czech Republic 000s 5.6 5.7 5.6 5.6 6.0 8.6 8.7 9.4 : : : : : : 0.0 3.3% -2.0%
DK Denmark 000s 11.6 12.7 12.7 12.7 10.4 6.9 8.1 8.1 6.9 4.1 5.3 7.3 7.5 6.3 0.0 -4.5% -1.9%
EE Estonia 000s 1.1 1.1 0.9 0.9 1.0 1.1 1.2 1.3 1.3 1.2 0.3 0.3 0.5 0.6 0.0 -4.6% -14.4%
FI Finland 000s 10.4 10.1 9.6 9.4 8.7 8.4 8.7 8.9 9.0 7.1 6.2 5.7 5.2 5.8 0.0 -4.4% -8.6%
FR France 000s 79.2 81.4 82.1 82.6 82.8 81.4 82.5 82.8 84.0 69.3 76.4 85.3 83.4 77.2 0.0 -0.2% -1.7%
DE Germany 000s 70.6 71.9 70.6 73.2 74.5 77.0 79.6 79.6 82.2 88.3 95.5 86.2 95.2 84.3 0.0 1.4% 0.5%
GR Greece 000s 15.5 15.0 13.2 12.2 5.3 5.6 6.1 6.2 6.7 6.5 7.2 8.6 8.5 7.2 0.0 -5.7% 1.6%
HU Hungary 000s 6.8 6.5 8.2 5.9 7.7 9.5 7.0 6.1 4.2 5.7 7.3 7.0 3.0 4.2 0.0 -3.6% 0.0%
IE Ireland 000s 8.2 7.8 8.0 7.8 7.1 5.8 8.3 7.5 7.5 9.2 10.1 8.8 9.3 : 0.0 1.1% 4.7%
IT Italy 000s 45.3 44.2 42.2 43.8 40.2 37.6 38.0 38.3 : : : : : : 0.0 -3.2% -4.3%
LV Latvia 000s 0.6 0.6 0.6 0.6 0.7 0.9 1.1 1.2 1.5 2.1 2.5 2.6 2.6 1.2 0.0 4.7% -4.4%
LT Lithuania 000s 1.4 2.9 2.0 2.8 2.2 2.6 3.2 2.8 0.5 0.4 0.3 0.4 0.4 0.3 0.0 -11.4% -10.3%
LU Luxembourg 000s 2.7 2.9 2.9 2.9 2.9 3.0 3.0 3.1 3.2 2.4 2.7 2.6 2.2 2.3 0.0 -1.3% -7.0%
MT Malta 000s 1.7 1.7 1.7 1.7 1.6 1.6 1.4 1.4 1.4 1.2 1.6 1.6 1.2 1.2 0.0 -2.8% -3.3%
NL Netherlands 000s 34.0 33.9 34.0 34.5 32.9 33.3 33.2 33.6 34.1 36.6 33.7 33.3 30.5 26.8 0.0 -1.8% -4.7%
PL Poland 000s 4.8 5.1 4.6 3.3 3.5 3.9 4.5 5.1 5.8 5.4 6.6 7.9 9.7 7.8 0.0 3.8% 6.1%
PT Portugal 000s 8.4 8.7 8.8 9.1 9.2 9.2 9.3 9.7 10.5 13.5 : : : : 0.0 -0.7% -6.1%
RO Romania 000s 6.4 6.7 7.3 6.0 5.9 6.4 6.7 8.3 7.7 8.7 7.6 8.9 9.8 8.4 0.0 2.1% 1.8%
SK Slovakia 000s 0.9 0.9 1.2 1.2 2.2 3.1 2.5 3.1 2.8 2.3 1.8 1.5 0.9 1.5 0.0 3.7% -11.8%
SI Slovenia 000s 1.2 1.2 1.2 1.2 1.2 1.2 1.4 1.4 1.6 2.0 1.9 1.6 1.2 1.5 0.0 1.3% -2.2%
ES Spain 000s 51.9 52.1 51.5 52.1 53.7 55.2 57.7 56.6 53.3 50.8 54.1 49.6 38.9 44.2 0.0 -1.2% -3.7%
SE Sweden 000s 21.0 18.9 18.4 16.5 14.9 8.0 8.8 7.9 7.9 7.6 7.4 6.4 6.9 6.6 0.0 -8.5% -3.4%
UK United Kingdom 000s 69.6 69.6 70.4 70.4 70.4 72.2 72.2 72.2 73.1 70.4 60.8 65.7 62.0 58.3 0.0 -1.3% -4.4%
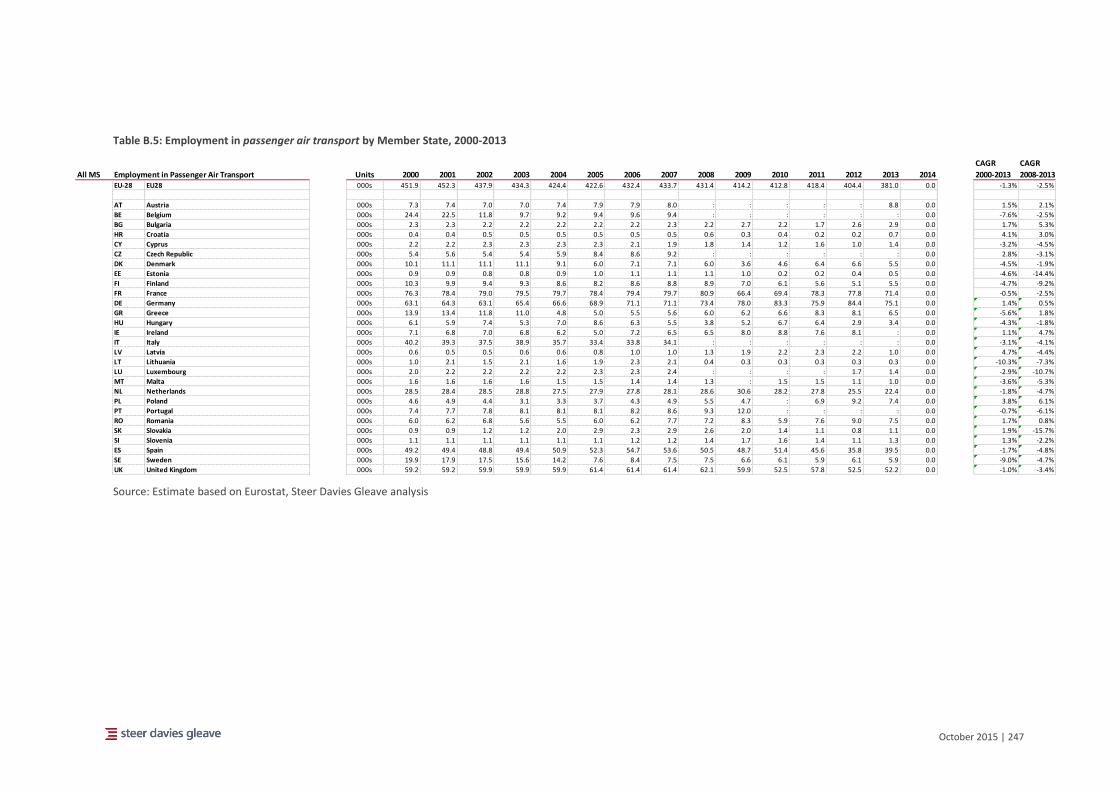
October 2015 | 247
Table B.5: Employment in passenger air transport by Member State, 2000-2013
Source: Estimate based on Eurostat, Steer Davies Gleave analysis
CAGR CAGR
All MS Employment in Passenger Air Transport Units 2000 2001 2002 2003 2004 2005 2006 2007 2008 2009 2010 2011 2012 2013 2014 2000-2013 2008-2013EU-28 EU28 000s 451.9 452.3 437.9 434.3 424.4 422.6 432.4 433.7 431.4 414.2 412.8 418.4 404.4 381.0 0.0 -1.3% -2.5%
AT Austria 000s 7.3 7.4 7.0 7.0 7.4 7.9 7.9 8.0 : : : : : 8.8 0.0 1.5% 2.1%
BE Belgium 000s 24.4 22.5 11.8 9.7 9.2 9.4 9.6 9.4 : : : : : : 0.0 -7.6% -2.5%
BG Bulgaria 000s 2.3 2.3 2.2 2.2 2.2 2.2 2.2 2.3 2.2 2.7 2.2 1.7 2.6 2.9 0.0 1.7% 5.3%
HR Croatia 000s 0.4 0.4 0.5 0.5 0.5 0.5 0.5 0.5 0.6 0.3 0.4 0.2 0.2 0.7 0.0 4.1% 3.0%
CY Cyprus 000s 2.2 2.2 2.3 2.3 2.3 2.3 2.1 1.9 1.8 1.4 1.2 1.6 1.0 1.4 0.0 -3.2% -4.5%
CZ Czech Republic 000s 5.4 5.6 5.4 5.4 5.9 8.4 8.6 9.2 : : : : : : 0.0 2.8% -3.1%
DK Denmark 000s 10.1 11.1 11.1 11.1 9.1 6.0 7.1 7.1 6.0 3.6 4.6 6.4 6.6 5.5 0.0 -4.5% -1.9%
EE Estonia 000s 0.9 0.9 0.8 0.8 0.9 1.0 1.1 1.1 1.1 1.0 0.2 0.2 0.4 0.5 0.0 -4.6% -14.4%
FI Finland 000s 10.3 9.9 9.4 9.3 8.6 8.2 8.6 8.8 8.9 7.0 6.1 5.6 5.1 5.5 0.0 -4.7% -9.2%
FR France 000s 76.3 78.4 79.0 79.5 79.7 78.4 79.4 79.7 80.9 66.4 69.4 78.3 77.8 71.4 0.0 -0.5% -2.5%
DE Germany 000s 63.1 64.3 63.1 65.4 66.6 68.9 71.1 71.1 73.4 78.0 83.3 75.9 84.4 75.1 0.0 1.4% 0.5%
GR Greece 000s 13.9 13.4 11.8 11.0 4.8 5.0 5.5 5.6 6.0 6.2 6.6 8.3 8.1 6.5 0.0 -5.6% 1.8%
HU Hungary 000s 6.1 5.9 7.4 5.3 7.0 8.6 6.3 5.5 3.8 5.2 6.7 6.4 2.9 3.4 0.0 -4.3% -1.8%
IE Ireland 000s 7.1 6.8 7.0 6.8 6.2 5.0 7.2 6.5 6.5 8.0 8.8 7.6 8.1 : 0.0 1.1% 4.7%
IT Italy 000s 40.2 39.3 37.5 38.9 35.7 33.4 33.8 34.1 : : : : : : 0.0 -3.1% -4.1%
LV Latvia 000s 0.6 0.5 0.5 0.6 0.6 0.8 1.0 1.0 1.3 1.9 2.2 2.3 2.2 1.0 0.0 4.7% -4.4%
LT Lithuania 000s 1.0 2.1 1.5 2.1 1.6 1.9 2.3 2.1 0.4 0.3 0.3 0.3 0.3 0.3 0.0 -10.3% -7.3%
LU Luxembourg 000s 2.0 2.2 2.2 2.2 2.2 2.3 2.3 2.4 : : : : 1.7 1.4 0.0 -2.9% -10.7%
MT Malta 000s 1.6 1.6 1.6 1.6 1.5 1.5 1.4 1.4 1.3 : 1.5 1.5 1.1 1.0 0.0 -3.6% -5.3%
NL Netherlands 000s 28.5 28.4 28.5 28.8 27.5 27.9 27.8 28.1 28.6 30.6 28.2 27.8 25.5 22.4 0.0 -1.8% -4.7%
PL Poland 000s 4.6 4.9 4.4 3.1 3.3 3.7 4.3 4.9 5.5 4.7 : 6.9 9.2 7.4 0.0 3.8% 6.1%
PT Portugal 000s 7.4 7.7 7.8 8.1 8.1 8.1 8.2 8.6 9.3 12.0 : : : : 0.0 -0.7% -6.1%
RO Romania 000s 6.0 6.2 6.8 5.6 5.5 6.0 6.2 7.7 7.2 8.3 5.9 7.6 9.0 7.5 0.0 1.7% 0.8%
SK Slovakia 000s 0.9 0.9 1.2 1.2 2.0 2.9 2.3 2.9 2.6 2.0 1.4 1.1 0.8 1.1 0.0 1.9% -15.7%
SI Slovenia 000s 1.1 1.1 1.1 1.1 1.1 1.1 1.2 1.2 1.4 1.7 1.6 1.4 1.1 1.3 0.0 1.3% -2.2%
ES Spain 000s 49.2 49.4 48.8 49.4 50.9 52.3 54.7 53.6 50.5 48.7 51.4 45.6 35.8 39.5 0.0 -1.7% -4.8%
SE Sweden 000s 19.9 17.9 17.5 15.6 14.2 7.6 8.4 7.5 7.5 6.6 6.1 5.9 6.1 5.9 0.0 -9.0% -4.7%
UK United Kingdom 000s 59.2 59.2 59.9 59.9 59.9 61.4 61.4 61.4 62.1 59.9 52.5 57.8 52.5 52.2 0.0 -1.0% -3.4%
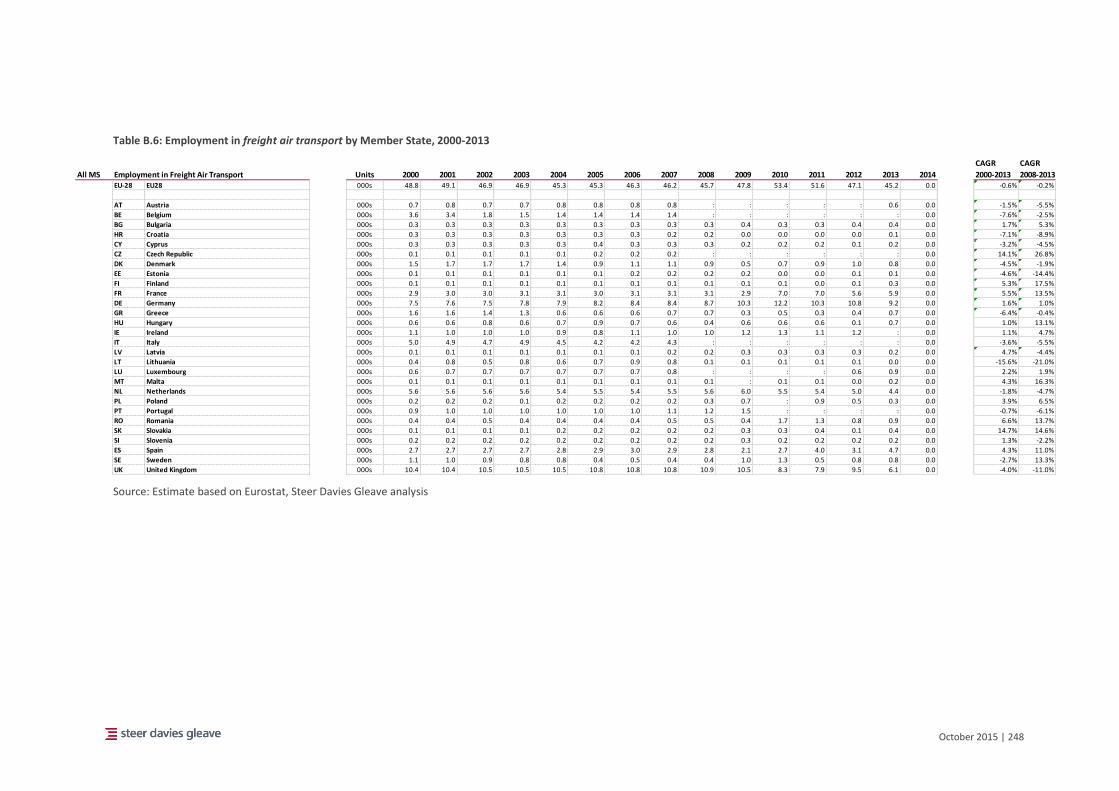
October 2015 | 248
Table B.6: Employment in freight air transport by Member State, 2000-2013
Source: Estimate based on Eurostat, Steer Davies Gleave analysis
CAGR CAGR
All MS Employment in Freight Air Transport Units 2000 2001 2002 2003 2004 2005 2006 2007 2008 2009 2010 2011 2012 2013 2014 2000-2013 2008-2013EU-28 EU28 000s 48.8 49.1 46.9 46.9 45.3 45.3 46.3 46.2 45.7 47.8 53.4 51.6 47.1 45.2 0.0 -0.6% -0.2%
AT Austria 000s 0.7 0.8 0.7 0.7 0.8 0.8 0.8 0.8 : : : : : 0.6 0.0 -1.5% -5.5%
BE Belgium 000s 3.6 3.4 1.8 1.5 1.4 1.4 1.4 1.4 : : : : : : 0.0 -7.6% -2.5%
BG Bulgaria 000s 0.3 0.3 0.3 0.3 0.3 0.3 0.3 0.3 0.3 0.4 0.3 0.3 0.4 0.4 0.0 1.7% 5.3%
HR Croatia 000s 0.3 0.3 0.3 0.3 0.3 0.3 0.3 0.2 0.2 0.0 0.0 0.0 0.0 0.1 0.0 -7.1% -8.9%
CY Cyprus 000s 0.3 0.3 0.3 0.3 0.3 0.4 0.3 0.3 0.3 0.2 0.2 0.2 0.1 0.2 0.0 -3.2% -4.5%
CZ Czech Republic 000s 0.1 0.1 0.1 0.1 0.1 0.2 0.2 0.2 : : : : : : 0.0 14.1% 26.8%
DK Denmark 000s 1.5 1.7 1.7 1.7 1.4 0.9 1.1 1.1 0.9 0.5 0.7 0.9 1.0 0.8 0.0 -4.5% -1.9%
EE Estonia 000s 0.1 0.1 0.1 0.1 0.1 0.1 0.2 0.2 0.2 0.2 0.0 0.0 0.1 0.1 0.0 -4.6% -14.4%
FI Finland 000s 0.1 0.1 0.1 0.1 0.1 0.1 0.1 0.1 0.1 0.1 0.1 0.0 0.1 0.3 0.0 5.3% 17.5%
FR France 000s 2.9 3.0 3.0 3.1 3.1 3.0 3.1 3.1 3.1 2.9 7.0 7.0 5.6 5.9 0.0 5.5% 13.5%
DE Germany 000s 7.5 7.6 7.5 7.8 7.9 8.2 8.4 8.4 8.7 10.3 12.2 10.3 10.8 9.2 0.0 1.6% 1.0%
GR Greece 000s 1.6 1.6 1.4 1.3 0.6 0.6 0.6 0.7 0.7 0.3 0.5 0.3 0.4 0.7 0.0 -6.4% -0.4%
HU Hungary 000s 0.6 0.6 0.8 0.6 0.7 0.9 0.7 0.6 0.4 0.6 0.6 0.6 0.1 0.7 0.0 1.0% 13.1%
IE Ireland 000s 1.1 1.0 1.0 1.0 0.9 0.8 1.1 1.0 1.0 1.2 1.3 1.1 1.2 : 0.0 1.1% 4.7%
IT Italy 000s 5.0 4.9 4.7 4.9 4.5 4.2 4.2 4.3 : : : : : : 0.0 -3.6% -5.5%
LV Latvia 000s 0.1 0.1 0.1 0.1 0.1 0.1 0.1 0.2 0.2 0.3 0.3 0.3 0.3 0.2 0.0 4.7% -4.4%
LT Lithuania 000s 0.4 0.8 0.5 0.8 0.6 0.7 0.9 0.8 0.1 0.1 0.1 0.1 0.1 0.0 0.0 -15.6% -21.0%
LU Luxembourg 000s 0.6 0.7 0.7 0.7 0.7 0.7 0.7 0.8 : : : : 0.6 0.9 0.0 2.2% 1.9%
MT Malta 000s 0.1 0.1 0.1 0.1 0.1 0.1 0.1 0.1 0.1 : 0.1 0.1 0.0 0.2 0.0 4.3% 16.3%
NL Netherlands 000s 5.6 5.6 5.6 5.6 5.4 5.5 5.4 5.5 5.6 6.0 5.5 5.4 5.0 4.4 0.0 -1.8% -4.7%
PL Poland 000s 0.2 0.2 0.2 0.1 0.2 0.2 0.2 0.2 0.3 0.7 : 0.9 0.5 0.3 0.0 3.9% 6.5%
PT Portugal 000s 0.9 1.0 1.0 1.0 1.0 1.0 1.0 1.1 1.2 1.5 : : : : 0.0 -0.7% -6.1%
RO Romania 000s 0.4 0.4 0.5 0.4 0.4 0.4 0.4 0.5 0.5 0.4 1.7 1.3 0.8 0.9 0.0 6.6% 13.7%
SK Slovakia 000s 0.1 0.1 0.1 0.1 0.2 0.2 0.2 0.2 0.2 0.3 0.3 0.4 0.1 0.4 0.0 14.7% 14.6%
SI Slovenia 000s 0.2 0.2 0.2 0.2 0.2 0.2 0.2 0.2 0.2 0.3 0.2 0.2 0.2 0.2 0.0 1.3% -2.2%
ES Spain 000s 2.7 2.7 2.7 2.7 2.8 2.9 3.0 2.9 2.8 2.1 2.7 4.0 3.1 4.7 0.0 4.3% 11.0%
SE Sweden 000s 1.1 1.0 0.9 0.8 0.8 0.4 0.5 0.4 0.4 1.0 1.3 0.5 0.8 0.8 0.0 -2.7% 13.3%
UK United Kingdom 000s 10.4 10.4 10.5 10.5 10.5 10.8 10.8 10.8 10.9 10.5 8.3 7.9 9.5 6.1 0.0 -4.0% -11.0%
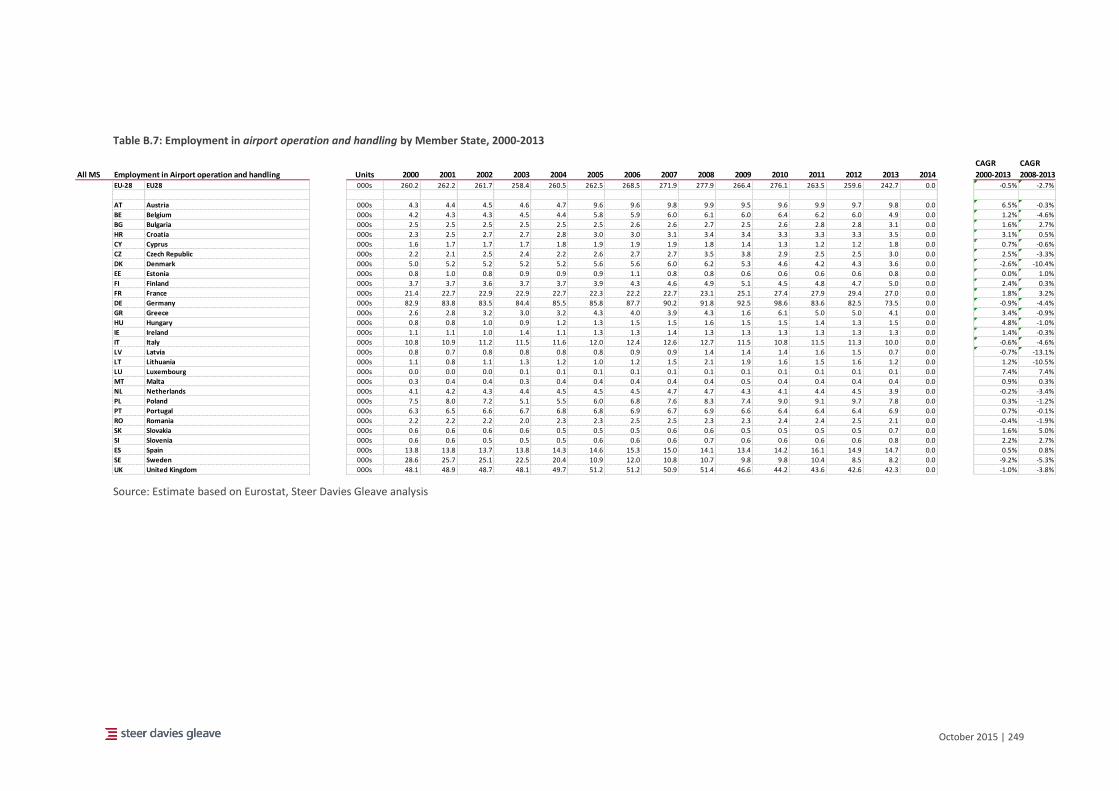
October 2015 | 249
Table B.7: Employment in airport operation and handling by Member State, 2000-2013
Source: Estimate based on Eurostat, Steer Davies Gleave analysis
CAGR CAGR
All MS Employment in Airport operation and handling Units 2000 2001 2002 2003 2004 2005 2006 2007 2008 2009 2010 2011 2012 2013 2014 2000-2013 2008-2013EU-28 EU28 000s 260.2 262.2 261.7 258.4 260.5 262.5 268.5 271.9 277.9 266.4 276.1 263.5 259.6 242.7 0.0 -0.5% -2.7%
AT Austria 000s 4.3 4.4 4.5 4.6 4.7 9.6 9.6 9.8 9.9 9.5 9.6 9.9 9.7 9.8 0.0 6.5% -0.3%
BE Belgium 000s 4.2 4.3 4.3 4.5 4.4 5.8 5.9 6.0 6.1 6.0 6.4 6.2 6.0 4.9 0.0 1.2% -4.6%
BG Bulgaria 000s 2.5 2.5 2.5 2.5 2.5 2.5 2.6 2.6 2.7 2.5 2.6 2.8 2.8 3.1 0.0 1.6% 2.7%
HR Croatia 000s 2.3 2.5 2.7 2.7 2.8 3.0 3.0 3.1 3.4 3.4 3.3 3.3 3.3 3.5 0.0 3.1% 0.5%
CY Cyprus 000s 1.6 1.7 1.7 1.7 1.8 1.9 1.9 1.9 1.8 1.4 1.3 1.2 1.2 1.8 0.0 0.7% -0.6%
CZ Czech Republic 000s 2.2 2.1 2.5 2.4 2.2 2.6 2.7 2.7 3.5 3.8 2.9 2.5 2.5 3.0 0.0 2.5% -3.3%
DK Denmark 000s 5.0 5.2 5.2 5.2 5.2 5.6 5.6 6.0 6.2 5.3 4.6 4.2 4.3 3.6 0.0 -2.6% -10.4%
EE Estonia 000s 0.8 1.0 0.8 0.9 0.9 0.9 1.1 0.8 0.8 0.6 0.6 0.6 0.6 0.8 0.0 0.0% 1.0%
FI Finland 000s 3.7 3.7 3.6 3.7 3.7 3.9 4.3 4.6 4.9 5.1 4.5 4.8 4.7 5.0 0.0 2.4% 0.3%
FR France 000s 21.4 22.7 22.9 22.9 22.7 22.3 22.2 22.7 23.1 25.1 27.4 27.9 29.4 27.0 0.0 1.8% 3.2%
DE Germany 000s 82.9 83.8 83.5 84.4 85.5 85.8 87.7 90.2 91.8 92.5 98.6 83.6 82.5 73.5 0.0 -0.9% -4.4%
GR Greece 000s 2.6 2.8 3.2 3.0 3.2 4.3 4.0 3.9 4.3 1.6 6.1 5.0 5.0 4.1 0.0 3.4% -0.9%
HU Hungary 000s 0.8 0.8 1.0 0.9 1.2 1.3 1.5 1.5 1.6 1.5 1.5 1.4 1.3 1.5 0.0 4.8% -1.0%
IE Ireland 000s 1.1 1.1 1.0 1.4 1.1 1.3 1.3 1.4 1.3 1.3 1.3 1.3 1.3 1.3 0.0 1.4% -0.3%
IT Italy 000s 10.8 10.9 11.2 11.5 11.6 12.0 12.4 12.6 12.7 11.5 10.8 11.5 11.3 10.0 0.0 -0.6% -4.6%
LV Latvia 000s 0.8 0.7 0.8 0.8 0.8 0.8 0.9 0.9 1.4 1.4 1.4 1.6 1.5 0.7 0.0 -0.7% -13.1%
LT Lithuania 000s 1.1 0.8 1.1 1.3 1.2 1.0 1.2 1.5 2.1 1.9 1.6 1.5 1.6 1.2 0.0 1.2% -10.5%
LU Luxembourg 000s 0.0 0.0 0.0 0.1 0.1 0.1 0.1 0.1 0.1 0.1 0.1 0.1 0.1 0.1 0.0 7.4% 7.4%
MT Malta 000s 0.3 0.4 0.4 0.3 0.4 0.4 0.4 0.4 0.4 0.5 0.4 0.4 0.4 0.4 0.0 0.9% 0.3%
NL Netherlands 000s 4.1 4.2 4.3 4.4 4.5 4.5 4.5 4.7 4.7 4.3 4.1 4.4 4.5 3.9 0.0 -0.2% -3.4%
PL Poland 000s 7.5 8.0 7.2 5.1 5.5 6.0 6.8 7.6 8.3 7.4 9.0 9.1 9.7 7.8 0.0 0.3% -1.2%
PT Portugal 000s 6.3 6.5 6.6 6.7 6.8 6.8 6.9 6.7 6.9 6.6 6.4 6.4 6.4 6.9 0.0 0.7% -0.1%
RO Romania 000s 2.2 2.2 2.2 2.0 2.3 2.3 2.5 2.5 2.3 2.3 2.4 2.4 2.5 2.1 0.0 -0.4% -1.9%
SK Slovakia 000s 0.6 0.6 0.6 0.6 0.5 0.5 0.5 0.6 0.6 0.5 0.5 0.5 0.5 0.7 0.0 1.6% 5.0%
SI Slovenia 000s 0.6 0.6 0.5 0.5 0.5 0.6 0.6 0.6 0.7 0.6 0.6 0.6 0.6 0.8 0.0 2.2% 2.7%
ES Spain 000s 13.8 13.8 13.7 13.8 14.3 14.6 15.3 15.0 14.1 13.4 14.2 16.1 14.9 14.7 0.0 0.5% 0.8%
SE Sweden 000s 28.6 25.7 25.1 22.5 20.4 10.9 12.0 10.8 10.7 9.8 9.8 10.4 8.5 8.2 0.0 -9.2% -5.3%
UK United Kingdom 000s 48.1 48.9 48.7 48.1 49.7 51.2 51.2 50.9 51.4 46.6 44.2 43.6 42.6 42.3 0.0 -1.0% -3.8%
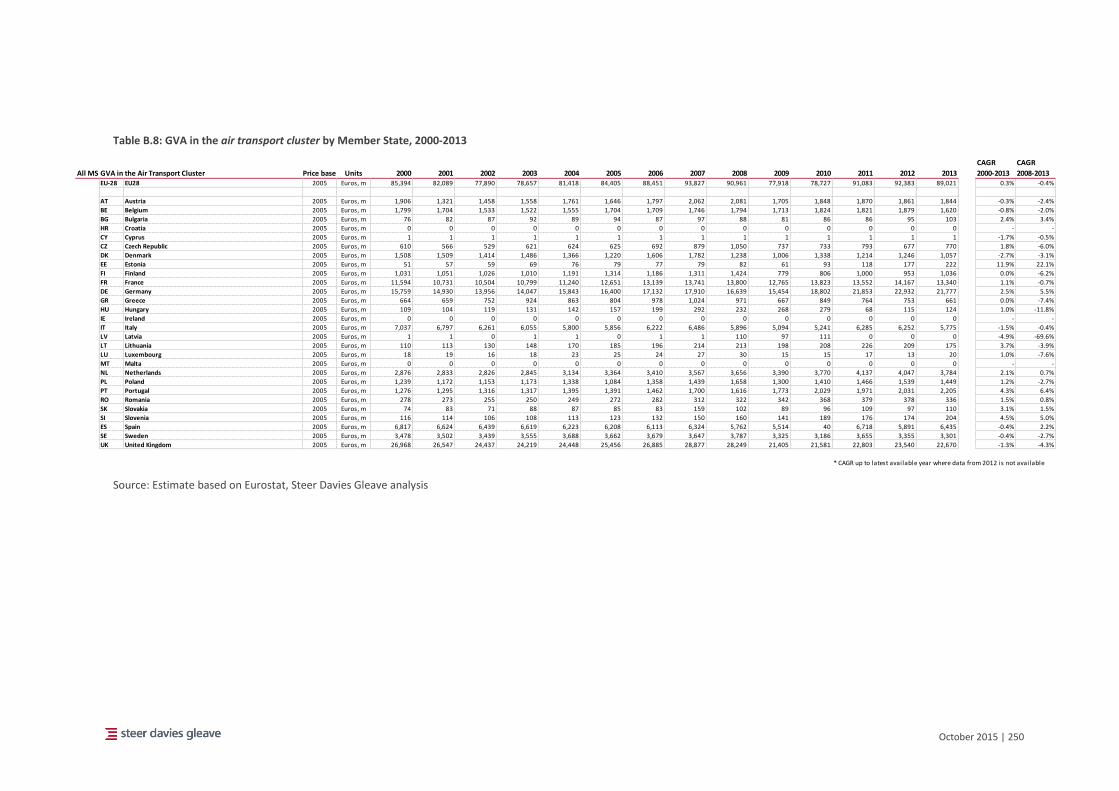
October 2015 | 250
Table B.8: GVA in the air transport cluster by Member State, 2000-2013
Source: Estimate based on Eurostat, Steer Davies Gleave analysis
CAGR CAGR
All MS GVA in the Air Transport Cluster Price base Units 2000 2001 2002 2003 2004 2005 2006 2007 2008 2009 2010 2011 2012 2013 2000-2013 2008-2013EU-28 EU28 2005 Euros, m 85,394 82,089 77,890 78,657 81,418 84,405 88,451 93,827 90,961 77,918 78,727 91,083 92,383 89,021 0.3% -0.4%
AT Austria 2005 Euros, m 1,906 1,321 1,458 1,558 1,761 1,646 1,797 2,062 2,081 1,705 1,848 1,870 1,861 1,844 -0.3% -2.4%
BE Belgium 2005 Euros, m 1,799 1,704 1,533 1,522 1,555 1,704 1,709 1,746 1,794 1,713 1,824 1,821 1,879 1,620 -0.8% -2.0%
BG Bulgaria 2005 Euros, m 76 82 87 92 89 94 87 97 88 81 86 86 95 103 2.4% 3.4%
HR Croatia 2005 Euros, m 0 0 0 0 0 0 0 0 0 0 0 0 0 0 - -
CY Cyprus 2005 Euros, m 1 1 1 1 1 1 1 1 1 1 1 1 1 1 -1.7% -0.5%
CZ Czech Republic 2005 Euros, m 610 566 529 621 624 625 692 879 1,050 737 733 793 677 770 1.8% -6.0%
DK Denmark 2005 Euros, m 1,508 1,509 1,414 1,486 1,366 1,220 1,606 1,782 1,238 1,006 1,338 1,214 1,246 1,057 -2.7% -3.1%
EE Estonia 2005 Euros, m 51 57 59 69 76 79 77 79 82 61 93 118 177 222 11.9% 22.1%
FI Finland 2005 Euros, m 1,031 1,051 1,026 1,010 1,191 1,314 1,186 1,311 1,424 779 806 1,000 953 1,036 0.0% -6.2%
FR France 2005 Euros, m 11,594 10,731 10,504 10,799 11,240 12,651 13,139 13,741 13,800 12,765 13,823 13,552 14,167 13,340 1.1% -0.7%
DE Germany 2005 Euros, m 15,759 14,930 13,956 14,047 15,843 16,400 17,132 17,910 16,639 15,454 18,802 21,853 22,932 21,777 2.5% 5.5%
GR Greece 2005 Euros, m 664 659 752 924 863 804 978 1,024 971 667 849 764 753 661 0.0% -7.4%
HU Hungary 2005 Euros, m 109 104 119 131 142 157 199 292 232 268 279 68 115 124 1.0% -11.8%
IE Ireland 2005 Euros, m 0 0 0 0 0 0 0 0 0 0 0 0 0 0 - -
IT Italy 2005 Euros, m 7,037 6,797 6,261 6,055 5,800 5,856 6,222 6,486 5,896 5,094 5,241 6,285 6,252 5,775 -1.5% -0.4%
LV Latvia 2005 Euros, m 1 1 0 1 1 0 1 1 110 97 111 0 0 0 -4.9% -69.6%
LT Lithuania 2005 Euros, m 110 113 130 148 170 185 196 214 213 198 208 226 209 175 3.7% -3.9%
LU Luxembourg 2005 Euros, m 18 19 16 18 23 25 24 27 30 15 15 17 13 20 1.0% -7.6%
MT Malta 2005 Euros, m 0 0 0 0 0 0 0 0 0 0 0 0 0 0 - -
NL Netherlands 2005 Euros, m 2,876 2,833 2,826 2,845 3,134 3,364 3,410 3,567 3,656 3,390 3,770 4,137 4,047 3,784 2.1% 0.7%
PL Poland 2005 Euros, m 1,239 1,172 1,153 1,173 1,338 1,084 1,358 1,439 1,658 1,300 1,410 1,466 1,539 1,449 1.2% -2.7%
PT Portugal 2005 Euros, m 1,276 1,295 1,316 1,317 1,395 1,391 1,462 1,700 1,616 1,773 2,029 1,971 2,031 2,205 4.3% 6.4%
RO Romania 2005 Euros, m 278 273 255 250 249 272 282 312 322 342 368 379 378 336 1.5% 0.8%
SK Slovakia 2005 Euros, m 74 83 71 88 87 85 83 159 102 89 96 109 97 110 3.1% 1.5%
SI Slovenia 2005 Euros, m 116 114 106 108 113 123 132 150 160 141 189 176 174 204 4.5% 5.0%
ES Spain 2005 Euros, m 6,817 6,624 6,439 6,619 6,223 6,208 6,113 6,324 5,762 5,514 40 6,718 5,891 6,435 -0.4% 2.2%
SE Sweden 2005 Euros, m 3,478 3,502 3,439 3,555 3,688 3,662 3,679 3,647 3,787 3,325 3,186 3,655 3,355 3,301 -0.4% -2.7%
UK United Kingdom 2005 Euros, m 26,968 26,547 24,437 24,219 24,448 25,456 26,885 28,877 28,249 21,405 21,581 22,803 23,540 22,670 -1.3% -4.3%
* CAGR up to latest available year where data from 2012 is not available
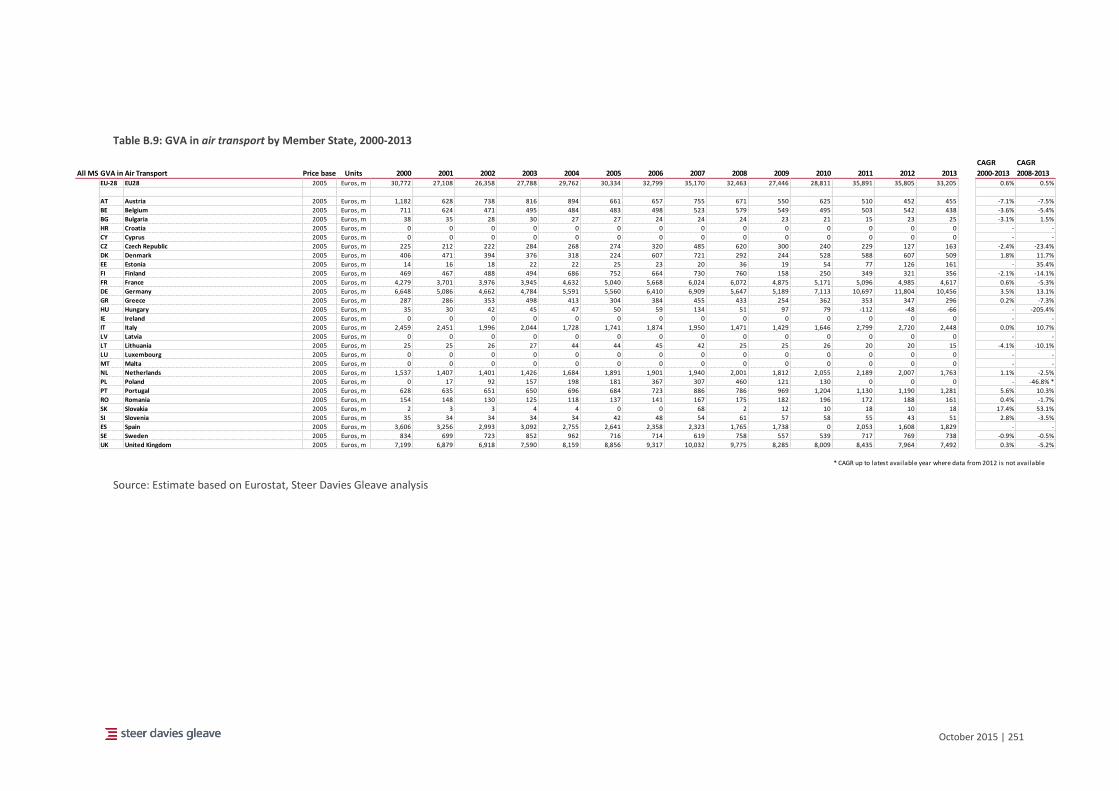
October 2015 | 251
Table B.9: GVA in air transport by Member State, 2000-2013
Source: Estimate based on Eurostat, Steer Davies Gleave analysis
CAGR CAGR
All MS GVA in Air Transport Price base Units 2000 2001 2002 2003 2004 2005 2006 2007 2008 2009 2010 2011 2012 2013 2000-2013 2008-2013EU-28 EU28 2005 Euros, m 30,772 27,108 26,358 27,788 29,762 30,334 32,799 35,170 32,463 27,446 28,811 35,891 35,805 33,205 0.6% 0.5%
AT Austria 2005 Euros, m 1,182 628 738 816 894 661 657 755 671 550 625 510 452 455 -7.1% -7.5%
BE Belgium 2005 Euros, m 711 624 471 495 484 483 498 523 579 549 495 503 542 438 -3.6% -5.4%
BG Bulgaria 2005 Euros, m 38 35 28 30 27 27 24 24 24 23 21 15 23 25 -3.1% 1.5%
HR Croatia 2005 Euros, m 0 0 0 0 0 0 0 0 0 0 0 0 0 0 - -
CY Cyprus 2005 Euros, m 0 0 0 0 0 0 0 0 0 0 0 0 0 0 - -
CZ Czech Republic 2005 Euros, m 225 212 222 284 268 274 320 485 620 300 240 229 127 163 -2.4% -23.4%
DK Denmark 2005 Euros, m 406 471 394 376 318 224 607 721 292 244 528 588 607 509 1.8% 11.7%
EE Estonia 2005 Euros, m 14 16 18 22 22 25 23 20 36 19 54 77 126 161 - 35.4%
FI Finland 2005 Euros, m 469 467 488 494 686 752 664 730 760 158 250 349 321 356 -2.1% -14.1%
FR France 2005 Euros, m 4,279 3,701 3,976 3,945 4,632 5,040 5,668 6,024 6,072 4,875 5,171 5,096 4,985 4,617 0.6% -5.3%
DE Germany 2005 Euros, m 6,648 5,086 4,662 4,784 5,591 5,560 6,410 6,909 5,647 5,189 7,113 10,697 11,804 10,456 3.5% 13.1%
GR Greece 2005 Euros, m 287 286 353 498 413 304 384 455 433 254 362 353 347 296 0.2% -7.3%
HU Hungary 2005 Euros, m 35 30 42 45 47 50 59 134 51 97 79 -112 -48 -66 - -205.4%
IE Ireland 2005 Euros, m 0 0 0 0 0 0 0 0 0 0 0 0 0 0 - -
IT Italy 2005 Euros, m 2,459 2,451 1,996 2,044 1,728 1,741 1,874 1,950 1,471 1,429 1,646 2,799 2,720 2,448 0.0% 10.7%
LV Latvia 2005 Euros, m 0 0 0 0 0 0 0 0 0 0 0 0 0 0 - -
LT Lithuania 2005 Euros, m 25 25 26 27 44 44 45 42 25 25 26 20 20 15 -4.1% -10.1%
LU Luxembourg 2005 Euros, m 0 0 0 0 0 0 0 0 0 0 0 0 0 0 - -
MT Malta 2005 Euros, m 0 0 0 0 0 0 0 0 0 0 0 0 0 0 - -
NL Netherlands 2005 Euros, m 1,537 1,407 1,401 1,426 1,684 1,891 1,901 1,940 2,001 1,812 2,055 2,189 2,007 1,763 1.1% -2.5%
PL Poland 2005 Euros, m 0 17 92 157 198 181 367 307 460 121 130 0 0 0 - -46.8% *
PT Portugal 2005 Euros, m 628 635 651 650 696 684 723 886 786 969 1,204 1,130 1,190 1,281 5.6% 10.3%
RO Romania 2005 Euros, m 154 148 130 125 118 137 141 167 175 182 196 172 188 161 0.4% -1.7%
SK Slovakia 2005 Euros, m 2 3 3 4 4 0 0 68 2 12 10 18 10 18 17.4% 53.1%
SI Slovenia 2005 Euros, m 35 34 34 34 34 42 48 54 61 57 58 55 43 51 2.8% -3.5%
ES Spain 2005 Euros, m 3,606 3,256 2,993 3,092 2,755 2,641 2,358 2,323 1,765 1,738 0 2,053 1,608 1,829 - -
SE Sweden 2005 Euros, m 834 699 723 852 962 716 714 619 758 557 539 717 769 738 -0.9% -0.5%
UK United Kingdom 2005 Euros, m 7,199 6,879 6,918 7,590 8,159 8,856 9,317 10,032 9,775 8,285 8,009 8,435 7,964 7,492 0.3% -5.2%
* CAGR up to latest available year where data from 2012 is not available
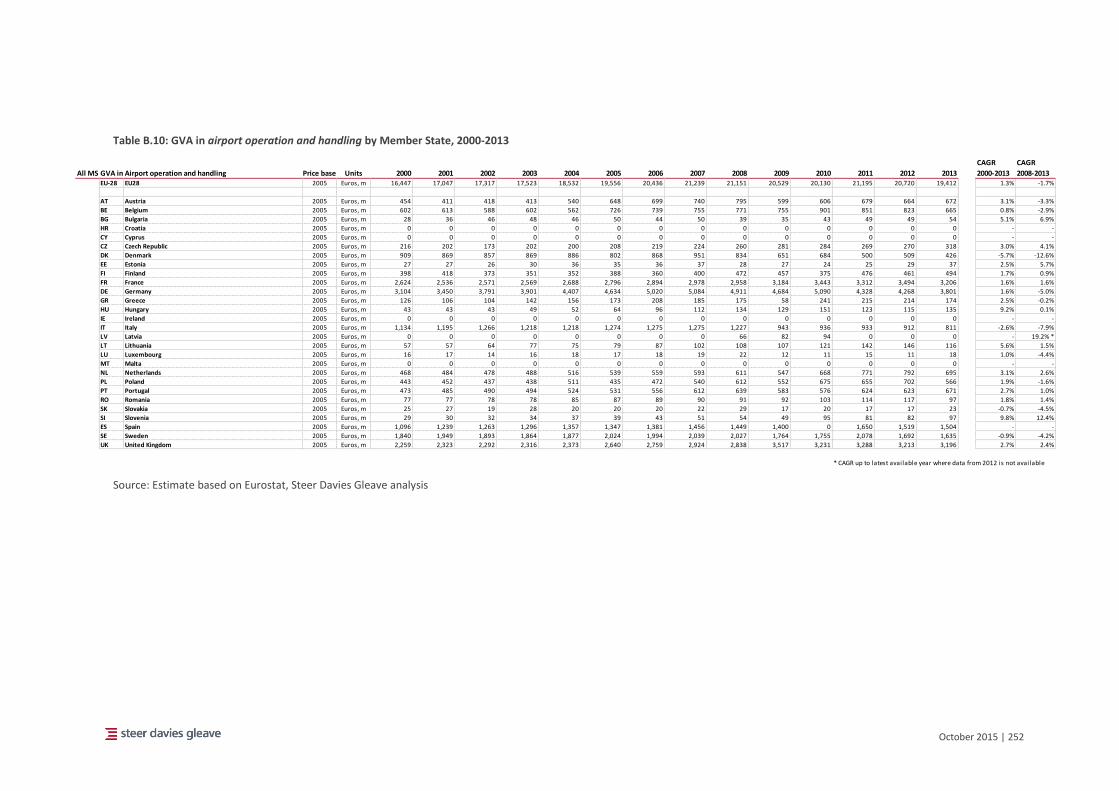
October 2015 | 252
Table B.10: GVA in airport operation and handling by Member State, 2000-2013
Source: Estimate based on Eurostat, Steer Davies Gleave analysis
CAGR CAGR
All MS GVA in Airport operation and handling Price base Units 2000 2001 2002 2003 2004 2005 2006 2007 2008 2009 2010 2011 2012 2013 2000-2013 2008-2013EU-28 EU28 2005 Euros, m 16,447 17,047 17,317 17,523 18,532 19,556 20,436 21,239 21,151 20,529 20,130 21,195 20,720 19,412 1.3% -1.7%
AT Austria 2005 Euros, m 454 411 418 413 540 648 699 740 795 599 606 679 664 672 3.1% -3.3%
BE Belgium 2005 Euros, m 602 613 588 602 562 726 739 755 771 755 901 851 823 665 0.8% -2.9%
BG Bulgaria 2005 Euros, m 28 36 46 48 46 50 44 50 39 35 43 49 49 54 5.1% 6.9%
HR Croatia 2005 Euros, m 0 0 0 0 0 0 0 0 0 0 0 0 0 0 - -
CY Cyprus 2005 Euros, m 0 0 0 0 0 0 0 0 0 0 0 0 0 0 - -
CZ Czech Republic 2005 Euros, m 216 202 173 202 200 208 219 224 260 281 284 269 270 318 3.0% 4.1%
DK Denmark 2005 Euros, m 909 869 857 869 886 802 868 951 834 651 684 500 509 426 -5.7% -12.6%
EE Estonia 2005 Euros, m 27 27 26 30 36 35 36 37 28 27 24 25 29 37 2.5% 5.7%
FI Finland 2005 Euros, m 398 418 373 351 352 388 360 400 472 457 375 476 461 494 1.7% 0.9%
FR France 2005 Euros, m 2,624 2,536 2,571 2,569 2,688 2,796 2,894 2,978 2,958 3,184 3,443 3,312 3,494 3,206 1.6% 1.6%
DE Germany 2005 Euros, m 3,104 3,450 3,791 3,901 4,407 4,634 5,020 5,084 4,911 4,684 5,090 4,328 4,268 3,801 1.6% -5.0%
GR Greece 2005 Euros, m 126 106 104 142 156 173 208 185 175 58 241 215 214 174 2.5% -0.2%
HU Hungary 2005 Euros, m 43 43 43 49 52 64 96 112 134 129 151 123 115 135 9.2% 0.1%
IE Ireland 2005 Euros, m 0 0 0 0 0 0 0 0 0 0 0 0 0 0 - -
IT Italy 2005 Euros, m 1,134 1,195 1,266 1,218 1,218 1,274 1,275 1,275 1,227 943 936 933 912 811 -2.6% -7.9%
LV Latvia 2005 Euros, m 0 0 0 0 0 0 0 0 66 82 94 0 0 0 - 19.2% *
LT Lithuania 2005 Euros, m 57 57 64 77 75 79 87 102 108 107 121 142 146 116 5.6% 1.5%
LU Luxembourg 2005 Euros, m 16 17 14 16 18 17 18 19 22 12 11 15 11 18 1.0% -4.4%
MT Malta 2005 Euros, m 0 0 0 0 0 0 0 0 0 0 0 0 0 0 - -
NL Netherlands 2005 Euros, m 468 484 478 488 516 539 559 593 611 547 668 771 792 695 3.1% 2.6%
PL Poland 2005 Euros, m 443 452 437 438 511 435 472 540 612 552 675 655 702 566 1.9% -1.6%
PT Portugal 2005 Euros, m 473 485 490 494 524 531 556 612 639 583 576 624 623 671 2.7% 1.0%
RO Romania 2005 Euros, m 77 77 78 78 85 87 89 90 91 92 103 114 117 97 1.8% 1.4%
SK Slovakia 2005 Euros, m 25 27 19 28 20 20 20 22 29 17 20 17 17 23 -0.7% -4.5%
SI Slovenia 2005 Euros, m 29 30 32 34 37 39 43 51 54 49 95 81 82 97 9.8% 12.4%
ES Spain 2005 Euros, m 1,096 1,239 1,263 1,296 1,357 1,347 1,381 1,456 1,449 1,400 0 1,650 1,519 1,504 - -
SE Sweden 2005 Euros, m 1,840 1,949 1,893 1,864 1,877 2,024 1,994 2,039 2,027 1,764 1,755 2,078 1,692 1,635 -0.9% -4.2%
UK United Kingdom 2005 Euros, m 2,259 2,323 2,292 2,316 2,373 2,640 2,759 2,924 2,838 3,517 3,231 3,288 3,213 3,196 2.7% 2.4%
* CAGR up to latest available year where data from 2012 is not available
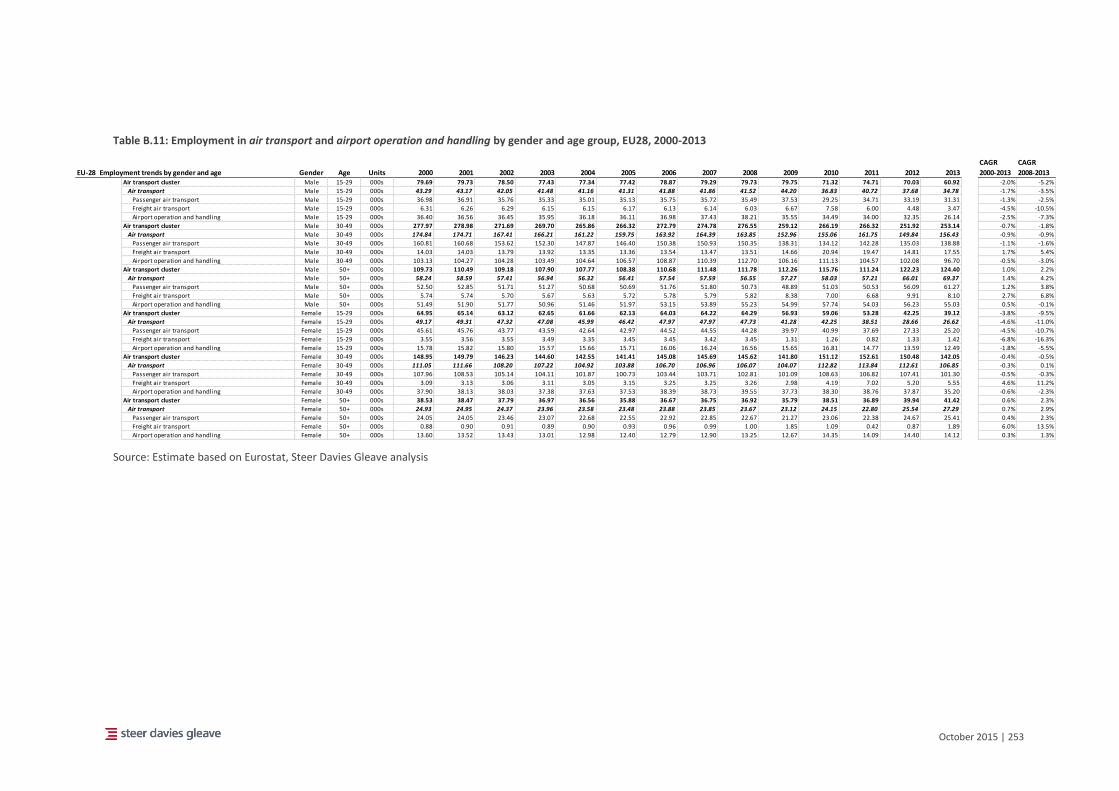
October 2015 | 253
Table B.11: Employment in air transport and airport operation and handling by gender and age group, EU28, 2000-2013
Source: Estimate based on Eurostat, Steer Davies Gleave analysis
CAGR CAGR
EU-28 Employment trends by gender and age Gender Age Units 2000 2001 2002 2003 2004 2005 2006 2007 2008 2009 2010 2011 2012 2013 2000-2013 2008-2013Air transport cluster Male 15-29 000s 79.69 79.73 78.50 77.43 77.34 77.42 78.87 79.29 79.73 79.75 71.32 74.71 70.03 60.92 -2.0% -5.2%
Air transport Male 15-29 000s 43.29 43.17 42.05 41.48 41.16 41.31 41.88 41.86 41.52 44.20 36.83 40.72 37.68 34.78 -1.7% -3.5%
Passenger air transport Male 15-29 000s 36.98 36.91 35.76 35.33 35.01 35.13 35.75 35.72 35.49 37.53 29.25 34.71 33.19 31.31 -1.3% -2.5%
Freight air transport Male 15-29 000s 6.31 6.26 6.29 6.15 6.15 6.17 6.13 6.14 6.03 6.67 7.58 6.00 4.48 3.47 -4.5% -10.5%
Airport operation and handling Male 15-29 000s 36.40 36.56 36.45 35.95 36.18 36.11 36.98 37.43 38.21 35.55 34.49 34.00 32.35 26.14 -2.5% -7.3%
Air transport cluster Male 30-49 000s 277.97 278.98 271.69 269.70 265.86 266.32 272.79 274.78 276.55 259.12 266.19 266.32 251.92 253.14 -0.7% -1.8%
Air transport Male 30-49 000s 174.84 174.71 167.41 166.21 161.22 159.75 163.92 164.39 163.85 152.96 155.06 161.75 149.84 156.43 -0.9% -0.9%
Passenger air transport Male 30-49 000s 160.81 160.68 153.62 152.30 147.87 146.40 150.38 150.93 150.35 138.31 134.12 142.28 135.03 138.88 -1.1% -1.6%
Freight air transport Male 30-49 000s 14.03 14.03 13.79 13.92 13.35 13.36 13.54 13.47 13.51 14.66 20.94 19.47 14.81 17.55 1.7% 5.4%
Airport operation and handling Male 30-49 000s 103.13 104.27 104.28 103.49 104.64 106.57 108.87 110.39 112.70 106.16 111.13 104.57 102.08 96.70 -0.5% -3.0%
Air transport cluster Male 50+ 000s 109.73 110.49 109.18 107.90 107.77 108.38 110.68 111.48 111.78 112.26 115.76 111.24 122.23 124.40 1.0% 2.2%
Air transport Male 50+ 000s 58.24 58.59 57.41 56.94 56.32 56.41 57.54 57.59 56.55 57.27 58.03 57.21 66.01 69.37 1.4% 4.2%
Passenger air transport Male 50+ 000s 52.50 52.85 51.71 51.27 50.68 50.69 51.76 51.80 50.73 48.89 51.03 50.53 56.09 61.27 1.2% 3.8%
Freight air transport Male 50+ 000s 5.74 5.74 5.70 5.67 5.63 5.72 5.78 5.79 5.82 8.38 7.00 6.68 9.91 8.10 2.7% 6.8%
Airport operation and handling Male 50+ 000s 51.49 51.90 51.77 50.96 51.46 51.97 53.15 53.89 55.23 54.99 57.74 54.03 56.23 55.03 0.5% -0.1%
Air transport cluster Female 15-29 000s 64.95 65.14 63.12 62.65 61.66 62.13 64.03 64.22 64.29 56.93 59.06 53.28 42.25 39.12 -3.8% -9.5%
Air transport Female 15-29 000s 49.17 49.31 47.32 47.08 45.99 46.42 47.97 47.97 47.73 41.28 42.25 38.51 28.66 26.62 -4.6% -11.0%
Passenger air transport Female 15-29 000s 45.61 45.76 43.77 43.59 42.64 42.97 44.52 44.55 44.28 39.97 40.99 37.69 27.33 25.20 -4.5% -10.7%
Freight air transport Female 15-29 000s 3.55 3.56 3.55 3.49 3.35 3.45 3.45 3.42 3.45 1.31 1.26 0.82 1.33 1.42 -6.8% -16.3%
Airport operation and handling Female 15-29 000s 15.78 15.82 15.80 15.57 15.66 15.71 16.06 16.24 16.56 15.65 16.81 14.77 13.59 12.49 -1.8% -5.5%
Air transport cluster Female 30-49 000s 148.95 149.79 146.23 144.60 142.55 141.41 145.08 145.69 145.62 141.80 151.12 152.61 150.48 142.05 -0.4% -0.5%
Air transport Female 30-49 000s 111.05 111.66 108.20 107.22 104.92 103.88 106.70 106.96 106.07 104.07 112.82 113.84 112.61 106.85 -0.3% 0.1%
Passenger air transport Female 30-49 000s 107.96 108.53 105.14 104.11 101.87 100.73 103.44 103.71 102.81 101.09 108.63 106.82 107.41 101.30 -0.5% -0.3%
Freight air transport Female 30-49 000s 3.09 3.13 3.06 3.11 3.05 3.15 3.25 3.25 3.26 2.98 4.19 7.02 5.20 5.55 4.6% 11.2%
Airport operation and handling Female 30-49 000s 37.90 38.13 38.03 37.38 37.63 37.53 38.39 38.73 39.55 37.73 38.30 38.76 37.87 35.20 -0.6% -2.3%
Air transport cluster Female 50+ 000s 38.53 38.47 37.79 36.97 36.56 35.88 36.67 36.75 36.92 35.79 38.51 36.89 39.94 41.42 0.6% 2.3%
Air transport Female 50+ 000s 24.93 24.95 24.37 23.96 23.58 23.48 23.88 23.85 23.67 23.12 24.15 22.80 25.54 27.29 0.7% 2.9%
Passenger air transport Female 50+ 000s 24.05 24.05 23.46 23.07 22.68 22.55 22.92 22.85 22.67 21.27 23.06 22.38 24.67 25.41 0.4% 2.3%
Freight air transport Female 50+ 000s 0.88 0.90 0.91 0.89 0.90 0.93 0.96 0.99 1.00 1.85 1.09 0.42 0.87 1.89 6.0% 13.5%
Airport operation and handling Female 50+ 000s 13.60 13.52 13.43 13.01 12.98 12.40 12.79 12.90 13.25 12.67 14.35 14.09 14.40 14.12 0.3% 1.3%
October 2015 | 254
C Airport case studies Athens International Airport
Background
C.1 This case study has been developed using information provided by Athens International
Airport (AIA) during a telephone interview and information provided via email, and from the
airport’s public website.
C.2 Athens International Airport S.A. was established in 1996 as a Public-Private Partnership with a
30-year concession agreement. The Greek state holds 55% of the shares in the private
company AIA, with the remaining 45% held by private shareholders. Following construction
the airport opened in 2001, with Ellinikon International Airport closing at the same time as AIA
opened.
C.3 Passenger traffic in 2014 was 15.2 million, a +21.2% increase on 2013 traffic levels attributed
primarily to the stabilisation of the Greek economy and airport charges incentives to grow and
attract new airlines and routes using Athens. Total cargo in 2014 was 77,338 tonnes (88%
freight and 12% mail).
Employment at Athens Airport
C.4 Under the terms of the 30 year concession agreement, AIA was under no obligation to take
over any employees of Ellinikon International Airport with the exception of Air Traffic
Controllers and airline employees. AIA was therefore able to decide and design a company
strategy regarding functions that should be provided by the airport company, and functions to
be outsourced. The airport company therefore includes an infrastructure management and
planning function, an airline marketing function, along with some other smaller functions also
provided in-house. The decision was taken to outsource non-critical functions, such as
cleaning and commercial activities. Maintenance activities are primarily outsourced with the
exception of some critical maintenance functions.
C.5 By taking this approach AIA considered the airport would operate at its most competitive, and
ensure that relevant experts provided the services required. Tenders were let to select the
most appropriate organisations for each of the relevant activities that were outsourced. Table
B.1 provides a list of outsourced functions (except ground-handling) and the contractors
providing the services. Contract length ranges from 3-5 years, and is usually no longer than 5
years.
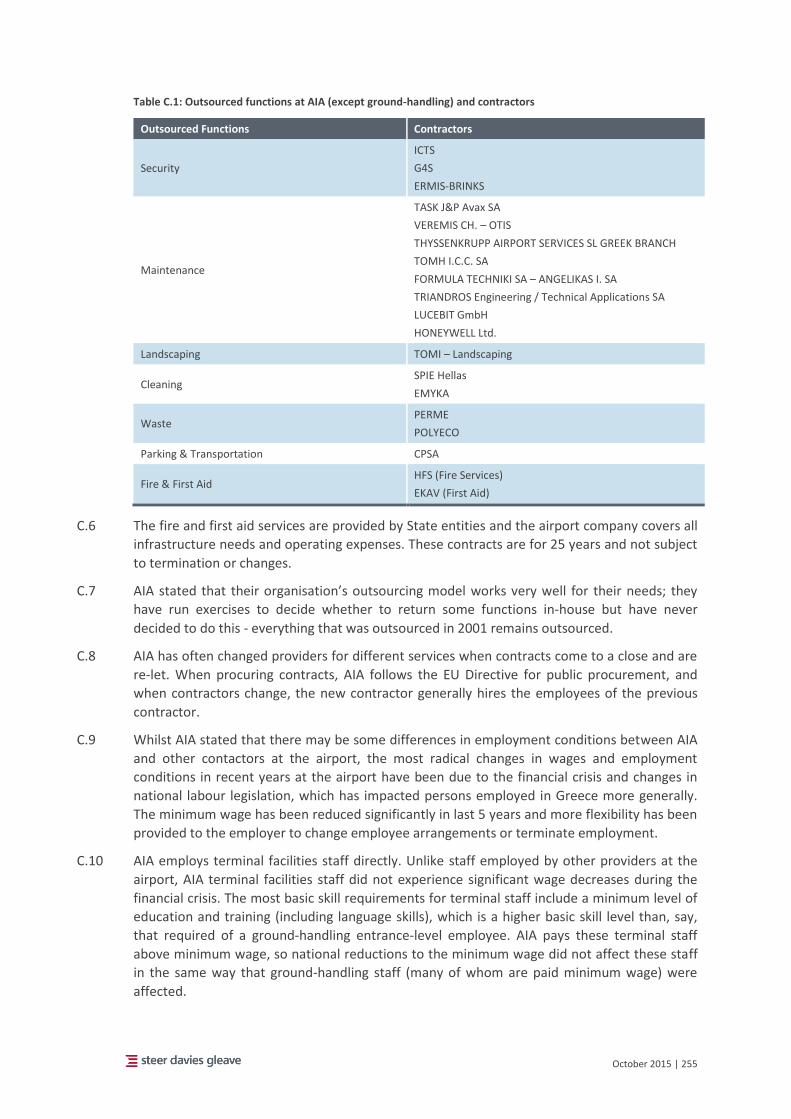
October 2015 | 255
Table C.1: Outsourced functions at AIA (except ground-handling) and contractors
Outsourced Functions Contractors
Security
ICTS
G4S
ERMIS-BRINKS
Maintenance
TASK J&P Avax SA
VEREMIS CH. – OTIS
THYSSENKRUPP AIRPORT SERVICES SL GREEK BRANCH
TOMH I.C.C. SA
FORMULA TECHNIKI SA – ANGELIKAS I. SA
TRIANDROS Engineering / Technical Applications SA
LUCEBIT GmbH
HONEYWELL Ltd.
Landscaping TOMI – Landscaping
Cleaning SPIE Hellas
EMYKA
Waste PERME
POLYECO
Parking & Transportation CPSA
Fire & First Aid HFS (Fire Services)
EKAV (First Aid)
C.6 The fire and first aid services are provided by State entities and the airport company covers all
infrastructure needs and operating expenses. These contracts are for 25 years and not subject
to termination or changes.
C.7 AIA stated that their organisation’s outsourcing model works very well for their needs; they
have run exercises to decide whether to return some functions in-house but have never
decided to do this - everything that was outsourced in 2001 remains outsourced.
C.8 AIA has often changed providers for different services when contracts come to a close and are
re-let. When procuring contracts, AIA follows the EU Directive for public procurement, and
when contractors change, the new contractor generally hires the employees of the previous
contractor.
C.9 Whilst AIA stated that there may be some differences in employment conditions between AIA
and other contactors at the airport, the most radical changes in wages and employment
conditions in recent years at the airport have been due to the financial crisis and changes in
national labour legislation, which has impacted persons employed in Greece more generally.
The minimum wage has been reduced significantly in last 5 years and more flexibility has been
provided to the employer to change employee arrangements or terminate employment.
C.10 AIA employs terminal facilities staff directly. Unlike staff employed by other providers at the
airport, AIA terminal facilities staff did not experience significant wage decreases during the
financial crisis. The most basic skill requirements for terminal staff include a minimum level of
education and training (including language skills), which is a higher basic skill level than, say,
that required of a ground-handling entrance-level employee. AIA pays these terminal staff
above minimum wage, so national reductions to the minimum wage did not affect these staff
in the same way that ground-handling staff (many of whom are paid minimum wage) were
affected.
October 2015 | 256
C.11 AIA notes also that its employee turnover is lower than that experienced by ground-handling
organisations at the airport, which it theorises is related to employees considering that the
airport is a more stable employer than the ground-handlers, which are more vulnerable to
competition with airlines switching providers.
Ground-handling at AIA
C.12 AIA decided to outsource ground-handling primarily for business reasons, but noted the
appeal also of having the power to select handlers at the airport. As with all in-scope airports
in the EU, AIA is obliged to follow the EU Directive on ground-handling, which has been
transcribed into national and local legislation. The local ground-handling regulation describes
each of the ground-handling activities, noting which are open and which are to have a limited
number of providers, which activities can be undertaken by a third party and which can be
self-handled, as well as charging rules. This results in a requirement for a certain number of
operators depending on ground-handling activity (minimum and maximum numbers).
C.13 There are three ground-handling providers at AIA:
Goldair, with 76.2% of the market share;
Swissport, with 13.4%; and
Skyserv, with 10.4%.
C.14 In the restricted third party handling activities, AIA states that providers do not change often.
Whilst tenders are run each time, there is not significant participation, which AIA considers to
be linked to the very significant investment required to establish operations at the airport, so
the incumbent providers have a benefit in this regard. AIA considers that the market is more
volatile in the open access areas, where the level of investment required to enter the market
is much smaller. The most investment- and employee- intensive activities are ramp and
baggage handling, cargo and fuelling.
C.15 At the previous airport (Ellinikon International Airport) the only ground-handling providers
were Olympic Airways and Goldair, Swissport started operating in Greece with the opening of
AIA in 2001 and now operate at other Greek airports as well.
C.16 The changes AIA has seen in the providers of ground-handling services are primarily related to
airline organisational developments. Olympic Airways once had a ground-handling subsidiary
for self- and third-party handling, however this has now been renamed skyserve. Up to 2-3
years ago, Aegean Airlines self-handled but now uses Goldair (Aegean is also a shareholder in
Goldair). AIA does not expect any other carriers to apply for a self-handling licence, and the
ground-handling tender process has recently been completed for another 7 year cycle – so no
changes to ground-handling arrangements are expected in the coming years.
C.17 There is a minimum level of required training by regulation (EU and Local Ground Handling
regulation) that all ground handling employees have to pass before they get licenced to
perform their duties. Such training is provided by the airport company and by HCAA (Hellenic
Civil Aviation Authority) irrespective of type of employment (open-ended, fixed term and
seasonal). Further to the minimum required, ground handling employees may take additional
training requested by the contracting airlines but such training concentrates mainly on
operational and quality aspects of the service to be provided.
October 2015 | 257
Temporary Agency Workers at AIA
C.18 AIA do not see any benefit in employing temporary agency workers. Use of temporary agency
workers does not fit well with the skilled mix of in-house staff that AIA has – they consider a
temporary agency worker would not be hired on a short-term basis to undertake specialised
maintenance activities or terminal supervision. The services that AIA provides in-house have
permanent, on-going needs, so it is not logical to use temporary staff for these functions.
There are however some very limited cases where AIA has engaged temporary workers
through an agency, for example to cover reception services, kitchen, and facilities for the AIA
administration building. AIA did not see any benefit in using these arrangements (it was to
fulfil a short term need rather than part of a long term strategy) and reports that the financial
benefit was negligible.
C.19 As far as AIA is aware, their providers do not engage temporary agency workers, but employ
their staff directly. AIA notes that if seasonal peaks require additional staffing, it is not difficult
to find workers to take these roles. AIA adds that the high unemployment rate in Greece has
made hiring people on seasonal contracts even easier, and there are a few areas where the
same people come every year to cover the peak period. AIA also hires fixed term contract staff
to provide information to passengers over the summer peak; again, some of these staff are
the same every year.
Conclusion
C.20 AIA operates as a PPP and from inception was able to decide and design a company strategy
regarding functions that should be provided by the airport company, and functions to be
outsourced. The decision was taken to outsource non-critical functions, such as cleaning and
commercial activities. By taking this approach AIA considered the airport would operate at its
most competitive, and ensure that relevant experts provided the services required.
C.21 Whilst AIA stated that there may be some differences in employment conditions between AIA
and other contactors at the airport, the most radical changes in wages and employment
conditions in recent years at the airport have been due to the financial crisis and changes in
national labour legislation, which has impacted persons employed in Greece more generally.
C.22 AIA do not see any benefit in employing temporary agency workers. Use of temporary agency
workers does not fit well with the skilled mix of in-house staff that AIA has – they consider a
temporary agency worker would not be hired on a short-term basis to undertake specialised
maintenance activities or terminal supervision. The services that AIA provides in-house have
permanent, on-going needs, so it is not logical to use temporary staff for these functions.
October 2015 | 258
Dublin Airport
C.23 This case study has been developed using publically available data and information on Dublin
Airport.
Background
C.24 Dublin Airport is Ireland’s largest and Europe’s 25th busiest airport, handling 21.7 million
passengers in 2014, a +7.7% growth over the previous year. It is operated by the Dublin
Airport Authority (daa). Dublin Airport has a mix of full cost and low cost flights serving short
and medium haul destinations. The airport is the main base for Aer Lingus, the national flag
carrier of Ireland, and a major base for the low cost carrier Ryanair. These two airlines account
for more than 80% of passengers at the airport.
C.25 Dublin Airport’s traffic has fluctuated over recent years rising to a peak of 23.5 million
passengers in 2008 before falling to only 18.4 million in 2010, a reduction linked to the
particular severity of the financial crisis in Ireland. Recovery since then has been relatively
strong and 2015 passenger numbers to date are +14% higher than the first five months in
2014.
C.26 Dublin airport expanded its terminal capacity in 2010 with the opening of its new Terminal 2,
which when combined with the original Terminal 1 provides a passenger capacity of
approximately 35 million passengers.
C.27 Aer Lingus and the majority of long haul carriers have moved to Terminal 2, which also has a
United States of America pre-border clearance facility, while Ryanair has remained in Terminal
1.
C.28 The operations of Terminal 2 were subject to significant discussion with Ryanair suggesting
that Terminal 2 be built as a low-cost facility, and run by a competing operator. The Irish
government originally decided that the daa would build Terminal 2 and that its operation
would be put out to tender. However, in March 2010 it was decided that Terminal 2 would be
operated by the daa as the other applicants did not meet the requirements for operating the
terminal. In practice, daa has differentiated the approach to operating Terminal 2 and
Terminal 1 as discussed in greater detail below.
Terminal 2: Different working arrangements for ‘new’ versus ‘legacy’ staff
C.29 The opening of Terminal 2 in 2010 coincided with the economic crisis, where there were
limited job opportunities particularly for low skilled workers, and a reduction in passengers
numbers using the airport. Under these conditions, daa was able to negotiate with staff, and
this resulted in the following:
Reduction in the number of staff through a voluntary severance scheme;
Salary reductions for existing staff, to be reversed when certain profit triggers were
achieved;
Staff for the new Terminal 2 operation to be recruited on contracts with lower costs and
fewer restrictions on working practices; and
New staff in Terminal 1 to be recruited on contracts with lower costs and fewer
restrictions on working practices.
C.30 The outcome of this negotiation meant that there were effectively two tiers of contracts
managed by daa for its staff: the ‘legacy’ contract and the ‘new’ contract. The new contract is
applied to all new entrants and provides for lower salary and associated costs and fewer
October 2015 | 259
restrictions on working practices. For example for security staff, in Terminal 2 there are two
staff groups, full and part time, with the latter having variable weekly hours (between 16 and
40 hours per week, at management’s discretion), whereas in Terminal 1 the rostering is much
less flexible.
C.31 DAA have created subsidiary companies Airport Services Consolidated Limited (ASC )(for new
Terminal 2 staff) and DAA Airport Services Limited (DASL) (for new Terminal 1 staff) to enable
different contractual arrangements to be introduced as compared to legacy staff of daa (pre-
2010).
C.32 The range of functions where these differential contracts have been introduced include:
Retail services;
Maintenance services;
Cleaning and facilities management services;
Car parking services; and
Security services.
C.33 Cost per staff varies very significantly between those employed on legacy daa contracts and
those with contracts for Terminal 2, employed by daa subsidiary company ASC, or newly
employed Terminal 1 staff, employed by daa subsidiary company DASL, excluding those
transferred from daa contracts. The new contracts are based on salaries and conditions
prevalent in the local job market while legacy staff appear to be paid on average
approximately 60% more than this benchmark comparison.
Conclusion
C.34 At the time of opening the new Terminal 2, daa was under considerable pressure from the
economic recession, its main users and the Irish Government to introduce a cost-effective way
of operation.
C.35 Although they did not resort to widespread use of outsourcing, daa used the creation of
subsidiary companies ASC and DASL to enable ‘new’ employees in Terminal 2 and Terminal 1
to be employed under different conditions to those of ‘legacy staff’. The salary levels were set
at benchmarks with other companies in the Irish economy and materially less than those paid
to legacy workers. In addition greater flexibility in working conditions were agreed facilitating
rostering in areas such as security and cleaning to more closely match the airports operational
needs.
October 2015 | 260
Liège Airport
Background
C.36 This case study has been developed using information provided directly by Liège Airport and
Liège Air Cargo Handling Services (LACHS), and supplemented with information gathered from
the airport website (http://www.liegeairport.com/).
C.37 Liège Airport is located in Belgium, in the middle of a triangular area linking Paris, Frankfurt
and Amsterdam that sees nearly 66% of European freight transiting within it. The airport
focusses on cargo activities; with 561,000 tonnes of cargo handled by Liège Airport in 2013 it is
the eighth largest cargo airport by volume in Europe. Passenger services tend to be offered in
summer peaks only, primarily by tour operators. Liège Airport handled just over 315,000
passengers in 2013.
C.38 Liège Airport is a privately owned company, with 51% owned by TEB Participations, 24% by
SOWAER (Walloon regional Airports) and 25 % by ADPm (Paris Airports Management), a
subsidiary of ADP (Paris Airports). The airport is operated under a renewable 50-year
concession contract (1990-2040) agreed with the Walloon Region.
Employment at the airport
C.39 Liège Airport S.A.’s workforce currently comprises 160 employees. In addition, the airport
company has two subsidiaries:
Liège Airport Security, created in 2008 when Belgian law required that security matters be
external of the airport operator. This business employs 29 individuals; and
The property company Liège Airport Business Park, created in 2010 with a focus on real
estate management (rather than airport operation) and employing three full time
equivalents.
C.40 The airport estimates that the number of directly employed personnel on the airport campus
is approximately 2,800 persons (1,600 full time and 1,200 part time), by 76 companies111.
Overview of ground-handling operations at Liège Airport
C.41 Liège Airport offers a “Flexport” product for cargo clients, offering 24/7 service, flexibility,
capacity and space for larger operations.
C.42 Ground-handling has always been outsourced at the airport (the airport is 25 years old) and
there are currently approximately 25 ground-handling companies at the airport, with a range
of services from a small number of activities to the full services. There are five “complete”
ground-handling companies operating on the site.
C.43 The airport considers that ground handling operations must be outsourced (rather than
provided by the airport) as cargo airlines tend to work with the same handlers across their
operations, so it is important that these handlers can establish operations at the airport and as
a result attract the airlines. Liège Airport therefore does not offer a ground-handling service
itself, and does not limit the number of ground handlers on site.
111 http://www.liegeairport.com/en/employment
October 2015 | 261
C.44 Consistent handling across the journey is important for the smooth facilitation of the flow of
goods from origin to final destination (i.e. not just airport to airport). It is important to have a
warehouse in front of the aircraft when it arrives for swift unloading, in particular for live or
perishable goods. For these reasons cargo airlines often prefer to work with a single handler in
order to ensure a unique supply chain from origin to destination. Each ground-handling
operation requires its own warehouse at the airport, so that movement of goods between
aircraft and road transport is swift and efficient. The airport noted that this is the case for
many but not all of the cargo airlines operating at the airport – some airlines are happy to use
a ground-handler that is already operating at the airport.
C.45 Ground handling arrangements at the airport are based on the requirements of Directive
96/67/EC. Ground-handling organisations which want to establish an operation at Liege
Airport must reach an agreement with the Walloon regional government, and if this is reached
then the operator may establish itself at the airport. The airport has seen very little change in
the number and range of ground-handlers in recent years, with the most recent new market
entrant, Swissport, launching services two to three years ago.
C.46 There is a large amount of physical space at the airport for new ground-handling companies to
establish an operation. The airport states that there are challenges in establishing a new
operation at the airport, as the company would need to set up operations from scratch,
however this would be a regular challenge for the major global companies. The usual
arrangement is that a ground-handling provider and the airport would agree a contract for 10
years for use of an airport-owned warehouse with access to the apron and runway.
C.47 Whilst there are 25 operators providing ground-handling services at the airport, there are four
dominant providers, as follows;
TNT is the largest provider by volume at Liège Airport (TNT a has an EU hub at Liège
Airport and also self-handles at the airport). TNT handles approximately half of the
ground-handling market at the airport.
Aviapartner has approximately a quarter.
LACHS (a subsidiary of Cargo air alliance) has 16%.
Swissport 5%.
C.48 As noted Swissport is the most recent market entrant, 2-3 years ago. Initially Swissport
handled for Avient Aviation (an African cargo airline with base in Liège Airport) and now
handles a little of TNT’s operations as well. Liège Airport considers that future changes to the
ground-handling providers at the airport are possible but that these depend on their airline
clients and whether they wish to use a particular provider that may not already be established
at the airport.
C.49 The airport has no data on ground-handling charges at the airport as these are generally the
outcome of a negotiation between the provider and airlines.
Liège Air Cargo Handling Services (LACHS)
C.50 LACHS is a cargo handling company based at Liège Airport. LACHS handles general cargo, with
the capability to handle specific sensitive cargo also, e.g. temperature controlled cargo,
horses, other live animals, and valuable works of art. LACHS’ main customers at Liège Airport
are as follows:
Airlines: CAL (Cargo Airlines Ltd), ANA, Euro Cargo Aviation, Blue Bird;
Agents: Fresh Freight, FFF (Fast Forward Freight), ADELANTEX, Fresh Express; and
October 2015 | 262
Brokers: Costair, Geodis, Peden.
C.51 LACHS’ contract durations with customers range from an undetermined amount of time to
yearly re-signings with automatic renewal.
C.52 LACHS permanently employs 200 people at Liège Airport:
20 office employees (managers and administrative employees);
56 operational employees (5 duty leaders, 6 shift leaders, 15 sales-logistics, 10
loadmaster/load controller, 20 cargo documentation employees; and
124 employees with manual ground-handling tasks.
C.53 LACHS hires all employees through temporary employment agencies in a three step process:
1. Workers are first engaged on a temporary bases through a temporary employment
agency;
2. If performance is good, workers are then offered fixed term contracts (CDD); and
3. Permanent employment (CDI) is offered to workers after a maximum of four CDD.
C.54 Progress through each of the steps is against an individual’s evaluation against the required
competencies. LACHS considers that this approach to hiring staff is the most beneficial to both
themselves and the workers involved, as it enables better integration into the organisation,
better understanding of the ways of working and a more comprehensive understanding of the
potential employee of the specific requirements and demands of working in an air cargo
handling operation. In other words, by the time a permanent employment contract is signed
the employee and employer are familiar with each other.
C.55 Currently, LACHS’ primary outsourced task is maintenance activities, as this is not considered
to be a core part of the business. LACHS has used subcontractors for other activities in the past
but for economic, efficiency and social reasons, LACHS decided to in-source these activities
once more. Subcontractors pay their employees as per the subcontractor’s own social and
salary policy rules, which LACHS does not interfere with, beyond being certain that
subcontractors respect social, safety and quality obligations in line with both national and
European law and LACHS rules and requirements. LACHS regularly reviews and analyses its
organisational needs and may decide to subcontract other activities which are not in its core
business in future.
C.56 LACHS provides all workers (permanently employed and temporary agency workers) with the
training required for cargo activities (including building training, ERP system usage, procedure
of working, safety procedures, and quality procedures). As noted below, Liège Airport provides
airport security and safety training to all persons employed on the airport campus.
C.57 LACHS states that its wages for ground-handling activities have increased above inflation in the
past five years, as “the company has been able to support this”. Management and office staff
are represented by SETCa (syndicale d'employés, de techniciens et de cadres) and CNE
(Centrale nationale des employés), and the manual ground-handling staff are represented by
FGTB (Fédération Générale du Travail de Belgique).
C.58 LACHS considers that relationships with unions and social dialogue activities are good, and
that unions are involved in all aspects of the company’s development. Requirements for
collective labour agreements in Belgium are clear, with all basic requirements for coverage
being enshrined in Belgian employment law, and individual contract level fix particular rules
October 2015 | 263
such as duration of employment, function, wages, conditions of work, and time schedules, all
within the boundaries of the general employment law requirements.
Liège Airport: other outsourcing and subsidiaries
C.59 Liège Airport is primarily a cargo airport with very low levels of passenger activity
(approximately only 300,000 per annum focused on charter operations in the summer
months). As the airport does not have year-round passenger activity, there is a need for a very
flexible passenger terminal staff group. There are three permanent employees and any
additional staffing requirements in peak periods are hired through temporary work agencies.
Liège Airport has relationships with three agencies (Adecco, Tempo-Team and LEM intérim)
and the number of temporary workers depends on charter airline schedules in the summer,
usually for the three peak summer months.
C.60 Each summer, between 5 and 10 people are hired to provide additional passenger terminal
coverage. Generally the workers hired differ from year to year, but on occasion, the same
people are hired each year. Terminal staff hired through agencies are required to have
language competencies in Dutch, German and English, and receive a large amount of training
in security, safety, and installations, requiring approximately one week of training before the
three month summer placement begins. After September the contracts for these temporary
agency employees are concluded as the core permanent staff numbers are sufficient to cover
the lower levels of passenger activity in the remainder of the year.
C.61 Temporary agency workers are also occasionally used to cover longer term absence of regular
staff due to illness.
C.62 In Belgium, the trade union responsible for a certain sector covers all employees within the
sector regardless of employer. Therefore, temporary agency employee wage increases and
social conditions are negotiated by the unions in the same manner as those for directly
employed staff. The level of the wage is not fixed by the union, however, this is the set by the
employer. Liège Airport confirmed however that temporary agency workers at the airport
have the same salary as employees hired directly by the airport.
C.63 Temporary agency workers at Liège Airport can transfer to become permanent employees
however this is not a normal occurrence due to the low staff levels overall (only 3 in terminal
operations).
C.64 Liège Airport observes no differences in the rate of accidents or incidents between
permanently employed staff and those employees engaged through a temporary agency.
C.65 Liège Airport organises training for all employees of ground-handling organisations at the
airport in airport security and safety measures. This training is mandatory under Belgian law
but is also in the airport’s interest to as it limits security issues and prevents accidents. All
employees on the airport campus, no matter who employs them, require minimum training.
The airport is not aware of the specific handling training programmes provided by ground-
handlers directly to their employees.
C.66 Every two or three years in Belgium, wages for certain employee types (by sector) are
negotiated between trade unions and employers at high level. This regularly results in
increases in wages, and relates to all employees with a contract at the airport. Liège Airport
workers are represented by the Belgian socialist union (General Confederation of Liberal Trade
Unions of Belgium), which represents all workers in a general sense, with representatives for
each sector.
October 2015 | 264
Conclusion
C.67 Liège Airport is a cargo-focussed airport that operates year-round, 24 hours a day. To address
the specific requirements of its primary customers (the cargo airlines), the airport has always
(since its inception 25 years ago) outsourced ground-handling and in addition does not restrict
the number of ground-handlers operating on the site. Ground-handling organisations
operating on site typically require access to a dedicated warehouse. There are currently no
capacity restrictions that might limit the number of ground-handling organisations operating
at the airport.
C.68 LACHS, a cargo handling company based at Liège Airport, handles general and specific cargo.
The organisation permanently employs 200 people at Liège Airport, 10% in the office and the
remainder in operational ground-handling roles. LACHS hires all employees through temporary
employment agencies in a three step process:
1. Workers are first engaged on a temporary bases through a temporary employment
agency;
2. If performance is good, workers are then offered fixed term contracts (CDD); and
3. Permanent employment (CDI) is offered to workers after a maximum of four CDD.
C.69 LACHS considers that this approach to hiring staff is the most beneficial to both themselves
and the workers involved, as it enables better integration into the organisation, better
understanding of the ways of working and a more comprehensive understanding of the
potential employee of the specific requirements and demands of working in an air cargo
handling operation.
C.70 Liège Airport’s passenger activity relates primarily to charter airline trips in the summer
months. The airport therefore relies on temporary agency workers for three months each year
to accommodate the additional passenger demand.
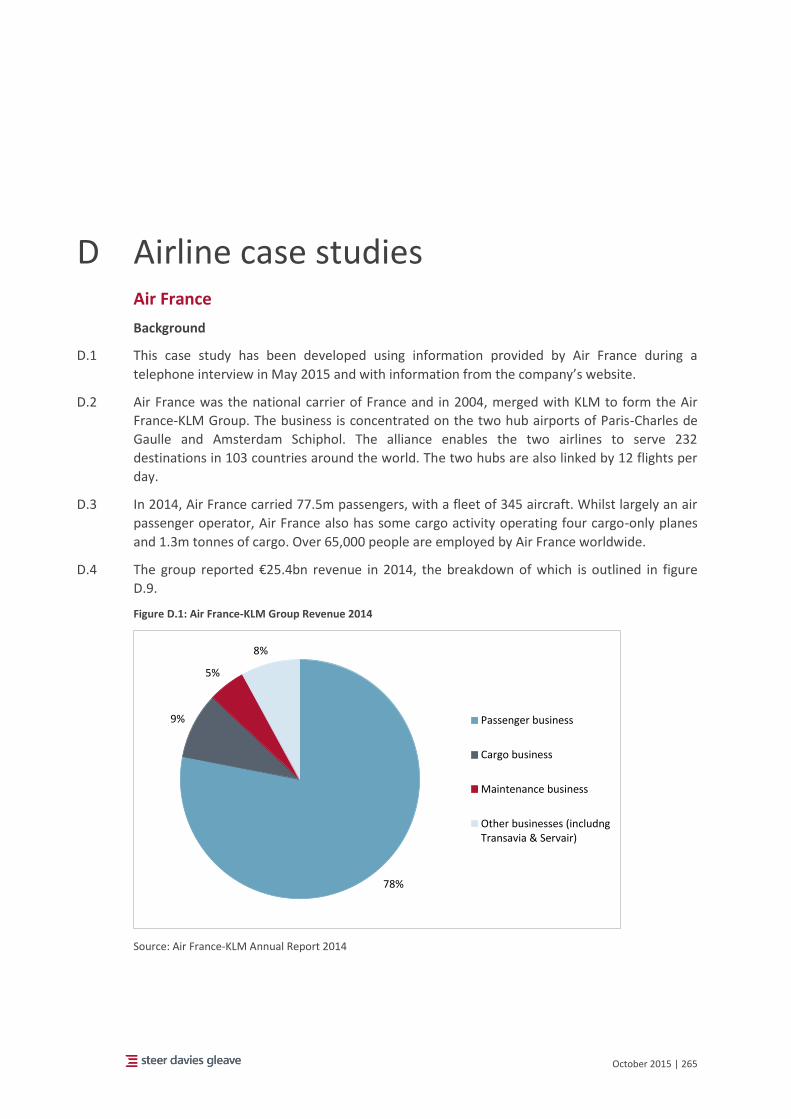
October 2015 | 265
D Airline case studies Air France
Background
D.1 This case study has been developed using information provided by Air France during a
telephone interview in May 2015 and with information from the company’s website.
D.2 Air France was the national carrier of France and in 2004, merged with KLM to form the Air
France-KLM Group. The business is concentrated on the two hub airports of Paris-Charles de
Gaulle and Amsterdam Schiphol. The alliance enables the two airlines to serve 232
destinations in 103 countries around the world. The two hubs are also linked by 12 flights per
day.
D.3 In 2014, Air France carried 77.5m passengers, with a fleet of 345 aircraft. Whilst largely an air
passenger operator, Air France also has some cargo activity operating four cargo-only planes
and 1.3m tonnes of cargo. Over 65,000 people are employed by Air France worldwide.
D.4 The group reported €25.4bn revenue in 2014, the breakdown of which is outlined in figure
D.9.
Figure D.1: Air France-KLM Group Revenue 2014
Source: Air France-KLM Annual Report 2014
78%
9%
5%
8%
Passenger business
Cargo business
Maintenance business
Other businesses (includngTransavia & Servair)

October 2015 | 266
D.5 The details outlined in the case study below refer solely to the operations of Air France, rather
than the group as a whole.
Employment arrangements
Outsourcing
D.6 Depending on the location, Air France outsource a large proportion of ground-handling to local
providers, particularly the low skilled ground-handling activities such as baggage-handling.
However, not all ground-handling is outsourced and Air France self-handles at a number of
airports.
D.7 Air France believe they are the only major airline in Europe to practice self-handling, noting
that the majority of others solely use external providers. Although they have not determined a
strategic direction, Air France expect that their future trend will be to outsource more ground-
handling activities and only keep high-skilled jobs in house. They recognise that self-handling is
generally more expensive than using external providers.
D.8 Some maintenance activities are also outsourced at the airline, particularly for high-skilled,
specialist functions. Air France note that it is not economical to employ experts in these fields
directly when they are only required relatively infrequently (perhaps only once per week).
D.9 Air France does not outsource any flight or cabin crew. Some cabin crew are employed from
China, however, these are employed directly by Air France in accordance with French law, and
receive the same pay and conditions as all cabin crew.
Self-employment
D.10 Air France report that they do not employ anyone on a self-employed basis. They believe that
self-employment is not consistent with ensuring the strict standards of safety are met.
Temporary agency workers
D.11 Air France do not engage temporary agency workers in flight or cabin crew roles, preferring to
offer short-term, direct employment contracts instead. Occasionally temporary agency
workers are engaged in back-office functions, such as Information Technology when there is a
requirement to build up a new team or skills base, but this is relatively rare.
Operational base
D.12 Air France’s home hub and main base is at Paris-Charles de Gaulle airport (CDG). Under the
previous CEO, additional home bases were set up in Nice, Marseille, Lyon and Bordeaux,
believing that it would be more efficient to fly long-haul direct from these additional bases
without needing an interchange at CDG. However, these additional home bases are being
reviewed, as demand for long-haul routes from these bases has not been sufficiently high to
justify direct flights.
D.13 Air France cabin crew and pilots are based in Paris and consider Paris as a whole to be the
home base. Although CDG is the principle hub airport, a number of crew fly out of Paris Orly.
Air France consider CDG and Orly (within 41km of each other) to be a single airport for the
purposes of employment contracts. Related to a case not directly linked to air transport, a
Supreme Court ruling supported their working practices that moving workers from one
location to the other is not considered a significant enough alteration to the employment
contract when close to 40km. This system enables Air France significant flexibility when
assigning staff to different airports.
October 2015 | 267
D.14 As all Air France staff are based in Paris, the changes made to the home base rule in 2012 have
had no impact on the airline, meaning that air crew remain taxed and subject to social
payments in France. From Air France’s perspective, the home base must be the real and usual
work place of the crew to be consistent with the law. In the case of bases outside of Europe:
they believe that if crew members fly in and out of Beijing and the majority of their duties are
based there, then Beijing is the home base. However, if they live in Beijing but start and finish
their flight duties in Gatwick, then Gatwick should be interpreted as their home base.
D.15 Air France also considers its principle place of business to be CDG in France. They understand
that the principle place of business refers specifically to where the financial, administrative
and legal aspects of the organisation to be based. However, they consider that the focus of the
air activity should also be taken into account when defining the principal place of business.
Social dialogue
D.16 All Air France staff are covered by Collective Labour Agreements (CLAs). There are four types
of CLAs at Air France:
CLA to cover all staff – this covers main issues such as holiday entitlement;
Specific CLAs to cover different categories of staff:
flight crew;
cabin crew; and
ground staff.
D.17 Different CLAs exist in order to account for the different conditions and requirements of
employees of different functions. For example, flight crew have significantly higher pay than
ground staff and consequently different CLAs apply.
D.18 Given that CLAs cover all employees, levels of unionisation within Air France are relatively low.
Air France report that 12-13% of all employees are members of a union, however, unionisation
amongst pilots is estimated to be much higher at around 40-45%. Any changes agreed by
unions effect all employees, not only those who are union members, and therefore, fewer
employees see the benefit of joining a union.
D.19 Despite the fact that unionisation is not significant, all representative unions are involved in
any negotiations which change the employment or working conditions of Air France
employees. When Air France wishes to make an alteration to any terms, it is obliged to invite
all representative unions to these negotiations, which could be performed separately for each
staff group depending on the matter. Although Air France have had disputes with unions, they
believe this trend is changing in France, given the 2008 law on representativeness. Indeed, if
an agreement is reached, it is not necessary for it to be signed by all unions present, but 30%
representativeness is required.
D.20 Six work councils exist in France at the enterprise level. These report to the centralised work
council, which subsequently feeds into the European work council. For some issues, it is only
necessary to open negotiations with a single enterprise work council. Where the issue is
common to all councils, the issue is negotiated at the level of the central work council.
Conclusion
D.21 Air France has largely maintained a traditional approach to employment of its air crew. All air
crew are employed directly and they do not outsource any of these functions nor engage
October 2015 | 268
temporary agency workers. However, its employment model has become more flexible and
cost-effective by reducing staff and adapting working conditions.
D.22 Amongst ground staff, whilst Air France does maintain some higher-skilled functions in house
and self-handles at a number of airports, increasingly these activities are under consideration
for outsourcing in order to reduce costs. Where an activity is not a core function of the airline,
and is either low-skilled or very specialist (such as some high-skilled maintenance), then
outsourcing is seen as the logical and economic step.
D.23 Air France has been unaffected by the revision of the home-base rule in 2012. All its crew are
based in France, and therefore are taxed and subject to social payments there. In order to
enhance flexibility, all staff is based within the ‘Paris system’, allowing employees to be based
at either Paris airport (CDG or Orly) without contravening their employment contract
obligations.
D.24 Collective labour agreements cover all staff at Air France, and are disaggregated by employee
group when negotiating specific issues, such as pay. Representative unions play a role in all
negotiations, although unionisation participation rates are not particularly high and
agreements can be reached without approval of all unions.
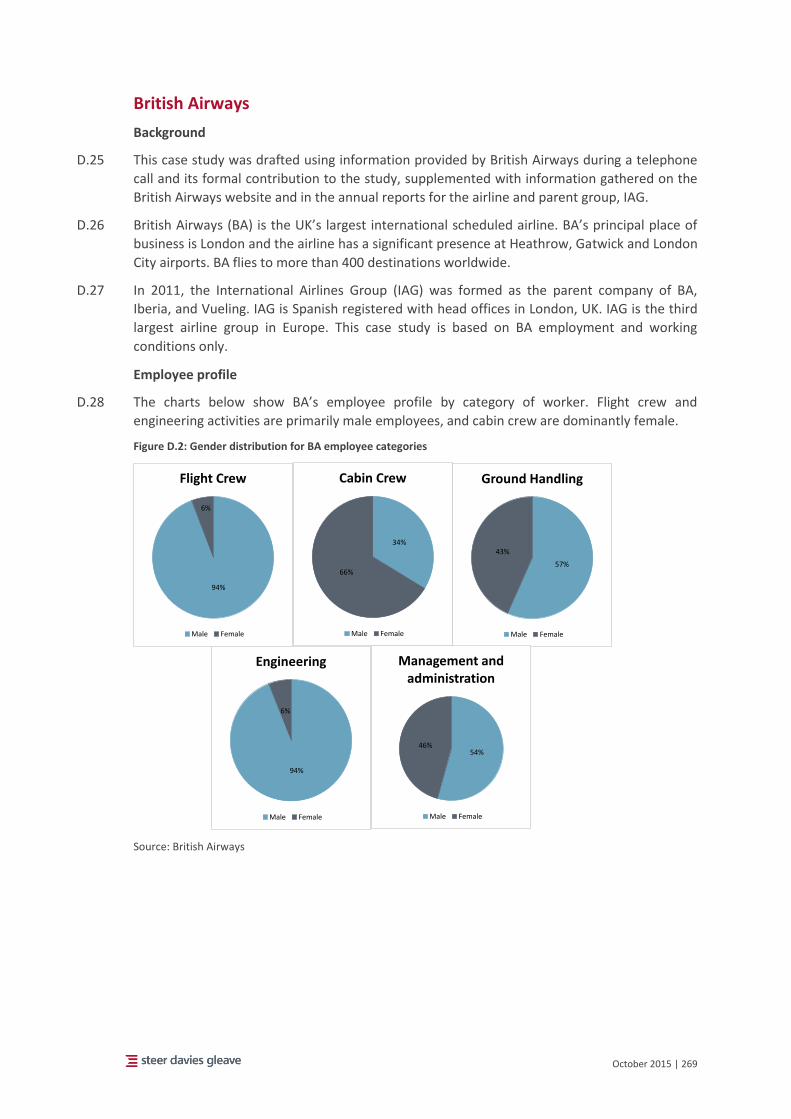
October 2015 | 269
British Airways
Background
D.25 This case study was drafted using information provided by British Airways during a telephone
call and its formal contribution to the study, supplemented with information gathered on the
British Airways website and in the annual reports for the airline and parent group, IAG.
D.26 British Airways (BA) is the UK’s largest international scheduled airline. BA’s principal place of
business is London and the airline has a significant presence at Heathrow, Gatwick and London
City airports. BA flies to more than 400 destinations worldwide.
D.27 In 2011, the International Airlines Group (IAG) was formed as the parent company of BA,
Iberia, and Vueling. IAG is Spanish registered with head offices in London, UK. IAG is the third
largest airline group in Europe. This case study is based on BA employment and working
conditions only.
Employee profile
D.28 The charts below show BA’s employee profile by category of worker. Flight crew and
engineering activities are primarily male employees, and cabin crew are dominantly female.
Figure D.2: Gender distribution for BA employee categories
Source: British Airways
94%
6%
Flight Crew
Male Female
34%
66%
Cabin Crew
Male Female
57%
43%
Ground Handling
Male Female
94%
6%
Engineering
Male Female
54%46%
Management and administration
Male Female
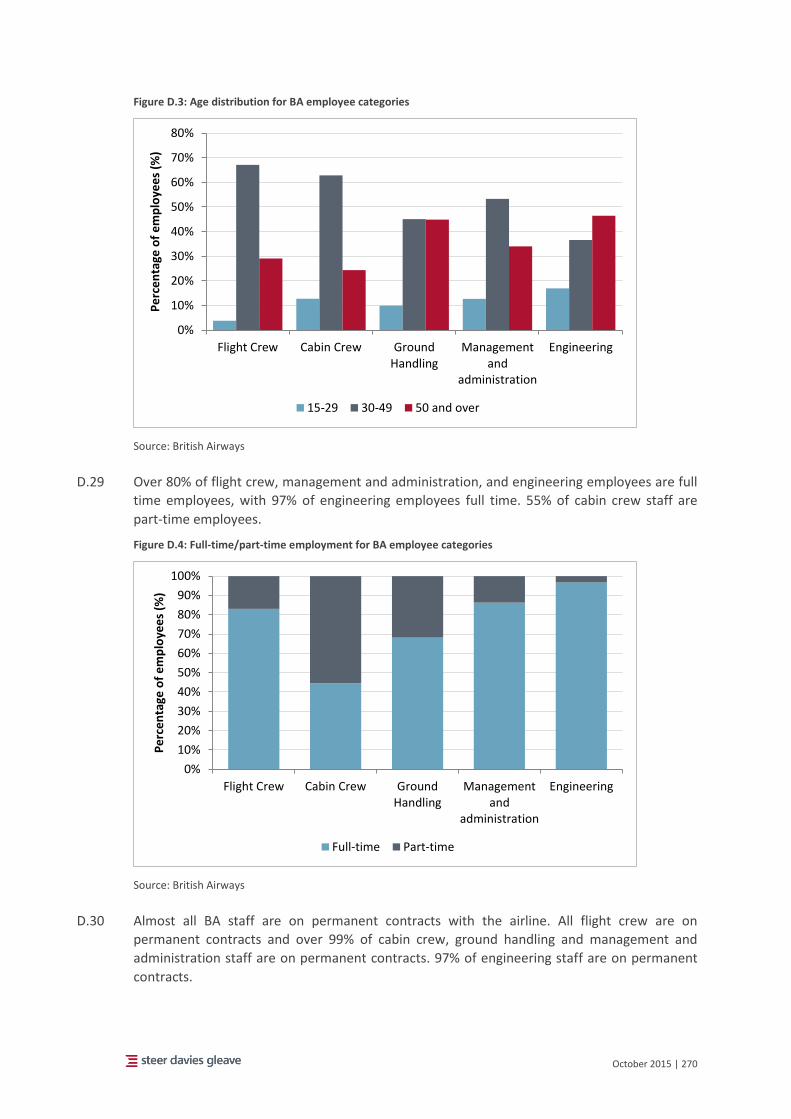
October 2015 | 270
Figure D.3: Age distribution for BA employee categories
Source: British Airways
D.29 Over 80% of flight crew, management and administration, and engineering employees are full
time employees, with 97% of engineering employees full time. 55% of cabin crew staff are
part-time employees.
Figure D.4: Full-time/part-time employment for BA employee categories
Source: British Airways
D.30 Almost all BA staff are on permanent contracts with the airline. All flight crew are on
permanent contracts and over 99% of cabin crew, ground handling and management and
administration staff are on permanent contracts. 97% of engineering staff are on permanent
contracts.
0%
10%
20%
30%
40%
50%
60%
70%
80%
Flight Crew Cabin Crew GroundHandling
Managementand
administration
Engineering
Pe
rce
nta
ge o
f e
mp
loye
es
(%)
15-29 30-49 50 and over
0%
10%
20%
30%
40%
50%
60%
70%
80%
90%
100%
Flight Crew Cabin Crew GroundHandling
Managementand
administration
Engineering
Pe
rce
nta
ge o
f e
mp
loye
es
(%)
Full-time Part-time
October 2015 | 271
Flight and cabin crew employment arrangements
D.31 BA do not outsource flight crew or cabin crew at all. There are a number of reasons for this:
BA consider these functions to be safety critical and outsourcing them does not fit with
the risk averse culture of the airline;
BA prefer to have a high level of control over these customer facing staff; rather than
employing agency pilots, BA prefer to have their own pilots, properly trained in the “BA
way of doing things”; and
BA are comfortable with their strategic human resource planning capabilities; the flying
schedule is known 2-3 years in advance and BA are confident their systems can ensure
they have the right people available at the right time, thus negating the need for short
term coverage.
D.32 In 2009, BA established a new cabin crew fleet, the Mixed Fleet (MF), that is based at London
Heathrow Airport (LHR) and flies to a combination of short and long haul destinations. There
are just under 4,000 persons employed in the MF cabin crew. Entry level salaries for a MF role
is £13,500, which BA states is 10% higher than offered by their competitors, in line with the BA
wage strategy to pay market rate plus 10%.
D.33 MF employment conditions and salary are different (lower) than for ‘Legacy’ cabin crew staff,
or the Worldwide (WW) fleet who were employed prior to the MF establishment in 2009.
Average legacy crew salary is £36,000 per annum.
D.34 The flight crew salary increase in 2013 was automatic under the collective labour agreement,
which allows for an “inflation plus x%” increase.
D.35 BA consider that the MF and WW conditions and wages, combined with the overall BA
employment proposition/brand appeal (including for example staff travel benefits, and variety
of work) presents an attractive proposition for potential recruits. In 2014, BA received in
excess of 10,000 applicants for 700 MF vacancies. BA notes that mixed fleet turnover is higher
than legacy fleets, but with the different conditions this is not surprising, and strategically, in
the longer term, the MF ensures BA has fully trained and compliant cabin crew staff employed
at a competitive rate. This is considered beneficial to both the customer and the organisation.
D.36 BA have a scheduling system that allows flight and cabin crew to bid for work: employees may
select either the days they wish to be at home, or the regions they wish to work in, or a
combination of the two, and BA schedule around these requests.
Outsourcing is limited
D.37 For BA, which carefully tracks impacts and trends in customer satisfaction, the significant pay
back on their customer satisfaction scores is cabin crew performance. This is a key driver in
their decision to employ these workers directly rather than outsource (to a temporary agency
or other organisation). For other functions, such as baggage handlers, the customer’s primary
concern is that their baggage arrives at their destination with them, a requirement that can be
written into strict Service Level Agreements (SLA) that BA has with their handling agents,
which drives improvement in operational performance. For customer facing staff, however,
the brand is key, and BA considers this is best managed and controlled when these functions
are provided in-house.
D.38 As a result, most BA workers are directly employed, however some functions have been
outsourced, as follows:
October 2015 | 272
Ground-handling functions have been outsourced across Europe, as well as UK regional
airports.
At London Gatwick Airport (LGW), ramp handing has been outsourced but not ground-
handling customer service functions. BA wants customer facing staff at its home base
(London) to be BA employees.
D.39 No activities have been outsourced at LHR; all above and below the wing staff are in-house.
This is partially due to the potential industrial relations issues that would arise should BA take
this route regarding their ground-handling staff.
D.40 For airports where BA has outsourced the ground-handling function, there remains a duty
manager at most of the airports where BA operates who is a BA employee. BA notes that there
is a move, however, for this duty manager function to be undertaken by a third party handler
as well, as is already the case for some airports in the USA. These days, passengers undertake
more activities online, and so many carry hand luggage only, meaning the length of time a
customer interacts with BA employee is reducing. There is therefore less of a need for BA’s
own staff managing ground operations at airports, ensuring the BA brand is presented to
customers. BA’s customer research on the issue has found that the branding doesn't matter so
much so these customers.
D.41 There has been some merging of back-office functions with the creation of IAG. As there was
no need for duplicate departments across the airlines in the group, some of the back-office
functions, such as IT and group finance, are no longer operating at an airline level, but IAG
level. Transactional finance activities have been outsourced to a Polish organisation, and the IT
service centre has also been outsourced, all in compliance with EU Directives and local
legislation.
D.42 BA states that the risk-adverse nature of the organisation means that the airline does not view
outsourcing as a solution for all parts of its operation. The airline cited as an example their
reservations call centre in Jacksonville, USA, which was outsourced but then closed and work
taken back in-house, to Manchester and Newcastle in the UK, for a range of drivers including
cost-effectiveness, operational performance and customer scores.
D.43 Having said that, that there are further potential opportunities for outsourcing in the next 5
years, with procurement activities cited as an example, or other back-office functions. These
functions could be outsourced elsewhere in Europe for a lower cost. In addition, some HR
functions, such as succession planning, may be more efficient if undertaken at an IAG level
rather than airline level. However the airline was clear these were ideas and that nothing had
been decided.
D.44 BA accepted that the unions are not pleased about the airline’s outsourcing decisions, but that
the airline does consult on these changes through a European Works Council. The unions have
stated that they wish to see a transnational European works council for IAG, and the terms of
this arrangement are currently being negotiated. Directly elected representatives have been
identified by work group (pilots, cabin crew, etc.), and each of the three airlines in the group
would have a representative for each work group.
Temporary agency workers
D.45 BA’s use of temporary agency workers is limited. Temporary agency workers are used in the
BA resourcing/recruitment centre, where they are relied on to support high volume
October 2015 | 273
recruitment activity. For example, agency employees from Hudson are currently supporting
BA’s pilot campaign.
D.46 There are limited examples of temporary agency workers transferring to direct employee
status with BA, primarily due to BA’s limited use of these workers overall.
Employment: contract, jurisdiction and representation
D.47 All BA flight crew and all BA employees working in UK are employed under a UK employment
contract. Whilst no flight crew are employed outside of the UK, BA has a number of
international cabin crew bases, where cabin crew are employed in a specific country to cover
specific needs. These international bases are in the following locations:
Buenos Aires, Mexico City, Sao Paulo, Cairo, Mumbai, Tokyo, Hong Kong, Delhi, Bahrain,
Singapore, Chennai and Bangalore.
D.48 BA considers this is the most practical approach to cabin crew staffing from a customer
perspective, as these employees understand the language and culture where they are based.
For the cabin crew at international bases, their assigned home base is where they are located
(e.g. Cairo), and this is also where these crew start and finish their shifts. These crew are
employed under local market rates, the Cairo base was cited as an example where employees
are hired under conditions equivalent to the MF terms and conditions.
D.49 As noted above BA employs a duty manager at the majority of airports it operates to. These
duty managers are employed under a mixture of arrangements: some are on local terms and
conditions, and others are UK-based employees sent to a specific destination for a duty
manager role requiring a little more expertise or experience than usual (for e.g. when a new
route starts). If UK-based staff are posted internationally, BA continues to pay social security
and pension contributions in the UK (as the employee is on a UK employment contract) but
also ensures social payments are in line with the specific labour laws in the jurisdiction of the
posting.
D.50 All BA staff in the UK, apart from the executive management grades, are covered by a
collective labour agreements (CLA) i.e. even low and mid-level managers are covered by CLA.
The CLAs for cabin crew, flight crew and ground staff have incremental pay scales, however
the CLAs for lower and middle management staff have no pay scales, as pay for these grades is
performance driven (based on a number of metrics including financial, customer, and
performance).
D.51 BA cabin crew fleets employed in the UK are covered by three separate CLAs. The Worldwide
and Euro-Fleets (legacy cabin crew staff) have separate collective agreements, and the MF
crew are covered under a third, more recent agreement. When the MF was initially
established in 2009, the MF group of employees were not covered by a CLA, they had an
employee handbook instead, which was a different arrangement to all other BA employees.
After a few years, however, CLAs were put in place for the MF employees as well (Mixed Fleet
Unite). Mixed fleet Unite also has directly elected representatives via a function called “Your
Voice”.
D.52 BA adds that a large number (hundreds) of cabin crew commute to their place of work in LHR
from residences in Spain (Barcelona) or other locations. These staff are employed on a UK
employment contract but for individual tax purposes are not domiciled in UK. An employee
living in Spain, therefore would pay Spanish income tax and not UK income tax.
October 2015 | 274
D.53 BA’s international cabin crew staff are generally covered by CLAs (e.g. Singapore, Japan, Hong
Kong based crew) however some groups (e.g. Cairo) are not. The Cairo-based cabin crew elect
employee representatives (through the “Your Voice” function), which BA describes as a
structured arrangement but not going “so far as for unions”.
D.54 Whilst not having data on union-membership available (as it is no longer deducted through
the pay roll), BA considers that union membership within the organisation is high, estimating
that 98% of flight crew are members of a union, and approximately 95% of cabin crew. BA has
relationships with a number of unions, including BALPA, Unite Union, and GMB (General trade
and manufacturers sections).
Training
D.55 BA reports that it is “heavily investing” in apprentice schemes across a range of business areas,
including customer service, head office, maintenance, Heathrow operations, and IT. These
schemes have been introduced in the last couple of years, and BA considers them to be part of
the organisation’s responsibility to be 'a good corporate citizen' whilst also clearly benefitting
BA.
D.56 As an example, the Customer Service Apprentice programme is a two year programme that
involves the following development activities:
a year as a Customer Service Representative (on the ground);
a year working as Mixed Fleet Cabin Crew; and
time with Customer Relations, Contact Centres and Head Office teams to gain an
understanding of the whole customer journey.
D.57 At the conclusion of the programme successful graduates receive formal customer service
qualifications (NVQ) and have the option to select which area (ground customer service or MF
cabin crew) they wish to work in. From BA’s perspective it is beneficial to have multi-skilled
staff as this provides additional flexibility to cover shortages if required. BA reports that this
new scheme has proven popular since its introduction – the airline have had many more
applicants than the 40 places available, and are considering whether to expand the group size.
D.58 BA apprentices have contracts which are separate from other employee types at the airline
(each group of employees has their own contract of employment).
Conclusion
D.59 BA have responded to competitive pressures by outsourcing ground-handling functions, and
creating a new cabin crew fleet for all cabin crew hired after 2009 with base salaries in line
with those offered by low cost carriers and approximately two-thirds lower than those of the
legacy cabin crew staff.
D.60 For BA, which carefully tracks impacts and trends in customer satisfaction, the significant pay
back on their customer satisfaction scores is cabin crew and other customer facing staff
performance. As a result, most BA workers are directly employed, however some functions
have been outsourced, primarily ground-handling at non-UK airports. No activities have been
outsourced at LHR; all above and below the wing staff are in-house. This is partially due to the
potential industrial relations issues that would arise should BA take this route regarding their
ground-handling staff.
D.61 All BA flight crew and all BA employees working in or based in the UK are employed under a
UK employment contract. A large number (hundreds) of BA cabin crew commute to their place

October 2015 | 275
of work in LHR from residences in Spain (Barcelona) or other locations. These staff are
employed on a UK employment contract but for individual tax purposes are not domiciled in
UK. Whilst no flight crew are employed outside of the UK, BA has a number of international
cabin crew bases, where cabin crew are employed in a specific country to cover specific needs.
These crew are employed under local market rates, the Cairo base was cited as an example
where employees are hired under conditions equivalent to the MF terms and conditions.
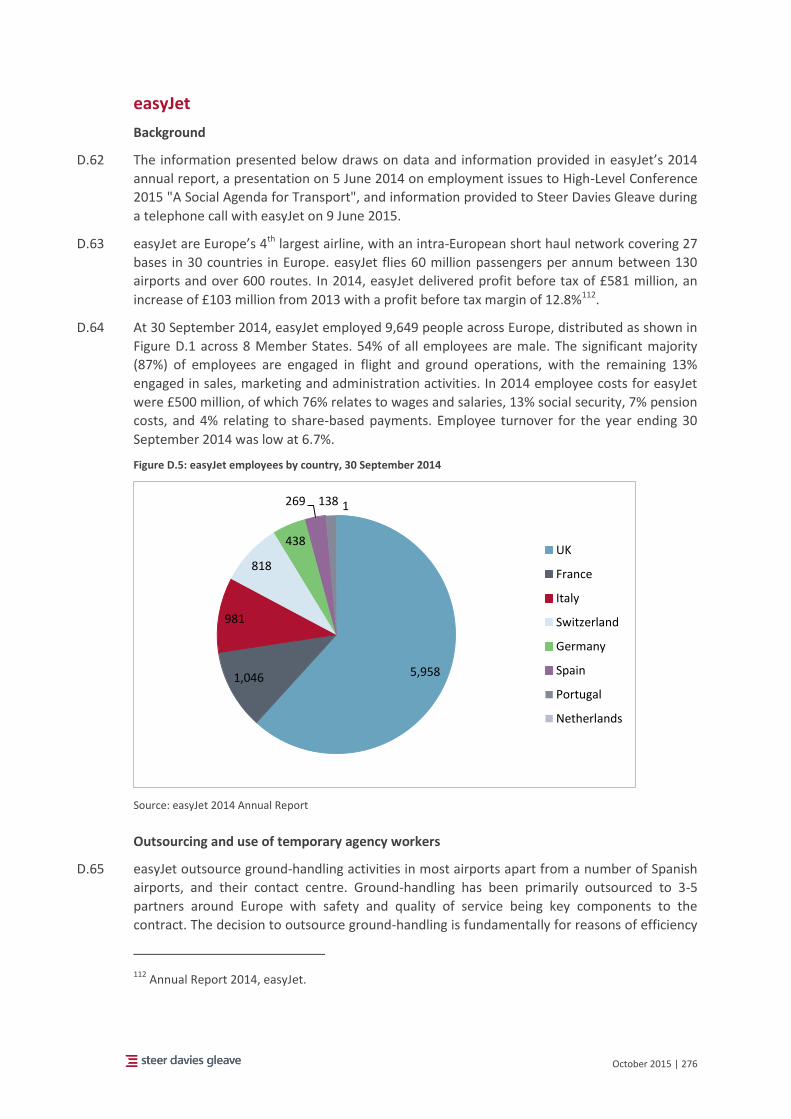
October 2015 | 276
easyJet
Background
D.62 The information presented below draws on data and information provided in easyJet’s 2014
annual report, a presentation on 5 June 2014 on employment issues to High-Level Conference
2015 "A Social Agenda for Transport", and information provided to Steer Davies Gleave during
a telephone call with easyJet on 9 June 2015.
D.63 easyJet are Europe’s 4th largest airline, with an intra-European short haul network covering 27
bases in 30 countries in Europe. easyJet flies 60 million passengers per annum between 130
airports and over 600 routes. In 2014, easyJet delivered profit before tax of £581 million, an
increase of £103 million from 2013 with a profit before tax margin of 12.8%112.
D.64 At 30 September 2014, easyJet employed 9,649 people across Europe, distributed as shown in
Figure D.1 across 8 Member States. 54% of all employees are male. The significant majority
(87%) of employees are engaged in flight and ground operations, with the remaining 13%
engaged in sales, marketing and administration activities. In 2014 employee costs for easyJet
were £500 million, of which 76% relates to wages and salaries, 13% social security, 7% pension
costs, and 4% relating to share-based payments. Employee turnover for the year ending 30
September 2014 was low at 6.7%.
Figure D.5: easyJet employees by country, 30 September 2014
Source: easyJet 2014 Annual Report
Outsourcing and use of temporary agency workers
D.65 easyJet outsource ground-handling activities in most airports apart from a number of Spanish
airports, and their contact centre. Ground-handling has been primarily outsourced to 3-5
partners around Europe with safety and quality of service being key components to the
contract. The decision to outsource ground-handling is fundamentally for reasons of efficiency
112 Annual Report 2014, easyJet.
5,9581,046
981
818
438
269 138 1
UK
France
Italy
Switzerland
Germany
Spain
Portugal
Netherlands
October 2015 | 277
– easyJet considers ground-handling an area where, in general, employing your own people is
not so efficient (as they may not be fully occupied at times when there is no aircraft to handle
at the airport where they are employed). easyJet considers that, in general, the most efficient
way of using the available ground-handling resource is for it to effectively be shared with other
airlines across the airport through provision by a third party. This method is cheaper, not
necessarily because it has been outsourced, but because it is more efficient.
D.66 There are a number of airports in Spain, however, where easyJet have a self-handling licence.
This arrangement has been in place for approximately 8 years and was set in place due to
what easyJet considered was Spanish authorities restricting licences at the airport, which had
the result of enabling an excessive charge for inefficient service. easyJet’s ground-handling
employees in Spain are all covered under a Collective Labour Agreement, as well as a number
of unions. These staff transferred to easyJet from a number of existing ground-handling
organisations, and since taking these steps to self-handle easyJet have seen quality of service
improve and efficiency improvements.
D.67 With two exceptions, all of easyJet’s flight crew and cabin crew are engaged on permanent
contracts directly with the airline. These two exceptions are as follows:
A number of trainee pilots (approximately 100) are engaged through agencies on fixed-
term contracts for cadetship-type schemes; and
A small number of cabin crew are employed on temporary or seasonal contracts: most of
whom are then offered permanent employment.
D.68 No flight crew or cabin crew are self-employed.
D.69 easyJet engages some personnel through temporary agencies, primarily for IT support
activities and some management and administrative activities. easyJet estimate that of the
approximately 1,500 management and administrative staff at the company, 90% would be
employed through permanent contracts with easyJet.
easyJet’s pilot cadetship scheme
D.70 easyJet engages approximately 100 pilots (less than 5% of the total flight crew at the airline)
through temporary agencies CTC Wings and CAE Parc, these are specifically for training
positions. Newly graduated cadets (i.e. with pilot licence but without flight hours experience)
are engaged on fixed-term contracts with easyJet to fly as First Officers. These pilots have a
contract of employment with the agency, which handles tax and national insurance payments
(i.e. the pilots are not self-employed), and the agency and easyJet have a separate contract.
D.71 Through these cadetships these pilots gain experience as type-rated first officers and receive a
guaranteed minimum payment per month (at trainee pay levels), which increases as they
become more experienced on the aircraft with more hours flown (the same payment model
applies for experienced pilots but with different pay grades according to experience).
D.72 At the end of 12 months of flying as an agency employed training pilot for easyJet, these
cadets are eligible to apply for a permanent position with easyJet. There is an interview
process involved in which easyJet assesses not only the technical skills required but also the
behavioural characteristics required of an easyJet captain (for example, people management
and customer service skills). easyJet stated that more than 90% of cadet pilots are offered a
permanent role at the end of their 12 month agency placement.
October 2015 | 278
D.73 In addition to the cadet programmes, easyJet has worked with CTC and Middlesex university in
recent years to develop a Bachelor of Science pilots degree that trainee pilots may add on as
part of their training in the cadetships with CTC (i.e. prior to their type certification and offer
of a fixed-term contract at easyJet through the agency).
D.74 The agency route and cadetship programmes are one of multiple avenues used by easyJet to
hire crew. Agencies are used to hire trainee crew, with younger inexperienced pilots generally
coming to easyJet through this route (as outlined above). Although easyjet also contracts
some experienced co-pilots through CAE PARC. easyJet also directly recruits more experienced
pilots from other airlines.
D.75 easyJet note that unions have not raised any objections to the current cadet scheme.
Multiplication of operational bases and employment law, representation and unionisation
D.76 easyJet’s principal place of business is the United Kingdom, where the head office is located.
The company is not incorporated in any other EU countries, and all decision making is made
out of the UK. At an organisational level, therefore, the business has structured itself so that
there are single teams running commercial, network and operations decisions across the
network, and hence “a consistent product”. However, whilst the ultimate decision making is in
the UK, employees are employed on local contracts in the Member State where they are
employed, and subject to the employment law and social security entitlements of the country
where they are employed. Whilst this has the additional benefit of mitigating currency
exchange rate risk for both the airline and employees, easyJet accept that employing staff in
the Member State where they are based has costs associated that are greater than the costs
associated with employing all staff in the same Member State, with one pay roll, one tax
authority, and one set of employment laws to apply.
D.77 CLAs are in place for each country in which easyJet has staff (see Figure D.1 above), for all
cabin crew and flight crew. For example, in the UK there is one CLA covering flight crew and
another for cabin crew, and in Germany and Portugal also. In France and Italy, however there
are two CLAs for the cabin crew staff, and one for flight crew. As noted above, the ground-
handlers employed by easyJet in Spain also have a CLA, as do the maintenance engineering
staff. easyJet management and some office staff are not covered by a CLA, nor are the pilots
engaged via agencies on the cadet schemes (as they are not employed by easyJet). easyJet
negotiate with staff on pay and conditions each year except when multi-year agreements are
in place.
D.78 The range of different CLAs for staff based in different Member States is due to the different
markets and national legislation that the staff are employed under. For example, the social
security coverage required by a salary are different depending on the MS of employment. In
France for example social security payments are in excess of 20% of salary for employee and
around 50% for the employer. In addition, MS have different taxation mechanisms and
different flight and duty time requirements. easyJet considers that the different national
employment and social conditions between MS require companies to look at these issues
locally. It is not logical to structure all staff employed across the MS with one single CLA, as
market is not structured in that way and does not support it. Doing business would be simpler
with a single social security system across Europe however this is not a realistic prospect in the
near future.
D.79 easyJet assigns home bases in accordance with Regulation 465/2012 and notes that crew can
have these reassigned, but the length of service would be preserved. easyJet have had
October 2015 | 279
employment contracts in Member States other than the UK since 2007 (with the first French
contract, the first Italian employment contracts were in 2008, and Germany in 2010). easyJet
have not had to make any changes to employment arrangements relating to changes to the
home base rule.
D.80 easyJet do not have union membership data available to them as employees are not required
to inform employers of their union memberships, but estimates that approximately 30-40% of
cabin crew and 95% of flight crew staff are members of unions in the UK. In other markets
where easyJet employs staff, all staff are automatically union members. easyJet has
relationships with 16-17 trade unions across the EU representing pilots, cabin crew and
engineers (including BALPA, Unite, SNPL, SNPNC, UNAC, ver.di, and others) and six
representative bodies covering information and consultation obligations across various
business areas and jurisdictions.
D.81 The easyJet European Works Council consists of representatives from across easyJet, and
there is also a UK Business Council for engagement and involvement with staff.
D.82 easyJet states that it consults with unions and staff on changes to operations. As an example,
before easyJet closed operations out of Madrid, Spain, there were two unions covering
approximately 300 flight crew and cabin crew staff employed in Spain. easyJet consulted with
European and Spanish works councils throughout the second half of 2012 and agreed a
process to relocate staff across the easyJet network, where those staff were able and willing to
relocate. easyJet reports that 90% of their Spanish employees found a job elsewhere in the
network, with the remaining 10% supported in redundancy process.
Conclusion
D.83 easyJet considers that its practice of employing staff under the national jurisdiction of the
Member State where they are based is the legal, moral and ethical way to operate, and notes
also that it benefits the airline by presenting their brand as an “EU airline” (rather than a
British airline).
D.84 easyJet considers many of the issues currently facing the industry would be resolved by more
consistent application of current legislation, which it believes requires local employment,
rather than introducing additional legislation which may further complicate the situation.
France was cited as an example of a MS where employment practices are challenged by the
authorities and fines levied by court judgements, whereas similar practices in other MS are not
challenged, resulting in an inconsistent application of the rules.
October 2015 | 280
FedEx
D.85 The information included in this case study was provided by FedEx and gathered from
publically available sources.
Introduction
D.86 FedEx Express (FXE) is a US-based and licensed airline and is the largest all-cargo airline in the
world. FXE’s global headquarters is located in Memphis, Tennessee (MEM) and its principle
business is the time-sensitive pickup and delivery of letters, parcels, and freight throughout a
global network operating between the US and over 220 countries and territories. FXE operates
a fleet of 647 aircraft, which serve approximately 375 airports worldwide. FXE maintains six
pilot operational bases around the world, four of which are in the US113. FXE opened a pilot
operational base in Subic Bay, Philippines (SFS) in 1995 and moved that base to Hong Kong,
China (HKG) in 2009114. In 2011, FXE opened a pilot operational base in Cologne, Germany
(CGN). As of June 1, 2015, FXE employed 4,165 pilots, of which 90 were based in CGN (~2%).
Operations
D.87 A key component FXE’s global air network the intra-European air network, which connects
major economic centres in Europe to the rest of the FXE global air network. Pilots who operate
the intra-European network are assigned to the CGN pilot operational base and operate
between CDG or CGN and other European and Middle East destinations. FXE operates these
flights pursuant to its Fifth Freedom air service rights contained in the US-EU Air Transport
Agreement. FXE intercontinental flights from the US or Asia arrive in Europe at the hub in CDG
(or in CGN) and continue on to their final destinations in Europe. FXE pilots assigned to the
CGN operational base do not regularly start or end their revenue flying for FXE in CDG or CGN.
Rather, FXE positions them, via commercial deadheads, to the various market cities in Europe
served by FXE, with most FXE pilots flying a week-on/week-off schedule.
D.88 As of June 1, 2015, FXE has ten B757 Freighter aircraft in Europe. Eight of these aircraft
operate into/out of CDG, one operates out of CGN and one is an operational spare located in
CDG.
Employment Arrangements
D.89 All FXE pilots operating out of the CGN base are employed under an open-ended, direct-
employment arrangement with FXE.
D.90 The terms and conditions of employment for FXE pilots are governed by a Collective Labour
Agreement (CLA) between FXE and the Air Line Pilots Association (ALPA), an international
labour union representing pilots in the US and Canada115. The terms and conditions of
113 http://about.van.fedex.com/our-story/company-structure/express-fact-sheet, visited 14 July 2015
114 FedEx to base pilots overseas” – The Commercial Appeal (June 15, 2007)
(http://www.commercialappeal.com/business/fedex-to-base-pilots-overseas) (last visited 14 July 2015);
115 Collective Labor Agreement between FedEx Express and the Air Line Pilots Association (February 28,
2011) (http://fdx.alpa.org/LinkClick.aspx?fileticket=Pu14FkSie8Y%3d&tabid=3068) (last visited May 24, 2015); Letter of Agreement between FedEx Express and the Air Line Pilots Association (February 28, 2011) (https://fdx.alpa.org/LinkClick.aspx?fileticket=jAceZBVmLno%3D&tabid=3211&mid=9074) (last visited May 24, 2015);
October 2015 | 281
employment are the same for all FXE pilots regardless of the operational base to which the
pilots are assigned. The CLA includes provisions on the range of aspects of employment, such
as scope of work, vacation, insurance, training, and many other elements.
D.91 FXE and ALPA have negotiated a ‘side-letter’ agreement concerning the pilots assigned to the
CGN operational base. The terms and conditions set forth in this side letter primarily relate to
the relocation-related benefits to which an FXE pilot is entitled when assigned to the CGN
operational base. The side-letter also contains terms and conditions of employment specific to
the CGN operational base.
D.92 Additionally, every FXE pilot based in CGN signs an individual employment agreement with FXE
stating that the terms and conditions of the pilot’s employment while assigned to CGN are
those set forth in the CLA (including the CGN specific side-letter) between FXE and ALPA. The
personal agreement also states that during the assignment to CGN, the pilot’s employment
with FXE is exclusively subject to the laws and regulations of the US.
D.93 All FXE flight crew operating out of the CGN base are US citizens, hold a Federal Aviation
Administration (FAA) Air Transport Pilot license, and operate aircraft that are certificated by
the FAA and registered in the US. All FXE flights (including those conducted in Europe by FXE
pilots assigned to the CGN base) are dispatched and controlled from the FXE Global
Operations Control Center, located in MEM, and are subject to FAA safety, flight and duty time
regulations.
D.94 The schedules and training of all FXE pilots based at CGN are managed from MEM. All
administration (e.g. HR, benefits and insurance management), management and operational
control are also managed from MEM.
D.95 FXE implements this system in accordance with the Social Security Agreement between the US
and Germany, which allows for a US employee assigned by a US employer to perform work for
the employer in Germany, and who continues to be covered by the US social security system
during the assignment, to be exempt from participating in the German social security system.
This is on the agreement that this assignment is no longer than five years in duration. As a
result, FXE pilots assigned to the CGN base are exempt from participating in the German social
security system. FXE ‘tax equalizes’ its pilots assigned to the CGN operational base. Under this
program, FXE pays both its portion and its pilots’ portion of German income and employment
taxes owed by FXE pilots assigned to the CGN operational base.
D.96 FXE’s interpretation of the home base rule is that it only applies if the pilot, who is a citizen of
an EU-member country, has a home base in the EU-member country where the pilot resides
(which itself is a different country than the pilot’s country of citizenship). They also understand
that this regulation does not apply if the pilot does not regularly begin revenue flying for his
airline in the country of his residence. Although most FXE pilots based in CGN reside in
Germany, a small percentage of those pilots live in the US and commute to Europe. FXE pilots
assigned to the CGN base do not normally begin revenue operations for FXE in CGN. Rather,
those pilots deadhead (via commercial airline) to the FXE destinations from CGN to begin
revenue operations. As such, FXE understand that Regulation 465/2012 is not applicable to the
FXE pilots assigned to the CGN base.
Employment Law
D.97 All FXE pilots based in CGN sign an individual employment agreement with FXE stating that the
terms and conditions of their employment while they are based in CGN are those set forth in
October 2015 | 282
the CLA (including the CGN specific side-letter) between FXE and ALPA, and that their
employment during their assignment to CGN is exclusively subject to the laws and regulations
of the US. This ‘choice of law’ clause is part of the CLA, which specifically requires that a pilot
agree to be bound by the choice of law provision before the pilot can be assigned to the CGN
base.
D.98 FXE understands that there are certain German employment laws that cannot be overridden
by the choice of law provision in its individual employment contract with its pilots assigned to
the CGN operational base. FXE complies with these mandatory overriding provisions regarding
its pilots assigned to the CGN operational base.
Unionisation
D.99 FXE pilots’ employment with FXE and FXE’s collective bargaining relationship with ALPA are
governed by the Railway Labor Act (RLA), which covers labour-management relations in the US
airline industry116. Pursuant to the RLA, ALPA has been certified by the US government as the
exclusive collective bargaining representative of all FXE pilots (regardless of which operational
base the pilots are assigned). The RLA imposes on FXE and ALPA an obligation to bargain with
each other concerning the terms and conditions of employment for FXE pilots. All FXE pilots
are required by the CLA to be members of ALPA (which includes an obligation for the pilot to
pay membership dues, fees, and assessments to ALPA)117. Pilots who object to membership in
ALPA may opt out of membership but must pay fees to ALPA in compensation for the
bargaining and representational activities that ALPA performs on their behalf.
Conclusion
D.100 FedEx is a US-based airline with a small number of pilots based in CGN since 2011. The terms
and conditions of employment for FXE pilots are governed by a CLA between FXE and ALPA (in
the US and Canada), the employment terms and conditions of which are the same regardless
of the operational base to which the pilots are assigned. The CGN pilots are assigned to the
CGN operational base but do not regularly start or end their revenue flying for FXE in CDG or
CGN.
D.101 All FXE flights (including those conducted in Europe by FXE pilots assigned to the CGN base)
are dispatched and controlled from the FXE Global Operations Control Centre, located in
MEM. FXE implements the CGN arrangement in accordance with the Social Security
Agreement between the US and Germany, which allows for a US employee assigned by a US
employer to perform work for the employer in Germany, and who continues to be covered by
the US social security system during the assignment, to be exempt from participating in the
German social security system. This is on the agreement that this assignment is no longer than
five years in duration.
D.102 FXE’s interpretation of the home base rule is that it only applies if the pilot, who is a citizen of
an EU-member country, has a home base in the EU-member country where the pilot resides
116 Railway Labor Act, 45 United States Code, Section 151, et al. (http://www.nmb.gov/help-training/)
(last visited May 24, 2015);
117 Collective Labor Agreement between FedEx Express and the Air Line Pilots Association (February 28,
2011) (http://fdx.alpa.org/LinkClick.aspx?fileticket=Pu14FkSie8Y%3d&tabid=3068) (last visited May 24, 2015);

October 2015 | 283
(which itself is a different country than the pilot’s country of citizenship). They also understand
that this regulation does not apply if the pilot does not regularly begin revenue flying for his
airline in the country of his residence. FXE pilots assigned to the CGN base do not normally
begin revenue operations for FXE in CGN. As such, FXE understand that Regulation 465/2012 is
not applicable to the FXE pilots assigned to the CGN base.
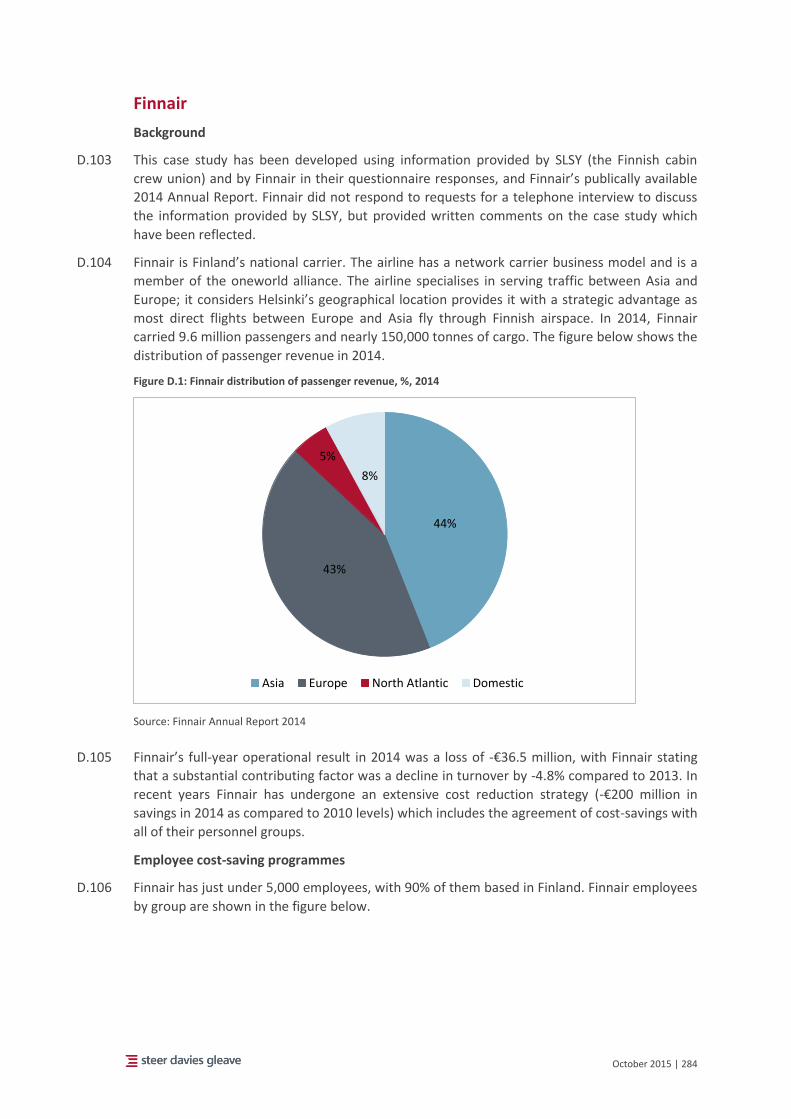
October 2015 | 284
Finnair
Background
D.103 This case study has been developed using information provided by SLSY (the Finnish cabin
crew union) and by Finnair in their questionnaire responses, and Finnair’s publically available
2014 Annual Report. Finnair did not respond to requests for a telephone interview to discuss
the information provided by SLSY, but provided written comments on the case study which
have been reflected.
D.104 Finnair is Finland’s national carrier. The airline has a network carrier business model and is a
member of the oneworld alliance. The airline specialises in serving traffic between Asia and
Europe; it considers Helsinki’s geographical location provides it with a strategic advantage as
most direct flights between Europe and Asia fly through Finnish airspace. In 2014, Finnair
carried 9.6 million passengers and nearly 150,000 tonnes of cargo. The figure below shows the
distribution of passenger revenue in 2014.
Figure D.1: Finnair distribution of passenger revenue, %, 2014
Source: Finnair Annual Report 2014
D.105 Finnair’s full-year operational result in 2014 was a loss of -€36.5 million, with Finnair stating
that a substantial contributing factor was a decline in turnover by -4.8% compared to 2013. In
recent years Finnair has undergone an extensive cost reduction strategy (-€200 million in
savings in 2014 as compared to 2010 levels) which includes the agreement of cost-savings with
all of their personnel groups.
Employee cost-saving programmes
D.106 Finnair has just under 5,000 employees, with 90% of them based in Finland. Finnair employees
by group are shown in the figure below.
44%
43%
5%
8%
Asia Europe North Atlantic Domestic
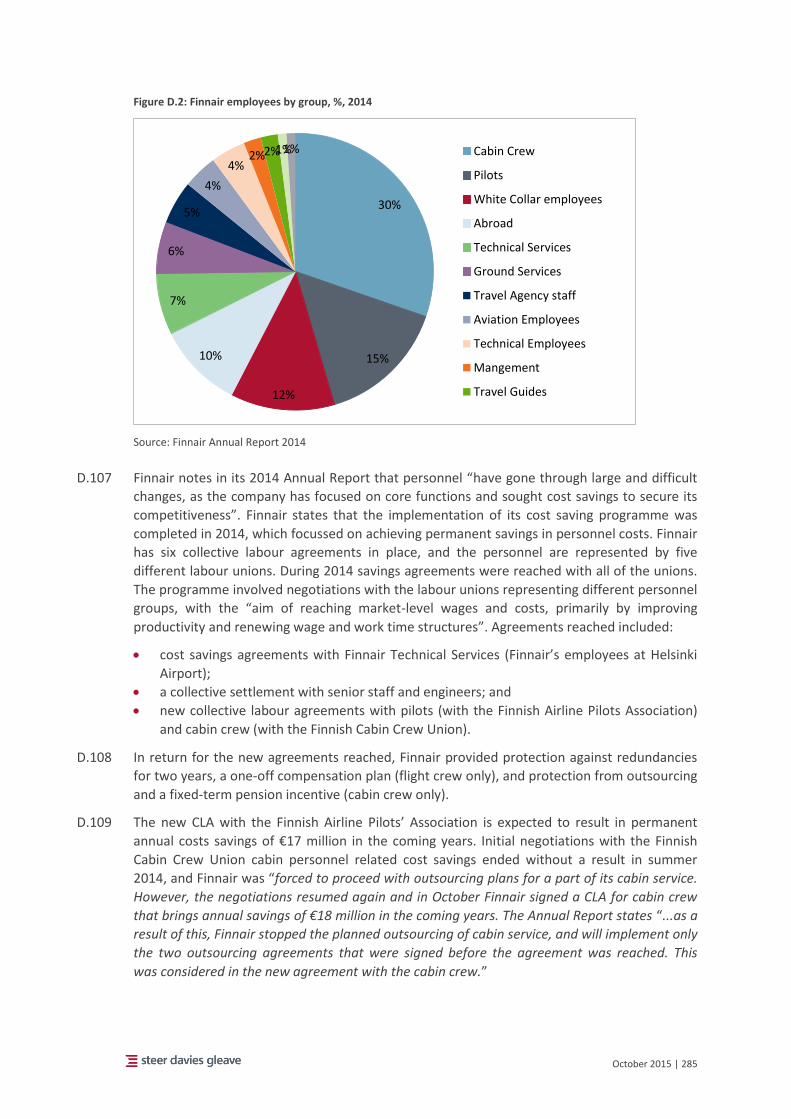
October 2015 | 285
Figure D.2: Finnair employees by group, %, 2014
Source: Finnair Annual Report 2014
D.107 Finnair notes in its 2014 Annual Report that personnel “have gone through large and difficult
changes, as the company has focused on core functions and sought cost savings to secure its
competitiveness”. Finnair states that the implementation of its cost saving programme was
completed in 2014, which focussed on achieving permanent savings in personnel costs. Finnair
has six collective labour agreements in place, and the personnel are represented by five
different labour unions. During 2014 savings agreements were reached with all of the unions.
The programme involved negotiations with the labour unions representing different personnel
groups, with the “aim of reaching market-level wages and costs, primarily by improving
productivity and renewing wage and work time structures”. Agreements reached included:
cost savings agreements with Finnair Technical Services (Finnair’s employees at Helsinki
Airport);
a collective settlement with senior staff and engineers; and
new collective labour agreements with pilots (with the Finnish Airline Pilots Association)
and cabin crew (with the Finnish Cabin Crew Union).
D.108 In return for the new agreements reached, Finnair provided protection against redundancies
for two years, a one-off compensation plan (flight crew only), and protection from outsourcing
and a fixed-term pension incentive (cabin crew only).
D.109 The new CLA with the Finnish Airline Pilots’ Association is expected to result in permanent
annual costs savings of €17 million in the coming years. Initial negotiations with the Finnish
Cabin Crew Union cabin personnel related cost savings ended without a result in summer
2014, and Finnair was “forced to proceed with outsourcing plans for a part of its cabin service.
However, the negotiations resumed again and in October Finnair signed a CLA for cabin crew
that brings annual savings of €18 million in the coming years. The Annual Report states “...as a
result of this, Finnair stopped the planned outsourcing of cabin service, and will implement only
the two outsourcing agreements that were signed before the agreement was reached. This
was considered in the new agreement with the cabin crew.”
30%
15%
12%
10%
7%
6%
5%
4%
4%2%2%1%1% Cabin Crew
Pilots
White Collar employees
Abroad
Technical Services
Ground Services
Travel Agency staff
Aviation Employees
Technical Employees
Mangement
Travel Guides
October 2015 | 286
D.110 The two cabin crew outsourcing programmes signed already concern the Hong Kong and
Singapore routes, for which Finnair has signed an agreement with Norwegian crew
management company OSM Aviation. The cabin crew for these routes will be recruited to
OSM Aviation’s bases in Asia and was expected to start in March 2015.
D.111 In addition to the above, Finnair outsourced its payroll management to Zalaris Oy in spring
2013.
D.112 The number of Finnair employees decreased significantly in 2014 as a result of the structural
changes noted above. At the end of 2014, Finnair employed 4,461 employees, a reduction of -
23% on 2013.
Airline comments
D.113 In their questionnaire response, Finnair stated that temporary agency employment has
significantly increased, due to CLA terms that are “non-flexible and costly”, with the effect of
the above programmes being a slight reduction of employment costs.
D.114 Finnair estimates employee coverage by CLAs to be as follows:
Flight crew: 91-100%;
Cabin crew: 81-90%;
Ground-handlers: 91-100%.
D.115 Finnair maintains regional bases in Europe, including a sub-contracted cabin crew base in
Spain, and other bases in Asian cities including Beijing, Hong Kong, Shanghai, Singapore,
Bangkok, Seoul, and Tokyo. With regards to other bases in the EU, Finnair notes that taxation,
social security and union affiliation differ slightly from Finnish arrangements.
D.116 Finnair state that recruitment in Finland has been limited due to the modest/negative business
results for several years (as noted above). In addition, the size of Finnair's operated aircraft
fleet has decreased in recent years, partially due to the outsourcing in 2012 of one-third of
short haul operations to FLyBe Finland, in which Finnair had minority ownership at the time. In
addition, having completed its cost-saving and restructuring program in 2014, Finnair is now
entering a new phase and preparing for growth. The airline states that it is currently recruiting
both pilots (60) and cabin personnel (over 100) in Finland, and expects this trend to continue
in the coming years.
Cabin crew union comments
D.117 SLSY, the Finnish Cabin Crew Union, provided a questionnaire response stating that Finnair
have hired cabin crew from Asia and Spain for “years”, either directly or through agencies, and
that this crew work together with the Finnish crew. No cabin crew have been hired in Finland
in the past 7 years. The recent decision to outsource cabin crew to OSM Aviation, however, is
a different arrangement, which requires the agency provide the complete cabin crew service
(staff, uniforms, training and procedures), and that these outsourced crew would fly as a single
entity (i.e. without directly employed Finnair cabin crew on board also).
D.118 SLSY estimates the following distribution and employment arrangements of Finnair cabin crew
currently (2015):
Finland: 1500 (down from approximately 2,050 in 2009);
Asia (direct employment in Japan and South Korea, agency employment in China, India,
Thailand and Singapore): 500;
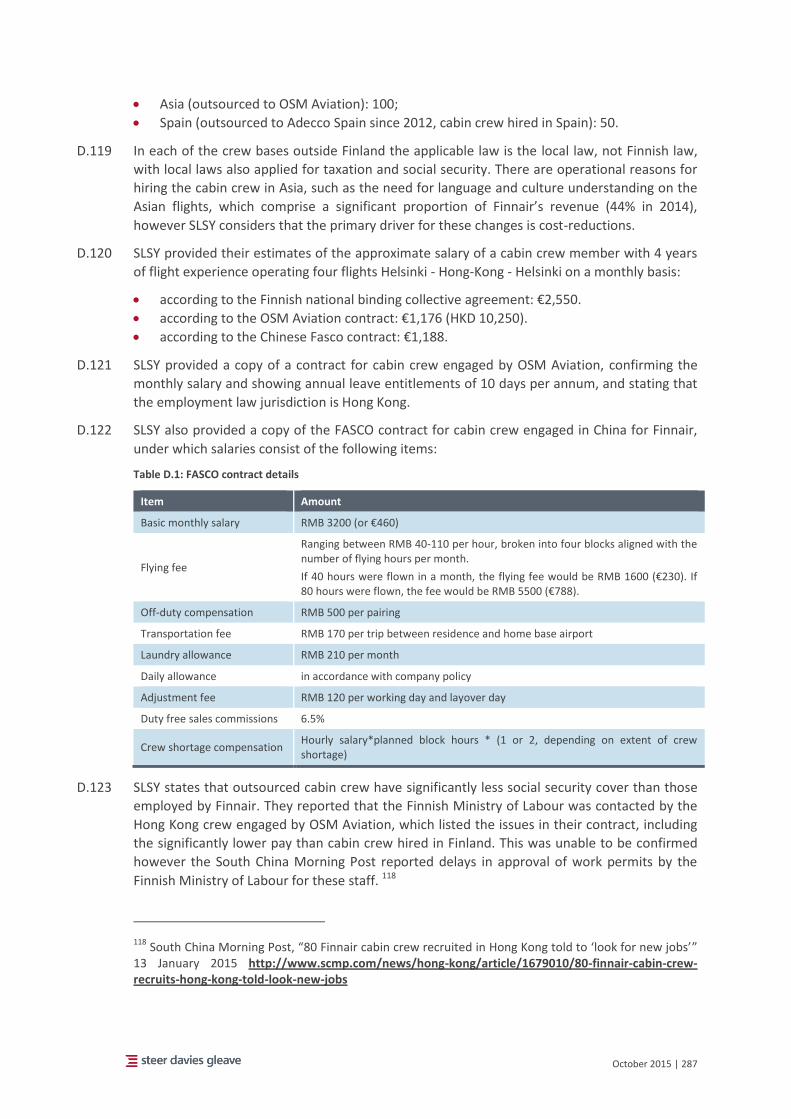
October 2015 | 287
Asia (outsourced to OSM Aviation): 100;
Spain (outsourced to Adecco Spain since 2012, cabin crew hired in Spain): 50.
D.119 In each of the crew bases outside Finland the applicable law is the local law, not Finnish law,
with local laws also applied for taxation and social security. There are operational reasons for
hiring the cabin crew in Asia, such as the need for language and culture understanding on the
Asian flights, which comprise a significant proportion of Finnair’s revenue (44% in 2014),
however SLSY considers that the primary driver for these changes is cost-reductions.
D.120 SLSY provided their estimates of the approximate salary of a cabin crew member with 4 years
of flight experience operating four flights Helsinki - Hong-Kong - Helsinki on a monthly basis:
according to the Finnish national binding collective agreement: €2,550.
according to the OSM Aviation contract: €1,176 (HKD 10,250).
according to the Chinese Fasco contract: €1,188.
D.121 SLSY provided a copy of a contract for cabin crew engaged by OSM Aviation, confirming the
monthly salary and showing annual leave entitlements of 10 days per annum, and stating that
the employment law jurisdiction is Hong Kong.
D.122 SLSY also provided a copy of the FASCO contract for cabin crew engaged in China for Finnair,
under which salaries consist of the following items:
Table D.1: FASCO contract details
Item Amount
Basic monthly salary RMB 3200 (or €460)
Flying fee
Ranging between RMB 40-110 per hour, broken into four blocks aligned with the number of flying hours per month.
If 40 hours were flown in a month, the flying fee would be RMB 1600 (€230). If 80 hours were flown, the fee would be RMB 5500 (€788).
Off-duty compensation RMB 500 per pairing
Transportation fee RMB 170 per trip between residence and home base airport
Laundry allowance RMB 210 per month
Daily allowance in accordance with company policy
Adjustment fee RMB 120 per working day and layover day
Duty free sales commissions 6.5%
Crew shortage compensation Hourly salary*planned block hours * (1 or 2, depending on extent of crew shortage)
D.123 SLSY states that outsourced cabin crew have significantly less social security cover than those
employed by Finnair. They reported that the Finnish Ministry of Labour was contacted by the
Hong Kong crew engaged by OSM Aviation, which listed the issues in their contract, including
the significantly lower pay than cabin crew hired in Finland. This was unable to be confirmed
however the South China Morning Post reported delays in approval of work permits by the
Finnish Ministry of Labour for these staff. 118
118 South China Morning Post, “80 Finnair cabin crew recruited in Hong Kong told to ‘look for new jobs’”
13 January 2015 http://www.scmp.com/news/hong-kong/article/1679010/80-finnair-cabin-crew-recruits-hong-kong-told-look-new-jobs
October 2015 | 288
D.124 SLSY’s members are only those Finnair cabin crew staff employed in Finland; their members
are not hired through agencies.
D.125 SLSY considers that a single CLA for a workforce distributed across a number of bases is not
possible. A Finnish national binding agreement must be followed by law for any crew based in
Finland, but this does not apply for home bases outside Finland.
D.126 Regarding union representation, there is significant representation of the Finnish-based cabin
crew (by SLSY) but as far as SLSY is aware, the crew hired from Spain and outside the EU has
no official representation, apart from some unofficial cooperation between the Hong Kong
cabin crew union (HKFFC) and SLSY.
Conclusion
D.127 Finnair has undergone challenging changes in recent years in order to improve its cost-
effectiveness and competitiveness. These have included negotiating new CLAs with both flight
and cabin crew, and the decision to outsource some cabin crew activities to Asia, where a
significant proportion of its operation is based (via a Norwegian employment agency).
D.128 According to the Finnish Cabin Crew Union SLSY, Finnair has hired all new cabin crew in the
past 7 years in either Spain or Asia, either directly or through agencies and all on local
employment contracts and conditions. Whilst there is a business driver for these practices, as
nearly half Finnair’s revenue is from Asia, the cost benefits to the airline are also clear, with
Asian crew engaged via an agency paid approximately half of what Finnish-based cabin crew
receive, according to information provided by SLSY.
D.129 Finnair have consulted with employee groups regarding these changes, and the financial need
for cost-reduction is evident. It is also evident that moves by the airline towards outsourcing
cabin crew resulted in a re-opening of negotiations (that had originally halted without
agreement) with the union and the reaching of a cost-savings agreement in return for a two-
year hold on any outsourcing practices.
D.130 SLSY reports that the legality of Finnair’s move to outsource Hong Kong crew operations
completely to OSM Aviation has been disputed by the Hong Kong employees. However, this
was unable to be confirmed beyond the reporting of delays in approval of work permits for
these staff from the Finnish Ministry of Labour.
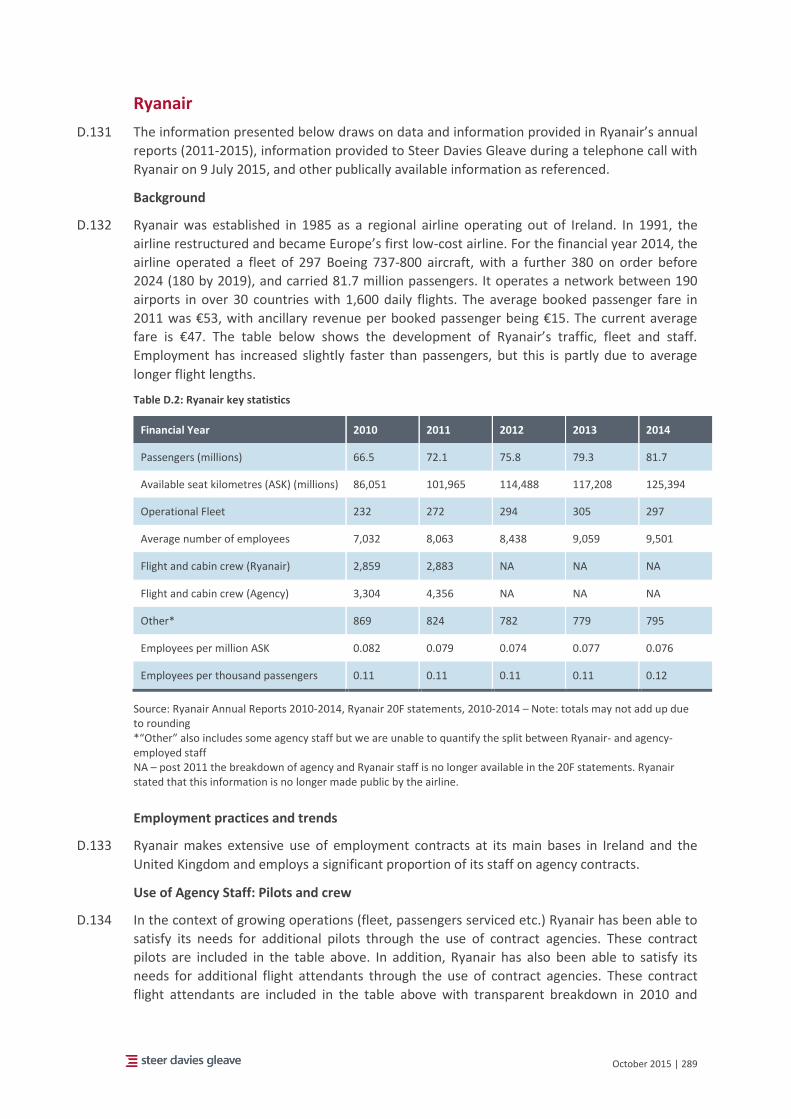
October 2015 | 289
Ryanair
D.131 The information presented below draws on data and information provided in Ryanair’s annual
reports (2011-2015), information provided to Steer Davies Gleave during a telephone call with
Ryanair on 9 July 2015, and other publically available information as referenced.
Background
D.132 Ryanair was established in 1985 as a regional airline operating out of Ireland. In 1991, the
airline restructured and became Europe’s first low-cost airline. For the financial year 2014, the
airline operated a fleet of 297 Boeing 737-800 aircraft, with a further 380 on order before
2024 (180 by 2019), and carried 81.7 million passengers. It operates a network between 190
airports in over 30 countries with 1,600 daily flights. The average booked passenger fare in
2011 was €53, with ancillary revenue per booked passenger being €15. The current average
fare is €47. The table below shows the development of Ryanair’s traffic, fleet and staff.
Employment has increased slightly faster than passengers, but this is partly due to average
longer flight lengths.
Table D.2: Ryanair key statistics
Financial Year 2010 2011 2012 2013 2014
Passengers (millions) 66.5 72.1 75.8 79.3 81.7
Available seat kilometres (ASK) (millions) 86,051 101,965 114,488 117,208 125,394
Operational Fleet 232 272 294 305 297
Average number of employees 7,032 8,063 8,438 9,059 9,501
Flight and cabin crew (Ryanair) 2,859 2,883 NA NA NA
Flight and cabin crew (Agency) 3,304 4,356 NA NA NA
Other* 869 824 782 779 795
Employees per million ASK 0.082 0.079 0.074 0.077 0.076
Employees per thousand passengers 0.11 0.11 0.11 0.11 0.12
Source: Ryanair Annual Reports 2010-2014, Ryanair 20F statements, 2010-2014 – Note: totals may not add up due to rounding *“Other” also includes some agency staff but we are unable to quantify the split between Ryanair- and agency-employed staff NA – post 2011 the breakdown of agency and Ryanair staff is no longer available in the 20F statements. Ryanair stated that this information is no longer made public by the airline.
Employment practices and trends
D.133 Ryanair makes extensive use of employment contracts at its main bases in Ireland and the
United Kingdom and employs a significant proportion of its staff on agency contracts.
Use of Agency Staff: Pilots and crew
D.134 In the context of growing operations (fleet, passengers serviced etc.) Ryanair has been able to
satisfy its needs for additional pilots through the use of contract agencies. These contract
pilots are included in the table above. In addition, Ryanair has also been able to satisfy its
needs for additional flight attendants through the use of contract agencies. These contract
flight attendants are included in the table above with transparent breakdown in 2010 and
October 2015 | 290
2011, but no such breakdown is available from 2012-2014, as Ryanair no longer publishes this
information.
D.135 In 2011, Ryanair employed just over 8,000 people, of which 2,900 cabin and flight crew were
employed by Ryanair and 4,300 were agency staff. The remaining 800 staff (covering other
functions such as administration, sales and maintenance) include both Ryanair and agency
employees, however data is not available to quantify the split of these staff between agency
and direct employees. Just over a third of staff work directly for Ryanair, as seen in the table
above. Since, total staff has grown to over 9,500 in 2014, however as noted Ryanair no longer
provide a breakdown between Ryanair and agency employees. Ryanair do state that despite
this increase in overall staff, under 50% of staff at Ryanair are currently (2015) engaged
through a temporary agency.
D.136 Agency staff are employed on renewable 3 to 5 year working contracts. Agency cabin crew are
employed by the agency and agency flight crew provided to Ryanair are either employed by
the agency directly, or these staff form small, limited companies that are engaged by the
agency to provide flight crew services to Ryanair (i.e. these flight crew are not employed by
the agency directly). Ryanair’s relationship with temporary agency flight or cabin crew is
therefore always through the agency; they do not directly engage with self-employed flight
crew or flight crew that have formed a limited company arrangement.
D.137 There are established links between Ryanair and the agencies that provide it with crew and
engineers, with Ryanair’s recruitment website providing direct links to these agencies for
prospective applicants. There are a number of agencies that Ryanair said they use in the
response to our questionnaire (Brookfield Aviation, McGinley Aviation, Excel Aviation,
Crewlink, Workforce International, Temple Recruitment). All of these agencies are
independent of Ryanair and there is no ownership relationship or shared directors between
Ryanair and the staffing agencies.
D.138 The agencies and Ryanair define the roster (usually well-defined and scheduled in advance,
with staff rostered five days on, four days off) and place of work (the location of the base).
Crew are paid per scheduled block hour flown, so pay tends to be higher in the summer
season and lower in the winter. In line with the Directive on Temporary Agency Work
(2008/104/EC), the pay and annual leave are comparable between directly employed and
temporary agency workers. Ryanair notes that agency staff working with more flexible
arrangements may have higher salaries than Ryanair staff. In particular, flight crew who are
engaged on ‘floating contracts’ (where pilots frequently change base) receive higher pay and
increased time off as a reward for the increased flexibility this system of working provides.
This is a small proportion of overall flight crew at Ryanair. There are some differences in other
benefits, for example there are different discounted travel rates for direct employees and
temporary agency workers (rates for agency workers are lower) and Ryanair’s disability
insurance scheme is available to directly employed flight crew only, as contracted staff are
responsible for their own arrangements.
D.139 Temporary agency employment tends to be the sole means for junior cadet pilots to work for
Ryanair. However, once a pilot has gained some experience, then it would be possible for
them to have a direct contract with Ryanair, by applying for an available position.
D.140 Ryanair report that the transition of temporary agency workers to permanent employees
happens on an ad-hoc basis and that there is no fixed policy for this transition. Often, the
opportunities to transfer depend on the operational base. If a base is growing, then there is
October 2015 | 291
increased employment and more opportunities for direct employment in more senior
positions. In contrast, it can be more difficult for temporary agency workers to find direct
employment at bases where there is little or no growth, however, if agency workers are willing
to change bases, it is usually possible to find a direct contract with Ryanair. In general,
temporary agency workers must interview for a permanent position and, since new positions
are often a promotion, this transition often tends to alter the worker’s role.
D.141 Ryanair report that generally pilots in the earlier part of their career prefer the flexibility of
working through an agency before settling into a permanent, direct contract once they are
older and more experienced. However, the situation varies as some experienced pilots prefer
a flexible model which offers more travelling opportunities and potentially more leave under
Ryanair’s floating base contracts.
Ground handling and maintenance services
D.142 Partly as a result of its rapid growth, and to maintain continued cost-effective support
services, Ryanair outsources a number of functions: passenger, aircraft and ground handling
services at airports apart from Dublin and certain airports in Spain and the Canary Islands are
outsourced, as well as catering and some areas of aircraft maintenance. Routine aircraft
maintenance and repair services are performed primarily by Ryanair, at Ryanair‘s main bases,
but are also performed at other base airports by maintenance contractors approved under the
terms of Part 145119. Ryanair also performs heavy airframe maintenance, but contracts with
other parties who perform engine overhaul services and “rotable” repairs.
D.143 According to Ryanair, ground handling accounted for 220 staff in 2014, consisting of both
Ryanair and agency employees120. The provision of ground handling directly at Dublin and
some airports in Spain is an exception to Ryanair’s normal policy. Elsewhere, Ryanair has
contracted external providers for ticketing, passenger and aircraft handling and other services
that its management believes can be more efficiently provided by third parties. External
handling contractors include large providers such as Serviceair, Swissport and Celebi Handling,
as well as local providers in the form of Prestwick Handling Services and Stockholm Skavtsa
Airport Services.
D.144 The core functions of aircraft operations and IT are not outsourced (Ryanair’s booking system
is operated under a hosting agreement with Navitaire). However, these functions are not
necessarily provided by Ryanair staff. The airline relies heavily on agency staff: in 2011 they
represented about 60% of flight and cabin crew working for Ryanair121. Some engineering staff
are also employed by agencies but the share of this is not known.
Worker representation and collective agreements
D.145 Ryanair have operational bases in Austria, Belgium, Croatia, Cyprus, Denmark, Germany,
Greece, Hungary, Ireland, Italy, Lithuania, Malta, Morocco, Netherlands, Norway, Poland,
Portugal, Slovakia, Spain, Sweden, and United Kingdom.
119 Part 145 (Annex II) to Commission Regulation 2042/2003, as amended, and related EASA Decisions
(Acceptable Means of Compliance and Guidance Material)
120 2014 annual report
121 Source: Ryanair annual report 2011, page 171
October 2015 | 292
D.146 Ryanair negotiates with groups of employees, including its pilots, through Employee
Representation Committees (ERCs) regarding pay, work practices and conditions of
employment, including conducting formal negotiations with these internal collective
bargaining units. ERCs exist for flight and cabin crew staff types at each base. Ryanair has no
involvement in the election or selection process for ERCs.
D.147 Ryanair has separate flight crew and cabin crew collective agreements at every one of its
bases. These are negotiated with the ERCs and vary between base and have different rates of
pay. Ryanair state that these differences arise from the different priorities of pilots and flight
attendants at different bases: stating that staff at some bases are more concerned about
salaries, whereas bases with more experienced pilots may prioritise career development in the
form of opportunities to become trainers. Although Ryanair does not know how aware flight
and cabin crew at one base are of the terms at another base, it is expected that they have
some awareness given that workers move around a lot in the course of their work. Pilots will
generally work from two or three bases during the course of their career, and therefore, will
sign up to the new bases’ agreement as part of this (as well as confirming a new contract
which is primarily an administrative matter; service and start date are honoured).
D.148 In its 2014 annual report, Ryanair stated that
Pilots at 65 out of Ryanair‘s 69 bases (in 2014)122 are covered by four or five year
agreements on pay, allowances and rosters which fall due for negotiation at various dates
between 2014 and 2019.
Cabin crew at all Ryanair bases are also party to long term collective agreements on pay,
allowances and rosters which expire March 2017.
In March 2013, Ryanair agreed to increase the pay of pilots and cabin crew in accordance
with the terms of individual base agreements.
D.149 Ryanair confirmed that every employee of Ryanair is covered by an ERC, and the members of
the ERC are all Ryanair employees, who are also elected by employees, rather than nominated
by Ryanair. Ryanair has no dialogue with unions and all engagement is through the ERCs. ERCs
are also the means with which Ryanair employees are represented on the European Work
Council.
D.150 This means that the ERCs and the agreements they negotiate do not cover any agency staff.
Agency staff have an employment relationship with the agency, not the airline, so must raise
any issues with the work agency, rather than Ryanair. Agency staff are not represented on
employee committees.
D.151 Working conditions, including representation, for outsourced staff may be different to those
of directly employed staff. Pay is comparable, however we do not have information to
comment on the extent to which other employment conditions may differ between agency
and directly employed personnel at Ryanair.
D.152 Ryanair states that it does not interfere or with employees’ rights to be members of trade
unions, as this is a constitutionally protected right under Irish law, but that it does not have
any dialogue with unions. Any negotiations are undertaken through the ERC.
122 In 2015, Ryanair has 74 bases, 72 in Europe and 2 in Morocco. http://corporate.ryanair.com/
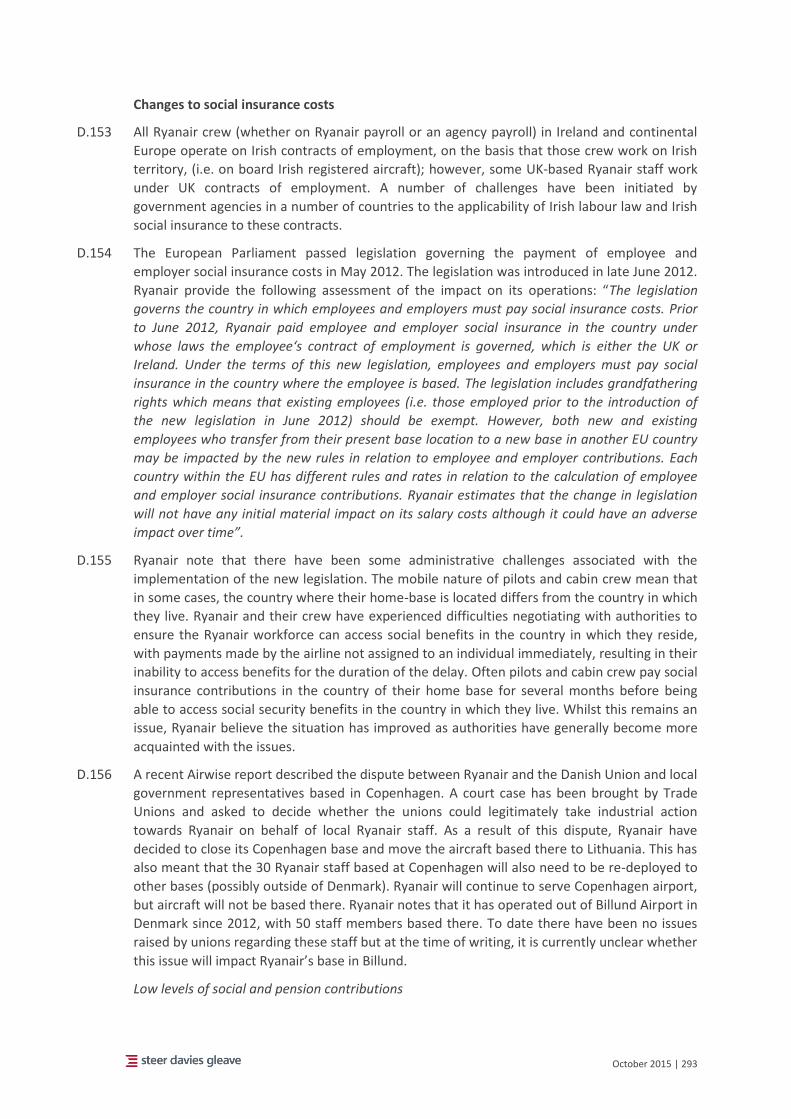
October 2015 | 293
Changes to social insurance costs
D.153 All Ryanair crew (whether on Ryanair payroll or an agency payroll) in Ireland and continental
Europe operate on Irish contracts of employment, on the basis that those crew work on Irish
territory, (i.e. on board Irish registered aircraft); however, some UK-based Ryanair staff work
under UK contracts of employment. A number of challenges have been initiated by
government agencies in a number of countries to the applicability of Irish labour law and Irish
social insurance to these contracts.
D.154 The European Parliament passed legislation governing the payment of employee and
employer social insurance costs in May 2012. The legislation was introduced in late June 2012.
Ryanair provide the following assessment of the impact on its operations: “The legislation
governs the country in which employees and employers must pay social insurance costs. Prior
to June 2012, Ryanair paid employee and employer social insurance in the country under
whose laws the employee‘s contract of employment is governed, which is either the UK or
Ireland. Under the terms of this new legislation, employees and employers must pay social
insurance in the country where the employee is based. The legislation includes grandfathering
rights which means that existing employees (i.e. those employed prior to the introduction of
the new legislation in June 2012) should be exempt. However, both new and existing
employees who transfer from their present base location to a new base in another EU country
may be impacted by the new rules in relation to employee and employer contributions. Each
country within the EU has different rules and rates in relation to the calculation of employee
and employer social insurance contributions. Ryanair estimates that the change in legislation
will not have any initial material impact on its salary costs although it could have an adverse
impact over time”.
D.155 Ryanair note that there have been some administrative challenges associated with the
implementation of the new legislation. The mobile nature of pilots and cabin crew mean that
in some cases, the country where their home-base is located differs from the country in which
they live. Ryanair and their crew have experienced difficulties negotiating with authorities to
ensure the Ryanair workforce can access social benefits in the country in which they reside,
with payments made by the airline not assigned to an individual immediately, resulting in their
inability to access benefits for the duration of the delay. Often pilots and cabin crew pay social
insurance contributions in the country of their home base for several months before being
able to access social security benefits in the country in which they live. Whilst this remains an
issue, Ryanair believe the situation has improved as authorities have generally become more
acquainted with the issues.
D.156 A recent Airwise report described the dispute between Ryanair and the Danish Union and local
government representatives based in Copenhagen. A court case has been brought by Trade
Unions and asked to decide whether the unions could legitimately take industrial action
towards Ryanair on behalf of local Ryanair staff. As a result of this dispute, Ryanair have
decided to close its Copenhagen base and move the aircraft based there to Lithuania. This has
also meant that the 30 Ryanair staff based at Copenhagen will also need to be re-deployed to
other bases (possibly outside of Denmark). Ryanair will continue to serve Copenhagen airport,
but aircraft will not be based there. Ryanair notes that it has operated out of Billund Airport in
Denmark since 2012, with 50 staff members based there. To date there have been no issues
raised by unions regarding these staff but at the time of writing, it is currently unclear whether
this issue will impact Ryanair’s base in Billund.
Low levels of social and pension contributions
October 2015 | 294
D.157 The full impact of the change in legislation regarding the home base and associated social
insurance payments has not yet had a material impact on salary costs, as shown in the figure
below. The change in the home base rule applies only to new employees; those employed
prior to the introduction of the new legislation in June 2012 are exempt from the effects of
this legislation for a period of 10 years up until 2022.
D.158 The figure below shows that the social and pension contributions of Ryanair represent only a
small fraction of the overall employment costs (in 2014, 5%). Under Irish law, Ryanair is
obliged to offer retirement plans to employees: Ryanair offers to match pilots pension
contributions by up to €6,000 per annum.
Figure D.3: Ryanair payroll costs (2012-14)
Source: Annual Reports
Incentive payments
D.159 Ryanair’s employees earn productivity-based incentive payments, including a sales bonus for
on-board sales for flight attendants and payments based on the number of hours or sectors
flown by pilots and flight attendants (within limits set by industry standards or regulations
fixing maximum working hours). During the 2014 financial year, such productivity-based
incentive payments accounted for approximately 44% of an average flight attendant’s total
earnings and approximately 32% of the typical pilot’s compensation.
Flying hours
D.160 Ryanair’s pilots are currently subject to Irish Aviation Authority (the Irish aviation safety
authority) approved limits of 100 flight-hours per 28-day cycle and 900 flight-hours per fiscal
year. For the 2013 financial year, the average flight hours for Ryanair’s pilots amounted to
395412.3
441.5
18.1
18.4
18.7
2.62.9
1.5
2.00
1.90
100
150
200
250
300
350
400
450
2012 2013 2014
€m
illio
n
Staff and related costs Social welfare costs
Other pension costs Share based payments
October 2015 | 295
approximately 66.5 hours per month and approximately 798 hours for the complete year, a 5%
decrease on the previous year.
Conclusions
D.161 Ryanair's rapid expansion has provided for a significant number of new jobs as it has grown its
operations across Europe. In 2014, Ryanair employed 9,500 personnel, making extensive use
of agency arrangements for flight and cabin crew to fulfil the employment requirements of the
airline. As a result, there are established links between Ryanair and a number of temporary
work agencies. Agency staff receive the same pay and annual leave as permanent employees,
although some differences in other benefits exist. There is no formal procedure for enabling
temporary agency workers to become permanent employees, but if an employee is willing to
change base, opportunities are usually available.
D.162 Ryanair outsources the majority of their ground-handling functions, except at a small number
of airports. Aircraft operations and IT are not outsourced, however, temporary agency workers
are relied on to fulfil many of these roles.
D.163 Ryanair have separate CLAs with flight and cabin crew at every one of its 72 operational bases.
CLAs are negotiated with Ryanair's Employee Representation Committees (ERCs) which
represent groups of employees for pay, working conditions and other elements of
employment. ERCs and CLAs do not cover temporary agency workers.
D.164 All Ryanair crew in Ireland and continental Europe operate on Irish employment contracts;
some UK-based staff operate under UK employment contracts. The applicability of Irish
employment law and social insurance payments has been challenged by a number of
government agencies. Since the change to the home base rule in 2012, Ryanair pays social
insurance to employees in the country in which they are based. This has caused some
administrative difficulties, particularly where employees live in different countries to their
home base.
D.165 The level of social payments made by Ryanair to employees as a proportion of total
employment costs is low (5% in 2014). Ryanair employees are also eligible for some
productivity-based incentive payments.
October 2015 | 296
Temporary work agency: CAE Parc Aviation
Background
D.166 This case study has been developed using information provided by CAE Parc Aviation during a
telephone interview and information from the company’s website.
D.167 CAE Parc Aviation provide aviation personnel and services to the air industry, specifically
focusing on the recruitment and management of pilots and technical staff to airlines
worldwide. It provides 1,200 aviation personnel to fifty airlines and leasing companies in forty
countries. Within the EU, easyJet, Norwegian, TNT and Aegean are amongst its biggest clients.
D.168 Parc Aviation was created as a subsidiary of Aer Lingus in 1975. During the 1970s oil crisis, Aer
Lingus (along with a number of airlines) struggled financially, resulting in a reduction in flight
activity and a surplus of flight crew. Parc was formed to find opportunities for these flight crew
by going directly to the European airline market to sell personnel services. Parc sees itself as
an originator of this recruitment model.
D.169 Following two buy-outs, Parc Aviation has been part of the CAE Group since 2012, which also
includes the flight school CAE Oxford Aviation Academy. CAE Parc Aviation partners with the
group’s aviation academy to provide a “holistic offer” for pilot training and recruitment.
Within the CAE group, an individual can train to become a commercial pilot within the aviation
academy and then be placed in their first job through Parc Aviation. The company notes that
this service is particularly helpful to trainee pilots as the often hardest step is finding the first
job post-training.
Client relationships
D.170 Parc’s revenues come primarily from payments by airlines to recruit pilots; Parc does not
charge individual pilots for being engaged through them. Although relationships can vary
depending on the airline’s requirements, the process is generally as follows (as demonstrated
in Figure D.10:
1. Airline provides Parc with the requirements of the individual being sought. This can
include (but is not limited to) qualifications, experience, skills, working hours and location.
2. Parc identifies an individual which fits requirements. The individual may be sourced from
Parc’s database, or externally through advertising the position.
3. Airline interviews the proposed individual, and if interview and assessment is passed, the
individual will be offered a contract.
4. Following this, one of two contractual arrangements will be in place:
a. Permanent contract: pilot is contracted on a permanent basis directly by the
airline. Parc aviation is paid recruitment fee and has no further relationship with
the pilot.
b. Leasing contract: pilot is contracted to airline through Parc Aviation. Parc manage
pilot’s insurance and personal issues, as well as paying them. Airline pays pilot’s
salary plus leasing charges to Parc.
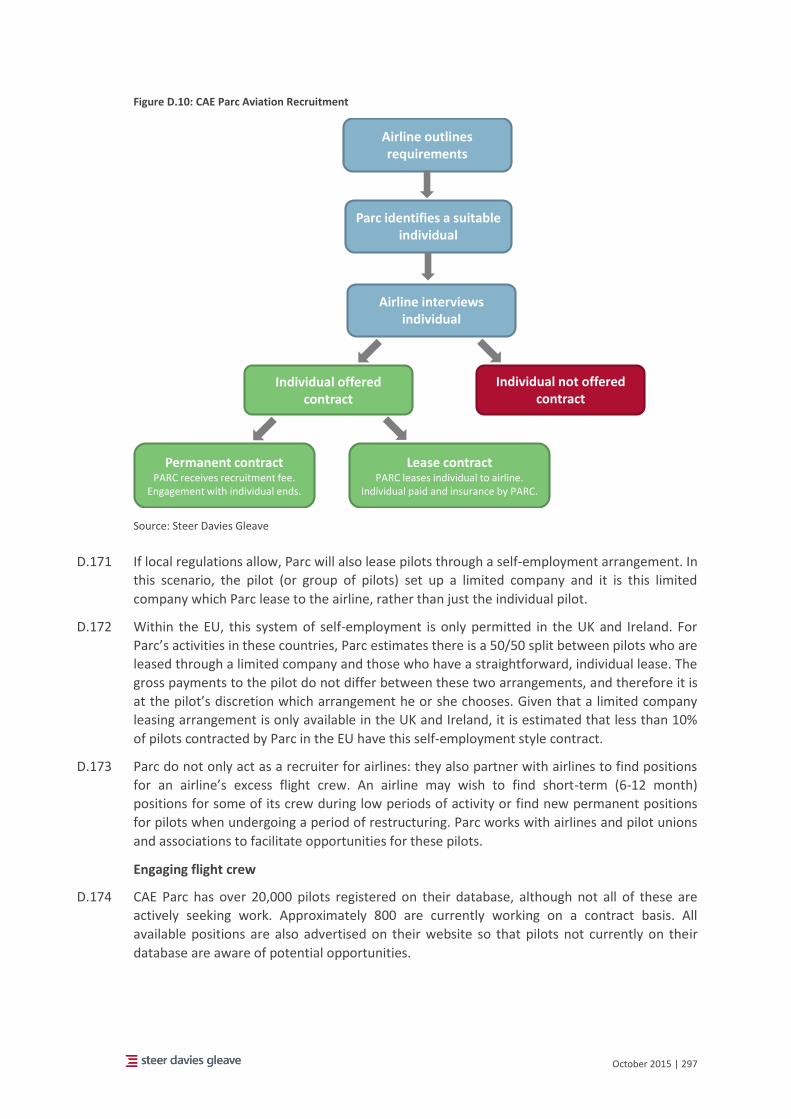
October 2015 | 297
Figure D.10: CAE Parc Aviation Recruitment
Source: Steer Davies Gleave
D.171 If local regulations allow, Parc will also lease pilots through a self-employment arrangement. In
this scenario, the pilot (or group of pilots) set up a limited company and it is this limited
company which Parc lease to the airline, rather than just the individual pilot.
D.172 Within the EU, this system of self-employment is only permitted in the UK and Ireland. For
Parc’s activities in these countries, Parc estimates there is a 50/50 split between pilots who are
leased through a limited company and those who have a straightforward, individual lease. The
gross payments to the pilot do not differ between these two arrangements, and therefore it is
at the pilot’s discretion which arrangement he or she chooses. Given that a limited company
leasing arrangement is only available in the UK and Ireland, it is estimated that less than 10%
of pilots contracted by Parc in the EU have this self-employment style contract.
D.173 Parc do not only act as a recruiter for airlines: they also partner with airlines to find positions
for an airline’s excess flight crew. An airline may wish to find short-term (6-12 month)
positions for some of its crew during low periods of activity or find new permanent positions
for pilots when undergoing a period of restructuring. Parc works with airlines and pilot unions
and associations to facilitate opportunities for these pilots.
Engaging flight crew
D.174 CAE Parc has over 20,000 pilots registered on their database, although not all of these are
actively seeking work. Approximately 800 are currently working on a contract basis. All
available positions are also advertised on their website so that pilots not currently on their
database are aware of potential opportunities.
Airline outlines requirements
Parc identifies a suitable individual
Airline interviews individual
Individual offered contract
Individual not offered contract
Permanent contractPARC receives recruitment fee.
Engagement with individual ends.
Lease contractPARC leases individual to airline.
Individual paid and insurance by PARC.
October 2015 | 298
D.175 Parc noted that it can be difficult to match pilots with positions, as airlines often have specific
requirements which restrict the number of pilots who fit the criteria. Generally highly-skilled
and experienced pilots are the most readily sought by airlines. For example, airlines require
pilots to have all the required training and skills for short-term contracts, otherwise airlines
will incur additional expenses for training a pilot, with no long term benefit. It can be difficult
to place less experienced pilots in this context.
D.176 Even if a pilot is highly-skilled and experienced, Parc aviation stated that it can be difficult to
find the right match: a pilot may have been off aircraft for a few years or have no flying hours
on the particular aircraft type required.
D.177 Parc lists a number of benefits for pilots by contracting to airlines through a temporary work
agency. Pilots are able to experience a range of airlines and aircraft types, which enhances a
pilots CV and increases their marketability. Sometimes highly-qualified commercial pilots also
choose to engage with a temporary work agency to move to a new location.
D.178 Parc did note however that pilots tend not to be engaged on a part-time basis through
temporary contracts. Although there are no clear reasons for this, Parc suggested that this
might be due to the rapid growth in the industry and the constant need for pilots, which
favours full-time contracts.
Compliance
D.179 The difficulties of contracting pilots correctly in each location was emphasised by Parc. In
accordance with legislation, Parc taxes and socially secures its pilots based on their home-
base.
D.180 Whilst Parc ensures all its pilots are taxed and socially secured correctly, there is a significant
time and cost impact associated for Parc. They note that the regulations are not clear and
there is a lack of information available to help understand them. Therefore it has been
necessary for Parc to invest a lot of money to understand the local laws in each Member State
it operates in.
D.181 A number of examples of the difficulties of taxing and socially securing pilots under the current
legislation were cited by Parc:
Where the pilot’s home-base is a different country to where he or she lives, they will be
socially secured in a different country to the one in which they live and wish to claim
social security benefits from.
Pilots can often pay tax in two or three countries. For example, if a pilot lives in Denmark
but his or her home base is in Spain, then he or she will be taxed twice as no double
taxation treaty exists between these countries. Similarly, Parc reported that they engaged
two French pilots who were working from a German base flying an Irish registered
aircraft. In this instance, they were taxed three times.
If a pilot has two or more bases in a 12 month period, then the home-base rule is
overridden and pilots will be social secured in the country of the employer (i.e. Ireland in
the case of CAE Parc Aviation).
D.182 These situations are evidently problematic for pilots, as they are unable to access social
security in their own country or face losing significant income through paying tax in multiple
countries. Many of these problems can be overcome, but Parc states that it takes significant
time and resources to resolve them. In order to ensure a pilot can claim social security in the
country in which he or she lives, Parc needs to engage and agree an arrangement with
October 2015 | 299
authorities in two or sometimes three countries. Each pilot’s situation is different, so
significant resources are required to assess each case.
D.183 On behalf of the pilot, Parc can apply for the following certifications:
A1 certificate: confirms an individual has paid social security in the country in which he or
she is paying it. For example, this certificate prove a non-Irish pilot working from an Irish
base was paying social security in Ireland.
S1 certificate: allows pilots to obtain benefits in country in which they live, even if
benefits are paid in a different country. For example, if a pilot is based and pays social
security contributions in Spain, but lives in France, an S1 certificate would enable him or
her to receive social security benefits in France.
D.184 Whilst these certifications can resolve many of the problems pilots working across Europe can
face, in practice there are difficulties in obtaining them. Experiences across the MS range
significantly - whilst some authorities provide the certification quickly, Parc Aviation reported
that for others, there can be significant delays (6-12 months) in receiving an A1 certificate
from the relevant authorities. An S1 certificate only be applied for, after an A1 certificate has
been granted, meaning that a pilot cannot access social security in their own country for over
a year. Within this time, the pilot’s contract may have ended.
D.185 In many instances, Parc note that authorities don’t respond to applications or the authority
will decline to provide the required certifications. In these cases, Parc has to reapply or appeal
the ruling, which causes further delay and incurs additional costs. Additionally, authorities are
often not internally consistent in their application of the regulations: two contacts from the
same authority can provide different responses on the same situation.
D.186 Following the commencement of the home-base rule, Parc has taken over responsibility for
taxation and social security from individual pilots. Compliance with the home-base rule has
also resulted in Parc losing pilots and clients, who were unhappy about being taxed at their
home-base (particularly if they do not live there).
Potential improvements
D.187 Parc suggested that the system would work better if the following improvements were made:
responses from authorities were received quicker than 6 – 12 months after an application
is made;
authorities were internally consistent in their application of the regulations; and
provision of more information and understanding of the rules, especially following
regulation changes.
Conclusion
D.188 CAE Parc Aviation work with airlines to engage pilots on a permanent or temporary, leasing
arrangement. Their primary function is to match available pilots with available positions,
subject to the requirements of the airline.
D.189 The international nature of pilots’ work causes difficulties in ensuring all pilots are compliant
with taxation and social security regulations. The current state of the regulations can cause a
number of issues for pilots, including paying tax in more than one country and being socially
secured in a different country to the one in which they live.

October 2015 | 300
D.190 Where a temporary, leasing arrangement is in place, these issues can be particularly acute.
Parc Aviation manage these issues on behalf of pilots, but often experience significant delays
and inconsistencies in the responses they receive to their applications for pilots to access
social security in their own country. This means that a pilot may not be socially secured for
over a year from the start of their contract, by which time the contract may have terminated
and they are working elsewhere.
D.191 Parc believe that quicker processing of cases and consistency in application of the regulations
by authorities would improve the current situation. More transparent information on the
regulations would also be welcomed.
October 2015 | 301
E List of abbreviations ACI Airports Council International
AIA Athens International Airport
ALPA Air Line Pilots Association
ANSP Air Navigation Service Provider
BA British Airways
CDD Fixed term contracts (Liège Airport)
CDG Paris Charles de Gaulle
CDI Permanent employment (Liège Airport)
CGN Cologne Airport
CLA Collective Labour Agreement
CRS Computer Reservation Systems
DAA Dublin Airport Authority
ERC Employee Representation Committees
EU European Union
FAA Federal Aviation Administration
FXE FedEx Express
GVA Gross Value Added
HKFFC Hong Kong Cabin Crew Union
HKG Hong Kong Airport
IAG International Airlines Group
LACHS Liège Air Cargo Handling Services
LCC Low Cost Carrier
LFS Labour Force Survey
MEM Memphis, Tennessee
MF Mixed Fleet

October 2015 | 302
MS Member State
NA National Accounts
NACE Nomenclature statistique des activités économiques dans la Communauté
européenne: a European industry standard system for the statistical
classification of economic activities
SBS Structural Business Statistics
SLA Service Level Agreement
SLSY Finnish Cabin Crew Union
P:\Projects\227\5\79\01\Work\04 Reporting\03 Final report\08 Final Report v4\Study on employment and working conditions in air transport and airports FINAL REPORT
4.1.docx
Control Sheet
Control Sheet Document Title
Study on employment and working conditions in air transport and airports
Document Type
Final Report
Client Contract/Project No. SDG Project/Proposal No.
MOVE/E1/2014-92-2 22757901
Issue history
Issue No. Date Details
3.0 2 October 2015
Review
Originator
Rosie Offord
Other Contributors
Stefan Kouris, Hannah Capek
Reviewed by
Stephen Wainwright
Distribution
Client Steer Davies Gleave

steerdaviesgleave.com