Embed Size (px)
Citation preview
STUDY ON DYNAMICS OF PDC BIT ON MULTI-LAYERED
FORMATIONS USING ANSYS – EXPLICIT DYNAMICS / AUTODYN
by
KIRSANTH A/L INDRAN
15048
Dissertation submitted in partial fulfillment
of the requirements for the
Bachelor of Engineering (Hons)
(Petroleum)
JANUARY 2015
Universiti Teknologi PETRONAS
Bandar Seri Iskandar
31750 Tronoh
Perak Darul Ridzuan
i
CERTIFICATION OF APPROVAL
STUDY ON DYNAMICS OF PDC BIT ON MULTI-LAYERED FORMATION
USING ANSYS – EXPLICIT DYNAMICS / AUTODYN
By
Kirsanth A/L Indran
15048
Dissertation submitted in partial fulfillment of the requirements for the
Bachelor of Engineering (Hons)
(Petroleum Engineering Engineering)
Approved by,
________________________________
(Dr Dereje Engida Woldemichael)
Universiti Teknologi PETRONAS
Bandar Seri Iskandar, 31750 Tronoh,
Perak Darul Ridzuan, Malaysia.

ii
CERTIFICATION OF ORIGINALITY
This is to certify that I am responsible for the work submitted in this project, that the
original work is my own except as specified in the references and acknowledgements,
and that the original work contained herein have not been undertaken or done by
unspecified sources or persons.
___________________________________________
Kirsanth A/L Indran
iii
Abstract
This project focuses on the performance of Polycrystalline Diamond Compact (PDC)
drill bit in multi-layered formations. Research papers conclude that PDC bit in market go
through difficulties in order to penetrate multi-layered formations. The performance of
PDC drill bit dropped when used in multi-layered formations, especially when hard
formations are present. In order to investigate the performance of PDC bit, simulations
will be carried out using computer aided software, since conducting experiment is much
more difficult and expensive. Therefore, the purpose of this project is to model and
simulate PDC bit using ANSYS. Parametric analyses were done in order to get a better
understanding regarding the performance of the bit. Throughout this project, three types
of simulation were done. Firstly, the project is started by constructing a preliminary
model of bit, formation and fluid. Successful simulation of preliminary model proved that
Audodyn can be indeed used as a solver for this simulation. Next, the reverse engineered
model of PDC bit was used for the simulation. Finally, a single cutter model was used to
carry out further simulations. The results of this project were obtained by varying the
rake angle of the cutter, as well as using different formations such as limestone,
sandstone and dolomite. From the simulations, it can be concluded that cutter with 0°
rake angle gives better penetration in hard formation, whereas cutter with 10° rake angle
gives better performance in soft formation. In future, Autodyn can be used to analyze the
effect of drilling fluid on PDC bit performance.
iv
ACKNOWLEDGEMENT
Firstly, I would like this opportunity to thank all parties who have contributed and
helped me in completing my Final Year Project for the past two semesters. I would
like to dedicate special thanks to my project supervisor, Dr Dereje Engida
Woldemichael, for his guidance and motivation throughout the completion of this
project. Moreover, I would like to extend my appreciation to those who may have
taught me voluntarily or involuntarily during my simulation process.
I would like to thank all the Y-UTP team members for the valuable information that
were provided by them. Last but not least, a heartfelt gratitude to Universiti Teknologi
PETRONAS for providing the platform for this project to be carried out.
Thank you.
v
TABLE OF CONTENTS
CERTIFICATION OF APPROVAL ............................................................................... i
CERTIFICATION OF ORIGINALITY ......................................................................... ii
ABSTRACT ................................................................................................................. iii
ACKNOWLEDGEMENT ............................................................................................ iv
TABLE OF CONTENTS ............................................................................................... v
LIST OF FIGURES ..................................................................................................... vii
LIST OF TABLES ....................................................................................................... ix
ABBREVIATIONS AND NOMENCLATURE ............................................................. x
CHAPTER 1: INTRODUCTION
1.1 Background of Study ....................................................................................... 1
1.2 Problem Statement ........................................................................................... 2
1.3 Objective ......................................................................................................... 3
1.4 Scope of Study ................................................................................................ 3
1.5 The Relevancy of the Project ........................................................................... 3
1.6 Feasibility of the Project within the Scope and Time Frame ............................. 4
1.7 Overview of the Thesis .................................................................................... 4
CHAPTER 2: LITERATURE REVIEW
2.1 Development of PDC Drill Bit ......................................................................... 5
2.2 PDC Bit in Multi-Layered Formation .............................................................. 6
2.3 Drilling Fluid ................................................................................................... 7
2.4 Finite Element Analysis (Explicit Dynamics)................................................... 9
2.5 ANSYS Autodyn ............................................................................................. 9
2.6 Summary ......................................................................................................... 9
CHAPTER 3: RESEARCH METHODOLOGY
3.1 Project Flow Chart ......................................................................................... 11
vi
3.2 Development of Model .................................................................................. 13
3.2.1 Preliminary Model ............................................................................... 13
3.2.2 Simulation of Preliminary Model ......................................................... 19
3.2.3 Simulation of PDC Bit ......................................................................... 21
3.2.4 Simulation of Single Cutter .................................................................. 24
3.3 Gantt Chart and Key Milestone ...................................................................... 28
3.4 Tools and Equipment ..................................................................................... 29
3.4 Summary ....................................................................................................... 29
CHAPTER 4: RESULT AND DISCUSSION
4.1 Result for 0° Rake Angle ............................................................................... 30
4.2 Result for 10° Rake Angle ............................................................................. 35
CHAPTER 5: CONCLUSION AND RECOMMENDATION
5.1 CONCLUSION ............................................................................................. 40
5.2 RECOMMENDATIONS ............................................................................... 41
REFERENCES ............................................................................................................ 42
vii
List of Figures
FIGURE 1. Component of PDC drill bits ....................................................................... 6
FIGURE 2. Condition of bit after drilling a multi-layer formation.................................. 7
FIGURE 3. Project Flow Chart .................................................................................... 12
FIGURE 4. Explicit Dynamics component analysis ..................................................... 13
FIGURE 5.Coordinate System ..................................................................................... 15
FIGURE 6. Preliminary Model meshing ...................................................................... 16
FIGURE 7. PDC Bit Model meshing ........................................................................... 16
FIGURE 8. Angular Velocity on Preliminary Model.................................................... 17
FIGURE 9. Force acting on Preliminary Model ........................................................... 18
FIGURE 10. Fixed support on Preliminary Model ...................................................... 18
FIGURE 11. Autodyn Setup ........................................................................................ 19
FIGURE 12. Preliminary Model – Case 1 .................................................................... 19
FIGURE 13. Energy Summary for Preliminary Model – Case 1 .................................. 20
FIGURE 14. Preliminary Model – Case 2 .................................................................... 20
FIGURE 15. Energy Summary for Preliminary Model – Case 2 .................................. 21
FIGURE 16. Model of PDC Bit in assembly design ..................................................... 22
FIGURE 17. PDC Bit simulation ................................................................................ 22
FIGURE 18. Energy summary for PDC Bit simulation ................................................ 22
FIGURE 19. Cutter with 0° rake angle ......................................................................... 25
FIGURE 20. Cutter with 10° rake angle ....................................................................... 25
FIGURE 21. Defining boundary condition for fluid flow ............................................. 26
FIGURE 22. Simulation of Fluid flow ......................................................................... 27
FIGURE 23. Directional Velocity for 0° Rake angle .................................................... 31
FIGURE 24. Pressure graph for Limestone & Sandstone (I) ........................................ 32
FIGURE 25. Pressure graph for Dolomite & Limestone (I) .......................................... 33
FIGURE 26. Pressure graph for Sandstone & Dolomite (I) .......................................... 34
FIGURE 27. Directional Velocity for 10° Rake angle .................................................. 36
FIGURE 28. Pressure graph for Limestone & Sandstone (II) ....................................... 37

viii
FIGURE 29. Pressure graph for Dolomite & Limestone (II) ........................................ 38
FIGURE 30. Pressure graph for Sandstone & Dolomite (II) ......................................... 39
ix
List of Tables
TABLE 1. Product specifications ................................................................................. 14
TABLE 2. List of Input and Output Considerations ..................................................... 28
TABLE 3. Tools parameter .......................................................................................... 28
TABLE 4. Operating parameters.................................................................................. 30
TABLE 5. Parameter and Level Chosen ...................................................................... 35

x
Abbreviations and Nomenclatures
3D Three Dimensional
FYP Final Year Project
PDC Polycrystalline Diamond Compact
ROP Rate of Penetration
UTP Universiti Teknologi Petronas
1
CHAPTER 1
INTRODUCTION
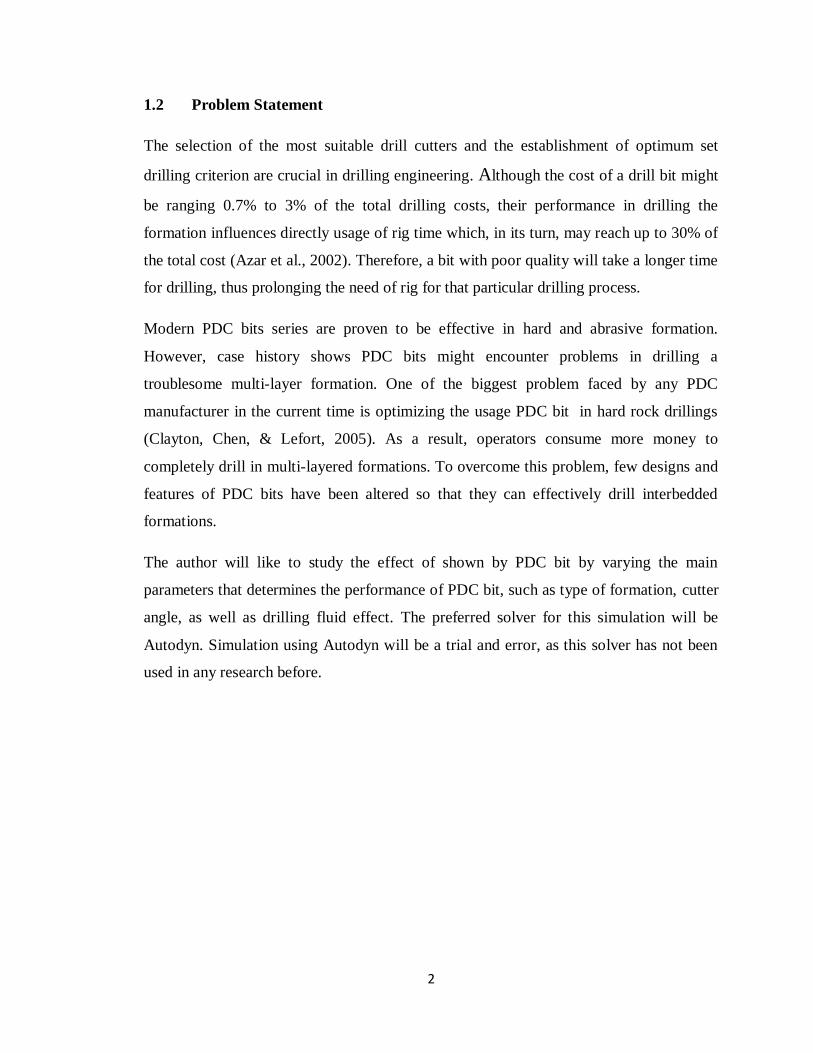
1.1 Background of Study
A new petroleum reserve is found and later on extracted by the process of drilling. A
drilling engineer should have all the understanding of engineering aspects and tools
required to drill a hole at the lowest cost. It is the responsibility of the drilling engineer to
make the drilling operation successful and as profitable as possible. (J.J. Azar & Samuel,
2007).
Drill bit is a tool used to drill a well and the success of drilling operation partly depends
on performance of the drill bit. There are several types of drill bits available in the
market, and the selection of drill bit depends on type of formation to be drilled. Some
formation are categorized as soft, some are categorized as hard formation, and some are
in between these two, called medium hard formations. The most challenging formation to
be drilled is when formations are interbedded with hard stringers. Around 98% of
hydrocarbon production is from a type of rock called sedimentary rock (Bowers,
Heavysege, Hamzah, and Passey, 2004). Examples of this type of rock are sandstone and
limestone.
Drill bit selection is a crucial process because it has the most impact on the total cost to
drill a new well. Generally, two types of drill bit are widely used in the industry. There
are roller cone bit and fixed cutter bit. In this project, the author will be studying on the
dynamics of Polycrystalline Diamond Compact (PDC) bit on multi-layered formation.
2
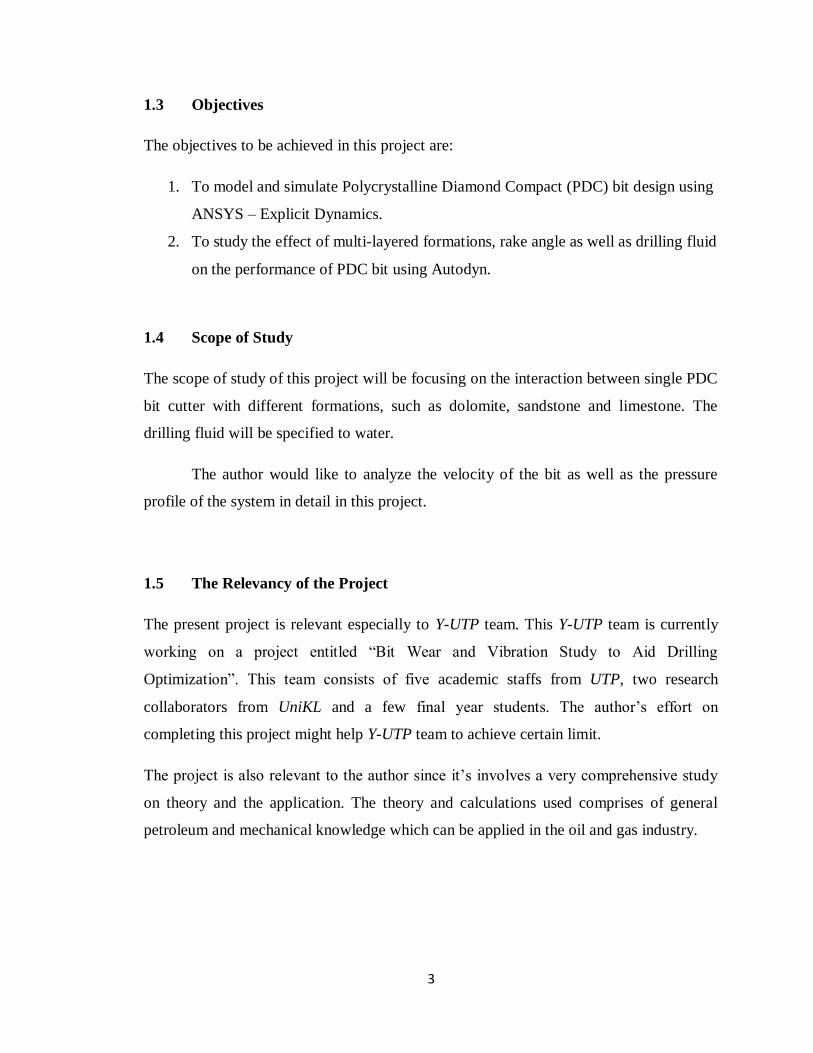
1.2 Problem Statement
The selection of the most suitable drill cutters and the establishment of optimum set
drilling criterion are crucial in drilling engineering. Although the cost of a drill bit might
be ranging 0.7% to 3% of the total drilling costs, their performance in drilling the
formation influences directly usage of rig time which, in its turn, may reach up to 30% of
the total cost (Azar et al., 2002). Therefore, a bit with poor quality will take a longer time
for drilling, thus prolonging the need of rig for that particular drilling process.
Modern PDC bits series are proven to be effective in hard and abrasive formation.
However, case history shows PDC bits might encounter problems in drilling a
troublesome multi-layer formation. One of the biggest problem faced by any PDC
manufacturer in the current time is optimizing the usage PDC bit in hard rock drillings
(Clayton, Chen, & Lefort, 2005). As a result, operators consume more money to
completely drill in multi-layered formations. To overcome this problem, few designs and
features of PDC bits have been altered so that they can effectively drill interbedded
formations.
The author will like to study the effect of shown by PDC bit by varying the main
parameters that determines the performance of PDC bit, such as type of formation, cutter
angle, as well as drilling fluid effect. The preferred solver for this simulation will be
Autodyn. Simulation using Autodyn will be a trial and error, as this solver has not been
used in any research before.
3
1.3 Objectives
The objectives to be achieved in this project are:
1. To model and simulate Polycrystalline Diamond Compact (PDC) bit design using
ANSYS – Explicit Dynamics.
2. To study the effect of multi-layered formations, rake angle as well as drilling fluid
on the performance of PDC bit using Autodyn.
1.4 Scope of Study
The scope of study of this project will be focusing on the interaction between single PDC
bit cutter with different formations, such as dolomite, sandstone and limestone. The
drilling fluid will be specified to water.
The author would like to analyze the velocity of the bit as well as the pressure
profile of the system in detail in this project.
1.5 The Relevancy of the Project
The present project is relevant especially to Y-UTP team. This Y-UTP team is currently
working on a project entitled “Bit Wear and Vibration Study to Aid Drilling
Optimization”. This team consists of five academic staffs from UTP, two research
collaborators from UniKL and a few final year students. The author’s effort on
completing this project might help Y-UTP team to achieve certain limit.
The project is also relevant to the author since it’s involves a very comprehensive study
on theory and the application. The theory and calculations used comprises of general
petroleum and mechanical knowledge which can be applied in the oil and gas industry.
4
1.6 Feasibility of the Project within the Scope and Time Frame
The project is within the capability of a final year student to be executed with the help
and guidance from the supervisor and the lab instructor. Drilling Engineering course is
one of the compulsory subjects for a Petroleum Engineering student. Therefore, the
author has the knowledge that can be useful for this project. The time frame is also
feasible and the project can be completed within the time allocated.
1.7 Overview of the Thesis
This paper consists of five chapters in total. Chapter 1 is basically an Introduction for this
project, mainly stating the problem statement and objectives of this project. Chapter 2 is
Literature Review, which has a critical analysis cited from research papers. Moving on,
Chapter 3 is about Methodology. Here, all the research methods and project activities are
stated.
Chapter 4, Results and Discussion will be presenting all the results and findings by
carrying out the proposed methods and activities. Finally, Chapter 5 concludes the entire
project with relevant to the objectives, and suggesting some recommendations in case of
future work.
5
CHAPTER 2
LITERATURE REVIEW
2.1 Development of PDC Drill Bit
The first fixed cutter bits, or also known as drag bits were started to be used around 1900
in rotary drilling. Since these bits have poor wear resistance, they were used to drill in
shallow and soft formations. In 1973, after years of researching and experimentation,
General Electric introduced PDC cutters, which have lead to the development of PDC
bits. Since its introduction, PDC cutters and bits have undergone tremendous
technological advances to improvise their performances. On earlier years, 2% of all
drilling process used PDC bits. This number has increased to 15% by late 1980s, 45% by
late 1990s, 50% in 2003. By 2010, 65% of all footage drilled in oil fields is done using
PDC bits (Che, Han, Guo, & Ehmann, 2012).
The polycrystalline diamond compact, or simply known as PDC bit consists of a layer of
diamond particles bonded with each other, and on the outer it is coated with a thicker
layer of a tungsten carbide (Gouda et al., 2011). A drilling bit has the highest influence
on the cost factor in any drilling operations. Therefore, in order to minimize the cost, the
same PDC bit will be used to drill a particular formation as long as the PDC cutters are in
great conditions. PDC bits are widely known for performing in soft and medium-hard
non-abrasive formations. Examples of these types of formations are sandstone, siltstone
and shale.
6
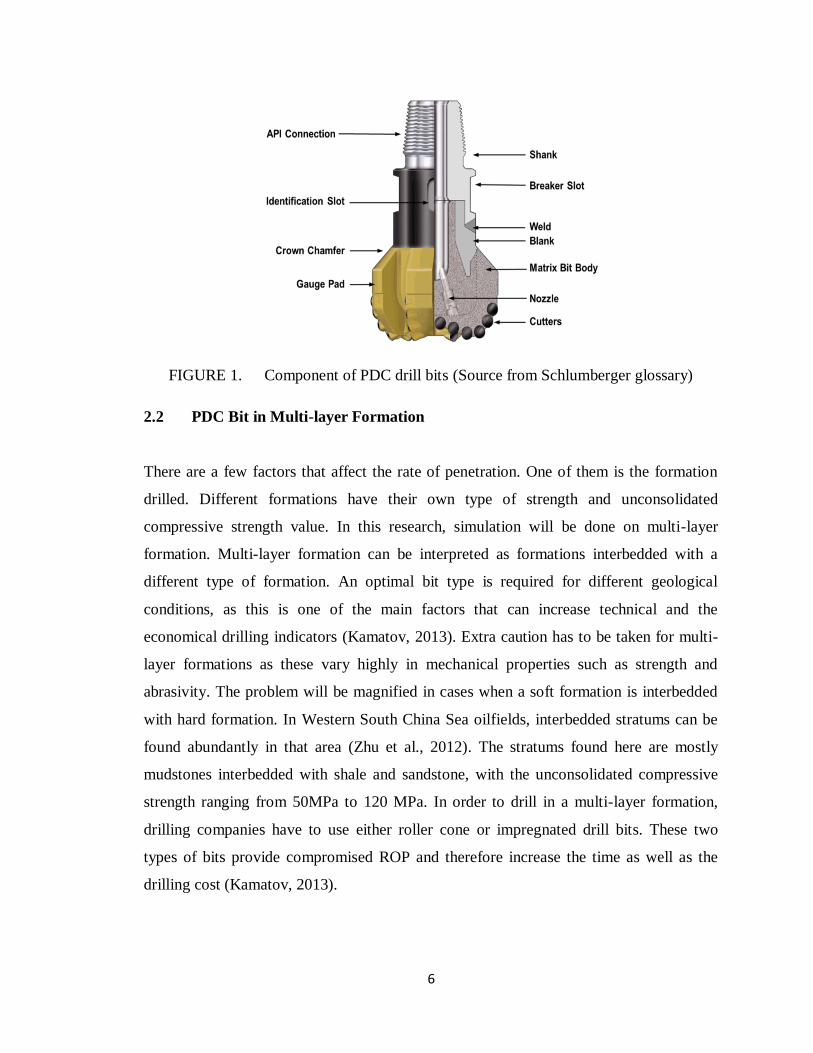
FIGURE 1. Component of PDC drill bits (Source from Schlumberger glossary)
2.2 PDC Bit in Multi-layer Formation
There are a few factors that affect the rate of penetration. One of them is the formation
drilled. Different formations have their own type of strength and unconsolidated
compressive strength value. In this research, simulation will be done on multi-layer
formation. Multi-layer formation can be interpreted as formations interbedded with a
different type of formation. An optimal bit type is required for different geological
conditions, as this is one of the main factors that can increase technical and the
economical drilling indicators (Kamatov, 2013). Extra caution has to be taken for multi-
layer formations as these vary highly in mechanical properties such as strength and
abrasivity. The problem will be magnified in cases when a soft formation is interbedded
with hard formation. In Western South China Sea oilfields, interbedded stratums can be
found abundantly in that area (Zhu et al., 2012). The stratums found here are mostly
mudstones interbedded with shale and sandstone, with the unconsolidated compressive
strength ranging from 50MPa to 120 MPa. In order to drill in a multi-layer formation,
drilling companies have to use either roller cone or impregnated drill bits. These two
types of bits provide compromised ROP and therefore increase the time as well as the
drilling cost (Kamatov, 2013).
7
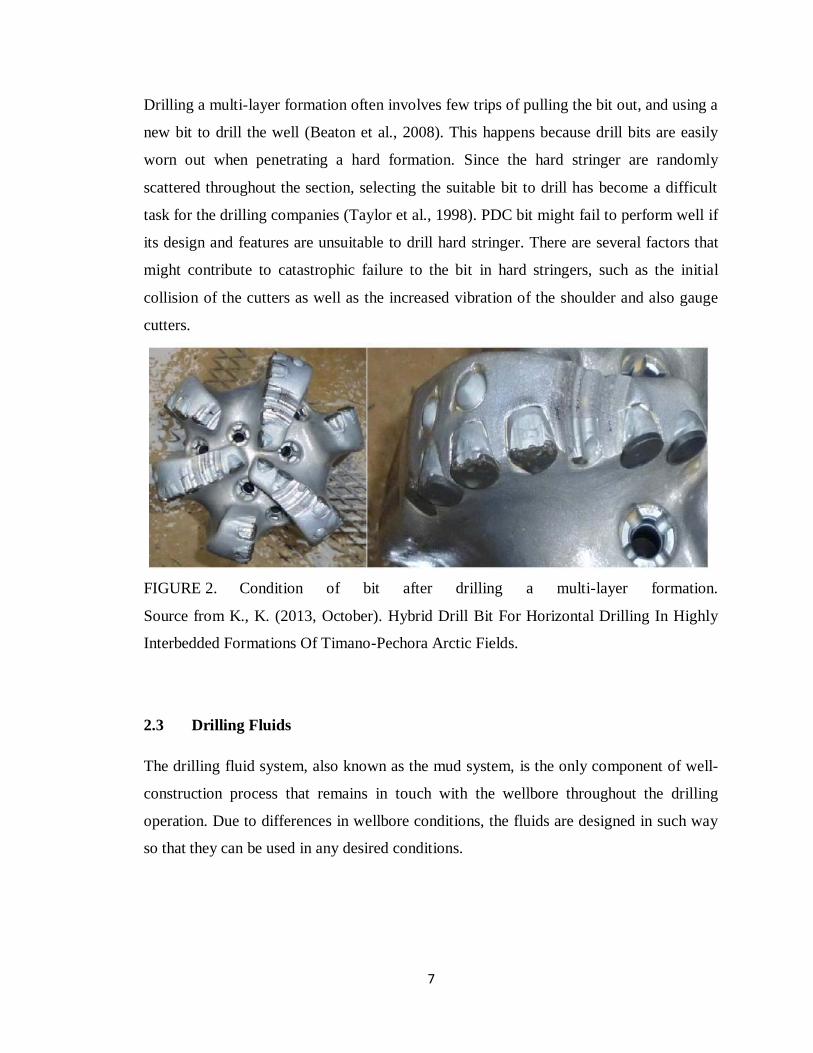
Drilling a multi-layer formation often involves few trips of pulling the bit out, and using a
new bit to drill the well (Beaton et al., 2008). This happens because drill bits are easily
worn out when penetrating a hard formation. Since the hard stringer are randomly
scattered throughout the section, selecting the suitable bit to drill has become a difficult
task for the drilling companies (Taylor et al., 1998). PDC bit might fail to perform well if
its design and features are unsuitable to drill hard stringer. There are several factors that
might contribute to catastrophic failure to the bit in hard stringers, such as the initial
collision of the cutters as well as the increased vibration of the shoulder and also gauge
cutters.
FIGURE 2. Condition of bit after drilling a multi-layer formation.
Source from K., K. (2013, October). Hybrid Drill Bit For Horizontal Drilling In Highly
Interbedded Formations Of Timano-Pechora Arctic Fields.
2.3 Drilling Fluids
The drilling fluid system, also known as the mud system, is the only component of well-
construction process that remains in touch with the wellbore throughout the drilling
operation. Due to differences in wellbore conditions, the fluids are designed in such way
so that they can be used in any desired conditions.
8
These are some of the usage of a drilling fluid:
1. Pumps the cuttings to the surface, thus cleaning the wellbore.
2. Stabilizes formation pressures of wellbore in order to minimize the risk of issues
such as kick.
3. Drilling fluid provides support to the wall of a well prior to casing and cementing.
4. Provides hydraulic horsepower to the bit to increase its impact force.
Drilling fluid is one of the factors that affect the rate of penetration (ROP). In drilling
industry, ROP is defined as the speed at which the drill bit penetrates the formation or
breaks the rock under it to increase the depth of borehole. By increasing the plastic
viscosity of the drilling fluid, rate of penetration as well as the normalized rate of
penetration is decreased (Paiaman et al., 2009). The penetration rate can be decreased by
increasing the mud weight. Lower penetration rate is desired in any drilling process as it
means less time is taken to drill, thus minimizing the usage of drill bit (Hemphill and
Clark, 1994).
The type of drilling fluid used also showed effect on the ROP of drill bit. Increased ROP,
together with reduction in torque and drag are observed when oil-emulsion mud is used
as the drilling fluid. This happens because of the mud’s lubricating properties. Apart from
this, some experiments have shown that under hydraulically limited conditions, the
effective bit hydraulics can be greatly enhanced by lowering the viscosity as well as the
Reynolds number of the drilling fluid used (Beck and Alaska, 1995).
Due to the frictional force, the drill bits tend to get worn out after some time, thus
increasing the time for drilling. Drill bits get affected from thermal wear and impact
when drilling interbedded formations (Yahiaoui at al., 2012).
9
2.4 Finite Element Analysis (Explicit Dynamics)
Finite Element Analysis (FEA) is a computer model of a material or design that is
analyzed to get specific results. It is used in existing or new product refinement. A
company can verify a proposed design to meet client’s specifications subject to
manufacturing or construction. Modifying an existing product or structure is utilized to
improve or qualify the product for a new service condition. If the model fails, FEA is
very useful to help designer to modify back the design to meet the targeted condition.
FEA help analyst to predict failure due to unknown stresses by showing problem areas on
an object and giving chances for designers to see all of the theoretical stresses within.
This method can help to reduce manufacturing costs and time rather than making and
testing the real component (Szabo, 1991). Explicit Dynamics is one of the features in
Finite Element Analysis. The ANSYS explicit dynamics product suite helps user to gain
insight into the physics of short-duration events for products that undergo highly
nonlinear, transient dynamic events.. With the ANSYS explicit dynamics products, the
author can study how a structure responds when subjected to severe loadings.
2.5 ANSYS Autodyn
ANSYS Autodyn software is a versatile explicit analysis tool for modeling the nonlinear
dynamics of solids, fluids, gases and their interactions. The product has been developed
to provide advanced capabilities within a robust, easy-to-use software tool. Simulation
projects can be completed with significantly less effort, less time and lower labor costs
than with other explicit programs. This high productivity is a result of the easy-to-use,
quick-to-learn, intuitive, interactive graphical interface implemented. Time and effort are
saved in problem setup and analysis by automatic options to define contact, by coupling
interfaces and by minimizing input requirements using safe logical defaults.
The solver technology in ANSYS Autodyn provides:
Finite element solvers for computational structural dynamics (FE)
Finite volume solvers for fast transient computational fluid dynamics (CFD)
10
Mesh-free particle solvers for high velocities, large deformation and
fragmentation (SPH)
Multi-solver coupling for multiphysics solutions including coupling between FE,
CFD and SPH
A wide suite of material models incorporating constitutive response and coupled
thermodynamics
Serial and parallel computation on shared and distributed memory systems
2.6 Summary
PDC bit are the most used drill bit in the industry now. Although PDC bits have
undergone several modifications since when they were introduced, their usage in multi-
layered formation is still not satisfactory. Besides that, drilling fluid has an effect on the
performance of PDC bit as well. Varying the properties of mud will have an effect on the
rate of penetration of drill bit.
The next chapter will be discussing on the steps taken in this project to model and
simulate PDC bit in different formations.
11
CHAPTER 3
METHODOLOGY
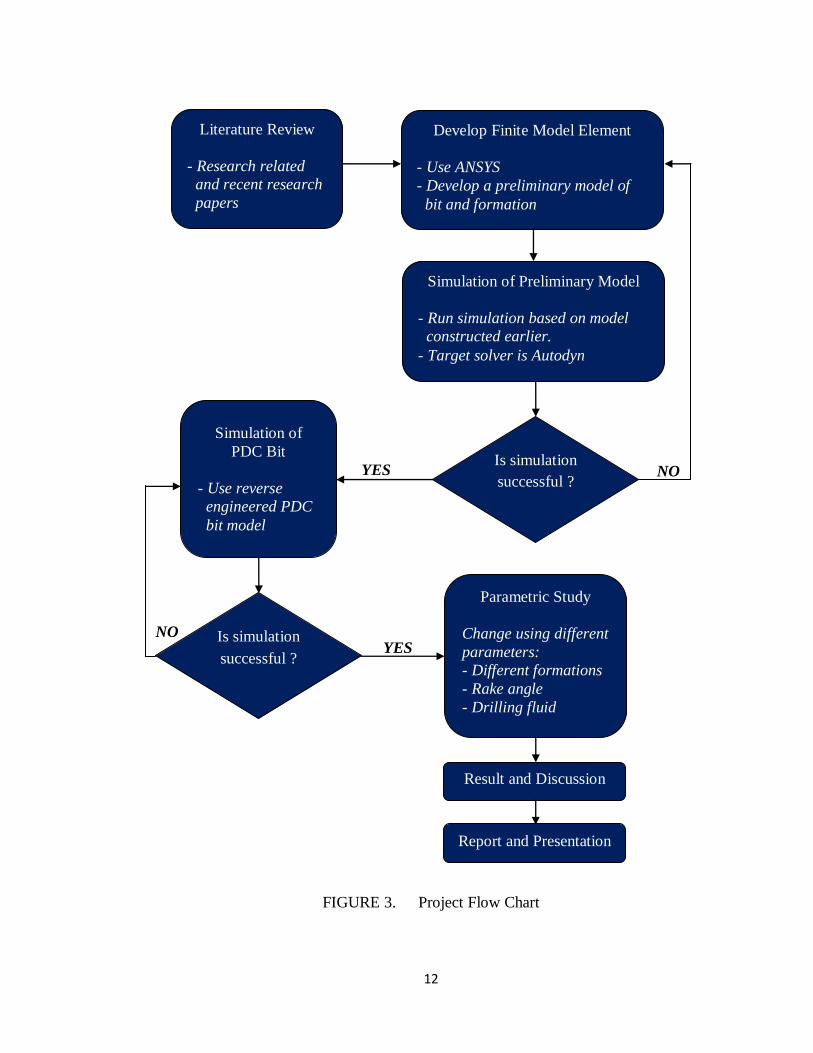
3.1 Project Flow Chart
The project is started by carrying out preliminary research on the topic from articles and
research papers. As stated in literature review, the author focused researching on PDC bit
itself first, followed by PDC bit performance in multi-layered formation, as well as
drilling fluid. Once adequate amount of understanding is acquired regarding the topic,
software will be used to carry out the rest of the project. A preliminary model with basic
design of bit and formation will be constructed using Explicit dynamics. All the
necessary parameters will be specified here. Once this is done, this model will be
imported to another solver, called Autodyn. After that, simulations will be done using this
model using Autodyn. The success of simulation using Autodyn will be crucial for this
project, as this determines whether Autodyn will be a suitable solver for this project.
If simulation in Autodyn is proven successful, further simulations will be done to
have a better understanding on the performance of PDC bit in multi-layered formation.
For this purpose, a reverse engineered model of PDC bit will be used to run the
simulation, replacing the preliminary model done earlier. Another parametric analysis
will be simulating the PDC bit in the presence of drilling fluid. All these simulations will
be solved using Autodyn. From here, the results for bit performances can be generated in
order to be discussed later on.
12
FIGURE 3. Project Flow Chart
Simulation of
PDC Bit
- Use reverse
engineered PDC
bit model
Simulation of Preliminary Model
- Run simulation based on model
constructed earlier.
- Target solver is Autodyn
Literature Review
- Research related
and recent research
papers
Develop Finite Model Element
- Use ANSYS
- Develop a preliminary model of
bit and formation
Is simulation
successful ?
Result and Discussion
Report and Presentation
Parametric Study
Change using different
parameters:
- Different formations
- Rake angle
- Drilling fluid
Is simulation
successful ?
NO YES
YES NO
13
3.2 Development of Model
3.2.1 Preliminary Model
In order to get familiarize with the software, a preliminary model is constructed, and later
run for simulation. This preliminary model basically consists of just a cylinder, which
represents a bit, and another slimmer cylinder which represents the formation itself.
There are few steps involved in setting up the model, which are explained as follows.
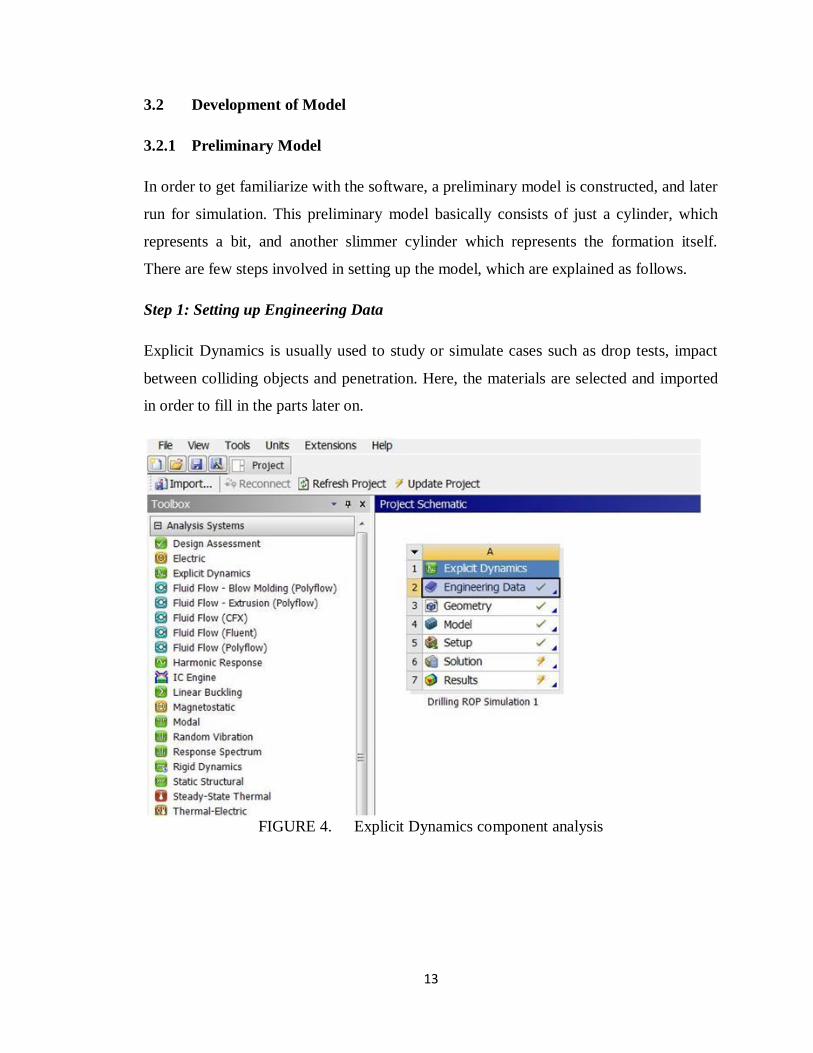
Step 1: Setting up Engineering Data
Explicit Dynamics is usually used to study or simulate cases such as drop tests, impact
between colliding objects and penetration. Here, the materials are selected and imported
in order to fill in the parts later on.
FIGURE 4. Explicit Dynamics component analysis
14
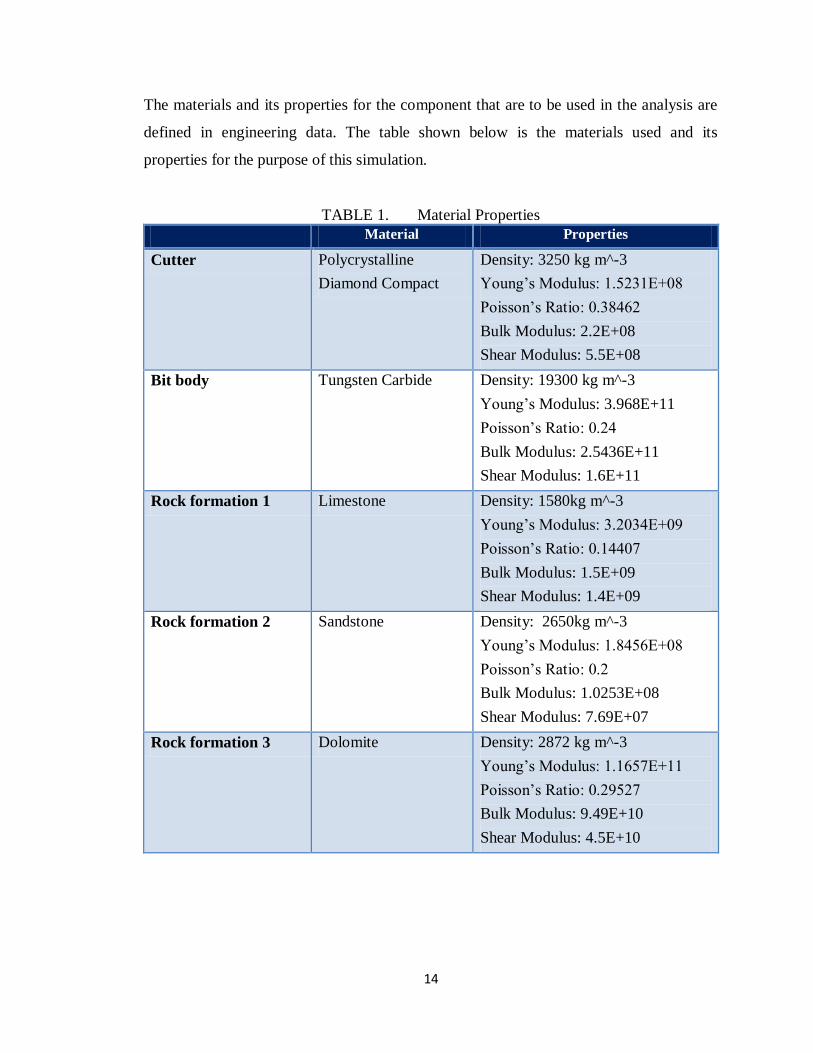
The materials and its properties for the component that are to be used in the analysis are
defined in engineering data. The table shown below is the materials used and its
properties for the purpose of this simulation.
TABLE 1. Material Properties
Material Properties
Cutter Polycrystalline
Diamond Compact
Density: 3250 kg m^-3
Young’s Modulus: 1.5231E+08
Poisson’s Ratio: 0.38462
Bulk Modulus: 2.2E+08
Shear Modulus: 5.5E+08
Bit body Tungsten Carbide Density: 19300 kg m^-3
Young’s Modulus: 3.968E+11
Poisson’s Ratio: 0.24
Bulk Modulus: 2.5436E+11
Shear Modulus: 1.6E+11
Rock formation 1 Limestone Density: 1580kg m^-3
Young’s Modulus: 3.2034E+09
Poisson’s Ratio: 0.14407
Bulk Modulus: 1.5E+09
Shear Modulus: 1.4E+09
Rock formation 2 Sandstone Density: 2650kg m^-3
Young’s Modulus: 1.8456E+08
Poisson’s Ratio: 0.2
Bulk Modulus: 1.0253E+08
Shear Modulus: 7.69E+07
Rock formation 3 Dolomite Density: 2872 kg m^-3
Young’s Modulus: 1.1657E+11
Poisson’s Ratio: 0.29527
Bulk Modulus: 9.49E+10
Shear Modulus: 4.5E+10
15
Step 2: Importing Geometry from CATIA
All the drawings for this project are done in CATIA mechanical part design. These
drawings will be saved to .stp file type so that they can be imported to ANSYS, as
ANSYS only accepts drawings in this particular format. Next up, the material for each
parts, coordinate systems, meshing, the initial conditions are defined in ANSYS
Workbench Mechanical.
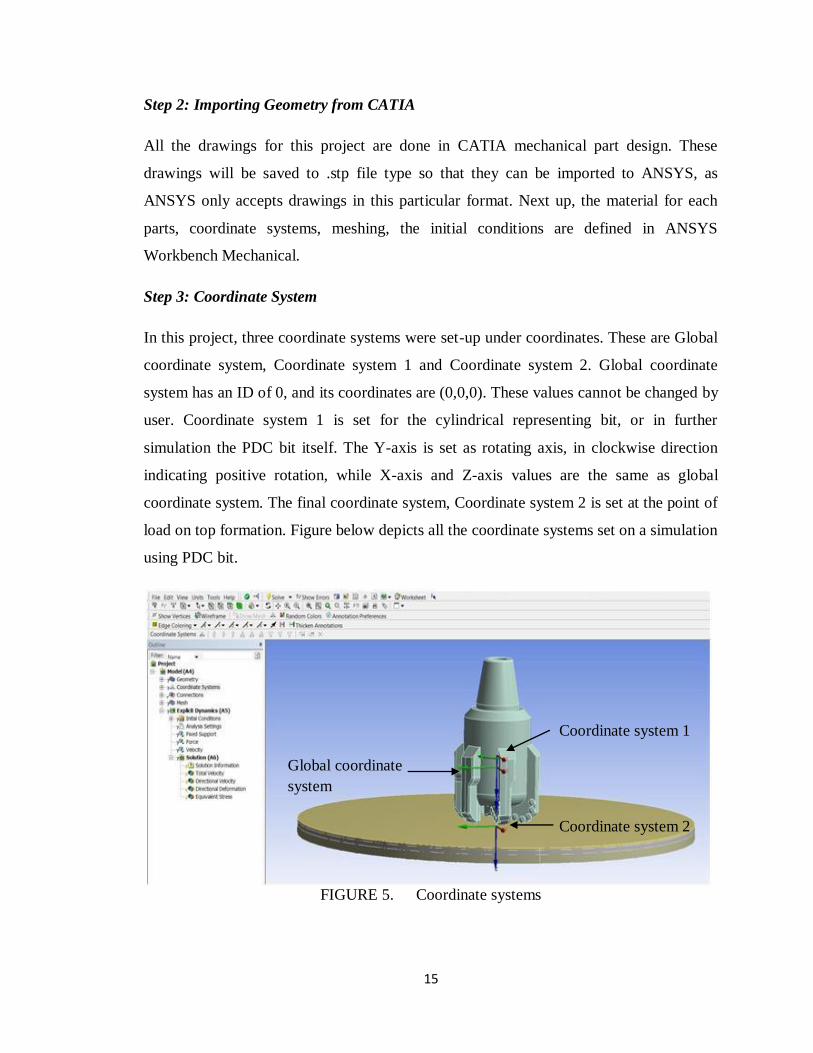
Step 3: Coordinate System
In this project, three coordinate systems were set-up under coordinates. These are Global
coordinate system, Coordinate system 1 and Coordinate system 2. Global coordinate
system has an ID of 0, and its coordinates are (0,0,0). These values cannot be changed by
user. Coordinate system 1 is set for the cylindrical representing bit, or in further
simulation the PDC bit itself. The Y-axis is set as rotating axis, in clockwise direction
indicating positive rotation, while X-axis and Z-axis values are the same as global
coordinate system. The final coordinate system, Coordinate system 2 is set at the point of
load on top formation. Figure below depicts all the coordinate systems set on a simulation
using PDC bit.
FIGURE 5. Coordinate systems
Coordinate system 1
Coordinate system 2
Global coordinate
system
16
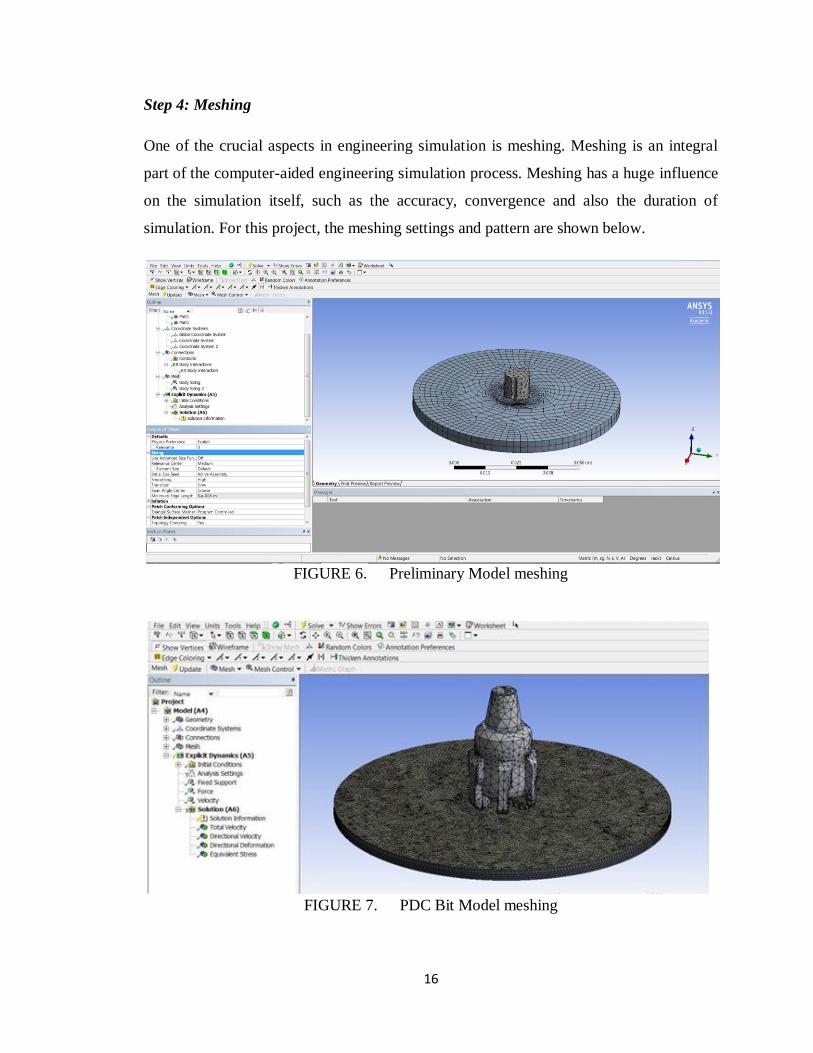
Step 4: Meshing
One of the crucial aspects in engineering simulation is meshing. Meshing is an integral
part of the computer-aided engineering simulation process. Meshing has a huge influence
on the simulation itself, such as the accuracy, convergence and also the duration of
simulation. For this project, the meshing settings and pattern are shown below.
FIGURE 6. Preliminary Model meshing
FIGURE 7. PDC Bit Model meshing
17
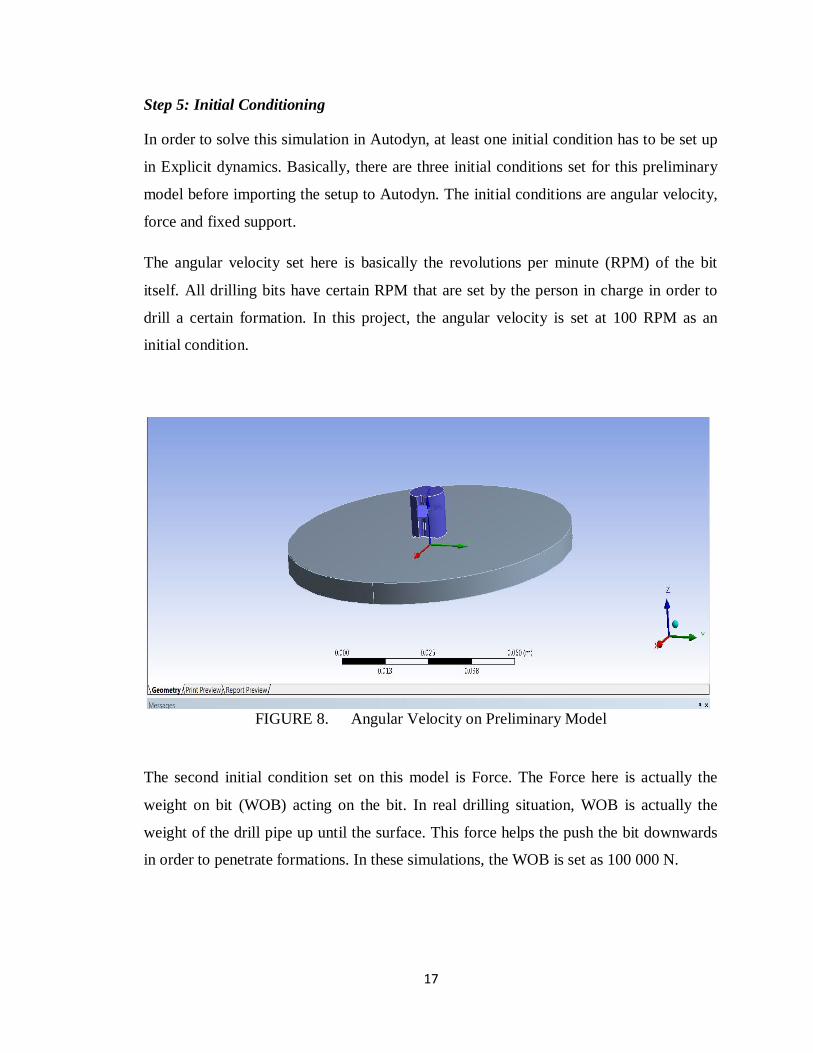
Step 5: Initial Conditioning
In order to solve this simulation in Autodyn, at least one initial condition has to be set up
in Explicit dynamics. Basically, there are three initial conditions set for this preliminary
model before importing the setup to Autodyn. The initial conditions are angular velocity,
force and fixed support.
The angular velocity set here is basically the revolutions per minute (RPM) of the bit
itself. All drilling bits have certain RPM that are set by the person in charge in order to
drill a certain formation. In this project, the angular velocity is set at 100 RPM as an
initial condition.
FIGURE 8. Angular Velocity on Preliminary Model
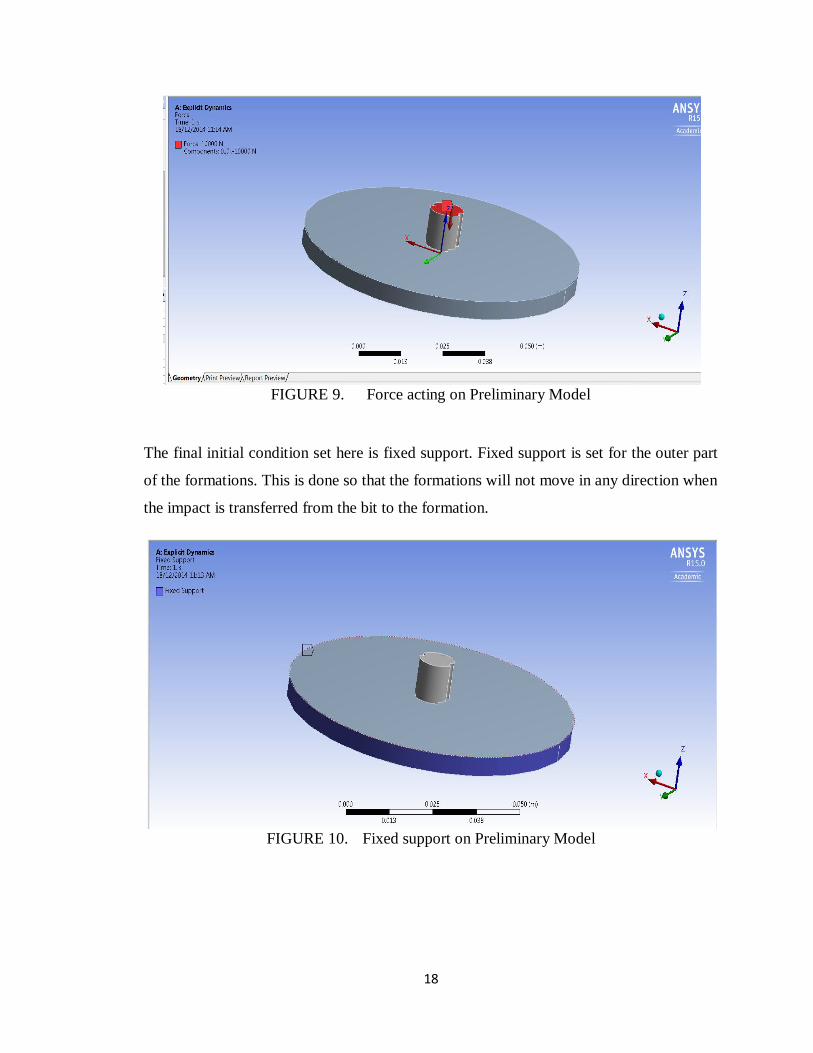
The second initial condition set on this model is Force. The Force here is actually the
weight on bit (WOB) acting on the bit. In real drilling situation, WOB is actually the
weight of the drill pipe up until the surface. This force helps the push the bit downwards
in order to penetrate formations. In these simulations, the WOB is set as 100 000 N.
18
FIGURE 9. Force acting on Preliminary Model
The final initial condition set here is fixed support. Fixed support is set for the outer part
of the formations. This is done so that the formations will not move in any direction when
the impact is transferred from the bit to the formation.
FIGURE 10. Fixed support on Preliminary Model
19
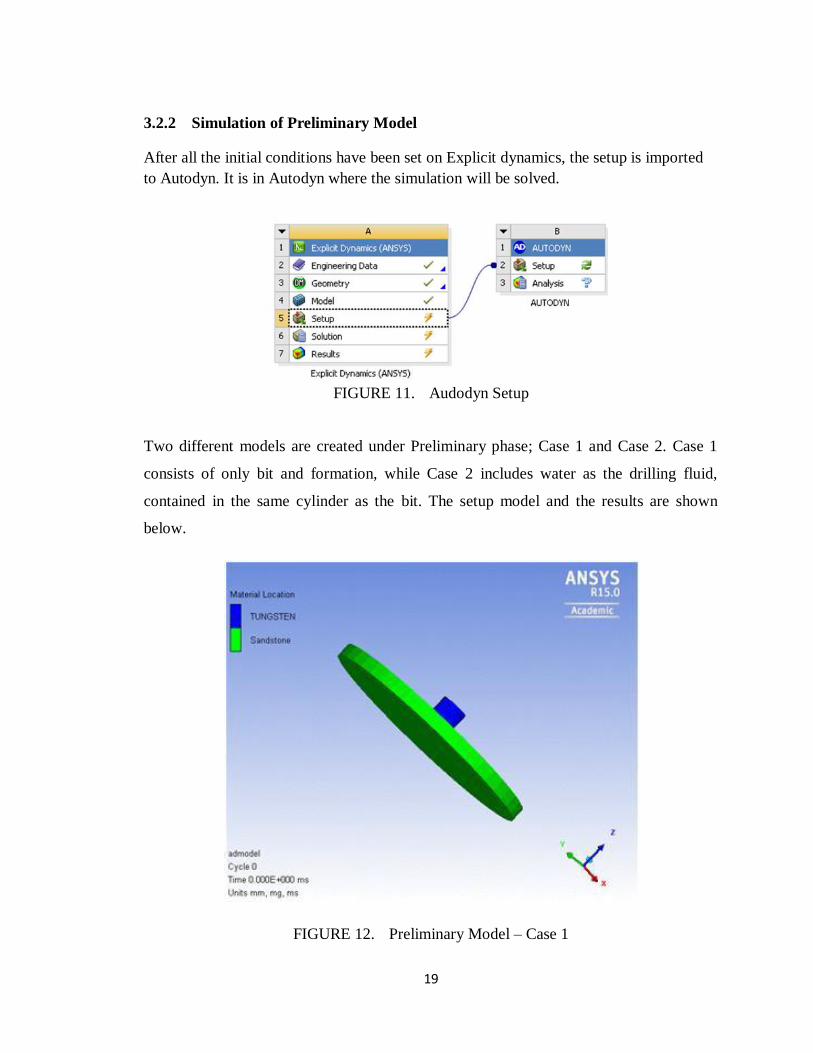
3.2.2 Simulation of Preliminary Model
After all the initial conditions have been set on Explicit dynamics, the setup is imported
to Autodyn. It is in Autodyn where the simulation will be solved.
FIGURE 11. Audodyn Setup
Two different models are created under Preliminary phase; Case 1 and Case 2. Case 1
consists of only bit and formation, while Case 2 includes water as the drilling fluid,
contained in the same cylinder as the bit. The setup model and the results are shown
below.
FIGURE 12. Preliminary Model – Case 1
20
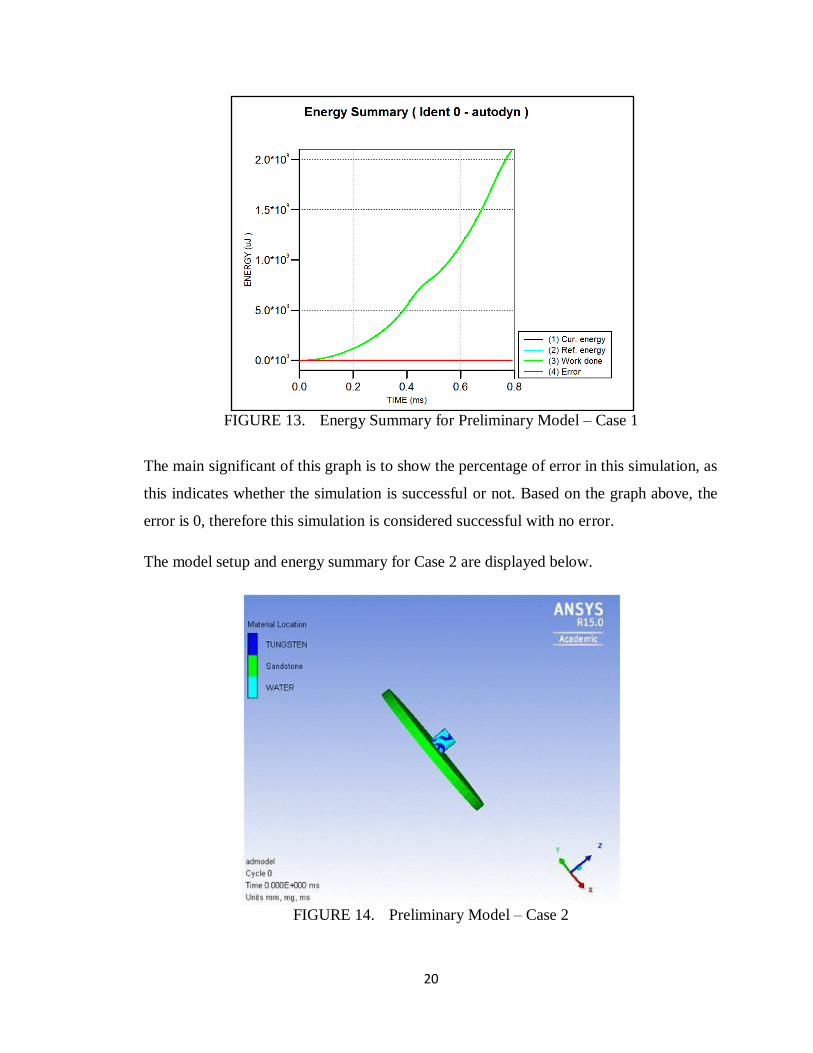
FIGURE 13. Energy Summary for Preliminary Model – Case 1
The main significant of this graph is to show the percentage of error in this simulation, as
this indicates whether the simulation is successful or not. Based on the graph above, the
error is 0, therefore this simulation is considered successful with no error.
The model setup and energy summary for Case 2 are displayed below.
FIGURE 14. Preliminary Model – Case 2
21
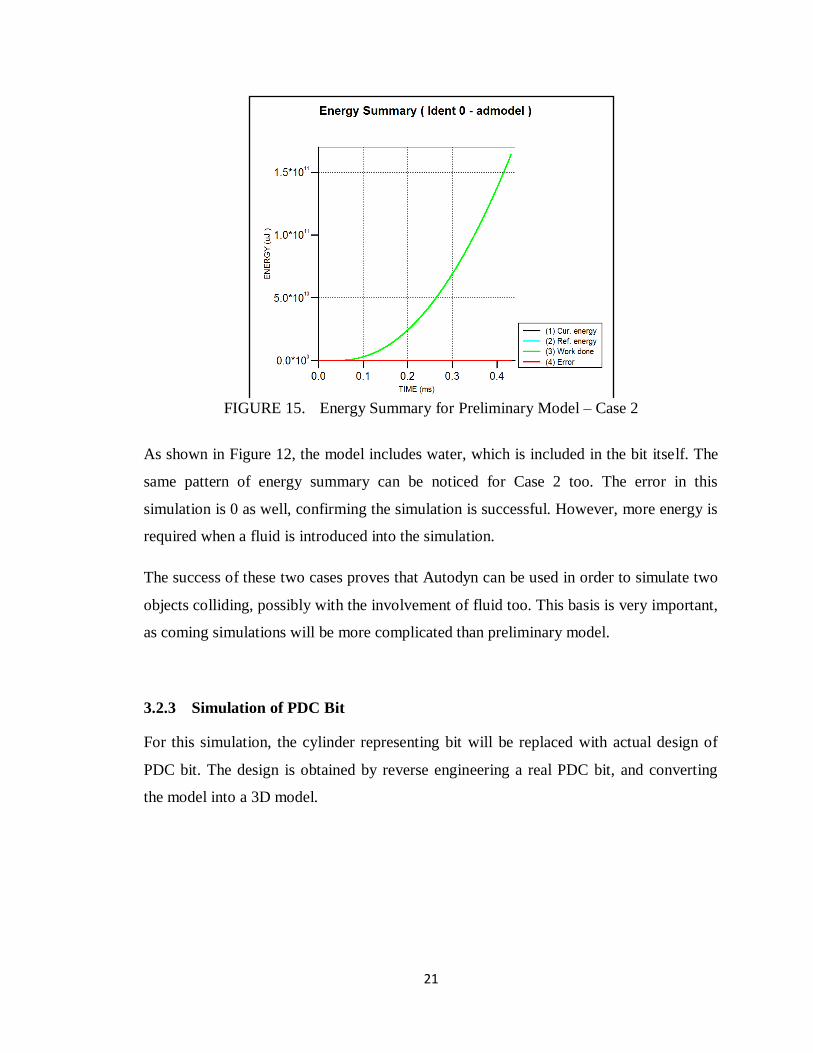
FIGURE 15. Energy Summary for Preliminary Model – Case 2
As shown in Figure 12, the model includes water, which is included in the bit itself. The
same pattern of energy summary can be noticed for Case 2 too. The error in this
simulation is 0 as well, confirming the simulation is successful. However, more energy is
required when a fluid is introduced into the simulation.
The success of these two cases proves that Autodyn can be used in order to simulate two
objects colliding, possibly with the involvement of fluid too. This basis is very important,
as coming simulations will be more complicated than preliminary model.
3.2.3 Simulation of PDC Bit
For this simulation, the cylinder representing bit will be replaced with actual design of
PDC bit. The design is obtained by reverse engineering a real PDC bit, and converting
the model into a 3D model.
22
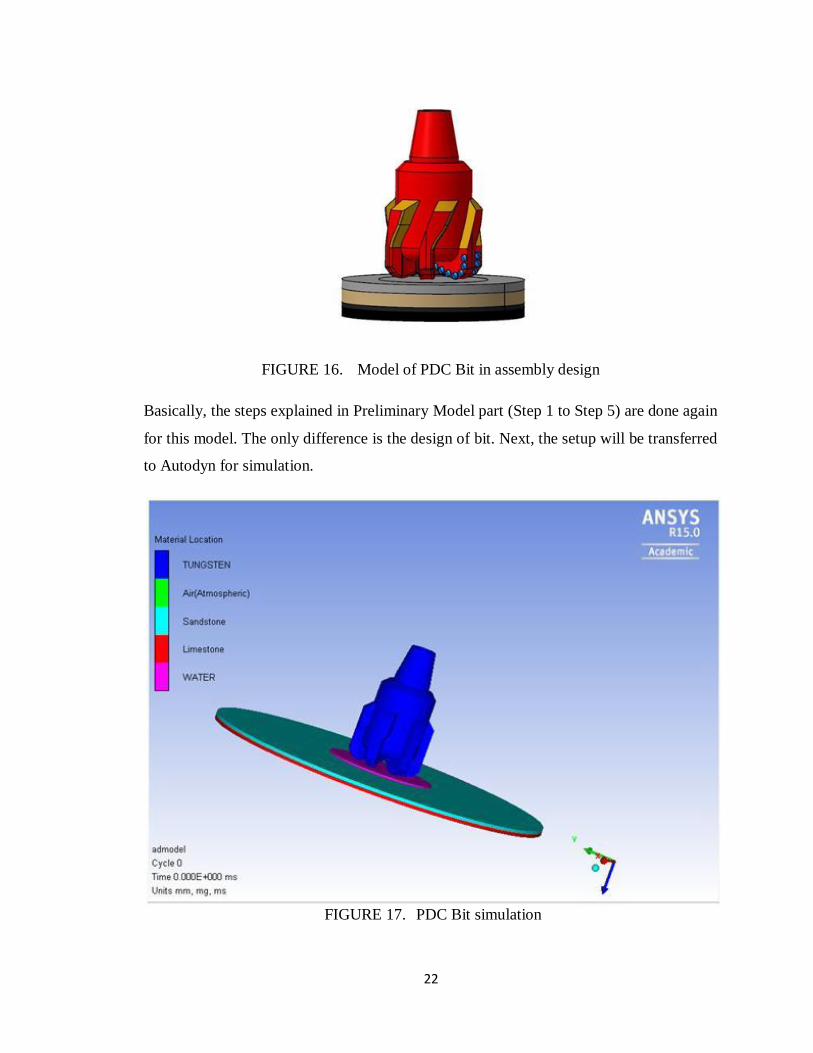
FIGURE 16. Model of PDC Bit in assembly design
Basically, the steps explained in Preliminary Model part (Step 1 to Step 5) are done again
for this model. The only difference is the design of bit. Next, the setup will be transferred
to Autodyn for simulation.
FIGURE 17. PDC Bit simulation
23
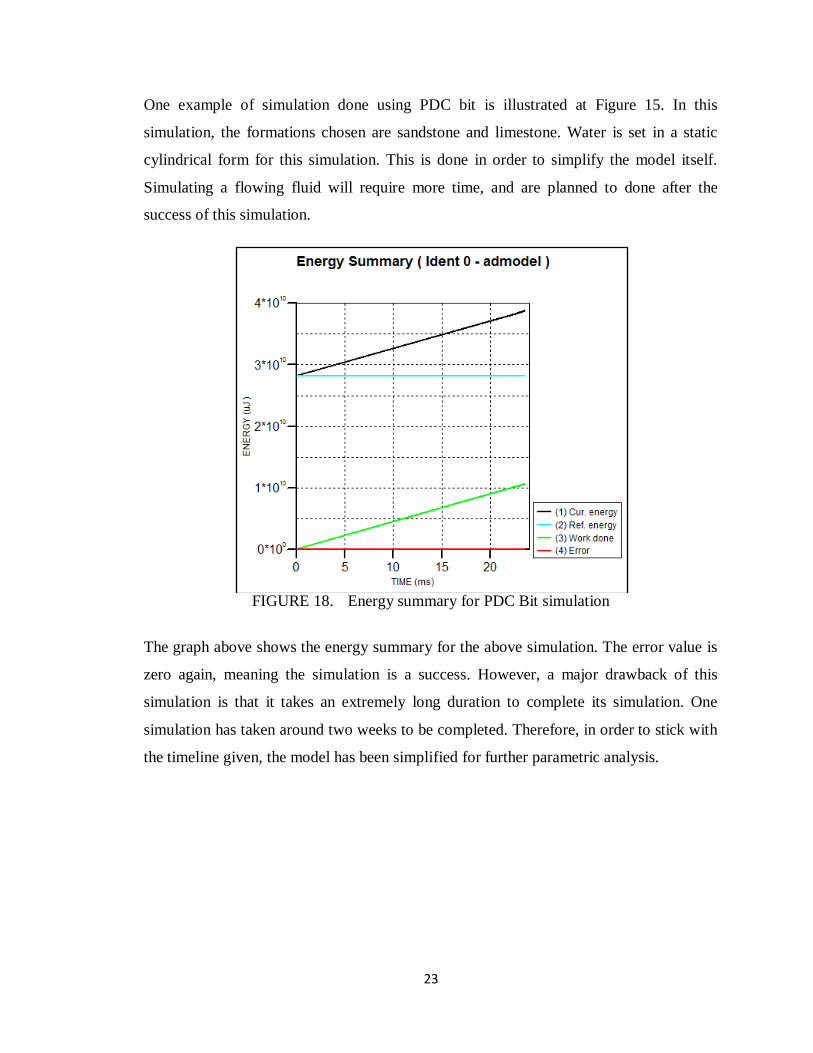
One example of simulation done using PDC bit is illustrated at Figure 15. In this
simulation, the formations chosen are sandstone and limestone. Water is set in a static
cylindrical form for this simulation. This is done in order to simplify the model itself.
Simulating a flowing fluid will require more time, and are planned to done after the
success of this simulation.
FIGURE 18. Energy summary for PDC Bit simulation
The graph above shows the energy summary for the above simulation. The error value is
zero again, meaning the simulation is a success. However, a major drawback of this
simulation is that it takes an extremely long duration to complete its simulation. One
simulation has taken around two weeks to be completed. Therefore, in order to stick with
the timeline given, the model has been simplified for further parametric analysis.
24
3.2.4 Simulation of Single Cutter
In this project, there are few criteria that have been chosen to investigate in order to
further analyze the performance of PDC bit in multi-layered formation. Mainly, since the
main objective of this project is to simulate the bit in multi-layered formation, all the
formation used for simulations here after will be multi-layered, meaning containing two
different types of formations. There are three sets of formations used in this simulation to
illustrate the real pattern of formation. All the formations are classified as such based on
its properties listed in Engineering Data section.
Set 1: Limestone (soft formation) + Sandstone (hard formation)
Set 2: Dolomite (hard formation) + Limestone (soft formation)
Set 3: Sandstone (hard formation) + Dolomite (hard formation)
The next parameter that will be varied is the rake angle of the cutter. Rake angle can be
defined as the amount that a cutter in a bit is tilted in the direction of bit rotation. This is
one of the factors in determining the aggressiveness as well as the depth of cut. However,
in this project, the effect of rake angle on different formations will be investigated
generally, without any concern of depth of cut.
Since the reverse engineering PDC bit takes a long time to simulate, the PDC bit
has been simplified to a simpler model to minimize the time usage for simulation. For
these following cases, a basic cylindrical model similar to preliminary model is assumed
as the bit, constructed with almost the same volume as PDC bit. However, one major
change here will be the addition of a single cutter at the bottom of cylinder. This cutter
will have either a rake angle of 0° or 10°.
Therefore, for each rake angle of cutter, there will be three sets of data,
comprising the simulation done in three different multi-layer formations. The results will
be discussed in the following chapter.
25
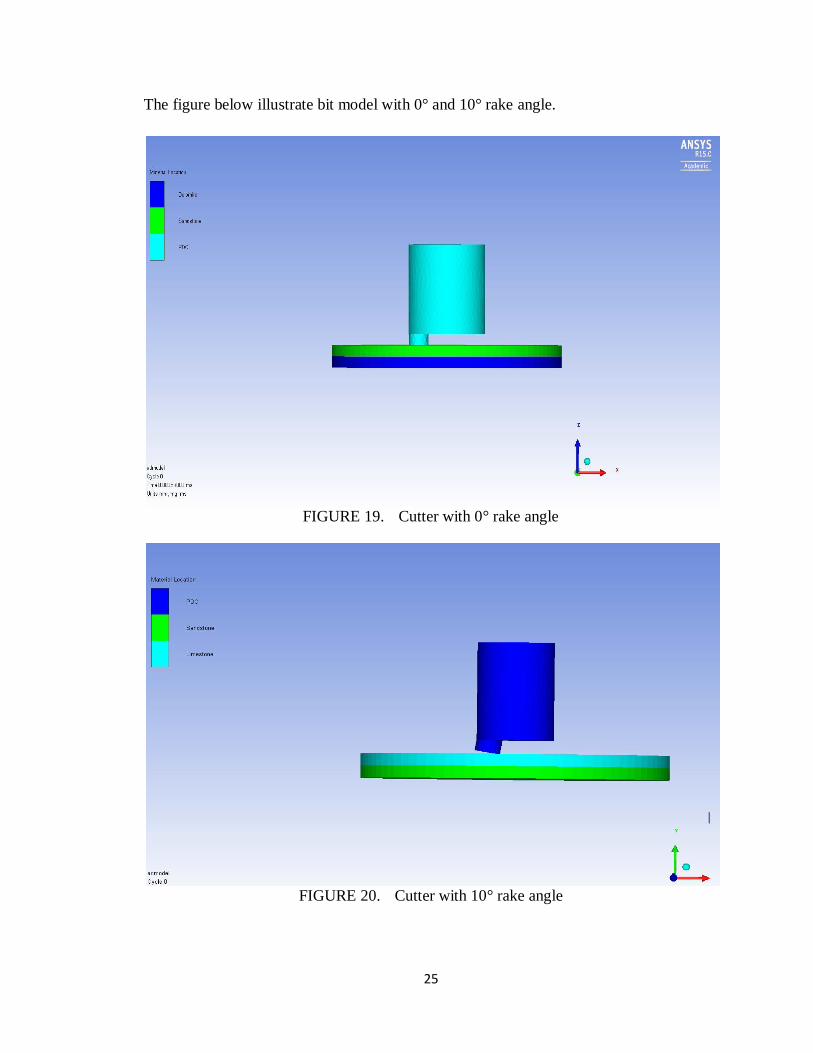
The figure below illustrate bit model with 0° and 10° rake angle.
FIGURE 19. Cutter with 0° rake angle
FIGURE 20. Cutter with 10° rake angle
26
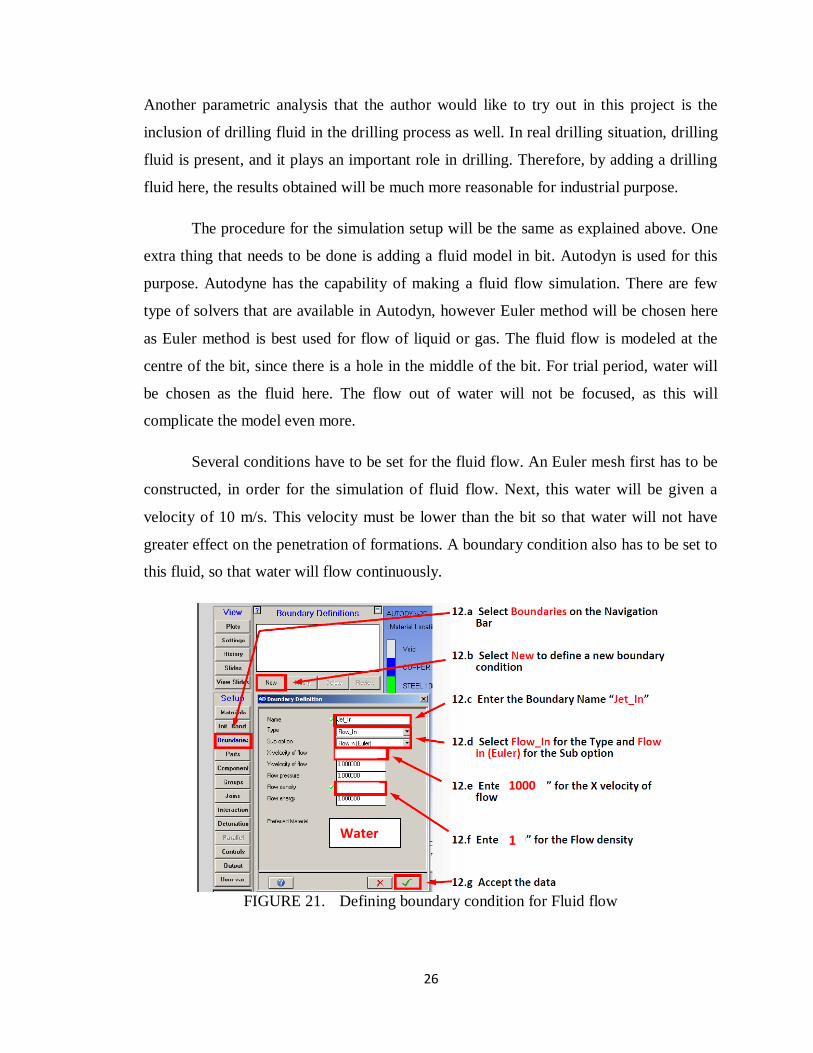
Another parametric analysis that the author would like to try out in this project is the
inclusion of drilling fluid in the drilling process as well. In real drilling situation, drilling
fluid is present, and it plays an important role in drilling. Therefore, by adding a drilling
fluid here, the results obtained will be much more reasonable for industrial purpose.
The procedure for the simulation setup will be the same as explained above. One
extra thing that needs to be done is adding a fluid model in bit. Autodyn is used for this
purpose. Autodyne has the capability of making a fluid flow simulation. There are few
type of solvers that are available in Autodyn, however Euler method will be chosen here
as Euler method is best used for flow of liquid or gas. The fluid flow is modeled at the
centre of the bit, since there is a hole in the middle of the bit. For trial period, water will
be chosen as the fluid here. The flow out of water will not be focused, as this will
complicate the model even more.
Several conditions have to be set for the fluid flow. An Euler mesh first has to be
constructed, in order for the simulation of fluid flow. Next, this water will be given a
velocity of 10 m/s. This velocity must be lower than the bit so that water will not have
greater effect on the penetration of formations. A boundary condition also has to be set to
this fluid, so that water will flow continuously.
FIGURE 21. Defining boundary condition for Fluid flow
1000
.0
1 Water
27
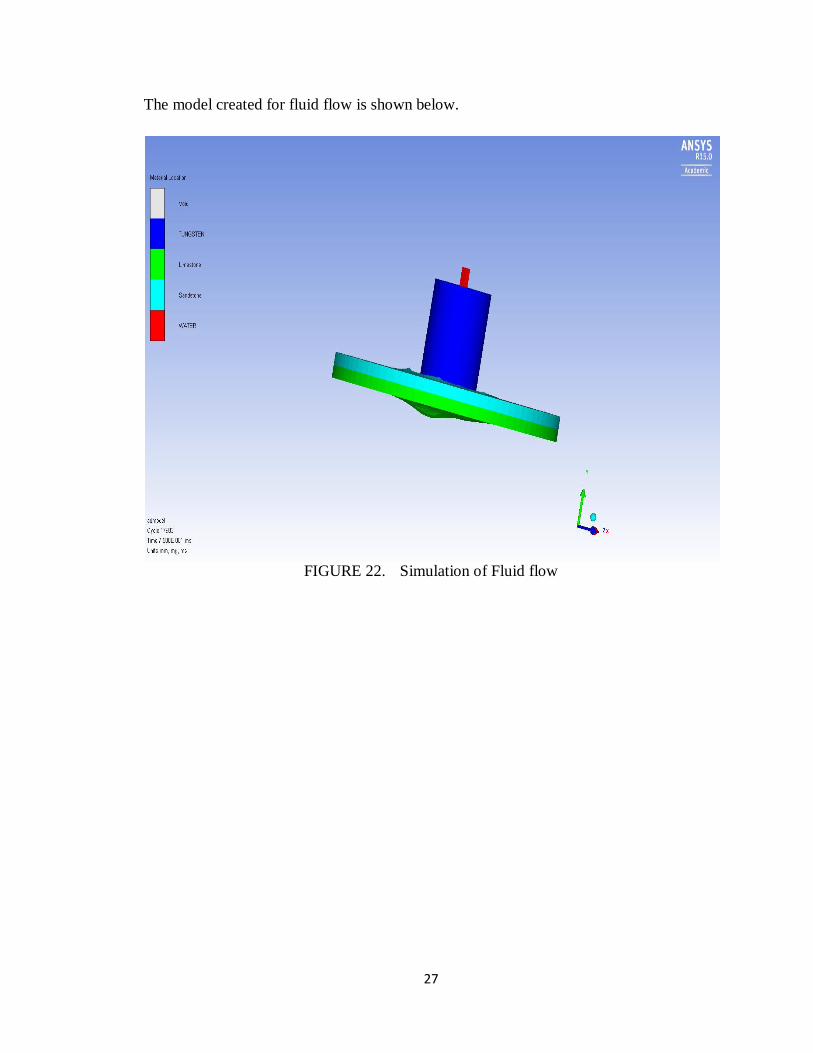
The model created for fluid flow is shown below.
FIGURE 22. Simulation of Fluid flow
28
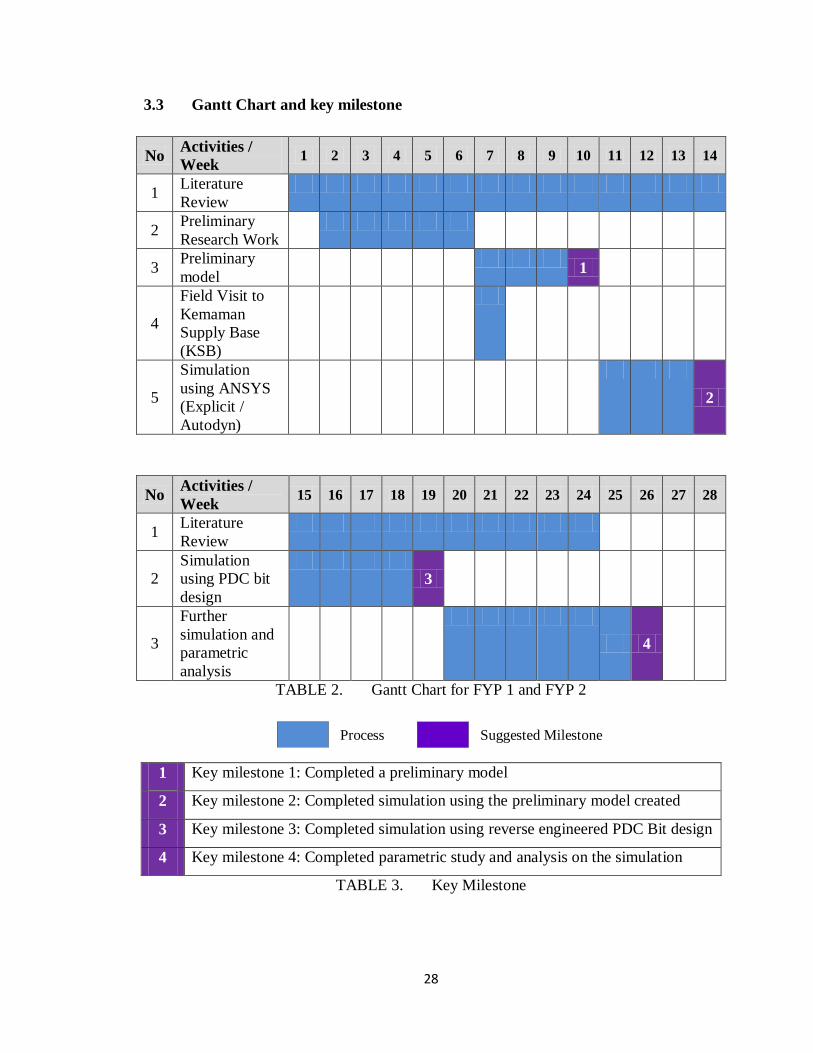
3.3 Gantt Chart and key milestone
No Activities /
Week 1 2 3 4 5 6 7 8 9 10 11 12 13 14
1 Literature
Review
2 Preliminary
Research Work
3 Preliminary
model
1
4
Field Visit to
Kemaman
Supply Base
(KSB)
5
Simulation
using ANSYS
(Explicit /
Autodyn)
2
No Activities /
Week 15 16 17 18 19 20 21 22 23 24 25 26 27 28
1 Literature
Review
2
Simulation
using PDC bit
design
3
3
Further
simulation and
parametric
analysis
4
TABLE 2. Gantt Chart for FYP 1 and FYP 2
1 Key milestone 1: Completed a preliminary model
2 Key milestone 2: Completed simulation using the preliminary model created
3 Key milestone 3: Completed simulation using reverse engineered PDC Bit design
4 Key milestone 4: Completed parametric study and analysis on the simulation
TABLE 3. Key Milestone
Process Suggested Milestone
29
3.4 Tools and Equipment
Tools and equipment used in this project are:
1) Computer-aided engineering simulation software, called ANSYS – Explicit
dynamics/Autodyn
2) CATIA (Computer Aided Three-dimensional Interactive Application
3.5 Summary
This chapter highlighted in detail the activities done in order to get the desired results.
Basically, three stages of simulations were done. First was with a preliminary model.
Later on, the reverse engineered PDC bit was used to run the simulation. A static model
of drilling fluid was included in that case. Due to complexity of the model, the simulation
takes too long to complete, thus new model with single cutter is chosen to simulate.
The following chapter discusses all the results obtained by changing the
parameters in the simulation with single cutter model.
30
CHAPTER 4
RESULTS AND DISCUSSION
Few sets of data were recorded from this simulation, such as directional velocity,
pressure, effective strain and absolute velocity. However, in this part, focus will be given
on directional velocity and pressure graphs.
4.1 Results for 0° Rake Angle
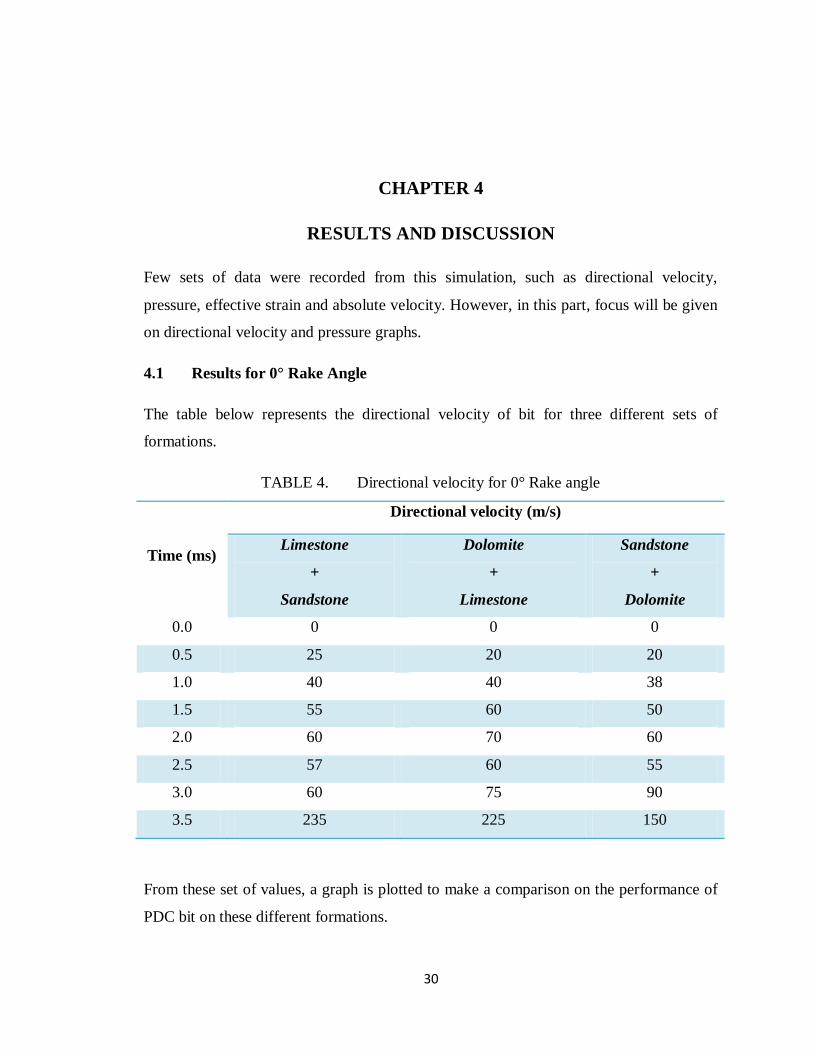
The table below represents the directional velocity of bit for three different sets of
formations.
TABLE 4. Directional velocity for 0° Rake angle
Time (ms)
Directional velocity (m/s)
Limestone
+
Sandstone
Dolomite
+
Limestone
Sandstone
+
Dolomite
0.0 0 0 0
0.5 25 20 20
1.0 40 40 38
1.5 55 60 50
2.0 60 70 60
2.5 57 60 55
3.0 60 75 90
3.5 235 225 150
From these set of values, a graph is plotted to make a comparison on the performance of
PDC bit on these different formations.
31
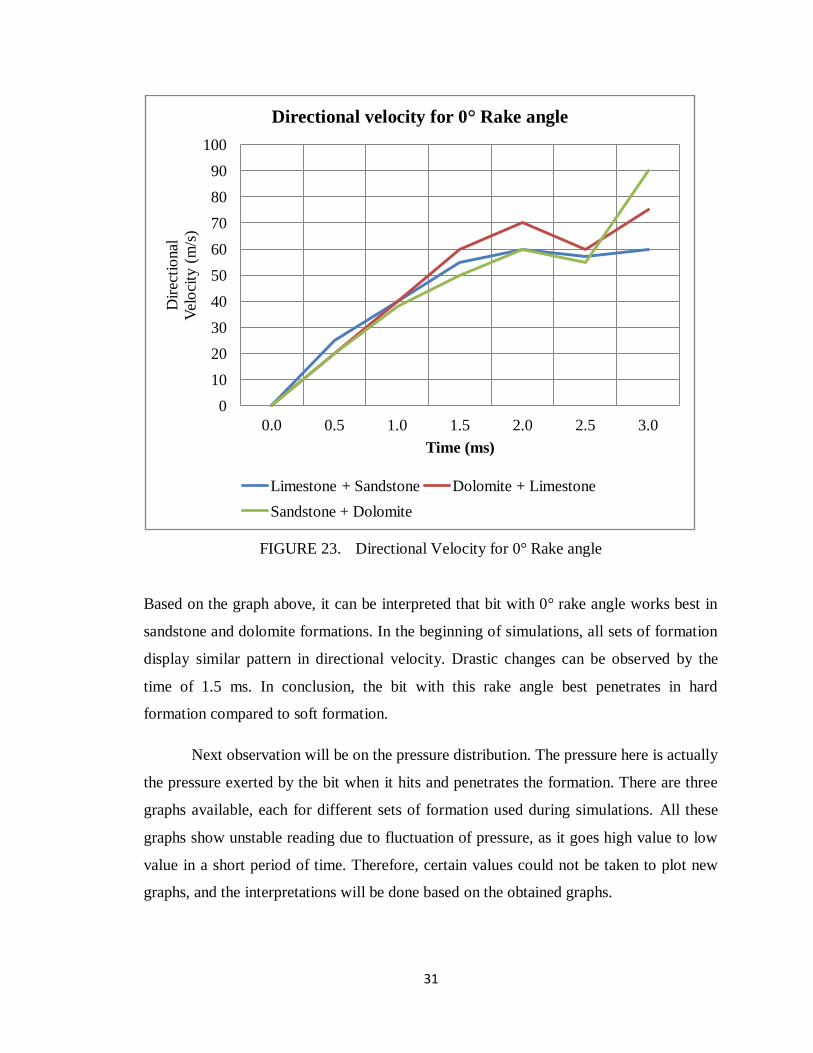
FIGURE 23. Directional Velocity for 0° Rake angle
Based on the graph above, it can be interpreted that bit with 0° rake angle works best in
sandstone and dolomite formations. In the beginning of simulations, all sets of formation
display similar pattern in directional velocity. Drastic changes can be observed by the
time of 1.5 ms. In conclusion, the bit with this rake angle best penetrates in hard
formation compared to soft formation.
Next observation will be on the pressure distribution. The pressure here is actually
the pressure exerted by the bit when it hits and penetrates the formation. There are three
graphs available, each for different sets of formation used during simulations. All these
graphs show unstable reading due to fluctuation of pressure, as it goes high value to low
value in a short period of time. Therefore, certain values could not be taken to plot new
graphs, and the interpretations will be done based on the obtained graphs.
0
10
20
30
40
50
60
70
80
90
100
0.0 0.5 1.0 1.5 2.0 2.5 3.0
Dir
ecti
onal
Vel
oci
ty (
m/s
)
Time (ms)
Directional velocity for 0° Rake angle
Limestone + Sandstone Dolomite + Limestone
Sandstone + Dolomite
32
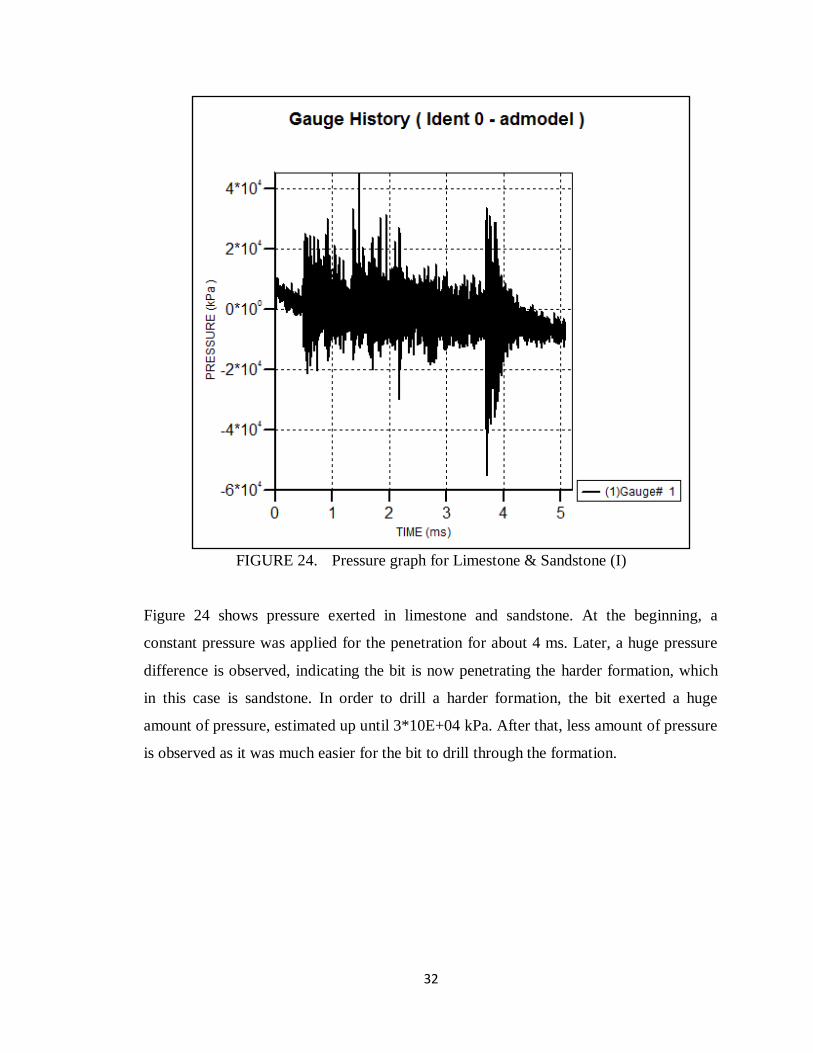
FIGURE 24. Pressure graph for Limestone & Sandstone (I)
Figure 24 shows pressure exerted in limestone and sandstone. At the beginning, a
constant pressure was applied for the penetration for about 4 ms. Later, a huge pressure
difference is observed, indicating the bit is now penetrating the harder formation, which
in this case is sandstone. In order to drill a harder formation, the bit exerted a huge
amount of pressure, estimated up until 3*10E+04 kPa. After that, less amount of pressure
is observed as it was much easier for the bit to drill through the formation.
33
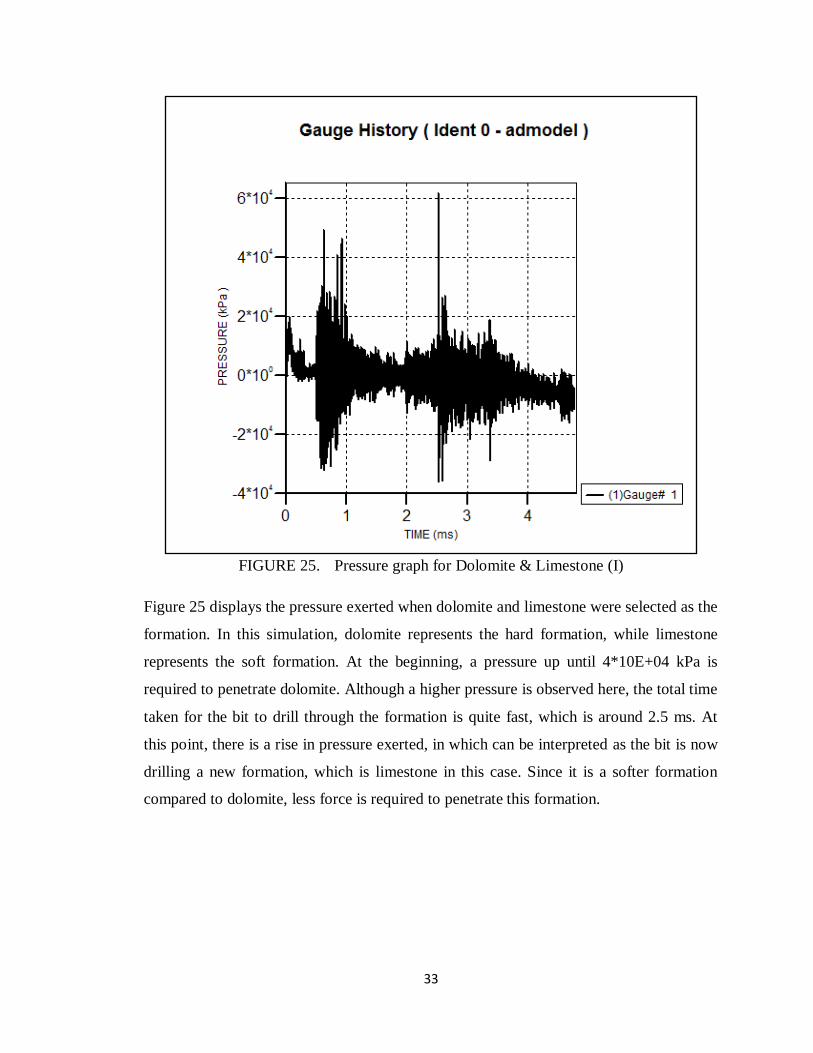
FIGURE 25. Pressure graph for Dolomite & Limestone (I)
Figure 25 displays the pressure exerted when dolomite and limestone were selected as the
formation. In this simulation, dolomite represents the hard formation, while limestone
represents the soft formation. At the beginning, a pressure up until 4*10E+04 kPa is
required to penetrate dolomite. Although a higher pressure is observed here, the total time
taken for the bit to drill through the formation is quite fast, which is around 2.5 ms. At
this point, there is a rise in pressure exerted, in which can be interpreted as the bit is now
drilling a new formation, which is limestone in this case. Since it is a softer formation
compared to dolomite, less force is required to penetrate this formation.
34
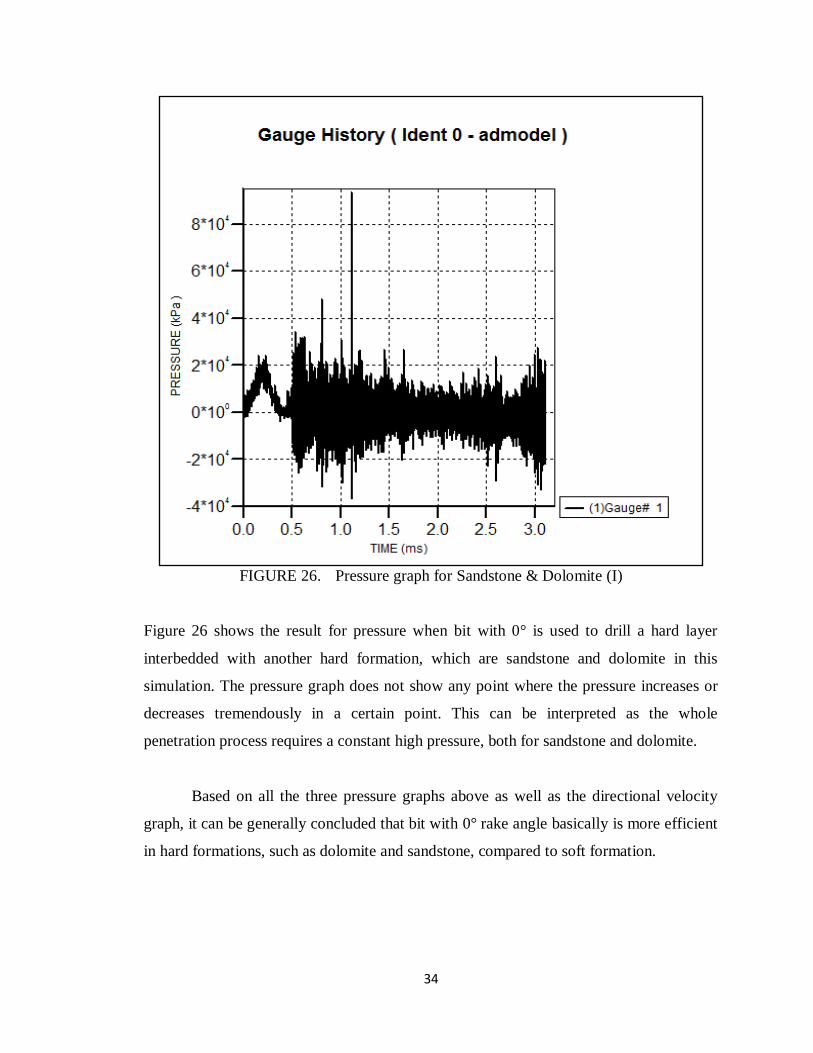
FIGURE 26. Pressure graph for Sandstone & Dolomite (I)
Figure 26 shows the result for pressure when bit with 0° is used to drill a hard layer
interbedded with another hard formation, which are sandstone and dolomite in this
simulation. The pressure graph does not show any point where the pressure increases or
decreases tremendously in a certain point. This can be interpreted as the whole
penetration process requires a constant high pressure, both for sandstone and dolomite.
Based on all the three pressure graphs above as well as the directional velocity
graph, it can be generally concluded that bit with 0° rake angle basically is more efficient
in hard formations, such as dolomite and sandstone, compared to soft formation.
35
4.2 Results for 10° Rake Angle
Another set of simulations are done, this time the parameter that was changed is rake
angle. For previous case, the rake angle was 0°, meanwhile for this set a rake angle of 10°
has been set for the bit. The directional velocity and pressure graph for this case will be
discussed here.
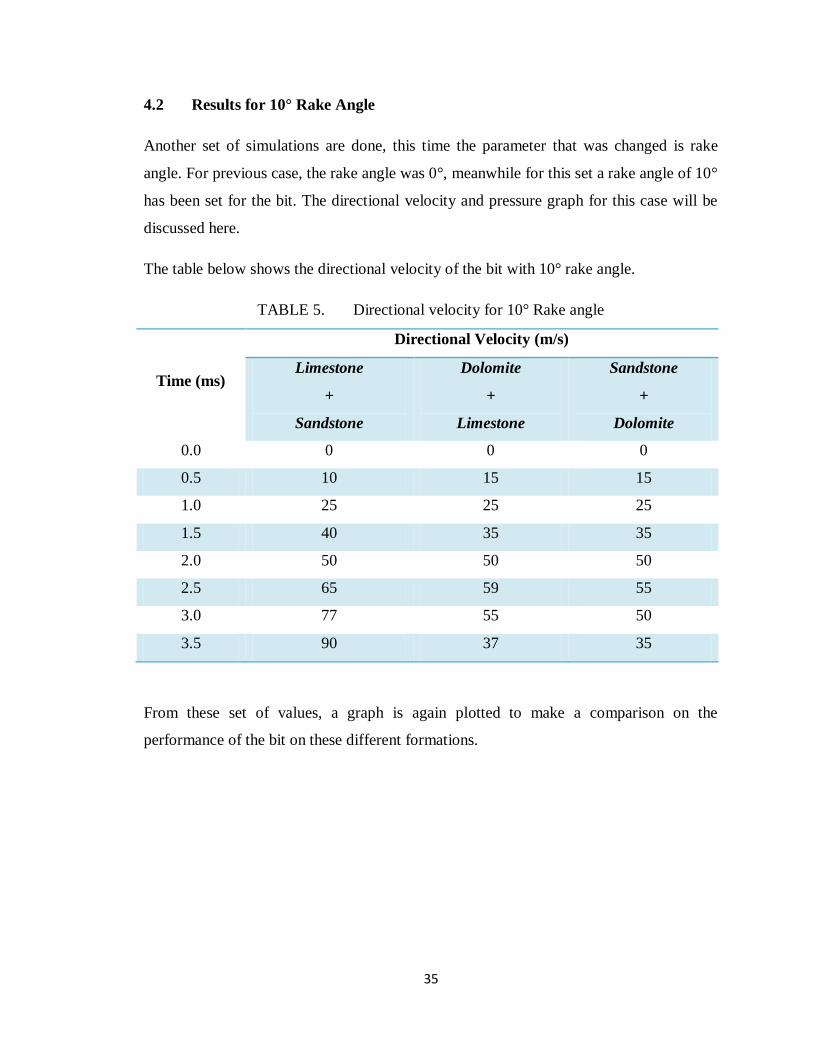
The table below shows the directional velocity of the bit with 10° rake angle.
TABLE 5. Directional velocity for 10° Rake angle
Time (ms)
Directional Velocity (m/s)
Limestone
+
Sandstone
Dolomite
+
Limestone
Sandstone
+
Dolomite
0.0 0 0 0
0.5 10 15 15
1.0 25 25 25
1.5 40 35 35
2.0 50 50 50
2.5 65 59 55
3.0 77 55 50
3.5 90 37 35
From these set of values, a graph is again plotted to make a comparison on the
performance of the bit on these different formations.
36
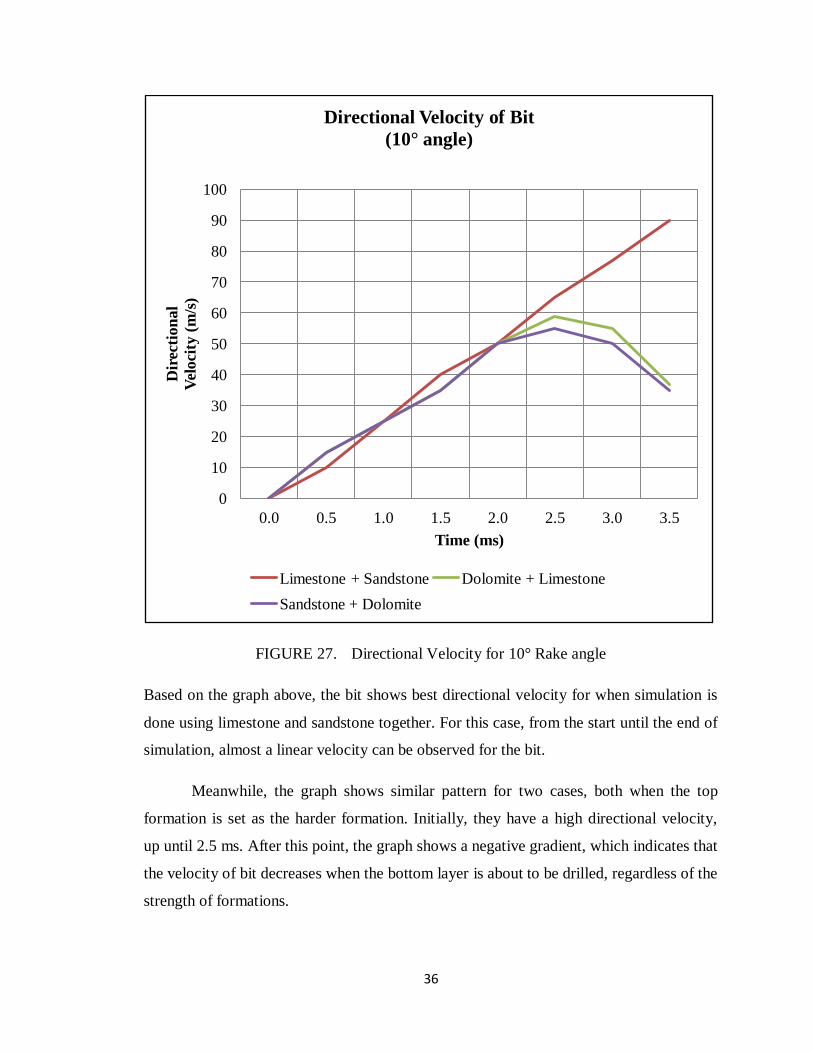
FIGURE 27. Directional Velocity for 10° Rake angle
Based on the graph above, the bit shows best directional velocity for when simulation is
done using limestone and sandstone together. For this case, from the start until the end of
simulation, almost a linear velocity can be observed for the bit.
Meanwhile, the graph shows similar pattern for two cases, both when the top
formation is set as the harder formation. Initially, they have a high directional velocity,
up until 2.5 ms. After this point, the graph shows a negative gradient, which indicates that
the velocity of bit decreases when the bottom layer is about to be drilled, regardless of the
strength of formations.
0
10
20
30
40
50
60
70
80
90
100
0.0 0.5 1.0 1.5 2.0 2.5 3.0 3.5
Dir
ecti
on
al
Vel
oci
ty (
m/s
)
Time (ms)
Directional Velocity of Bit
(10° angle)
Limestone + Sandstone Dolomite + Limestone
Sandstone + Dolomite
37
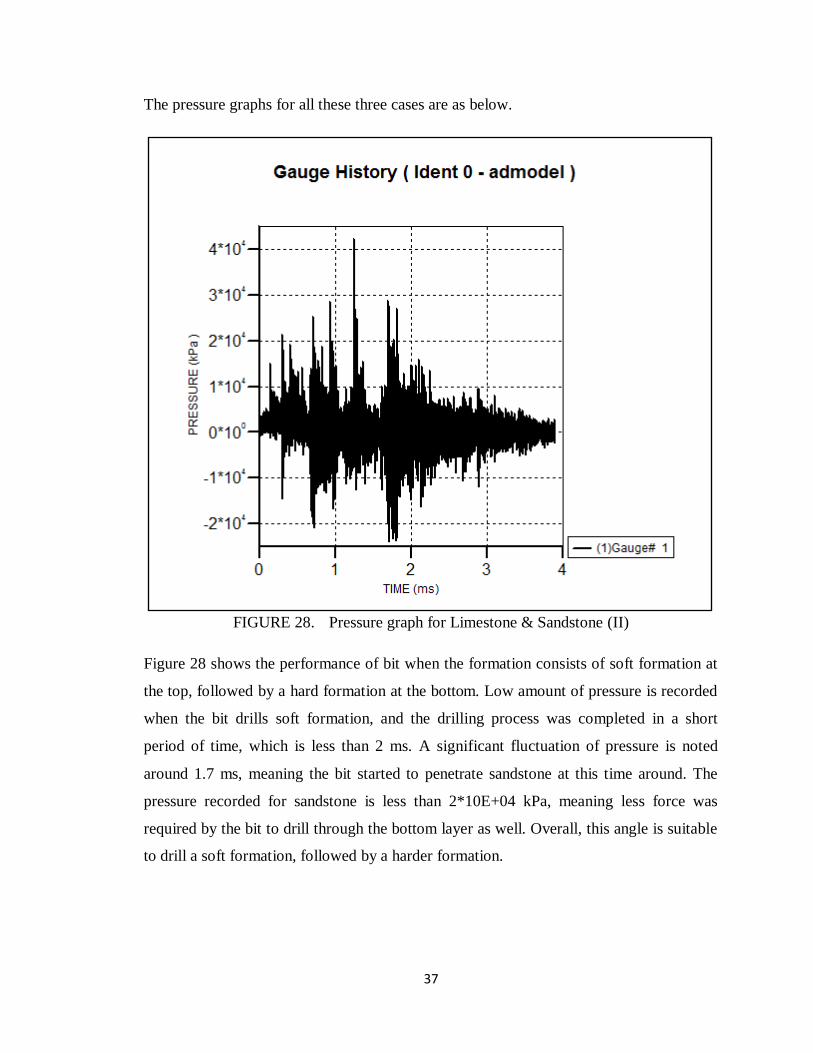
The pressure graphs for all these three cases are as below.
FIGURE 28. Pressure graph for Limestone & Sandstone (II)
Figure 28 shows the performance of bit when the formation consists of soft formation at
the top, followed by a hard formation at the bottom. Low amount of pressure is recorded
when the bit drills soft formation, and the drilling process was completed in a short
period of time, which is less than 2 ms. A significant fluctuation of pressure is noted
around 1.7 ms, meaning the bit started to penetrate sandstone at this time around. The
pressure recorded for sandstone is less than 2*10E+04 kPa, meaning less force was
required by the bit to drill through the bottom layer as well. Overall, this angle is suitable
to drill a soft formation, followed by a harder formation.
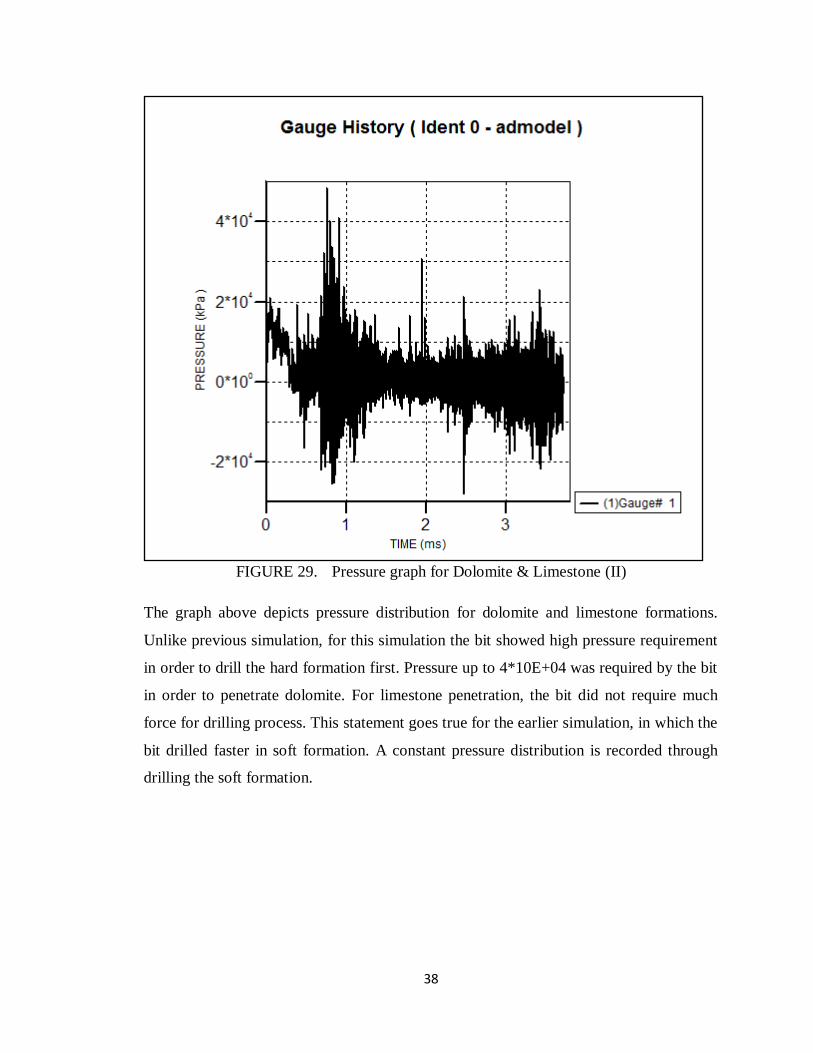
38
FIGURE 29. Pressure graph for Dolomite & Limestone (II)
The graph above depicts pressure distribution for dolomite and limestone formations.
Unlike previous simulation, for this simulation the bit showed high pressure requirement
in order to drill the hard formation first. Pressure up to 4*10E+04 was required by the bit
in order to penetrate dolomite. For limestone penetration, the bit did not require much
force for drilling process. This statement goes true for the earlier simulation, in which the
bit drilled faster in soft formation. A constant pressure distribution is recorded through
drilling the soft formation.
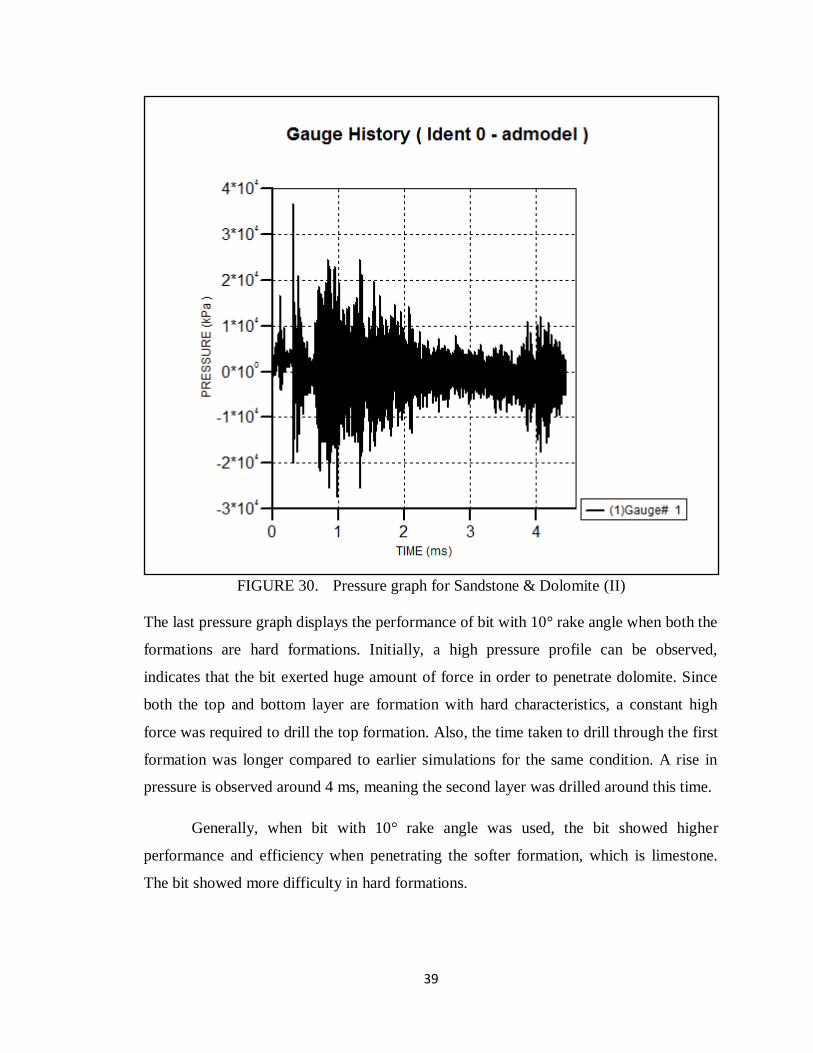
39
FIGURE 30. Pressure graph for Sandstone & Dolomite (II)
The last pressure graph displays the performance of bit with 10° rake angle when both the
formations are hard formations. Initially, a high pressure profile can be observed,
indicates that the bit exerted huge amount of force in order to penetrate dolomite. Since
both the top and bottom layer are formation with hard characteristics, a constant high
force was required to drill the top formation. Also, the time taken to drill through the first
formation was longer compared to earlier simulations for the same condition. A rise in
pressure is observed around 4 ms, meaning the second layer was drilled around this time.
Generally, when bit with 10° rake angle was used, the bit showed higher
performance and efficiency when penetrating the softer formation, which is limestone.
The bit showed more difficulty in hard formations.
40
CHAPTER 5
CONCLUSION AND RECOMMENDATION
5.1 Conclusion
This project has provided an insight on PDC bit performance in multi-layered formations.
Some of the conclusions that can be drawn are:
1. Autodyn can be used as a solver in order to conduct parametric analysis on PDC
bit on multi-layered formation.
2. Bit performance in drilling is highly influenced by the type of formation drilled.
Different formations have different mechanical strength, therefore the efficiency
of bit changes according to this. In this project, limestone is categorized as soft
formation, whereas sandstone and dolomite are categorized as hard formations.
3. Rake angle of cutter has specific effect on the drillabillity of PDC bit.
Cutter with 0° rake angle shows higher directional velocity in hard formations.
The best penetration was observed in sandstone and dolomite formations. This
cutter exerts a constant pressure at soft formation, thus it takes longer time to fully
drill a hard formation, and start drilling the bottom formation. Meanwhile, in hard
formation, the drilling time is very short.
Cutter with 10° rake angle showed the best velocity trend when limestone and
sandstone formations were used. A slightly high pressure is enough to penetrate
the soft formation in a very short period of time. On the other hand, constant high
pressure was needed to drill hard formations.
Thus, the objectives of this project have been achieved.

41
5.2 Recommendations
1. Use supercomputers in order to run simulation involving complex model. This is
so that the simulation time can be reduced greatly.
2. Model the geometry in Autodyn, rather than exporting from Explicit dynamics.
3. Include the complete flow of drilling fluid in the system.
42
References
Azar, J. J., & Samuel, G. R. (2007). Drilling engineering: PennWell Books.
Azar, M., Beaton, T., Ford, R., Kembaiyan, K., Mensa-Wilmot, G., Oldham, T., &
Rideout, W. (2002). Introduction to PDC Bits. Houston Smith International, Inc.
Beaton, T., Krooshoop, M., & Herman, J. (2008). Multi-Row Steel PDC Drill Bit
Technology Redefines Performance Standards in Hard, Interbedded and
Abrasive Applications. 2008 SPE Annual Technical Conference and Exhibition.
Denver, Colorado, USA: Society of Petroleum Engineers.
Beck, F.E., Powelland, J.W., (1995). The Effect of Rheology on Rate of Penetration. This
paper was prepared for presentation at the 1SS5 SPE/lADC Drilling Conference
held In Amsterdam, 2S February-2 March 1S95.
Bowers, M., Heavysege, G., Hamzah, S., & Passey, Q. (2004). Formation Evaluation
School (Basic). Kuala Lumpur, Malaysia.
Che, D., Han, P., Guo, P., & Ehmann, K. (2012). Issues in Polycrystalline Diamond
Compact Cutter-Rock Interaction From a Metal Machining Point of View-Part I:
Temperature, Stresses, and Forces. Journal of Manufacturing Science and
Engineering, Vol. 134.
Clayton, R., Chen, S., & Lefort, G. (2005). New Bit Design Cutter Technology Extend
PDC Applications to Hard Rock Drilling. Paper presented at the SPE/IADC
Drilling Conference.
Gouda, G. M., Maestrami, M., Abu Saif, M. A., El-Moghrebi, S. S., Dahab, A. S. A. H.,
& Farehat, M. S. (2011). A Mathematical Model To Compute The Pdc Cutter
Wear Value To Terminate PDC Bit Run. Paper presented at the SPE Middle East
Oil and Gas Show and Conference.
43
Hemphill, T., & Clark, R.K. (1994, September). Effects of PDC-Bit Selection and Mud
Chemistry on Drilling Rates in Shale. SPE Drilling & Completion.
K., K. (2013, October). Hybrid Drill Bit For Horizontal Drilling In Highly Interbedded
Formations Of Timano-Pechora Arctic Fields. SPE Arctic and Extreme
Environments Conference & Exhibition. Moscow, Russia: Society of Petroleum
Engineers.
Paiaman, A.M., Ghassem Al-Askari, M.K., Salmani, B., Al-Anazi, B.D., & Masihi, M.
(2009) Effect of Drilling Fluid Properties on Rate of Penetration.
Szabo, B. (1991). Finite Element Analysis. Canada: John Wiley and Sons Inc.
Taylor, S., Besson, A., Minto, D., & Mampuk, I. (1998). Unique PDC Bit Technologies
Combine to Consistently Reduce Drilling Time in Interbedded Formations. 1998
IADC/SPE Asia Pasific Drilling Conference. Jakarta, Indonesia: IADC/SPE
Asia Pasific Drilling Technology.
Yahiaoui, M, Gerbaud, L., Paris, J., Delbe, K., Denape, J., Dourfaye, A. (2011, June).
Analytical and Experimental Study on PDC Drill Bits Quality. 3rd Europeen
Conference on Tribology (pp. 475). Vienne, Austria.
Zhu, H.-Y., Deng, J.-G., Xie, Y.-H., Huang, K.-W., Zhao, J.-Y., & Yu, B.-H. (2012).
Rock mechanics characteristic of complex formation and faster drilling
techniques in Western South China Sea oilfields. Ocean Engineering, 44, 33-45.