Embed Size (px)
Citation preview

NOAA Technical Memorandum NWS WR-98
STUDY ON A SIGNIFICANT PRECIPITATION EPISODE IN THE WESTERN UNITED STATES
Ira S. Brenner Salt Lake City, Utah
April 1975
noaa NATIONAL OCEANIC AND I ATMOSPHERIC ADMINISTRATION
National Weather Service
NOAA TECHNICAL MEMORANDA National Weather Service, Western Region Subseries
The National Weather Servic~ <NWS) Western Region (WR) Subseries provides an informal medium for the documentation and quick dissemination of results not appropriate, or not yet ready, for formal publication. The series is used to report on work in progress, to describe technical procedures and practices, or to relate progress to a limited audience. These Technical Memoranda wi I I report on investigations devoted primarily to regional and local prob-1 ems of Interest me In I y to personne I '. and hence w I II not be wIde I y distrIbuted.
Papers I to 23 are in the former series, ESSA Technical Memoranda, Western Region Technical Memoranda <WRTM); papers 24 to §9 are in the former series, ESSA Technical Memoranda, Weather Bureau Technical Memoranda (WBTM). Beginning with qO, the papers are part of the series, NOAA Technical Memoranda NWS.
Papers I to 23, except for 5 (revised edition) and 10, are available from the·Natlonal Weather Service Western Region, Scientific Services Division, P. o. Box I I 188, Federal Sui !ding, 125 South State Street, Salt Lake City, Utah 84111. Papers 5 (revised edition), 10, and all others beginning with 24 are available from the National Technical Information Service, U. S, Department of Commerce, Sills Building, 5285 Port Royal Road, Springfield, Virginia 22151. Prices vary for all. paper copy; $2,25 microfiche, Order by accession number shown in parentheses at end of each entry.
WRTM I WRTM 2 WRTM 3
WRTM 4 WRTM 5
WRTM 6 WRTM 7 WRTM 8 WRTM 9 WRTM 10 WRTM II WRTM 12
\~RTM 13
WRTM 14
WRTM 15
WRTM 16 WRTM 17
WRTM 18 WRTM 19
WRTM 20
WRTM 21
WRTM 22 WRTM 23
WBTM 24
WBTM 25
WBTM 26 WBTM 27 WBTM 28 WBTM 29 WBTM 30
WBTM 31
WBTM 32
WBTM 33 WBTM 34 WBTM 35
WBTM 36
WBTM 37 WBTM 38
WBTM 39 WBTM 40 WBTM 41 WBTM 42
WBTM 43. WBTM 44
WBTM 45/1
ESSA Technical Memoranda
Some Notes on Probabll ity Forecasting. Edwa.rd D, Diemer, September 1965, <Out of print.) Cl imatologlcal Precipitation Probabi titles, Compiled by Lucianna Miller, December 1965. Western Region Pre- and Post-FP-3 Program, December I, 1965, to February 20, 1966. Edward D. Diemer, March 1966. Use of Meteorological Sate! lite Data. March 1966, Station Descriptions of Local Effects on Synoptic Weather Patterns, Philip Wi I I lams, Jr., Apri I 1966 (revised November ·1967, October 1969). (PB-17800) Improvement of Forecast Wording and Format, C. L, Glenn, May 1966. Final Report on Precipitation Probabi I ity Test Programs, Edward D. Diemer, May 1966. Interpreting the RAREP. Herbert P. Benner, May 1966 (revised January 1967). (Out of print.) A Collection of Papers Related to the 1966 NMC Primitive-Equation Model, June 1966. (Out of print.) Sonic Boom. Loren Crow (6th Weather Wing, USAF, Pamphlet), June 1966. <Out of print.) (AD-479366) Some Electrical Processes in the Atmosphere. J, Latham·, June 1966. A Comparison of Fog Incidence at Missoula, Montana, with Surrounding Locations. Richard A. Dightman, August 1966. (Out of print. l A Col lectlon of Technical Attachments on the 1966 NMC Primitive-Equation Model. Leonard W. Snel !man, August 1966. (Out of print.) Appl !cation of Net Radiometer Measurements to Short-Range Fog and Stratus Forecasting at Los Angeles. Frederick Thomas, September 1966. The Use of the Mean as an Estimate of "Normal" Precipitation in an Arid Region. Paul C. Kangieser, November 1966. (Out of print.) Some Notes on Acclimatization in Man. Edited by Leonard W. Snel !man, November 1966. A Digitalized Summary of Radar Echoes Within 100 Miles of Sacramento, Cali'fornia. J. A. Youngberg and L. B. Overaas, December 1966. Limitations of Selected Meteorological Data. December 1966. A Grid Method for Estimating Precipitation Amounts by Using the WSR-57 Radar. R. Granger, December 1966. <Out of print.) Transmitting Radar Echo Locations to Local Fire Control Agencies for Lightning Fire Detection. Robert R. Peterson, March 1967. (Out of print.) An Objective Aid for Forecasting the End of East Winds in the Columbia Gorge, July through October. D. John Coparanis, Apri I 1967. Derivation of Radar Horizons In Mountainous Terrain. Roger G. Pappas, Apri I 1967. "K" Chart Applications to Thunderstorm For·ecasts Over the Western United States, Richard E. Hambidge, May 1967.
ESSA Technical Memoranda, Weather Bureau Technical Memoranda (WBTM)
Historical and Climatological Study of Grinnel I Glacier, Montana. Richard A. Dightman, July 1967. (Out of pr i'nt.) (PB-178071) Verification of Operational Probabi I ity of Precipitation Forecasts, Apri I 1966-March 1967. W. W. Dickey, October 1967. (PB-176240) A Study of Winds in the Lake Mead Recreation Area. R. P. Augul is, January 1968. · <PB-177830) Objective Minimum Temperature Forecasting for Helena, Montana, D. E. Olsen, February 1968. (PB-177827) Weather Extremes. R. J. Schmid! i, Apri I 1968 (revised July 1968), <PB-178928) Smal !-Scale Analysis and Prediction. Philip Wi I Iiams, Jr., May 1968. <PB-178425) Numerical Weather Prediction and Synoptic Meteorology. Capt. Thomas D. Murphy, U.S.A.F., May 1968. (AD-673365) Precipitation Detection Probabi I ities by Salt Lake ARTC Radars. Robert K, Belesky, July 1968. (PB-179084) Probability Forecasting--A Problem Analysis with Reference to the Portland Fire Weather District. Harold S. Ayer, July 1968. (PB-179289) Objective Forecasting. Phi lip Wi II lams, Jr., August 1968. (Out of print.) (AD-680425) The WSR-57 Radar Program at Missoula, Montana. R. Granger, October 1968. (Out of print.) <PB-180292) Joint ESSA/FAA ARTC Radar Weather Survei !lance Program. Herbert P. Benner and DeVon B. Smith, December 1968 (revised June 1970). (AD-681857) Temperature Trends in Sacramento--Another Heat Island. Anthony D. Lentini, February 1969. (Out of print.) <PB-183055) Disposal of Logging Residues Without Damage to Air Quality. Owen P. Cramer, March 1969. <PB-183057) Climate of Phoenix, Ariozna. R. J. Schmidll, P. C. Kangieser, and R. S. Ingram, April 1969. (Out of print. l (PB-184295) Upper-Air Lows Over Northwestern United States. A. L. Jacobson, April 1969. (PB-184296) The Man-Machine Mix In Applied Weather Forecastlnq In the 1970s. L. W, Snellman, Auqust 1969. <PB-185068) High Resolution Radiosonde Observations. W. S. Johnson, August 1969. <PB-185673) Analysis of the Southern Cal ifornla Santa Ana of January 15-17, 1966. Barry B. Aronovitch, August 1969. (PB-185670) . Forecasting Maximum Temperatures at Helena, Montana. David E. Olsen, October 1969. (PB-185762) Estimated Return Periods for Short-Duration Precipitation in Arizona. Paul C. Kangieser, October 1969. (PB-187763) Precipitation Probabilities in the Western Region Associated with Winter 500-mb Map Types. Richard A. Augul is, December 1969. <PB-188248)
U. S. DEPAfHMENT OF COMMERCE NATIONAL OCEANIC AND ATMOSPHERIC ADMINISTRATION
NATIONAL WEATHER SERVICE ,
NOAA Technical Memorandum NWSTM WR-98
STUDY ON A SIGNIFICANT PRECIPITATION EPISODE IN THE WESTERN UNITED STATES
WESTERN REGION
Ira S. Brenner Scientific Services Division
Salt Lake City, Utah
TECHNICAL MEMORANDUM NO. 98
SALT LAKE CITY, UTAH APRIL 1975

TABLE OF CONTENTS
Page
Abstract
'· Upper Tropospheric Trough 1-2
II. Construction of Analyses 2-3
II I . Synoptic Review 3-4
IV. Conclusions 5
v. Acknowledgments 5
VI • References 5-6
i i

LIST OF FIGURES AND TABLE
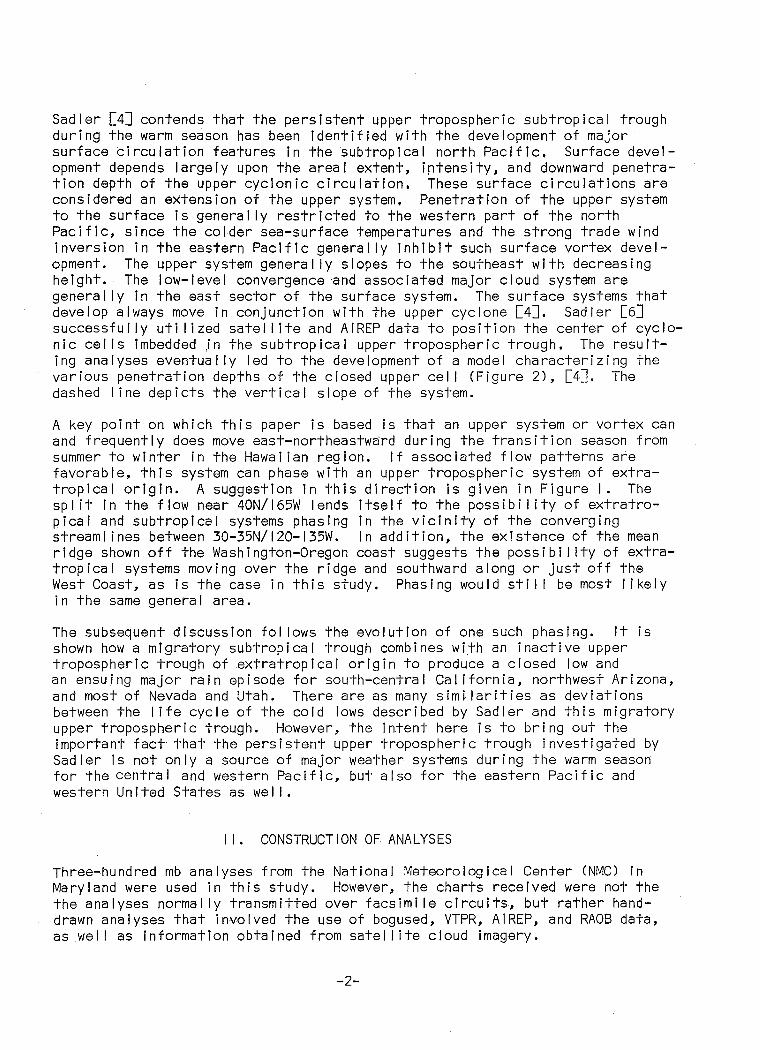
Figure I. Mean September 300-mb Winds Over the Cnetral and Eastern Pacific with Position of Subtropical Upper Tropospheric Trough (------), Subtropical Ridge (···), and Subequatorial Ridge(----), 7
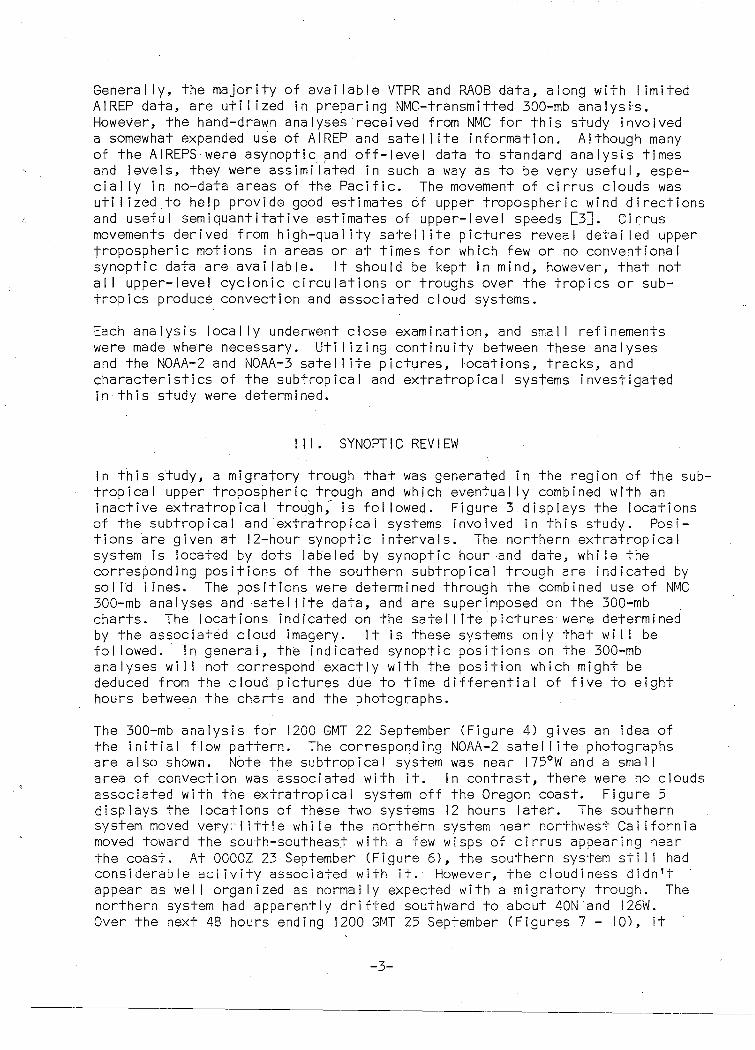
Figure 2. Schematic Three-Dimensional Model of Various Penetration Depths of 200-mb Cyclone: (a) 700-mb with Easterly Wave at Surface, (b) Completely to Surface, (c) Typical Satellite-Observed Cloud Distribution Associated with (b). 8
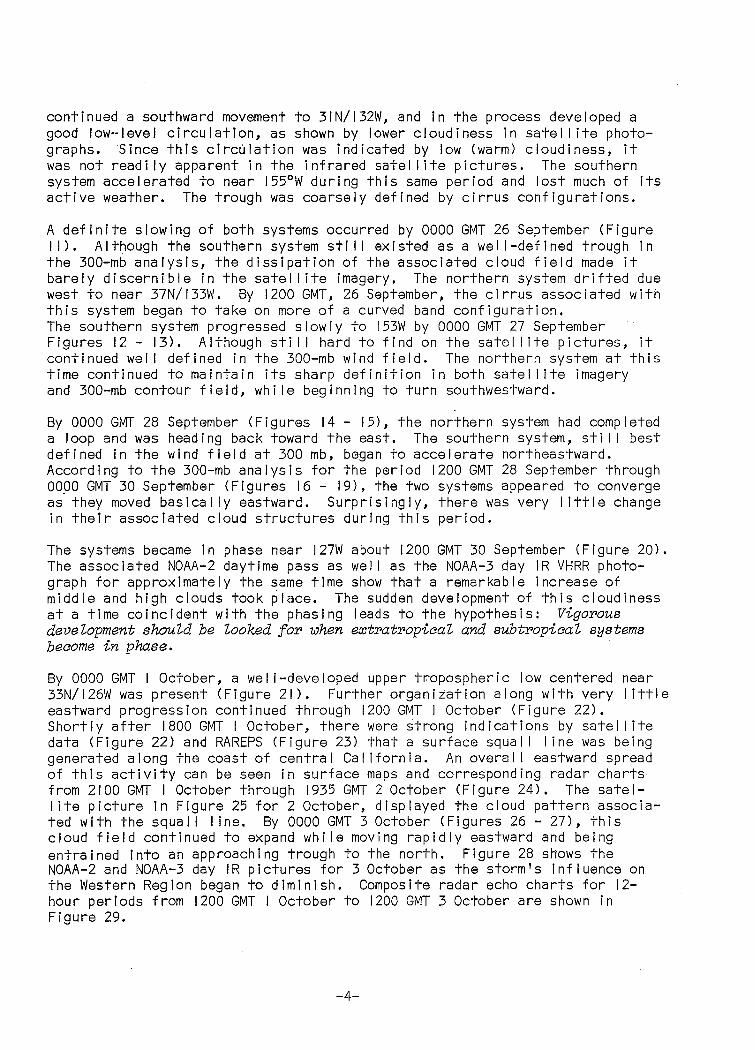
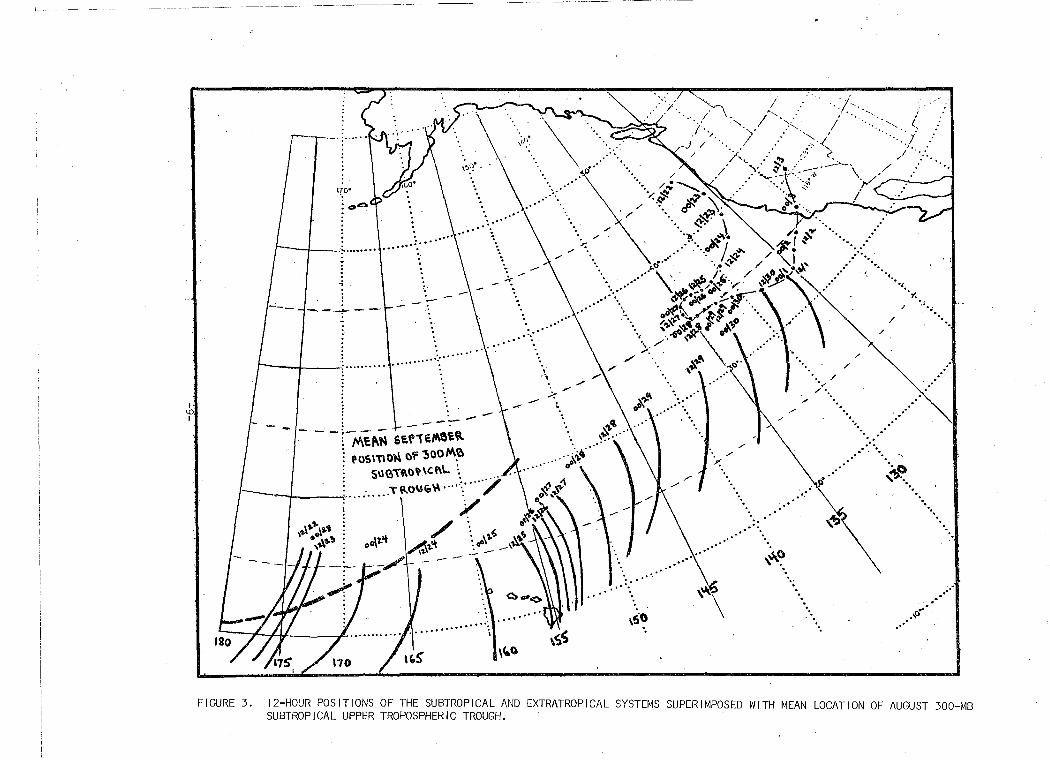
Figure 3. Twelve-Hour Positions of the Subtropical and Extratropical Systems Superimposed with Mean Location of August 300-m~ Subtropical Upper Troposphere Trough. 9
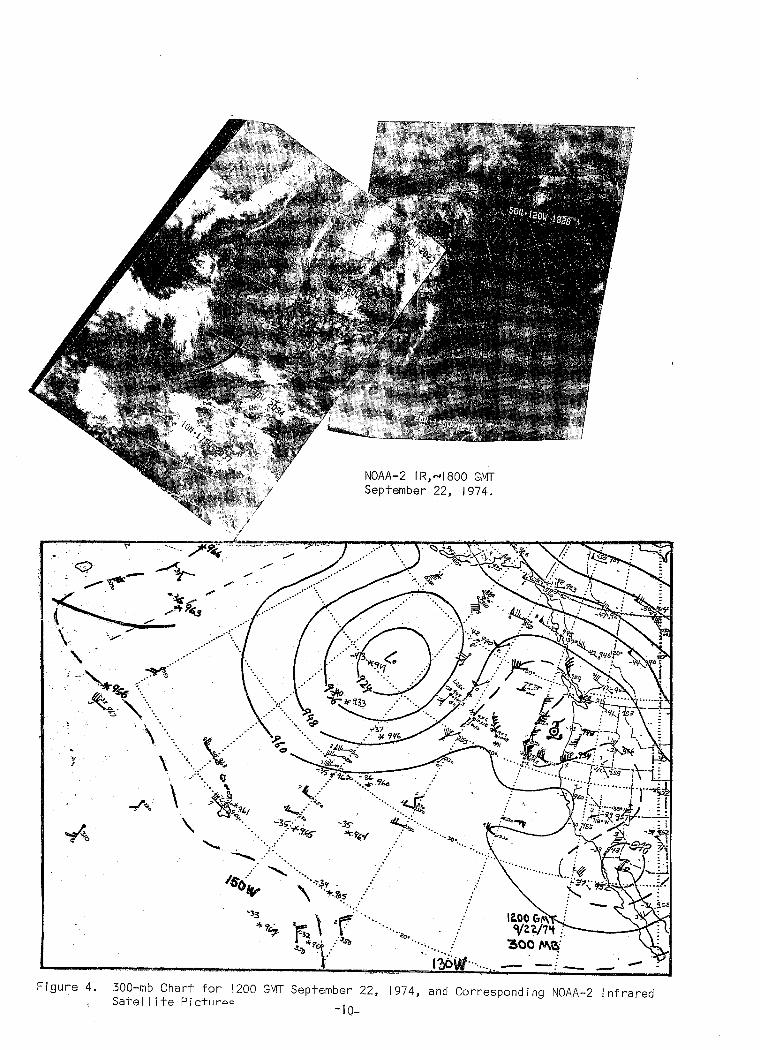
Figure 4. 300-mb Chart for 1200 GMT September 22, 1974, and Corresponding NOAA-2 Infrared Satel I ite Pict~res. 10
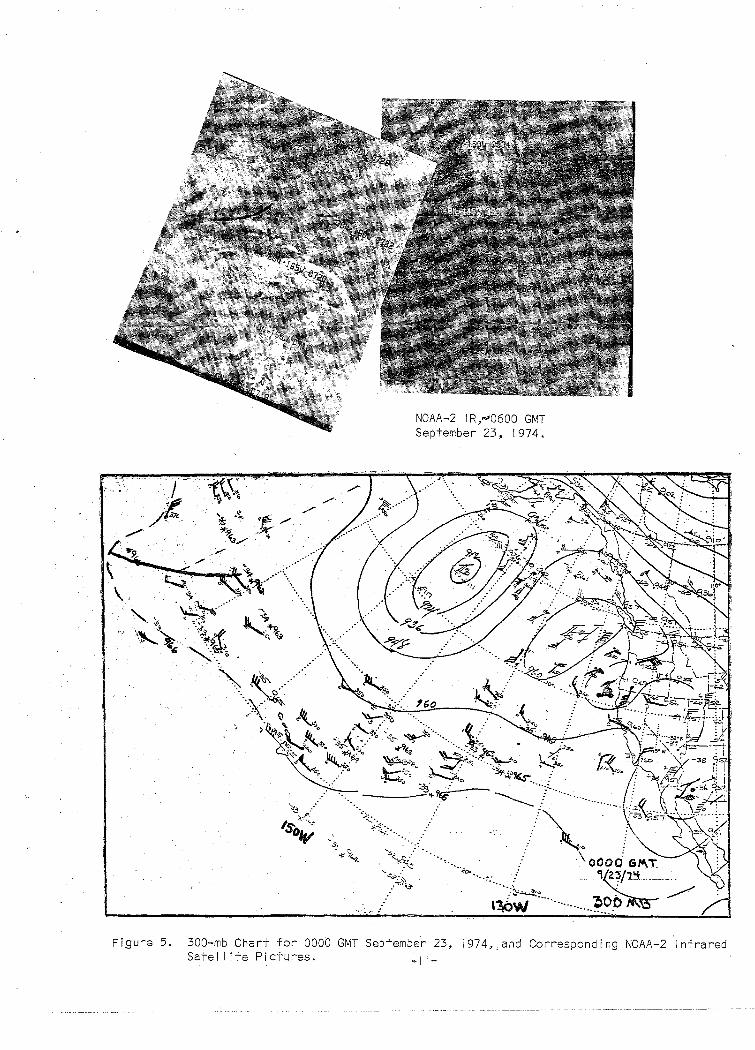
Figure 5. 300-mb Chart for 0000 GMT September 23, 1974, and Corresponding NOAA-2 Infrared Satel I ite Pictures. I I
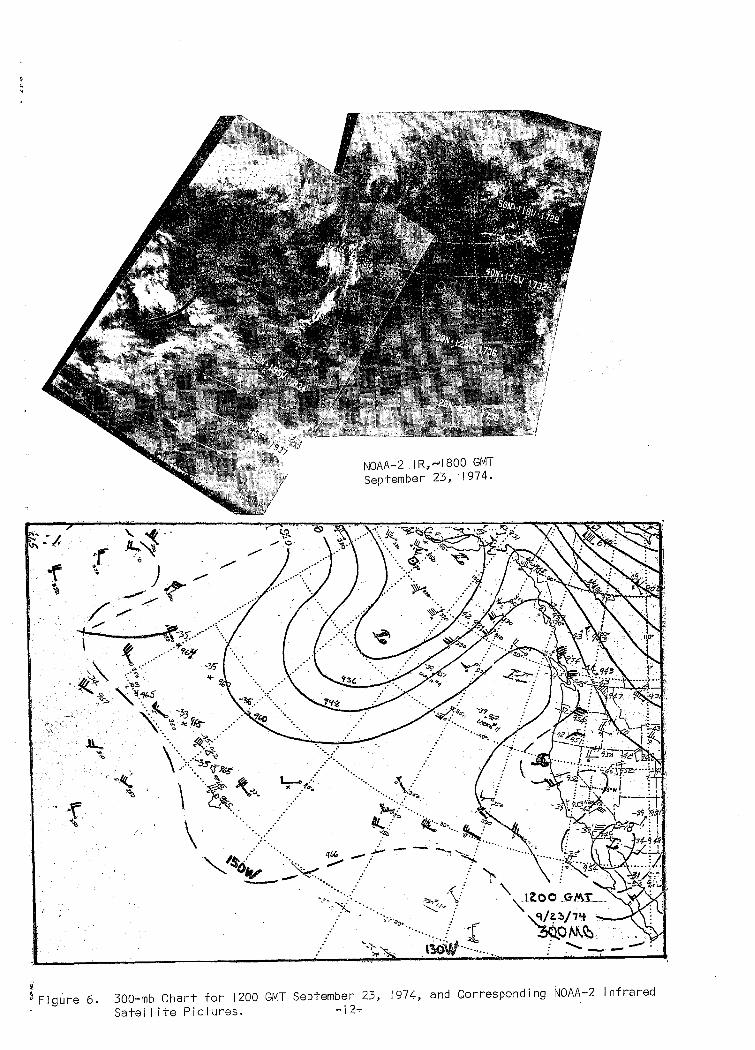
Figure 6. 300-mb Chart for 1200 GMT September 23, 1974, and Corresponding NOAA-2 Infrared Satel I ite PictDres. 12
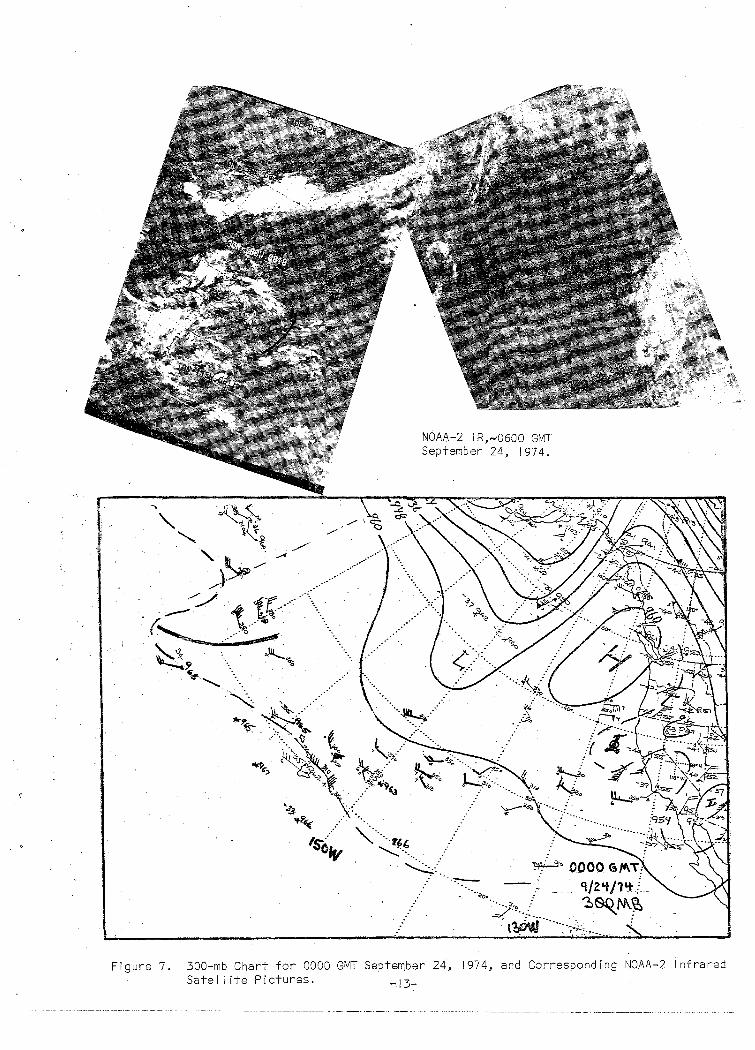
Figure 7. 300-mb Chart for 0000 GMT September 24, 1974, and Corresponding NOAA-2 Infrared Satellite Pictures. 13
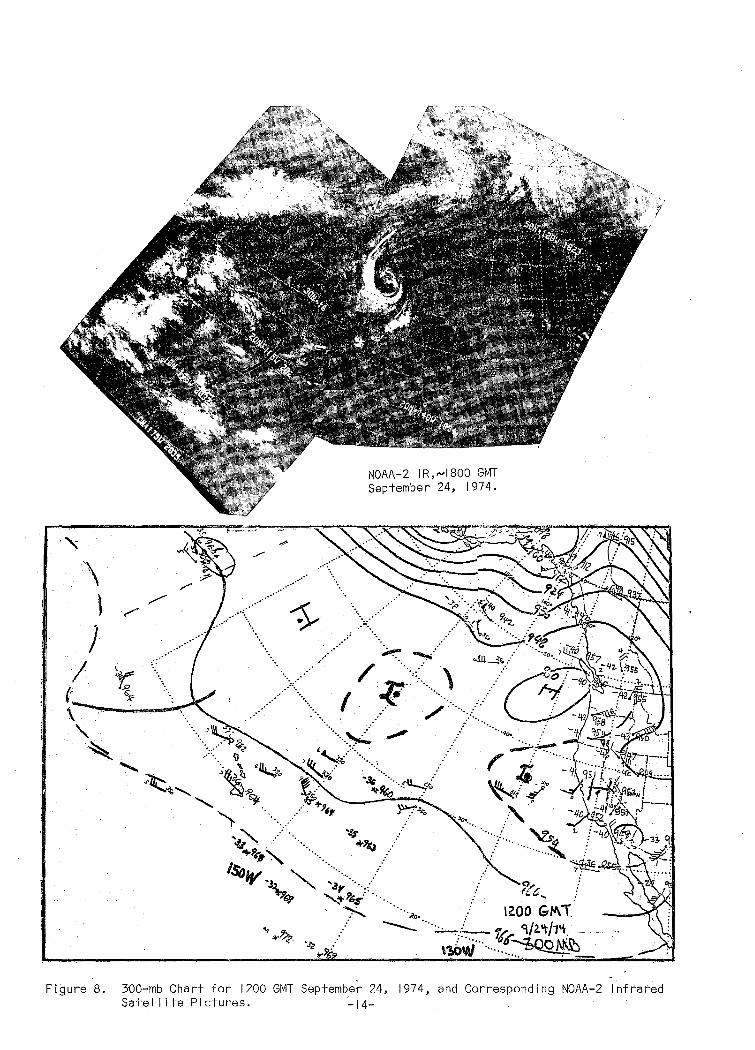
Figure 8. 300-mb Chart for 1200 GMT September 24, 1974, and Corresponding NOAA-2 Infrared Satel I ite Pictures. 14
Figure 9. 300-mb Chart for 0000 GMT September 25, 1974, and Corresponding NOAA-2 Infrared Satel I ite Pictures. 15
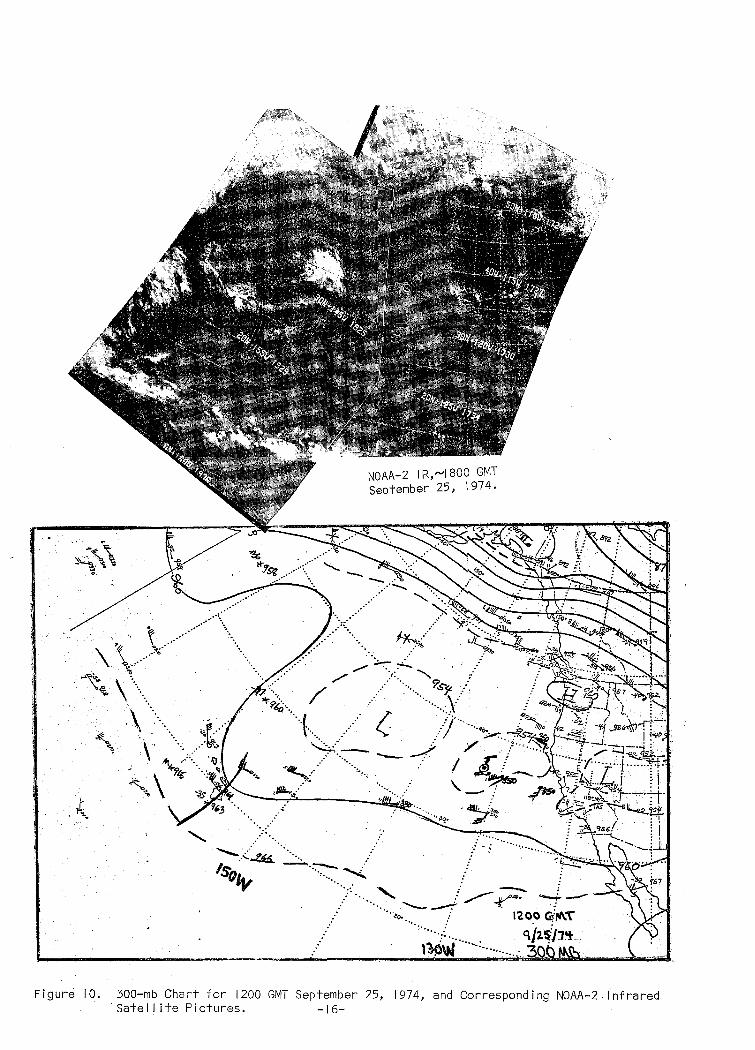
Figure 10. 300-mb Chart for 1200 GMT September 25, 1974, and Corresponding NOAA-2 Infrared Satellite Pictures. 16
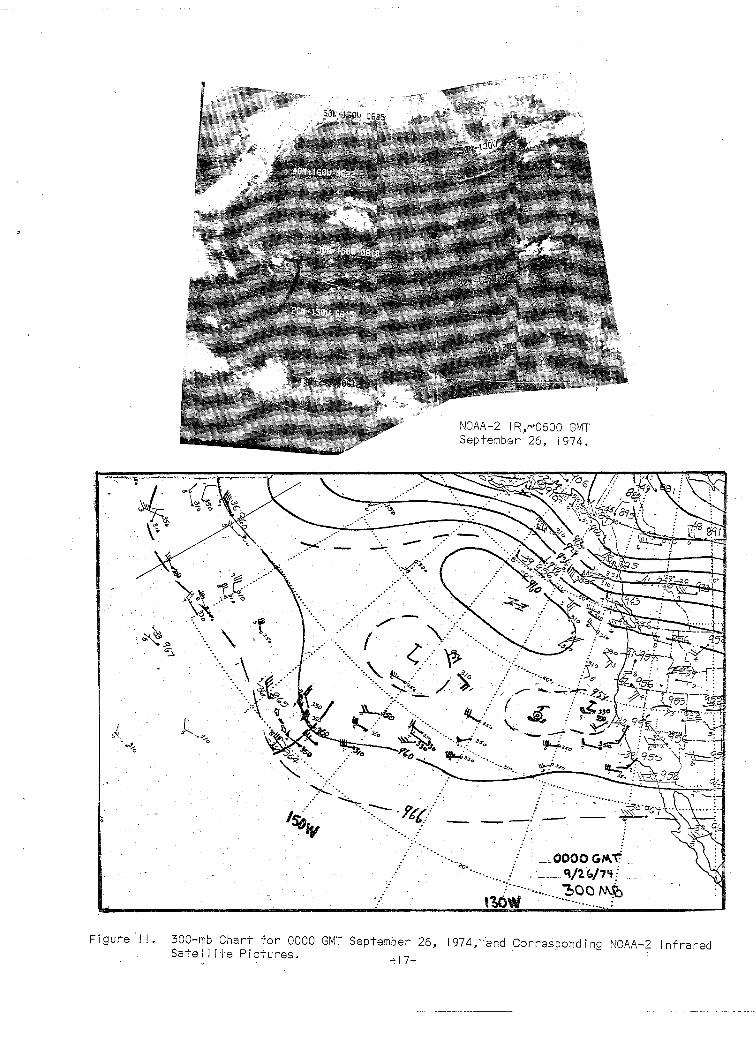
Figure I I. 300-mb Chart for 0000 GMT September 26, 1974, and Corresponding NOAA-2 Infrared Sate! I ite Pictures. 17
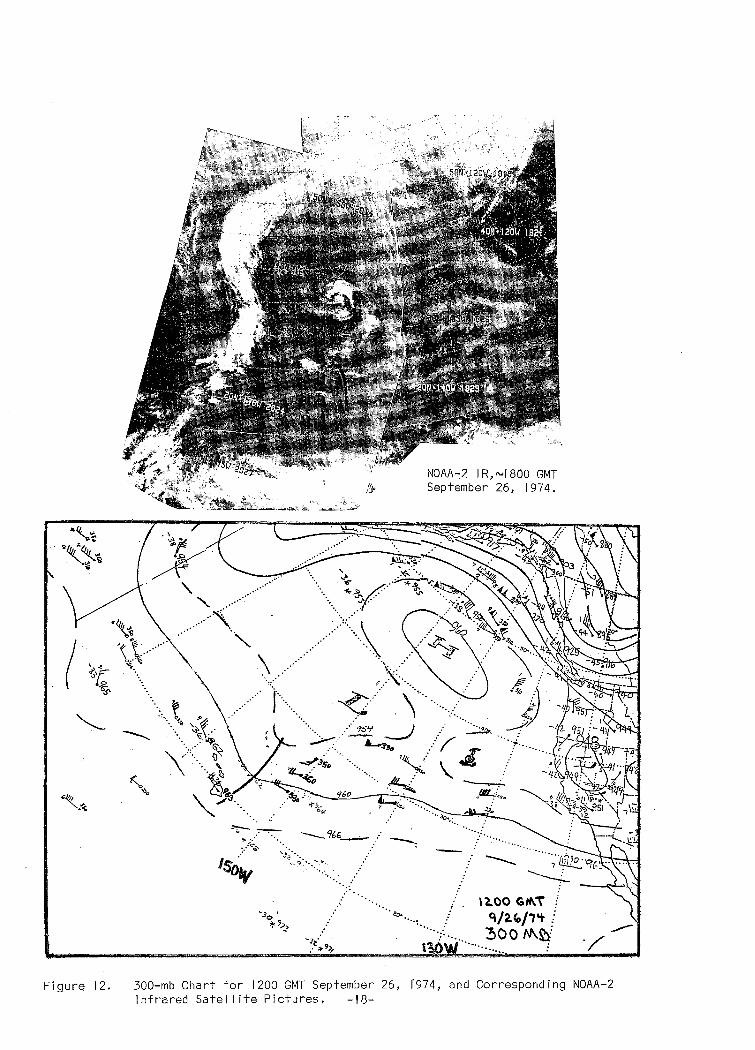
Figure 12. 300-mb Chart for 1200 GMT September 26, 1974, and Corresponding NOAA-2 Infrared Sate! I ite Pictures. 18
Figure 13. 300-mb Chart for 0000 GMT September 27, 1974, and Corresponding NOAA-2 Infrared Sate! I ite Pictures. 19
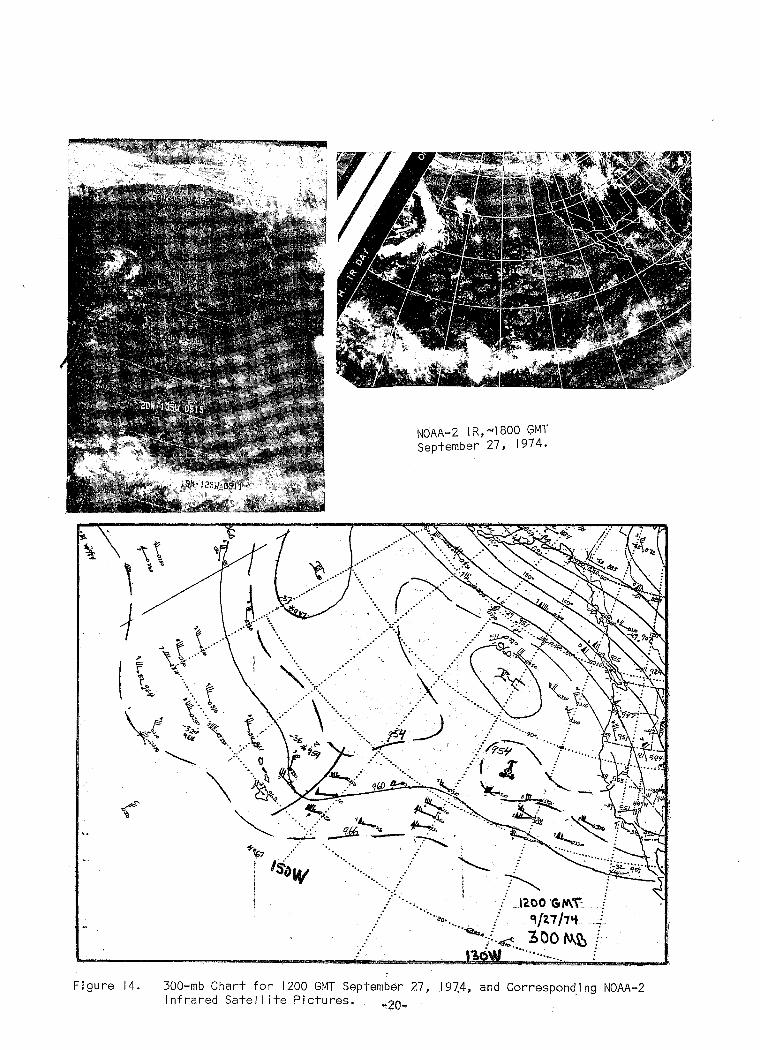
Figure 14. 300-mb Chart for 1200 GMT September 27, 1974, and Corresponding NOAA-2 Infrared-Sate! I ite Pictures. 20
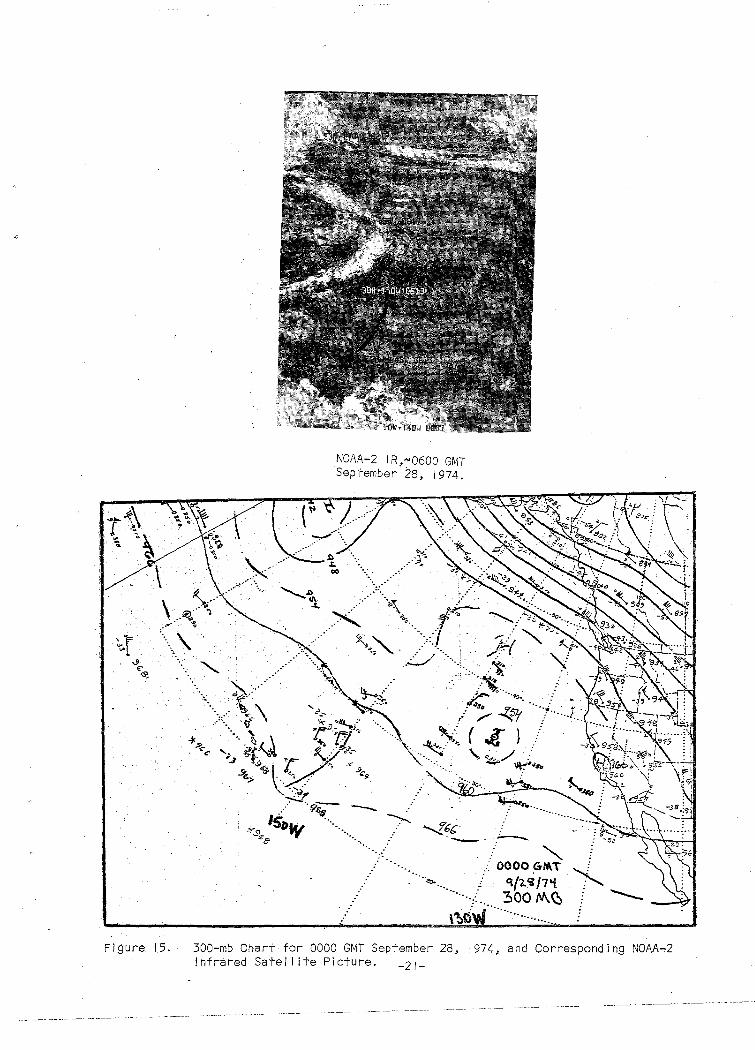
Figure 15. 300-mb Chart for 0000 GMT September 28, 1974, and Corresponding NOAA-2 Infrared Satel I ite Picture. 21
iii

LIST OF FIGURES AND TABLE (Continued)
Figure 16.
Figure 17.
Figure 18.
Figure 19.
Figure 20.
Figure 21.
Figure 22.
Figure 23.
Figure 24.
Figure 25.
Figure 26.
Figure 27.
Figure 28.
Figure 29.
Table 1.
300-mb Chart for 1200 GMT September 28, 1974, and Corresponding NOAA-2 Infrared Sate! lite Picture.
300-mb Chart for 0000 GMT September 29, 1974, and Corresponding NOAA-2 Infrared Sate! I ite Picture.
300-mb Chart for 1200 GMT September 29, 1974, and Corresponding NOAA-2 and NOAA-3 Infrared Sate! I ite Pictures.
300-mb Chart for 0000 GMT September 30, 1974, and Corresponding NOAA-2 and NOAA-3 Infrared Sate! I ite Pictures.
300-mb Chart for 1200 GMT September 30, 1974, and Corresponding NOAA-2 and NOAA-3 Infrared Sate! I ite Pictures.
300-mb Chart for 0000 GMT October I, 1974, and Corresponding NOAA-2 Infrared Sate! I ite Picture.
300-mb Chart for 1200 GMT October I, 1974, and Corresponding NOAA-3 Infrared Sate! I ite Picture.
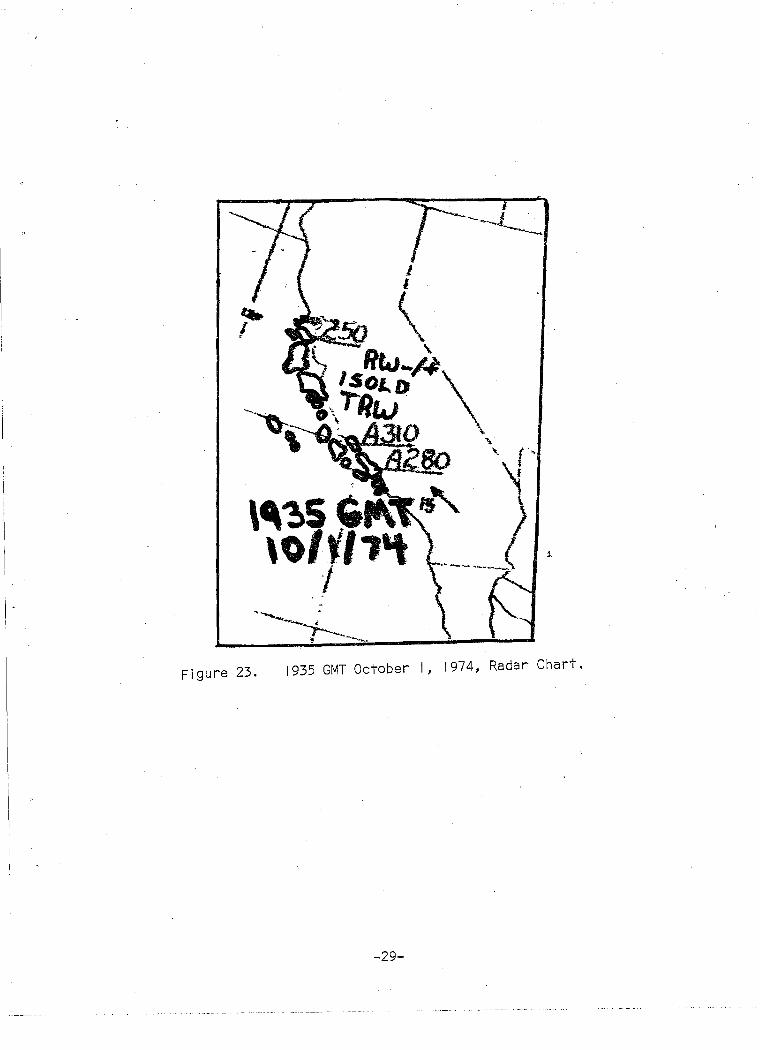
1935 GMT October I, 1974, Radar Chart.
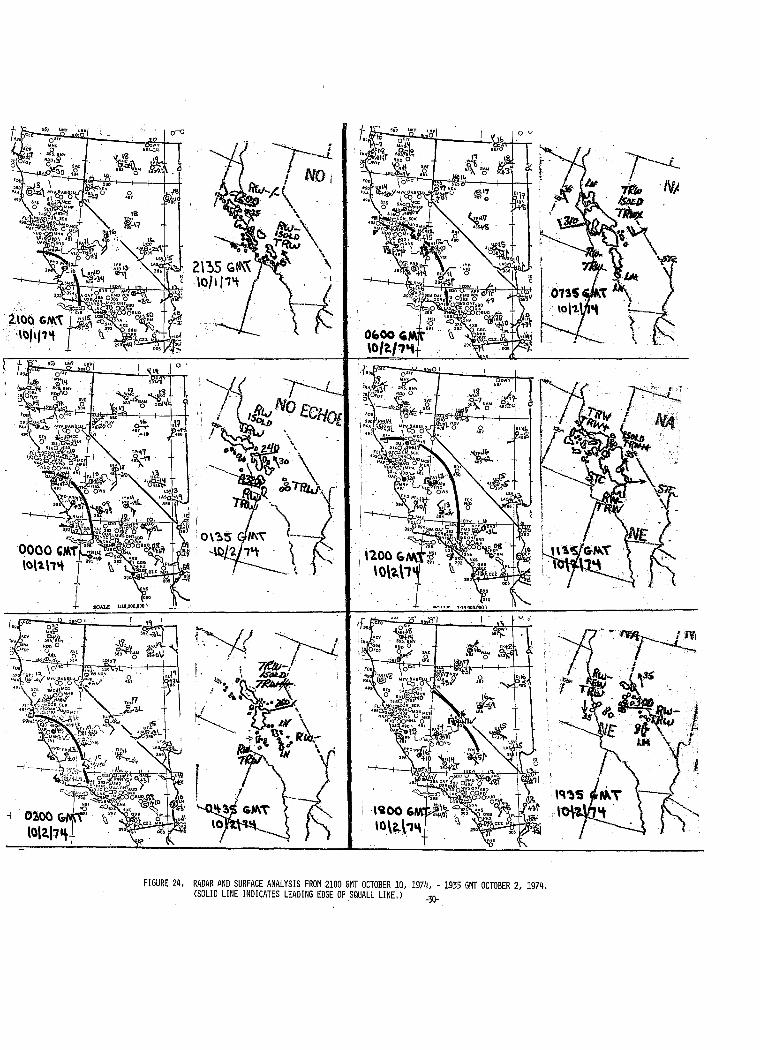
Radar and Surface Analysis from 2100 GMT
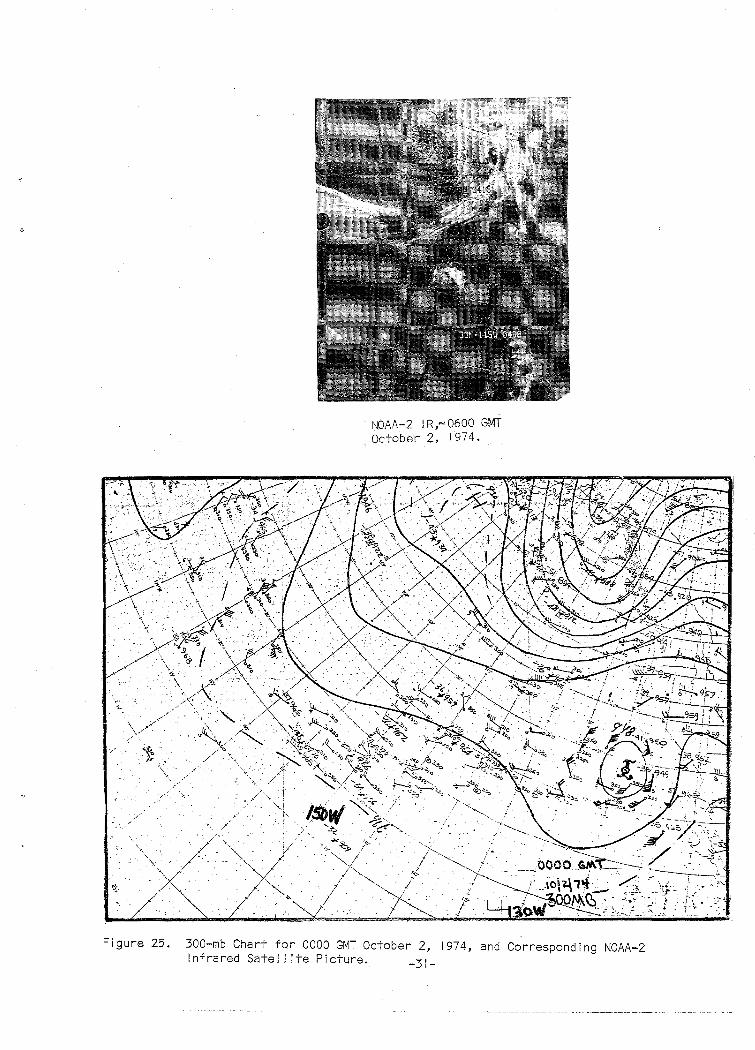
300-mb Chart for 0000 GMT October 2, 1974, and Corresponding NOAA-,2 Infrared Sate! I ite Picture.
300-mb Chart for 1200 GMT October 2, 1974, and Corresponding NOAA Infrared Sate! I ite Pictures~
300-mb Chart for 0000 GMT October 3, 1974, and Corresponding NOAA Infrared Sate! I ite Pictures.
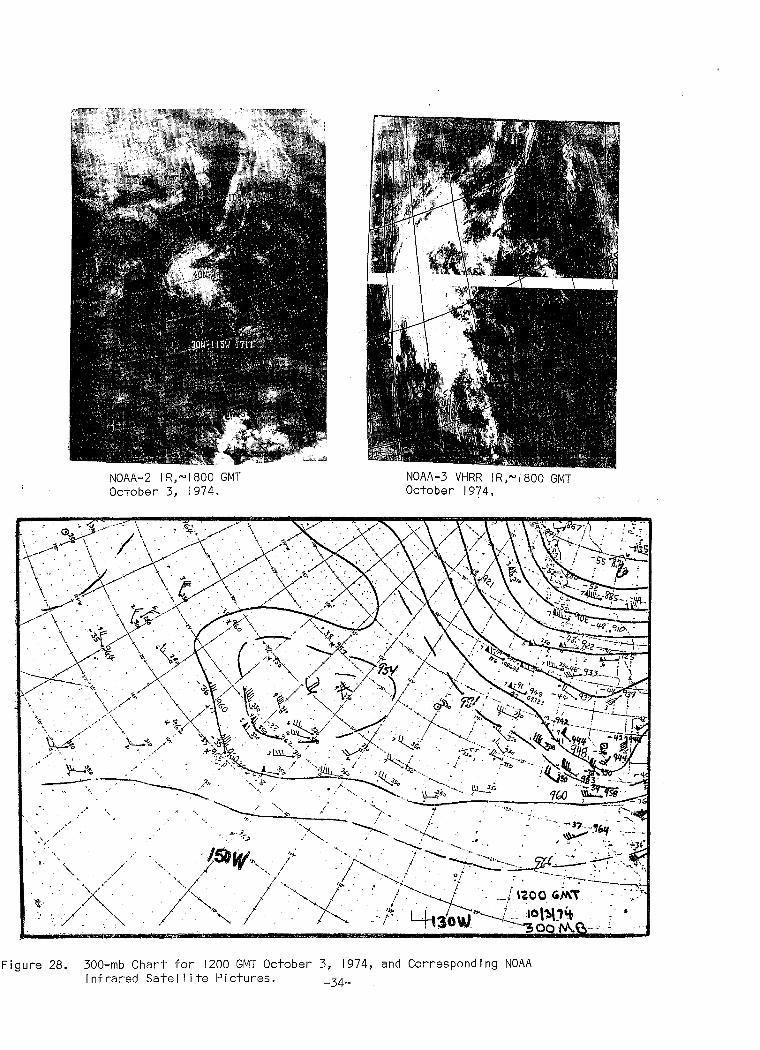
300-mb Chart for 1200 GMT October 3, 1974, and Corresponding NOAA Infrared Sate I I ite Pictures.
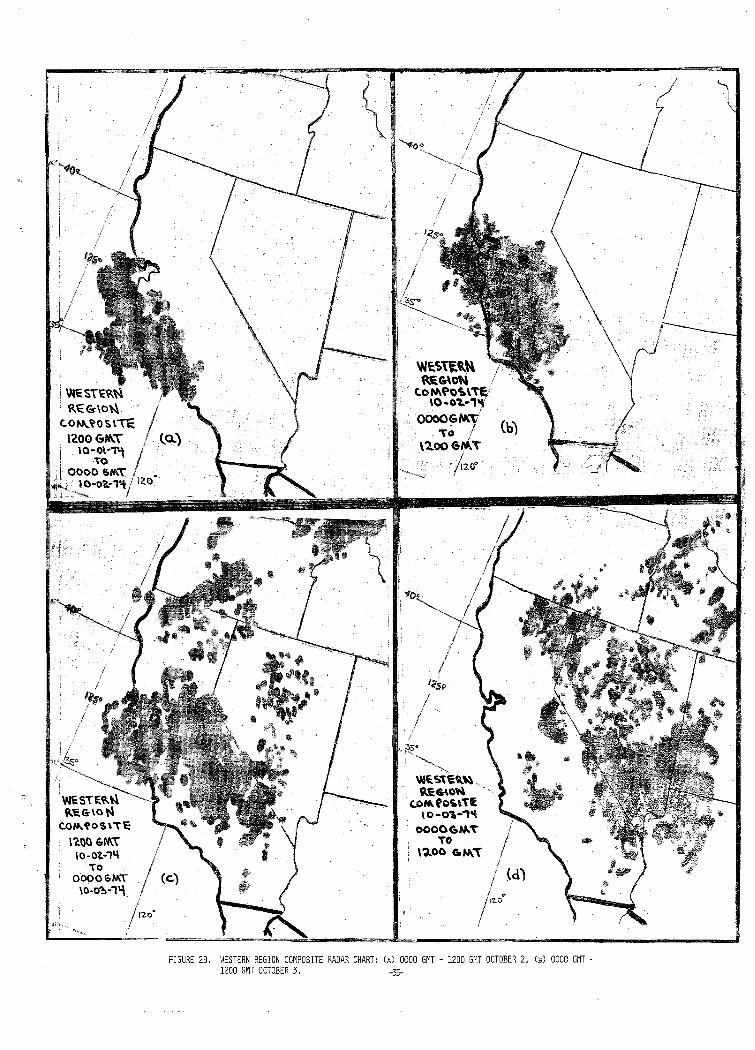
Western Region Composite Radar Chart: (a) 0000 GMT - 1200 GMT October 2, (b) 0000 GMT - 1200 GMT October 3.
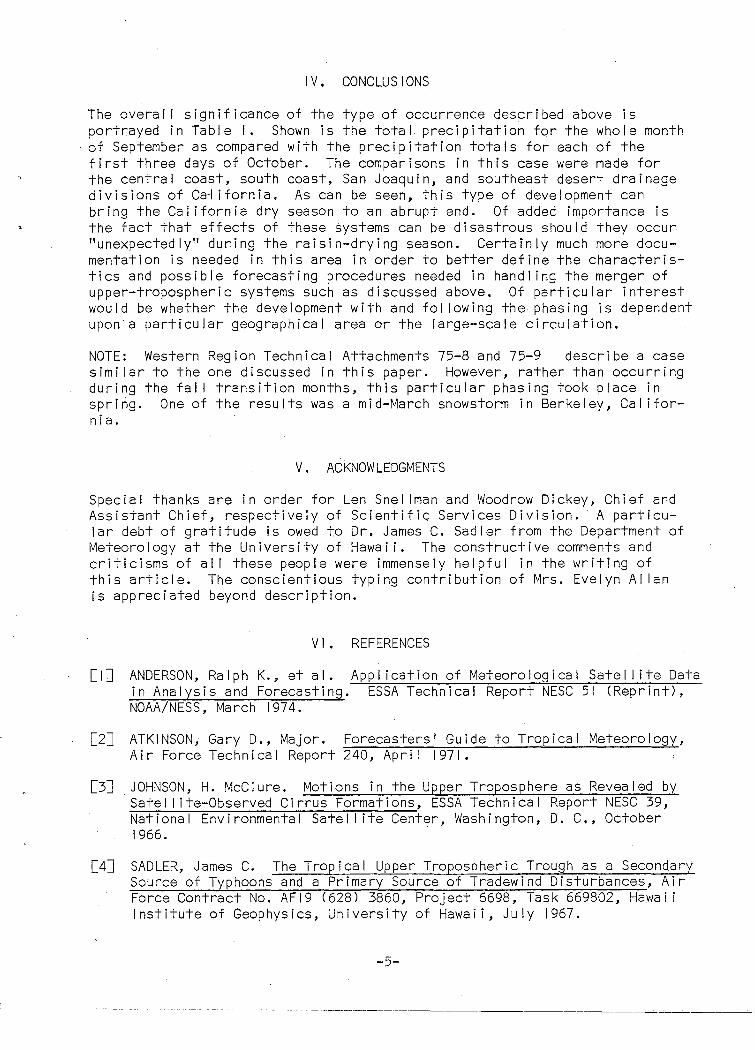
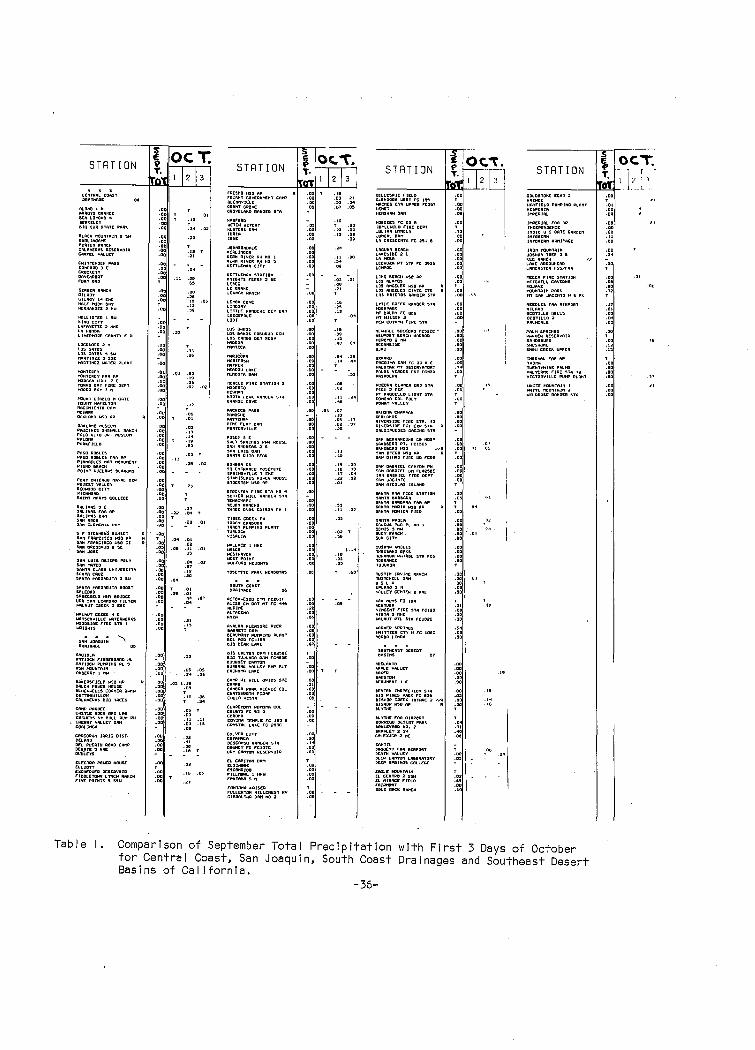
Comparison of September Total Precipitation with First 3 Days of October for Central Coast, San Joaquin, South Coast Drainages and Southeast Desert Basins of California.
iv
----------------------------------
22
23
24
25
26
27
28
29
30
31
32
33
34
35
36
STUDY ON A SIGNIFICANT PRECIPITATION EPISODE IN THE WESTERN UNITED STATES
ABSTRACT
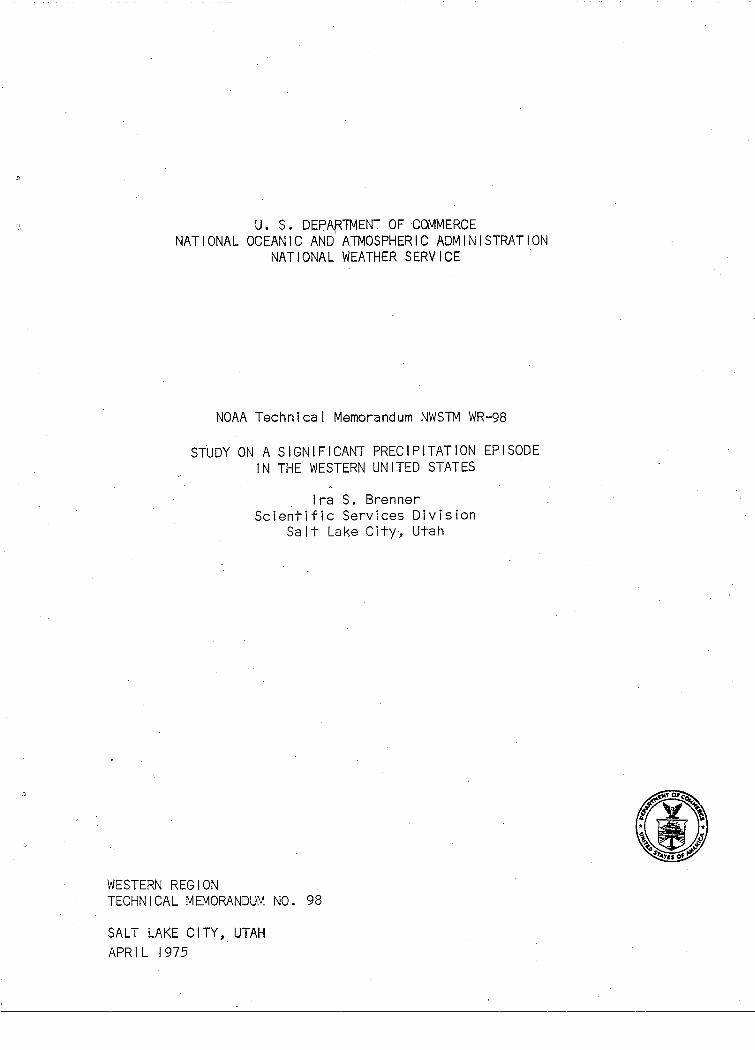
This synoptic study for the period 22 September to 3 October 1974 involves a case analysis of an unforeseen major precipitation episode. This was associated with the merging of an inactive upper tropospheric perturbation that moved east-northeastward out of the subtropics and an inactive e~tratropical low moving southeastward. Prior to the amalgamation of the two systems, only specks of high clouds were associated with each. Almost immediately with the merging of the two systems, rapid downward penetration of the upper-level extratropical system to middle levels took place, as evidenced on VHRR satel I ite imagery by· the development of rather organized middle cloudi~ess. Within 24 hours, a distinct vortex comprising alI cloud levels was evident on satel I ite photographs, and a wei !-developed low center became established in the upper troposphere near the 300-mb level. Twentyfour hours later, a major surface storm was in existence. The major impact of this storm was an abrupt end to the California dry season.
I . UPPER TROPOSPHERIC TROUGH
Each year, during the latter portion of the warm season, a significant rain episode usually occurs in California. These episodes are frequently accompanied by organized thunderstorm activity. With increased coverage and accuracy of air! ine upper-wind reports (AIREPS) and satel I ite data, it appears that these "surprise" storms are related to impulses originating in the persistent subtropical mid-Pacific 300- to 200-mb trough that has been investigated in-depth by Sadler [4].
Sadler prepared, with the help of numerous AIREPS, upper-wind climatology maps for the central and eastern Pacific [5], His mean September flow pattern is given in Figure I. Note the positions of the subtropical trough and ridge and subequatorial ridge. This subtropical trough can be present from May unti I November, but is best developed and most persistent from July to September [2]. At times, this trough exists only as a shear I ine, with no apparent low centers. However, some of the time the trough is dominated by closed circulations. Clouds not associated with these cyclonic circulations are associated with the westerly flow between the near equatorial upper ridge and the subtropical trough [4]. However, the more intense convective cloud systems are generally associated with migratory closed lows [4].
Intensification of these closed vorticies is thought to occur under one of two conditions. The first is the phasing of a trough in the extratropical wester! ies with the subtropical vortex. When this occurs, the translational motion of the vortex slows and convection becomes enhanced. The second condition involves an areal expansion of the subtropical vortex and occurs as the vortex moves into the area south of the upper extratropical anticy- · clone, thereby reinforcing the east flow to the north ot the vortex [7] .
. . . ---~·-··------·------~~------~~
Sadler [4] contends that the persistent upper tropospheric subtropical trough during the warm season has been identified with the development of major surface circulation features in the subtropical north Pacific. Surface development depends largely upon the areal extent, !~tensity, and downward penetration depth of the upper cyclonic circulation. These surface circulations are considered an extension of the upper system. Penetration of the upper system to the surface is generally restricted to the western part of the north Pacific, since the colder sea-surface temperatures and the strong trade wind inversion in the eastern Pacific generally inhibit such surface vortex development. The upper system generally slopes to the southeast with decreasing height. The low-level convergence ,and associated major cloud system are generally in the east sector of the surface system. The surface systems that develop always move in conjunction with the upper cyclone [4]. Sadler [6] successfully utilized sate! I ite and AIREP data to position the center of cyclonic cells imbedded ,in the subtropical uppeT tropospheric trough. The resulting analyses eventually led to the development of a model characterizing the various penetration depths of the closed upper eel I (Figure 2), [4]. The dashed I ine depicts the vertical slope of the system.
A key point on which this paper is based is that an upper system or vortex can and frequently does move east-northeastw~rd during the transition season from summer to winter in the Hawaiian region. If associated flow patterns are favorable, this system can phase with an upper tropospheric system of extratropical origin. A suggestion in this direction is given in Figure I. The split in the flow near 40N/165W lends itself to the possibi I ity of extratropical and subtropical systems phasing in the vicinity of the converging stream! ines between 30-35N/120-135W. In addition, the existence of the mean ridge shown off the Washington-Oregon coast suggests the possibi I ity of extratropical systems moving over the ridge and southward along or just off the West Coast, as is the case in this study. Phasing would sti I I be most I ikely in the same general area.
The subsequent discussion follows the evolution of one such phasing. It is shown how a migratory subtropical trough combines with an inactive upper tropospheric trough of .extratropical origin to produce a closed low and an ensuing major rain episode for south-central California, northwest Arizona, and most of Nevada and Utah. There are as many sim~larities as deviations between the life cycle of the cold lows described by Sadler and this migratory upper tropospheric trough. However, the intent here is to bring out the important fact· that the persistent upper tropospheric trough investigated by Sadler is not only a source of major weather systems during the warm season for the central and western Pacific, but also for the eastern Pacific and western United States as wei I.
I I. CONSTRUCTION OF ANALYSES
Three-hundred mb analyses from the National Meteorological Center (NMC) in Maryland were used in this study. However, the charts received were not the the analyses normally transmitted over facsimile circuits, but rather handdrawn analyses that involved the use of bogused, VTPR, AIREP, and RAOB data, as wei I as information obtained from sate! I ite cloud imagery.
-2-
Generally, the majority of available VTPR and RAOB data, along with I imited AIREP data, are uti I ized in preparing NMC-transmitted 300-mb analysis. However, the hand-drawn analyses received from NMC for this study involved a somewhat expanded use of AIREP and sate! lite information. Although many of the AIREPS were asynoptic and off-level data to standard analysis times and levels, they were assimilated in such a way as to be very useful, especially in no-data areas of the Pacific. The movement of cirrus clouds was uti I ized_to help provide good estimates of upper tropospheric wind directions and useful semiquantitative estimates of upper-level speeds [3]. Cirrus movements derived from high-quality satel I ite pictures reveal detailed upper tropospheric motions in areas or at times for which few or no conventional synoptic data are avai !able. It should be kept in mind, however, that not alI upper-level cyclonic circulations or troughs over the tropics or s~btropics produce convection and associated cloud systems.
Each analysis locally underwent close examination, and smal I refinements were made where necessary. Uti I izing continuity between these analyses and the NOAA-2 and NOAA-3 satellite pictures, locations, tracks, and characteristics of the subtropical and extratropical systems investigated in this study were determined.
I I I. SYNOPTIC REVIEW
In this study, a migratory trough that was generated in the region of the subtropical upper tropospheric trough and which eventually combined with an inactive extratropical trough,- is followed. Figure 3 displays the locations of the subtropical and extratropical systems involved in this study. Positions are given at 12-hour synoptic intervals. The northern extratropical system is located by dots labeled by synoptic hour and date, while the corresponding positions of the southern subtropical trough are indicated by solid I lnes. The positions were determined through the combined use of NMC 300-mb analyses and satel I ite data, and are superimposed on the 300~mb charts. The locations Indicated on the sate I I ite pictures were determined by the associated cloud imagery. It is these systems only that wi I I be followed. In general, the indicated synoptic positions on the 300-mb analyses wi I I not correspond exactly with the position which might be deduced from the cloud pictures due to time differential of five to eight hours between the charts and the photographs.
The 300-mb analysis for 1200 GMT 22 September (Figure 4) gives an idea of the initial flow pattern. The corresponding NOAA-2 satellite photographs are also shown. Note the subtropical system was near 175°W and a smal I area of convection was associated with it. In contrast, there were no clouds associated with the extratropical system off the Oregon coast. Figure 5 displays the locations of these two systems 12 hours later. The southern system moved very; I itt I e wh i I e the northern system near northwest Ca I i torn i a moved toward the south-southeast with a few wisps of cirrus appearing near the coast. At OOOOZ 23 September (Figure 6), the southern system sti I I had considerable activity associated with it, However, the cloudiness didn't appear as wei I organized as normally expected with a migratory trough. The northern system had apparently drifted southward to about 40N and 126W. Over the next 48 hours ending 1200 GMT 25 September (Figures 7- 10), it
-3-
·---···---·---------------·-·--
continued a southward movement to 31N/132W, and in the process developed a good low-level circulation, as shown by lower cloudiness in sate! I ite photographs. Since this circulation was indicated by low <warm) cloudiness, it was not readily apparent in the infrared sate! lite pictures. The southern system accelerated to near 155°W during this same period and lost much of its active weather. The trough was coarsely defined by cirrus configurations.
A definite slowing of both systems occurred by 0000 GMT 26 September (Figure I 1). Alt~ough the southern system sti I I existed as a wei !-defined trough in the 300-mb analysis, the dissipation of the associated cloud field made it barely discernible in the sate! I ite imagery. The northern system drifted due west to near 37N/133W. By 1200 GMT, 26 September, the cirrus associated with this system began to take on more of a curved band configuration, The southern system progressed slowly to 153W by 0000 GMT 27 September Figures 12- 13). Although sti I I hard to find on the sate! I ite pictures, it continued wei I defined in the 300-mb wind field. The northern system at this time continued to maintain its sharp definition in both sate! I ite imagery and 300-mb contour field, while beginning to turn southwestward.
By 0000 GMT 28 September (Figures 14- 15), the northern system had completed a loop and was heading back toward the east. The southern system, sti I I best defined in the wind field at 300mb, began to accelerate northeastward. According to the 300-mb analysis for the period 1200 GMT 28 September through oopo GMT 30 September (Figures 16- 19), the two systems appeared to converge as they moved basically eastward. Surprisingly, there was very I ittle change in their associated cloud structures during this period.
The systems became in phase near 127W about 1200 GMT 30 September (Figure 20). The associated NOAA-2 daytime pass as wei I as the NOAA-3 day IR VHRR photograph for approximately the same time show that a remarkable increase of middle and high clouds took place. The sudden development of this cloudiness at a time coincident with the phasing leads to the hypothesis: Vigorous development should be looked for when extratropical and subtropical systems become in phase.
By 0000 GMT I October, a wei !-developed upper t~opospheric low centered near 33N/126W was present (Figure 21). Further organization along with very I ittle eastward progression continued through 1200 GMT I October (Figure 22). Shortly after 1800 GMT I October, there were strong indications by sate! I ite data (Figure 22) and RAREPS (Figure 23) that a surface squal I I ine was being generated along the coast of central California. An overal I eastward spread of this activity can be seen in surface maps and corresponding radar charts from 2100 GMT I October through 1935 GMT 2 October (Figure 24), The satel-1 ite picture in Figure 25 for 2 October, displayed the cloud pattern associated with the squal I I ine. By 0000 GMT 3 October (Figures 26- 27), this cloud field continued to expand while moving rapidly eastward and being entrained into an approaching trough to the north. Figure 28 shows the NOAA-2 and NOAA-3 day IR pictures for 3 October as the storm's influence on the Western Region began to diminish. Composite radar echo charts for 12-hour periods from 1200 GMT I October to 1200 GMT 3 October are shown in Figure 29.
-4-
IV, CONCLUSIONS
The overal I significance of the type of occurrence described above is portrayed in Table I. Shown is the total precipitation for the whole month
·of September as compared with the precipitation totals for each of the first three days of October. The comparisons in this case were made for the central coast, south coast, San Joaquin, and southeast desert drainage divisions of Cfrl ifornia. As can be seen, this type of development can bring the California dry season to an abrupt end. Of added importance is the fact that effects of these systems can be disastrous should they occur "unexpectedly" dur:ing the raisin-drying season. Certainly much more documentation is needed in this area in order to better define the characteristics and possible forecasting procedures needed in hand I ing the merger of upper-tropospheric systems such as discussed above, Of particular interest would be whether the development with and following the phasing is dependent upon a particular geographical area or the large-scale circulation.
NOTE: Western Region Technical Attachments 75-8 and 75-9 describe a case similar to the one discussed in this paper. However, rather than occurring during the fal I transition months, this particular phasing took place in spring. One of the resu Its was a mi d-~~arch snowstorm in Berke I ey, Ca I i fornia.
V. ACKNOWLEDGMENTS
Special thanks are in order for Len Snel lman and Woodrow Dickey, Chief and Assistant Chief, respectively of Scientific Services Division. A particular debt of gratitude is owed to Dr. James C. Sadler from the Department of Meteorology at the University of Hawaii. The constructive comments and criticisms of alI these people were immensely helpful in the writing of this article. The conscientious typing contribution of Mrs. Evelyn AI ian is appreciated beyond description.
[I]
VI • REFERENCES
ANDERSON, Ralph K., et al. Application of Meteorological Sate! I ite Data in Analysis and Forecasting. ESSA Technical Report NESC 51 (Reprint), NOAA/NESS, March 1974.
[2] ATKINSON, Gary D., Major. Forecasters' Guide to Tropical Meteorology, Air Force Technical Report 240, Apri I 1971.
[3] JOHNSON, H. McClure. Motions in the Upper Troposphere as Revealed by Sate! lite-Observed Cirrus Formations, ESSA T~chnical Report NESC 39, National Environmental Sate! I ite Center, Washington, D. C., October 1966.
[4] SADLER, James C. The Tropical Upper Tropospheric Trough as a Secondary Source of Typhoons and a Primary Source of Tradewind Disturbances, Air Force Contract No. AFI9 (628) 3860, Project 6698, Task 669802, Hawaii Institute of Geophysics, University of Hawaii, July 1967.
-5-

[5] SADLER, James C. The Mean Winds of the Upper Troposphere Over the Central and Eastern Pacific, UHMET 72-04 ENVPREDRSCHFAC Technical Paper No. 8-72, Department of Meteorology, University of Hawaii, June 1972.
[6] SADLER, James C. A Role of the Tropical Upper Tropospheric Trough in Early Season Typhoon Development, ENVPREDRSCHFAC Technical Paper No. 9-74, Department of Meteorology, University of Hawaii, May 1974.
[7] The Evolution of an Upper Tropospheric Vortex- Tropical AtlanticATS-3 Satel I ite, Applications Department, Environmental Prediction Research Faci I ity, Naval Postgraduate School, Monterey, California, The Walter A. Bohan Company, Park Ridge, I I I inois.
-6-

i -.. I
\ r. I ... ' ...... ~:-.. "': ..
_::~~:~:;:;l;,uro:::::~;~~~- 0 0 <I
.·,. /
·'· . ,, '~
: .. -:-
~ ..... i -~ .. . ..-!.
~.~:;,c",~i>:~ t~ =:o;.J_,, .
/
I· - ) -- ~:.;···-----------------! ----- [ ., :~---·:..·· . ---~.:::...:______ ....... ---. 1
j_ --------.-----.. ' ________ ~::~·.:· ___ -_-_-_-_:::. -,~:--~~~~~:--::--:--.-.. ,.,-,~ . .;~---- .:.:.-'-~0-·- 5~:: .. -.: ___ -~)J''"j ··········-:-··-··· • • • • !IU~1'Mt'\<:A\. R\OGrE 300 M& . . . ~~)
\\\ --- SU&TI\00\<k\. T~OU~" 5~1'0Cf'IGER .,,. I. ,.w '· __ ....... su~eQ\l~~\1\L R\tlGt...i. -- ·- -- -··---------·--- -·-
FIGURE I. MEAN SEPTEMBER 300-mb WINDS OVER THE CENTRAL AND EASTERN PACIFIC WITH POSITION OF SUBTROPICAL UPPER TROPOSPHERIC TROUGH(------), SUBTROPICAL RIDGE (• • •), AND SUBEQUATORIAL RIDGE(---).

200mb.
500mb.
700mb.
Surface
c.
Figure 2. Schematic Three-Dimensional Model of Various Penetration Depths of 200-mb Cyclone: (a) 700-mb with Easterly Wave at Surface, (b) Completely to Surface, (c) Typical Sate! lite-Observed Cloud Distribution Associated with (b).
-8-
;_
I \0, I
r-- I :- ....... . .......... ..
. - I . -~-·--. ' ·. -. . -..,_ . \ ·. ·.. . .( , " I"·,_. ,. .. -,_ , / ,o · . . ./ -, )' -"- . I .... ( '·; · .... ·. / "-./ · .. · ·. ..·.. ·.. .-:- '-... · .. /
•• •••• ·._ /' .-· ., -~· <?' /"·,: • ~· • • , '\.,. 0 ~ •• ~ / •• ·. / ....... ~-. ...---_.....:.......\ /.
,• ...... .· · .. ··-.;; •./~ . .· --1:·-~ ... . N .. -· . ··.. " I,.--
·. cr ~- ~.-. ,.--...:... / \1" .. ·. $'? .J. 0 •.
/ · .. , .. · /i. .... ~ --: . .··. -,.,...:/\ "'- I~ · .. . / . . . d"/ "'~ " ·. . ~ / ·. .·· ·.. it' / • · .. · ·. -- ·. t~··· . ~ I .··· . . -- . .. ....... / ~' .
.. ····. .. ···.······ ·.
· .. ·.,_ '>(.
• r
-'\ ·· ....... ······ \-~~/·~'·., / ,o?\~· .... \'x······· :. .. ·. .-·d' "r.· ~ .· • ••• •• ~ .r•vJII ;::...• . . .. ,.· '\ " .... ·. . ·.. ,... . :.. ..o~l/r;.~ r ·.. .·.
... ··· ·. .~,.'<f ,..i q, ~ .. .).'l,o •.• •• ---~--
/ ···• ... /
.. • • • • • ··: ... ... . .fjOV oN ~- If'' • • ·' .. . ·, /' '""'~ \ .. ····· .
t- I ; . :··········.1···········:···
__.
-·- --;----....,....... ----=------M~Mol se.n~"'e~~ POS\1'\0N Of ~ooM.~
SUQit't.Ot\CI\L ~ . Jn ... -.I :, .... /·"· , .... -.. ... T~O\!fO'c\•"'··.
I /
oo\l.'t \ ~. ( \ ~.;~-~ r.,'l-\~ :"' " """" --_, ~ ------
., .. ······
,<.o
\ . '\ .-~ t
./
...... ~,,. .. J'•
\S~
//. . .· . _,..- -.._ ,~-. ~a· .
·. \ .··
.... ··::· /
/
·. / ·. /
.P: ,/
·. .. · .
,.s...~ .. .. ·. .
,so ...
/
·--/· .. _,
,($
. ·~
/
·.
.· .. · ..
... ·.·· .. .· .
·.
~~-. ··.
·.
... ··· r:r
-~ ..·
FIGURE 3. 12-HOUR POSITIONS OF THE SUBTROPICAL AND EXTRATROPICAL SYSTEMS SUPERIMPOSED WITH MEAN LOCATION OF AUGUST 300-MB SUBTROPICAL UPPER TROPOSPHERIC TROUGH.
. •
\
NOAA-2 IR,NI800 GMT September 22, 1974 .
... ... libW··· .... -- -:----
Figure 4. 300-mb Chart for 1200 GMT September 22, 1974, and Corresponding NOAA-2 Infrared Sate I I i te pi ctr I roc -I 0-
NOAA-2 IR,~0600 GMT September 23, 1974,
Figure 5. 300-mb Chart for 0000 G~JJT Se:Jtember 23, 1974,. and Corresponding NOAA-2 Infrared Sate! I ite Pictures. -1 1-
Q
~ Figure 6.
NOAA-2 IR,""ISOO GMT September 23, '1974.
. ~r ·····~·: 3'.io
llOV/·········
300-mb Chart for 1200 GMT September 23, 1974, and Corresponding NOAA-2 Infrared Sate! I ite Pictures. -12-
NOAA-2 IR,~0600 GMT September 24, I 97 4.
'.'i~.: ~ .• 0000 G !#'\
. q}Z.'t/1"+} .
~SQ_N\~
Figure 7. 300-mb Chart for 0000 GMT Septem.ber 24, 1974, and Corresponding NOAA-2 Infrared Satellite Pictures. -13-
NOAA-2 IR,~IBOO GMT September 24, 1974.
Figure 8. 300-mb Chart for 1200 GMT September 24, 1974, and Corresponding NOAA-2 Infrared Sate II ite Pictures. -14-
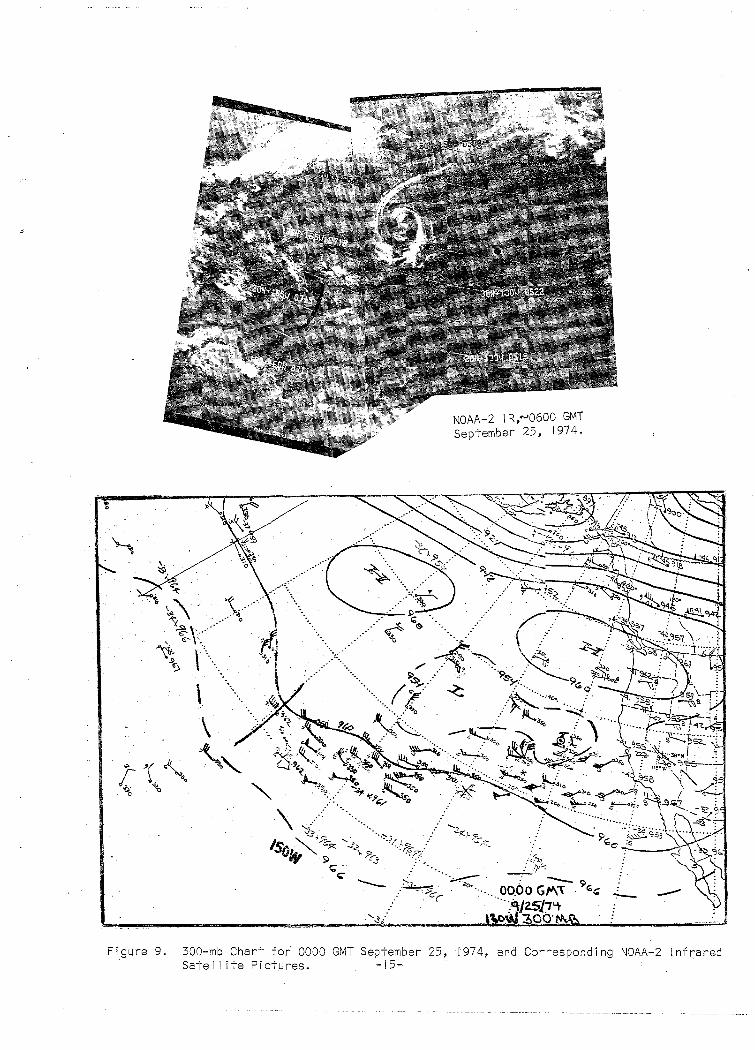
Figure 9.
NOAA-2 IR,N0600 GMT September 25, 1974.
300-mb Chart for 0000 GMT Se?tember 25, 1974, and Corresponding NOAA-2 lnf(ared Sate! I ite Pictures. -15-
·.
.(
:...- . ........ · .. . =-- "-.. . /
/ ... /···...... 7'.s-j: ./ ..... .· ··· ......... } ....
·-c.. (. ...-/·-.---.<a.~-~<-- _; :/~. . . . ·· ·······-,... . I . /_
\. '_. he. ___., : .., orw--
--~~ :
.·· · . ................. ·· ... . ·'-~ · ..
'SO~y --~,
...
Figure 10. 300-mb Chart for 1200 GMT September 25, 1974, and Corresponding NOAA-2.1nfrared Sate! I ite Pictures. -16-
~--·······
NOAA-2 IR 1~0600 GMT September 26, 1974.
- ----:·
__ 0000 Gf'A. -r: _ ··· .. · ' - -- q/2. fo/7'i f
.:-·--......... ~00 M!R:> . .,,.._ .. , ···--. . '40UW ............... ..
Figure II. 300-mb Chart for 0000 GMT September 26, 1974,'·and Corresponding NOAA-2 Infrared Satefl ite Pictures. ~17·
"'-...
Figure 12.
~~ ,. ... · · . . :/c~. •
'sO~r '~<··~·-.. ~.
'-Jo. I
"'9,.:..1
'J~·
: ""'''
·:·.
...
NOAA~2 IR,~I800 GMT September 26, 1974.
12.00 Gff\\ / qj2.~/7tt ; 300 N\~
300-mb Chart for 1200 GMT September 26, f974, and Corresponding NOAA-2 Infrared Sate! I ite Pictures, -18-

Figure 13.
NOAA-2 I R/''0600 GMT · September 27, 1974.
300-mb Chart for 0000 GMT September 27, 1974, and Corresponding NOAA-2 Infrared Sate! I ite Pictures. _ 19_
NOAA-2 IR,NI800 GMT September 27, 1974.
~ / raoo ·Gf4\~
····2o.... : q/2. 7/7'i ··~·/. 306 M_n. ! . <: ~. l. ·············· !
Figure 14. 300-mb Chart for 1200 GMT September 27, 197,4, and Corresponding NOAA-2 Infrared Sate! I ite Pictures. ~zo~
'or ~
NOAA-2 IR,~0600 GMT September 28, 1974,
--·. ·.
·· .. .....
Figure I5. 300-mb Chart for 0000 GMT September 28, 1974, and Corresponding NOAA-,2 Infrared Sate! I ite Picture. -21-
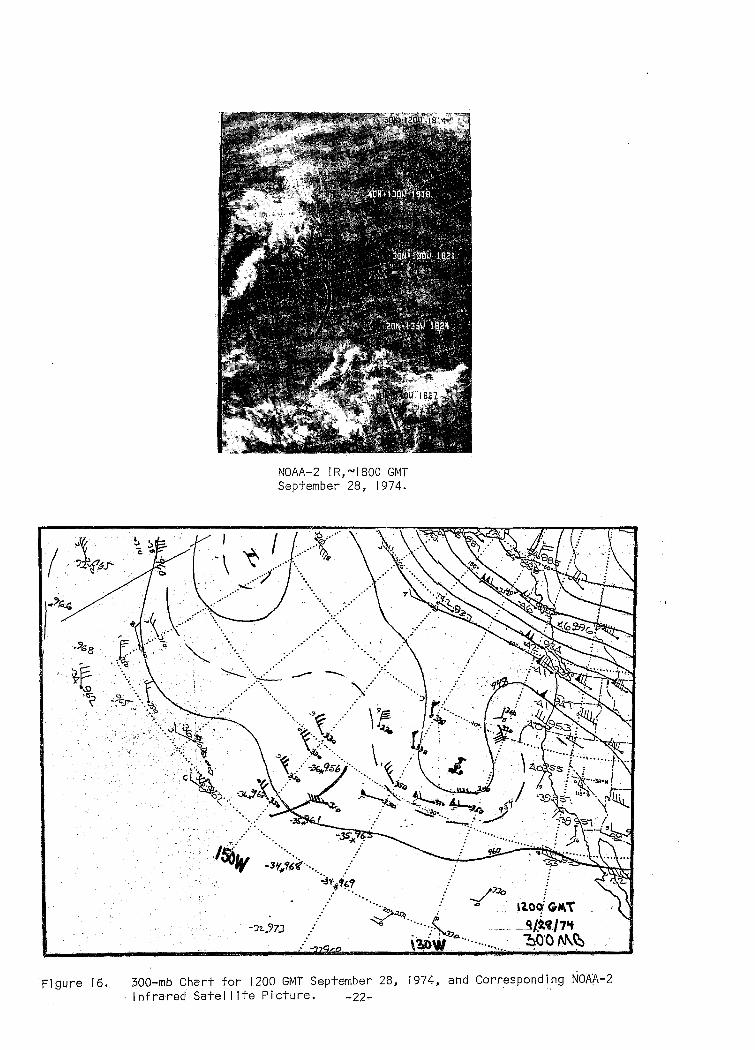
Figure 16.
NOAA-2 IR,NI800 GMT September 28, 1974.
-·:rz .• ?7J
. -
J:7.Jo
.::~ .. t2.oq-" GI4T
-·· _t:tJ~ti,/1'+ ~'0 (\!\.~
300-mb Chart for 1200 GMT September 28, 1974, and Corresponding NOAA-2 Infrared Sate! I ite Picture. -22-
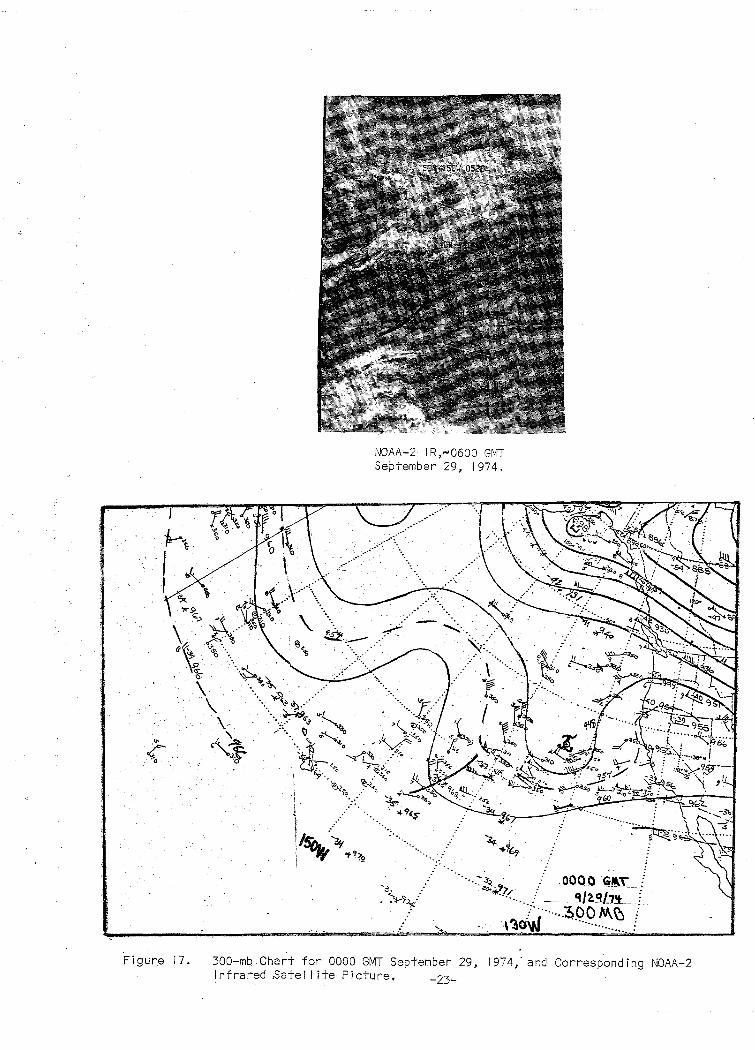
Figure 17.
NOAA-2 IR,~0600 GMT September 29, 1974.
·. ~. ·. ~ . .J.
...~~
··-.::::;~7.~ .. · 000 0 (;~t.T. ....
··_:.::·-~.·: .. ~~~~~--/· \1~W ·········--.... :
300-mb Chart for 0000 GMT September 29, 1974," and Corresponding NOAA-2 Infrared ,Satellite Picture. -23-

i"'-. ~ :
Figure 18.
NOAA-2 IR,~J800 GMT September 29, 1974.
·. ·· .. · .. . ·~ ...
·· .
NOAA-3 VHRR IR,NJ800 GMT September 29, 1974.
........... ...
·~. \
, \'!»~-~·.·····················
1100. GPI\T qi~Cf /7't :;_coM.~
300-mb Chart for 1200 GMT September 29, 1974, and Corresponding NOAA-2 and NOAA-3 Infrared Sate! I ite Pictures .
.,24~
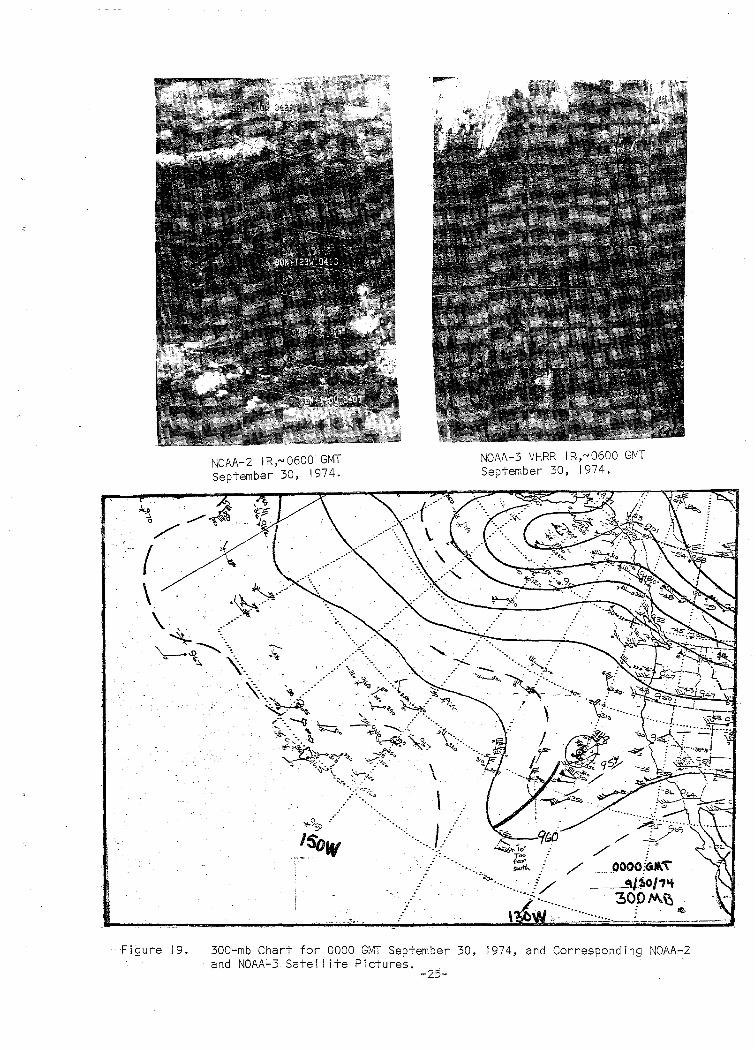
Figure 19.
NOAA-2 \Rr0600 GMT September 30, 1974.
·:_.:·:~<:;o
*~ ~/
---~sow . :·
\ ·.. I ...
·---...... ___ _. ......
NOAA-3 VHRR I R,"'0600 GMT September 30, 1974.
~io' T"" fo.>l"
··:-- ~. C'o. . .;
······ .... :_[/ .......
\ .. ........ .
L ··-------~.::.:..:.: .• _.:__~·----.-----·
300-mb Chart for 0000 GMT September 30, 1974, and Corresponding NOAA-2 and NOAA~3 Sate! I ite Pictures.
-25-
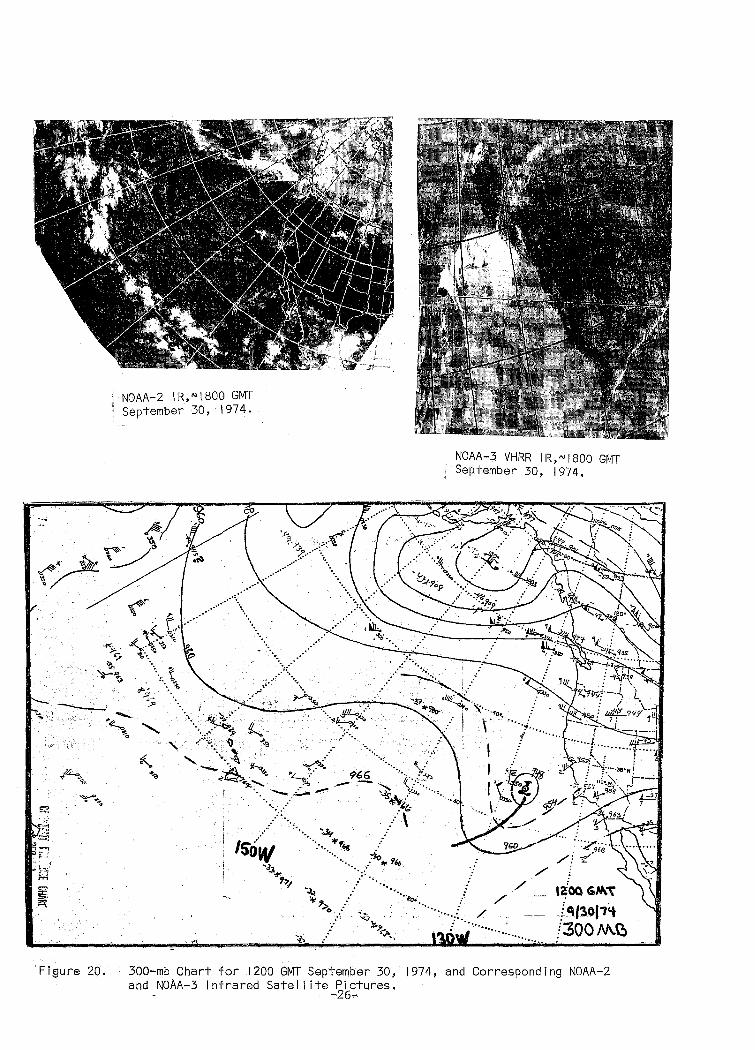
Figure 20.
NOAA-2 \R,N\800 GMT September 30, \974.
_.-:io"' 9(.o .. ·~~ ....... ····· ...... ., ...
...
NOAA-3 VHRR IR,NI800 GMT September 30, 1974,
······.:.::· ... / ·· .......... . ..... ·····
l~QQ G"'~ _£~llOJ1't /300M.~
300-mb Chart for .1200 GMT September 30, 1974, and Corresponding NOAA-2 and NOAA-3 Infrared Sate\ I ite Pictures, . -26.,.
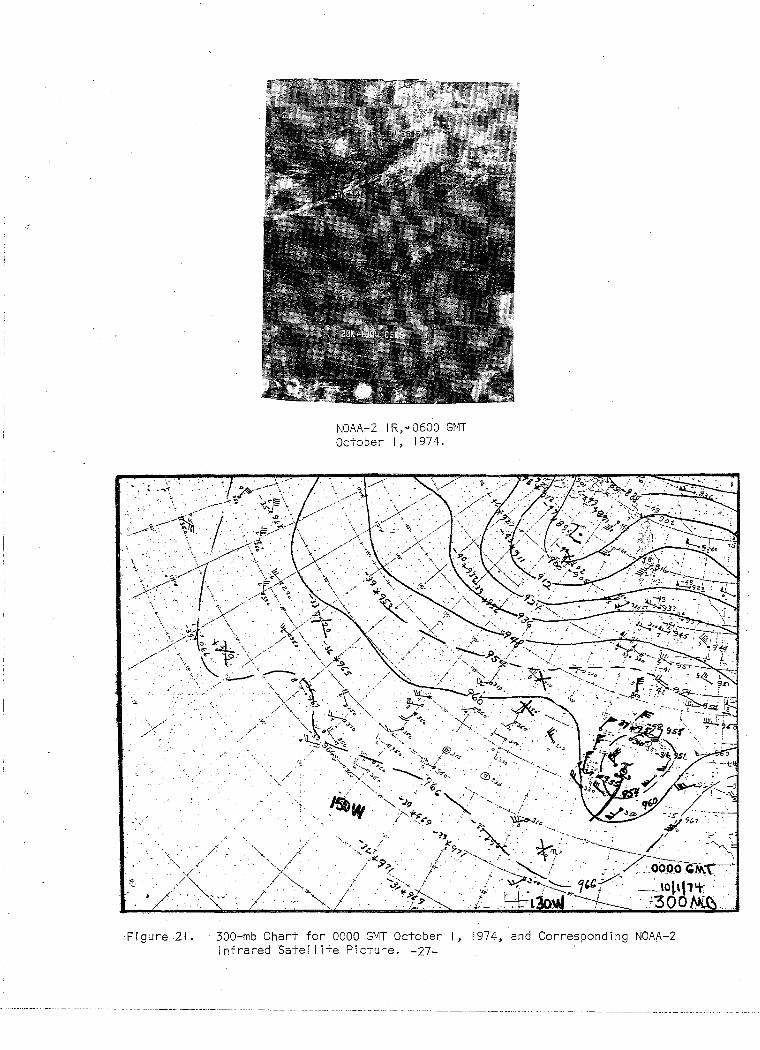
Figure 21.
NOAA-2 IR,,..0600 GMT October I, 1974.
300-mb Chart for 0000 GMT October I, 1974, and Corresponding NOAA-2 Infrared Sate II ite Picture. -27-

'1-. · ..
.. ·
./
Figure 22.
··-,~~/ ..... "·/''- . ;<'
NOAA-3 VHRR IR,NISOO GMT October I, 1974
· .. y:· '<s. "'· ·, . . . . I .
·_· .. '--~·- .
300-mb Chart for 1200 GMT October I, 1974, and Corresponding NOAA-3 Infrared Satel I ite Picture. _28_
. ' . ,
-.... ~.... ~ ---;-__
!o """~~.-... .....
Figure 23. 1935 GMT October I, 1974, Radar Chart.
I •
-29-
--j :J
FIGURE 24, RADAR AND SURFACE ANALYSIS FROM 2100 GMT OCTOBER 10, 1974, - 1935 GMT OCTOBER 2, 1974. <SOLID LINE INDICATES LEADING EDGE OF SQUALL LINE. l -30-
w ,/ .,_
-.
··,~ l
h ·. i
NOAA-2 IR, ... 0600 GMT October 2, 1974.
Figure 25. 300-mb Chart for 0000 GMT October 2, 1974, and Corresponding NOAA-2 Infrared Sate! I ite Picture. -31-

\/ .. ~e- ..
·-
>-
NOAA-2 IR,N1800 GMT October 2, 1974.
·,_ .,. "$/)"'
300-mb Chart for 1200 GMT October 2, 1974, and Corresponding NOAA Infrared Sate! lite Pictures. _32_

Figure 27.
NOAA-2 IR,N0600 GMT October 3, 1974. NOAA-3 VHRR IR,N0600 GMT
October 3, 1974.
300-mb Chart tor 0000 GMT October 3, 1974, and Corresponding NOAA Infrared Sate! I ite Pictures. -,33-
•·
NOAA-2 IR,N1800 GMT October 3, 1974.
//.
·/~
NOAA-3 VHRR IR,NI800 GMT October 1974,
Figure 28. 300-mb Chart for 1200 GMT October 3, 1974, and Corresponding NOAA Infrared Sate! I ite Pictures. _34-
:w~STE:9..N : ~'iG\ON <:.oM. to~ n·e i \20() G.M.\
IO~Ot-1"1 'TO
oooo&ti.T \0-0'!1~1"\
no·
(c.)
I~$P
I . I /
·~~ ~"
WE:O:.T~~\1\. ~6\0\ll
(.ON.fOf.\Ti \0-0'!.-,'\
OOOOG.MT TO
\~00 G.M.\
FIGURE 29. HESTERN REGION COMPOSITE RADAR CHART: CAl 0000 GMT- 1200 Gr1T OCTOBER 2, CBl 0000 GMT · 1200 Gf1T OCTOBER 3, -35-
~ oc T. ~ oc. "t'. STAT ION ~ STAT ION .. STATION T. 1 12 13 ,.. 11213 ~ STATION
~ll1 traJ rRESI'101-1SOAP .00 ' ... OILLUPIE: FU;LQ GOL0SlOit£tCHD2 ~~:~~~t COAST FRII'I11TQOVE:RI111EIITCIII't" :gg ·" :~~ 0~£11001111 J.I:ST rt IllS 111111-CC g~~~;~~~~~;t ·" HAI1'1UCYfiUPPE:IIFt367 HFITF'InD PUI"PIHO PLAin
·" ·" Hti'I:T H£SP£1UA ALIII'SJ '" ·00 OII:IIVELAI'IOili'I1'10£RSTA I!£11SIUIIoi0AI1 ll'f'EAJAL AIIIIOYDCRAI'ID£
:~g Bti'ILOI'DIIO<t ·" ~~~~~~~~tTCHT ·" H3E0££51'CI!IOA .00 Jt'PtAIALFAAFIP Bl:'lllltU:T
' ·" ' ·" IOY\.UULD I'll!.£ OtPT ' UID£P£N0£11tt t.IQSURSl'IITtPAIIII. ·00 ·" ·" IIUI1TEIISOAI1 .oo ·" ·" J~LJAII lol'milLA ·" IIIIHOUSOA'tEOAii!DEII 1011111 • 00 ... :~: .JUilCALDAt'l .00 II'IYCII((AII IILACII M0UI'1TtHI1 01 SU ;gg 101'1( .001 LIICIIUCti'ITArCUI 6 .00 UtYOII.£111'1 Allt11TAGC IIUALU'10AHE"
:ggl 11101'1 I"'UI'ITAll'l IIUATOIIIIAIICH
' JCIHIISOHDALt LllllUIIAIIEACH ·" CIILAVEAASIIUEII .. oJIII .oo ... ' lltRLIHQtA LIII:.UJCU:2t ·" JOSHUATAtt35 CARI"£L VIILL£Y .oo ·" II(AIIAJVI!Ii!PHtHI ' • 00 ... ·" Lll t£~11 .oo ~EC RAHCII r.tRIIAJVtiiP,HI'I(J'l :gg ·" L£CHUZII PT $Til F'C 'l~211 :gg LA~£ IIAII;Q~[IIQ CIUTT£110(11 Pll$5 .oo ~ETTL£1'11111'1 CITY ·" LOI'f'OC LAIICA5TCRF55.1f'IIA COI'IC01103C .oo CROC~tTT .oo K!:TTLtHAnSTA'{IOI'I q LOHQII(IICHilSOAP ·" MECCAF'IIU:STATJall OIIVCIIPOIIT ;.Do ... ·" KHIOIITSF'tAil\':ISE: ·" ·" LaSALAttlS ;.DO HrlCHtLL CII'V£R"5 F'QRTOIIO ·" LtlltC ·" L!ISAHOCLE!oWSOAP HOJIIV£ Ctii&CAIIAIICH . oo t~~~:~~~~AIItlf ·" LOS 1\HOCU:S CIVICCTR ·" ttlUHTAJ11PAS!rt ·" ' LIJ5PIUtTOSIIAHOCASTA ·" m ~iiiH JACJHTQ 1.1 5 P .. DILIIDY .oo ·" 0JLAIIY1'4£11C ;.DO ... ·" LCI"'lHC0\1£ ·" ...
~~~~~~~:£[1; IIIIIICCA STII ·" HttOLtS rAil fHRPIIAT HALrttl!IHM'I' ... LIHDSAY
:i~! ·" ·" HILAND HCRtlllltOCZ 2 111.1 ·" ·" Lnnt PAIIOCHC OCT 01111 ... HTIIALOYF'CB!IG ·" OCOTILLOI<IELL:i tgg~rPott NTWIL$0112 ·' OCOTILL02 IIOLLI!.T£11 I 51.1
·" l'ltt.ICUYII1111r{II£5TA PAUCIIIL£ !!.HID CITY ·" PAL115PIUI1GS
LAF'AYETT£21111£ .oo LOSIIIIHOS .oo ·" HE;IJHALLSDLEDIIDF'C'l:IC.C" ·" Li<IHOIIOA ·" LIIS 8At!OS A~IIU~UA IICII .00 ·" nti.>POIITIIEACIIIIAIIIIOII :~~ PAIIotEIIIItStRVOtll LtV£1111011£COUt!T'rfD LOSBIII'IOSOtTIIt!'iV ·" ·" ~;!:,;£1'1~ IIAI'!OSIIUAG h'IOEIIFI ·" ·" :~~ SHIJSIIIIIIE LIICKI-IODOO!I'I .oo h'II'ITCCFI ·" OJIIJ StiO~ Cllttot UPP£11 LOS GATOS .oo .35
LOSGATOS"'S!.I .oo ·" §}~i!:;A~E .oo ·" :~~ OX!iAIID ·" ~~~~~L ffiA AP ~RTIIIEZ3SS£ . oo ... PAC01111'11DAMfC33A£ ·" ~IITII'IEZioiATEIIPLAI'IT
·" ' PAt0111'111111'TDIISER1tATOIIT ·" T!.ltt1Tl'tii11EPFILHS .00
==~=~~~110£5 EST fE•m ·" VAL'I"EII1'11JF'IIIESTA711 MCI11Ttii£T
:~i ·" K:tiOOTA DAM ·" VtCTOIIVIlttPU$PLAIIT
~~~i:;~~~F~:~otPr ... I
·" ·" ·" !oo51ITEI10UIITAI111 ·" K:RC£0 fJRt STAT IIlii 2
~!~:~J~~:c~ .::: ::: :~g ·" .o<!!
~a::~ri~/AI'IG£11 STA
·" ·" Tool !oo51ITI:n3UIITAJHO!
! ·" !.IJLOIIOSCAAI'IGEIISTA .oo ·" ·" POrlli'IACALPIILT ·" g~~:~~=~~:: "" • 00 .... PO!.IAYVALL£'1" ' I Too
m~!~i;:;:" ·" =~~O~IlAPrw:tl'l "I ·" ·" ·" ·" ·" .oo ' ·" ·" ·" 111\IEIISIDtrtAtSTA. "
':I DAoU.AtiO I"USCUM .oo ·" ·" ·" AJ'itiiSIDECITEXPSTA ' ·" " ·" SALSIPUEOESGAGJIIGSTA PAJCJtltSOillll.lflLLIIAI'ICH .oo ·" PALO ALTO .Ill. I"USEUM .oo ·" POSEY:!£ .00 SIII'IIIEAI'IAAOitiOCOHOSI> I>AL0111'11 .oo ' ... SAtTSPRJtiGSPI$lHIIUSE ·" SI'II'IDII£AGPTLfCI3011 .oo
" PAIIKfiELD ·" ·" SAtiA"DIItAS2S ·" SAIIOIItAGioiSO -~ ·" "' PASIIADIILES ::~,~~~~~T~11~EAot ·" ·" SAIIOIEGDioiSOAI> ' ' PASIIAIJflt[SfAAAP :~~ ·" ·" SAHDJrw:tSfJIICI-IOfCQS ·" PJtiiiACLCSIIATMCII'IUI'£1'11 .oo SII"IIIIAIIS ·" ·" ·" SAII'GABIIIELCAI'ITOtiPH jj! PISMOIItACil .oo Sll EHTAA"C£ YIJS[tUT£ ·" ·" ·" SAil GABRIEL OMfC .. MIIt POJriTPitOAASBLIIIPICFIS .oo SPIIIHGVJLL£7[tl£ ·" ·" ·" SAIIGABAIELfJQEO[PT
.oo STAIIISLAUSPIII..IEIIHIIUS£ .00 ·" ·" SAti.IACtnTO =~~~S~~~~~~~~ytiAWAL OCP STOCKTOI'IIoiSDAP .00 ·" SAtii'IJCOLASJSLAHO ' .oo ' RCDI-IOIIOCtT1' .oo STOCUOHfiRESTAIIII"' SAI'ITAAtiAfllltSTATJIIII :~~ IIJCIIMOIID ·" suntlllliU AA"GEIISTA 5AI'ITABAIIBAIIA '5AJHT~III'SCOLL£Dt ·" T£HACHAPI ·" SAIITABAABAAAfAAAP ' 5ALltiAS:It .oo TC.IOIIIIAIICHO ·" ·" SAIITAP'MIIIAioiSOAP ' ·" 'nlRECAVAStOJSDI'IPH ' ·" ·" SAIITAI'OI'IICAPI£11 ·" SALltiA!.fAAAP .oo ·" ·" '
"' SALJtiA!.OAI't .oo ' :~~~~ ~=~;~ti:H ·" ::~~~/::'1iAP~ 1'!0 l :~~ ~:~ ~~g~,.u; o•m :gg ·" TRACY PUI"PIIIG PUII'IT ·'' I
!OtUS 3111.1 SF'RlCHI'01'10SUI'IStT TU~LOCII
·"\ :g: ' :~~"c~~~c~~ ·" SAI'IfAAI'ICISCII~OAP
i:DD
·" VUALIA .00 .00
SAil fRANCISCO 140 Cl ·" ·" l.lflLLACt 1111'1£ ·" .JDI.l .. i !USAIIAIII'I!ILLS ·" SAI'IDIIEGORIOOIS£ ·" ·" ·" l.lllSCO ]g 1HOUSAH00!'1115 ·" 5A1'1.1115C .oo ·" loi:STHAV£11 lOPAti!IAPATIIOLSTI\F'CII ·" 5AI'ILUJ501USPOPOLT ·" ICSTPOJHT ·" ~~~~~:~£ ·" ·" I-IOfF'I.'~O HtlOHTS ·" ' SAI'II"'''T£0 ·" ·"
.Dol SAIITAtLIIAAUHIVtAUTT ·" ... TOSEMITt PAliK HtAOQTRS TUSTIIfiRVItltRAIICH SAIITACIIUZ .oo ·" ~~~T~H~LL DAti ·"I SAHTA I"'I~OARITA 2 Slol .oo
·" SAI'ITArw:tiiOARITABDOST ·00 SOUTIICOAST UPLAII0311 ·" ' ·" DIIAIIIAO£
~ALL£'1" CEIITER 2 I'IN( ·" SOttOAO .oo ·" ·" i SPR£CK£L'5H..,...8AIDG£ .oo ... ACTOI'I-£SOOCl'tiF'COI6lf .00 ~~~~~r F'C ISA ' UPIISAIILCANOROF'JLTCA .oo ·" ALISO ttl OAT t!T rt "1"16 .00 ·" WIILIIUTCIIECII2C5£
ALPin£ ·' Vl/'ltti'ITF'IIIt STA fCUO :gr ·" ALTIIOEIIA ·" VJSTA21111£ WAtNUTCIItCII"'t '"~ ·" I.IALtiUTP'n. STAF'C102C J.IATSOIIVtLLtJ.IATtRJ.IOIIJIS :g~ :~~ l-lllOOSJOtF'JRtSTAI AVAUIIPLEASUIItPI£11 ·" l$IIIH£ASI>IIJIIOS ·" l$lJOHTS ·" ' IIAIIIIETT DAM ·" l.tiJTTJtiiCTYIIF'CJOec ·" Bt'AUMOKT PUI"PitiG PLAIIT ·" YOIIIIALII'IOA ·" '5Aif.IIIADUJI'I " BtLAIAfC-IOA ·" IIJGBEAALAII£ ... DIIAJI'IAGC
' :~~~;AST 0£5£AT AIIQJIILA fifO DALTOI'I DAM F'COI2311E
BJDTU.IU"GAOAttfC'IeO£ ·" AI'ITJOCHF'JBA£BOAAOK.
·" 811UDU£TCAI'ITOI'I ~0£LAIITO ·" AI'ITJOCIIPUI"PJIIGPL:I liURIIAIIotVIILL£YPI"PPLT ·" ' :=~~ VIILttY ·" ASH/'tlUI'ITAJII ·" ·" ·" CACHUI"''' LA~£ ·" ·" AUBERRY I IIW ·" ... ·" IAIISTIIH .00
IIAII£A5fi£L01-ISOAP .00 CAt9HIHILLOPIDSS7£ .oo IIEAUI1011Tit .00 .O:SI.IQ CAI"PII ·" IIALCHPOI..IEAHGUS£ ·" ·" CAIIIIDAPARitPltACECOL ·" liEI1TOIIli'ISP£CTIIIH5TA .00 BLACKI..IELLS COAHEII OIW'IIol .oo ' CHATSI-IOA'nlF'C.O!'If" ·" BIG PUlES PMot fC 11311 ·" ·" llUTTOfilliLLOiol ·" ·" ·" CHULAVJSTA .oo BJSIIOPCIItt:ltJHTAII£2"",.1;1 .00 CALAYriiASBIGTR££S ·" ' ·" :t~~loiSBAP ' ·" ... CAI"PPAIIDEE ·" ·" '
CtllR£/'tll'IT PIIKti'IA COL
·" ' Clltii'I"SfCSlD CASTLtADCI(AAOLflll ·" ·" CIIIIOIIA .00 BL'I'TlltfAfiAJAPORT ' CATHE'I"SV'I"IIULLRUifRH ·" ... ... COVIIfA TCI"Pt£ F'C Hl3 II .oo IIOAI!f:GO O[S£111 PAR~ ·' CHEAIIYVALL£YOA11 ·" ·" ·" CR'I"STfli. LA~£ F'C 2B3C li0VLEVAA01111. ' ·" CctALJMGI'I ·" ·" IIIIAiol.EY 2 SW ....
COIICOIIAI'IJIIAJGDIST CULYrACITY CALEXIC02nt ·" =~ ·" CU'I'Ati'ICA ·" DELAnO ... D£5CAft5011AIIGEIISTA ·' CAHTIL
' . 0£LPU£ATOAOAOCAI"P ·" OIIW'ItYF'DfCIDlC ·" ~~'!~~~~~/!APORT " D£1'1.1\fA 'l 1111£ ·" ·" ' OA1'CNITBnAtS£11VOIII ·" :~I OUOLt'I"S
' P£EPCAII'I"DI'ILAIIIIRJIITOIIT
£LECTAAPOI..IEAH9\Jst
~: tLC,.JTAtiOAI't D££P '5Pflll1105 COLLEGE
I ELSJ1'1811£ ·" tLLIOTT CSCIII'IDIDIJ ·" £AGL£1'0UIITAJI'I ' £XCHI£0U£111H:5£AVOIA flLLMIII£JI.IIIIol ·" EL CEI'ITRO 2 SSW ·" F'IOOttTIJW'ttl'HCIIAAtiCH ·" ' F'III'ITIIIIIISH ·" ~~~~::n~ F'ltLD
... fiVEPOIIITS5SSII ·" ·" fOIITAnAIIAJS£11 ' GOI.OADCI(AAI!Cfl .. fULLEATOtl HILLtlltST AV .00 IHBIIALTAII CAM 110 2 ·"
Table 1. Comparison of September Total Precipitation with First 3 Days of October for Central Coast, San Joaquin, South Coast Drainages and Southeast Desert Basins of California.
-36-
;::I :~~
·" .00
:!! .oo
·" ·" ' ·" ·" ·" :/'
·" ·" .00
·' ·" ·" ' ·" ·" ·" ' ·" ·" ·" ·" ·" ·" ·"

"
Western RAgion Technical Memoranda: (Continued)
No. 45/2
No. 45/3
No. 45/4
No. 46
No. 47 No. 48 No. 49 No. 50
No. 51
No. 52 No. 53
No. 54
No. 55
No. 56
No. 57
No. 58
No. 59
No. 60
No. 61
No. 62 No. 63
No. 64 No. 65 No. 66
No. 67
No. 68 No. 69
No. 70
No. 71
No. 72
No. 73
No. 74 No. 75
No. 76
No. 77
No. 78
No. 79 No. 80
No. 81
No. 82
No. 83
No. 84
No. 85
No. 86
No. 87
No. 88
No. 89
No. 90 No. 91
Precipitation Probabilities in the Western Region Associated with Spring 500-mb Map Types. Richard P. Augulis, J~nuary 1970. (Out of print.) <PB-189434) Precipitation Probabilities in the Western Region Associated with Summer 500-mb Map Types. Richard P. Augul is, January 1970. (Out of print.) (PB-189414) Precipitation Probabilities in the Western Region Associated with Fa! I 500-mb Map Types. Richard P. Augulis, January 1970. <Out of prlnt.J <PB-189435) Applications of the Net Radiometer to Short-Range Fog and Stratus Forecasting at Eugene, Oregon. L. Yee and E. Bates, December 1969. CPB-190476) Statistical Analysis as a Floop Routing Tool. Robert J. C. Burnash, December 1969. (PB-188744) Tsunami. Richard P. Augul is, February 1970. (PB-190157) Predicting Precipitation Type. Robert J. C. Burnash and Floyd E. Hug, March 1970. (PB-190962) Statistical Report on Aeroal !ergens (Pol lens and Molds) Fort Huachuca, Arizona, 1969. Wayne S. Johnson, Apri I 1970. (PB-191743) Western Region Sea State and Surf Forecaster's Manual. Gordon C. Shields and Gerald B. Burdwel I, July 1970. (PB-193102) Sacramento Weather Radar Climatology. R. G. Pappas and C. M. Vel ique+te, July 1970. (PB-193347) Experimenter Air Quality Forecasts in the Sacramento Val ley. NormanS. Bene5, August 1970. (Out of print.) (PB-194128) A Refinement of the Vorticity. Field to Delineate Areas of Significant Precipitation. Barry B. Aronovitch, August 1970. Application of the SSARR Model to a Basin Without Discharge Record. Vai I Schermerhorn and Donald W. Kuehl, August 1970. (PB-194394) Areal Coverage of Precipitation in Northwestern.Utah. Philip Williams, Jr., and Werner J. Heck, September 1970. (PB-194389) Preliminary Report on Agricultural Field Burning vs. Atmospheric Visibility in the Wi I lamette Val ley of Oregon. Earl M. Bates and David 0. Chi I cote, September 1970. (PB-194710) Air Pol I uti on by Jet Aircraft at Seattle-Tacoma Airport. Wallace R. Donaldson, October 1970. CCOM-71-00017) Application of P.E. Model Forecast Parameters to Local-Area Forecasting. Leonard W. Snel !man, October 1970. CCOM-71-00016)
NOAA Technical Memoranda NWS
An Aid for Forecasting the Minimum Temperature at Medford, Oregon. Arthur W. Fritz, October 1970. (COM-71-00120) Relationship of Wind Velocity and Stability to so2 Concentrations at Salt Lake City, Utah. Werner J. Heck, January 1971. (COM-71-00232) Forecasting the Catalina Eddy. Arthur L. Eichelberger, February 1971. (COM-71-00223) 700-mb Warm Air Advection as a Forecasting Tool for Montana and Northern Idaho. Norris E. Woerner, February 1971. <COM-71-00349) Wind and Weather Regimes at Great Fa! Is, Montana. Warren B. Price, March 1971. Climate of Sacramento, California. Wi I bur E. Figgins, June 1971. (COM-71-00764) A Preliminary Report on Correlation of ARTCC Radar Echoes and Precipitation. Wilbur K. Hal I, June 1971. CCOM-71-00829) Precipitation Detection Probabi I ities by Los Angeles ARTC Radars. Dennis E. Ronne, July 1971. <Out of print.) (COM-71-00925) A Survey of Marine Weather Requirements. Herbert P. Benner, July 1971. (Out of print.) (COM-71-00889) National Weather Service Support to Soaring Activities. ElI is Burton, August 1971. (Out of print.) (COM-71-00956) Predicting Inversion Depths and Temperature Influences in the Helena Val ley. David E. Olsen, October 1971. (Out ofprint.J (COM-71-01037) Western Region Synoptic Analysis-Problems and Methods. Phi I ip Wi II lams, Jr., February 1972. (COM-72-10433) A Paradox Principle in the Prediction of Precipitation Type. Thomas J. Weitz, February 1972. (Out of print. J (COM-72-1 0432) A Synoptic Climatology for Snowstorms in Northwestern Nevada. Bert L. Nelson, Paul M. Fransiol i, and Clarence M. Sakamoto, February 1972. <Out of print.) <COM-72-10338) Thunderstorms and Hai I Days Probabilities in Nevada. Clarence M. Sakamoto, Apri I 1972. (COM-72-10554) A Study of the Low Level Jet Stream of the San Joaquin Valley. Ronald A. Wi II is and Phi I ip Wi II lams, Jr., May 1972. (COM-72-10707) Monthly Climatological Charts of.the Behavior of Fog and Low Stratus at Los Angeles lnternationl Airport. Donald M. Gales, July 1972. (COM-72-111401 A Study of Radar Echo Distribution in Arizona During July and August. John E. Hales, Jr., July 1972. CCOM-72-11 136) Forecasting Precipitation at Bakersfield, California, Using Pressure Gradient Vectors. Earl T. Riddiough, July 1972. (COM-72-11146) . Climate of Stockton, California. Robert C. Nelson, July 1972. (COM-72-10920) Estimation of Number of Days Above or Below Selected Temperatures. Clarence M. Sakamoto, October 1972. (COM-72-1 0021 J An Aid for Forecasting Summer Maximum Temperatures at Seattle, Washington. Edgar G. Johnson, November 1972. CCOM-73-1 0 150) Flash Flood Forecasting and Warning Program in the Western Region. Phi I ip Wi II iams, Jr., Chester L. Glenn, and Roland L. Raetz, December 1972. (COM-73-10251) A Comparison of Manual· and Semiautomatic Methods of Digitizing Analog Wind Records. Glenn E. Rasch, March 1973. CCOM-73-10669) Southwestern United States Summer Monsoon Source--Gulf of Mexico or Pacific Ocean? John E. Hales, Jr., March 1973. CCOM-73-10769) Range of. Radar Detection Associated with Precipitation Echoes of Given Heights by the WSR-57 at Missoula, Montana. Raymond Granger, Apri I 1973. (COM-73-11030) Conditional Probabilities for Sequences of Wet Days at Phoenix, Arizona. Paul c. Kangieser, June 1973. CCOM-73-11264) A Refinement of the Use of K-Values in ForecasTing ThundersTorms in Washington and Oregon. Robert Y. G. Lee, June 1973. (COM-73-11276) A Surge of Maritime Tropical Air--Gulf of California to the Southwestern United States. Ira S. Brenner, July 1973. Objective Forecast of Precipitation Over the Western Region of the United States. JuliaN. Paegle and Larry P. Kierulff, September 1973. (COM-73-1 1946/3AS) A Thunderstorm "Warm Wake" at Midland, Texas, Richard A. Wood, September 1973. <COM-73-1 1845/AS) Arizona "Eddy" Tornadoes. RobertS. Ingram, October 1973. (COM-74-10465)

NOAA Technical Memoranda NWSWR: (Continued)
No. 92 Smoke Management in the. Wi llamette Valley. Earl M. Bate$, May 1974. (COM-74-11277 /AS)
No. 93 An Operational Evaluation of 50C-mb Type Stratified Regress.ion Equations. Alexander E. MacDonald, June 1974, (COM-74-11407/AS)
No. 94 Conditional Probabi I ity of Visib.i I ity t..ess Than One-Half Mile in Radiation Fog at Fresno, California. John D. Thomas, August 1974. (COM-74-1 1555/AS)
No. 95 Climate of Flagstaff, Arizona. Paul W. Sorenson, August 1974. (COM-74-1 1678/AS)
No. 96 Mc:~p Type Precipitation Probabi I ities for the Western Region. Glenn E. Ra.sch <;~nd A I exander E. MacDona I d, February 1975.
No. 97 .~<:~stern Pacific cut-Off Low of Apri I 21-28, 1974, Wi II iam J .• Alder and George R. Miller.