Embed Size (px)
Citation preview
STUDY OF TRANSPORT AND INTERMOLECULAR INTERACTIONS IN COMPRESSED SUPERCRITICAL FLUIDS
J. Jonas and 0. M. Lamb
Department of Chemistry, School of Chemical Sciences University of Illinois, Urbana, Illinois 61 801
General overview of several studies of transport and intermolecular interactions in compressed supercritical fluids will be presented. strumentation used in these studies will also be emphasized. First, the results of NMR studies of self-diffusion in supercritical ethylene and toluene will be dis- cussed. nique.. Second, the novel NMR technique for the determination of solubility of solids in supercritical fluids will be described. scattering experiments investigating interaction induced spectra will be illustrated on several specific studies of depolarized Rayleigh scattering. The interaction induced spectra offer valuable information about intermolecular interactions in su- percritical fluids.
Introduction
The unique aspects of the in-
These experiments are using the fixed field gradient NMR spin-echo tech-
Third, the promising potential of laser
Research on the properties of supercritical fluids and supercritical fluid mix- tures has become very important in recent years due to the great promise of super- Critical fluid extraction techniques. These techniques and their applications have been reviewed by several authors (1-4). There are many advantages of using super- critical fluid extraction over conventional extraction techniques. Many low vola- tility molecular solids show greatly enhanced solubilities in supercritical dense fluids. Solvent recovery is easily accomplished by manipulating the density, and therefore the solvating power, of the supercritical fluid to precipitate the solid. In addition, although the densities of the supercritical fluids are comparable to liquid densities, the viscosities are generally an order of magnitude smaller, and diffusivities an order of magnitude larger than liquids. A more efficient separation can therefore be achieved.
Unfortunately, there is a lack of fundamental data on transport and relaxation in model fluids at supercritical conditions. Not surprisingly, there is a corres- ponding lack of theoretical models to explain the dynamics of supercritical fluids on a molecular level, particularly at the intermediate densities.
The main purpose of our work is the improvement of molecular level understanding of solute-solvent interactions under supercritical conditions. Unique nuclear mag- netic resonance (5) and laser scattering techniques (6) are employed to obtain new information about dynamics of molecules in supercritical fluids at high pressures.
The main results of several of our studies will be discussed. First, the re-
These experiments are using the fixed field gradient NMR spin- sults of NMR studies of self-diffusion in supercritical ethylene (7 ) and toluene (8) will be discussed. echo technique. Second, the novel NMR technique (9) for the determination of solu- bility of solids in supercritical fluids will be described. Third, the promising potential of laser scattering experiments investigating interaction induced spectra (6) w i l l be illustrated on several specific studies of depolarized Rayleigh scatter- ing.
Experimental
The self-diffusion coefficients in supercritical ethylene were measured using the pulsed NMR spectrometer described elsewhere (101, automated for the measurement of diffusion coefficients by the Hahn spin echo method (11). The measurements were made at the proton resonance frequency of 60 HHz using a.14.2 kC electromagnet.
1
The pressure was generated using the gas compression system described previously (12). A Heise-Bourdon pressure gauge was installed between the compression system and the high pressure vessel to supplement the 30,000 psi pressure transducer. The oxygen scavenger system was bypassed as the amount of oxygen in the ethylene was below the minimum detection level (10 ppm) of the oxygen analyzer (Beckman Instru- ments, Inc.). at the experimental conditions studied. small quantities ( < 1000 ppm) of oxygen were mixed with the ethylene before measurement of the diffusion coefficient. The addi- tion of oxygen brought the T1 values down to 2-3 sec, but should not affect the value of the diffusion coefficient. The shorter T1 values allowed a much shorter measure- ment time.
In order to depress the extremely long T1 values of pure ethylene (13)
The self-diffusion coefficients in supercritical toluene-da were measured at the deuterium resonance frequency of 9.21 MHz, using a 14.1 kG electromagnet with a wide gap (3.8") to accommodate the high pressure vessel. The pulsed NMR spectrometer and receiver system were described in detail elsewhere ( 1 0 ) . The argon pressurized high pressure, high temperature NMR probe (14) was used previously for studies of relaxa- tion (15) and diffusion (16) in compressed supercritical water. It consists of two high pressure vessels: the primary vessel, containing an internal furnace, two ther- mocouples and the RF coil and sample, and the secondary vessel, containing the stain- less steel sample bellows. Quartz sample cells were used rather than ceramic cells, as corrosion is not a problem. The RF coil was constructed by winding 1 4 1/2 turns of 22 gauge nichrome (Chromel'A) wire. The coil was silver soldered to nichrome conductor coaxial high pressure leads. The tuning circuit consisted of a six foot impedance transforming coaxial cable terminated with a tapped-parallel capacitor box with both fixed and variable capacitors totalling 70 pF in series and 10 pF in paral- lel. 60:l after one scan.
The observed signal peak to rms noise ratio in liquid toluene-dg (3OoC) was
Some experimental detail (9) on the experimental NMR setup for the measurement of solubilities of organic solids in supercritical fluids will be given in the sec- tion dealing with Results and Discussion.
The description of equipment and experimental techniques for laser Rayleigh scattering experiments on supercritical fluids at high pressures were given earlier (6,17,18).
Results and Discussion
Self-Diffusion in Compressed Supercritical Ethylene
The main purpose of our work (7) was to provide transport data on dense super- critical ethylene and to analyze the data in terms of currently available theories. Ethylene was chosen for the study for a number of reasons. First, it is one of the most widely used solvents in industry due to its easily accessible critical tempera- ture. its relatively low cost and wide availability. Highly accurate compressibility data are available (19,20,21) in the literature over a wide range of temperature and Pressures. These data are necessary for a complete analysis of the transport data.
%me measurements have been made of self diffusion in pure ethylene and in ethy- lene-sulfur hexafluoride mixtures (22). but these measurements were made very close to the critical temperature and up to pressures of only about 100 bar. lattice relaxation times (T1 ) of ethylene have been measured at temperatures from O°C to 50°C and pressures up to about 2300 bar (13). 40-50 sec for much of the region studied. to this long relaxation time and make both the measurement and analysis of the re- laxation times very difficult. the measurement of the self-diffusion coefficient in supercritical ethylene.
Proton spin-
The relaxation time values were Several relaxation mechanisms contribute
For these reasons. we decided to limit our study to
2
The measurements were made as a runction or density for pressures from 1 - 2000 bar and at 50°, 75O, 100' and 125OC. which density data (19-21) for ethylene and ethylene-C02 are available.
Using the Enskog theory (23) of diffusion of hard spheres corrected for the effects Of correlated motion (24). forces between molecules, but it has proved to be in excellent agreement with experi- ment for the transport coefficients of supercritical dense gases such as argon, kryp- ton, methane and carbon tetrafluoride (25). At densities less than the critical density (p,), the attractive forces between the molecules become important and devia- tions from the theory are observed.
The temperatures chosen correspond to those for
The density dependence of the ethylene self-diffusion coefficients was analyzed
The corrected Enskog theory considers only repulsive
In previous work on supercritical fluids, Jonas et al. (26-28) measured self- diffusion, shear viscosity and angular momentum correlation times in very dense ( p > 2~ ) supercritical fluids of simple polyatonic molecules such as SF^. CF4, CFC13 and C4f8. The goal of the experiments was to investigate the applicability of the rough hard'sphere (RHS) model (29) at very high densities. At these high densities, the harsh, short ranged repulsive forces screen out the long range attractive forces. The RHS model accounts for the coupling between rotational and translational motion and was found to agree well with the experimental data for p > 2pc. lower densities, deviations between the theory and experiment were observed for angu- lar momentum relaxation in CF4 (12) and mixtures of CF4 with argon and neon (30). These deviations were attributed to the effects of attractive forces, causing the RHS model to break down. A theoretical model based on optimized cluster theory (31) was proposed (12) to account for the effects of attractive forces and was found to give a good explanation of the experimental data.
However, at the
Another problem with applying the Enskog theory to explain the ethylene data is that ethylene is not spherical. Attempts to develop a theoretical description of the dynamics in fluids of non-spherical molecules have been made for many years. The model which most closely corresponds to the molecular shape of ethylene is the pro- late spherocylinder. non-spherical molecules in the dilute gas region and applied it to the calculation of the diffusion coefficient of a spherocylinder in this region (33). They showed that diffusion in a spherocylinder fluid is faster than in a fluid composed of spheres of the same volume as the spherocylinder. the values of the self-diffusion coefficient at two different densities in the inter- mediate region for a spherocylinder of length-to-breadth ratio equal to one were cal- culated. More extensive calculations have been made of the equations of state, com- pressibility ratios and virial coefficients for a variety of length-to-breadth ratios for spherocylinders (35-37). description or molecular dynamics data for the density dependence of diffusion in a spherocylinder fluid with the ethylene length-to-breadth ratio, we used hard sphere theory to interpret our data.
Self-Diffusion in Compressed Supercritical TOlUene-dg
Curtiss and Muckenfuss (32) developed a kinetic theory for
In a limited molecular dynamics study (34)
However, due to the lack of any complete theoretical
Our investigation was motivated by the interest in supercritical toluene as a solvent in the extraction of thermally generated coal liquids (38,39). Typically, coal is heated to temperatures between 350' and 45OoC in the presence of a super- critical fluid at a pressure of 100-200 atm. As the large molecular weight compo- nents depolymerize thermally, the resulting hydrogen rich material dissolves in the supercritical solvent and is removed. extraction, as its critical temperature is 319OC, and critical pressure is 41 atm. Recent experimental studies of supercritical fluid extraction in the process of coal liquefication investigate the basic steps involved by varying solvents, pressure and temperatures (40). transport in supercritical toluene-d8. These data should help in the design and in- terpretation of extraction processes using supercritical toluene.
Toluene is a convenient solvent to use for the
The goal of our experiment was to provide fundamental data on
3
We have measured the self-diffusion coefficient in supercritical toluene-d8 for temperatures from 300°C to 450°C (0.97 5 Tr d 1.22) for pressures of 100, 500 and 1000 bar.
Self diffusion coefficients of deuterated toluene were measured. rather than protonated toluene in order to minimize the experimental difficulties associated with very long proton spin lattice relaxation times (T1). termines the length of time between pulse sequences, a long relaxation time leads to prohibitively long measurement times. Previous measurements (41-43) of proton and deuterium relaxation times in liquid toluene have been made as a function of tempera- ture and pressure. The relaxation is due to dipolar interactions in protonated tolu- ene and quadrupolar interactions in toluene-d8. Therefore, the relaxation times can be expected to increase with increasing temperature. However, the quadrupolar re- laxed deuterium T1 values are smaller than the proton T1 values, resulting in a com- paratively shorter measurement time. The self diffusion coefficients of deuterated toluene should not be significantly different from those of protonated toluene at the temperatures of the measurement and will provide an excellent estimate.
Since the value of the T1 de-
Our previous study ( 1 6 ) of self diffusion in compressed supercritical water compared the experimental results to the predictions of the dilute polar gas model of Monchick and Mason (44). The model, using a Stockmayer potential for the evaluation of the collision integrals and a temperature dependent hard sphere diameters, gave a good description of the temperature and pressure dependence of the diffusion. Unfor- tunately, a similar detailed analysis of the self diffusion of supercritical toluene is prevented by the lack of density data at supercritical conditions. Viscosities of toluene from 32OoC to 470°C at constant volumes corresponding to densities from p/pc - 0.5 to 1.8 have been reported (45). However, without PVT data, we cannot calculate the correbponding values of the pressure.
The diffusion data at 100 bar are compared to values obtained using various estimation schemes for the self diffusion coefficient of protonated toluene. No at- tempt was made to estimate coefficients at 500 and 1000 bar. as these correspond to reduced pressures (P, - 11.9 and 24.7) well beyond the range of the approximative methods.
Naphthalene Solubility NMR Measurements in Supercritical Carbon Dioxide
We have completed our study of naphthalene solubilities in supercritical carbon Our unique, in situ NMR method has been used to obtain solubility data dioxide (9).
for this system at 50.0, 55.0 and 58.5OC in the pressure range of 120-500 bar. Al- though this system had been previously investigated (46) we have defined better the solubilities near the upper critical end point of the binary mixture. And finally, we have completed our determination of the three phase solid-liquid-vapor curve of the system.
We have developed our static NMR method for the determination of solid solubili- Using this technique we found our 55Oc solubility data ties in supercritical fluids.
to agree to within 5% of that taken by Paulaitis, et al. (46). with their technique. We have Since proceeded to take data along the previously uninvestigated 50.0 and 58.5OC isotherms. A number of interesting features can be noted. First, by extend- ing the Pressure range to 500 bar we were able to observe the limiting solubilities at these isotherms. an effect not before seen for this system. Secondly, the iso- therms cross at about 160 bar showing the presence of the two critical end points for the naphthalenelcarbon dioxide system. Point Of inflection at about 235 bar.' This behavior shows the close proximity to the upper critical end point (UCEP) temperature and pressure.
And finally, the 58.5OC isotherm shows a
4
The location of the UCEP is quite important to supercritical solubilities, as this critical point gives the maximum temperature at which solid-gas equilibrium exists at all pressures. first time the S2LG phaee line for this mixture. by the UCEP, with this data and the inflection point in the 58.5'C isotherm we can now locate the UCEP at 60.1°C and 235 bar. about 3OC lower than that.reported previously by Paulaltis. et al. (46). However, the in situ nature of our NMR method allows us to precisely measure this UCEP tem- perature since we can determine the S2LC phase line. NMR technique can be greatly advantageous for solubility determinations near the UCEP. now In progress.
Density and Temperature Effects on Collision Induced Scattering in Supercritical C02
We have also developed an NMR method to determine for the Since this phase line is terminated
Our determination of the UCEP location is
These results indicate that our
A more detailed analysis of our experimentally determined solubility data is
In view of the importance of C02 in supercritical fluid extraction, we carried out an experimental study of the pressure and temperature effects on depolarized Rayleigh lineshapes in supercritical C02 (47). Collision induced scattering (6) (CIS) is of considerable interest because it is a fairly unique probe of intermolecu- lar interactions. Depolarized Rayleigh spectra (DRS) of dense atomic fluid and the DRS of spherical molecules have been extensively studied because the entire DRS of these fluids may be attributed to collision induced effects. For linear triatomics the interpretation of the DRS is necessarily more complicated as the time dependence of the polarizability anisotropy of the molecule will contain contributions from both the permanent anisotropy of the molecule, whose time dependence arises from molecular reorientation, and the induced polarizability which arises from multi-body interac- tions. The part arising from the permanent anisotropy may be referred to as the allowed part and the induced component as the non-allowed part. Despite these com- plications, significant progress has been made in the study Of'COlliSiOn induced effects on the DRS of linear triatomics.
The results of our study were as follows. We obtained experimental data on the density dependence of the DRS of carbon dioxide at temperatures both above and below the critical temperature. By using Madden's theories (48-51) and the analogous re- sults from other linear triatomics [CS,, COS1 (17,18) as a guide, we showed the ef- fects of CIS on the DRS of C02. Lastly, we showed how failure to adequately account for CIS in the DRS of linear triatomics can cause ambiguity in the interpretation of the information on molecular reorientation present in the DRS.
Acknowledgments
This work was partially supported by the Department of Energy under Grant DE-FC-82PC50800.
References
1.
2 . 3. 4. 5. 6.
7. 8.
9.
C. A. Irani and E. W. Funk, in "Recent Developments in Separation Sci ence," N. N. Li, Ed., CRC Press, Cleveland, Ohio, 1977, V. 3A, p. 171. D. F. Williams, Chem. Eng. Science 36, 1769 (1981): G. M. Schneider. Angew. Chem. Int. Ed. 2, 716 (1978). C. Brunner and S. Peter, Ger. Chem. Eng. 5, 181 (1982). J. Jonas, Science 216, 1179 (1982). "Pressure - An Essential Experimental Variable in Spectroscopic Studies of Liq- uids," J. Jonas in "Phenomena Induced by Intermolecular Interactions,tt Ed. C. Birnbaum, Proceedings of NATO Advanced Workshop, Bonas, France, 1983; Elsevier, 1984. E. S. Baker, D. R. Brown and J. Jonas, J. Phys. Chem. 88, 5425 (1984). E. S. Baker, D. R . Brown, D. M. Lamb and J. Jonas. J. of Chem. ahd Eng. Data 2, 141 (1985). D. M. Lamb and J. Jonas. Manuscript in preparation.
5
10. 11. 12. 13. 14. 15. 16. 17. 18. 19.
20. 21. 22.
23.
24. 25. 26. 27.
28. 29. 30. 31 * 32. 33. 34. 35. 36. 37. 38. 39.
40. 41. 42. 43. 44. 45.
46. 47. 48. 49. 50; 51;
J. Jonas, Rev. Sci. Instrum. 3, 643 (1972). D. M. Cantor and J. Jonas , J. Mag. Res. E, 157 (1977). R. J. Finney. M. Wolfe and J. Jonas, J. Chem. Phys. 67, 4004 (1977). N. J. Trappenieps and K. 0. P r ins , Physica g, 435 (367). W. J. Lamb and J. Jonas, J. Chem. Phys. 74, 913 (1981 1. D. M. Cantor and J. Jonas, J. Mag. Res. x, 157 (1977). W. J. Lamb, G. A. Hoffman and J. Jonas, Chem. Phys. 74. 6875 (1981 1. E. Hegemann and J. Jonas , J. Phys. Chem. E, 5851 (1984r B. Hegemann and J. Jonas , J. Chem. Phys. E, 2845 (1985). w. F. L. Dick and A. G. M. Hedley, i n "Thermodynamic Func t ions of Cases," F. Din, Ed., Bu t t e rwor ths , London, 1962, V. 2, p. 88. A. Michels and M. Geldermans, Physics 9, 967 (1942). A. S a s s , B. F. Dodge and R. H. Bretton, J. Chem. Eng. Data 12, 158 (1967). H. Hamann, H. R i c h t e r i n g and U. Zucker, Ber. Buns. Phys. C h z . 70. 1084 (1966). S. Chapman and T. G. Cowling, "Mathematical Theory of Non-Uniform Cases," Cambridge Univ. P res s , Cambridge, 1970, 3rd Ed. E. J. Alder, D. M. Gass and T. E. Wainwright, J. Chem. Phys. 53, 3813 (1970). J. H. Dymond. Physica 75, 100 (1974). J. Jonas , Ann. Rev. Phys. Chem. 26, 167 (1975). J. Jonas i n "NATO AS1 on High Pressure Chemistry," H. K e l m . Ed., D. Reidel Publ. Co., Dordrechi , Holland, 1978, p. 65. J. Jonas , Rev. Phys. Chem. Japan 50, 19 (1980). D. Chandler , J. Chem. PhyS. 60, 3500, 3508 (1974). M. Wolfe, E. Arndt and J. Jonas, J. Chem. Phps. 61, 4012 (1977). H. C. Andersen, D. Chandler and J. D. Weeks, Adv. Chem. Phps. 34, 105 (1976). C. F. C u r t l s s and C. Muckenfuss, J. Chem. Phys. g, 1619 ( 1 9 5 7 r C. Muckenfuss and C. F. C u r t i s s , J. Chem. Phys. 29, 1259 (1958). D. W. Rebertus and K. M. Sando, J. Chem. Phys. 67, 2585 (1977). T. Boublik, Adv. Chem. Ser . 204, 173 (1983). P. A. Monson and M. Rigby, M o l . Phys. 2, 1337 (1978). P. A. Monson and M. Rigby, Chem. Phys. Le t t . 58, 122 (1978). J. C. Whitehead and D. E. Williams, J. I n s t . Fuel 5, 397 (1975). N. Berkowitz. "An I n t r o d u c t i o n t o Coal Technology," Academic Press: New York. 1979. W. Worthy, Chem. Eng. N e w s 61, 35 (1983). H. J. Pa rkhur s t , Y. Lee and?. Jonas, J. Chem. Phys. 55. 1368 (1971). D. J. Wilbur and J. Jonas, J. Chem. Phys. 55, 5840 (1971 1. D. J. Wilbur and J. Jonas, J. Chem. Phys. E, 2800 (1975). L. Monchick and E. A. Mason, J. Chem. Phys. 35, 1676 (1961). A. Knappwost. F. Ruhe, M. Rasch t i , H. Wochnowski and U. Ankara, 2. Phys. Chem. (Wiesbaden) 122. 143 (1980). M. E. P a u l a i t i s and M. McHugh, J. Chem. Eng. Data 25, 326 (1980). K. Baker and J. Jonas, Manuscript i n p repa ra t ion . T. I. Cox, M. R. B a t t a g l i a and P. A. Madden, Mol. Phys. 38, 1539 (1979). T. I. Cox and P. A. Madden, Chem. Phys. Le t t . 41 , 188 (1976). P. A. Madden and T. J. Cox, Mol. Phys. 43, 28771981 1. p. A. Madden and D. J. T i ldes l ey . Mol. K y s . 2, 193 (1983).
6
SUPERCRITICAL FLUID SOLVENT PROPERTIES AS A FUNCTION OF TEMPERATURE AND DENSITY MEASURED BY THE SOLVATOCHROMIC METHOD
S. L. Frye, C. R. Yonker, D. R. Kalkwarf , and R. D. Smith
Chemical Methods and K i n e t i c s Sec t ion P a c i f i c Northwest Laboratory
(Operated by B a t t e l l e Memorial I n s t i t u t e ) Richland, Washington 99352
INTRODUCTION
I n the past few years s u p e r c r i t i c a l f l u i d s have a t t r a c t e d i n t e r e s t as sol- vents f o r both a n a l y t i c a l and chemical process a p p l i c a t i o n s . They possess i n t e r - e s t i n g combinations o f so lvent p roper t ies , such as h igh d i f f u s i v i t y and l i q u i d - l i k e s o l v a t i n g p r o p e r t i e s which can be d r a s t i c a l l y changed w i t h moderate changes i n temperature and pressure, making them a t t r a c t i v e f o r a v a r i e t y o f uses.
One hindrance t o the f u r t h e r development o f s u p e r c r i t i c a l f l u i d e x t r a c t i o n o r chromatographic techniques i s t h a t r e l a t i v e l y l i t t l e i s known about t h e dependence of so lvent p r o p e r t i e s o f s u p e r c r i t i c a l f l u i d s , and f l u i d mixtures, upon var ious phys ica l parameters. This study o f the i n t e r a c t i o n s between so lu tes and super- c r i t i c a l f l u i d so lvents was aimed a t extending the understanding o f s u p e r c r i t i c a l f l u i d s as solvents, and t o h e l p i n t h e s e l e c t i o n o f t h e most appropr ia te f l u i d f o r a p a r t i c u l a r a p p l i c a t i o n .
EXPERIMENTAL
Absorpt ion spec t ra were measured on a Cary model 1605 spectrophotometer used i n t h e dual beam mode. The measurements us ing l i q u i d so lvents were made using 1 cm square quar tz c e l l s w i t h a so lvent blank i n t h e re fe rence beam. The vapor and s u p e r c r i t i c a l f l u i d spec t ra were taken versus a i r i n the re fe rence beam.
t h e s u p e r c r i t i c a l f l y i d solvents. Th is c e l l has a c y l i n d r i c a l s t a i n l e s s s t e e l body approximately 1 t h e axis. Two connections f o r 1/16" t u b i n g are present t o a l l o w f o r i n l e t and o u t l e t f low. Each end o f t h e c e l l has a seat f o r a 1/4" diameter 1/4" t h i c k q u a r t z window and i s threaded t o accept a brass nut. p laced on each s i d e o f each window t o p r o v i d e cush ion ing and a gas t i g h t sea l . The o p t i c a l path between the windows was approximately 1/4 . The absorp t ion c e l l was wrapped w i t h heat ing tape, i n s u l a t e d and equipped w i t h a thermocouple. Th is arrangement al lowed temperature r e g u l a t i o n t o w i t h i n f0.5 C.
a t t h e appropr ia te pressure. va lve equipped w i t h a 10 u1 sample loop. A pressure t ransducer was connected t o t h e c e l l o u t l e t t o a l l o w accurate pressure measurement.
The experiments were conducted as f o l l o w s : t h e sample was loaded i n t o sam- p l e loop and the va lve switched t o a l l o w f l u i d from t h e pump t o f l o w t o the c e l l through the loop. A s h u t - o f f valve a t t h e c e l l o u t l e t was opened t o a l l o w so lvent f l o w throuyh the c e l l and t h e absorbance a t a se lec ted wavelength was measured t o d e t e c t the appearance o f t h e sample i n t h e c e l l c a v i t y . Often it was necessary t o
A s p e c i a l l y cons t ruc ted h igh pressure c e l l was used i n t a k i n g the spectra i n
i n diameter which has a 3/16" diameter ho le d r i l l e d along
A 1/4" 0.d. Te f lon O-r ing i s
A Var ian 8500 syr inge pump was used t o supply the s u p e r c r i t i c a l f l u i d so lvent The pump was connected t o t h e c e l l v i a a Rheodyne
7
p a r t i a l l y purge t h e c e l l w i t h a d d i t i o n a l so lvent t o decrease t h e sample concentra- t i o n t o t h e p o i n t t h a t t h e absorbance measurement was on scale. concent ra t ion o f sample had been obtained t h e o u t l e t va lve was c losed and the absorp t ion spectrum was taken under i s o b a r i c and isothermal cond i t ions . scan the pressure o r temperature was increased t o t h e nex t l e v e l and t h e c e l l a l lowed t o e q u i l i b r a t e a t t h e new c o n d i t i o n s be fore the nex t measurement. cases the spectrum o f t h e pure f l u i d was a l s o recorded t o insure t h a t t h e r e was no i n t e r f e r e n c e w i t h t h e spectrum o f t h e so lu te .
RESULTS AND DISCUSSION
When a usable
A f t e r a
I n a l l
Since i n t e r e s t centers on t h e s p e c i f i c i n t e r a c t i o n s between s o l u t e and so l -
One such technique i s
vent, and how those i n t e r a c t i o n s change as the d e n s i t y and composi t ion o f the s u p e r c r i t i c a l f l u i d so lvent are var ied, an exper imental technique i s needed which i s s e n s i t i v e t o t h e cybotac t ic environment o f t h e solute. t h e solvatochromic method, which probes t h e e f f e c t o f so lvent on t h e o p t i c a l absorp t ion spectrum o f t h e s o l u t e molecule (1).
f l u i d s i s p a r t i c u l a r l y e f f i c a c i o u s i n view o f t h e ex tens ive work o f T a f t and coworkers i n measuring t h e solvatochromic s h i f t s o f a l a r g e number o f s o l u t e molecules i n a wide range o f l i q u i d s o l v e n t s (2). They have been successful i n developing a n* s o l u b i l i t y sca le which encompasses a wide range o f s o l u t e types and which can account f o r var iance i n several so lvent p roper t ies , i n c l u d i n g p o l a r i t y , p o l a r i z a b i l i t y , hydrogen bonding a b i l i t y , etc.
Using the solvatochromic method t o study so lvent e f f e c t s o f s u p e r c r i t i c a l
The n* p o l a r i z a b i l i t y sca le was o r i g i n a l l y developed from observa t ions o f solvent e f f e c t s on n->n* and n->n* t r a n s i t i o n s i n the probe molecules. Ry using a s e l e c t group o f so lu tes and so lvents which minimized hydrogen-bonding, T a f t and co-workers were a b l e t o r e l a t e so lvent p o l a r i t y t o r e l a t i v e s h i f t s i n t h e p o s i t i o n o f the absorp t ion maximum. These da ta were p r i m a r i l y dependent on the i n t e r a c t i o n between s o l u t e and so lvent d ipo les . account f o r sol vent-sol vent i n t e r a c t i o n , t h e presence o f induced dipoles, and hydrogen bonding between s o l u t e and s o l v e n t (3).
i t may a f f o r d a convenient bas is f o r t h e comparison o f l i q u i d and s u p e r c r i t i c a l solvents. Fur ther , by de termin ing t h e var ious sca le parameters f o r these f l u i d s i t should be p o s s i b l e t o o b t a i n some i n s i g h t i n t o t h e s p e c i f i c s o l v a t i o n mechan- isms involved, and how those mechanisms change as the so lvent composi t ion and cond i t ions are a l te red .
F u r t h e r ref inements have s ince heen made t o
Since the n* scale i s w e l l e s t a b l i s h e d f o r t h e study o f convent ional so lvents
The compounds 2 - n i t r o a n i s o l e (2NA) and 4-e thy ln i t robenzene (4ENB) were chosen t o be t h e i n i t i a l probe molecules i n our i n i t i a l solvatochromic s tud ies o f super- c r i t i c a l f l u i d solvents. These compounds have been p r e v i o u s l y used by T a f t e t a l . i n t h e s t u d i e s o f convent ional l i q u i d solvents, thus making it e a s i e r t o i n t e g r a t e s u p e r c r i t i c a l f l u i d so lvents i n t o t h e II* so lvent p o l a r i t y scale. advantageous t h a t these compounds are l i q u i d s and have absorp t ion maxima a t con- venient wavelengths i n t h e UV.
The maxima o f the absorp t ion spectrum o f each o f these compounds are s h i f t e d i n wavelength when i n l i q u i d so lvents o f vary ing p o l a r i t i e s (Table 1). The pos i - t i o n of t h e absorp t ion band o f t h e vapor ( e s s e n t i a l l y a so lvent w i t h no p o l a r i t y o r hydrogen bonding a b i l i t y ) i s used as a reference. As the s o l v e n t becomes more p o l a r the absorp t ion maximum i s s h i f t e d t o longer wavelengths ( lower energies). T h i s type of s h i f t i n d i c a t e s t h a t the e x c i t e d e l e c t r o n i c s t a t e i s being s t a b i l i z e d
It i s a l s o
a
I
Vapor (4 ) -1.06 Heptane (4 ) -0.08 Tetrahydrofuran(4) 0.58 Acetoni t r i l e ( 4 ) 0.75 Methanol ( 3 ) 0.60
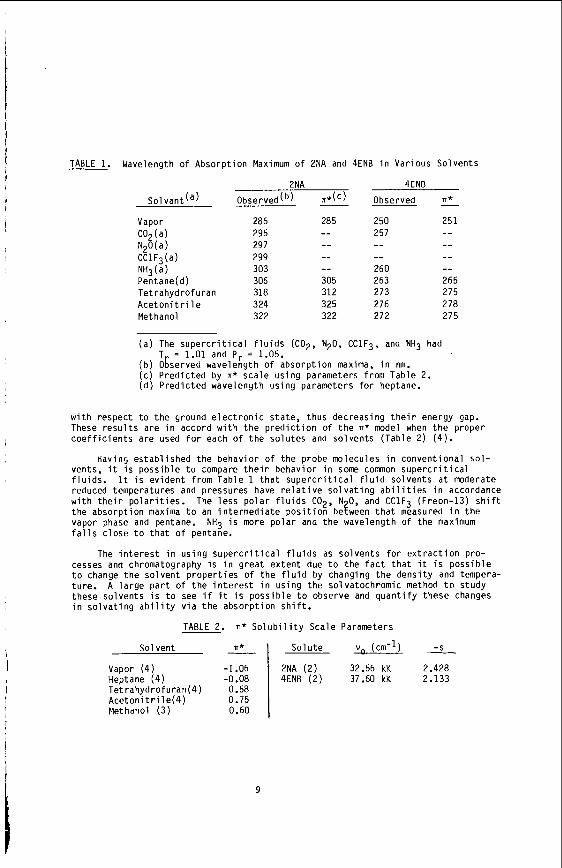
TABLE 1. Wavelength o f Absorpt ion Maximum o f 2NA and 4ENB i n Various Solvents
2NA (2) 32.56 kK 2.428 4ENB ( 2 ) 37.60 kK 2.133
2NA 4ENB
s o l vant (a) Observed(b) n*(') Observed n*
Vapor C02(a) N20(a) C C 1 F3 (a ) NH3(a) Pentane(d) Tet rahydrofuran A c e t o n i t r i l e Methanol
286 295 297 299 303 306 318 3 24 322
285
-- -- 305 312 325 322
250 257
-- 260 263 273 276 272
251
-- -- 265 275 278 27 5
( a ) The s u p e r c r i t i c a l f l u i d s (CO2, N20, CClF3, and NH3 had T = 1.01 and Pr = 1.05.
( b ) Ogserved wavelength o f absorpt ion maxima, i n nm. ( c ) P red ic ted by n* sca le us ing parameters from Table 2. ( d ) P red ic ted wavelength us ing parameters f o r heptane.
w i t h respect t o t h e ground e l e c t r o n i c s ta te, thus decreasing t h e i r energy gap. These r e s u l t s are i n accord w i t h the p r e d i c t i o n o f t h e n* model when t h e proper c o e f f i c i e n t s are used f o r each o f t h e so lu tes and so lvents (Table 2) (4 ) .
Having es tab l i shed the behavior o f t he probe molecules i n convent ional s o l - vents, i t i s poss ib le t o compare t h e i r behavior i n some common s u p e r c r i t i c a l f l u i d s . I t i s ev ident from Table 1 t h a t s u p e r c r i t i c a l f l u i d so lvents a t moderate reduced temperatures and pressures have r e l a t i v e s o l v a t i n g a b i l i t i e s i n accordance w i t h t h e i r p o l a r i t i e s . The l e s s p o l a r f l u i d s C02, N 0, and CC1F-j (Freon-13) s h i f t t he absorpt ion maxima t o an i n te rmed ia te p o s i t i o n becween t h a t measured i n the vapor phase and pentane. f a l l s c lose t o t h a t o f pentane.
cesses and chromatography i s i n g rea t ex ten t due t o the f a c t t h a t i t i s poss ib le t o change t h e so l ven t p r o p e r t i e s o f t h e f l u i d by changing t h e dens i t y and tempera- ture. A l a r g e p a r t o f t h e i n t e r e s t i n us ing t h e solvatochromic method t o s tudy these so lvents i s t o see i f i t i s poss ib le t o observe and q u a n t i f y these changes i n s o l v a t i n g a b i l i t y v i a t h e absorpt ion s h i f t .
NH3 i s more p o l a r and the wavelength o f t he maximum
The i n t e r e s t i n us ing s u p e r c r i t i c a l f l u i d s as so l ven ts f o r e x t r a c t i o n pro-
TABLE 2. TI* S o l u b i l i t y Scale Parameters
Sol vent L I ~ So lu te v, (cm-1) 2
9
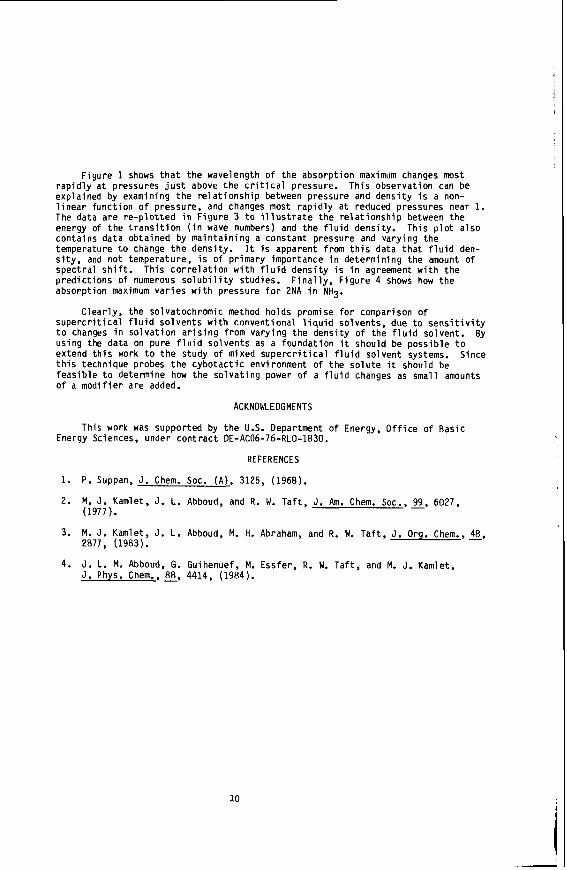
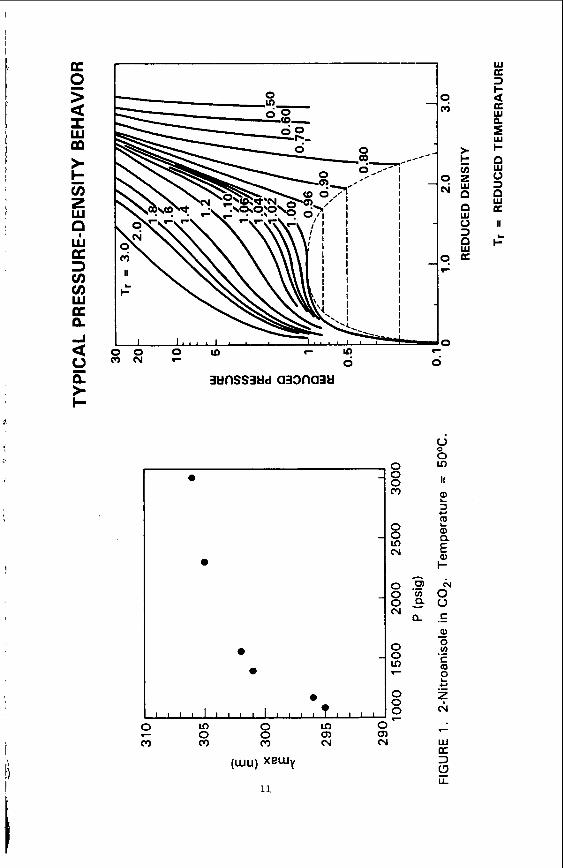
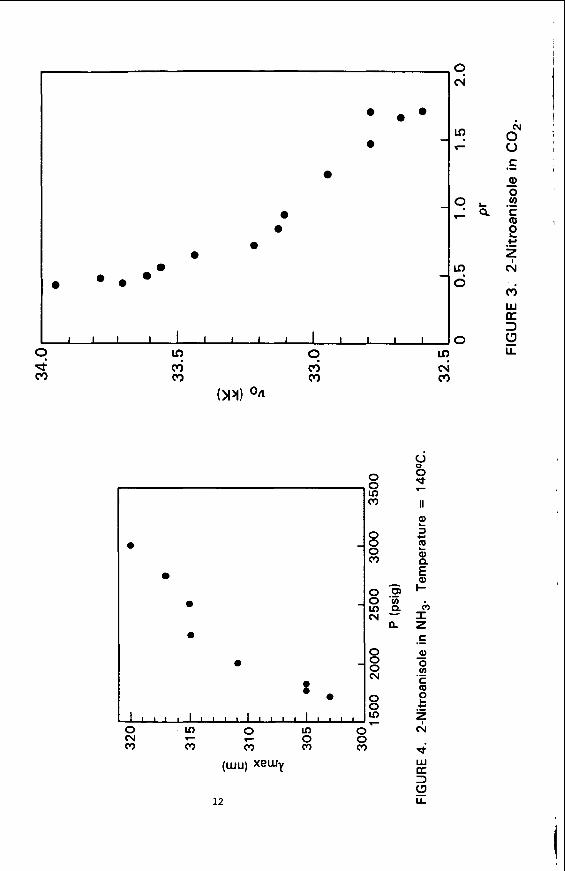
Figure 1 shows t h a t t h e wavelength o f the absorp t ion maximum changes most r a p i d l y a t pressures j u s t above t h e c r i t i c a l pressure. explained by examining t h e r e l a t i o n s h i p between pressure and d e n s i t y i s a non- l i n e a r func t ion o f pressure, and changes most r a p i d l y a t reduced pressures near 1. The data a r e r e - p l o t t e d i n F i g u r e 3 t o i l l u s t r a t e t h e r e l a t i o n s h i p between t h e energy of t h e t r a n s i t i o n ( i n wave numbers) and t h e f l u i d dens i ty . Th is p l o t a l s o contains da ta obtained by m a i n t a i n i n g a cons tan t pressure and vary ing t h e temperature t o change t h e dens i ty . It i s apparent from t h i s data t h a t f l u i d den- s i t y , and no t temperature, i s o f pr imary importance i n de termin ing the amount o f s p e c t r a l s h i f t . p r e d i c t i o n s o f numerous s o l u b i l i t y studies. absorp t ion maximum v a r i e s w i t h pressure f o r 2NA i n NH3.
s u p e r c r i t i c a l f l u i d s o l v e n t s with convent ional l i q u i d so lvents , due t o s e n s i t i v i t y t o changes i n s o l v a t i o n a r i s i n g f rom vary ing t h e d e n s i t y o f t h e f l u i d so lvent . By us ing the data on pure f l u i d so lvents as a foundat ion it should be p o s s i b l e t o extend t h i s work t o t h e study o f mixed s u p e r c r i t i c a l f l u i d so lvent systems. Since t h i s technique probes t h e c y b o t a c t i c environment o f t h e s o l u t e i t should be feas ib le t o determine how t h e s o l v a t i n g power o f a f l u i d changes as small amounts o f a m o d i f i e r are added.
T h i s observa t ion can be
Th is c o r r e l a t i o n w i t h f l u i d d e n s i t y i s i n agreement w i t h t h e F i n a l l y , F i g u r e 4 shows how the
C lear ly , the solvatochromic method ho lds promise f o r comparison o f
ACKNOWLEDGMENTS
This work was supported by t h e U.S. Department o f Energy, O f f i c e o f Bas ic Energy Sciences, under c o n t r a c t DE-AC06-76-RLO-1830.
REFERENCES
1. P. Suppan, J. Chem. SOC. (A), 3125, (1968).
2. M. J. Kamlet, J. L. Abboud, and R. W. Ta f t , J. Am. Chem. SOC., 99, 6027, (1977).
3. M. J . Kamlet, J. L. Abboud, M. H. Abraham, and R. W. T a f t , J. Org. Chem., 48, 2877, (1983).
4. J. L. M. Abboud, G. Guihenuef, M. Essfer, R. W. Ta f t , and M. J. Kamlet, J. Phys. Chem., E, 4414, (1984).
10
0 0 0 v) m e 4 r
,,,,l,,,,l,,,ft,,,,
r " 0
0
0
0
0
0 0 0 m
0
(v
0 0 :: 0 0 In 7
0 0 0 7
UJ a 3 I-
UJ s 3 B
B
n
+ 0 3
K II
c'
@ e 0
0
0 0
0 0
0 0
0 0
I l l I I I 1 I 1 I I I I I
0
9 m m
0
0
0
a E, I z C .-
Mixed S u p e r c r i t i c a l Solvents f o r S e l e c t i v e S o l u b i l i t y Enhancement
J. G. Van Alsten and C. A. Eckert
Department of Chemical Engineering Univers i ty of I l l i n o i s
Urbana, IL 61801
S u p e r c r i t i c a l f l u i d s have genera ted a g r e a t d e a l of i n t e r e s t in t h e chemical engineering community f o r a v a r i e t y of app l i ca t ions , inc luding enhanced oil recovery, r e s i d upgrading, and e x t r a c t i o n (1). This being t h e case, we have been involved in an in t ens ive program designed to understand both q u a l i t a t i v e l y and q u a n t i t a t i v e l y the complex phase behavior i nhe ren t in mixtures of s o l u t e s d isso lved in s u p e r c r i t i c a l so lvents .
Th i s program involves measurements on thermodynamic modeling of s e l e c t e d s u p e r c r i t i c a l systems. Our work f i r s t involved a n a l y s i s of s o l u t e s d i s so lved in pure s u p e r c r i t i c a l f l u i d s t o determine what d i f f e rences , i f any, s o l u t e na tu re had on the s o l u b i l i t y behavior. Our d a t a a n a l y s i s r equ i r e s two p rope r t i e s of t h e so lu t e : f i r s t , i t s s o l u b i l i t y in t h e s e l e c t e d s u p e r c r i t i c a l f l u i d , second, t h e s o l u t e subl imat ion pressure a t system temperature. Combining these two q u a n t i t i e s y i e l d s t h e enhancement f a c t o r
Y . 3 E = L
P sat 2
which is simply a dimensionless s o l u b i l i t y t h a t s c a l e s out t h e s a t u r a t i o n p res su re con t r ibu t ion t o t h e s o l u b i l i t y . Comparison of enhancement f a c t o r s ( n o t s o l u b i l i t i e s ! ) y i e l d s t h e t r u e s o l u t i o n behavior of t h e var ious s o l u t e s used in these s tudies.
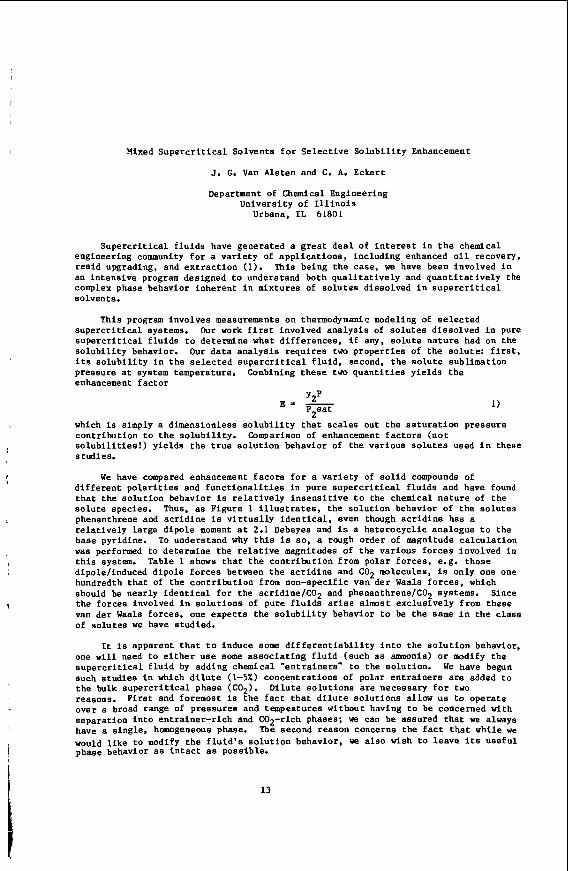
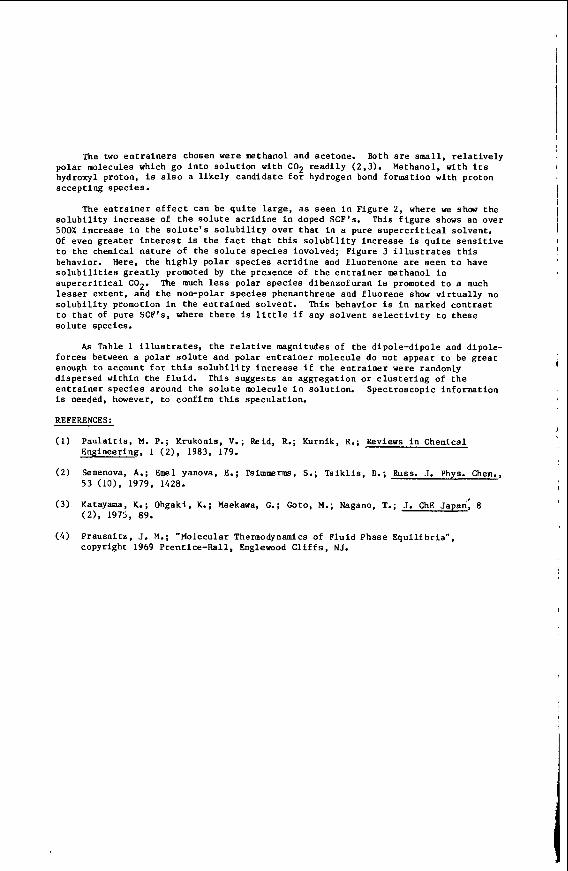
We have compared enhancement f aco r s f o r a v a r i e t y of s o l i d compounds of d i f f e r e n t p o l a r i t i e s and f u n c t i o n a l i t i e s in pure s u p e r c r i t i c a l f l u i d s and have found t h a t t h e s o l u t i o n behavior is r e l a t i v e l y i n s e n s i t i v e t o the chemical n a t u r e of t h e s o l u t e spec ies . Thus, as Figure I i l l u s t r a t e s , t he so lu t ion behavior of t he s o l u t e s phenanthrene and a c r i d i n e is v i r t u a l l y i d e n t i c a l , even though a c r i d i n e has a r e l a t i v e l y l a rge d ipo le moment a t 2.1 Debeyes and is a he t e rocyc l i c analogue t o the base pyridine. To understand why t h i s is so, a rough order of magnitude ca l cu la t ion was performed t o determine the r e l a t i v e magnitudes of t he var ious f o r c e s involved i n t h i s system. Table 1 shows t h a t t h e con t r ibu t ion from po la r fo rces , e.g. those dipole/induced d ipo le fo rces between t h e a c r i d i n e and C02 molecules, i s only one one hundredth t h a t of t he con t r ibu t ion from non-specific van d e r Waals f o r c e s , which should be near ly i d e n t i c a l f o r t he acridine/C02 and phenanthrene/C02 systems. Since the fo rces involved in s o l u t i o n s of pure f l u i d s a r i s e almost exc lus ive ly from these van de r Waals fo rces , one expec ts t h e s o l u b i l i t y behavior t o be t h e same in t h e c l a s s of s o l u t e s we have studied.
It i s apparent t h a t t o induce some d i f f e r e n t i a b i l i t y i n t o t h e s o l u t i o n behavior, one w i l l need t o e i t h e r use some a s s o c i a t i n g f l u i d (such a s ammonia) or modify t h e s u p e r c r i t i c a l f l u i d by adding chemical "en t ra iners" t o the so lu t ion . We have begun such s tud ie s in which d i l u t e (1-5%) concent ra t ions of po lar e n t r a i n e r s a r e added t o t h e bulk s u p e r c r i t i c a l phase (C02). reasons. F i r s t and foremost is t h e f a c t t h a t d i l u t e s o l u t i o n s allow us t o opera te over a broad range of p re s su res and tempeatures wi thout having t o be concerned wi th sepa ra t ion i n t o en t r a ine r - r i ch and C02-rich phases; we can be assured t h a t we always have a s ing le , homogeneous phase. The second reason concerns the fact t h a t while we would l i k e t o modify t h e f l u i d ' s s o l u t i o n behavior, we a l s o wish t o l eave i t s use fu l phase behavior as i n t a c t as poss ib le .
D i lu t e s o l u t i o n s are necessary f o r two
13
The two e n t r a i n e r s chosen were methanol and acetone. Both a r e small, r e l a t i v e l y polar molecules which g o i n t o s o l u t i o n wi th CO2 r e a d i l y (2.3). hydroxyl proton, is a l s o a l i k e l y candida te f o r hydrogen bond formation wi th proton accept ing spec ies .
Methanol, with i t s
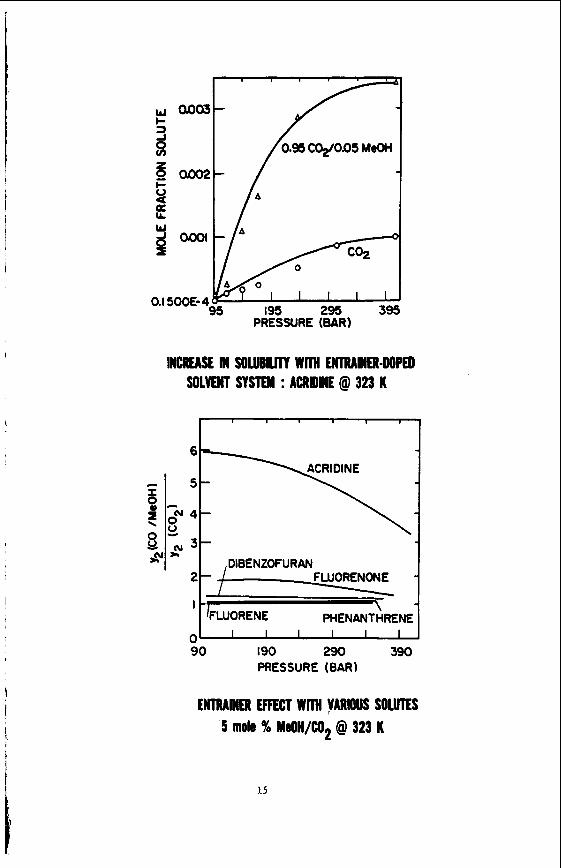
The e n t r a i n e r e f f e c t can be q u i t e l a r g e , as s e e n i n F igure 2 , where we show t h e s o l u b i l i t y i n c r e a s e of t h e s o l u t e a c r i d i n e i n doped SCP's. This f i g u r e shows an over 500% i n c r e a s e in t h e s o l u t e ' s s o l u b i l i t y over t h a t i n a pure s u p e r c r i t i c a l solvent. Of even g r e a t e r i n t e r e s t i s t h e f a c t t h a t t h i s s o l u b i l i t y i n c r e a s e i s q u i t e s e n s i t i v e t o t h e chemical n a t u r e of t h e s o l u t e s p e c i e s involved; Figure 3 i l l u s t r a t e s t h i s behavior. Here, t h e h i g h l y polar spec ies a c r i d i n e and fluorenone are s e e n t o have s o l u b i l i t i e s g r e a t l y promoted by t h e presence of t h e e n t r a i n e r methanol i n s u p e r c r i t i c a l COz. The much less polar spec ies dibenzofuran i s promoted t o a much l e s s e r ex ten t , and t h e non-polar s p e c i e s phenanthrene and f l u o r e n e show v i r t u a l l y no s o l u b i l i t y promotion in the e n t r a i n e d so lvent . This behavior i s i n marked c o n t r a s t t o t h a t of pure SCF's, where t h e r e i s l i t t l e i f any s o l v e n t s e l e c t i v i t y t o t h e s e s o l u t e species.
As Table 1 i l l u s t r a t e s , t h e r e l a t i v e magnitudes of t h e d ipole-d ipole and dipole- f o r c e s between a polar s o l u t e and polar e n t r a i n e r molecule do not appear t o be g r e a t enough t o account for th i s s o l u b i l i t y i n c r e a s e i f t h e e n t r a i n e r were randomly d ispersed wi th in t h e f l u i d . e n t r a i n e r s p e c i e s around the s o l u t e molecule in so lu t ion . Spec t roscopic information is needed, however, t o confirm t h i s speculation.
This sugges ts an aggrega t ion o r c l u s t e r i n g of t h e
REFERENCES:
P a u l a i t i s , M. P.; Krukonis, V.; Reid, R.; Kurnik, R.; Reviews i n Chemical Engineering, 1 ( 2 ) , 1983, 179.
Semenova, A.; Emel yanova, E.; Tsirnmerms, S . ; T s i k l i s , D.; Russ. J. Phys. Chem., 53 (101, 1979, 1428.
I Katayama, K.; Ohgaki, K.; Maekawa, G.; Goto, M.; Nagano, T.; J. ChE Japan, 8 (2), 1975, 89.
Prausni tz , J. M.; "Molecular Thermodynamics of F lu id Phase E q u i l i b r i a " , copyright 1969 Prent ice-Hal l , Englewood C l i f f s , NJ.
1
i
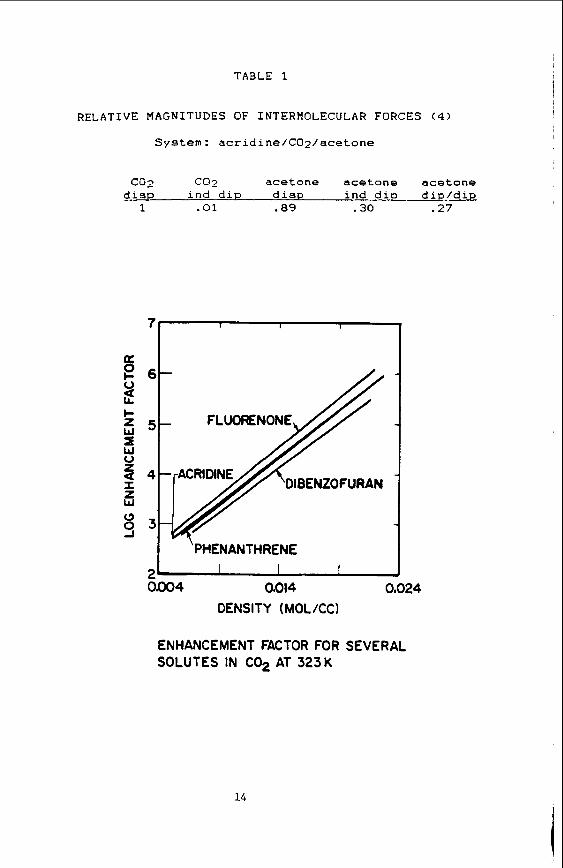
TABLE 1
‘PHENANTHRENE I I I
RELATIVE MAGNITUDES OF INTERMOLECULAR FORCES ( 4 )
System: acridine/COz/acetone
co2 coz acetone acetone acetone disp ind diP disp ind dip dip/*
1 . a i .89 .30 .27
ENHANCEMENT FACTOR FOR SEVERAL SOLUTES IN C02 AT 323K
14
w -- c
PRESSURE (BAR)
.
INCREASE IN SOUBUTT Wm UITRAMER-DOPED SOLVENT SYSTEM : ACRQME @ 323 K
/FLUORENE WEN ANT~RENE I I I I I I
I ,DIBENZOFURAN I FLUORENONE
ENTRAINER EFFECT WITH v m u s soims 5 mole % M80H/W2 @ 323 K
15
ELECTROCHEMISTRY I N SUBCRITICAL AND SWERCRITICAL WATER W. M. Flarsheim, A. C . McDonald, A. J . Bard. K. P. Johnston, Departments of Chemical Engineering and Chemistry, The Universi ty of Texas, Austin, TX 78712
Introduct ion
S u p e r c r i t i c a l f l u i d s have received s i g n i f i c a n t i n t e r e s t r e c e n t l y because of t h e i r unique so lvent proper t ies . Gases such a s carbon dioxide and ethylene have been used t o perform a number of d i f f i c u l t separa t ions . example t h e d e c a f f e i n a t i o n o f coffee, have been commercialized (1).
Some of these processes , f o r
Water has not been s tudied extensively f o r use as a s u p e r c r i t i c a l so lvent because of t h e high temperature and pressure of i ts cr i t ical point (Tc = 374OC, Pc = 221 bar ) . W e a r e performing eLectrochemica1 research i n s u p e r c r i t i c a l water t o t a k e advantage of i ts unusual proper t ies . The a r e a s of s tudy include t h e e f fec t of temperature on the e lectrochemical p o t e n t i a l of ions in water and t h e e lec t ro- chemical r e a c t i o n of organic compounds in aqueous so lu t ion .
The chemical behavior of an ion in water is of course inf luenced by water molecules t h a t a r e or ien ted around it. A change in t h e s t r u c t u r e of t h e so lva t ion sphere around a n ion w i l l a f f e c t the electrochemical p o t e n t i a l of t h e ion. Such a change in s t r u c t u r e c a n be achieved by hea t ing water t o t h e c r i t i c a l region where t h e i n t e r n a l s t r u c t u r e of hydrogen bonding is very s e n s i t i v e t o temperature changes. In t h i s region, t h e electrochemical p o t e n t i a l can a l s o be a s t rong func t ion of tem- perature . A s tudy of these p o t e n t i a l s h i f t s should provide i n s i g h t i n t o t h e s t ruc- t u r e of so lva t ion spheres in water and of water i t s e l f .
At high temperature , t h e breakdown of hydrogen bonding in water g r e a t l y reduces t h e d i e l e c t r i c cons tan t . A t the c r i t i c a l po in t , t h e d i e l e c t r i c constant of water is 3, approximately t h e same as that of benzene. misc ib le with non-polar organics a t high temperatures. is poss ib le t o r e a c t organics e lectrochemical ly without using t h e more tox ic and expensive organic so lvents t h a t are necessary f o r d i s s o l u t i o n a t 25'C. compounds w i l l decompose in high temperature water , o thers , which are not a c t i v e a t normal condi t ions, w i l l become subjec t t o e lectrochemical a t t a c k a t h igh temperature.
Not s u r p r i s i n g l y , water becomes In t h e misc ib le region, i t
While many
Though no d e f i n i t e pred ic t ions can be made, s u p e r c r i t i c a l water appears to be A c e l l has been designed which w i l l opera te a t super- a promising a r e a f o r s tudy .
c r i t i c a l condi t ions , and preliminary da tahave been obtained f o r e l e c t r o l y t e solut ions.
Experimental
The high temperature s e c t i o n of t h e electrochemical c e l l is made of an aluminum oxide ceramic. energy of t h e system is very s m a l l . s ta t ionary i n t h e ce l l , but a high pressure pump al lows t h e c e l l t o be f lushed with f r e s h so lu t ion . The platinum working and s i l v e r reference e lec t rodes are in c l o s e proximity in the heated zone. The working e l e c t r o d e a rea is approximately 3 x cm2. The platinum counter e l e c t r o d e is in a cool region downstream from t h e heated zone. s e a l s a r e made of t e f l o n , and a r e i n unheated p a r t s of the c e l l .
The volume of heated s o l u t i o n is less than 1 cm3, so t h e s tored A l l measurements w e r e made with t h e s o l u t i o n
This prevents reac t ion products from contaminating t h e e l e c t r o l y t e .
A l l
Resul t 8
Cyclic voltammetry has been car r ied out i n so lu t ions of 0.05M H3P04, 0.2M NaHS04, and 0 . 2 M K C . 1 . The scan rate w a s 200 mV/sec.
The pressure w a s held a t 240 b a r while t h e temperature was var ied.
In 0 . 0 5 M H3P04, the p o t e n t i a l d i f fe rence between t h e evolu t ion of hydrogen and
16
oxygen declined from 1.7 V at 25OC to 1.0 V at 375OC. solution resistance increased dramatically indicating the dissociation of the acid was declining.
At high temperature, the
In 0.24 NaHS04, the potential difference between the evolution of hydrogen and oxygen declined from 2.0 V at 25OC to 1.3 V at 375'C.
In 0.W KC1, the potential difference between the evolution of hydrogen and oxy- gen declined from 1.8 V at 25OC to 1.6 V at 300'C. the chloride/chlorine couple and oxygen declined from 0.2 V to <O.lV over this same temperature range.
Sunrmary
The potential difference between
The data presented here represent the first steps into a new area of electrochem- istry. Much more data will be necessary before any major conclusions can be drawn. Even so. these results do show that electrochemistry can be carried out under near critical and supercritical conditions, and that there are significant changes in the behavior of ions in solution.
References
1. M. E. Paulaitis, J . M. L. Penninger, P. Davidson, and R. D. Gray, Chemical Engineering at Supercritical Fluid Conditions, Ann Arbor Science (1983).
17
ORGANIC CHEHISTRY IN SOPERCRITICAL FLUID SOLVENTS: PHOTOISOIlERIZATION OF trans-STILBENE
Tetsuo Aida and Thomas G. Squires
Applied Organic Chemistry Energy & Minerals Resources Research Institute
Iowa State University Ames, Iowa 50011
INTRODUCTION
The unusual solvent properties of supercritical fluids (SCF's) have been known for over a century (1). Just above the critical temperature, forces of molecular attraction are balanced by kinetic energy: and fluid properties, including solvent power, exhibit a substantial pressure dependence. Many complex organic materials are soluble at moderate pressures (80 to 100 atmospheres); and SCF solvent power increases dramatically when the pressure is increased to 300 atmospheres. The pressure responsive range of solvent properties thus attainable has provided the basis for investigating the fundamental nature of molecular interactions and, more recently, for exploitation of supercritical fluids in areas of applied research (2,3).
In the latter activity, supercritical fluids have been utilized extensively in the thermochemical solubilization of coal ( 4 ) , f o r selective extraction of naturally occurring materials (5,6), and in various separation techniques including destraction (7) and supercrit- ical fluid chromatography (8,9). The physicochemical principles underlying these applications have also been investigated (10). In view of the high level interest in manipulating complex organic mixtures with supercritical fluids, it is surprising that these fluids have seen little use as solvents for organic reactions (11,12). The pivotal role of solvent properties in controlling the course and rate of chemical reactions is well established (13): and, thus, the same
. kind of pressure responsive solvent-solute interactions which control extractions and separations in SCF's can be expected to direct chem- ical pathways and influence reaction rates.
Moreover, much of our understanding of the nature of chemical reactions has been derived by observing the responses of these pro- cesses to changes in solvent properties. While investigations of this type have been highly productive, interpretation of the results has often been blurred by uncertainties inherent in the experimental approach. Heretofore, liquid solvents have been used in these invest- igations, and solvent properties have been changed by adjusting the solvent composition. Unfortunately, no quantitative relationship between bulk solvent properties and chemical phenomena has emerged, presumably due to selective solvent-solute interactions which result in differences between bulk solvent composition and microscopic sol- vent Composition (13).
In contrast to liquid solvents, the properties of a single SCF solvent can be altered over a wide range through modest manipulations Of pressure andlor temperature. Thus, SCF's provide an opportunity to investigate the effects of solvent properties on chemical reactions without changing the solvent composition. Experimentally, in order to
18 i
induce the greatest response of solvent properties to changes in Pressure, it is generally best to operate at a constant reduced temp- erature, T between 1.0 and 1.1 and to vary the reduced pressure, P R ~ between 1.v and 3.0 (14).
For several reasons, we chose carbon dioxide for these initial investigations. In the first place, the properties of supercritical carbon dioxide are well known, and the solubility of a relatively large number of organic materials have been examined in this medium. Secondly, although carbon dioxide is interactive with solute mole- cules, it is generally unreactive. Finally, the supercritical working range (1.0 < TR < l.l)! 31.5 to 6OoC, is experimentally convenient; and many organic reactions have been extensively investigated in this temperature range.
Investigations of organic reactions in supercritical solvents are subject to several constraints, one attributable to supercritical fluid properties and others imposed for interpretive and experimental simplicity. Because supercritical fluid properties are affected by changes in temperature, a reaction should be selected which does not require heat for initiation and is not highly exothermic. Secondly, for experimental simplicity and clarity of interpretation, a clean, well understood reaction should be chosen; and one should expect an experimentally observable response to changes in pressure. Finally, a unimolecular reaction which produces a single product obviates the complication of controlling the concentrations of two reactants and simplifies product analysis. The photoisomerization of trans-stilbene meets these requirements.
J The photoisomerization of stilbene is one of the most extensively studied and best understood photoreactions (15). Solvent effects have been thoroughly investigated for both the direct and photosensitized
effects to solvent viscosity (16). Increased viscosity inhibits direct photoisomerization of the & isomer, but facilitates that of trans-stilbene. As a result, the cisltrans ratio of the photostation- ary state increases with i n c r e a s i n F o K t viscosity. The wide range of viscosities which are attainable by pressure manipulation of super- critical carbon dioxide provides an excellent opportunity to probe the effect of viscostiy on stilbene photochemistry in the same solvent.
1 isomerizations, and a model has been developed which attributes these
EXPERIHENTAL
Construction of the SCF photochemical reactor and experimental techniques are described elsewhere (12). Photoisomerizations were carried out using a 450 watt Hanovia medium pressure mercury source, and each reaction was followed to the photostationary state by gas chromatographic determination of the cisltrans ratios.
RESULTS h DISCUSSION
A widely used method for assessing supercritical fluid phenomena consists of comparing physical and chemical behavior above the crit- ical point with corresponding behavior in the subcritical liquid. Because this approach (unrealistically) seeks to observe discontinuous behavior between states, the results of such experiments are often ambiguous. In the present study, we have compared the photoisomeriza- tion of --stilbene in subcritical and supercritical COz; and, as a
19
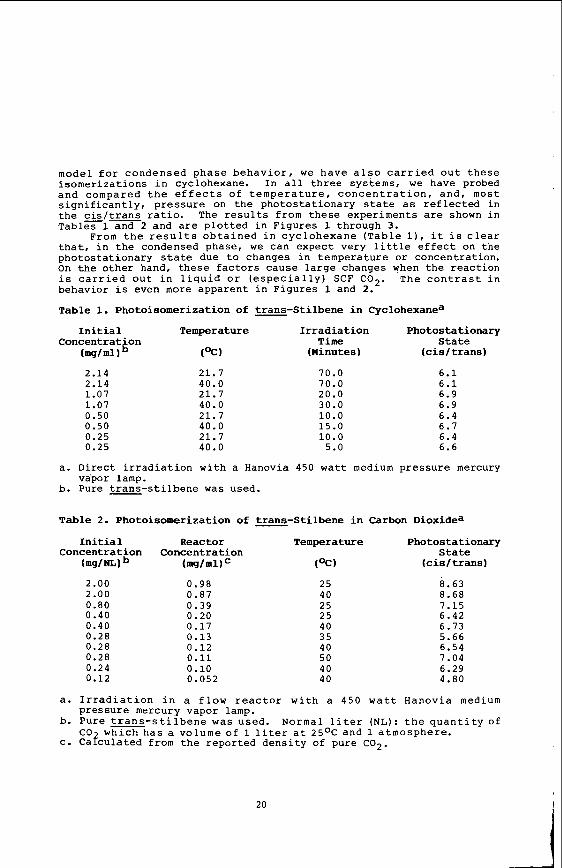
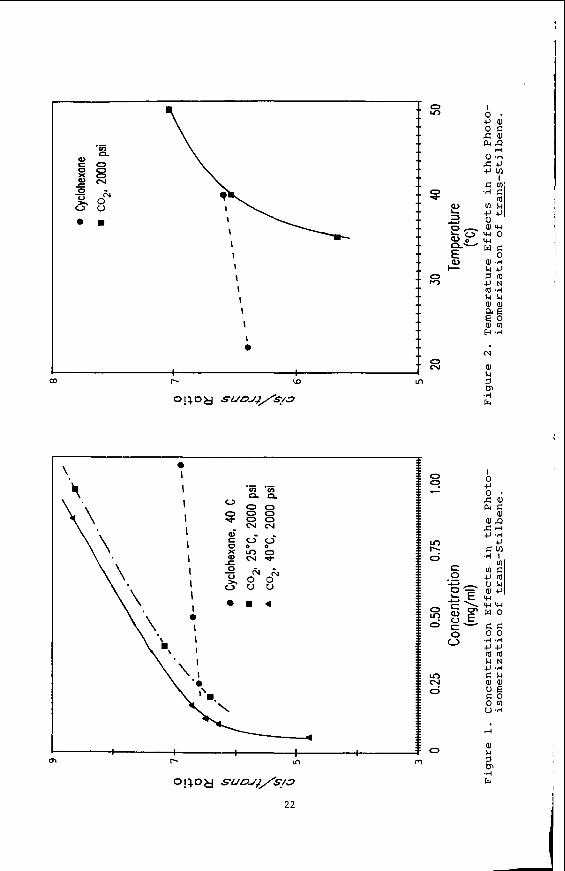
model for condensed phase behavior, we have also carried out these isomerizations in cyclohexane. In all three systems, we have probed and compared the effects of temperature, concentration, and, most significantly, pressure on the photostationary state as reflected in the cisltrans ratio. The results from these experiments are shown in Tablesland2 and are plotted in Figures 1 through 3 .
From the results obtained in cyclohexane (Table l), it is clear that, in the condensed phase, we can expect very little effect on the photostationary state due to changes in temperature or concentration. On the other hand, these factors cause large changes when the reaction is carried out in liquid or (especially) SCF C02. The contrast in behavior is even more apparent in Figures 1 and 2 .
Table 1. Photoisomerization of trans-Stilbene in Cyclohexanea
Concentration Time State Initial Temperature Irradiation Photostationary
(mg/ml I (OC) (Minutes) (cis/ trans)
2.14 2.14 1.07 1.07 0.50 0.50 0.25 0.25
21.7 70.0 40.0 70.0 21.7 20.0 40.0 30.0 21.7 10.0 40.0 15.0 21.7 10.0 40.0 5.0
6.1 6.1 6.9 6.9 6.4 6.7 6.4 6.6
a. Direct irradiation with a Hanovia 450 watt medium pressure mercury
b. Pure trans-stilbene was used. vapor lamp.
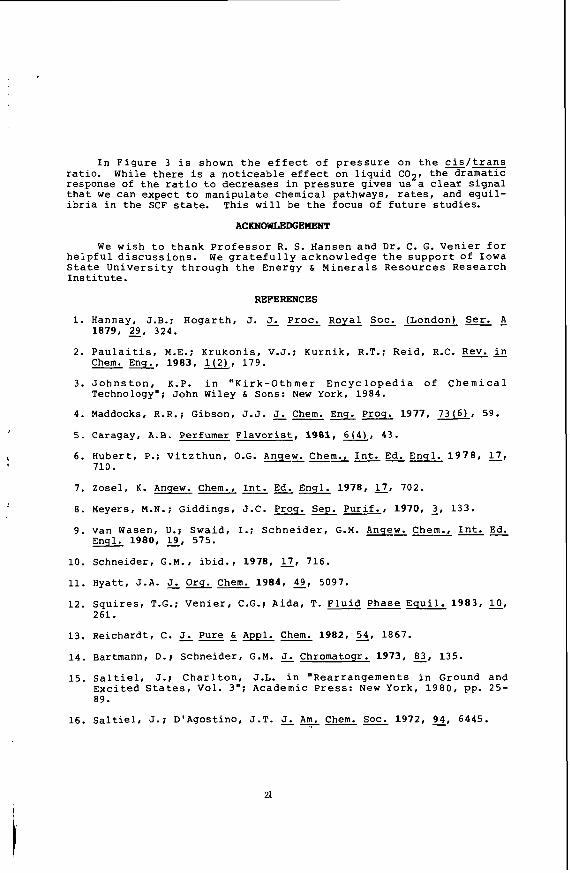
Table 2. Photoisomerization of trans-Stilbene in Carbon Dioxidea
Initial Concentration
(mg/m)
2.00 2.00 0.80 0.40 0.40 0.28 0.28 0.28 0.24 0.12
Reactor Concentration
(ms/ml)c
0.98 0.87 0.39 0.20 0.17 0.13 0.12 0.11 0.10 0.052
Temperature
(OC 1
25 40 25 25 40 35 40 50 40 40
Photostationary State
(cis/ trans)
8.63 8.68 7.15 6.42 6.73 5.66 6.54 7.04 6.29 4.80
a. Irradiation in a flow reactor with a 450 watt Hanovia medium
b. Pure trans-stilbene was used. Normal liter (NL): the quantity of which has a volume of 1 liter at 25OC and 1 atmosphere.
C. Cafculated from the reported density of pure C02.
pressure mercury vapor lamp.
CO
20 1
i
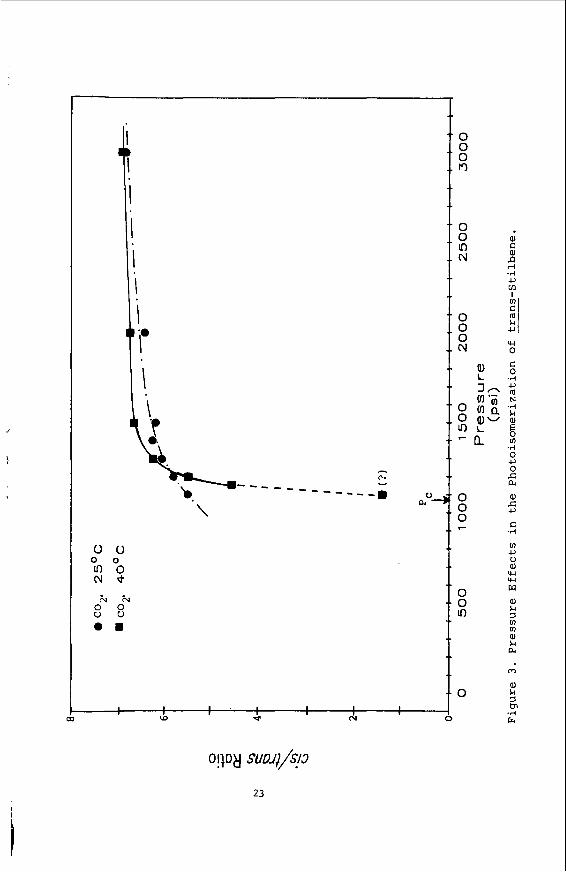
I n F i g u r e 3 i s shown t h e e f f e c t of p r e s s u r e on t h e c i s / t r a n s r a t i o . While t h e r e i s a n o t i c e a b l e e f f e c t on l i q u i d C02, t h e dramat ic response of t h e r a t i o t o decreases i n p r e s s u r e g i v e s us a clear s i g n a l t h a t w e can expec t t o manipulate chemical pathways, r a t e s , and e q u i l - i b r i a i n t h e SCF state. This w i l l be t h e focus of f u t u r e s tud ies .
ACKNOWLEDGEIIKNT
W e w i s h t o t h a n k P r o f e s s o r R. S. Hansen and D r . C. G. V e n i e r f o r h e l p f u l d i s c u s s i o n s . W e g r a t e f u l l y acknowledge t h e s u p p o r t o f Iowa S t a t e U n i v e r s i t y t h r o u g h t h e Energy & Minera ls R e s o u r c e s R e s e a r c h I n s t i t u t e .
REFERENCES
1. Hannay, J.B.; Hogar th , J. J. Proc. Royal SOC. (London) S e r . A
2. P a u l a i t i s , M.E.; Krukonis , V.J.; Kurn ik , R.T.; R e i d , R.C. Rev. i n
1879, E , 324.
Chem. Eng., 1 9 8 3 , 10, 179.
Technology"; John Wiley & Sons: New York, 1984. 3 . J o h n s t o n , K.P. i n " K i r k - O t h m e r E n c y c l o p e d i a o f C h e m i c a l
4. Maddocks, R.R.; Gibson, J.J. J. Chem. Eng. Prog. 1977, 7 3 ( 6 ) , 5 9 .
5 . Caragay, A.B. Perfumer F l a v o r i s t , 1981, 60, 43.
6 . Huber t , P.; V i t z t h u n , O.G. Angew. Chem., I n t . Ed. Engl. 1 9 7 8 , 17,
7. Zosel, K. Angew. Chem., I n t . Ed. Engl. 1 9 7 8 , 11, 702.
8 . Meyers, M.N.; Giddings, J . C . Prog. Sep. Pur i f . , 1 9 7 0 , 3 , 1 3 3 .
710.
9. van Wasen, U.; Swaid , I.; S c h n e i d e r , G.M. Angew. Chem., I n t . Ed. Engl. 1980, 19, 575.
10. Schneider , G.M., i b i d . , 1978, 17, 716.
11. Hyat t , J . A . J. Org. Chem. 1 9 8 4 , 9, 5097.
12 . S q u i r e s , T.G.; V e n i e r , C.G.; Aida , T. F l u i d Phase E q u i l . 1 9 8 3 , E,
13. Reichardt , C. J. Pure & Appl. Chem. 1982, 54, 1867.
14 . Bartmann, D.; Schneider , G.M. J- Chromatogr. 1 9 7 3 , 83, 135.
15. S a l t i e l , J.; C h a r l t o n , J.L. i n "Rear rangements i n Ground and E x c i t e d S t a t e s , V o l . 3"; Academic P r e s s : N e w York, 1 9 8 0 , pp. 25- 89.
261.
16. S a l t i e l , J.; D'Agostino, J . T . J. Am. Chem. SOC. 1 9 7 2 , 94, 6445.
e .
'a n. aY c o 8 % - E & as L:
e .
I I I
\ I I I
I I 0
i T oo r- In
I t I I
\ I I I
I I 0
L t oo r- In
I ', e I
0 In
0 rc)
0 cv
2 3 O h 4
E 2
0 m
0. - -. - - - - - - - - - - - 1. \
0 0 0 0 100 N t
i u h 0 0 v u e .
I I W I -r I 0
EFFECTS OF SWERCRITICAL SOLVENTS ON THE RATES @F HOMOGENEOUS CHEMICAL REACTIONS
K. P Johnston and S. Kim Department of Chemical Engineering
W d v e r s i t y of Texas, Austin. TX 78712
Discussion
A number of recent reviews descr ibe s u p e r c r i t i c a l f l u i d ex t rac t ion (1,2,3), however, t h e l i t e r a t u r e conta ins r e l a t i v e l y few examples where s u p e r c r i t i c a l f l u i d so lvents have been used t o modify or c o n t r o l r e a c t i o n rate constants . Liquid phase reac t ions have been s tudied over wide pressure ranges, e.g. 1-10 kbar, t o determine a c t i v a t i o n volumes, Le. t h e pressure d e r i v a t i v e of t h e rate constant . These s tudies e s s e n t i a l l y ignore the h ighly compressible near s u p e r c r i t i c a l region where a c t i v a t i o n volumes can become i n f i n i t e , e i t h e r p o s i t i v e l y o r negat ively.
It is i r o n i c t h a t t h e l a r g e growth i n SF e x t r a c t i o n a t t h e Max Planck I n s t i t u t e i n Germany i n t h e 1960's w a s t h e r e s u l t of a serendip i tous discovery of the solvent power of s u p e r c r i t i c a l e thylene during the "Aufbau" reac t ion of triethylaluminum wi th ethylene (4). The l i t e r a t u r e contains few examples where s u p e r c r i t i c a l f l u i d s have been used as a medium to modify o r c o n t r o l reac t ion rate cons tan ts (5 ,6 ,7) .
Simmons and Mason (7) observed an abrupt decrease i n AvT near t h e c r i t i c a l con- d i t i o n s f o r t h e c y c l i c d imer iza t ion of C2F3C1. It i s due t o t h e l a r g e negat ive par- tial molar volume o f t h e dimer i n t h e t r a n s i t i o n state. A t 120°C, t h e rate constant doubled f o r a pressure increase from 43 t o 53 bar . volumes a s low aa -500 cc/mol f o r t h e Diels-Alder cycloaddi t ion of isoprene and maleic anhydride i n COz. severa l bar. t r a n s i t i o n state, which is on t h e order of 3-7 Debye f o r o ther d ienes with maleic anhydride (8 ) .
so lvents on r e a c t i o n rate cons tan ts . I n the near cr i t ical region, a l l of t h e densi ty dependent v a r i a b l e s such as t h e d i e l e c t r i c cons tan t , r e f r a c t i v e index, fugaci ty coef- f i c i e n t . and s o l u b i l i t y parameter are extremely s t rong func t ions of temperature and Pressure. t r a c t i o n , could a l s o be explo i ted i n r e a c t i o n processes. could be changed orders of magnitude using modest changes i n t h e temperature and Pressure in t h e c r i t i c a l region. A W-vis ib le spectroscopic technique has been appl ied .to s u p e r c r i t i c a l f l u i d s f o r the f i r s t time t o determine the solvent po lar i ty a s a funct ion o f temperature and pressure. chromism, i.e., s h i f t s i n t h e absorpt ion wavelength of i n d i c a t o r dyes caused by the solvent . a r e used commonly t o c o r r e l a t e and t o pred ic t r a t e cons tan ts f o r l i q u i d phase react ions. achieve and cont ro l the d e s i r e d s e l e c t i v i t y i n p a r a l l e l reac t ions , t h e y ie ld i n rever- s i b l e reac t ions , and to recover and pur i fy reac t ion products e f f i c i e n t l y using super- c r i t i c a l f l u i d ex t rac t ion .
Conclusions
P a u l a i t i s (6) measured a c t i v a t i o n
The rate cons tan t increased about 60% f o r a change i n pressure Of
The pronounced solvent e f f e c t i s due t o t h e l a r g e d ipole moment of the
The objec t ive i s to measure and t o p r e d i c t the e f f e c t s of s u p e r c r i t i c a l f l u i d
This s e n s i t i v i t y , which is used advantageously i n s u p e r c r i t i c a l f l u i d ex- For example, rate constants
Solvent p o l a r i t y scales based on solvato-
Novel processes could be developed using s u p e r c r i t i c a l f l u i d so lvents to
For dyes such as phenol b lue , solvatochromic s h i f t d a t a provide a s e n s i t i v e indi- c a t i o n of t h e s t r u c t u r e and p o l a r i t y of s u p e r c r i t i c a l f l u i d so lvents . of s u p e r c r i t i c a l e thylene and l i q u i d hex&e become equiva len t f o r a densi ty r a t i o of c2/c6 O f 2.7 s i n c e t h e lat ter is more polar izable . used to predict t h a t the a c t i v a t i o n volume is -5000 cc/mol f o r t h e Menschutkin reac- t i o n Of tripropylamine and methyl iodide. u g h compressibi l i ty of SF e thylene i n t h e c r i t i c a l region. t h a t rate cons tan ts may b e a l t e r e d markedly i n SF so lvents using small changes i n
The p o l a r i t i e s
A t 25OC and 66 bar, the da ta were
This l a r g e nega t ive va lue i s due t o t h e These r e s u l t s suggest
I
24
I
I
temperature and pressure.
s t a t e by including the e f f e c t s of t h e isothermal compressibi l i ty . The l o c a l dens i ty of t h e SF solvent about t h e s o l u t e can be obtained by comparing t h e experimental ET with the i n t r i n s i c value, ETo, which is ca lcu la ted s t ra ight forwardly f o r incompress- i b l e l iqu ids . A t t h e bulk dens i ty , t h e p o l a r i t y of t h e SF solvent is equivalent t o t h a t of 8 hypothet ical reference l i q u i d a t the l o c a l dens i ty . which is due t o hydrogen bonding, may be obtained by comparing t h i s hypothe t ica l reference f l u i d with t h e experimental da ta . For C F p , the s p e c i f i c p o l a r i t y appears t o be less s e n s i t i v e t o dens i ty than t h e i n t r i n s i c p o l a r i t y . t h e p o l a r i t y of SF so lvents a t t h e microscopic l e v e l w i l l benef i t t h e development of both ex t rac t ion and reac t ion process a t SF condi t ions.
References
The theory of solvent e f f e c t s on e l e c t r o n i c s p e c t r a can be extended t o the SF
The s p e c i f i c po lar i ty ,
The understanding of
1.
2.
3.
4.
5.
6 .
7.
a .
P a u l a i t i s , M.E.; Krukonis. V.J.; Kurnik. R.T.; Reid, R.C., Rev. i n Chem. Engr.. l(2). 179-250 (1983).
Johnston, K.P., "Kirk-Othmer Encyclopedia of Chemical Technology," John Wiley and Sons, Inc., New York (1984).
MuHugh, M.A., "Extract ion with S u p e r c r i t i c a l Fluids." i n "Recent Developments i n Separat ion Science," Li, N.N.; Carlo, J.M., Ed.; CRC Press , Inc.: FL, V O l . IX, 1984.
Zosel, K., Angew. Chem. I n t . Ed. Engl., 17. 702 (1978).
Randall, L.G., Sep. Sci . Technol.. 1 7 , 1 (1982).
Alexander, G.; P a u l a i t i s . M.E., AICHE Annual Meeting, #140 d , San Francisco (1984).
S imons , G.M.; Mason, D.M., Chem. Eng. Sc i . , 27, 89 (1972).
Eckert. C.A.; Hsieh, C.K.; McCabe. J . R . , AICHE J., 20(1), 20-36 (1974).
Boca Raton,
25
Flow Adsorption Calorimetry with Supercritical Fluids on Silica G e l
Edward M. Arnett, B. Chawla', Elaine A. Dwyer, and Charles H. Lochmuller
Department of Chemistry Duke University
Durham, North Carolina 27706
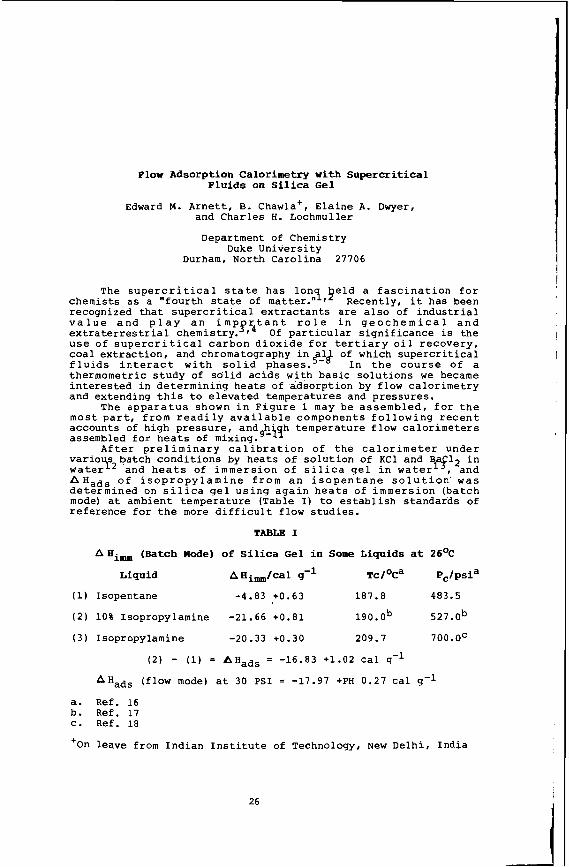
The supercritical state has lon eld a fascination for chemists as a "fourth state of matter. 'Ir' Recently, it has been recognized that supercritical extractants are also of industrial value and play an imp rtant role in geochemical and extraterrestrial chemistry.'t4 Of particular significance is the use of supercritical carbon dioxide for tertiary oil recovery, coal extraction, and chromatography in 1 of which supercritical fluids interact with solid phases. e-k In the course of a thermometric study of solid acids with basic solutions we became interested in determining heats of adsorption by flow calorimetry and extending this to elevated temperatures and pressures.
The apparatus shown in Figure 1 may be assembled, for the most part, from readily available components following recent accounts of high pressure, and h' h temperature flow calorimeters assembled for heats of
After preliminary calibration of the calorimeter under varioyi2batch conditions by heats of solution of KCl and B in water and heats of immersion of silica gel in water8,,and AHads,of isopropylamine from an isopentane solution was determined on silica gel using again heats of immersion (batch mode) at ambient temperature (Table I) to establish standards of reference for the more difficult flow studies.
1
TABLE I
ABimm (Batch node) of Silica Gel in Some Liquids at 26OC
Liquid AHim/cal g-l TC/OC~ P,tpsia
(1) Isopentane -4.83 .+0.63 187.8 483.5
(2) 10% Isopropylamine -21.66 +0.81 190. ob 527.0b
( 3 ) Isopropylamine -20.33 +0.30 209.7 700.0'
(2) - (1) = AHads = -16.83 +1.02 cal g-l
&Hads (flow mode) at 30 PSI = -17.97 +PH 0.27 cal g-l
a. Ref. 16 b. Ref. 17 C. Ref. 18
+On leave from Indian Institute of Technology, New Delhi, India
26
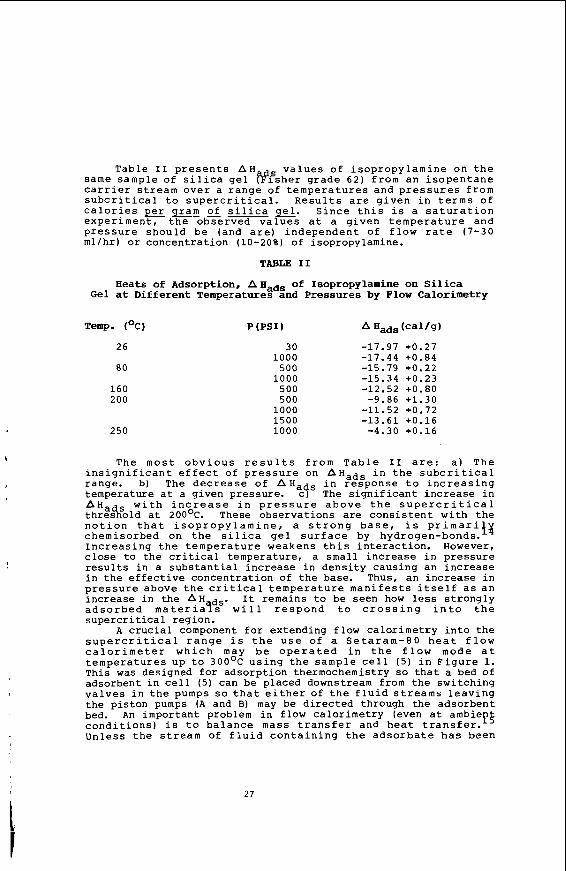
Table I1 presents A H values of isopropylamine on the same sample of silica gel @i?sher grade 6 2 ) from an isopentane carrier stream over a range of temperatures and pressures from subcritical to supercritical. Results are given in terms of calories per of silica gel. Since this is a saturation experiment, the observed values at a given temperature and pressure should be (and are) independent of flow rate ( 7 - 3 0 ml/hr) or concentration (10 -20%) of isopropylamine.
TABLE 11
Heats of Adsorption, AH,^^ of Isopropylamine on Silica Gel at Different Temperatures and Pressures by Flow Calorimetry
Temp. (OC)
26
80
1 6 0 200
250
30 -17 .97 1000 -17.44
500 -15 .79 1000 -15.34
500 -12 .52 500 -9.86
1000 -11 .52 1500 - 1 3 . 6 1 1000 - 4 . 3 0
+ 0 . 2 7 +0.84 c0.22 + O . 2 3 + 0 . 8 0 + 1 . 3 0 + O . 7 2 + 0 . 1 6 +0 .16
The most obvious results from Table I1 are: a) The insignificant effect of pressure on AH,^^ in the subcritical range. b) The decrease of A H a in response to increasing temperature at a given pressure. cq The significant increase in A H a with increase in pressure above the supercritical threAold at 20OoC. These observations are consistent with the notion that isopropylamine, a strong base, is primari chemisorbed on the silica gel surface by hydrogen-bonds. Increasing the temperature weakens this interaction. However, close to the critical temperature, a small increase in pressure results in a substantial increase in density causing an increase in the effective concentration of the base. Thus, an increase in pressure above the critical temperature manifests itself as an increase in the AHyds. It remains to be seen how less strongly adsorbed materia s will respond to crossing into the supercritical region.
A crucial component for extending flow calorimetry into the supercritical range is the use of a Setaram-80 heat flow calorimeter which may be operated in the flow mode at temperatures up to 3OO0C using the sample cell (5) in Figure 1. This was designed for adsorption thermochemistry so that a bed of adsorbent in cell ( 5 ) can be placed downstream from the switching valves in the pumps so that either of the fluid streams leaving the piston pumps (A and B) may be directed through the adsorbent bed. An important problem in flow calorimetry (even at ambie conditions) is to balance mass transfer and heat transfer. Unless the stream of fluid containing the adsorbate has been
i x
27
brought to exactly the temperature of the adsorbent (in cell 5 ) the observed AHads will contain a contribution due to incomplete thermal equilibration of the streams. Figure 2 shows how this problem was solved by forcing the stream through a coil of 1/8" (OD) x 0.60" (ID) 316 stainless steel tubing positioned in the preheating chamber of the calorimeter.
In each experiment, about 100-150 mg. of silica gel was used. After initial cleaning with methanol followed by hexane, the system was then purged with N 2 for about 10-15 min. before the assembled cell was put in line. The system was brought to the appropriate pressure by pumping an inert solvent (isopentane) at 75 mllhr and adjusting the back pressure regulators. Once the appropriate pressure was obtained, the solvent flow rate was reduced to either 7 or 15 mllhr and then the system was thermally equilibrated as demonstrated by a steady baseline on the recorder. Once a steady baseline was achieved, the reactive liquid in pump B was pressurized while still closed to the system to avoid a pressure drop and backflow when switching pumps. Simultaneously, pump A was turned off and pump B was opened to the system at the same flow rate as that of pump A. Heat evolved during the process of interaction of the isopropylamine with the silica gel was monitored by both digital and analog outputs, and was presented as an exothermic release of heat up tothe point of surface saturation after which the system returned to its original baseline temperature in about 30 min.
ACKNOWLEDGEMENTS
This work was made possible through grants from the Exxon Educational Foundation and the Department of Energy (Contract No. FG22-82PC50807) to E.M.A. and the National Science Foundation (Grant CHE-8119600 to C.H.L.). We are glad to acknowledge the expertise of Mr. Milton L. Whitfield in the Duke Physics Shop.
REFERENCES
1. a. Hannay, J. B. Proc. Roy. SOC. (London) 1880, 30, 484 b. D. I. Mendelejeff has also been credited with arriving at
the notion of the critical state as early as 1861; Glasstone, S., "Textbook of Physical Chemistry" Van Nostrand, N.Y. 1940, 421.
2 . van der Waals, J. D. Zittingsv. V. Akad. Wet. (Amsterdam) 1894, 133.
3. 4. 5.
6. 7.
9. a.
Street, W. B.. Astro h s. J. 1973, 186, 1107. Street, W. B. Icaru: :97672, 173. Orr, F. M. Jr.; Taber, J. J. Science 1984, 224 (no. 4649), 563 and the references cited th- Worthy, W. C, 5 1983, Aug. g, 18. Peader, P. A.; Lee, M. L. J. Liquid Chrom. 1982, 2, 179. Maddocks, R. R. Chem. Enq. Prog. 1977, 73(6), 59. Christensen, J . r I z a t t , R. M. Thermochim. Acta 1984, 73 117 and the references cited therein.
10. Siddiqi, M. A.; Lucas, K. J. Chem. Thermodyn. 1982, 14, 1183. 11. Wormald, C. J.; Lewis, K. L.; Mosedale, S. J- Chem.
Thermodyn. 1977, 2. 27.
28
1 2 . Our A H v a l u e s f o r KC1 nd B a C l of 4.25 +0.0.4 a t 25OC and -6.8F1?0.30 k c a l mole-' a t 75+ a g r e e e l l w i t h t h e l i t e r a t u r e v a l u e s of 4.20 and -6.76 k c a l mole-' r e s D e c t i v e l v (Gunn, S. J. Phys. Chem. 1965, 69, 2 9 0 2 and C r i s s , C. M.; Cobble, J. W. J. A m e r . Chem. SOC. 1961, G, 3223) .
13. Our A H . v a l T e o f 1 i Z T c Z i - q - . f o r s i l i ca g e l i n wate a g r e e $y!h t h e r a n g e o f v a l u e s -11.95 t o -13.14 ca l g- f o b t a i n e d a t B a r t l e s v i l l e L a b o r a t o r y ( N o l l , L. A. p r i v a t e communication) us ing d i f f e r e n t samples of s i l i ca g e l (F isher , g rade 6 2 ) .
14.' I l e r , R. K. "The C h e m i s t r y of S i l i c a " 1979, J o h n Wiley & Sons, N e w York.
15. I t i s a l s o i m p o r t a n t t o r e d u c e dead s p a c e i n c e l l 5 by t h e u s e of a machined m e t a l i n s e r t so t h a t m i x i n g of t h e f l o w stream i s minimized f o l l o w i n g s w i t c h i n g from pure s o l v e n t t o t h e s o l u t i o n of base.
1 6 . Handboook of Chemistry and Phys ics , 57 th E d i t i o n , 1976-1977, CRC Press Inc . , Cleveland.
1 7 . Kay's approximation has been used t o c a l c u l a t e p s e u d o c r i t i c a l c o n s t a n t s f o r a m i x t u r e (Kay, W. B. Ind. Eng. Chem. 1936, 28, 1014 and Reid R. C.; Sherwood, T. K. "The p r o p e r t i e s o f g a s e s and l i q u i d s , t h e i r e s t i m a t i o n and c o r r e l a t i o n " 1958. McGraw- H i l l Book Co. Inc . , New Y o r k ) .
18. P c ( isopropylamine) i s an average v a l u e from estimates us ing R i e d e l ' s and Lydersen 's methods r e p o r t e d i n r e f . 17.
29
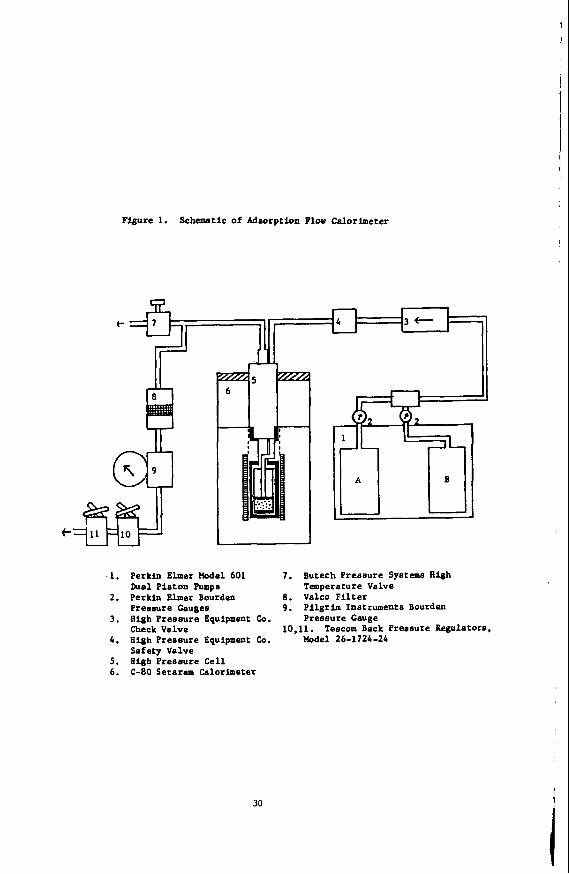
Figure 1. Schemetic of Adsorption Flow Calorimeter
. I . Perkin Elmer Model 601 7 . Butech Pressure Systems H u h Dual Piston Pumps Temperature Valve
Pressure Gauges 9 . Pilgrim Instruments Bourden
Check Valve 10.11. Tescom Back Pressure Regulators,
Safety Valve
2 . Perkin Elmer Bourden 8. Valco Fi l ter
3 . High Pressure Equipment Co. Preasure Gauge
4 . High Pressure Equipment Co. Model 26-1724-24
5. High Preesure C e l l 6. C-80 Setaram Calorimeter
30
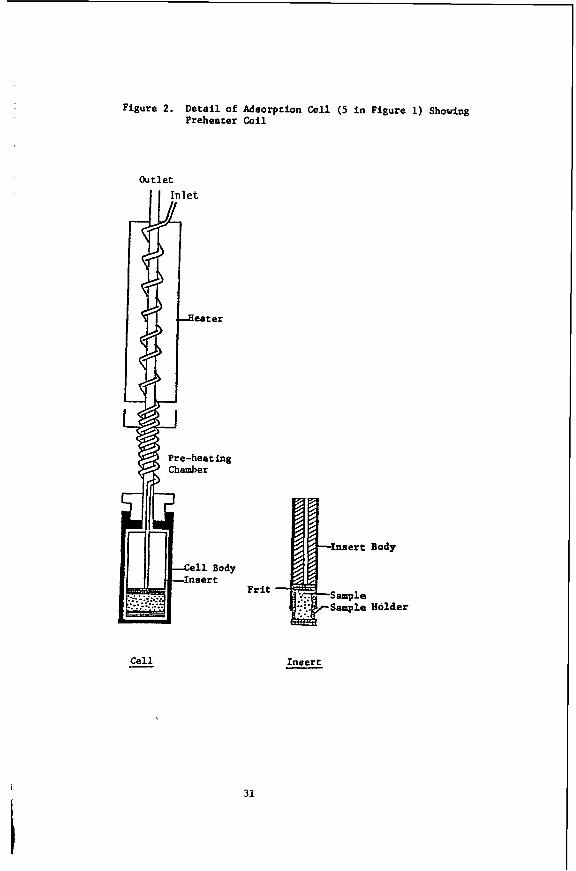
Figure 2. Deta i l of Adsorption Cell (5 i n Figure 1) Showing Preheater Coil
Outlet
F r i t
- C e l l Insert
31
SUPERCRITICAL
CPC I n t e r n a t i o n a l ,
INTRODUCTION
FLUID ADSORPTION AT THE GAS-SOLID INTERFACE
J e r r y W . King
M o f f e t t Technical Center, Argo, I l l i n o i s 60501
S u p e r c r i t i c a l f l u i d s (SCF) i n tandem with adsorbent media are c u r r e n t l y be ing used i n a number o f chemical processes. Such app l i ca t i ons as t h e regeneration of adsorbents, c a t a l y s i s under s u p e r c r i t i c a l condit ions, a n a l y t i c a l and preparat ive chromatography, and t h e proposed storage o f r a d i o a c t i v e gases i n t h e i r s u p e r c r i t i - ca l s t a t e (1-4) r e q u i r e an understanding o f t h e r o l e o f SCF a t t h e sorbentlgas i n - ter face. Adsorbate e q u i l i b r i u m between a dense gas and adsorbent i s no t t o t a l l y con- t r o l l e d by the “ v o l a t i l i t y enhancement” o f t h e sorbate by t h e s u p e r c r i t i c a l f l u i d , but can inc lude such a d d i t i o n a l mechanisms as displacement o f t h e sorbate from t h e i n t e r f a c e b y t h e SCF as w e l l as thermally- induced desorpt ion ( 5 ) . Unfor tunate ly , many inves t i ga to rs do n o t apprec iate t h e compet i t ive adsorpt ion e f f e c t of t he SCF a t t h e gas-so l id i n t e r f a c e and employ e x t r a c t i o n condi t ions which are s o l e l y based on t h e s o l u b i l i t y o f t h e adsorbate i n t h e s u p e r c r i t i c a l f l u i d . I n t h i s presentation, we s h a l l discuss t h e adsorpt ion o f s u p e r c r i t i c a l f l u i d s on a c t i v e adsorbents and show the relevance o f t h i s i n fo rma t ion f o r t h e design o f adsorbent regenerat ion pro- cesses.
reduced s t a t e . co r re la t i on i n F igu re 1. The choice o f these regenerat ion condi t ions i s p a r t i a l l y emp i r i ca l o r based on s o l u t e s o l u b i l i t i e s i n t h e SCF. Whereas, h igh reduced temperatures (T )and pressures (p ) maybe requ i red t o d isp lace po la r species o r h igher molecular. weibht components f r o h t h e carbon surface, these condi t ions can have an adverse e f f e c t on t h e cyc le l i f e t i m e o f t h e adsorbent. The displacement c a p a b i l i t y o f s u p e r c r i t i c a l f l u i d s on p rev ious l y adsorbed solutescan be maximized by s tudy ing t h e adsorpt ion isotherm o f t h e SCF on t h e adsorbent o f i n t e r e s t . The r e s u l t s presented i n t h i s paper are r e l e v a n t t o the l a t t e r phenomena and .can be o f s i g n i f i - cant importance i n regenera t i ng weak t o m d e r a t e l y adsorbed species f rom the s o l i d surface us ing minimal gas compression.
The phys i ca l cond i t i ons f o r regenerat ing adsorbents vary w ide ly as shown by the
EXPERIMENTAL AND DATA SOURCES,
Data f o r t h e adsorpt ion o f s u p e r c r i t i c a l gases on a c t i v a t e d carbon were taken from the s tud ies o f Ozawa and Ogino (6-8). Cor re la t i on o f t h e adsorpt ion maxima for s u p e r c r i t i c a l f l u i d s oh various adsorbents as a f u n c t i o n o f pressure were der ived from the work o f Menon ( 9 ) . Tracer pu lse chromatographic experiments were performed by t h e author a t the U n i v e r s i t y o f Utah. The b a s i c apparatus requ i red f o r performing these experiments has been p rev ious l y described (10). Desorption breakthrough volumes were determined a t 40°C us ing s u p e r c r i t i c a l CO and He as c a r r i e r gases. Two sorbent columns packed w i t h alumina and cross l inked st$rene/divinylbenzene r e s i n were u t i l - i zed i n these s tud ies. Retent ion volume data were determined f o r a a homologous ser- i e s of n-alkanes (n-propane throuqh n-heptane) as w e l l as benzene and naphthalene on t h e above adsorbents.
RESULTS AND DISCtiSSION
‘A t y p i c a l adsorpt ion isotherm f o r a s u p e r c r i t i c a l gas adsorbing on ac t i va ted carbon i s shown i n F i g u r e 2 . Such isotherms show a l i n e a r increase i n t h e amount of gas adsorbed w i t h i nc reas ing pressure and even tua l l y e x h i b i t a maxima i n the pres- sure range corresponding t o p = 0.5-1.0. The shape o f such isotherms i s p a r t i a l l y in f luenced b y t h e adsorpt ion Snd pressure scales t h a t are u t i l i z e d (111, the maxima be ing more pronounced when t h e surface excess i s used as a measure o f t h e q u a n t i t y
32
of gas adsorbed. Further compression of the SCF resu l t s resu l t s in a decrease of the surface excess as the density o f the bulk f lu id becomes equal t o o r exceeds the den- s i t y of the adsorbed gas. The occurence of a pressure maximium i n the adsorption iso- therm for the supercrit ical gas on a given adsorbent i s important, since i t repre- sents a condition favorable f o r the displacement of the adsorbed specie from the ad- sorbent surface. Typical conditions associated with the occurence of the pressure maximium ( p pressure re&%rements fo r attaining p close t o the c r i t i ca l temperature of !f% gas. T h i s i s consistent w i t h the larger up- take of supercrit ical f lu id by the porous medium.
c r i t i ca l properties and has prop89ed the following equation which i s applicable for adsorption on macroporous adsorbentsf
) are presented i n Figure 3 f o r microporous carbons. Note tha t the are lower when the adsorption i s conducted
Menon (11) has correlated p fo r various gases in terms of t h e i r respective
The predicted p from this relationship have been plotted i n Figure 4 from 20 t o 100°C for carboRa8ioxide, ethylene, and chlorotrifluoromethane. The values fo r pma, obtained from Equation 1 occur a t reduced temperatures which are greater then unity, a resu l t which is quite different from the cases cited i n F igu re 3 fo r the microporous sorbents.
Studies by several investigators (6-8) u t i l i z ing different adsorbent/gas com- binations indicate tha t the pore s t ruc ture of the adsorbent has a pronounced effect on the value fo r p . As shown i n Figure 5, a decrease in the mean pore diameter of the activated c%%on decreases the pressure t o a t ta in maximium adsorption of the gas. This suggests tha t there maybe some advantage t o u t i l i z ing a microporous adsor- bent in a supercrit ical f l u i d regeneration process, provided there is no inhibition t o desorption due t o res t r ic ted diffusion of the displaced adsorbate from the sor- bent bed. For activated carbons, the p occurs between 25-72 atmospheres depend- i n g on the pore s i ze distribution o f tR8'adsorbent. Prediction of the adsorption isotherm f o r the supercrit ical gas on activated carbons of varying pore s i ze dis- tr ibution can be accomplished by application of the Pickett equation ( 6 ) .
i lar t o tha t predicted by Equation lyabwever the absolute values f o r p respondingly lower due t o the pore s i ze dependence. Figure 6 suggests t R % lower values for p the adsorben!axHowever, a corresponding reduction in adsorbent surface area occurs upon decreasing the pore s i ze and this i s usually undesirable i n t e r n of providing a large adsorbent capacity.
A knowledge of the dependence of adsorbate breakthrough volume on pressure can greatly aid in the design of a supercrit ical f l u id regeneration process. There is a paucity of information i n the l i t e r a tu re concerning this phenomena, hence, we have measured the desorption breakthrough volumes for reversibly adsorbed species on beds of alumina and crosslinked styreneldivinylbenzene resin using the elution pulse ana- log of frontal analysis. The desorption breakthrough volume, V , .can be readily ob- tained from the capacity factor, k ' , f o r the various injected gorbates and is given by Equation 2 as:
The temperature dependence fo r p on carbons exhibiting microoorosity i s sim- are cor-
can be obtained by reducing both the temperature and pore s ize of
V = V o ( k ' + 1) 2 )
where V Figere 7 i l l u s t r a t e s the dependence of the desorption breakthrough volume on
gas pressure fo r benzene ddsorbing from crosslinked resin matrix. Close examination of the plot reveals t ha t there i s a l inear decrease i n the breakthrough volume for benzene up t o a pressure of approximately 70 atmospheres. Beyond this pressure, there i s a rather dramatic decrease i n breakthrough volume which continues up t o a pressure of 100 atmospheres. Benzene breakthrough volumes a t pressures beyond 100
i s the void volume of the column.
33
atmospheres tend t o asympto t i ca l l y appraoch a constant volume l a r g e l y determined by the dimensions associated wi th t h e bed voidage. This general t rend i n desorpt ion breakthrough behavior ha5 been confirmed b y running add i t i ona l so lu tes on both alumina as w e l l as t h e c ross l i nked res in . I n t e r e s t i n g l y , t h e t r a n s i t i o n t o a con- s t a n t breakthrough volume occurs i n approximately t h e same pressure range f o r a l l o f t h e adsorbates we have s tud ied suggesting the maximium adsorption o f t h e car- r i e r f l u i d occurs i n t h i s pressure i n t e r v a l . Th is r e s u l t suggests t h a t carbon d i - ox ide i s d i sp lac ing t h e adsorbate from the surface o f t h e adsorbent. It should be noted, t h a t s e l e c t i v e f r a c t i o n a t i o n o f t h e adsorbed so lu tes can be achieved b y operat ing i n t h e lower pressure regime, b u t t h i s segregat ion c a p a b i l i t y i s r a p i d l y l o s t when pressures exceed 80 atmospheres
The above behavior has been v e r i f i e d w i t h s i m i l a r adsorbates on alumina columns. F igure 8 shows t h e dependence o f t h e capaci ty f a c t o r f o r n-butane adsorbing on alumina as a f u n c t i o n o f gas pressure. The recorded decrease i n t h e capaci ty f a c t o r p a r a l l e l s t h e reduc t i on i n adsorbate breakthrough volume as a f u n c t i o n o f pressure and i t becomes constant as t h e breakthrough volume approaches t h e v o i d volume o f t h e adsorbent bed. Add i t i ona l experiments performed us ing hel ium as a c a r r i e r gas a l so showed a decrease i n the k ' . f o r n-butane as a f u n c t i o n o f i nc reas ing gas pres- sure. As shown i n F igu re 8, t h e maqnitude o f t h i s change was not as dramatic as t h a t exh ib i t ed f o r t h e a1umina-CO2-n-butane system, however the recorded reduct ion i n k' suggest t h a t a displacement mechanism i s responsib le f o r t h e capaci ty f a c t o r changes when us ing t h i s r e l a t i v e i n e r t gas.
The above r e s u l t s s t r o n g l y support t h e hypothesis t h a t displacement o f bound ad- sorbates b y a s u p e r c r i t i c a l f l u i d can be a major f a c t o r i n regenerat ing adsorbent beds. Addi t ional support f o r t h i s concept can be found f rom the regenerat ion studies o f Eppig and coworkers (3) who recovered ethanol, methyl e t h y l ketone, and toluene from ac t i va ted carbon beds us ing modest CO pressures ( so rp t i on s tud ies o f CO / l i g h t hydrocarbon h x t u r e s desorbing from molecular sieves (12) also i n d i c a t e tha? CO Clear ly , t h i s mode o f adsoken t regenerat ion can be used f o r desorbing se lected so lu tes w i thou t t h e need f o r excessive gas compression.
100 atm.). Competit ive ad-
i s p r e f e r e n t i a l l y adsorbed ove r the alkane moiet ies.
REFERENCES
1.
2.
3 .
4.
5.
6.
M. Modell, R . d e f i l i p p i , and V. Krukonis i n "Ac t i va ted Carbon Adsorption o f O r - ganics from t h e Aqueous Phase-Vol. l", I.H. S u f f e t and M.J. McQuire, eds., Ann Arbor Science Publishers, Inc.,. Ann Arbor, Michigan, (1983), pgs. 447-461.
R . d e f i l i p p i , V. Krukonis, R. Robey, and M. Modell, " S u p e r c r i t i c a l F l u i d Regen- e r a t i o n of Ac t i va ted Carbon f o r Adsorption o f Pest ic ides" , EPA Report 600/2-80- 054, USEPA, (1980).
C. Eppig, R . a e f i l i p p i , and R. Murphy, ' S u p e r c r i t i c a l F l u i d Regeneration o f A c t i - vated Carbon Used f o r Volatile-Organic-Compound Vapor Adsorption", EPA Report
G.H. Findenegg, B. Korner, J. Fischer, and M. Bohn, Ger. Chem. Eng., 5, 80 (1983).
R. Kander and M. Pau la i tus i n "Chemical Engineering a t S u p e r c r i t i c a l F l u i d Con- d i t i ons " , M. Paula i tus, J. Penninger, R. Gray, Jr., and P. Davidson, eds., Ann Arbor Science Publishers, Inc., Ann Arbor, Michigan, (1983), pgs. 461-476
s. Ozawa, S . Kusumi, and Y . Ogino i; "Proceedings of t h e 4th I n t e r n a t i o n a l Con- ference on High Pressure-Kyoto-1974 , The Physico-Chemical Society of Japan, Kyoto, Japan (1975), pgs. 580-587.
600/2-82-067, USEPA, (1982).
7.)S. Ozawa and Y. Ogino, Nippon Kagaku Kaish i , (1972), 1.
34
8. S Ozawa and Y . Ogino, Nippon Kagaku Kaishi. (1972), 8.
9. P.G. Menon, 3. Phys. Chem., 72, 2695 (‘1968).
10. J.C. Giddings, M. Myers, and J.W. King, J . Chrom. Sci . , 1, 276 (1969).
11. P.G. Menon, Chem. Rev., 68, 277 (1968).
12. D . Basmadian and.D. Wright, Chem. Eng. S c i . , 36, 937 (1981).
35
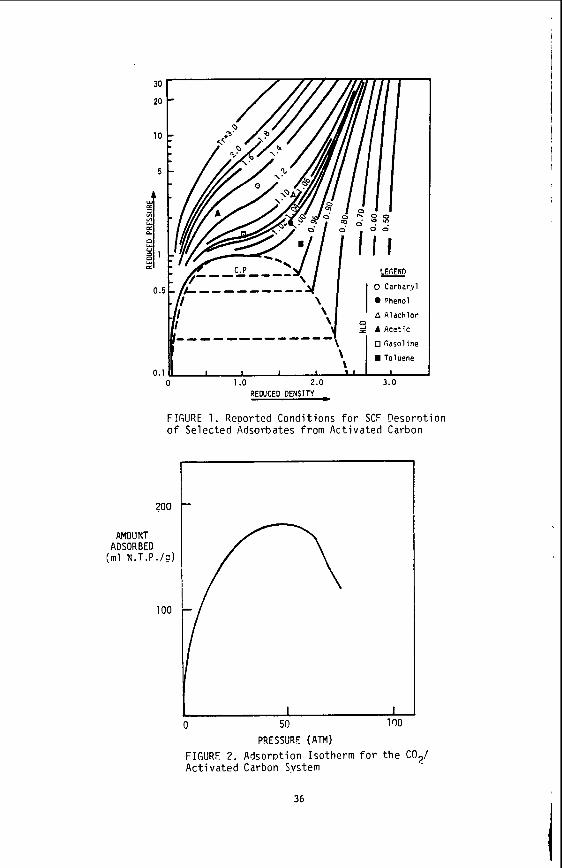
I
I I
1 I I , , ',{,, , A A:achlor
0 Gasoline W Toluene
0 1 .o 2.0 3.0 REDUCED DENSIN
9 A Acetic ---- --------- \
0.1
FIGURE 1. ReDorted C o n d i t i o n s f o r SCF D e s o r o t i o n o f S e l e c t e d Adsorbates f r o m A c t i v a t e d Carbon
36
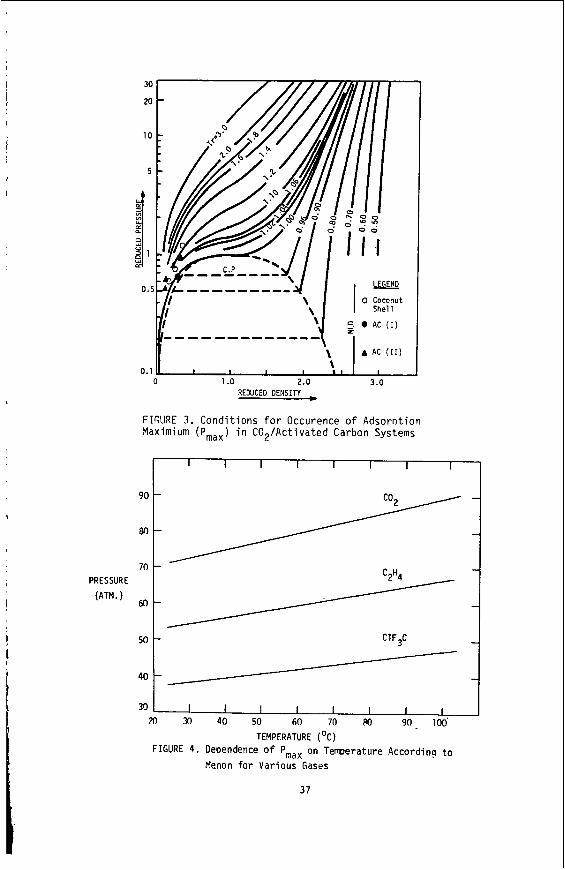
\ 0.1 I I I I I
0 1 .o 2.0 3.0 REDUCED DENSITY
FIGURE 3 . C o n d i t i o n s f o r Occurence o f Adsornt ion Maximium (Pmax) i n CO$Activated Carbon Systems
90
70 PRESSURE
(ATM.) 60
50
40
30
I I I I I I I I
ClF3C
-- I I I I I I I I
M 30 40 50 60 70 Po 90- 100 TEMPERATURE (OC)
FIGURE 4 . Deoendence of Pmax on T e m e r a t u r e According t o Menon f o r Various Gases
37
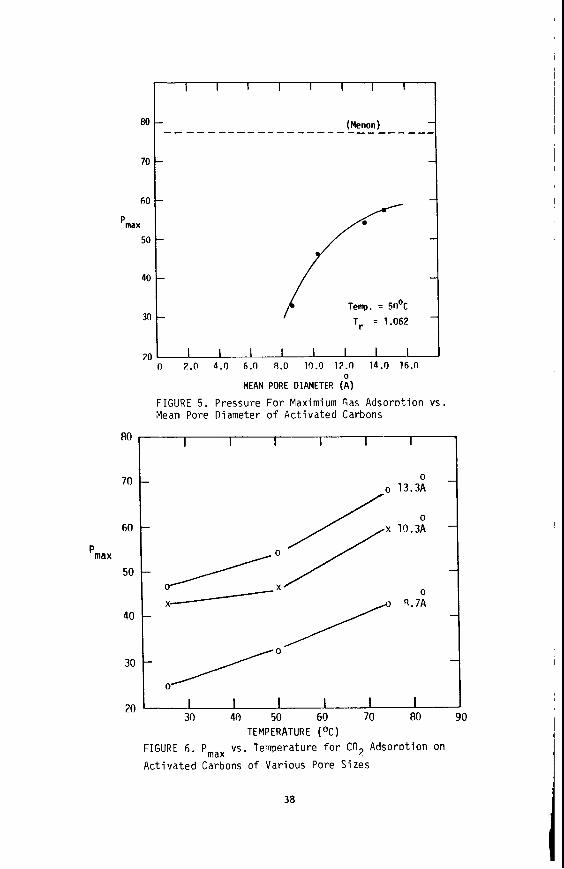
’O t 60
Pmax
50
40
30
80
70
60
Pmax 50
40
30
20
Temp. I: W 0 C T, = 1.062
20 I I I 1 I I I I I n 2.0 4.0 6.0 8.0 10.0 17.0 14.0 i6 .n
0 MEAN PORE DIAMETER ( A )
FIGURE 5 . Pressure F o r Maximiurn Gas A d s o r n t i o n vs. Nean Pore Diameter o f A c t i v a t e d Carbons
I I I I I I
0 o 13.3A
I I I 1 I I 30 40 50 60 70 80 90
TEMPERATURE (OC)
FIGURE 6. Pmax vs. Temperature f o r CO, A d s o r o t i o n on
A c t i v a t e d Carbons o f Var ious Pore S i z e s
‘ I
i l
38
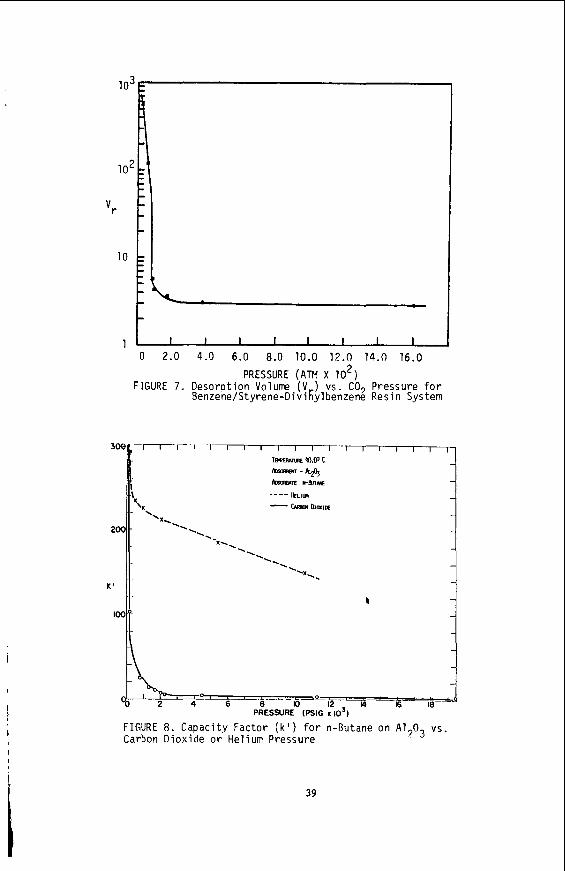
30
20
K '
10
t 1 1 I I 1 I I I I I
0 2.0 4.0 6.0 8.0 10.0 12.0 14.0 16.0
PRESSURE (ATM x i o 2 ) F I G U R E 7. Desorotion Volume ( V ) vs. CO, Pressure f o r
Bewenelstyrene-Di vif;yl benzene Pesi n System
b
FIGURE 8. Capacity Factor ( k ' ) f o r n-Butane on A1703 vs Carbon Dioxide o r Helium Pressure
39
SOLUBILITIES OF SOLID n-UAWES I N SUPERCRITICAL ETHANE
The s o l u b i l i t i e s a (n-C32H66) i n
pressures upto
I r a j Moradinia and Amyn S. Te ja School of Chemical Engineering
Georgia I n s t i t u t e o f Technology Atlanta, Georgia 30332-0100
ABSTRACT
s o l i d n - t r i acontane ( n-C30H62 and n-Da -:i acontane s u p e r c r i t i c a l ethane a t temperatures between 30% and 319K and 20 W a are reported i n t h i s work. The r e s u l t s have been
corre la ted using an equation o f state, using subl imation pressures which are extrapolated from data avai lab le f o r the lower even-numbered members of the alkane series.
INTRODUCTIOES
Then n-alkanes a re an i n t e r e s t i n g ser ies because they d isp lay great r e g u l a r i t y i n t h e i r behavior. Many o f t h e i r f l u i d phase propert ies, f o r example, can be co r re la ted w i t h the number o f carbon atoms i n the molecules. I n order t o develop general r e l a t i o n s f o r s u p e r c r i t i c a l ext ract ion, therefore we have s tud ied the s o l u b i l i t i e s o f s o l i d n-alkanes i n superc r i t i ca l ethane. The solubf l i t i e s o f n-tr iacontane (n-CXIH62) and n-dotriacontane
(n-C32H66) i n ethane are reported i n t h i s paper. Results f o r n-tetracosane (tVC24H50) , n-hexacosane In-C26H54) and n-octacssane (fbC28H58) w i l l a l so be
presented a t the symposium. One reason f o r studying only the even-numbered members of the n-alkane ser ies i s t h a t they e x h i b i t d i f f e r e n t packing proper t ies than the odd-numbered members o f the ser ies C1,2,31. Thus t h e i r s o l i d phase proper t ies such as heats o f subl imation and vapor pressures fol low d i f f e ren t trends from those o f the odd-numbered members. This i s shown i n F i g . 1 for the heats o f sublimation. Any general izat ions f o r superc r i t i ca l ex t rac t i on of so l i ds must therefore take account o f t h i s d i f ference I n behavior.
EXPERIENTAL
The apparatus used i n t h i s study was a single-pass f l o w system shown
40
those of Kurnik e t a1 C41. These r e s u l t s are presented i n tab le 1 f o r the 308.15K isotherm. I n no case d i d our s o l u b i l i t i e s d i f f e r from those o f Kurnik e t a1 by more than 3.6% f o r any o f the isotherms.
I
I
41
Our results for the + n C30H62 and I+H6 + n C32H66 systems are shown i n Tables 2 and 3. Since the sublimation pressures of the higher n-alkanes wew not available i n the l i terature, we have treated these as adjustable parameters i n our equation of state correlations of the solubility data. The sub1 imation pressures were not freely adjustable, however, but were bounded by t h e values obtained by extrapolating propane and n-octadecane sublimation pressures 25%. Our results are shown i n F i g 3 and 4. Addi t iona l results will be discussed a t t h e symposium. The equation of s t a t e used was t h a t of Patel and Teja C81.
REFERENCES
1.
2 .
3.
4.
5 .
6.
7.
8.
Morawetz, E., "Ethalpfes Of Vaporitatfon from C12to C ~ O " , J. Chem. Thermo. - 4, 139 (1972).
Bondi, A. , "Heat of Sublimation of Molecular Crystals A Catalog of Molecular Structure Increments", J. Chem. Eng. Data E, 371 (1963).
Broadhurst , M. 6.. J. Res. Nat. Bur. Stand. A*, 241, (1962).
Kurnik, R. T., Holla, S. J . and Reid, R. C., "Solubility of Solids in Supercritical Carbon Dioxtde and Ethylene", J. Chem. Data, 26, 47 ( 1981 1.
Adachi, Y . , Benjamin, C. and Lu, Y. , "Supercritical Fluid Extraction w i t h Carbon Dioxide and Ethylene", F l u i d Phase E q u i l . , 14, 147 (1983).
Mchugh, M. A. and Paulaitis, M. E., "Solid Sclubili t ies of Naphthalene and Biphenyl i n Supercritical Carbon dioxide", J . Chem. Eng. Data, 25, 326 (1980).
Johnston, K . P. and Eckert, C. A., "Analytical Carnahan-Starling-van der Waal s Model for Sol ubi 1 i ty of Hydrocarbon Sol i d s in Supercri tical
Patel, N. C. and Teja, A. S., "A N e w Cubic Equation of State for Fluids and Fluid Mixtures", Chem. Eng. Sci., 37. 463 (1982).
F9Uids", AIChE J., 27, 773-779 (1981).
42
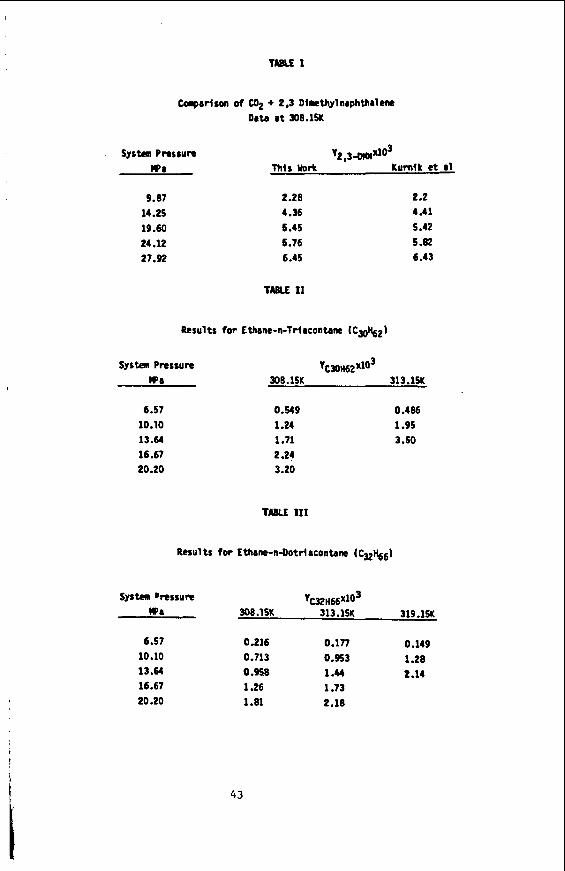
TABLE 1
tolparlson of W2 + 2.3 Dlmethylnrphthalem Data a t 308.15K
system Pressure Y 2 2 3 ~ x 1 0 3 b a This Work Kurnlk e t a1
9.87 14.25 19.60 24.12 27.92
2.28 4.36 5 .45 5.76 6.45
2.2 4-41 5.42 5.82 6.43
TABLE 11
Results f o r Ethane-n-Trlrcontmne (Cm%2)
system Prcssure Yt#)H62X1O3 Wa 308.15K 313.15K
6.57 0.549 0.486 10.10 1.24 1.95 1 3 . a 1.71 3.50
20.20 3.20 16.67 2.24
TABLE 111
Results for Ethane-n-Dotrlrconhm (c&6)
systca DrcSSUR yCXH66x103 !Pa 308.15K 313.13K 319.13K
6.57 0.216 0.177 0.149 10.10 0.713 0.953 1.28 13.64 0.958 1 .u 2 .M 16.67 1.26 1.73 20.20 1.81 2.18
i
43
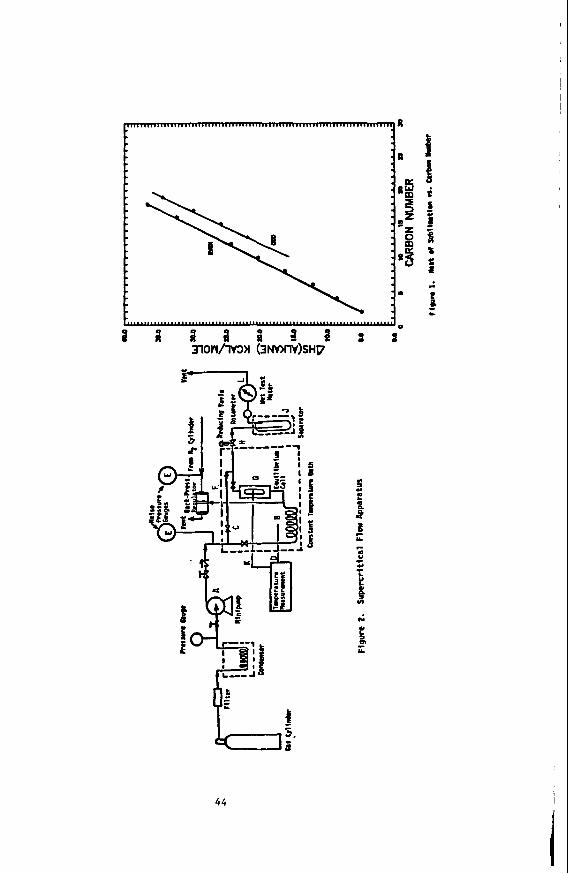
t c Y
N
f t d
t
44
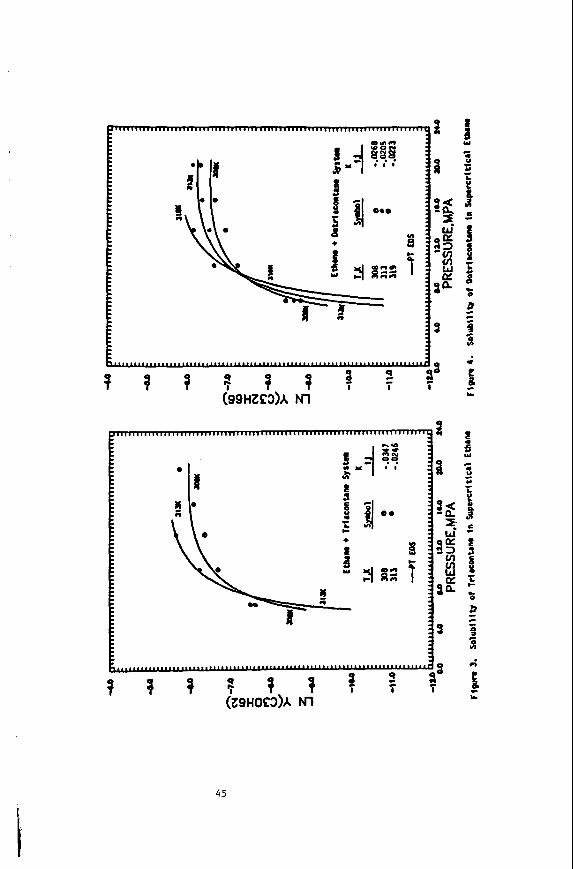
45
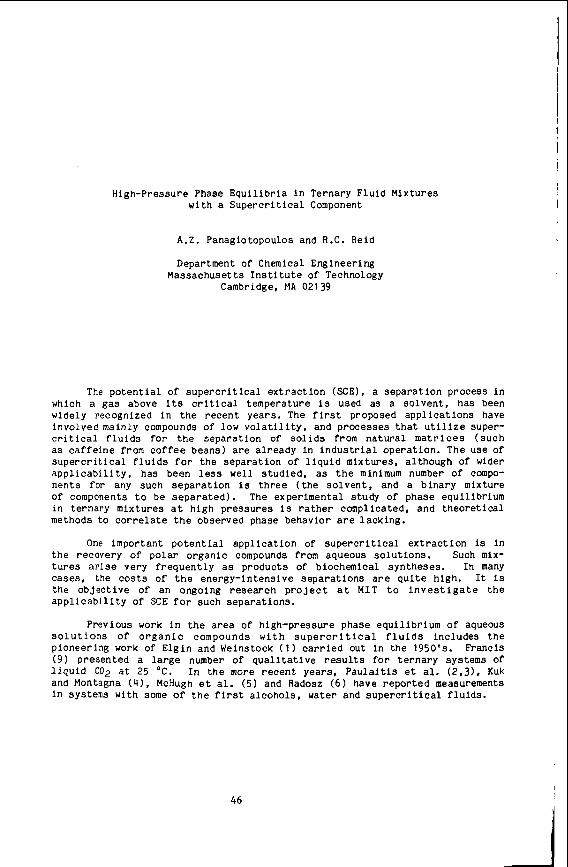
High-pressure Phase E q u i l i b r i a i n Ternary F lu id Mixtures wi th a S u p e r c r i t i c a l Component
A . Z . Panagiotopoulos and R.C. Reid
Department of Chemical Engineer ing Massachuset ts I n s t i t u t e of Technology
Cambridge, MA 02139
The p o t e n t i a l of s u p e r c r i t i c a l e x t r a c t i o n (%E), a s e p a r a t i o n process i n which a g a s above its c r i t i c a l temperature is used a s a s o l v e n t , has been widely recognized i n t h e r e c e n t years . The f i r s t proposed a p p l i c a t i o n s have involved mainly compounds of low v o l a t i l i t y , and processes t h a t u t i l i z e super- c r i t i c a l f l u i d s f o r t h e s e p a r a t i o n of s o l i d s from n a t u r a l m a t r i c e s ( s u c h a s c a f f e i n e from c o f f e e beans) are a l r e a d y in i n d u s t r i a l opera t ion . The use of s u p e r c r i t i c a l f l u i d s f o r t h e s e p a r a t i o n of l i q u i d mixtures , a l though of wider a p p l i c a b i l i t y , has been less wel l s t u d i e d , as the minimum number of compo- n e n t s for any such s e p a r a t i o n is t h r e e ( t h e s o l v e n t , and a b inary mixture of components t o be s e p a r a t e d ) . The experimental s tudy of phase equi l ibr ium i n t e r n a r y mixtures a t h igh p r e s s u r e s i s r a t h e r complicated, and t h e o r e t i c a l methods t o c o r r e l a t e t h e observed phase behavior are l a c k i n g .
One important p o t e n t i a l a p p l i c a t i o n of s u p e r c r i t i c a l e x t r a c t i o n is i n t h e recovery of p o l a r o r g a n i c compounds from aqueous s o l u t i o n s . Such mix- t u r e s arise very f r e q u e n t l y a s products of biochemical syntheses . In many c a s e s , t h e c o s t s of t h e energy- in tens ive s e p a r a t i o n s a r e q u i t e high. I t is t h e o b j e c t i v e of an ongoing research p r o j e c t a t M I T t o i n v e s t i g a t e t h e a p p l i c a b i l i t y of SCE f o r such s e p a r a t i o n s .
Previous work i n t h e a r e a of high-pressure phase equi l ibr ium of aqueous s o l u t i o n s o f o r g a n i c compounds w i t h s u p e r c r i t i c a l f l u i d s inc ludes t h e p ioneer ing work of E l g i n and Weinstock ( 1 ) c a r r i e d out i n t h e 1950's. Francis ( 9 ) presented a l a r g e number of q u a l i t a t i v e r e s u l t s f o r t e r n a r y systems of l i q u i d C O 2 a t 25 'C. I n t h e more r e c e n t years , P a u l a i t i s e t al. ( 2 , 3 ) , Kuk and Montagna ( 4 ) , McHugh e t a l . (5) and Radosz (6) have r e p o r t e d measurements i n systems w i t h some of t h e f i r s t a l c o h o l s , water and s u p e r c r i t i c a l f l u i d s .
46
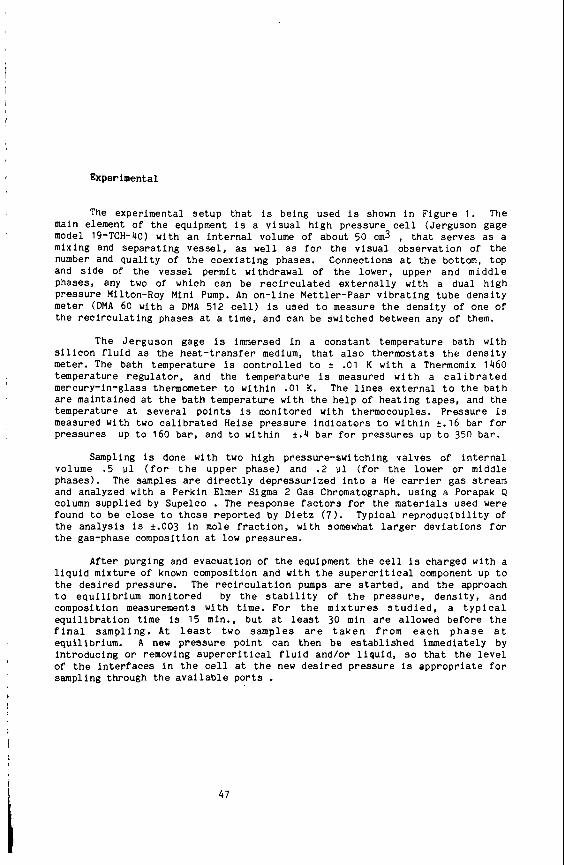
Experimental
The experimental s e t u p t h a t is being used is shown i n F igure 1 . The main element of t h e equipment is a v i s u a l h igh p r e s s u r e c e l l ( Je rguson gage model 19-TCH-40) wi th a n i n t e r n a l volume of about 50 cm3 , t h a t s e r v e s a s a mixing and s e p a r a t i n g v e s s e l , as well as f o r t h e v i s u a l o b s e r v a t i o n of t h e number and q u a l i t y of t h e c o e x i s t i n g phases . Connections a t t h e bottom, t o p and s i d e Of t h e v e s s e l permit withdrawal of t h e lower, upper a n d m i d d l e phases , any two of which can be r e c i r c u l a t e d e x t e r n a l l y wi th a dua l h i g h P r e s s u r e Milton-Roy Mini Pump. An o n - l i n e Met t le r -Paar v i b r a t i n g t u b e d e n s i t y meter (DNA 60 wi th a DMA 512 c e l l ) is used t o measure t h e d e n s i t y of one of t h e r e c i r c u l a t i n g phases at a time, and can be switched between any of them.
The J e r g u s o n gage is immersed i n a c o n s t a n t tempera ture bath with S i l i c o n f l u i d a s t h e h e a t - t r a n s f e r medium, t h a t a l s o thermosta t s t h e d e n s i t y meter. The bath tempera ture is c o n t r o l l e d t o k .01 K w i t h a Thermomix 1460 tempera ture r e g u l a t o r , and t h e tempera ture is measured w i t h a c a l i b r a t e d mercury-in-glass thermometer t o w i t h i n .01 K. The l i n e s e x t e r n a l t o t h e b a t h are maintained a t t h e b a t h tempera ture w i t h t h e h e l p of h e a t i n g t a p e s , and t h e tempera ture a t s e v e r a l p o i n t s is monitored w i t h thermocouples. P r e s s u r e i s measured wi th two c a l i b r a t e d Heise p r e s s u r e i n d i c a t o r s t o w i t h i n k.16 bar for p r e s s u r e s up t o 160 bar, and t o w i t h i n +.4 bar for p r e s s u r e s up t o 350 bar .
Sampling is done with two h i g h pressure-swi tch ing v a l v e s of i n t e r n a l volume . 5 u 1 ( f o r t h e u p p e r phase) and .2 111 ( f o r t h e lower o r middle phases) . The samples are d i r e c t l y d e p r e s s u r i z e d i n t o a He c a r r i e r g a s s t ream and analyzed with a Perk in Elmer Sigma 2 Cas Chromatograph, us ing a Porapak 4 column suppl ied by Supelco . The response f a c t o r s for t h e m a t e r i a l s used were found t o b e c l o s e t o t h o s e r e p o r t e d by Die tz ( 7 ) . Typical r e p r o d u c i b i l i t y of t h e a n a l y s i s is k.003 i n mole f r a c t i o n , wi th somewhat l a r g e r d e v i a t i o n s f o r t h e gas-phase composition a t low pressures .
After purging and evacuat ion of t h e equipment t h e cell is charged wi th a l i q u i d mixture of known composition and w i t h t h e s u p e r c r i t i c a l component up t o t h e d e s i r e d pressure . The r e c i r c u l a t i o n pumps are s t a r t e d , and t h e approach t o e q u i l i b r i u m monitored by t h e s t a b i l i t y of t h e pressure . d e n s i t y , and composition measurements wi th time. For t h e m i x t u r e s s t u d i e d , a t y p i c a l e q u i l i b r a t i o n time is 15 min., b u t a t l e a s t 30 min a r e allowed b e f o r e t h e f i n a l s a m p l i n g . A t l e a s t two s a m p l e s a r e t a k e n from e a c h p h a s e a t equi l ibr ium. A new p r e s s u r e p o i n t can t h e n b e e s t a b l i s h e d immediately by i n t r o d u c i n g or removing s u p e r c r i t i c a l f l u i d and/or l i q u i d , s o t h a t t h e l e v e l of t h e i n t e r f a c e s i n t h e c e l l a t t h e new d e s i r e d p r e s s u r e is a p p r o p r i a t e f o r sampling through t h e a v a i l a b l e p o r t s .
47
Results
Binary Systems
As a tes t of t h e v a l i d i t y of t h e equipment des ign and t h e experimental procedures , we f irst i n v e s t i g a t e d a b i n a r y system for which r e s u l t s have been previous ly publ ished. Knowledge of t h e behavior o f t h e b inary systems is i n i t s e l f impor tan t , s i n c e the d a t a provide the a p p r o p r i a t e limits f o r t he corresponding t e r n a r y systems.
I n F igure 2 w e present t h e experimental r e s u l t s and l i t e r a t u r e da ta f o r t h e system C02 - ace tone at 313 and 333 K ( l i t e r a t u r e r e s u l t s are a v a i l a b l e o n l y a t t he lower tempera ture) . A s can be seen, t h e agreement between the two sets of r e s u l t s is e x c e l l e n t . Also shown on t h e same f i g u r e a s continuous l i n e s a r e the r e s u l t s of the f i t t i n g of the experimental d a t a us ing a modified Peng-Robinson e q u a t i o n o f s t a t e t h a t is descr ibed i n t h e Appendix. The agreement between experimental and p r e d i c t e d phase composi t ions is with in the experimental u n c e r t a i n t y of t h e data, except i n the c r i t i c a l reg ion .
Several of the f e a t u r e s of t h e phase behavior shown on Figure 2 a r e q u i t e genera l . I n p a r t i c u l a r , i t can be s e e n t h a t t h e s o l u b i l i t y of C02 i n t h e l i q u i d phase is q u i t e h igh , even a t moderate p r e s s u r e s . The system c r i t i c a l p r e s s u r e is, i n g e n e r a l , comparable t o t h e c r i t i c a l p r e s s u r e of C02, and i n c r e a s e s w i t h temperature a t the tempera ture range s t u d i e d . Although t h e s o l u b i l i t y of a c e t o n e i n t h e gas phase is low i n t h e two-phase reg ion , t h e r e is complete m i s c i b i l i t y between C02 and ace tone a t p r e s s u r e s t h a t a r e not very high. C02 a t l i q u i d - l i k e d e n s i t i e s is a n e x c e l l e n t s o l v e n t f o r a wide range of organic compounds, a s was f i r s t observed by Franc is (9 ) f o r near c r i t i c a l l i q u i d C02 .
One a d d i t i o n a l example o f t h e same g e n e r a l t y p e of b e h a v i o r is demonstrated by t h e C02 - ethanol system. Three measured isotherms f o r t h i s system a r e p r e s e n t e d i n F igure 3. No comparable s e t of experimental r e s u l t s appears t o be a v a i l a b l e i n t h e open l i t e r a t u r e . Again, t h e agreement between experimental r e s u l t s and model p r e d i c t i o n s is very good.
Ternary Systems
A s one of a s e r i e s of model systems, we s t u d i e d t h e C02 - acetone - water system a t 313 and 333 K. The most s t r i k i n g f e a t u r e of t h e sys tem behavior , is a very e x t e n s i v e three-phase r e g i o n a t b o t h temperatures . The three-phase reg ion is first observed a t a p r e s s u r e of o n l y 25 bar a t 313 K , and extends t o approximately t h e cr i t ical p r e s s u r e of the b inary C02 - acetone System. Table 1 provides the experimental r e s u l t s f o r t h e composi t ion of the three phases a t e q u i l i b r i u m as a f u n c t i o n of p r e s s u r e and temperature .
The p h y s i c a l p i c t u r e t h a t u n d e r l i e s t h i s behavior , as pointed out first by E l s i n and Weinstock ( 1 ) . is t h e ' s a l t i n g o u t ' e f f e c t by a s u p e r c r i t i c a l f l u i d on an aqueous s o l u t i o n of an o r g a n i c compound. A s p r e s s u r e is increased the tendency of t h e s u p e r c r i t i c a l f l u i d t o s o l u b i l i z e i n t h e o r g a n i c l i q u i d r e s u l t s i n a phase s p l i t i n the aqueous phase, a t what can be named a lower c r i t i c a l s o l u t i o n p r e s s u r e (which v a r i e s w i t h tempera ture) . A s p ressure
4a
1s f u r t h e r decreased, t h e second l i q u i d phase and t h e s u p e r c r i t i c a l phase become more and more similar t o each o t h e r , and merge a t an upper Critical S o l u t i o n pressure , above which only two phases can c o e x i s t .
This p a t t e r n of behavior was a l s o observed by Elg in and Weinstock f o r the system e thylene - ace tone - water a t 15 'C. I n a d d i t i o n , t h e same t y p e of behavior , bu t a t q u i t e d i f f e r e n t p r e s s u r e s r e l a t i v e t o t h e p u r e s o l v e n t C r i t i c a l p r e s s u r e was r e p o r t e d by P a u l a i t i s e t a 1 . ( 3 ) f o r t h e System cO2 - isopropanol - water , by McHugh e t a1.(5) f o r t h e system ethane - e thanol - water and again by P a u l a i t i s et a 1 . ( 2 ) f o r t h e C02 - e thanol - water System, and t h e r e f o r e appears t o be q u i t e genera l .
A more complete p i c t u r e of t h e phase equi l ibr ium behavior i s given i n F igure 4 f o r t h e system under s t u d y a t 333 K. The darker l i n e s and squares on t h i s f i g u r e a r e exper imenta l ly measured t i e - l i n e s and phase compositions. The l i g h t l i n e s are model p r e d i c t i o n s , us ing v a l u e s of i n t e r a c t i o n p a r a m e t e r s determined s o l e l y from r e g r e s s i o n of b inary d a t a ( s e e Appendix). The two sets of r e s u l t s a r e i n good agreement w i t h each o t h e r .
An i n t e r e s t i n g f e a t u r e of the phase e q u i l i b r i u m behavior is t h e r e l a t i v e i n s e n s i t i v i t y of t h e p h a s e e n v e l o p e and p o s i t i o n s of t h e t i e - l i n e s t o v a r i a t i o n s i n p r e s s u r e i n the two-phase r e g i o n , a s evidenced by comparison of the diagrams a t 100 and 150 bar i n F igure 4. T h i s would seem t o imply that s i m i l a r s e p a r a t i o n s can be achieved by o p e r a t i o n a t p r e s s u r e s j u s t above t h e upper c r i t i c a l s o l u t i o n p r e s s u r e of -95 bar a s compared t o o p e r a t i o n a t h igher pressures .
The phase equi l ibr ium behavior a t 313 K is q u i t e s i m i l a r t o t h a t a t 333 K, w i t h t h e three-phase r e g i o n s h i f t e d t o lower pressures, a s presented i n Table 1 .
From an engineer ing p o i n t of view, t h e most impor tan t q u a n t i t i e s i n t h e e v a l u a t i o n of a s e p a r a t i o n scheme based on a phase behavior p a t t e r n such as t h e one shown, are t h e s e l e c t i v i t y of t h e s e p a r a t i o n w i t h r e s p e c t t o t h e d e s i r e d component, a s well a s t h e l o a d i n g of the d e s i r e d component i n t h e e x t r a c t a n t phase. I t is well known . t ha t t h o s e two f a c t o r s u s u a l l y i n c r e a s e i n d i f f e r e n t d i r e c t i o n s . F igures 5 and 6 p r e s e n t experimental d a t a and model p r e d i c t i o n s f o r t h e d i s t r i b u t i o n c o e f f i c i e n t of a c e t o n e , a n d f o r t h e s e l e c t i v i t y r a t i o o of a c e t o n e o v e r water ( d e f i n e d a s t he r a t i o of d i s t r i b u t i o n c o e f f i c i e n t s o f a c e t o n e and water i n t h e l i q u i d and f l u i d phases) , as a f u n c t i o n of t h e water c o n c e n t r a t i o n i n t h e l i q u i d phase. The d i s t r i b u t i o n f a c t o r shows a s h a r p maximum a t both tempera tures , w i t h a h igher v a l u e a t t h e h igher tempera ture , whereas t h e s e l e c t i v i t y decreases smoothly from t h e l i m i t i n g va lue of -300 at low ace tone concent ra t ions t o 1 as t h e p l a i t p o i n t is approached. The experimental da ta show t h e same t r e n d s , a l though t h e r e is some s c a t t e r t h a t is due t o the f a c t t h a t small a b s o l u t e e r r o r s i n t he low s u p e r c r i t i c a l phase c o n c e n t r a t i o n s of a c e t o n e and water r e s u l t i n l a r g e r e l a t i v e e r r o r s f o r t h e d i s t r i b u t i o n c o e f f i c i e n t and s e l e c t i v i t y f a c t o r s . S e l e c t i v i t i e s a r e g e n e r a l l y h i g h e r f o r t h e l o w e r temperature , b u t l o a d i n g s are lower. Based on t h e observed behavior f o r t h e system, the maximum CO2-free ace tone c o n c e n t r a t i o n s i n t h e upper phase is 85% mole (-95% u/w) ace tone f o r o p e r a t i o n a t 150 bar and 333 K.
49
Conclusions
I
An a p p a r a t u s f o r t h e de te rmina t ion of h i g h p r e s s u r e phase equi l ibr ium d a t a f o r mixtures of water, p o l a r o r g a n i c l i q u i d s and s u p e r c r i t i c a l f l u i d s was c o n s t r u c t e d and s u c c e s s f u l l y opera ted for b inary and t e r n a r y s y s t e m s w i t h super cri t ical carbon d i o x i de.
The system C02 - ace tone - water was e x t e n s i v e l y i n v e s t i g a t e d a t 313 and 333 K. The system demonstrates several of t h e genera l c h a r a c t e r i s t i c s of phase equi l ibr ium behavior observed e a r l i e r f o r similar systems, including an ex tens ive LLV r e g i o n t h a t appears a t r e l a t i v e l y low pressures .
A model based on a modif ied form of t h e Peng-Robinson equat ion of s t a t e was able t o reproduce q u a n t i t a t i v e l y a l l f e a t u r e s of t h e o b s e r v e d phase equi l ibr ium behavior , with model parameters determined from only binary data . The use of such models may f a c i l i t a t e s u b s t a n t i a l l y t h e t a s k of process design and opt imiza t ion for s e p a r a t i o n s t h a t u t i l i z e s u p e r c r i t i c a l f l u i d s .
A s u b s t a n t i a l s e n s i t i v i t y of t h e s e p a r a t i o n e f f i c i e n c y , as determined by t h e a b i l i t y of t h e s o l v e n t t o s e l e c t i v e l y e x t r a c t t h e o r g a n i c compound with h i g h loadings was observed when t h e o p e r a t i n g c o n d i t i o n s were var ied .
Acknowledgement
F inancia l s u p p o r t for t h i s r e s e a r c h was provided by a g r a n t from the Nat ional Sc ience Foundation. One of t h e a u t h o r s ( A Z P ) was also supported by a Halcon Inc. Fel lowship. We g r a t e f u l l y acknowledge both sponsors .
1 . 2.
3.
4.
5.
6. 7. 8.
References
Elgin, J.C. and Weinstock, J.J., J . Chem. Eng. Data (1959) . i ( 1 ) 3-12. P a u l a i t i s , M.E.. G i l b e r t , M.L. and Nash, C.A. , 'Separa t ion of Ethanol - Water Mixtures w i t h S u p e r c r i t i c a l F l u i d s ' , paper presented a t t h e 2nd World Congress of Chemical Engineering, Montreal, Canada, Oct. 5, 1981. P a u l a i t i s , M.E., Kander, R.C. and DiAndreth, J . R . , Ber. Bunsenges. Phys. Chem. (1984). E. 869-875. Kuk, M.S. and Montagna, J . C . , ' S o l u b i l i t y of Oxygenated Hydrocarbons i n S u p e r c r i t i c a l Carbon Dioxide ' , Ch. 4 i n P a u l a i t i s . M.E. e t a l . ( e d ) , 'Chemica l E n g i n e e r i n g a t S u p e r c r i t i c a l F lu id Condi t ions ' , Ann Arbor Science P u b l i s h e r s , Ann Arbor, Mich., 1983 p. 101-111. McHugh, M . A . , Mallett, M.W. and Kohn, J .P . , 'High P r e s s u r e F lu id Phase E q u i l i b r i a of Alcohol - Water - S u p e r c r i t i c a l Solvent Mixtures, paper p r e s e n t e d a t t h e 1981 annual AIChE meet ing, New Orleans, Louis iana, Nov. 9,. 1981. Radosz, M., Ber. Bunsenges. Phys. Chen. (19841, 88, 859-862. Dietz , W.A. , J. Cas Chrom. (19671, 5_(2) 68-71. P a n a g i o t o p o u l o s , A.Z. and Reid, R . C . , ' A New Mixing Rule f o r Cubic Equat ions of S t a t e for H i g h l y Polar , Asymmetr ic S y s t e m s ' , paper Presented a t t h e n a t i o n a l American Chemical Soc ie ty meeting i n Miami,
50
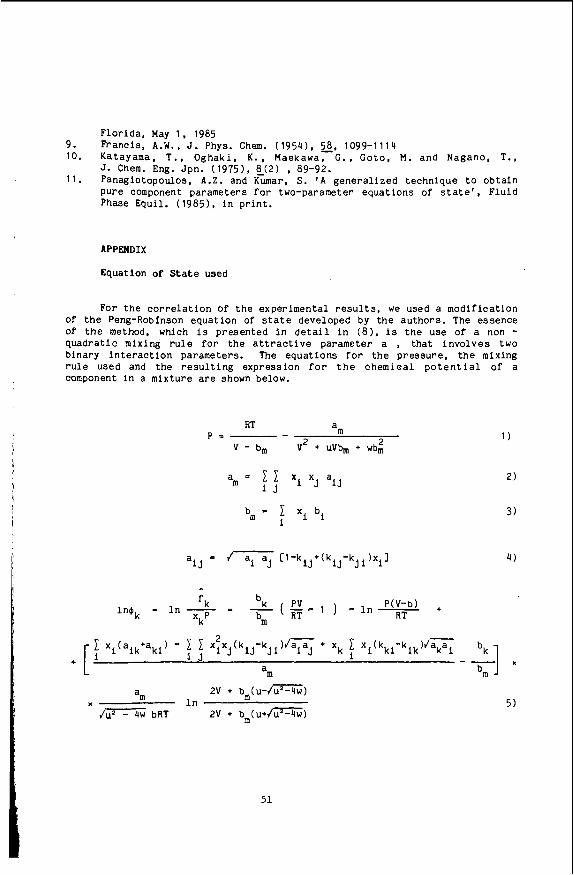
,
\
Y
I
F l o r i d a , May 1 . 1985 9. Francis , A.W., J. Phys. Chem. (1954) . 2. 1099-1114 10. Katayama, T . , Oghaki , K . , Maekawa, C . , C o t o , M. and Nagano, T . ,
J. Chem. Eng. Jpn. (1975) , 8_(2) , 89-92. 11. Panagiotopoulos, A.Z . and Kumar, S. ' A g e n e r a l i z e d technique t o obta in
pure component parameters f o r two-parameter equat ions of s t a t e ' , F lu id Phase E q u i l . (19851, i n p r i n t .
APPENDIX
Equation of State used
For t h e c o r r e l a t i o n of t h e exper imenta l r e s u l t s , we used a modi f ica t ion Of the Peng-Robfnson equat ion of s t a t e developed by t h e au thors . The essence Of t h e method, which is presented i n d e t a i l i n (8) . is t h e use of a non - q u a d r a t i c mixing r u l e f o r t he a t t r a c t i v e parameter a , that i n v o l v e s two binary i n t e r a c t i o n parameters. The equat ions for t h e p r e s s u r e , t h e mixing r u l e used and t h e r e s u l t i n g express ion f o r t h e chemical p o t e n t i a l of a component i n a mixture a r e shown below.
RT a 2 2 V - b, V + UVb, + wb,
p m - - 11
l n e k = I n - f k = y ( F - 1 'k PV ) - 1 n T P(V-b) +
X P k m
2V + b m ( u - m )
4- bRT 2V + b m ( u + m ) x I n 'm
51
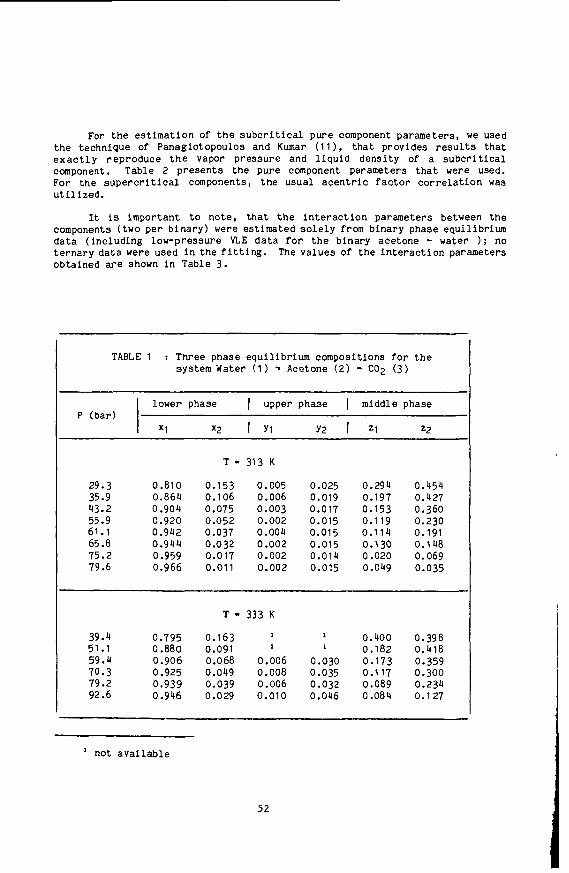
For t h e e s t i m a t i o n of t h e s u b c r i t i c a l pure component parameters , we used t h e technique of Panagiotopoulos and Kumar (1 1 ) , t h a t provides r e s u l t s t h a t e x a c t l y r ep roduce t h e vapor pressure and l i q u i d d e n s i t y of a s u b c r i t i c a l component. Table 2 p r e s e n t s t h e pu re component parameters t h a t were used. For t h e s u p e r c r i t i c a l components, t h e usua l a c e n t r i c f a c t o r c o r r e l a t i o n was u t 11 ized.
It is impor t an t t o n o t e , t h a t t h e i n t e r a c t i o n parameters between t h e components ( two per b i n a r y ) were e s t ima ted s o l e l y from binary phase equi l ibr ium da ta ( i n c l u d i n g low-pressure VLE d a t a f o r t h e b ina ry acetone - water ) ; no t e r n a r y d a t a were used i n the f i t t i n g . The v a l u e s of t h e i n t e r a c t i o n parameters obtained a r e shown i n Table 3.
TABLE 1 : Three phase equ i l ib r ium compositions f o r t h e s y s t e m Water ( 1 ) + Acetone (2) - C02 (3)
lower phase I upper phase I middle phase P (ba r )
x2 I y1 Y2 I z1 22
T = 313 K
29.3 35.9 43.2 55.9 61.1 65.8 75.2 79.6
0.810 0.864 0 .go4 0.920 0.942 0.944 0.959 0.966
0.153 0.106 0.075 0.052 0.037 0.032 0.017 0.01 1
0.005 0.006 0.003 0.002 0.004 0.002 0.002 0.002
0.025 0.019 0.017 0.015 0.015 0.015 0.014 0.015
0.294 0.197 0.153 0.119 0.114 0.130 0.020 0.049
0.454 0.427 0.360
0.191 0.148 0.069 0.035
0.230
T = 333 K
1
I 0.400 0.398 0.182 0.418
39.4 0.795 0.163 51.1 0.880 0.091 59.4 0.906 0.068 0.006 0.030 0.173 0.359 70.3 0.925 0.049 0.008 0.035 0.117 0.300 79.2 0.939 0.039 0.006 0.032 0.089 0.234 92.6 0.946 0.029 0.010 0.046 0.084 0.127
not a v a i l a b l e
52
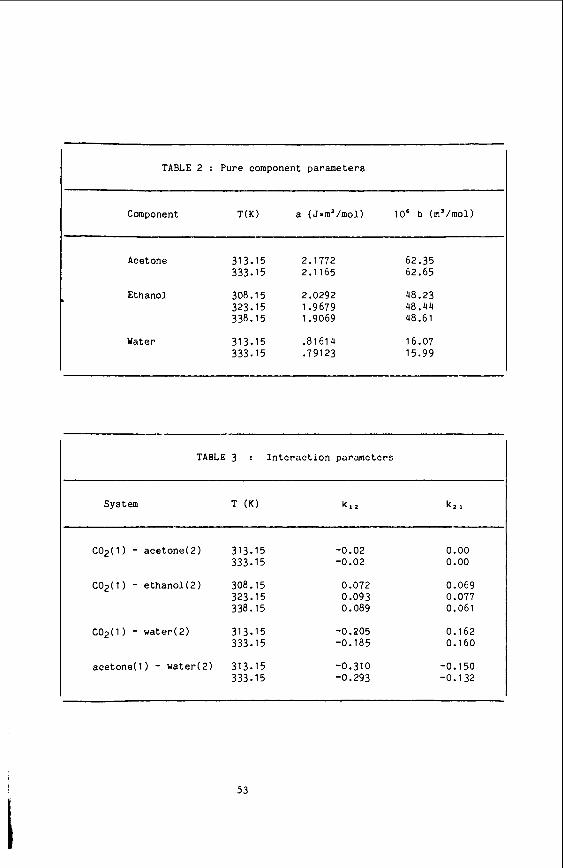
TABLE 2 : Pure component parameters
- Component T(K) a (Jxm’/mol) lo6 b (m’/mol)
Acetone 313.15 2.1772 62.35 333.15 2.1165 62.65
Ethanol 308.15 2.0292 48.23
338.15 1.9069 48.6 1
Water 313.15 .8161 4 16.07 333.15 .79123 15.99
323.15 1.9679 48.44
TABLE 3 : Interaction parameters
co2(1) - acetone(2) 313.15 333.15
C02(1) - ethanol(2) 308.15 323.15 338.15
acetone(1) - uater(2) 313.15 333.15
-0.02 -0.02
0.072 0.093 0.089
-0.205 -0.185
-0.310 -0.293
0.00 0.00
0.069 0.077 0.061
0.162 0.160
-0.150 -0.132
53
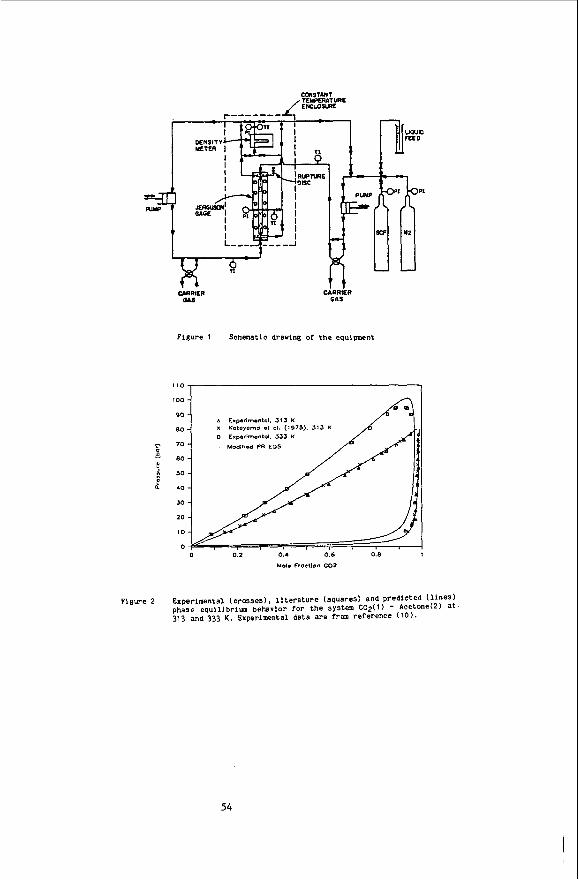
CeRRlER as GAS
Figure 1 Schematlc draulng of the equipment
110 I
Figure 2
100
SO
80
70
60
so
40
30
20
IO
0 0 0.2 0.4 0.6 0.8 1
Mol. FrocUon C 0 2
Experimental ( crosses ) , l l t era ture (squares) and predicted (lines) phase equlllbrium behavior ror the system CO2(1) - Acetone(2) at 313 and 333 K . Experimental data are from reference (10).
54
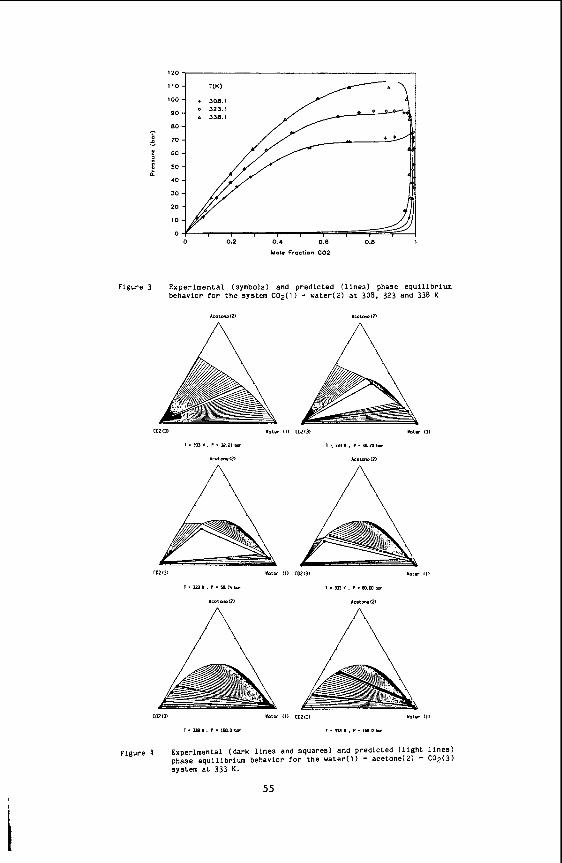
Figure 3
0 0.2 0.4 0.6 0.8 1
Mol. Fraction COZ
Experimental (symbols) and predicted ! l i n e s ) phase equilibrium behavior for the system C02(1 ) - uater(2) a t 308, 323 and 338 K
A F ~ L D M I Z I I r o l m l 2 1
A A CD213) h l W 11) to2131 uatw 111
I . 333 K . P - U a P br 1 . = K , ?. I s O b r
Figure 4 Experimental (dark l ines and squares) and predicted ( l i g h t l i n e s ) phase egullibrium behavior for the Water(1) - acetone(2) - COz(3) system a t 333 K .
55
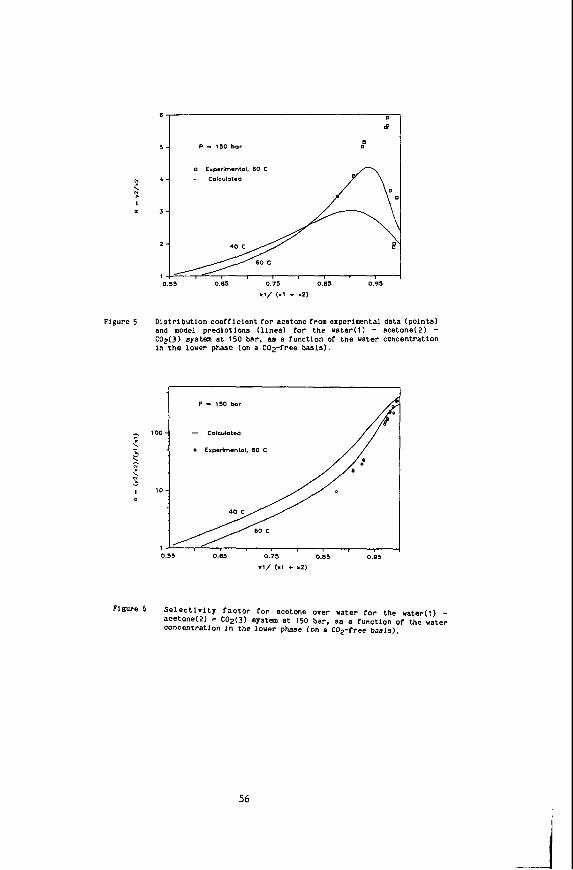
: :: I Y
5 -
0
B
I P - 150 bo7 m
Flgure 5 Distribution coefficient for acetone from experimental data (points) and model predlctlons (lines) for the uater(1) - acetone(2) - C02(3) system at 150 bar, BS a function of the water concentration in the lower phase (on a COZ-free basis).
P - 150 bo,
- Colsulotod I 100
X l / ( i l + r2)
Figure 6 Selectivity factor for acetone over water lor the water(1) - acetone(2) 7 COz(3) system at 150 bar, as a function of the water concentration l n the lower phase (on a COZ-free basis).
56
Mu1 t i phase Behavior i n Ternary Mix tu res o f Elevated Pressures
J. R. DiAndreth and M. E. P a u l a i t i s
Department o f Chemical Engineer ing U n i v e r s i t y o f Delaware Newark, Delaware 19716
INTRODUCTION
Separat ions us ing s u p e r c r i t i c a l o r n e a r - c r i t i c a l f l u i d s as so lvents a re f requen t l y c a r r i e d o u t i n t h e presence o f water. E x t r a c t i o n o f products from fe rmenta t ion bro ths , t e r t i a r y o i l recovery by C02 f lood ing , and s u p e r c r i t i c a l - f l u i d (SCF) chromatography are examples o f separa t ions i n which water can be present. Such systems w i l l o f t e n e x h i b i t phase behavior i n which severa l c o e x i s t i n g f l u i d phases a r e present a t equ i l i b r i um. For example, ex tens i ve regions o f l i q u i d - l i q u i d - g a s e q u i l i b r i u m have been observed f o r water-alcohol-SCF m ix tu res (1-3), and even f o u r coex is t i ng phases ( l i q u i d - i u id - l i qu id -gas ) have been observed f o r n-propanol-water-C02 m i x t ,res{ 47.
There are severa l p r a c t i c a l i m p l i c a t i o n s o f three-phase, 1 i q u i d - 1 iqu id -gas equ i l i b r i um. For convent iona l e x t r a c t i o n processes, i t i s d e s i r a b l e t o avo id such regimes, o r i n t h e case o f C02 f l o o d i n g o f o i l r ese rvo i r s , t o accu ra te l y account f o r m u l t i p l e phases i n de termin ing e x t r a c t i o n e f f i c i e n c y . A l t e r n a t i v e l y , t h e fo rmat ion o f two l i q u i d phases i n t h e presence o f a compressed gas can be e x p l o i t e d t o achieve a des i red separat ion.
phase e q u i l i b r i a a t e leva ted pressures f o r t h e system isopropanol-water-C02. These r e s u l t s i n c l u d e measured e q u i l i b r i u m composi t ions f o r two, th ree , and f o u r c o e x i s t i n g f l u i d phases over a range o f temperatures and pressures i n t h e v i c i n i t y o f t h e c r i t i c a l p o i n t o f CO2. e q u i l i b r i a f o r t h i s three-component system i s a l s o presented. The s imu la t ion , which i s based on t h e Peng-Robinson equat ion of s t a t e ( 7 ) and t h e exper imental r e s u l t s , d m n s t r a t e s t h e complex i ty o f phase behavior t h a t can be ob ta ined f o r aqueous s o l u t i o n s i n t h e presence o f SCF solvents. This phase behav io r must be understood f o r c o r r e c t i n t e r p r e t a t i o n o f SCF e x t r a c t i o n experiments, and f o r design o f separa t ion processes us ing s u p e r c r i t i c a l o r n e a r - c r i t i c a l so l ven ts a t e leva ted pressures.
I n t h i s paper, we present t h e r e s u l t s o f an i n v e s t i g a t i o n o f f l u i d
A computer s imu la t i on o f t he phase
EXPERIMENTAL SECTION
Phase composi t ions ( t i e l i n e s ) f o r l i qu id -gas e q u i l i b r i u m were measured u s i n g a f low techn ique f o r m ix ing and f o r cont inuous sampling o f t h e phases. E q u i l i b r i u m composi t ions f o r t h r e e and f o u r c o e x i s t i n g phases were ob ta ined u s i n g a s t a t i c techn ique w i t h a var iable-volume view c e l l . Th is technique
57
i nvo l ved c a l c u l a t i n g phase composi t ions f rom component ma te r ia l balances and measured phase volumes a t known Ce l l loadings; no sampling o f t h e i n d i v i d u a l phases i s r e uired. Both exper imental techniques are descr ibed i n d e t a i l e l sewhere (5~ z 1.
Phase composi t ions f o r l i qu id -gas and l i q u i d - l i q u i d - g a s e q u i l i b r i a were F igure 1 measured as a f u n c t i o n o f pressure a t several constant temperatures.
shows these r e s u l t s f o r 60°C i n t h e form o f t r i a n g u l a r phase diagrams corresponding t o d i f f e r e n t pressures. t h e three-phase t r i a n g l e s a t t h e i n te rmed ia te pressures have been omi t ted f o r c l a r i t y . F igu re 2 g i ves t h e measured composi t ions o f these phases a t 40°C and 1110 psia.
The two-phase regions which bound
A t lower temperatures, four e q u i l i b r i u m phases were observed, and
EQUILIBRIUM PHASE BEHAVIOR
The phase behav io r dep ic ted i n F igure 1 shows a dramatic s h i f t i n the t i e l i n e s f o r l i qu id -gas e q u i l i b r i u m as pressure i s changed from 1500 ps ia t o 2000 psia. A t t he lower pressure, t he s o l u b i l i t i e s o f water and isopropanol i n s u p e r c r i t i c a l C02 a r e low, al though t h e s e l e c t i v i t y f o r t h e a l coho l i s high. A t 2000 psia, h i g h s o l u b i l i t i e s a re ob ta ined w i t h lower a lcoho l s e l e c t i v i t i e s . A cont inuous s h i f t i n g of t h e t i e l i n e s between these two pressures can no t ob ta ined, however, as th ree c o e x i s t i n g phases emerge a t i n te rmed ia te pressures. s p l i t s i n t o two l i q u i d phases a t a pressure between 1500 and 1600 p s i a (a c r i t i c a l endpoint) . As pressure i s increased fu r the r , t h e composi t ion o f the l i q u i d phase o f i n te rmed ia te dens i ty , L2, approaches t h a t o f t h e carbon d i o x i d e - r i c h gas phase, and t h e a lcoho l concent ra t ion i n i t i a l l y increases and then decreases. s i n g l e f l u i d phase (another c r i t i c a l endpoint) a t a pressure j u s t below 2000 ps ia .
p r o p e r t i e s o f C02 can be changed s i g n i f i c a n t l y over a r e l a t i v e l y small p ressure range. Thus so l ven t /ex t rac t separa t ion can be e a s i l y achieved, and an opt imal r a t i o o f so l ven t capac i ty t o s e l e c t i v i t y can p o t e n t i a l l y be se lec ted , depending on whether th ree c o e x i s t i n g phases can be avoided i n the separa t ion process. separa te o t h e r components t h a t would be present i n d i l u t e aqueous s o l u t i o n by d i s t r i b u t i n g these components between t h e L1 and L2 phases. The advantage o f such a separat ion would i nc lude (1) moderate opera t ing temperatures and pressures, (2) t h e a b i l i t y t o con t ro l t h e composi t ion o f t h e i n te rmed ia te phase w i th pressure, ( 3 ) t h e complete r e v e r s i b i l i t y o f t he phase s p l i t t i n g , and (4) the a b i l i t y t o fo rm two l i q u i d phases w i t h components t h a t a re s i m i l a r i n molecular nature.
phase behavior f o r t h i s t e r n a r y m ix tu re can be q u i t e complex a t cond i t i ons near t h e c r i t i c a l p o i n t o f C02. f o r t h i s system, t h e Peng-Robinson equat ion o f s t a t e was f i t t o t h e
With i nc reas ing pressure, t h e wa te r - r i ch l i q u i d phase
Even tua l l y t h e L2 phase and the gas phase merge t o form a
One p r a c t i c a l i m p l i c a t i o n o f t h i s phase behavior i s t h a t the so lvent
It i s a l s o poss ib le t o use t h e two l i q u i d phases t o
The four-phase e q u i l i b r i u m i l l u s t r a t e d i n F igu re 2 suggests t h a t t h e
I n order t o descr ibe global phase e q u i l i b r i a
58
exper imental r e s u l t s and than used t o p r e d i c t phase behav io r over an extended reg ion o f temperatures and pressures. D e t a i l s o f these c a l c u l a t i o n s a re g iven elsewhere(6). isopropanol-water-C02 i s g iven i n F igure 3. Th is p r o j e c t i o n dep ic t s t h e four-phase (LLLG) l i n e f o r t h e te rna ry m ix tu re , t h e three-phase (LLG) l i n e f o r t h e b i n a r y water-C02 system, t h e vapor pressure curve f o r carbon d iox ide (CO2 VP), and t h e l i q u i d - g a s and l i q u i d - l i q u i d c r i t i c a l l i n e s (dashed l i n e s ) which bound t h e three-phase reg ions f o r t he t e r n a r y mixture.
Two impor tan t aspects o f t he phase behav io r a re ev ident from t h i s p ro jec t i on . F i r s t , t h e three-phase reg ion extends t o r e l a t i v e l y h igh temperatures and pressures; t h a t i s , t h e mul t iphase behavior i s no t l i m i t e d t o cond i t ions c lose t o t h e c r i t i c a l p o i n t o f C02. pressures near t h i s c r i t i c a l p o i n t , t h e phase behavior can be q u i t e complex. Four d i f f e r e n t three-phase reg ions bound t h e four-phase l i n e , and t h e r e a re f i v e d i f f e r e n t two-phase reg ions which bound these three-phase regions. Obviously, simp1 e screening experiments on t h i s three-component system t o o b t a i n " rep resen ta t i ve " a lcoho l /water s o l u b i l i t i e s i n compressed COP c o u l d g i ve d ramat i ca l l y d i f f e r e n t r e s u l t s depending on t h e temperature, pressure, and m i x t u r e composi t ion examined. A t temperatures below 20°C, even m r e complex behavior i s poss ib le s ince a s o l i d hydra te phase can a l s o be obtained.
The c a l c u l a t e d pressure-temperature p r o j e c t i o n fo r
Second, a t temperatures and
I n conclusion, our exper imental r e s u l t s and model c a l c u l a t i o n s deimnstrate t h a t complex mu1 t i phase behav io r can occur f o r m ix tu res con ta in ing water and s u p e r c r i t i c a l o r n e a r - c r i t i c a l f l u i d s a t e leva ted pressures. The a b i l i t y t o p r e d i c t such behav io r i s an impor tan t f a c t o r i n i n t e r p r e t t i n g s o l u b i l i t y behavior f o r SCF so l ven t e x t r a c t i o n s and f o r t h e design o f separa t ion processes us ing dense f l u i d s a t e leva ted pressures. form two l i q u i d phases i n t h e presence o f a compressed gas can a l s o be e x p l o i t e d t o achieve a des i red separa t ion o f n o n v o l a t i l e components i n d i l u t e aqueous s o l u t i o n s where i t i s not poss ib le t o d i sso l ve these components i n a dense f l u i d such as compressed CO2.
The a b i l i t y t o
REFERENCES
1.
2. Efremova, G.D.; Shvarts, A.V. Russ. J. Phys. Chem. 1970, 44, 614 and
3. P a u l a i t i s , M . E . ; G i l b e r t , M.L.; Nash, C.A. Proc. 2nd World Conference
4. Fleck, R.E. Ph.0. Thesis, U n i v e r s i t y o f C a l i f o r n i a - Berkeley, 1967.
5. Kander, R.G. Ph.D. Thesis, U n i v e r s i t y o f Delaware, 1985.
6. OiAndreth, J.R. Ph.D. Thesis, U n i v e r s i t y o f Delaware, 1985.
E lg in , J.C.; Weinstock. J.J. J. Chem. Eng. Data 1959, 4, 3.
1972, 46, 237.
o f Chemical Engineer ing, Montreal , 1981.
7. Peng, D.-Y.; Robinson, D.B. I E C Fund. 1976, 2, 59.
59
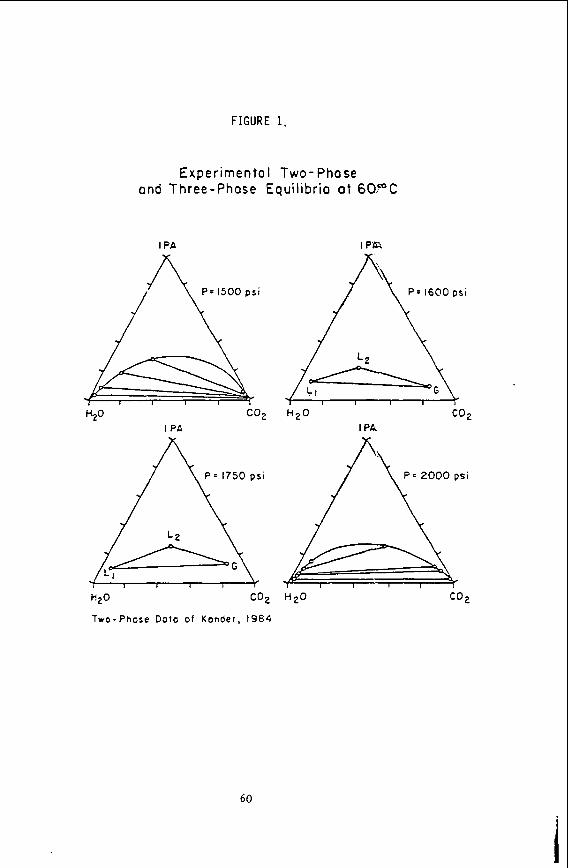
FIGURE 1.
Experiment01 Two- Phase ond Three-Phose Equilibria ot 60°C
I PA
J \
I PA
ps i
I I
H20 co2
Two-Phose Dolo of Konder , 1984
I P R
. . I I I I
H20 co2 I PI%
60
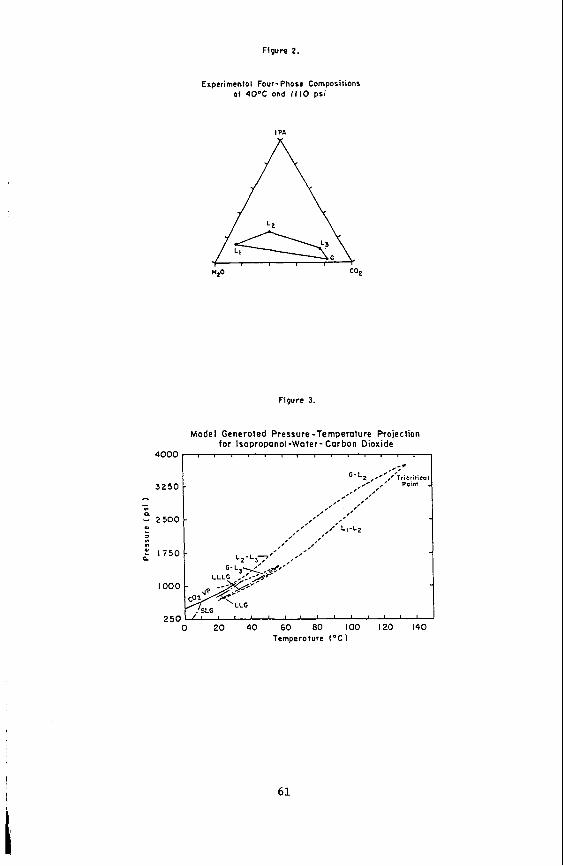
Figure 2.
Experimenlol Four- Phose Compositions o i 4 0 % ond I I10 p s i
I PA
Figure 3.
Ternperoture ( " C I
! t 61
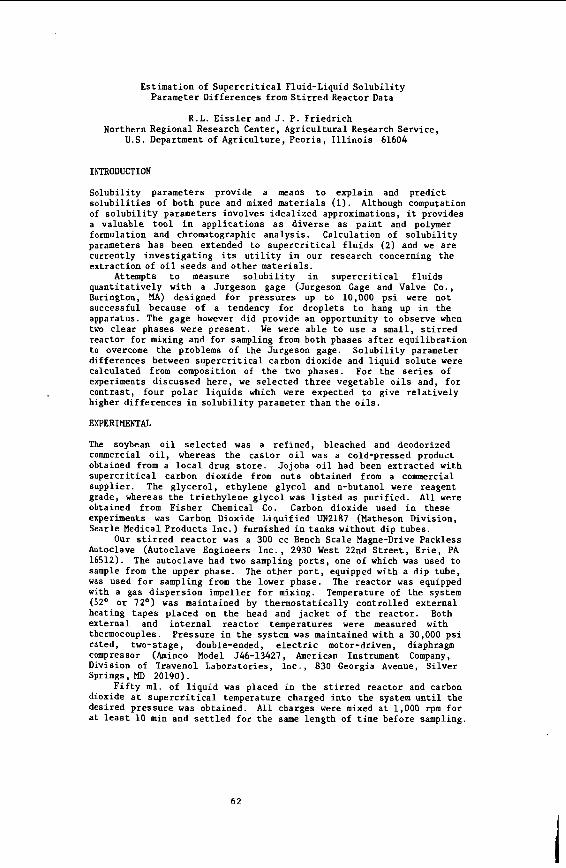
Estimation of S u p e r c r i t i c a l Fluid-Liquid S o l u b i l i t y Parameter Differences from S t i r r e d Reactor Data
R.L. E i s s l e r and J. P. Fr iedr ich Northern Regional Research Center, Agr icu l tura l Research Serv ice ,
U.S. Department of Agr icu l ture , Peor ia , I l l i n o i s 61604
INTRODUCTION
S o l u b i l i t y parameters provide a means t o expla in and p r e d i c t s o l u b i l i t i e s of bo th pure and mixed mater ia l s (1). Although computation of s o l u b i l i t y parameters involves i d e a l i z e d approximations, it provides a va luable t o o l i n appl ica t ions a s d i v e r s e a s p a i n t and polymer formulation and chromatographic ana lys i s . Calculat ion of s o l u b i l i t y parameters has been extended t o s u p e r c r i t i c a l f l u i d s (2) and we a r e cur ren t ly i n v e s t i g a t i n g i t s u t i l i t y i n our research concerning t h e ex t rac t ion of o i l seeds and o ther mater ia l s .
q u a n t i t a t i v e l y wi th a Jurgeson gage (Jurgeson Gage and Valve Co., Burington, MA) designed f o r pressures up t o 10,000 p s i were not successful because of a tendency f o r drople t s t o hang up i n t h e apparatus. The gage however did provide an opportuni ty t o observe when two c l e a r phases were present . We were a b l e t o use a small , s t i r r e d reactor f o r mixing and f o r sampling from both phases a f t e r e q u i l i b r a t i o n t o overcome the problems of the Jurgeson gage. S o l u b i l i t y parameter d i f fe rences between s u p e r c r i t i c a l carbon dioxide and l iqu id s o l u t e were calculated from composition of t h e two phases. For the s e r i e s of experiments d i scussed here , we s e l e c t e d t h r e e vegetable o i l s and, f o r cont ras t , four p o l a r l i q u i d s which were expected t o give r e l a t i v e l y higher d i f fe rences i n s o l u b i l i t y parameter than t h e o i l s .
Attempts t o measure s o l u b i l i t y i n s u p e r c r i t i c a l f l u i d s
EXPERIMENTAL
The soybean o i l s e l e c t e d was a re f ined , bleached and deodorized commercial o i l , whereas t h e c a s t o r o i l was a cold-pressed product obtained from a l o c a l drug s t o r e . Jojoba o i l had been ex t rac ted with s u p e r c r i t i c a l carbon dioxide from nuts obtained from a commercial suppl ie r . The g l y c e r o l , e thylene g lycol and n-butanol were reagent grade, whereas t h e t r i e t h y l e n e g lycol was l i s t e d a s pur i f ied . obtained from F i s h e r Chemical Co. Carbon dioxide used i n these experiments was Carbon Dioxide Liqui f ied UN2187 (Matheson Divis ion, Sear le Medical Products Inc . ) furnished i n tanks without dip tubes.
Our s t i r r e d r e a c t o r was a 300 cc Bench Scale Magne-Drive Packless Autoclave (Autoclave Engineers I n c . , 2930 West 22nd S t r e e t , E r i e , PA 16512). The autoclave had two sampling p o r t s , one of which was used t o sample from t h e upper phase. The o ther p o r t , equipped with a d ip tube, was used f o r sampling from t h e lower phase. The reac tor was equipped with a gas d i s p e r s i o n impel ler f o r mixing. Temperature of the system (52' o r 72O) was maintained by thermosta t ica l ly cont ro l led e x t e r n a l heat ing t a p e s p laced on t h e head and j a c k e t of t h e reac tor . Both ex terna l and i n t e r n a l reac tor temperatures were measured with thermocouples. ra ted , two-stage, double-ended, e l e c t r i c motor-driven, diaphragm compressor (Aminco Model 546-13427, American Instrument Company, Divis ion of Travenol Laborator ies , I n c . , 830 Georgia Avenue, S i l v e r Springs, MD 20190).
F i f t y m l . of l i q u i d was placed i n t h e s t i r r e d reac tor and carbon dioxide a t s u p e r c r i t i c a l temperature charged i n t o t h e system u n t i l t h e desired pressure was obtained. A l l charges were mixed a t 1,000 rpm f o r a t l e a s t 10 min and s e t t l e d f o r t h e same length of time before sampling.
A l l were
Pressure i n t h e system was maintained with a 30,000 p s i
62
Use of longer agitation times did not appear to change results. At least 3 and frequently 4 or more samples of each phase were taken. Pressure drops during sampling were recorded, but results were not affected by differing pressure drops. (usually the top one) were taken before sampling the other. Where a different order was followed, results were not changed.
Samples of 3.7 ml. were taken from both upper and lower phases. The apparatus provided for isolating the samples in a section of tubing by means of valves. The isolated sample was drawn off into a weighed container which allowed the carbon dioxide to come to a standard temperature and pressure and escape into another part of the apparatus for volume measurement. After rinsing the sample tube with a suitable solvent, the liquid was recovered by solvent evaporation and weighed with an analytical balance. as well as mole fractions and volume fractions in each of the phases were computed from weight, density and molecular weight. Solubility parameter differences were computed from Equation 1, which was published by Fujishiro and Hildebrand (3) for calculation of solubility parameter differences between immiscible liquids:
Normally, all samples of a phase
Molecular volumes of each of the components
1) RT 1 XIB 1 '2A
'1 '1A '2 '2B (61-62)2 = - (- In - + - In -I/($ IB-%A)
where 6 is the solubility parameter, x the mole fraction, 6 the volume fraction, T temperature and V the molecular volume. In Equation 1, subscripts 1 and 2 refer to components and A and B to phases. In our experiments, phase B was arbitrarily selected as the upper phase. This upper phase was sometimes liquid rich and sometimes carbon dioxide rich. Some systems, because of a greater change in supercritical fluid density than in liquid density, inverted within the pressure range of the experimental series.
RESULTS
Absolute values for solubility parameter differences, 1*CO,-*liq I are given in Table I. Values were computed for system pressures of 5000, 8000 and 10,000 psi for all liquids and also at 16,000 and 20,300 psi for soybean oil. When compared to the oils a greater parameter difference between polar liquids and supercritical carbon dioxide correlates with experience indicating that the latter fluid acts as a relatively non polar solvent. For the series of polar liquids solubility parameter differences were estimated at 52OC which was a convenient temperature for operation of the stirred reactor. Because we wanted to compare data for the oils with results from other experiments, measurements were taken at 71 to 72OC, although control of temperature at this s more difficult. Standard devia on fo calculated values of\'~&-%q(from the same charge was .23 calY cm -372.
DISCUSSION
Our method requires incomplete miscibility and relatively rapid attainment of equilibrium. Gage. Equilibrium is more rapidly attained in super critical fluid- liquid than in liquid-liquid systems due to greater fluidity. Phase inversion, where it occurred, was apparently at pressures far enough removed from those where solubility was measured that any increased time required to reach equilibrium did not change computed parameter differences. For most of the liquids shown in Table I parameter differences were calculated by assuming the liquids incompressible, but
Miscibility can be checked with the Jurgeson
63
where informat ion was ava i l ab le , t h e o r e t i c a l (4) o r a c t u a l (5) compress ib i l i t i e s were a l s o used. Comparison of r e s u l t s i nd ica t ed t h a t e r ro r s a r i s i n g from neg lec t of l i q u i d compress ib i l i ty were less than experimental ones. T r i a l ca l cu la t ions assuming reasonable e r r o r s (10% or l e s s ) i n determined q u a n t i t i e s of carbon dioxide and l i q u i d i n each phase a l s o f a i l e d t o produce l a r g e e r r o r s . The small change i n parameter difference r e s u l t i n g from l a r g e changes i n pressure i s a l s o i n accord with t h e o r e t i c a l ca l cu la t ions (4). Larger d i f f e rences between parameters of p o l a r l i q u i d s and s u p e r c r i t i c a l carbon dioxide than between o i l s and the same s u p e r c r i t i c a l f l u i d a l s o agrees wi th t h e experience t h a t s u p e r c r i t i c a l carbon d ioxide a c t s much l i k e a nonpolar solvent , such a s hexane, i n vegetable o i l ex t r ac t ions .
Employment o f s o l u b i l i t y parameters involves too many approximations t o provide an e x a c t method f o r p red ic t ing m i s c i b i l i t y . Resu l t s , however, are v a l i d o f t en enough t o be use fu l . In l i qu id - l iqu id systems composed of hydrocarbons and fluorocarbons, parameter d i f f e rence est imates from Equation 1 were shown t o more nea r ly r e f l e c t ac tua l d i f f e rences than calculated " theo re t i ca l " parameters based on t he geometric mean assumption and r egu la r so lu t ion theory (1 ) . Since t h e f i n a l r e s u l t of our est imate i s a n absolute value of t he d i f f e rence , we cannot t e l l from t h i s c a l c u l a t i o n which parameter has t h e higher value. Judgment concerning a c t u a l magnitudes of t h e two s o l u b i l i t y parameters can frequent ly be made from va lues f o r l i q u i d s under conventional condi t ions. For example, t h e s o l u b i l i t y parameter of s u p e r c r i t i c a l carbon dioxide can be computed from Equation 2 which was proposed by Giddings e t a 1 (2) fo r dense gases:
6 gas 1.25 Pc ' (PJ2.66) 2)
where 6 i s t h e s o l u b i l i t y parameter of t h e s u p e r c r i t i c a l f l u i d , P i t s c r i t #& p res su re , P a constant which i s e q d v a l e n t t o an average reduced dens i ty f o r t he corresponding l i q u i d . of carbon dioxide a t 52OC and 8000 p s i p ressure i s about 8 .5 c a l Values taken from l i t e r a t u r e (6) a r e 17.7, 17.1, 14.2 and 14.0 c a l fo r s o l u b i l i t y parameters of glycerol , e thylene g lyco l , t r i e t h y l e n e glycol and n-butanol, r e spec t ive ly . Values f o r l i q u i d s a r e usual ly presented f o r 25OC and one atmosphere p re s su re , but f o r most l i q u i d s they e x h i b i t on ly l i t t l e v a r i a t i o n wi th inc rease i n pressure and increase i n temperature t o 52OC.
While most data i n Table I appear reasonable, we have no explana t ion f o r t h e r e l a t i v e l y high va lues f o r e thylene glycol a t 8000 p s i . Our parameter d i f f e rences a l s o do no t exp la in the increased s o l u b i l i t y of soy o i l i n s u p e r c r i t i c a l carbon dioxide t h a t occurs a t 11000 t o 12000 p s i p re s su re ( 7 ) .
CONCLUSION
Calculated abso lu te values of s o l u b i l i t y parameter d i f f e rence f o r t he s e r i e s of po la r l i q u i d s used i n our experiment agree wel l enough with values taken o r computed from l i t e r a t u r e t o ind ica t e t h a t data from a s t i r r e d au toc lave can provide a use fu l es t imate . With s u f f i c i e n t a t t e n t i o n t o temperature, p ressure and a t ta inment of equi l ibr ium, r e s u l t s a r e reproducib le and the ca l cu la t ion does not seem unduly s e n s i t i v e t o small environmental v a r i a t i o n s . Resul t s appear t o c o r r e l a t e wel l with ex t r ac t ion experience.
i s the reduced dens i ty of t h e gas and 2.66 is Computed from Equation 2 the s o l u b i l i t y yramckyp.
-3'2
The mention o f firm names o r t r ade products does no t imply t h a t they a r e endorsed or recommended by the U.S. Department of Agr icu l ture over o the r f i rms o r s i m i l a r products not mentioned.
64
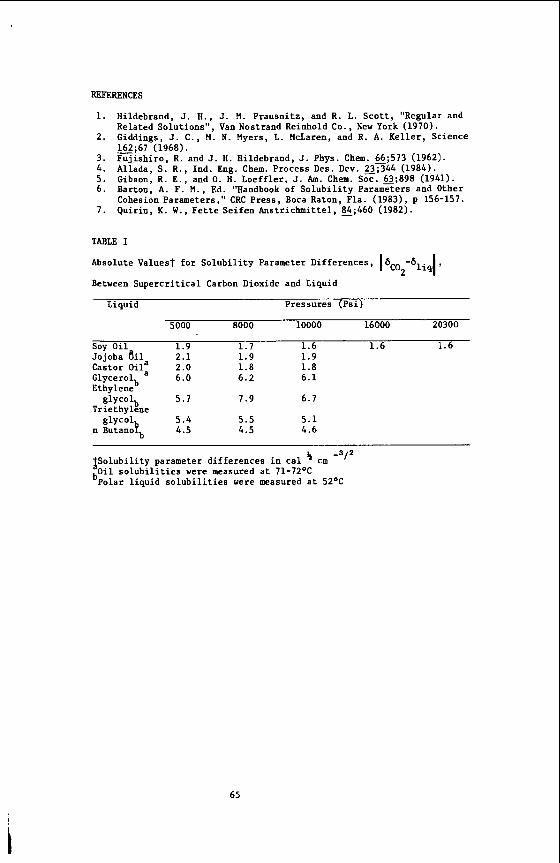
REFERENCES
1. Hildebrand, J. H., J. M. Prausni tz , and R . L. S c o t t , "Regular and Related Solut ions" , Van Nostrand Reinhold Co., New York (1970).
2. Giddings, J. C . , M. N. Myers, L . McLaren, and R. A. K e l l e r , Science 162;67 (1968).
3. w i s h i r o , R . and J. H. Hildebrand, J. Phys. Chem. %;573 (1962). 4. Allada, S. R . , Ind. Eng. Chem. Process Des. Dev. 23;344 (1984). 5. Gibson, R. E., and 0. H. Loeff le r , J. Am. Chem. SOC. @;898 (1941). 6 . Barton, A. F. M., Ed. "Handbook of S o l u b i l i t y Parameters and Other
Cohesion Parameters," CRC Press , Boca Raton, F la . (19831, p 156-157. 7. Quir in , K. W., F e t t e Se i fen Ans t r ichmi t te l , %;460 (1982).
TABLE I
Absolute Values? f o r S o l u b i l i t y Parameter Differences, I 6c02-61iql , Between S u p e r c r i t i c a l Carbon Dioxide and Liquid
Liquid Pressures (Psi)
5000 8000 10000 16000 20300
Soy Oil 1.9 1.7 1 .6 1.6 1.6
Glycerolb a 6.0 6 .2 6 . 1 Ethylene
5.7 1.9 6.7 g lycol Triethylene
g lycol 5.4 5 .5 5 . 1 n Butanolb 4.5 4.5 4.6
Jojoba a i l 2.1 1 .9 1 .9 Castor O i l a 2.0 1.8 1.8
b
-312 i s o l u b i l i t y parameter d i f fe rences i n c a l ' cm
s o l u b i l i t i e s were measured a t 71-72OC Polar l i q u i d s o l u b i l i t i e s were measured a t 52OC
65
A GTATISTICAL-MECHANICS BASED LATTICE MODEL EQUATION OF STATE: APPLICATIONS TO MIXTURES W I T H
SUPERCRITICAL FLUIDS
Sanat K.Kumar. R.C.Reid and U.W.Suter
Department of Chemical Engineering, Massachusetts I n s t i t u t e O f Technology, Cambridge, MA 02139
During t h e l a s t decade, i nc reas ing emphasis has been placed on the use of t h e equa t ion of s t a t e (EOS) approach t o model and c o r r e l a t e high- pressure phase equ i l ib r ium behaviour. More s u c c e s s f u l a p p l i c a t i o n s have employed some form of cubic EOS (1-3) a l though o t h e r s (e.g.. 4 ) have been proposed. However. as the types of systems s t u d i e d have become more complex, t h e inhe ren t weaknesses o f a cub ic EOS have become apparent . We, in p a r t i c u l a r , a r e i n t e r e s t e d i n s tudy ing phase behaviour of systems comprising polymer molecules i n t h e presence of a s u p e r c r i t i c a l f l u i d . Here t h e s i z e d i s p a r i t y of the component molecules can be l a r g e . One approach would have been t o adopt t h e modified per turbed hard cha in theory (5.6) which has been adapted f o r mixtures of l a r g e and smal l hydrocarbon molecules. We, however, e l ec t ed t o study whether l a t t i c e theory models could be of va lue f o r systems of our i n t e r e s t . S tud ie s based on t h i s approach, have been attempted f o r d i f f e r e n t s y s t e m s (7-1 1 ) , and a n i n t e r e s t i n g gene ra l model proposed by Panayiotou and Vera (12 ) . Our approach is s i m i l a r i n many r e s p e c t s t o the l a s t re fe rence although s i g n i f i c a n t d i f f e r e n c e s appear i n t r e a t i n g mixtures.
Pure Components
Theory
Molecules a r e assumed t o ttsitlf on a l a t t i ce of coord ina t ion number z and of c e l l s i z e VH. Each molecule ( spec ie s 1 ) is assumed t o occupy r1 sites (where r1 can b e f r a c t i o n a l ) , and t h e l a t t i ce has empty sites c a l l e d holes . There a r e NO holes and N1 molecules. To account f o r the connec t iv i ty of t h e segments o f a molecule, a n e f f e c t i v e chain l e n t h q1 is def ined as,
zql - zr1 - 2r l 2 1 )
wherein i t has been assumed that cha ins a r e not c y c l i c . zq1 now rep resen t s t h e effective number of e x t e r n a l c o n t a c t s per molecule . The i n t e r a c t i o n energy between segments of molecules is denoted by -EI 1 , while the i n t e r a c t i o n energy of any species w i t h a h o l e is zero. Only n e a r e s t neighbour i n t e r a c t i o n s are cons idered , and pairwise a d d i t i v i t y is assumed. The canonica l p a r t i t i o n func t ion for t h i s ensemble can be formal ly r ep resen ted as:
66
where 6- l/kT. On the assumption of random mixing of ho les and molecules. and followlng the approach of Panayiotou and Vera (12) , we ob ta in an express ion f o r Q which is v a l i d o u t s i d e t h e c r i t i c a l r eg ion of t h e pure Component. i.e.,
where 6 is t h e number of i n t e r n a l arrangements of a molecule and a a symmetry f ac to r . Using the fo l lowing reducing parameters
( 2 / 2 ) ~ 1 1 - P’VH - RT* 4 )
and de f in ing 1, the t o t a l volume of t h e system,
an EOS t h a t de f ines the pu re component is obta ined , i.e.,
= - P T v - 1 V T
” ” - e2 - 1 - - i n ( A ) + : i n ( v + ( q / r ) - 1
Here e is the e f f e c t i v e s u r f a c e f r a c t i o n of molecules and the t i l d e (-1 denotes reduced va r i ab le s . All q u a n t i t i e s except v , i n the EOS are reduced by t h e parameters i n Eq.(4). The s p e c i f i c volume v, is reduced by v* , the molecular hard-core volume,
Vi - NlrlVH 7)
Expressions for the chemical p o t e n t i a l of a pure component can a l s o be der ived from Eq. (3 ) and s tandard thermodynamics (13) .
Determination of pu re component parameters
In order t o use t h e obta ined EOS t o model r e a l subs tances one needs t o ob ta in ‘11 and v*. For a pure component below its c r i t i c a l po in t , a technique suggested by Jo f fe e t al.. (14) was used. Th i s involves the matching o f chemical p o t e n t i a l s of each component i n the l i q u i d and t h e vapour phases a t t h e vapour p re s su re of the substance. Also t he a c t u a l and p red ic t ed s a t u r a t e d l i q u i d d e n s i t i e s were matched. The set of equat ions s o obta ined were solved by the , use of a s t anda rd Newtons method t o y i e l d t h e pure component para- meters. Values of €11 and vi f o r e thanol and water a t s e v e r a l t empera tures are shown i n Table 1. I n t h i s c a l c u l a t i o n VH and z were set at 9.75 x m3 mole-1 and 10, r e s p e c t i v e l y ( 1 2 ) . The c a p a b i l i t y of the l a t t i c e EOS t o
67
fi t pure component VLE was found t o be q u i t e i n s e n s i t i v e t o v a r i a t i o n s i n z ( 6 ~ 2 ~ 2 6 ) and VH ( 1 .Ox 10-7 m 3 m 0 l e - ~ < v ~ < 1 . 5 ~ 10-5 m3mole-l).
For SCF, t h e pure component parameters were obta ined by f i t t i n g P-v d a t a on a n isotherm. Prel iminary d a t a for t h e s e subs tances sugges t t h a t although the computed vi is a f u n c t i o n of temperature , €11 is a constant w l t h i n r e g r e s s i o n e r r o r .
Discussion
I n order t o q u a l i t a t i v e l y understand t h e behaviour of t h e l a t t i c e WS. i t was examined i n t h e l i m i t of small molecules ( q,r - 1 ) . I n t h i s c a s e Eq.(6) s i m p l i f i e s t o the form,
., - 1 ) - - P :: - I n ( - v
T v - 1 T v2
The f irst term can be i d e n t i f i e d w i t h a "hard-sphereff repuls ion term, whi le t h e second acconts for a t t r a c t i v e forces . The second term can be r e w r i t t e n as.
( P*V*2) a
R T V2 V2 B - - Pa v
z a E i - . - 9)
Thus, t h e a t t r a c t i v e term represented i n Eq.(9) has t h e same form as the a t t r a c t i v e term in t h e van d e r Waals EOS (15) . On examining t h e data i n Table 1 , and computing t h e parameter a i n Eq.(9) , i t was found t h a t f o r v a r i a t i o n s of up t o 150K. the v a r i a t i o n of t h i s parameter was always less than 31, a l though t h e computed values of v* and €11 themselves showed a 7% v a r i a t i o n . I n t h e l i m i t of small molecules , t h e r e f o r e , the l a t t i c e EOS has a term t h a t approximates t h e van d e r Waals t y p e a t t r a c t i v e term closely.
The behaviour of t h e r e p u l s i v e term of t h e l a t t i c e EOS is more complicated and w i l l n o t be d iscussed i n d e t a i l . A t l i q u i d - l i k e d e n s i t i e s t h i s repuls ion term i s a b e t t e r approximation t o t h e hard spheres r e p u l s i o n than the van de r Waals r e p u l s i o n term. A t gas - l ike d e n s i t i e s , however, the oppos i te behaviour is observed.
Binary Uixtures
Theory:
Consider a mixture of NO holes , N1 molecules of s p e c i e s 1 and N2 molecules of s p e c i e s 2. Following Panayiotou and Vera ( 1 2 ) t h e fol lowing mixing ru les a r e assumed for t h e mixture parameters FM, qM and vM*.
rM = 1 x i Pi 10)
68
I
I
j I
I ! I
i
I I
1
1
12)
L a t t i c e coord ina t ion numbers ( 2 ) and t h e c e l l volumes ( V H ) f o r both t h e Pure components and mixture l a t t i c e s a r e assumed t o have t h e same value. The P a r t i t i o n func t ion f o r t h i s ensemble can be formulated following Eq.(2). I t is assumed now t h a t t h e p a r t i t i o n func t ion , f a r from t h e b inary c r i t i c a l Poin t can be approximated by its l a r g e s t term. S ince molecule segments and ho le s can d i s t r i b u t e themselves nonrandanly, t h e p a r t i t i o n f u n c t i o n must i nco rpora t e terms t o account f o r t h i s e f f e c t . The nonrandomness c o r r e c t i o n r i j allows f o r d i s t r i b u t i o n of t h e segments of spec ie s i about t h e segments Of spec ie s j over t he random values of such con tac t s . I t is def ined through t h e equat ion
where N i j is t h e a c t u a l number of i-j c o n t a c t s and N i j o is t h e number of i-j con tac t s i n t h e completely random case. Expressions f o r t h e nonrandomness c o r r e c t i o n m u s t be obtained through t h e s o l u t i o n of t h e "quasichemical" equa t ions ( l6 ) . These equat ions can be so lved i n a c losed a n a l y t i c form only i n t h e case of a two component system. I n o rde r t o ensure t h e mathematical t r a c t a b i l i t y o f t h e b i n a r y r e s u l t s , i t is t he re fo re assumed t h a t ho le s d i s t r i b u t e randomly w h i l e molecules do not .
The s o l u t i o n f o r t h e quasichemical express ions f o r t h e pseudo two component system y i e l d s a n expression f o r t h e nonrandomness co r rec t ion r i j . which can be represented mathematically a s ,
- 8 1 is t h e su r face f r a c t i o n of i molecule segments on a hole- f ree b a s i s a n d e is t he t o t a l s u r f a c e a rea f r a c t i o n of molecule segments. Eq.(16) immediately sugges ts a combining rule f o r €12 as a measure of t h e depa r tu re of t h e mixture from randomness, i .e . ,
The mixing r u l e for E a r i s e s n a t u r a l l y through t h e formula t ion of t h e canonical p a r t i t i o n func t ion , i . e . ,
! 6 9
An EOS for t h e mixture and chemical p o t e n t i a l s f o r component i i n t he mixture can now be der ived u s i n g s t a n d a r d thermodynamics.
- - - e2 r22 - I e2 (262i- 5,) + 0.5zqi[ En - r22Ln -
r12
el ( 2 6 1 1 - e2
where p i r e p r e s e n t s the chemical p o t e n t i a l of component i i n a binary mixture, j - 3 - i and ACT) is some universa l temperature funct ion. 6 i j is t h e Dirac-delta funct ion. Parameters used for obta in ing t h e s e equat ions i n a dimensionless form a r e def ined i n manner analogous t o Eq.(4).
The mixture EOS [Eq. ( l g ) ] has the three terms t h a t a r e present i n the pure component EOS. Also, i t has an a d d i t i o n a l term which accounts f o r t h e nonrandomness c o r r e c t i o n s t h a t have been incorporated i n t o t h e p a r t i t i o n f u n c t i o n express ion . This l as t term, fo r a l l c a s e s tested, is a l w a y s a t
70
least 4 orde r s of magnitude smaller than t h e o t h e r three te rms and can e f fec- t i v e l y be neglec ted . However, i t is r e t a i n e d f o r the sake of mathematical consistency.
Resu l t s and Discussion
The express ions der ived f o r t h e EOS and the chemical p o t e n t i a l of component i i n a b ina ry mixture were used t o model the phase e q u i l i b r i a of b inary mixtures. A set of non- l inear equat ions was obta ined and so lved by the use of a Newton's method.
Mixtures of small molecules (acetone-benzene, ethanol-water) were considered f i r s t . I n F igures 1 and 2 , a comparison is made between t h e pred ic ted and experimental l o r p r e s s u r e VLE d a t a (17,18) f o r these systems. An e x c e l l e n t fit t o the da ta is obta ined in both cases, w i t h t h e use of one apparent ly temperature independent parameter ( k i j ) pe r binary.
The i n t e r e s t i n g a spec t of t h i s modelling is the tempera ture indepen- dence of k i j . I t was shown e a r l i e r t h a t , i f the pure components were small molecules, t h e l a t t i c e EOS has a n a t t r a c t i v e term w i t h an e s s e n t i a l l y temp- e r a t u r e independent s. Extending t h i s argument t o mixtures r e s u l t s i n the p red ic t ion of t h e temperature independence of k i j f o r binary mixtures of small molecules. A t empera ture independent i n t e r a c t i o n parameter is a proper ty of t h e binary, which could , i n concept, be c a l c u l a t e d by group con t r ibu t ion techniques. T h i s scheme, i f implemented, would make the modelling technique a p r e d i c t i v e one.
In examining t h e s e n s i t i v i t y of t h e model t o t h e assumed va lue of z , i t was found f o r the ethanol-water system tha t the model p red ic t ions were i n s e n s i t i v e t o the z value i n the v i c i n i t y of 2-10. For l a r g e va lues of z (z>15) , however, i t was found tha t the model was incapable of even q u a l i t a t i v e l y p r e d i c i t i n g mixture VLE behaviour.
The a p p l i c a b i l i t y of the l a t t i ce EOS i n the modelling o f the VLE of mixtures of molecules of d i f f e r e n t s i z e s was examined next . The results f o r t h e H2S-2-heptane system a t 310K and 352K are shown i n F igure 3 (19) . For t h e temperatures modelled, it is seen t h a t t h e r e is a good agreement between the p red ic t ion and t h e experimental d a t a , aga in w i t h the use of one temperature independent b inary i n t e r a c t i o n parameter.
The l a t t i c e model t h u s provides t h e c a p a b i l i t y t o ob ta in good, q u a n t i t a t i v e f i t s t o experimental VLE data f o r b ina ry mixtures of molecules be low t h e i r c r i t i c a l po in t . Its va lue l i es i n t h e f a c t t h a t i t performs equa l ly well r e g a r d l e s s of the size d i f f e r e n c e s between the component molecules.
The model was then extended t o t h e phase equ i l ib r ium modelling of s o l i d - s u p e r c r i t i c a l f l u i d (SCF) b i n a r i e s . In F igu res 4 and 5 , the model behaviour is compared t o experimental data f o r t h e naphthalene-carbon d ioxide b ina ry a t 308 and 318K respec t ive ly . Outs ide the c r i t i c a l reg ion , the la t t ice EOS provides a good f i t t o t h e measured data (20). The k i j values , however,
71
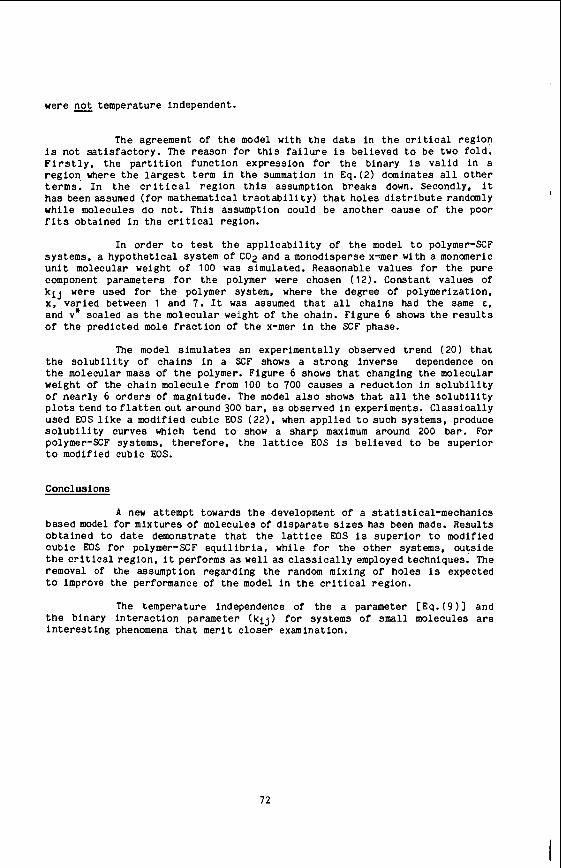
were not t empera ture independent.
The agreement of t h e model wi th t h e data in t h e c r i t i c a l reg ion is n o t s a t i s f a c t o r y . The reason fo r t h i s f a i l u r e is bel ieved t o be two fo ld . F i r s t l y , t h e p a r t i t i o n f u n c t i o n express ion f o r t h e b inary is v a l i d i n a r e g i o n where the l a r g e s t term i n the summation i n Eq.(2) dominates a l l o t h e r terms. I n t h e c r i t i c a l r eg ion t h i s assumption breaks down. Secondly, it
whi l e molecules do not. Th i s assumption could be another cause of t h e poor fits obta ined i n t h e c r i t i c a l region.
I
has been assumed ( f o r mathematical t r a c t a b i l i t y ) t h a t h o l e s d i s t r i b u t e randomly {
In o rde r t o tes t t h e a p p l i c a b i l i t y of t h e model t o polymer-SCF systems. a hypo the t i ca l system of CO2 and a monodisperse x-mer w i t h a monomeric u n i t molecular weight of 100 was simulated. Reasonable va lues f o r the pure component parameters for t h e polymer were chosen (12) . Constant va lues of
were used f o r t h e polymer system, where t h e degree of polymerization, :'varied between 1 and 7. I t was assumed t h a t a l l cha ins had t h e same E, and v* sca l ed as the molecular weight of t h e chain. F igure 6 shows t h e r e s u l t s of t h e pred ic ted mole f r a c t i o n of t h e x-mer i n t h e SCF phase.
The model s imula t e s an exper imenta l ly observed t r end (20) t h a t the s o l u b i l i t y of cha ins i n a SCF shows a s t r o n g inve r se dependence on t h e molecular mass of the polymer. F igure 6 shows t h a t changing t h e molecular weight of t h e cha in molecule from 100 t o 700 causes a reduct ion i n s o l u b i l i t y of nea r ly 6 o rde r s of magnitude. The model a l s o shows t h a t a l l t h e s o l u b i l i t y p l o t s tend t o f l a t t e n ou t around 300 ba r , as observed i n experiments. C l a s s i c a l l y used EOS l i k e a modified cubic EOS (22) . when app l i ed t o such systems, produce s o l u b i l i t y curves which t end t o show a sha rp maximum around 200 bar . For polymer-SCF systems, t h e r e f o r e , the l a t t i ce EOS is be l i eved t o be supe r io r t o modified cubic EOS.
Conclusions
A new a t tempt towards t h e development of a s t a t i s t i ca l -mechan ics based model f o r mixtures of molecules of d i s p a r a t e s i z e s has been made. Resul t s ob ta ined t o date demonstrate t h a t t h e l a t t i ce EOS is s u p e r i o r t o modified c u b i c EOS f o r polymer-SCF e q u i l i b r i a , while for t h e o t h e r systems, ou t s ide t h e c r i t i c a l r eg ion , it performs as well as c l a s s i c a l l y employed techniques. The removal of t h e assumption regard ing t h e random mixing of h o l e s is expected t o improve t h e performance of t h e model i n t h e c r i t i ca l reg ion .
The tempera ture independence of t h e a parameter CEq. (9 1 and t h e binary i n t e r a c t i o n parameter ( k i j ) f o r systems of small molecules a r e i n t e r e s t i n g phenomena t h a t mer i t c l o s e r examination.
72
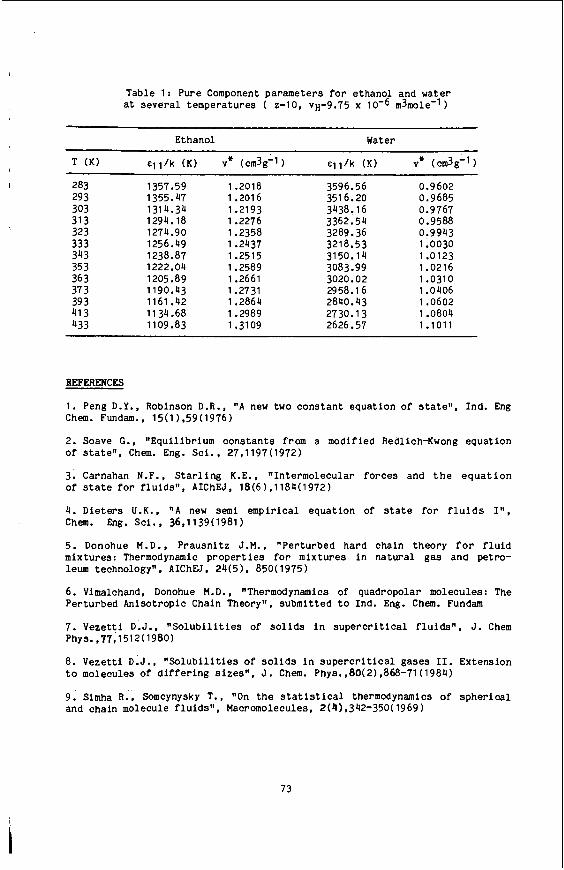
I
Table 1: Pure Component parameters f o r e thanol and water at s e v e r a l t empera tures ( 2-10, VH-9.75 x 10⁻⁶ m3mole-1)
Ethanol Water
~~~ ~
283 1357.59 1.2018 3596.56 0.9602 29 3 1355.47 1.201 6 3516.20 0.9685 303 1314.34 1.2193 3438.16 0.9767 31 3 1294.18 1.2276 3362.54 0.9588 323 1274.90 1.2358 3289.36 0.9943 333 343 35 3 36 3 37 3 39 3 41 3
256.49 238.87 222.04 205.89 190.43 161.42 134.68
.2437 32 18.53
.2515 3150.14
.2589 3083.99
.2661 3020.02
.2731 2958.16
.2864 2840.43
.2989 2730.13
.0030
.0123
.0216
.0310
.0406
.0602
.0804 431 1109.83 1 .YO9 2626.57 1.1011
REFERENCES
1. Peng D.Y., Robinson D.R., " A new two cons t an t equat ion of state". Ind. Eng Chem. Fundam.. 15(1),59(1976)
2. Soave G., gvEquilibrium cons tan t s from a modified Redlich-Kwong equation of s t a t e " , Chem. Eng. Sc i . , 27,1197(1972)
3. Carnahan N.F., S t a r l i n g K . E . , " In te rmolecular fo rces and t h e e q u a t i o n of s t a t e f o r f l u i d s " , AIChEJ, 18(6),1184(1972)
4. Die te r s U.K., "A new semi empir ica l equat ion of s t a t e for f l u i d s I", Chem. Eng. Sc i . . 36,1139(1981)
5. Donohue M . D . , P r ausn i t z J.M., "Perturbed hard chain theory for f l u i d mixtures: Thermodynamic p r o p e r t i e s f o r mixtures i n n a t u r a l g a s and petro- leum technology", AIChEJ, 24(5), 850(1975)
6. Vimalchand, Donohue M.D., "Thermodynamics of quadropolar molecules: The Perturbed Anisotropic Chain Theory", submi t ted t o Ind. Eng. Chem. Fundam
7. Vezetti D . J . , " S o l u b i l i t i e s of s o l i d s i n s u p e r c r i t i c a l f l u i d s " , J. Chem Phys. ,77,1512(1980)
8. Vezetti D.J., " S o l u b i l i t i e s o f s o l i d s i n s u p e r c r i t i c a l gases 11. Extension t o molecules of d i f f e r i n g s i z e s " , J. Chem. Phys. ,80(2) ,868-71 (1984)
9. S i h a R., Somcynysky T., "On the s t a t i s t i ca l thermodynamics of sphe r i ca l and chain molecule f l u i d s " , Macromolecules, 2(4) ,342-350( 1969)
73
10. J a in R.K., Simha R . , "On t h e equat ion of state of argon and organic 1 l i q u i d s " , J. Chem. Phys. , 72 (9 ) , 4909-4912(1980)
11. Hi rshfe lder J .O. , C u r t i s s C.O., Bird R.B., "Molecular theory of gases and l i q u i d s t t , pp275-320, John Wiley and sons . , 1954
12. Panayiotou C.. Vera J.H., " S t a t i s t i c a l thermodynamics of r-mer f l u i d s and t h e i r mixtures", Polymer Jou rna l , 14(9),681(1982)
13. Model1 M . , Reid R.C., "Thermodynamics and its app l i ca t ionsn ,2 ed., Pren- I
t i ce Hall, 1983.
14. J o f f e J.. Schroeder G.M., Zudkevitch D. , t'Vapor-llquid E q u i l i b r i a with t h e Redlich-Kuong Equation of S ta t e" , AIChEJ, 48,261-266(1970)
15. van der Waals J . D . , Doctoral t h e s i s , Leiden.1873.
16. Guggenheim E.A., "Mixtures". Clarendon Press, Oxford, 1954.
17. Weisphart J . , "Thermodynamic e q u i l i b r i a of b o i l i n g mixtures", Springer- Verlaeg. Berlin.1975
18 . Pemberton R.C., Mash C . J . , "Thermodynamic p rope r t i e s of aqueous non- e l e c t r o l y t e mixtures 11. Vapour p re s su res and e x c e s s Gibbs e n e r g i e s f o r water + e thano l a t 303.15 K t o 363.15 K determined by a n accu ra t e s t a t i c method"., J. Chem. Therm.,10,867-888(1978)
19. Ng H-J., Kalra H . . Robinson D.B.. Kubota H., "Equilibrium phase p rope r t i e s of t h e toluene-hydrogen s u l f i d e and n-heptane-hydrogen s u l f i d e b inary systems", J . Chem. Eng. Data.,25, 51-55(1980)
20. Tsekhanskaya Yu. V . , Iomtev M.B., Muskina E.V., "So lub i l i t y of naphthalene i n e thy lene and carbon d iox ide under p re s su reqv , Russ. J. Phy. Chem., 38(9) , 1173(1964)
21. Schroeder E., Arndt K-F., "Los l i chke i tve rha l t en von Makromolekiilen i n komprimierter Gasen", Faserforschung und Tex t i l t echn ik , 247(3) , 135(1976)
22. Panagiotopoulos A.Z., Reid R.C., " A new mixing r u l e f o r cubic equations of s t a t e for h igh ly p o l a r , asymmetric systems", Paper presented a t t h e ACS meeting i n M i a m i , F l o r i d a (1985)
74
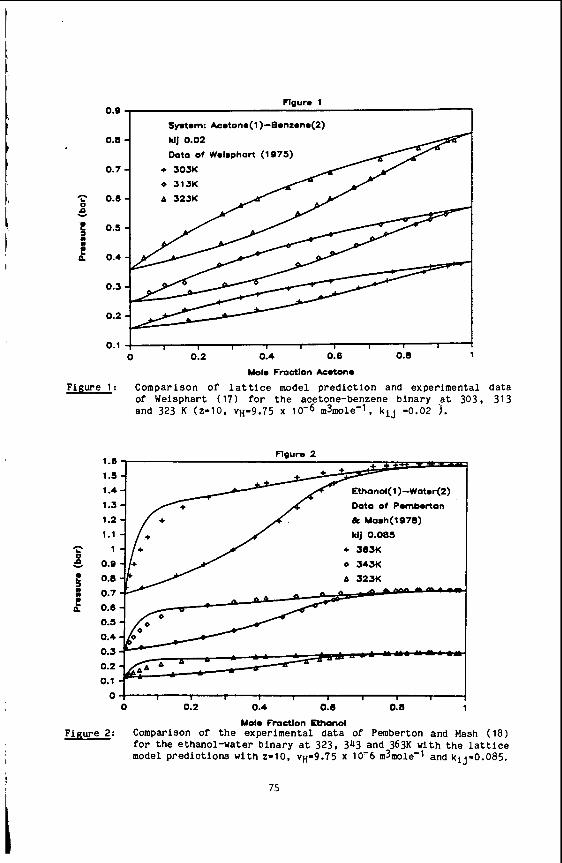
ngum 1 0.0
0.8
o of Wohphort (1975)
0.7
0.8
0.5
0.4
0.3
0.2
0 0:2 0.4 0.8 0:5 1
0.1 ! I I 1 1 1 1 1 1 1
0 0.2 0.4 0.8 0.8 1
Mol. Fructlon Aeotono
Figure 1 : Comparison of l a t t i c e model p r e d i c t i o n and experimental da ta of Weisphart (17) for t h e acetone-benzene binary ,a t 303, 313 and 323 K (z=10. VH'9.75 x 10⁻⁶ m3mole-1, kij -0.02 1.
Figure 2 1.6
1 .s 1.4
1.3 Doto of Pomborton 1.2 & MoBh(1078)
1.1 kij 0.085
- 1 + 363K .+ B 0.0
h 0.6
t 0.8 . 0.7
0.5
0.4
0.3
0.2
0.1
i 75
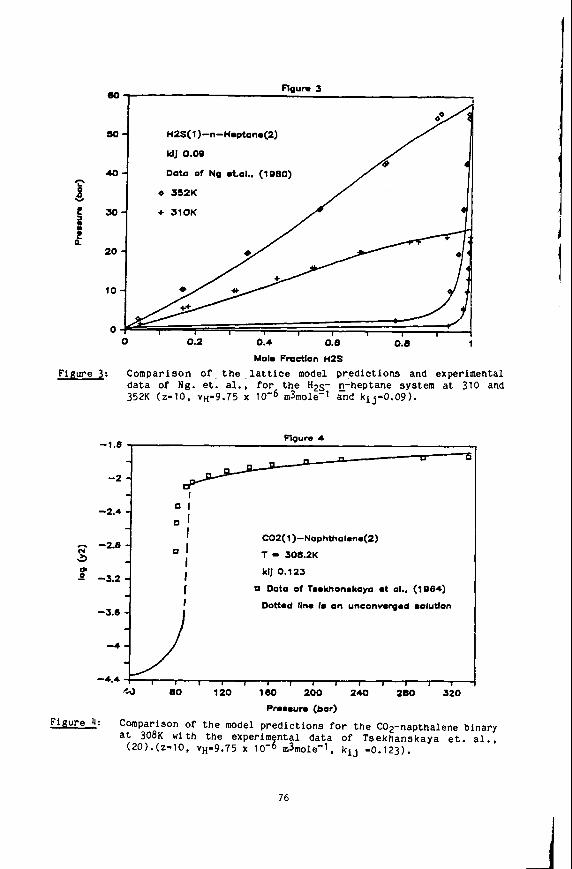
w - H2S( 1 )-n-Hoptano(2)
kiJ 0.09
Data of Ng .tal.. (1980) 40- T x 0 552K
I? 5 0 - + 51OK
2 a
Y
7 20 -
0 0.2 0.4 0. e 0.8 1
Mol. Fmctlon H2S
Figure 3: Comparison of t h e l a t t i c e model p r e d i c t i o n s and experimental data of Ng. et. a l . , for t h e H ~ s - n-heptane system at 310 and 352K (2-10, VH-9.75 x rn3rn0le-~ &d k i j - 0 . 0 9 ) .
-2.4 - -
A -2.8 - - s
0 -0 -3.2 -
-
Figure 4
-2
I 0 1
0 1
0 1
I I
I C02(1 )-Nophthalono(2)
T - 506.2K
klJ 0.123
r I
0 Data of Tookhanskoya ot 01.. (1984)
Dotted Ilne Io an unconvorgod oolution
Pro*suro (bor) Figure 4: Cmparison of t h e model p r e d i c t i o n s for t h e C02-napthalene binary
at 308K w i t h the experimental data of Tsekhanskaya e t . a l . , ( 2 0 ) . ( 2 - 1 0 , vH-9.75 x 10⁻⁶ rn3mole-1, k i j -0 .123) .
76
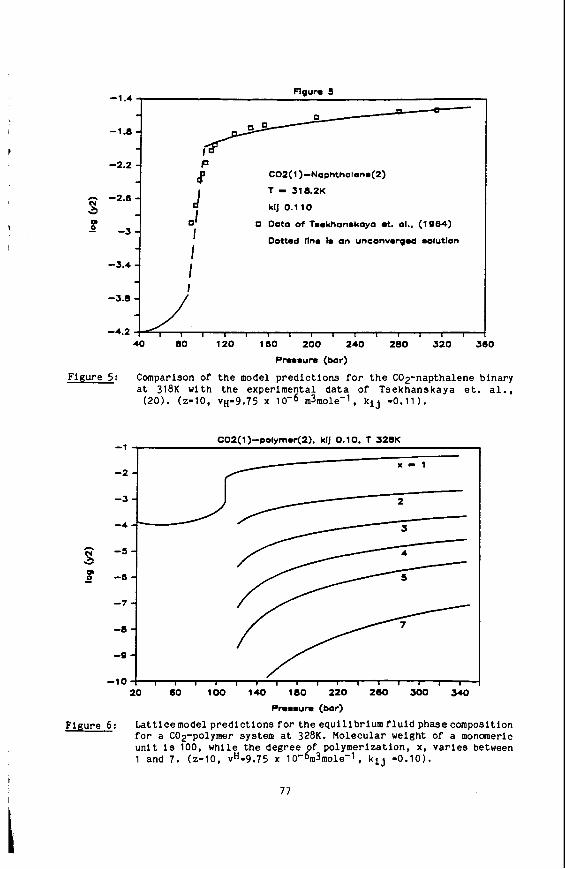
Flgun S -1.4 - - -1.8 -
- -
-2.2 -
- -2.6 - 5
H -3-
- -3.4 -
-
C02( 1 )-Naphthaleno(2)
T 9 318.2K
klJ 0.110
0 Data of Tmokhanmkaya ot. al.. (1984)
Dotted tin. 1. an unconvergod molution
d I I I I
0
I
0
Figure 5: Comparison of t h e model p r e d i c t i o n s f o r t h e C02-napthalene binary a t 318K wi th t h e experimental d a t a of Tsekhanskaya e t . a l . ,
(20) . (2-10, vH'9.75 x 10⁻⁶ m3mole-1. k i j -0.111.
COZ(l)-polyrnor(2). klj 0.10. T 328K -1
x - 1 -2
20 60 100 140 180 220 260 500 340
Pmmmum (bar)
Figure 6: La t t icemodel p r e d i c t i o n s f o r t h e e q u i l i b r i u m f l u i d phasecomposition f o r a C02-polymer system a t 328K. Molecular weight of a monomeric u n i t is 100, whi le t h e degree of po lymer iza t ion , x, v a r i e s between 1 and 7. (2-10, vH-9.75 x 10'6m3mole-1, k i j -0.10).
7 7
HETEROLYSIS AND HOMOLYSIS IN SUPERCRITICAL WATER
Michael Jerry Antal, Jr., Andrew Brittain, Carlos DeAlmeida and Sundaresh Ramayya
Department of Mechanical Engineering University of Hawaii, Honolulu, Hawaii 96822
INTRODUCTION
Efficient thermochemical processes underlie the conversion of crude oil and natural gas liquids to higher value chemicals and fuels. Unfortunately, attempts to develop similar conversion processes for biomass feedstocks (such as wood chips and bagasse) have been frustrated by the non-specificity of high temperature pyrolysis reactions involving biopolymer substrates (1,2). For example, the pyrolysis of bagasse yields a liquid mixture of carbohydrate sirups and phenolic tars, a gas composed primarily of carbon oxides and hydrogen, and a solid charcoal. Variations of the conventional engineering parameters (temperature, heating rate, residence time and pressure) do not provide a good control over the complex set of concurrent and consecutive pyrolysis reactions. Thus it has not been possible to engineer the pyrolysis reactions to produce a few high value products from biomass materials.
Recent advances in materials technology, high pressure pumps and other high performance liquid chromatography (HPLC) equipment, have created new opportunities (3) for fundamental studies of chemical reactions in solvents at very high pressures (>30 MPa) and temperatures ( > 4 0 0 ° C). For sufficiently dilute solute-solvent mixtures at pressures P>Pc , no liquid-vapor phase transition occurs as the mixture is heated. Furthermore, when the temperature T is near the solvent's critical temperature Tc and P>Pc many solvents manifest extraordinary properties (4 ,5 ) . These unusual properties provide new parameters for the control of chemical reactions involving biopolymers and other substrates.
AS discussed in the following sections, when the density of supercritical ( S C ) water exceeds 0.4 g/cm3 the fluid retains its ionic properties (high dielectric constant and ion product) - even at high temperatures. These properties provide new opportunities to catalyze a variety of heterolytic bond cleavages with a high degree of specificity. Examples discussed in this paper include the dehydration of ethanol to ethylene, the dehydration of glycerol to acrolein, and the conversion of 1,3 dioxolane to glycol and formaldehyde. In each of these examples the specificity of the heterolytic bond cleavage is high (approaching one mole of desired product per mole of reactant); whereas the conventional, higher temperature, free radical reactions offeralower yields of the same desired products. In the case of ethanol dehydration, findings reported here have exciting implications for the production of ethylene from ethanol, which may find early application in Brazil.
PRIOR WORK
Interest in the use of S C F solvents as a reaction media is founded upon recent advances in our understanding of their unique thermophysical and chemical properties. Worthy of special note are those thermophysical properties (6) which can be manipulated as parameters to selectively direct the progress of desirable chemical reactions. These properties include the solvent's dielectric constant (71, ion product (8 ,9 ) , electrolyte solvent power (10,11), transport properties (viscosity (121, diffusion coefficients (13) and ion mobilities (14)), hydrogen bonding characteristics (15), and solute-solvent 'enhancement factors' (6). All these properties are strongly influenced by the solvent's density p in the supercritical state.
P = 0.47 g/cm3 at 400' C (P = 35. MPa) enjoys a dielectric constant of about 10 (comparable to a polarl%rganic 1 id under normal conditions), an ion product of 7x10- (vs lo-" at room conditions) and a dynamic viscosity =0.57 millipoise ( v s 10 at room conditions). Under these conditions SC water behaves as a water-like fluid with strong electrolytic solvent power, high diffusion coefficients and ion mobilities, and considerable hydrogen bonding. These properties favor chemical reactions involving heterolytic (ionic) bond cleavages which can be catalyzed by the presence of acids or bases.
Dramatic chan es occur when the temperature of the SC wa er
Decreases in the di ectric constant to a value of 2 and ion product to 2.1 x lo-" cause the fluid to lose its water-like characteristics and behave as a high temperature gas. Under these conditions homolytic (free radical) bond cleavages are expected to dominate the reaction chemistry. Thus by using the engineering parameters of temperature and pressure one can dramatically change the chemical properties of the solvent (dielectric constant and ion product) to favor heterolytic or homolytic bond cleavages. This paper emphasizes the manipulation of these parameters as a means for engineering the reaction chemistry of biopolymer materials.
For example, SC water with
is raised to 500% C at constant pressure (P=O.144 g/cm 5 1 .
APPARATUS AND EXPERIMENTAL PROCEDURES
Figure 1 is a schematic of the S C flow reactor. Prior to the initiation of flow, the system is brought up to pressure by an air compressor. Afterwards, an HPLC pump forces a pure solvent into the reactant accumulator at a measured rate of flow. This flow displaces the solvent/solute reactant mixture out of the accumulator, through the reactor and a 10 port valve dual loop sampling system, and into the product accumulator. The flow of products into the second accumulator displaces air through a back-pressure regulator and into a water displacement apparatus, which measures the rate of air flow at ambient conditions. The
79
reactant flow is rapidly heated to reaction temperature by the entry heat guard, and maintained at isothermal conditions by a Transtemp Infra-red furnace and an exit heat guard. Samples captured in 5.4 ml sample loops are released into sealed, evacuated test tubes for quantitative analysis by GC, GC-MS, and HPLC instruments within the laboratory. The outer annulus of the reactor is a 4.572 mm ID Hastelloy C-276 tube, and the inner annulus is a 3.175 mm OD sintered alumina tube, giving the reactor an effective hydraulic diameter of 3.2 mm. The alumina tube accommodates a movable type K thermocouple along the reactor's axis, which provides for the measurement of axial temperature gradients along the reactor's functional length. Radial temperature gradients are measured as differences between the centerline temperature and temperatures measured at 10 fixed positions al.ong the outer wall of the reactor using type K thermocouples. The location of the movable thermocouple within the reactor is measured electronically to within 0.01 mm by a TRAK digital position read out system. The entire reactor and sampling system is housed in a .bullet proof. enclosure which can be purged of air (oxygen) during studies involving flammable solvents (such as methanol).
The reactor can be characterized by the following representative nondimensional numbers: Re = 33, Pr = 1.3, Sc = ::",',: P;rp;pm,a+ cg~;y:;: 4:;,~~~pe€~~~,~~o~r~f~leanoq Dth; reactor during operation. Because the thermal diffusivity of SC water is comparable to that of many high quality insulation materials, gross radial temperature gradients can easily exist in a flow reactor. As shown in Figure 2, radial temperature gradients within the annular flow reactor are negligible. A computer program, which accurately accounts for the effects of the various fluid (solvent, solvent and solute, air) compressibilities on flow measurements, calculates mass and elemental balances for each experiment. A typical experiment evidences mass and elemental balances of 1.00+0.05.
RESULTS AND DISCUSSION
Results of experiments probing the dehydration chemistry of ethanol in SC water (P = 34MPa) are summarized in Table 1. The low temperature (400' C), uncatalyzed dehydration is very slow, and little ethylene is formed. However, in the presence of 0.1 M H2SO4 the reaction is both rapid and highly specific. The effectiveness of the acid catalyst is a result of the high degree of dissociation of H SO4 in SC water at 400 ' C and 34 MPa, as Well as the high mobility of 8' ions in SC water. These results contrast. with the conventional (16) acid catalyzed dehydration, which requires heating the alcohol in 95% H2S0 at 170' C. Figure 3 displays the acid catalyzed heteroly?ic reaction mechanism for ethanol dehydration.
Table 1 also reveals a dramatic loss in specificity at higher temperatures ( 5 0 0 ° C ) due to the increasing role of homolysis i n the reaction chemistry. Unwanted products Of
80
t
I
homolysis include CHI, H2, and c H6, which serve to decrease the yields of the desired product ethylene. Homolysis is favored under these conditions becau the water has lost its ionic properties (ion product = lo-”) and will not facilitate the dissociation of acid catalysts or the formation of carbonium ion intermediates.
Table 2 summarizes similar results for the dehydration of glycerol (40). A s shown in Figure 4 , the observed products (acetaldehyde, acrolein, and the gases C02, H2, CO, CH4, C2H4 and C2H6) can be explained by any one of several different pathways and mechanisms. However, an experiment with the posited intermediate acetol as the reactant produced only gases; hence pathway 1 cannot be the source of acrolein. The dramatic increase in the relative yield of acrolein in the presence of NaHS04 at 360’ C supports the role of the heterolytic pathway 2 in forming acrolein. The significant influence of the free radical scavenger hydroquinone in reducing acrolein yields supports the role of homolytic bond cleavage (pathway 3) in the formation of acrolein at higher temperatures (500’ C). These findings are in accord with earlier studies of the vapor phase pyrolysis of glycerol (171, and the results of experiments involving ethanol given in Table 1. Here again we observe the high specificity of dehydration reactions involving acid catalyzed, heterolytic bond cleavages.
In addition to the dehydration of ethanol and glycerol, we have also completed less detailed studies of the reaction chemistry of 1,3 dioxolane, glycol, acetaldehyde and acetic acid in SC water, and (in some cases) SC methanol. At 350° C and 3 4 MPa the facile reaction of 1,3 dioxolane with water produces glycol and formaldehyde ( 9 9 . 8 % yield) via a carbonium ion intermediate. Here again is an example of the extraordinary specificity heterolytic reaction chemistry. The model compounds glycol, acetaldehyde and acetic acid undergo negligible decomposition in SC water at temperatures up to 500’ C, pressures to 34 MPa, and residence times approaching 3 minutes.
Because of the potential commercial significance of ethanol dehydration in SC water, we are presently developing kinetic expressions for the rate of ethylene formation in the SC water environment. We are also measuring the rate of ethanol dehydration in the vicinity of the critical point of water to determine if the properties of the fluid near the critical point have any influence on the reaction rates. In the near future we plan to begin studies of the reaction chemistry of glucose and related model compounds (levulinic acid) in SC water.
CONCLUSIONS
The significance of this work is its identification of SC water as a media which supports and enhances aqueous phase chemistry ordinarily observed at much lower temperatures. Fundamental studies of the reaction chemistry of biopolymer related model compounds described in this paper offer insights
81
into the details of reaction mechanisms, and facilitate the choice of reaction conditions which enhance the yields of (
valuable products. Chemical reaction engineering in supercritical solvents, based on the ability to choose between heterolytic and homolytic reaction mechanisms ~ 4 t h a foreknowledge of results, holds much promise as a new means to improve our utilization of the vast biopolymer resource.
ACKNOWLEDGMENTS
This research was supported by the National Science Foundation under grant CPE 8304381, the Department of Planning and Economic Development of the State of Hawaii, and the Coral Industries Endowment. The authors thank Dr. Maria Burka (NSF), Kent Keith and Dr. Tak Yoshihara (DPED), and David Chalmers (Coral Industries) for their interest in this work. The authors also thank William Mok for his continuing assistance with the flow reactor, Dr. Ali Tabatabaie-Raissi, Dr. Jiben Roy, and Professor Maitland Jones (Princeton) for many stimulating discussions.
REFERENCES
1. Antal, M.J. 'Biomass Pyrolysis. A Review of the Literature - Part 1: Carbohydrate Pyrolysis' in Advances in Solar Energy, (Eds. K.W. Boer and J.A. Duffie) Vol. 2, Plenum Press, New York, 1985.
2. Antal, M.J. 'Biomass Pyrolysis. A Review of the Literature - Part 2: Lignocellulose Pyrolysis' in Advances in Solar Energy, 2, American Solar Energy Society, Boulder, 1985.
3. Paulaitis, M.E., Penninger, J.M.L., Gray, R.D, Jr. and Davidson, P. 'Chemical Engineering. at Supercritical Fluid Conditions' Ann Arbor Science, Ann Arbor, 1983.
4. Franck, E.U. 'Supercritical .Water' Endeavor, 1968,27, 55-59.
5. Marshall, W.L. 'Water at High Temperatures and Pressures' Chemistry, 1975, 48, 6-12.
6 . Franck, E.U. 'Thermophysical Properties of Supercritical Fluids with Special Consideration of Aqueous Systems', Fluid Phase Equilib. 1983, lO(2-31, 211-22.
7. Franck, E.U. 'Water and Aqueous Solutions at High Pressures and Temperatures-.
8. Marshall, W.L and Franck, E.U.,J. Phys. Chem. Ref. Data, 1981, lo, 295-304.
9. Quist, A.s., ~arshall, W.L., and JOlleY, H.R. J. PhYs. Chem., 1965, 69, 2726-2735.
10. Marshall, W.L., Rev. Pure. Appl. Chem., 19681 18, 167-186-
a2
11. Quist, A.S., J. Phys. Chem., 1970, 74, 3396-3402.
12. Bruges, E.A. and Gibson, M.R., J. Mech. Eng. Sci., 1969, 11,
13. Lamb, w.J., Hoffman, G.A., Jonas, J., J. Chem. Phys., 1981,
14. Franck, E.U., Hartmann, D., and Hensel, F., J. Phys. Chem., 1968, 72, 200-206.
15. Gorbatyi, Yu.E., Probl. Fix.-Khim. Petrol., (Eds. Zharikov, V.A., Fonarev, V . I . , Korikovskii, S.P.) 1979, 2, 14-24.
16. Morrison, R.T. and Boyd, R.N. 'Organic Chemistry' (3rd Edition), Allyn and Bacon, Inc., London, 1978.
17. Stein, Y.S., Antal, M.J. and Jones, M. J- Analytic and Applied Pyrolysis, 1983, 4, 283-296.
189-205.
74(12), 6875-80.
a3
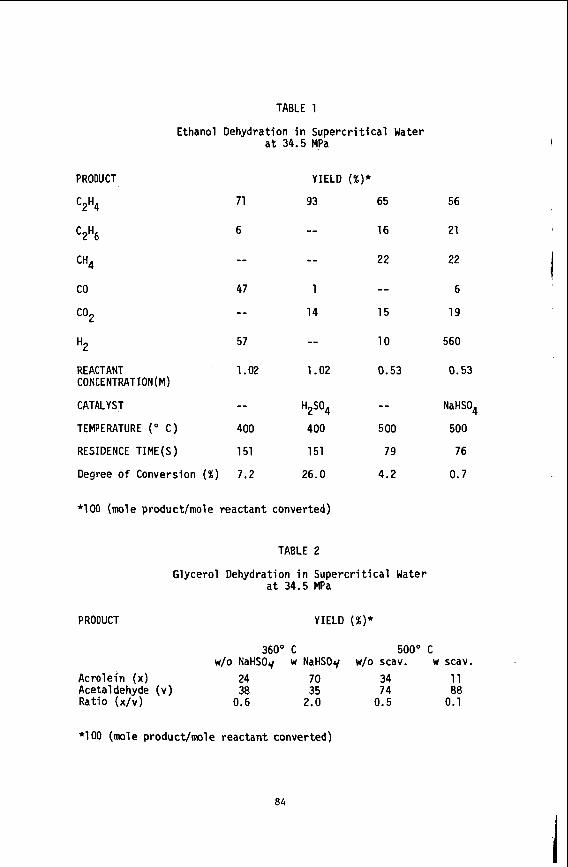
TABLE 1
Ethanol Dehydration i n Superc r i t i ca l Water a t 34.5 MPa
PRODUCT YIELD (%)*
'ZH4 71 93
6 -- C2H6
-- -- CH4
c02
H2
co 47 1
-- 14
57 -- REACTANT 1.02 1.02 CONCENTRATION(M)
CATALYST -- TEMPERATURE (" C ) 400 400
RESIDENCE TIME(S) 151 151
Degree of Conversion (%) 7.2 26.0
H2S04
65
16
22
-- 15
10
0.53
-- 500
79
4.2
56
21
22
6
19
560
0.53
NaHS04
500
76
0.7
*lo0 (mole product/mole reactant converted)
TABLE 2
Glycerol Dehydration i n Supercri t i c a l Water a t 34.5 MPa
PRODUCT YIELD (%)*
360" C 500" C w/o NaHSOJ w NaHSOq w/o scav. w scav.
Acro le in (x) 24 70 34 11
Ratio (x /v ) 0.6 2.0 0.5 0.1 Acetaldehyde (v) 38 35 74 88
*I 00 (mole product/mole reactant converted)
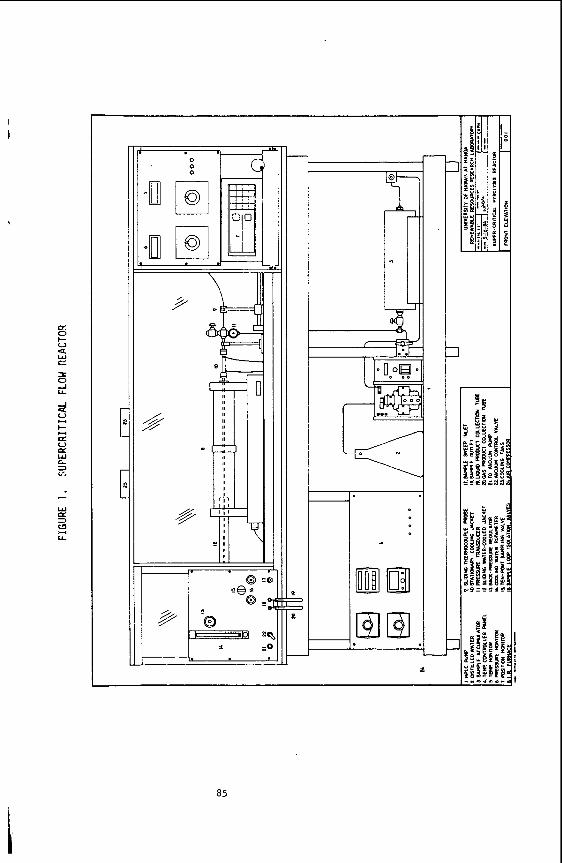
I
T I
I:;I I *. I
d
3
as
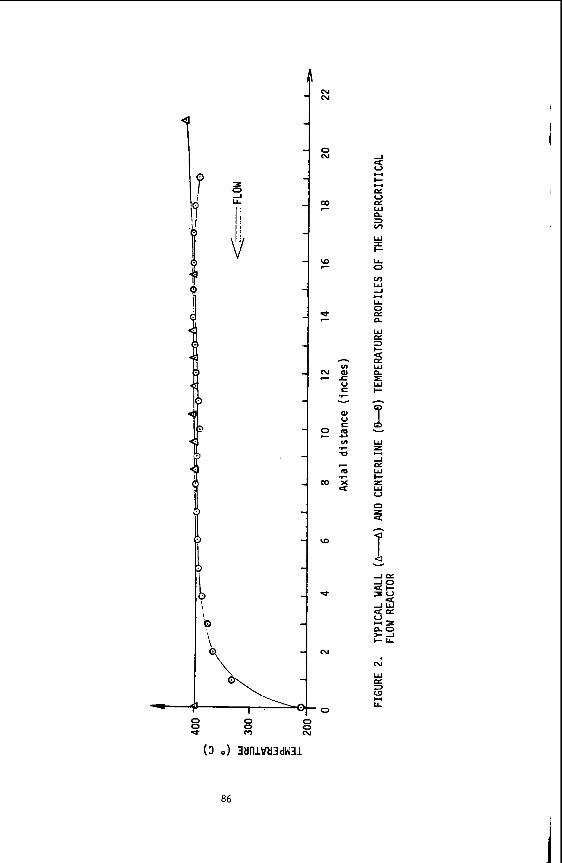
0
‘“\--d 86
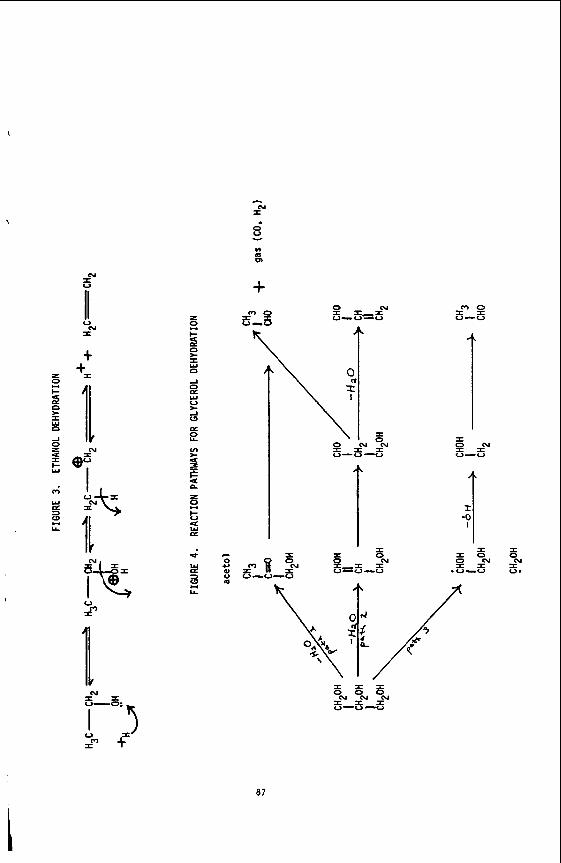
\
h
N I
8 v
cn lu m
N
B +
t z +I
f W n 11 -I 0
4 N a
m Y
N I I v-0:
V 1 1 3 t
N 8 2-I I- s v-v-v v-v
I ON % a 5-3-5
a7
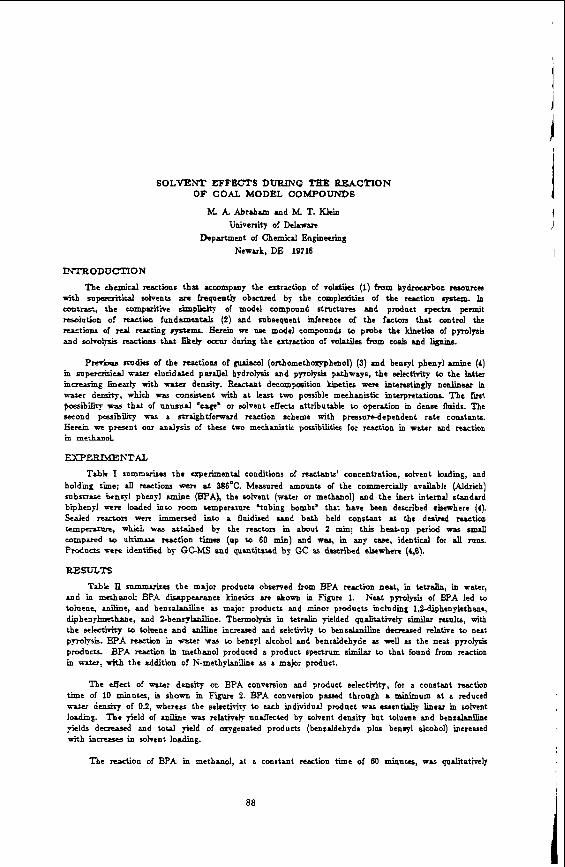
SOLVENT EFFBC1‘S DtJFUNG TEE REACTION OF COAL. MODEL COMPOUNDS M k Abraham and h4. T. Klein
Wversitp of Delaware Department of Chemical Engineering
h’ewuk, DE 19718
IhTBODUCTION T’ne chemicd w t i o n s that accompany the extraction of volatiles (1) from hydrocarbon resouma
a i th supczaitii mlvents a n freyaentb obscnrcd by the camplojties of t h e reaction system. In contmz? the cornpazithe simp- of model compound structures and product spectra p e d t resolution of ructieo fundament& (2) and snbsequent inference of the factors that control the rractiom of real reacting syrtcmr. €kr& we use model compouads to probe the kiuetids 01 ppzolpss and sohow rrsctions that likely ODIU during the extraction of vofotiks from coals and lignb.
P- studies of the ratctions of guaiacol (orthomethoxgphenol) (3) and benrpl phenyl amine (4) m snperaizicd water elucidated p a r d e l hydrolysis and pyrolysis pathways, the selectivity to the latter m-g line&- with ada density. Reactant decomparition kinetics w e n interestingly nonlinuv in 7Flter densit)-, which WTS consistent with a t l u s t two possible mechanistic interpretations. The fvst p c s s i b i vas that of unusual ‘uge’ or solvent effects attributable to operation in dense fmids. The second p a s i b i i - a draightforward reaction scheme wi th p r e s s d e p e n d e n t rate constants. Hereh m present our andpsis of these two mechanistic possibilities for reaction in water and reaction m methanol
W E E M E N T A L
Tabk I summarizes rhe fcperimentd conditions of reactants’ concentration, solvent b d i g , and holding time; J1 rrsctions were at 386OC. Mcasnred amounts 01 the commercially available (Aldrich) sub- benql phenyl amine P A ) , the solvent (water or methanol) and the inert internal standard biphenyl -re loaded into room temperature Ytobing bombs’ that have been described elsewhere (4). Sealed -rs wen imrmrsed into a nnidmed sand bath held consstant d the d 4 m d reaction tcmpcamn, ~ h i c b was artaiDed by the reactors in about 2 min; this heat-up period was small compared ro u k i i reaction times (up to 60 min) and RW, in any case, identical for all mns. Products sere identGd b r GGMS and quantitated by GC as described &where (la). BESULTS
Table II summarizes the major products observed from BPA reaction neat, in tetraiin, in water, and in methanol- BPA dLappcarance kinetics M sbown in Figure 1. Neat pyrolysis of BPA led to tohen+ d i n e , and benralsniline a5 major products and minor products including l,%dipbenylethane, d i p h e n + e t b e , and % b e r u + d i n e . Thermolj-sii in tetralin yielded quaiitativeb similar result(, with the s&zxi+y to toluene and aniline increased and sektivity to benralaniline decreased relative to neat p++. BPA reaction in water RS to benzyl alcohol and benzaldehyde as well as the neat pyrolysis products- BPA readon in methanol produced a product spectrum simila~ to that found from reaction in vatu, ui th the addition of K - m e t h p k n i e as a major product.
The &et of water density on BPA convenion and product selectirity, for a constant reaction t i m e of 10 minutes, is shown in Figurr 2. BPA conversion passad through a miniium at a reduced arfu d- of 0.2, whereas the s e k c t m v to each individual product was essentially lineat in solvent loading. T h e yield 01 anil ine was relativeb unaffected by solvent density but toluene and benralaniie yields dsoaased and total yield of oxygenated products (benraldehydr p l u benrgl dcohol) iucrewd with in- in solvent loading.
The reaction 01 BPA in methanol, at a constant rsaction time of 60 minutes, was qualitatively
I
88
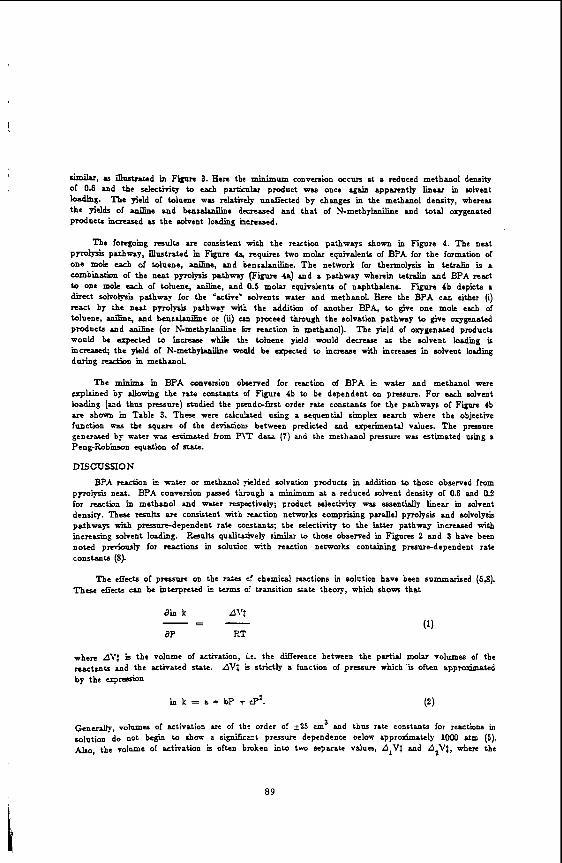
similar, 2s anstrated in F i i 3. Here the minimum convvsion occurs at a reduced methanol density of Ob and the selectivity to each partkuhr product was once again apparently linear in solvent a g . The yield of toluene was rrLtirely nndected by changes in the methanol density, wbereas the yields of aniline and benxdaniline decreased and that of N-methykrriline and total oxygenakd product in-d as the solvent loading hcreased.
Tbe foregoing results are consistent with the reaction pathways shown in Figure 4. The neat pyrolysis pathway, illustrated m Fignre 4% requires two molar equivalents of BPA for the formation of one mole u c h of toluene, aniline, and b e n r d a n i e . The network for thermolysis in tetralin is a comb- of the nest pyrolysis patbaa]. ( F i i 44 and a pathway wberein tetraIin and BPA react to one mole each of toluene, miline, an2 0.5 molar equivalents of naphthalene. Figure 4b depicts a k t s o l v o e pathway for the 'active' aolvents w a r and methanoL Here the BPA can either (i) react by the neat p p l p ~ pathway witi the addition of another BPA, to +e one mole each of toluene, aniihe, and benralanihe or (ii) can proceed thmugh the solvation pathway to give oxygenated products and aniline (or N-methykniline for reaction in methanol). T h e yield of oxygenated products would he crpcted to in- while the toluene yield would decrease as the solvent loading is mc& the + I d of N-methykoiline would be expected to increase &h increases in solvent lording during ructiDn in methanol
Tbe minima in BPA conversion observed for reaction of BPA in water and methanol were erplained by allowing t h e rate constantr of Figure 4b to be dependent on pressure. For ea& solvent loading (and thns pressure) rmdied the psendcdkst order rsk constants for the pathways of Figarr 4h are shown m Table 3. These were cdcdated using a sequential simplex search where the objective function the square of the dev&io= between predicted and experimental values. The pressure g e n e a d br water vh5 estimued horn PIT data (7) and the methanol pressure was estimated using a Peng-Rob- equation of state.
DISCUSSION
BPA M a i o n in water or methanol +lded solvation products in addition to those observed from pyrolysis neat. P A conversion passed throngh a minimum at a reduced solvent density of 0.6 and 0 2 for reactb m methanol and wakr respectively; product selectivity was essentially linear in solvent density. These & are consistent with reaction networks compriring parallel pyrolysis and solvolysii pathways with p d e p e n d e n t rate colrstanh; the selectivity to the latter pathway increased with increa~hg solvent loading. P d t s qualitarisely similar to those observed in F q r e s 2 and 3 have been noted prcrionsly for reactions b solution with reaction networks containing pmurc-dependent rate constants (8)
T h e elJats of pressure on the rates cf chemical reactions in solution have been summarized ( 5 4 . There efjects can be interpreted in terms 0:' transition state theorp, which shows that
where AV; k the volume of actbation, ic. the difference between the partial molar volumes of the -tats a d the activated state. AVJ is strictly a function of pressure which 'is often approximated by the up-n
ln k = a + bP + cPz.
&nu*, volumes of activation are of the order of ~ 2 5 cm3 and thus rate constants for reactions in solution do not begin to show a signS-t pressure dependence Deloa approximately loo0 atm (5). h0, the volume of activation is often broken into two separate values, A,V$ and AzV$, where the
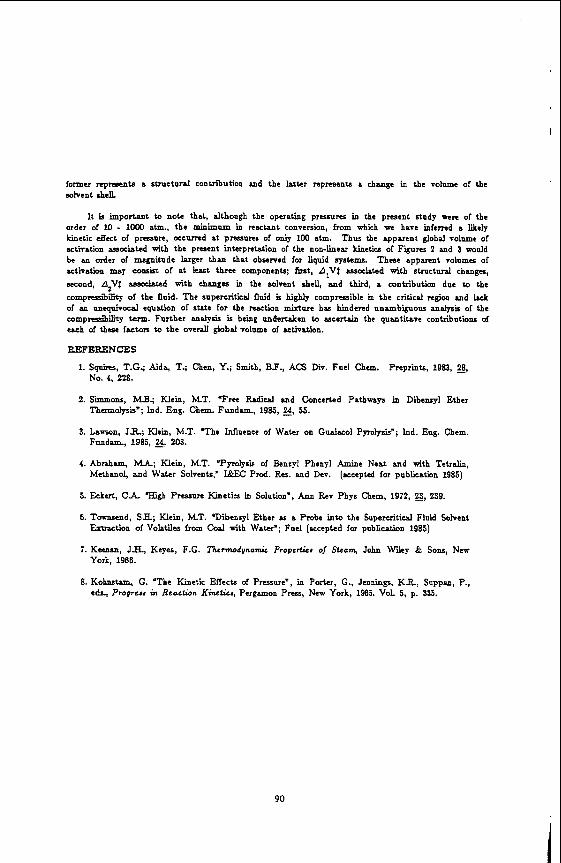
I
former rep-ts a structural contribution and the la te r reprrsents a change in the volume of tbe solvent shd.
It k important to n o k that, although the operating pressures in the present study were of the order of 10 - loo0 ah., the minimum in n a c b n t conversion, from which we have infemd a likeb Linetic deet of prrssure, occurred at pressures of only 100 atm. Thus the apparent global volume of activation associated with the present interpretation of the non-linear kinetics of Figures 2 and 3 would be an order of magnitude larger than that observed for liquid systems. These apparent volumes of activation may consist of at least three components; first, AIVt Mscciakd with s t r n c t d changes, second, AzVf & with changes in tbe solvent shell, and third, a contribution due to the c o m p d m of the fluid. The supercritical fluid is highly compresible in the critical region and UC of &t u n q n i v d equation of state for the =tion &we has hindered unambiguous andysii of the compressibilitp term. Furtber analysis is being undertaken to ascertain the quantitave contributions of each of tbese factors to the overdl global volume of activrtion.
REFEFGNCES
1. Sqmiru, T.G; Aida, T.; Chert, Y.; Smith, BE., ACS Div. Fuel Chun. Preprints, 1983, 28, No. 4, 228.
2. Simmons, hLB.; Klein, UT. Tree Ff,ujid and Concerted Patharays in Dibenryl Ether Thamolysis’; Ind. Eng. Chem. Fundam., 1985, 24, 55.
3. Lavxn, JB.; Klein, M.T. ‘The InIluence of W a k r on Guaiacol Pyroiysii”; Ind. Eng. Cbem. Fundam., 1985, 24! 203.
4. Abraham, U; Klein, M.T. .Pyrolysis of Benzyl Phenyl Amine Neat and with T e t r h , Methanol, and W a k r Solvents,’ X&EC Prod. Res. and Dev. (accepted for publication 1985)
5. Eckut , C A CBIgh Pressure Kinetics in Solution”, Ann Rev Phys Chem, 1972, 23, 239.
6. Toansend, SE; Klein, U T . Vibeuryl Ether as a Probe into the Supercritical Fluid Solvent Exuaction of Volatile6 from Coal with Wakr*; Fuel (accepted for publication 1985)
7. K-, JX., Keyes, F.G. Thennodynamic Propcrticr of Steam, John Wdey & Sons, New York, 1966.
8. Kohrstrm, G. T h e Kinetic Effects of Presure”, in Porter, G., Jennings, K E , Suppan, P., e& Proprcrr in Reaction Kineticc, Pergamon Press, New York, 1965. Vol. 5, p. 335.
90
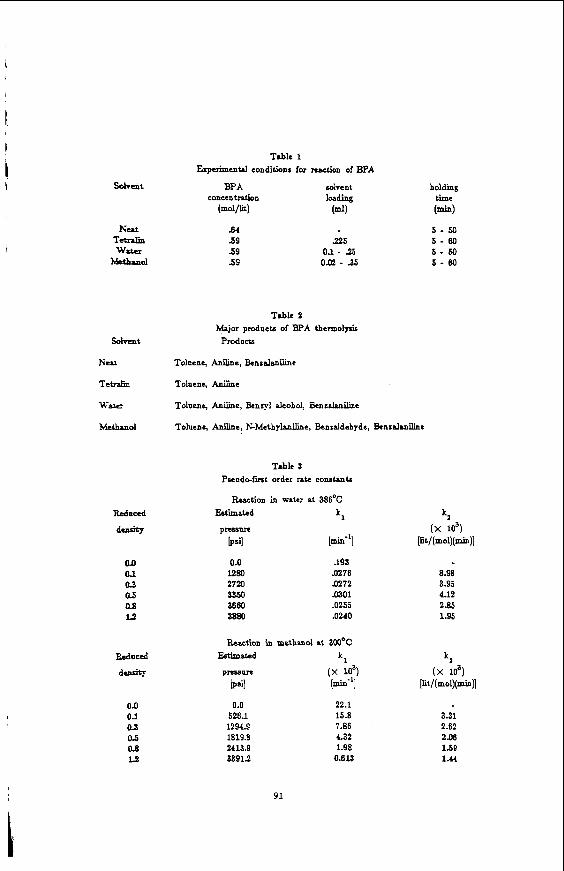
Sdrmt
Trble 1 Experimental conditions lor reaction of BPA
BPA concentration
(m0lW)
.E4 59 59 39
solvent loading (4
325 0.1 - 35 0.02 - 4 5
Table 2 Major products of BPA thermolysis
Prodons
Kert Toluene, Aniliae, Bendaniline
Tetdin Toloen+ Aniline
water
Methanol
Toluene, Aniline, Benzyl alcohol, Benzd+ailine
Toluene, Aniline, N-Methylaniline, Benzaldehyde, Benrdtniline
OD 01 03 0 5 08 I.
Table 3 Pseoddimt order rate constants
Reaction in water at 386OC
kl &timated
P- C i l [min4]
0.0 1280
3350 3660 3880
2720
.193 8276 .0272 a301 . O S 5 .OW
0.0 526.1 1294.9 1819.8 2413.9 33913
22.1
7.86 C32 1.98 0.613
158
holding time (4 5 - 5 0 5 - 60 5 - 50 5 - 6 0
8.98 3.95 4.12 2.85 1.95
3.31 2.82 2.06 1.59 1.44
91
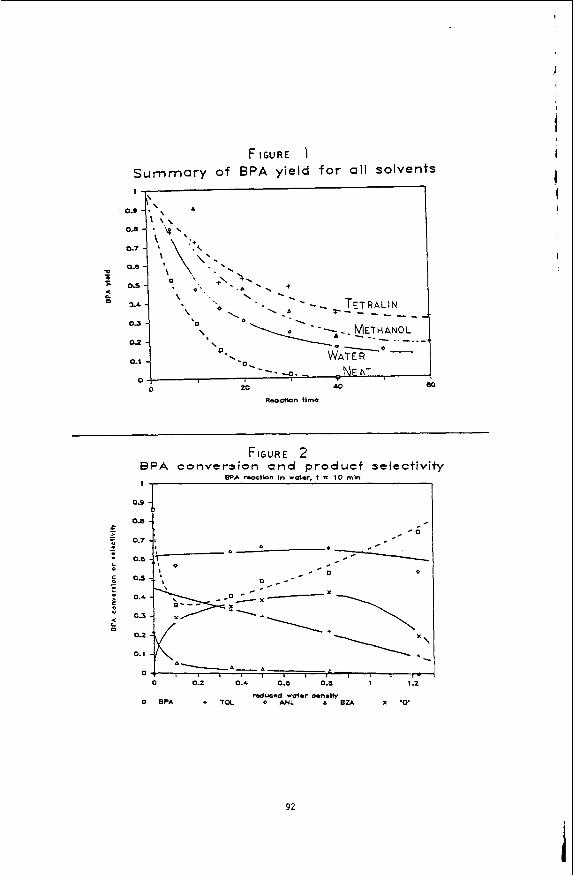
FIGURE I S u m m a r y of B P A yield for all s o l v e n t s
FIGURE 2 BPA convcr t ion a n d p r o d u c t selectivity
0.7
0.6
0 5
0.1
0.3
0 2
0.1
0
"- r
. - 0 0 ti, O 0 - - -
, I I , I I I , I , - 0 0.2 0.4 0.6 0.8 1 1 3
A
92
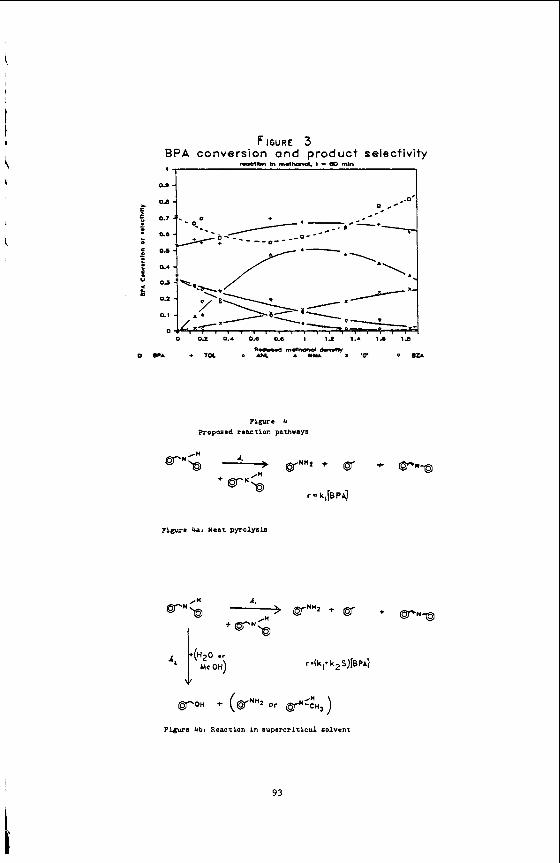
i
F I G U R E 3 BPA conversion and product selectivity
m a n )n m.thQIo1. I - ea rmn
0 0 2 0.1 0.6 0.8 I 1 . l 1.6 1.5 la
Pigurc 4 Proposed reaction pathways
Pigure 4 a t Neat pyrolysis
Pigure 4b1 Reaction i n supercrit ical solvent
93
ISOTOPE EFFECTS I N SUPERCRITICAL WATER--KINETIC STUDIES OF COAL LIQUEFACTION
David S . Ross*, Georgina P. Hum, and Tiee-Chyau W i n Fuel Chemistry Program
SRI I n t e r n a t i o n a l Menlo Park, CA 94025, USA
Thomas K. Green Yertern Kentucky Universi ty
Bowling Green, KY, USA
Riccardo Mansani Enir icerche S.p.A
Milan, ITALY
INTRODUCTION
The chemistry of c o a l l iquefac t ion i s not very w e l l understood, even a f t e r more than two decades of research i n t o the k i n e t i c s and mechanism of the process. There have been a number of models f o r conversion proposed, most of them focused on the severa l l iquefac t ion products , including preasphaltenes. asphal tenes , o i l s , and gases. A survey of s o m e of the models has been presented ( l ) , and a common fea ture among them is the m u l t i p l i c i t y of paths connecting a l l of the components.
Kinet ic model s t u d i e s have invar iab ly been car r ied out In organic donor media, and while the use of these media may be convenient i n l a r g e sca le conversion systems, they do not lend themselves well t o labora tory study of conversion. Not the l e a s t s i g n i f i c a n t of the problems to be faced i n such a study i s t h e unavoidable par t ic ipa t ion i n the o v e r a l l chemistry of various i n t e r r e l a t e d and in te r locked f ree rad ica l chain reac t ions , most of which having no d i r e c t bearing on, and perhaps only a secondary r e l a t i o n s h i p v i t h , the l i q u e f a c t i o n process.
The complications presented t h i s network of i n c i d e n t a l reac t ions , coupled with the mult iple r e a c t i o n paths to products, prompted the study of the k i n e t i c s of coal l iquefac t ion using s u p e r c r i t i c a l water as the medium. The a c t i o n of CO/wa te r t o reduce both lov rank and bituminous c o a l s t o upgradea products has been known for more than half a century, having been introduced i n the work of Fischer and Schrader ( 2 ) . Hydrothermal media are recognized as being exce l len t solvents f o r aromatics, with t e t r a l i n and naphthalene, f o r example, being f u l l y miscible with water a t a l l proportions a t temperatures as low as 30OoC (3) . A review of the CO/water conversion process, inc luding t h e most recent work, has recent ly appeared ( 4 ) .
In the research descr ibed here. batch runs were performed using samples of an I l l i n o i s No. 6 coal (PSOC 1098) In a s t i r r e d , 300 m l s t a i n l e s s steel autoclave. A l l of the runs were f o r 20 min a t 4OOOC. The only product considered is the toluene- soluble f r a c t i o n (TS), separated from t h e toluene-insoluble f r a c t i o n (TI) by simple f i l t r a t i o n .
RESULTS
Working Model. Our lrorRing model evolved from considerat ion of t h e p r o f i l e s typ ica l ly noted i n the modeling l i t e r a t u r e . Products are seen to grow with t i m e , and then leve l off a t some l e v e l below q u a n t i t a t i v e conversion. A t t h e same time the q u a n t i t i e s "unreacted coal" decl ine, l eve l ing off a t a Value above t o t a l conversion. conversion would depict a c o l l e c t i o n of organic uni t s , connected t o each o ther through a series of l i n k s increas ingly more d i f f i c u l t to break.
A p i c t u r e of the coa l organic matr ix der ived from t h i s view of
94
On t h i s basis conversion is l imited by coa l s t r u c t u r e . And i n terms of the conventional homolytic scission/H-capping view of conversion, increased y i e l d s of coa l l iqu ids a r e therefore obtainable only through increases in conversion temperature or residence time. Unfortunately, increases i n the thermal s e v e r i t y of the process r e s u l t i n products r e f l e c t i n g the r i s e of dea lkyla t ion and aromatizat ion react ion8 a t higher temperatures. Thus increased product y i e l d s a r e brought about a t a considerable cost t o product q u a l i t y (5).
The f a c t tha t the p r o f i l e s of both t h e desired so luble product and t h e inso luble product ("unreacted coal") l e v e l off a t intermediate values suggest a simpler model f o r conversion. This scheme, presented i n Figure 1, is our working model, and is tes ted i n the study descr ibed here . In the scheme coal i s par t i t ioned i n p a r a l l e l , competitive routes between i) reac t ion with some reducing component i n the system t o yield TS, and i i ) thermal l o s s of conver t ib le s i t e s t o y i e l d char. In t h i s work we have avoided cons idera t ion of s p e c i f i c mechanism f o r decrease i n molecular weight with l iquefac t ion , including i n p a r t i c u l a r the perceived need f o r thermal sc i ss ion of C-0 and C-C bonds during conversion. simply as a process requir ing some kind of nonspecif ic reduct ion chemistry.
Thus we view conversion
This two-reaction scheme, i f t r u l y opera t ive , suggests a view of the p o t e n t i a l u t i l i t y of l iquefac t ion more o p t i m i s t i c than t h a t der ived from the convent ional ly accepted scheme. The y ie ld of TS is a funct ion of the r a t e s of the two reac t ions . Therefore an increase i n the r a t e of the TS route , or a decrease i n the r a t e of char formation, would bring about increased TS y ie lds . In turn, an increase i n the r a t e of TS formation could be brought about with an increase i n the reducing capac i ty of the system, ra ther than through an increase i n reac t ion temperature. And thus i n pr inc ip le , increases i n TS y ie ld t o product q u a n t i t i e s represent ing a l l of the convert ible port ion of the s t a r t i n g coa l could be obtained, and a t no cos t t o product qua l i ty .
CO/Water Conversions. In c o n t r a s t t o the more-or-less f ixed reducing capaci ty a v a i l a b l e in conventional donor systems, the CO/water system offered cons iderable l a t i t u d e . We had e a r l i e r demonstrated t h a t changes i n the i n i t i a l ph of the system brought about wide v a r i a t i o n i n the TS y ie lds for I l l i n o i s No. 6 coal ( 6 ) . In accord with the f indings of s e v e r a l o ther groups including Appell, e t a l . ( 7 ) , t h e conversions were found t o be base promoted. The present study included a range of i n i t i a l pH values , and focused on a comparison of the r e s u l t s in H20 with those from a s u b s t i t u t i o n i n p a r a l l e l experiments of D20.
The r e s u l t s for severa l runs i n the two media are presented in Figure 2 . The f i g u r e presents a p lo t of %-toluene so luble products = q u a n t i t y of P2 produced i n t h e run (cold) . There is a range of TS y i e l d s from values up t o around 50% f o r the p r o t i o medium. These conversions were a t t a i n e d by ranging the i n i t i a l pH from 7 t o 13.
We have pointed out t h a t the water gas s h i f t reac t ion
CO + H20 4 H2 + C02
p a r a l l e l s the conversion ( 6 ) . and the r e s u l t s when presented as a funct ion of product H2 show tha t the hydrogen from t h i s reac t ion is not the e f f e c t i v e reducing species . Thus i n the f igure is a r e s u l t f o r a run with H2/P20, plo t ted a t an absc issa value equal t o tho s t a r t i n g quant i ty of hydrogen (co ld) . This point f a l l s w e l l below the 'CO/HZO r e s u l t s , and i t is c lear t h a t t h e TS y ie ld is below tha t which would be produced f o r a run with CO y ie ld ing t h a t quant i ty of hydrogen.
~ 1 ~ 0 present i n the plot is a r e s u l t f o r a conversion i n t e t r a l i n f o r 60 min at 400°c. Again the hydrothermal CO system provides the superior r e s u l t s , and a t a I
I I 95
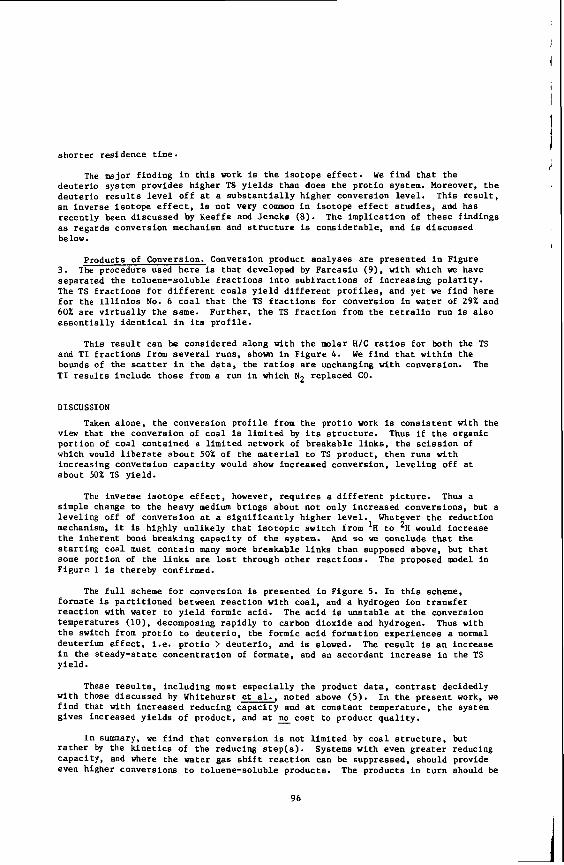
shor te r res idence t i m e .
The major f ind ing in t h i s work is t h e i so tope e f f e c t . We f ind t h a t the deuter io system provides higher TS y i e l d s than does t h e p r o t i o system. Moreover, t h e deuter io r e s u l t s l e v e l off a t a s u b s t a n t i a l l y higher conversion leve l . This r e s u l t , an inverse i so tope e f f e c t , is not very common in isotope e f f e c t s t u d i e s , and has recent ly been discussed by Keeffe and Jencks ( 8 ) . The implicat ion of these f indings as regards conversion mechanism and s t r u c t u r e is considerable , and is discussed below.
products of Conversion. Conversion product analyses a re presented in Figure 3. The procedure used here is t h a t developed by Parcasiu (9) , with which we have separated the toluene-soluble f r a c t i o n s i n t o subf rac t ions of increasing polar i ty . The TS f r a c t i o n s f o r d i f f e r e n t coa ls y i e l d d i f f e r e n t p r o f i l e s , and yet we f ind here f o r the I l l i n i o s No. 6 c o a l t h a t the TS f r a c t i o n s f o r conversion in water of 29% and 60% are v i r t u a l l y the same. Further , t h e TS f r a c t i o n from the t e t r a l i n run is a l s o e s s e n t i a l l y i d e n t i c a l in i t s p r o f i l e .
T h i s r e s u l t can be considered along with t h e molar H/C r a t i o s f o r both the TS and TI f r a c t i o n s from s e v e r a l runs. s h o w in Figure 4. We f ind t h a t within the bounds of the scatter in the da ta , the r a t i o s are unchanging with conversion. The T I results include those from a run in which N2 replaced CO.
DISCUSSION Taken alone, the conversion p r o f i l e from t h e pro t io work is cons is ten t with the
view tha t the conversion of coa l is l imi ted by i ts s t ruc ture . Thus i f t h e organic port ion of coal contained a l imi ted network of breakable links, the s c i s s i o n of which would l i b e r a t e about 50% of the material t o TS product, then runs with increasing conversion capac i ty would show increased conversion, leve l ing off a t about 50% TS yield.
The inverse i so tope e f f e c t , however. requi res a d i f f e r e n t p ic ture . Thus a s i m p l e change t o the heavy medium brings about no t only increased conversions, but a leve l ing off of conversion a t a s i g n i f i c a n t l y higher l e v e l . Whatever the reduction mechanism, it is highly unl ikely t h a t i s o t o p i c switch from 'H t o '8 would increase t h e inherent bond breaking capaci ty of t h e system. And so we conclude t h a t the s t a r t i n g coa l must conta in many more breakable l i n k s than supposed above, but tha t some portion of the l i n k s a re l o s t through o ther reac t ions . The proposed model i n F igure 1 is thereby confirmed.
The f u l l scheme f o r conversion is presented in Figure 5. In t h i s scheme, formate is par t i t ioned between reac t ion with coal , and a hydrogen ion t r a n s f e r reac t ion with water t o y ie ld formic acid. The a c i d is unstable a t the conversion temperatures (lo), decomposing rapidly t o carbon dioxide and hydrogen. Thus with t h e switch from pro t io t o deuter io , the formic ac id formation experiences a normal deuterium e f f e c t , i . e . p r o t i o > deuter io , and is slowed. The r e s u l t is a n increase in the s teady-state concent ra t ion of formate, and an accordant increase in the TS y ie ld .
These r e s u l t s , including most e s p e c i a l l y the product da ta , cont ras t decidedly with those discussed by Whitehurst e t al. , noted above (5 ) . f ind tha t with increased reducing capac i ty and a t constant temperature, the system gives increased y i e l d s of product, and a t no cos t to product q u a l i t y .
r a t h e r by t h e k i n e t i c s of t h e reducing s t e p ( s ) . capaci ty , and where the water gas s h i f t reac t ion can be suppressed, should provide even higher conversions t o toluene-soluble products.
In the present work, we
I n summary, we f i n d t h a t conversion is not l imi ted by coal s t r u c t u r e , but Systems w i t h even g r e a t e r reducing
The products in t u r n should be
96
iI
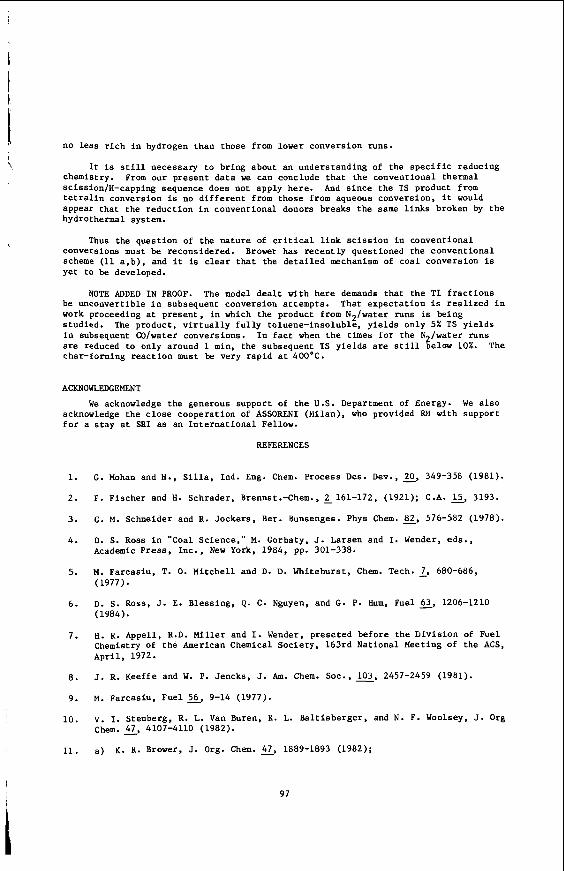
no l e s s r i c h i n hydrogen than those from lower conversion runs.
It is s t i l l necessary t o br ing about an understanding of the s p e c i f i c reducing chemistry. From our present da ta we can conclude t h a t the conventional thermal scission/H-capping sequence does not apply here. And s i n c e the TS product from t e t r a l i n conversion is no d i f f e r e n t from those from aqueous conversion, i t would appear t h a t the reduct ion i n conventional donors breaks the same links broken by the hydrothermal system.
Thus the quest ion of the nature of c r i t i c a l l i n k s c i s s i o n i n convent ional Conversions must be reconsidered. Brower has recent ly questioned the convent ional scheme (11 a , b ) , and it is c l e a r t h a t the d e t a i l e d mechanism of coa l conversion i s Yet to be developed.
NOTE ADDED I N PROOF. The model d e a l t with here demands tha t the T I f r a c t i o n s be unconvertible in subsequent conversion at tempts . work proceeding a t p resent , i n which the product from N 2 / w a t e r runs is being s tudied. The product, v i r t u a l l y f u l l y toluene-insoluble, y i e l d s only 5% TS y i e l d s i n subsequent CO/water conversions. a r e reduced to only around 1 min, the subsequent TS y i e l d s a r e s t i l l below 10%. The char-forming reac t ion must be very rapid at 4OOOC.
That expec ta t ion i s r e a l i z e d in
I n f a c t when t h e times f o r the N2/water runs
ACKNOWLEDGEMENT
We acknowledge the generous support of the U.S. Department of Energy. We a l s o acknowledge the c lose cooperat ion of ASSORENI (Milan), who provided REI with support f o r a s tay at SRI as an I n t e r n a t i o n a l Fellow.
REFERENCES
1. G. Mohan and H., S i l l a , Ind. Eng. Chem. Process D e s . Dev., z, 349-358 (1981).
2 . F. Fischer and 8. Schrader, Brennst.-Chem., 2161-172, (1921); C.A. s, 3193.
3. G. M. Schneider and R. Jockers , Ber. Bunsenges. Phys Chem. 82, 576-582 (1978).
4. D. S. Ross i n "Coal Science," M. Gorbaty, J. Larsen and I. Wender, eds . , Academic Press , Inc., New York, 1984, pp. 301-338.
5 . M. Farcasiu, T. 0. Mitchel l and D. D. Whitehurst, Chem. Tech. L, 680-686, (1977) *
6. D. S. Ross, J. E. Blessing, Q. C. Nguyen, and G. P. Hum, F u e l 3 , 1206-1210 (1984).
7. H. R. Appell, R.D. Miller and I. Wender, preseted before t h e Divis ion of Fuel Chemistry of the American Chemical Society, 163rd National Meeting of t h e ACS, Apr i l , 1972.
8. J. R. Keeffe and W. P. Jencks, J. Am. Chem. SOC., 103, 2457-2459 (1981).
9. M. Farcasiu, F u e l x , 9-14 (1977).
10. v. I. Stenberg, K. L. Van Buren. R. L. Bal t i sberger , and N. F. Woolsey, J. Org Chem. 5 4107-4110 (1982).
11. a ) K. R. Brower, J. Org. Chem. c, 1889-1893 (1982);
I 97
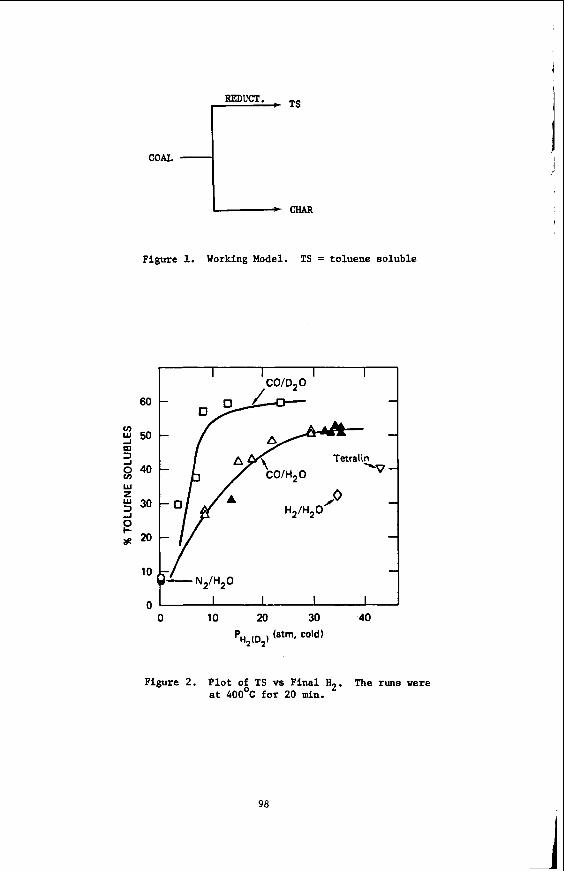
Figure 1. Working Model. TS = toluene soluble
60
v) 50
m 2 40 W z
30 2 e
10
0 1 I I I I I 0
Figure 2.
10 20 30 PH (D (atm. cold)
2 2
Plot of TS vs Final H2. at 40OoC for 20 min.
40
The runs were
98
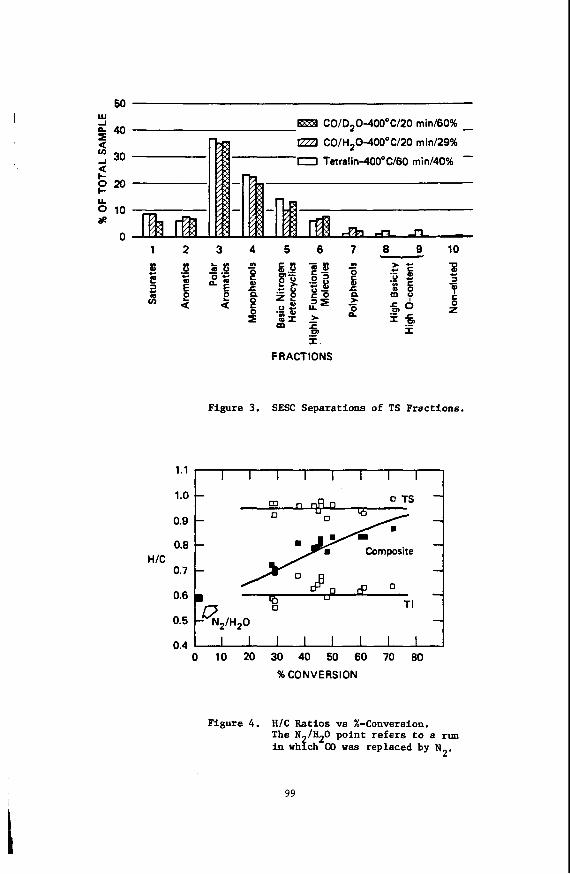
w CO/D20-400"C/20 min/60% -
0 Tetralin-400°C/60 rninNO% -
g40
E20
4 EZJ CO/H20-40O0C/20 min/29% -I 30 U v)
10
0 aR
1 2 3 4 5 6 7 8 9 10
H/C
FRACTIONS
Figure 3. SESC Separations of TS Fractions.
1 .o
0.9
0.8
0.7
0.6
0.5
0 TS m
Composite
0 TI
0.4 I I I I I I I I I I 0 10 20 30 40 50 60 70 80
%CONVERSION
Figure 4. H/C Ratios vs %-Conversion. The N /H20 point refers to a run i n whgch CO was replaced by N2.
99
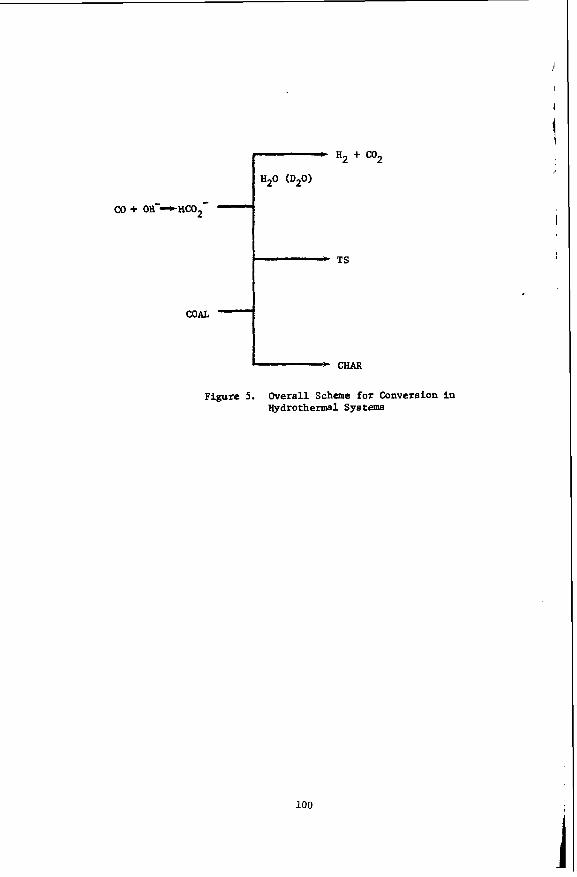
co + oH--+Hco2-
COAL 1 - CHAR Figure 5. Overall Scheme for Conversion in
Hydrothermal Systems
100
EXTRACTION OF AWTRALIAN COALS WITH SUPERCRITICAL WATER
John R. Kershaw and Laurence J. Bagnell
CSIRO Division of Applied Organic Chemistry, G.P.O. Box 4331, Melbourne, Victor ia 3001, Aus t ra l ia . !
INTRODUCTION
The ex t rac t ion of coals v i t h s u p e r c r i t i c a l f l u i d s is a promising route f o r the production of l iqu id fue ls and chemical feedstocks from coal. Generally, hydrocarbon so lvents , notably toluene, have been used as the s u p e r c r i t i c a l f lu id . Supercr i t ica l water e x t r a c t i o n has not received the same a t t e n t i o n and only recent ly t h e f i r s t de ta i led study w a s reported. In tha t work, Holder et al. ( 1 ) obtained high conversion f o r e x t r a c t i o n of a German brown coal and a Bruceton bituminous coal with s u p e r c r i t i c a l water a t ca. 375'C and 23 MPa. They reported conversions of 70-75% f o r the brown coal and ca 58% for t h e bituminous coa l , when t h e coa l was i n j e c t e d i n t o the reactor . However, the conversion was lower (ca 58% f o r the brown coa l ) when the coal was present during t h e heating-up period. These high y i e l d s cont ras t with the work of Scarrah ( 2 ) , who obtained a conversion of approximately 35% and a l i q u i d y ie ld of only about 10% f o r the ex t rac ton of a North Dakota l i g n i t e at 4OOOC and 28 MPa, while Holder e t al. a l s o obtained very low conversion with a high sodium l i g n i t e ( 1 ) . In other br ie f r e p o r t s (3-5) on t h e ex t rac t ion of bituminous coals with s u p e r c r i t i c a l water, conversions were considerably less than produced with t h e Bruceton coa l (1). However, t h e condi t ions used in a t l e a s t one of these s tud ies ( 4 ) were not i d e a l f o r s u p e r c r i t i c a l water e x t r a c t i o n as the solvent densi ty was r e l a t i v e l y low. Nevertheless, there appears t o be considerable v a r i a t i o n i n the e x t r a c t i v e power of s u p e r c r i t i c a l water with d i f f e r e n t coals. None of the above r e p o r t s discussed i n any d e t a i l the chemical nature of t h e products, nor how the products compare with those obtained from more conventional solvents .
The p o t e n t i a l use of s u p e r c r i t i c a l water appears e s p e c i a l l y a t t r a c t i v e f o r the ex t rac t ion of brown coals with t h e i r high water conten t , 50-70% f o r Victor ian brown coa ls , thus removing t h e need f o r a coal-drying s tage. The drying and ex t rac t ion of these low rank coals would occur in a s i n g l e process. The purpose of the present study was t o i n v e s t i g a t e the f e a s i b i l i t y of the ex t rac t ion of Austral ian black and brown coa ls with s u p e r c r i t i c a l water. The chemical na ture of the products is discussed toge ther with a comparison with toluene ex t rac t ion of the same coals .
EXPERIMENTAL
The analyses of the coals used are given i n Table 1.
Su e r c r i t i c a l gas e x t r a c t i o n s M e t h o d r r i e d out f o r 1 h a t temperature in a 1 1 semi- continuous reac tor (6 ) . The reactor w a s charged v i t h coa l (50 g dry bas is ) and solvent (600 ml) and heated. When the temperature reached 300°C, solvent ( 1 1 h-1) was pumped v i a a d i p tube, which a c t s as a pre-heater , i n t o t h e bottom of the reac tor and through t h e coal bed. The pressure was control led by adjust ing t h r o t t l i n g valves and the gaseous phase w a s condensed by a water- cooled condenser.
101
For t he toluene e x t r a c t i o n s , t h e work-up procedure was as described previously ( 6 ) . i n water, a f t e r cooling and lowering of t h e pressure , and p r e c i p i t a t e s out i n the condenser and rece iver . The product adhering t o the s ides of t h e condenser and rece iver was co l l ec t ed by washing with acetone and then THF. The aqueous suspension w a s evaporated t o dryness on a ro ta ry evaporator and t h e residue ex t rac ted with acetone and THF. The so lvents were removed under reduced pressure from the combined acetone and THF so lu t ions t o give the t o t a l e x t r a c t ( l i q u i d product). I n c a l c u l a t i n g t h e conversion f igu res , any product which was inso luble in THF was assumed t o be unreacted coal , which had been ca r r i ed over. The l i q u i d product was ex t rac ted with hot toluene and the cooled so lu t ion f i l t e r e d t o g ive the pre-asphaltene f r ac t ion . After the toluene was removed under reduced pressure from t h e f i l t r a t e , t he residue was re-dissolved i n a small volume of to luene and a 20 fo ld excess of pentane added t o p r e c i p i t a t e t h e asphal tene which was f i l t e r e d off . toluene were then removed from the f i l t r a t e under reduced pressure t o give the o i l . For t h e NaOH ex t r ac t ions , t h e NaOH solu t ions were neu t r a l i s ed with HC1. The inso luble ex t r ac t w a s washed with water and then ex t rac ted with THF.
Method B with a s t a i n l e s s s t e e l l i n e r . The i n t e r n a l volume of the autoclave with l i n e r was 420 ml. and maintained at tha t temperature f o r 1 h. The residue was washed out of the cooled r eac to r with acetone, f i l t e r e d , washed with pyridine and then acetone and dried under vacuum. In some cases , g.c. analyses of the gases i n the cooled reac tor were ca r r i ed out. Analy t ica l procedures f o r t h e products were as described previously (7 ) .
For the water ex t r ac t ions , most of t he ex t r ac t is insoluble
The pentane and
Ext rac t ions were carried out i n a 500 m l rocking autoclave f i t t e d
The au toc lave w a s charged with coa l and so lvent , heated t o 380'C
RESULTS AND DISCUSSION
Good conversions were obtained f o r ex t r ac t ion of a number of Victorian brown coals a t conditions (380'C and 22 XPa) close t o the c r i t i c a l temperature (374°C) and p r e s s u r e (22 @ a ) of water (see Table 2). The conversion increased as the v o l a t i l e matter content of these coa ls increased (see Fig. 1). Similar t rends were a l s o obtained f o r toluene and 5% t e t r a l i n / t o l u e n e ex t rac t ion . The highest conversions were obtained f o r the two pale l i thotypes (F and G). These were s l i g h t l y lower than obtained by Holder e t a l . (1) f o r ex t r ac t ion of a high v o l a t i l e German brown coa l and may be due t o d i f fe rences i n t h e ex t r ac t ion procedure. Except f o r t he low ash Loy Yang coal, da t a f o r the brown coals a r e given on a dry mineral and inorganic f r e e (dmif) basis which is the prefer red b a s i s f o r recording da ta on these coa l s (8). The conversions were not a s high f o r Nillmerran (sub-bituminous) and Liddel l (bituminous) coals ( s ee Table 2 ) . conversions fo r ex t r ac t ion of Bruceton coa l v i t h high reac tor stirrer speeds which were not poss ib le with our reac tor . da ta i n Table 2 are the average of dupl ica te determinations. v a r i a t i o n between t h e dup l i ca t e s was 1.8%. The asphaltene and pre-asphaltene contents of the l i qu ids a r e high ( see Table 2 ) , as is the case with s u p e r c r i t i c a l g a s e x t r a c t i o n us ing hydrocarbon so lvents . Two of t h e coals , Morwell and Yallourn were as-mined samples tha t had not been dr ied and were broken i n t o small p ieces f o r t h e ex t rac t ion . with these coa ls i nd ica t e s t he f e a s i b i l i t y of ex t r ac t ing ' w e t ' brown coals with s u p e r c r i t i c a l water.
Holder e t a 1 (1) only obtained high
The conversion and l i q u i d y ie ld Average
The p r o d s i n g r e s u l t s obtained
Ext rac t ions of two of t h e coa l s , Loy Yang and Coolungoolun, were a l s o
102
car r ied out i n a rocking autoclave (method B) mainly t o a l low a n a l y s i s of the gases to be c a r r i e d out . The r e s u l t s of these e x t r a c t i o n s are shown i n Table 3. were ind ica t ive of t h e high carboxyl ic content of t h e brown coals . hydrocarbon gas make was low as was the y i e l d of carbon monoxide. S tudies of the Pyrolysis of Victor ian brown coa ls have shown t h a t s i g n i f i c a n t q u a n t i t i e s of water a r e evolved together with the carbon dioxide (9) . The loss of water (and a l s o hydrogen sulphide i n the case of Coolungoolun coa l ) presumambly accounts f o r some of t h e d i f f e r e n c e between t h e conversion f i g u r e s and t h e sum of the e x t r a c t y ie ld and the gas f igures i n Table 3. The carbon dioxide y ie ld was not iceably lower on e x t r a c t i o n of Coolungoolun coa l , which has the lowest oxygen content of the seven brown coa ls , than f o r e x t r a c t i o n of Loy Yang coal.
Chemical Nature of t h e Product
The high carbon dioxide y i e l d s obtained, espec ia l ly from Loy Yang c o a l , The
Analyt ical d a t a f o r the o i l s , asphal tenes and pre-asphaltenes from the various ex t rac t ions are summarised i n Table 4. There appeared t o be l i t t l e d i f fe rence between t h e l i q u i d s produced from the coals A-E under the same conditions (380"C, 22 MPa). This is not surpr i s ing consider ing t h e s i m i l a r i t y between the coals ( s e e Table 1) . The l i q u i d s have a high oxygen and hydroxyl content , espec ia l ly i n the asphal tene and pre-asphaltene f r a c t i o n s , in keeping with t h e high oxygen content of these coals. oils, asphal tenes and pre-asphaltenes are higher than f o r most coa l l iqu ids .
The H/C atomic r a t i o of t h e
13C-NMR spec t ra showed the presence of s u b s t a n t i a l amounts of unsubst i tuted a l k y l chains , with a chain length of more than e i g h t carbon atoms, in both t h e o i l s and asphal tenes by s t rong s i g n a l s a t ca 14, 23, 3 2 , 29 and 29.5 ppm, which are due t o the respect ive a, 6, Y , 6 and E carbons (10). Weak s igna ls a t ca 178 ppm indica ted t h e presence of COOH groups in t h e oils and asphaltenes.
Analyt ical da ta on t h e res idues from four e x t r a c t i o n s are given in Table 5. The high c a l o r i f i c value of the ex t rac t ion res idues i n d i c a t e s t h a t they should be a t t r a c t i v e materials f o r combustion.
13C CP-MAS NMR spec t ra were recorded f o r Coolungoolun c o a l and f o r t h e residue from e x t r a c t i o n of t h i s coa l with s u p e r c r i t i c a l water. The major difference between t h e two spec t ra was a much more in tense a l i p h a t i c peak centered a t 30 ppm in t h e spectrum of t h e s t a r t i n g coal. The decrease i n the i n t e n s i t y of the a l i p h a t i c s i g n a l on processing is in agreement with the a l i p h a t i c na ture of t h e l i q u i d product e s p e c i a l l y t h e presence of long methylene chains i n t h e oil and asphaltene. These methylene chains cont r ibu te s i g n i f i c a n t l y t o t h e peak a t 30 ppm i n t h e s t a r t i n g coa l (11).
The ex t rac t ion of Coolungoolun coal with s u p e r c r i t i c a l water can be summarisied as:-
Char, 57.6%, H/C=0.60, fa=0.84 +
Pre-asphaltene, 7.6%, H/C-0.96, fa-0.79 + Asphaltene, 5.3%, H/C=0.99, fa=0.66
+ O i l , 13.2%, H/C-1.35, fa=0.47 +
Coal H2° 380 'C+ 22 MPa
H/C=0.87 f a = 0.62
cog, 9.7% I
103
The conversion and l i qu id y i e ld both increase considerably as the pressure increases ( s e e Fig. 2 ) . The asphaltene and pre-asphaltene content of I the l i qu ids a l s o inc rease with pressure (compare 5,6 and 7 i n Table 2). The
104
Extrac t ions of Gelliondale coa l were ca r r i ed out a t 38OoC, 42OOC and 46OOC. There were only small d i f fe rences between the conversions, l i qu id y i e l d s and na tu re of t h e products a t these var ious temperatures (compare 2 , 3 and 4 i n Tables 2 and 4 ) . This is somewhat su rp r i s ing as i t was expected,
aromat ic i ty than t h e asphal tene form t h e to luene ex t rac t ion . unable t o expla in whether the d i f fe rences between the water and to luene e x t r a c t s a r e due t o t h e s u p e r c r i t i c a l water e x t r a c t i n g more polar substances from the coa l , o r whether r eac t ions occur between the coa l fragments and s u p e r c r i t i c a l water which give rise t o t h e high oxygen content of t h e ex t r ac t .
Extraction with a l k a l i and te t ra l idwater mixtures
This work is
A considerable inc rease i n conversion of Morwell brown coa l occurs when d i l u t e sodium hydroxide was used i n place of water ( see Table 6 and Fig. 4 ) . Dilute sodium carbonate and formate had a similar e f f e c t ( see Table 6 ) . The conversion and l i q u i d y i e l d increases with t h e molar i ty of t h e sodium hydroxide (Fig. 4 ) . The d i s so lu t ion of low rank coa ls by sodium (o r potassium) hydroxide so lu t ions has been previously documented (11 -13 ) and; therefore , an increase in conversion was expected. It is not iceable t h a t t h e
I i nc rease i n l i qu id y i e l d is mainly due t o an increase i n t h e pre-asphaltene I f r a c t i o n (Fig. 4 ) . The composition of the o i l s and asha l tenes from the sodium
hydoxide ex t r ac t ions appear similar t o those obtained form water ex t r ac t ion
high hydrogen a romat i c i t i e s than from water ex t rac t ion . 1 but the pre-asphaltenes from t h e a l k a l i ex t r ac t ions have lower H/C r a t i o s and
Increase i n conversion is a l s o obtained with t e t r a l in /wa te r mixtures (see Table 6) i n an analogous manner t o the increased conversion with t h e add i t ion of small amounts of t e t r a l i n t o toluene ( 6 and Fig.1).
CONCLUSIONS
This study ind ica t e s t ha t ex t r ac t ion wi th s u p e r c r i t i c a l water could be an a t t r a c t i v e route fo r l i que fac t ion of Victorian brown coa l s . The low cos t and ready a v a i l a b i l i t y of t h e so lvent (water), t h e r e l a t i v e l y high H/C r a t i o of t he ex t r ac t s , and a l s o as ne i the r hydrogen nor a coal-drying s tage a r e required, a r e pos i t i ve f ac to r s .
1
2
3
4
5
6 7 8 9
10
11
12 13 14
REFERENCES kshpande, G.V., Holder, G.D., Bishop, A . A . , Gopal, J. and Wender, I. Fuel, 1984, 63, 956. Scarrah, W.P. i n 'Chemical Engineering a t Supe rc r t i ca l Fluid Conditions' (M.E. Pau la i t i s , J.M.L. Penninger, R.D. Gray and P. Davidson Eds.). Ann Arbor Science, Ann Arbor, 1983, pp. 395-407. Modell, M., Reid, R.C. and Amin, S.I. U.S. Patent 4 , 1 1 3 , 4 4 6 , September 1 2 , 1978. Jezko, J., Gray, D. and Kershaw, J.R. Fuel Processing Technology, 1982, 5, 229. Vasilakos, N.P., Dobbs, J .M. and Paras i , A.S. he r . Chem. SOC., Mv. Fuel Chem. Prepr in ts , 1983 , z ( 4 ) . 212. Kershaw, J.R. and Overbeek, J .M. Fuel, 1 9 8 4 3 , 1174. Kershaw, J.R. Fuel Processing Technology, 1984, 2 , 2 3 5 . Kiss, L.T. and King, T.N. Fuel, 1 9 7 9 2 , 547. Schafer, H.N.S. Fuel, 1979, 58, 667 and 673. Pugmire, R.J., Grant, D.M., Z i l m , K.W., Anderson, L.L., Oblad, A.G. and Wood, R.E. Fuel, 1 9 7 7 , 5 6 , 295. Russell , N . J . , Wilson, M.A. , Pugmire, R.J. and Grant, D.M. Fuel, 601. Lynch, B.M. and Durie, R.A. Aust. J. Chem., 1960, 2, 567. Brooks, J.D. and S te rnhe l l , S . Fuel, 1958, 37, 124. van Bodegom, B., van Veen, J.A.R., van Kessel, G.M.M., Sinnige - Nijssen, M.W.A. and Stu iver , H.C.M. Fuel, 1984, 63, 346.
1 9 8 3 , 2 ,
I ' ! ' 105
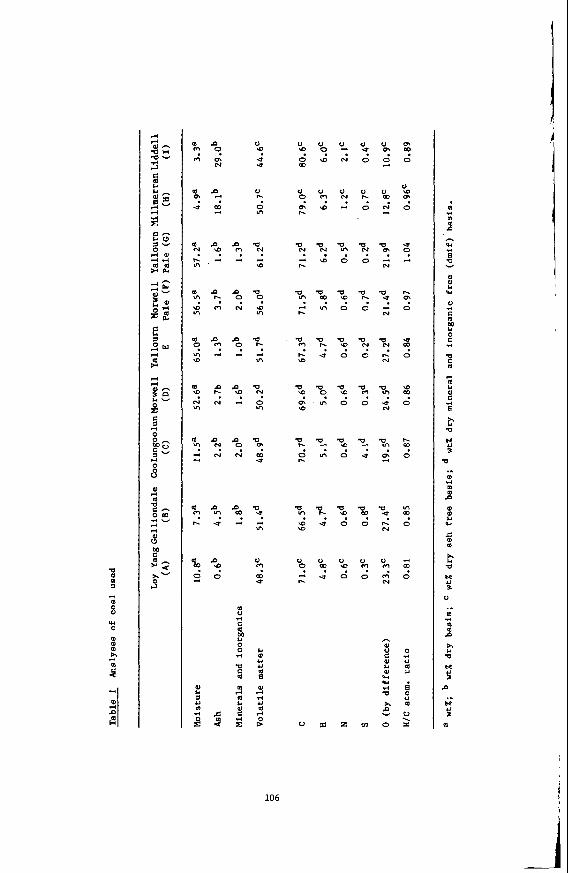
m m
d
0
W
0
%G 9 - s” d
m d
m M 0
d
X
h
8 al
P) W
W d
a h e
0
w
6
Yi Q
5 .. m
e
d
3 al
CI W
fi c Q
n 3
0
.^ m d m e A a n U
e .. M u 3 m
106 t i
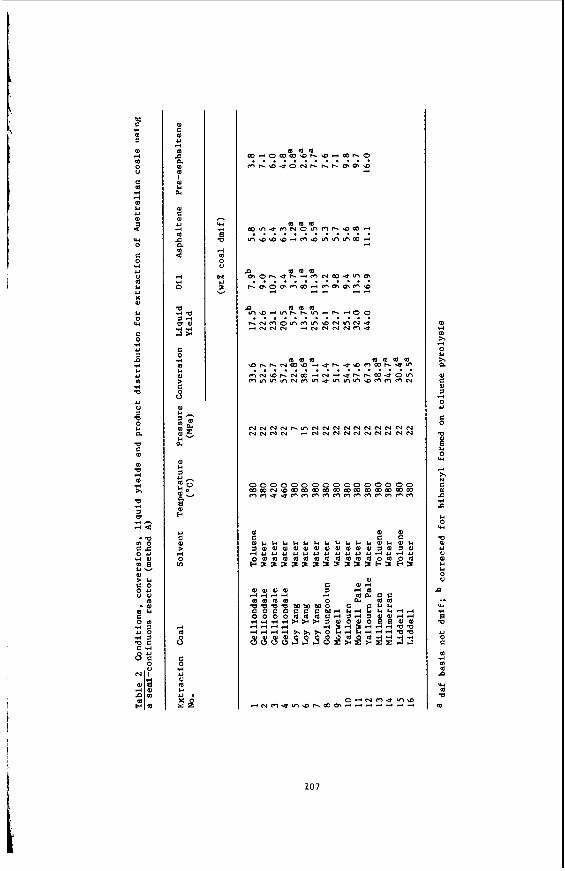
bo d m
(D d
0
C
4 4 m U
! W 0 C
d U
m
X
Id
W
C d U
u
2 u
d Q
U
0
L,
71
m m a d
W d h
Q d
0-
m
a
n
=a ^ Q
G P o u d W
m o
m g 2- 3&4 c o o u u v
- P I m & 4
g m ro u o d a Q C
$ 2
00 d 0 m % b % a - m h 0 . . . . . . . . . . . . + m t - a u o ~ h ~ - h r n r n a
N N N N h m N N N N N N N N N N N N N N 4 N N N N N N N N N N
0000000000000000 m m u u m m m m m m m m m m m m c e m ~ a w m m m m m m c o m c o m m
m d
x 3 0 x a W
W
rl
0 U
g
e 0
L,
w 3 p e d e L,
W
a U
PI Y 0
e .” w d
0
U
2
: m d
e W
a m
10 7
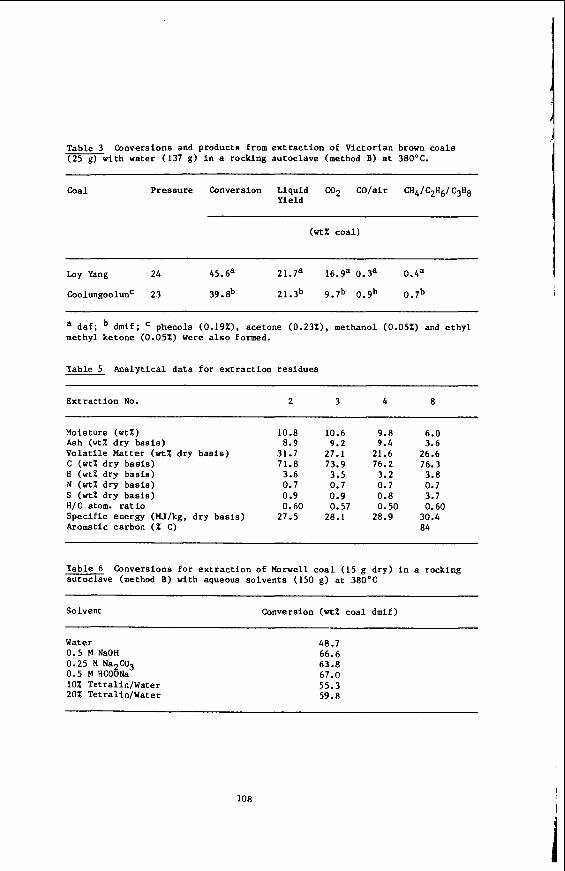
Table 3 .-with water (137 g) in a rocking autoclave (method B) at 380'C.
Conversions and products from e x t r a c t i o n of V ic to r i an brown coa l s
Coal
Loy Yang 24 45.6a 21.7a 16.ga 0.3a 0.4a
Coolungoolun' 23 39.8b 21.3b 9.7b O.gb 0.7b
a d a f ; dmif; phenols (0.19%), acetone (0.23%), methanol (0.05%) and e t h y l methyl ketone (0.05%) were a l s o formed.
Table 5 Ana ly t i ca l da t a f o r e x t r a c t i o n r e s idues
Ex t rac t ion No. 2 3 4 8
Moisture ( w t % ) 10.8 10.6 9.8 6.0 Ash (wtX d ry bas i s ) 8.9 9.2 9.4 3.6 Vo la t i l e Matter ( w t % dry b a s i s ) 31.7 27.1 21.6 26.6 C (wtX d r y bas i s ) 71.8 73.9 76.2 76.3 H (we% dry b a s i s ) 3.6 3.5 3.2 3.8 N (we% dry b a s i s ) 0.7 0.7 0.7 0.7 S (w% dry b a s i s ) 0.9 0.9 0.8 3.7 H / C atom. r a t i o 0.60 0.57 0.50 0.60 Spec i f i c energy (MJ/kg, dry b a s i s ) 27.5 28.1 28.9 30.4 Aromatic carbon ( % C) 84
Table 6 autoclave (method B) with aqueous so lven t s (150 g) a t 38OoC
Conversions f o r e x t r a c t i o n of Morwell c o a l (15 g d ry ) in a rocking
Solvent Conversion (wt% coa l dmif)
Water 0.5 M NaOH 0.25 M Na2C03 0.5 M HCOONa 10% Tetral in/Water 20% Tetral inIWater
48.7 66.6 63.8 67.0 55.3 59.8
108
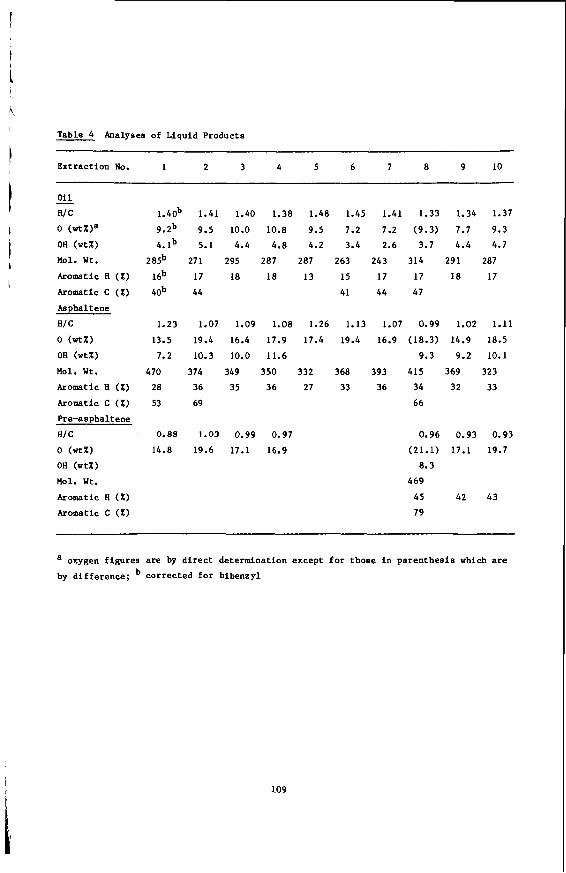
Table 4 Analyses of Liquid Products
Extraction No. 1 2 3 4 5 6 7 8 9 10
Oil H/ C 0 (wtX)a
-
OH (wt%)
Mol. W t .
Aromatic H ( X )
Aromatic c ( X )
Asphalt ene
A/ C 0 (wt%)
OH (wt.?)
Mol. W t .
Aromatic H (Z) Aromatic c (2;)
Pre-asphaltene
H/ c 0 (an OH (wt.?)
Mol. U t .
Aromatic H ( X )
Aromatic C ( X )
1.40b 1.41 1.40 1.38 1.48 1.45 1.41 1.33 1.34 1.37
9.2b 9.5 10.0 10.8 9.5 7.2 7.2 (9.3) 7.7 9.3
4.1b 5.1 4.4 4.8 4.2 3.4 2.6 3.7 4.4 4.7
28Sb 271 295 287 287 263 243 314 291 287
16b 17 18 18 13 15 17 17 18 17
40b 44 41 44 47
1.23 1.07 1.09 1.08 1.26 1.13 1.07 0.99 1.02 1.11
13.5 19.4 16.4 17.9 17.4 19.4 16.9 (18.3) 14.9 18.5
7.2 10.3 10.0 11.6 9.3 9.2 10.1
470 374 349 350 332 368 393 415 369 323 28 36 35 36 27 33 36 34 32 33
53 69 66
0.88 1.03 0.99 0.97
14.8 19.6 17.1 16.9 0.96 0.93 0.93
(21.1) 17.1 19.7 8.3
469
45 42 43
79
a oxygen figures are by direct determination except for those i n parenthesis which are
by difference; corrected for bibenzyl
109
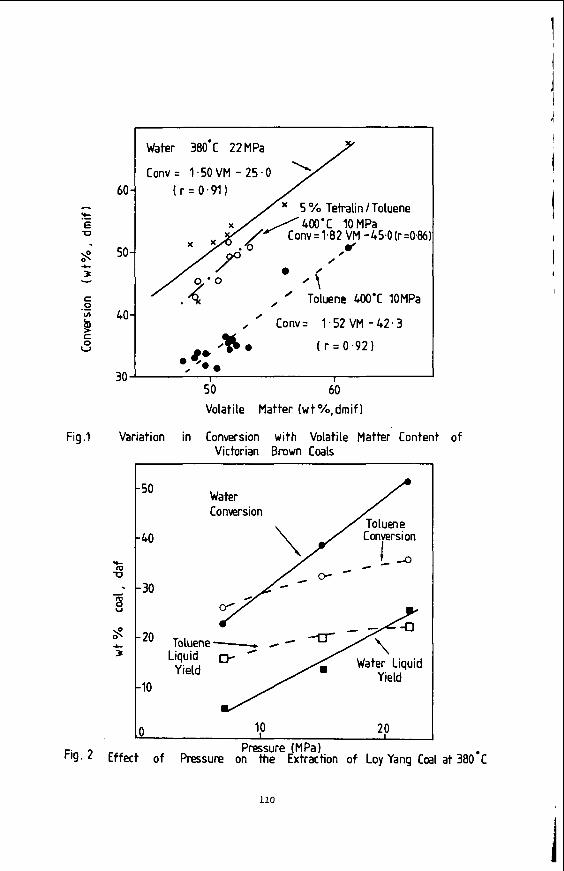
i
60 -
50 -
40-
30
- Y- E U
$ c 3 I
c 0 v) .- k c 0 U
Fig .I
Fig. 2
Water 380'C 22MPa
Conv = 1.50VM - 25.0
' Toluene 400.C 10MPa / , Conv= 1.52VM -42 .3
05 0 ( r = O . 9 2 ) 0 e:*
0
I I
rc 3 . 3 U
4- 3
- 50
-40
-30
-20
-10
Water Conversion
Toluene- - U Liquid
Yield Water Liquid Yield
10 10 20 Pressure (MPal
Effect o f Pressure on the Extraction o f Loy Yang Coal at 380.C
110
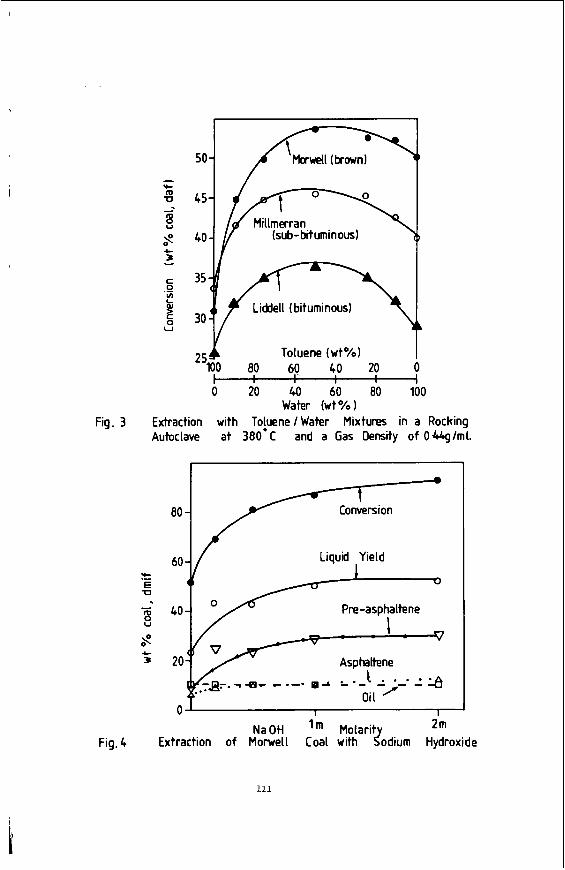
(sub-tntuminous)
Toluene (wt%)
0 20 40 60 80 100 Water (wto/o)
Fig. 3 Extraction with To!uene/Water Mixtures in a Rocking Autoclave at 380 C and a Gas Density of O U q l r n l .
604 / Liquid Yield Y- I
8 s 3 20 Asphaltene
oil-/
E 0 U
40 Pre-asphaltene d
; I ;
LA - *-“a
U
v c
2m Na OH ’ Molarit Fig.4 Extraction of Momell Coal with {odium Hydroxide
111
Effec t of Solvent Density on Coal Liquefact ion Under S u p e r c r i t i c a l Conditions
G.V. Deshpande G.D. Holder
and Y.T.Shah
b p a r t m e n t of Chemical and Petroleum Engineering Universi ty of P i t t sburgh
Pi t t sburgh , PA 15261
ABSTRACT
S u p e r c r i t i c a l f l u i d e x t r a c t i o n is an a t t r a c t i v e process pr imar i ly because the dens i ty and s o l v e n t power of a f l u i d changes dramat ica l ly with pressure a t temperatures near t h e cr i t ical . I n complex s u p e r c r i t i c a l e x t r a c t i o n s , such a s the e x t r a c t i o n of c o a l , t h e d e n s i t y of t h e s u p e r c r i t i c a l f l u i d should a l s o change the e x t r a c t a b i l i t y of t h e coal . In t h i s experiment a non-reacting s u p e r c r i t i c a l f l u i d , to luene , was s tudied t o determine t h e e f f e c t of d e n s i t y on the coa l ex t rac t ion / reac t ion process . Ext rac t ions were c a r r i e d out f o r two t o 60 minutes at reduced d e n s i t i e s between 0.5 and 2.0 and a t temperatures between 647 and 698K. t h e d a t a obta ined can be explained by t h e hypothesis t h a t coa l d i sso lu t ion i s required preceding l i q u e f a c t i o n reac t ions and t h a t t h e degree of d isso lu t ion depends upon so lvent d e n s i t y and temperature.
INTRODUCTION
E a r l i e r e f f o r t s aimed a t understanding s u p e r c r i t i c a l e x t r a c t i o n of coal used both flow and b a t c h r e a c t o r s .
In the f low c o a l was packed i n t o the reac tor and the s u p e r c r i t i c a l f l u i d w a s passed through the bed of coa l u n t i l t h e condensed e f f l u e n t w a s c l e a r . The conversion was def ined as t h e t o t a l weight loss of the c o a l due t o e x t r a c t i o n by t h e so lvent .
In batch s y ~ t e . m s ( ' ) - ( ~ ~ ) , t h e coa l and so lvent were placed i n a reac tor and
More recent ~ t u d i e s ( l ~ ) * ( ~ ~ ) have employed a rap id i n j e c t i o n autoclave, where c o a l i s i n j e c t e d i n t o a preheated s u p e r c r i t i c a l so lvent . Af te r the reac t ion i s over t h e products are quenched by passing water through i n t e r n a l cool ing c o i l s .
heated toge ther t o t h e r e a c t i o n teapera ture .
m e g e n e r a l t r e n d s observed i n t h e s t u d i e s d iscussed above do provide some important i n s i g h t s ; h igher temperatures and higher d e n s i t i e s r e s u l t i n higher conversions p a r t i a l l y because more coa l d i sso lves i n t h e s e r c r i t i c a l solvent a s temperature and d e n s i t y are increased. Blessing and Ross?') c o r r e l a t e d the coa l conversion t o p y r i d i n e s o l u b l e s wi th t h e Hldebrand S o l u b i l i t y Parameter, 6 , which they def ined as
where P, is t h e c r i t i c a l p ressure of t h e medium i n atmospheres, P , is its reduced d e n s i t y and pE i s genera l ized reduced d e n s i t y of l i q u i d s , taken t o be 2.66. They found t h e product p y r i d i n e s o l u b i l i t y t o be a l i n e a r func t ion of 6 .
EXPERIMeNTAL I_ --
Bruceton bi tuminous, a P i t t sburgh Seam c o a l was used i n t h e experiment. The The c o a l was d r i e d i n vacuum @ 343 chemical a n a l y s i s of c o a l i s g iven i n ' b b l e I.
K p r i o r t o use and s t o r e d i n g l a s s conta iners under n i t rogen .
1 1 2
I
J
S u p e r c r i t i c a l Coal Liquefact ion Procedure
The experimental apparatus i s shown i n Figure 1 and c o n s i s t s of a I-L s t a i n l e s s steel au toc lave equipped wi th a b g n e d r i v e s t i r k e r and a c o a l i n j e c t i o n system. The reac tor i s charged with a known q u a n t i t y of toluene depending on t h e f l u i d d e n s i t y d e s i r e d f o r t h e experiment and i s heated a t 3-4 Umin t o t h e temperature desired. Once t h i s temperature is reached, ambient coa l is i n j e c t e d i n t o the reac tor from a c o a l r e s e r v o i r using h igh-pressure Argon. lhe average weight of in jec ted coa l was 3Og. Reaction times are measured from t h e time at which t h e c o a l is i n j e c t e d .
The l i q u i d and s o l i d contents were c o l l e c t e d from t h e r e a c t o r and placed i n a n e x t r a c t i o n thimble which was then placed i n a soxhle t u n i t . 'he contents were then ex t rac ted wi th toluene u n t i l t h e e x t r a c t a n t w a s c l e a r a f t e r which t h e thimble was d r i e d and weighed. The weight of t h e d r i e d product is designated as toluene inso lubles .
The conversion, based on the e x t r a c t i o n r e s u l t s . are def ined below.
Gases, Oils and Asphaltenes (GOA), X - 100 x
(SaJLnJected ( 9 ) - to luene inso lubles (9) coal i n j e c t e d (g)
All weights a r e on a moiature and a s h f r e e b a s i s .
)
Discussion
Experiments were c a r r i e d out wi th Bruceton c o a l and toluene a t s u p e r c r i t i c a l toluene d e n s i t i e s i n t h e range of 0.157-0.601 g/cc . m e temperature range s tudied w a s 647-698,K and t h e r e a c t i o n t i m e was var ied from two minutes t o 60 minutes.
'he r e s u l t s of experiments a t 647K and reduced d e n s i t i e s of 0.5 t o 2.0 ( toluene d e n s i t i e s of 0.157 g/cc and 0.601 g/cc) a r e given i n Figures 2a and 2b. lhe experimental r e s u l t s show t h a t to luene s o l u b l e s ( o i l s , asphal tenes , and gases) a r e produced during t h e react ion. They a l s o show t h a t t h e amount of toluene so lubles formed a t low r e a c t i o n times increases with both temperature and dens i ty . In addi t ion , s o l u b i l i t y s t u d i e s have shown t h a t the amount of a s o l i d which can d isso lve i n a s u p e r c r i t i c a l f l u i d increases wi th d e n s i t y and, genera l ly , with temperature. Hence, we concluded t h a t t h e conversion of c o a l t o o i l s + asphal tenes + g a s e s i s i n some sense l i m i t e d by t h e d i s s o l u t i o n of the c o a l i n t h e so lvent .
We hypothesize t h a t t h e only par t of t h e coa l which undergoes r e a c t i o n t o gas , o i l s and asphal tenes i s t h e d isso lved f r a c t i o n , which increases with temperature and dens i ty . Increases i n t h e d isso lved f r a c t i o n thus lead t o higher conversions and f a s t e r r e a c t i o n r a t e s . These(fqfversion products then p a r t i c i p a t e i n re t rogress ive reac t ions (Amestica and Wolf ) forming char , so t h a t at longer times ( 1 5 minutes O K more) t h e y i e l d of gases + o i l s + asphal tenes decreases . A t lower temperatures (647 K), the re t rogress ive reac t ions are i n s i g n i f i c a n t and conversion does n o t decrease with time.
The above hypothesis is w e l l explained by t h e r e s u l t s given i n Figures 2a and 2b. A t a lower d e n s i t y of 0.157 g/cc t h e f r a c t i o n of c o a l d i sso lved i n t h e s u p e r c r i t i c a l f l u i d i s much lower than when t h e d e n s i t y of t h e s u p e r c r i t i c a l f l u i d i s 0.601 g/cc . tlence, t h e f r a c t i o n of c o a l , which i s converted t o asphal tenes , o i l s and gases , i s a l s o lower.
The r e s u l t s of experiments at 673 K and reduced d e n s i t y of 1.0 and 1.5 ( s u p e r c r i t i c a l to luene d e n s i t y of 0.301 g / c c and 0.444 g/cc) are given i n Figure 3a. A s observed a t 647 K. the coa l conversion t o gases + o i l s + asphal tenes ( toluene so lubles ) i n c r e a s e wi th r e a c t i o n time and wi th t h e d e n s i t y of t h e
113
s u p e r c r i t i c a l f l u i d . The re t rogress ive reac t ions are more s i g n i f i c a n t now and hence, t h e to luene s o l u b l e s show a maxima in conversion with t i m e .
The r e s u l t s o f experiments a t 698 K and reduced dens i ty of 1.0 and 1 .5 ( s u p e r c r i t i c a l to luene d e n s i t y of 0.301 g / c c and 0.444 g / c c ) a r e given in Figure 3b. As observed a t 647 K and 673 K. t h e c o a l conversion t o gases + o i l s + asphal tenes ( toluena s o l u b l e s ) increases with r e a c t i o n t i m e and d e n s i t y of t h e s u p e r c r i t i c a l f l u i d . The re t rogress ive reac t ions are more pronounced than t h a t a t 673 K but we s t i l l observe a maxima in t h e to luene s o l u b l e s a s a func t ion of reac t ion t i m e . The i n i t i a l r a t e of formation of toluene so lubles ( a s seen from t h e s teepness of t h e curves of toluene s o l u b l e s versus r e a c t i o n t i m e ) is higher a t h igher d e n s i t y and higher temperature. Also n o t e t h a t t h e amount of toluene so lubles at t h e maxima is higher when t h e temperature and d e n s i t y of t h e s u p e r c r i t i c a l f l u i d is higher . This is c o n s i s t e n t with the hypothesis t h a t the so luble f r a c t i o n o f t h e c o a l increases wi th temperature and d e n s i t y of t h e s u p e r c r i t i c a l f l u i d .
Because c o a l is heterogeneous in nature, a s t h e dens i ty I s increased, heavier and heavier c o a l f r a c t i o n s (as opposed t o more and more of t h e same f r a c t i o n ) a r e dissolved in t h e s u p e r c r i t i c a l f l u i d . These would not d i s s o l v e i f the dens i ty of t h e s u p e r c r i t i c a l f l u i d were lower, and t h e s u p e r c r i t i c a l f l u i d is, i n genera l , un l ike ly t o be s a t u r a t e d wi th any given f r a c t i o n t h a t is s u b s t a n t i a l l y dissolved ( i .e . e i t h e r zero O K 100% of a f r a c t i o n is disso lved) . For example, i f coa l is considered t o be composed of 100 f r a c t i o n s charac te r ized by increas ing molecular weight , more and more of t h e s e f r a c t i o n s d i s s o l v e as dens i ty i s increased , b u t t h e s o l u b i l i t y of a given f r a c t i o n goes from (approximately) z e r o t o 100% over a small change i n dens i ty . I f a given f r a c t i o n , number 46 f o r example, is disso lved , then more of t h a t molecular weight group would d i s s o l v e a t t h a t d e n s i t y i f i t were present , but none o f t h e undissolved f r a c t i o n s would d i s s o l v e regard lese of t h e amount of c o a l present . Hence, t h e f r a c t i o n of t h e c o a l and not the amount of c o a l which d i s s o l v e s in t h e s u p e r c r i t i c a l f l u i d is a s t r o n g func t ion of dens i ty and temperature of t h e s u p e r c r i t i c a l f l u i d . In o t h e r words. i f the amount of coa l i n j e c t e d i n t o the s u p e r c r i t i c a l f l u i d a t given temperatures and d e n s i t y w a s reduced t o i t s half value. t h e absolu te amount d isso lved w i l l f a l l by 50%.
I f t h e amount o f c o a l i n j e c t e d w a s increased i n d e f i n i t e l y , then a poin t might be reached where t h e s u p e r c r i t i c a l f l u i d is s a t u r a t e d wi th d isso lved coal . I f the amount of c o a l i n j e c t e d is increased beyond t h i s va lue , t h e f r a c t i o n of dissolved c o a l a n d t h e f r a c t i o n a l c o a l conversion w i l l s t a r t decreasing. The amount of dissolved c o a l in t h e s u p e r c r i t i c a l f l u i d w i l l be independent of t h e amount of c o a l i n j e c t e d in such a case.
Conclusions
When c o a l is contac ted wi th a non-donor s u p e r c r i t i c a l f l u i d a par r of the c o a l ins tan taneous ly d i s s o l v e s in t h e s u p e r c r i t i c a l f l u i d . The d isso lved coa l undergoes l i q u e f a c t i o n reac t ions which a r e thermal in nature r e s u l t i n g in toluene s o l u b l e products being formed from c o a l . These products can subsequent ly undergo re t rogress ive r e a c t i o n s y ie ld ing inso luble mater ia l . Hence t h e toluene so lubles show a maxima I n conversion wi th time.
The f r a c t i o n of coa l which d isso lves ins tan taneous ly in the s u p e r c r i t i c a l f l u i d increases wi th a n increase in the d e n s i t y and temperature of t h e s u p e r c r i t i c a l f l u i d . This e f f e c t is similar t o t h a t genera l ly observed f o r the s o l u b i l i t y of a s o l i d i n a s u p e r c r i t i c a l f l u i d . With a n increase i n d e n s i t y and temperature h igher molecular compounds present in c o a l go i n t o s o l u t i o n , r e s u l t i n g in a n undersatured s o l v e n t wi th the f r a c t i o n , no t t h e amount, of t h e c o a l which is being dissolved.
114
i
L i t e r a t u r e CLtg
1. Slomka, B. and Rutkowski, A., "A Kine t ic Study of t h e S u p e r c r i t i c a l Toluene Extract ion of Coal a t 9.8 MPa," Fuel Processing Technology, 2, 247 (1982).
Jezko, J., Gray, David and Kershaw, J.R., Fuel Processing Technology, E, 229 2. (1982).
3. Kershaw, J.R., Fuel Processing Technology, 2, 241 (1982).
4.Whitehead, J.C and Williams, D.F., "Solvent Extract ion of Coal by S u p e r c r i t i c a l Gases," J. I n s t . Fuel (London) 182 (1975).
5. Penninger, J.M.L., "Oil Ext rac t ion from Sub-bituminous Coal wi th Compressed Aqueous Gas Extractants-Stoichiometry and Mechanism of Extract ion," presented a t 1984 Annual AIChE Meeting, San Francisco, Cal i forn ia , November (1984).
6. Blessing, J .E. and Ross. D.S.. "Supercr i t ica l Solvents and t h e Disso lu t ion of Coal and Ltgni te ," ACS Symposium Series 71, Washington, D.C., (1978).
7. Bart le . K.D., C a l i m l i , A., Jones, D.W.. Hatthews, R.S. and Olcay, A., Fuel - 58, 423 (1979).
8. Tugrul, T. and Olcay, A., Fuel 17, 415 (1978).
9. Bar t le , K.D., P a r t i n , T.G. and W i l l i a m s , D.F., Fue l= , 226 (1975).
1 0 . Kershaw. J.R.. S . Afr. J. Chem., 30, 205, (1977).
11. Barton, Paul, Ind. Eng. Chem. Process Des. Dev., 2, 589 (1983).
12. Amestica, L.A. and Wolf, E.E., "Supercr i t ica l Toluene and Ethanol Ext rac t ion of a n I l l i n o i s No. 6 Coal," Fuel 62, 227 (1984).
13. Deshpande, G.V.. Holder, G.D.. Bishop, A.A., Gopal, J. and Wender, I., "Extraction of Coal Using S u p e r c r i t i c a l Water," Fuel 63, 958 (1984).
14. Tome, S.E ., "Supercr i t ica l Coal Ext rac t ion Using Aqueous-Organic Solvent Mtxtures," M.S. Disser ta t ion , Universi ty of Pi t tsburgh. December (1983).
TABLE 1
Analysis of Bruceton Bituminous Coal
ASH
Carbon Hydrogen Sulfur Nitrogen
3.93a
82 .6gb 5.56b 1 .46b 1 .7Zb
a - moisture f r e e b a s i s - moisture and a s h f r e e b a s i s
115
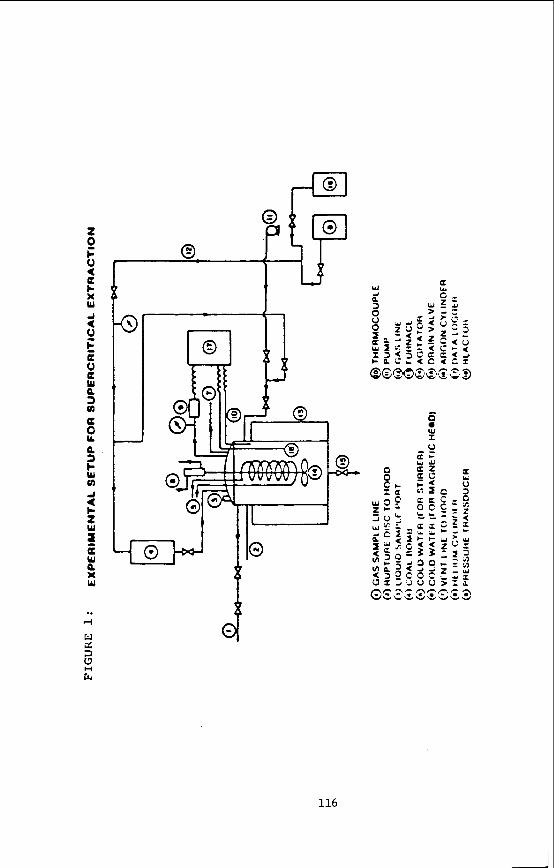
a 2
116
o w I
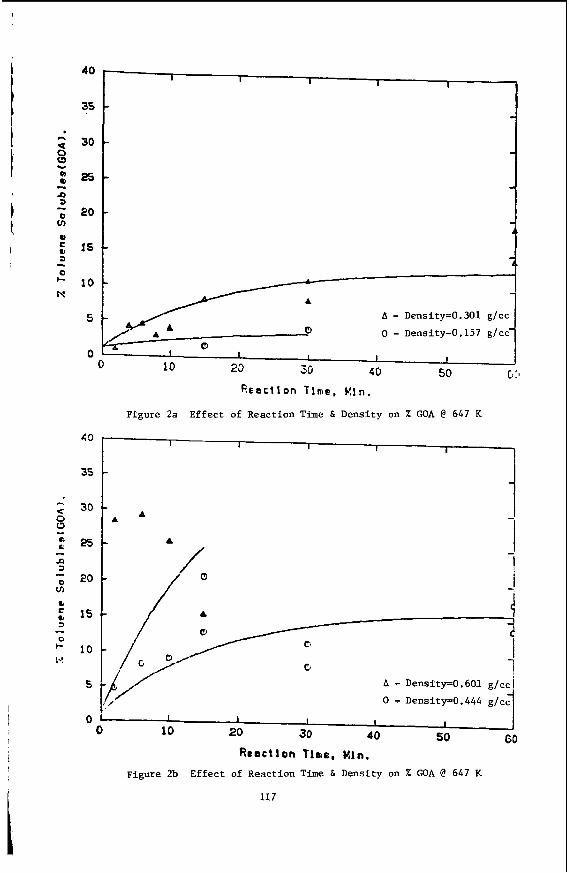
I
40
35
30
2 5 -
20
15
10
- 1 I I I I
- - - -
- -
d
A .
- - 1.
-
40
3s
30
2s
20
15
10
5
0
- h - Density=0.301 glcc
0 - Density-0.157 glcc- (3
I I 0 10 20
Reaction Time, Hin.
Fi'gure 2a Effect of Reaction Time & Density on % GOA @ 647 K
I I I I I
A A
A
c:
C
h - Densitp0.601 g/c 0 - DensitpO.444 g/c
I I I I I
40 so GO 0 10 20 30 Resctlon time, Hln,
Figure 2b Effect of Reaction Time & Density on % GOA @ 647 K
117
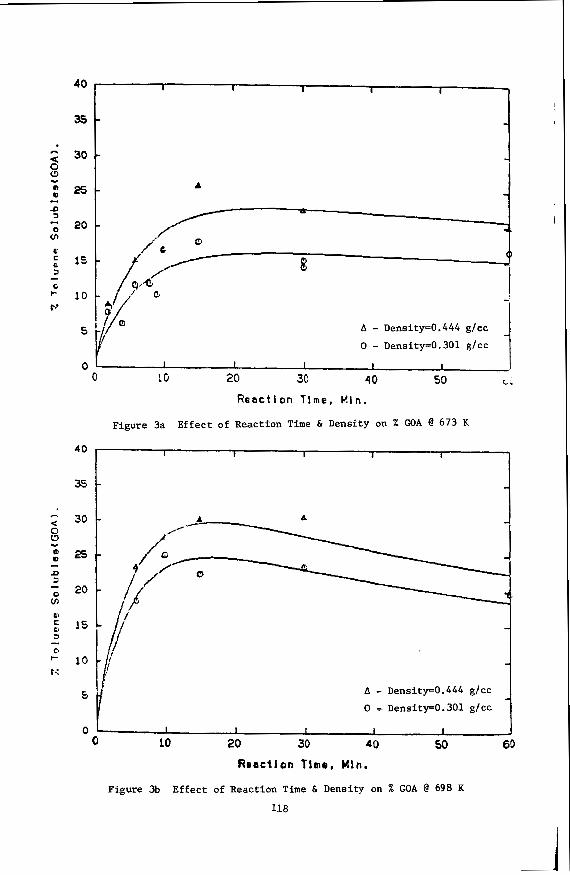
40
35
30
25
20
1s
10
5
I I I I I
-
A
I A - Density-0.444 gfcc 0 - Density=0.301 gfcc
I I I I I I 30 40 50 ci 0 LG 20
Resctlon T i m e , M i n .
Figure 3a Effect of Reaction Time 6 Density on % GOA @ 673 K
40
35
30
25
20
15
10
5
0
I I I I I
A - Density-0.444 g/cc 0 - DensityrO.301 gfcc
I I I I I
10 20 30 40 50 0 I
R e a c t i o n f l rne, Hln.
Figure 3b Effect of Reaction Time & Density on % GOA @ 698 K
118
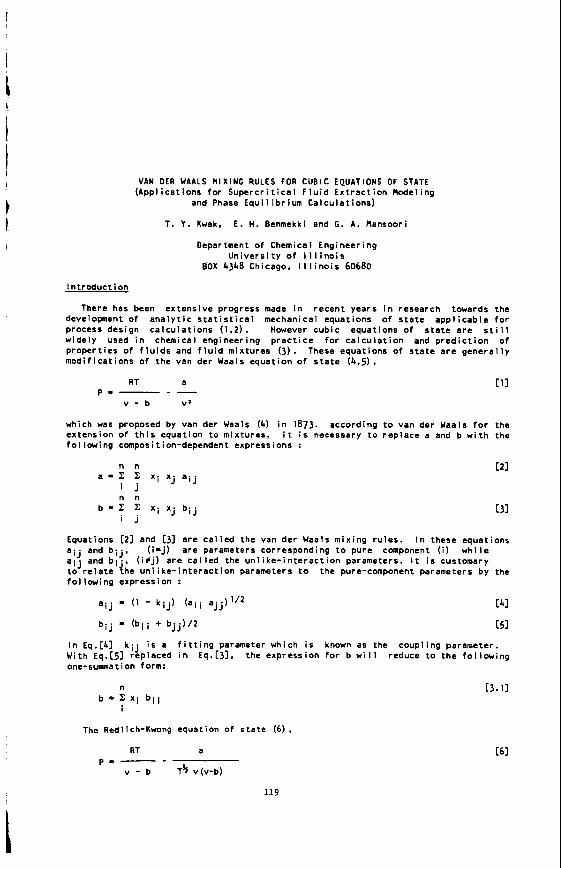
I
VAN DER WAALS NIXING RULES FOR CUBIC EQUATIONS OF STATE (Applications for Supercritical Fluid Extraction Nodeling
and Phase Equilibrium Calculations)
T. Y . Kwak. E. H. Benmekki and C. A. Ransoori
Department of Chemical Engineering University of Illinois
BOX 4348 Chicago, I 1 1 inois 60680
Introduction
There has been extensive progress made in recent years in research towards the development of analytic statistical mechanical equations of state applicable for process design calculations (l,2). However cubic equations of state are still widely useU in chemical engineering practice for calculation and prediction of properties of fluids and fluid mixtures (3). These equations of state are generally modifications of the van der Waals equation of state (4,5),
P -
which was extension following
a -
b -
Eauat ions
RT a
v - b V'
- - - c11
proposed by van der Waals (4) in 1873. according to van der Waals for the of this equation to mixtures, it is necessary to replace a and b with the composition-dependent expressions :
n n Z Z xi xj aij i j n n
i j 2 Z xi xj bij
t21
C3l
[2] and [)I are called the van der Waals mixing rules. In these equations and b.., (i-j) are parameters corresponding to pure component (i) while and b;!. (i#j) are called the unlike-interaction parameters. It is customary .elate ihe unl i ke-interaction parameters to the pure-component parameters by the
following expression :
C41
C51
In Eq.[4] kij is a fitting parameter which is known as the coupling parameter. With Eq.[5] replaced in Eq.[3], the expression for b will reduce to the following one-summation form:
n
i b 0 Z Xi bii
The Redlich-Kwong equation of state ( 6 ) .
RT a p - - -
v - b T4 v(v-b)
119
c3. I 1
and the Peng-Robinson equation of State (7),
RT a (TI PI--
v-b v (v+b) +b (v-b)
a(T)
a(Tc) = 0.45724 R' T: / Pc
K = 0.37464 + 1.54226~ - 0 . 2 6 9 9 2 ~ '
b = 0.0778 RTc/Pc
- a(Tc) ( 1 + ~ ( 1 - T$ ) I '
are widely used for thermodynamic property calculations.
The Theory of the Van Der Waals Hixinq Rules - Leland and Co-workers (8-10) have been able to re-derive the van der Waals mixing
rules with the use of statiscal mechanical theory of radial distribution functions. According to these investigators for a fluid mixture with a pair intermolecular potential energy function ,
uij (r) = c ' .f (r/uij) I J
the following mixing rules will be derived :
In these equations, cij is the interaction energy parameter between molecule i and j while u . . is the intermolecular interaction distance between the two molecules. Knowing tt%t coefficients (a) and (b) of the van der Waals equation of state are proportional to c and u according to the following expressions :
a = 1.1250 RT,V, = N, €03
b = 0.3333 vc = No v3
[I41
C151
We can see that Eq.[IZ] and Eq.1131 are identical with Eqs.[2] and [31 respectively. Statistical mechanical arguments which are used in deriving Eq.[lZ] and Eq.[13] dictate the following guidelines in using the van der Waals mixing rules
(1) The van der Waals mixing rules are for constants of an equation of state.
(2) Equation [I21 is a mixing rule for the molecular volume, and Eq.[13] is a mixing rule for (molecular volume). (molecular energy). It happens that b and a of the van der Waals equation of state are proportional to (molecular volume) and (molecular volume). (molecular energy), respectively, and as a result, these mixing rules are used in the form which was proposed by van der Waals.
(3) Knowing that u.. (for i # j), the unlike-interaction diameters, for spherical molecules I! equal to
120
Th is w i l l make the expression f o r b i j f o r spher i ca l molecules t o be
b i j = [ ( b i i l / 3 + b j j 1 / 3 ) / 2 1 3 [I71
Then f o r non-spher ical molecules express ion for b i j w i l l be
I
\ With the use of these g u i d l i n e s . we now d e r i v e the van der Waals m i x i n g r u l e s f o r
t he two representa t ive equat ions o f s ta te . S im i la r procedure can be used f o r d e r i v i n g the van der Waals m i x i n g r u l e s f o r o ther equat ions o f s t a t e .
H i x i n a Rules f o r t he Redlich-Kwong Equat ion o f S ta te
The Redlich-Kwong equat ion o f s t a t e ,Eq.[6], can be w r i t t e n in the f o l l o w i n g form:
In t h i s equat ion o f s ta te , b has the dimension o f a molar volume,
b = 0 . 2 6 ~ ~ = Noa
Then the mix ing r u l e f o r b w i l l be t h e same as the one f o r t he f i r s t van der Waals m i x i n g ru les , Eq.(3), However m i x i n g r u l e f o r a w i l l be d i f f e r e n t f rom the second van der Waals mix ing r u l e , Eq.[2]. R-p;amet;r a appearing i n the Redlich-Kwong equat ion of s ta te has dimension o f molecular energy) 312 (rnolecul a r volume), t h a t i s
( a = 1.2828RTc1*5vc = No(c/k)1*503)
As a r e s u l t the second van der Waals m i x i n g ru les , Eq.[13]. cannot be used d i r e c t l y foj; &he a parameter o f t he Redilch-Kwong equat ion o f s t a t e . However, s ince (R ab ) has the dimension o f (molecular energy). (molecular volume), t he second van der Waals m i x i n g ru les , Eq.[13]. can be w r i t t e n f o r t h i s term. F i n a l l y t h e van der Waals mix ing r u l e s f o r t h e Redlich-Kwong equat ion o f s t a t e w i l l be i n the f o l l o w i n g form:
n n
i j b Z 2 x i ~j b i j
c201
C31
These mix ing ru les , when j o i n e d w i t h the Redlich-Kwong equat ion o f s ta te , w i l l c o n s t i t u t e the Redlich-Kwong equat ion of s t a t e f o r mix tu res t h a t i s c o n s i s t e n t w i t h the s t a t i s t i c a l mechanical b a s i s o f t he van der Waals m i x i n g r u l e s .
n i x i n g Rules f o r t he Pena-Robinson Equat ion o f S ta te
In order t o separate thermodynamic v a r i a b l e s from constants o f the Peng-Robinson equat ion of sate, we w i l l i n s e r t Eq.[8] and Eq.[9] i n Eq.171 and we w i l l w r i t e i t i n the f o l l o w i n g form :
v c/RT + d - 2 J (c d/RT) z = - -
v-b (v+b) + (b/v) (v-b)
r211
121
where c = a(Tc) (1 + I) and d = acrz/RTc
T h i s form of the Peng-Robinson equat ion of s t a t e suggests t h a t t he re e x i s t t h ree independent cons tan ts which are b. C. and d. Now, f o l l o w i n g the prescr ibed gu ide l i nes f o r t h e for the van der Waals m ix ing ru les , m i x i n g r u l e s f o r b. c. and d of the Peng-Robinson equa t ion o f s t a t e w i l l be
w i t h the f o l l o w i n g i n t e r a c t i o n parameters :
C231
E241
A p p l i c a t i o n s for S u p e r c r i t i c a l Fluid E x t r a c t i o n hode l i nq
A ser ious t e s t o f m i x t u r e equations o f s t a t e i s shown t o be t h e i r a p p l i c a t i o n f o r p r e d i c t i o n o f s o l u b i l i t y o f so lu tes i n s u p e r c r i t i c a l f l u i d s ( 1 1 ) . I n the present r e p o r t , we app ly t h e van der Waals , t h e Redlich-Kwong and the Peng-Robinson equations o f s t a t e for s u p e r c r i t i c a l f l u i d e x t r a c t i o n of s o l i d s and the e f f e c t o f choosing d i f f e r e n t m ix ing r u l e s on p r e d i c t i o n of s o l u b i l i t y o f s o l i d s i n supercr i t i c a l f l u i d s . Thermodvnami c nodel
S o l u b i l i t y o f a condensed phase, y2 , i n a vapor phase a t s u p e r c r i t i c a l cond i t i ons (12) can b e d e f i n e as :
P
psat ~2 (Pqat/P) (I /+) @qat Exp{ I (vSo"d/RT)dPl C281
where i s the f u g a c i t y c o e f f i c i e n t a t pressure P. Provided we assume v,solid i s independent o f pressure and f o r small va lues o f o f Pzsat the above expression w i l l be conver ted t o the f o l l o w i n g form:
y2' (Pzsat/P1 ( l /d2) Exp { vzSo1 id (P-Pzsat) /RTl 1291
In order t o c a l c u l a t e s o l u b i l i t y from Eq.[29] we need t o choose an expression f o r the f u g a c i t y c o e f f i c i e n t . General ly f o r c a l c u l a t i o n of f u g a c i t y c o e f f i c i e n t an equat ion of s t a t e w i t h appropr ia te mix ing r u l e s i s used (12) i n the f o l l o w i n g expression :
[Sol OD
RT I n @i= [ (aP/ani)T,V,n - (RT/V)] dV - RTlnZ V j
S o l u b i l i t y C a l c u l a t i o n s
I n Figure 1 s o l u b i l i t y o f 2.3 dimethyl naphtalene (DHN) i n s u p e r c r i t i c a l carbon d i o x i d e i s repo r ted versus pressure a t 308 k e l v i n a long w i t h p red ic t i ons us ing the
122
I
t
van der Waals equat ion o f s t a t e . According t o t h i s f i g u r e p r e d i c t i o n s by the van der Waals equat ion o f s ta te w i l l improve when Eq.[3], a long w i t h combining r u l e i n Eq.[17], i s used as the m i x i n g r u l e f o r b instead o f Eq.[3.1] which i s cus tomar i l y used. This comparaison and o t h e r s i m i l a r comparaisons which a r e r e p o r t e d elsewhere ( 1 1 ) f o r other so lu te -so lvent systems e s t a b l i s h the s u p e r i o r i t y of double-summation
mix ing ru les , Eq.[3], f o r b over s i n g l e summatiom expression, Eq.[3.1].
I n F igure 2 the same exper imental s o l u b i l i t y da ta as i n F i g u r e 1 are compared w i t h p r e d i c t i o n s using the Redlich-Kwong equat ion o f s ta te . According t o t h i s f i g u r e the corected van der Waals m i x i n g r u l e s f o r the Redlich-Kwong equat ion o f s ta te , Eqs.[3] and Eq.[20], a re c l e a r l y super io r t o the m i x i n g r u l e s t h a t a r e cus tomar i l y used,Eq.[2] and Eq.[).I], f o r t h i s equat ion o f s ta te . S im i la r observa t ions a re made fo r p r e d i c t i o n of s o l u b i l i t i e s o f o ther s o l i d s i n s u p e r c r i t i c a l f l u i d s which w i l l no t be reported here.
The Peng-Robinson equat ion o f s t a t e w i t h i t s customary m i x i n g ru les , Eqs.[2] and c3.11, i s w ide ly used f o r p r e d i c t i o n o f s o l u b i l i t y o f heavy s o l u t e s i n s u p e r c r i t i c a l gases and f o r petroleum r e s e r v o i r f l u i d phase e q u i l i b r i u m c a l c u l a t i o n s (13-15). I n F igure 3 the same exper imental s o l u b i l i t y da ta as in Figures 1 and 2 are compared w i t h p r e d i c t i o n s us ing the Peng-Robinson equat ion o f s t a t e w i t h i t s o r i g i n a l m i x i n g r u l e s w i t h the cor rec ted m i x i n g ru les . According t o F igure 3 c o r r e c t e d van der Waals m i x i n g r u l e s o f the Peng-Robinson equat ion o f s t a t e apparent ly do no t improve s o l u b i l i t y p red ic t i ons over t h e o r i g i n a l m ix ing ru les . However, v a r i a t i o n o f s o l u b i l i t y versus pressure f o r the new m i x i n g r u l e s i s more c o n s i s t e n t w i t h the experimental data than the o l d mix ing ru les . A l s o cons ider ing the f a c t t h a t new mix ing ru les fo r the Peng-Robinson equat ion o f s t a t e c o n t a i n th ree adustable parameters (k. . , l i j and m i j ) w h i l e the o l d mix ing r u l e s c o n t a i n on l y one ad jus tab le paibmeter (k i .), i t makes the new mix ing r u l e s more a t t r a c t i v e . To demonstrate the s u p e r i o r i i y o f the new mix ing r u l e s f o r the Peng-Robinson equat ion o f s t a t e we have repor ted here F igures 4 t o 9. According t o these f i g u r e s when the u n l i k e - i n t e r a c t i o n adustable parameters o f the mix ing r u l e s a r e f i t t e d t o the experimental data, the Peng-Robinson equat ion o f s t a t e w i t h the cor rec ted van der Waals mix ing r u l e s can p r e d i c t s o l u b i l i t y o f heavy s o l i d s i n s u p e r c r i t i c a l f l u i d more accura te ly than w i t h t h e o r i g i n a l m i x i n g r u l e s over d i f f e r e n t ranges of temperature and pressure and f o r d i f f e r e n t so lu tes and s u p e r c r i t i c a l soi-ents.
ApDl ica t ions for C o r r e l a t i o n s of Vapor-Liquid E q u i l i b r i a
When app l ied t o both vapor and l i q u i d phases , cubic equat ions o f s t a t e can be used t o generate thermodynamically cons is ten t data, p a r t i c u l a r l y e q u i l i b r i u m data. Good co r re la t i ons o f vapor - l i q u i d e q u i l i b r i a depend on the equat ion of s t a t e used and, f o r multicomponent systems, on the mix ing ru les .
Thermodynamic
I n the e q u i l i b r i u m s t a t e , t h e i n tens i ve p r o p e r t i e s - temperature, pressure and chemical p o t e n t i a l s of each component - are constant i n the o v e r a l l system.Since the f u g a c i t i e s a re func t i on o f temperature,pressure and composi t ions , t he e q u i l i b r i u m condi t ion
can be expressed by
The expression fo r the f u g a c i t y c o e f f i c i e n t 4i depends on the equat ion of s ta te t h a t i s used and i s the same f o r the vapor and l i q u i d phases
123
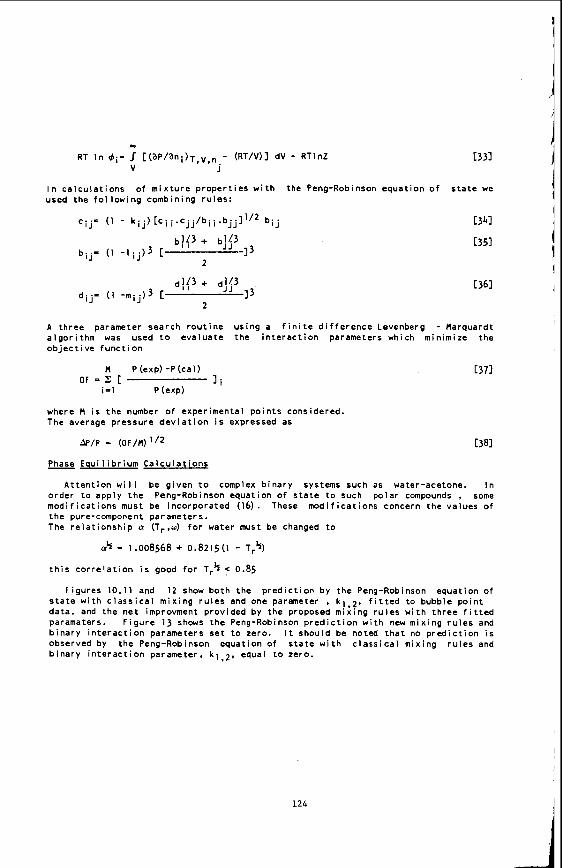
In calculations of mixture properties with the Peng-Robinson equation of state we used the following combining rules:
C341
C351
C361
A three parameter search routine using a finite difference Levenberg - Harquardt algorithm was used to evaluate the interaction parameters which minimize the objective f unct i o n
H P (exp) -P (cal) C371
i=l P (exp) O F = Z C l i
where H is the number of experimental points considered. The average pressure deviation is expressed as
AF'/P - (OF/H) E381
Phase Equilibrium Calculations
Attention will be given to complex binary systems such as water-acetone. In order to apply the Peng-Robinson equation of state to such polar compounds , some modifications must be incorporated (16) . These modifications concern the values of the pure-component parameters. The relationship (2 (Tr,w) for water must be changed to
CY% = 1.008568 + 0.8215(1 - Tr%) this correlation is good for Tr* < 0.85
Figures 10,ll and 1 2 show both the prediction by the Peng-Robinson equation of state with classical mixing rules and one parameter , k ! , ? . fitted to bubble point data, and the net improvment provided by the proposed mixlng rules with three fitted paramaters. Figure 13 shows the Peng-Robinson prediction with new mixing rules and binary interaction parameters set to zero. It should be noted that no prediction is observed by the Peng-Robinson equation of state with classical mixing rules and binary interaction parameter, k l . 2 , equal to zero.
124
I
i
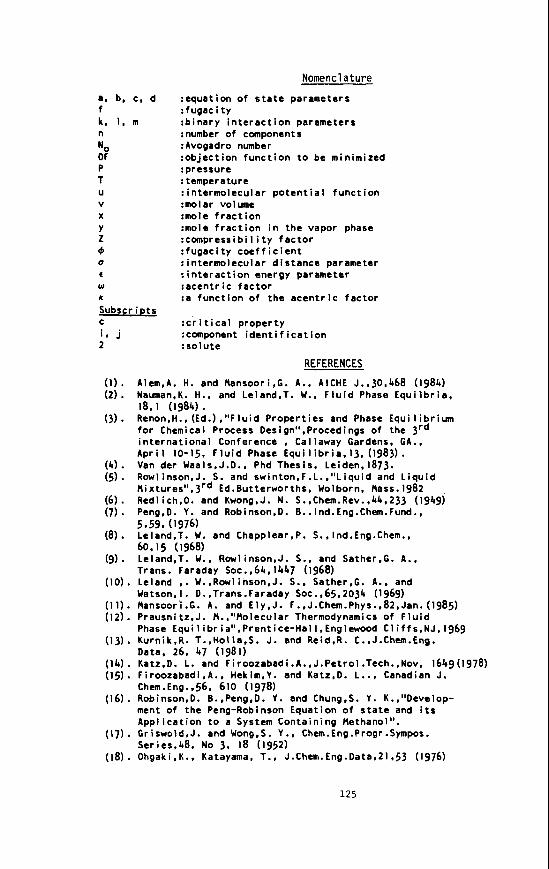
Nomenclature a. b, c, d f k. I, m n
OF P T
NO
U V X Y 2 d 0
c W
K
SUbscriDts C
:equation of state parameters :fugacity :binary interaction parameters :number of components :Avogadro number :objection function to be minimized :pressure :temperature :intermolecular potential function :molar volume :mole fraction :mole fraction in the vapor phase :compressibility factor :fugacity coefficient :intermolecular distance parameter :interaction energy parameter :acentric factor :a function of the acentric factor
:critical property :component identification :sol Ute
REFERENCES
A1m.A. H. and Hansoori,C. A., AICHE J.,30.468 (1984) Nauman.K. H.. and Le1and.T. W . , Fluid Phase Equilbria.
Ren0n.H.. (Ed.) ."Fluid Properties and Phase Equilibrium for Chemical Process Design".Procedings of the 3rd international Conference , Callaway Gardens, GA., April 10-15, Fluid Phase Equilibria,l3.(1983). Van der Waa1s.J.D.. Phd Thesis, Leiden.1873. Row1inson.J. 5 . and swinton.F.L.."Liquid and Liquid hixture~'l.3~~ Ed.Butterworths, Wolborn. Hass.1982 ,
Redlich.0. and Kw0ng.J. N. S..Chem.Rev..44.233 (1949) Peng,D. Y . and R0binson.D. B..Ind.Eng.Chem.Fund.,
Le1and.T. W. and Chapp1ear.P. S..lnd.Eng.Chem., 60.15 (19681
18.1 (1984).
5.59. (1976)
. - . _ . Le1and.T. W . , Rowlinson,J. S.. and Sather,G. A.. Trans. Faraday S O C . , ~ ~ . 1447 (1968)
(10). Leland ,. W.,Rowlinson,J. S.. Sather.C. A.. and Watson, I . D..Trans.Faraday Soc.,65,2034 (1969)
(11). 8ansoor'i.C. A. and E1y.J. F..J.Chun.Phys..82,Jan.(1985) (12). Prausnitz.J. H.,"8olecular Thermodynamics of Fluid
(13). Kurnik.R. T.,Holla,S. J. and Reid.R. C..J.Chem.Eng.
(14). Katz.0. L. and Firoozabadi,A.,J.Petrol .Tech.,Nov, 1649(1978) (15). Firo0zabadi.A.. Hekim.Y. and Katz,D. L . . , Canadian J.
(16). Robins0n.D. B..Peng,D. Y . and Chung.S. Y. K.,"Develop-
Phase €qui 1 i br i a".Prent ice-Hal 1 , Englewood Cl iff s.NJ. 1969
Data, 26. 47 (1981)
Chem.Eng.,56. 610 (1978)
ment of the Peng-Robinson Equation of state and its Application to a System Containing Hethanol".
(17). Criswold,J. and W0ng.S. Y . . Chem.Eng.Progr.Sympos. Series.48. No 3, 18 (1952)
( 1 8 ) . 0hgaki.K.. Katayama, T., J.Chem.Eng.Data.21.53 (1976)
125
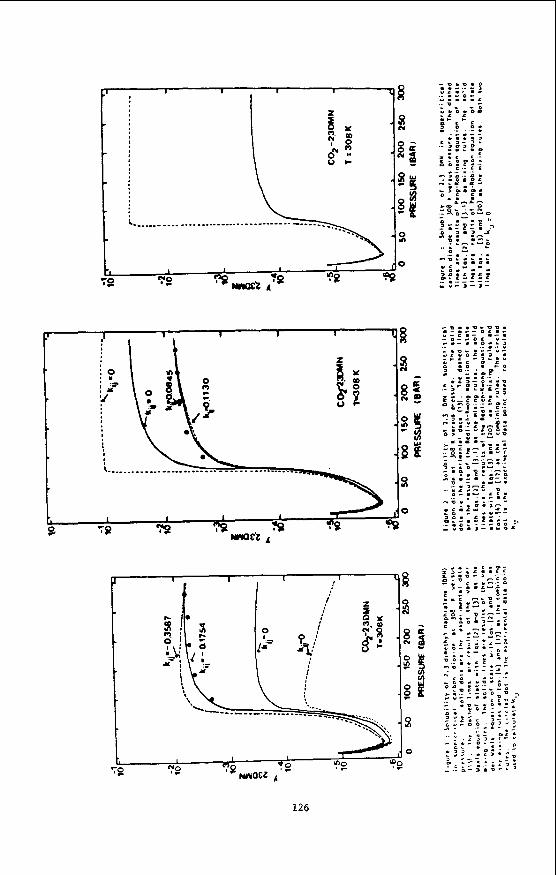
P i I I I 1
I
126
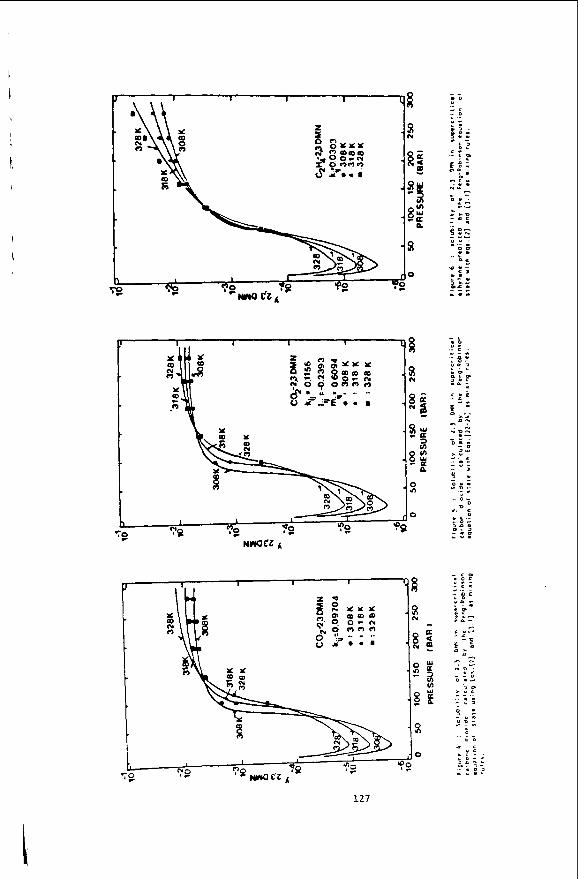
n I I I 1
127
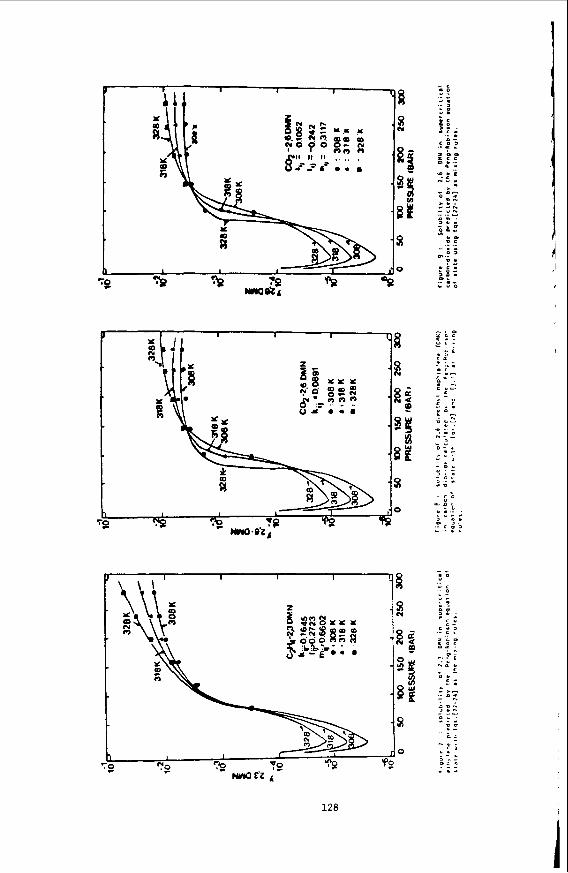
- ' 0
O L .
r L
' $ 5 - . _ * i, c a * . .. - Y . . C -.I- L L -
c .- P .4 - - - Y
I C - .. ;a'= D u- a . * .. . ..D n - -
0 - & .- - 1 - o * > . * - 0 - 0 - * .D
- " - I -
I-
128
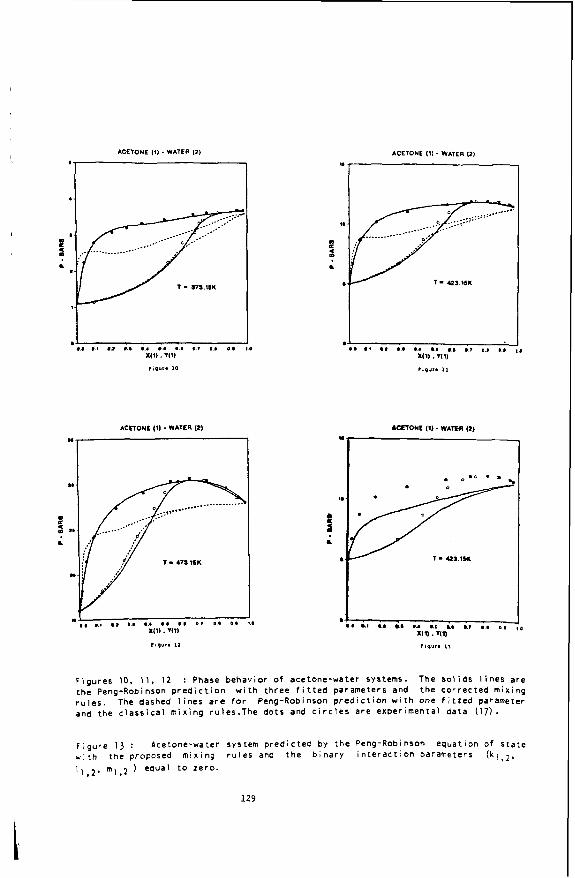
ACETONE (1). WATER (21
'7
ACETONE (11 - WATER (21
I , I , I* 0 . ,. . I o * 0 1 a * 0 1 ' 0 XI11 . V I 0
ACETONE (1) . WATER (11
'* 7
ll
1
L
I
a
f i g u r e s 10. 11, 1 2 : Phase behav io r of acetone-water Systems. The s o l i d s l i n e s are the Peng-Robinson p r e d i c t i o n t h e cor rec ted mix ing r u l e s . The dashed l i n e s a r e for Peng-Robinson p r e d i c t i o n w i t h one f i t f e d parameter and the c l a s s i c a l m i x i n g ru1es.The do ts and circles are exper imental da ta ( 1 7 ) .
w i t h th ree f i t t e d parameters and
figure 13 : * ' t h t h e proposed m i x i n g rules and the b i n a r y i n t e r a c t i o n parameters ( k , , * ,
I , , ~ , m,,2 1 equal to zero.
Acetone-water system p r e d i c t e d by t h e Peng-Robinson equat ion o f s t a t e
129
EXTRACTION OF A NORTH DAKOTA LIGNITE W I T H SUPERCRITICAL ALIPHATIC SOLVENTS
M.L. Swanson, J. Doll imore, E.S. Olson, and J.W. Oiehl
U n i v e r s i t y o f Nor th Dakota Energy Research Center Box 8213, U n i v e r s i t y S t a t i o n
Grand Forks, Nor th Dakota 58202
I n t r o d u c t i o n
E x t r a c t i o n o f coa l with var ious so lvents has been a commonly used method f o r o b t a i n i n g knowledge about t h e s t r u c t u r e o f coal and i t s chemical composition. Solvent e x t r a c t i o n o f coal has been c l a s s i f i e d i n t o f o u r d i f f e r e n t types by Oele and others ( l ) , and Oryden (2.3). A recent rev iew o f so lvent e x t r a c t i o n was prepared by Pul len
1. Nonspecif ic e x t r a c t i o n - nonspeci f ic so lvents e x t r a c t on l y a small percentage o f t h e coal. These so lvents tend t o p r i m a r i l y d i sso l ve t h e waxy and resinous canpounds which res ide i n t h e coa l ' s phys ica l s t r u c t u r e i n t h e form o f res in bodies and p a r t i c l e s .
2. Spec i f i c e x t r a c t i o n - s p e c i f i c so lvents e x t r a c t a l a r g e r p o r t i o n o f the coal (up t o 40%) w i t h t h e ext racted ma te r ia l c l o s e l y resembling t h e i nso lub le coal residue. The e f fec t i veness o f these so lvents has been a t t r i b u t e d t o the ex is tence o f an unshared p a i r o f e lec t rons on n i t rogen or oxygen i n the so lvent molecule thereby making t h e so lvent behave as a p o l a r f l u i d @,A).
3. Ex t rac t i ve d i s i n t e g r a t i o n o r degradat ion - t h i s t ype o f e x t r a c t i o n occurs a t temperatures between 200' and 400'C where t h e percent e x t r a c t i o n i s dependent on t h e p roduc t i on o f smaller so lub le f r a c t i o n s by t h e thermal decomposition of t h e coal. Solvents under these cond i t i ons can d i sso l ve up t o 240% o f t he coal a t temperatures o f 400'C.
4. Ex t rac t i ve chemical d i s i n t e g r a t i o n - these ex t rac t i ons d i sso l ve t h e coal by the rma l l y decomposing and chemical ly r e a c t i n g with t h e coal t o form smaller molecular fragments (l). Most o f t h i s work invo lves us ing hydrogen-donor so lvents (i.e., so lvents t h a t can e i t h e r donate hydrogen t o t h e various reac t i ve coal species o r a t l e a s t ac t as a hydrogen t r a n s f e r agent) t o manufacture 1 i q u i d products fran t h e coal.
I n t e r e s t i n t h e e x t r a c t i o n o f coal (and o the r subst rates) w i t h s u p e r c r i t i c a l so lvents has been inc reas ing r a p i d l y over t h e past f i f t e e n years. This i n t e r e s t i s P r i m a r i l y due t o t h e enhanced s o l u b i l i t y o f subst rates i n t h e f l u i d phase t h a t occurs a t o r above t h e c r i t i c a l po int . Also, t h e so lvent power o f t he so lvent (which depends on the solvent dens i t y ) can be convenient ly c o n t r o l l e d over a l a rge range w i t h small changes i n t h e so lvent pressure o r temperature (5,6). Most o f t h e coal ex t rac t i ons us ing s u p e r c r i t i c a l f l u i d s have been performed a t temperatures above 350'C. Squires and o the rs ( 7) repo r ted t h a t thermal decomposition processes were becoming s i g n i f i c a n t above 325'C T o r t h e e x t r a c t i o n o f an I l l i n o i s No. 6 coa l w i t h s u p e r c r i t i c a l methanol. This suggests t h a t r e s u l t s fran s u p e r c r i t i c a l f l u i d ex t rac t i ons above t h i s temperature a re a canbinat ion o f phys ica l and chemical so lvent-coal i n te rac t i ons .
@I .
130
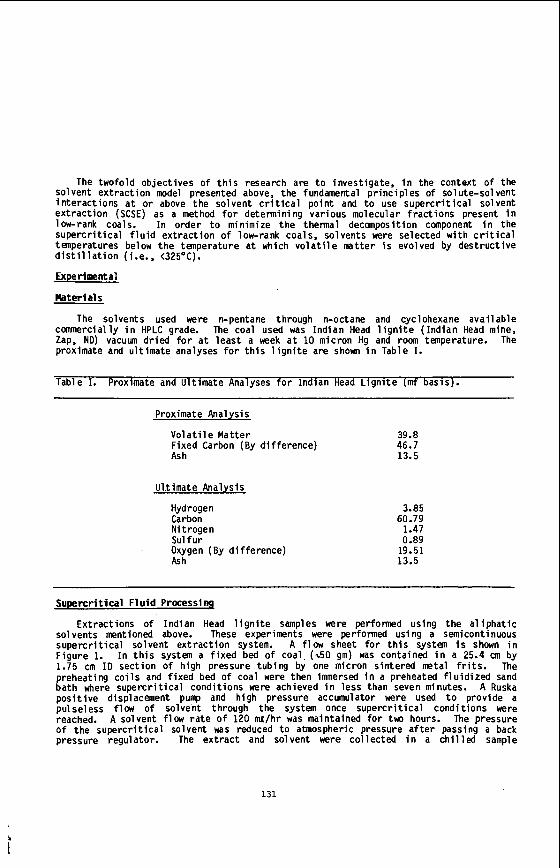
The two fo ld ob jec t i ves o f t h i s research are t o invest igate, i n the context o f t he Solvent e x t r a c t i o n model presented above, t he fundamental p r i n c i p l e s o f so l Ute-sol vent i n t e r a c t i o n s a t o r above t h e so lvent c r i t i c a l p o i n t and t o use s u p e r c r i t i c a l so lvent e x t r a c t i o n (SCSE) as a method f o r determining var ious molecular f r a c t i o n s present i n low-rank coals. I n order t o minimize t h e thermal decomposition canponent i n t h e s u p e r c r i t i c a l f l u i d e x t r a c t i o n o f low-rank coals, so lvents were se lected wi th c r i t i c a l tenperatures below t h e tenperature a t which v o l a t i l e ma t te r i s evolved by des t ruc t i ve d i s t i l l a t i o n (i.e., <325OC).
Experimental
l h t e r i a1 s
The so lvents used were n-pentane through n-octane and cyclohexane a v a i l a b l e commercially i n HPLC grade. The coal used was I n d i a n Head l i g n i t e ( I n d i a n Head mine, Zap, ND) vacuum d r i e d f o r a t l e a s t a week a t 10 micron Hg and roan temperature. The proximate and u l t i m a t e analyses f o r t h i s l i g n i t e are shown i n Table I.
Table I . Proximate and U l t ima te Analyses f o r I nd ian Head L i g n i t e (mf basis).
Proximate Analysis
V o l a t i l e Ma t te r 39.8 F ixed Carbon (By d i f f e rence ) 46.7 Ash 13.5
U l t ima te Analysis
Hydrogen Carbon N i t rogen Sul f u r Oxygen (By d i f f e rence ) Ash
3.85 60.79
1.47 0.89
19.51 13.5
S u p e r r r i t i c a l F l u i d Processing
Ex t rac t i ons o f I nd ian Head l i g n i t e samples were performed us ing t h e a l i p h a t i c sol vents mentioned above. These experiments were performed us ing a semicontinuous s u p e r c r i t i c a l so lvent e x t r a c t i o n system. A f l o w sheet f o r t h i s system i s shown i n F igu re 1. I n t h i s system a f i x e d bed o f coal ( 4 0 gm) was contained i n a 25.4 u n by 1.75 cm I D sec t i on o f h igh pressure tub ing by one micron s in te red metal f r i t s . The preheating c o i l s and f i x e d bed o f coal were then immersed i n a preheated f l u i d i z e d sand b a t h where s u p e r c r i t i c a l cond i t i ons were achieved i n l e s s than seven minutes. A Ruska p o s i t i v e displacement pump and h igh pressure accumulator were used t o prov ide a pu lse less flow o f so lvent through t h e system once s u p e r c r i t i c a l cond i t i ons were reached. The pressure of t h e s u p e r c r i t i c a l so lvent was reduced t o atmospheric pressure a f t e r passing a back pressure regulator . The e x t r a c t and so lvent were c o l l e c t e d i n a c h i l l e d sample
A solvent f l ow r a t e o f 120 m l h r was maintained f o r t w hours.
131
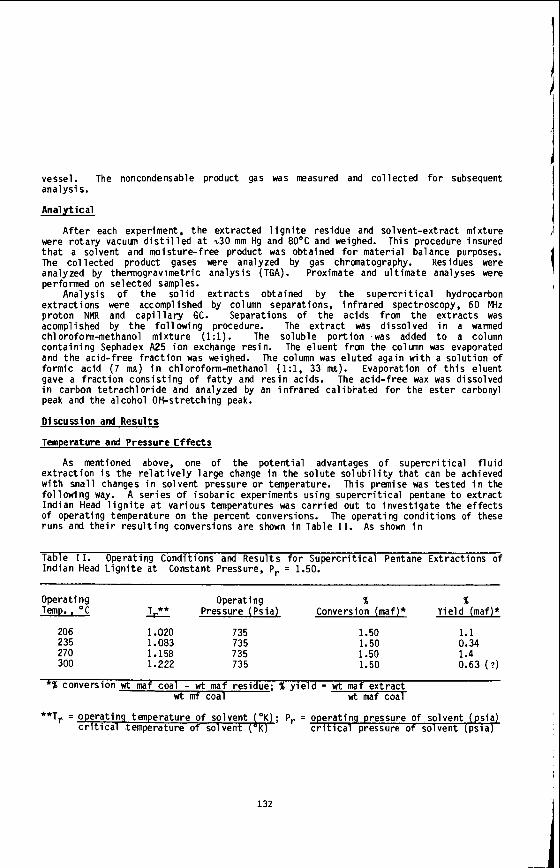
vessel. The noncondensable product gas was measured and c o l l e c t e d f o r subsequent analys is .
A n a l y t i c a l
A f t e r each experiment, t h e ex t rac ted l i g n i t e res idue and so l ven t -ex t rac t mix ture were r o t a r y vacuum d i s t i l l e d a t 9 0 mm Hg and 80°C and weighed. This procedure insured t h a t a solvent and mois ture- f ree product was obtained f o r mater ia l balance purposes. The c o l l e c t e d product gases were analyzed by gas chromatography. Residues were analyzed by thermogravimetric ana lys i s (TGA). Proximate and u l t i m a t e analyses were performed on se lected samples.
Analys is o f t h e s o l i d e x t r a c t s obtained by t h e s u p e r c r i t i c a l hydrocarbon ex t rac t i ons were accomplished by column separations, i n f r a r e d spectroscopy, 60 MHz p ro ton NMR and c a p i l l a r y GC. Separations o f t h e ac ids from t h e e x t r a c t s was acomplished by t h e f o l l o w i n g procedure. The e x t r a c t was d isso lved i n a warmed chloroform-methanol m i x t u r e (1:l). The so lub le p o r t i o n was added t o a column con ta in ing Sephadex A25 i o n exchange res in . The e luent fran t h e column was evaporated and t h e ac id- f ree f r a c t i o n was weighed. The column was e lu ted again wi th a s o l u t i o n o f formic ac id (7 ma) i n chloroform-methanol (l:l, 33 ma). Evaporation o f t h i s eluent gave a f r a c t i o n c o n s i s t i n g o f f a t t y and r e s i n acids. The ac id - f ree wax was dissolved i n carbon t e t r a c h l o r i d e and analyzed by an i n f r a r e d c a l i b r a t e d f o r t h e es te r carbonyl peak and the a lcohol OH-stretching peak.
Discussion and Resu l t s
Tenperature and Pressure E f f e c t s
As mentioned above, one o f t h e p o t e n t i a l advantages o f s u p e r c r i t i c a l f l u i d e x t r a c t i o n i s t h e r e l a t i v e l y l a r g e change i n the so lu te s o l u b i l i t y t h a t can be achieved w i t h small changes i n so lvent pressure o r temperature. This premise was tested i n the fo l l ow ing way. A se r ies o f i s o b a r i c experiments us ing s u p e r c r i t i c a l pentane t o ex t rac t I nd ian Head l i g n i t e a t var ious temperatures was c a r r i e d ou t t o i n v e s t i g a t e t h e e f f e c t s of operat ing temperature on t h e percent conversions. The operat ing cond i t i ons o f these runs and t h e i r r e s u l t i n g conversions a re shown i n Table 11. As shown i n
Table I I. Operating Condi t ions and Resul ts f o r S u p e r c r i t i c a l Pentane Ex t rac t i ons o f I nd ian Head L i g n i t e a t Constant Pressure, Pr = 1.50.
Operating Operating % % Temp., O C Pressure (Psia) Conversion (maf)* Y i e l d (maf)*
206 235 270 300
1.020 1.083 1.158 1.222 735
735 735 135
1.50 1.50 1.50 1.50
1.1 0.34 1.4 0.63 ( ? )
*% conversion wt maf coal - wt maf residue; % y i e l d = wt maf e x t r a c t wt m f coal w t maf coal
**Tr = ope ra t i ng temperature o f so lvent ( O K L ; Pr = operat ing pressure o f so lvent (ps ia ) C r i t i c a l temperature o f sol vent ( O K ) c r i t i c a l pressure o f so lvent (ps ia )
132
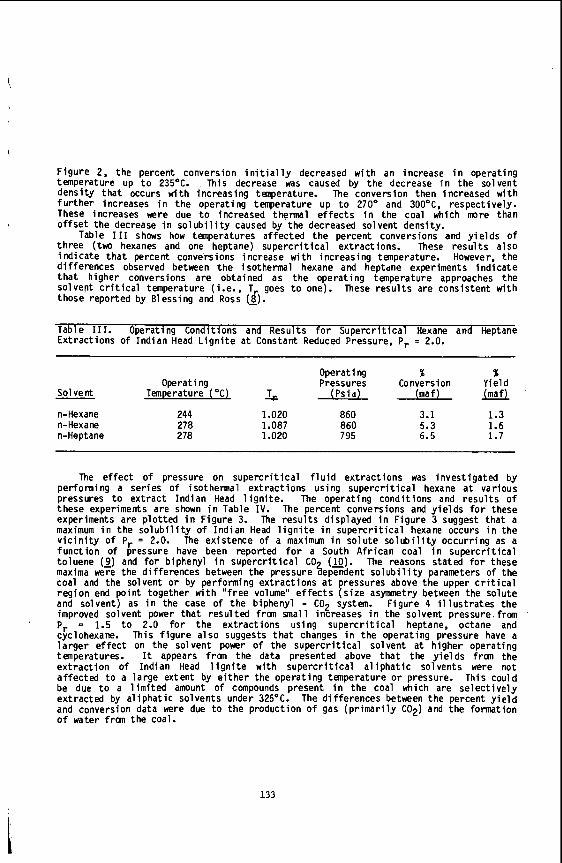
I
F igu re 2, t h e percent conversion i n i t i a l l y decreased w i t h an increase i n operat ing temperature up t o 235°C. This decrease was caused by t h e decrease i n t h e so lvent dens i t y t h a t occurs w i t h increas ing temperature. The conversion then increased w i t h fu r the r increases i n t h e operat ing temperature up t o 270" and 3OO0C, respec t i ve l y . These increases were due t o increased thermal e f f e c t s i n t h e coal which more than offset t h e decrease i n s o l u b i l i t y caused by t h e decreased solvent densi ty .
Table I 1 1 shows how temperatures a f fec ted t h e percent conversions and y i e l d s of t h r e e (two hexanes and one heptane) s u p e r c r i t i c a l ext ract ions. These r e s u l t s a l so i n d i c a t e t h a t percent conversions increase w i t h increas ing temperature. However, t h e dif ferences observed between t h e isothermal hexane and heptane experiments i n d i c a t e t h a t h igher conversions a re obtained as t h e operat ing temperature approaches t h e solve(lt c r i t i c a l temperature (i.e., T goes t o one). These r e s u l t s are consis tent w i t h those repor ted by Bless ing and Ross d). Table 111. Operating Condit ions and Resul ts f o r S u p e r c r i t i c a l Hexane and Heptane Ext ract ions o f I nd ian Head L i g n i t e a t Constant Reduced Pressure, Pr = 2.0.
Operating I x Operating Pressures Conversion Yie ld
(Ps ia) (maf) M ' Temperature ("C) L Sol vent
n-Hexane n- Hexane n-Heptane
244 278 278
1.020 860 3.1 1.3 1.087 860 5.3 1.6 1.020 795 6.5 1.7
The e f f e c t o f pressure on s u p e r c r i t i c a l f l u i d e x t r a c t i o n s was inves t i ga ted by performing a ser ies o f isothermal ex t rac t i ons us ing s u p e r c r i t i c a l hexane a t var ious pressures t o e x t r a c t I nd ian Head l i g n i t e . The operat ing cond i t i ons and r e s u l t s o f these experiments are shown i n Table I V . The percent conversions and y i e l d s f o r these experiments are p l o t t e d i n F igure 3. The r e s u l t s d isp layed i n F igure 3 suggest t h a t a maximum i n t h e s o l u b i l i t y o f I nd ian Head l i g n i t e i n s u p e r c r i t i c a l hexane occurs i n t h e v i c i n i t y o f Pr = 2.0. The ex is tence o f a maximum i n s o l u t e s o l u b i l i t y occu r r i ng as a f u n c t i o n o f pressure have been reported f o r a South A f r i c a n coal i n s u p e r c r i t i c a l to luene ( 9 ) and f o r biphenyl i n s u p e r c r i t i c a l CO (10). The reasons s tated f o r these maxima weye t h e d i f f e rences between the pressure 2dependent s o l u b i l i t y parameters o f t h e coal and t h e solvent o r by performing ex t rac t i ons a t pressures above t h e upper c r i t i c a l r e g i o n end po in t together w i t h " f r e e volume" e f f e c t s ( s i z e asymmetry between t h e so lu te and so lvent) as i n the case o f t h e biphenyl - C02 system. F igure 4 i l l u s t r a t e s t h e improved solvent power t h a t resu l ted fran small increases i n the so lvent pressure.from Pr = 1.5 t o 2.0 f o r t h e ex t rac t i ons us ing s u p e r c r i t i c a l heptane, octane and cyclohexane. This f i g u r e a l so suggests t h a t changes i n t h e operat ing pressure have a l a r g e r e f f e c t on t h e so lvent power o f t h e s u p e r c r i t i c a l so lvent a t h igher operat ing temperatures. It appears fran t h e data presented above t h a t t h e y i e l d s from the e x t r a c t i o n o f Ind ian Head 1 i g n i t e w i t h s u p e r c r i t i c a l a1 i p h a t i c so lvents were not affected t o a l a rge extent by e i t h e r the operat ing temperature o r pressure. This could be due t o a l i m i t e d amount o f compounds present i n t h e coal which a re s e l e c t i v e l y ex t rac ted by a l i p h a t i c so lvents under 325OC. The d i f f e rences between t h e percent y i e l d and conversion data were due t o t h e product ion o f gas ( p r i m a r i l y C02) and t h e format ion o f water from t h e coal.
133
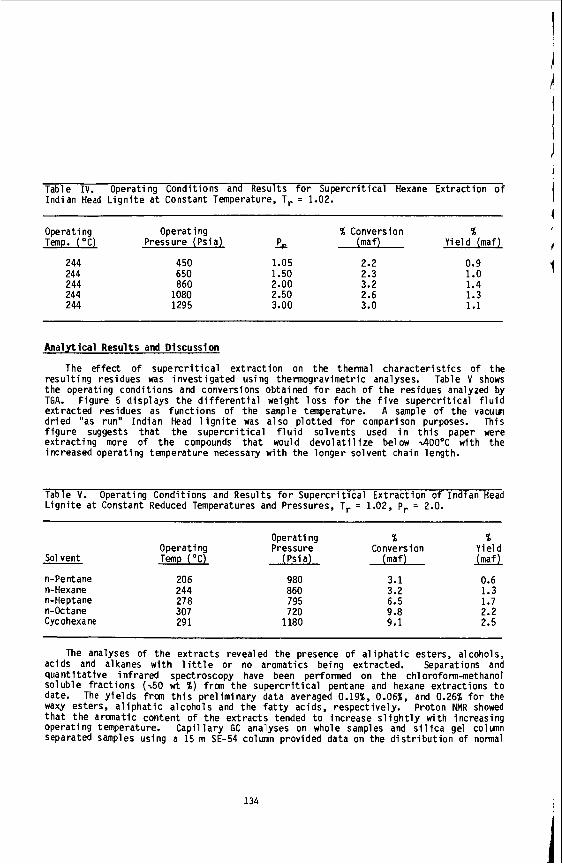
Table I V . Operating Condi t ions and Results f o r S u p e r c r i t i c a l Hexane Ex t rac t i on o f I nd ian Head L i g n i t e a t Constant Temperature, Tr = 1.02.
Ope r a t i ng Operating 96 Conversion % Temp. ( " C l Pressure (Ps ia) L (maf) Y ie ld ( m a f l
244 244 244 244 244
450 650 860 1080 1295
1.05 2.2 0.9 1.50 2.3 1 .o 2.00 3.2 1.4 2.50 2.6 1.3 3.00 3.0 1.1
A n a l y t i c a l Resu l t s and Discuss ion
The e f f e c t o f s u p e r c r i t i c a l e x t r a c t i o n on t h e thermal c h a r a c t e r i s t i c s o f t he r e s u l t i n g res idues was inves t i ga ted us ing thermogravimetric analyses. Table V shows t h e operating cond i t i ons and conversions obtained f o r each o f t h e res idues analyzed by TGA. Figure 5 d isp lays t h e d i f f e r e n t i a l weight l o s s f o r t h e f i v e s u p e r c r i t i c a l f l u i d e x t r a c t p res idues as func t i ons o f t h e sample temperature. A sample o f t h e vacuun d r i e d as run" Ind ian Head l i g n i t e was a l s o p l o t t e d f o r comparison purposes. This f i g u r e suggests t h a t t h e s u p e r c r i t i c a l f l u i d so lvents used i n t h i s paper were e x t r a c t i n g more o f t h e compounds t h a t would d e v o l a t i l i z e below 4 O O ' C w i th the increased operat ing tenperature necessary w i t h the longer so lvent chain length.
Table V. L i g n i t e a t Constant Reduced Temperatures and Pressures, Tr = 1.02, Pr = 2.0.
Operating Condi t ions and Resul ts f o r S u p e r c r i t i c a l E x t r a c t i o n o f I nd ian Head
Operating % % Operating Pressure Conversion Y ie ld
Sol vent Temp ( "C) (Psia) (maf) (maf)
n-Pentane 206 980 3.1 0.6 n-Hexane 244 860 3.2 1.3 n-Heptane 27 8 795 6.5 1.7 n-Octane 307 720 9.8 2.2 Cyc ohexa ne 29 1 1180 9.1 2.5
The analyses o f t h e e x t r a c t s revealed t h e presence o f a l i p h a t i c esters, alcohols, ac ids and alkanes with l i t t l e o r no aromatics being extracted. Separations and q u a n t i t a t i v e i n f r a r e d spectroscopy have been performed on t h e ch l orofom-methanol so lub le f rac t i ons (%50 w t %) from t h e s u p e r c r i t i c a l pentane and hexane ext ract ions t o date. The y i e l d s f ra t h i s p re l im ina ry data averaged 0.191, 0.061, and 0.26% f o r the waxy esters, a l i p h a t i c a lcohols and t h e f a t t y acids, respect ive ly . Proton NMR showed t h a t t h e aromatic content o f t h e e x t r a c t s tended t o increase s l i g h t l y w i th increasing operat ing temperature. C a p i l l a r y GC analyses on whole samples and s i l i c a gel column separated samples using a 15 m SE-54 column provided data on t h e d i s t r i b u t i o n of normal
134
1
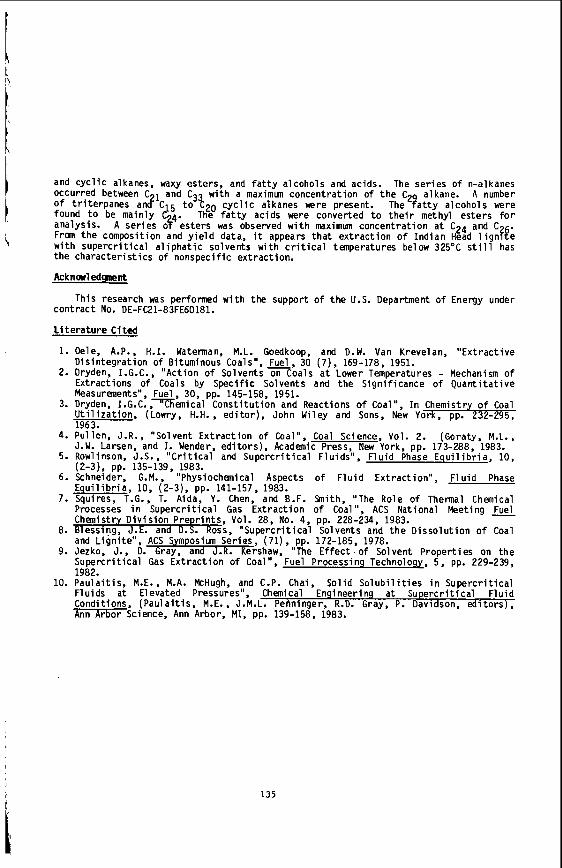
and c y c l i c alkanes, waxy esters , and f a t t y a lcohols and acids. The s e r i e s o f n-alkanes occurred between C and C3 w i t h a maximun concentrat ion o f t h e C alkane. A number of t r i t e rpanes an& t o $2, c y c l i c alkanes were present. The'Batty a lcohols were found t o be main ly 2;. The f a t t y ac ids were converted t o t h e i r methyl esters f o r analysis. A se r ies o esters was observed w i t h maximun concentrat ion a t C24 From t h e composit ion and y i e l d data, i t appears t h a t e x t r a c t i o n o f I n d i a n Heada:!g%f; wi th s u p e r c r i t i c a l a l i p h a t i c so lvents w i t h c r i t i c a l temperatures below 325°C s t i l l has the c h a r a c t e r i s t i c s o f nonspeci f ic ext ract ion.
Ackncul edge&
con t rac t No. DE-FC21-83FE60181.
L i t e r a t u r e C i t e d
1 1 $
This research was performed w i t h t h e support o f t h e U.S. Department o f Energy under
1. Oele, A.P., H.I. Waterman, M.L.,, Goedkoop, and D.W. Van Krevelan, "Ex t rac t i ve D is in teg ra t i on Bituminous Coals , m, 30 (7), 169-178, 1951.
2. Dryden, I.G.C., Ac t i on o f Solvents on Coals a t Lower Temperatures - Mechanism o f Ext ract ions o f Coals by Spec i f i c Solvents and t h e Sign i f icance o f Q u a n t i t a t i v e Measurements", Fuel, 30, pp. 145-158, 1951.
3. Dryden, I.G.C. , T e m i c a l Cons t i t u t i on and Reactions o f Coal", In Chemistry o f Coal U t i l i z a t i o n . (Lowry, H.H., e d i t o r ) , John Wiley and Sons, New York, pp. 232-295, 1963.
4. Pul len, J.R., "Solvent E x t r a c t i o n o f Coal", Coal Science, Vol. 2. (Goraty, M.L., J.W. Larsen, and I,,. Wender, e d i t o r s ) , Academic Press, New York, pp. 173-288, 1983.
5. Rowlinson, J . S . , C r i t i c a l and S u p e r c r i t i c a l F lu ids " , F l u i d Phase E q u i l i b r i a , 10,
6. Schneider, G.M., Physiochemical Aspects o f F l u i d Ex t rac t i on " , F1 u i d Phase E q u i l i b r i a , 10, (2-3), pp. 141-157, 1983.
7. Squires, T.G., T. Aida, Y. Chen, and B.F. Smith, "The Role o f Thermal Chemical Processes i n S u p e r c r i t i c a l Gas Ex t rac t i on of Coal", ACS Nat ional Meeting Fuel Chemistry D i v i s i o n P rep r in t s , VCI,'. 28, No. 4, pp. 228-234, 1983.
8. Blessing, J.E. and D.S. Ross, S u p e r c r i t i c a l Solvents and t h e D i s s o l u t i o n o f Coal and L ign i te " , ACS Symposium Series, (71) ,,,pp. 172-185, 1978.
9. Jezko, J., D. Gray, and J.R. Kershaw, The Effect of Solvent P roper t i es on t h e Superc r i t i ca l Gas E x t r a c t i o n o f Coal", Fuel Processing Technology, 5, pp. 229-239, 1982.
10. Pau la i t i s . M.E.. M.A. McHuqh. and C.P. Chai. So l i d S o l u b i l i t i e s i n S u w r c r i t i c a l
(2-3), pp. 135-139, ,,l983.
F lu ids a t Elevated Pres&iies", Chemical *Engineering a t Superc r i t i ca l F l u i d Conditions, ( P a u l a i t i s , M.E., J.M.L. Pehninger, R.D. Gray, P. Davidson, e d i t o r s ) , Ann Arbor Science, Ann Arbor, M I , pp. 139-158, 1983.
i 135
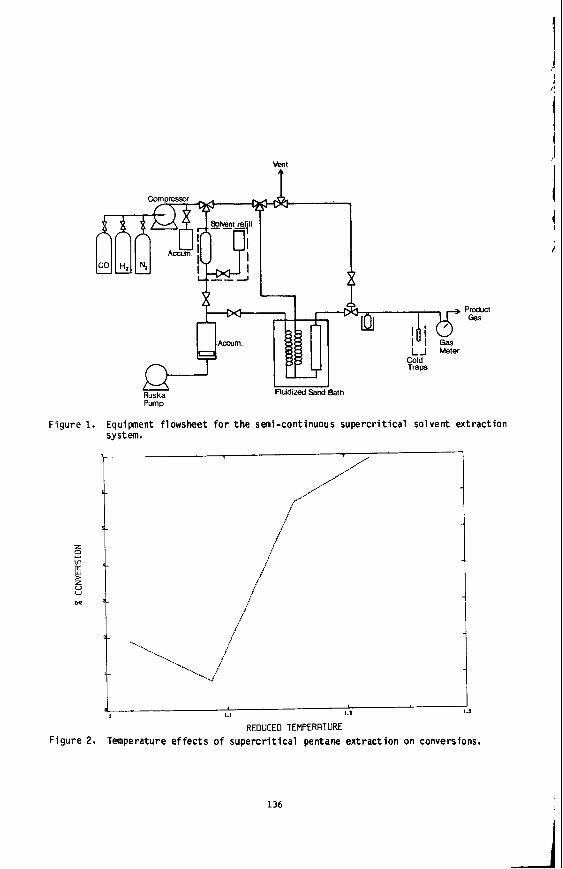
Pump
Product QS
F i g u r e 1. Equipnent f lowsheet f o r t h e semi-continuous s u p e r c r i t i c a l solvent e x t r a c t i o n system.
F i g u r e 2.
136
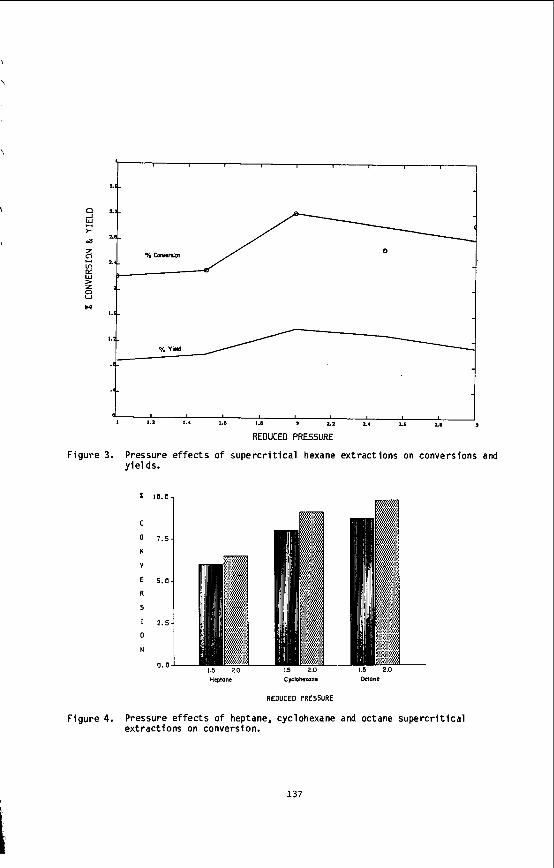
\
\
REDUCED PRESSURE
F i g u r e 3. Pressure e f f e c t s o f s u p e r c r i t i c a l hexane e x t r a c t i o n s on conversions and y i e l d s .
10.0
c 0 7 . 5
N
V
E 5.0 R
S
I 2.5
O
N
1.5 2.0 1.5 2.0 1.5 2.0 0.0
Heptane Cyslohwna mano
REDUCED PRESSURE
F i g u r e 4. Pressure ef fects o f heptane, cyclohexane and octane s u p e r c r i t i c a l e x t r a c t i o n s on conversion.
137
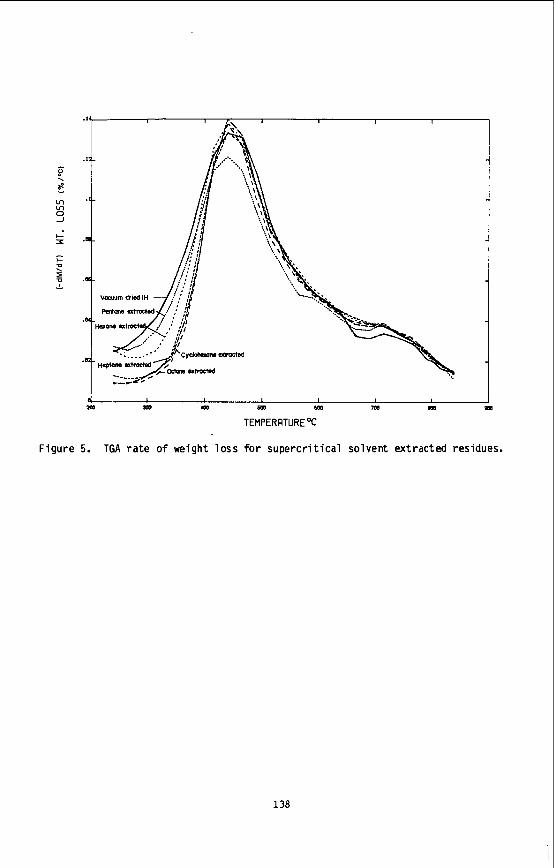
Figure 5. TGA rate of weight loss for supercritical solvent extracted residues.
138
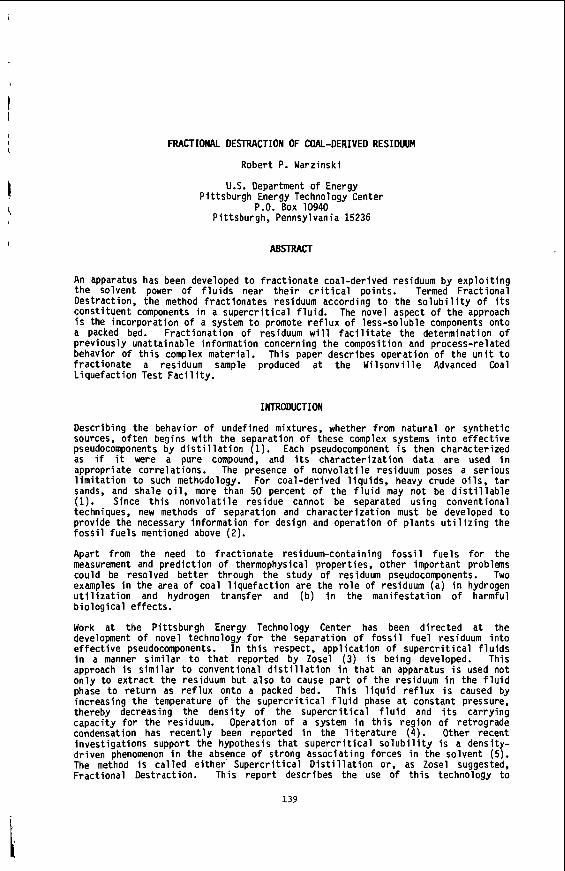
I b
I
FRACTIONAL DESTRACTION OF COAL-DERIVED RESIDUUM
Robert P. Warzinski
U.S. Department of Energy Pittsburgh Energy Technology Center
P.O. Box 10940 Pittsburgh , Pennsylvania 15236
An apparatus has been developed to fractionate coal-derived residuum by exploiting the solvent power of fluids near their critical points. Termed Fractional Destraction, the method fractionates residuum according to the solubility of its constituent components in a supercritical fluid. The novel aspect of the approach is the incorporation of a system to promote reflux of less-soluble components onto a packed bed. Fractionation of residuum will facilitate the determination of previously unattainable information concerning the composition and process-re1 ated behavior of this complex material. This paper describes operation of the unit to fractionate a residuum sample produced at the Wilsonville Advanced Coal Liquefaction Test Facility.
INlRODUCTION
Describing the behavior of undefined mixtures, whether from natural or synthetic sources, often begins with the separation of these complex systems into effective pseudocomponents by distil lation (1). Each pseudocomponent is then characterized as if it were a pure compound, and its characterization data are used in appropriate correlations. The presence of nonvolatile residuum poses a serious limitation to such methcdology. For coal-derived liquids, heavy crude oils, tar sands, and shale oil, more than 50 percent of the fluid may not be distillable (1). Since this nonvolatile residue cannot be separated using conventional techniques, new methods of separation and characterization must be developed to provide the necessary information for design and operation of plants utilizing the fossil fuels mentioned above (2).
Apart from the need to fractionate residuum-containing fossil fuels for the measurement and prediction of thermophysical properties, other important problems could be resolved better through the study of residuum pseudocomponents. Two examples in the area of coal liquefaction are the role of residuum (a) in hydrogen utilization and hydrogen transfer and (b) in the manifestation of harmful biological effects.
Work at the Pittsburgh Energy Technology Center has been directed at the development of novel technology for the separation of fossil fuel residuum into effective pseudocomponents. In this respect, application of supercritical fluids in a manner similar to that reported by Zosel (3) is being developed. This approach is similar to conventional distillation in that an apparatus is used not only to extract the residuum but also to cause part of the residuum in the fluid phase to return as reflux onto a packed bed. This liquid reflux is caused by increasing the temperature of the supercritical fluid phase at constant pressure, thereby decreasing the density of the supercritical fluid and its carrying capacity for the residuum. Operation of a system in this region of retrograde condensation has recently been reported in the literature (4). Other recent investigations support the hypothesis that supercritical solubility is a density- driven phenomenon in the absence of strong associating forces in the solvent (5). The method is called either Supercritical Distillation or, as Zosel suggested, Fractional Destraction. This report describes the use of this technology to
139
fractionate a coal-derived residuum from the Wilsonville Advanced Coal Liquefaction Test Facility.
EXPERIMENTAL
The experimental unit, called the Fractional Destraction Unit (FDU), has been designed to contact a 3-4 kg charge of residuum with a continuous flow of supercritical fluid at conditions up to 673 K and 27.6 MPa. The heart of the FDU is the Fractional Destraction Vessel (FDV) shown in Figure 1. The FDV consists of a modified 3.8-L 316 stainless steel pressure vessel onto which is attached a 78- cm column fabricated of 316 stainless steel (6.03-cm o.d. , 1.11-cm wall). The column contains a packed bed and a condenser section. In the experiments reported here, the 30-cm bed - section was packed with 0.41-cm stainless steel Pro-Pak protruded metal distillation packing from Scientific Development Co., State College, Pa. This is the same packing used in a conventional Podbelniak distillation column. The condenser consists of a removable 38-cm finger made o f 316 stainless steel (2.67-cm o.d., 0.78-cm wall) that is heated by an internal cartridge heater to promote reflux. A triple zone furnace is used to control the temperature in the extraction zone. Temperature control on the column is accomplished with independently controlled band heaters on the packed bed and condenser sections.
The desired charge of residuum is placed in the extraction section of the FDV, and the entire unit is purged with nitrogen. The FDU is then brought up to the operating temperature before beginning solvent flow. The destraction fluid is then pumped as a liquid through a preheater to raise its temperature above the critical point before it is introduced into the FDV through the sparging device at the bottom. The pressure is controlled by a high-temperature Badger-Meter control valve located near the outlet of the FDV. After traveling up the column, the fluid stream, which now contains destracted residuum, exits at the top of the FDV and is partially depressurized through the heated control valve into a separator constructed o f a 2.25 L (approximately 10.2-cm o.d., 42.5-cm long) 304 stainless steel cylinder. The separator is operated slightly above the critical temperature of the solvent (T~z1.02) at a pressure of 0.8 MPa. Separation of the residuum from the supercritical fluid is accomplished by the reduction in pressure. The residuum is drained and collected from the bottom of the separator at periodic intervals, while the solvent is flashed to atmospheric pressure, condensed, and recovered as a liquid. The operation of the FDU will be reported in detail in a later publication.
Toluene (Tc = 591.7 K, Pc = 4.115 MPa) and cyclohexane (Tc = 553.4 K, Pc = 4.074 MPa) were used as the supercritical fluids in the work reported here. They were obtained in drum quantities at greater than 99 percent purity and used as received. Owing to inefficiency in the separator, some o f the destracted residuum is collected with the solvent. This material is recovered in a rotary evaporator. The distilled solvent is then reused in the FDU. In the figures in this report that depict residuum overhead data, correction has been made for the residuum recovered in the spent solvent.
The residuum used in the work reported here was collected from the T102 vacuum distillation tower during Run 242 at the Wilsonville Advanced Coal Liquefaction Test Facility. This run was made using Illinois No. 6 coal from the Burning Star mine i n what is termed a Short-Contact-Time Integrated Two-Stage Liquefaction (SCT-ITSL) mode (6). During the time this particular sample was collected, the T102 unit was operated at 594 K and 3.4 KPa. The residuum was crushed to minus 0.64 cm and mixed by riffling before use.
140
DISCUSSION Operation of the FDU with coal-derived residuum was preceded by tests on pure compounds and distillable coal liquids using n-pentane as the supercritical fluid (7). The results o f tests with the coal-derived distillate showed that the FDU was basically performing as expected. Liquid reflux was generated by means of the hot finger when the device was operated at a temperature slightly above the critical temperature of the transport fluid. When reflux was established, fractionation based upon volatility was observed. Poorer separation was achieved in the absence of reflux.
The first work on the T102 bottoms involved operation in the non-reflux mode to obtain base-line data on the transport o f this residuum in various hydrocarbon Solvents. Using n-pentane, cyclohexane, and toluene at a TR of 1.02 and at a PR of 2, the residuum brol!ght overhead was 23, 54, ad 67 percent of that charged, respectively. Basc I on this information, further studies were performed using cyclohexane as the supercritical fluid, since a large portion of the residuum could be destracted at a temperature similar to or less than that in the T102 separator.
A two-step destraction procedure was develeped to maximize the amount of T102 residuum brought overhead. In the first step, t0luem is used In a manner similar to conventional supercritical extraction to produce a nearly ash-free material for subsequent fractionation. This first step is called the non-reflux mode because the column of the FDV is maintained at the same temperature as the extraction section. In the second step, called the reflux mode, the column and finger are heated to a higher temperature than the extraction section, which causes the density of the fluid to decrease as it travels up the column and thus promotes reflux of the less-soluble components.
In the non-reflux mode, the FDU was used to process five 800-gram charges o f the T102 bottoms. Repetitive operation of the unit was performed to produce sufficient quantities of the final fractions for subsequent characterization and experimentation. Figure 2 sumnarizes the operation of the FDU during these five destractions. Shown is the amount of residuum brought overhead as a function of the time on stream at a PR of 2. As previously mentioned, the residuum overhead data include residuum recovered from both the separator and the spent solvent. The FDV was maintained at a TR of 1.02, with overall variance in temperature for the five tests being 2 5 K. Temperature variance during any one test was ? 2 K. The differences observed, especially in the final amounts destracted, appear to be due to this small temperature variance betweeen runs. The higher yields were consistently obtained at temperatures nearer the critical point. This phenomenon appears to be particularly sensitive to the temperature of the extraction zone when the fluid is first introduced. The fact that the initial dissolution of the residuum in the fluid influences the overall yield suggests that components in the residuum may be acting as cosolvents.
Table 1 contains the elemental analysis of the T102 bottoms, the material brought overhead with toluene, the residue remaining after the toluene destraction, and the starting coal used at Wilsonville during Run 242. The toluene overhead represented 66.8 percent of the material charged to the FOU, and the residue accounted for 27.9 percent. Other material collected from the FDU includes 4.2 percent in the spent solvent and 2.7 percent recovered during cleaning of the FDV and separator with tetrahydrofuran. The total material balance is 101.6 percent. This number also includes any residual toluene or tetrahydrofuran in the various samples. The overhead collected from the five destractions was ground and combined before use in the reflux mode experiments.
As previously mentioned, cyclohexane was chosen for the fractionation solvent for the second step, since it could transport sufficient quantities of residuum at reasonable temperatures. In the reflux mode, the column of the FDV is operated at
These two steps are described below.
141
a higher temperature than t h e e x t r a c t i o n zone. As t h e carry-over o f residuum decreases, t h e temperature o f t h e column i s reduced t o cause the d e n s i t y i n t h i s reg ion t o increase and consequently more residuum i s t ranspor ted This i s repeated u n t i l t h e column i s a t t h e same temperature as t h e e x t r a c t i o n zone. In t h i s work, f o u r f r a c t i o n s were brought overhead by operat ing the column i n i t i a l l y a t 593 K and then decreasing t h e temperature t o 578, 573, and 563 K as the residuum carry-over approached 1.0 gram per gram-mole o f cyclohexane. This concentrat ion value i s ca l cu la ted from t h e amount o f residuum c o l l e c t e d f rom the bottom o f the separator a f t e r a 30-minute c o l l e c t i o n pe r iod and from t h e amount o f cyclohexane pumped d u r i n g t h a t period. The column temperatures were se lected both from densi ty es t ima t ion and from actual experlrnentation. A more de ta i l ed discussion o f t he development o f t h e operat ional parameters f e r t h e r e f l u x mode w i l l be presented i n a f u t u r e paper.
F igure 3 i l l u s t r a t e s the d i f f e r e n c e between operat ion o f the FMI i n t h e non-ref lux and the r e f l u x modes w i t h cyclohexane. This f i g u r e dep ic t s t h e r e s u l t s i n terms o f t h e overhead concen t ra t i on o f residuum. The r e f l u x mode data represent one of three r e p l i c a t e f r a c t i o n a t i o n s t h a t were performed on t h e T102 to luene des t rac t i on overhead. Each p o i n t represents a 30-minute sample c o l l e c t l o n period. Owing t o the l i m i t e d q u a n t i t y o f to luene overhead produced, no non-ref lux mode experiments were conducted us ing t h i s ma te r ia l . From t h e e a r l i e r development werk, however, severa l non-ref lux mode experiments were performed on the T102 residuum sample from Run 242. The non- re f l ux mode data i n F igure 3 were der ived from one o f these experiments and adjusted f o r comparab i l i t y t o the da ta from t h e r e f l u x mode. The adjustment compensates f o r separator i n e f f i c i e n c y and f o r residuum inso lub le i n s u p e r c r i t i c a l toluene. A l l b u t t h e l a s t t h r e e data p o i n t s i n the non-ref lux mode data represent 15-minute sample periods. The o n l y other d i f f e r e n c e between the two t e s t s was the so l ven t d e l i v e r y ra te, which was 0.24 mole per minute f o r the non-ref lux mode, and 0.43 mole per minute i n t h e r e f l u x mode.
As shown i n F igure 3 t h e temperature o f t h e column was i n i t i a l l y 30 degrees higher than the pot, which produced the reduced carry-over r a t e by causing r e f l u x t o occur. An expanded view o f t h e carry-over concentrat ion i s shown i n F igure 4. This view shows more c l e a r l y how residuum carry-over i s manipulated by changes i n the column temperature. F igu re 5 contains the same in format ion f o r t he three rep1 i c a t e cyclohexane f r a c t i o n a t i o n s performed on t h e to luene overhead. Condit ions i n a l l t h r e e experiments were s im i la r ; however, t h e smal l dev iat ions due t o inherent l i m i t a t l o n s o f t he process c o n t r o l l e r s produced some overlap between successive f r a c t i o n s . f be amount o f over lap i s est imated a t 2.6 percent between F rac t i ons 1 and 2, 2.5 percent between F rac t i ons 2 and 3, and 3.0 percent between F rac t i ons 3 and 4. Also, 32 grams t h a t should have been i n the 573 K f r a c t i o n were i n a d v e r t e n t l y c o l l e c t e d i n t h e 578 K f r a c t i o n . The respect ive f rac t i ons and res idues from t h e th ree f r a c t i o n a l des t rac t i ons were ground and combined be fo re cha rac te r i za t i on .
Table 2 conta ins t h e ana lys i s o f t he f o u r overhead f r a c t i o n s and t h e residue. The o v e r a l l m a t e r i a l balance was 96.1 percent, w i t h 57.2 percent o f t h e charge being brought overhead ( i nc ludes residuum recovered from spent so l ven t ) and 31.7 percent remaining i n t h e res idue. An a d d i t i o n a l 7.2 percent was recovered upon cleaning the u n i t with te t rahydrofuran. The trends ev ident from t h e elemental analys is i nd i ca te t h a t the components t h a t have lower molecular weights, h ighe r hydrogen- to-carbon r a t i o s , and lower heteroatom contents are concentrated i n the e a r l i e r f rac t i ons . A lso n o t e t h a t t h e separator i n e f f i c i e n c y i s h ighest f o r the e a r l i e r f rac t i ons , i n d i c a t i n g t h a t t h e more v o l a t i l e components are more r e a d i l y ca r r i ed through the ssparator w i t h t h e solvent. The matef ia l c a r r i e d through the separator w i t h the so lvent was n o t mixed wi th the respec t i ve f r a c t i o n s co l l ec ted from the separator. Independent r h a r a c t e r i z a t i o n o f these samples w i l l provide valuable i n s i g h t i n t o t h e opera t i on o f the separator.
The molecular weight data i n Table 2 were determined by vapor pressure osmometry (VPO) and g e l permeation chromatography (GPC). The molecular w i g h t increases
overhead.
142
I
regularly from Fraction 1 to the residue. In comparison, the VPO molecular weights for six fractions collected in the non-reflux mode cyclohexane destraction shown in Figure 3 range from 441 to 471, with no consistent trend. The polydispersity values ( /RN) shown for the four fractions in Table 2 are less than those for the non-re 7 lux mode fractions, which ranged from 1.47 for the first fraction to 1.88 for the sixth fraction. This number is a measure of the breadth of the molecular weight distribution and shows that operation in the reflux mode produces fractions with narrower molecular weight distributions than those prepared without reflux.
In Figure 6 the GPC traces for the four fractions and for the residue from each of the three cyclohexane fractional destractions are overlaid. The trend to higher molecular weight distributions as the fractionation proceeded is evident, as well as the reproducibility of the fractionation process. Additional characterization Of similar samples produced in the FDU is the subject of another paper (9).
CONCLUSIONS
The main conclusion to be drawn from the experimental data presented here is that fractionation of residuum through the use of a supercritical fluid system incorporating internal reflux produced by retrograde condensation results in sharper fractions than those obtained by ordinary supercritical extraction. The capability of the FDU to process coal-derived residuum in the internal reflux mode has been demonstrated. The density-driven separation does appear to fractionate the residuum on the basis of volatility, with lower molecular weight species preceding larger ones.
Other methods of fractionation with supercritical fluids are conceivable. One such possiblility could involve manipulation of the pressure during the destraction or upon subsequent separation of the fluid and residuum. The relative merits of such possibilities remain to be explored. Successful development of such technology will result in the ability to fractionate and characterize material currently intractable by conventional methods.
D I S C L A I E R
Reference in this report to any specific product, process, or service is to facilitate understanding and does not necessarily imply its endorsement or favoring by the United States Department of Energy.
1.
2. 3. 4. 5.
6.
7. 8.
9.
REFERENCES
Brule. M.R., Kumar, K.H., and Watansiri, S. Oil & 6as Journal Feb. 11, 1985, ,,-I
19, July, 1983. Warzinski, R.P.. and Ruether, J.A. Fuel 1984, 63, 1619. Loffe. B.V.. and Vitenberg, A.G. Hx-Space Analysis and Related Methods in Gas Chromatograph 1984. John Wiley & Sons, New York, 131. Warzinski, R.P., jtrycker, AS., and Lett, R.G., Paper to be presented at the ACS meeting, Fuel Division Symposium, entitled Liquefaction and Characterization of Liquids, Chicago, 1985.
143
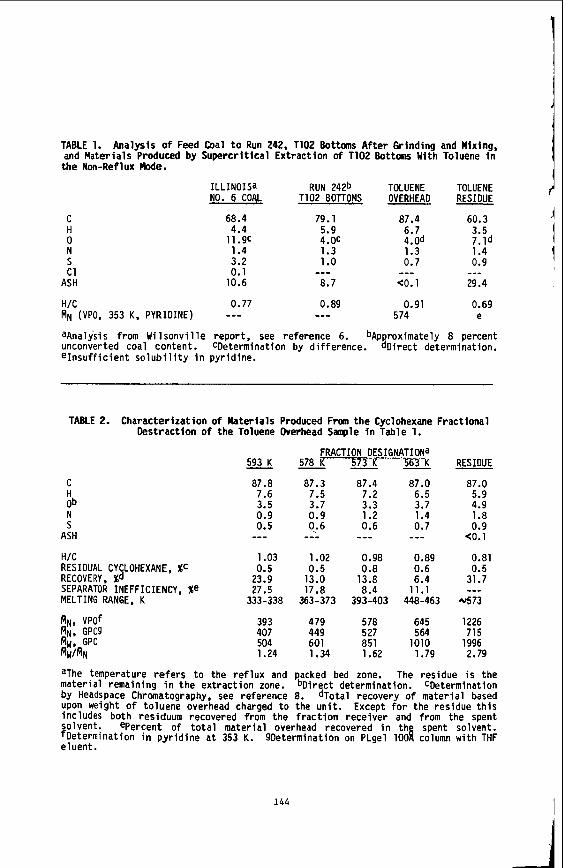
TABLE 1. Analysis of Feed Coal to Run 242. T102 Bottoms After Grinding and Mixing, and Materials Produced by Supercritical Extraction of T102 B o t t w With Toluene in the Non-Reflux Mode.
ILLINOISa RUN 242b TOLUENE TOLUENE NO. 6 COAL T102 BOTTOMS OVERHEAD RESIDUE
C H 0 N S c1
ASH
68.4 79.1 87.4 60.3 4.4 5.9 6.7 3.5 11.9c 4.0C 4.0d 7.ld 1.4 1.3 1.3 1.4 3.2 1 .o 0.7 0.9 0.1 10.6 8.7 <o. 1 29.4
_ _ _ _ _ _ ---
0.77 0.89 0.91 0.69 --- 574 e H/C
aAnalysis from Wilsonville report, see reference 6. bApproximately 8 percent unconverted coal content. CDetermination by difference. dDirect determination. eInsuff i cient sol ubi 1 i ty in pyridine.
RN (VPO, 353 K, PYRIDINE) ---
TABLE 2. Characterization of Materials Produced From the Cyclohexane Fractional Destraction of the Toluene Overhead Saaple in Table 1.
C H
N S
ASH
H/C RESIDUAL CYCLOHEXANE, %C RECOVERY, %d SEPARATOR INEFFICIENCY, %e MELTING RANGE, K
PIN, GPCg Aw, GPC AW/flN
Ob
AN, VPOf
593 K
87.8 7.6 3.5 0.9 0.5
-
_ _ _ 1.03 0.5 23.9 27.5
333-338
393 407 504 1.24
FRACTION DES IGNATIONa 578 K 573 K 563 K - - - 87.3 87.4 87.0
0.5 0.8 0.6 13.0 13.8 6.4 17.8 8.4 11.1
363-373 393-403 448-463
479 578 645 449 527 564 60 1 851 1010 1.34 1.62 1.79
RESIDUE
87.0 5.9 4.9 1.8 0.9
<0.1
-
0.81 0.5 31.7 --L
4 7 3
1226 715 1996 2.79
aThe temperature refers to the reflux and packed bed zone. The residue is the mater i a1 remaining i n the extract ion zone. CDetermi nat i on by Headspace Chromatography, see reference 8. dTotal recovery of material based upon weight of toluene overhead charged to the unit. Except for the residue this includes both residuum recovered from the fraction receiver and from the spent fOlVent. epercent of total material overhead recovered in th spent solvent. Determination in pyridine at 353 K. 9Determination on PLgel loo! column with THF
eluent.
bDirect determination.
144
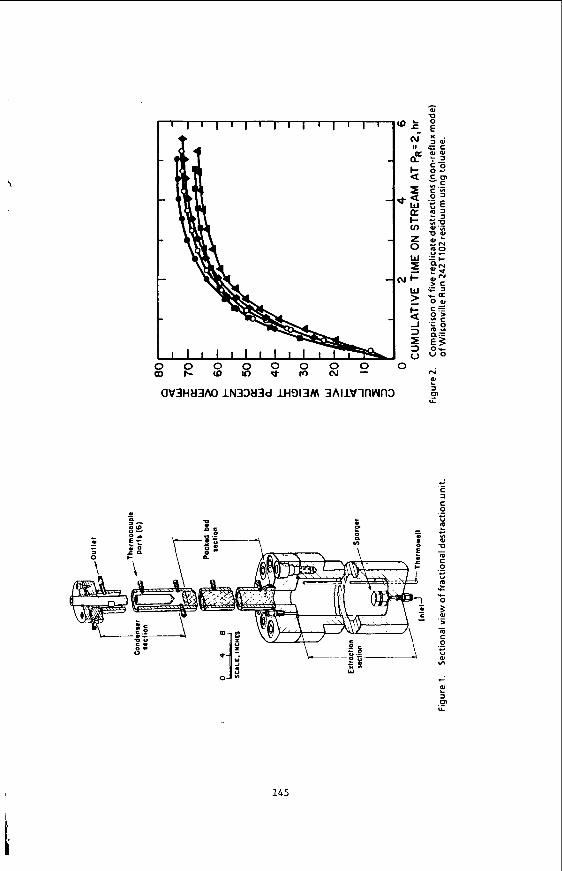
c
a8 L 3 m .- Y
145
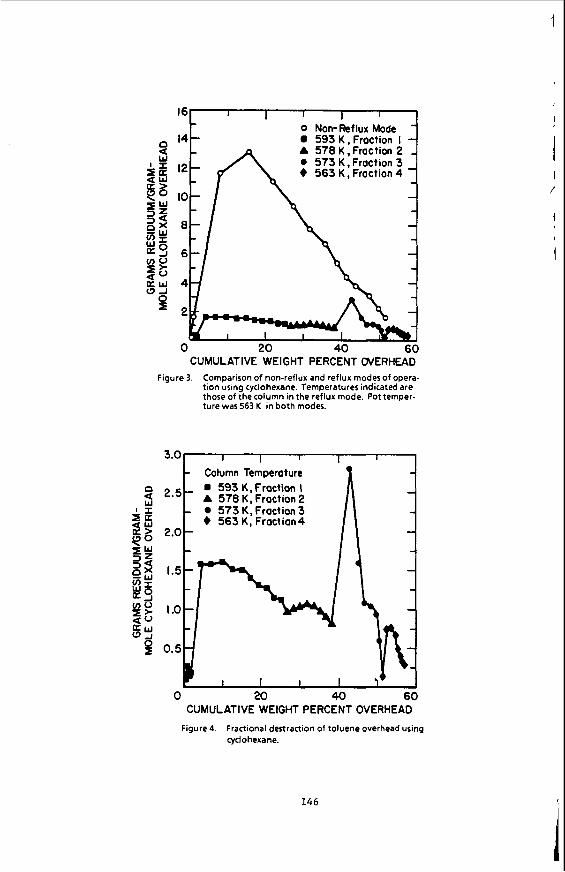
1
161 I I I I I 1 0 Non-Reflux Mode
593 K , Fraction I A 578 K , Fraction 2 0 573 K , Fraction 3 + 563 K , Fraction 4
14
12
IO
8
6
4
2
0 20 40 60 CUMULATIVE WEIGHT PERCENT OVERHEAD
0 Non-Reflux Mode - 593 K , Fraction I -
A 578 K , Fraction 2 - 0 573 K , Fraction 3 + 563 K , Fraction 4 -
14 -
0 20 40 60 CUMULATIVE WEIGHT PERCENT OVERHEAD
Figure 3. Comparison of non-reflux and reflux modes of opera- tion using cyclohexane. Temperatures indicated are those of the column in the reflux mode. Pot temper- ture was 563 K in both modes.
3.01 I I I I I I Column Temperature -
593 K, Fraction I A 578 K, Fraction 2
573 K, Fraction 3 - + 563 K, Fraction4 2.0 - 2*5 -
- I .5 -
- I .o -
- 0.5
4 A- - I I I I 7
0 20 40 60 CUMULATIVE WEIGHT PERCENT OVERHEAD
Figure 4. Fractional destraction of toluene overhead using cyclohexane.
146
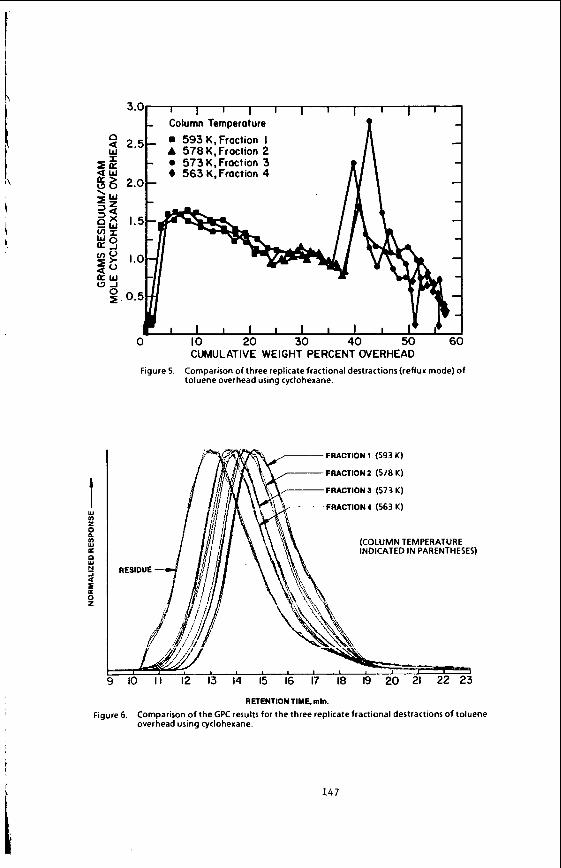
n a w
0 IO 20 30 40 50 60 CUMULATIVE WEIGHT PERCENT OVERHEAD
Comparison of three replicate fractional destractions (reflux mode) of toluene overhead using cyclohexane.
Figure 5.
A- FRACTION I (593 K)
FRACTION 2 (578 K)
j FRACTION 3 (573 K)
L \yJ, FRACTION4 (563 K)
RETENTION TIME, mln.
Figure 6. Comparison of the GPC results for the three replicate fractional destractions of toluene overhead using cyclohexane.
I 147
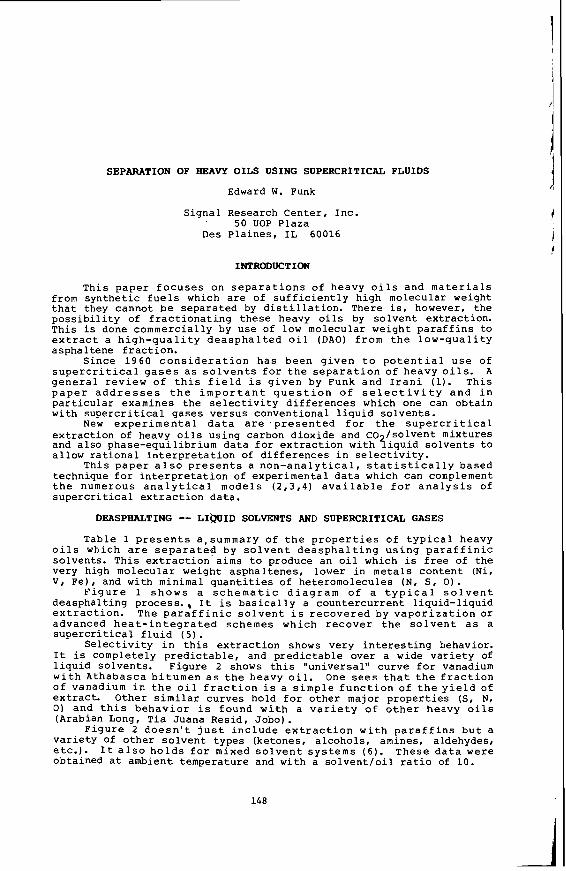
SEPARATION OF HEAVY OILS USING SOPERCRITICAL FLUIDS
Edward W. Funk
Signal Research Center, Inc. ' 50 UOP Plaza Des Plaines. IL 60016
INTRODOCT ION
This paper focuses on separations of heavy oils and materials from synthetic fuels which are of sufficiently high molecular weight that they cannot be separated by distillation. There is, however, the possibility of fractionating these heavy oils by solvent extraction. This is done commercially by use of low molecular weight paraffins to extract a high-quality deasphalted oil (DAO) from the low-quality asphaltene fraction.
Since 1960 consideration has been given to potential use of supercritical gases as solvents for the separation of heavy oils. A general review o f this field is given by Funk and Irani (1). This paper addresses the important question of selectivity and in particular examines the selectivity differences which one can obtain with supercritical gases versus conventional liquid solvents.
New experimental data are .presented for the supercritical extraction of heavy oils using carbon dioxide and CO /solvent mixtures and also phase-equilibrium data for extraction with liquid solvents to allow rational interpretation of differences in selectivity.
This paper also presents a non-analytical, statistically based technique for interpretation of experimental data which can complement the numerous analytical models ( 2 , 3 , 4 ) available for analysis of supercritical extraction data.
DEASPEALTING -- LImID SOLVENTS AND SOPERCRITICAL GASES
Table 1 presents a,summary of the properties of typical heavy oils which are separated by solvent deasphalting using paraffinic solvents. This extraction aims to produce an oil which is free of the very high molecular weight asphaltenes, lower in metals content (Ni, V, Fe), and with minimal quantities of heteromolecules (N, S, 0).
Figure 1 shows a schematic diagram of a typical solvent deasphalting process., It is basically a countercurrent liquid-liquid extraction. The paraffinic solvent is recovered by vaporization or advanced heat-integrated schemes which recover the solvent as a supercritical fluid ( 5 ) .
Selectivity in this extraction shows very interesting behavior. It is completely predictable, and predictable over a wide variety of liquid solvents. Figure 2 shows this "universal" curve for vanadium with Athabasca bitumen as the heavy oil. One sees that the fraction of vanadium in the oil fraction is a simple function of the yield of extract. Other similar curves hold for other major properties (S, N, 0) and this behavior is found with a variety of other heavy oils (Arabian Long, Tia Juana Resid, Jobo).
Figure 2 doesn't just include extraction with paraffins but a variety Of other solvent types (ketones, alcohols, amines, aldehydes, etc.). It also holds for mixed solvent systems (6). These data were obtained at ambient temperature and with a solvent/oil ratio of 10.
148
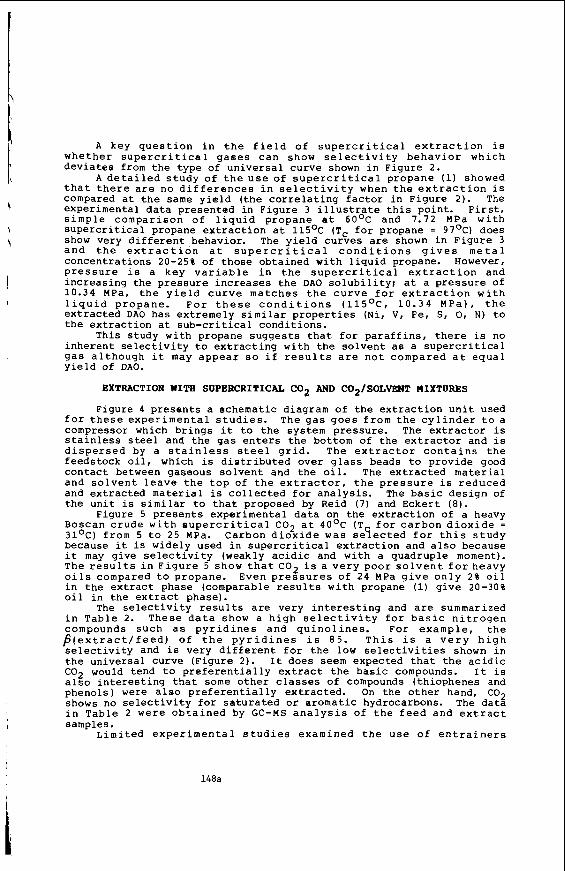
A key question in the field of supercritical extraction is whether supercritical gases can show selectivity behavior which deviates from the type of universal curve shown in Figure 2 .
A detailed study of the use of supercritical propane (1) showed that there are no differences in selectivity when the extraction is compared at the same yield (the correlating factor in Figure 2 ) . The experimental data presented in Figure 3 illustrate this point. First, simple comparison of liquid propane at 6OoC and 7.72 MPa with supercritical propane extraction at 115OC (Tc for propane = 97OC) does show very different behavior. The yield curves are shown in Figure 3 and the extraction at supercritical conditions gives metal concentrations 20-25% of those obtained with liquid propane. However, pressure is a key variable in the supercritical extraction and increasing the pressure increases the DAO solubility! at a pressure of 10.34 MPa, the yield curve matches the curve for extraction with liquid propane. For these conditions (115OC, 10.34 MPa), the extracted DAO has extremely similar properties (Ni, V, Fe, S, 0, N) to the extraction at sub-critical conditions.
This study with propane suggests that for paraffins, there is no inherent selectivity to extracting with the solvent as a supercritical gas although it may appear so if results are not compared at equal yield of DAO.
EXTRACTION WITE SUPERCRITICAL CO2 AND COz/SOLWT MIXTURES
Figure 4 presents a schematic diagram of the extraction unit used for these experimental studies. The gas goes from the cylinder to a compressor which brings it to the system pressure. The extractor is stainless steel and the gas enters the bottom of the extractor and is dispersed by a stainless steel grid. The extractor contains the feedstock oil, which is distributed over glass beads to provide good contact between gaseous solvent and the oil. The extracted material and solvent leave the top of the extractor, the pressure is reduced and extracted material is collected for analysis. The basic design of the unit is similar to that proposed by Reid ( 7 ) and Eckert (8).
Figure 5 presents experimental data on the extraction of a heavy Boscan crude with supercritical C02 at 4OoC (T for carbon dioxide = 3loC) from 5 to 25 MPa. Carbon dioxide was seyected for this study because it is widely used in supercritical extraction and also because it may give selectivity (weakly acidic and with a quadruple moment). The results in Figure 5 show that C02 is a very poor solvent for heavy oils compared to propane. Even pressures of 24 MPa give only 2 % oil in the extract phase (comparable results with propane (1) give 20-30% oil in the extract phase).
The selectivity results are very interesting and are summarized in Table 2. These data show a high Selectivity for basic nitrogen compounds such as pyridines and quinolines. For example, the p(extract/feed) of the pyridines is 8 5 . This is a very high selectivity and is very different for the low selectivities shown in the universal curve (Figure 2). It does seem expected that the acidic C02 It is also interesting that some other classes of compounds (thiophenes and phenols) were also preferentially extracted. On the other hand, C02 shows no selectivity for saturated or aromatic hydrocarbons. The data in Table 2 were obtained by GC-MS analysis Of the feed and extract samples.
Limited experimental studies examined the use of entrainers
would tend to preferentially extract the basic compounds.
i
148a
I
(ethanol, heptane) to increase oil yield during the supercritical extraction with CO For these studies the solvents were added to the Oil feedstock in &e extractor. For both ethanol and heptane, 10% solvent added to the oil gave a 3-5 times increase in yield, however the type of selectivity shown in Table 2 disappeared and for each compound type, selectivities were less than 5 (similar to Figure 2). Thus for CO extraction, entrainers may be used to dramatically increase yield but at the price of selectivity.
DATA ANALYSIS FOR SOPERCRITICAL EXTRACTION OF HEAVY OILS
There are presently available very powerful statistical techniques to design experiments in such a way that the data can be reduced to provide quantitative measures of key variables and interactions between variables (9). These statistical techniques are used in a wide variety of other technologies which deal with complex systems but have not found application in the area of supercritical extraction. This type of statistical analysis could complement the more traditional analytical modeling of supercritical phenomena.
ACKNOWLEDGEMENTS
I would like to acknowledge the advice of C. A. Eckert (University of Illinois) on experimental design and P. Palmese of Signal Research Center, who was responsible for overall design and construction of the experimental unit.
1.
2.
3 .
4.
5.
6.
7.
8.
9.
REFERENCES
Funk, E.W.; Irani, C.A. Recent Developments &I Separation Science 1977, 2, 171. Balder, J.R.; Prausnitz, J.M. Ind. Eng. Chem. Fund. 1966, 2, 449. Kurnik, R.T.; Reid, R.C. "Solubility of Solid Mixtures in Supercritical Fluids"; 2nd World Congress of Chemical Engineering, Montreal, Canada, 1981.
Paul, P.F.M.; Wise, H.S. in "The Principles of Gas Extraction"; Mills L Boon, Ltd., London, 1971.
Gearhar, J.A.; Garwin, L. 011 Gas Journal 1976, 74(24), 63.
Funk, E.W. "Phase Equilibria in Mixtures of Athabasca Bitumen With Alcohol and Paraffin Solvents"; AIChE Meeting, Houston, Texas, 1981.
Kurnik, R.T.; Holla, S.J.; Reid, R.C. J. Chem. Eng. Data 1981, 26, 47.
Johnston, K.P.; Eckert, C.A. AIChE Journal 1981, 27, 773. Box, G.E.P.; Hunter, W.G.; Hunter, J.S. "Statistics for Experimenters"; Wiley-Interscience, John Wiley and Sons, New York, 1978.
149
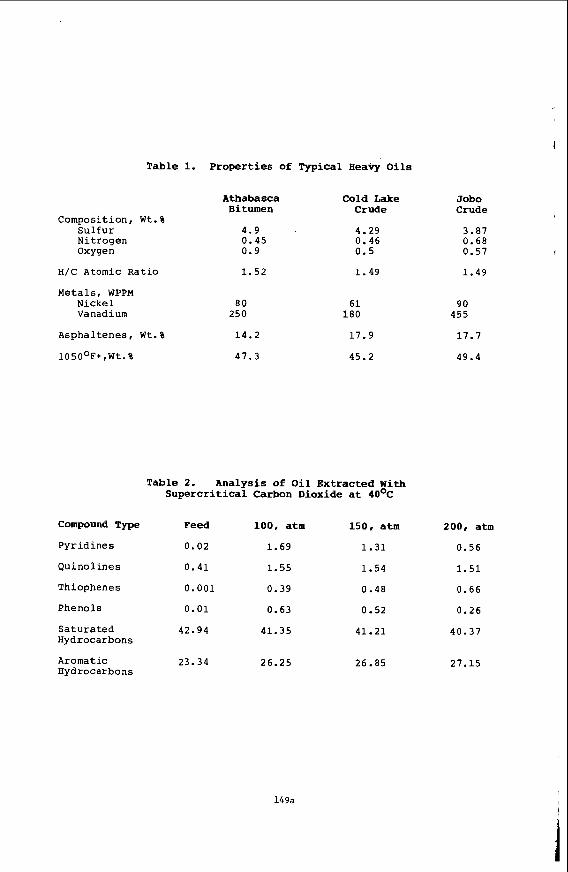
Table 1. Properties of Typical H e a v y O i l s
Composition, Wt.% Sulfur Nitrogen Oxygen
H/C Atomic Ratio
Me t a l s , WPPM N i c k e l Vanadium
Aspha 1 tenes , W t . %
1050°F+,Wt.%
Athabasca C o l d Lake Bitumen Crude
4.9 0.45 0.9
4.29 0.46 0.5
1.52 1.49
80 250
14.2
61 180
17.9
47.3 45.2
Job0 Crude
3.87 0.68 0.57
1.49
90 455
17.7
49.4
T a b l e 2. Analysis of O i l Extracted With Supercr i t ica l Carbon Dioxide at 4OoC
Compound Type Peed 100, a t m 1 5 0 , atm 200, atm
Pyridines 0.02 1.69 1.31 0.56
Quinol ines 0.41 1.55 1.54 1.51
Thiophenes 0.001 0.39 0.48 0.66
Phenols 0.01 0.63
Saturated 42.94 41.35 Hydrocarbons
Aromatic Hydrocarbons
23.34 26.25
0.52 0.26
41.21 40.37
26.85 27.15
149a
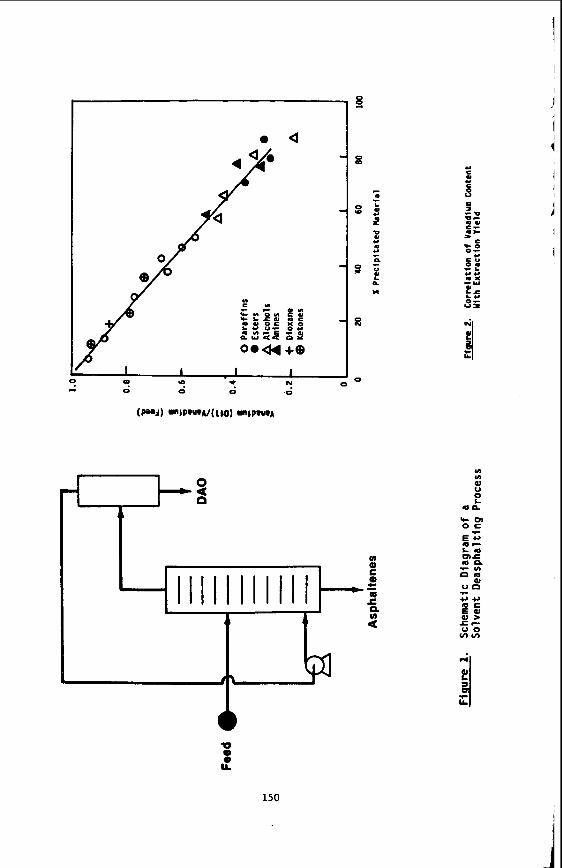
. a
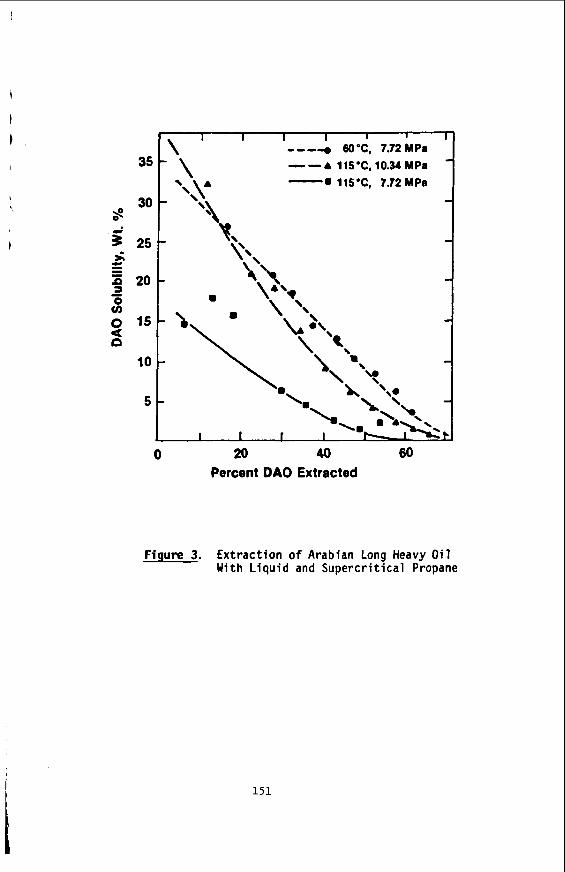
I ~
I I I I I
---j W'C, 7.72MPa - - 4 115*C, 10.34 MPa \ ' \ 3 5 -
30
25
20
15
10
5
0 20 40 60 Percent DAO Extracted
Figure 3. Extract ion o f Arabian Long Heavy O i l With L i q u i d and Supercr i t ica l Propane
151
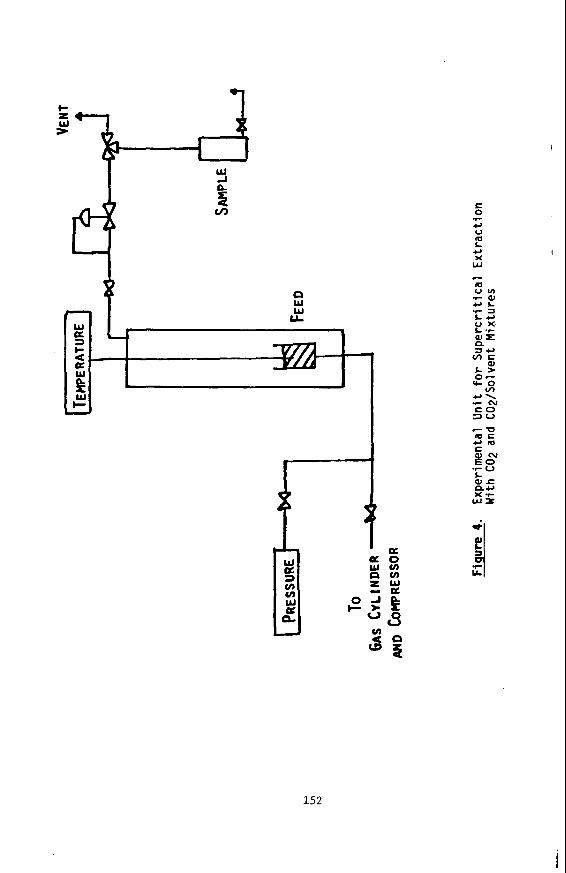
L- I
s a
E 0
c, U L c, X w
.C
m
l
152
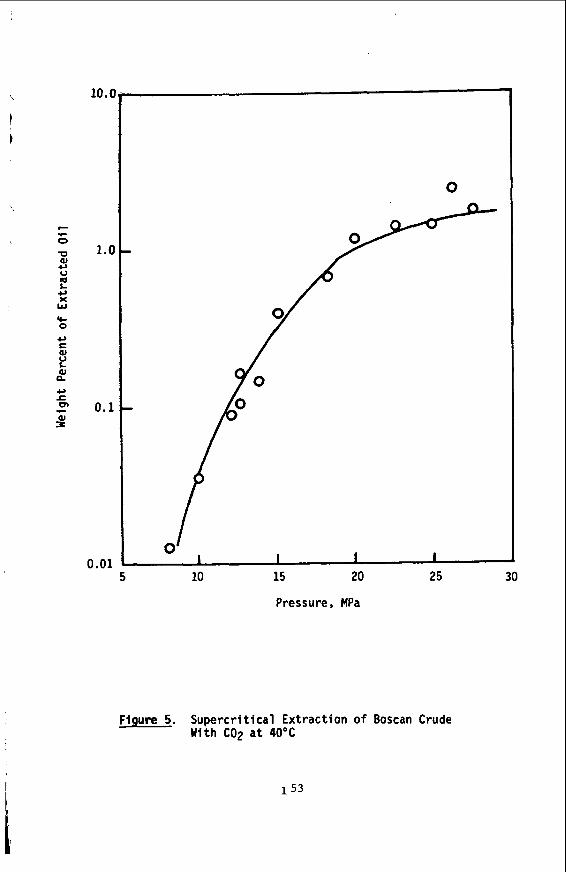
10.0
1.0
0.1
0.01
0
5 10 15 20 25 30
Pressure. MPa
Fiqure 5. Supercr i t ica l Extraction of Boscan Crude With C02 a t 40°C
153
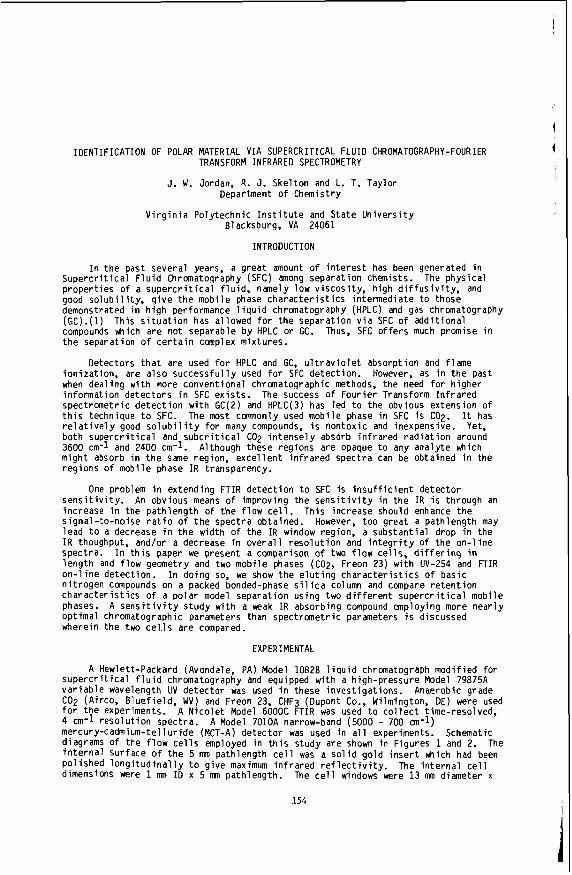
IDENTIFICATION OF POLAR MATERIAL V I A SUPERCRITICAL FLUID CHROMATOGRAPHY-FOURIER TRANSFORM INFRARED SPECTROMETRY
J. W. Jordan, R. J. Skel ton and L. T. Taylor Department o f Chemistry
V i r g i n i a Poly technic I n s t i t u t e and State U n i v e r s i t y Blacksburg, VA 24061
INTRODUCTION
I n t h e past severa l years, a great amount o f i n t e r e s t has been generated i n S u p e r c r i t i c a l F l u i d Chromatography (SFC) among separat ion chemists. p roper t i es o f a s u p e r c r i t i c a l f l u id , namely low v i scos i t y , h igh d i f f u s i v i t y , and good s o l u b i l i t y , g i v e the mobi le phase c h a r a c t e r i s t i c s in termediate t o those demonstrated i n h igh performance 1 i q u i d chromatography (HPLC) and gas chromatography (GC).(l) This s i t u a t i o n has al lowed f o r t he separat ion v i a SFC o f add i t i ona l compounds which are not separable by HPLC or GC. Thus, SFC o f f e r s much promise i n the separation o f c e r t a i n complex mixtures.
Detectors t h a t are used f o r HPLC and GC, u l t r a v i o l e t absorption and f lame ion i za t i on , are a l s o success fu l l y used f o r SFC detect ion. However, as i n the past when deal ing w i th more convent ional chromatographic methods, the need f o r h igher in format ion de tec to rs i n SFC ex i s t s . The success o f Four ie r Transform I n f r a r e d spect rometr ic d e t e c t i o n w i th GC(2) and HPLC(3) has led t o the obvious extens ion o f t h i s technique t o SFC. It has r e l a t i v e l y good s o l u b i l i t y f o r many compounds, i s nontox ic and inexpensive. Yet, both s u p e r c r i t i c a l and s u b c r i t i c a l CO2 i n t e n s e l y absorb i n f r a r e d r a d i a t i o n around 3600 cm-l and 2400 cm-1. might absorb i n the same region, exce l l en t i n f r a r e d spect ra can be obtained i n the reg ions o f mobi le phase I R transparency.
s e n s i t i v i t y . increase i n the pa th leng th o f t h e f l o w c e l l . Th i s increase should enhance the s ignal - to-noise r a t i o o f t he spect ra obtained. lead t o a decrease i n t h e width o f the I R window region, a subs tan t i a l drop i n the I R thoughput, and/or a decrease i n o v e r a l l r e s o l u t i o n and i n t e g r i t y of the on - l i ne spect ra. I n t h i s paper we present a comparison o f two f l o w ce l l s , d i f f e r i n g i n leng th and f low geometry and two mobi le phases (CO2, Freon 23) w i th UV-254 and FTIR o n - l i n e detect ion. I n do ing so, we show t h e e l u t i n g c h a r a c t e r i s t i c s o f bas ic n i t rogen compounds on a packed bonded-phase s i l i c a column and compare r e t e n t i o n c h a r a c t e r i s t i c s o f a po la r model separat ion us ing two d i f f e r e n t s u p e r c r i t i c a l mobile phases. A s e n s i t i v i t y s tudy w i th a weak I R absorbing compound employing more n e a r l y opt imal chromatographic parameters than spect rometr ic parameters i s discussed wherein the two c e l l s are compared.
The phys ica l
The most commonly used mobi le phase i n SFC i s CO2.
Although these reg ions are opaque t o any analy te which
One problem i n extending FTIR de tec t i on t o SFC i s i n s u f f i c i e n t de tec to r An obvious means o f improving the s e n s i t i v i t y i n the I R i s through an
However, t oo great a path length may
EXPERIMENTAL
A Hewlett-Packard (Avondale, PA) Model 10828 l i q u i d chromatograph mod i f i ed f o r s u p e r c r i t i c a l f l u i d chromatography and equipped w i th a high-pressure Model 79875A v a r i a b l e wavelength UV detector was used i n these inves t i ga t i ons . Anaerobic grade CO2 (Airco, B lue f i e ld , WV) and Freon 23, CHF3 (Dupont Co., Wilmington, DE) were used fo r t he experiments. A N ico le t Model 6000C FTIR was used t o c o l l e c t t ime-resolved, 4 cm-1 r e s o l u t i o n spectra. mercury-cadmium-tel lur ide (MCT-A) detector was used i n a l l experiments. Schematic diagrams of the f l o w c e l l s employed i n t h i s study are shown i n Figures 1 and 2. The i n t e r n a l sur face o f t he 5 mn path length c e l l was a s o l i d go ld i n s e r t vh ich had been po l i shed l o n g i t u d i n a l l y t o g ive maximum i n f r a r e d r e f l e c t i v i t y . dimensions were 1 mn I D x 5 mn path length.
A Model 7010A narrow-band (5000 - 700 cm-1)
The i n t e r n a l c e l l The c e l l windows were 13 mn diameter x
154
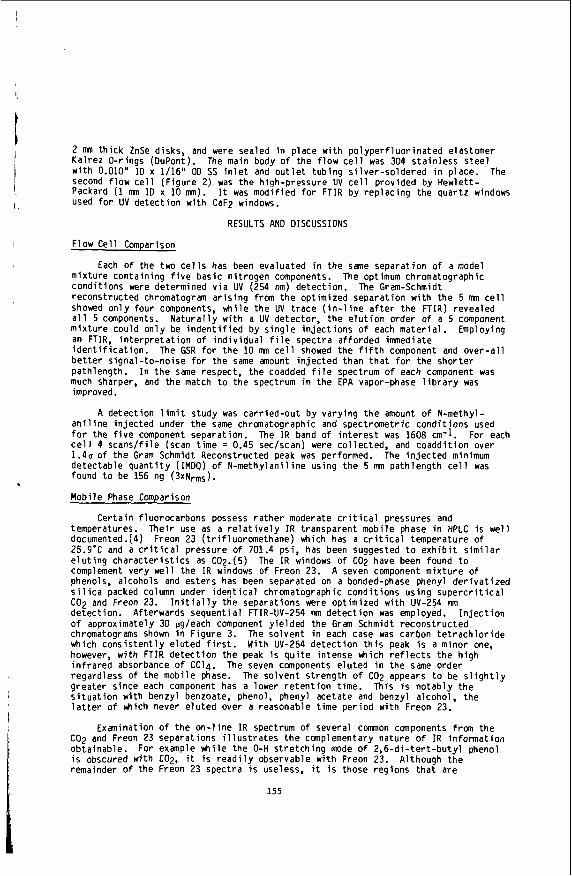
2 mn t h i c k ZnSe disks, and were sealed i n p lace w i th po l ype r f l uo r ina ted elastomer Ka l rez O-rings (DuPont). The main body o f the f l o w c e l l was 304 s t a i n l e s s s t e e l w i t h 0.010'' IO x 1/16" OD SS i n l e t and o u t l e t tub ing s i l ve r -so lde red i n place. second f l o w c e l l (F igure 2) was the high-pressure UV c e l l provided by Hewlet t - Packard (1 mn I D x 10 mn). used for UV de tec t i on wi th CaF2 windows.
The
It was mod i f i ed f o r FTIR by rep lac ing the quar tz windows
RESULTS AND DISCUSSIONS
Flow Cel l Comparison
Each o f the two c e l l s has been evaluated i n the same separat ion o f a model m ix tu re conta in ing f i v e bas ic n i t rogen components. The optimum chromatographic condi t ions were determined v i a UV (254 nm) detect ion. The Gram-Schmidt reconst ructed chromatogram a r i s i n g from t h e optimized separat ion w i t h the 5 mn c e l l showed o n l y fou r components, wh i l e the UV t r a c e ( i n - l i n e a f t e r t he FTIR) revealed a l l 5 canponents. N a t u r a l l y w i th a UV detector, t he e l u t i o n order o f a 5 component m ix tu re could o n l y be i n d e n t i f i e d by s i n g l e i n j e c t i o n s of each ma te r ia l . Employing an FTIR, i n t e r p r e t a t i o n o f i n d i v i d u a l f i l e spectra af forded imnediate i d e n t i f i c a t i o n . The GSR f o r the 10 mn c e l l showed the f i f t h component and ove r -a l l b e t t e r s ignal - to-noise f o r the same amount i n j e c t e d than t h a t f o r the sho r te r pathlength. much sharper, and the match t o the spectrum i n the EPA vapor-phase l i b r a r y was improved.
a n i l i n e i n jec ted under the same chromatographic and spect rometr ic cond i t i ons used f o r the f i v e component separation. c e l l 4 scans / f i l e (scan t ime = 0.45 sec/scan) were co l lected, and coadd i t i on over 1 . 4 ~ o f t he Gram Schmidt Reconstructed peak was performed. The i n j e c t e d minimum detectable quan t i t y (IMDQ) o f N-methy lan i l ine us ing the 5 mn path length c e l l was found t o be 156 ng (3xNrmS).
Mobi le Phase Comparison
temperatures. The i r use as a r e l a t i v e l y I R t ransparent mobi le phase i n HPLC i s well documented.(4) 25.9'C and a c r i t i c a l pressure o f 701.4 psi, has been suggested t o e x h i b i t s i m i l a r e l u t i n g c h a r a c t e r i s t i c s as C02.(5) complement very we l l the I R windows o f Freon 23. A seven component m i x t u r e o f phenols, alcohols and es te rs has been separated on a bonded-phase phenyl d e r i v a t i z e d s i l i c a packed column under i d e n t i c a l chromatographic cond i t i ons us ing s u p e r c r i t i c a l COP and Freon 23. detect ion. Afterwards sequent ia l FTIR-UV-254 nm de tec t i on was employed. I n j e c t i o n o f approximately 30 pg/each component y ie lded the Gram Schmidt reconst ructed chromatograms shown i n F igure 3. The so lvent i n each case was carbon t e t r a c h l o r i d e which c o n s i s t e n t l y e lu ted f i r s t . With UV-254 de tec t i on t h i s peak i s a minor one, however, w i th FTIR de tec t i on the peak i s q u i t e in tense vh ich r e f l e c t s the h igh i n f r a r e d absorbance of CCl4. regard less o f the mobi le phase. The so lvent s t reng th o f COP appears t o be s l i g h t l y greater s ince each component has a lower r e t e n t i o n time. This i s no tab ly the s i t u a t i o n wi th benzyl benzoate, phenol, phenyl acetate and benzyl alcohol, the l a t t e r of Hhich never e lu ted over a reasonable t ime pe r iod wi th Freon 23.
Examination o f the on - l i ne I R spectrum Of several common components from the C02 and Freon 23 separations i l l u s t r a t e s t h e complementary nature o f I R in format ion obtainable. i s obscured wi th CO2, i t i s r e a d i l y observable with Freon 23. remainder o f the Freon 23 spect ra i s useless, i t i s those reg ions t h a t are
I n t h e same respect, the coadded f i l e spectrum o f each component was
A detect ion l i m i t s tudy was ca r r i ed -ou t by vary ing the amount o f N-methyl-
The I R band of i n t e r e s t was 1608 cm-l. For each
Cer ta in f luorocarbons possess ra the r moderate c r i t i c a l pressures and
Freon 23 ( t r i f l uo romethane) which has a c r i t i c a l temperature o f
The I R windows o f C02 have been found t o
I n i t i a l l y the separations were optimized w i th UV-254 nm
The seven components e lu ted i n the same order
For example wh i l e the 0-H s t r e t c h i n g mode of 2 .6 -d i - t e r t -bu ty l phenol Although the
155
t ransparent w i th C02. Consequently continuous in fo rmat ion i s ava i l ab le through the mid- in f ra red reg ion except f o r the t r ip le-bonded absorbances around 2100 cm-1. The o n - t h e - f l y spec t ra o f o -n i t ropheno l i n C02 and Freon 23 are shown i n F igure 4. A r e l a t i v e l y weak, broad bonded 0-H s t re t ch ing mode i s observed i n both mobi le phases fo r 0 -n i t ropheno l . Freon 23 r e l a t i v e t o C02 due t o decreased I R throughput t o the de tec tor windows.
There i s a loss i n s e n s i t i v i t y a t t h i s frequency M e n using
I n summary, both l i g h t p i p e c e l l s o f f e r very good S/N spectra obtained on- l ine d u r i n g a chromatographic run. SFC-FTIR, the regions o f t o t a l absorbance may hinder the i d e n t i f i c a t i o n o f a component in a complex mix tu re . Freon 23, although r e l a t i v e l y opaque i n the IR. does have reasonable t ransparency from 4000 cm-l t o 2500 cm-1. s i m i l a r e l u t i o n c h a r c t e r i s t i c s t o C02 make method development w i th Freon 23 f a i r l y easy and inexpensive. SFC-FTIR a l low ing f o r more complete i d e n t i f i c a t i o n o f analyte species.
Although C02 seems t o be an adequate mobi le phase fo r
The seemingly
Thus C02 and Freon 23 make a good mobi le phase p a i r f o r
REFERENCES
1. D. R. Gere, Science, 3, 253 (1983).
2. J. R. Cooper, L. T. Taylor, Anal. Chem. !%, 1989 (1984).
3. R. S. Brown, L. T. Taylor, Anal. Chem. E, 723 (1983).
4. C. C. Johnson, L. T. Taylor, Anal. Chem., 3, 436 (1983).
5. P r i va te Comunicat ion, J. F. Oeye,E.I. DuPont De Nemours & Co. Inc.
ACKNOWLEDGEMENTS
The authors wish t o express t h e i r g r a t i t u d e t o Dennis R. Gere o f Hewlett-Packard f o r e n t h u s i a s t i c discussions o f SFC. The f i n a n c i a l assistance o f t he Commonwealth o f V i r g i n i a and Department o f Energy Grant DE-FG22-84PC70799 .is g r e a t l y appreciated.
156
I R
Figure 1
ZnSe W I N D O W
G O L D I N S E R T
K A L R E Z O - R I N G
Figure 2
157
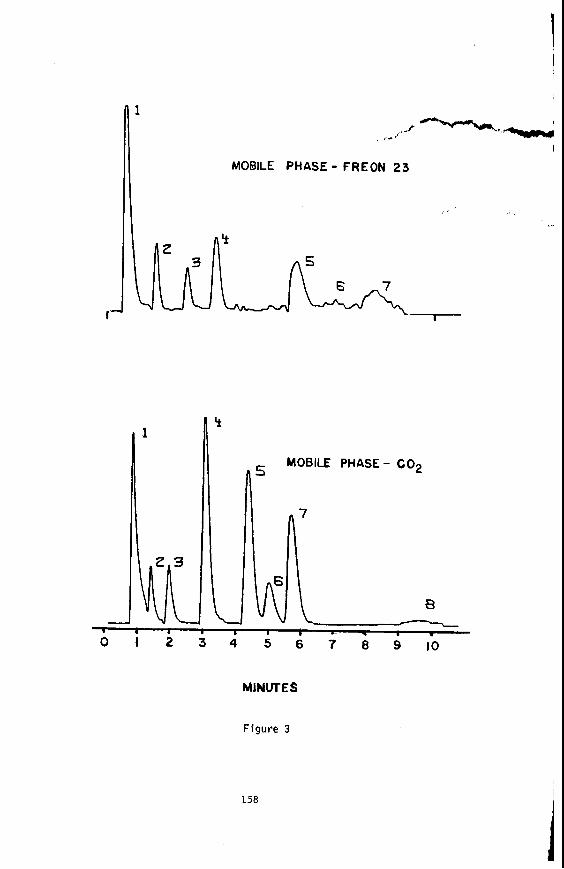
n l ,J -'.- I
I 4 ,' I
MOBILE PHASE: - FREON 23
I-
-1
5
' 9
MOBILE PHASE- COz
v
.' .
Figure 3
158
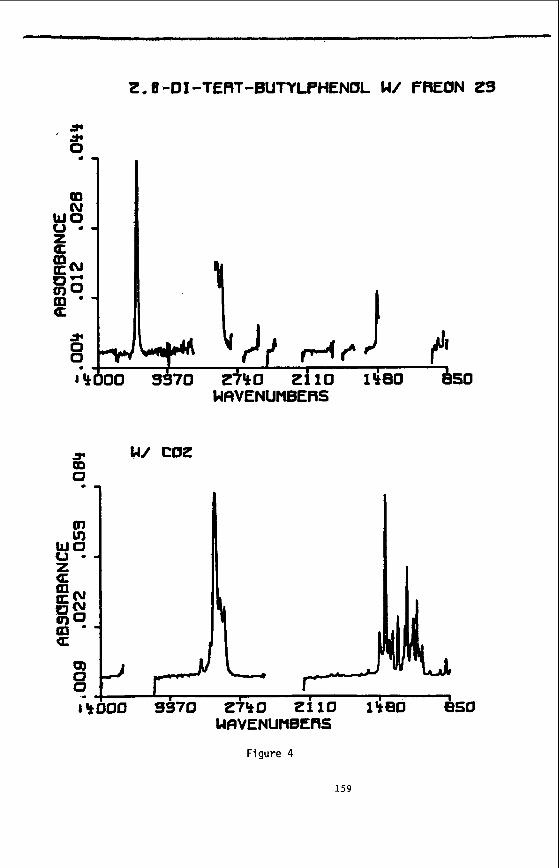
‘Z.B-DI-TERT-BUTYLPHENOL U/ FREON ZS
’ j c 0
r OD 0
WRVENUHBERS
w/ coz
Figure 4
159
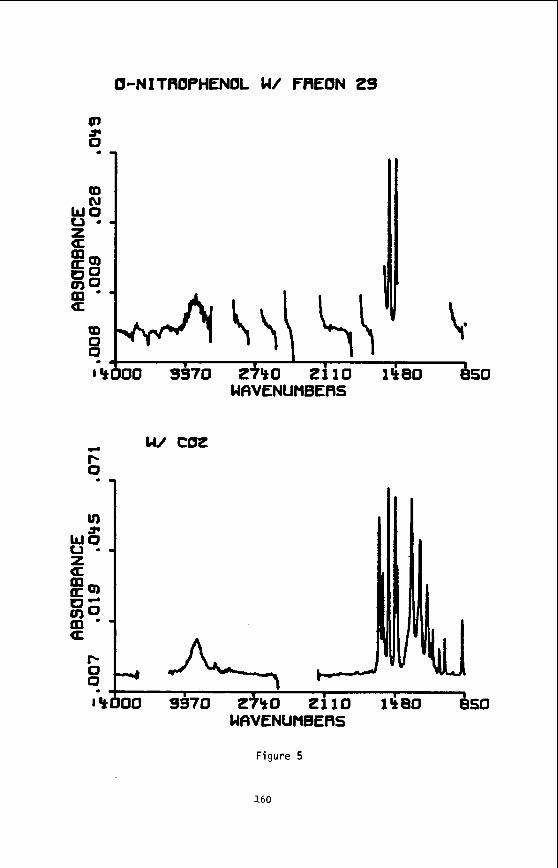
0-NITROPHENOL W/ FREON ZS
n, I 1 Figure 5
160
I
HYDROTREATING IN SUPERCRITICAL MEDIA
by
J. Y. Low
PHILLIPS PETROLEUM COMPANY PHILLIPS RESEARCH CENTER
BARTLESVILLE. OKLAHOMA 74004
In recent years, supercritical fluid extraction has been a very popular technique for separations. The food and drug industries have used this technique for years on a commercial scale. Recently the energy industries have extende this application to coal liquefac- tion and oil shale extraction.(l-5? We, at Phillips, have also found that supercritical extraction of oil shale has improved the oil yield but produced a lower quality liquid product than those from insitu or above ground retorts. We were interested in developing an upgrading technology to upgrade the supercritically extracted (SCE) shale oil to synfuel or clean motor fuels. One of our upgrading projects was to investigate hydrotreating in the presence of the supercritical fluid which is used in the extraction step. If the hydrotreating step can be integrated with the supercritical extraction step, perhaps one can take advantage of, among other things, the pressure and heat available in the extraction step.
Our investigation consisted of essentially two parts. The first part involved the feasibility study of catalytic hydrotreating in the presence of supercritical fluid (in short, supercritical hydro- treating). If hydrotreating in the presence of supercritical media is possible, then we would like to extend the feasibility studies to other heavy feeds, such as topped crude and coal liquids. The second part of our investigation involved the parametric studies to see how reaction parameters effect supercritical hydrotreating.
From our extensive investigation of the potential of hydro- treating of shale oil under supercritical conditions of the solvent used and then the reaction parameter effects. we would like to make the following conclusions:
A high nitrogen, heavy oil such as shale oil can be hydro- treated under supercritical conditions to yield very low nitrogen fuels and syncrude in one step, depending on the conditions used;
The presence of a light solvent gives a better product and reduces coke formation on the catalyst surface;
16 1
. A non-aromatic s o l v e n t s u c h as h e p t a n e improves n i t r o g e n removal a n d r e d u c e s hydrogen consumption (from 2600 s c f / b b l of s h a l e o i l to 1200 s c f / b b l ) ;
. With A r a b i a n topped c r u d e , t h e s o l v e n t l o s e s i t s , e n h a n c e m e n t e f f e c t f o r n i t r o g e n removal i f t h e s o l v e n t is 'less t h a n 50 w e i g h t p e r c e n t of t h e f e e d ;
. From p a r a m e t e r s t u d i e s , f o r an e x t e n s i v e n i t r o g e n removal, a r e l a t i v e l y l o n g r e s i d e n c e time (30 minu tes or l o n g e r ) is r e q u i r e d at 8500F and 1400 p s i g ;
m i l d e s t r e a c t i o n c o n d i t i o n s s t u d i e d .
- I I
. And the s u l f u r w a s almost c o m p l e t e l y removed even w i t h t h e ,
i
A. H v d r o t r e a t i n a Svstem
A bench scale h y d r o t r e a t i n g u n i t was u s e d f o r these e x p e r i - ments as shown i n F i g u r e 1. The reactor is a 316 s t a i n l e s s s teel t u b e w i t h an i n n e r d i a m e t e r of one i n c h and a l e n g t h o f 27.5 i n c h e s . The t o t a l volume is a b o u t 290 m l . The reactor w a s equ ipped w i t h a t h e r - mocouple w e l l ( a 1/4" x 25" s t a i n l e s s s tee l t u b e ) f o r t e m p e r a t u r e mea- surements . The reactor w a s first f i l l e d w i t h a b o u t 90 m l of i n e r t pack ing , 100 m l of c a t a l y s t and t h e rest w i t h a n i n e r t p a c k i n g a g a i n t o serve as t h e p r e h e a t i n g zone for the o i l and hydrogen. The t e m - p e r a t u r e s were measured by t he rmocoup les p l a c e d i n t h e midd le of each of t h e i n e r t beds a n d t h e c a t a l y s t bed.
B.
Dur ing t h e c o u r s e o f t h e i n v e s t i g a t i o n the f o l l o w i n g f e e d s were used : s u p e r c r i t i c a l e x t r a c t e d coal l i q u i d , s u p e r c r i t i c a l ex- tracted s h a l e o i l , P a r a h o s h a l e o i l , and Arabian t o p p e d c r u d e (650°F+). T h e i r p r o p e r t i e s are g iven i n T a b l e 1. T o make t h e f e e d mix tu re , t h e heavy o i l w a s u s u a l l y d i s s o l v e d i n a s o l v e n t such as t o l u e n e o r n-heptane.
C. C a t a l v s t s
The N i - M o c a t a l y s t was commercial ly a v a i l a b l e f rom Nalco.
D. C a t a l v s t P r e s u l f u r i z a t i o n
The c a t a l y s t w a s g e n e r a l l y h e a t e d t o 3000F w i t h n i t r o g e n p u r g i n g , and t h e n t h e n i t r o g e n a tmosphe re w a s r e p l a c e d w i t h a f low o f 10% H2S i n hydrogen. A t t h e same t i m e , t h e t e m p e r a t u r e w a s s l o w l y i n c r e a s e d t o 6000F and w a s k e p t at t h i s t e m p e r a t u r e u n t i l t h e c a t a l y s t W a s comple t e ly s u l f i d e d . T h e r e a c t i o n u s u a l l y takes f o u r h o u r s at 6000F and 100 l i t e r of 10% H2S i n B2.
162
RESULTS AND DISCUSSIW
In this report the results from the investigation of hydro- treatment of shale oil, Arabian topped crude, and lignite extract (under supercritical conditions) are being discussed. These experi- ments were carried out to investigate the potential of hydrotreatment in the presence of a light solvent under supercritical conditions for shale oil upgrading and the effect of reaction parameters in super- critical hydrotreating. In other words, these experiments are mainly exploratory in nature to find whether hydrotreatment under supercriti- cal conditions has any advantage in the upgrading of high nitrogen heavy crudes, and if so, how do the major parameters affect the hydro- treatment under these conditions. The first few experiments were car- ried out with shale oil obtained from supercritical extraction. This shale oil is a very waxy grease and almost fits the definition of a solid. It has a very high nitrogen content (2.3%) and a sulfur con- tent of 0.9%. The hydrogen content in the shale oil is relatively high with H/C atomic ratio of 1.48, equal to that of some petroleum crudes. Only a limited amount of this material was available, so Only a few experiments were performed with this shale oil.
A. Suaercritical Hydrotreatment of SCB Shale Oil
SCE shale oil was hydrotreated at high severity because of its high nitrogen content and extremely high viscosity (Table 1). The experimental results are shown in Table 2. Based on the shale oil fed, the product distribution is the following: 12% gases, 52% boil- ing less than 3000F (calculated by difference) and 36% in the heavy oil fraction 03000F). The elemental analyses of the heavy oil frac- tion have indicated that better than 99% of the nitrogen was removed. The sulfur removal was equally high. The actual heteroatom removal may even be higher because part of the nitrogen and sulfur found in the heavy oil could be contributed by the presence of dissolved ammo- nia and hydrogen sulfide gases. No attempt was made to wash out the ammonium sulfide before the elemental analyses were carried out.
For runs 2, 3, 4, and 5 the feed entered the hydrotreater directly from the supercritical extraction unit. The extract con- tained about 4% shale oil in toluene. Runs 2 and 3 were carried out at 8420F, and Runs 4 and 5, at 7500F. At the lower reaction tempera- ture (7500F). the yield of gases dropped to less than 28, and the yield of heavy oil fraction increased by about 10%. The extent of nitrogen removal was reduced significantly at the lower temperature. However, the sulfur removal seemed to be unaffected by the lowering of reaction temperature from 842 to 7500F. Thus these experimental results suggest that the supercritically extracted shale oil can be processed to yield very low nitrogen and sulfur fuels or syncrudes.
B. awrcritical Hydrotreatment of Arabian Toveed Crude
A series of experiments were performed with Arabian topped crude (6500F+) to investigate the hydrotreatment of high sulfur crudes in the presence of a light solvent under supercritical conditions. The experimental results obtained are summarized in Table 3. The overall results are comparable to those obtained from the supercriti- cal hydrotreatment of SCE shale oil (Run 1). The sulfur removal is
163
very extensive (about 99% removal, reduced from 3.3% to 0.02%). The nitrogen content in the heavy oil fractions are relatively low, less than 60 ppm for runs with total liquid hourly space velocity (LHSV) Of 0.5 (Runs 6 and 7) and about 770 ppm for Run 8 with an LHSV of 1.6. Thus, for extensive nitrogen removal, lower LHSV is needed.
Runs 9 and 10 were carried out to study the effect of an aliphatic solvent such as n-heptane in supercritical hydrotreating of topped crude. Comparing the results from Runs 6 and 7 in which toluene was used as the solvent, the nitrogen contents in heavy oil fractions are much lower for the heptane runs than the toluene ones. The sulfur contents are about the same. Thus, one can conclude that an aliphatic solvent is better solvent for hydrodenitrogenation than the aromatic solvent. The reason is that the aromatic solvent was competing for hydrogenation.
C. SuDercritical Hydrotreatment of Lianite Extract
Lignite extract was hydrotreated in the presence of toluene under supercritical conditions (8500F, 1400 psig, 20 wt % lignite in toluene, a hydrogen GHSV of 300, and a LHSV of 1 or 1.6). The results are tabulated in Table 4. The elemental analyses of the heavy oil fraction have indicated the following changes (Runs 13 and 14): nitrogen, reduced from 0.91 to 0.14% and sulfur reduced from 4700 ppm to about 100 ppm.
Run 15 was carried out with a higher LHSV of 1.6, and the results are not too much different from Runs 13 and 14. The heteroat- om removals are about the same. The heavy oil fraction, however, was increased to 43% from 30 and 36% (Runs 13 and 14). Thus the conclu- sion is that the lignite extract, a solid, can also be upgraded to yield a syncrude by the supercritical hydrotreatment process.
D. Supercritical Versus Conventional
A series of hydrotreating experiments were carried out under conventional conditions (without the use of a light solvent). The results are given in Table 5, along with some results obtained from a supercritical hydrotreatment experiment. The experiments performed were not under identical conditions, but they are close enough that the results obtained are valid enough for comparison.
The results from the supercritical hydrotreatment experi- ments are superior in almost every respect to conventional hydrotreat- ment experiments (without the use of solvent). Under similar condi- tions supercritical hydrotreating produced better products, for exam- ple: less gas yield (10% = 2511, more of light oil fraction, <3000F, (55 12 35%) and less coke formed on the catalyst surface (0.3 = 3.8% based on the feed). For conventional hydrotreating we had encountered reactor plugging problems when the unit was running more than 196 hours. This problem was not found with supercritical hydrotreating.
E. Beaction Parameter Studies
Experiments were carried out with conventional shale oil (direct retorted Paraho shale oil) for the purpose of studying the
164
I
effects of reaction parameters in hydrotreating under supercritical conditions. In one group of experiments, the space velocity was var- ied (1.6, 3.2, and 5) while the other reaction parameters were kept constant. For temperature studies, the following reaction tempera- tures were investigated: 700, 750, 800, and 8500F. The pressure ef- fect was examined at four levels -- 1000, 1400, 2000, and 2400 psig at 800°F. We have also studied the effect of solvent to feed ratio and solvent types (saturate aromatics).
The liquid hourly space velocities (LHSV, including the sol- vent) of 1.6, 3.2, and 5 were investigated at 8500F, 1400 psig, 20 wt % Paraho shale oil in toluene. The results are illustrated in Figure 2. With the LHSV of 1.6, the heavy oil fraction is only 3446, but when LHSV is increased to 3.2, the heavy oil fraction increased to 63% and did not change with further increase in LHSV. This seems to suggest that one third of the shale oil can undergo a molecular weight reduc- tion more rapidly (a residence time of about 12 minutes) than the second third, which needs a residence time of up to an hour, while the last third survives longer than one hour.
For heteroatom removal, the results reveal that for a LHSV of 1.6 the nitrogen content in the heavy oil fraction, which is about 34 wt % of the total products, is 360 ppm (1.9% in the feed). Thus, the overall nitrogen removal is greater than 98%. For LHSV of 3.2 the nitrogen content in the heavy oil is increased to about 6,000 ppm. With a further increase in LHSV to 5, there seems to be very little change in the nitrogen removal. The sulfur removal is very rapid. Even with the LHSV of 5, there is only 53 ppm sulfur in the heavy oil.
Figure 3 illustrates the results from reaction temperature studies. The reaction temperatures used ranged from 700 to 850°F, with an increment of 50°F. The sulfur seems to be removed rather easily even at 7000F (from 7000 ppm in the feed to 200 ppm in the heavy oil fraction) or 97% removal. At higher temperatures the sulfur content in the heavy oil is much lower (%lo0 pprn). On the other hand, the nitrogen removal requires a much higher temperature. This. of course, is not surprising. For the purpose of obtaining relatively clean syncrude, we probably have to operate at high temperature (8000F) and low space velocity (<1.6).
The yield of heavy oil increases with a decrease of reaction temperature (Figure 3). For example, with the reaction temperature of 8500F, the heavy oil is only about 30% of the total products. While at the other extreme, that is, with the reaction temperature of only 7000F, the heavy oil fraction represents 90% of the whole products. Thus the higher temperature is necessary for the production of light products.
The effect of pressure on EDN and heavy oil yield in super- critical hydrotreating of shale oil is given in Figure 4. The ex- perimental conditions used for these experiments are: 8000F, hydrogen GHSV of 600, LHSV of 1.6, 20 wt % shale oil in toluene, and reaction pressure of 1000-2400 psig. The nitrogen content in the heavy oil fractions have revealed that nitrogen removal increases with increas- ing reaction pressure. At the highest pressure studied (2400 psig), the nitrogen content in the heavy oil is only about 300 ppm. This is
165
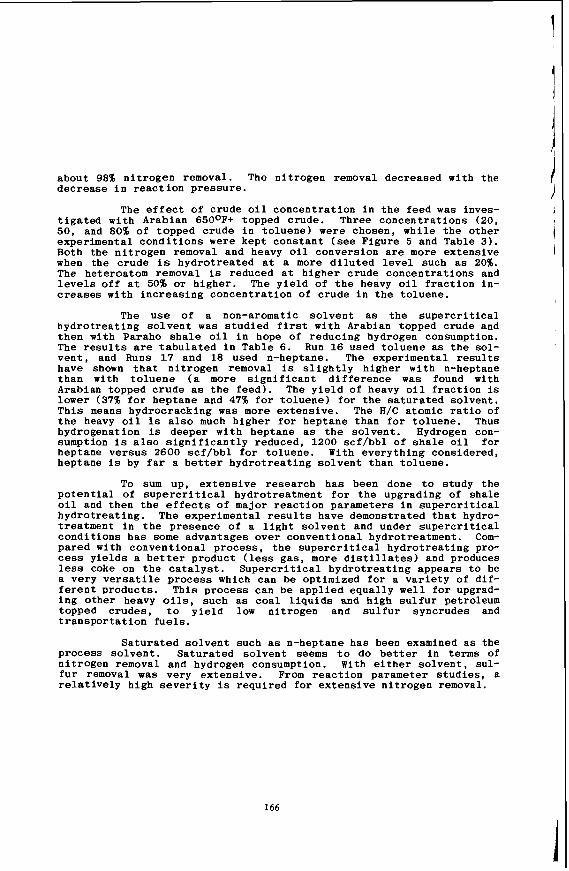
1
a b o u t 98% n i t r o g e n removal . The n i t r o g e n removal d e c r e a s e d w i t h t h e d e c r e a s e i n r e a c t i o n p r e s s u r e .
t i g a t e d w i t h Arab ian 650°F+ topped c r u d e . Three c o n c e n t r a t i o n s (20, 50, and 80% o f t o p p e d c r u d e i n t o l u e n e ) were chosen , w h i l e t h e o t h e r e x p e r i m e n t a l c o n d i t i o n s were k e p t c o n s t a n t (see F i g u r e 5 and Tab le 3). Both t h e n i t r o g e n removal and heavy o i l c o n v e r s i o n are more e x t e n s i v e when t h e c r u d e is h y d r o t r e a t e d at a more d i l u t e d l e v e l such as 20%. The he te roa tom removal is reduced a t h i g h e r c r u d e c o n c e n t r a t i o n s and l e v e l s o f f a t 50% or h i g h e r . The y i e l d o f t h e heavy o i l f r a c t i o n i n - creases w i t h i n c r e a s i n g c o n c e n t r a t i o n o f c r u d e i n t h e t o l u e n e .
The u s e of a non-aromatic s o l v e n t as t h e s u p e r c r i t i c a l h y d r o t r e a t i n g s o l v e n t w a s s t u d i e d f i r s t w i t h Arabian topped c r u d e and t h e n w i t h P a r a h o s h a l e o i l i n hope of r e d u c i n g hydrogen consumption. The r e s u l t s are t a b u l a t e d i n T a b l e 6. Run 16 u s e d t o l u e n e as t h e sol- v e n t , and Runs 17 and 18 used n-heptane. The e x p e r i m e n t a l r e s u l t s have shown t h a t n i t r o g e n removal is s l i g h t l y h i g h e r w i t h n-heptane t h a n wi th t o l u e n e (a more s i g n i f i c a n t d i f f e r e n c e w a s found wi th Arabian topped c r u d e as t h e f e e d ) . The y i e l d o f heavy o i l f r a c t i o n is lower (37% for h e p t a n e and 47% f o r t o l u e n e ) for t h e s a t u r a t e d s o l v e n t . T h i s means h y d r o c r a c k i n g w a s more e x t e n s i v e . The A/C atomic r a t i o of t he heavy o i l is also much h i g h e r for h e p t a n e t h a n f o r t o l u e n e . Thus hydrogena t ion i s d e e p e r w i t h h e p t a n e as t h e s o l v e n t . Hydrogen con- sumption is also s i g n i f i c a n t l y r e d u c e d , 1200 scf /bbl of shale o i l for h e p t a n e v e r s u s 2600 s c f / b b l for t o l u e n e . W i t h e v e r y t h i n g c o n s i d e r e d , h e p t a n e is by f a r a bet ter h y d r o t r e a t i n g s o l v e n t t h a n t o l u e n e .
To sum up , e x t e n s i v e r e s e a r c h h a s been done t o s t u d y t h e p o t e n t i a l o f s u p e r c r i t i c a l h y d r o t r e a t m e n t f o r t h e u p g r a d i n g of s h a l e o i l and t h e n t h e e f f e c t s o f major r e a c t i o n p a r a m e t e r s i n s u p e r c r i t i c a l h y d r o t r e a t i n g . The e x p e r i m e n t a l r e s u l t s have demons t r a t ed t h a t hydro- t r e a t m e n t i n t h e p r e s e n c e of a l i g h t s o l v e n t and unde r s u p e r c r i t i c a l c o n d i t i o n s has s o m e a d v a n t a g e s over c o n v e n t i o n a l b y d r o t r e a t m e n t . Com- p a r e d w i t h c o n v e n t i o n a l p r o c e s s , t h e s u p e r c r i t i c a l h y d r o t r e a t i n g pro- cess y i e l d s a b e t t e r p r o d u c t (less g a s , more d i s t i l l a t e s ) and produces less coke on t h e c a t a l y s t . S u p e r c r i t i c a l h y d r o t r e a t i n g a p p e a r s t o be a v e r y v e r s a t i l e process which can be o p t i m i z e d f o r a v a r i e t y o f d i f - f e r e n t p r o d u c t s . T h i s p r o c e s s can b e a p p l i e d e q u a l l y w e l l f o r upgrad- i n g o t h e r heavy oils , s u c h as coal l i q u i d s and h i g h s u l f u r petroleum topped c r u d e s . t o y i e l d l o w n i t r o g e n and s u l f u r s y n c r u d e s and t r a n s p o r t a t i o n f u e l s .
S a t u r a t e d s o l v e n t such as n -hep tane h a s been examined as t h e p r o c e s s s o l v e n t . S a t u r a t e d s o l v e n t seems t o d o b e t t e r i n terms of n i t r o g e n removal and hydrogen consumption. With e i ther s o l v e n t , s u l - f u r removal w a s v e r y e x t e n s i v e . From r e a c t i o n p a r a m e t e r s t u d i e s , a r e l a t i v e l y h i g h s e v e r i t y i s r e q u i r e d f o r e x t e n s i v e n i t r o g e n removal.
i The e f f e c t o f c r u d e o i l c o n c e n t r a t i o n i n t h e f e e d was inves- d
I i
166
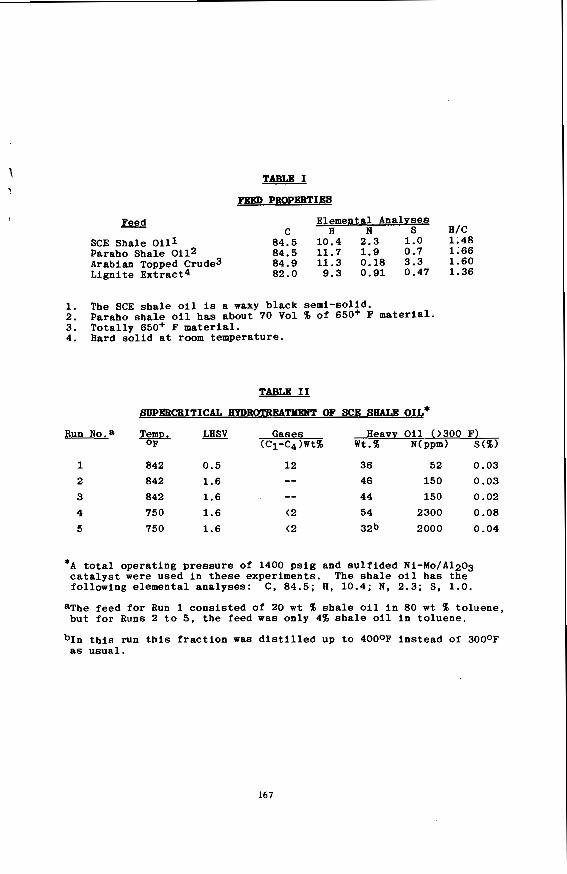
TABLE I
PEED PROPEEl'IES
Feed Elemental Analvses S H/C -
C H N SCE Shale Oil1 84.5 10.4 2.3 1.0 1i48 Paraho Shale 0112 04.5 11.7 1.9 0.7 1.66 Arabian Topped Crude3 84.9 11.3 0.18 3.3 1.60 Lignite Extract4 82.0 9.3 0.91 0.47 1.36
1. The SCE shale oil is a waxy black semi-solid. 2. Paraho shale oil has about 70 Vol % of 650+ F material. 3. Totally 650+ F material. 4. Bard solid at room temperature.
TABLE I1
E L *
Run NO.^ TemD. Gases Heavy Oil 0300 F) (Ci-C4)Wt% Wt.% N(PPm) S(%) OF
1 842 0.5 12 36 52 0.03 46 150 0.03 2 842 1.6 --
3 842 1.6 44 150 0.02 4 750 1.6 <2 54 2300 0.08
--
5 750 1.6 <2 32b 2000 0.04
*A total operating pressure of 1400 psig and sulfided NI-Mo/A1203 catalyst were used in these experiments. The shale oil has the following elemental analyses: C, 84.5; H, 10.4; N, 2.3; S, 1.0.
but for Runs 2 to 5, the feed was only 4% shale oil in toluene.
as usual.
aThe feed for Run 1 consisted of 20 wt % shale oil in 80 at % toluene,
bIn this run this fraction was distilled up to 4000F instead of 300oF
167
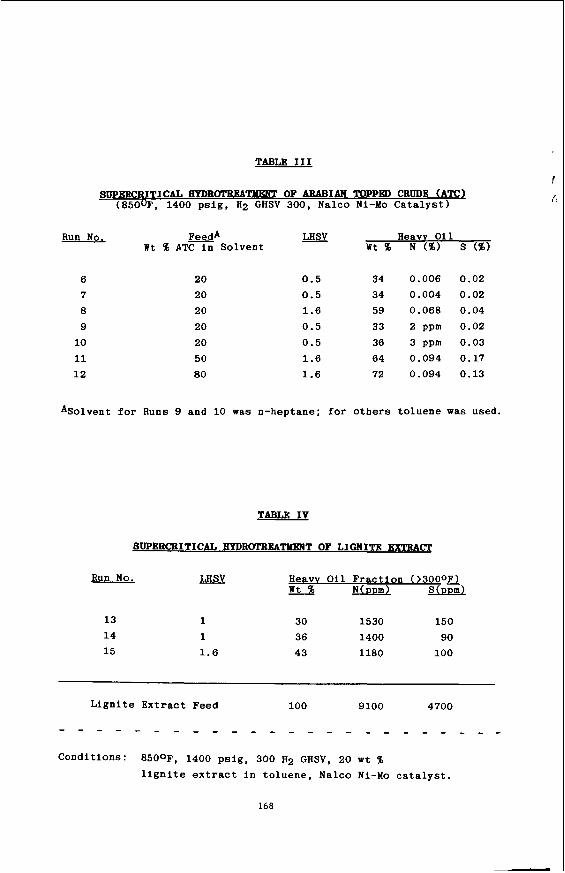
TABLE I11
SUPEBCRITICAL HYDROTRBAl" OF ARABIAN TOPPED CRUDE (ATc) (850oF, 1400 p s i g , H2 GHSV 300, Nalco NI-Mo C a t a l y s t )
LHSV Heavv O i l Run No. &&A - W t 46 ATC i n S o l v e n t W t 46 N (46) S (%)
6 7 8 9 10 11 12
20 20 20 20 20 50 80
0.5 34 0.006 0.02 0.5 34 0.004 0.02 1 . 6 59 0.068 0.04 0.5 33 2 pprn 0.02 0 . 5 36 3 ppm 0.03 1.6 64 0.094 0.17 1.6 72 0.094 0.13
A S o l v e n t for Runs 9 and 10 was n-heptane; for o t h e r s t o l u e n e w a s used.
TABLE IV
SUPEBCRITICAL HYDROTREATMENT OF LIGNITB EXTRACT
Run N o . - LHSV Heavv O i l F r a c t i o n (>30003 H c z No ShX!,!
13 14 15
1 1 1.6
30 1530 150 36 1400 90 43 1180 100
L i g n i t e E x t r a c t F e e d 100 9100 4700
C o n d i t i o n s : 8500F, 1400 p s i g , 300 A2 GHSV, 20 w t % l i g n i t e e x t r a c t i n t o l u e n e , Nalco NI-Mo c a t a l y s t .
168
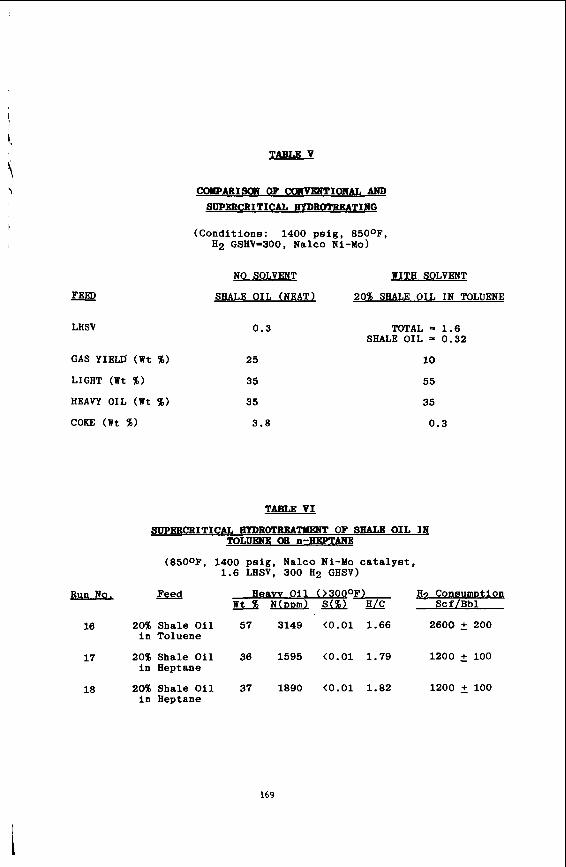
TABLE V
- FEED
LHSV
GAS YIEm' (Wt 46)
LIGHT (Wt 46)
HEAVY OIL (Wt $)
COKE ( W t 46)
coypAR1m OF f.xHmmTIar7AL Am SUPERCRITICAL EYDROTBgdTIlG
( C o n d i t i o n s : 1400 p s l g , 8500F, H 2 GSHV=300, Nalco N l - l o )
NO SOLVENT WITH SOLVENT
SHALE OIL (NEAT1 20% SHALE OIL I N TOLUENE
0.3
25
35
35
3.8
TOTAL = 1.6 SHALE OIL = 0.32
10
55
35
0.3
TABLE VI
SUPERCRITICAL HPDRUI'RBATHERT OF SEALB O I L IN TOLUEtTE OR n-HEPTANE
(8500F, 1400 p s l g , Nalco Ni-Mo c a t a l y s t , 1.6 LHSV, 300 H 2 G H S V )
Run N o , Heavv O i l 03000F) H 9 ConsumDtion
16 20% S h a l e O i l 57 3149 <0.01 1.66 2600 2 200
W t Sb N(DDm1 S c f / B b l
In Toluene
17 20% S h a l e O i l 36 1595 <0.01 1.79 1200 2 100
18 20% S h a l e Oil 37 1890 <0.01 1.82 1200 2 100
i n Heptane
In Heptane
169
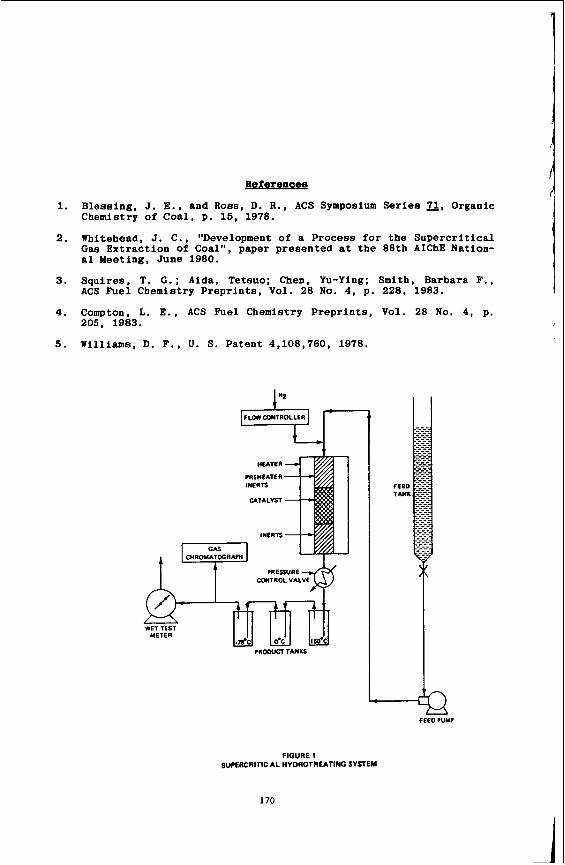
&&pnoes
1. Blessing, J. E., and Ross, D. R., ACS Symposium Series 71, Organic Chemistry of Coal. p. 15, 1978.
2. Whitehead, J. C., "Development of a Process for the Supercritical Gas Extraction of Coal", paper presented at the 88th AIChE Nation- al Meeting, June 1980.
3. Squires, T. G.; Aida, Tetsuo; Chen, Yu-Ying; Smith, Barbara F., ACS Fuel Chemistry Preprints, Vol. 28 No. 4, p. 228, 1983.
4. Compton. L. E., ACS Fuel Chemistry Preprints,
5. Williams, D. F., U. S. Patent 4,108,760, 1978.
205, 1983.
WET TEST METER
PROWCT TMKS
Vol. 28 No. 4, p.
-4 FEED PUMP
FIGURE 1 SUPERCRITIC AL HYDROTREATING SYSTEM
170
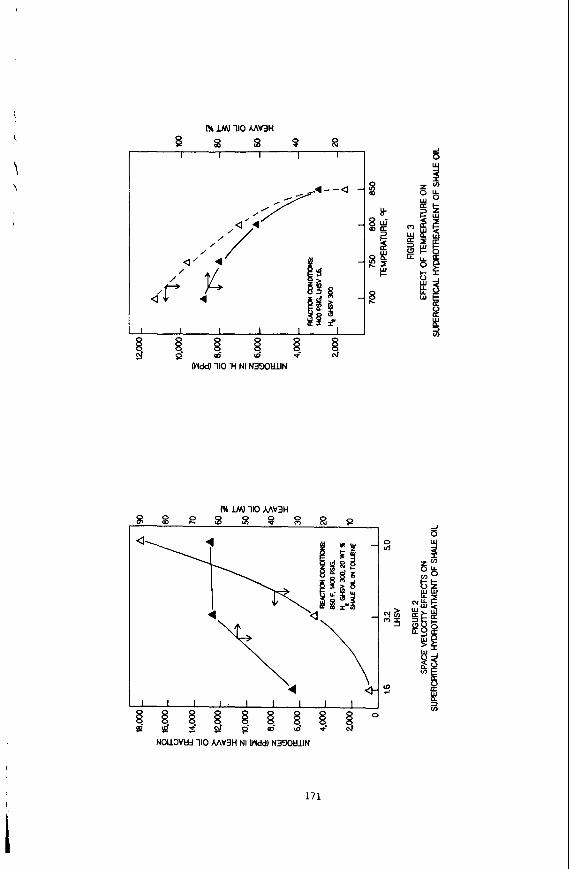
i o( IM) 110 M M H
8 3 s 9 a I I I I I
I
171
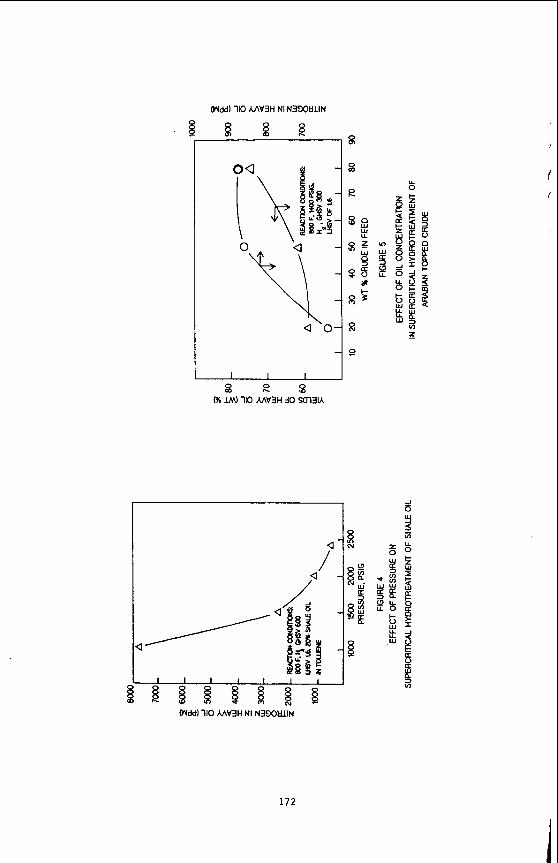
(Wdd1110 AAV3H NI N3WtJllN
8 8 8
O\ a 0
I I -J 0
(wdd) 110 M V 3 H NI N3SOtJllN
172
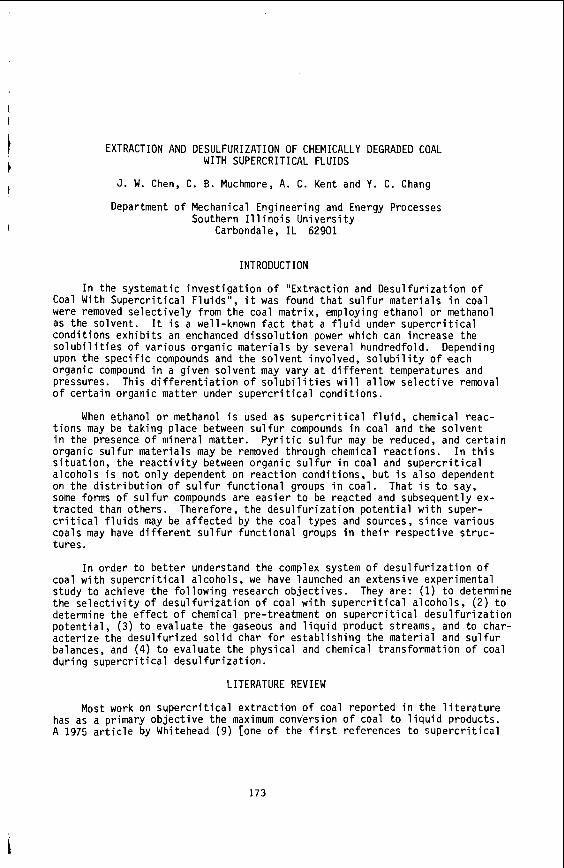
EXTRACTION AND DESULFURIZATION OF CHEMICALLY DEGRADED COAL WITH SUPERCRITICAL FLUIDS
J. W. Chen, C. 6. Muchmore, A. C. Kent and Y . C. Chang
Department o f Mechanical Engineering and Energy Processes Southern I 1 1 i n o i s U n i v e r s i t y
Carbondale, I L 62901
INTRODUCTION
I n the systematic i n v e s t i g a t i o n o f "Ex t rac t ion and D e s u l f u r i z a t i o n o f Coal With S u p e r c r i t i c a l F lu ids" , i t was found t h a t s u l f u r m a t e r i a l s i n coal were removed s e l e c t i v e l y from t h e coa l mat r i x , employing ethanol o r methanol as the so lvent . It i s a well-known f a c t t h a t a f l u i d under s u p e r c r i t i c a l cond i t ions e x h i b i t s an enchanced d i s s o l u t i o n power which can increase the so l ub i 1 i t i e s of var ious organic m a t e r i a l s by severa l hundredfold. Depending upon t h e s p e c i f i c compounds and t h e so lvent invo lved, s o l u b i l i t y o f each organic compound i n a g iven so lvent may vary a t d i f f e r e n t temperatures and pressures. This d i f f e r e n t i a t i o n o f s o l u b i l i t i e s w i l l a l l o w s e l e c t i v e removal of c e r t a i n organic mat te r under s u p e r c r i t i c a l cond i t ions .
When ethanol o r methanol i s used as s u p e r c r i t i c a l f l u i d , chemical reac- t i o n s may be t a k i n g p lace between s u l f u r compounds i n coal and the s o l v e n t i n the presence o f minera l mat ter . P y r i t i c s u l f u r may be reduced, and c e r t a i n organic s u l f u r mater ia ls may be removed through chemical reac t ions . I n t h i s s i t u a t i o n , the r e a c t i v i t y between organ ic s u l f u r i n coal and s u p e r c r i t i c a l a lcoho ls i s n o t o n l y dependent on r e a c t i o n cond i t ions , b u t i s a l s o dependent on the d i s t r i b u t i o n o f s u l f u r f u n c t i o n a l groups i n coal . That i s t o say, some forms o f s u l f u r compounds are e a s i e r t o be reacted and subsequently ex- t r a c t e d than others. Therefore, t h e d e s u l f u r i z a t i o n p o t e n t i a l w i t h super- c r i t i c a l f l u i d s may be a f f e c t e d by t h e coal types and sources, s ince var ious coa ls may have d i f f e r e n t s u l f u r f u n c t i o n a l groups i n t h e i r respec t ive s t r u c - tu res .
I n order t o b e t t e r understand t h e complex system o f d e s u l f u r i z a t i o n o f coa l w i t h s u p e r c r i t i c a l a lcoho ls , we have launched an extens ive experimental study t o achieve the f o l l o w i n g research ob jec t ives . They are : (1) t o determine the s e l e c t i v i t y o f d e s u l f u r i z a t i o n o f coal w i t h s u p e r c r i t i c a l a lcoho ls , (2) t o determine t h e e f f e c t o f chemical pre-treatment on s u p e r c r i t i c a l d e s u l f u r i z a t i o n p o t e n t i a l , (3) t o evaluate the gaseous and l i q u i d product streams, and t o char- a c t e r i z e t h e d e s u l f u r i z e d s o l i d char f o r e s t a b l i s h i n g the mater ia l and s u l f u r balances, and (4) t o evaluate t h e phys ica l and chemical t rans format ion o f coal dur ing s u p e r c r i t i c a l d e s u l f u r i z a t i o n .
LITERATURE REVIEW
Most work on s u p e r c r i t i c a l e x t r a c t i o n o f coal repor ted i n the l i t e r a t u r e has as a primary o b j e c t i v e t h e maximum conversion o f coal t o l i q u i d products. A 1975 a r t i c l e by Whitehead (9) [one o f the f i r s t re ferences t o s u p e r c r i t i c a l
173
coal e x t r a c t i o n presented i n t h e l i t e r a t u r e ] presented data on s u p e r c r i t i c a l e x t r a c t i o n o f coal by coal t a r o r petroleum naphtha f r a c t i o n s . Tugrul and
174
n e a r l y complete a f t e r 30 minutes; e x t r a c t y i e l d s o f about 24% were repor ted. Gas chromatography/mass spectrometry analyses o f severa l e x t r a c t f r a c t i o n s i n d i c a t e d dozens o f p a r a f f i n s , a1 k y l a t e d hydrocarbons, phenol ic and oxygenated compounds; however, no s u l f u r compounds were repor ted. A k i n e t i c s tudy o f a h i g h - v o l a t i l e b i tuminous coa l u t i l i z i n g s u p e r c r i t i c a l to luene was repor ted by Slomka and Rutkowski (7) . dependence o f e x t r a c t i o n y i e l d was found when a second order equat ion was used.
A c lose f i t o f t h e i r experimental d a t a on t i m e \
I occur ing dur ing s u p e r c r i t i c a l e x t r a c t i o n o f coal w i t h ethanol and a lka l i -e thano l i s supported by da ta g iven by Makabe and Ouchi (5, 6). s ion t h a t fo l lows w i l l i n d i c a t e , we have n o t found evidence t h a t t h i s occurs under t h e cond i t ions we employ f o r s u p e r c r i t i c a l d e s u l f u r i z a t i o n o f coal w i t h
EXPERIMENTAL
However, as t h e d iscus-
1 3 a1 coho1 s . l
I
Most of the i n v e s t i g a t i o n was performed i n two r e a c t o r systems. They are
175
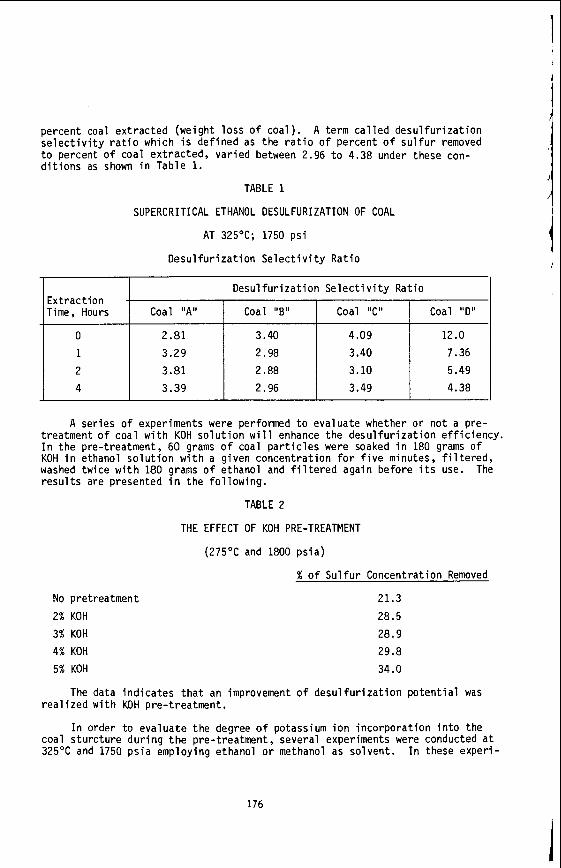
/ percent coal ex t rac ted (weight l oss of coa l ) . A term c a l l e d d e s u l f u r i z a t i o n s e l e c t i v i t y r a t i o which i s de f ined as the r a t i o o f percent o f s u l f u r removed t o percent o f coal ex t rac ted , var ied between 2.96 t o 4.38 under these con- d i t i o n s as shown i n Table 1.
I TABLE 1 1
SUPERCRITICAL ETHANOL DESULFURIZATION OF COAL
D e s u l f u r i z a t i o n S e l e c t i v i t y Rat io
E x t r a c t i o n - Time, Hours
0
1 2
4
D e s u l f u r i z a t i o n S e l e c t i v i t y Rat io
Coal "A" Coal "B" Coal "C" Coal "D"
2.81 3.40 4.09 12.0
3.29 2.98 3.40 7.36 3.81 2.88 3.10 5.49
3.39 2.96 3.49 4.38
A ser ies o f experiments were performed t o evaluate whether o r no t a pre- t reatment o f coal w i t h KOH s o l u t i o n w i l l enhance the d e s u l f u r i z a t i o n e f f i c i e n c y . I n the pre-treatment, 60 grams o f coal p a r t i c l e s were soaked i n 180 grams o f KOH i n ethanol s o l u t i o n w i t h a given concent ra t ion f o r f i v e minutes, f i l t e r e d , washed twice w i t h 180 grams o f ethanol and f i l t e r e d again before i t s use. The r e s u l t s are presented i n the f o l l o w i n g .
TABLE 2
THE EFFECT OF KOH PRE-TREATMENT
(275OC and 1800 p s i a )
% o f S u l f u r Concentrat ion Removed
No pretreatment
2% KOH
3% KOH 4% KOH 5% KOH
21.3
28.5
28.9
29.8
34.0
The data i n d i c a t e s t h a t an improvement o f d e s u l f u r i z a t i o n p o t e n t i a l was
I n order t o evaluate the degree o f potassium i o n i n c o r p o r a t i o n i n t o the
r e a l i z e d w i t h KOH pre-treatment.
coal s t u r c t u r e d u r i n g t h e pre-treatment , several experiments were conducted a t 325OC and 1750 ps ia employing ethanol o r methanol as so lvent . I n these exper i -
176
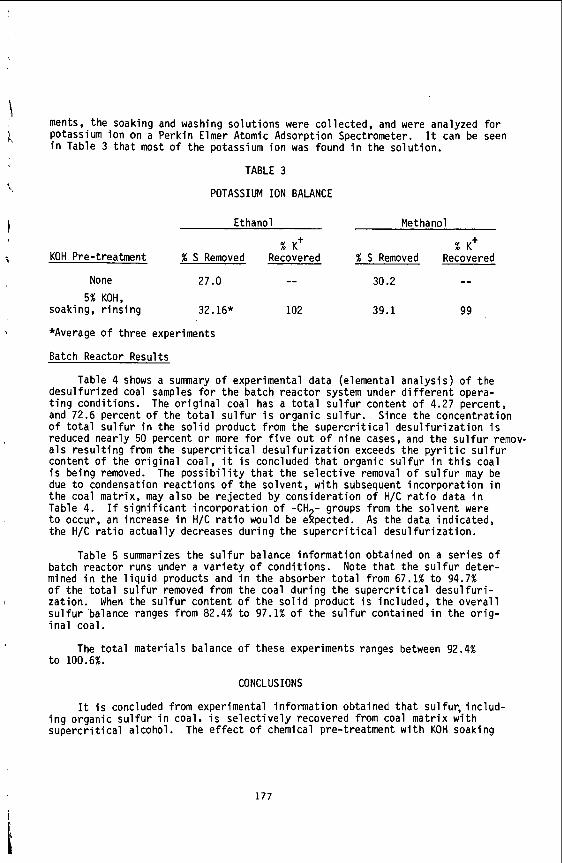
ments, the soaking and washing solutions were collected, and were analyzed for potassium ion on a Perkin Elmer Atomic Adsorption Spectrometer. in Table 3 that most of the potassium ion was found in the solution.
It can be seen
TABLE 3
POTASSIUM ION BALANCE
Et hano 1
% K+ KOH Pre-treatment % S Removed Recovered
None 27.0 -- 5% KOH,
soaking, rinsing 32.16* 102
*Average of three experiments
Batch Reactor Results
Methanol
% S Removed Recovered % K'
30.2 --
39.1 99
Table 4 shows a summary of experimental data (elemental analysis) of the desulfurized coal samples for the batch reactor system under different opera- ting conditions. The original coal has a total sulfur content of 4.27 percent, and 72.6 percent of the total sulfur is organic sulfur. Since the concentration of total sulfur in the solid product from the supercritical desulfurization is reduced nearly 50 percent or more for five out of nine cases, and the sulfur remov- als resulting from the supercritical desulfurization exceeds the pyritic sulfur content of the original coal, it is concluded that organic sulfur in this coal is being removed. The possibility that the selective removal of sulfur may be due to condensation reactions of the solvent, with subsequent incorporation in the coal matrix, may also be rejected by consideration of H/C ratio data in Table 4. to occur, an increase in H/C ratio would be egpected. As the data indicated, the H/C ratio actually decreases during the supercritical desulfurization.
Table 5 summarizes the sulfur balance information obtained on a series of batch reactor runs under a variety of conditions. Note that the sulfur deter- mined in the liquid products and in the absorber total from 67.1% to 94.7% of the total sulfur removed from the coal during the supercritical desulfuri- zation. When the sulfur content of the solid product is included, the overall sulfur balance ranges from 82.4% to 97.1% of the sulfur contained in the orig- inal coal.
The total materials balance of these experiments ranges between 92.4% to 100.6%.
If significant incorporation of -CH - groups from the solvent were
CONCLUSIONS
It is concluded from experimental information obtained that sulfur, includ- ing organic sulfur in coal, is selectively recovered from coal matrix with supercritical alcohol. The effect of chemical pre-treatment with KOH soaking
177
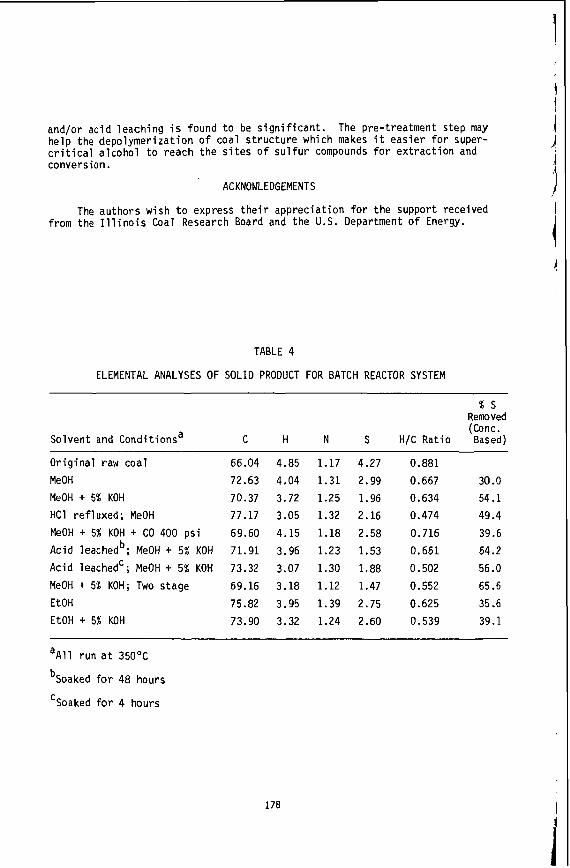
and/or ac id leach ing i s found t o be s i g n i f i c a n t . The pre- t reatment step may he lp the depolymer izat ion o f coal s t r u c t u r e which makes i t eas ie r f o r super- c r i t i c a l a l c o h o l t o reach t h e s i t e s o f s u l f u r compounds f o r e x t r a c t i o n and conversion.
ACKNOWLEDGEMENTS
The au thors wish t o express t h e i r apprec ia t ion f o r t h e support received from the I l l i n o i s Coal Research Board and the U.S. Department o f Energy.
TABLE 4
ELEMENTAL ANALYSES OF SOLID PRODUCT FOR BATCH REACTOR SYSTEM
% S Removed (Conc.
Solvent and Condi t ionsa C H N S H/C Rat io Based)
O r i g i n a l raw coa l
MeOH
MeOH + 5% KOH
HC1 ref luxed; MeOH
MeOH + 5% KOH + CO 400 p s i
Ac id leachedb; MeOH + 5% KOH
Acid leachedc; MeOH + 5% KOH MeOH + 5% KOH; Two stage
E t O H E t O H + 5% KOH
66.04 72.63 70.37 77.17 69.60 71.91 73.32 69.16 75.82 73.90
4.85 1.17 4.27 4.04 1.31 2.99 3.72 1.25 1.96 3.05 1.32 2.16 4.15 1.18 2.58 3.96 1.23 1.53 3.07 1.30 1.88 3.18 1.12 1.47 3.95 1.39 2.75 3.32 1.24 2.60
0.881 0.667 0.634 0.474 0.716 0.661 0.502 0.552 0.625 0.539
30.0 54.1 49.4 39.6 64.2 56 .O
65.6 35.6 39.1
a A l l run a t 350°C
bSoaked f o r 48 hours
‘Soaked f o r 4 hours
178
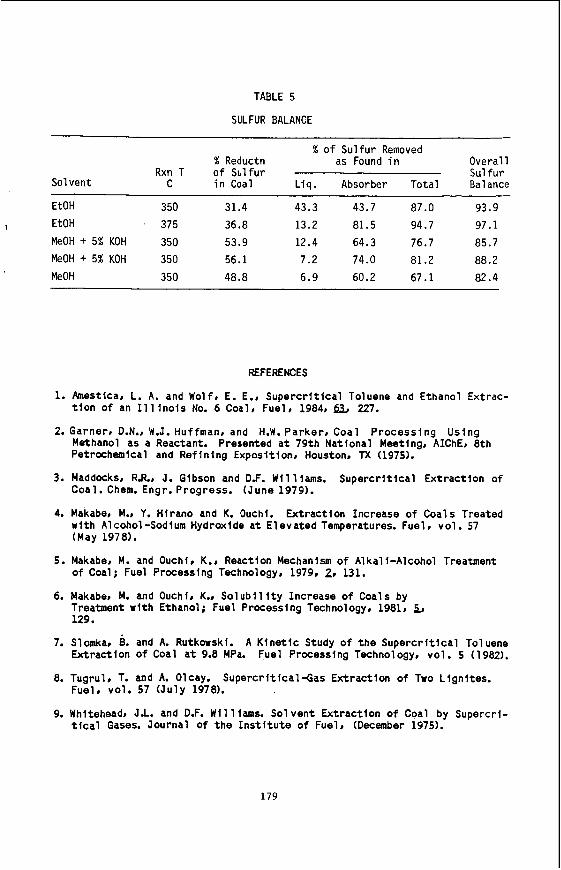
TABLE 5
SULFUR BALANCE
% of Sulfur Removed % Reductn as Found i n Overall
Rxn T of Sulfur Sulfur Solvent C in Coal Liq. Absorber Total Balance
~ ~~ ~~
E t O H 350 31.4 43.3 43.7 87.0 93.9 1 E t O H 375 36.8 13.2 81.5 94.7 97.1
MeOH + 5% KOH 350 53.9 12.4 64.3 76.7 85.7 MeOH + 5% KOH 350 56.1 7.2 74.0 81.2 88.2
MeOH 350 48.8 6.9 60.2 67.1 82.4
REFERENCES
1. Amestica, L. A. and Wolf, E. E., Supercr i t ica l Toluene and Ethanol Extrac-
2. Garner, D.N., W.J. Huffman, and H.W. P a r k e r , Coal P r o c e s s i n g Using
t i o n of an I l l ino is No. 6 Coal, Fuel, 1984, & 227.
Methanol a s a Reactant. Presented a t 79th National Meeting, AIChE, 8 t h Petrochemical and Refining Exposition, Houston. TX (1975).
3. Haddocksr RR., J. Gibson and D.F. Williams. Supercr i t ica l Extraction of Coal. Chem. Engr. Progress . ( J u n e 1979).
4. Makabe, M., Y. Hirano and K. Ouchl. Extraction Increase of Coals Treated with Alcohol -Sodium Hydroxide a t Elevated Temperatures. F u e l , vol . 57 (May 1978).
5. Makabe, M. and O u c h i , K., Reaction Mechanism of Alkali-Alcohol Treatment of Coal; Fuel Processing Technology, 1979, 2, 131.
6. Makabe, M. and Ouch l r K.r S o l u b i l i t y Increase of Coals by Treatment with Ethanol; Fuel Processing Technology, 1981, 5 129.
7. Slomka, 6. and A. Rutkowski. A Kinetic Study of t h e Supercr i t ica l Toluene Extraction of Coal a t 9.8 MPa. Fuel Processing Technology, vol . 5 (1982).
Fuel, vol. 57 ( J u l y 1978). 8. Tugrulr T. and A. Olcay.
9. Whitehead, J.L. and D.F. Will lams. Sol vent Extraction of Coal by Supercri-
Supercrltlcal-Gas Extraction of Two Lignites.
t i c a l Gases. Journal of t h e I n s t i t u t e of Fuel, (December 1975).
179
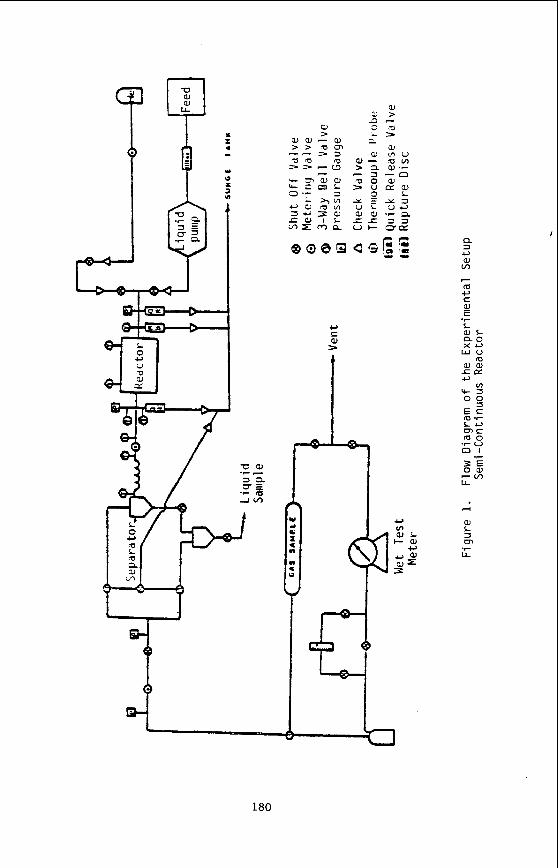
U
(1 3 c, aJ m r- fu c, S aJ E L aJL P O X c , w v
4 ala, c c z
.r
aJ L 2 0,
L L .r
180
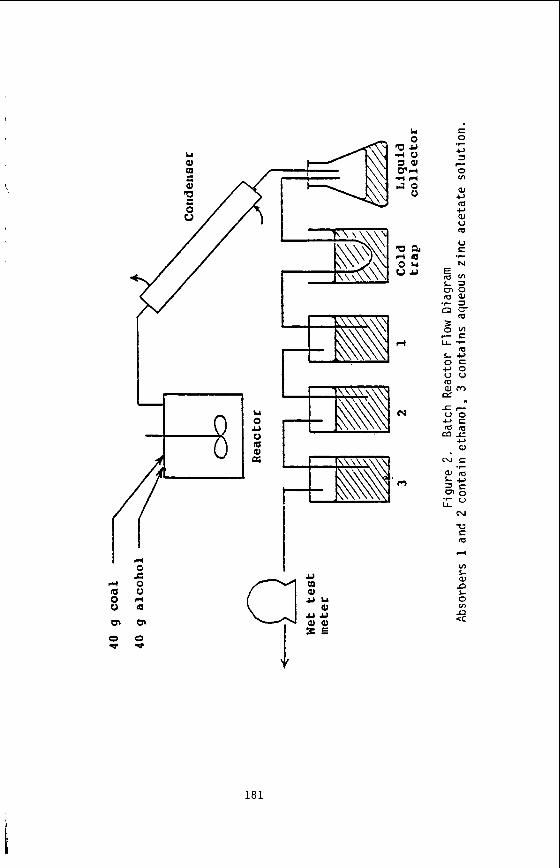
N
U S a 4
v) L aJ L 0 v) 13 cc
n
181
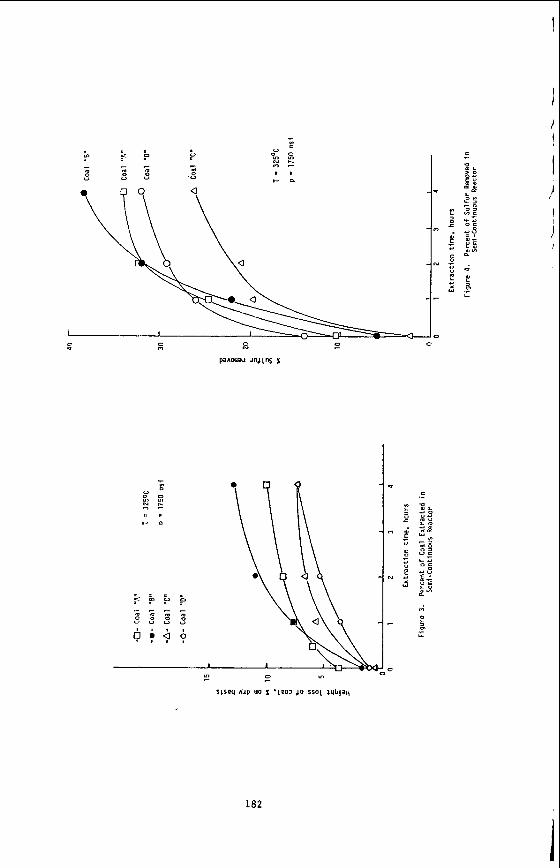
182
MECHANISM OF SOLUTE RETENTION I N SIJPERCRITICAL FLUID CHROMATOGRAPHY
C. R. Yonker, S. L. Frye, H. R. Udseth, R . W. Wright, and R. D. Smith
Chemical Methods and K i n e t i c s Sect ion, P a c i f i c Northwest Lahoratory, (Operated by B a t t e l l e Memorial I n s t i t u t e ) , Richland, Washington 99352
I n t r o d u c t i o n
Retent ion i n s u p e r c r i t i c a l f l u i d chromatography (SFC) i s determined by s o l u t e s o l u b i l i t y i n t h e f l u i d and s o l u t e i n t e r a c t i o n w i t h the s t a t i o n a r y phase. func t iona l r e l a t i o n s h i p between r e t e n t i o n and pressure a t constant temperature has been described by Van Wasen and Schneider (1). The t r e n d i n r e t e n t i o n i s shown t o depend on the p a r t i a l molar volume o f t h e s o l u t e i n t h e mobi le and s t a t i o n a r y phase coupled w i t h the isothermal c o m p r e s s i b i l i t y o f t h e f l u i d mobi le phase.
The
The s o l u b i l i t y o f the s o l u t e i n a f l u i d has been discussed by Git terman and Procaccia (2 ) and s o l u t e s o l u b i l i t y has been descr ibed over the e n t i r e reg ion o f pressures o f i n t e r e s t . The combination o f s o l u t e s o l u b i l i t y i n a f l u i d w i t h t h e equat ion f o r r e t e n t i o n as a f u n c t i o n o f pressure d e r i v e d hy Van Clasen and Schneider al lows one t o determine the e f f e c t o f s o l u b i l i t y on s o l u t e r e t e n t i o n .
The purpose o f t h i s work was t o determine the r e l a t i o n s h i p hetween s o l u b i l i t y and re ten t ion . A thermodynamic model was developed which p r e d i c t s t h e t r e n d i n r e t e n t i o n as a func t ion o f pressure, g iven the s o l u h i l i t y o f t h e s o l u t e i n t h e f l u i d mobi le phase. From t h i s model, s o l u t e r e t e n t i o n behavior can he examined by theory and experiment i n order t o gain some i n s i g h t i n t o the compl icated &?pen- dence o f r e t e n t i o n on t h e thermodynamic and phys ica l p r o p e r t i e s o f t h e s o l u t e and the f l u i d , p r o v i d i n g a bas is f o r c o n s i d e r a t i o n o f more subt le e f f e c t s unique t o SFC.
Theory
I n SFC, the basic assumption o f i n f i n i t e l y d i l u t e s o l u t i o n s o f t h e s o l u t e i n the mobi le and s t a t i o n a r y phases i s v a l i d . The concent ra t ion o f t h e s o l u t e i n these phases r e s p e c t i v e l y i s C i = Xj/V,, where X i i s t h e mole f r a c t i o n o f so l - u t e ( i ) and V, i s the molar volume o f t h e pure mobi le o r s t a t i o n a r y phase (1). So lu te r e t e n t i o n i s c a l c u l a t e d from a dimensionless r e t e n t i o n f a c t o r , k, where,
k = (Cistat/Cimob) . (vstat f V 1 1)
Cistat and Cimob are the concent ra t ion o f s o l u t e ( i ) i n t h e s t a t i o n a r y and mobi le phases respec t ive ly , VStat and VMob a re the volumes o f the s t a t i o n a r y and mobi le phase. S u b s t i t u t i n g f o r concent ra t ion i n t o equat ion 1,
k = (Xistat/Ximob) (Vm mob/vmstat) . (vstat,Vmob 1 2 )
Taking the na tura l logar i thm o f both s ides o f equat ion 2 one ob ta ins ,
1 moh " s t a t s t a t ,,"oh i n k = an (Xistat/Ximob) + an (Vm l V m 3 )
183
A t equ i l ib r ium, t h e s o l u t e chemical p o t e n t i a l i n t h e r e s p e c t i v e phases piStat = pimob (3). Therefore,
s t g t s t a t = mob = ’i pi pi + RT anxistat = pingb + RT an ximob
are equal
4 )
where pim i s t h e chosen standard s t a t e o f i n f i n i t e d i l u t i o n o f s o l u t e ( i ) i n t h e two phases. Rearranging equat ion 4,
S u b s t i t u t i n g equat ion 5 i n t o 3,
i n k = (pi - pi ) / RT + an ( V m 1 6 ) mgb s t a t
An assumption can be made t h a t the second t e n on the r igh t -hand s ide (RHS) o f equat ion 6 i s independent o f pressure except f o r V,”Ob, the molar volume o f t h e f l u i d mobile phase. There fore d i f f e r e n t i a t i o n o f equat ion 6 w i t h respect t o pres- sure a t constant tenpera ture y i e l d s ,
The p a r t i a l molar volume o f a s o l u t e i s de f ined as (api/aP)T !3) and on rearrang- i n g t h e second term on t h e RHS of equat ion 7 one ob ta ins t h e iso thermal compressi- b i l i t y o f the f l u i d n o b i l e phase (4) . Thus on s u b s t i t u t i o n equat ion 7 reduces to,
mgb s t g t (aEnk/aP)T = I / R T [pi - vi 1 - K
where iimo’ and VistaH a re the p a r t i a l molar volume o f the s o l u t e ( i ) i n t h e mob i le and s t a t i o n a r y phases a t i n f i n i t e d i l u t i o n r e s p e c t i v e l y and K i s t h e i s o - thermal c o m p r e s s i b i l i t y o f t h e f l u i d m o b i l e phase. Equat ion 8 i s the same as obtained by Van Wasen and Schneider (1) i n t h e i r d e r i v a t i o n o f the t rend i n reten- t i o n as a f u n c t i o n o f pressure f o r SFC.
Gi t terman and Procaccia ( 2 ) . The reg ion o f i n t e r e s t chromatographical ly w i l l be f o r i n f i n i t e l y d i l u t e s o l u t i o n s whose concent ra t ion i s f a r removed from t h e lower c r i t i c a l end p o i n t (LCEP) o f t h e s o l u t i o n . i n a s u p e r c r i t i c a l f l u i d a t i n f i n i t e d i l u t i o n can be approximated as,
The s o l u b i l i t y o f a s o l i d i n a s u p e r c r i t i c a l f l u i d has been descr ibed by
Therefore t h e s o l u b i l i t y o f t h e s o l u t e
184
I
where V s i s the molar volume o f t h e pure s o l i d so lu te . equat ion 2.5 i n Git terman and Procaccia ( 2 ) , d e s c r i h i n g s o l u t e ' o & B i l i t y f o r d i l u t e s o l u t i o n s f a r from c r i t i c a l i t y .
This i s the same as
S o l v i n g equat ion 9 f o r V i . mgb
vi = - R T (arn ximob/ap)T + v s 10)
\
Equation 10 can be s u b s t i t u t e d i n t o equat ion 8 and upon rearrangement,
Equation 11 should be the r e l a t i o n s h i p between r e t e n t i o n - s o l u b i l i t y and pressure a t constant temperature f o r i n f i n i t e l y d i l u t e so lu t ions . The RHS o f equat ion 11 cons is ts o f t h r e e terms, the f i r s t term w i l l be a constant whose value depends on the p a r t i a l molar volume o f the s o l u t e i n the s t a t i o n a r y phase. The second term can be determined exper imenta l l y from bulk s o l u b i l i t y measurements o f the s o l u t e i n the s u p e r c r i t i c a l f l u i d mobi le phase. The l a s t term, the so lvent isothermal compress ib i l i t y , can be reasonably p r e d i c t e d from a two-parameter, cubic equat ion o f s t a t e (EOS) such as the Redlich-Kwong EOS o r t h e Peng-Robinson €OS (5,6).
The f l u i d mobi le phases isothermal c o m p r e s s i b i l i t y was determined us ing t h e Redlich-Kwong EOS t o eva lua te the d e r i v a t i v e (a Vmmob/aP)T i n equat ion 12,
From the Redlich-Kwong EOS,
m mob T0.5 (b2 - (V$ob)2) (avmmob/aP)T = 13 1
P T Oe5(3 (Vmmob)' - b2) - RT3'2 (2Vmmob t b) + a
where R i s t h e gas constant, P i s pressure, and T i s temperature i n K. The con- s t a n t s a and b o f the Redlich-Kwong EOS are,
a = 0.4278 R2 T:'5/Pc 14a)
b = 0.0867 RTc/Pc 14b)
where P c and Tc are t h e c r i t i c a l pressure and temperature o f t h e f l u i d . volume o f the f l u i d was determined by t h e Peng-Robinson EOS, thus a l l o w i n g one t o so lve f o r the isothermal c o m p r e s s i b i l i t y o f t h e f l u i d .
Therefore from equat ion 11, the t r e n d i n r e t e n t i o n as a f u n c t i o n of pressure a t constant temperature can be determined and i t i s r e l a t e d t o the s o l u h i l i t y o f the s o l u t e i n the s u p e r c r i t i c a l f l u i d , t h e iso thermal c o m p r e s s i b i l i t y of the so l - vent and the p a r t i a l molar volume o f the s o l u t e i n the s t a t i o n a r y phase a t i n f i - n i t e d i l u t i o n .
The molar
185
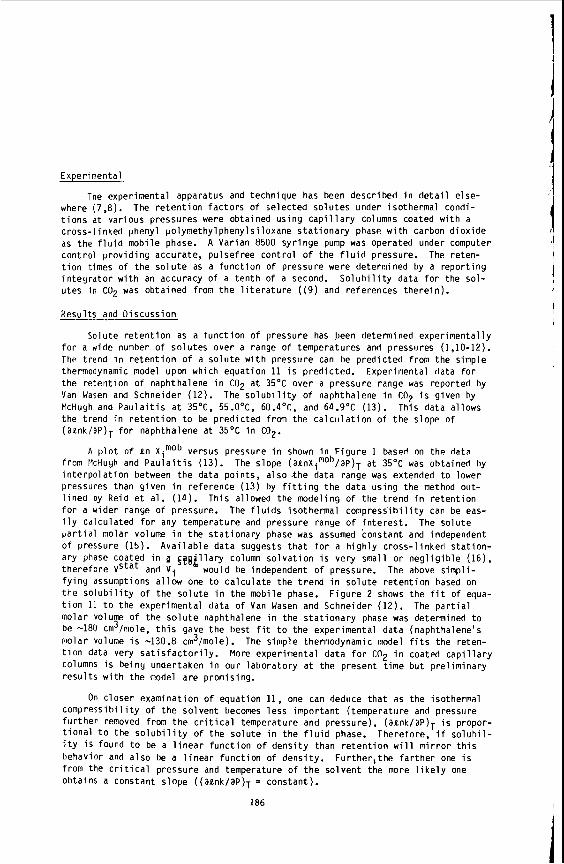
Experimental
where (7 ,8 ) . The r e t e n t i o n f a c t o r s o f se lec ted so lu tes under isothermal condi- t i o n s a t var ious pressures were obtained us ing c a p i l l a r y columns coated w i t h a cross-1 inked phenyl polymethylphenylsiloxane s t a t i o n a r y phase w i t h carbon d i o x i d e as the f l u i d mob i le phase. c o n t r o l providin(; accurate, pu lse f ree c o n t r o l o f the f l u i d pressure. The reten- t i o n times of t h e s o l u t e as a f u n c t i o n o f pressure were determined by a r e p o r t i n g i n t e g r a t o r w i t h an accuracy o f a t e n t h o f a second. S o l u b i l i t y data f o r the so l - u tes i n C02 was ob ta ined from t h e l i t e r a t u r e ( ( 9 ) and references t h e r e i n ) .
Resul ts and D iscuss ion
The exper imental apparatus and technique has been descr ibed i n d e t a i l e lse-
A Varian 8500 s y r i n g e pump was operated under computer
Solute r e t e n t i o n as a f u n c t i o n o f pressure has been determined exper imenta l l y f o r a wide number o f s o l u t e s over a range o f temperatures and pressures (1,10-12). The t rend i n r e t e n t i o n o f a s o l u t e w i t h pressure can be p r e d i c t e d from the simple thermodynamic model upon which equat ion 11 i s p red ic ted . Experimental data f o r the r e t e n t i o n o f naphthalene i n C02 a t 35'C over a pressure range was reported hy Van Wasen and Schneider (12). The s o l u b i l i t y o f naphthalene i n Cn2 i s g iven hy McHuyh and P a u l a i t i s a t 35'C, 55.0°C, 60.4'C, and 64.9"C (13). This data al lows the trend i n r e t e n t i o n t o be p r e d i c t e d frm the c a l c u l a t i o n o f t h e s lope o f (aank/aP)T f o r naphthalene a t 35OC i n C02.
from PlcHugh and P a u l a i t i s (13). i n t e r p o l a t i o n between t h e data po in ts , a l s o t h e data range was extended t o lower pressures than y iven i n re fe rence (13) by f i t t i n g t h e data us ing the method out- l i n e d by Reid e t a l . (14). Th is allowed the m d e l i n g o f the t r e n d i n r e t e n t i o n f o r a wider range o f pressure. The f l u i d s isothermal c o m p r e s s i b i l i t y can be eas- i l y ca lcu la ted f o r any temperature and pressure ranye o f i n t e r e s t . p a r t i a l n o l a r volume i n the s t a t i o n a r y phase was assumed cons tan t and independent of pressure (15). A v a i l a b l e da ta suggests t h a t f o r a h i g h l y c ross- l inked s t a t i o n - ary phase coated i n p #iRfllary column s o l v a t i o n i s very small o r n e g l i g i b l e (16) , there fore VStat and V i The above s imp l i - f y i n g assumptions a l l o w one t o c a l c u l a t e the t r e n d i n s o l u t e r e t e n t i o n based on the s o l u b i l i t y o f the s o l u t e i n the mobi le phase. F i g u r e 2 shows the f i t o f equa- t i o n 11 t o the exper imental data o f Van Wasen and Schneider ( 1 2 ) . molar volume o f the s o l u t e naphthalene i n the s t a t i o n a r y phase was determined t o be -180 cm3/nole, t h i s gave the hest f i t t o the exper imental data (naphthalene's n o l a r volume i s -130.8 cm3/mole). The simple thermodynamic model f i t s the reten- t i o n data very s a t i s f a c t o r i l y . columns i s being undertaken i n our labora tory a t the present t i m e bu t p r e l i m i n a r y r e s u l t s w i t h t h e model a re promising.
A p l o t o f a n Ximob versus pressure i n shown i n F i g u r e 1 based on the data The slope (aPnXimob/aP)T a t 35OC was obtained hy
The s o l u t e
would be independent o f pressure.
The p a r t i a l
More exper imental da ta f o r C02 i n coated c a p i l l a r y
On c loser examinat ion o f equat ion 11, one can deduce t h a t as the isothermal c o m p r e s s i b i l i t y o f t h e so lvent becomes l e s s impor tan t ( temperature and pressure f l i r t h e r removed f r o n t h e c r i t i c a l temperature and pressure) , (aank/aP)T i s propor- t i o n a l t o the s o l u b i l i t y o f the s o l u t e i n the f l u i d phase. Therefore, i f s o l u h i l - i t y i s found t o be a l i n e a r f u n c t i o n o f d e n s i t y than r e t e n t i o n w i l l m i r r o r t h i s behavior and a l s o be a l i n e a r f u n c t i o n o f dens i ty . from the c r i t i c a l pressure and temperature o f t h e so lvent the more l i k e l y one obtains a constant s lope ((aank/aP)T = constant) .
Fur ther , the f a r t h e r one i s
186 ' I
Conclusion
The simple thermodyanamic r e l a t i o n s h i p developed i n t h i s work has been shown t o adequately descr ibe the fea tu res o f s o l u t e r e t e n t i o n as a func t i on o f pressure a t constant temperature f o r s u p e r c r i t i c a l f l u i d chromatography. The importance o f t h i s model i s the r e l a t i o n s h i p drawn between s o l u t e s o l u h i l i t y i n the f l u i d mobi le phase t o the t rend i n s o l u t e re ten t i on . The t rend i n so lu te r e t e n t i o n i s demon- s t r a t e d t o be dependent on isothermal compress ib i l i t y , s o l u b i l i t y i n t h e f l u i d and f h p t a g r t i a l molar volume o f t h e s o l u t e i n t h e s t a t i o n a r y phase. The dependence o f V i on pressure i s being examined and w i l l be discussed i n a f u t u r e work. This chanye and f u r t h e r experimental i n v e s t i g a t i o n s over t h e re levan t ranges o f tem- pe ra tu re and pressure are i n progress and w i l l serve t o guide f u t u r e experimental and t h e o r e t i c a l developments.
Acknowledyments
The authors acknowledge the f i n a n c i a l support o f the U.S. Department o f Eneryy, O f f i c e o f Basic Energy Science, under Contract DE-AC06-764LO 1830.
References
Van Wasen, U.; Schneider, G. M., Chromatographia, (1975). 8, 274.
Gitterman, M.; Procaccia, I . , J . Chem. Phys., (1983), 78, 2648.
K lo te , 1. M.; Rosenberg, R. M., "Chemical Thermodynamics," 3 rd Ed. W. A. Benjamin, Inc. (1972).
Van Ness, H. C.; Abbott, Y. M., "C lass i ca l Thermodynamics o f Mon E l e c t r o l y t e Solut ions w i t h App l i ca t i ons t o Phase E q u i l i b r i a , " McGraw-Hill Rook Company (1982).
Redlich, 0.; Kwony, J . N. S., Chem Rev., (1949). 44, 233.
Peny, D. Y.; Robinson, D. R., Ind. Eny. Chem. Fundam., (1976), 15,59.
Wriyht, B. W.; Smith, R. D., Chromatographia, (1984), 18, 542.
Smith, R. O., Ka l i nosk i , H. T., Udseth, H. R.; Wright, B. LJ., Anal. Chem., (1984), 56, 2476.
P a u l a i t i s , M. E., Krukonis, V. J . , Kurnik , R. T.; Reid, R. C., Rev. Chem. Eny., (19831, 1, 179.
(10) Sie, S. T.; R i j nde rs , G. W. A., Sep. Sci., (1967), 2, 729.
(11) Semonian, B. P.; Rogers, L. B., J. Chromatogr. Sci., (197R), 16, 49.
(12) Van Wasen, U.; Schneider, G. M., J. Phys. Chem., (1980). 84, 229.
(13) McHugh, M.; P a u l a i t i s , M. E., J . Chem. Eng. nata,, (1980), 25, 326.
(14) Reid, R. C., Kurnik, R. T.; Hol la , S. J., J . Chem. Eng. Data, (1981), 26, 47. 187
( 1 5 ) Wicar, S.; Novak, J. , J . Chromatogr., (1974), 95, 1.
(16) McHugti, M.; P r i v a t e communication.
3-
2-
- c 1 -
0-
Y
-1
- 2 -
-3 80 120 160 200 240 280 Atrn
0 , , / -
Figure 1. Plot of In X mob against pressure in atmospheres dt 3 5 O C . 5 5 O C . and 60.4OC. Data fran McHugh and Paulaitis (13).
5 0
4t O
Pressure (atrn) 0
Figure 2. Experimental data for naphthalene with CO (ref. 12) a t 3 5 O C and theoret?cal model ( so l id l ine).
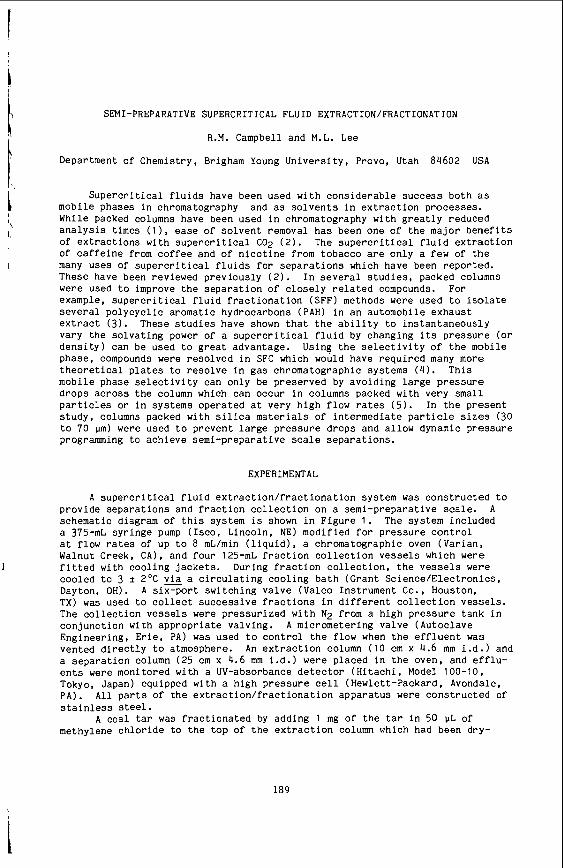
ij SEMI-PREPARATIVE SUPERCRITICAL FLUID EXTRACTION/FRACTIONATION
Department of Chemistry, Brigham Young University, Provo, Utah 84602 USA
Supercritical fluids have been used with considerable success both as mobile phases in chromatography and as solvents in extraction processes.
R.M. Campbell and M.L. Lee
EXPERIMENTAL
A supercritical fluid extraction/fractionation system was constructed to provide separations and fraction collection on a semi-preparative scale. A schematic diagram of this system is shown in Figure 1. The system included a 375-mL syringe pump (Isco, Lincoln, NE) modified for pressure control at flow rates of up to 8 mL/min (liquid), a chromatographic oven (Varian. Walnut Creek, CA), and four 125-mL fraction collection vessels which were
cooled to 3 f 2OC Dayton, OH). A six-port switching valve (Valco Instrument Co., Houston, TX) was used to collect successive fractions in different collection vessels. The collection vessels were pressurized with N2 from a high pressure tank in conjunction with appropriate valving. A micrometering valve (Autoclave Engineering, Erie, PA) was used to control the flow when the effluent was vented directly to atmosphere. a separation column (25 em x 4.6 mm i.d.) were placed in the oven, and efflu- ents were monitored with a UV-absorbance detector (Hitachi, Model 100-10, Tokyo, Japan) equipped with a high pressure cell (Hewlett-Packard. Avondale, PA). ~ i i parts of the extraction/fractionation apparatus were constructed of stainless steel.
A coal tar was fractionated by adding 1 mg of the tar in 50 UL of methylene chloride to the top of the extraction column which had been dry-
I fitted with cooling jackets. During fraction collection, the vessels were a circulating cooling bath (Grant Science/Electronics,
An extraction column (10 em x 4.6 mm i.d.) and
189
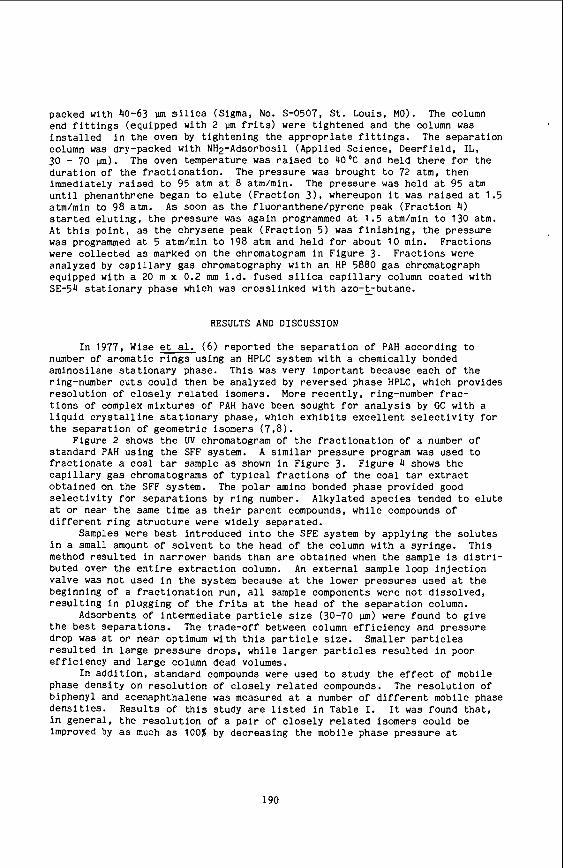
packed with 40-63 !.un s i l i c a (Sigma, No. S-0507. S t . Louis, M O ) . The column end f i t t i n g s (equipped with 2 wn f r i t s ) were t igh tened and the column was i n s t a l l e d i n t h e oven by t i gh ten ing the appropr i a t e f i t t i n g s . The sepa ra t ion column was dry-packed w i t h NH2-Adsorbosil (Applied Science, Deer f ie ld , I L , 30 - 70 m ) . du ra t ion o f t h e f r a c t i o n a t i o n . The p re s su re was brought t o 72 atm, then immediately r a i s e d t o 95 atm at 8 atmlmin. u n t i l phenanthrene began t o e l u t e (F rac t ion 3 ) , whereupon it was r a i s e d a t 1.5 atm/min t o 98 atm. A s soon as t h e f luoranthene/pyrene peak (F rac t ion 4) s t a r t e d e l u t i n g , t h e p re s su re was aga in programmed a t 1.5 atm/min t o 130 atm. A t t h i s po in t , a s t h e chrysene peak ( F r a c t i o n 5 ) was f i n i s h i n g , t h e p re s su re was programmed at 5 atmlmin to 198 atm and he ld f o r about 10 min. Frac t ions were co l l ec t ed as marked on t h e chromatogram i n F igure 3. F rac t ions were analyzed by c a p i l l a r y gas chromatography w i t h an HP 5880 gas chromatograph equipped with a 20 m x 0.2 mm i .d. fused s i l i c a c a p i l l a r y column coated with SE-54 s t a t i o n a r y phase which was c ross l inked w i t h azo-t-butane.
The oven temperature was r a i s e d t o 4 O o C and he ld t h e r e f o r t he
The p res su re was h e l d a t 95 atm
RESULTS AND DISCUSSION
In 1977, Wise e t al. ( 6 ) r epor t ed the sepa ra t ion of PAH according t o number of a romat ic r i n g s us ing an HPLC system w i t h a chemically bonded aminosilane s t a t i o n a r y phase. This was very important because each of t h e ring-number cuts could then be analyzed by reversed phase HPLC, which provides r e s o l u t i o n of c l o s e l y r e l a t e d isomers. More r e c e n t l y , ring-number f r a c - t i o n s of complex mixtures of PAH have been sought f o r a n a l y s i s by CC w i t h a l i q u i d c r y s t a l l i n e s t a t i o n a r y phase, which e x h i b i t s e x c e l l e n t s e l e c t i v i t y f o r t h e sepa ra t ion of geometr ic isomers ( 7 , 8 ) .
Figure 2 shows t h e UV chromatogram of t h e f r a c t i o n a t i o n of a number of s t anda rd PAH using t h e SFF system. A similar p res su re program was used t o f r a c t i o n a t e a c o a l tar sample as shown i n F igure 3. F igure 4 shows t h e c a p i l l a r y g a s chromatograms of t y p i c a l f r a c t i o n s of the coa l tar e x t r a c t ob ta ined on t h e SFF system. The p o l a r amino bonded phase provided good s e l e c t i v i t y f o r s e p a r a t i o n s by r i n g number. Alkylated spec ie s tended t o e l u t e a t or near t h e same t ime as t h e i r paren t compounds, whi le compounds of d i f f e r e n t r i n g s t r u c t u r e were widely separa ted .
i n a Small amount of s o l v e n t t o t h e head o f t h e column wi th a syr inge . This method r e s u l t e d i n narrower bands than are obta ined when t h e sample is d i s t r i - buted over t h e e n t i r e e x t r a c t i o n column. An e x t e r n a l sample loop i n j e c t i o n va lve was n o t used i n t h e system because a t t h e lower p re s su res used a t the beginning o f a f r a c t i o n a t i o n run , a l l sample components were n o t d i s so lved , r e s u l t i n g i n plugging o f the f r i t s a t the head of the sepa ra t ion column.
Adsorbents of i n t e rmed ia t e p a r t i c l e s i z e (30-70 !.un) were found t o g ive t h e best sepa ra t ions . The trade-off between column e f f i c i e n c y and pressure drop was a t or near optimum with t h i s p a r t i c l e S ize . r e s u l t e d i n l a r g e p r e s s u r e drops , while l a r g e r p a r t i c l e s r e s u l t e d i n poor e f f i c i ency and l a r g e column dead volumes.
I n a d d i t i o n , s t anda rd compounds were used to s tudy t h e e f f e c t of mobile phase dens i ty on r e s o l u t i o n of c lose ly r e l a t e d compounds. The r e s o l u t i o n of biphenyl and acenaphthalene was measured at a number of d i f f e r e n t mobile phase d e n s i t i e s . Resul t s of t h i s study a r e l i s t e d i n Table I. I t was found tha t , i n genera l , t h e r e s o l u t i o n of a p a i r of c l o s e l y r e l a t e d isomers could be improved by a8 much as 100% by decreas ing the mobile phase p re s su re a t
Samples were b e s t introduced i n t o t h e SFE system by applying t h e s o l u t e s
Smaller p a r t i c l e s
190
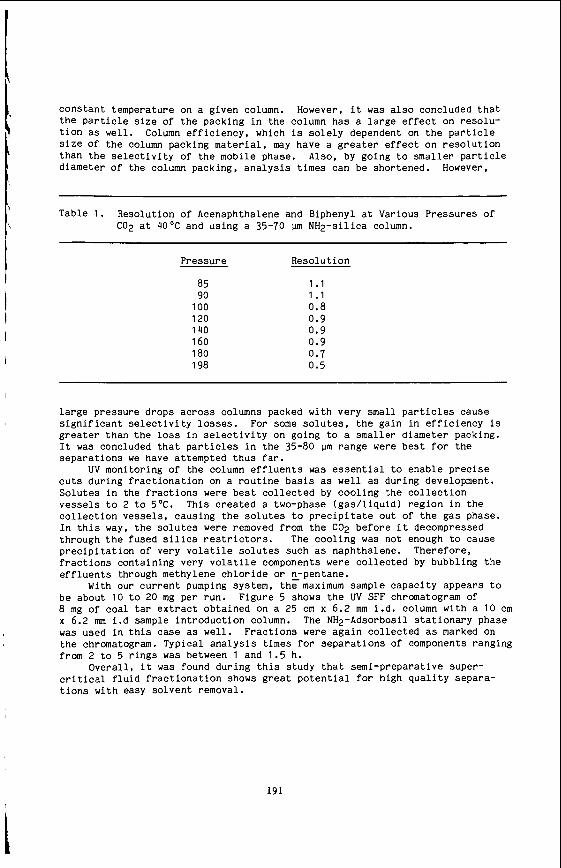
I'
size Of the column packing material, may have a greater effect on resolution than the selectivity of the mobile phase. Also, by going to smaller particle <
4 diameter of the column packing, analysis times can be shortened. However,
Pres sur e
85 90
100 120 140 160 180 198
Resolution
1.1 1.1 0.8 0.9 0.9 0.9 0.7 0.5
large pressure drops across columns packed with very small particles cause significant selectivity losses. For some solutes, the gain in efficiency is greater than the loss in selectivity on going to a smaller diameter packing. It was concluded that particles in the 35-80 pm range were best for the separations we have attempted thus far.
cuts during fractionation on a routine basis as well as during development. Solutes in the fractions were best collected by cooling the collection vessels to 2 to 5°C. This created a two-phase (gas/liquid) region in the collection vessels, causing the solutes to precipitate out of the gas phase. In this way, the solutes were removed from the C02 before it decompressed through the fused silica restrictors. The cooling was not enough to cause precipitation of very volatile solutes such as naphthalene. Therefore, fractions containing very volatile components were collected by bubbling the effluents through methylene chloride or 1-pentane.
With our current pumping system, the maximum sample capacity appears to be about 10 to 20 mg per run. Figure 5 shows the UV SFF chromatogram of 8 mg of coal tar extract obtained on a 25 cm x 6.2 mm i.d. column with a 10 cm x 6.2 mm i.d sample introduction column. The NH2-Adsorbosil stationary phase was used in this case as well. Fractions were again collected as marked on the chromatogram. Typical analysis times for separations of components ranging from 2 to 5 rings was between 1 and 1.5 h.
Overall, it was found during this study that semi-preparative super- critical fluid fractionation shows great potential for high quality separa- tions with easy solvent removal.
UV monitoring of the column effluents was essential to enable precise
191
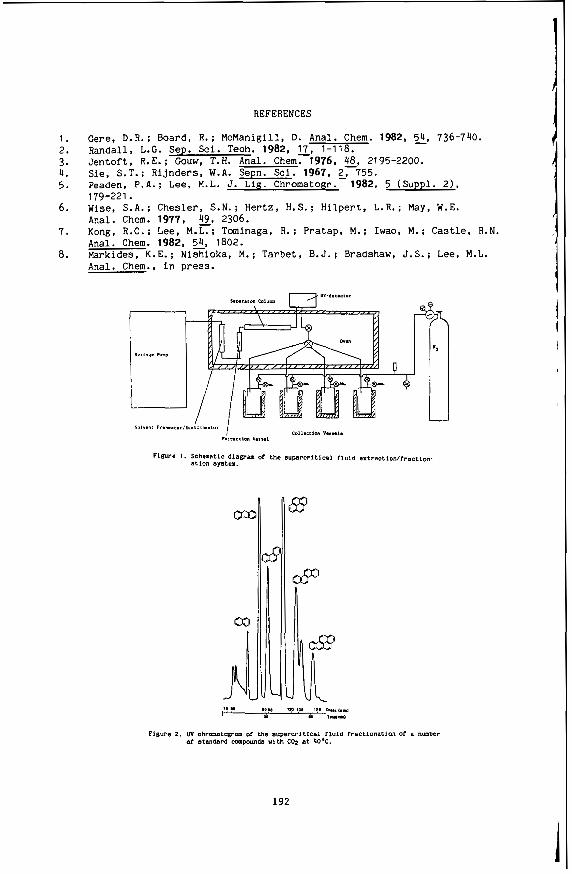
REFERENCES
1 . Cere, D . R . : Board, R.; McManigill, D. Anal. Chem. 1982, 54, 736-7110. 2. Randall, L.C. Sep. Sci. Tech. 1982. x, 1-118. 3. Jen to f t , R.E. : Gouw, T.H. Anal. Chem. 1976, 48, 2195-2200. 4. Sie , S.T.; R i jnde r s , W.A. Sepn. Sc i . 1967, 2, 755. 5. Peaden, P . A . : Lee, M.L. J. Lig. Chromatogr. 1982, 5 (Suppl. Z ) ,
179-221. 6. Wise, S.A.: Ches le r , S.N.: Her tz , H.S.; H i l p e r t , L . R . ; May, W.E.
Anal. Chem. 1977, 49, 2306. 7. Kong, R.C. : Lee, M.C: Tominaga, R. : Pra tap , M . ; Iwao, M. : Castle, R . N .
Anal. Chem. 1982, 2, 1802. 8. Markides. K.E.; Nishioka, M.; Tarbe t , B.J . : Bradshaw, J.S.; Lee, M.L.
Anal . Chem., i n p ress .
ay:
I 192
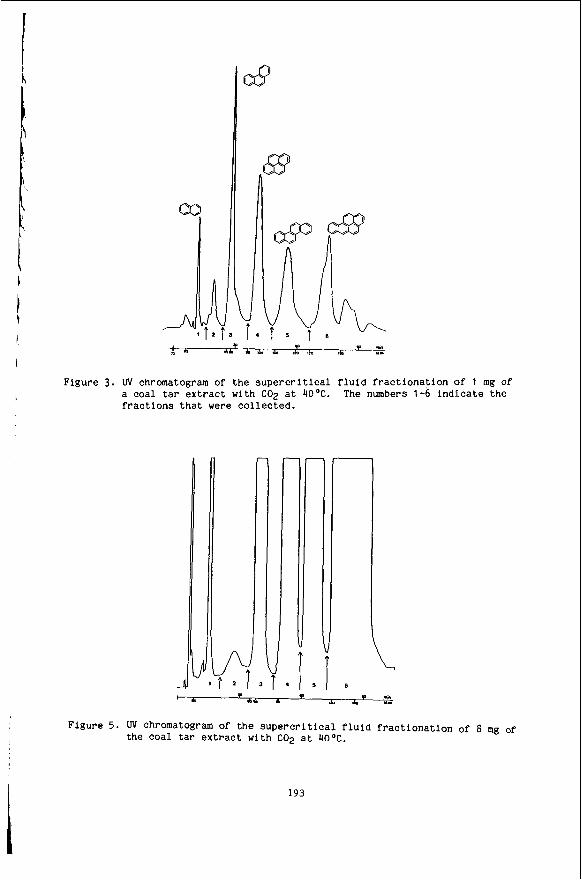
I
I
Figure 3.
03 I
".7
110
W chromatogram of the supercritical fluid fractionation of 1 mg of a coal tar extract with COP at 4OOC. The numbers 1-6 indicate the fractions that were collected.
J ' I 6
Figure 5. W chromatogram of the supercritical fluid fractionation of 8 mg of the coal tar extract with C02 at 4OoC.
193
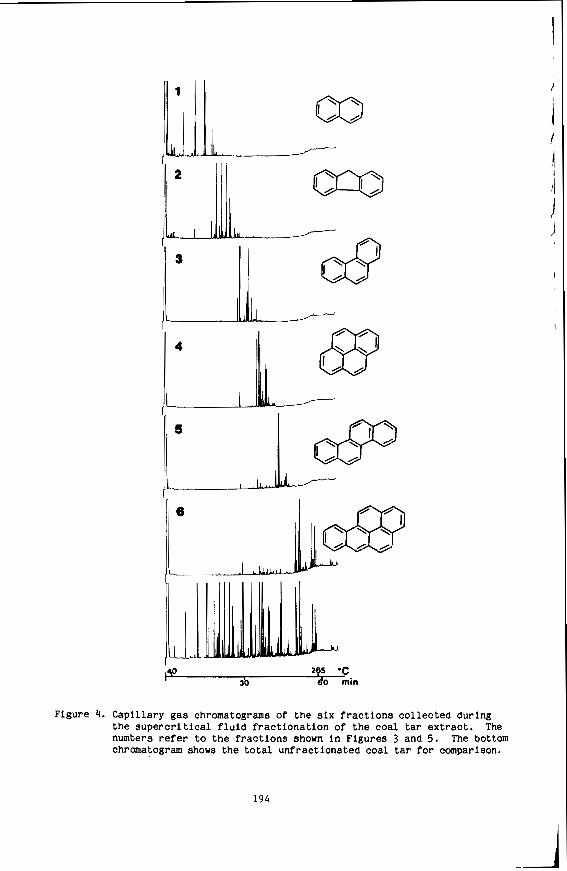
L
0
P 295 'C 3b BO min
Figure 4. Capillary gas chromatograms of the six fractions collected during the supercritical fluid fractionation of the coal tar extract. The numbers refer to the fractions shown in Figures 3 and 5. chromatogram shows the total unfractionated coal tar for comparison.
The bottom
194
i
\
S u p e r c r i t i c a l Carbon Diox ide E x t r a c t i o n of Lemon O i l
Steven J. Coppella and Paul Barton*
Department o f Chemtcal Engineer lng The Pennsylvania S ta te U n i v e r s i t y
Un ive rs t t y Park, PA 16802
I n 1983-1984, Arizona and C a l i f o r n i a produced annua l l y over 106 kg o f cold-pressed lemon o i l . A f t e r being concentrated by d i s t i l l a t i o n o r l i q u i d ex t rac t i on , lemon 011 i s used as f l a v o r i n g and/or f ragrance agent i n beverages and cosmetics. D i s t i l l a t t o n thermal ly degrades lemon o i l . E x t r a c t i o n w l t h organic solvents on l y p a r t l a l l y reduces thermal degradat ion ( s i n c e the so lvents must be recovered by d i s t i l l a t i o n ) and in t roduces so l ven t contamination. E x t r a c t i o n w l t h nonfermentative s u p e r c r i t i c a l carbon d iox ide near i t s c r i t i c a l p o i n t (304.3 K. 7.38 MPa, 0.467 g/cma) o f f e r s a cheap, nontox ic so l ven t t h a t does n o t impar t f l a v o r s nor thermal ly degrade the product. I t can handle feedstocks w i t h h igh wax content because these cons t i t uen ts can be so lub t l t zed i n s u p e r c r i t i c a l carbon d iox lde. S u p e r c r i t i c a l e x t r a c t i o n i s a hyb r id u n i t ope ra t i on i n the domaln between e x t r a c t i v e d l s t l l l a t i o n and l i q u i d ex t rac t i on . Solvent recovery I s accomplished by depressur izat ion a t ambient temperature.
Processes f o r s u p e r c r i t i c a l e x t r a c t i o n o f o i l s have been described i n numerous l i t e r a t u r e references. Several recent ones a re P a u l a l t i s e t a l . (1983). E l y and Baker (1983). Gerard (1984). Stahl e t a l . (1984). and Robey and Sunder (1984). The l i t e r a t u r e lacks d e t a i l e d data on multicomponent e s s e n t i a l o i l s w i t h s u p e r c r i t i c a l solvents i n the p r o x i m i t y o f the so lvent c r i t i c a l temperature. Accurate p r e d i c t l o n o f data i n t h i s reg ion by equations o f s t a t e i s l i m i t e d t o b ina ry and te rna ry sys terns.
The purpose o f our research Is t h ree fo ld : evaluate the f e a s i b t l t t y o f s u p e r c r t t t c a l carbon d iox ide e x t r a c t i o n o f lemon o i l near ambient temperature. generate e q u i l i b r i u m data w i t h carbon d iox ide and multicomponent essen t ia l o i l const i tuents , and evaluate the a b i l i t y o f the Peng-Robinson equat ion of s t a t e t o model a reduced multicomponent s u p e r c r i t i c a l system.
CONCENTRATING LEMON OIL
Starosc ik and Wilson (1982) have quan t i t a ted var ious lemon o i l s and I d e n t i f i e d 38 compounds. These compounds can be subdivided i n t o th ree major c l a s s l f t c a t i o n s : terpenes ( C ~ O hydrocarbons), oxy ' s (oxygenated C s - C i r hydrocarbons), and sesquiterpenes ( C I S hydrocarbons). A usual goal i n concen t ra t i ng lemon o i l Is t o remove the terpenes and sesquiterpenes f rom t h e des i red oxy f r a c t i o n .
When concentrat ing the lemon o i l by mu l t i s tage f r a c t i o n a l d i s t i l l a t i o n under vacuum, column o p e r a b t l i t y coupled w i t h condenser pressure, column pressure drop, r e b o i l e r design, and mode o f operat ion (batch o r continuous) d i c t a t e the degree o f thermal exposure. Overhead temperatures increase i n the range o f 320 t o 340 K. r e b o i l e r temperatures increase i n the range o f 330 t o 370 K . and exposure times o f 15 to 20 hours may be expected dur ing batch d i s t i l l a t i o n . I n continuous d i s t i l l a t i o n , exposure times a re lower bu t r e b o i l e r temperature may be h igher .
I n e x t r a c t i v e d t s t i l l a t i o n w i t h s u p e r c r l t t c a l so lvent , v o l a t t l i t y amp l t f t ca t ton by the so lvent r a t h e r than vacuum I s used t o g e t t h e components i n t o the e x t r a c t o r vapor phase. Operating temperature can be made lower than i n conventional distillation, and the hear t -cut product w i l l have been subjected t o l ess thermal degradation. Carbon d i o x l d e has a c r i t i c a l temperature t h a t meets t h t s goal.
195
I n order t o make data c o r r e l a t l o n t r a c t a b l e I n s u p e r c r l t l c a l carbon d lox lde extraction, I t l s convenlent t o represent each major chemlcal c l a s s l f l c a t l o n by a s l n g l e compound. Each se lec t compound should have a v a l l a b l e good vapor pressure d a t a and should be a predominant c o n s t l t u e n t I n t t s group w l t h regard t o s t r u c t u r e and concentrat lon. For c o r r e l a t l o n purposes, we se lec ted llmonene. geran la l . and E-caryophyllene. Their s t ruc tu res a re shown I n F lgure 1.
Stah l e t a l . (1984) presented s o l u b l l l t y data f o r llmonene and caryophyl lene w l t h carbon dioxide; Gerard (1984) Inc luded carvone. Temperatures I n the range o f 279 t o 377 K, and pressures I n the range o f 1 .5 t o 11 MPa were covered. Robey and Sunder (1984) provlded s o l u b l l l t y and r e l a t l v e v o l a t t l l t y da ta f o r carbon d lox lde w i t h fo lded lemon 011 and w l t h llmonene and c l t r a l ( g e r a n l a l / n e r a l ) a t 323 t o 353 K and 9.4 t o 10.6 MPa.
Gerard (1984) descr lbes a cont lnuous m u l t l s t a g e Column process f o r carbon d lox lde ex t rac t ton ( d l s t l l l a t l o n ) o f essen t la l 011s a t amblent temperature and 8 MPa. w l t h s o l v e n t recovery a t 273 K and 3 MPa. Robey and Sunder (1984) propose a lemon o l l f r a c t l o n a t o r operated a t 333 K and 10 MPa wlth an e f f l c l e n c y equ lva len t t o 12 stages, wlth so lvent recovery a t 293 K and 5.5 MPa.
EXPERIMENTAL SECTION
Cold-pressed 011 from Arlzona e a r l y deser t lemons was suppl led by A. M. Todd Company, Kalamazoo. MI. Degassed lemon 011 and d r y carbon d lox lde were charged I n t o the o n e - l t t e r Isothermal cons tan t volume c e l l shown t n F lgure 2. A f t e r the opera t lng temperature was reached, the system was s t l r r e d f o r one hour, then allowed t o s e t t l e f o r 15 mlnutes be fore sampllng. Experlmehts were performed a t 303 t o 313 K and 4 t o 9 MPa. P a r a l l e l phase v l s u a l l z a t l o n experlments were conducted l n a s l g h t gauge t o Insu re opera t ion I n the two-phase reglon.
A sample of t h e e q u l l l b r a t e d l l q u l d phase was removed ( a f t e r purglng) by d e p r e s s u r l r a t l o n through a va lve and hypodermlc tub lng I n t o a two-stage t r a p cooled by d ry I c e - acetone. A wet t e s t meter measured the carbon d l o x l d e of f -gas. A sample of t he vapor phase was then s l m l l a r l y removed. Purge and sample s lzes were kep t small t o mlnlmlze d ls tu rbance o f equ l l l b r l um. Pressure changes I n the c e l l were 0-0.1 MPa du r lng sampllng o f l l q u l d phase and 0-1.2 MPa du r lng sampllng o f vapor phase. Speclal h lgh-pressure sample valves w l t h m l c r o l l t e r - s l z e d t raps were t r l e d I n an e f f o r t t o reduce pressure dlsturbance. b u t r e l l a b l l l t y was Inadequate.
Estlmated r e l a t i v e e r ro rs a re 0.2% f o r temperature, 5% f o r pressure, 4% f o r carbon d l o x l d e mole f r a c t i o n I n t h e l l q u l d phase, and 10% f o r lemon o l l mole f r a c t l o n I n the vapor phase.
The recovered lemon 011 samples were analyzed by gas chromatography. A 0.5 mn 1.d. x 30 m t h l n f l l m (0.1 m) SE-30 g lass c a p l l l a r y column (Supelco, Inc.. Be l le fon te . PA) was used utth a flame l o n l z a t l o n d e t e c t o r I n a F M 810 chromatograph. The u n l t was f l t t e d w i t h a temperature p r o g r a m e r (FM S c l e n t l f l c Model 240), g lass- l ined I n l e t s p l t t t e r (JW Sc len t l c , Inc . ) , and I n t e g r a t o r (Hewlett-Packard Model 33708). NO reference column was used. The f o l l o w l n g c o n d l t l o n s were employed: 27 cm/s He c a r r l e r gas; 250 cmVmIn a l r . 40 cma/mln Np. and 55 cms/mln H2 t o de tec tor ; 0.4 p l
sample slze. 27/1 s p l l t r a t l o ; temperature program 348 K ho ld 8 mlnutes. 4 K/mln. 473 K ho ld 15 mlnutes; l n j e c t l o n p o r t temperature 523 K; de tec tor temperature 523 K; a t t e n u a t l o n X l , range 102; s lope s e n s l t l v l t y 0.01 mV/mln; manual base l ine rese t ; c h a r t speed 1.3 cm/mln. Basel lne d r i f t was 0.02 mV/125 K. Peak areas from the I n t e g r a t o r were w l t h l n 5% o f those determlned by c u t t l n g and welghlng t h e peaks.
196
Peak l d e n t l f l c a t l o n was based on In fo rma t lon o f Supelco, Inc., A. M . Todd Company, and Starosc lk and Wllson (1982). S ta rosc l k (1984) prov lded us u l t h the response Values used I n h i s work and we assumed t h a t our de tec to r would g l v e p ropor t l ona te response. Starosc lk found I n h l s work t h a t r e l a t l v e standard dev la t l ons were genera l ly less than 3%.
-- RESULTS
Lemon o i l -carbon d lox lde e q u l l l b r l u m was measured a t 303, 308, and 313 K and I n the Pressure range of 4 t o 9 HPa. Below 6 MPa. the re was l n s u f f l c l e n t lemon o i l I n the vapor phase t o a t t a l n good samples f o r ana lys l s . Above 9.0 HPa a t 313 K, above 7.8 RPa a t 308 K, and above 7.4 HPa a t 303 K, t he system reve r ted t o a s l n g l e phase. Nlne experlments prov lded two-phase, vapor - l l qu ld e q u l l l b r l u m data s u l t a b l e f o r co r re la t i ons and generat ing c o e f f l c l e n t s f o r t he Peng-Robinson equatlon. Deta l led experlmental data can be found I n Coppella (1985).
The r e s u l t s o f an experlment a t 308 K and 6.98 HPa a r e d e t a l l e d here. The l l q u i d phase contalned 48 ut% (74 mole X ) carbon d l o x l d e and the vapor phase conta lned 99.5 ut% (99.8 mole %) carbon d lox lde. A gas chromatogram f o r the lemon 011 from the l l q u l d phase sample l s shown I n F igure 3. A chromatogram f o r t he lemon 011 I n the vapor phase I s shown i n F lgure 4. Peak I d e n t l f l c a t l o n . re ten t l on . response value, and concentrat lon f o r these t races are g lven I n Table I . Average molecular welght o f lemon 011 I s 137.9 I n l l q u l d and 136.4 I n vapor.
The r e l a t l v e v o l a t l l l t y I n the presence o f carbon d lox lde , o r s e l e c t i v l t y f a c t o r , f o r each component w l t h respect t o llmonene I s a l s o g iven I n Table I. Rela t l ve v o l a t l l l t y I s def lned as the r a t l o o f e q u i l l b r l u m vapor l za t l on K f o r component I t o e q u l l l b r l u m vapor l za t l on K f o r llmonene. E q u l l l b r l u m vapor l za t l on Ki I s def lned as mole f r a c t l o n 1 I n the vapor ( e x t r a c t ) phase t o mole f r a c t l o n 1 l n the l l q u l d ( r a f f l n a t e ) phase.
By comparlng the r e l a t l v e v o l a t l l l t l e s o f var ious components, t he ease o f separat lon between these components can be determlned. The chromatographic column employed separates components I n the order o f v o l a t l l l t y ; thus, the f i r s t c u t p o l n t I n the separat lon should be between te rp lno lene and adjacent oxygenated compounds. The chromatograph doesn't separate te rp lno lene from l l n a l o o l o r nonanal. so the s e p a r a b l l l t y o f these compounds cou ldn ' t be determlned. The nex t ad jacent separat lon lnvo lves te rp lno lene w l t h a r e l a t l v e v o l a t l l l t y w l t h respec t t o llmonene of 0.7 and c l t r o n e l l a l w l t h a r e l a t l v e v o l a t l l l t y w l t h 'respect t o llmonene o f 0.4. The r e l a t l v e v o l a t l l l t y o f t e rp lno lene t o c i t r o n e l l a l i s then 0.7/0.4 o r 2. For the l lmonene/geranlal pa l r . the r e l a t l v e v o l a t l l l t y I s 1.0/0.2 o r 5. These separat lon f a c t o r s f o r t he terpene-oxy s p l l t a re adequate.
The second c u t p o l n t I n the separat lon I s between geranylacetate and 8-caryophyllene. Thls separat lon f a c t o r I s 0.06/0.07. o r 0.9. Thls I s opposl te t h a t o f 0.2/0.07 o r 3 f o r ge ran la l t o 8-caryophyl lene.
There I s some over lap I n the v o l a t l l l t l e s o f CIZ oxys and sesqulterpenes. uh l ch means t h a t f o r ex t rac t l ons o f lemon 011 w l t h s u p e r c r l t l c a l carbon d lox lde , some 0-caryophyl lene w l l l be ex t rac ted I n t o the hear t -cut oxy product . Thls I s t h e r e s u l t of t he nonpolar carbon d lox lde p r e f e r e n t l a l l y e x t r a c t l n g the l ess p o l a r o f t h e lemon 011 cons t l t uen ts .
SOLUBILITY AND SELECTIVITY
S o l u b l l l t y dlagrams were prepared f o r the phases t h a t separated I n t h e lemon 011 extractions performed l n t h l s study w l t h carbon d lox lde. Such dlagrams can serve
197
t
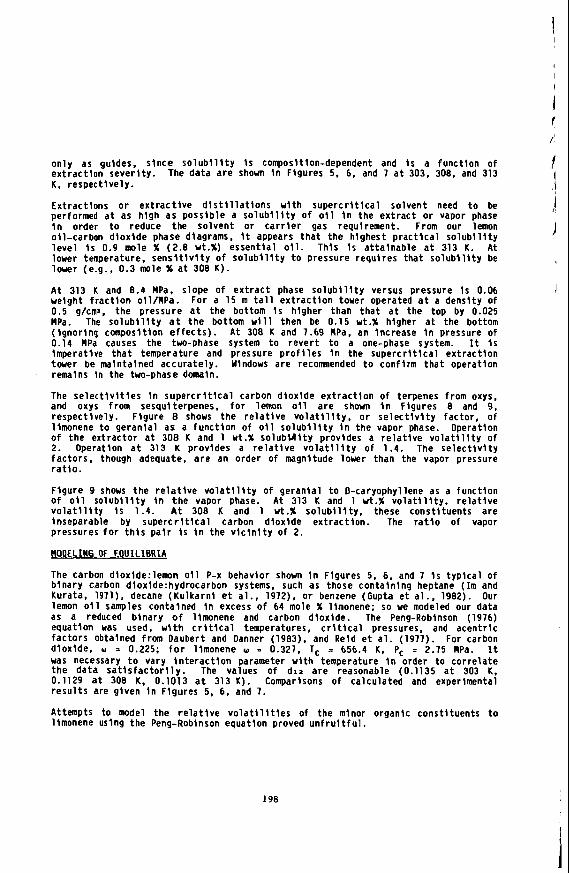
on ly as guldes. s l n c e s o l u b l l l t y I s composltlon-dependent and I s a func t l on of e x t r a c t i o n seve r l t y . The d a t a a r e shown l n Flgures 5. 6. and 7 a t 303. 308. and 313 K, respec t lve ly .
Ex t rac t ions o r e x t r a c t l v e d l s t l l l a t l o n s w l t h s u p e r c r l t l c a l so lvent need t o be performed a t as h lgh a s p o s s l b l e a s o l u b l l l t y o f o i l I n the e x t r a c t o r vapor phase I n order t o reduce the so lvent or c a r r l e r gas requlrement. From our lemon 011-carbon d l o x l d e phase dlagrams, I t appears t h a t t h e h lghes t p r a c t l c a l s o l u b l l l t y l e v e l I s 0.9 mole % (2.8 ut.%) essen t la l 011. Thls I s a t ta lnab le a t 313 K. A t lower temperature, s e n s l t l v l t y of s o l u b t l l t y t o pressure requ l res t h a t s o l u b t l l t y be lower (e.g., 0.3 mole % a t 308 K ) .
A t 313 K and 8.4 HPa. s lope of e x t r a c t phase s o l u b l l l t y versus pressure I s 0.06 welght f r a c t l o n oll/MPa. For a 1 5 m t a l l e x t r a c t l o n tower operated a t a dens l ty o f 0.5 g/cw. the pressure a t t h e bottom I s h lgher than t h a t a t t he top by 0.025 MPa. The s o l u b l l l t y a t t h e bottom w l l l then be 0.15 ut.% hlgher a l the bottom ( l gno r lng c o n p o s l t l o n e f f e c t s ) . A t 308 K and 7.69 MPa, an Increase I n pressure of 0.14 HPa causes the two-phase system t o r e v e r t t o a one-phase system. I t i s lmperat lve t h a t temperature and pressure p r o f i l e s I n the s u p e r c r l t l c a l ex t rac t l on tower be malntalned accura te ly . Wlndows a re recomnended t o conf l rm t h a t opera t lon remalns I n the two-phase domaln.
The s e l e c t l v l t l e s I n s u p e r c r l t l c a l carbon d l o x l d e e x t r a c t l o n o f terpenes from oxys. and oxys f rom sesqutterpenes. f o r lemon 011 a re shown t n Flgures 8 and 9, respec t lve ly . F igure 8 shows t h e r e l a t l v e v o l a t l l l t y . o r s e l e c t l v l t y f ac to r , o f l lmonene t o ge ran la l as a f u n c t l o n o f 011 s o l u b l l l t y I n t h e vapor phase. Operatlon o f t h e ex t rac to r a t 308 K and 1 ut.% s o l u b U l t y provldes a r e l a t l v e v o l a t l l l t y o f 2. Operatlon a t 313 K p rov ldes a r e l a t l v e v o l a t l l l t y o f 1.4. The s e l e c t l v l t y f ac to rs , though adequate, are an order o f m g n l t u d e lower than the vapor pressure r a t l o .
F i g u r e 9 shows t h e r e l a t l v e v o l a t l l l t y o f ge ran la l t o 8-caryophyllene as a func t l on Of 011 s o l u b l l l t y I n t h e vapor phase. A t 313 K and 1 ut.% v o l a t l l l t y . r e l a t l v e v o l a t l l l t y l s 1.4. A t 308 K and 1 ut.% s o l u b l l l t y . these cons t l t uen ts a re Inseparable by s u p e r c r l t l c a l carbon d l o x l d e ex t rac t l on . The r a t l o o f vapor pressures f o r t h l s p a l r l s l n the v l c l n l t y o f 2.
MODELING OF EQUILIBRIA
The carbon dlox1de:lemon o i l P-x behavlor shown I n Flgures 5. 6. and 7 I s t y p l c a l o f b l n a r y carbon dlox1de:hydrocarbon systems, such as those c o n t a l n l n g heptane ( I m and Kurata. 1971), decane (Ku lka rn l e t a l . , 1972). o r benzene (Gupta e t a l . , 1982). Our lemon 011 samples contalned I n excess o f 64 mole X llmonene; so we modeled our data as a reduced b lna ry o f l lmonene and carbon d lox lde . The Peng-Roblnson (197b) equat lon was used, w l t h c r l t l c a l temperatures, c r l t l c a l pressures, and acen t r I c fac to rs obtalned from Oaubert and Oanner (1983). and Reld e t a l . (1977). For carbon d lox lde . o = 0.225; for llmonene o = 0.327, Tc = 656.4 K. Pc = 2.75 MPa. I t was necessary t o vary t n t e r a c t l o n parameter 4 t h temperature I n order t o c o r r e l a t e t h e d a t a s a t l s f a c t o r l l y . The values o f d12 a r e reasonable (0.1135 a t 303 K. 0.1129 a t 308 K. 0.1013 a t 313 K ) . Comparlsons o f c a l c u l a t e d and experlmental r e s u l t s are g lven I n Flgures 5, 6. and 7.
Attempts to model the r e l a t l v e v o l a t l l l t l e s o f t he minor organlc cons t l tuents t o llmonene uslng t h e Peng-Roblnson equat lon proved u n f r u l t f u l .
198
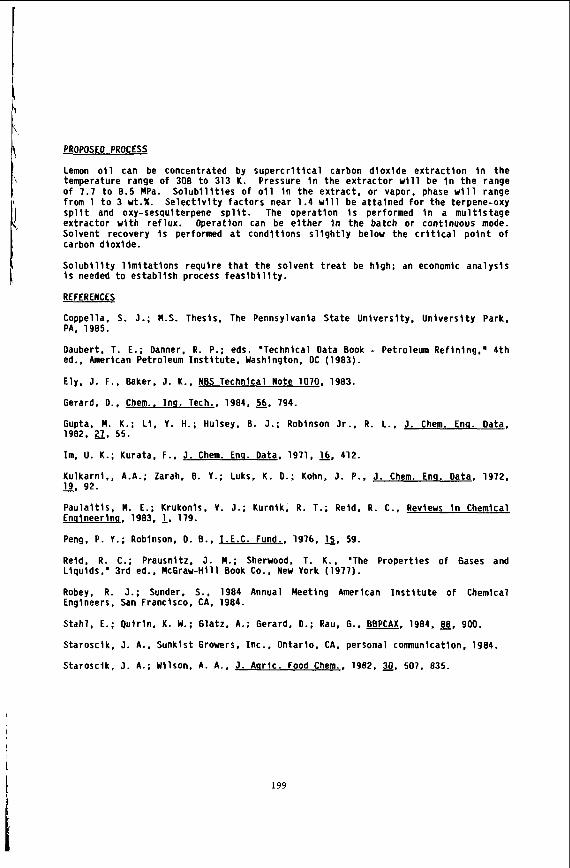
PROPOSED PROCESS
Lemon o i l can be concentrated by s u p e r c r l t l c a l carbon d l o x l d e e x t r a c t l o n I n t h e temperature range of 308 t o 313 K. Pressure I n the e x t r a c t o r w l l l be I n t h e range o f 7.7 t o 8.5 MPa. S o l u b l l l t l e s o f 011 I n t h e e x t r a c t , or vapor, phase w l l l range from 1 t o 3 ut.%. S e l e c t l v l t y f ac to rs near 1.4 u l l l be a t ta lned f o r t he terpene-oxy s p l l t and oxy-sesqulterpene s p l l t . The opera t lon I s performed I n a m u l t l s t a g e e x t r a c t o r w i t h re f l ux . Operat lon can be e i t h e r I n the ba tch o r cont lnuous mode. Solvent recovery I s performed a t cond l t lons s l i g h t l y below the c r l t l c a l p o l n t o f carbon d lox lde .
S o l u b l l l t y l l m l t a t l o n s requ l re t h a t t he so lvent t r e a t be hlgh; an economlc a n a l y s l s I s needed t o es tab l l sh process f e a s l b l l l t y .
REFERENCES
Coppella. S. J . ; M.S. Thesls, The Pennsylvanla S ta te Un lve rs l t y . U n l v e r s l t y Park, PA, 1985.
Daubert. T. E.; Oanner. R. P.; eds. "Technlcal Data Book - Petroleum Reflnlng.' 4 th ed., Amerlcan Petroleum I n s t l t u t e , Washlngton. DC (1983).
Ely. J . F., Baker. J . K.. NBS Technlcal Note 1070. 1983.
Gerard, D.. Chem.. Ins . Tech., 1984, s. 794.
Gupta. H. K.; L1, Y. H.; Hulsey, 8. J . ; Roblnson Jr.. R. L.. J . Chem. Enq. Data, 1982. 2. 55.
Im, U. K.; Kurata, F.. J . Chem. Enq. Data. 1971, l6. 412.
Kulkarnl.. A.A.; Zarah. 8. Y.; Luks. K. 0.; Kohn. J . P.. J . Chem. Enq. Data, 1972. - 19, 92.
P a u l a l t l s , M. E.; Krukonls. V. J . ; Kurnlk, R. T.; Reld, R. C., R e v l w s I n Chemlcal Enqlneerlnq. 1983. 1, 179.
Peng. P. Y.; Roblnson. 0. E.. I.E.C. Fund., 1976. E. 59.
Reld. R. C.; Prausnl tz. J . M.; Sherwood. T. K.. 'The Proper t les of Gases and Llqulds; 3 rd ed.. Hc6raw-HIll Book Co.. New York (1977).
Robey, R. J . ; Sunder, S.. 1984 Annual Meeting American I n s t l t u t e o f Chemical Englneers. San Francisco. CA. 1984.
S tah l , E.; Qu l r l n . K. U.; Glatz, A.; Gerard, 0.; Rau, 6.. BBPCAX, 1984, 88, 900.
S tarosc lk , J . A.. Sunklst Growers. Inc . . Ontar lo. CA. personal coinnunlcatlon. 1984.
Starosclk, J . A.; U i l son . A. A.. J. Aqr lc . Food Chem.. 1982. 30. 507, 835.
I 199
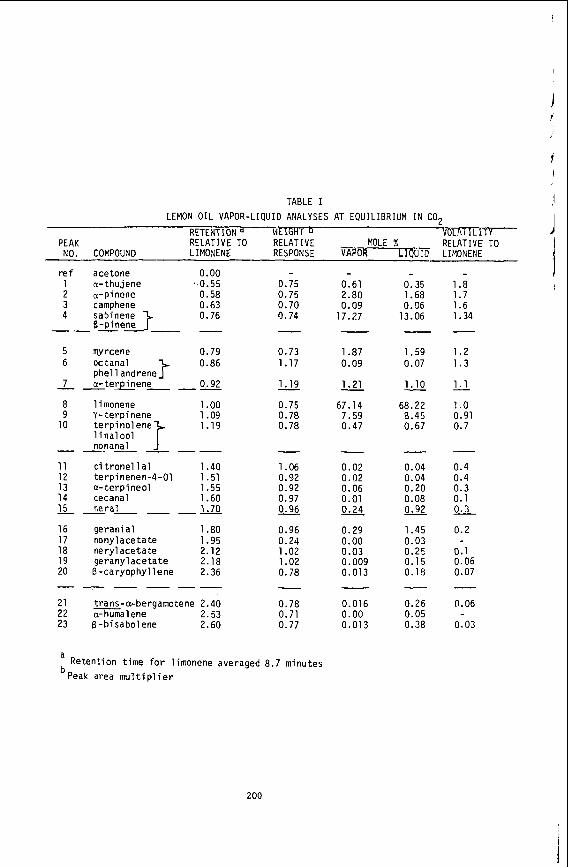
I
i I
TABLE I LEMON O I L VAPOR-LIQUID ANALYSES AT E Q U I L I B R I U M I N CO,
RETENTIONd WEIGHT 0 VOLAT IL ITY i PEAK RELATIVE TO RELATIVE MOLE X RELATIVE TO ' I
NO. COMPOUND LIMONENE RESPONSE VAPOR L I Q U I D LIMONENE
r e f 1 2 3 4
-- 5 6
7
8 9
10
-
- 11 12 13 14 15
16 17 18 19 20
-
-
acetone a-thu j e n e a-pinene camphene sabinene _ - C-pineneJ
myrcene octanal phel landrene? a- t e e e n e -
0.00 .0.55 0.58 0.63 0.76 - 0.79 0.86
0.92 - 1 imonene 1 .oo v- te rp i nene 1.09
1.19
nom&
1.40
te rp inolene l ina lool
c i t rone l 1 a1 terpinenen-4-01 1.51 a- terpineol 1.55 decanal 1.60
_. n e r a l - -- 1.70
geranial 1.80 nonyl a c e t a t e 1.95 nery lace ta te 2.12 geranylace ta te 2.18 6 -caryophyll ene 2.36
I- -
- - ---
0.75 0.75 0.70 0.74 - 0.73 1.17
1.19
0.75 0.78 0.78
-
- 1.06 0.92 0.92 0.97 0.96
0.96 0.24 1.02 1.02 0.78
-
0.61 2.80 0.09
17.27 - 1.87 0.09
1.21
67.14 7.59 0.47
-
- 0.02 0.02 0.06 0.01 0.24
0.29 0.00 0.03 0.009 0.013
-
- 0.35 1.68 0.06
13.06 - 1.59 0.07
1.10
68.22 8.45 0.67
-
- 0.04 0.04 0.20 0.08 0.92
1.45 0.03 0.25 0.15 0.18
-
21 trans-a-bergamotene 2.40 0.78 22 a-humalene 2.53 0.71 23 6-bisabolene 2.60 0.77
1.8 1.7 1.6 1.34 - 1 . 2 1 .3
1 .1
1 .o 0.91 0.7
-
- 0.4 0.4 0.3 0.1 0.3
0.2
0.1 0.06 0.07
-
0.016 0.00 0.013
0.26 0.05 0.38
0.06
0.03
a Retention time f o r limonene averaged 8.7 minutes bPeak area m u l t i p l i e r
200
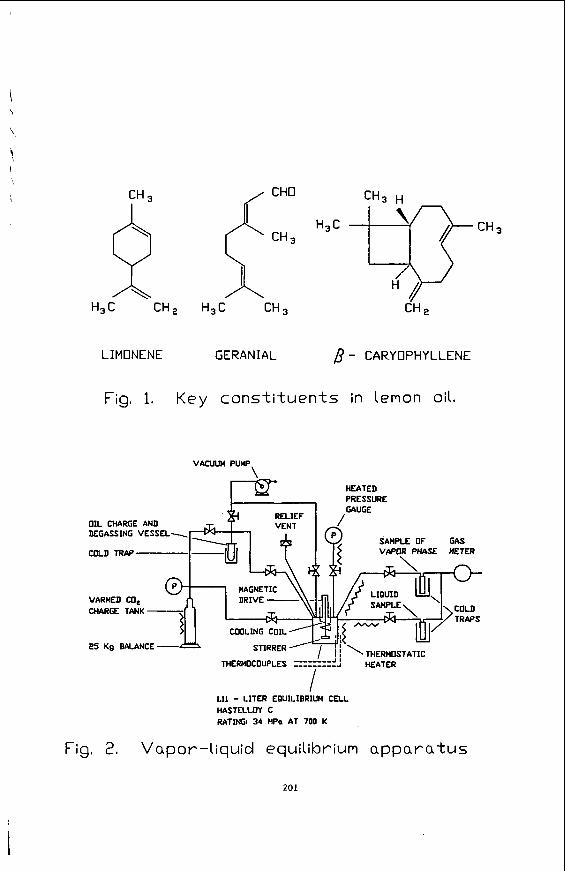
LIMONENE GERANIAL B - CAR-YOPHYLLENE
Fig, 1. Key cons t i t uen ts in lemon Oil .
VACUUM PUMP \
PRESSURE
OIL CHARGE AND DEGASSING VESSEL-
SAMPLE OF GAS
CHARGE TANK
25 KQ BALANCE-
I 1.11 - LITER EOUILIBRIUH CELL HASTELLDY C RATING1 34 HPo AT 700 K
Fig, 2. Vapor-l iquid equilibrium a p p a r a t u s
201
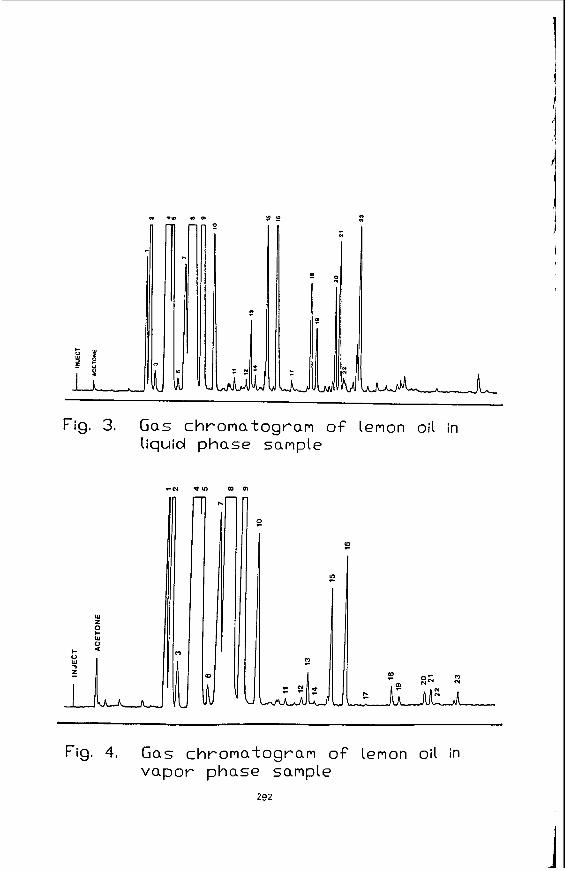
n .II) 0 0 2 s
Fig. 3. Gas chromatogram o f lemon oil in Iiquid phase sample
P
w 0
w
I - * n
z
Fig. 4, Gas chromatogram o f lemon oil in vapor phase sample
2P2
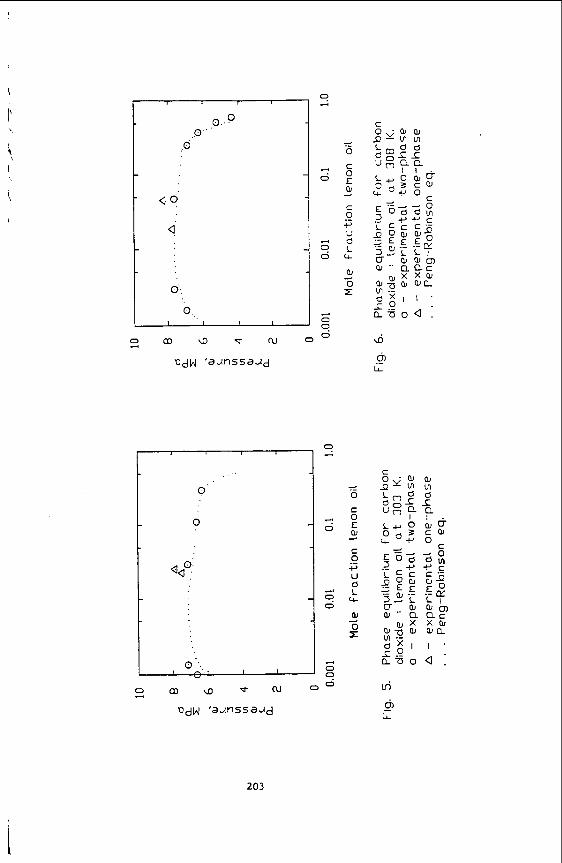
x t
d .- 0
c 0 E @
C 0
-P U d L
Le
a, 0 E
.-
d
d ._ 0
4
0
+ 9 0
203
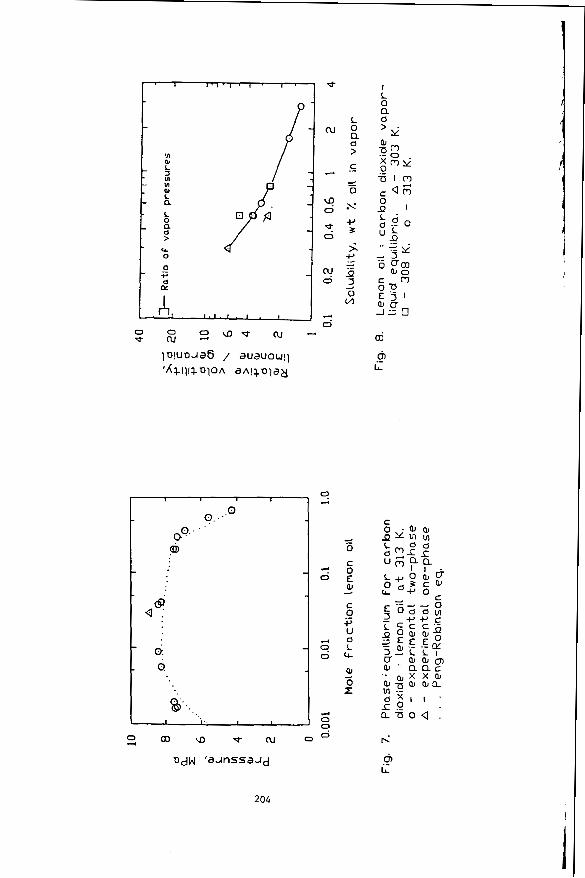
srl 0
204
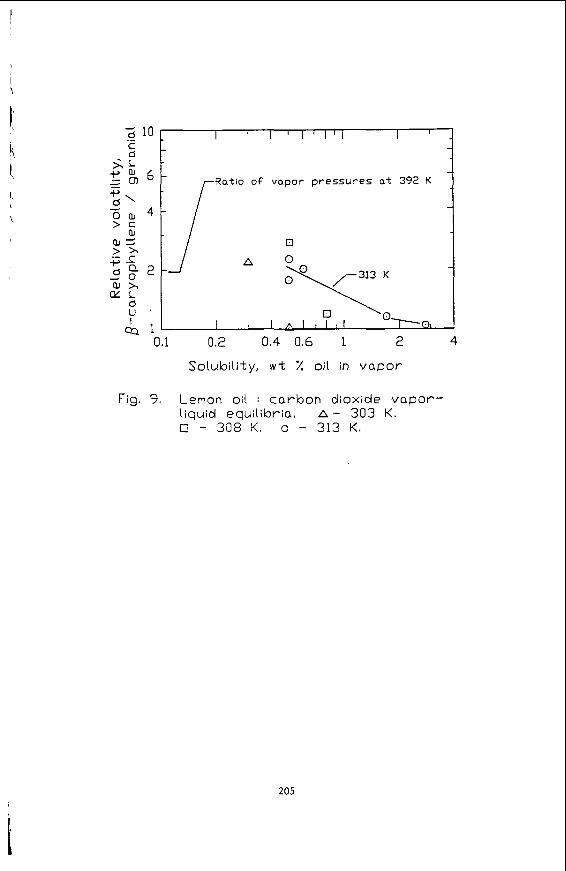
Ratio of vapor pressures a t 392 K r
0.1 0.2 0.4 0,6 1 2 4
Solubility, w t 7. oil in vapor
Fig. 9. Lemon oil : carbon dioxide vapor - liquid equilibria. a - 303 K. 0 - 305 K. o - 313 K.
205
FRACTIONATION OF ETHYL ESTERS FROM FISH OIL
by Dr. Wilhelm 0. Eisenbach
Max-Planck-Institut f u r Kohlenforschung 4330 Miilheim-Ruhr West Germany
1 . I n t r o d u c t i o n
In t h i s paper t h e e f f i c i e n c y of s u p e r c r i t i c a l f l u i d e x t r a c t i o n as a s e p a r a t i o n procedure w i l l be presented , as a n example t h e f r a c t i o n a t i o n of a mixture of h i g h b o i l i n g subs tances is descr ibed. Generally t h e product d i sso lved i n a s u p e r c r i t i c a l f l u i d can be separa ted e i t h e r by i n c r e a s i n g t h e temperature at c o n s t a n t pressure ( i s o b a r i c method) o r by lowering t h e p r e s s u r e at cons tan t temperature ( i so thermal method). Both phenomena can be used i n f r a c t i o n a t i o n procedures.
1.1 V a r i a t i o n of Preseure
Discontinuous v a r i a t i o n of t h e p r e s s u r e i n e i t h e r t h e e x t r a c t i o n v e s s e l o r i n t h e s e p a r a t o r can l e a d t o f r a c t i o n a t i o n . In t h e f i r s t case t h e p r e s s u r e and hence t h e d e n s i t y of t h e e x t r a c t i o n agent i s increased i n a s tepwise manner w i t h t h e r e s u l t t h a t m a t e r i a l is taken up i n t o t h e s u p e r c r i t i c a l phase i n order o f i n c r e a s i n g b o i l i n g poin t o r molecular weight . The d i s s o l v e d material can be i s o l a t e d then i n e i t h e r an i s o b a r i c o r i so thermal manner. In p r a c t i c e t h e p r e s s u r e i s g e n e r a l l y r a i s e d a f te r e x t r a c t i o n at t h e lower p r e s s u r e is completed.
A l t e r n a t i v e l y t h e e x t r a c t i o n can be c a r r i e d out at a c o n s t a n t pressure i n t h e e x t r a c t i o n v e s s e l and t h e loaded s u p e r c r i t i c a l phase w i l l b e expanded i n a step-wise manner whereby t h e l e a s t v o l a t i l e components a r e depos i ted f i r s t , while t h e b e t t e r v o l a t i l e components remain d isso lved i n t h e s u p e r c r i t i c a l phase.
1.2 The B o t F i n g e r
The o ther a p p l i c a t i o n of f r a c t i o n a t i o n by i n c r e a s i n g t h e temperature i s shown i n F igure 1 . The e x t r a c t i o n v e s s e l has been combined w i t h a r e c t i f i c a t i o n column c o n s i s t i n g of a p r e s s u r e tube packed wi th s t a i n l e s s s t e e l packings. A heated head of column, t h e so-cal led Hot Finger , is f i t t e d o n t o t h e t o p of t h e column and is held at a higher temperature t h a n t h e r e s t o f t h e appara tus . On c o n t a c t with t h e H o t Finger t h e d e n s i t y of t h e s u p e r c r i t i c a l loaded phase decreases and t h e l e s s v o l a t i l e components condense a n d drop back i n t o t h e column a n d a r e subjec ted t o r e c t i f i c a t i o n i n t h e same manner as i n a convent ional d i s t i l l a t i o n . The product s t i l l d i s s o l v e d i n t h e s u p e r c r i t i c a l phase after pass ing t h e Hot Finger is i s o l a t e d by d e c r e a s i n g t h e p r e s s u r e as a l ready descr ibed.
2. F r a c t i o n a t i o n of F a t t y Acid E t h y l E a t e r e
As a n example of v a r i o u s a p p l i c a t i o n s which a r e i n v e s t i g a t e d a t t h e Max-Planck-Institut f u r Kohlenforschung i n Mulheim-Ruhr i n t h i s paper t h e f r a c t i o n a t i o n of a mixture of e t h y l e s t e r s of f a t t y a c i d s is
206
\ described. This investigation was concerned with the separation of eicospentaenoic acid (EPA) out of a mixture of fatty acid ethyl esters from codfish oil. The starting material consisted of eth 1 esters of saturated and unsaturated fatty acids from C(14) to C(229 partly containing up to 6 double bonds. In order of the high boiling points of these esters a conventional vacuum distillation needs relatively high temperatures so that, first, decomposition cannot be excluded and, second, a separation into single components is hardly possible.
In co-operation with the NIPPON SUISAN KAISHA,LTD - TOKYO (Japan) it was tried to fractionate such a mixture, the composition is shown in table 1, by using supercritical carbon dioxide to isolate a C(20-5)-rich fraction. (x-y) means the ethyl ester of a fatty acid with x carbon atoms and y double bonds.
\
Table 1 Composition of the Codfish Oil
Acid % Acid % 14-0 _--___ 5.80 20-1 ----- 11.43 15-0 ------- 0.19 20-4 ------ 0.50 16-0 ------ 12.88 20-5 ----- 14.46 16-1 __--___ 9.79 22-1 ------ 8.64 18-0 _---___ 2.66 22-4 ------ 0.43
5.74 18-2 ----___ 0.16 22-6 ------
................................................
18-1 _---__ 23 - 25 22-5 ------ 0.49 18-4 __--___ 2.19 ...............................................
In a series of experiments carried out in an equipment similar to that shown in figure 1 various conditions were investigated to optim.ize this procedure, mainly the following:
1. The increase of the temperature of the Hot Finger in order
2. The increase of the pressure to get a higher loading of the
3. Variation of the length of the column and of the packings
to increase the the reflux ratio.
supercritical phase.
In all these experiments the temperature of &he extraction vessel, column and separator was kept constant at 50 C, the supercritical loaded phase was expanded to 25 bar in the separator and the flow rate of the supercritical carbon dioxide amounted to about 25 l/h. Samples of the loaded supercritical phase after passing the Hot Finger were analyzed each hour by gaschromatography.
2.1
2.11 Without the Hot Pinger
The first experiment was carried out without the influence of the Hot Fitfger that means, the temperature of the Hot Finger was kept also at 50 C. The starting material was divided into 10 fractions by SCF extraction with supercritical carbon dioxide. It shows that no separation comes off, only an enrichment of the lower boilin esters C(14) and C(16) in the first fractions and of C(20) and C(22$ in the later fractions according to their boiling points.
Variation of the Temperature of the Hot Finger
207
2.12 With the Hot Finger
The variation of the temperature of the Hot Pinger really led to an increase of the reflux ratio bu& the selectivity decreased by exceeding the temperature of 90 C.
The curves in figure 2 Ejhow the difference in selectivity at the two temperatures 90 and 100 C. Here out of the whole mixture only the content of two components in the supercritical loaded phase, that are the sum of C(16)- and C(20)-esters analyzed by GC, are plotted versus the extraction time. T8 get a high purity combined with a yield as high as possible at 90 C one is able to collect a fraction amounting to 13.5 $ of the starting material containing 50 8 of the C(20)-esters of the feed-stock with a purity of 96.2 $. At 100 C it is only possible to collect 25.7 $ of the C(20)-esters with a maximum concentration of 85.5 $.
2.2 Variation of Preeaure
The loading of the supercritical carbon dioxide depends on the pressure of the system. Under constant conditions of temperature and flow rate of the supercritical carbon dioxide the increase of the loading with raising the pressure can be demonstrated by the extraction rate: at 150 bar 15 g/h extract could be isolated, at 170 bar the amount was 55 g/h and at 200 bar 140 g/h. But the higher extraction rate was accompanied by a decrease in selectivity, at 200 bar no fractionation could be realized.
2.3 Reeulte of Optimization
The results of these optimization experiments suitable only for the equipment we used are listed in table 2.
Table 2 Conditions and Results of Optimization .......................................................................... N r Temperature Pressure Rate of Max. 50 $ Yield C(20)-esters
Hot Finger Extraction Content Extract Purity (OC) (bar) (g/h) ($1 "1 ($1 **) (%) --------------__________________________--------------------------------
01 80 120 8.2 84.2 17.2 75.0 02 ***) 80 120 13.1 92.2 14.4 86.8 03 ****) 80 120 12.8 55.6 25.1 50.3 04 90 200 138.5 no fractionation
90 170 55.3 no fractionation 14-7 9.9 13.5 96.2
200 1 5 0 38.2 45.3 42.8 33.0 06 O5 90 07 1 20 08 120 09 1 20 10 100
170 12.4 89.3 15.7 80.7 150 7.8 150 15.8 92.7 14.7 84.5
of C(20)-esters in the loaded supercritical phase (without C02) *:I related to the starting material ***I with smaller packings ****I without packings
208
In all these experiments the extraction temperature, the length of the column and the flow rate of the supercritical carbon dioxide were kept constant. Besides the reaction conditions in this table the results of the fractionation are listed in relation to the isolation of the sum of C(2O)-ester.s In this table the maximum content means the maximum concentration of C(20)-esters in the supercritical loaded phase during the extraction, analyzed by GC. Next to the last column of the table shows the amount of extract including 50 $ of the C(20)-esters,s related to the starting material. The last column shows purity of this fraction.
The best result was obtp,ined in the experiment 06 with a temperature of the Hot Finger of 90 C and a pressure of 150 bar. Both at higher temperatures and higher pressures the selectivity of the fractionation decreases.
2.4 Two-step Extraction
The last experiments have shown that it is impossible to get a higher yield than 50 $ with a purity of more than 90 $. Under the best conditions described above it should be tried to raise the yield of C(20)-esters by a two-step extraction procedure.
2.41 First Fractionation Step
In this experiment the codfish oil was extracted with supercritical carbon dioxide and by means of the hourly GC-analyses of the loaded supercritical phase several fractions were collected. In the first fraction all extracts were joined in which no C(ZO)-esters could be detected. In the second fraction the extracts up to 10 $ C(20)-esters were collected and in the third fraction the extracts which contain the last traces of C(16)-esters. The next fraction contained only C(18)- and C(ZO)-esters of different composition. After the content of C(20)-esters of more than 90 $ in the supercritical phase was reached the main fraction was collected until the content again reached 90 $ after passing a maximum content of about 99 $. The next fraction consisted only of C(20)- and C(22)-esters in various combinations. When the value of the C(20)-esters was lower than 2 $, then the rest of the inserted material was extracted without using the Hot Finger. This last fraction besides C(22)-esters contained some not identified higher molecular components. Figure 7 shows the fractionation curves where the composition of the mixture dissolved in the supercritical phase is plotted versus the extraction time respectively versus the amount of extract in percent of the starting material.
The main fraction containing in the original starting material with a purity of 95.8 $, this is the first part of the desired product.
contains 48.2 $ of the C(ZO)-esters which have been
2.42 Second Fractionation Step
The fractions got in the first fractionation step containing only C(18)- and C(20)-esters respectively C(20)- and C(22)-esters were combined to give the new starting material for the second fractionation step. The first and the last fraction which contained only c(14)- to C(18)-esters respectively C(22)-esters were rejected.
209
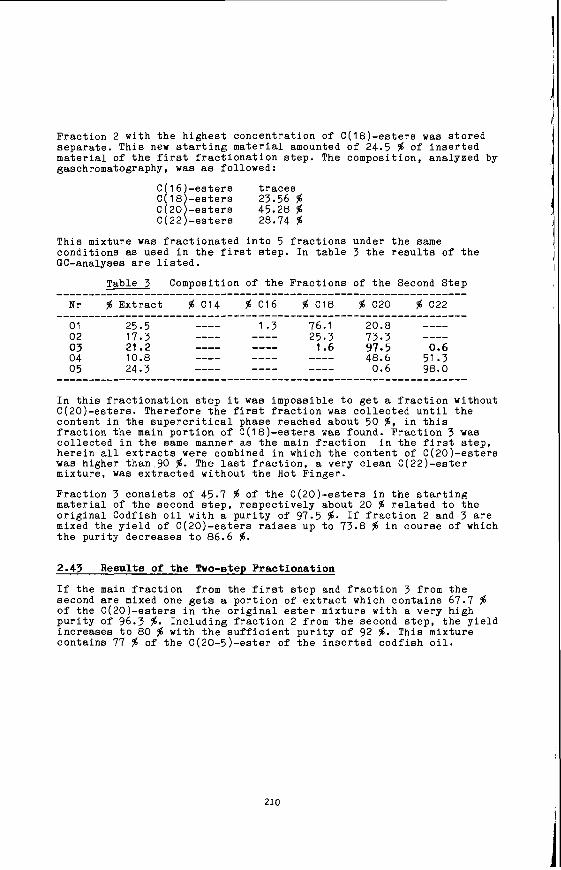
Fraction 2 with the highest concentration of C(18)-esters was stored separate. This new starting material amounted of 24.5 $ of inserted material of the first fractionation step. The composition, analyzed by gaschromatography, was as followed:
C( 16)-esters traces C(18)-esters 23.56 $ C(20)-esters 45.28 $ C(22)-esters 28.74 $
This mixture was fractionated into 5 fractions under the same conditions as used in the first step. In table 3 the results of the GC-analyses are listed.
Table 3 Composition of the Fractions of the Second Step ____________________-------------------_------------------------- N r $ Extract $ C14 $ C16 $ C18 $ C20 $ C22
In this fractionation step it was impossible to get a fraction without C(20)-esters. Therefore the first fraction was collected until the content in the supercritical phase reached about 50 $, in this fraction the main portion of C(18)-esters was found. Fraction 3 was collected in the same manner as the main fraction in the first step, herein all extracts were combined in which the content of C(20)-esters was higher than.90 $. The last fraction, a very clean C(22)-ester mixture, was extracted without the Hot Finger.
Fraction 7 consists of 45.7 $ of the C(20)-esters in the starting material of the second step, respectively about 20 $ related to the original Codfish oil with a purity of 97.5 $. If fraction 2 and 3 are mixed the yield of C(20)-esters raises up to 73.8 $ in course of which the purity decreases to 86.6 $.
2.43 Results of the Rro-step Fractionation
If the main fraction from the first step and fraction 3 from the second are mixed one gets a portion of extract which contains 67.7 $ of the C(20)-esters in the original ester mixture with a very high purity of 96.3 $. Including fraction 2 from the second step, the yield increases to 80 $ with the sufficient purity of 92 $. This mixture contains 77 $ of the G(PO-s)-ester of the inserted codfish oil.
210
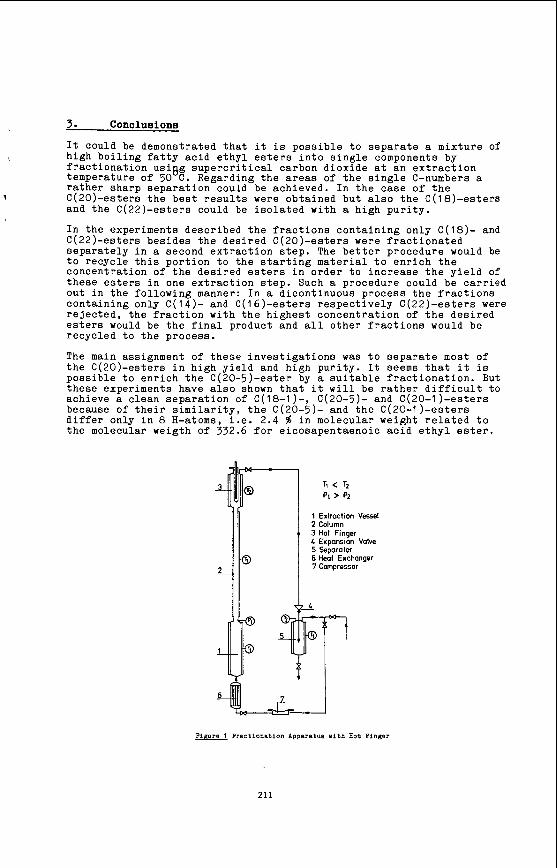
3. Conclusions
It could be demonstrated that it is possible to separate a mixture of high boiling fatty acid ethyl esters into single components by fractionation usiBg supercritical carbon dioxide at an extraction temperature of 50 C. Regarding the areas of the single C-numbers a rather sharp separation could be achieved. In the case of the C(20)-esters the best results were obtained but also the C( 18)-esters and the C(22)-esters could be isolated with a high purity.
In the experiments described the fractions containing only C ( 1 8 ) - and C(22)-esters besides the desired C(20)-esters were fractionated separately in a second extraction step. The better procedure would be to recycle this portion to the starting material to enrich the concentration of the desired esters in order to increase the yield of these esters in one extraction step. Such a procedure could be carried out in the following manner: In a dicontinuous process the fractions containing only C(14)- and C(16)-esters respectively C(22)-esters were rejected, the fraction with the highest concentration of the desired esters would be the final product and all other fractions would be recycled to the process.
The main assignment of these investigations was to separate most of the C(20)-esters in high yield and high purity. It seems that it is possible to enrich the C(20-5)-ester by a suitable fractionation. But these experiments have also shown that it will be rather difficult to achieve a clean separation of C(18-1)-, C(20-5)- and C(20-1 )-esters because of their similarity, the C(20-5)- and the C(20-l)-esters differ only in 8 H-atoms, i.e. 2.4 $ in molecular weight related to the molecular weigth of 332.6 for eicosapentaenoic acid ethyl ester.
2- a
1 Extraction Vessel 2 Column 3 Hot Finger L Expansion Valve 5 Separator 6 Heat Exchanger 7 Compressor
7
Pifire 1 Fractionation Apparitu w i t h Hot Plnger
211
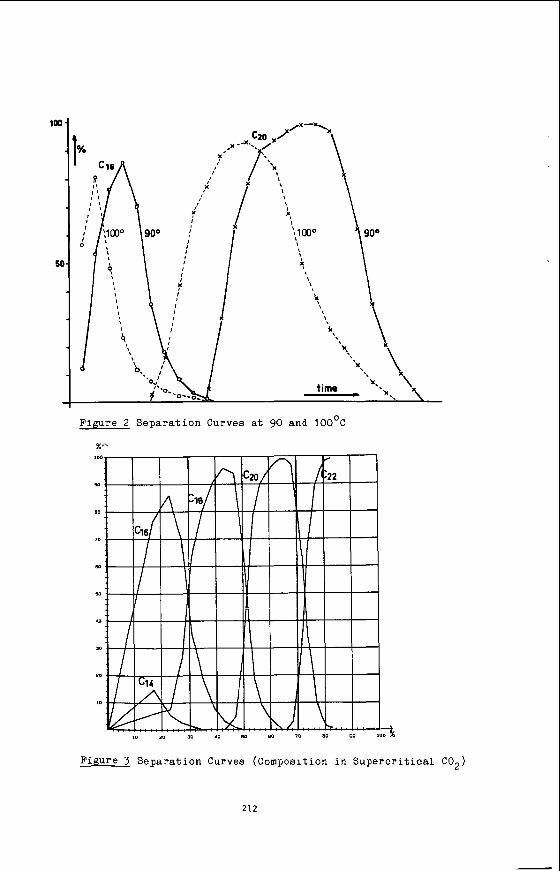
51
Figure 2 S e p a r a t i o n Curves a t 90 and 100°C
Figure 3 S e p a r a t i o n Curves (composition i n S u p e r c r i t i c a l C02)
212
- I
SEPARATION OF BUTADIENE BUTENE MIXTURE WITH MIXTURES OF AMMONIA AND ETHYLENE I N NEAR CRITICAL CONDITIONS
D.S. Hacker, Amoco Chemicals, Naperville,I1.,60566
Abstract
I We describe the r e s u l t s of an inves t iga t ion i n t o the separation of mixtures of 1,3-butadiene and 1-butene conducted a t near c r i t i c a l conditions. Selected solvents and solvents containing ammonia as an en t r a ine r a r e compared with respect to t h e i r s e l e c t i v i t y i n removing 1-butene from t h i s c lose boi l ing mixture. Separation f ac to r s of 1.4 t o 1.8 a t a pressure of 600 psig and a temperature of 20 C a r e observed f o r mixtures containing 5%-0% ammonia i n ethylene . carbon dioxide show no se l ec t iv i ty . This i s a l s o t rue f o r ethane /ammonia mixtures which a l s o appear poor a s separating agents f o r t h i s mixture. Experimental r e s u l t s a r e compared with values predicted by a modified two parameter corresponding s t a t e s equation with reasonably good agreement. A case is made f o r the choice of an entraining component t o be made on the bas i s t h a t i t contributes a chemical property t o the system enabling the same se l ec t ion c r i t e r i a described by Elgin to be used i n SC processes a s a r e i n l i q u i d - l i q u i d ex t rac t ion o r ex t rac t ive o r azeotropic d i s t i l l a t i o n processes.
Pure solvent gases, on the other hand,such a s ethane,ethylene, and
Introduction:
An a l t e rna t ive separation process is much to be desired to replace the more conventional azeotropic o r ex t rac t ive d i s t i l l a t i o n used i n the separa t ion of c lose ly boiling mixtures. associated with so lvent recovery and cos t s due t o loss of the expensive solvent . Idea l ly suited t o the task would be a separating agent t h a t could be readily flashed o f f , leaving a r e l a t ive ly pure product behind, assuring almost complete recovery of the so lvent with a minimum expenditure of energy. Supercr i t ica l and near c r i t i c a l ex t rac t ion where retrograde condensation and vaporization occur may be candidates f o r t h i s task.
There is a need t o reduce both the energy cos ts
The separation of l i q u i d mixtures by near c r i t i c a l solvents i s s t i l l a r e l a t ive ly new technology. The lack of experimental phase equ i l ib r i a da ta f o r many liquid systems and the dearth of s o l u b i l i t y da ta for,either c r i t i c a l gaseous solvents i n l i q u i d mixtures o r f o r so lu t e s dissolved i n c r i t i c a l solvents makes any r e a l i s t i c design d i f f i c u l t . Some estimate can be obtained from an understanding of the general physical chemical pr inc ip les involved,but ult imately each system m u s t be addressed individually and i ts cha rac t e r i s t i c s determined experimentally. In the discussion t h a t follows, an experimental inves t iga t ion was undertaken t o determine the app l i cab i l i t y of mixed so lvents , near t he i r c r i t i c a l conditions t o the separation of butadiene from mixtures with 1-butene.These r e s u l t s a r e compared with pred ic t ions obtained from a representative equation of s t a t e i n the region of the solvent-solute c r i t i c a l so lu t ion envelope.
213
Theoretical Discussion:
The recovery of butadiene from a mixed C4 o l e f i n stream has a l l of the charac te r i s t ics of an energe t ica l ly d i f f i c u l t separat ion resu l t ing from t h e almost pinched VLE condi t ions ex is t ing i n t h i s mixture. As is shown in Table I, the physical p roper t ies of these components are almost ident ica l with the exception of the l a r g e d ipole moment of the 1-butene. Conventional d i s t i l l a t i o n is imprac t ica l s ince the r e l a t i v e v o l a t i l i t y of many of the C4 compounds a r e reasonably c l o s e to unity. A separation,nevertheless, can be effected provided a su i tab ly polar solvent i s used to se lec t ive ly remove the butene. The inf luence of p o l a r i t y can be exploited i n t h i s separat ion by "sal t ing out" the more nonpolar compound( 1).
As a r e s u l t , v i r t u a l l y a l l i n d u s t r i a l p rac t ice f o r the recovery of butadiene current ly makes u s e of e x t r a c t i v e d i s t i l l a t i o n with an en t ra iner such as a c e t o n i t r i l e or some o t h e r s t rong organic base t o enhance the r e l a t i v e v o l a t i l i t y of the components. The p o t e n t i a l of achieving an equally e f fec t ive separation through the introduct ion of a mixture of a solvent and an entrainer exhibiting polar proper t ies c lose t o i t s c r i t i c a l so lu t ion conditions is intriguing. Ammonia, a polar gas , has a l ready been shown to a c t as an e f fec t ive solvent(2) f o r t h i s separat ion although a t pressures much below i ts c r i t i c a l . I t s use as a s u p e r c r i t i c a l solvent f o r t h i s separat ion would be a l s o feas ib le were i t not f o r its very high c r i t i c a l temperature (405.45 K) which favors the polymerization of the butadiene. A method developed in t h i s work and described i n a recent publ icat ion (3) makes u s e of a s u p e r c r i t i c a l mixture of so lvents which i n combination provides the chemical as well as the physical conditions f o r the most e f f i c i e n t ex t rac t ion of the 1-butene solute i n the mixture within the l imi ta t ions imposed by the thermal s t a b i l i t y of the s y s t e m .
The a b i l i t y t o e f f e c t t h e separat ion of various l iqu id solut ions i n the presence of a s u p e r c r i t i c a l or near c r i t i c a l component has been adequately demonstrated(4). I n genera l , these solvents tend t o be e i t h e r inorganic gases or l i g h t hydrocarbons such a s carbon dioxide, ammonia,ethane, ethylene, o r propane. For example, Weinstock and Elgin ( 5 ) used pressurized ethylene t o promote the separat ion a number of miscible aqueous-organic l iquid mixtures. Through the int roduct ion of a solvent a t o r near c r i t i c a l conditions one can e f f e c t separat ion by forming mult iple phases. The d is t r ibu ted component may concentrate i n e i t h e r one of the newly created phases. More recent ly several p rac t ica l processes have been developed t h a t u s e carbon dioxide t o e f f i c i e n t l y dehydrate e thanol(6) .Deashing and the physical separat ion of asphal t ines by s u p e r c r i t i c a l propane have been commercially developed(7). recent ly applied t h i s concept to the separat ion of l i g h t hydrocarbons such a s n-butane and n-decane(8). The theory of separat ion of multicomponent mixtures by SC solvents i s now of cur ren t research interest with several papers devoted t o the appl ica t ion of concepts of continuous thermodynamics(9,lO) t o handle multicomponent mixtures as w e l l .
S t a r l i n g e t a1
214
Reid and o thers ( l1 , lZ) have shown tha t supe rc r i t i ca l solvents show varying degrees of s e l e c t i v i t y towards a pa r t i cu la r solute. This i s not surpr i s ing since the same pr inc ip le t h a t appl ies i n l i q u i d solvent se lec t ion should apply in the case of SC solvents. Because of the limited number of SC solvents ava i lab le , the application of SC ex t rac t ion to a broad range of systems i s very l i m i t e d . One way of increasing the app l i cab i l i t y of the technique is e i the r to f ind ways of expanding the solvent category, which does not seem l ike ly a t t h i s t i m e , or to develop methods of modifying ex is t ing solvents. Since the maximum s e l e c t i v i t y of the solvent occurs when i t s c r i t i c a l temperature matches the ex t rac t ion temperature, a match between the so lu t e and the S C solvent i s no t always possible with a s ing le solvent.
To circumvent t h i s d i f f i c u l t y , Brunner(l3) introduced an en t ra iner whose function is to modify the chemical a c t i v i t y of the so lu te mixture s u f f i c i e n t l y to enhance the separation. This was p u t t o use i n the ex t rac t ion of t r ig lycer ides from a mixture of polyglycerides using carbon dioxide w i t h acetone as an en t ra iner . The en t ra iner served a s a source of hydrogen bonding to augment the separation of the desired component. The pr inc ip le of the entrainer i n improving separation has been widely known i n l i q u i d ex t r ac t ion processes and described by Treybal(l4).
A ternary nonideal so lu t ion , f o r example, w i l l generally exh ib i t a minimum i n one of the pa i r s of a c t i v i t y coef f ic ien ts . The addition of a second so lvent , i f properly se lec ted , may fu r the r lower the a c t i v i t y coe f f i c i en t of the so lu t e and increase i t s concentration i n a given phase(l5). The addi t ion of a second component to an SC solvent w i l l r e s u l t i n configurational e f f e c t s t h a t enhance the ex t rac t ion of a pure so l id . I t can be shown theore t ica l ly tha t a binary SC solvent a t pressures c lose t o the c r i t i c a l envelope w i l l a l so have a strong influence on the s o l u b i l i t y of the so l id so lu te ( l6) . How well t h i s p r inc ip l e can be extrapolated t o multicomponent so l id s or l i q u i d systems i s s t i l l t o be determined.
In t h i s study, we have measured the degree of ex t rac t ion of butene from a binary mixture of butadiene/ butene with various solvents eg. ethane, carbon dioxide,ethylene, ammonia and ethylene and ammonia and ethane so lvent mixtures i n the region of c r i t i c a l so lu t ion pressure of the solvent mixture. The experimental r e su l t s a r e then compared with the VLE ca lcu la t ions f o r t h i s system using a newly developed corresponding s t a t e s equation devised by Ely and Mansoori(l7).
215
I
I
J The primary fea tures of the equation a r e a new generalization f o r the shape
Experimen t a 1
Near-cr i t ica l ex t r ac t ion experiments were carried out in a one - l i t e r , s t i r r ed , s t a in l e s s s t e e l Autoclave( MR #7331), rated a t 5000 psig a t 600 F. Phase separations were monitored through an attached 50 cc Jerguson s igh t gauge (rated a t 5000 ps ig a t 72 F) which a l s o served a s a l eve l indicator. A complete schematic of the assembly i s shown i n Fig.1. The autoclave was maintained a t cons tan t temperature by means of an ex terna l heating tape and an in te rna l cooling c o i l . Cooling was furnished by a c i rcu la t ing water Freon r e f r ige ra t ion uni t . An Autoclave magnetic s t i r r i n g u n i t powered by an a i r motor was used t o ensure adequate mixing of the sample volume. A l l l i n e s were heat traced with electrothermal heating tapes. The reac tor was depressurized before each experiment by venting the system and then evacuating the chamber under reduced pressure to ensure the complete removal of residual mixture and a i r from the system. F i l l i n g of the vesse l was accomplished through a feed port a t the base of the reac tor . The samples of the upper and lower phases was removed through small bore (1/8 ") t u b i n g through the head of the reac tor and a t the bottom of the reactor. No provision was made t o sample any second l i q u i d phase tha t may appear during an experiment.
Volumetric measurements obtained from observations through the s i g h t g lass of the Jerguson guage and were used to determine the the molar volume of a l l l iqu id components used t o make up the charge. A ca l ibra ted platinum thermocouple was used to measure the temperature of the contents of the autoclave reac tor . The p r e s s u r e of the system and of each of the receiver vesse ls were measured with ca l ibra ted high pressure precision Bourdon tube guages of appropr ia te range. The guage g l a s s window waa ca l ibra ted t o give a d i r e c t readink of the volumes of the l i q u i d s added. When ammonia was used i n the solvent makeup, i t was added to the contents before the addi t ion of the pressurizing solvent gas.
216
Ammonia was fed through a second Whitey pump in to a storage cylinder t ha t could be independently cooled t o ensure minimum vaporization of the ammonia before admitting i t t o the reactor. The ammonia was added under a s l i g h t helium pressure to minimize l iqu id vaporization a t the surface and t o allow for a measurement of a quiescent in te r face .
The solvent gases, ethylene, carbon dioxide, o r ethane, were fed by a Haskel gas compressor, Model AG-62, a 25-1 a i r driven compression pump with a maximum out le t pressure of 9000 psig. The quantity of these gases introduced i n t o the autoclave was determined by measuring the weight change of the gas cy l inder and separately by a measurement of the change of the l iqu id l eve l r e su l t i ng from gas dissolving i n the l iqu id during pressurization. between the l i q u i d leve l and the t o t a l volume of the vesse l was measured and the second phase volume determined.
Chemically p u r e grade butene and butadiene were supplied i n cy l inders by Hatheson Co. and used a s received without fu r the r pu r i f i ca t ion . The hydrocarbons were fed t o the reac tor through an LPlO Whitey laboratory posit ive displacement pump. A 30-pound nitrogen head was added t o each hydrocarbon cylinder to maintain adequate pumping ef f ic iency .
The d i f fe rence
Heating controls were manually adjusted and the temperatures were indicated on a 10- point Acromag. The heating zones of the reac tor were controlled by three Eurotherm 103 with voltage controlled manually by Variacs. sections were hea t traced with se l f - l imi t ing au to t race heating tapes to prevent condensation i n the l i nes .
The remaining
Sample Analysis:
The contents of the reac tor were sampled before and a f t e r the introduction of the solvent gas and en t ra iner by trapping approximately 1 cc of the mixture from the reac tor volume i n a precalibrated volume of sample l i n e located between two high pressure valves, adjacent to the vessel . The volume of the sample withdrawn was su f f i en t ly small t o minimize any changes i n the pressure of the main contents of the vessel . Once trapped,the high pressure sample was fur ther expanded in to a pre-evacuated 300 cc Hoke cylinder t o about 5 atm. This volume of sample was again expanded i n t o a f i n a l 70-cc Hoke cylinder to about 1 atm. Portions of t h i s volume were introduced i n t o the Valco valve located a t the Varian 920 Gas Chromatograph. A l l sample loops were hea t traced as well t o prevent condensation i n the l i nes . This procedure was followed i n sampling the lower portion of the l i q u i d phase a s w e l l . An additional sample por t was in s t a l l ed i n the low pressure cy l inder f o r syringe sampling to provide an addi t iona l check on the accuracy of sampling procedures.
217
The pressure of the gas was slowly increased u n t i l the l i q u i d i n t e r f ace disappeared, ind ica t ing the attainment of the c r i t i c a l region. The gas pressure was then reduced by s l i g h t l y depressurizing the chamber un t i l the interface j u s t reappeared. I t was established t h a t t h i s procedure permitted the contents to be wi th in 2 t o 3 ps i below the region of the c r i t i c a l . After s t i r r i n g f o r about f i v e minutes, the system was allowed t o equ i l ib ra t e before vapor and l iqu id phases were sampled.
1 Samples withdrawn f r a n the upper and lower sec t ions of the reac tor autoclave were analyzed i n the G.C. using a thermoconductivity de tec tor with a 20' . 1/8" VZ-7 packed column wi th helium used a s the c a r r i e r gas. The C.C. was run with the in jec tor s e t a t 115 C, the column oven temperature a t 60 C , and the detector s e t a t 115 C. Filament cur ren t t o the de tec tor was s e t a t 150 ma.
1
I
Samples were in jec ted i n t o the column by an air-operated Valco valve, which I was controlled by a t i m e r - controlled solenoid. The de tec tor output was integrated and a concentration ana lys i s was performed by an Autolab System. A Leeds and Northrup recorder was used t o monitor the condition changes, and peak shapes, and composition analysis. The la rger volume of solvent to so lu te required a change i n s e n s i t i v i t y t o adequately monitor the butadiene and butene peaks. A t yp ica l record of t h e CC output is shown i n Fig.2 and indicates the in tegra ted values of the represented peaks of the solvent gas, and butene and butadiene. The equilibrium compositions f o r each run a r e obtained i n t h i s manner and with the i n i t i a l mixture composition tie l i n e s of t h e system can be generated. The entrainer-solvent gas a r e considered a s a pseudosolvent of f ixed composition. The results of the measurements obtained fo r the 8% ammonia/ethylene a r e represented i n the ternary diagram i n Fig.3. Butene i s represented as the d i s t r i b u t e d component with the butadiene as the heavy component .
I
Results:
The r a t i o of the in tegra ted peaks f o r butene(i) and butadiene(j) was used t o determine the separa t ion f ac to r , B , where the separation f ac to r i s defined as
{y i /x i ) so lvent phase
{y j /x j ]heavy phase (1) B P -------_------------__
218
The resu l t s shown in Table I1 and I11 a re representative of the da ta collected f o r the studies conducted with ethylene and ethylene/ammonia and ethane and ethane/ammonia solvent mixtures. Table IV shows some selected data f o r other solvents and solvent mixtures a s w e l l . The r e s u l t s of ex t rac t ion conducted with pure ethylene, carbon dioxide, and ethane i n a l l cases showed no evidence of appreciable separation. I n each s e t of experiments with s ing le so lvents , the same r a t i o of butadiene t o butene was obtained i n both phases. The butadiene/butene mixture i s d is t r ibu ted i n each phase i n amounts t h a t a r e primarily a function of the ex t rac t ing gas and the temperature and pressure of the system.
I
Runs were made with several mixtures of ammonia/ethylene and ammonia/ethane with varying concentrations of ammonia. For both of these mixtures a separation of the butadiene was achieved, but t h e e f f e c t of the ethylene a s a preferred solvent i s most pronounced. The butene appears to concentrated i n the vapor phase i n agreement w i t h the findings of the e a r l i e r pure ammonia study(2). A s e r i e s of experiments were a l s o conducted to determine the temperature and pressure conditions i n which maximum separation could be a t ta ined . For the ethylene/ hydrocarbon/ 6 % ammonia mixtures, t h i s was found to be a t 20 C and 600 psia. The maximum occurs a t a pressure below the c r i t i c a l solution temperature determined by Lentz(l8) fo r the ethylene/ammonia binary ( Fig.4). The experimental se lec t iGi ty was observed t o decrease with an increase i n pressure with an accompanying increase i n the loading i n the solvent phase. The s e l e c t i v i t y is a l s o reduced a s the temperature rises a l l other things being equal(Fig.5).
Discuss ion
The r e su l t s obtained i n t h i s study a r e by no means comprehensive and cover only a narrow range of variables. However, they ind ica te the maximum e f f e c t of en t ra iner enhancement on the r e l a t i v e v o l a t i l i t y of an otherwise close-boiling mixture through the addi t ion of 8% ammonia/ethylene solvent mixture c lose to its c r i t i c a l solution conditions. The r e l a t ive ly la rge s e l e c t i v i t y achieved of 1.4 to 1.8 i s to be considered i n l i g h t of the value obtained f o r pure l iquid ammonia of 1.63 reported by Poffenberger(2). Moreover, i t is shown t h a t the use of a solvent and an en t r a ine r so lvent p e r m i t s the separation to be effected a t temperatures and pressures lower than would have been otherwise predicted had pure c r i t i c a l ammonia been used,a r e s u l t a l so observed by Fong e t al(19) in s tud ies of mixed so lvent ex t rac t ion of coal. An explanation f o r the lower than expected pressure f o r the separation i s the l i k e l y formation of a Class I V mixture according t o Van Konynenburg(20). I t has been observed i n
219
several systems containing ammonia and aromatics t ha t a second l i q u i d phase i s formed under lower pressures than expected i f the mixture behaved a s an idea l Class I system. The P-T projection f o r these c lasses of mixtures is shown i n Fig.6. A lower c r i t i c a l so lu t ion temperature (LCST) and an upper c r i t i c a l solution temperature (UCST) a r e the boundaries f o r the VLL phases observed to be present i n these experiments. The c r i t i c a l points a r e the values f o r the two pseudo-components. Despite the f a c t t h a t these phase r e l a t ions a r e s imi la r to those observed f o r a number of binary mixtures, one can consider the present mixture as a pseudo-binary system i n which the so lvent mixture, comprising ammonia and excess ethylene/ or ethane and a hydrocarbon phase of butadiene and butene exhibit ing very s imi la r vapor pressures.
The enhanced s o l u b i l i t y of the so lvent i n the so lu t ion phase is evidenced i n Table I1 by the l a r g e concentration of the ethylene present i n both phases. An estimate of the volume of so lvent added t o the hydrocarbon mixture was obtained by ca lcu la t ing the d i f fe rence i n the l i q u i d l eve l before and a f t e r gas solvent addition. This is approximately the volume of gas dissolved in the l i q u i d phase. T h i s va lue is added t o the volume above the l iqu id in te r face t o obtain the t o t a l so lvent added t o the system. The volume of ethylene/ammonia solvent mixture added t o the volume of butadiene/butene so lu t ion was approximately 5 : 1.
A comparison of t he calculated s e l e c t i v i t i e s obtained f o r the ethylene mixtures given i n Table I1 can be made with the r e s u l t s i n Table 111 obtained f o r the ethane system. These d i f fe rences cannot be explained so le ly i n terns of the c r i t i c a l p roper t ies of the respective gases. Usually the e f f ic iency of ex t rac t ion of a g iven so lvent towards a pa r t i cu la r so lu t e i s re la ted to the proximity of the ex t r ac t ion temperature t o the c r i t i c a l temperature of the solvent. The r a t i o of the two temperatures, Text/Tc, or the e f f ec t ive reduced temperature should be uni ty or somewhat g rea t e r to maximize separation. For a gas of given c r i t i c a l temperature, the reduced temperature is inversely proportional t o the s o l u b i l i t y of the so lu t e i n the solvent.Since ethane has a reduced temperature more nearly equal t o unity a t the ex t rac t ion conditions a t 20 C ( T r = .98) a s compared with ethylene (Tr = 1.47), one would expect the ethane mixtures t o be a b e t t e r so lvent f o r the butene. That t h i s is not the case suggests an a l t e r n a t i v e explanation would be t h a t the e thylen ic double bond s t r u c t u r e has a g rea t e r chemical a f f i n i t y f o r the o l e f in s i n the SolutiOn phase which may account f o r t h e enhanced so lub i l ty of the butene i n the ethylene phase. This is i n addi t ion t o the chemical synerg is t ic e f f e c t exerted by the ammonia which fu r the r increases the s o l u b i l i t y of the butene i n the vapor phase.
220
\
\
I
These r e su l t s a r e a l s o compared with calculated values obtained from the equation of s t a t e using k i j = 0.8. e f f ec t of ammonia concentration in the solvent were independently varied t o
constant pressure and temperature i n both ethylenefammonia and ethanefammonia solvent mixtures a r e shown i n Table V. The separation f a c t o r increases proportionally t o an increase i n en t r a ine r concentration and appears t o have a more important influence than e i t h e r temperature or pres su re . This is i n cont ras t to the experimental observations i n which the s e l e c t i v i t y achieves a maximum a t an ammonia composition of 8%. findings with both the predictions of the present model and the Prausnitz model fo r the s o l u b i l i t y of so lu te i n mixed SC solvents suggests t h a t chemical f ac to r s such as syne rg i s t i c e f f e c t s cannot be ignored and a r e l i k e l y t o have a grea te r e f f e c t than an t ic ipa ted . The vapor l i q u i d equilibrium predic t ions are , i n general, i n f a i r agreement with the r e s u l t s of these experiments.
Solvent t o feed r a t i o s as w e l l a s the
1 match the experimental data. The e f f e c t increasing ammonia concentration a t
A comparison of these experimental
Conclusions:
1. The information presented i n t h i s study ind ica tes the degree of mixing c r i t i c a l solvents with an appropriate component whose hydrogen bonding or polar i ty w i l l enhance the separation of a c lose boi l ing mixture of butene-butadiene.
2. A maximum value i n the s e l e c t i v i t y of 1.4 - 1.8 can be achieved with a 5 - 8% ammonia concentration i n ethylene f o r the butadiene - butene separation. This i s in agreement with the predictions of the Ely-Mansoori equation of s t a t e . by the model, suggesting the synerg is t ic e f f e c t of the ammonia i n the solvent ra ther than a concentration e f f e c t which i s proportional t o the added en t ra iner .
However, the presence of a maximum i n the s e l e c t i v i t y i s ' n o t predicted
3. Ethylenefammonia mixtures a r e more e f f ec t ive solvents f o r the separation of t h i s mixture than is ethane/ammonia mixture with the same concentration of ammonia. I t is suggested tha t ethylene because of i t s g rea t e r chemical s i m i l a r i t y i n the butenefbutadiene so lu t ion exe r t s a g rea t e r influence on the binary ac t iv i ty coe f f i c i en t s of the system.
221
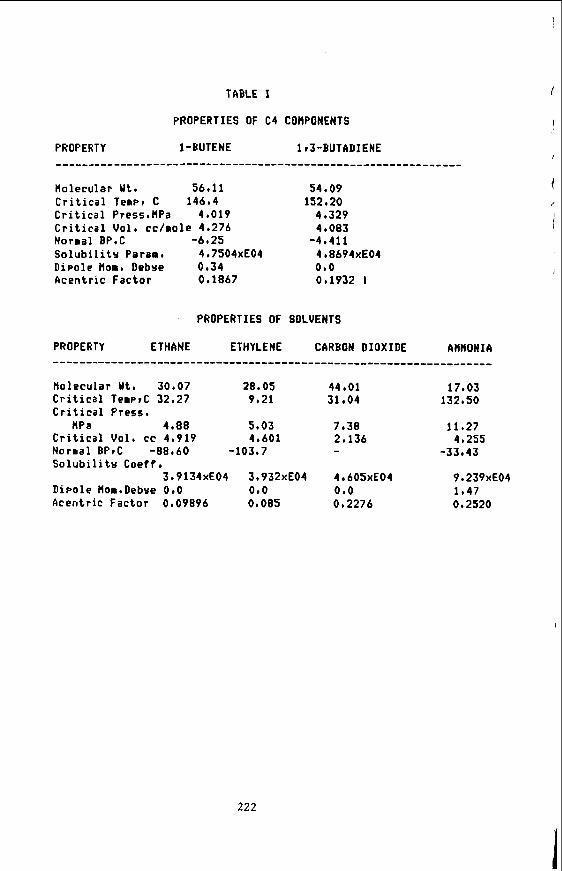
TABLE I
PROPERTIES OF C4 CONPONENTS
PROPERTY 1 -BUTENE 1r3-BUTADIENE
Holecular U t . 56.11 C r i t i c a l T e w v C 146.4 C r i t i c a l Press.flPa 4.019 C r i t i c a l V o l t c c / r o l e 4,276 Normal- BP .C -6 25 S o l u b i l i t y Param. 4.7504xE04 D ipo le nom. Debre 0.34 Acent r i c Fac to r 0,1867
54 s 09 152.20
4.329 4.083
-4.411 4.8694xE04 0.0 0.1932 I
PROPERTIES OF SOLVENTS
PROPERTY ETHANE ETHYLENE CARBON DIOXIDE ANHONIA
f lo lecu la r U t . 30.07 28.05 C r i t i c a l TewtC 32.27 9.21 C r i t i c a l Press.
HPa 4.88 5.03 C r i t i c a l U o l . cc 4,919 4.601 Normal EPIC -88.60 -103.7 S o l u b i l i t r Coetf.
D ipo le flom+Debue 0 . 0 0 .0 Acent r i c Fac tor 0.09896 0 e 085
3.9134xE04 3.932xE04
222
44.01 31 e 0 4
7.38 2.136 - 4 605xE04 0.0 0 e 2276
17.03 132.50
11.27
-33.43 4 t 255
9 e 23hE04 1.47 012520
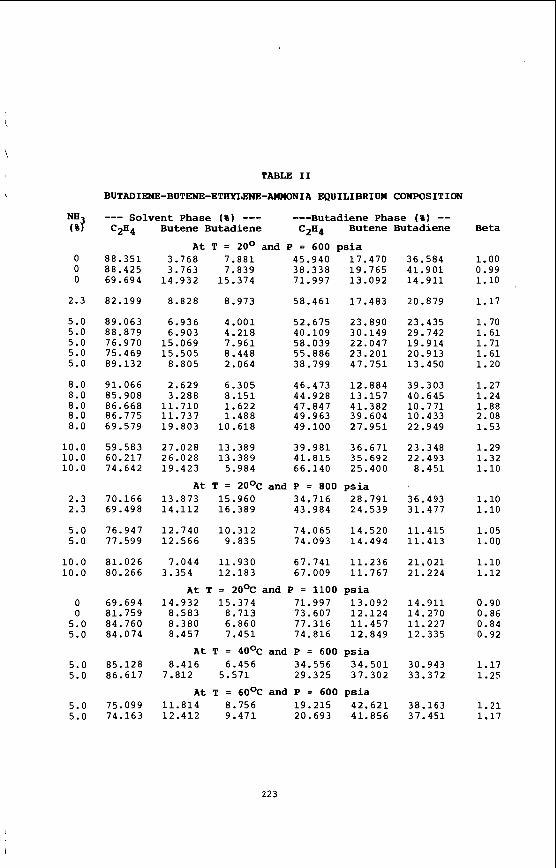
\
NH ( O f
0 0 0
2.3
5.0 5.0 5.0 5.0 5.0
8.0 8.0 8.0 8.0 8.0
10.0 10.0 10.0
2.3 2.3
5.0 5.0
10.0 10.0
0 0
5.0 5.0
5.0 5.0
5.0 5.0
TABLE I1
BUTADIENE-BUTENE-ETHYLENE-AnnONIA EQUILIBRIUU COMPOSITION
Solvent Phase ( $ 1 --- ---Butadiene Phase ($1 -- --- '2'4
88.351 88.425 69.694
82.199
89.063 88.879 76.970 75.469 89.132
91.066 85.908 86.668 86.775 69.579
59.583 60.217 74.642
70.166 69.498
76.947 77.599
81.026 80.266
69.694 81.759 84.760 84.074
85.128 86.617
75.099 74.163
Butene Butadiene C2B4 Butene Butadiene
A t T = 20° and P = 600 ps ia 3.768 3.763
14.932
8.828
6.936 6.903
15.069 15.505 8.805
2.629 3.288
11.710 11.737 19.803
27.028 26.028 19.423
7.881 7.839
15.374
8.973
4.001 4.218 7.961 8.448 2.064
6.305 8.151 1.622 1.488
10.618
13.389 13.389 5.984
45.940 38.338 71.997
58.461
52.675 40.109 58.039 55.886 38.799
46.473 44.928 47.847 49.963 49.100
39.981 41.815 66.140
17.470 19.765 13.092
17.483
23.890 30.149 22.047 23.201 47.751
12.884 13.157 41.382 39.604 27.951
36.671 35.692 25.400
A t T = 2OoC and P = 800 psia 13.873 15.960 34.716 28.791 14.112 16.389 43.984 24.539
12.740 10.312 74.065 14.520 12.566 9.835 74.093 14.494
7.044 11.930 67.741 11.236 3.354 12.183 67.009 11.767
A t T = 2OoC and P = 1100 psia 14.932 15.374 71.997 13.092 8.583 8.713 73.607 12.124 8.380 6.860 77.316 11.457 8.457 7.451 74.816 12.849
A t T = 40°C and P = 600 psia 8.416 6.456 34.556 34.501
7.812 5.571 29.325 37.302
A t T = 6OoC and P = 600 ps ia 11.814 8.756 19.215 42.621 12.412 9.471 20.693 41.856
36.584 41.901 14.911
20.879
23.435 29.742 19.914 20.913 13.450
39.303 40.645 10.771 10.433 22.949
23.348 22.493 8.451
36.493 31.477
11.415 11.413
21.021 21.224
14.911 14.270 11.227 12.335
30.943 33.372
38.163 37.451
Beta
1.00 0.99 1.10
1.17
1.70 1.61 1.71 1.61 1.20
1.27 1.24 1.88 2.08 1.53
1.29 1.32 1.10
1.10 1.10
1.05 1.00
1.10 1.12
0.90 0.86 0.84 0.92
1.17 1.25
1.21 1.17
223
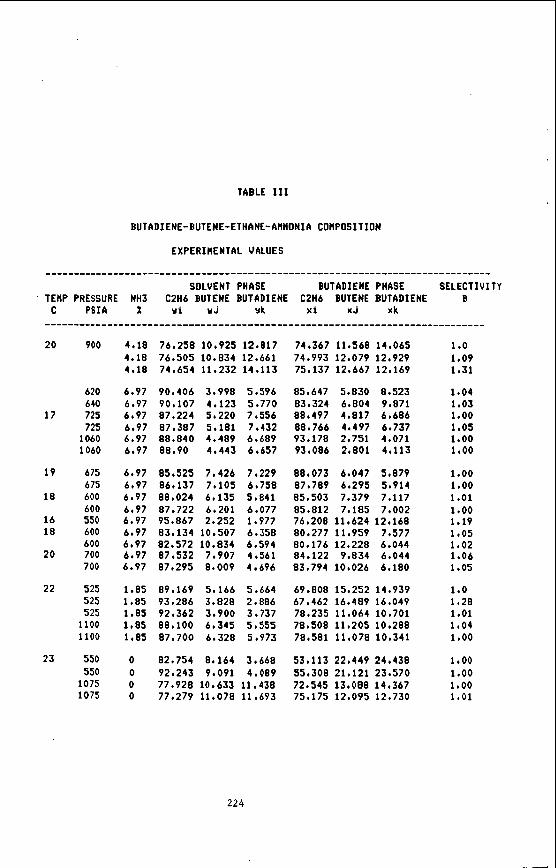
TABLE 111
BUTADIENE-BUTENE-ETHANE-AMHONIA COHPOSITION
EXPERIHENTAL VALUES
SOLVENT PHASE BUTADIENE PHASE SELECTIVITY TEHP PRESSURE NH3 C2H6 BUTENE BUTADIENE C2H6 BUTENE BUTADIENE B
C P S I A X r i YJ Yk xi xJ xk
20
17
19
18
16 10
20
22
23
900
620 640 725 725
1060 1060
675 675 600 600 550 600 600 700 700
525 525 525
1100 1100
550 550
1075 1075
4.10 76.250 10.925 12.817 4010 76.905 10.034 12.661 4.10 74.654 11,232 14.113
6.97 90+406 3.990 5.596 6.97 90.107 4.123 5.770 6.97 87.224 5.220 7.556 6.97 87.307 5.101 7.432 6.97 88.840 4.409 6.689 6.97 00,30 4.443 6.657
05 t 525 06.137 88.024 07.722 95 e 067 03.134 02 t 572 07.532 07.295
7.426 7.105 6.135 6.201 2.252
10.507 10.034
7.907 0.009
7.229 6.750 5.041 6.077 1 .977 6 350 6,594 4.561 4 696
1.05 09.169 5.166 5.664 1.05 93.286 3.828 2.006 1.85 92.362 3.900 3.737 1.85 80,100 6.345 5.555 1.05 87.700 6.320 5.973
0 82.754 0.164 3.660 0 92.243 9r091 4.089 0 77.920 10.633 11.430 0 77.279 11.070 11.693
74.367 11.568 14.065 74.993 12.079 12.929 75.137 12.667 12.169
05.647 5.030 0.523 83,324 6.004 9.071 00.497 4.017 6.686 08.766 4.497 6.737 93.170 2.751 4.071 93.006 2.001 4.113
00.073 6.047 5.079 87.709 6.295 5.914 05.503 7.379 7.117 05.812 7.185 7.002 76.208 11.624 12.160 00.277 11.959 7.577 00.176 12.220 6.044 04.122 9.034 6.044 83.794 101026 6.100
6?*000 15,252 14.939 67.462 16.409 16.049 70.235 11.064 10.701 70.500 11,205 10.200 70.581 11,078 10.341
53.113 22.449 24.430 55.300 21,121 23,570 72.545 13.080 14.367 75.175 12.095 12.730
1 .o 1 eo9 1.31
1.04 1 e03 1.00 1.05 1.00 1 eo0
1.00 1.00 1 . O l 1-00 1.19 1.05 1.02 1.06 1 .os
1 .o 1.20 1.01 1.04 1.00
1.00 1.00 1.00 1e01
224
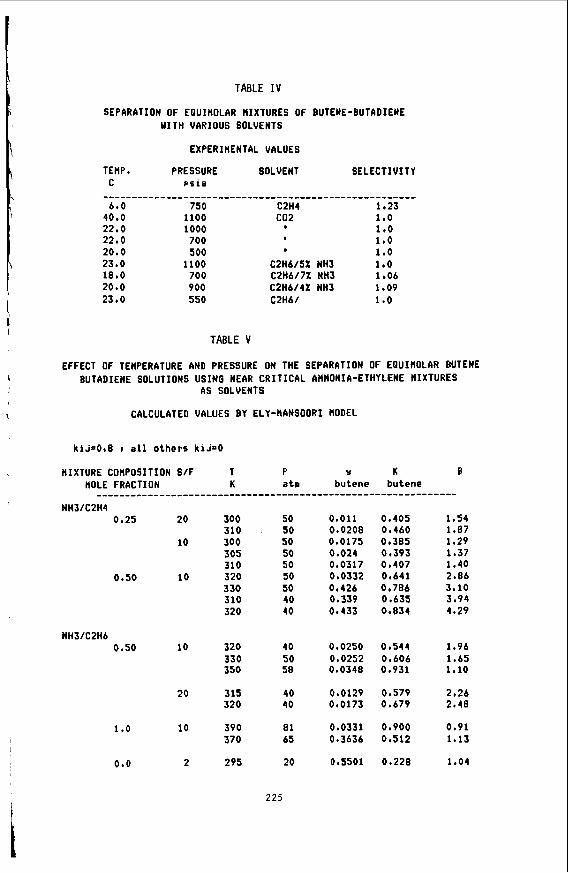
TABLE IV
SEPARATION OF EQUIHOLAR MIXTURES OF BUTENE-BUTADIENE YITH VARIOUS SOLVENTS
TEMP. C
6.0 40.0 22.0 22.0 20.0 23.0 18.0 20.0 23.0
--------___
EXPERIMENTAL VALUES
PRESSURE P s i a
750 1100 1000 700 500
1100 700 900 550
.---------------
SOLVENT
.---------------- C2H4 c02 I
. C2H6/5X NH3 C2H6/7% NH3 C2H6/4% NH3 C2H6/
SELECTIVITY
------------ 1.23 1.0 1.0 1.0 1 .o 1.0 1 r06 1.09 1 r O
TABLE V
EFFECT OF TEMPERATURE AND PRESSURE ON THE SEPARATION OF EQUIMOLAR BUTENE BUTADIENE SOLUTIONS USING NEAR CRITICAL AMMONIA-ETHYLENE HIXTURES
AS SOLVENTS
CALCULATED VALUES BY ELY-MANSOORI HODEL
ki.i=O18 t a l l others kiJ=O
MIXTURE COHPOSITION S/F T P HOLE FRACTION K a t a _-_____--______------------------------
N H 3 I C 2 H 4 0.25 20 300 50
310 . 50 10 300 so
305 50 310 50
0.50 10 320 50 330 50 310 40 320 40
Y
butene --------- 0,011 0.0208 0.0175 0.024 0.0317 0.0332 0.426 0.339 0.433
K butene .---------
0.405 0 t 460 0.385 0.393 0 407 0.641 0,786 0 e 635 0.834
6
----- 1.54 1.87 1.29 1 e37 1.40 2.86 3.10 3.94 4.29
NH3/C2H6 0.50 10 320 40 0.0250 0.544 1.96
330 50 0.0252 0.606 1.65 350 58 0.0348 0.931 1.10
20 315 40 0.0129 0.579 2.26 320 40 0.0173 0.679 2.48
1 e o 10 390 8 1 0.0331 0.900 0.91 370 65 0.3636 0.512 1.13
0.0 2 295 20 0.5501 0.228 1.04
225
References:
1. Prausnitz, J .M. ,"Molecular Thermodynamics of Fluid Phase Equilibria", Chap.
2. Poffenberger,N,Horsley,L.H.Nutting,H.S.,Trans. AIChE,42,815,(1946) 3. Joshi ,D.K,Prausnitz ,J .M. ,AIChE Jour.30,522 ,( 1984) 4. Todd, D.B.,Elgin,AIChE Jour.1,20,(1955) 5. Weinstock,J.J. ,Elgin,J.C. ,Jour Chem Engr.Data,4,3,(1959) 6. Fogel,W.Arlie,J.P.,Revue Franc. Petrole,39,617,(1984) 7. Brule,M.R.,Corbett,J.C.,Hydrocarbon Process. 73,(1984)June 8. Starling,K.E.,Khan,M.A.,Watanasiri,S.,Fundamental Thermodynamics
of Supercritical Extraction, Presented Annual Mtg AIChE, San Francisco,Ca. (1984)
10,Prentice Hall, N.Y .(1969)
9. Prauanitz, J.M.,Fluid Phase Equi1.,14,1,(1983) lO.Cotterman,R.L.,Dimitrelis, D.,Prausnitz,J.M.,Ber. Bunsen Gelsch. Phy und
ll.Reid,R.C. ,Schmitt,N.J.,The Influence of Solvent Gas on the Solubility and Chem,9,796 ,(1984)
Selectivity in SC Extraction, Presented Annual Mtg AIChE., San Francisco (1984)
12.Vasilakos,N.P.,Dobbs,J.M., Parisi,A.S., IEC Process Design,24,121,(1985) 13.Brunner, G. Fluid Phase Equil, Part II,10,289,(1983) 14 ,Treyba 1 ,R . E. ,"Liquid Extract ion" 2nd Ed .McGraw-Hi 11 ,N .Y . ( 1963 ) 15.Prigogine,I.,Bull SOC. Chim,Belg.,52,115,(1943) 16 .Eckert ,C.A., Greiger, R.A. ,IEC Process Design,6,250 ,( 1967) 17.Mansoori.G.A.,Ely,J.F.,Density Expansion Mixing Rules,Unpublished (1984) 18.Lentz,H, Franck,E.U.,Extraction by SC Gases, Ed.Schneider,G.M.
19.Fong,W.s. ,et a1,Experimental Observations on Systematic Approach to
Orleans ,La. ( 1981) 2O.Van Konynenburg, P.H.,Scott,R.L.,Phil. Trans.,Royal Soc.,298,495,(1980)
Verlag Chemie, ( 1980)
SC Extraction of Coa1,Presented at National Mtg AIChE, New
Acknowledgement :
We are grateful to the AMOCO Chemical Corp. for their support for this work. In particular we express our appreciation for the interest shown in this work by D.E.Hannemann and P.Thornley and to Frank Brooks for his industry and care in carrying out these experiments.
226
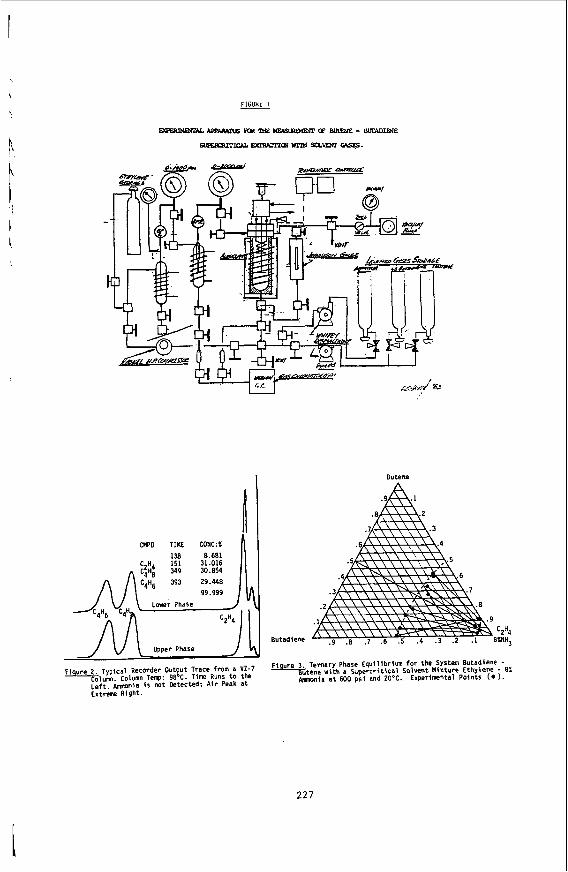
FlGUHt 1
n
\
Butene
CWD TIME C0NC:Z A I
F t ure 2 -lum. Column Temp: 98'C. Time Runs t o the
Typical Recorder Output Trace from a '42-7
left. Ammnia is not Detected; Air Peak a t
Butadiene
.1 .9
\ \ \ \ \ \ \ \ - \ \ \ \ \ \ -
'2"4 .9 .B . I .6 .5 .4 . 3 .2 .1 BINH3
F i ure 3. Ternary Phase Equilibrium for the System Butadiene - 9 - - 8 3 t e n e With a Supercrit ical Solvent Mixture Ethylene - 8%
Experimental Points ( 0 ). m n i a a t 600 psi and 20Oc.
E;t& Right.
22 7
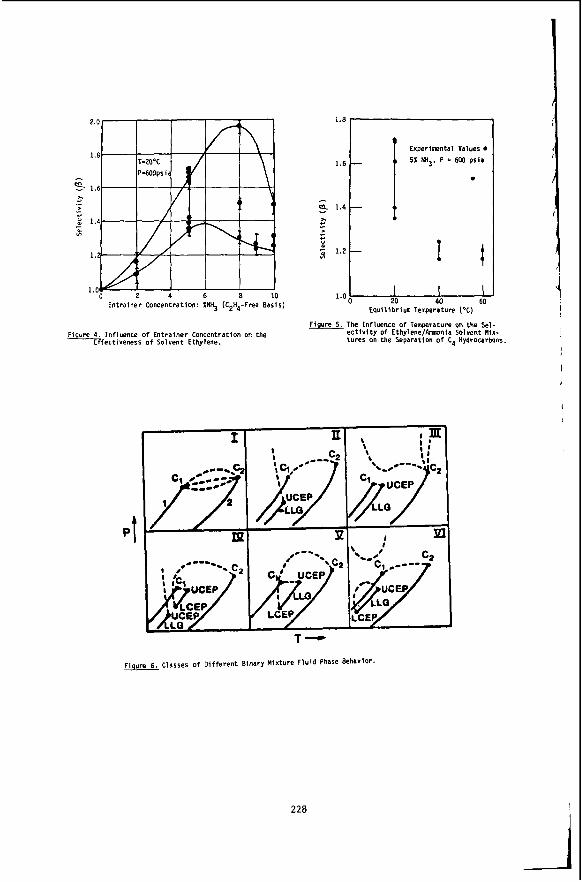
Entrainer Concentration: XNH) (C2H4-Free Basis)
I
r c 0
Experimental Values 0
5% NH3. P 600 psia
0
I t 1.0 ow 20 40 60
Equllibrium Temperature ("C)
Figure 4+ Inf!uence o f Entrainer Concentration on the E fectiveners o f Solvent Ethylene.
Fiqure 5. The Influence of Temperature on the Sel- e c t i v i t y o f EthylenelAmmnia Solvent Nix- tures on the Separation of C4 Hydrocarbons.
I
P t
I
P I
T-
Figure 6. Classes o f Different Binary Mixture Fluid Phase Behavior.
228
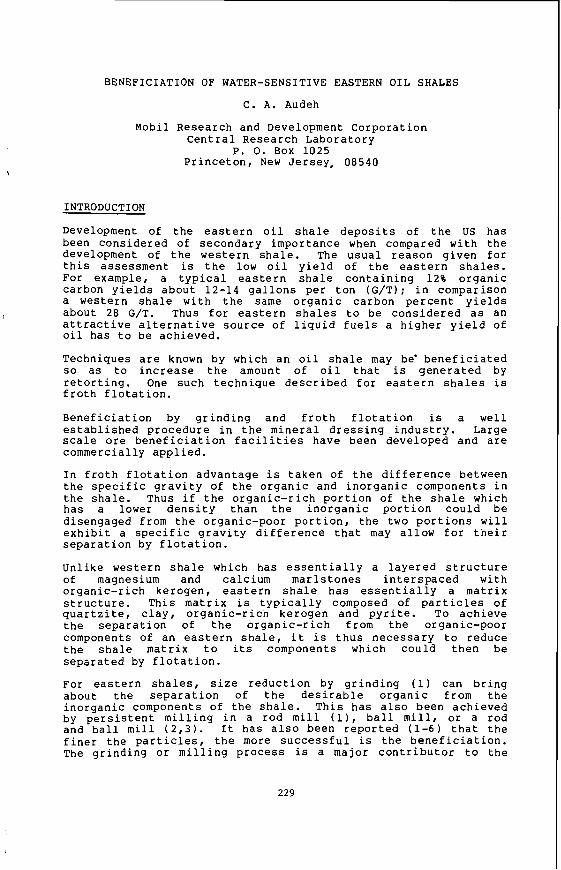
BENEFICIATION OF WATER-SENSITIVE EASTERN OIL SHALES
C. A. Audeh
Mobil Research and Development Corporation Central Research Laboratory
P. 0. Box 1025 Princeton, New Jersey, 08540
INTRODUCTION
Development of the eastern oil shale deposits of the US has been considered of secondary importance when compared with the development of the western shale. The usual reason given for this assessment is the low oil yield of the eastern shales. For example, a typical eastern shale containing 12% organic carbon yields about 12-14 gallons per ton (G/T); in comparison a western shale with the same organic carbon percent yields about 28 G/T. Thus for eastern shales to be considered as an attractive alternative source of liquid fuels a higher yield of oil has to be achieved.
Techniques are known by which an oil shale may be' beneficiated so as to increase the amount of oil that is generated by retorting. One such technique described for eastern shales is froth flotation.
Beneficiation by grinding and froth flotation is a well established procedure in the mineral dressing industry. Large scale ore beneficiation facilities have been developed and are commercially applied.
In froth flotation advantage is taken of the difference between the specific gravity of the organic and inorganic components in the shale. Thus if the organic-rich portion of the shale which has a lower density than the inorganic portion could be disengaged from the organic-poor portion, the two portions will exhibit a specific gravity difference that may allow for their separation by flotation.
Unlike western shale which has essentially a layered structure of magnesium and calcium marlstones interspaced with organic-rich kerogen, eastern shale has essentially a matrix structure. This matrix is typically composed of particles of quartzite, clay, organic-rich kerogen and pyrite. To achieve the separation of the organic-rich from the organic-poor components of an eastern shale, it is thus necessary t o reduce the shale matrix to its components which could then be separated by flotation.
For eastern shales, size reduction by grinding (1) can bring about the separation of the desirable organic from the inorganic components of the shale. This has also been achieved by persistent milling in a rod mill (11, ball mill, or a rod and ball mill (2,3). It has also been reported (1-6) that the finer the particles, the more successful is the beneficiation. The grinding or milling process is a major contributor to the
229
cost of beneficiation. It has been estimated (7) that 45% of the cost of beneficiation accrues to the grinding step with energy the major component.
Although water has been used for dust control and lubrication during grinding, it has not been used as the main medium for size reduction. Earlier work at Mobil (8) has shown that when a water slurry of an eastern shale is stirred, the shale particles crumble and lose their shape and size. This suggested the use of agitated water slurries of the shale as a means of size reduction and flotation.
EXPERIMENTAL
Apparatus
The beneficiation apparatus consisted of two components, a flotation cell and a circulating pump. Figure 1 depicts the flotation cell used. A TEEL pump manufactured by Dayton Electric Co., Model IP 810, equipped with 2 1/4 inch diameter flexible impeller driven by a 1/4 HP electric motor was used to circulate the shale and reduce its size. The outlet of the flotation cell was attached to the inlet of the impeller pump and the pump outlet was attached to the inlet of the flotation cell. A 1/2 inch 25 micron frit was used to support the shale slurry and to supply the frothing gas.
A DuPont thermogravimetric analyzer (TGA) was used to determine the weight loss: heat up rate was 10°C/min. Air or argon was used to sweep the volatiles during thermal decomposition of the kerogen.
Procedure
In a typical experiment about 750ml of water was placed in the flotation cell and the pump started. About 509 of 8-mesh shale was then added to the circulating water and the slurry was allowed to circulate for 30-60 minutes.
About 0. lg of sodium dodecylbenzenesulf onate was then added to the slurry and the mixture circulated for 10 minutes. Flotation gas was then turned on to generate, a foam with small bubbles and the f l o w adjusted so as to achieve a steady flow of foam at the foam outlet of the flotation cell.
Samples of the foam were collected at predetermined intervals. Each sample was filtered, Biichner, and the collected solid washed well, and dried to constant weight at room temperature at a pressure of about 0 .05 mm Hg, weighed and analyzed.
In TG analyses care was taken to use an amount of shale that gave a uniform layer of shale on the TGA balance. Usually a 20-25 mg sample was satisfactory.
RESULTS AND DISCUSSION
Shale Particle Size Reduction
Earlier work on eastern shale at Mobil (8) has shown that some shales are friable when wet. It was observed, for example,
230
that when a slurry of 8-mesh New Albany shale was stirred gently, most of the shale became smaller than the original 8-mesh size. It was clear that wet New Albany shales yield and crumble under the impact of the Teflon blade of a glass stirrer. This observation suggested to us the use of an impeller slurry pump as a means of size reduction. It was reasoned that when the impeller struck the wet shale particles, they would break down and crumble.
After several experiments with different impellers it was concluded that the impact of the impeller on the wet shale reduced the particle size of the shale but the particle size was not small enough to bring about flotation. However, when a slurry pump equipped with a flexible impeller was used, the shale size was sufficiently reduced for its flotation. This size reduction was brought about by the scraping action of the flexible impeller over the wet shale. As the impeller moved in its housing, the shale particles were trapped by the flexible vanes and scraped over the metal surface of the impeller housing; this scraping action brought about the size reduction.
Shale Flotation
Several attempts were made to apply the sink/float procedure ( 9 ) for beneficiating the shale particles generated by the action of the impeller pump. The fine shale was mixed with brines of various densities and allowed to segregate into lighter and heavier portions. Brines containing calcium chloride or calcium bromide with densities in the range of 1.05-1.64 g/cc were used. In all sink/float attempts little or no beneficiation took place.
The same brines were also used as the liquid medium of the shale slurry and circulated by the impeller pump followed by flotation. Although size reduction was affected, little or no beneficiation took place. In one example a brine with a density of 1.105 g/cc produced a small fraction containing 41% more carbon than the raw shale; organic carbon was increased from 12.83% to 18.10% by weight.
After the unsuccessful experiments with the various brines a slurry composed of 509, 8-mesh shale and 750 ml water containing 0.013% by weight (0.19) sodium dodecylbenzenesulfonate was circulated and was successfully beneficiated. The shale used in all these studies was a well characterized New Albany shale containing little or no carbonate carbon. Table 1 presents the elemental analyses of the raw shale and shows the yields of products obtained in the Fischer assay and selected properties and elemental composition of the oil and spent shale. The carbon content of the oil represents a 33% conversion of the carbon of the raw shale to oil. This level of carbon conversion is typical of eastern shales (10) and serves to illustrate the need for beneficiation.
Table 2 shows the elemental analyses and amounts of the beneficiated fractions of the New Albany shale studied. About 17% by wt of the shale has over 32% by weight carbon, a 2.5 fold carbon beneficiation. This 17% fraction contains 45% of the total carbon contained in the 509 sample. About 5% of the
231
The leanest fraction was a finely ground portion of the shale that remained in the flotation cell upon termination of the experiment and was separated from the 8-mesh residue by sieving. This finely ground residue passed a 200 mesh sieve and had a 3% by wt. carbon content. I
I
Estimate of Oil Yield by TGA ,
Since these experiments were carried out on 509 samples of shale, Fischer assay (FA) yields could not be determined on any of the beneficiated shale fractions. Although all beneficiated fractions were analysed for carbon and hydrogen content, Table 2, it was considered necessary to estimate their oil yield potential. ,
It has been shown (11) that small samples, 1 or 2 mg, could be I
generating potential of shales. Also, thermogravimetric (TG) analysis techniques have been used to compare shales by determining relative weight loss profiles (12,131. Weight loss from three shales of known FA yield, including the shale used in this study, was determined by TGA, Table 3. The New Albany shales have similar weight loss in TGA and have FA yields consistent with such weight loss. Also the western shale which is known to produce more oil per percent organic carbon than the eastern shales shows the same trend in the TGA.
By combining elemental analyses of the beneficiated shale fractions with their TGA weight loss and using the data for shales with known FA yields an estimate of the FA yields of the fractions could be made, Table 4 . The two fractions with the highest carbon contents also have the highest weight loss in argon. Weight loss in air was also determined, Table 5, and shows that the raw shale and the unground residue have the same weight loss. Considering the elemental composition and the TGA weight loss in argon of both samples, it was concluded that the unground residue is unbeneficiated shale. The recovered unground material was similar in appearance to the raw shale and crumbled when wet. It was reasoned that this material must have been trapped at the bottom of the flotation cell and was not carried into the pump housing where size reduction takes place.
TGA weight loss in air when compared to weight loss in argon is one measure of how well carbon conversion to oil takes place during thermal decomposition of a kerogen. A spent shale with a high char content will loose that char by oxidation when air is the sweep gas. A high char content is an indication of poor organic carbon conversion to oil. The beneficiated fractons do not generate char to the same extent as the raw shale. Whereas
used in thermal decomposition studies for comparing the oil I
232
the weight loss in argon of the raw shale is 36% of that in air, that of the beneficiated fractions is 65%. It is possible that the inorganic matrix, in the raw shale, especially the Pyrite, contributes to the inefficient conversion of the kerogen to oil.
Although the sulfur content of the beneficiated shale increases relative to that of the raw shale, the ratio of carbon to sulfur is higher, 5.22 vs. 2.69, and that of sulfur to hydrogen is lower 2.30 vs 3.38. Pyrite in shales is a hydrogen consumer (14) and competes with carbon for the available hydrogen during thermal conversion of kerogen to product oil. Shales containing pyrite are known to produce significant amounts of hydrogen sulfide (15).
\
\
CONCLUSIONS
A new approach to size reduction followed by froth flotation to beneficiate water-sensitive eastern shales coupled with thermogravimetric analysis has been investigated. Organic-rich fractions with 3.5 times the oil generating capacity of the raw shale were prepared by this procedure. It is suggested that this procedure be used as a screening test for the applicability of flotation to the beneficiation of shales.
REFERENCES
1. H. S . Hanna and W. E. Lamont, AIChE 1982 Summer National Meeting, August 1982, Cleveland, Paper No. 35A.
2. U.S. D.O.E. Contract ET 78 Col 2628, December 31, 1982.
3. P. H. Fahstrom, 12th Oil Shale Symposium, Golden, Colorado, April 1979.
4. News Feature, Chemical Engineering, February 22, 1982, p.
5. Synthetic Fuels Report, September 1982, p. 2-10.
6. Synthetic Fuels Report, June 1983, p. 2-28.
37.
7. J. D. Miller, U.S. Patent NO. 4,279,743, July 21, 1981.
8. c. A. Audeh, J. J. Dickert and P. E. Fowles, U . S . Patent
9. c. J. Vadovic ACS Symposium Series #230, 1983, p. 385.
4,466,882, August 24, 1984.
10. A. M Rube1 and T. T. Coburn, 1981 Eastern Oil Shale Symposium Proceedings, Lexington, Kentucky, November, 1984, p. 21.
11. J. W. Reasoner, L. Sturgeon, K. Naples and M. Margolis, 1981 Eastern Oil Shale Symposium Proceedings, Lexington, Kentucky, November, 1981, p. 11.
12. R. A. Addington , J. P. Humphrey, and E. M. Piper, 1983, IGT Symposium Synthetic Fuels from Oil Shale and Tar Sands, Louisville, Kentucky, May 17-19, 1983, P. 497.
233
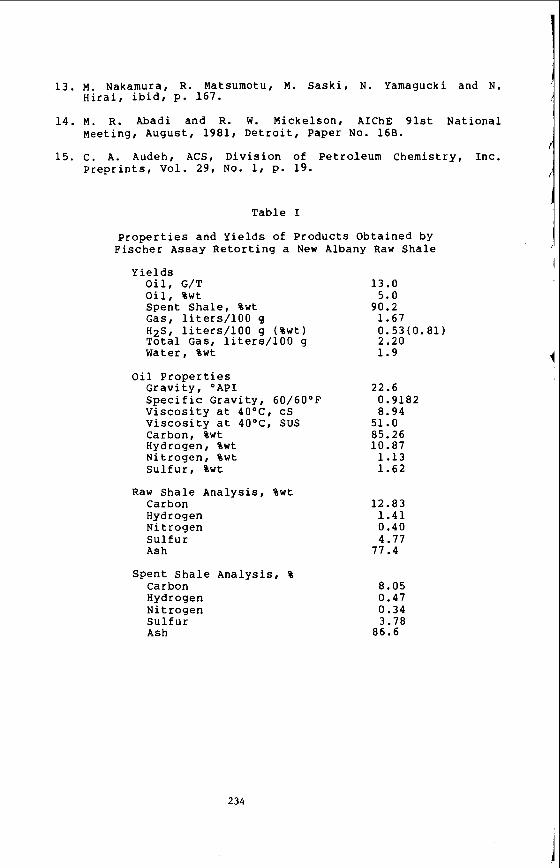
13. M. Nakamura, R. Matsumotu, M. Saski, N. Yamagucki and N.
14. M. R. Abadi and R. W. Mickelson, AIChE 91st National
Hirai, ibid, p. 167.
Meeting, August, 1981, Detroit, Paper No. 16B.
15. C. A. Audeh, ACS, Division of Petroleum Chemistry, Inc. preprints, Vol. 29, NO. 11 p. 19.
Table I
properties and Yields of Products Obtained by Fischer Assay Retorting a New Albany Raw Shale
Yields Oil, G/T 13.0 Oil, %wt 5.0 Spent Shale, %wt 90.2 Gas, liters/100 g 1.67 H2S, liters/100 g (%wt) 0.53(0.81) Total Gasr liters/100 g 2.20 Water , %wt 1.9
Oil Properties Gravity, OAPI Specific Gravity, 6O/6O0F Viscosity at 4OoC, CS Viscosity at 4OoC, SUS Carbon , %wt Hydrogen, %wt Nitrogen, %wt Sulfur, %wt
22.6 0.9182 8.94 51.0 85.26 10.87 1.13 1.62
Raw Shale Analysis, %wt Carbon 12.83 Hydrogen 1.41 Nitrogen 0.40 Sulfur 4.77 Ash 77.4
Spent Shale Analysis, % Carbon 8.05 Hydrogen 0.47 Nitrogen 0.34 Sulfur 3.78 Ash 86.6
234
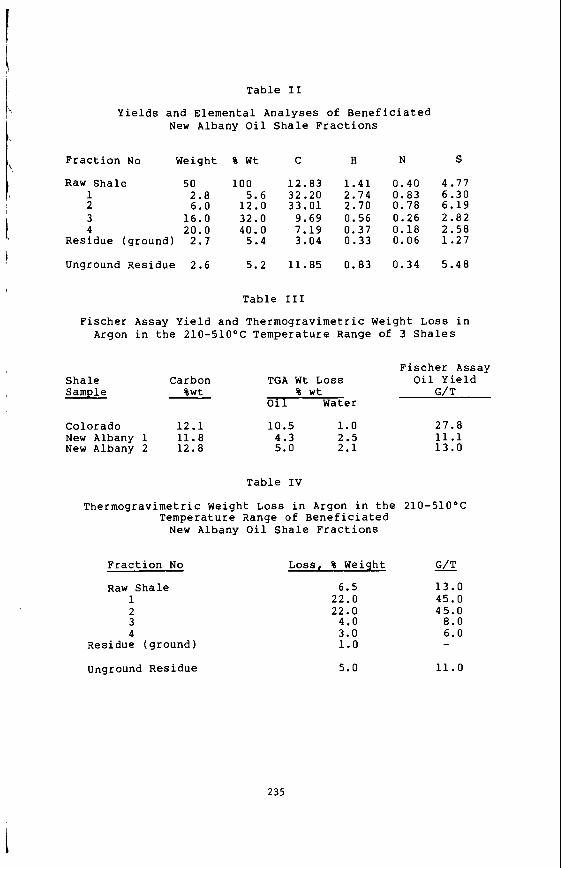
I Table I1
Yields and Elemental Analyses of Beneficiated New Albany Oil Shale Fractions
Fraction No Weight % Wt C H N S \
Raw Shale 50 100 12.83 1.41 0.40 4.77 1 2.8 5.6 32.20 2.74 0.83 6.30 2 6.0 12.0 33.01 2.70 0.78 6.19 3 16.0 32.0 9.69 0.56 0.26 2.82 4 20.0 40.0 7.19 0.37 0.18 2.58 I, Residue (ground) 2.1 5.4 3.04 0.33 0.06 1.27
Unground Residue 2.6 5.2 11.85 0.83 0.34 5.48
I> I
I
I
Table I11
Fischer Assay Yield and Thermogravimetric Weight Loss in Argon in the 21O-51O0C Temperature Range of 3 Shales
I \ Fischer Assay
, Sample %wt % wt G/T Shale Carbon TGA Wt LOSS Oil Yield
Oi 1 Water
Colorado 12.1 New Albany 1 11.8 New Albany 2 12.8
Thermogravimetric
10.5 1.0 27.8 4.3 2 . 5 11.1 5.0 2.1 13.0
Table IV
3ight Loss in Argon in the 210-510°C Temperature Range of Beneficiated New Albany Oil Shale Fractions
Fraction No Loss, % Weight - G/T
Raw Shale 6.5 13.0 1 22.0 45.0 2 22.0 45.0 3 4.0 8.0
3.0 6.0 4 - Residue (ground) 1.0
Unground Residue 5.0 11.0
235
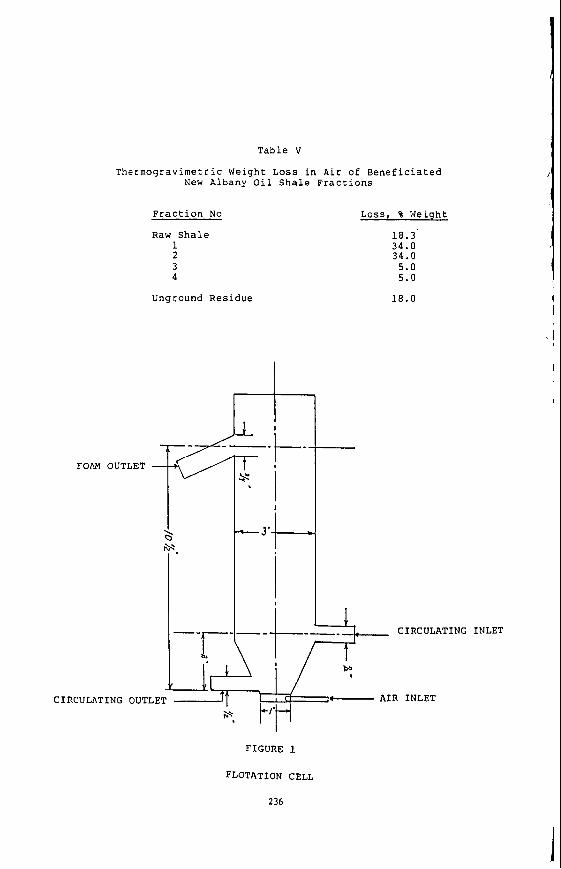
Table V
Thermogravimetric Weight Loss in Ai r of Beneficiated New Albany Oil Shale Fractions
FOAM OUTLET
Fraction No Loss, % Weight
Raw Shale 1 2 3 4
18.3 34.0 34.0 5.0 5.0
Unground Residue 18.0
q / I
- - I - - AIR INLET i
CIRCULATING OUTLET
FIGURE 1
FLOTATION CELL
236
'\
I
COMBINED BENEFICIATION AND WDRORETORTING OF OIL SHALE R. Bruce Tippin, University of Alabama P. 0. Box AY, University, AL 35486
and
Raymond C. Rex, WCRUDE Corporation 10 West 35th S t r e e t
Chicago, I l l i n o i s 60616
ABSTRACT
The Mineral Resources I n s t i t u t e (MRI) of The University of Alabama and I n s t i t u t e of Gas Technology subsidiary, HYCRUDE Corporation, a r e evaluat ing t h e po ten t i a l bene f i t s of combining pre-concentration of o i l shale by f r o t h f l o t a t i o n followed by hydroretorting t o recover the oi l . Exploratory laboratory t e s t i n g of s eve ra l o i l shales has been completed i n a continuing research program. Devonian N e w Albany sha le from Indiana, an upper Chattanooga shale from Alabama and a Permian I r a t i shale from Brazi l .
To date the t e s t i n g includes a sample of Upper
Results of f l o t a t i o n tests of the th ree samples showed t h a t t he o i l content i n the beneficiat ion concentrates was increased by a f ac to r of 2 t o 3 with recoveries up t o 90 percent. to HYCRUDE and subjected t o bench sca l e HYTORT processing. The y i e ld was improved f u r t h e r through hydroretorting by a f ac to r between 3 and 5 . 5 .
After br iquet t ing the products, t he MRI beneficiated o i l sha l e s were submitted
INTRODUCTION
Unti l recent years mast of t h e research and development work d i r ec t ed toward e s t ab l i sh ing a domestic o i l shale industry has focused on t h e sha le s of t h e Green River Formation of Eocene age occurring i n Colorado, Utah, and Wyoming. This is l a rge ly because the Western shales a r e r e l a t i v e l y r i c h ( i n the range of 25-30 gal/ ton) and respond favorably t o o i l . p roduc t ion by simple thermal treatment, yielding 75-850 of t h e i r organic content (kerogen) as o i l when pyrolyzed.
Recent developments i n innovative r e t o r t i n g and f i n e p a r t i c l e technologies have a l t e r e d t h i s s i t ua t ion s ign i f i can t ly . The HYTORT process, developed by HYCRUDE Corporation u t i l i z e s hydrogen r i c h gas during r e t o r t i n g to enhance o i l y i e lds f r a n ce r t a in types of o i l shales . It has provided a key t o processing the Devonian- Mississippian sha le s of t h e Eastern United S ta t e s t o achieve oil y ie lds comparable t o those from Colorado shales . This technique permits t h e f u l l e s t possible recovery of o i l f r an the kerogen present i n t h e shale .
The range of po ten t i a l o i l shale resources avai lable t o HYTORT processing can be expanded by combining hydroretorting with The University of Alabama Mineral Resources I n s t i t u t e ' s ( M R I ) physical beneficiat ion process. The MRI process involves f i n e grinding t h e o i l shale matrix followed by se l ec t ive f r o t h f l o t a t i o n of t h e kerogen. During f l o t a t i o n up to th ree quarters of r e l a t ive ly kerogen-free inorganic matter is r e j ec t ed a s waste.
~y combining the HYTORT and MRI processes, t h e economics of t r e a t i n g oil shales can be improved, and t h e range of o i l shales which can be processed is extended. Descriptions of t h e MRI and HYTORT processes, and typ ica l r e s u l t s obtained on o i l shales of low and uoderate kerogen content a r e presented i n t h i s paper.
BACKGROUND The HYTORT Process
o i l sha l e s vary s ign i f i can t ly i n t h e i r a b i l i t y t o produce o i l . For example, the Green f iver o i l sha l e s of t he Western U.S. contain a high hydrogen content i n
237
proportion to organic carbon, and exh ib i t r e l a t i v e l y canplete conversion of kerogen t o 011. However, many other o i l shales including the Eastern U.S. Devonian shales , contain lesser amounts of hydrogen r e l a t ive to organic carbon as shown i n Table 1. of the kerogen which can be converted t o hydrocarbon products by conventional r e to r t ing (1,2) . during r e to r t ing . , Thus a s i g n i f i c a n t l a rge r f r ac t ion of t h e kerogen is converted to hydrocarbon products r a t h e r than remaining i n t h e spent shale i n t h e form of coke. degree of o i l y i e l d enhancement f o r each p a r t i c u l a r o i l shale depends upon the p a r t i a l pressure of hydrogen used.
men r e t o r t e d by conventional thermal processes.
This deficiency i n hydrogen reduces the f r ac t ion
o i l y i e lds f r m these shales can be subs t an t i a l ly improved by supplying hydrogen
The
In 1980 HYCRUDE Corporation was formed t o commercialize the HYTORT process. HYTORT is a process which u t i l i z e s a hydrogen-rich gas f o r t h e hydroretor t ing of o i l shale kerogen to produce a syn the t i c crude o i l . hydrogen-rich atmosphere a t elevated pressure, and enables attainment of t he maximum poss ib l e o i l y i e lds f r m m o s t oil shales . As a r e s u l t of a Development Agreement w i t h P h i l l i p s Petroleum Company, a f e a s i b i l i t y study was conducted by AYCRUDE Corporation, P h i l l i p s Petroleum Company, Bechtel Group, Inc. , and t h e I n s t i t u t e of Gas Technology. The HYTORT process development work during t h e f e a s i b i l i t y study was divided i n t o three bas i c areas:
The hydroretor t ing is ca r r i ed out i n a
chemistry of hydroretor t ing
o Experimental development work to support mechanical design of HYTORT reac to r s
a Process design. r e a c t o r mechanical design. and cos t es t imat ion work.
The HYTORT experimental work and process econanics were cmple t ed i n Hay 1983 and d e t a i l s are ava i l ab le i n o the r publ icat ions (3.4) .
Throughout t h e course of t h e f e a s i b i l i t y study, t h e HYCRUDE Corporation and Bechtel Group, Inc. cont inual ly reviewed t h e experimental e f f o r t s t o assure t h a t t he experimental programs addressed areas important t o the design of cammercial react ions ( 5 ) . This study r e s u l t e d i n a conceptual commercial p l an t design for Eastern U.S. Devonian shale processing based on the r e s u l t s of t h e experimental program. The conceptual HYTORT p lan t f l o w diagram is shown in Figure 1. The p l an t contains a l l t h e process a reas necessary t o produce upqaded s h a l e oil including by-product recovery of su l fu r and ammonia. As designed, t h e HYTORT r e a c t o r s can be constructed using current ly ava i l ab le equipment. A l l o ther processes a r e within the s i z i n g and operat ing cons t r a in t s of commercial f a c i l i t i e s . technology.
Implementation of the p l a n t design can be achieved with current process
Natural gas is u t i l i z e d i n the production of hydrogen and a s an i nd i r ec t heat source for hydroretorting. S t a t e s where inexpensive sources of na tu ra l gas area avai lable . a r e a s lacking an inexpensive natural gas source, t h e HYTORT process conditions would be s e l e c t e d t o provide s u f f i c i e n t by-product gas a s a substitute.
This is an economic optimum f o r a reas such as t h e Eastern United For p l an t s located i n
Althou?h most of t h e HYTORT process development e f f o r t has concentrated on Eocene o i l sha l e s of t he Western U . S . and on Eastern U.S. Devonian o i l sha l e s (1 ,2 ) , HYCRUDE Corporation i n Cooperation with t h e U.S. Geological Survey is conducting work on other o i l sha le s from various loca t ions worldwide. t o detelmine t h e ex ten t of oi l y i e ld enhancement which can be obtained using HYTORT Processing. t o se rve the Same funct ion for HYTORT processing t h a t t h e ASZM D3904-80 Fischer Assay t e s t serves f o r conventional thermal r e to r t ing processes.
The primary goal of t h i s on-going work is
Test work is conducted i n a Hydroretorting Assay u n i t ( 6 ) , which is designed
Table 2 gives r e s u l t s
238
of l iydroretorting Assay t e s t s on some of t h e samples. The data show t h a t HYTORT processing had a wide range of e f f e c t s on t h e sha le s t e s t ed , with o i l y i e ld enhancements varying from no improvement to o i l y i e lds pver four t imes those obtained i n Fischer AaSaY tests. No t rend of behavior with geological age is evident. Further d e t a i l s of these t e s t r e s u l t s a r e avai lable i n a previous publ icat ion ( 4 ) .
The MRI O i l Shale Beneficiat ion Process
Physical beneficiat ion techniques have long been used i n the mineral and coal i ndus t r i e s to obtain a product more enriched i n the economical mineral than t h e run-of-mine ore. const i tuent f r m the associated impurit ies. the r a w mater ia l t o s i z e s f i n e r than t h e i r natural p a r t i c l e s i z e consis t . grinding may d i c t a t e ce r t a in separat ion approaches. This i s p a r t i c u l a r l y important i n the case of oil shales , which a r e f i n e grained sedimentary rocks composed of 10 micron p a r t i c l e s ( 7 ) . Thus u l t r a f i n e grinding of t he shale i s required t o achieve reasonable l i b e r a t i o n of oi l -bear ing kerogen from t h e int imately associated inorganic mineral matter.
A p re requ i s i t e f o r physical separat ion is to f r e e the valuable This is normally achieved by comminution Of
The degree of
Ultraf ine grinding and physical bene f i c i a t ion of f ine ly disseminated ores were once considered impractical . This i s because of t h e general bel ief t h a t t h e grinding cos t s a r e p roh ib i t i ve and t h a t most separat ion techniques a t s i ze s f i n e r than 74 microns (ZOO mesh) a r e ine f f ec t ive ( 8 ) . However, t h i s b e l i e f has been dispel led with t h e continuing engineering advancement i n beneficiat ion equipment and recent advances in f i n e p a r t i c l e technology. Cleveland-Cliffs Iron Company i n t h e Lake Superior Region (9). I n t h i s l a rge tonnage p l a n t t h e hard t acon i t e o re is ground t o a p a r t i c l e s i z e f i n e r than 30 microns (500 mesh) p r i o r t o f lo t a t ion t o recover high grade i ron oxide products. The t echn ica l p r a c t i c a l i t y and economic f e a s i b i l i t y of extremely f i n e grinding of t he hard, tough t a c o n i t e suggests t h a t f i n e grinding and f l o t a t i o n of t h e o i l sha l e should be equally e f f ec t ive .
mis is evidenced by t h e non-magnetic t acon i t e f l o t a t i o n p l a n t of t h e
During t h e past six years of continuing research, MRI has developed a beneficiat ion The process which successful ly concentrates t h e Devonian o i l sha le s of t h e Eastern U.S.
MRI process involves wet grinding the raw sha le t o minus 20 microns followed by f r o t h f l o t a t i o n to recover a kerogen r i ch concentrate. Details of t h e development of this process a re avai lable i n previous pub l i ca t ions (10-12) .
MRI t e s t r e s u l t s have been used to formulate a process flowsheet f o r an oi l sha le beneficiat ion p l an t (Figure 2 ) . t o 3 times a s much recoverable o i l per ton as can be obtained f r an t h e raw untreated shale . p rac t i ce . r e j ec t ed a s a subs t an t i a l ly barren waste which need not be retor ted.
The p l an t is designed to recover concentrates yielding 2
U n i t operations of t h i s p l an t a r e within t h e limits of current commercial In t h e process, a t l e a s t 50% t o as much a s 70% of t h e raw shale w i l l be
The beneficiat ion p l an t includes t h e following standard mineral processing unit operations:
rn Fine grinding of sha le t o mineral p a r t i c l e l i b e r a t i o n s i z e
c l a s s i f i c a t i o n
0 Kerogen f l o t a t i o n
0 Thickening and f i l t r a t i o n
0
rn
Agglomeration or br iquet t ing of t h e f l o t a t i o n concentrate
Disposal, of t h e f l o t a t i o n t a i l i n g
239
Most of t h e bene f i c i a t ion research inves t iga t ions has been directed t o t h e Eastern o i l sha l e deposi ts , p a r t i c u l a r l y the Devonian sha le s outcropping i n Northern Alabama, but several samples from t h e Western United S t a t e s and foreign countr ies a l s o have been t e s t e d i n a cursory way. Typical r e s u l t s a r e shown i n Table 3. Plans a re to evaluate addi t ional types of o i l sha l e s as they become avai lable .
BXPERIMENTAL
The combined bene f i c i a t ion and hydroretor t ing s t u d i e s were conducted on two Eastern o i l sha l e samples (Alabama and Indiana) and one foreign sample (Braz i l ) . The Indiana sample was co l l ec t ed by WCRUDE Corporation from the Upper Devonian New Albany shale formation near Henryville, Indiana. The Alabama sha le sample w a s p a r t of a 5-tOn lot of Upper Chattanooga sha le co l l ec t ed by MRI from t h e Hester Creek area i n Madison County, Alabama. The Brazi l ian oil sha le represents a t yp ica l shale from t h e I r a t i formation i n t h e south of Brazi l . Analyses and Fischer Assay oil y ie lds from the th ree samples and a Western shale a r e shown i n Table 1.
I
/
i
I
Procedures and Techniques
The beneficiat ion t e s t a were conducted a t t he Mineral Resource8 I n s t i t u t e a t t h e University of Alabama. In these t e s t s t he raw sha le samples were s tage crushed d r y t o minus 2 ma (10 mesh) and wet ground i n a 20 x 30 an s t a i n l e s s s t e e l rod m i l l operated a t 780 of c r i t i c a l speed using 26 s t a i n l e s s s t e e l rods of 1.7 cm diameter a s t he grinding medium. A 500-gram charge of each f l o t a t i o n test sample was ground a t 500 s o l i d s in Rlscaloosa t a p water f o r two hours t o reduce t h e p a r t i c l e s to 900 minus 10 microns. Bench scale f l o t a t i o n t e s t s were conducted using a Denver Model D-12 laboratory f lo t a t ion machine for t h e conditioning, roughing and cleaning s teps . The f l o t a t i o n products were f i l t e r e d , d r i ed a t 50.C. weighed and assayed f o r o i l y i e l d using the modified Fischer Assay method. Samples f o r hydroretorting were produced from the f l o t a t i o n concentrate using a uniaxial ccmpression b r ique t t i ng u n i t t o make 1.25 an diamter by 1 an high specimens.
Hydroretorting t e s t s were conducted a t t h e I n s t i t u t e of Gas Technology a t Chicago, I l l i n o i s under t h e sponsorship of HYCRUDE Corporation using a Hydroretorting Assay u n i t designed to evaluate t h e hydroretor t ing c h a r a c t e r i s t i c s of oil shale samples. Details of the apparatus and t h e t e s t procedure have been previously published (6). In t h i s un i t a 100-gram sample of ma te r i a l is reacted with hydrogen gas under the following conditions.
1000 p s i g p re s su re
o. 1 000" F temperature
4 SCF/hr gas flow
25 degree/minute heat-up r a t e
3 0 minutes r eac t ion t i m e
RESULTS AND DISCUSSION
Beneficiation of Raw Oil Shale
Response of t h e o i l sha le samples to bene f i c i a t ion by u l t r a f i n e grinding and f l o t a t i o n a r e given i n Table 4. Good f l o t a t i o n of t he kerogen-enriched f r ac t ions was obtained from the ground shale which indicated t h a t reasonable l i be ra t ion of t h e kerogen and t h e mineral components w a s achieved. As compared to the f l o t a t i o n feed, t h e concentrates recovered from the Alabama and Indiana samples were upgraded i n kerogen by f a c t o r s of 2.4 and 2.8,
A l l t h r ee samples responded favorably to beneficiat ion.
240
respectively. Flotation of the Brazilian shale yielded a concentrate assaying 33.5 gallons per ton, but the ratio of concentration (1.7) was less than that of the American oil shale samples. The variations in the response of the samples to flotaton are attributed to differences in their origin, mineral substrate, and composition. recoveries in all cases were comparable. investigated extensively.at MRI and improvements in the flotation results of the other shales would be expected by further research. Even with the limited number of samples evaluated, it appears reasonable to assume that beneficiation of oil shales can be accomplished with good results.
\
\ The oil
Only the Alabama oil shale has been
Experimental testwork is continuing on this research program at The University of Alabama to further define the beneficiation variables in an efforr to optimize the process. The goal of the research is to establish the technical parameters of the process in a continuous pilot plant operation to define the process economics. testing will also produce a reasonably large quantity of kerogen enriched concentrate which will be used in more extensive hydroretorting tests.
Hydroretorting of Raw Oil Shale
The pilot
Results of Hydroretorting Assay tests on the three raw shale samples are given in
produce oil yields of 222 to 226% of those obtained by conventional thermal retorting. The oil yeild from the Brazilian sample was less, only 156%. The hydroretorting data shows that oil yields of 27 to 29 gallons per ton can be produced fran oil shale resources which would be considered too lean for cammercialization by conventional retorting.
Combined Beneficiation and Hydroretorting of Oil Shale
-. Table 5. Results of the tests of the U.S. samples indicate that the HYTORT process can
Combined MRI beneficiation-HYTORT processing was tested on a laboratory scale by hydroretorting the flotation concentrates of three oil shale samples. Test results are shown in Table 6. The concept proved to be technically successful in substantially increasing the extraction of oil. The data indicate that the combined technique can improve the overall level of oil yield from the raw shale by a factor of 2.9 to 5.6.
CONCLUSIONS
Based on the above results, the potential of the oombined beneficiation- hydroretorting approach is evident in the following areas:
-- Reduction in the capital and operating costs for oil shale production should be possible by substituting atmospheric pressure, ambient temperature, grinding and froth flotation equipment for s o m e of the elevated pressure and temperature W O R T reactor units. Further, because of the enhanced shale oil yields, energy savings should result in a lower cost per barrel of shale oil.
-- Pre-retorting concentration of kerogen from lean shales should extend the range of oil shales which can be considered for c-rcial processing.
-- Rejection of inorganic sulfur (i.e., pyrite) may be possible either by flotation or high-intensity magnetic separation. By removing the pyrite, not only will the kerogen content increase but the overall quality of the concentrate will be enhanced.
-- During grinding, trace elements are solubilized into the process water. the tailings rejected during beneficiation and the spent shale produced by WTORT processing should be less prone to the natural leaching of harmful metals and elements. Thus, surface and groundwater contamination after disposal should be substantialy reduced.
As a result,
241
ACKNOWLEDGEMENTS
HYCRUDE Corporation would l i ke to acknowledge the i n t e r e s t and support of the I n s t i t u t e of Gas Technology, pa r t i cu la r ly D r . F. S. Lou, and Mr. M. J. Roberts, in conducting the hydroretorting assay testwork. The BtaZilian oil shale sample was graciously provided by Mr. Lauro Carts of Petrobras, Pe t ro leo Bras i le ro , S.A.
REFERENCES
1. Janka, J . C. and J. M. Dennison, "Devonian O i l Shale: A Major American Energy Resource," Presented a t the IGT Symposium on Synthetic Fuels from O i l Shale, Atlant8, Georgia, December 3-6, 1979. Published in Proceedings, A p r i l 1980, pp. 22-116.
2 . Matthews, R. D., J. C. Janka, and J. M. Dennison, "New Ins ights i n t o Devonian Oil Shale Resources of the Eas te rn United S ta t e s , " AAPG Bul le t in , Vol. 65, No. 5 (May 1981), pg. 53. Paper presented a t the following meetings: AAPG Eastern Section Meeting, October 1-3, 1980, Evansville. Indiana (AAPG Bul l e t in ) , Vol. 64, No. 8, August 1980, pg. 1285). AAPG Annual Convention, San Francisco, Uay 31 - June 3, 1981.
3. Rex, R. C . , P. A. Lynch, M. J. Roberts, and H. L. Feldkirchner, "Experimental Test Program of the HYTORT F e a s i b i l i t y Study." Symposium, Lexington, Kentucky, November 13-16, 1983. Published in Proceedings, February 1984, pp. 391-229.
Presented a t the 1983 Eastern O i l S h a h
4. Janka, J. C., and R. C. Rex, "Application of the HYTORT Process t o O i l Sha les Throughout the World," Paper presented a t the Summer National Meeting of the American I n s t i t u t e of Chemical Engineers, Philadelphia, Pennsylvania, August 19-22, 1984.
5 . presented a t the 3rd IGT Symposium on Synthe t ic Fuels from O i l Shale and Tar Sands, Louisv i l le , Kentucky, May 17-19, 1983. Published i n Proceedings, Ju ly 1983, pp. 531-544.
6. Assessment," Paper presented a t the J o i n t Fuel/Petroleum Division Meeting of the American Chemical Society, S t . L o u i s , Missouri, Apri l 8-13, 1984.
Rex, R. C., etal, "Selection of a Commercial P lan t Design for the HYTORT Process."
Lynch, P. A . , et., "The Hydroretorting Assay - A New Technique for O i l Shale
7. Nowack, P., O i l Shale Technical Data Handbook, Noyes Data Corporation, Park Ridge, New Jersey (1981).
8.
9 . I ron Ore," Mining Congress. 40-48 (1975).
Somasundaran, P., Ed.
V i l l a r , J. W. and G. A. DaWe, "The Ti lden Mine - A New Processing Technology for
Fine P a r t i c l e s Processing, Pub. A I M E , New York, 1, 2 (1980).
10. Hanna, H. S., and W. E. Lamont, "Physical Beneficiation S tudies O f Eastern O i l Shales," Proceedings of the Symposium on Synthe t ic Fuels from O i l Shale and Tar Sands, Louisv i l le , Kentucky, May 17-19, 1983. Published I G T , pp. 295-321. Ju ly 1983.
11. LamOnt,. W. E . , "Beneficiation of the Kerogen Content of Eastern Devonian O i l Shales by Flotation," Paper No. 83-621, presented a t the SHE-AIME Annual Meeting, Atlanta, Georgia 6-10, 1983.
12. Hanna, H. S. and C. Rampacek. "Eastern O i l Shale Inves t iga t ions a t The University Of Alabama." Presented a t the 1981 Shale Symposium, Lexington, Kentucky, November 15-17, 1981. Published in Proceedings. dated November 1981, pp. 24-25.
242
I
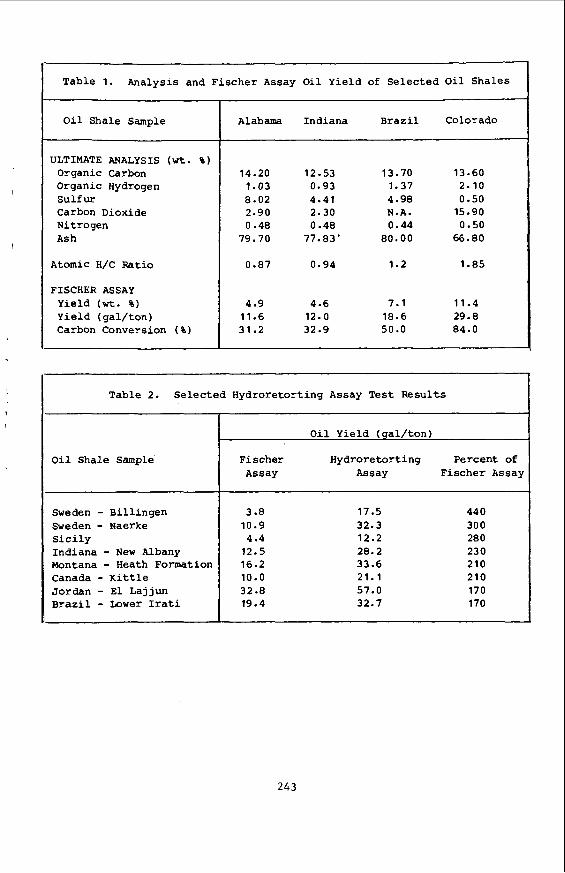
Table 1. Analysis and F i sche r Assay O i l Yie ld of Se lec t ed O i l Sha les
O i l Shale Sample
~ ~~
O i l Shale Sample
F i sche r Hydrore tor t ing Percent of Assay Assay F i sche r Assay
ULTIMATE ANALYSIS ( w t . % ) Organic Carbon Organic Hydrogen Su l fu r Carbon Dioxide Nitrogen Ash
A t o m i c H/C Ratio
FISCHER. ASSAY Yield ( w t . %) Yield (ga l / t on ) Carbon Conversion ( %)
Alabama Indiana B r a z i l Colorado
14.20 1.03 8.02 2.90 0 -48
79.70
0.87
4.9 11.6 3 1 - 2
12.53 0.93 4.41 2.30 0 -48
77.83'
0.94
4 - 6 12.0 32.9
13.70 1.37 4.98 N.A. 0.44
80.00
1.2
7.1 18.6 50.0
13.60 2.10 0.50
15.90 0.50
66 * 80
1.85
11.4 29.8 84.0
Table 2. Se lec t ed Hydrore tor t ing Assay T e s t Resu l t s
o i l Yie ld (ga l / t on )
Sweden - Bi l l ingen Sweden - Naerke S i c i l y Indiana - New Albany Montana - Heath Formation Canada - K i t t l e Jordan - E l Lajjun Brazi l - Lower I r a t i
3.8 10.9 4.4
12.5 16.2 10.0 32.8 19.4
17.5 32.3 12.2 28.2 33.6 21.1 57.0 32.7
44 0 300 280 230 210 210 170 170
I I
243
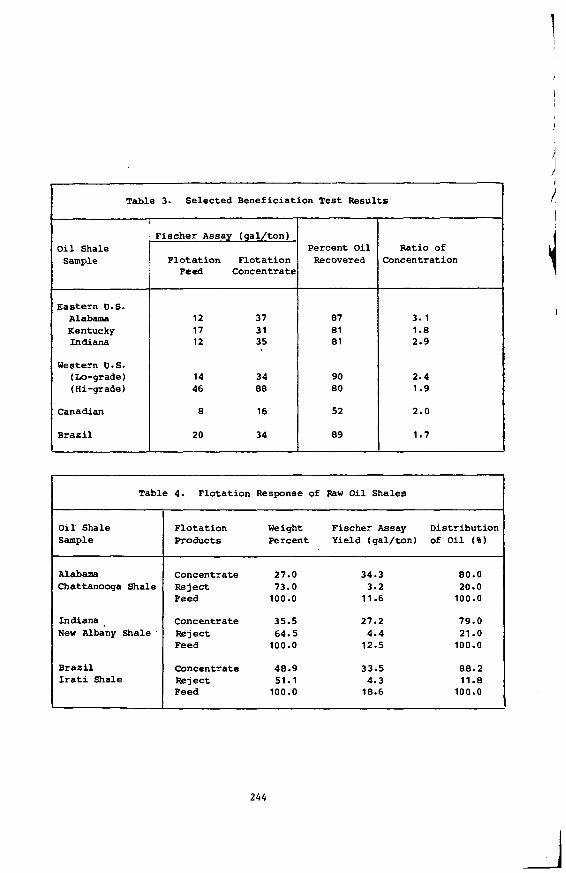
Table 3. Selected Beneficiation Test Results
87 81 81
90 80
52
89
O i l Shale Sample
3.1 1.8 2.9
2.4 1.9
2.0
1.7
Eastern U.S. Alabama Kentucky Indiana
Western U.S. (Lo-grade) (Hi-grade)
Canadian
Brazil
Fischer Assay (gal/ton)
Flotat ion Flotation Feed Concentrate
12 37 17 31 12 35
14 34 46 88
8 16
20 34
I
Table 4. Flotation Response of Raw O i l Shale8
O i l : Shale Sample
Alabama Chattanooga Shale
Indiana . New Albany Shale
Brazil I r a t i Shale
Flotation Weight Fischer Assay Distribution Products Percent Yield (gal/ton) of O i l (%)
Concentrate Reject Feed
Concentrate Reject Feed
Concentrate Reject Feed
27.0 73.0
100.0
35.5 64.5
100.0
48.9 51.1
100.0
34.3 3.2
11 - 6
27.2 4.4
12.5
33.5 4.3
18.6
80.0 20.0
100.0
79.0 21.0
100.0
88.2 11.8
100.0
244
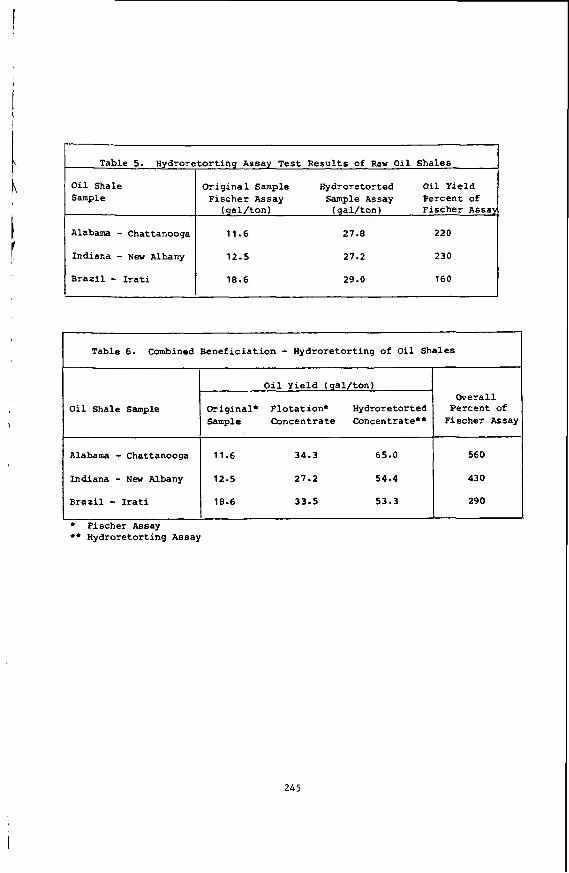
\
O i l Shale Sample
Alabama - Chattanooga
Indiana - ~ e w Albany
Brazil - Irati
O r i g i n a l Sample Hydro re to r t ed O i l Y ie ld F i s c h e r Assay Sample Assay P e r c e n t of
( g a l / t o n 1 ( g a l / t o n ) F i s c h e r Assa
11.6 27.0 220
12.5 27.2 230
18.6 29.0 160
Tab le 6. Combined B e n e f i c i a t i o n - H y d r o r e t o r t i n g of O i l S h a l e s
O i l Y i e l d ( g a l / t o n )
Or ig ina l ' F l o t a t i o n . Hydro re to r t ed Sample C o n c e n t r a t e Concentrate"
11.6 34.3 65.0
O i l Sha le Sample O v e r a l l
P e r c e n t of F i s c h e r Assay
560 Alabama - Chattanooga
Indiana - New Albany
B r a z i l - I r a t i
12.5 27.2 54.4 43 0
18.6 33.5 53.3 290
245
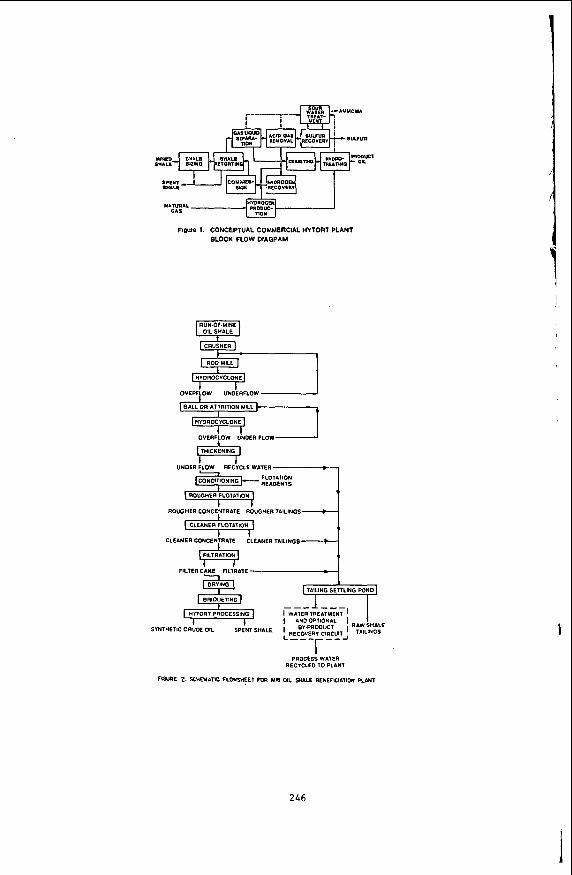
F I W O 1 . CONCEPTUAL COMMERCIAL HnORT PLAN1 BLOCK FLOW DIAOPAM
FlLlER C S FlLTRAlE
SYNTHETIC CRUDE OIL SPENT SHALE
I ---I--- WATER TREATMENT I
BV.PRODUC1 I AND OPTIONAL 1 SHALE ' RECOVERY C l R C U l ~ TAILINGS L--- r--
I PROCESS WATER
RECICLEDTOPLANT
FWRE 2. SC*EUAlK F L ( I I W E 1 $OR MM OIL =ALE BENEFICIATION PLANT
246
INVESTIGATION OF THE REACTION MEC ISMS FOR PYROLYSIS OF RUNDLE OIL SHALES BY DYNAMIC H NMR TeCHNIQUES
T. Parks, L . J . Lynch and D.S. Webster
CSIRO Division of Fossil Fuels, P.O. Box 136, North Ryde, NSW, 2113, Australia
Y
ABSTRACT
Dynamic proton nuclear magnetic resonance ( l H NMR) techniques were used to study the pyrolysis behaviour of a suite of Ru dle oil shale ore types. Experimental results were obtained by monitoring the 'H NMR transverse relaxation signal for both the shales and their kerogen concentrates during their pyrolysis by heating at a uniform rate in open glass tubes in an inert atmosphere provided by flowing nitrogen gas.
These results indicate that while the Rundle ore types have variable pyrolysis behaviour, all of the demineralized shales pyrolyse similarly. The differences observed in the behaviour of the shales are thought to be a consequence of variations in the permeability of the inorganic matrices to evolving volatile species. Enhancement of molecular mobility marks two transitions of the specimen during pyrolysis. The first, which occurs between room temperature and - 500 K and involves most of the structure, is probably a "glass to rubber" type transition and the second, which occurs near 600 K indicates the 7resence of a relatively thermally stable component in the kerogen. The results show that the pyrolysis residue formed above 750 K is contributed to by material that passes through a transient mobile state.
INTRODUCTION
Studies over many years of the pyrolytic decomposition of oil shales have led to a variety of kinetic models which invoke intermediate species referred to as pyrobitumens (1-3) and sometimes also as rubberoid (4) and polyoil (5) species. These intermediate species are at best only loosely defined and while it is expected that such intermediate states do occur during pyrolysis their delineation in composition and occurrence are still matters for investigation. In these models the original kerogen is usually treated as being homogeneous but recently kerogen pyrolysis has been analysed in terms of the chemically distinct aromatic and aliphatic fractions (6-8).
Dynamic measurement techniques have an advantage over equilibrium measurement techniques in such investigations because of their potential to monitor transient s ates of the reacting system. The adaptation of proton nuclear magnetic resonance ( H NMR) as a dynamic measurem nt technique has been described previously (9-11). The hydrogen Specificity of the H NMR experiment aids in the distinction of thermal processes associated with the organic kerogen from those of the inorganic mat ix of the shale. For organic solids the most importanc factors governing their 'H NMR behaviour are the concentration and distribution of protons and unpaired electrons in the structure and the molecular dynamics. To this extent undecoupled or "broadline" NMR can provide information on the complex interactions which determine the molecular properties and form of the bulk material. These NMR measurements will detect molecular mobility changes associated with melting and other "softening" transitions and likewise transitions of the molecular lattice back to the rigid lattice state, the loss of hydrogen from the specimen during decomposition and changes in free radical concentrations related to bond rupture and condensation reac ions. The results reported here are all derived from dynamic measurements of the 'H NMR transverse relaxation signal I(t). Parameters are derived from these measured signals which (a) represent the residual specimen as consisting of two
P f
247
components, one containing rigid hydrogen and the other mobile hydrogen, (b) characterize the molecular mobility of the structure containing the mobile hyfrogen. (c) estimate che residual hydrogen content and (d) characterize the H NMR transverse relaxation signal I(t) and therefore the total residue in terms of its average molecular mobility. The temperature dependences of these parameters form a set of pyrograms reflecting changes in the specimen during the pyrolysis.
EXPERIMENTAL
The shales studied were a suite of the ore types distinguished and characterized in the Rundle deposit by Coshell (12). Specimens in the form of -100 mesh powders were supplied by ESSO Australia together with chemical analysis and Pischer assay oil yield data (Table I). A composite Rundle shale has been reported as having a 13C CP-MAS aromaticity value of about 0.22 (13). Kerogen concentrates were prepared by HCl/HF digestion of the mineral matter and subsequent analysis showed them to contain large quantities of fluorine and to have total ash contents in the range 17 to 38% (13).
Predried shale and kerogen concentra e specimens of - 400 mg contained in 8 mm O.D. open glass tubes were used for the H NMR theTal analysis experiments which were conducted under nitrogen gas flowing at 5 ml min . Comparative studies of the shale ore types and their kerogen concentrates we e made a series of pyrolysis experiments at a uniform heating rate of 4 K min- . The H NMR measurements were made using the two pulse ( 9 0 0 - ~ - 9 0 9 0 ) sequence to generate the solid-echo form of the 'H NMR transverse relaxation signal I(t). A sequence repetition time of 1 s avoided saturation effects which indicates that the shales are free of inorganic hydrogen with much longer 'H NMR spin-lattice relaxation times that have been found to occur in Green River oil shales (14).
5
f
RESULTS AND ANALYSIS
The peak signal amplitude I ( ~ T ) normalized per gram of sample at room temperature (which is a measure of the hydrogen concentration contributing to the NMR signal of the specimens) shows a linear correlation with elemental percent hydrogen (w/w) as shown in figure 1 for both the whole and the demineralized shales used in the study. The fact that both the whole and demineralized shales ga e the same linearity of I(27) with elemental hydrogen further indicates that the 'H NMR signals are representative of all the hydrogen in he shales. It is important therefore to know the relative contributions to the *H NMR signals of the organic kerogen and t e inorganic matrix. Figure 2 compares the temperature variation of the relative 'H NMR signal amplitudes (normalized per gram of shale) for three shales of d fferent grade with that for a predried montmorillonite sample pyrolysed at 6 K min- . Analyses of these shales (15) have shown that clays which account for - 35% of the inorganic matter are the only significant source of inorganic hydrogen with montmorillonite being the most abundant clay variety. The data in Figure 2 therefore show that the inorganic hydrogen signal is a minor fraction of the total shale signal except for the relatively kerogen-poor ore types such as claystone (ore type 111 in figure 2). The mineral matter analysis data of Loughnan (15) identified montmorillonite, kaolinite and illite clays in Rundle shales. From the experimentally determined 'H NMR signal contributions of montmorillonite and kaolinite and an estimated signal contribution of illite, the calculated signal contributions of the clays in the ore types studied range from - 13% for the type 111 claystone to -6% for the most kerogen-rich type I ore.
A selection of 'H NMR relaxation signals I(t), recorded at various stages of pyrolysis of a predried shale and its kerogen concentrate are shown in figures 3(a) and 3(b) respectively. These data are typical for all the shales studied. At room temperature the signals for both materials are dominated by a rapidly decaying component, which comprises about 90% of the total signal intensity in the case of
l!
248
I
\
I
the raw shale. This rapidly decaying component is characteristic of a rigid lattice or "glfasy" structure devoid of molecular mobility on a time scale less than - 10- 6. The more slowly relaxing minor component of each signal indicates that parts of the structure have a degree of molecular mobility on this time scale, consistent either with extended structural domains being above their glass transition temperature or with a distribution of isolated mobile molecular segments in the structure. As the temperature is raised above room temperature the slower relaxing component increases in intensity at the expense of the rapidly decaying "rigid" signal, suggesting a gradual transition of the structure from the glassy to the mobile state. This occurs earlier and to a greater extent for the demineralized shale. However, even for the shale above .- 600 K the mobile component accounts for almost all of the signal intensity of the residual specimen. At higher temperatures the total signal intensity falls rapidly as a result of pyrolytic loss of volatile material from the specimen and there is a regrowth of a rapidly decaying signal intensity consistent with the formatlon of the rigid char residue.
These data were reduced to provide a number of largely independent parameters: (i) The percentage of the total initial signal intensity that is contributed by the rapidly decaying or rigid component ( X rigid) is estimated. This estimate is made by fitting an exponential function to the slowly relaxing tail of the signal and extrapolating to the echo pea$ time of the signal to obtain the mobile signal intensity. The time constant T , of the exponential function is a second parameter which is a measure of the averaig, molecular mobility of the mobile component. These two parameters - X rigid and T - are plotted together against temperature in figures 4a and 4b for a shale an% its kerogen concentrate respectively.
(ii) The aqparent hydrogen content of the specimen ( W ) , obtained by calibration of the total H NMR signal intensity I(2T) for its sensitivity to temperature, is a semi-quantitative parameter useful for monitoring the pyrolytic decomposition and loss of volatile products from the sample. Its temperature dependence for the shale and kerogen concentrate are plotted in figures 5(a) and 5(b) respectively. Also shown in these figures are the differential hydrogen contents computed from these data.
(iii) The anaytical second moment M* of the frequency power spectrum represent- ation of the H NMR signal (11) whlch is characteristic of the total signal and enables a qualitative measure of the average molecular mobility of the total specimen to be monitored during the pyrolysis. The temperature variations of M for the whole and demineralized specimens are also recorded in figures 5(a) and 5 ( t ) respectively.
The apparent hydrogen loss pyrolysis profiles at 4 K mih' for all of the shales were found to be similar. Two outlying prQfiles of this set are compared in figure 6, and in figure 7 the corresponding M2 pyrograms are compared. The temperature of maximum rate of loss of hydrogen as defined by the minimum in the differential percent hydrogen content curve, and the total percentage loss of hydrogen from room temperature to 875 K did not vary significantly (see Table I) between the ore types. This small variation in the total percentage loss for t e shale ore types and the linear correlation between this loss when expressed as 'H h'MR signal loss normalized per gram of shale and Pischer assay oil yield (figure 8) show that the hydrogen loss during the pyrolysis is predominantly organic.
Previous (16) 'H NMR second moment profiles presented by us on the pyrolysis of Rundle oil shale identified two regions of enhanced molecular mobility of the kerogen during pyrolysis. The first event occurred on heating from room temperature to - 500 K and was attributed to a possible glass to rubber transition. This observation is similar to Haddadin and Tawarah's (17) interpretation of an endotherm they detected for a Jordanian o i l shale, peaking in the region 433-443 K, as a physical softening and molecular rearrangement of the kerogen, and is also
249
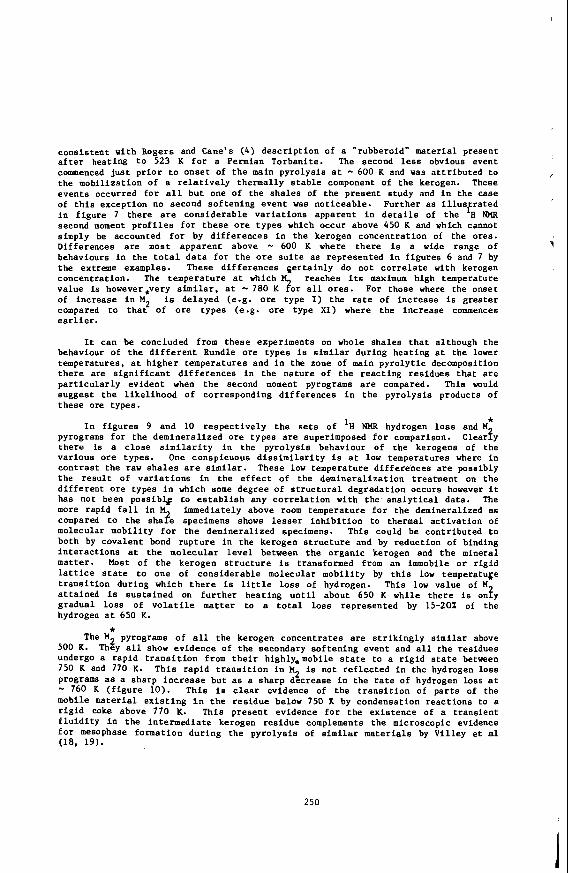
cons i s t en t wi th Rogers and Cane's (4) desc r ip t ion of a "rubberoid" ma te r i a l present a f t e r heating t o 523 K f o r a Permian Torbani te . The second l e s s obvious event commenced j u s t p r i o r t o onse t of t h e main pyro lys i s at - 600 K and vas a t t r i b u t e d t o the mobi l iza t ion of a r e l a t i v e l y thermal ly s t a b l e component of t h e kerogen. These events occurred for a l l but one of t he s h a l e s of t h e present s tudy and in the case of t h i s except ion no second so f t en ing event was not iceable . Fur ther a s i l l u s ra ted i n f igu re 7 t he re are cons iderable v a r i a t i o n s apparent i n d e t a i l s of the f€i NMR second moment p r o f i l e s f o r t hese o r e types which occur above 450 K and which cannot simply be accounted f o r by d i f f e r e n c e s i n the kerogen concent ra t ion of the ores .
behaviours i n the t o t a l d a t a f o r t he o r e s u i t e a s represented i n f igu res 6 and 7 by the extreme examples. These d i f f e rences f e r t a i n l y do not c o r r e l a t e with kerogen concent ra t ion . The temperature a t which M reaches i t s maximum high temperature va lue is however*very s i m i l a r , a t - 780 K for a l l o re s . For those where the onse t of increase i n M p is delayed (e.g. o r e type I) the r a t e of increase i s g rea t e r compared t o t h a t of o r e types (e.g. o r e type X I ) where the increase commences e a r l i e r .
I
Differences are most apparent above - 600 K where the re is a wide range of Y
It can be concluded from these experiments on whole sha le s t h a t although the behaviour of t h e d i f f e r e n t Rundle o re types is s i m i l a r dur ing hea t ing a t t he lover temperatures, a t h ighe r temperatures and in the zone of main py ro ly t i c decomposition t h e r e a re s i g n i f i c a n t d i f f e rences i n the na tu re of t he r eac t ing res idues t h a t a r e p a r t i c u l a r l y ev ident when t h e second moment pyrograms a r e compared. This would sugges t t h e l i ke l ihood of corresponding d i f f e rences i n the py ro lys i s products of t hese ore types.
I n f i g u r e s 9 and 10 r e spec t ive ly t h e sets of 'I? NMR hydrogen loss and H* pyrograms f o r t he deminera l ized o r e types are superimposed f o r comparison. Clearfy the re is a c lose s i m i l a r i t y in the py ro lys i s behaviour of the kerogens of the va r ious o r e types. One conspicuous d i s s i m i l a r i t y i s a t low temperatures where i n con t r a s t the raw s h a l e s a r e similar. These low temperature d i f f e rences a r e possibly the r e s u l t of v a r i a t i o n s i n the e f f e c t of t h e deminera l iza t ion treatment on t he d i f f e r e n t ore types i n which some degree of s t r u c t u r a l degrada t ion occurs however i t has not been possibQ to e s t a b l i s h any c o r r e l a t i o n with the a n a l y t i c a l da t a . The more rapid f a l l i n M immediately above room temperature f o r the demineralized as compared t o the s h a l e specimens shows lesser i n h i b i t i o n to thermal ac t iva t ion of molecular mobi l i ty f o r t h e demineralized specimens. This could be cont r ibu ted t o both by covalen t bond rup tu re i n the kerogen s t r u c t u r e and by reduction of binding i n t e r a c t i o n s a t t h e molecular l e v e l between t h e organic kerogen and t h e mineral matter. Most of t h e kerogen s t r u c t u r e is transformed from an immobile o r r i g i d la t t ice state t o one of cons iderable molecular mobi l i ty by t h i s low temperatulje t r a n s i t i o n during which t h e r e is l i t t l e l o s s of hydrogen. This low value of M a t t a i n e d i s sus t a ined on f u r t h e r hea t ing u n t i l about 650 K while t h e r e i s onfy gradual loss of v o l a t i l e matter t o a t o t a l l o s s represented by 1540% of the hydrogen a t 650 K.
* The M2 pyrograms of a l l the kerogen concent ra tes a r e s t r i k i n g l y similar above
500 K. They a l l show evidence of t he secondary so f t en ing event and a l l t h e res idues undergo a rap id t r a n s i t i o n from t h e i r highly,mobile state to a r i g i d s t a t e between 750 K and 770 K. This rap id t r a n s i t i o n i n M2 i s not r e f l e c t e d i n the hydrogen lo s s Programs as a sharp inc rease but as a sharp decrease i n the r a t e of hydrogen lo s s a t - 760 K ( f i g u r e 10). This is c l e a r evidence of t he t r a n s i t i o n of p a r t s of the mobile material e x i s t i n g i n t h e r e s idue below 750 K by condensation r eac t ions to a r i g i d coke above 770 K. This p re sen t evidence f o r the ex i s t ence of a t r ans i en t f l u i d i t y in t he in t e rmed ia t e kerogen r e s idue complements t he microscopic evidence f o r mesophase format ion du r ing the py ro lys i s of similar materials by Vi l l ey et a1 (18. 19).
250
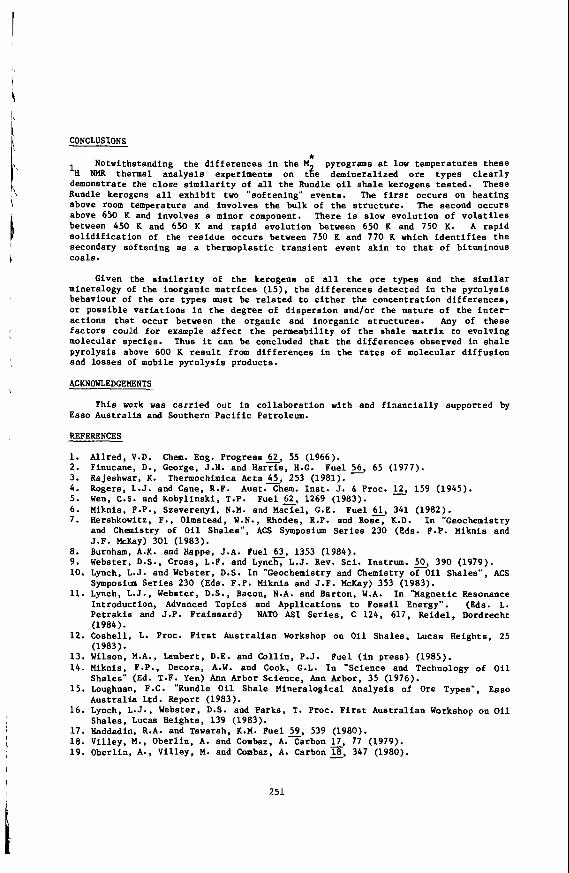
CONCLUSIONS
Notwithstanding the differences in the pyrograms at low temperatures these 'H NMR thermal analysis experiments on i t e demineralized ore types clearly demonstrate the close similarity of all the Rundle oil shale kerogens tested. These Rundle kerogens all exhibit two "softening" events. The first occurs on heating above room temperature and involves the bulk of the structure. The second occurs above 650 K and involves a minor component. There is slow evolution of volatiles between 450 K and 650 K and rapid evolution between 650 K and 750 K. A rapid solidification of the residue occurs between 750 K and 770 K which identifies the secondary softening as a thermoplastic transient event akin to that of bituminous coals.
Given the similarity of the kerogens of all the ore types and the similar mineralogy of the inorganic matrices (15), the differences detected in the pyrolysis behaviour of the ore types must be related to either the concentration differences, or possible variations in the degree of dispersion and/or the nature of the inter- actions that occur between the organic and inorganic structures. Any of these factors could for example affect the permeability of the shale matrix to evolving molecular species. Thus it can be concluded that the difxerences observed in shale pyrolysis above 600 K result from differences in the rates of molecular diffusion and losses of mobile pyrolysis products.
ACKNOWLEDGEMENTS
This work was carried out in collaboration with and financially supported by Esso Australia and Southern Pacific Petroleum.
REFERENCES
1. Allred. V.D. Chem. Eng. Progress 62, 55 (1966). 2. Finucane, D., George, J.H. and Harris, H.G. 3. Rajeshwar. K. Thermochimica Acta 45, 253 (1981). 4. Rogers, L.J. and Cane, R.F. 5 . Wen, C.S. and Kobylinski, T.P. F u e l z , 1269 (1983). 6. Miknis. F.P., Szeverenyi, N.M. and Maciel, G.E. Fuel 61, 341 (1982). 7. Hershkowitz, F . , Olmstead, W.N., Rhodes, R.P. and Rose, K.D. In "Geochemistry
and Chemistry of Oil Shales", ACS Symposium Series 230 (Eds. F.P. Miknis and J.F. McKay) 301 (1983).
8. Burnham, A.K. and Happe, J.A. Fuel 63, 1353 (1984). 9. Webster, D.S., Cross, L.F. and Lynch.L.J. Rev. Sci. Instrum. 2, 390 (1979). 10. Lynch, L.J. and Webster, D.S. In "Geochemistry and Chemistry of Oil Shales", ACS
Symposium Series 230 (Eds. F.P. Miknis and J.F. McKay) 353 (1983). 11. Lynch, L.J., Webster, D.S., Bacon, N.A. and Barton, W.A. In "Magnetic Resonance
Introduction, Advanced Topics and Applications to Fossil Energy". (Eds. L. Petrakis and J.P. Fraissard) NATO AS1 Series, C 124, 617, Reidel, Dordrecht (1984).
12. Coshell, L. Proc. First Australian Workshop on Oil Shales, Lucas Heights, 25 (1983).
13. Wilson, M.A., Lambert, D.E. and Collin, P.J. Fuel (in press) (1985). 14. Miknis, F.P., Decora, A.W. and Cook, G.L. In "Science and Technology of Oil
15. Loughnan, P.C. "Rundle Oil Shale Mineralogical Analysis of Ore Types", Esso
16. Lynch, L.J., Webster, D.S. and Parks, T. Proc. First Australian Workshop on Oil
17. Haddadin, R.A. and Tawarah, K.M. Fuel 59, 539 (1980). 18. Villey, M., Oberlin, A. and Combaz, A.Carbon 17 19. Oberlin, A., Villey, M. and Combaz. A. Carbonz; 347 (1980).
Fuel E, 65 (1977). Auat.Chem. Inst. J. 6 Proc. z, 159 (1945).
Shales" (Ed. T.F. Yen) Ann Arbor Science, Ann Arbor, 35 (1976).
Australia Ltd. Report (1983).
Shales, Lucas Heights, 139 (1983).
77 (1979).
251
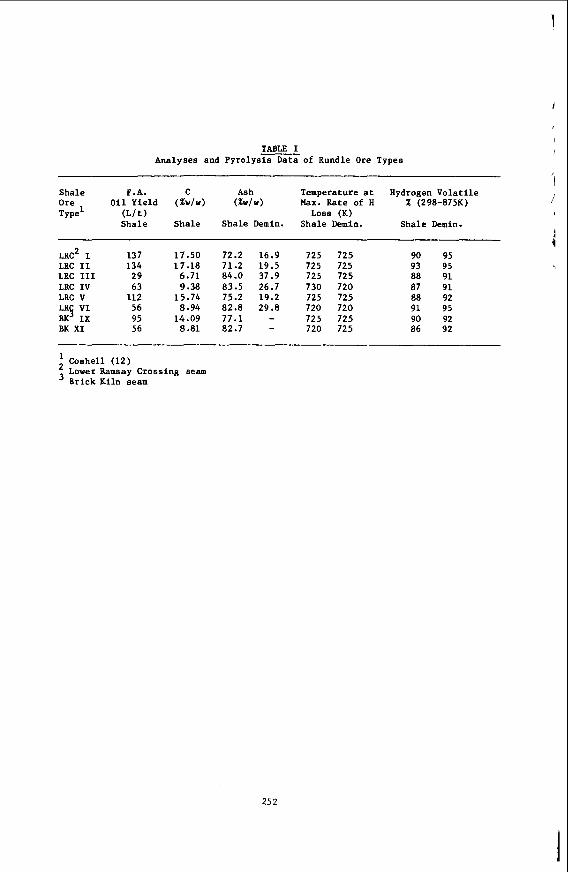
TABLE I Analyses and Pyro lys i s Data of Rundle Ore Types
Shale F.A. C Ash Temperature a t Hydrogen Vo la t i l e Ore O i l Yield (%w/w) (%w/w) Max. Rate of H X (298-875K) Type' (L / t ) Loss (K)
Sha le Shale Shale Demin. Shale Demin. Shale Demin.
L R C ~ I LRC I1 LRC I11 LRC I V LRC V LR V I BK I X BK X I
5
137 134
29 63
112 56 95 56
17.50 72.2 16.9 725 725 17.18 71.2 19.5 725 725 6.71 84.0 37.9 725 725 9.38 83.5 26.7 730 720
15.74 75.2 19.2 725 725 8.94 82.8 29.8 720 720
14.09 77.1 - 725 725 8.81 82.7 - 720 725
90 95 93 95 88 91 87 91 88 92 91 95 90 92 86 92
Coshell (12)
Brick Kiln seam '3 Lower Ramsay Cross ing seam
f
252
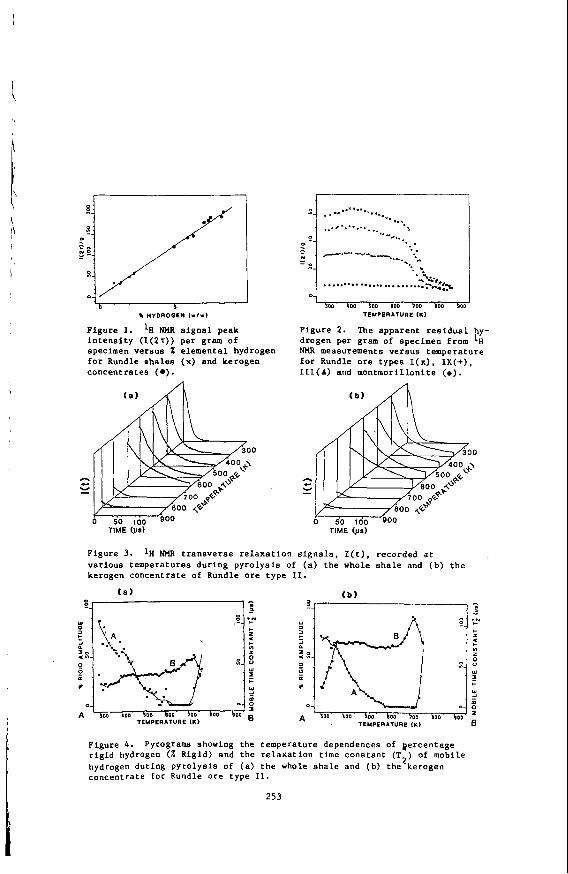
h
!A HYDROOEN I - / - )
Figure 1. 'B NMR s i g n a l peak i n t e n s i t y ( I ( ~ T ) ) per gram of specimen versus % elemental hydrogen for Rundle sha le s (x) and kerogen concentrates ( 0 ) .
0
- c Y
0 50 100 TIME (US)
'.... ..*....
- 0
TEMPERATURE (10
Figure 2. The apparent r e s i d u a l hy- drogen per gram of specimen from 'H NMR measurements versus temperature f o r Rundle o r e types I(x), IX(+), I I I (A) and montmoril lonite (e) .
TIME (ps)
Figure 3. various temperatures during py ro lys i s of ( a ) t he whole sha le and (b) t h e kerogen concentrate of Rundle o re type 11.
lH NMR t r ansve r se r e l axa t ion s i g n a l s , I ( t ) , recorded a t
Figure 4. r i g i d hydrogen (% Rigid) and the r e l axa t ion time constant (T ) of mobtle hydrogen during py ro lys i s of ( a ) t h e vhole s h a l e and (b) the kerogen concentrate f o r Rundle ore type XI.
Pyrograms showing the temperature dependences of Rercentage
2
253
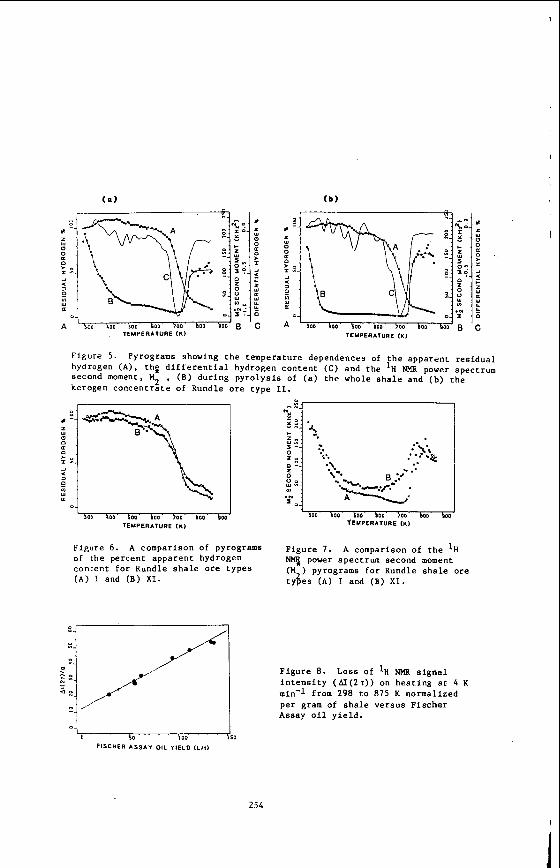
( a ) (b)
TEMPERATURE (IO
Figure 5 . Pyrograms showing the temperature dependences of t h e apparent res idual hydrogen ( A ) , thfi d i f f e r e n t i a l hydrogen content ( C ) and the 'H NMR power spectrum second moment, M2 , (B) during py ro lys i s of ( a ) t he whole s h a l e and (b) t he kerogen concentrate of Rundle o r e type 11.
h o Loo $00 koo >on boo boo TEMPERATURE (10
J I 500 boo 100 Loo 500 boo Loo J
TEMPERATURE (0
Figure 6. A comparison of pyrograms Figure 7. A comparison of t h e l H of t h e percent apparent hydrogen power spectrum second moment content for Rundle s h a l e o re types ( A ) I and (B) XI.
(M ) pyrograms f o r Rundle sha le ore ty$es ( A ) I and (B) X I .
Figure 8. i n t e n s i t y ( A I ( 2 1 ) ) on heat ing a t 4 K min-l from 298 t o 875 K normalized per gram of sha le versus Fischer Assay o i l y i e l d .
Loss of 'H NMR s i g n a l
I so
254
0 0
tlQ -- 2 - W 0 - 0 - [r n - > o
a 3 - n c n - W [ r -
I m- J
-
0-
Figure 9 . A comparison of pyrograms of the percent apparent residual hydrogen for demineralized specimens of e i g h t Rundle oil shale ore types l i s t e d i n Table I .
0 i n - N -
0 - 0 - N-
0 - i n - - 0 - 0 - -_ 0 - in-
0-
n
9 4 I Y
F . z W 5 0 2 Q z 0 0 W v)
*N 5
Y
A
i 500 $00 $00 boo >oo boo boo
TEMPERATURE (K)
Figure 10, moment (M ) pyrograms For kerogen concentrates of e i g h t Rundle 2 oil shale ore t y p e s l i s t e d i n Table I .
A comparison of the 'H NMR power spectrum second
255
i
I3C N.M.R. DIPOLAR DEPBASING AS A PROBE INTO THE STRUCTURE OF AUSTRALIAN OIL SHALE KEROGENS AND PYROLYSIS RESIDUES
D.E. Lambert and M.A. Wilson
CSIRO Division of Fossil Fuels, PO Box 136, North Ryde, NSW 2113, Australia
ABSTRACT
The solid state nuclear magnetic resonance (n.m.r.) technique of dipolar dephasing was applied to a range of Australian o i l shale kerogens and pyrolysis residues of an aliphatic shale (Rundle, Queensland), in order to gain more inform- ation on chemical structure than can be obtained from a conventional cross polar ization spectrum. From these measurements the proportion of aliphatic carbon that is methyl or non-protonated in an aromatic shale and the pyrolysis residues was estimated. Non-protonated carbon was found to be unimportant and thus it was shown that the methyl content varied according to shale type and/or thermal history. The proportion of aliphatic methyl carbon in residues, generated at a range of temperatures from 400-5OO0C, was found to increase with increasing reaction temp- erature. This trend indicates that the 8-bond in alkyl chains attached to aromatic ring structures is cleaved in preference to the arbond during shale pyrolysis.
INTRODUCTION
Dipolar dephasing 13C n.m.r has been extensively employed in determining the fraction of aromatic carbon that is protonated in a range of solid samples including model compounds, coals and other geochemical materials (1-17). In many heterogeneous samples the decay of aromatic signal intensity with increasing carbon magnetization holding time (tl) can be expressed, in terns of the decay constants TiA and T i B , as the sum of tvo exponential decays from protonated and non-protonated aromatic carbon, respectively. A separation of the aromatic signal intensity into two components is possible as the minimum T' values for model aromatic ring compounds are five times the TiA values obtaineaBfor methine carbon (1). However, this was not found to be the case for oil shales (18). We have attributed this difference in relaxation behaviour to the intrinsic nature of the oil shale kerogen. Either the non-protonated carbons are in close proximity to protonated structures and thus have reduced T' values, which approach those of the protonated carbons, and/or there are significantly more protonated carbons present, which still dominate the total signal Intensity at tl > 45 us, when only signal from non- protonated carbon is normally observed.
Little work has been undertaken to investigate the chemical structure of the aliphatic components of fossil fuels by n.m.r. Some studies have been reported on coals (11, but data on oil shales are not currently available. Thus, in this work we have examined the potential of dipolar dephasing as a probe of the chemical structure of the aliphatic components in Australian shales and shale pyrolysis residues. The fraction of aliphatic carbon that is methyl in the most aromatic shale and the pyrolysis residues has been estimated. This is related to kerogen structure and the mechanism of shale pyrolysis.
2
The technique of dipolar dephasing is based on the rapid loss of signal inten- sity from protonated carbons, when a time period (tl), in which the proton decoupler is turned off, is inserted before data acquisition in a conventional croas polar ization program. The rate at which signal intensity is lost is dependent on the magnitude of the carbon-hydrogen dipolar interaction. Hence carbons bonded to pro- tons experience stronger dipolar interactions than non-protonated carbons, unless the dipolar interaction is modulated by molecular motion, e.g. rapid rotation of
256
\ 1 methyl groups. It has been shown for some compounds (19) that at a dipolar dephas-
ing time of 50 ps the signal intensity from methine and methylene carbons is almost completely eliminated from the conventional cross polarization spectrum. Resonances from quaternary carbons remain, although attenuated in intensity due to long range, weak interactions with protons. Methyl carbon resonances also remain if the methyl groups present are free to rotate at speeds sufficient to severely weaken the carbon-proton interaction. This is possible in almost all solids including coals (1).
For carbons that are weakly coupled to protons, model compound studies have shown that the decay of signal intensity is simply exponential with increasing dipolar dephasing time (t ) (5.7.20). However, for strongly coupled methylene and methine carbons, signal intensity decays as a function of time squared, 1.e. a Gaussian decay pattern (5,7,20). In more complex systems such as coals the decay of aliphatic signal intensity is closer to exponential than Gaussian, however similar Ti values are normally obtained from either Gaussian or exponential calculations (1).
For kerogen residues and highly aromatic shales (aromaticity (fa) > 0.60). which contain methine, methylene, quaternary and methyl carbons. our results (Figure 1) show that the decay of aliphatic signal intensity can be described as the sum of two decays given by Equation 1.
IT = Izexp-[t1/2T;(S) 2 2 I + I:exp-[tl/T;(W)]
where is the total aliphatic signal intensity; Io is the initial signal intensity of the strongly coupled aliphatic carbons (CHZ,CR)B Io is the initial signal inten- sity of the weakly coupled aliphatic carbons (C,CH3)P tl is the delay period where the decoupler is gated off; and T'(S) and T'(W) are respectively the decay constants for the decay processes of strongly and weakly coupled carbon types.
If one approximates that the signal intensity of the strongly coupled carbons has decayed to a negligible amount after a delay period of 50 us, then Equation 1 simplifies to
Io can therefore be determined from the zero time extrapolated intercept of the graphey data for tl > T'(W) is obtained from the reciprocal slope of the least-squares fit to the data. T2ese parameters can then be used to obtain damo on the decay of the strongly coupled carbons. The plot of In [I - Iw exp-t /T ( ) ] versus the square of tl (1) yields a linear relationship and T'(?F) is obtained from the slope.
The parameter, fw(Ali) - Io/(Io+ Io) - Io/Io, gives the fraction of aliphatic carbon that is methyl or non-pYotoLte8. Fz(ATi) is related to the fraction of total carbon that is methyl or non-protonated (fw), by (l-fa), where f is the fraction of total carbon that is ar0matic.i.e.
50 us (see Figure 1).
1 i W 2
fw = fw(Ali) x (l-fa) 3)
Alternatively, when only a single exponential decay is observed (Figure 2), an estimate of fw(Ali) can be made indirectly from the signal intensity of the aliphatic resonance at t = 0 ps and a delay time at which all methylene and methine carbon has decayed completely (1). A delay of 50 us would be appropriate for the oil shale samples examined. However, as the T; values of the aliphatic kerogens are > 25 w, indicating that the methine and methylene groups in the kerogens are highly mobile, this approach is not applicable to oil shales.
257
EXPERIMENTAL.
Samole Preparation
All samples were demineralized by hydrochloric/hydrofluoric acid treatment (18) prior to analysis by n.m.r.
Pyrolysis residues of Rundle shale (Queensland, Australia) were generated from pyrolysis experiments using a modification of the Fischer Assay method (ASTM D3904- 80). Shale, crushed to -100 mesh, was heated to various temperatures between 400- 50OoC at a rate of 12.S°C/min. and held isothermally at temperature for the time specified between 10-40 min. The raw shale used in these experiments contained 13.35% organic C. 2.3% €I, 1.3% S. 0.4 % N and 1.25% inorganic C on a dry weight basis. The major inorganic components were clay minerals (illite, kaolinite and
. montmorillonite), quartz, siderite, calcite and pyrite.
N.M.R.
Solid-state 13C n.m.r. spectroscopic measurements were made on a Bruker CXP 100 instrument at 22.6 MHz. Kerogen was packed in a boron nitride rotor with a Kel-F base. The dipolar dephasing program chosen for this study used alternate phase inversion of the 90' r.f pulse to minimize baseline artifacts, and a refocusing 180' pulse along the spin locking co-ordinate was inserted in the middle of the tl period to avoid linear phase distortions. The 90" pulse width was 4.5-8 ps, with a recycle time of 0-8-1 8 . Data were collected in 1 K of memory, zero filled to 4 K and Fourier transformed using line broadening factors of 30-100 Hz. Dipolar dephasing delays (tl) between 2-200 vs were used and each experiment continued until 4,000- 6.000 scans were acquired. Results were calculated from integrated signal intensities divided at the point of inflection between 80-100 ppm.
RESULTS AND DISCUSSION
Results obtained from dipolar dephasing experiments of a selection of Australian kerogens, with a range of aromatic carbon contents (fa) are presented in Table 1. Figure 2 shows a typical plot of the logarithm of aliphatic signal intensity versus tl for a kerogen of low aromaticity (fa = 0.21). Only an average Ti value (T' ) can be determined for the decay process. A slowly decaying component with a TJC> 30 ys is not apparent in the plot; this indicates a very low concentration of me%hyl carbon in the kerogen. Figure 1 shows a similar plot for a highly aromatic kerogen (fa = 0.60). The decay process is clearly not exponential and two rate constants governing the decay, T;(S) and T'(W), can be determined respectively from Gaussian (Figure 3) and exponential fat, calculations using Equations 1 or 2. Since two decay processes can be observed for the Condor carbonaceous shale and only one for the aliphatic shales then the aliphatic structures of the Condor carbonaceous kerogen contain large concentrations of methyl and/or non-protonated carbon whereas kerogens of lower aromatic content have relatively much lower concentrations of these species. The aliphatic moieties of the Glen Davis, Rundle, Condor brown and Nagoorin kerogens must consist mainly of chain methylene and methine carbons and an insignificant amount of quaternary carbon, whereas the highly aromatic kerogen must contain aromatic ring structures associated with relatively short alkyl chains and aliphatic cross-linking structures.
The TiC data calculated from dipolar dephasing experiments of shale pyrolysis residues from the Rundle deposit (Queensland) are listed in Table 2. The TiC values for the residues are greater than those of the aliphatic kerogens. However, the loss of aliphatic signal intensity is more appropriately described as a sum of two decays. The decay constants for strongly coupled carbon, T'(S), lie near the lower limit for the time constants quoted for methylene and metiine carbons (12-29 ps)
\ TABLE 1 DIPOLAR DEPHASING DATA FOR THE ALIPHATIC COMPONENTS
OF AUSTWIAN OIL SHALESa
~ ~ ~~~ ~ ~ ~ _ _ _ _ _ ~
Glen Davis 0.19 1.52 29 - - - - Rundle 0.21 1.55 26 - - - Condor brown 0.25 1.41 26 - - - - Nagoorin 0.49 0.83 28 - - - - Condor carbonaceous 0.60 0.93 55b 16' 88' 0.45 0.18
-
a T i C va lues a r e the average T i va lues determined from exponential f i t t o a l l tl da ta points.
Values obtained when da ta f i t t e d t o s i n g l e exponent ia l decay. Values obtained using Equation 1.
TABLE 2 DIPOLAR DEPHASING DECAY DATA FOR THE ALIPHATIC COMPONENTS OF SHALE
PYROLYSIS RESIDUES FROM TW RUNDLE DEPOSIT (QIJEENSLAND)~
Pyro lys i s condi t ions f a Atomic T i c Ti(S) T;(W) fw(Al i ) f w Temperature Time ("c) (dn)
425 10 0.33 1.26 46 19 67 0.69 0.46 425 20 0.52 1.17 52 20 82 0.64 0.31 400 40 0.38 1.18 48 l g 69 0.58 0.36 425 40 0.64 1.01 57 - 76 0.78 0.28 450 40 0.81 0.74 52 - - - 475 40 0.85 0.64 65 - - -
TiC values determined from exponential f i t t o a l l tl da ta poin ts . I n s u f f i c i e n t po in ts f o r accura te determination.
259
(20). The decay constants for weakly coupled carbons, T;(W), are all less than 100 us suggesting a predominantly methyl contribution to the signal intensity. Hence the f ( A l i ) estimates obtained for the residues reflect an increase in the proporalon of aliphatic carbon that is methyl with increasing pyrolysis temperature.
The decay of aliphatic signal intensity from the highly aromatic residues could not be resolved into two components for a number of reasons. The aliphatic content of these residues is low, and there is a small contribution from spinning side bands to the total aliphatic signal intensity, owing to the greater chemical shift anisot- ropy of these samples. At t > 45 us these contribute most of the signal intensity in the aliphatic region ana the small 'real' aliphatic signal becomes buried. Nevertheless chemical shift data (Figure 4) show that there is an upfield shift of the centre of the aliphatic resonance with increasing pyrolysis temperature of the shale residues. This resonance, centred at 31 ppm in the raw kerogen, approaches a value of 16 ppm, similar to the chemical shift expected for methyl carbon, in the high temperature residues. This progressive increase in methyl carbon content of the shale residues is more clearly illustrated by dipolar dephasing experiments. Figure 5 shows the spectra obtained after a dipolar dephasing delay of 2, 30 and 60 )IS from Rundle shale and a low (425OC) and high (475'12) temperature pyrolysis residue. The aliphatic peak of the raw shale is narrow, sharp and unsplit after a delay time of 60 us. In the 425°C residue set, a shoulder emerges from the central aliphatic resonance after a 30 us delay and a distinct separation of a methyl resonance is obvious after a 60 us delay. A marked upfield shift of the whole aliphatic resonance occurs after a 30 us delay in the high temperature residue. Thus our results indicate that the proportion of aliphatic carbon that is methyl increases aignificantly with increasing pyrolysis temperature.
These results allow some conclusions to be drawn about the mechanism of shale pyrolysis. Although the fraction of total carbon that is methyl OK non-protonated in the residues (f ) appears to decrease with increasing pyrolysis temperature (Table 21, the alrphatic carbon of the pyrolysis residues contains a larger proportion of methyl groups than the parent shale (Rundle). Thus alkyl chains in the kerogen must be preferentially cleaved B to aromatic rings rather than a to aromatic rings during pyrolysis. It is noteworthy that similar behaviour has been observed in residues from the flash pyrolysis of coals (21).
CONCLUSIONS
Dipolar dephasing studies on shales and shale residues can yield useful information about the structure of the aliphatic components present in these solids. It has been demonstrated that in an Australian shale (Condor carbonaceous) with a high aromatic carbon content (f = 0.60) the aliphatic carbon consists of a high proportion of methyl groups whereat shales of lower aromaticity (Glen Davis, fa = 0.19; Rundle, fa = 0.21; Condor brown, fa = 0.25 and Nagoorin, fa = 0.49) all have very low methyl contents.
The dipolar dephasing behaviour of the aliphatic signal of the Condor carbon- aceous shale can be resolved into a rapidly decaying component, with a signal intensity dependent on the square of the dipolar dephasing time and a slower expon- entially decaying component. Similar behaviour has also been observed for pyrolysis residues from a highly aliphatic shale (Rundle). These results together with chemical shift data show that when shale is pyrolysed the proportion of aliphatic carbon that is methyl increases with increasing pyrolysis temperature up to 500°C. Hence during pyrolysis the B-carbon-carbon bond of alkyl chains attached to aromatic rings is cleaved in preference to the a-bond, 1.e. methyl groups are more stable.
ACKNOWLEDGEMENTS
Esso Australia Ltd and Southern Pacific Petroleum are thanked for financial support.
I
260
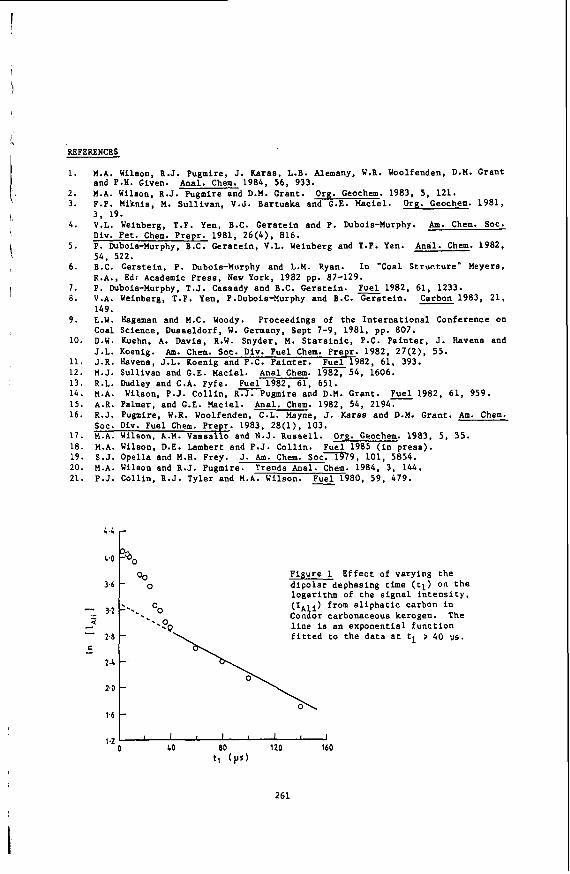
REFERENCES
1. M.A. Wilson, R.J. Pugmire, J. Karas, L.B. Alemany, W.R. Woolfenden, D.M. Grant
2. M.A. Wilson, R.J. Pugmire and D.M. Grant. Org. Geochem. 1983, 5, 121. 3 . F.P. Miknis, M . Sul l ivan , V.J. Bartuska and G.E. Maciel. Org. Geochem. 1981,
and P.H. Given. Anal. Chem. 1984, 56, 933.
3. 19. 4 . V.L. Weinberg, T . F . Yen, B.C. Ge r s t e in and P. Dubois-Murphy. Am. Chem. SoC.
5. Anal. Chem. 1982, Div. Pet. Chem. Prepr. 1981, 26(4), 816. P. Dubois-Murphy, B.C. Ge r s t e in , V.L. Weinberg and T.F. Yen. 56 522.
6.
7 . 8.
9.
10.
11. 1 2 . 13. 14 . 15. 16.
1 7 . 18. 19. 20. 21.
-.. - ~ - B.C. Gerstein, P. hbois-Murphy and L.M. Ryan. I n "Coal S t ruc tu re" Meyers, R.A., Ed: Academic Press, N e w York, 1982 pp. 87-129. P. Dubois-Murphy, T.J. Cassady and B.C. Gers te in . V.A. Weinberg, T.F. Yen, P.Dubois-Murphy and B.C. Gers te in . Carbon 1983, 2 1 , 149. E.W. Hagaman and M.C. Woody. Proceedings of the I n t e r n a t i o n a l Conference on Coal Science, Dusseldorf, W. Germany, Sept 7-9, 1981, pp. 807. D.W. Kuehn, A. Davis, R.W. Snyder, M . S t a r s i n i c , P.C. Pa in t e r , J. Havens and J .L. Koenig. Am. Chem. SOC. Div. Fuel Chem. Prepr. 1982, 27(2) , 5 5 . J.R. Havens, J.L. Koenig and P.C. Pa in te r . Fuel 1982, 61, 393. M . J . Sull ivan and G.E. Maciel. R.L. Dudley and C.A. Fyfe. Fuel 1982, 61, 651. M.A. A.R. Palmer, and G.E. Maciel. R.J . Pugmire, W.R. Woolfenden, C.L. Mayne, J. Karas and D.M. Grant. Am. Chem. SOC. Div. Fuel Chem. Prepr. 1983, 28(1), 103. M.A. Wilson, A.M. Vassa l lo and N.J. Russe l l . Org. Geochem. 1983. 5 , 35. M.A. Wilson, D.E. Lambert and P.J. Col l in . Fuel 1985 ( i n p re s s ) . S.J. Opella and M . H . Frey. M.A. Wilson and R.J. Pugmire. Trends Anal. Chem. 1984, 3, 1 4 4 . P.J. Collin, R . J . Tyler and M.A. Wilson.
Pue]. 1982, 61, 1233.
Anal Chem. 1982 ,54 , 1606.
Wilson, P.J. Col l in , R T P u g m i r e and D.M. Grant. Fuel 1982, 61, 959. Anal. Chem. 1982, 54, 2194-
J. Am. Chem. Soc.79, 101, 5854.
x 1 9 8 0 , 59, 479.
F igure 1 Ef fec t of varying the d ipo la r dephasing time ( t l ) on t h e logarithm of the s i g n a l i n t e n s i t y , (IAli) from a l i p h a t i c carbon i n Condor carbonaceous kerogen. The l i n e is an exponent ia l func t ion f i t t e d t o the d a t a a t tl > 40 ys.
1 2 0 LO 80 120 160
t, (PSI
261
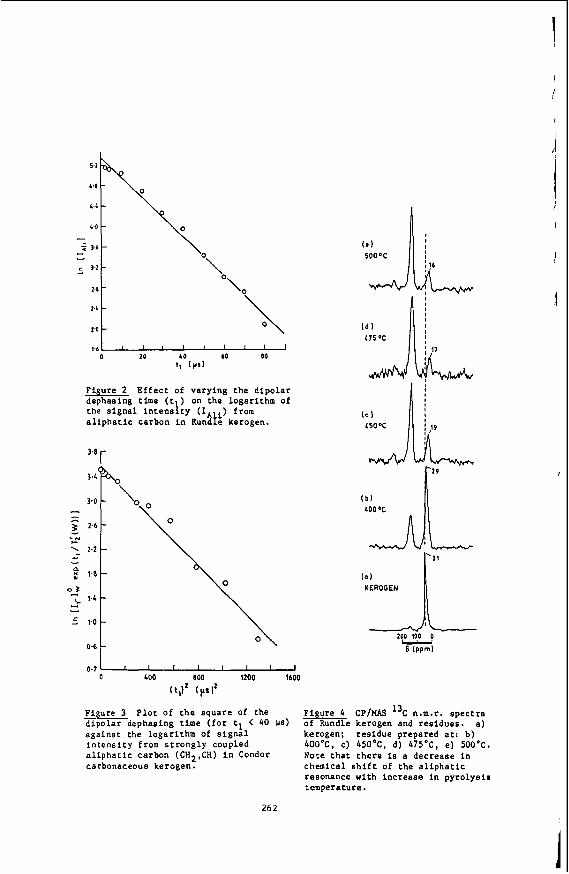
PL "I: ' 0
\
Figure 2 E f f e c t of varying the d i p o l a r dephasing time ( t ) on the logarithm of the s igna l i n t e n s l t y ( I i) from a l i p h a t i c carbon i n Run%!e kerogen.
0 400 800 1200 1600
(t,? (psf
Figure 3 P l o t of t h e square of the p i ure 4 CP/MAS 13c n.m.r. spectra d ipo la r dephasing t ime ( f o r t l < 40 Us) ofgRundle kerogen and residues. a ) aga ins t the logari thm of s i g n a l kerogen; r e s idue prepared at: b) i n t e n s i t y from s t r o n g l y coupled 400°C, c) 450°C, d) 475'C, e) 5OOOC. a l i p h a t i c carbon (CH2,CH) i n Condor Note t h a t t h e r e is a decrease i n carbonaceous kerogen. chemical s h i f t of the a l i p h a t i c
resonance with increase i n pyrolyaia temperature.
262
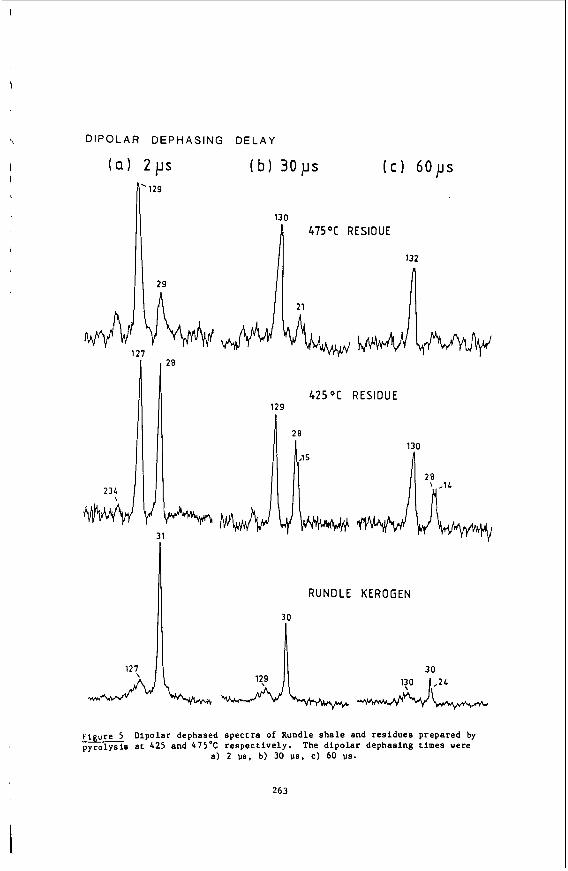
I
$.129
4 7 5 O C RESIDUE
DIPOLAR DEPHASING DELAY
2 3 L \
\
RUNDLE KEROGEN
1 2 1 30
( c ) 6 0 p s
F i "re 5 Dipolar dephased spectra of Rundle shale and residues prepared by pyfolysis a t 4 2 5 and 4 7 5 ' C respec t ive ly . The dipolar dephasing times were
a) 2 u s , b) 30 us, c) 60 us.
263
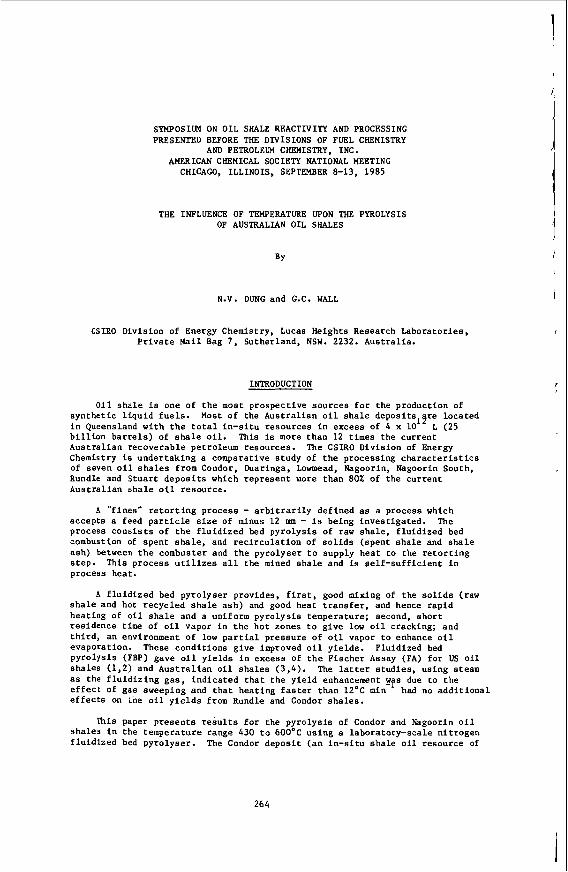
SYMPOSIUM ON O I L SHALE REACTIVITY AND PROCESSING PRESENTED BEFORE THE DIVISIONS OF FUEL CHEMISTRY
AND PETROLEUM CHEMISTRY, INC. AMERICAN CHEMICAL S O C I E T l NATIONAL MEETING
CHICAGO, ILLINOIS, SEPTEMBER 8-13, 1985
THE INFLUENCE OF TEMPERATURE UPON THE PYROLYSIS OF AUSTRALIAN OIL SHALES
BY
N.V. DUNG and G.C. WALL
CSIRO Division of Energy Chemistry, Lucas Heights Research Laborator ies , P r i v a t e Mail Bag 7 , Sutherland, NSW. 2232. Austral ia .
INTRODUCTION
Oil s h a l e is one of t h e most prospect ive sources f o r the production of synthe t ic l i q u i d f u e l s . in Queensland with t h e t o t a l in -s i tu resources i n excess of 4 x 10 L (25 b i l l i o n b a r r e l s ) of s h a l e o i l . This is more than 12 times the cur ren t Aus t ra l ian recoverable petroleum resources . Chemistry i s undertaking a comparative s tudy of t h e processing c h a r a c t e r i s t i c s of seven oil s h a l e s from Condor, Euaringa, Lowmead. Nagoorin, Nagoorin South, Rundle and Stuar t depos i t s which represent more than 80% of the cur ren t Austral ian s h a l e oil resource.
Most of the Austral ian o i l sha le deposi ts lgre loca ted
The CSIRO Divis ion of Energy
A "fines" r e t o r t i n g process - a r b i t r a r i l y def ined a s a process which The accepts a feed p a r t i c l e s i z e of minus 12 mm - is being invest igated.
process c o n s i s t s of t h e f l u i d i z e d bed pyro lys i s of raw shale , f l u i d i z e d bed combustion of spent sha le , and r e c i r c u l a t i o n of s o l i d s (spent s h a l e and s h a l e ash) between t h e combuster and the pyrolyser t o supply heat t o the r e t o r t i n g s t e p . This process u t i l i z e s a l l the mined sha le and is s e l f - s u f f i c i e n t i n process heat.
A f l u i d i z e d bed pyrolyser provides. f i r s t , good mixing of the s o l i d s (raw s h a l e and hot recycled s h a l e ash) and good heat t r a n s f e r , and hence rap id heat ing of oil sha le and a uniform pyro lys is temperature; second, shor t res idence time of oil vapor in the hot zones t o give low oil cracking; and t h i r d , an environment of low p a r t i a l pressure of o i l vapor t o enhance o i l evaporation. These condi t ions give improved o i l y ie lds . Fluidized bed pyrolysis (PBP) gave o i l y i e l d s i n excess of t h e Fischer Assay (FA) f o r US o i l shales (1,2) and Aust ra l ian o i l sha les ( 3 , 4 ) . The la t ter s tudies , using steam a s the f l u i d i z i n g gas , ind ica ted t h a t the y ie ld enhancement e f f e c t of gas sweeping and t h a t heat ing f a s t e r than 12OC min e f f e c t s on ine o i l y i e l d s from Rundle and Condor sha les .
due t o the had no a d d i t i o n a l
This paper presents r e s u l t s f o r the pyro lys i s of Condor and Nagoorin oil sha les i n the temperature range 430 t o 6OO0C using a laboratory-scale n i t rogen f lu id ized bed pyrolyser . The Condor depos i t (an in-s i tu sha le o i l resource of
r
264

1.3 x 10" L) is the largest Tertiary oil shale deposit in Australia and a potential candidate for the first new Australian shale oil production plant. TheNagoorin deposit is a carbonaceous oil shale which gives a high yield of oil of high aromatic content.
Small-scale fluidized beds severely dilute the product oil vapours with non-condensable fluidizing gases. vapours presents problems with condensing the naphtha fractions and the formation of oil mists (1,3). of shrouded turbine mixers was used to overcome these difficulties.
Quantitative recovery of the diluted oil
A dichloromethane scrubber fitted with a series
APPARATUS AND PROCEDURE
The pyrolyser, which had long solids and short (<0.5 s) vapour residence times was designed to complete the kerogen decomposition and to minimize the oil loss due to the thermal cracking of oil vapor, and hence provided the ultimate yields and characteristics of the pyrolysis products. used together with the data from pyrolysis kinetics ( 5 ) and oil cracking kinetics experiments to evaluate the performance of a largescale continuous
The final data will be
retort (6).
The FBP apparatus is shown in Figure 1. preheated to and controlled at the pyrolysis temperature in a coil of 9.5 mm 0.d. tubing by an electric furnace before entering below a conical section at the base of the reactor vessel. The reactor was a stainless steel vessel (48 mm i.d. by 300 mm long) which was initially charged with LOO g of 0.5-1.0 mm roasted, acid-washed silica sand. The temperature of the fluidized bed was controlled t o within ? l0C by an electric heater wound around the bed section. The reactor axial temperature had a uniform profile from the bottom of the bed to a height of 220 mm. lower than the bed temperature. Reactor wall temperatures were recorded at three heights to monitor for hot spots. A superficial velocity of 1.35 times the mininum fluidizing velocity was used.
Metered high purity nitrogen was
Temperature at the top of the reactor was about 30%
Samples of dried oil shale (100 g, particle size 0.6-1.4 mm) were added to the bed at the rate of 0.22 g every five seconds via an air-operated feed valve which was actuated by a cycle timer. Spent shale was accumulated in the reactor and s further retorting period of two to ten minutes after the completion of shale feeding was used to simulate an infinite solid residence time. The pyrolysis gases were passed through an internal 10 mm 0.d. cyclone to remove fines from the product. The fines were then recovered, weighed and combined with the spent shale for each run. scrubber (80 mm i.d. by 400 mm long), containing 1.2 L of rectified dichloromethane, via a sparger. Oil vapors condensed and dissolved in the dichloromethane which was kept at between 2 and 5OC by evaporation. The dichloromethane was refluxed through a condenser (-60°C) into the scrubber. O i l mists formed within gas bubbles were scrubbed by three shrouded turbines connected in series; big bubbles were sheared into smaller ones and then recirculated through one turbine many times before being released to the next. Before being metered. the off-gas passed through a bed packed with glass wool which trapped about 1 to 2% of the oil yield.
The hot gases and vapors entered a turbine
The oil/dichloromethane solution was pressure-filtered to remove traces of spent shale which were then weighed and included in the material balance. Dichloromethane was separated from the oil by atmospheric and vacuum distillation. The atmospheric fractionation column concentrated the solution to about 40 w t % of dichloromethane in the oil to keep the temperature of the solution below 60'C. rotary evaporator. condenser temperature (OOC). The oil yield was corrected for the
The vacuum distillation was performed in a closed-system The equilibrium vacuum of the system was determined by the
265
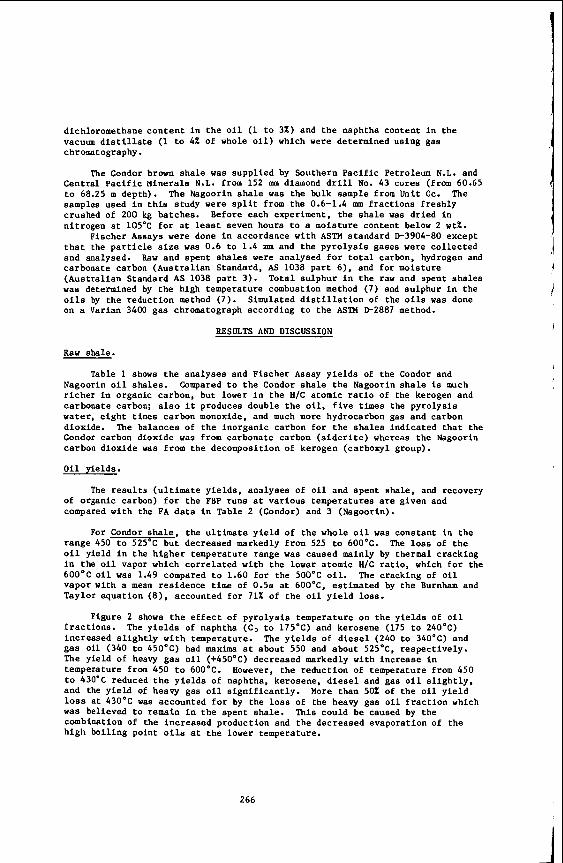
dichloromethane conten t in t h e o i l (1 t o 3%) and t h e naphtha content i n t h e vacuum d i s t i l l a t e (1 t o 4% of whole o i l ) which were determined using gas chromatography.
The Condor brown sha le was suppl ied by Southern P a c i f i c Petroleum N.L. and Central P a c i f i c Minerals N.L. from 152 mm diamond d r i l l No. 43 cores (from 60.65 t o 68.25 m depth). The Nagoorin s h a l e was t h e bulk sample from Unit Cc. The samples used i n t h i s study were s p l i t from the 0.6-1.4 mm f r a c t i o n s f r e s h l y crushed of 200 kg batches. n i t rogen a t 105% f o r a t least seven hours t o a moisture content below 2 w t % .
Fischer Assays were done i n accordance with ASTM standard D-3904-80 except t h a t the p a r t i c l e s i z e was 0.6 t o 1.4 mm and the pyro lys i s gases were col lec ted and analysed. Raw and spent sha les were analysed f o r t o t a l carbon, hydrogen and carbonate carbon (Aus t ra l ian Standard, AS 1038 par t 6), and f o r moisture (Aus t ra l ian Standard AS 1038 p a r t 3 ) . Tota l sulphur i n the raw and spent sha les w a s determined by t h e high temperature combustion method (7 ) and sulphur i n the o i l s by the reduct ion method (7). Simulated d i s t i l l a t i o n of the oils was done on a Varian 3400 gas chromatograph according t o the ASTM D-2887 method.
Before each experiment, the s h a l e was dr ied i n
RESULTS AND DISCUSSION
Raw shale.
Table 1 shows t h e analyses and Pischer Assay y i e l d s of the Condor and Nagoorin o i l shales . Compared t o t h e Condor s h a l e t h e Nagoorin s h a l e i s much r i c h e r i n organic carbon, but lower i n the H/C atomic r a t i o of the kerogen and carbonate carbon; a l s o it produces double t h e o i l , f i v e times the pyro lys i s water, e ight times carbon monoxide, and much more hydrocarbon gas and carbon dioxide. The balances of the inorganic carbon f o r t h e s h a l e s ind ica ted t h a t the Condor carbon dioxide w a s from carbonate carbon ( s i d e r i t e ) whereas the Nagoorin carbon dioxide was from t h e decomposition of kerogen (carboxyl group).
O i l y ie lds .
The r e s u l t s (u l t imate y i e l d s , analyses of o i l and spent shale , and recovery of organic carbon) f o r the PBP runs a t var ious temperatures are given and compared with the FA d a t a i n Table 2 (Condor) and 3 (Nagoorin).
For Condor shale, the u l t imate y i e l d of the whole o i l was constant i n the range 450 t o 525'C but decreased markedly from 525 t o 60OOC. o i l yield in the h igher temperature range was caused mainly by thermal cracking i n the o i l vapor which cor re la ted with the lower atomic H/C r a t i o , which f o r the 6OO0C o i l was 1.49 compared t o 1.60 f o r the 500°C o i l . vapor with a mean residence time of 0.5s a t 6OOoC, est imated by the Burnham and Taylor equat ion (8). accounted f o r 71% of t h e oil y i e l d loss.
The l o s s of t h e
The cracking of o i l
F i g u r e 2 shows t h e e f f e c t of pyro lys i s temperature on t h e y i e l d s of o i l f r a c t i o n s . The y i e l d s of naphtha (C5 t o 175°C) and kerosene (175 t o 240'C) increased s l i g h t l y w i t h temperature. The y i e l d s of d i e s e l (240 t o 340°C) and gas oil (340 t o 45OoC) had maxima a t about 550 and about 525OC. respec t ive ly . The yield of heavy gas oil (+450°C) decreased markedly with increase in temperature from 450 t o 6OO0C. However, the reduct ion of temperature from 450 t o 430°C reduced t h e y i e l d s of naphtha, kerosene, d i e s e l and gas o i l s l i g h t l y . and the y i e l d of heavy gas o i l s i g n i f i c a n t l y . loss a t 43O0C was accounted f o r by the l o s s of the heavy gas o i l f r a c t i o n which was believed t o remain i n t h e spent shale . combination of the increased production and the decreased evaporat ion of the h igh boi l ing point o i l s at t h e lower temperature.
More than 50% of t h e oil y i e l d
This could be caused by the
266
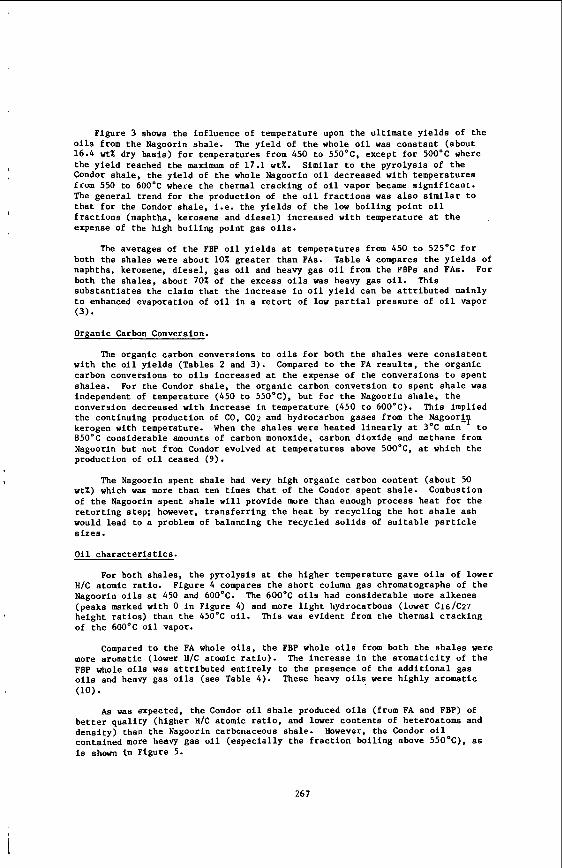
I
Figure 3 shows the inf luence of temperature upon t h e u l t imate y i e l d s of the o i l s from the Nagoorin shale . The y i e l d of the whole oil was constant (about 16.4 w t % dry basis) f o r temperatures from 450 t o 55OoC, except f o r 500'C where the y i e l d reached the maximum of 17.1 w t % . S i m i l a r t o the pyrolysis of the Condor shale , the y i e l d of the whole Nagoorin o i l decreased with temperatures from 550 to 6OO0C where the thermal cracking of o i l vapor became s i g n i f i c a n t . The general trend f o r the production of the o i l f r a c t i o n s was a l s o s i m i l a r t o t h a t f o r the Condor sha le , i.e. the y i e l d s of the low boi l ing point o i l f r a c t i o n s (naphtha, kerosene and d i e s e l ) increased with temperature a t t h e expense of the high boi l ing point gas oils.
The averages of the FBP o i l y i e l d s a t temperatures from 450 t o 525°C f o r both the shales were about 10% grea ter than FAs. Table 4 compares the y i e l d s of naphtha, kerosene, d i e s e l , gas oil and heavy gas o i l from the FBPs and FAs . For both the shales , about 70% of the excess o i l s was heavy gas o i l . This subs tan t ia tes the claim t h a t the increase i n o i l y i e l d can be a t t r i b u t e d mainly t o enhanced evaporation of o i l i n a r e t o r t of low p a r t i a l pressure of oil vapor (3) .
Organic Carbon Conversion.
The organic carbon conversions t o o i l s f o r both the sha les were c o n s i s t e n t with the o i l y ie lds (Tables 2 and 3). Compared t o t h e FA r e s u l t s , the organic carbon conversions to o i l s increased a t the expense of the conversions t o spent sha les . For the Condor shale , the organic carbon conversion t o spent s h a l e was independent of temperature (450 to 550°C), but f o r t h e Nagoorin sha le , t h e conversion decreased with increase i n temperature (450 t o 600°C). This implied the continuing production of CO, COz and hydrocarbon gases from the Nagoor&p kerogen with temperature. t o 850'C considerable amounts of carbon monoxide, carbon dioxide and methane from Nagoorin but not from Condor evolved a t temperatures above 500°C. a t which t h e production of o i l ceased (9) .
When the sha les were heated l i n e a r l y a t 3OC min
The Nagoorin spent sha le had very high organic carbon content (about 50 wt%) which was more than ten times t h a t of the Condor spent shale . Combustion of the Nagoorin spent sha le w i l l provide more than enough process heat f o r the r e t o r t i n g s tep; however, t ransfer r ing the heat by recycl ing the hot s h a l e ash would lead t o a problem of balancing the recycled s o l i d s of s u i t a b l e p a r t i c l e s i z e s .
O i l c h a r a c t e r i s t i c s .
For both shales , the pyrolysis a t the higher temperature gave o i l s of lower H/C atomic ra t io . Figure 4 compares the s h o r t column gas chromatographs of t h e Nagoorin o i l s a t 450 and 6OOOC. (peaks marked with 0 i n Figure 4) and more l i g h t hydrocarbons (lower c16/c27 height r a t i o s ) than the 450°C oil. of t h e 600OC o i l vapor.
The 600°C o i l s had considerable more alkenes
This was evident from the thermal cracking
Compared t o the FA whole o i l s , t h e FBP whole o i l s from both the s h a l e s were more aromatic (lower H/C atomic r a t i o ) . FBP whole o i l s was a t t r i b u t e d e n t i r e l y to the presence of the a d d i t i o n a l gas o i l s and heavy gas o i l s (see T a b l e 4).
The increase i n the a romat ic i ty of t h e
These heavy o i l s were highly aromatic (10).
AS was expected, the Condor oil s h a l e produced oi ls (from FA and FBP) of b e t t e r qua l i ty (higher H/C atomic r a t i o , and lower contents of heteroatoms and dens i ty) than the Nagoorin carbonaceous shale. However, the Condor o i l contained more heavy gas o i l (espec ia l ly the f r a c t i o n boi l ing above 55OoC), as i s s h a m i n Figure 5.
267
Carbonate Carbon.
By c o n t r a s t wi th the s h a l e s from Green River formation, both sha les contain small amounts of mineral carbonates ( s i d e r i t e ) . However, as is shown i n Figure 6, the r e s i d u a l carbonate carbon i n t h e Condor spent sha le reduced sharply with increase i n pyro lys i s temperature, t o 3% of the Condor sha le carbonate carbon a t 50OoC. This implies t h a t the heat of the decomposition of s i d e r i t e has t o be provided t o the r e t o r t i n g s tep , hence the content of t h i s mineral i n the feed s h a l e is v i t a l t o t h e r e t o r t heat balance.
SUMMARY
The pyro lys i s of Condor and Nagoorin sha les was s tudied i n the temperature range 430 t o 60OoC i n a n i t rogen f l u i d i z e d bed r e t o r t with long s o l i d and short vapour res idence t i m e s .
The o i l y i e l d s were constant from 450 t o 525OC (Condor) and from 450 to 55OoC (Nagoorin), and both were about 10% i n excess of Fischer Assay. addi t iona l o i l s were mainly high boi l ing point f rac t ions . o i l f rac t ions , namely naphtha, kerosene, d i e s e l , gas o i l and heavy gas o i l were s i g n i f i c a n t l y inf luenced by temperature. Generally, increase i n temperature reduced the high b o i l i n g point f r a c t i o n s (gas o i l and heavy gas o i l ) and increased t h e low b o i l i n g point f r a c t i o n s (naphtha, kerosene and d i e s e l ) .
The The d i s t r i b u t i o n of
The y i e l d s and q u a l i t y of the o i l s decreased wi th temperature from 525 t o 600'C where the thermal cracking of t h e o i l vapors (having 0.5 s residence time) became s i g n i f i c a n t .
ACKNOWLEDGEMENTS
This work is p a r t l y funded t h o u g h a co l labora t ive research agreement v i t h Southern P a c i f i c Petroleum NL and Cent ra l P a c i f i c Minerals NL (SPP/CPM) supported by a Nat ional Energy Research Development and Demonstration Program (NERDDP) grant . SPP/CPM. The authors g r a t e f u l l y acknowledge the cont r ibu t ions of M. Chensee who conducted the Nagoorin experiments, P. Udaja and T.A. Noble who analysed the feed and product samples, G. Kastl who designed and operated the d i s t i l l a t i o n u n i t s , S.J. Smith who conducted the simulated d i s t i l l a t i o n ana lys i s on the Nagoorin o i l s , and R.D. Pearse who did the Fischer Assays.
The Condor and Nagoorin o i l sha le samples were provided by
LITERATURE CITED
1.
2.
3.
4.
5.
6. 7. 8.
9.
10.
M.J. Margolis, Proceedings of the 1981 Eastern O i l Shale Symposium, Lexington KY.. 151 (1982). A.M. Rube1 and S.D. Carter, Prepr in ts of Symposium on Character izat ion and Chemistry of O i l Shales, American Chemical Society, St . Louis. 202 (1984). G.C. Wall, Proceedings of the F i r s t Austral ian Workshop on O i l Shale, Lucas Heights, 105 (1983). G.C. Wall, Seventeenth O i l Shale Symposium Proceedings, Colorado School of Mines Press , 300 (1984). G.C. Wall and N.V. Dung, Proceedings of t h e Second Austral ian Workshop on O i l Shale, Brisbane, 129 (1984). N.V. Dung and G.C. Wall, ib id , 199. P. Udaja, M.D. Chensee and T.A. Noble, i b i d , 114, (1984). A.K. Burnham and J.R. Taylor, Lawrence Livermore National Laboratory, Livermore, CA. UCID-18284 (1979). A. Ekstrom, H.J. Wurst and C.H. Randall. Symposium S e r i e s 230, 161 (1983). J.A. Gray, C.J. Brady, J.R. Cunningham, J.R. Freeman and G.M. Wilson. Ind. Eng. Chem. Process Des. Dev.. 22. 410 (1983).
American Chemical Society
260
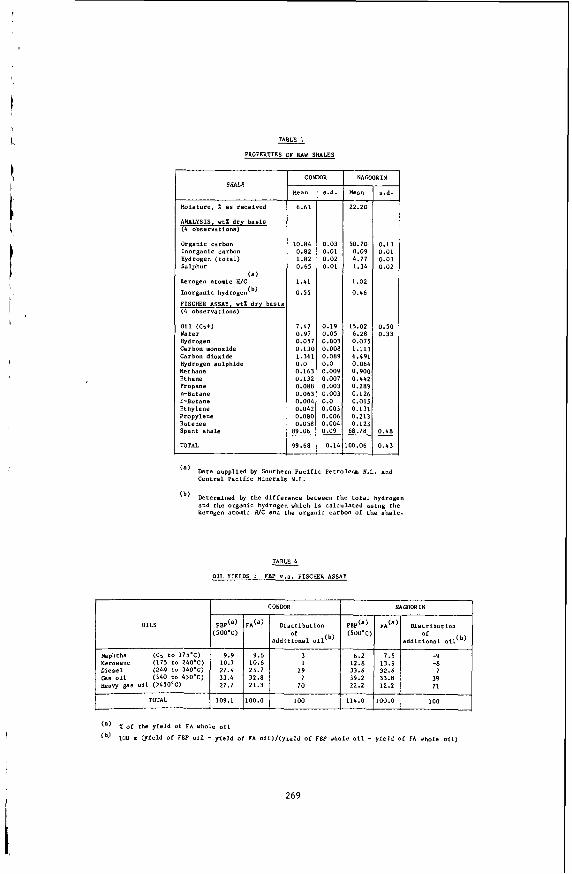
r
Mean
22.20
50.70 0.09 4.77 1.34
1.02 0.46
15.02 6.28 0.075 1.113 6.491 0.064 0.900 0.442 0.283 0.126 0.015 0.131 0.213 0.123 58.78
10.06
TABLE 1
PROPERTIES OF RAW SHALES
8.d.
0.13 0.01 0.03 0.02
0.50 0.33
0.48
0.43
I
10.84 0.82 1.82 0.65
1.41 0.55
7.47 0.97 0.057
1.361 0.0 0.163 0.132 0.088 0.063 0.004 0.042 0.080 0.058 19.06
P9.68
0.130
Moisture , X 88 received
ANALYSIS. w t % d r y b a s i s ( 4 obse rva t ions )
Organic carbon Inorganic carbon Hydrogen ( t o t e l ) Sulphur
Kerogen atomic HIC
Inorganic hydrogen(b)
(a)
0.03 0.01 0.02 0.01
0.19 0.05 0.003
0.089 0.0 0.009 0.007 0.003 0.003 0.0 0.003 0.006 0.004 0.09
0.14
o.ooe
FISCHER ASSAY. vtX d r y bas i s (4 obaeruat ione)
TOTAL
O i l (C,+) water Hydrogen Carbon monoxide Carbon d iox ide Hydrogen su lph ide Methane Ethane Propane "-Butane 1-Butane Ethylene
BULL?W* Spent s h a l e
TOTAL
Propylene
109.1 100.0 100 114.0 100.0 100
CONDOR
lean I s.d. q- NAMORIN
(a) Data supp l i ed by Southern P a c i f i c Petroleum N.L. and c e n t r a l P a c i f i c Minerals N.L.
Determined by t h e d i f f e r e n c e between t h e t a r a l hydrogen and t h e organic hydrogen which is c a l c u l a t e d using t h e kerogen a tou ic H/C and the organic carbon of the sha le .
(b )
TABLE 4 - OIL YIELDS : FBP Y.S . FISCHER ASSAY
I NAGOORIN 1 I CONWR
OILS
a d d i r i o n a l 0 1 1 ' ~ ) (500°C)
a d d i t i o n a l 011 '~ )
Naphtha (C, t o 175.C) Kerosene (175 t O 240.C) 1 3
1 Diesel (240 fo 340'C) 27.4 25.1 19 as a i l (340 t o 450'C) 32.8 7 ~ e a w gas o i l 0450'C) 27.7 21.3 70
I 1::; I
269
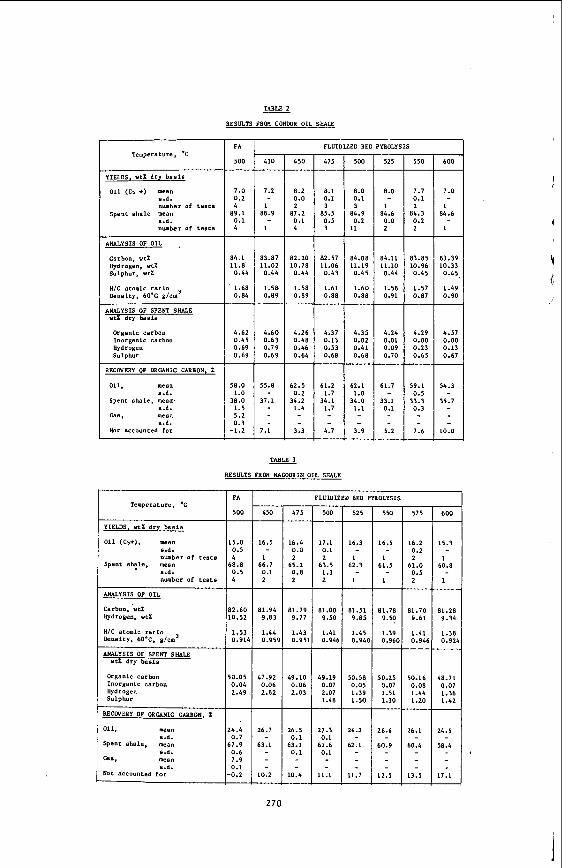
4.29 0.00 0.23 0.65
4.51 0.00 0.13 0.67
HIC atomic ratio D e n s i t y , 60.C. glcm'
ANALYSIS OF SPENT SHALE ut% dry b a s i s
Organic carbon Inorganic carbon Hydrogen Sulphur
RECOVERY OF ORGANIC CARBON. X
1.5: 0.91
50.01 0.04 2.45
1 1 TABLE 2 - RESULTS FROU CONWR OIL SHALE
- FA
500 _.
7.0 0.2 4 89.1 0.1 4
FLUIDIZED BED PyBoLrsIs Temperature. .C
YIELDS, u t % dry b a s i s
o i l (Cb +) mean
number of tents Spent shale mean
8.d. number of tests
ANALYSIS OF OIL
- 525 - 8.0
1 84.6 0.0 2 - 84.11 11.10 0.44
1.58 0.91 -
4.24 0.01 0.09 0.70 -
61.7
33.1 0.1
5.2 -
430 + 500 7.2
1 88.9
1
8.0 0.1 3 84.9 0.2 11 - 84.08 11.19 0.45
1.60 0.88
Carbon, ut% Hydrogen, u t % Sulphur, ut%
84.1 11.8 0.44
1.68 0.84
83.87 11.02 0.44
1.58 0.89
I H/c atomic ra t io Densi ty , 60-C glcm'
w t l dry basis
4.62 0.45 0.69 0.69
4.60 0.63 0.79 0.69
Organle carbon Inorganic carbon Hydrogen Sulphur I I RECOVERY OF ORGANIC CARBON. %
Not accounted for
58.0 1.0
38.0 1.5 5.2 0.3 -1.2 -
55.8
37.1
7.1 -
::! 3.3 4.7
62.1 1.0 34.0 1.1
3.9 - 7f6 I 1:O
TABLE 3
RESULTS PRCM NAGOORIN OIL SHALE
FLUIUIZEU BED PYROLYSIS - 600
Temperature, .C
YIELDS, w t X dry b a s i s
number of tests Spent shale. mean 68.8
s . d . 0.5 number of t e s t s
- 475 - 16.4 0.0 2 65.2 0.8 2 -
81.79 9.77
1.43 0.95 -
49.10 0.06 2.03
-
16.5 0.1 13.1 0.1
10.4 -
- 575 450 500 525 550
16.5
1 66.1 0.1 2
17.1 0.1 2
63.5 1.3 2
16.3
1 62.3
L _.
81.51 9.85
1.45 0.941 -
50.58 0.05 1.39 1.50
16.5
I 61.5
1
16.2 0.2 2 61.0 0.5 2 _.
81.70 5.61
1.41 0.94 -
50.16 0.08 1.44 1.20 - 26.1
60.4
13.5 -
15.3
I 60.8
1 __
81.28 9.34
1.38 0.92,
I marsis OF OIL
Carboo, ut% Hydrogen, ut%
81.94 9.83
1.44 0.9% -
47.92 0.06 2.82
81.00 9.50
1.41 0.941
81.78 9.50
1.39 0.96C
49.19 0.07 2.07 1.48
50.25 0.07 1.51 1.30 _.
26.6
60.9
12.5 -
48.71 0.07 1.36 1.42 -
21.5
58.4
17.1
O i l . mean s .d .
Spent shale, mean 8 .6 .
s . d . us, mean
Not accounted for
26.7
63.1
10.2 -
27.3 0.1 61.6 0.1
11.1 -
26.2
62.1
11.7 -
24.4 0.7 67.9 0.6 7.9 0.1
-0.2
270
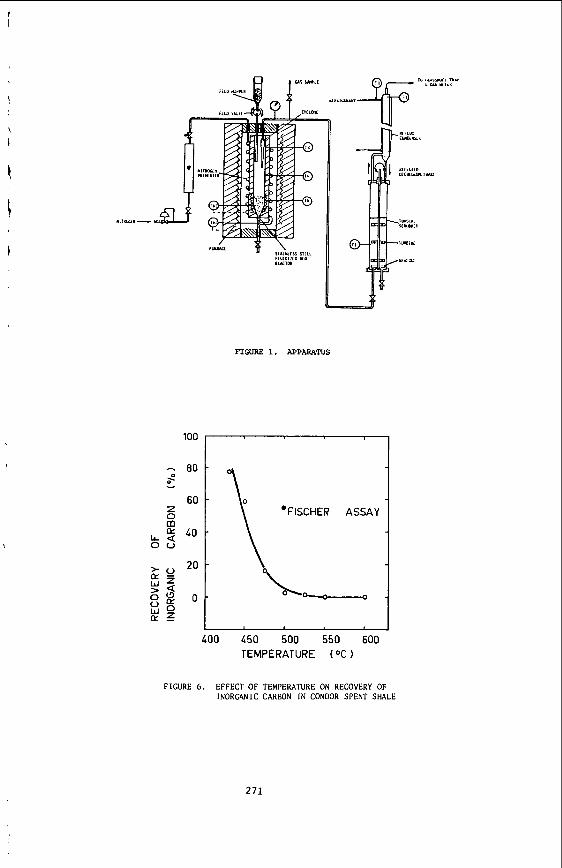
,FIGURE 1. APPARATUS
60 z 0
L L Q 0 0
LO
ji2:1 , , , , , w o a z
400 150 500 550 600 TEMPERATURE ( O C )
FIGURE 6. EFFECT O F TEMPERATURE ON RECOVERY OF INORGANIC CARBON IN CONDOR SPENT SHALE
271
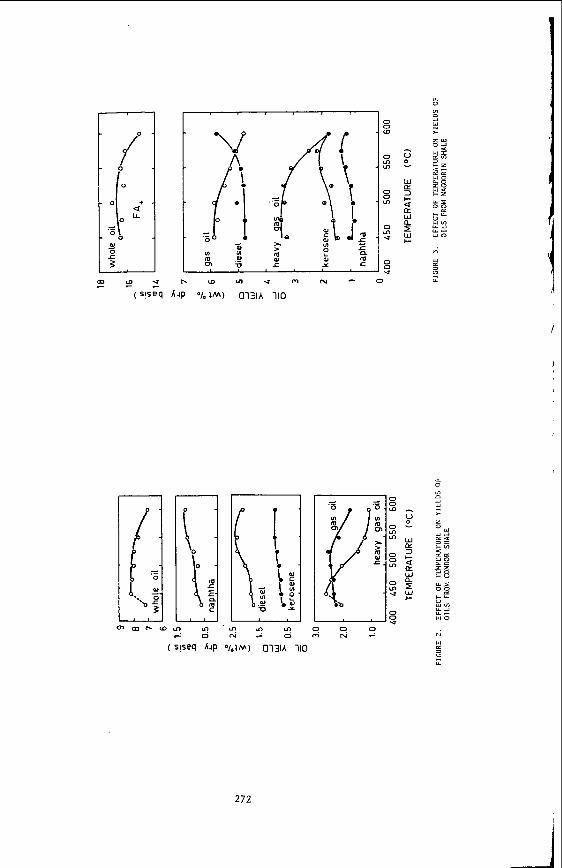
272
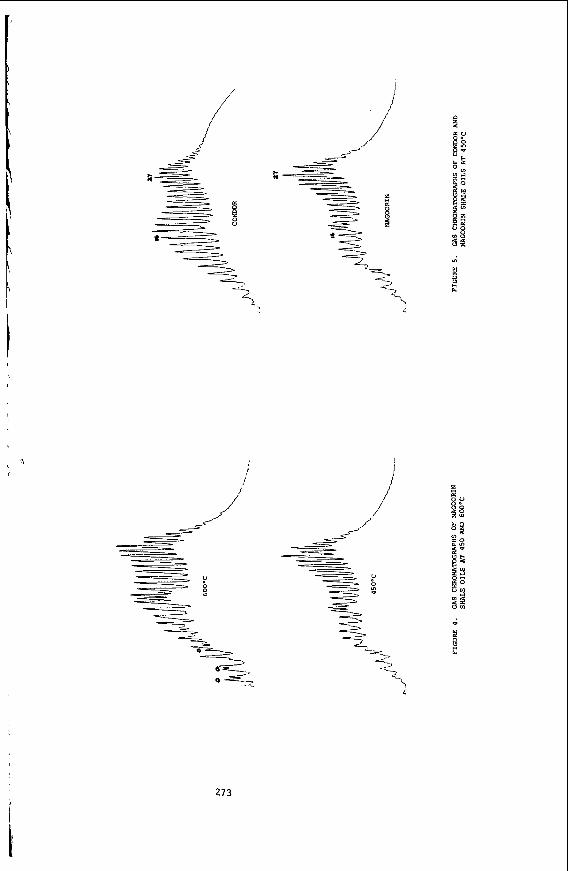
1''
I
I
,i i'
P B E:
273
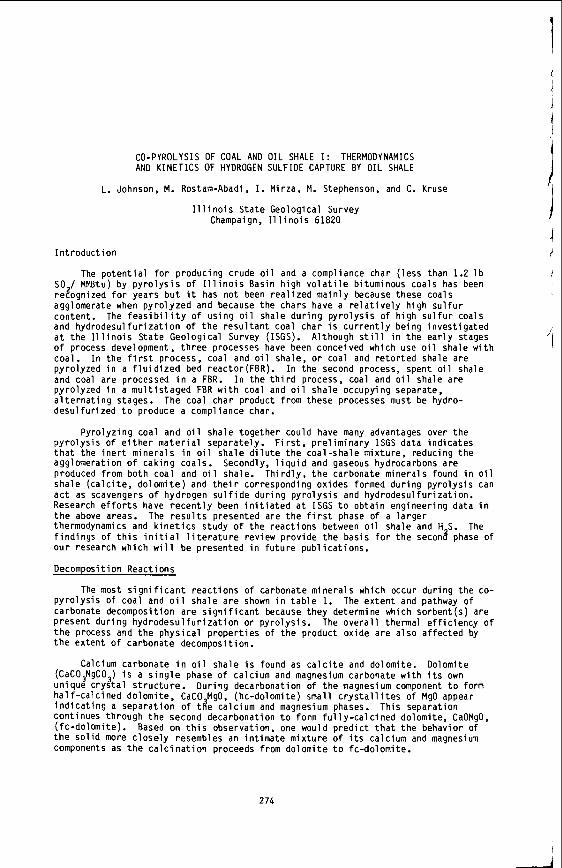
CO-PYROLYSIS OF COAL AN0 OIL SHALE I : THERMODYNAMICS AND KINETICS OF HYDROGEN SULFIDE CAPTURE BY OIL SHALE
L. Johnson, M. Rostam-Abadi, I . Mirza, M. Stephenson, and C. Kruse
I l l i n o i s State Geological Survey Champaign, I 1 1 i noi s 61820
In t roduc t i on
The p o t e n t i a l f o r producing crude o i l and a compliance char ( l ess than 1.2 l b SO / MMBtu) by p y r o l y s i s o f I l l i n o i s Basin h igh v o l a t i l e bituminous coals has been rezognized f o r years b u t i t has not been rea l i zed main ly because these coals agglomerate when py ro l yzed and because the chars have a r e l a t i v e l y h igh s u l f u r content. The f e a s i b i l i t y o f us ing o i l shale du r ing p y r o l y s i s o f h igh s u l f u r coals and hyd rodesu l fu r i za t i on o f t h e r e s u l t a n t coal char i s c u r r e n t l y being i nves t i ga ted a t t he I l l i n o i s State Geological Survey (ISGS). Although s t i l l i n t he e a r l y stages o f process development, t h r e e processes have been conceived which use o i l shale w i t h coa l . I n the f i r s t process, coal and o i l shale, o r coal and r e t o r t e d shale are pyro lyzed i n a f l u i d i z e d bed reactor(FBR). and coal are processed i n a FBR. I n the t h i r d process, coal and o i l shale are pyro lyzed i n a m u l t i s t a g e d FBR w i t h coal and o i l shale occupying separate, a l t e r n a t i n g stages. The coal char product from these processes must be hydro- desu l fu r i zed t o produce a compliance char.
I n the second process, spent o i l shale
Pyro lyz ing coal and o i l shale together could have many advantages over the p y r o l y s i s o f e i t h e r m a t e r i a l separately. F i r s t , p r e l i m i n a r y ISGS data i nd i ca tes t h a t the i n e r t m ine ra l s i n o i l shale d i l u t e t h e coal -shale mixture, reducing the agglomeration o f cak ing coals. produced from both coal and o i l shale. T h i r d l y , t h e carbonate minera ls found i n o i l shale ( c a l c i t e , do lomi te ) and t h e i r corresponding oxides formed dur ing py ro l ys i s can a c t as scavengers o f hydrogen s u l f i d e dur ing p y r o l y s i s and hydrodesul fur izat ion. Research e f f o r t s have r e c e n t l y been i n i t i a t e d a t I S G S t o ob ta in engineering data i n t h e above areas. The r e s u l t s presented are t h e f i r s t phase o f a l a r g e r thermodynamics and k i n e t i c s study o f t he react ions between o i l shale and H S. The f i n d i n g s of t h i s i n i t i a l l i t e r a t u r e review prov ide the bas is f o r t h e secona phase o f ou r research which w i l l be presented i n fu tu re pub l i ca t i ons .
Secondly, l i q u i d and gaseous hydrocarbons are
Decomposition Reactions
The most s i g n i f i c a n t reac t i ons o f carbonate m ine ra l s which occur dur ing the co- p y r o l y s i s o f coal and o i l shale a re shown i n t a b l e 1. carbonate decomposition are s i g n i f i c a n t because they determine which sorbent(s) are present du r ing h y d r o d e s u l f u r i z a t i o n o r py ro l ys i s . The o v e r a l l thermal e f f i c i e n c y o f t h e process and the phys i ca l p roper t i es of t he product oxide are a l so a f fec ted by t h e extent o f carbonate decomposition.
The ex ten t and pathway o f
Calcium carbonate i n o i l shale i s found as c a l c i t e and dolomite. Dolomite (CaC0,MgCOJ i s a s i n g l e phase o f calcium and magnesium carbonate w i t h i t s own unique c r y s t a l s t r u c t u r e . Dur ing decarbonation o f t h e magnesium component t o form ha l f - ca l c ined dolomite, CaCO MgO, (hc-dolomite) small c r y s t a l l i t e s o f MgO appear i n d i c a t i n g a separat ion o f t d e ca lc ium and magnesium phases. This separation continues through t h e second decarbonation t o form f u l l y - c a l c ined dolomite, CaOMg0, ( fc-do lomi te) . Based on t h i s observation, one would p r e d i c t t h a t t he behavior o f t h e s o l i d more c l o s e l y resembles an i n t ima te m ix tu re o f i t s calcium and magnesium components as t h e c a l c i n a t i o n proceeds from dolomi te t o fc-do lomi te.
I
274
Table 1. Shale Mineral Reactions Occurr ing During Py ro l ys i s and Hydrodesu l fu r i za t i on
Equation H,,, ( K c a l h o l e ) Equation No
~~~ ~
Decomposition Reactions CaCO, + CaO + CO,
MgCO, + MgO + CO, CaCO,MgCO, + (CaCO, t MgO) + CO, CaCO,MgCO, + (CaO + MgO) t 2C0,
43
28
30 73
Desul f u r i za t i on Reactions
CaCO, t H,S + Cas t CO, t H,O
CaC0,MgO + H,S + (Cas + MgO) f H,O + CO,
28 -15
28 -15
CaO + H,S + Cas t H20
CaOMgO + H,S + (Cas t MgO) t H,O
CaCO,MgCO, t H,S + (Cas t MgO) + 2C0, t H,O 62
Both the extent and mechanism o f do lomi te decomposition are a f f e c t e d by the p a r t i a l pressure o f CO . Haul and Markus (1952) fo l l owed the decomposition o f do lomi te by thermogravfmetric ana lys i s o f powdered dolomi te a t 500-900°C under var ious p a r t i a l pressures o f CO,.. The i r resu l t s , shown i n f i g u r e 1, i n d i c a t e t h a t t h e decomposition occurs by two d i f f e r e n t pathways:
CaCO,MgCO, + [CaCO, + MgO] + CO, + [CaO t MgO] +2C02
CaCO,MgCO, + [CaO t MgO] + ZCO,
Path A
Path B
The decomposition fo l lowed Path A when the p a r t i a l pressure o f CO was 12-24 mmHg w h i l e Path B p r e v a i l s a t h igher CO pressures. t h e decomposition reac t i on i s simp?y t h e p a r t i a l pressure o f CO , the concentrat ion of CO which'a carbonaceous ma te r ia l ( r e t o r t e d shale or coal char) i s ox id i zed t o supply energy f o r the p y r o l y s i s stage, t he presence o f CO, i n t h e recyc led combustion gases w i l l i n h i b i t t he carbonate decomposition.
The onset o f decomposition i s a f f e c t e d by the presence o f steam. M a c I n t i r e and Stansel l (1953) r e p o r t t h a t calcium and magnesium components of do lomi te decompose about 2OOOC lower than when a i r i s used alone. The same e f f e c t was observed by Burnham e t a l . (1980) except do lomi te was a f f e c t e d t o a much greater ex ten t t han c a l c i t e .
Since the equi l ibF ium constant f o r
a f f e c t s both t h e mechanism and extent o f decomposition. 'For processes i n
Decomposition reac t i ons are h i g h l y endothermic, thus they adversely a f f e c t the
The minimum heat fdr
thermal e f f i c i e n c y o f t h e process. Boynton (1980) described the heat balance f o r t he c a l c i n a t i o n o f l imestone i n a r o t a r y k i l n . Between 1.7 and 4.8 MMBtu/ton o f CaCO a r e expended depending on t h e heat recovery systems employed. c a l c i n a t i o n a t t he d i s s o c i a t i o n temperature i s 2.5 WBtu/ ton of c a l c i t e o r 0.61 MMBtu/ton o f shale t o c a l c i n e an average western shale con ta in ing 33% carbonates. Chen e t a l . (1982) used t h e ASPEN computer s imu la t i on system t o study t h e e f f e c t o f c a l c i t e decomposition on t h e o v e r a l l thermal e f f i c i e n c y o f an o i l shale r e t o r t .
275
1 F i n a l l y , t h e r a t e and t h e temperature o f decomposition a f f e c t t h e pore
s t r u c t u r e o f t h e carbonate minera l p a r t i c l e s as we l l as t h e shale. Steen e t a l . (1980) repor ted an i nc rease i n p o r o s i t y from 12 t o 29% accompanied by an increase i n
Surface area and p o r o s i t y have a s t rong in f l uence on t h e r a t e o f s u l f i d a t i o n and
Campbell (1978) and McCarthy e t a l . (1984) have shown t h a t t he under t y p i c a l
i surface area from 0.3 t o 8.9 m2/g a f t e r h a l f c a l c i n a t i o n o f a do lomi te sample.
absorbance capac i t y o f t h e minerals.
I
i I r e t o r t i n g cond i t i ons CaCO, a l s o reacts w i t h SiO,. The competing reac t i ons are:
xCaCO, + ySi0, + CaxSiyOxt2y t XCO,
CaCO, CaO t CO,
When a h igh CO reac t i on t o f o h s i l i c a t e s increased because o f t h e g rea te r l eng th o f t ime requi red t o reach the decarbonation temperature. Decomposition t o CaO i s very r a p i d once t h i s temperature i s reached. t h e CO p a r t i a l pressure whereas s i l i c a t e format ion occurs a t about 70O-80ODC. Theref i re , t h i s undes i rab le dep le t i on o f a v a i l a b l e carbonates would no t be s i g n i f i - cant dur ing p y r o l y s i s (6OOOC) bu t may become a problem dur ing hyd rodesu l fu r i za t i on (750-850°C) or i f t h e shale i s r e t o r t e d p r i o r t o m ix ing w i t h the coal t o be pyrolyzed.
Thermodynamics o f D e s u l f u r i z a t i o n Reactions
gas d e s u l f u r i z a t i o n by carbonates. H CO. CO and H S i n f l u e n c e t h e H S adsorpt ion e q u i l i b r i a , i.e. equations 5-9,
p y r o l y s i s and hyd rodesu l fu r i za t i on processes, but these condi t ions may not be the most favorable f o r H S adsorpt ion. o f H S adsorpt ion by 'o i l shale minerals are reviewed w h i l e tak ing i n t o considerat ion the Pimited range o f ope ra t i ng condi t ions t y p i c a l o f p y r o l y s i s and hydrodesul f u r i z a t i o n processes.
The reac t i on between ca lc ium oxide and hydrogen s u l f i d e (eqs. 6 and 8 ) has been s tud ied by many researchers (Uno, 1951; Rosenquist, 1951; Curran e t al., 1967). P e l l (1971) summarized these experimental s tud ies w i t h the f o l l o w i n g l e a s t squares f i t of t h e i r data:
p a r t i a l pressure and a slow heat ing r a t e were used, t he carbonate
Oxide format ion occurs a t 600 t o 75D°C depending on
The ISGS a p p l i c a t i o n o f t he minera ls i n o i l shale d i f f e r s markedly from fue l During p y r o l y s i s and hyd rodesu l fu r i za t i on , H,O,
1. dpt imal ,temperatures, pre lsures, f lowrates, e tc . have been s p e c i f i e d f o r
I n the f o l l o w i n g d iscuss ion the thermodynamics
Pel l combined t h i s expression w i t h the data g iven by H i l l and Winter (1956) f o r the decomposition o f ca lc ium carbonate t o f i n d the f o l l o w i n g e q u i l i b r i u m expression f o r the reac t i on between hc-dolomite and hydrogen s u l f i d e (eq. 7):
'H20 * 'C02 l o g K = l o g = 7.253 - 5280.5/T
H2S Combining equat ion 11 w i t h the data given by Stern and Weise (1969) on t h e
decomposition o f magnesium carbonate, t h e f o l l o w i n g expression f o r t h e e q u i l i b r i u m between dolomi te and H2S (eq. 9) i s obtained:
276
\ 1 og
3. and
(pC02)2 'H20 K = l o g = 16.19 - 10,553/T 12)
H2S
P l o t s o f l o g K vs 1/T de r i ved from equations 10-12 are shown i n f i g u r e s 2 and P lo ts from thermodynamic c a l c u l a t i o n s based on t h e data o f Ba r in e t a l . (1977) M i l l s (1974) are a l so shown. A number o f i n t e r e s t i n g observations can be made
from these f i gu res .
1. The e f f i c i e n c y o f ca lc ium ox ide as an H,S absorbent decreases a t h ighe r temperatures whereas t h e e f f i c i e n c y o f ca lc ium carbonate increases.
2 . The thermodynamic c a l c u l a t i o n s o f the e q u i l i b r i u m constant f o r t he reac t i on o f H S and l i m e agree we l l w i t h the experimental data. Since on ly therdodynamic data f o r do lomi te ex i s t s , t he c a l c u l a t i o n s , f o r t h e s u l f i d a t i o n o f t he f u l l and h a l f ca l c ines were made as shown above, 1.e.. s t a r t i n g w i t h dolomite c a l c u l a t i o n s and combining them w i t h decomposition data. Therefore, t h e good match between the thermodynamic and experimental values shown i n f i g u r e 3 r e f l e c t accurate p r e d i c t i o n s o f t he extent o f carbonate decomposition, no t s u l f i d a t i o n .
3. As was mentioned e a r l i e r , t he behavior o f fc -do lomi te i s nea r l y t h e same as t h a t o f ca lc ium oxide, and the reac t i on o f hc-dolomite w i t h hydrogen s u l f i d e i s s i m i l a r t o t h a t o f c a l c i t e . On the other hand, do lomi te behaves completely d i f f e r e n t than c a l c i t e .
When coal i s pyrolyzed, p y r i t e (FeS ) i s converted t o p y r r h o t i t e (FeS) and hydrogen su l f i de . captured i n the carbon m a t r i x o f t he coal o r char (Huang and P u l s i f e r , 1977). s tud ies o f t he reac t i on o f H S w i t h char, commonly r e f e r r e d t o as the back-reaction, have been c a r r i e d out (Robinton, 1976; Z ie l ke e t al., 1954; Jones e t al., 1966). Depending o r t h e temperature and nature o f t he char, t h e back reac t i on can occur a t H S concentrat ions as low as 300 ppm. An acceptable scavanger should l i m i t t he H S c incen t ra t i on t o t h i s l e v e l t o i n h i b i t t he back-reaction. F igure 4 shows t h a t u n b r t y p i c a l py ro l ys i s condi t ions, ca lc ium minera ls are capable o f ma in ta in ing t h i s l e v e l i f e q u i l i b r i u m i s reached. 300 ppm, i s p red ic ted a t a l l temperatures of i n t e r e s t when CaO i s present, a t temperatures above 400°C when dolomi te i s present, and a t temperatures above 750'C when CaCO i s present. Data from t h e Lurgi-Rhurgas o i l shale d i s t i l l a t i o n process which r e c j c l e s ox id i zed shale t o the p y r o l y s i s bed demonstrates the r e a c t i v i t y o f CaO toward H,S. concentrat ions o f -1300 ppm and -4000 ppm i n the o f f gas have been repo r ted by Schmalfeld (1975) and Weiss (1982). respec t i ve l y . S i t r a i (1984) has a l so shown t h a t r e t o r t i n g a 1:l m ix tu re o f o i l shale and shale ash reduces the concen t ra t i on o f H,S i n t h e off-gas t o l ess than 100 ppm.
The hydrogen s u l f i d e day then be removed w i t h the o f f -gas o r be Many
The des i red e q u i l i b r i u m p a r t i a l pressure, i.e., below
A t a recyc le r a t i o o f about 7 /1 and a t 65OoC, hydrogen s u l f i d e
The decomposition and d e s u l f u r i z a t i o n react ions o f carbonates occur i n p a r a l l e l . Therefore, the compet i t ion between the two react ions should be considered. The FACT thermodynamics computing system (Bale e t al., 1979) was used t o develop the phase s t a b i l i t y diagrams f o r Mg-C-H-0-S and the Ca-C-H-0-S systems shown i n f igures 5-7. Magnesium carbonate i s unstable w i t h respect t o the ox ide a t 327OC and .10 atm. CO . As shown i n f i g u r e 5, a t hydrogen s u l f i d e concentrat ions of 0.6% o r higher, s u l f i d a t i o n i s i n h i b i t e d u n t i l about 1227'C. This r e s u l t agrees w i t h Westmoreland and Harr ison (1980) who concluded t h a t MgO i s t o o s t a b l e t o be used as an H2S acceptor.
temperature, and 750'C. a t y p i c a l hyd rodesu l fu r i za t i on temperature f o r coal char, are shown i n f i g u r e s 6 and 7.
217
phase diagrams f o r t he Ca-0-H-S-C system a t about 5OO0C, t h e maximum p y r o l y s i s
A t 600°C calc ium oxide e x i s t s on l y a t carbon d iox ide
pressures lower than about 0.01 atm. cen t ra t i ons as low as 10 ppm whereas, depending on the C O concentrat lon, H S concentrat ions from 100 t o 1000 ppm are requ i red before t t e carbonate w i l l Jndergo s u l f i d a t i o n . A t 750°C t h e r e a c t i v i t y o f t h e ox ide i s nea r l y unchanged. However, a t t h i s temperature CaCO pressures as h igh as 0.2 atm and w i l l undergo s u l f i d a t i o n a? H,S concentrat iorfs as low as 100 ppm. Nonetheless, CaO s t i l l appears t o be the most reac t i ve . t i o n s o f Harr ison and Westmoreland (1980) who repor ted t h a t the most e f f i c i e n t d e s u l f u r i z a t i o n occurred a t t he lowest temperature (about 880°C) a t which CaO was f i r s t formed from CaCO,.
An increase i n t h e t o t a l pressure, w i t h a corresponding increase i n t h e CO and H 0 p a r t i a l pressures, would i n h i b i t d e s u l f u r i z a t i o n by the carbonates (e s. 5,'7 a$d 9) but would not a f f e c t the e q u i l i b r i a between H S and ca lc ium ox ide qeqs. 6 and 8). However, a t a h ighe r C O p a r t i a l pressure recargonat ion o f the oxide competes w i t h s u l f i d a t i o n reac t i on . &der a 0.4 atmosphere pressure of CO , CaO w i l l recar- bonate at temperatures below 827OC (Stern and Wiese, 1969). Thus2H,S adsorpt ion by any o f the sorbents considered i s less e f f i c i e n t a t h igher pressure. However, most p y r o l y s i s and hyd rodesu l fu r i za t i on processes operate a t or near atmospheric pressure.
Calcium ox ide w i l l r eac t w i t h H,S a t gas con-
I , decomposes a t CO
These r e s u l t s are i n agreement w i t h the observa-
Oesul f u r i z a t i o n K i n e t i c s
Before any engineer ing dec is ions on t h e e f fec t i veness o f o i l shale as hydrogen s u l f i d e acceptor are made, d e t a i l e d i n fo rma t ion on the thermodynamics and k i n e t i c s o f react ions i nvo l ved i s required. However, thermodynamics on ly determine whether a g iven d e s u l f u r i z a t i o n reac t i on could occur, w h i l e the k i n e t i c s determine the degree o f conversion of a thermodynamical ly a l lowable react ion. I n p a r t i c u l a r , k i n e t i c data are essen t ia l s ince i n most engineer ing modeling c a l c u l a t i o n s they are combined w i t h t ranspor t equations t o p r e d i c t the performance o f a given system.
r o x i d e w i t h H S have been repor ted by a number o f i nves t i ga to rs . publ ished wor f i s presented i n t a b l e 2. The experiments were conducted under cond i t i ons where t r a n s p o r t e f f e c t s were minimized. f o r t h e reac t i on ca lc ium ox ide and H S range from 3.6 t o 38 kcal/mole and those f o r t h e carbonate range from 17.3 t o 60 fcal/mole. (1976) and Kamath and P e t r i e (1981) may be due t o d i f f u s i o n res is tances. The a c t i v a t i o n energy values f o r t h e s u l f i d a t i o n o f l ime as repor ted by A t t a r (1978) and Borgwardt e t a l . (1984) a r e 37 and 31 kcal/mole. be l i eves t h a t t he r e a c t i o n i s c o n t r o l l e d k i n e t i c a l l y wh i l e the l a t t e r be l ieves t h a t d i f f u s i o n through t h e CaS l a y e r i s the c o n t r o l l i n g step. f a c t o r s , shown i n t a b l e 2, a l so vary by many orders o f magnitude. t h e data a v a i l a b l e i n t h e l i t e r a t u r e a re inconclus ive. i t i e s repor ted i n t h e l i t e r a t u r e can be a t t r i b u t e d e i t h e r t o d i f f e rences i n experimental methodology or i n t h e phys i ca l c h a r a c t e r i s t i c s of m ine ra l s employed.
The pore s i z e d i s t r i b u t i o n , poros i ty , and sur face area of the sample as we l l as t h e presence o f magnesium ox ide have been shown t o a f f e c t t h e r e a c t i v i t y o f ca lc ium minera ls w i t h H2S. r eac t i on of l i m e w i t h H S a t 7OOOC i s p ropor t i ona l t o t h e 2.3 power o f t h e B.E.T. surface area ind icat ing 'product l a y e r d i f f u s i o n con t ro l a t these condi t ions. Other authors, however, have observed t h a t t he reac t i on "stops dead" a f t e r 5 t o 25% conversion due t o t h e s o l i d product l a y e r (A t ta r , 1979; Squires, 1972). a l . (1976) concluded t h a t t he c r y s t a l l i t e s o f MgO found i n hc-dolomite increased t h e r e a c t i v i t y o f t he ca lc ium carbonate by ma in ta in ing t h e p o r o s i t y o f t h e ma te r ia l and h inde r ing t h e c o n s o l i d a t i o n o f t he carbonate i n t o l a r g e r c r y s t a l s . Pel1 (1971) a l so found tha t the s u l f i d a t i o n of fc-do lomi te p a r t i c l e s occurred homogeneously through- ou t t h e s o l i d . MgO i n dolomite, thereby enhancing the r e a c t i v i t y of t h e CaO or CaCO, i n o i l shale.
2 78
The i n t r i n s i c r a t e constants f o r t h e reac t i ons of ca lc ium carbonate or calc ium A summary o f
The repor ted a c t i v a t i o n energies
The low values o f Westmoreland
However, t he former author
The pre-exponent ia l It appears t h a t
The wide range o f r e a c t i v -
The work o f Borgwardt e t a l . (1984) showed t h a t t he r a t e o f
Harvey e t
The i n e r t minera ls i n o i l shale could perform t h e same func t i on as
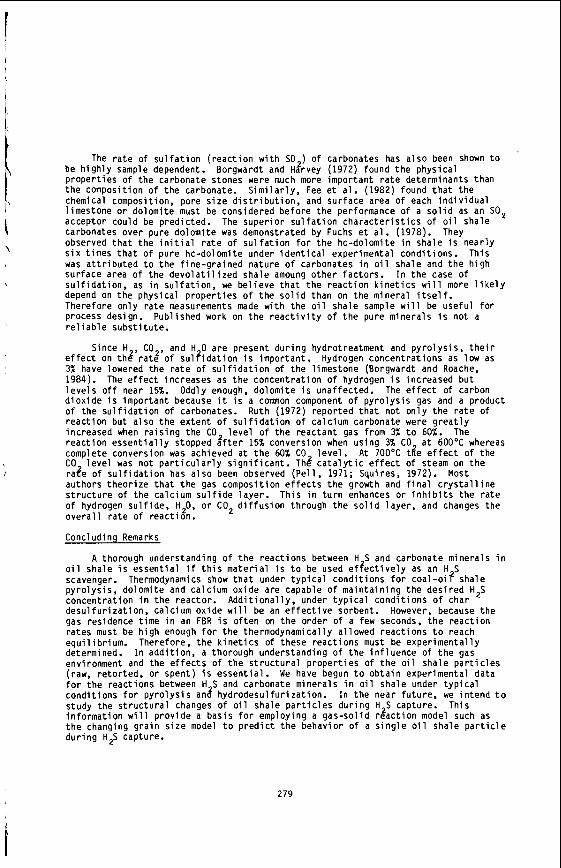
I, '\
\
The r a t e o f s u l f a t i o n ( reac t i on w i t h SO,) o f carbonates has a l so been shown t o be h i g h l y sample dependent. Borgwardt and Harvey (1972) found t h e phys i ca l p roper t i es o f the carbonate stones were much more impor tant r a t e determinants than the composit ion o f t he carbonate. S i m i l a r l y , Fee e t a l . (1982) found t h a t t he chemical composition, pore s i z e d i s t r i b u t i o n , and sur face area o f each i n d i v i d u a l l imestone or dolomi te must be considered be fo re the performance o f a s o l i d as an SO, acceptor could be predic ted. The super ior s u l f a t i o n c h a r a c t e r i s t i c s o f o i l shale carbonates over pure dolomi te was demonstrated by Fuchs e t a l . (1978). observed t h a t t h e i n i t i a l r a t e o f s u l f a t i o n f o r t h e hc-dolomite i n shale i s near ly s i x t imes t h a t o f pure hc-dolomite under i d e n t i c a l experimental condi t ions. This was a t t r i b u t e d t o the f i ne -g ra ined nature o f carbonates i n o i l shale and t h e h igh surface area o f t he d e v o l a t i l i z e d shale amoung o the r fac to rs . I n the case o f s u l f i d a t i o n , as i n s u l f a t i o n , we be l i eve t h a t t he reac t i on k i n e t i c s w i l l more l i k e l y depend on the phys ica l p roper t i es o f t he s o l i d than on the minera l i t s e l f . Therefore only r a t e measurements made w i t h the o i l shale sample w i l l be useful for process design. Published work on t h e r e a c t i v i t y o f t h e pure minera ls i s not a re1 i a b l e subs t i t u te .
e f f e c t on the2 r a t 2 o f s u l f i d a t i o n i s impor tant . 3% have lowered the r a t e o f s u l f i d a t i o n o f t he l imestone (Borgwardt and Roache, 1984). l e v e l s o f f near 15%. Oddly enough, do lomi te i s unaf fected. The e f f e c t o f carbon d iox ide i s impor tant because i t i s a common component o f p y r o l y s i s gas and a product o f t he s u l f i d a t i o n of carbonates. Ruth (1972) repor ted t h a t not on l y t h e r a t e o f reac t i on but a l so the ex ten t o f s u l f i d a t i o n o f ca lc ium carbonate were g r e a t l y increased when r a i s i n g the CO l e v e l o f t he reactant gas from 3% t o 602. The reac t i on e s s e n t i a l l y stopped i f t e r 15% conversion when us ing 3% CO complete conversion was achieved a t t h e 60% CO l e v e l . CO l e v e l was no t p a r t i c u l a r l y s i g n i f i c a n t . Th8 c a t a l y t i c e f f e c t o f steam on t h e ra?e o f s u l f i d a t i o n has a l so been observed (Pe l l , 1971; Squires, 1972). authors theo r i ze t h a t t h e gas composit ion e f f e c t s t h e growth and f i n a l c r y s t a l l i n e s t r u c t u r e o f t he ca lc ium s u l f i d e l aye r . Th is i n t u r n enhances or i n h i b i t s t he r a t e o f hydrogen s u l f i d e , H,O, or CO, d i f f u s i o n through the s o l i d l aye r , and changes the o v e r a l l r a t e o f react ion.
Concluding Remarks
o i l shale i s essen t ia l i f t h i s ma te r ia l i s t o be used e f f e c t i v e l y as an H S scavenger. Thermodynamics show t h a t under t y p i c a l cond i t i ons f o r coal-oi i ! shale py ro l ys i s , do lomi te and ca lc ium ox ide are capable o f ma in ta in ing t h e des i red H,S concentrat ion i n t h e reactor . A d d i t i o n a l l y , under t y p i c a l cond i t i ons o f char desu l fu r i za t i on , ca lc ium ox ide w i l l be an e f f e c t i v e sorbent. However, because the gas residence t ime i n an FBR i s o f ten on t h e order o f a few seconds, t h e reac t i on ra tes must be h igh enough f o r t h e thermodynamically a l lowed reac t i ons t o reach equ i l i b r i um. determined. I n add i t i on , a thorough understanding o f t h e i n f l u e n c e o f t h e gas environment and the e f f e c t s o f the s t r u c t u r a l p roper t i es o f t h e o i l shale p a r t i c l e s (raw, re to r ted , or spent) i s essen t ia l . W e have begun t o ob ta in experimental data f o r t he react ions between H S and carbonate minera ls i n o i l shale under t y p i c a l cond i t i ons f o r p y r o l y s i s and hyd rodesu l fu r i za t i on . I n the near fu tu re , we in tend t o study the s t r u c t u r a l changes o f o i l shale p a r t i c l e s du r ing H S capture. This in format ion w i l l p rov ide a bas is f o r employing a gas-so l id rgac t i on model such as t h e changing g ra in s i z e model t o p r e d i c t t h e behavior o f a s i n g l e o i l shale p a r t i c l e du r ing H2S capture.
They
Since H , CO , and H 0 are present du r ing hydrotreatment and py ro l ys i s , t h e i r Hydrogen concentrat ions as low as
The e f f e c t increases as the concentrat ion o f hydrogen i s increased bu t
a t 600'C whereas A t 700'C tt fe e f f e c t of the
Most
A thorough understanding o f t h e react ions between H S and carbonate minera ls i n
Therefore, t h e k i n e t i c s o f these react ions must be exper imenta l ly
279
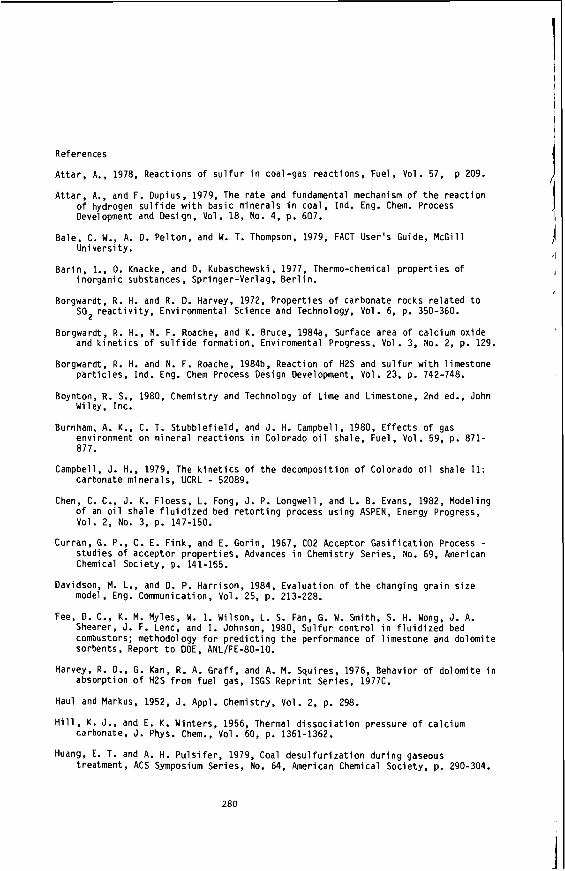
References
A t t a r , A., 1978, Reactions o f s u l f u r i n coal-gas react ions, Fuel, Vol. 57, p 209.
A t t a r , A., and F. Dupius, 1979, The r a t e and fundamental mechanism o f t h e reac t i on of hydrogen s u l f i d e w i t h bas ic minera ls i n coal, Ind. Eng. Chem. Process Development and Design, Vol. 18, No. 4, p. 607.
Bale, C. W., A. 0. Pel ton, and W. T. Thompson, 1979, FACT User's Guide, McGil l Un ive rs i t y .
Bar in , I., 0. Knacke, and 0. Kubaschewski, 1977, Thermo-chemical p roper t i es o f i no rgan ic substances, Springer-Verlag, B e r l i n .
Borgwardt, R. H. and R. 0. Harvey, 1972, P roper t i es o f carbonate rocks r e l a t e d t o SO, r e a c t i v i t y , Environmental Science and Technology, Vol. 6, p. 350-360.
Borgwardt, R. H., N. F. Roache, and K. Bruce, 1984a, Surface area o f ca lc ium oxide and k i n e t i c s o f s u l f i d e formation, Enviromental Progress, Vol. 3, No. 2, p. 129.
Borgwardt, R. H. and N. F. Roache, 1984b, Reaction o f H2S and s u l f u r w i t h l imestone p a r t i c l e s , Ind. Eng. Chem Process Design Development, Vol. 23, p. 742-748.
Boynton, R. S., 1980, Chemistry and Technology o f Lime and Limestone, 2nd ed., John
Burnham, A. K., C. T. S tubb le f i e ld , and J. H. Campbell, 1980, E f f e c t s of gas
Wiley, Inc.
environment on m ine ra l reac t i ons i n Colorado o i l shale, Fuel, Vol. 59, p. 871- 877.
Campbell, J. H., 1979, The k i n e t i c s o f t h e decomposition of Colorado o i l shale 11:
Chen, C. C., J. K. Floess, L. Fong, J. P. Longwell, and L. B. Evans, 1982, Modeling
carbonate minera ls , UCRL - 52089.
of an o i l shale f l u i d i z e d bed r e t o r t i n g process us ing ASPEN, Energy Progress, Vol. 2, No. 3, p. 147-150.
Curran, G. P., C. E. F ink , and E. Gorin, 1967, C02 Acceptor G a s i f i c a t i o n Process - s tud ies o f acceptor p roper t i es , Advances i n Chemistry Series, No. 69, American Chemical Society, p. 141-165.
model, Eng. Communication, Vol. 25, p. 213-228.
Shearer, J. F. Lenc, and I . Johnson, 1980, S u l f u r con t ro l i n f l u i d i z e d bed combustors; methodology f o r p r e d i c t i n g t h e performance o f l imestone and dolomite sorbents. Report t o DOE, ANL/FE-80-10.
Harvey, R. D., G. Kan, R. A. G ra f f , and A. M. Squires, 1976, Behavior o f do lomi te i n absorpt ion o f H2S from f u e l gas, I S G S Repr in t Series, 1977C.
Haul and Markus, 1952, J. Appl. Chemistry, Vol. 2, p. 298.
H i l l , K. J., and E. K. Winters, 1956, Thermal d i s s o c i a t i o n pressure o f ca lc ium
Huang, E. T. and A. H. P u l s i f e r , 1979, Coal d e s u l f u r i z a t i o n d u r i n g gaseous
Oavidson, M. L., and 0. P. Harr ison, 1984, Eva lua t i on o f t h e changing g r a i n s i z e
Fee, 0. C., K. M. Myles, W. I. Wilson, L. S. Fan, G. W. Smith, S. H. Wong, J. A.
carbonate, J. Phys. Chem., Vol. 60, p. 1361-1362.
treatment, ACS Symposium Series, No. 64, American Chemical Society , p. 290-304.
280
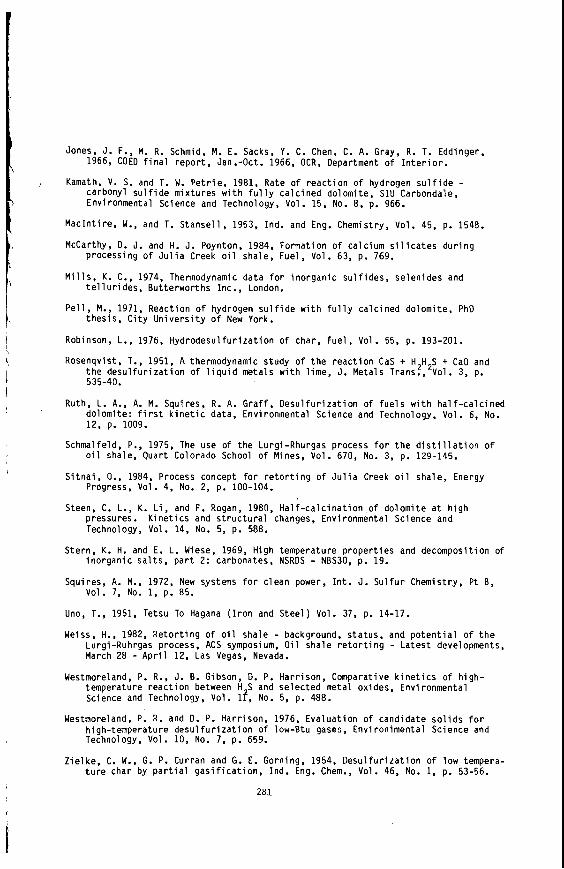
Jones, J. F., M. R. Schmid, M. E. Sacks, Y. C. Chen, C. A. Gray, R. T. Eddinger,
Kamath, V. S. and T. W. Pe t r i e , 1981, Rate o f reac t i on o f hydrogen s u l f i d e -
1966. COED f i n a l repo r t , Jan.-Oct. 1966, OCR, Department o f I n t e r i o r .
carbonyl s u l f i d e mixtures w i t h f u l l y ca l c ined dolomite, SIU Carbondale, Environmental Science and Technology, Vol. 15, No. 8, p. 966.
MacInt i re , W., and T. S tanse l l , 1953, Ind. and Eng. Chemistry, Vol. 45, p. 1548.
McCarthy, 0. J. and H. J. Poynton, 1984, Formation o f ca lc ium s i l i c a t e s du r ing
M i l l s , K. C., 1974, Thermodynamic data f o r i no rgan ic s u l f i d e s , se len ides and
P e l l , M., 1971, Reaction o f hydrogen s u l f i d e w i t h f u l l y ca l c ined dolomite, PhD
Robinson, L., 1976, Hydrodesu l fu r i za t i on o f char, Fuel, Vol. 55, p. 193-201.
Rosenqvist, T., 1951, A thermodynamic study o f t h e reac t i on CaS + H H S + CaO and
processing o f J u l i a Creek o i l shale, Fuel, Vol. 63, p. 769.
t e l l u r i d e s , But terwor ths Inc., London.
thes i s , C i t y U n i v e r s i t y o f New York.
t he desu l fu r i za t i on o f l i q u i d metals w i t h l ime, J. Metals Trans?,’Vol. 3, p. 535-40.
Ruth, L. A., A. M. Squires, R. A. Graf f , Desu l fu r i za t i on o f f u e l s w i t h ha l f - ca l c ined dolomite: f i r s t k i n e t i c data, Environmental Science and Technology, Vol. 6, No. 12, p. 1009.
Schmalfeld, P., 1975, The use o f t he Lurgi-Rhurgas process f o r t h e d i s t i l l a t i o n o f o i l shale, Quar t Colorado School o f Mines, Vol. 670, No. 3, p. 129-145.
S i t n a i , O., 1984, Process concept f o r r e t o r t i n g o f J u l i a Creek o i l shale, Energy Progress, Vol. 4, No. 2, p. 100-104.
Steen, C. L., K. L i , and F. Rogan, 1980, H a l f - c a l c i n a t i o n o f do lomi te a t h igh pressures. K i n e t i c s and s t r u c t u r a l changes, Environmental Science and Technology, Vol. 14, No. 5, p. 588.
i no rgan ic s a l t s , p a r t 2: carbonates, NSROS - NBS30, p. 19.
Vol. 7, No. 1, p. 85.
Stern, K. H. and E. L. Wiese, 1969, High temperature p roper t i es and decomposition of
Squires, A. M., 1972, New systems f o r c lean power, I n t . J. S u l f u r Chemistry, P t B,
Uno, T., 1951, Tetsu To Hagana ( I r o n and S tee l ) Vol. 37, p. 14-17.
Weiss, H., 1982, Re to r t i ng o f o i l shale - background, s ta tus, and p o t e n t i a l o f t h e Lurgi-Ruhrgas process, ACS symposium, O i l shale r e t o r t i n g - Latest developments, March 28 - A p r i l 12, Las Vegas, Nevada.
Westmoreland, P. R., J. B. Gibson, 0. P. Harrison, Comparative k i n e t i c s o f h igh- temperature reac t i on between H S and se lected metal oxides, Environmental Science and Technology, Vol. 11, No. 5, p. 488.
Westmoreland, P. R. and D. P. Harrison, 1976, Evaluat ion o f candidate s o l i d s f o r high-temperature d e s u l f u r i z a t i o n o f low-Btu gases, Envi ronimental Science and Technology, Vol. 10, No. 7, p. 659.
Z ie l ke , C. W., G. P. Curran and G. E. Gorning, 1954, D e s u l f u r i z a t i o n o f low tempera- t u r e char by p a r t i a l g a s i f i c a t i o n , Ind. Eng. Chem., Vol. 46, No. 1, p. 53-56.
281
I
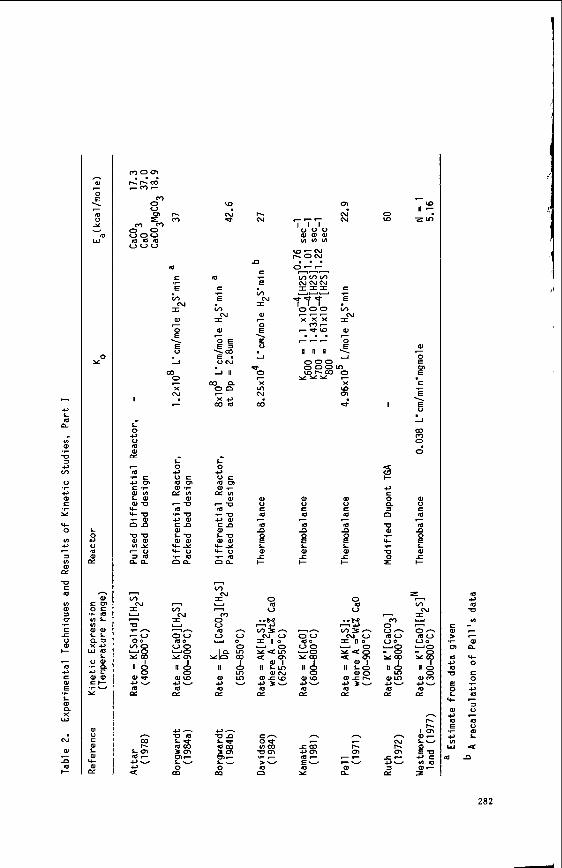
- C,
n. m
VI al v C, v, V
C,
c Y
‘c
VI C,
5
al E
W
.r
.r
.r
- m v)
3 u
E r u
I-
.r
? m C,
W
L .r
n W
N
a, - n m I-
h W - 8 \
a Y
7
v a W
0 Y
L 0 C, V
m Y
h
al E01 o c .C m B L m
ala L L
X C ,
V a l
+ r E o w e+
bi
n a A J ~
.- n
.r u
0, u 0
al t
Y
m 0 V 0 1 -
m =m 808 m m m v v v
I
i
m C,
W cc - m ’r c @ c n c .r a m L a W W ‘c
3 -0-0 m a l v)Y
- u a m nn.
- fn
I
V
- v 0 0 fn0
N
Y - .r n
Y 8 II A 0 a)* C,u
PI
h
R LOI m - C,u C,
a
m c E v,
I 0)
0 1
O
J
.r
N - Q)
51 “1 ?
L 0 C, u c m .r
p s v )
- w ‘r v C , a l
al L - 0 m a l Y-Y Y-u
m c n
c n
.+- m on
- fn N I
-n
U O -0
Y
%Y
nA Y m
0 m W C,w
PI
@-
rrtW a m m- L W 0
2;
m
W
%
m c E fn
I m O E € 3
U N
.r
N
7
‘;? L n
w a 00
X C , F-
w m
L
C, O E m o l 0, .r p s m
- v
.r v C , a J
L V o m + Y
’ c v .- m nn.
m
e n
- fn
I hl Y
tr N
n c E .r
j, N I a, - P 5 i
2
ai
\
*
m N
0
E m
m n ?
P 0 I
I-
o, V
m N’ N
c E .r
j, N I a 0
\
-
On
B Y vo -0 Y W
II
U W C,u
ps
10 n - =In
c
0
0 - SI
E
E \
V
-I
v
R 0
0
al E m m n 7
0) I c
*- v, I N
L1
c > 01
C,
V
E
+ m C,
- m
e
2 .,- C,
w
282
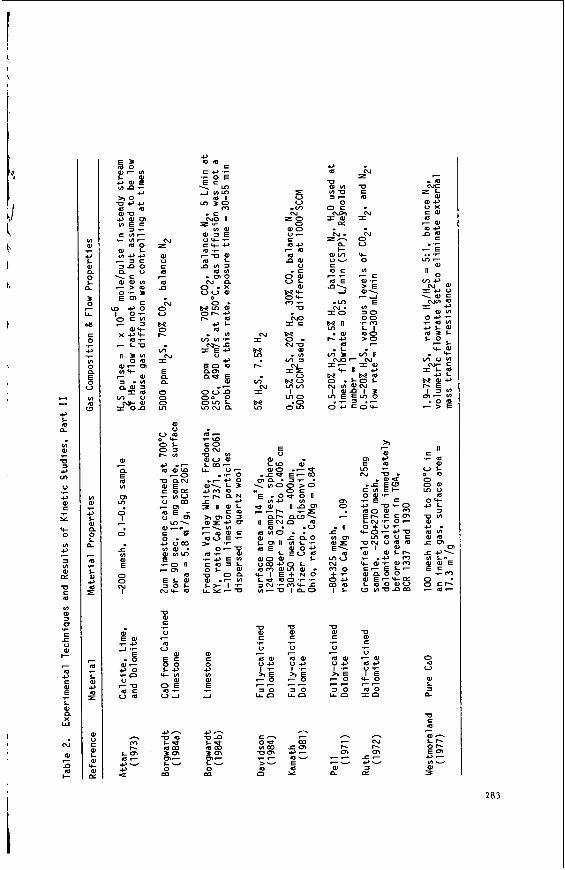
n n i c,
m n.
a , n 1 I-
7
5 V rm
N Z O 0 a 0 u- E
c m m c ,
N
a . m a N I= u
N Lorn
!no .O
M r V )
v; w u
M o m
P-
I I
a 0 c,
a
2 - c,- L e
cn- L-
w n mw 3 m
m
m 9
i" 0 8
c
E\
!nu N
+ .- oc, w 4 I L
m o
V
E
u m a 0 4 I 'C
.r
7
25 - 7 a 0 un
h
c I- m
7 - F V
a n.
-0
c u - a u 'r I E Lco
.r
m c ,
7-
m o sn
n N I- o?
.e.- c,-
Di a
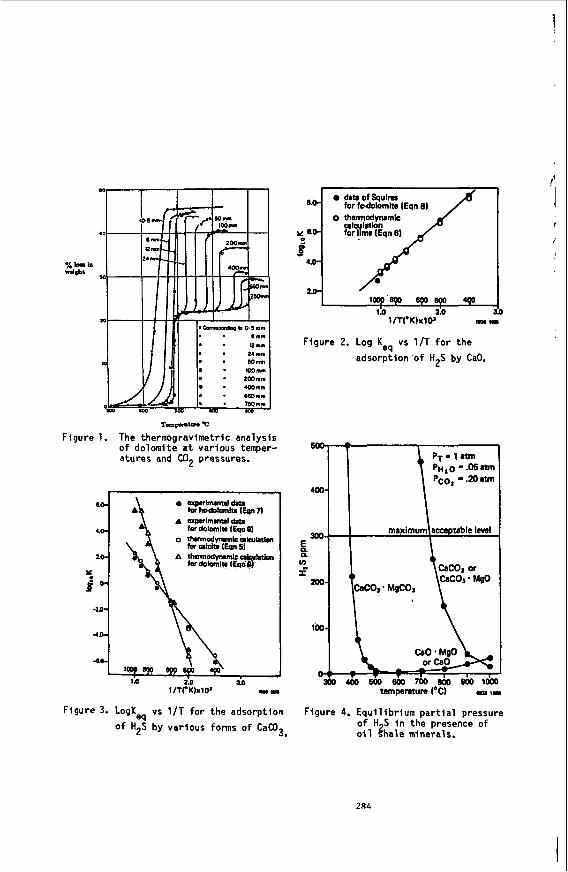
1
Tmpm(w'(:
Figure 1. The thermogravimetric analysis o f dolomite a t various temper- atures and C02 pressures.
Figure 3. LogK vs 1/T for the adsorption of H2S by var ious forms o f CaCO?
eq
Figure 2. Log K vs l / T for t h e eq
adsorption ' o f H2S by CaO.
400-
E P
3
100-
Figure 4. Equi l ibr ium p a r t i a l pressure o f H,S i n the Dresence o f
- ". o i l Shale minerals.
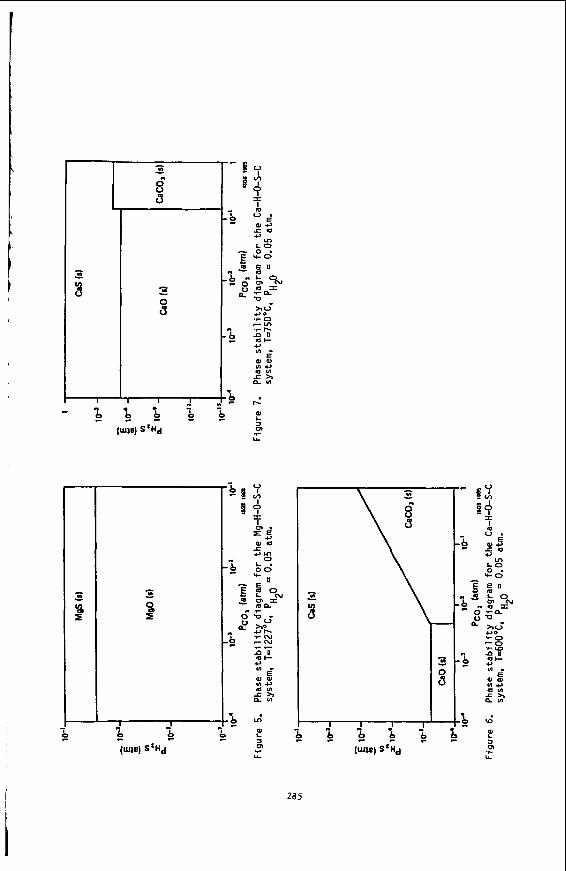
285
ENHANCED OIL RECOVERY FROM PYROLYSIS OF VARIOUS AUSTRALIAN SHALES
V e t k a v P a r a m e s w a r a n , Mark P o l a s k y a n d Sunggyu Lee
D e p a r t m e n t o f C h e m i c a l E n g i n e e r i n g The U n i v e r s i t y o f Akron.
Akron. O h i o 44325.
ABSTRACT
The o i l y i e l d s f r o m r e t o r t i n g S t u a r t , R u n d l e a n d Condor s h a l e s h a v e b e e n o p t i m i z e d w i t h r e s p e c t t o t h e i r p r o c e s s o p e r a t i n g c o n d i t i o n s u s i n g a s t a t i s t i c a l e x p e r i m e n t a l d e s i g n t e c h n i q u e . A t h r e e f a c t o r , t w o l e v e l f a c t o r i a l d e s i g n o f e x p e r i m e n t s was a d o p t e d t o d e t e r m i n e t h e m a i n a n d i n t e r a c t i o n e f f e c t s o f v a r i a b l e s on t h e y i e l d of o i l from these s h a l e s . T h e t h r e e v a r i a b l e s a r e t h e p a r t i c l e s i z e , t h e t y p e o f s w e e p gas a n d t h e sweep g a s f l o w r a t e .
I t was f o u n d t h a t r e t o r t i n g w i t h c a r b o n d i o x i d e as t h e s w e e p g a s e n h a n c e s t h e o i l y i e l d f r o m S t u a r t s h a l e b y u p t o 24 p e r c e n t . The s t r o n g e s t e f f e c t was o b s e r v e d from t h e s w e e p g a s f l o w r a t e a n d t h e o p t i m a l c o n d i t i o n f o r t h i s v a r i a b l e was f o u n d t h r o u g h o u t - l a y e r e x p e r i m e n t s . F o r e a c h of t h e s i g n i f i c a n t e f f e c t s , t r a n s p o r t p r o c e s s e s s u c h a s t h e c o m b i n e d h e a t a n d mass t r a n s f e r were e x p l a i n e d a n d d e s i g n c r i t e r i a f o r a r e t o r t i n g s y s t e m were f o u n d f o r s c a l e u p p u r p o s e s .
INTRODUCTION
E x t e n s i v e d e p o s i t s o f o i l s h a l e , b e a r i n g e n o r m o u s a m o u n t s o f e q u i v a l e n t s , y n t h e t i c f u e l e x i s t i n t h e U.S.A., A u s t r a l i a , C a n a d a , C h i n a a n d v a r i o u s o t h e r p a r t s o f t h e w o r l d . However , t h e s e d e p o s i t s a r e f a r f r o m u n i f o r m a n d t h e r e a r e w i d e v a r i a t i o n s in t h e p h y s i c a l a n d c h e m i c a l s t r u c t u r e of t h e r o c k s e v e n w i t h i n t h e same g e n e r a l l o c a t i o n . As a r e s u l t , e n g i n e e r i n g a n d f u n d a m e n t a l d a t a a r e r e q u i r e d e v e n f o r p r e l i m i n a r y d e s i g n a n d e c o n o m i c f e a s i b i l i t y a n a l y s i s . The n e e d f o r d a t a i s e v e n more v i t a l d u r i n g t h e d e t a i l e d i n d u s t r i a l p r o c e s s d e v e l o p m e n t . I n o r d e r t o m a x i m i z e t h e y i e l d , t h e k i n e t i c s a s w e l l a s t h e p h y s i c a l a n d c h e m i c a l p r o p e r t i e s of t h e s h a l e a n d s h a l e o i l m u s t b e known. An e x t e n s i v e r e v i e w of o i l s h a l e t e c h n o l o g y c o v e r i n g t h e h i s t o r i c a l d e v e l o p m e n t a n d t h e k i n e t i c s of o i l s h a l e r e t o r t i n g a s w e l l a s t h e p r o p e r t i e s o f o i l s h a l e h a s b e e n p r e s e n t e d by B r a n c h (1). T h i s p a p e r a ims a t f i n d i n g t h e op t imum o p e r a t i n g c o n d i t i o n s f o r t h e r e t o r t i n g o f A u s t r a l i a n T e r t i a r y s h a l e s . T h e s h a l e s a m p l e s s t u d i e d were t a k e n f r o m t h e K e r o s e n e C r e e k member o f t h e S t u a r t d e p o s i t , t h e Ramsey c r o s s i n g member o f t h e R u n d l e d e p o s i t , a n d t h e Brown o i l s h a l e u n i t o f t h e C o n d o r d e p o s i t , a l l o f w h i c h a r e l o c a t e d a l o n g t h e c o a s t l i n e o f Q u e e n s l a n d , A u s t r a l i a .
286
APPROACHES
O p t i m i z a t i o n s t u d i e s g e n e r a l l y i n v o l v e e i t h e r t h e s o l u t i o n o f d i f f e r e n t i a l e q u a t i o n s o r t h e d i s c r e t e t e c h n i q u e s o f l i n e a r a l g e b r a . I n e i t h e r case , i t i s n e c e s s a r y t o h a v e a m a t h e m a t i c a l d e s c r i p t i o n o f t h e s y s t e m . The p h y s i c a l a n d c h e m i c a l c o m p l e x i t y o f o i l s h a l e r e n d e r s s u c h a r i g o r o u s m a t h e m a t i c a l t r e a t m e n t e x t r e m e l y d i f f i c u l t .
F o r e n g i n e e r i n g p u r p o s e s h o w e v e r , a n e x p e r i m e n t a l e x p l o r a t i o n o f t h e r a n g e o f i n t e r e s t i n g p r o c e s s c o n d i t i o n s c a n b e c o u p l e d w i t h t h e m e t h o d s o f s t a t i s t i c a l e x p e r i m e n t a l d e s i g n t o a r r i v e a t op t imum o p e r a t i n g p a r a m e t e r s w i t h t h e minimum o f e x p e r i m e n t a l c o s t a n d e f f o r t . T h e r e f o r e a t h r e e f a c t o r , t w o l e v e l d e s i g n o f e x p e r i m e n t s f o r e a c h t y p e o f o i l s h a l e was a d o p t e d f o r t h i s s t u d y .
IDENTIFYING THE CRITICAL VARIABLES
I n o r d e r t o e n s u r e t h e r e p r o d u c i b i l i t y o f e x p e r i m e n t a l r e s u l t s , s t a n d a r d r e t o r t i n g p r o c e d u r e s m u s t b e a d o p t e d w i t h o u t s t i f l i n g t h e d e g r e e o f f r e e d o m n e c e s s a r y t o o p t i m i z e t h e o p e r a t i n g c o n d i t i o n s . Twen ty g r a m s o f o i l s h a l e were c h a r g e d i n t o t h e r e t o r t w h i c h was t h e n h e a t e d a t t h e r a t e o f 10 C/min f r o m 25 C t o 700 C a t a t m o s p h e r i c p r e s s u r e . T h e d e t a i l s o f t h e r e t o r t i n g a p p a r a t u s h a v e b e e n p u b l i s h e d e l s e w h e r e ( 2 ) . T h e a p p a r a t u s c o n s i s t s e s s e n t i a l l y o f a 1 5 . 7 5 i n c h l o n g x 1 i n c h d i a m e t e r s t a i n l e s s s tee l t u b e w h i c h i s p l a c e d i n s i d e a n e l e c t r i c f u r n a c e . The s h a l e s a m p l e i s l o a d e d i n t o t h e r e t o r t t h r o u g h a b a l l v a l v e a t t h e t o p o f t h e t u b e . The sweep g a s ( w h i c h i s p r e h e a t e d i n a g a s p r e h e a t e r f o l l o w i n g t h e r e a c t o r p r e h e a t i n g s c h e d u l e ) f l o w s down t h r o u g h t h e s a m o l e bed i n t o a n o i l c o l l e c t i o n t u b e w h i c h i s k i p t c o o l i h a water b a t h .
T h e v a r i a b l e s s t u d i e d were t h e p a r t i c l e s i z e (-8 and -20 t40 mesh ( T y l e r ) ) , s w e e p g a s t y p e ( c a r b o n d i o x i d e n i t r o g e n ) and s w e e p g a s f l o w r a t e ( 2 ml/sec a n d 5 ml/sec The l e v e l s o f t h e s e v a r i a b l e s h a v e b e e n c h o s e n b a s e d on p r e l i m i n a r y e x p e r i m e n t s a s w e l l a s p r i o r e x p e r i e n c e ( 2 ) .
1 0 mesh a n d STP) ) .
The mechan i sm by w h i c h t h e o i l i s r e l e a s e d f r o m t h e p o r e s o f t h e s h a l e i s n o t v e r y c l e a r . The i n f l u e n c e o f t h e p a r t i c l e s i z e on t h e r e t o r t e r y i e l d seems t o d e p e n d on t h e t y p e o f o i l s h a l e b e i n g r e t o r t e d . A s t h e o i l s h a l e s a r e f a i r l y n o n - p o r o u s ( v e r y o f t e n b e l o w 5 X p o r o s i t y ) , i t i s t o b e e x p e c t e d t h a t c r u s h i n g t h e o i l s h a l e wou ld i m p r o v e t h e p r o c e s s o f o i l e v o l u t i o n . However , t h e r e seems t o b e a minimum p a r t i c l e s i z e b e l o w w h i c h t h e i n f l u e n c e o n t h e y i e l d t e n d s t o b e n e g a t i v e . T h i s i s d u e t o t h e l o s s of k e r o g e n e n t r a p p e d i n m a c r o p o r e s w h i l e c r u s h i n g . T h e r e f o r e , two d i f f e r e n t s i z e s were t e s t e d , v i z , -8 +10 mesh a n d -20 +40 mesh ( T y l e r ) .
i
It h a s b e e n f o u n d by L e e (3), t h a t c a r b o n d i o x i d e s w e e p g a s c o n d i t i o n s e n h a n c e t h e o i l r e c o v e r y f r o m C o l o r a d o o i l s h a l e s . T h e r e f o r e tes ts were c o n d u c t e d w i t h two t y p e s o f s w e e p g a s , i .e . , n i t r o g e n a n d c a r b o n d i o x i d e .
The f l o w r a t e o f s w e e p g a s i s v e r y i m p o r t a n t f r o m a n e n g i n e e r i n g p o i n t o f v i ew. T h i s i n f l u e n c e s t h e h e a t a n d mass t r a n s f e r c o n d i t i o n s w i t h i n t h e r e a c t o r a n d s ca l e u p a n d s c a l e down of c o m m e r c i a l r e a c t o r s would be d i s a s t r o u s i f t h e mass t r a n s f e r c o n d i t i o n s were n o t k e p t u n i f o r m i n t h e s c a l e d m o d e l s . T h e r e f o r e e x p e r i m e n t s were made w i t h two d i f f e r e n t sweep g a s f l o w r a t e s , v i z , 2 m l ( S T P ) / s e c a n d 5 m l ( S T P ) / s e c . T h i s c o r r e s p o n d s t o
h o u r ( s u p e r f i c i a l l i n e a r v e l o c i t i e s o f 0.4 a n d 1.0 c m / s e c ) r e s p e c t i v e l y i n t h e r e t o r t .
1 v a p o r s p a c e v e l o c i t i e s ( c a l c u l a t e d a t STP) o f 720 a n d 1800 p e r /
The i n f l u e n c e s o f t h e s e t h r e e v a r i a b l e s were s t u d i e d o n t h r e e d i f f e r e n t A u s t r a l i a n T e r t i a r y o i l s h a l e s i d e n t i f i e d a s R u n d l e , S t u a r t a n d C o n d o r o i l s h a l e s a n d t h e r e s u l t s were c r i t i c a l l y c o m p a r e d w i t h t h o s e o b t a i n e d w i t h t h e E a s t e r n a n d W e s t e r n U.S. o i l s h a l e s i n terms o f t h e i r y i e l d , e f f e c t s a n d o p t i m a l p r o c e s s c o n d i t i o n s .
RESULTS A N D DISCUSSION
T h e r e s u l t s of t h e v a r i o u s e x p e r i m e n t s c o n d u c t e d o n S t u a r t , R u n d l e a n d C o n d o r o i l s h a l e s a r e p r e s e n t e d i n T a b l e 1. T h e y i e l d s o b t a i n e d were a n a l y z e d u s i n g Yates ' a l g o r i t h m (4) t o d e t e r m i n e t h e e f f e c t s o f t h e v a r i o u s t r e a t m e n t c o m b i n a t i o n s on t h e y i e l d . T h e s e e f f e c t s a r e a l s o summar ized i n T a b l e 1. F o r t h e p u r p o s e o f c o m p a r i s o n , s i m i l a r d a t a a r e a l s o i n c l u d e d i n T a b l e 1 f o r t h e C o l o r a d o ( 5 ) a n d O h i o 82 ( 6 ) o i l s h a l e s .
F o r t h e p u r p o s e o f d e t e r m i n i n g t h e s i g n i f i c a n t e f f e c t s , t h r e e r e p l i c a t i o n s were c a r r i e d o u t a n d t h e e f f e c t s t h a t were l a r g e r t h a n twice t h e s t a n d a r d d e v i a t i o n i n t h e s e r u n s were i d e n t i f i e d a s t he s i g n i f i c a n t e f f e c t s . A c c o r d i n g l y , t h e minimum e f f e c t s f o r t h e d e t e r m i n a t i o n o f s i g n i f i c a n c e were 4.80, 6.38, 2.34, 4.10, a n d 1.90 f o r t h e S t u a r t , R u n d l e , C o n d o r , C o l o r a d o a n d O h i o # 2 s h a l e s r e s p e c t i v e l y .
S t u a r t S h a l e
O f t h e t h r e e A u s t r a l i a n s h a l e s t e s t e d , t h e S t u a r t s h a l e g a v e t h e l a r g e s t o i l y i e l d ( F i s c h e r A s s a y o f 101 m l / k g ) c o m p a r a b l e t o t h e y i e l d s o b t a i n e d f r o m most C o l o r a d o s h a l e s .
The s w e e p g a s f l o w r a t e h a d t h e l a r g e s t i n f l u e n c e on t h e o i l y i e l d . T h i s p r e d o m i n a n t e f f e c t was o b s e r v e d w i t h a l l t h e o i l s h a l e s S O f a r t e s t e d . The i n f l u e n c e i n a l l cases was n e g a t i v e i n t h e r a n g e o f t h e v a r i a b l e s t u d i e d i n d i c a t i n g t h e r e b y t h a t a n i n c r e a s e i n t h e f l o w r a t e f r o m 2 m l ( S T P ) / s e c t o 5 m l ( S T P ) / s e c r e d u c e s t h e y i e l d . T h i s s t r o n g l y s u g g e s t s t h a t mass t r a n s f e r
288
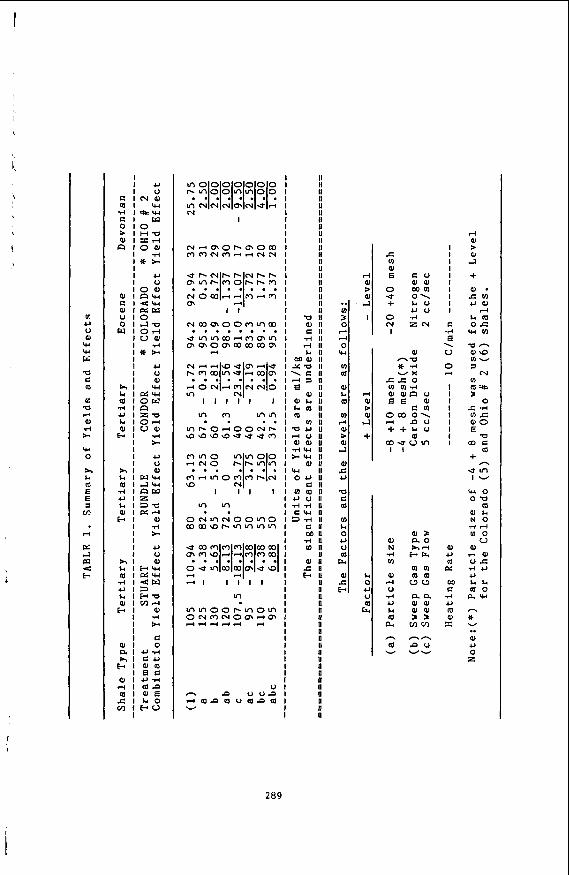
i
I
I I I I
m U U 0) w w w a E 0
m 0 d aJ .rl * w 0
h L. m 6 e s rn
d
PI c7 a 4 E
I U I u 1 0 9 )
E l < U al I W W u I O 0 14-0 w l 0 d
I V a l I .rl I * *
I C , t u I a J
h I w L. l r n r u
u I z a L. l 0 r l 01 I V a l
CI I .rl I * I l e , I U
h l aJ & l w w m 11-3w
u I 2 L. 13- P) I M r l b l aJ
I d I *
I U t u
h l al $4 I E W m I E w rl I 4 W u 13 L. I E U aJ l m d b l al
I .rl I *
I C a J I 0 PI1 ur( h l E u b l a m
I B C aJ I u7.1 r( I m a m l aJa C I L . 0 rn I W W
a~ inru
m I O W 7.1 i n
7.1 i n w
I
lnooooooo l - m o o m m o o rnCI(NNO\NUJrl N
. .I ./ .( .( .( .( . I
U - P u u n H m a m u m n m v
.. rn 3 0 rl rl 0 w
m m aJ L. m m rl aJ > aJ 4
W c 0
Q
m m L. 0 0 u
F a
al c E-r
m
rl aJ > 0) 1-3
I
c m aJ 6
0 U + 0 N I
I I I I I I I I I I
E .rl E \ 0
0
I I I I I I I I I
d
0) U m e: 00
.rl U m PI 3:
a
rl m > aJ el + 0 - CUI uaJ d
O S w m b m
v n ala m u s
N u) m * 3
0 c %-I u)c 0 0
W COG
m
a
+-
e m I W
w o 01)
m a J L . N O d d 100
U aJ
d a J u c TI U U b b
n.w m o
h * v
aJ u 0 z
289
I
I I ,i i
p l a y s a n i m p o r t a n t r o l e i n s h a l e o i l e x t r a c t i o n . B a s e d on s i m i l a r s i t u a t i o n s i n g a s - s o l i d r e a c t i o n s y s t e m s , t h i s i m p l i e s t h a t beyond a c e r t a i n l i m i t i n t h e s w e e p g a s f l o w r a t e , a n i n c r e a s e i n t h e f l o w r a t e a d v e r s e l y a f f e c t s t h e t o t a l y i e l d . T h e r e f o r e , e i t h e r a c o r n e r t e s t o r o u t l a y e r e x p e r i m e n t s h a v e t o b e c o n d u c t e d t o d e t e r m i n e t h e o p t i m a l f l ow r a t e . In t h e c o r n e r t e s t , t h e s w e e p g a s f l o w r a t e was v a r i e d w h i l e k e e p i n g t h e o t h e r v a r i a b l e s a t t h e i r o p t i m a l v a l u e s . The r e s u l t s show t h a t t h e b e s t y i e l d i s o b t a i n e d w i t h a s w e e p g a s f l o w r a t e o f 2 m l ( S T P ) / s e c .
(
1 On t h e o t h e r h a n d , t h e t y p e o f s w e e p g a s u s e d a l s o h a s a
s i g n i f i c a n t e f f e c t on t h e y i e l d . A s t h e e f f e c t i s p o s i t i v e , i t c a n b e c o n c l u d e d t h a t c a r b o n d i o x i d e r e t o r t i n g e n h a n c e s t h e , y i e l d . T h i s was a l s o t h e case w i t h t h e C o l o r a d o a n d some E a s t e r n U.S. D e v o n i a n s h a l e s (2.5). T h e r o l e o f c a r b o n d i o x i d e i n e n h a n c i n g t h e y i e l d f r o m s u c h s h a l e s w h i l e h a v i n g n e g a t i v e e f f e c t s on t h e y i e l d f r o m o t h e r s h a l e s i s n o t c o m p l e t e l y u n d e r s t o o d . However , t h e t r e n d i n d i c a t e s t h a t c a r b o n d i o x i d e e n h a n c e s t h e r e t o r t i n g y i e l d f r o m s h a l e s w i t h a l a r g e k e r o g e n c o n t e n t . This i n f l u e n c e i s much l e s s o r e v e n n e g a t i v e when t h e k e r o g e n c o n t e n t i s l o w ( F i s c h e r A s s a y b e l o w 30) o r medium ( F i s c h e r A s s a y o f t h e o r d e r of 60 t o 70). I t h a s b e e n known among v a r i o u s i n v e s t i g a t o r s t h a t k e r o g e n swel l s b e t t e r i n a c a r b o n d i o x i d e medium t h a n i n a n i t r o g e n medium. T h i s s h o u l d n o r m a l l y r e s u l t i n a n i m p r o v e d y i e l d ; h o w e v e r , i t a l s o e n h a n c e s t h e p r o b a b i l i t y o f c a k i n g o r a g g l o m e r a t i o n i n s i d e a n d o u t s i d e t h e s h a l e p a r t i c l e s . T h e r e f o r e h i g h l y c a k i n g s h a l e s , s u c h a s t h e N o r t h C a r o l i n a l a c u s t r i n e s h a l e d o n o t e x h i b i t a n i n c r e a s e i n o i l y i e l d a n d t h i s c a k i n g phenomenon i s a l s o o b s e r v e d .
The i n f l u e n c e o f t h e p a r t i c l e s i z e on t h e o i l y i e l d was i n s i g n i f i c a n t . However , t h e i n t e r a c t i o n e f f e c t o f t h e g a s f l o w r a t e a n d t h e p a r t i c l e s i z e was n e g a t i v e a n d s i g n i f i c a n t . T h i s a l s o shows t h a t mass t r a n s f e r p l a y s a n i m p o r t a n t r o l e i n t h e p r o c e s s . Even t h o u g h i m p r o v e d mass t r a n s f e r c o n d i t i o n s a r o u n d t h e s h a l e p a r t i c l e s h o u l d d i r e c t l y r e s u l t i n a s m o o t h e r t r a n s p o r t of o i l a n d v a p o r p r o d u c t s o u t o f t h e s a m p l e b e d , c o m p l e x , s e m i - m a c r o s c o p i c phenomena s u c h a s t h e b l o c k a g e o f p o r e m o u t h s , g e l o r l i q u i d e n t r a p m e n t w i t h i n t h e p o r e s , f o r m a t i o n o f new p o r e s , a g g l o m e r a t i o n o f p a r t i c l e s , e t c . , are n o t e a s i l y a c c o u n t e d f o r . T h e r e f o r e , i t c a n b e s a i d t h a t t h e t o t a l y i e l d of o i l f r o m o i l s h a l e i s n o t o n l y d i r e c t l y r e l a t e d t o t h e h e a t a n d mass t r a n s f e r c o n d i t i o n s , b u t a l s o t o t h e m o r p h o l o g i c a l c h a n g e s a n d t h e s w e l l i n g o f k e r o g e n .
p a r t i c l e s and l o w w e e p gas f l o w r a t e s c o u p l e d w i t h t h e u s e o f c a r b o n d i o x i d e . T h e s i g n i f i c a n c e o f c a r b o n d i o x i d e is a l s o i n d i c a t e d by t h e l a r g e p o s i t i v e a b c i n t e r a c t i o n e f f e c t .
c o n d i t i o n s f o r r e t o r t i n g S t u a r t s h a l e are:
The l a r g e s t y i e l d was i n d e e d o b t a i n e d w i t h small s i z e
I t c a n t h e r e f o r e b e c o n c l u d e d t h a t t h e o p t i m a l o p e r a t i n g
1. Use c a r b q n d i o x i d e a s t h e s w e e p g a s . 2 - O p e r a t e a t l o w s w e e p g a s f l o w r a t e s ,
3 . Use sma l l e r p a r t i c l e s , i .e . , -20 +40 mesh. i .e . , 2 m l ( S T P ) / s e c .
290
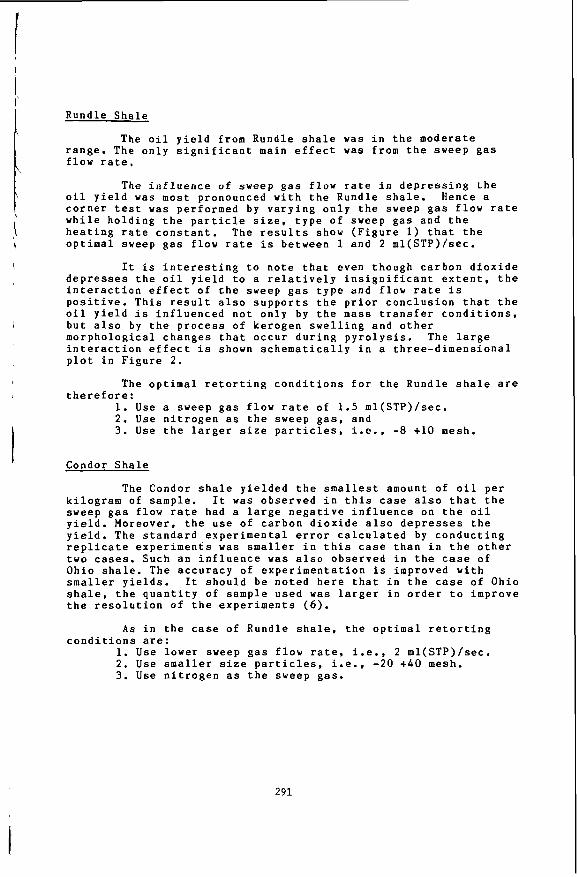
R u n d l e S h a l e
The o i l y i e l d f r o m R u n d l e s h a l e was i n t h e m o d e r a t e r a n g e . The o n l y s i g n i f i c a n t m a i n e f f e c t was f r o m t h e s w e e p g a s f l o w r a t e ,
The i n f l u e n c e o f s w e e p g a s f l o w r a t e i n d e p r e s s i n g t h e o i l y i e l d was m o s t p r o n o u n c e d w i t h t h e R u n d l e s h a l e . Hence a c o r n e r t e s t was p e r f o r m e d by v a r y i n g o n l y t h e s w e e p g a s f l o w r a t e w h i l e h o l d i n g t h e p a r t i c l e s i z e , t y p e o f s w e e p g a s a n d t h e h e a t i n g r a t e c o n s t a n t . The r e s u l t s show ( F i g u r e 1) t h a t t h e o p t i m a l sweep g a s f l o w r a t e i s b e t w e e n 1 a n d 2 m l ( S T P ) / s e c .
It i s i n t e r e s t i n g t o n o t e t h a t e v e n t h o u g h c a r b o n d i o x i d e d e p r e s s e s t h e o i l y i e l d t o a r e l a t i v e l y i n s i g n i f i c a n t e x t e n t , t h e i n t e r a c t i o n e f f e c t o f t h e s w e e p g a s t y p e a n d f l o w r a t e i s p o s i t i v e . T h i s r e s u l t a l s o s u p p o r t s t h e p r i o r c o n c l u s i o n t h a t t h e o i l y i e l d i s i n f l u e n c e d n o t o n l y by t h e mass t r a n s f e r c o n d i t i o n s , b u t a l s o b y t h e p r o c e s s o f k e r o g e n s w e l l i n g a n d o t h e r m o r p h o l o g i c a l c h a n g e s t h a t o c c u r d u r i n g p y r o l y s i s , The l a r g e i n t e r a c t i o n e f f e c t is shown s c h e m a t i c a l l y i n a t h r e e - d i m e n s i o n a l p l o t i n F i g u r e 2 .
The o p t i m a l r e t o r t i n g c o n d i t i o n s f o r t h e R u n d l e s h a l e a r e t h e r e f o r e :
1. Use a s w e e p g a s f l o w r a t e o f 1.5 m l ( S T P ) / s e c . 2. Use n i t r o g e n a s t h e s w e e p g a s , a n d 3. Use t h e l a r g e r s i z e p a r t i c l e s , i .e . , -8 +10 mesh.
Condor S h a l e
The Condor s h a l e y i e l d e d t h e s m a l l e s t amoun t o f o i l p e r k i l o g r a m o f s a m p l e . I t was o b s e r v e d i n t h i s case a l s o t h a t t h e s w e e p g a s f l o w r a t e h a d a l a r g e n e g a t i v e i n f l u e n c e on t h e o i l y i e l d . M o r e o v e r , t h e use o f c a r b o n d i o x i d e a l s o d e p r e s s e s t h e y i e l d . The s t a n d a r d e x p e r i m e n t a l e r r o r c a l c u l a t e d by c o n d u c t i n g r e p l i c a t e e x p e r i m e n t s was smaller i n t h i s case t h a n i n t h e o t h e r two cases. S u c h a n i n f l u e n c e was a l s o o b s e r v e d i n t h e case o f O h i o s h a l e . T h e a c c u r a c y o f e x p e r i m e n t a t i o n i s i m p r o v e d w i t h sma l l e r y i e l d s . It s h o u l d b e n o t e d h e r e t h a t i n t h e c a s e o f O h i o s h a l e , t h e q u a n t i t y o f s a m p l e u s e d was l a r g e r i n order to i m p r o v e t h e r e s o l u t i o n o f t h e e x p e r i m e n t s (6).
As i n t h e ca se o f R u n d l e s h a l e , t h e o p t i m a l r e t o r t i n g
1. Use l o w e r sweep g a s f l o w r a t e , i . e . , 2 m l ( S T P ) / s e c . 2 . Use smaller s i z e p a r t i c l e s , i .e . , -20 +10 mesh . 3. Use n i t r o g e n a s t h e s w e e p gas.
c o n d i t i o n s a re :
291
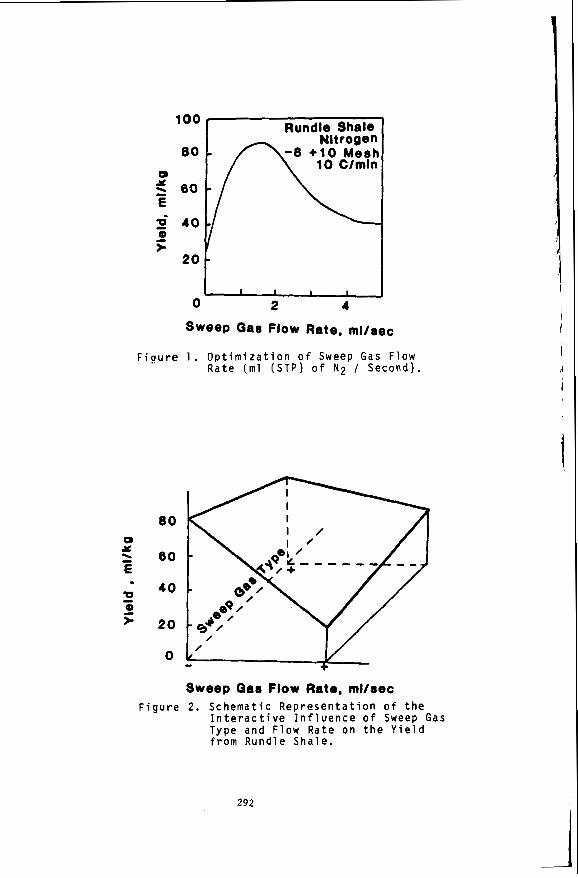
Rundle Shale 1 100 1
2o 0 L 2 4
sweep Gas Flow Rate, ml/sec
F i g u r e 1. O p t i m i z a t i o n o f Sweep Gas F low R a t e (ml (STP) o f N2 / Second) .
I
80
60
40
2 0
0
Sweep Ga8 Flow Rete, ml/rec F i g u r e 2 . S c h e m a t i c R e p r e s e n t a t i o n o f t h e
I n t e r a c t i v e I n f l u e n c e o f Sweep Gas Type and F l o w R a t e on t h e Y i e l d f r o m Rund le Sha le .
292
i
CONCLUSION
A statistical experimental approach was used to determine the optimal retorting conditions for three Australian oil shales. The optimal conditions are summarized below:
Stuart Rundle Condor Particle size: -20 +40 mesh -8 +10 mesh -20 +40 mesh Sweep Gas Type: Carbon dioxide Nitrogen Nitrogen Gas Flow Rate: 2 ml(STP)/sec 1.5 ml(STP)/sec 2 ml(STP)/sec
It is also concluded that the yield from oil shale pyrolysis is influenced by many mechanistic factors such as the heat and mass transfer conditions, the swelling of kerogen in the rock matrix, morphological changes during pyrolysis, agglomerating properties etc. Therefore, the factors investigated in this statistical optimization study represent a set of process variables that are most important for the successful design and operation of retorting equipment. The vapor hourly space velocity of the sweep gas was also calculated for scale up purposes.
REFERENCES
1. Branch M.C., Prog. Energy Combust. Sci., 5, pp 193 (1979). 2. Joshi R. and S . Lee, Liquid Fuels Technology, 1, p p 17
(1983).
3. Lee S., U . S . Patent No: 4,502,942. (1985).
4. Box G.E.P., W.G. Hunter, J.S. Hunter, Statistics for Experimenters. John Wiley and Sons, New York (1978).
5. Joshi R., Kinetic Study of Eastern Oil Shale Pyrolysis, Masters Thesis, The University of Akron (1983).
6 . Lee S . , M. Polasky, R. Joshi, Proceedings of 1983 Eastern Oil Shale Symposium, pp 225-233, University of Kentucky, Institute for Mining and Minerals Research (1984).
293
PYROLYSIS KINETICS OF VARIOUS AUSTRALIAN OIL SHALES IN NITROGEN AND CARBON DIOXIDE ATMOSPHERES
Hark E. Polasky and Sunggyu Lee
Department,of Chemical Engineering The University of Akron
Akron, Ohio 44325
ABSTRACT
The kinetics of oil generation from retorting of various Australian shales have been investigated under both nitrogen and carbon dioxide sweep gas conditions. Experiments were conducted both isothermally and nonisothermally with linear temperature control, in a unique fixed bed retorting system. The kinetics of these shales were directly compared with those of eastern and western U . S . shales, previously studied on the same experimental s ys tem.
The pyrolysis of the investigated Australian shales was found to comply with first-order global kinetics witin the limits of experimental error. The activation energies calculated were: 217.2 kJ/gmole (CO ) and 114.8 kJ/gmole (N ) for Condor shale: 252.2 kJ/gmole (C02) and 190.1 kJ/gmole (Ni) for Rundle shale: 154.0 kJ/gmole (C02) and 127.4 kJ/gmole (N ) for Stuart shale. The average Fisher'assay of these shales afe 62 cc/kg for Rundle, 63 cctkg for Condor, and 100 CC/kg for Stuart shale.
INTRODUCTION
An experimental study has been performed in order to obtain the retorting kinetics of oil generation from various Australian Tertiary oil shales under both nitrogen and carbon dioxide sweep gas conditions. The carbon dioxide retorting has been investigated first by Lee et al. and proven efficent for the western U.S. type oil shale (1). Therefore, the rather nonconventional carbon dioxide retorting a s well as the conventional nitrogen retorting has been applied to Australian shales.
The shale samples studied were taken from the Kerosene Creek member of the Stuart deposit, the Ramsey Crossing member of the Rundle deposit, and the Brown oil shale unit of the Condor deposit, all of which are located along the coastline of Queensland. Australia.
In order to obtain an unbiased comparison and to eliminate unaccountable systemic errors, a unique fixed bed retorting system was used to determine the kinetic parameters of each shale (2). Both the isothermal and nonisothermal retorting techniques were employed for the kinetic measurements. and the results compared favorably with each other. The pyrolysis of the Australian shales under investigation were found to comply with global first-order kinetics within the limits of experimental errors.
294
THEORY
Three experiments for each shale under different isothermal conditions vere carried out and the global power-lav type rate expression vas applied to analyze the data:
= A[exp(-E/RT)](l-x)”
where x is the kerogen conversion based on the Fisher assay oil yield, E is the activation energy, kJ/gmol, A is the Arrhenius frequency factor, l/sec. and n is the reaction order.
The nonisothermsl technique eliminated the uncertainty of the initial heat-up period which had been an inherent problem with a fixed bed type retorter for an isothermal measurement. The kinetic parameters vere obtained for the condition that a linear heating rate be maintained. The choice of a linear heating rate is to facilitate an easier mathematical analysis. For an overall first-order reaction, one obtains the following equation by integration (1):
-ln(l-x) = AE -uU-2 - 2e-~u-31
where C is the heating rate (dT/dt) in C/min and u=E/RT. Rearranging equation (2) yields
= %[(1 - ZRT/E) exp(-E/RT)] T2
( 3 )
Taking natural logarithms
A plot of ln[-ln(l-x)/T2] plot for RT/E << 1 . gives
on
In
both sides of equation (3) gives
( ~ ( 1 A R - 2RT/E)) - E/RT (4)
V S . 1/T, vhich turns out to be a linear the activation energy and the kinetic
frequency factor for-a first-order kinetics from the slope and intercept, respectively. The goodness of fit was a good indication of the validity of the assumed reaction order. A similar analysis can be done for an n-th order kinetics using successive approximation of exponential integrals and the best fitting order can be found by a regression technique (3).
295
EXPERIMENTAL SYSTEM A N D PROCEDURE
A s c h e m a t i c d i a g r a m o f t h e a p p a r a t u s u s e d f o r t h i s s t u d y a n d a d e t a i l e d d e s i g n o f r e t o r t e r i n t e r n a l s are p u b l i s h e d e l s e w h e r e ( 2 ) . Some o f t h e f e a t u r e s o f t h i s r e t o r t i n g s y s t e m a r e c o n s i d e r e d t o b e s p e c i a l o r u n i q u e . T h e s e f e a t u r e s i n c l u d e t h e u s e o f a s t a i n l e s s s t e e l w i r e mesh d i s t i b u t o r p l a t e , so t h a t a w e l l - d e f i n e d f l u i d d y n a m i c c o n d i t i o n i s a c h i e v e d w i t h a m i n i m a l p r e s s u r e d r o p , t h e use o f a q u i c k o p e n i n g a n d c l o s i n g b a l l v a l v e w h i c h p e r m i t s t h e i n s t a n t a n e o u s l o a d i n g o f a s a m p l e i n a d d i t i o n t o p e r m i t t i n g t h e a p p l i c a t i o n o f b o t h i s o t h e r m a l a n d n o n i s o t h e r m a l t e c h n i q u e s t o t h e same r e t o r t e r , i n t r o d u c i n g a c h r o m e l - a l u m e l t h e r m o c o u p l e d i r e c t l y i n t o t h e s h a l e b e d t o o b t a i n g o o d t e m p e r a t u r e c o n t r o l a n d m e a s u r e m e n t s , a n d by c o n n e c t i n g t w o s p e c i a l l y d e s i g n e d g r a d u a t e d U - t u b e s i n s e r i e s w h i c h a l l o w s t h e c o n d e n s a b l e p r o d u c t t o s e t t l e i n t h e b o t t o m o f t h e t u b e s w h i l e t h e n o n c o n d e n s a b l e p r o d u c t t o p a s s t h r o u g h a b r i d g e a c r o s s t h e t u b e arms,
A 20 g r a m s a m p l e o f -35+40 mesh A u s t r a l i a n o i l s h a l e w a s u s e d f o r e a c h e x p e r i m e n t . For a n i s o t h e r m a l m e a s u r e m e n t t h e r e t o r t e r was p r e h e a t e d t o a t e m p e r a t u r e a b o u t 100 C h i g h e r t h a n t h e r e a c t i o n t e m p e r a t u r e t o f a c i l i t a t e a n e a s y a n d f a s t c o n t r o l of t h e t e m p e r a t u r e . For a n o n i s o t h e r m a l m e a s u r e m e n t t h e r e t o r t e r w a s h e a t e d u p a t a l i n e a r h e a t i n g r a t e o f 10 C / m i n , w h i c h w a s f o u n d t o b e i d e a l f o r k i n e t i c m e a s u r e m e n t . T h e s w e e p g a s was s e n t i n t o t h e r e t o r t e r a t t h e n o m i n a l l y same t e m p e r a t u r e a s t h e s h a l e s a m p l s f o r b o t h i s o t h e r m a l a n d n o n i s o t h e r m a l m e a s u r e m e n t . T h e f l o w r a t e u s e d was 2 c c ( S T P ) / s e c a n d if e q u i v a l e n t t o t h e v a p o r h o u r l y s p a c e v e l o c i t i e s o f 720 h o u r - . S i n c e t h e l e n g t h o f t h e c o n n e c t i n g l i n e b e t w e e n t h e r e t o r t e r a n d t h e c o l l e c t i o n t u b e was k e p t s h o r t a n d t h e t e m p e r a t u r e was k e p t h i g h e n o u g h t o k e e p t h e p r o d u c t a s a v a p o r a n d t h e l i q u i d h o l d u p i n t h e r e t o r t was n e g l i g i b l e .
DATA A N D ANALYSIS
N i t r o g e n R e t o r t i n g K i n e t i c p a r a m e t e r s f o r t h e p y r o l y s i s o f A u s t r a l i a n a n d e a s t e r n a n d w e s t e r n U.S. o i l s h a l e s , u n d e r n i t r o g e n s w e e p g a s c o n d i t i o n s a r e s u m m a r i z e d i n T a b l e 1. A s shown i n t h e t a b l e , t h e r e l a t i v e r a t e s o b t a i n e d f r o m i s o t h e r m a l a n d n o n i s o t h e r m a l m e t h o d s a r e n e a r l y t h e same a t 450 C. However . t h e k i n e t i c p a r a m e t e r s o b t a i n e d f r o m n o n i s o t h e r m a l r e t o r t i n g m a y g i v e a m o r e r e a l i s t i c s e t o f e n g i n e e r i n g i n f o r m a t i o n o f t h e o v e r a l l k i n e t i c p a r a m e t e r s f o r t h e d e s i g n o f e f f i c e n t a n d e c o n o m i c a l r e t o r t i n g p r o c e s s e s , s i n c e i t comes c l o s e r t o a c t u a l r e t o r t e r c o n d i t i o n s . It s h o u l d b e n o t e d t h a t t h e l o w e r r e l a t i v e r e a c t i o n r a t e f o r N o r t h C a r o l i n a s h a l e was d u e t o t h e f a c t t h a t t h e r e t o r t i n g of t h i s s h a l e r e q u i r e d a much h i g h e r i n i t i a l r e t o r t i n g t e m p e r a t u r e t h a n t h o s e f o r t h e o t h e r s h a l e s s t u d i e d . T h e r e f o r e , t h e p r a c t i c a l r e t o r t i n g t e m p e r a t u r e s u n d e r n i t r o g e n s w e e p g a s c o n d i t i o n s r a n g e s f r o m 400 t o 500 d e g r e e s C e l c i u s f o r a l l t h r e e t y p e s o f A u s t r a l i a n s h a l e s w h i c h m a t c h e s t h e p r a c t i c a l r e t o r t i n g c o n d i t i o n s o f most o f t h e w e s t e r n U.S. s h a l e s .
296
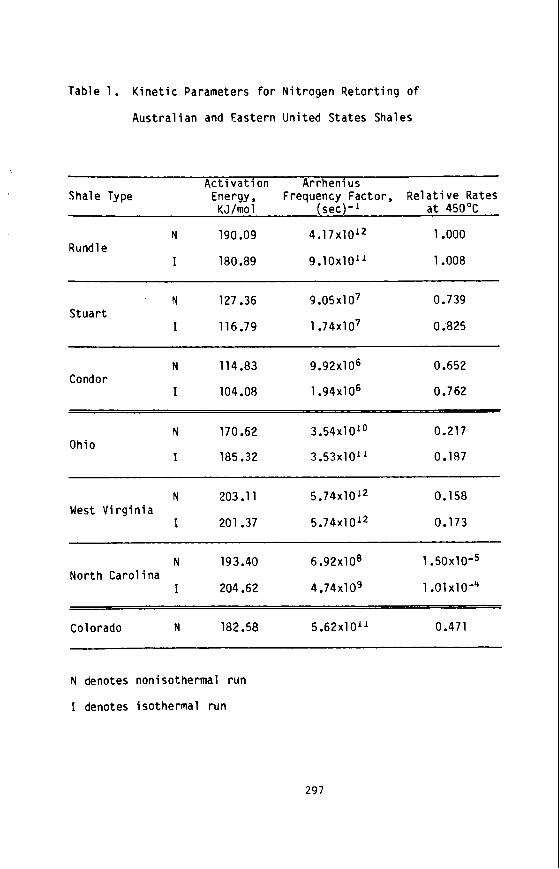
Table 1. K i n e t i c Parameters f o r N i t rogen R e t o r t i n g o f
Aus t ra l i an and Eastern Uni ted States Shales
A c t i v a t i o n Arrheni us Shale Type Energy, Frequency Factor, R e l a t i v e Rates
KJ/mol (sec) - l a t 45OOC
N 190.09 4.1 7x1Ol2 1 .ooo Rundle
I 180.89 9.10 x l 0" 1.008
' N 127.36 9 .05~1 O7 0.739
I 116.79 1 .74x107 0.825 Stuar t
Condor N 114.83 9 .92~1 O6 0.652
I 104.08 1 .94~1 O6 0.762
N 170.62 3.54~1 O L 0 0.217
I 185.32 3 . 5 3 ~ 1 0 ~ ~ 0.187 Ohio
N 203.11 5 .74x10L2 0.158
I 201.37 5.74~1 Oi2 0.173 West V i r g i n i a
N 193.40 6 .92x108 1 . 5 0 ~ 1 0 - ~ Nor th Carol i na
I 204.62 4 . 7 4 ~ 1 0 ~ 1 .oi x i 0-4
Colorado N 182.58 5 . 6 2 ~ 1 0 ~ ~ 0.471
N denotes nonisothermal run
I denotes isothermal run
297
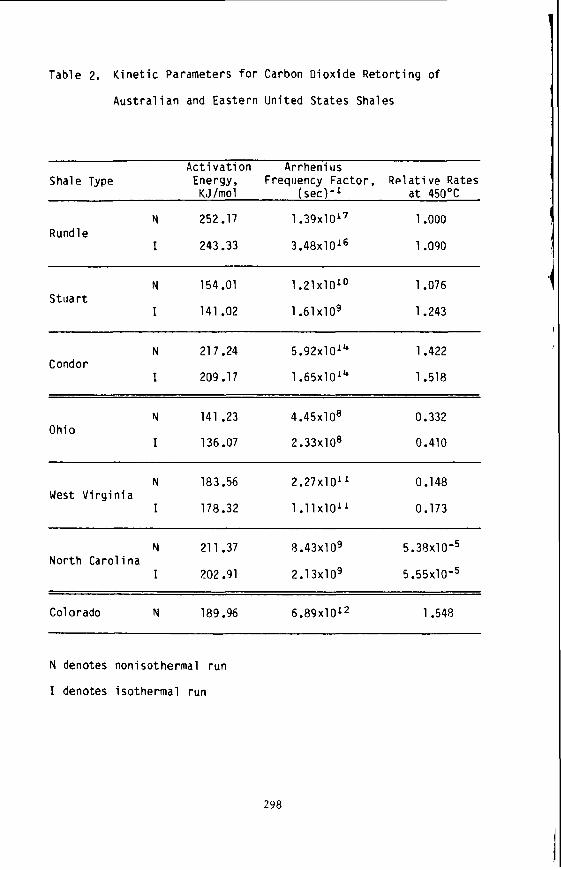
Table 2. K i n e t i c Parameters for Carbon D iox ide R e t o r t i n g o f
A u s t r a l i a n and Eastern Uni ted States Shales
A c t i v a t i o n Arrheni us Shale Type Energy, Frequency Factor, Re1 a t i ve Rates
KJ/mol ( se t ) - ' a t 450°C
N 252.17 1 .39x10i7 1 .ooo Rundle
I 243.33 3 .48x1Ol6 1.090
N 154.01 1.21x10'0 1.076
I 141.02 1 .61x109 1.243 S t u a r t
N 21 7.24 5.92~10'" 1.422
I 209.17 1 .65x1Ol4 1.518 Condor
N 141.23 4.45~1 O8 0.332
I 136.07 2 .33x108 0.410 Ohio
N 183.56 2.27~10' 0.148
I 178.32 1.11x10" 0.173 West V i r g i n i a
N 21 1.37 8 . 4 3 ~ 1 0 ~ 5 . 3 8 ~ 1 0 ' ~
I 202.91 2.1 3x10⁹ 5.55~10" Nor th Carol i na
Colorado N 189.96 6 . 8 9 ~ 1 0 ' ~ 1.548
N denotes nonisothermal run
I denotes iso thermal run
298
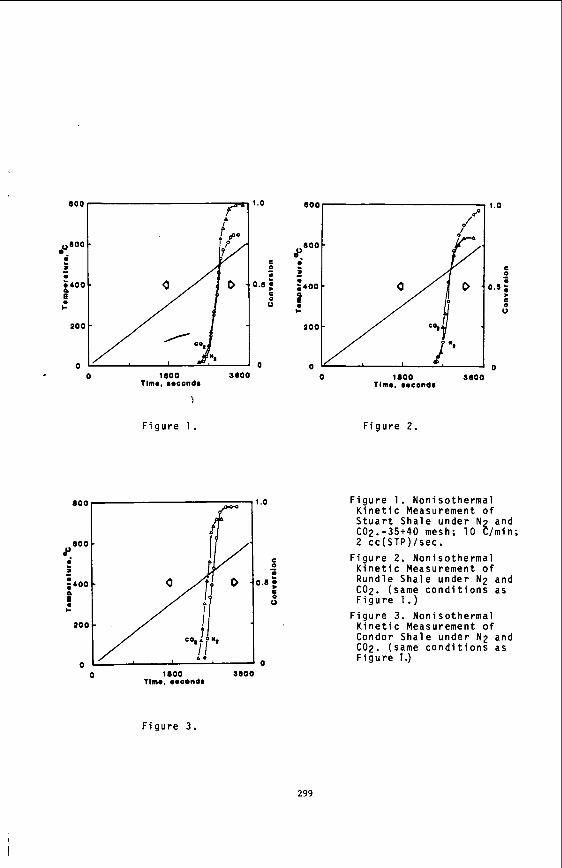
0 1800 3800 Tlmo. rocondr
3
0 1800 3800 11mo. rocondr
F i g u r e 1. F i g u r e 2.
800 - + 1.0
i
!
. 0.8 ;400 - 0
200 - 1 0
0 0 1800 3800
TImo. rmcondr 0
F i g u r e 3.
F i g u r e 1. N o n i s o t h e r m a l K i n e t i c Measurement o f S t u a r t S h a l e u n d e r N and C02.-35+40 mesh; 10 $/min; 2 cc (STP) /sec .
F i g u r e 2. N o n i s o t h e r m a l K i n e t i c Measurement o f Rund le S h a l e u n d e r N2 and C02. (same c o n d i t i o n s as F i g u r e 1.)
F i g u r e 3 . N o n i s o t h e r m a l K i n e t i c Measurement o f Condor S h a l e u n d e r N2 and C02. (same c o n d i t i o n s as F i g u r e 1.)
299
C a r b o n D i o x i d e R e t o r t i n g K i n e t i c p a r a m e t e r s f o r t h e p y r o l y s i s o f A u s t r a l i a n a n d e a s t e r n a n d w e s t e r n o i l s h a l e s u n d e r c a r b o n d i o x i d e s w e e p g a s c o n d i t i o n s a r e s u m m a r i z e d i n T a b l e 2. F i g u r e s 1, 2, a n d 3 show t h e e x p e r i m e n t a l d a t a f o r n o n i s o t h e r m a l k i n e t i c m e a s u r e m e n t o f p y r o l y s i s o f S t u a r t , C o n d o r , a n d R u n d l e s h a l e s u n d e r n i t r o g e n a n d c a r b o n d i o x i d e s w e e p g a s c o n d i t i o n s . I t i s i n t e r e s t i n g t o n o t e t h e d i f f e r e n c e i n k i n e t i c p a r a m e t e r s b e t w e e n n i t r o g e n a n d c a r b o n d i o x i d e r e t o r t i n g c o n d i t i o n s . T h i s i s b e l i e v e d t o b e d u e t o t h e d i f f e r e n c e i n k e r o g e n s w e l l i n g i n b o t h g a s e s a n d / o r t h e d i f f e r e n c e s i n m o l e c u l a r p e n e t r a t i o n i n t o p o r e s b e t w e e n n i t r o g e n a n d c a r b o n d i o x i d e . I t h a s b e e n known among t h e r e s e a r c h e r s t h a t t h e k e r o g e n i n o i l s h a l e s w e l l s b e t t e r i n t h e c a r b o n d i o x i d e medium t h a n t h e n i t r o g e n medium. T h i s i s why c a r b o n d i o x i d e r e t o r t i n g i s a l w a y s k i n e t i c a l l y f a s t e r t h a n n i t r o g e n r e t o r t i n g a t n o m i n a l l y i d e n t i c a l p r o c e s s c o n d i t i o n s .
SUMMARY
T h e p y r o l y s i s k i n e t i c s o f v a r i o u s A u s t r a l i a n o i l s h a l e s were e x p e r i m e n t a l l y o b t a i n e d u s i n g b o t h i s o t h e r m a l a n d n o n i s o t h e r m a l r e t o r t i n g t e c h n i q u e s . T h e r e s u l t s f r o m t h e t w o m e t h o d s c o m p a r e d f a v o r a b l y w i t h e a c h o t h e r o v e r a p r a c t i c a l r a n g e o f r e t o r t i n g t e m p e r a t u r e s . T h e p y r o l y s i s r e a c t i o n o f t h e i n v e s t i g a t e d A u s t r a l i a n o i l s h a l e s f o l l o w e d a g l o b a l f i r s t - o r d e r k i n e t i c s v e r y c l o s e l y a n d t h e a c t i v a t i o n e n e r g i e s r a n g e f r o m 110 t o 250 k J / g m o l e , d e p e n d i n g on t h e t y p e o f s h a l e . T h e s e v a l u e s c l o s e l y f o l l o w e d t h o s e f o r e a s t e r n a n d w e s t e r n U.S. o i l s h a l e s r e t o r t e d u s i n g t h e same e x p e r i m e n t a l s y s t e m . E v e r y p o s s i b l e e f f o r t h a s b e e n made t o e l i m i n a t e t h e i n t e r n a l a n d e x t e r n a l mass t r a n s f e r i n f l u e n c e o n t h e k i n e t i c s o b t a i n e d , v i z . , u s i n g f i n e l y g r o u n d s h a l e s a s w e l l a s p r o v i d i n g o p t i m a l h e a t a n d mass t r a n s f e r c o n d i t i o n s .
In a d d i t i o n , t h e p y r o l y s i s k i n e t i c s of v a r i o u s A u s t r a l i a n s h a l e s were i n v e s t i g a t e d b o t h u n d e r n i t r o g e n s w e e p g a s c o n d i t i o n s a n d u n d e r c a r b o n d i o x i d e s w e e p g a s c o n d i t i o n s a n d t h e r e s u l t s were d i r e c t l y c o m p a r e d . I t was f o u n d t h a t t h e c a r b o n d i o x i d e r e t o r t i n g p r o c e s s e x h i b i t s a k i n e t i c a l l y f a s t e r r a t e o f o i l e v o l u t i o n f r o m a l l t h e A u s t r a l i a n s h a l e s . T h i s r e s u l t was t r u e r e g a r d l e s s o f i t s i m p a c t o n t h e o v e r a l l y i e l d f r o m t h e s h a l e a n d was e q u a l l y v a l i d f o r o t h e r t y p e s o f o i l s h a l e s i n c l u d i n g t h e E a s t e r n a n d Western U.S. o i l s h a l e s .
REFERENCES
1. L e e S. a n d J o s h i R . . U.S. P a t e n t , No. 4,502,942 , (1985). 2. J o s h i R . a n d Lee S . . L i q u i d F u e l s T e c h n o l o g y , 1. 17, (1983).
3. P o l a s k y M . E . , ' P y r o l y s i s K i n e t i c s a n d P r o c e s s O p t i m i z a t i o n o f E a s t e r n U n i t e d S t a t e s a n d A u s t r a l i a n O i l S h a l e s I , M a s t e r ' s T h e s i s , T h e U n i v e r s i t y o f A k r o n , (1985).
300
THE RETORTING OF SELECTED AUSTRALIAN OIL SHALES UNDER HIGH PRESSURE HYDROGEN AND NITROGEN
BY
A. EKSTROM*, C.J.R. FOOKES, K. WONG
CSIRO Divis ion of Energy Chemistry, Lucas Heights Research Labora to r i e s . P r i v a t e Mail Bag 7 , Suthe r l and , NSW 2232, A u s t r a l i a .
INTRODUCTION
There i s i n c r e a s i n g i n t e r e s t i n t he e f f e c t s of gas p re s su re on t h e r e t o r t i n g p r o p e r t i e s of o i l s h a l e s , both as a means of i nc reas ing t h e o i l y i e l d and as an a i d to developing a b e t t e r understanding of t he chemical processes involved i n o i l s h a l e r e t o r t i n g . I n t h e presence of hydrogen a t p re s su res up to 7 MPa. s i g n i f i c a n t i n c r e a s e s i n o i l y i e l d have been r epor t ed f o r some s h a l e s ( l - 5 ) , and t h e technique forma t h e b a s i s of t h e HYTORT process under development in the USA(6,7). Although t h e small i n c r e a s e i n o i l y i e l d observed(8) when Green River s h a l e w a s r e t o r t e d under 2 . 7 MPa hydrogen w a s accompanied by a s l i g h t i n c r e a s e i n t h e a romat i c i ty (8 -10) . the changes i n t h e composition of t h e o i l s produced from s h a l e s , which under h ighe r hydrogen p res su res gave ve ry much g r e a t e r o i l y i e l d s (up t o 500%). have not been r epor t ed .
The present work w s s undertaken t o i n v e s t i g a t e t h e e f f e c t s of hydrogen and n i t rogen p res su re a t 6 MPa on t h e y i e l d s and composi t ion o f t h e o i l s produced from t h r e e A u s t r a l i a n o i l s h a l e s . These included Rundle a s r e p r e s e n t a t i v e of t h e T e r t i a r y s h a l e s of l a c u s t r i n e o r i g i n found i n Queensland, and Nagoorin as t y p i c a l of the h i g h l y aromatic and o rgan ic r i c h s h a l e s of mixed l a m o s i t e / l i g n i t e o r i g i n ( l 1 ) . The e x t e n t of t h e M t Coolon d e p o s i t . l oca t ed approximately 200 km west of t h e c i t y of Mackay i n Queensland is a t p re sen t unknown. The s h a l e was formed i n t h e e a r l y Miocene, i s unusual ly r i c h i n p a r t s , and is probably b e s t regarded a s an immature t o r b a n i t e ( l 2 ) .
EXPERIMENTAL
Samples of t h e sha le s were crushed and s i e v e d to -2.8 +1.4 mm. Reto r t ing was c a r r i e d out a t v a r i o u s p re s su res i n a f ixed bed r e a c t o r using a h e a t i n g r a t e of 6'C/minute t o 550'C followed by a 30 minute soak period. The gas flow r a t e s were ad jus t ed t o g i v e a cons t an t r e s idence t i m e o f 30 seconds a t a l l p re s su res . This r equ i r ed very high gas flow r a t e s at t h e h ighe r ope ra t ing p res su res . The o i l s (condensed st -10.C) were analysed by gas chromatography/mass spectrometry (GC/MS: JEOL DX300) and nuc lea r magnetic resonance (NMR: JEOL GX400) techniques. S o l u t i o n 13C s p e c t r a were determined i n the presence of chromium r e l a x a t i o n reagents with an inve r se gated decoupl ing and a recycle time of f i v e seconds. Proton s p e c t r a were recorded with s r e c y c l e t ime of 20 seconds.
RESULTS AND DISCUSSION
( a ) P rope r t i e s of Sha le s
Table 1 i l l u s t r a t e s t h e d i v e r s i t y of t h e s h a l e s used i n t h i s s tudy with r e spec t to t h e i r o rgan ic carbon con ten t , a tomic H/C r a t i o , a r o m a t i c i t y and r e t o r t i n g p r o p e r t i e s . Of p a r t i c u l a r i n t e r e s t a r e t h e ve ry poor conversions oE organic carbon i n t h e s h a l e t o o i l ob ta ined under normal ( F i s c h e r Assay) r e t o r t i n g for t h e Mt Coolon and Nagoorin s h a l e s , i n d i c a t i n g t h a t for t hese sha le0 convent ional r e t o r t i n g procedures a r e not p a r t i c u l a r l y e f f e c t i v e . i
30 1
( b ) E f f e c t of P res su re on O i l Yields
For a l l t h r e e s h a l e s . i n c r e a s i n g n i t r o g e n p r e s s u r e r e s u l t e d i n only minor decreases i n o i l y i e l d s ( F i g u r e 1 ) and o rgan ic carbon conversions (F igu re 2) . Inc reas ing hydrogen p r e s s u r e had no e f f e c t on t h e o i l y i e l d from t h e a l i p h a t i c Rundle s h a l e , a l t hough a r educ t ion i n the o rgan ic carbon remaining i n the char was observed, presumably r e f l e c t i n g t h e conversion of the carbonaceous r e s idue to methane, as has been p rev ious ly observed f o r Green River s h a l e ( 8 ) .
However, i n c r e a s e s of 150 and 350% of F i s c h e r Assay o i l y i e l d s were observed f o r t h e M t Coolon and Nagoorin s h a l e s , equ iva len t t o oi l y i e l d s of 390 and 290 L t-1 r e s p e c t i v e l y . assuming an o i l d e n s i t y o f 0.9 g These l a r g e i nc reases a r e matched by corresponding dec reases i n t h e organic carbon remaining i n the char (F igu re 2 ) which, i n the c a s e o f Nagoorin decreased from 58 t o 24% a t 6 HPa hydrogen. Increased hydrogen p r e s s u r e r e s u l t e d i n on ly small changes i n the conversion of o rgan ic carbon t o gaseous products .
As shown i n F i g u r e 3, t h e o i l y i e l d s determined fo r t h r e e A u s t r a l i a n ( l 3 ) aromatic s h a l e s r e t o r t e d i n 6 MPa hydrogen compared favourably with similar r e s u l t s ( 3 ) fo r a v a r i e t y of o t h e r s h a l e s . Data on t h e importance of the t o t a l o i l y i e l d on t h e economics of HYTORT type processes do not appear t o have been publ ished. but it appears t h a t t h e t h r e e A u s t r a l i a n sha le s a r e p a r t i c u l a r l y s u i t e d t o r e t o r t i n g i n high p res su re hydrogen.
( c ) E f f e c t o f P res su re on O i l Composition
Although inc reased o i l y i e l d s a r e obviously important . t h e composition of t h e o i l is equa l ly s i g n i f i c a n t from the viewpoint of t h e subsequent hydro- t reatment and r e f i n i n g of t h e crude product .
I n c r e a s i n g n i t r o g e n p r e s s u r e had no e f f e c t on t h e IH and 13C a r o m a t i c i t i e s of t h e whole s h a l e o i l s (F igu re 4). but l a r g e changes were observed with inc reas ing hydrogen p res su re , p a r t i c u l a r l y f o r t h e Mt Coolon and Nagoorin sha le s . For example, t h e Nagoorin o i l formed i n 6 MPa hydrogen had carbon and proton a r o m a t i c i t i e s of 68 and 29% r e s p e c t i v e l y . The d a t a i n d i c a t e t h a t fo r t he M t Coolon and Nagoorin s h a l e s a s u b s t a n t i a l p a r t of t h e a d d i t i o n a l o i l formed i n t h e presence of hydrogen is aromatic .
Examination of t h e whole o i l s by gas chromatography (GC) and gas chromatography/mass spec t romet ry (CC/MS) showed ( F i g u r e 5 ) t h a t phenol, t he c r e s o l s and d ime thy l / e thy l phenols were prominent components of t h e o i l s r e t o r t e d under h igh p r e s s u r e hydrogen from t h e M t Coolon and Nagoorin s h a l e s . These compounds a l s o completely dominate t h e I 3 C NHR s p e c t r a of these o i l s i n t h e aromatic r eg ion b u t were absent i n the o i l s r e t o r t e d from t h e Rundle s h a l e i n both n i t r o g e n and hydrogen.
Nitrogen had v i r t u a l l y no e f f e c t on t h e y i e l d of any of t he var ious molecular groups determined by p ro ton NMR spec t roscopy (F igu re 6 ) , ss was expected from t h e absence of any co r re spond ing e f f e c t on the t o t a l o i l y i e l d However. l a r g e i n c r e a s e s i n the p ropor t ions of p a r t i c u l a r l y po lycyc l i c aromatics were observed f o r t h e M t Coolon and Nsgoorin s h a l e s r e t o r t e d i n t h e presence of hydrogen. Very much s m a l l e r i n c r e a s e s i n the r e l a t i v e p ropor t ions of these compounds were observed i n o i l s r e t o r t e d from t h e a l i p h a t i c Rundle sha le .
Taken t o g e t h e r , t h e r e s u l t s ob ta ined f o r t he Nagoorin and M t Coolon o i l s r e t o r t e d under hydrogen suggest t h a t t h e s e a r e not normal s h a l e oils, but more Closely resemble coal-der ived l i q u i d s , no doubt r e f l e c t i n g t h e p a r t i a l l i g n i t i c o r i g i n of t hese s h a l e s . The r e s u l t s a l s o i n d i c a t e t h a t f o r t h e s e s h a l e s i n t h e
302
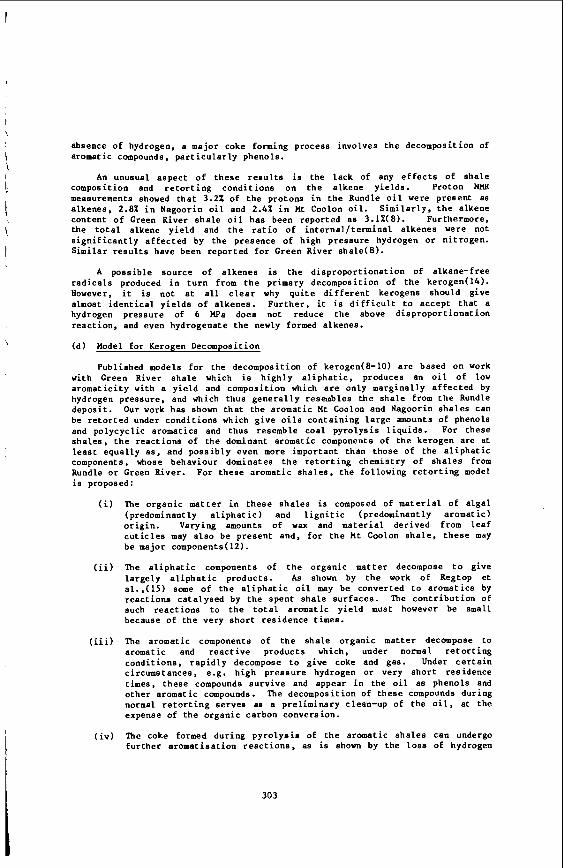
\ \ I
absence of hydrogen, a major coke forming process involves t h e decomposition of aromatic compounds, p a r t i c u l a r l y phenols .
An unusual a spec t o f t h e s e r e s u l t s is t h e l ack of any e f f e c t s of s h a l e composition and r e t o r t i n g c o n d i t i o n s on t h e alkene y i e lds . Proton NMR measurements showed t h a t 3.2% of t h e protons i n t h e Rundle o i l were p re sen t as a lkenes , 2.8% i n Nagoorin o i l and 2.4% i n M t Coolon o i l . S i m i l a r l y , t h e alkene con ten t o f Green River s h a l e o i l h a s been r epor t ed a s 3.1%(6). Furthermore, t h e t o t a l a lkene y i e l d and t h e r a t i o of i n t e rna l . / t e rmina l a lkenes were not s i g n i f i c a n t l y a f f e c t e d by t h e presence o f high p res su re hydrogen or n i t rogen . S imi l a r r e s u l t s have been r epor t ed f o r Green River s h a l e ( 8 ) .
A poss ib l e sou rce of a lkenes is t h e d i s p r o p o r t i o n a t i o n of a lkane - f r ee r a d i c a l s produced i n t u r n from t h e primary decomposition of t h e ke rogen( l4 ) . However, it is not a t a l l c l e a r why q u i t e d i f f e r e n t kerogens should g ive almost i d e n t i c a l y i e l d s o f a lkenes . F u r t h e r , i t i s d i f f i c u l t to accep t t h a t a hydrogen p res su re of 6 W a does not reduce t h e above d i s p r o p o r t i o n a t i o n r eac t ion . and even hydrogenate t h e newly formed alkenes.
(d ) Model f o r Kerogen Decomposition
Published models f o r t he decomposi t ion of kerogen(8-10) are based on work with Green River s h a l e which is h i g h l y a l i p h a t i c , produces an o i l o f low a r o m a t i c i t y with a y i e l d and composi t ion which are only marg ina l ly a f f e c t e d by hydrogen p res su re , and which thus g e n e r a l l y resembles t h e s h a l e from t h e Rundle depos i t . Our work has shown t h a t t h e aromatic M t Coolon and Nagoorin s h a l e s can be r e t o r t e d under c o n d i t i o n s which g i v e oils con ta in ing l a r g e amounts of phenols and po lycyc l i c aromatics and thus resemble coa l p y r o l y s i s l i q u i d s . For these s h a l e s , t h e r e a c t i o n s of t h e dominant aromatic components of t h e kerogen a r e a t l e a s t equa l ly as, and p o s s i b l y even more important than those of t h e a l i p h a t i c components, whose behaviour dominates t h e r e t o r t i n g chemistry of s h a l e s from Rundle o r Green River. For t h e s e aromatic s h a l e s , t he fol lowing r e t o r t i n g model is proposed:
The o rgan ic m a t t e r i n t h e s e s h a l e s is composed of m a t e r i a l of a l g a l (predominantly a l i p h a t i c ) and l i g n i t i c (predominant ly a romat i c ) o r i g i n . Varying amounts of wax and m a t e r i a l de r ived from l e a f c u t i c l e s may a l s o be p re sen t and, f o r t h e M t Coolon s h a l e , t h e s e may be major components(l2).
The a l i p h a t i c components of t h e o rgan ic ma t t e r decompose to g ive l a r g e l y a l i p h a t i c p roduc t s . As shown by t h e work o f Regtop e t a l . , ( l 5 ) some o f t h e a l i p h a t i c o i l may be converted to aromatics by r e a c t i o n s c a t a l y s e d by t h e spen t s h a l e s u r f a c e s . The c o n t r i b u t i o n of such r e a c t i o n s to t h e t o t a l aromatic y i e l d must however be small because of t h e ve ry s h o r t r e s idence times.
The aromatic components of t h e s h a l e o rgan ic ma t t e r decompose to aromatic and r e a c t i v e products which, under normal r e t o r t i n g cond i t ions , r a p i d l y decompose t o g ive coke and gas. Under c e r t a i n c i rcumstances, e.g. h igh p r e s s u r e hydrogen or very s h o r t r e s idence t imes, t h e s e compounds s u r v i v e and appear i n the o i l a s phenols and o t h e r aromatic compounds. The decomposition of t hese compounds du r ing normal r e t o r t i n g s e r v e s as a pre l imina ry clean-up of t h e o i l , at t h e expense of t h e o rgan ic carbon conversion.
The coke formed dur ing p y r o l y s i s of t h e aromatic s h a l e s can undergo f u r t h e r a r o m a t i s a t i o n r e a c t i o n s , as is shown by the loss of hydrogen
303
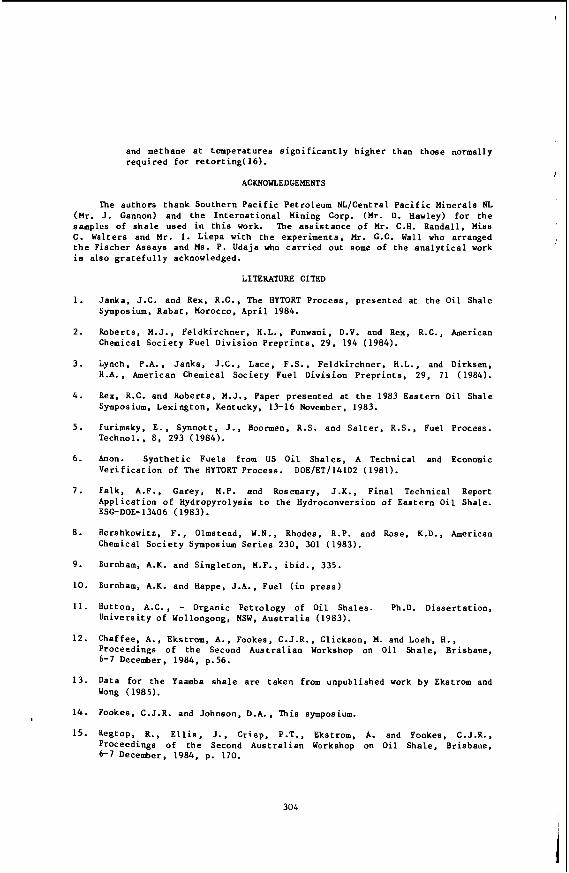
and methane a t temperatures s i g n i f i c a n t l y h ighe r than those normally r e q u i r e d f o r r e t o r t i n g ( l 6 ) .
ACKNOWLEDGEMENTS
The au tho r s thank Southern P a c i f i c Petroleum NLjCentral P a c i f i c Minerals NL (Mr. J . Gannon) and t h e I n t e r n a t i o n a l Mining Corp. (Mr. D. Hawley) f o r t h e samples o f s h a l e used i n t h i s work. The a s s i s t a n c e o f Mr. C.H. Randal l , Miss C. Walters and Mr. I. Liepa wi th t h e experiments , Mr. C.C. Wall who arranged t h e F i sche r Assays and Ma. P. Udaja who c a r r i e d ou t some of t h e a n a l y t i c a l work is a l so g r a t e f u l l y acknowledged.
1.
2.
3.
4.
5.
6 .
7.
8.
9.
10.
11.
12.
13.
14.
15.
LITERATURE CITED
Janka, J . C . and Rex, R.C., The HYTORT Process , presented a t t h e O i l Shale Symposium, Rabat , Morocco, A p r i l 1984.
Roberts , M.J., Feldkirchner . H.L., Punwani. D.V. and Rex, R.C., American Chemical S o c i e t y Fuel D iv i s ion P r e p r i n t s , 29. 194 (1984).
Lynch, P.A., Janka. J .C. , Lace, F.S., Fe ldk i r chne r , H.L., and Dirksen, H.A., American Chemical Soc ie ty Fuel D iv i s ion P r e p r i n t s , 29, 7 1 (1984).
Rex, R.C. and Roberts , M.J., Paper p re sen ted a t t h e 1983 Eas t e rn O i l Shale Symposium, Lexington. Kentucky, 13-16 November, 1983.
Furimsky, E . , Synno t t , J., Boormen, R.S. and S a l t e r , R.S.. Fuel Process. Technol. , 8, 293 (1984).
Anon. S y n t h e t i c Fue l s from US O i l Sha le s , A Technical and Economic V e r i f i c a t i o n of The HYTORT Process .
Falk, A.F., Garey, M.P. and Rosemary, J . K . , F i n a l Technical Report App l i ca t ion o f Hydropyrolysis to t h e Hydroconversion of Eas t e rn O i l Shale. ESODOE-13406 (1983).
Hershkowitz, F., Olmstead, W.N., Rhodes, R.P. and Rose, K.D., American Chemical S o c i e t y Symposium S e r i e s 230, 301 (1983).
Burnham, A.K. and S ing le ton , M.F., i b i d . , 335.
Burnham, A.K. and Happe. J .A. , Fuel ( i n p r e s s )
Hutton, A.C., - Organic Petrology o f O i l Shales . Ph.D. D i s s e r t a t i o n , Un ive r s i ty o f Wollongong, NSW, A u s t r a l i a (1983).
Chaffee, A. , Ekstrom, A. , Fookes, C.J .R. , Gl ickson, M. and Loeh, H., Proceedings of t h e Second A u s t r a l i a n Workshop on O i l Sha le , Brisbane, 6-7 December, 1984. p.56.
Data f o r t h e Yaamba s h a l e a r e t aken from unpubl ished work by Ekstrom and Wong (1985).
Fookes, C.J.R. and Johnson, D.A., This symposium.
Regtop, R., E l l i s , J . , Cr i sp , P.T., Ekstrom, A. and Fookes. C.J.R.. Proceedings o f t h e Second A u s t r a l i a n Workshop on O i l Sha le , Brisbane, 6-7 December. 1984, p. 170.
DOE/ET/14102 (1981).
304
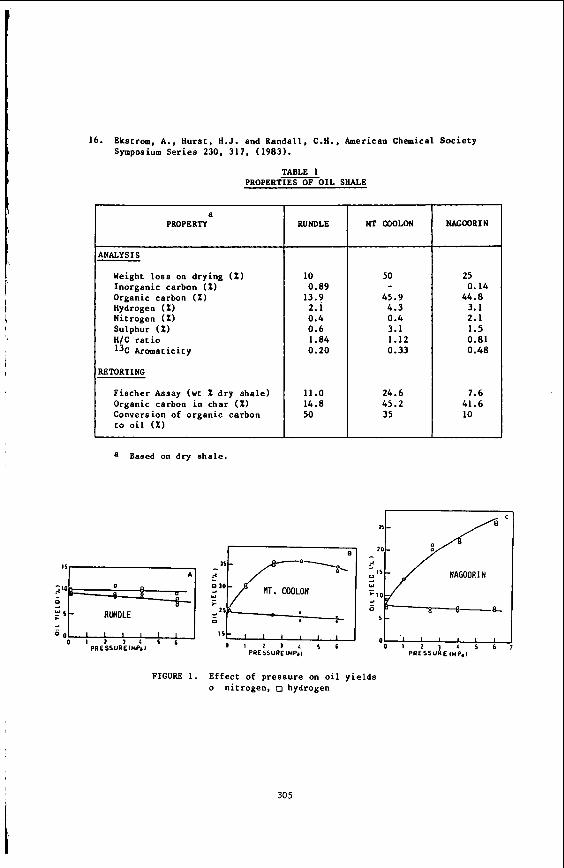
16. Ekstrom, A., Hurs t , H.J. and Randal l , C.H., American Chemical S o c i e t y Symposium S e r i e s 230, 317, (1983) .
TABLE 1 PROPERTIESOIL SHALE
F i s c h e r Assay (wt % d r y s h a l e ) Organic carbon i n cha r (%) Conversion of o rgan ic carbon to o i l ( X I
€4
PROPERTY
ANALYSIS
Weight loas on dry ing ( X ) Inorganic carbon (%) Organic carbon (%) Hydrogen ( X ) Nitrogen ( I ) Sulphur ( X ) H/C r a t i o 1 3 ~ ~ r o m a t i c i t y
I RETORTING
RUNDLE MT COOLON NACOORIN
10 0.89
13.9 2.1 0.4 0.6 1.84 0.20
a Based on d r y eha le .
I f :::E Y S RUNDLE
2 - 0 0
PRESSURE 1MP.l
50
45.9 4.3 0.4 3.1 1.12 0.33
- 25 0.14
44.8 3.1 2.1 1.5 0.81 0.48
FIGURE 1. E f f e c t of p re s su re on oil y i e l d s o n i t rogen , o hydrogen
305
+ OIL I
FIGURE 2 . Effect of pressure on organic carbon d i s t r i b u t i o n s
1 I -- em +-
FIGURE 3. Comparison of rhe e f f e c t s of hydrogen preseure on o i l y i e l d s .
l a
306
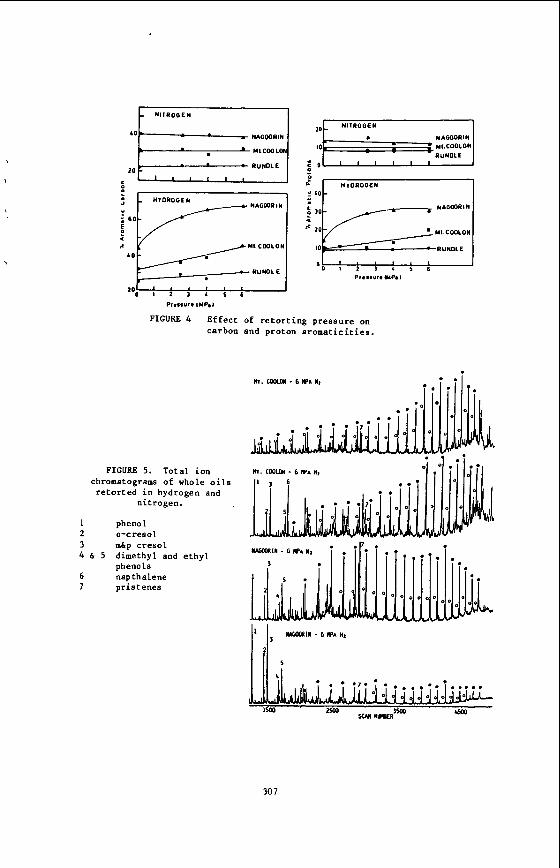
,
NAG00RIN
N1 COO LON
RUNDLE
0
NAGOORIN
M I C r n L O N L O
R U N D L E
Pr.uuro wP.i
l o N l l R O G E N 1
--- NAGOORIN
' MI COOLON
RUNDLE
F I G U R E 4 Effec t o f re tor t ing pressure on carbon and proton aromat ic i t i e s .
F I G U R E 5. Total ion chromatograms o f whole o i l s
retorted i n hydrogen and nitrogen.
1 phenol 2 o-cresol 3 mhp creso l 4 6 5
6 napthalene 7 pristenes
dimethyl and e thy l phenols
30 7
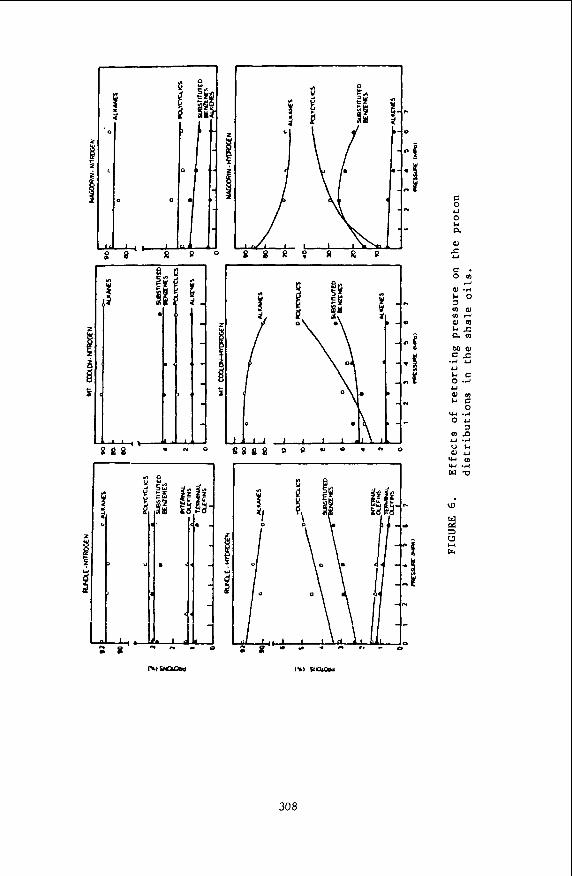
C 0 U 0 a o 5
308
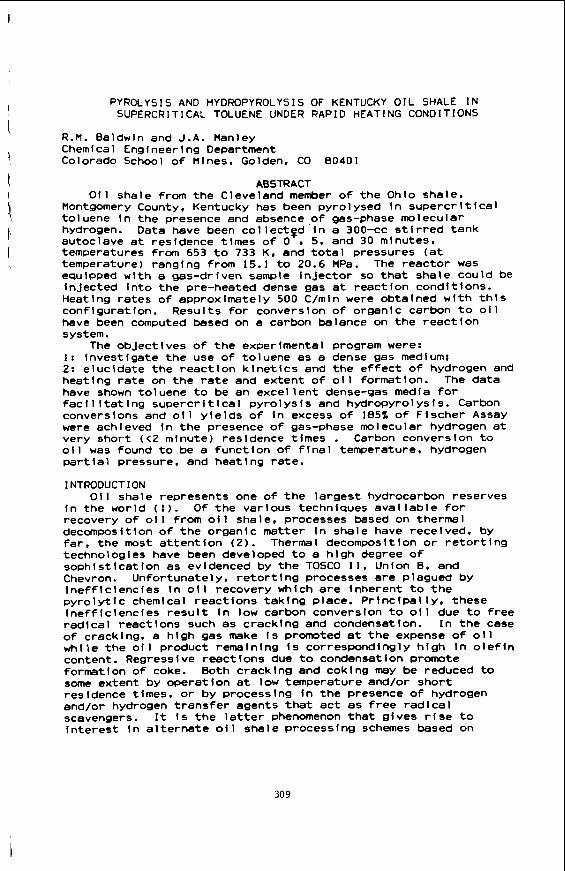
PYROLYSIS AND HYDROPYROLYSIS OF KENTUCKY OIL SHALE IN SUPERCRITICAL TOLUENE UNDER RAPID HEATING CONDITIONS
R.M. Baldwin and J.A. Hanley Chemical Engineering Department Colorado School of Mines. Golden, CO 80401
ABSTRACT Oil shale from the Cleveland member of the Ohio shale.
Montgomery County, Kentucky has been pyrolysed in supercrfticai toluene in the presence and absence,of gas-phase molecular hydrogen. Data have been collectgd in a 300-cc stirred tank autoclave at residence times of 0 5. and 30 minutes. temperatures from 653 to 733 K. and total pressures (at temperature) ranging from 15.1 to 20.6 HPa. The reactor was equipped with a gas-driven sample injector so that shale could inJected into the pre-heated dense gas at reaction conditions. Heating rates of approximately 500 C h i n were obtained with th configuration. Results for conversion of organic carbon to of have been computed based on a carbon balance on the reaction system.
The objectives of the experimental program were: 1: investigate the use of toluene as a dense gas medium:
be
S
2: elucidate the reaction kinetics and the effect of hydrogen and heating rate on the rate and extent of oil formation. The data have shown toluene to be an excellent dense-gas media for facilitating supercritical pyrolysis and hydropyrolysis. Carbon conversions and oil yields of in excess of 185% o f Fischer Assay were achieved in the presence of gas-phase molecular hydrogen at very short ( < 2 minute) residence times . Carbon conversion to oil was found to be a function of final temperature. hydrogen partlal pressure, and heating rate.
INTRODUCTION
in the world (1). Of the various techniques available for recovery of oil from oil shale, processes based on thermal decomposition of the organic matter in shale have received, by far. the most attention (2). Thermal decomposition or retorting technologies have been developed to a hlgh degree of sophistication as evidenced by the TOSCO 1 1 . Union 0 . and Chevron. Unfortunately. retorting processes are plagued by inefficiencies in oil recovery which are inherent to the pyrolytic chemical reactions taking place. Principally. these inefficiencies result in low carbon conversfon to oil due to free radical reactions such as cracking and condensatfon. In the case of cracking. a high gas make is promoted at the expense of oil while the of1 product remaining i s correspondingly high in olefin content. Regressive reactions due to condensatfon promote formation of coke. Both cracking and coking may be reduced to some extent by operatlon at low temperature and/or short residence times, or by processing in the presence of hydrogen and/or hydrogen transfer agents that act as free radical scavengers. It is the latter phenomenon that gives rise to interest in alternate oil shale processtng schemes based on
Oil shale represents one of the largest hydrocarbon reserves
309
reactions in dense gas media.
most organic solvents at or below their normal boiling points, but when oil shale is heated to temperatures above 600 K, the organic matter may be extracted in high yield (3.4). Several early patents describe solvent processing of torbanite and other shale-like materials at elevated temperatures both with and
Kerogen in oil shale is known to be relatively insoluble in
310
vehicle oils. while Gregoli (10). Patzer (11 ) . and Greene (12 ) have all recently been issued patents for hydrogenation of oil shale in hydrogen donor and non-donor solvents In the presence l
and absence of gas phase molecular hydrogen. Recently, McKay et el. (13) and Baldwin et al. (14) have reported on investigations using dense (supercritical) gases and subcritical fluids for extraction of shale oil from oil shale under a wide variety of
I
I
K. critical pressure 4.07 MPa) was present in the reactor as a dense gas. After heating to reaction conditions with only gas and toluene present in the reactor, the shale was injected into the vessel with an overpressure of helium. The reaction temperature rapidly rebounded to the desired temperature (generally within One minute). Following the desired reaction time, the reactor Was quenched by forced convection. Samples of the spent shale were analyzed for total and inorganic carbon, and ashed in a muffle furnace. Carbon conversion to oil plus gas was then calculated based on a forced ash balance, while carbon conversion to gas was calculated from an analysis of the reaction product gases. Carbon conversion to oil, and thus oil selectivity, was then finally computed by difference. In the following discussion, oil selectivity refers to the fraction of carbon converted that is converted to oil.
Two baseline runs in helium and hydrogen atmospheres were Performed at 698 K in order to establish the thermal reactivity of the shale in supercritical toluene. These runs were, however. done with the reactor used in the true batch mode of operation where the entire reaction mass was heated slowly (approximately 8 C per minute) to the final temperature, and then held at this level for one hour. Results of this run are shown in Table 2. As may be seen, an organic carbon conversion of 44.07, and oil selectivity of 91.6%. resulting in an overall conversion of carbon to oil of only 40.37. was achieved in the absence of hydrogen. This conversion level is consistent with the results obtained in standard Fischer Assay pyrolysis (viz. Table 1). Pyrolysis under these conditlons in the presence of hydrogen however raises the carbon conversion to oil to 68.92. thus demonstratlng the well-recognized benefits attendant to hydropyrolysis of aromatic oil shales. Clearly, hydrogen in the reaction gas atmosphere greatly enhances carbon conversion. This is primarfly accomplished by inhibiting condensation reactions which lead to formatton of coke, as the oil selectivities differ by only about 109.. This observation I s consistent with a radical quenching mechanism, promoted by the presence of gas phase molecular hydrogen.
Results for pyrolysis and hydropyrolysis in supercritical toluene under rapid heating conditions (c.a. 500 C/min) are shown in Figures 2, and 3. Figure 2 presents the kinetic data for organic carbon conversion obtained with hydropyrolysis under rapid heating conditions at an initial (cold) hydrogen pressure of 300 psi. As may be seen, the low temperature isotherms (653, 673. and 693 K ) exhibit the expected tlme/temperature behavior. Hydropyrolysis at 713 and 733 K however shows an entirely different behavior, with the organic carbon conversion reaction becoming essentially instantaneous at the hlghest temperature studied (733 K ) . 011 selectivlty (the fraction of carbon reacted that is converted to oil) at the highest temperature and shortest residence time is 95.6%. Thls. coupled wlth the 61.3% organic carbon conversion achieved at this combinatlon of reaction conditions gives rise to an overall oil yield in excess of 1857. of Fischer Assay. Perhaps more interesting however, is the effect o f hydrogen on the reaction that I s indicated in Figure 3. As illustrated. under conditlons of rapid heating and low final
311
temperature (673 K). the organic conversion is insensitive to the presence of hydrogen in the reaction gas atmosphere over a wide range of residence times as shown by the essentially identical results for pyrolysis (helium atmosphere) and hydropyrolysis. This is in direct contrast to the slow heating data shown in Table 2 . where hydrogen has a marked effect on the ultimate yield of oil. At 713 K, the presence of hydrogen has a small beneficial effect at the short residence time (5 minutes), and a substantial beneficial effect at the extended resldence time of 30 minutes. At 733 K , the effect of hydrogen is pronounced over the entire range of reaction times studied. and i s especially pronounced at 30 minutes. Considerlng these data in light of the previous data from the slow heating rate experlments serves to indicate that a complex mechanism involving both radical quenchlng and oil evolution rate processes is operative in this reaction system. Under conditlons of rapld heating but at low final temperatures (673 K or less) the secondary condensation reactions leading to decreased oil yield are apparently sufficiently slow such that the carbon conversion reactlons are not sensftive to the presence o f added hydrogen. Reaction at high heating rates but higher flnal temperatures (713 K and above) however shows a significant sensitivity to the presence of gas-phase molecular hydrogen, especlally at extended residence times. Apparently. under these conditions, regressive (coke-forming) reactions are Sufficiently rapid that inhibition of condensation by radical quenching becomes significant, thus leading to enhanced organic carbon conversions. At high heating rates, significantly higher organic carbon conversions can be obtained with inert atmosphere pyrolysfs when compared to the Fischer Assay as shown by a comparison o f the high temperature helium atmosphere data in Figure 3 and the data in Table 1 . Thls enhanced yield is, however, only present at short residence times ( < 5 minutes). This is undoubtedly due to the well documented effect of "flash pyrolysis". where the rapid rate of volatiles evolution is successful in preventing secondary reactfons whlch decrease carbon conversion ( 1 5 ) . At higher reaction severity (time/temperature combinations). some form of hydrogen activity is required to prevent the onset of regressive reactions with the resultant loss of carbon conversion.
ACKNOWLEDGEMENTS
Southern Pacific Petroleum, N.L. of Sydney, Australia. Conversations with Carl S. Minden and John Gannon were also helpful in execution and interpretation of the research.
LITERATURE CITED
The authors wish to acknowledge the financial support of
1 . Dickson, P.F.. Oil Shale. Kirk-Othmer Encyclopedia o f Chemical Technology, Vol. 16. Third Edition, 1981. 2. Baughman. G.L . . Synthetic Fuels Data Handbook. second edition, Cameron Engineers, Inc.. 1978. 3. Gavin. M.J., and Aydelotte, J.T.. "Solubilities of Oil Shales in Solvents for Petroleum". Bureau of Mines R.l..2313, 1922. 4. Dulhunty. J . A . . "Solvent Extraction of Torbanite", Proc.
312
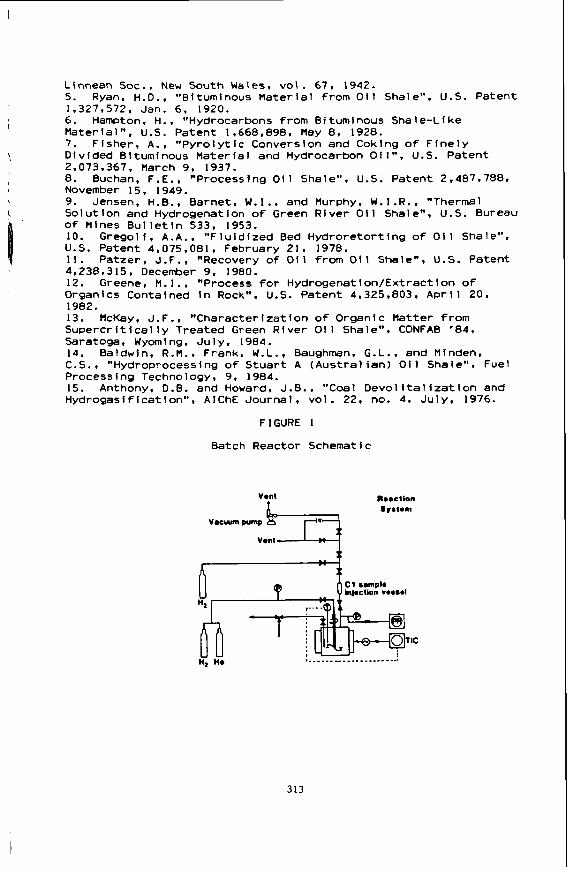
I
Linnean SOC.. New S o u t h Wales, vol. 67. 1942. 5. Ryan, H.D.. "Bituminous Material from Oil Shale". U.S. Patent 1,327,572, Jan. 6, 1920. 6. Hampton, H., **Hydrocarbons from Bituminous Shale-Like Material", U.S. Patent 1,668,898, May 8, 1928. 7. Fisher, A., "Pyrolytic Conversion and Coking of Finely Divided Bituminous Material and Hydrocarbon Oil", U.S. Patent 2.073.367. March 9. 1937. 8. Buchan. F.E.. "Processlng Oil Shale". U.S. Patent 2,487,7889 November 15. 1949. 9. Jensen, H.B.. Barnet. W . 1 . . and Murphy, W.I.R.. "Thermal Solutfon and Hydrogenation of Green River Oil Shale", U.S. Bureau of Mines Bulletin 533. 1953. 10. Gregoli. A.A.. "Fluidized Bed Hydroretorting of Oil Shale", U.S. Patent 4,075,081, February 21. 1978. 11 . Patzer, J.F.. "Recovery o f Oil from Oil Shale", U.S. Patent 4,238,315, December 9, 1980. 12. Greene, M.1.. "Process for Hydrogenation/Extraction of Organics Contained in Rock", U.S. Patent 4,325,803, April 20. 1982. 13. McKay. J.F.. "Characterization of Organic Matter from Supercritically Treated Green River Oil Shale". CONFAB '84. Saratoga. Wyoming, July, 1984. 14. Baldwin, R.M.. Frank, W.L.. Baughman. G.L., and Mlnden. C.S.. "Hydroprocessing o f Stuart A (Australian) Oil Shale". Fuel Processing Technology. 9. 1984. 15. Anthony. D.B. and Howard. J.B.. "Coal Devolitalization and Hydrogasification". AlChE Journal, vol. 22. no. 4. July, 1976.
FIGURE 1
Batch Reactor Schematic
Vent Reacllon Sy.1.m
v a c u n pump
313
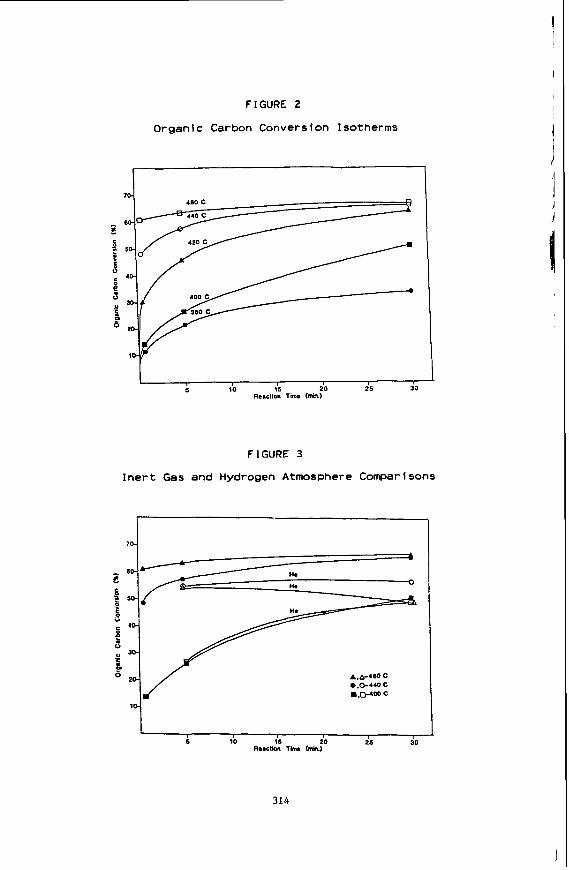
FIGURE 2
Organic Carbon Conversion Isotherms
F I GURE 3
Inert Gas and Hydrogen Atmosphere Comparlsons
L 6 10 15 20 26 30
Raacllon Thu W)
314
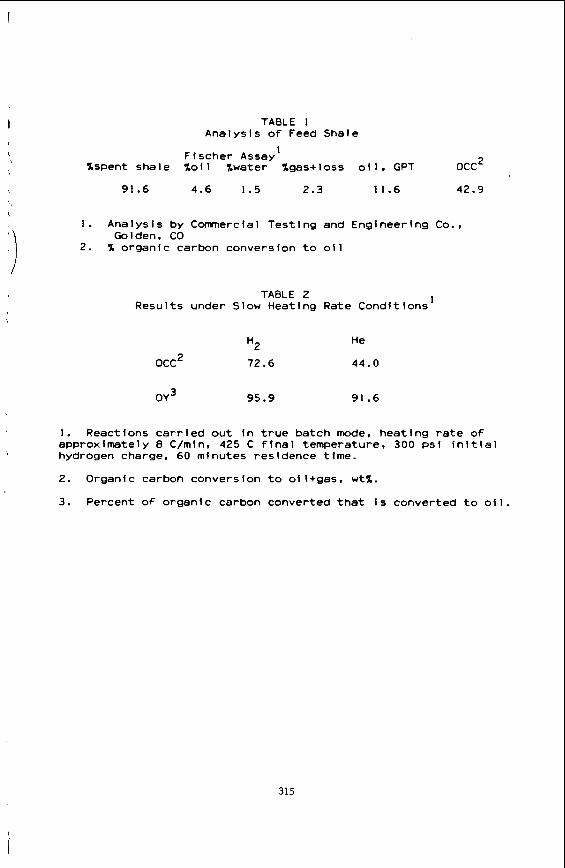
TABLE 1 Analysis o f Feed Shale
1 Fischer Assay %spent shale % o i l %water %gas+loss o i l . GPT occ2
91.6 4.6 1.5 2.3 11.6 42.9
1. Analysis by Commercial Testing and Engineering Co..
2 . % organic carbon conversion t o o f1 Golden, CO
1 TABLE 2 Results under Slow Heating Rate Condit ions
He
occ2 72.6 44.0
OY 95.9 91.6
1 . Reactlons c a r r l e d ou t i n t r u e batch mode, heat lng r a t e o f approximately 8 C/minr 425 C f i n a l temperature. 300 p s i i n i t i a l hydrogen charge. 60 minutes residence t i m e .
2. Organic carbon conversion t o oi l+gas. w t % .
3. Percent of organic carbon converted t h a t is converted t o o l l .
315
CHARACTERIZATION AND STABILITY PROPERTIES OF POLAR EXTRACTS DERIVED FROM A RECENT SHALE LIQUID
John V. Cooney*, George W . Mushrush and Erna J. Beal
Naval Research Laboratory, Code 6180, Washington, D.C. 20375-5000
INTRODUCTION
Recent studies into the mechanisms of storage instability with middle distillate fuels have indicated that the presence of polar compounds, particularly nitrogen heterocycles, is frequently related to the deterioration of aged fuel samples 11-51. In certain instances, direct autoxidation of nitrogen containing species is indicated, which may be subject to catalytic effects made possible by trace fuel components [6,7]. At other times, the organic nitrogen compounds themselves assume the role of catalyst in the oxidation of other fuel molecules. One approach to the problem of nitrogen compound induced storage instability has involved model compound dopant studies [8,9]. A second approach involves the study of the stability properties of actual high- nitrogen middle distillate fuels [lO,ll]. In this paper we discuss the second approach which was applied to a recently refined high-nitrogen shale liquid. Thus, polar extract components were isolated, characterized and studied in the context of accelerated storage stability tests.
EXPERIMENTAL
The high-nitrogen shale liquid which was examined in this study was refined from Geokinetics crude shale oil refined at the Caribou-Four Corners Refinery (Utah). The sample which was studied had been distilled and partially hydrotreated, and was designated at NRL as "fuel 83-65". Fuel 83-65 is identical to processing intermediate 1-HTR-3 recently studied by Thompson and Holmes [12]. Fuel 83-65 was separated into three polar extracts using a reported procedure involving extraction with acid (1.0 N HC1) followed by batch adsorption onto silica gel, which was subsequently back-washed with methylene chloride and methanol [lO,ll]. The three extracts thus provided were: (a) BNC ("basic nitrogen compound" extract, the acid-extractable material, in methylene chloride), (b) NBNC(CH2C12)(nnon-basicn extract in methylene chloride), and (c) NBNC(CH3OH)(methanolic wash of the Sifica el). The polar extracts were examined by capillary GC/MS using reported conditions [lo].
The accelerated storage stability test method used has been described in detail [ 4 ] . In summary, 300 ml samples of filtered fuel were thermally stressed in the dark in 500 ml screw-cap borosilicate Erlenmeyer flasks (Teflon-lined caps). Replicate Samples were run, with both filterable sediment and adherent gum values determined after storage. Peroxide numbers (ASTM D1583-60) were also determined in samples of filtered fuel before and after stress. Extract-doping experiments employed a very stable Navy Shale-I1 process shale diesel fuel, fuel D-11, as diluent. Fuel
' I
I
316
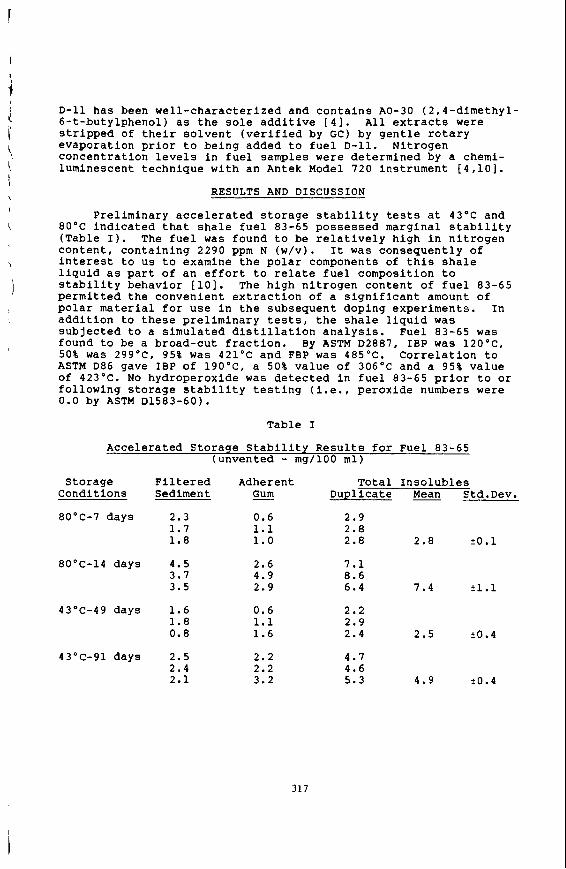
D-11 has been well-characterized and contains AO-30 (2,4-dimethyl- 6-t-butylphenol) as the sole additive [4]. All extracts were stripped of their solvent (verified by GC) by gentle rotary evaporation prior to being added to fuel D-11. Nitrogen concentration levels in fuel samples were determined by a chemi- luminescent technique with an Antek Model 720 instrument [4,101.
RESULTS AND DISCUSSION
Preliminary accelerated storage stability tests at 43'C and 8O'C indicated that shale fuel 83-65 possessed marginal stability (Table I). The fuel was found to be relatively high in nitrogen content, containing 2290 ppm N (w/v). It was consequently of interest to us to examine the polar components of this shale liquid as part of an effort to relate fuel composition to stability behavior [lo]. The high nitrogen content of fuel 83-65 permitted the convenient extraction of a significant amount of polar material for use in the subsequent doping experiments. In addition to these preliminary tests, the shale liquid was subjected to a simulated distillation analysis. Fuel 83-65 was found to be a broad-cut fraction. By ASTM D2881, IBP was 120°C, 50% was 299"C, 95% was 421'C and FBP was 485°C. Correlation to ASTM D86 gave IBP of 190°C, a 50% value of 306°C and a 95% value of 423°C. NO hydroperoxide was detected in fuel 83-65 prior to or following storage stability testing (i.e., peroxide numbers were 0.0 by ASTM D1583-60).
Table I
Accelerated Storage Stability Results for Fuel 83-65 (unvented - mg/100 ml)
Storage Filtered Adherent Total Insolubles Conditions Sediment - Gum Duplicate Mean Std.Dev.
80°C-7 days 2.3 0.6 2.9 1.7 1.1 2.8 1.8 1.0 2 . 8 2.8 io.1
80"c-14 days 4.5 2.6 7.1 3.7 4.9 8.6 3.5 2.9 6.4
43'c-49 days 1.6 1.8 0.8
43°C-91 days 2.5 2.4 2.1
0.6 2.2 1.1 2.9 1.6 2.4
7.4 t1.1
2.5 i0.4
2.2 2.2 3.2
317
4.7 4.6 5.3 4.9 t0.4
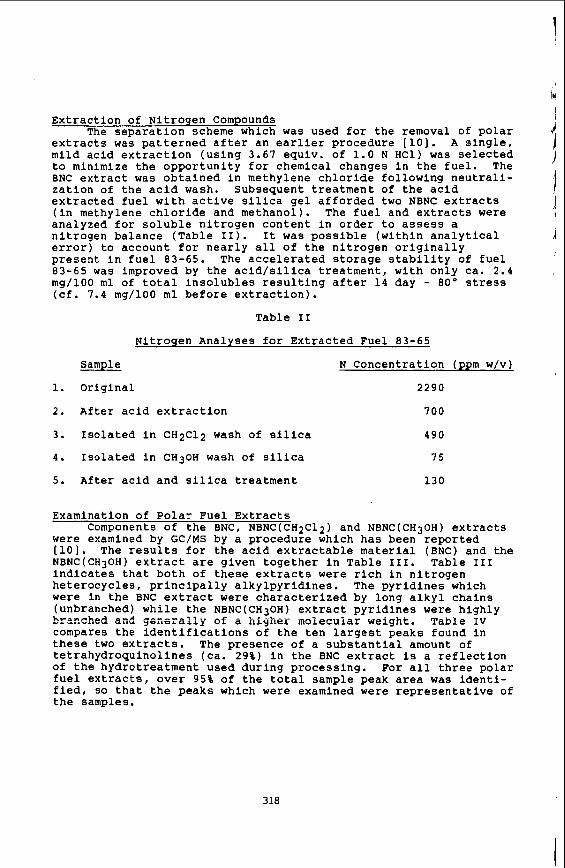
Extraction of Nitrogen Compounds The separation scheme which was used for the removal of polar
extracts was patterned after an earlier procedure [lo]. A single, mild acid ext2action (using 3.67 equiv. of 1.0 N HCl)-was selected to minimize the opportunity for chemical changes in the fuel. The BNC extract was obtained in methylene chloride following neutrali- zation of the acid wash. Subsequent treatment of the acid extracted fuel with active silica gel afforded two NBNC extracts (in methylene chloride and methanol). The fuel and extracts were analyzed for soluble nitrogen content in order to assess a nitrogen balance (Table 11). It was possible (within analytical error) to account for nearly all of the nitrogen originally present in fuel 83-65. The accelerated storage stability of fuel 83-65 was improved by the acid/silica treatment, with only ca. 2.4 mg/100 ml of total insolubles resulting after 14 day - 80" stress (cf. 7.4 mg/100 ml before extraction).
Table I1
Nitrogen Analyses for Extracted Fuel 83-65
Sample N Concentration (ppm w/v)
1. Original 2290
2. After acid extraction 700
3 . Isolated in CH2Cl2 wash of silica 490
4. Isolated in CH3OH wash of silica 75
5 . After acid and silica treatment 130
Examination of Polar Fuel Extracts
were examined by GC/MS by a procedure which has been reDorted Components of the BNC, NBNC(CH2C12) and NBNC(CH30H) extracts
[lo]. The resuits for the acid extractable material ( B k ) and the NBNC(CH30H) extract are given together in Table 111. Table I11 indicates that both of these extracts were rich in nitrogen heterocycles, principally alkylpyridines. The pyridines which were in the BNC extract were characterized by long alkyl chains (unbranchecl) while the NBNC(CH30H) extract pyridines were highly brzzche8 anc? geileially a f d higlier moiecuiar weight. Table IV compares the identifications of the ten largest peaks found in these two extracts. The presence of a substantial amount of tetrahydroquinolines (ca. 29%) in the BNC extract is a reflection of the hydrotreatment used during processing. For all three polar fuel extracts, over 95% of the total sample peak area was identi- fied, so that the peaks which were examined were representative of the samples.
318
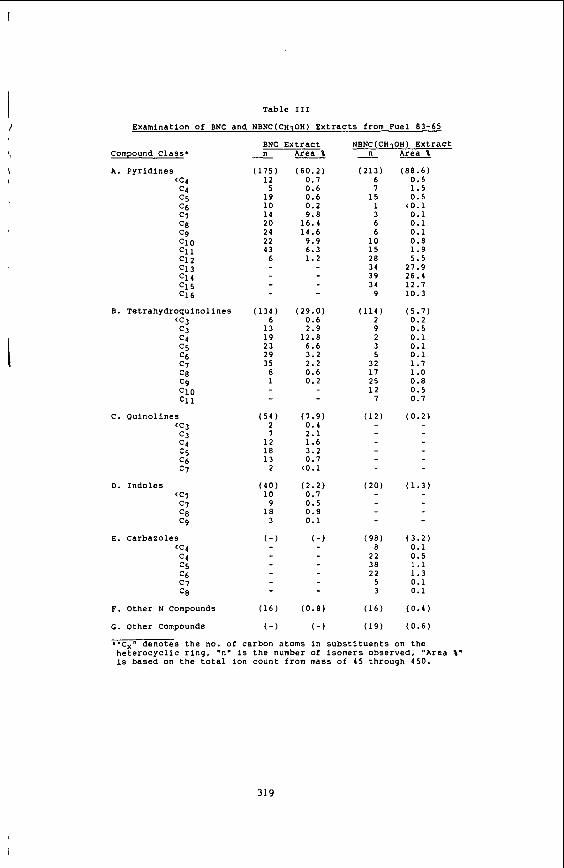
Table I11
Examination Of BNC and NBNC(CH1OH) Extracts from Fuel 83-65
Compound Class'
A. Pyridines (C4 c4 c5 c6 C7 C8 C9 e10 c11 c12 c1 3 c14 c15 c16
B. Tetrahydroquinolines (C3 c3 c4 c5 c6 c7
Tetrahydroquinolines (C3 c3 c4 c5 c6 c7
C. Quinolines <e3 c3 c4 c5 c6 c7
<C7 c7 C8 C9
(C4 c4 c5 c6 c7 C8
D. Indoles
E. Carbazoles
F. other N Compounds
G. other compounds
n
(175) 12 5
19 10 14 20 24 22 43 6
-
(134) 6
13 19 23 29 35
8 1
( 5 4 ) 2 7 12 18 13 2
(40) 10 9
18 3
( - )
(16)
( - )
BNC Extract NBNC(CH1OH) Extract n m
(60.2) (213) 0.7 6 0.6 7 0.6 15 0.2 1 9.8 3
16.4 6 14.6 6 9.9 10 6.3 15 1.2 28
34 39 34 9
(29.0) (114) 0.6 2 2.9 9
12.8 2 6.6 3 3.2 5 2.2 32 0.6 17 0.2 25
12 7
(7.9) (12) 0.4 2.1 1.6 3.2 0.7 (0.1
(2.2) (20) 0.7 0.5 0.8 0.1
( - ) (98) 8
22 38 22 5 3
(0.8) (16)
( - 1 (19)
(88.6) 0.6 1.5 0.6 (0.1 0.1 0.1 0.1 0.8 1.9 5.5
27.9 26.4 12.7 10.3
(5.7) 0.2 0.5 0.1 0.1 0.1 1.7 1.0 0.8 0.5 0.7
(0.2)
(1.3)
(3.2) 0.1 0.5 1.1 1.3 0.1 0.1
(0.4)
(0.6)
+*CX" denotes the no. of carbon atoms in substituents on the heterocyclic ring, "n" is the number of isomers observed, "Area 8" is based on the total ion count from mass of 45 through 450.
319
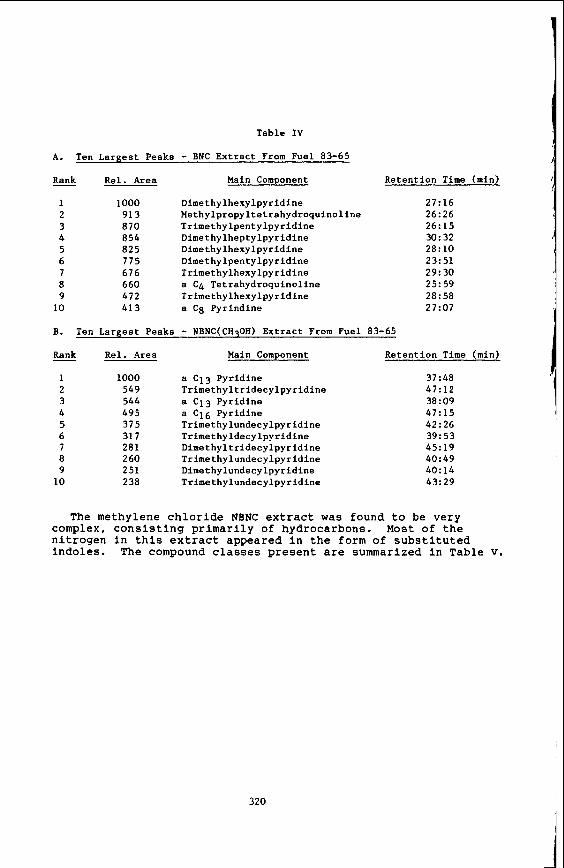
Table IV
A. Ten Largest Peaks - BNC Extract From Fuel 83-65 Rank Rel. Area Main Component
1 2 3 4 5 6 7 8 9 10
1000 91 3 870 854 825 775 676 660 472 41 3
Dimethylhexylpyridine Methylpropyltetrahydroquinoline Trimethylpentylpyridine Dimethylheptylpyridine Dimethylhexylpyridine Dimethylpentylpyridine Trimethylhexylpyridine a C4 Tetrahydroquinoline Trimethylhexylpyridine a C8 Pyrindine
Retention Time (min)
27:16 26:26 26:15 30: 32 28:lO 23: 51 29: 30 25: 59 28:58 27:07
B. Ten Largest Peaks - NBNC(CHq0H) Extract From Fuel 83-65
Rank Rel. Area Main Component Retention Time (min) - 1 2 3 4 5 6 7 8 9
10
1000 549 544 495 375 31 7 281 2 60 251 238
a C13 Pyridine Trimethyltridecylpyridine a C13 Pyridine a c16 Pyridine Trimethylundecylpyridine Trimethyldecylpyridine Dimethyltridecylpyridine Trimethylundecylpyridine Dimethylundecylpyridine Trimethylundecylpyridine
37:48 47:12 38 : 09 47:15 42: 26 39:53 45:19 40:49 40: 14 43:29
The methylene chloride NBNC extract was found to be very complex, consisting primarily of hydrocarbons. Most of the nitrogen in this extract appeared in the form of substituted indoles. The compound classes present are summarized in Table V.
320
i
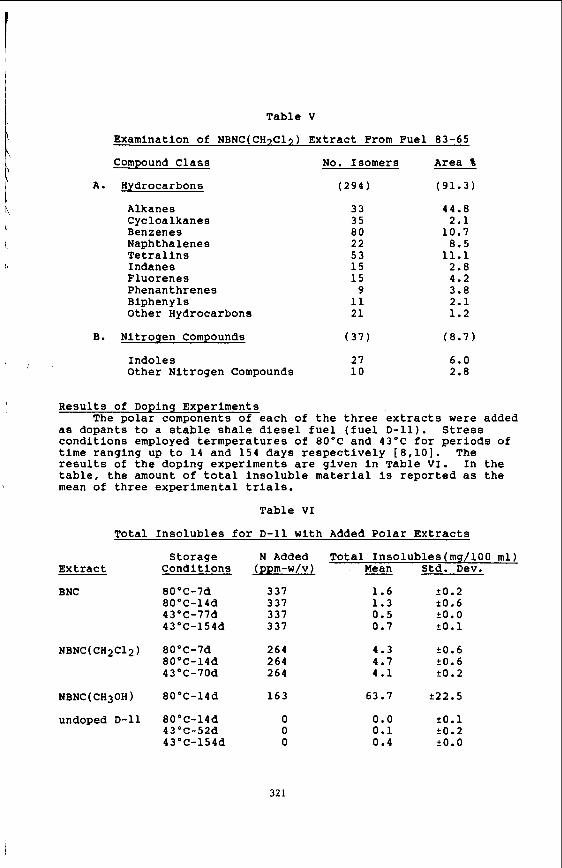
Table V
Examination of NBNC(CH7C17) Extract From Fuel 83-65
Compound Class No. Isomers Area %
A. Hydrocarbons
Alkanes Cycloalkanes Benzenes Naphthalenes Tetralins Indanes Fluorenes Phenanthrenes Biphenyls Other Hydrocarbons
B. Nitrogen Compounds
(294)
33 35 80 22 53 15 15 9
11 21
(37)
I ndo 1 e s 27 Other Nitrogen Compounds 10
(91.3)
44.8 2.1
10.7 8.5
11.1 2.8 4.2 3.8 2.1 1.2
(8.7)
6.0 2.8
Results of Doping Experiments
as dopants to a stable shale diesel fuel (fuel D-11). Stress conditions employed temperatures of 8OoC and 43'C for periods of time ranging up to 14 and 154 days respectively [8,10]. The results of the doping experiments are given in Table VI. In the table, the amount of total insoluble material is reported as the mean of three experimental trials.
The polar components of each of the three extracts were added
Table VI
Total Insolubles for D-11 with Added Polar Extracts
Extract
BNC
NBNC(CH30H)
undoped D-11
Storage N Added Total Insolubles(mg/lOO ml) Conditions (pgm-w/v) - Mean Std. Dev.
80°C-7d 337 1.6 k0.2 80 "C-146 337 1.3 20.6 43°C-778 337 0.5 kO.0 43OC-1546 337 0 . 1 20.1
80°C-78 264 8OoC-14d 264 43OC-7Od 264
4.3 k 0 . 6 4.7 k 0 . 6 4.1 k0.2
80°C-14d 163 63.7 222.5
80°C-14d 0 43 OC-52d 0 43°C-1546 0
0.0 20.1 0.1 20.2 0.4 kO.0
32 1
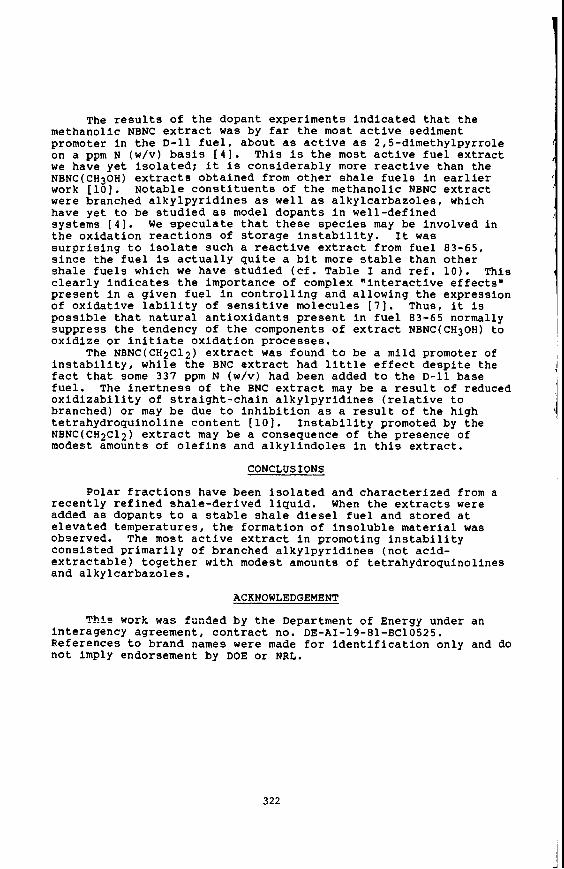
The results of the dopant experiments indicated that the methanolic NBNC extract was by far the most active sediment promoter in the D-11 fuel, about as active as 2,5-dimethylpyrrole on a ppm N (w/v) basis [4]. This is the most active fuel extract we have yet isolated; it is considerably more reactive than the NBNC(CH30H) extracts obtained from other shale fuels in earlier work [lo]. Notable constituents of the methanolic NBNC extract were branched alkylpyridines as well as alkylcarbazoles, which have yet to be studied as model dopants in well-defined systems [ 4 ] . We speculate that these species may be involved in the oxidation reactions of storage Instability. It was surprising to isolate such a reactive extract from fuel 83-65, since the fuel is actually quite a bit more stable than other shale fuels which we have studied (cf. Table I and ref. 10). This clearly indicates the importance of complex "interactive effects" present in a given fuel in controlling and allowing the expression of oxidative lability of sensitive molecules [7]. Thus, it is possible that natural antioxidants present in fuel 83-65 normally suppress the tendency of the components of extract NBNC(CH30H) to oxidize or initiate oxidation processes.
The NBNC(CH2Cl2) extract was found to be a mild promoter of instability, while the BNC extract had little effect despite the fact that some 337 ppm N (w/v) had been added to the D-11 base fuel. The inertness of the BNC extract may be a result of reduced oxidizability of straight-chain alkylpyridines (relative to branched) or may be due to inhibition as a result of the high tetrahydroquinoline content [lo]. Instability promoted by the NBNC(CH2C12) extract may be a consequence of the presence of modest amounts of olefins and alkylindoles in this extract.
CONCLUSIONS
Polar fractions have been isolated and characterized from a recently refined shale-derived liquid. When the extracts were added as dopants to a stable shale diesel fuel and stored at elevated temperatures, the formation of insoluble material was observed. The most active extract in promoting instability consisted primarily of branched alkylpyridines (not acid- extractable) together with modest amounts of tetrahydroquinolines and alkylcarbazoles.
ACKNOWLEDGEMENT
This w ~ r k m s funded by the Department or' Energy under an interagency agreement, contract no. DE-AI-19-81-BC10525. References to brand names were made for identification only and do not imply endorsement by DOE or NRL.
322
LITERATURE CITED
(1) Frankenfeld, J.W., Taylor, W.F. and Brinkman, D.W., U.S.
(2) Frankenfeld, J.W., Taylor, W.F. and Brinkman, D.W., Ind. Eng.
(3) Goetzinger, J.W., Thompson, C.J. and Brinkman, D.W., U . S .
Department of Energy Report No. DOE/BC/10045-12 (1981).
Chem. Prod. Res. Dev., 2, 608, 615, 622 (1983).
Department of Energy Report No. DOE/BETC/IC-83/3 (1983).
- 2, 395 (1984). (5) Dahlin, K.E., Daniel, S . R . and Worstell, J.H., Fuel, 60, 477
(1981); Worstell, J.H. and Daniel, s.R., Fuel, 60, 48i- (1981); Worstell, J.H., Daniel, S.R. and Frauenhoff, G., Fuel, 60, 485 (1981).
( 6 ) Frankenfeld, J.W., Taylor, W.F. and Brinkman, D.W., U.S. Department of Energy Report No. DOE/BC/10045-23 (1982).
(7) Cooney, J.V., Beal, E.J. and Beaver, B.D., Preprints, Div. of Fuel Chem., ACS, 30, in press (1985).
(8) Cooney, J.V., Beal, E.J. and Hazlett, R.N., Preprints, Div. of Petro. Chem., ACS, 28, 1139 (1983).
(9) Cooney, J.V., Beal, E.J., Wechter, M.A., mushrush, G.W. and Hazlett, R.N., Preprints, Div. of Petro. Chem., ACS, 29, 1003 (1984).
I\ (4) Cooney, J.V., Beal, E.J. and Hazlett, R.N., Liq. Fuels Tech.,
t
(10) Cooney, J.V., Beal, E.J. and Hazlett, R.N., Preprints, Div.
(11) Cooney, J.V., Beal, E.J. and Hazlett, R.N., Ind. Eng. Chem.
(12) Thompson, L.F. and Holmes, S.A., Fuel, 64, 9 (1985).
of Petro. Chem., ACS, 29, 247 (1984).
Prod. Res. Dev., in press (1985).
323
CALORIMETRIC DETERMINATION OF THE HEATS OF RETORTING GREEN R I V E R AND RUNDLE OIL SHALES TO 5DOOC AND OF
THE HEAT OF COMBUSTION OF SPENT GREEN R I V E R SHALE AT 705OC
Stephen C. Mraw and Charles F. Keweshan
Exxon Research and Engineer ing Co. C l i n t o n Township, Annandale, New Jersey 08801
INTRODUCTION
Two impor tan t cons idera t ions f o r t h e f u t u r e p roduc t ion o f o i l from shale are So l ids hand l i ng and heat management. For a resource y i e l d i n g about 90 a/tonne , two tonnes o f rock must be handled f o r each b a r r e l o f o i l pro- duced, and l a r g e q u a n t i t i e s o f heat must be supp l ied or removed f o r t h e high- temperature processes invo lved. Proper reac to r design and e f f i c i e n t process operat ions requ i re accura te en tha lpy da ta f o r r e t o r t i n g raw shale and combust- i n g spent shale. It i s p a r t o f our program i n high-temperature ca lo r ime t ry t o develop novel techniques f o r o i l -shale measurements and t o p rov ide accurate enthalpy da ta f o r sha les o f commercial i n t e r e s t . I n previous papers, we have descr ibed a new method f o r de termin ing t h e en tha lpy o f vapor i za t i on o f organic ma te r ia l s a t h igh temperatures ( l ) , demonstrated t h e a p p l i c a t i o n o f t h i s method t o o i l - s h a l e systems (2), and g iven a complete s e t o f r e s u l t s f o r t h e heat o f r e t o r t i n g raw Colorado Green R ive r and A u s t r a l i a n Rundle o i l shales t o 500°C ( 3 ) . I n t h e present paper we present new r e s u l t s f o r t h e heat o f com- bus t i on o f spent Green R ive r shales a t 705OC.
EXPERIMENTAL METHOD
Our apparatus i s t h e high-temperature Calvet- type ca lo r ime te r de- sc r i bed p rev ious l y (4 ) . B r i e f l y , it cons is t s o f a c e n t r a l incone l b lock sur- rounded by a furnace designed f o r opera t ion from room temperature t o 1000°C. Wi th in the b lock a re two symmet r ica l l y mounted w e l l s which serve as sample chambers. Each we l l i s surrounded by a m u l t i - j u n c t i o n thermop i le which moni- t o r s the temperature d i f f e r e n c e between t h e we l l and t h e b lock . When any process w i t h i n t h e sample chamber absorbs o r l i b e r a t e s heat, t he thermopi le s igna l observed i s p ropor t i ona l t o t h e heat flew between the chamber and the b lock . The t w i n thermop i les are w i red i n oppos i t i on so t h a t a d i f f e rence reading i s obtained f o r the l e f t versus r i g h t sample chambers. A diagram of t h e apparatus i s shown i n F igure 1.
Most o f t h e experiments t o be descr ibed a re "drop" experiments. A qua r t z o r ceramic tube w i t h i n t h e sample chamber i s con t inuous ly swept w i th Gas (ni t rngen c r oxygen, depending on t h e exper iment) , and a sample i s droppea from room temperature i n t o t h e r e c e i v i n g tube a t t h e h igh temperature o f the ca lo r ime te r . A peak i n t h e thermop i le s igna l records the t o t a l heat necessary t o b r i n g the sample f rom room temperature t o i t s f i n a l s t a t e a t h i g h tempera- tu re . The area o f t he peak i s d i r e c t l y p ropor t i ona l t o t h e t o t a l heat.
+a/tonne = 4.174 U.S. g a l / t o n
324
I n t h e case o f samples dropped i n t o n i t rogen, we have developed a novel method f o r de termin ing t h e heat necessary f o r r a p i d vapor i za t i on pro- cesses i n t h e ca lo r ime te r (1). When a sample o f an organic compound, o r of a Complex mix tu re , i s dropped i n t o the ca lo r ime te r a t a temperature where evapo- r a t i o n o r b o i l i n g i s rap id , a l l processes can be completed w i t h i n the t ime constant of t h e ca lo r ime te r (about 2 t o 3 minutes). The ca lo r ime te r thermo- p i l e then responds " b a l l i s t i c a l l y " , and t h e peak he igh t (as w e l l as the more t r a d i t i o n a l peak area) i s d i r e c t l y p ropor t i ona l t o t h e o t a l heat t r a n s f e r r e d t o the sample. I n Reference 2 we showed t h a t t h e method was accura te beyond Pure compounds and cou ld be used t o determine t h e heats associated w i t h o i l - shale processes. Resu l ts on Green R ive r o i l sha le f o r t h e t o t a l en tha lpy change
raw shale (25OC) + spent shale + v o l a t i l e s (5OOOC) 1)
agreed very we l l w i t h those from an e a r l i e r study us ing an e n t i r e l y d i f f e r e n t technique (5 ) .
I n a d d i t i o n , t h i s experiment f o r a complex m a t e r i a l such as o i l shale presents an oppor tun i t y t o study t h e phys ica l chemistry o f t h e associ- ated processes. When a sample i s dropped i n t o h i g h temperature, some processes may be completed w i t h i n t h e response t ime o f t h e ca lo r imeter , and o ther processes may take longer. The peak-height value w i l l accu ra te l y repre- sent t h e heat f o r t h e r a p i d processes, w h i l e t h e peak-area va lue w i l l repre- sent t he t o t a l heat f o r a l l o f t he processes u n t i l t h e ca lo r ime te r re tu rns t o equ i l i b r i um (about 1.5 t o 2.5 hours). Al though comparison o f t h e peak-height and peak-area values f o r each run nomina l l y d i s t i ngu ishes rap id vs. slower processes, t h i s can sometimes a l l ow a d i s t i n c t i o n between organ ic and i n - organic con t r i bu t i ons . I n Reference 3, we presented r e s u l t s f o r two complete s i n k - f l o a t s e r i e s o f r a w shales, Colorado Green R ive r and A u s t r a l i a n Rundle. The enthalpy q u a n t i t i e s f o r equat ion 1 were accu ra te l y determined, and the comparison o f peak-height and peak-area values showed t h e importance o f slower inorgan ic processes occu r r i ng i n the Rundle shales a t 500°C.
C a l i b r a t i o n o f t h e c a l o r i m e t r i c s e n s i t i v i t y , bo th f o r endo- and exothermic events, i s in te rspersed repeated ly among t h e ac tua l shale exper i - ments. For endothermic drops i n t o n i t rogen, the c a l o r i m e t r i c s e n s i t i v i t y i s determined by dropping samples o f wAl O3 i n t o t h e ca lo r ime te r and record ing bo th t h e he igh t and area o f t h e resu?lting peak. From t h e known enthalpy change (6) o f A1 O3 between room temperature and t h e ca lo r ime te r temperature, both a peak-heiggt and a peak-area c a l i b r a t i o n constant a re ca l cu la ted . For exothermic combustion experiments, t he c a l o r i m e t r i c s e n s i t i v i t y i s determined us ing a c a l i b r a t i o n heater wound onto t h e ceramic tube which serves as the gas d e l i v e r y i n l e t . A heat pu lse i s generated us ing a p r e c i s i o n power supply, and
, t he t o t a l heat i s c a l c u l a t e d from t h e known vo l tage and the measured re - s i stance.
OIL-SHALE SAMPLES
The raw Green R ive r o i l - s h a l e samples are from t h e s i n k - f l o a t sepa- r a t i o n procedures devel oped a t Exxon Research and Engi neer i ng Company i n Baytown, Texas (7 ) . They are t h e same as those used i n our r e t o r t i n g s tud ies ( 3 ) and are from t h e Mahogany Zone (Colony Mine) , rang ing from 87 t o 340 a/tonne (21 t o 82 U.S. g a l / t o n ) Fischer Assay. Compositional de ta i l s , inc lud-
325
i n g minera l analyses, have been given by Vadovic ( 7 ) . The powdered shale sam- p l e s were d r i e d i n our l a b o r a t o r y over a P20 desiccant t o remove surface mo is tu re and l o o s e l y h e l d water. Occasional d e c k s have i n d i c a t e d t h a t t h i s process removes an amount o f water comparable t o t h a t removed by d r y i n g a t 105OC.
COMBUSTION OF SPENT GREEN R I V E R SHALE AT 705OC
Combustion o f Model Carbonaceous Ma te r ia l s
The e l e c t r i c a l c a l i b r a t i o n procedure o u t l i n e d e a r l i e r determines the c a l i b r a t i o n cons tan t f o r t h e r e l a t i v e l y " s t e r i l e " procedure o f a c o n t r o l l e d e l e c t r i c a l power i n p u t w i t h i n t h e thermop i le reac t i on zone. To determine whether t h i s constant i s app l i cab le t o a v igo rous l y combusting organic sample a t h igh temperature, we performed several chemical checks us ing model combus- t i ons.
A t 75OoC, we measured t h e heat o f combustion o f SP-1 g raph i te (8 ) . I n our f i r s t exper iments, us ing d r y oxygen, t h e heat o f combustion values were w ide ly sca t te red and i n v a r i a b l y low w i t h respec t t o t h e l i t e r a t u r e va lue f o r g r a p h i t e (9 ) . We suspected incomplete combustion of carbon monoxide, and, when we humid i f i ed the oxygen by bubb l ing i t through l i q u i d water a t room temperature ( l o ) , t h e combustion values immediately improved t o w i t h i n 3 t o 4 percent o f t he l i t e r a t u r e value. By a d j u s t i n g t h e gas f l o w r a t e t o change the residence t ime o f gases i n t h e r e a c t i o n zone, we even tua l l y ob ta ined an accu- racy o f 1 t o 2 percent . Thus, a l l subsequeni combustions o f shale samples used humidi fed oxygen a t a f l o w r a t e o f 20 cm /min. Fu r the r tes ts , bo th a t 705 and 750'C. were made by combusting the highly-porous amorphous carbon, spherocarb ( l l ) , t o s imu la te t h e r a p i d burn ing o f a spent shale sample, and these t e s t s i n d i c a t e d t h a t t h e e l e c t r i c a l c a l i b r a t i o n constant, even when app l i ed t o a r a p i d combustion, g i ves t h e t r u e en tha lpy va lue w i t h i n a few percent.
To t e s t whether v o l a t i l e m a t e r i a l s would combust w i t h i n the thermo- p i l e zone under our cond i t i ons , we dropped samples o f heavy, pure aromat ic compounds d i r e c t l y i n t o t h e oxygen stream i n t h e ca lo r ime te r a t 705OC. We used 1,2,5,6-dibenzanthracene ( t b = 524OC) and coronene ( t b = 525OC), and sample s izes (about 2 t o 3 mg) w8re chosen t o s imu la te the ankunt o f organic t h a t might v o l a t i l i z e from a spent sha le sample. Even though combustion was no t complete (60 t o 90 percent o f t h e expected en tha lpy) , we concluded t h a t , if our system was t h i s e f f i c i e n t i n combusting these r e f r a c t o r y molecules, we cou ld expect v o l a t i l e m a t e r i a l s evo lv ing from a spent shale t o be combusted as we1 1.
Prepara t ion o f Spent Shales
P e l l e t s o f each raw shale were pyro lyzed i n a thermogravimetr ic ana lyser (TGA) t o 5OOaC a t hea t ing ra tes o f 50 t o 100°C/min and he ld f o r 20 minutes. Most o f the p e l l e t s cou ld be recovered i n t a c t f r o m the TGA and used fo r subsequent experiments. For p e l l e t s o f t h e two r i c h e s t samples, however, t he re was cons iderab le s w e l l i n g and cracking, o f t e n causing mechani- c a l l o s s of some o f t h e ma te r ia l . These p e l l e t s had t o be h e l d i n go ld cruc- i b l e s du r ing the TGA runs and i n subsequent ca lo r ime t ry experiments. To check t h a t t h e TGA purge gas was reasonably f r e e o f oxygen, occasional samples were
326
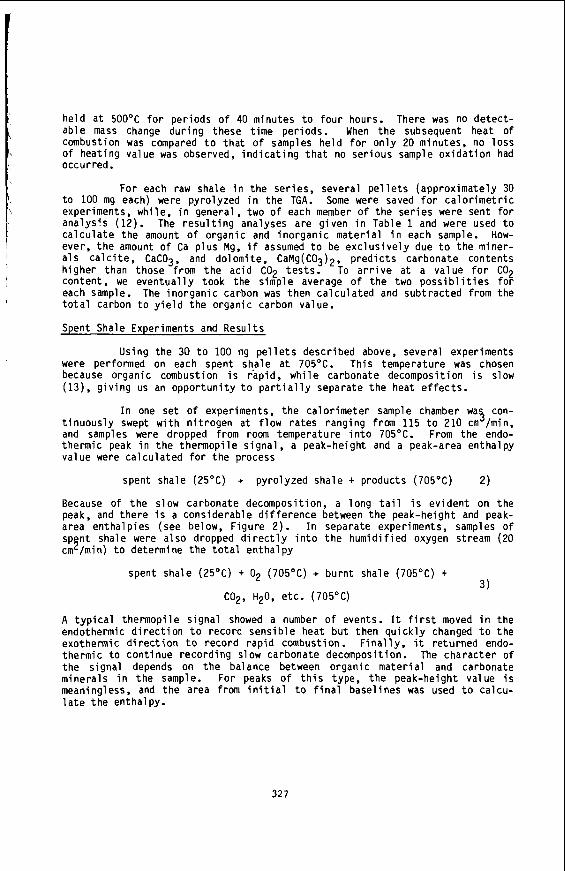
he ld a t 5OOOC f o r per iods o f 40 minutes t o f o u r hours. There was no de tec t - ab le mass change du r ing these t ime per iods. When t h e subsequent heat of combustion was compared t o t h a t of samples he ld f o r o n l y 20 minutes, no l o s s of heat ing value was observed, i n d i c a t i n g t h a t no ser ious sample o x i d a t i o n had occurred.
For each raw shale i n the ser ies , several p e l l e t s (approx imate ly 30 t o 100 mg each) were pyro lyzed i n t h e TGA. Some were saved f o r c a l o r i m e t r i c experiments, whi le, i n general, two o f each member o f t h e se r ies were sent f o r ana lys i s (12). The r e s u l t i n g analyses are g iven i n Table 1 and were used t o c a l c u l a t e the amount o f organic and ino rgan ic ma te r ia l i n each sample. How- ever, t h e amount o f Ca p lus Mg, i f assumed t o be e x c l u s i v e l y due t o t h e miner- a l s c a l c i t e , CaC03, and dolomite, CaMg(C03)2, p r e d i c t s carbonate contents h igher than those from t h e ac id C02 t e s t s . To a r r i v e a t a va lue f o r C02 content, we even tua l l y took the s imple average o f t h e two p o s s i b l i t i e s f o r each sample. The ino rgan ic carbon was then ca l cu la ted and subt rac ted from the t o t a l carbon t o y i e l d t h e organic carbon value.
Spent Shale Experiments and Resu l ts
Using the 30 t o 100 mg p e l l e t s descr ibed above, several experiments were performed on each spent sha le a t 705OC. Th is temperature was chosen because organic combustion i s rap id , w h i l e carbonate decomposition i s slow (13), g i v i n g us an oppor tun i t y t o p a r t i a l l y separate t h e heat e f f e c t s .
I n one se t o f experiments, t h e ca lo r ime te r sample chamber wa3 con- t i n u o u s l y swept w i t h n i t rogen a t f l ow ra tes ranging from 115 t o 210 cm /min, and samples were dropped from room temperature i n t o 705OC. From the endo- thermic peak i n t h e thermop i le s igna l , a peak-height and a peak-area enthalpy va lue were ca l cu la ted f o r t h e process
spent shale (25OC) + pyro lyzed sha le + products (705OC) 2)
Because o f t h e slow carbonate decomposition, a l ong t a i l i s ev iden t on the peak, and the re i s a cons iderab le d i f f e r e n c e between t h e peak-height and peak- area en tha lp ies (see below, F igure 2) . I n separate experiments, samples o f sp n t shale were a l so dropped d i r e c t l y i n t o t h e humid i f i ed oxygen stream (20
spent shale (25OC) + O2 (705OC) + bu rn t shale (705OC) +
cm E /min) t o determine t h e t o t a l en tha lpy
3) C02, H20, e tc . (705OC)
A t y p i c a l thermop i le s igna l showed a number o f events. It f i r s t moved i n the endothermic d i r e c t i o n t o record sens ib le heat bu t then q u i c k l y changed t o t h e exothermic d i r e c t i o n t o record r a p i d combustion. F i n a l l y , it re turned endo- thermic t o cont inue record ing slow carbonate decomposition. The charac ter o f t h e s igna l depends on t h e balance between organic ma te r ia l and carbonate minera ls i n t h e sample. For peaks o f t h i s type, t h e peak-height value i s meaningless, and the area from i n i t i a l t o f i n a l base l ines was used t o calcu- l a t e t h e enthalpy.
32 7
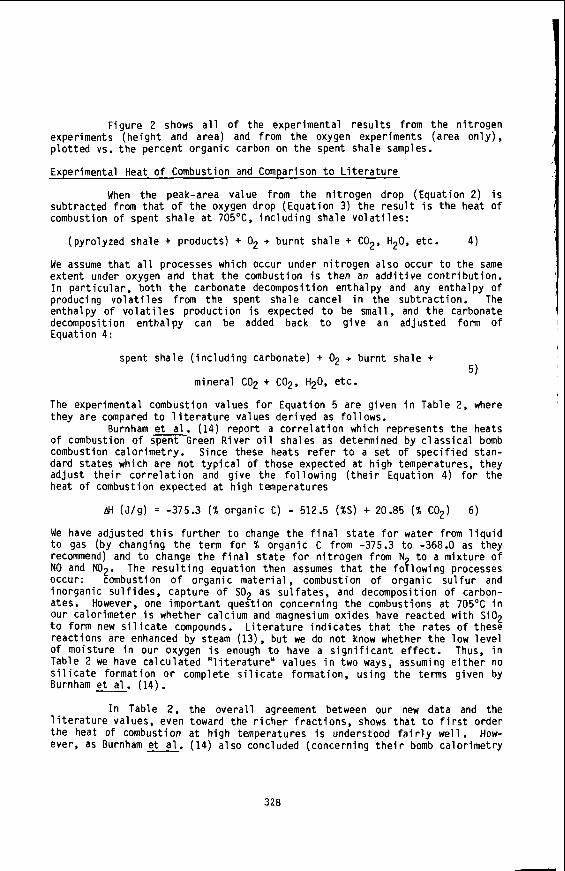
Figure 2 shows a l l o f t h e exper imental r e s u l t s from t h e n i t rogen experiments (he igh t and area) and from t h e oxygen experiments (area on ly ) , p l o t t e d vs. t h e percent o rgan ic carbon on t h e spent shale samples.
Experimental Heat o f Combustion and Comparison t o L i t e r a t u r e
When the peak-area value from t h e n i t r o g e n drop (Equat ion 2) i s subtracted from t h a t o f t h e oxygen drop (Equat ion 3) t h e r e s u l t i s t he heat o f combustion of spent sha le a t 705"C, i n c l u d i n g shale v o l a t i l e s :
(pyro lyzed shale + products) + O2 + b u r n t shale + C02, H20, etc. 4)
We assume t h a t a l l processes which occur under n i t r o g e n a l so occur t o t h e same ex ten t under oxygen and t h a t t h e combustion i s then an a d d i t i v e c o n t r i b u t i o n . I n p a r t i c u l a r , both t h e carbonate decomposition en tha lpy and any enthalpy o f producing v o l a t i l e s from t h e spent shale cancel i n t h e sub t rac t i on . The en tha lpy of v o l a t i l e s p roduc t ion i s expected t o be small, and t h e carbonate decomposition en tha lpy can be added back t o g i v e an ad jus ted form o f Equat ion 4:
spent sha le ( i n c l u d i n g carbonate) + 02 + bu rn t shale +
minera l C02 + CO2, H20, etc.
The experimental combustion values f o r Equat ion 5 a re g iven i n Table 2, where they a re compared t o l i t e r a t u r e values de r i ved as fo l l ows .
Burnham e t a l . (14) repo r t a c o r r e l a t i o n which represents the heats o f combustion o f s-Green R ive r o i l shales as determined by c l a s s i c a l bomb combustion ca lo r ime t ry . Since these heats r e f e r t o a se t o f s p e c i f i e d stan- dard s ta tes which are no t t y p i c a l o f those expected a t h igh temperatures, they ad jus t t h e i r c o r r e l a t i o n and g i ve the f o l l o w i n g ( t h e i r Equat ion 4) f o r the heat of combustion expected a t h igh temperatures
M ( J /g ) = -375.3 (% organic C) - 512.5 (%SI + 20.85 (% C02)
We have ad jus ted t h i s f u r t h e r t o change t h e f i n a l s t a t e f o r water from l i q u i d t o gas (by changing t h e term f o r % o rgan ic C from -375.3 t o -368.0 as they recommend) and t o change t h e f i n a l s t a t e f o r n i t r o g e n from N t o a m ix tu re o f NO and NO2. The r e s u l t i n g equat ion then assumes t h a t t h e fo? lowing processes occur: combustion o f o rgan ic m a t e r i a l , combustion o f o rgan ic s u l f u r and inorgan ic s u l f i d e s , cap ture o f SO2 as su l fa tes , and decomposition o f carbon- ates. However, one impor tan t quest ion concerning t h e combustions a t 705OC i n our ca lo r ime te r i s whether calc ium and magnesium oxides have reac ted w i t h Si02 t o form new s i l i c a t e compounds. L i t e r a t u r e i n d i c a t e s t h a t t he r a t e s o f these reac t ions are enhanced by steam (13), but we do no t know whether t h e low l e v e l Of mo is tu re i n our oxygen i s enough t o have a s i g n i f i c a n t e f f e c t . Thus, i n Table 2 we have c a l c u l a t e d " l i t e r a t u r e " values i n two ways, assuming e i t h e r no s i l i c a t e format ion o r complete s i l i c a t e format ion, us ing t h e terms given by Burnham et. (14).
I n Table 2, the o v e r a l l agreement between our new data and the l i t e r a t u r e values, even toward the r i c h e r f r a c t i o n s , shows t h a t t o f i r s t order t h e heat of combustion a t h igh temperatures i s understood f a i r l y we l l . How- ever, as Burnham e t a l . (14) a l s o concluded (concerning t h e i r bomb ca lo r ime t ry
5)
6)
' I
328
1.
I \ o ther .
r e s u l t s ) , t he re are impor tan t quest ions remaining, p a r t i c u l a r l y on the r o l e of
d e f i n i t i v e statement on t h e occurrence o f s i l i c a t e reac t ions i n our c a l o r i - meter, s ince some of t he p o i n t s i n Table 2 support one assumption and some the
\ mineral reac t ions . For example, t he exper imental s c a t t e r does no t permit a
CONCLUSION \
High-temperature Calvet ca lo r ime t ry i s a powerful means o f de ter - m in ing accurate en tha lpy values f o r o i l shale processes a t h igh temperatures, us ing very small samples (50 t o 200 mg). By us ing samples from s i n k - f l o a t separa t ion procedures (7 ) , a wide range o f o rgan ic and ino rgan ic c o n t r i b u t i o n s can be studied. I n a previous paper (3 ) , values f o r the heat o f r e t o r t i n g Green R ive r o i l shales t o 5OOOC have been extended beyond t h e o i l y i e l d s p rev ious l y studied (5,15), and t h e f i r s t accurate values f o r Rundle shales were determined. To our knowledge, t h e present study a l s o represents the f i r s t attempt t o measure heats o f combustion o f spent shales i n a high-temper- a t u r e ca lo r imeter ( i .e. o the r than by d i f f e r e n t i a l scanning c a l o r i m e t r y o r d i f f e r e n t i a l thermal ana lys i s ) . Resu l ts f o r spent Green R ive r o i l shales a t 705OC agree reasonably we l l w i t h those de r i ved from c l a s s i c a l bomb calo- r ime t ry , bu t t he re are impor tan t quest ions remaining on t h e c o n t r i b u t i o n s o f mineral reac t ions t o the enthalpy.
ACKNOWLEDGEMENT
We thank Charles J. Vadovic f o r p rov id ing us w i t h t h e valuable se r ies o f s i n k - f l o a t samples and t h e many col leagues a t Exxon who have o f f e r e d va luab le comments and suggestions du r ing the course o f t h i s work.
REFERENCES
1. Mraw, S . C.; Keweshan, C. F. J . Chem. Thermodynamics 1984, 16, 873. 2. Mraw, S . C.; Keweshan, C. F. Ind. En . Chem., Fundamentals 1985, i n
(See also, AIChE Spr ing # a t i % a l Meeting, May 20-23, 1984. press. . - - . - Anaheim, C a l i f o r n i a , USA.)
Mraw, S. C.; Kleppa, 0. J. J. Chem. Thermodynamics984, 16, 865.
Report o f I n v e s t i g a t i o n 7482.
ed. NSRDS-NBS 37: U.S. Government P r i n t i n g O f f i ce , Washinton, DC 1971. Vadovic, C. J. Prepr. h. Chem. SOC. Div. Fuel. Chem. 1983, 28 (3 ) ,148 . Union Carbide Corporat ion, Carbon Products D i v i s i o n , New York, New York.
namics o f Or an ic Compounds, Wiley: New York, 1969. va luab le suggestion.
3. Mraw, S . C.; Keweshan, C. F., paper submit ted t o Fuel. 4. 5. Wise, R. L.; M i l l e r , R. C.; Sohnr, H. W., U.S. Bureau o f Mines, 1971, 6. JANAF Thermochemical Tables. S t u l l , D . R.; Prophet, H., d i r e c t o r s . 2nd
7. 8. 9 . S t u l l , 0. R.) Westrum; E. F., Jr.; Sinke, G. C., The Chemical Thermody-
10. We thank Jam& E. Hardy o f t h i s l abo ra to ry f o r 11. Analabs, Inc., 80 Republ ic Or., Nor th Haven, Connect icut 06473. 12. Ga lb ra i th Labora tor ies , Inc., P. 0. Box 4187, Knoxv i l l e , TN 37921. 13. Burnham, A. K.; S tubb le f i e ld , C. T.; Campbell, J . H. Fuel 1980, 59, 871. 14. Burnham, A. K.; Crawford, P. C.; Carley, J. F. Ind. Eng. Chem. Process
15. Carley, J . F., Lawrence Livermore Nat iona l Laboratory, p r i v a t e communi- Des. Dev. 1982, 21, 485.
ca t ion , t o be published.
329
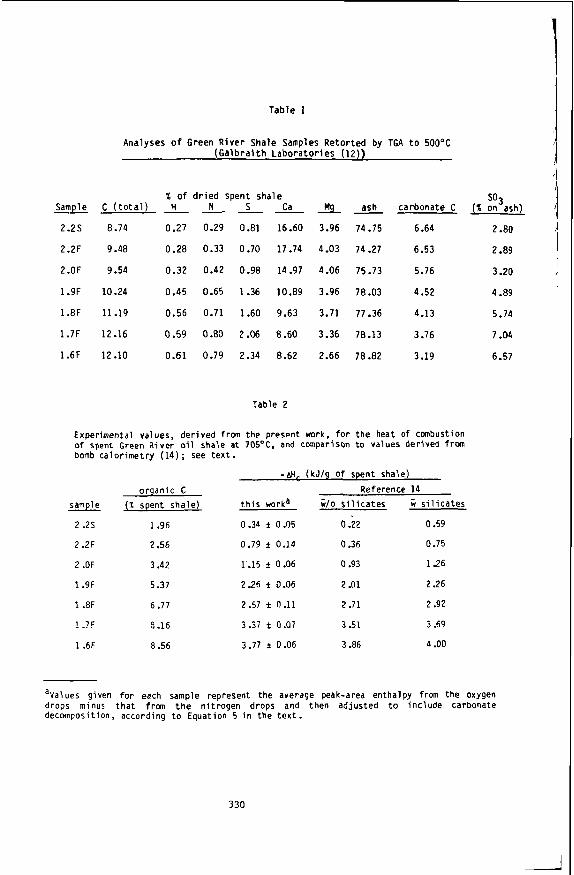
Tab le 1
I
I
/
Analyses o f Green R i v e r Shale Samples R e t o r t e d by TGA t o 50OOC ( G a l b r a i t h L a b o r a t o r i e s (12))
so3 Sample C ( t o t a l ) H N S Ca 5 ash carbonate C ( X on ash) % o f d r i e d spent sha le
2.25 8.74 0.27 0.29 0.81 16.60 3.96 74.75 6.64
2.2F 9.48 0.28 0.33 0.70 17.74 4.03 74.27 6.53
2.0F 9.54 0.32 0.42 0.98 14.97 4.06 75.73 5.76
1.9F 10.24 0.45 0.65 1.36 10.89 3.96 78.03 4.52
1.8F 11.19 0.56 0.71 1.60 9.63 3.71 77.36 4.13
1.7F 12.16 0.59 0.80 2.06 8.60 3.36 78.13 3.76
1.6F 12.10 0.61 0.79 2.34 8.62 2.66 78.82 3.19
Table 2
Exper imental values, de r i ved from the present work, f o r t h e heat of combustion of spent Green R ive r o i l sha le a t 705OC, and comparison t o values der ived from bomb ca lo r ime t ry (14) ; see t e x t .
-AH- ( k J l g of spent shale)
o rgan ic C Reference 14 sample ( % spent sha le ) t h i s worka n / O s i l i c a t e s w s i l i c a t e s
2 .25 1.96 0.34 f 0.05 0 2 2 0.59
2.2F 2.56 0.79 f 0.14 0.36 0.75
2 .OF 3.42 1'.15 f 0.06 0 .93 1.26
1 .9F 5.37 2.26 f 0.06 z .ni 2 2 6
1 .8F 6 .77 2.57 f n.11 2 .71 2.92
1.7F ".I" 0 3 c 3 .3i t O.Oi 3 .51 3 -69
1 .6F 8.56 3.77 f 0.06 3.86 4 .OO
2 .EO
2 .E9
3 2 0
4.89
5.74
7.04
6.57
aValues given f o r each sample represent the average peak-area enthalpy from the oxygen drops minus t h a t from t h e n i t rogen drops and then ad jus ted t o i nc lude carbonate decomposition. according t o Equation 5 i n t he t e x t .
330
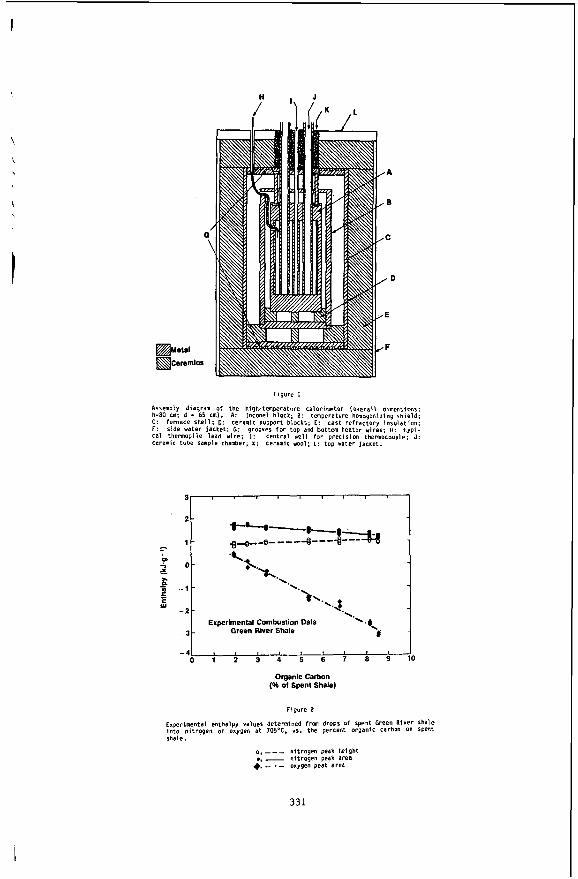
H . J
Figure 1
Assembly diagram of the high-temperature calorimeter (overall dimensions: h.80 cm; d - 65 cn). A: lnconel block; 8: temperature homogenizing shield; C: furnace s h e l l ; 0: Ceramic support blocks; E: cast re f ractory insu lat ion; F : side ua te r j ac te t ; G: grooves f o r top and b o t t m heater wires; H: t y p i - cal thermopile lead wlre; I : centra l *el l f o r prec is ion thermocouple; J: ceramic tube sample chamber; X: ceramic n o l ; 1: top water j ac te t .
-41 I I I 8 8 f * 1 I
0 1 2 3 4 5 6 7 8 9
Organic Carbon (96 01 Spent Shale)
Figure 2
Experimental enthalpy va lves detemined frw drops of spent Green River shale i n t o n i t rogen or oxygen a t 705°C. VI. the percent organic carbon on Spent shale.
0 . _ _ _ ni t rogen peak height e. - nitrogen peak area +. - - oxygen peak area
331
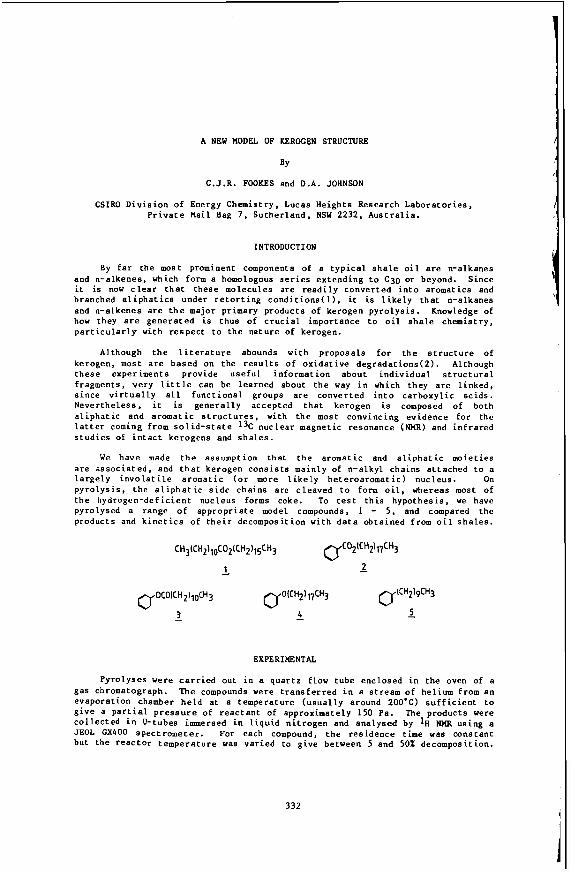
A NEW MODEL OF KEROGEN STRUCTURE
BY
C . J . R . FOOKES and D.A. JOHNSON
CSIRO Div i s ion o f Energy Chemistry. Lucaa Heights Research Labora to r i e s , P r i v a t e Mail Bag 7 , Suthe r l and , NSW 2232, A u s t r a l i a .
INTRODUCTION
By f a r t he most prominent components of a t yp ica l s h a l e o i l a r e n-alkanes and n-alkenes, which form a homologous s e r i e s ex tend ing t o C30 or beyond. Since i t i s now c l e a r t h a t t hese molecules a r e r e a d i l y converted i n t o aromatics and branched a l i p h a t i c s under r e t o r t i n g c o n d i t i o n s ( l ) , it i s l i k e l y t h a t n-alkanes and n-alkenes a r e t h e major primary products of kerogen p y r o l y s i s . Knowledge of how they a r e gene ra t ed i s thus of c r u c i a l importance t o o i l s h a l e chemistry, p a r t i c u l a r l y v i t h r e s p e c t t o t h e n a t u r e of kerogen.
Although t h e l i t e r a t u r e abounds with proposals f o r t h e s t r u c t u r e of kerogen, most a r e based on the r e s u l t s o f o x i d a t i v e deg rada t ions (2 ) . Although t h e s e experiments provide useful information about i nd iv idua l s t r u c t u r a l fragments, ve ry l i t t l e can be learned about t h e way i n which they a r e l i nked , s i n c e v i r t u a l l y a l l func t iona l groups a r e converted i n t o ca rboxy l i c ac ids . Nevertheless , i t is g e n e r a l l y accepted t h a t kerogen is composed of both a l i p h a t i c and a r o m a t i c s t r u c t u r e s , with t h e most convincing evidence fo r t he l a t t e r coming from s o l i d - s t a t e 13C n u c l e a r magnetic resonance (NMR) and i n f r a r e d s t u d i e s of i n t a c t kerogens and s h a l e s .
We have made t h e assumption t h a t t h e aromatic and a l i p h a t i c moie t i e s a r e a s s o c i a t e d , and t h a t kerogen c o n s i s t s mainly of n-alkyl chains a t t ached t o a l a r g e l y i n v o l a t i l e aromatic (or more l i k e l y he t e roa romat i c ) nucleus. On p y r o l y s i s , t h e a l i p h a t i c s i d e cha ins a r e c leaved t o form o i l , whereas most of t h e hydrogen-deficient nucleus forms coke. To t e s t t h i s hypothesis . we have pyrolysed a range o f appropr i a t e model compounds, 1 - 5, and compared the products and k i n e t i c s of t h e i r decomposition v i t h d a t a obtained from o i l s h a l e s .
EXPERIMENTAL
Pyrolyses were c a r r i e d out i n a qua r t z flow tube enclosed i n t h e oven of a gas chromatograph. The compounds were t r a n s f e r r e d i n a s t ream of helium from an evaporat ion chamber h e l d a t a temperature ( u s u a l l y around 200.C) s u f f i c i e n t t o g ive a p a r t i a l p r e s s u r e of r e a c t a n t of approximately 150 Pa. The products were c o l l e c t e d i n U-tubes immersed i n l i q u i d n i t rogen and analysed by NHR using a JEOL GX400 Spec t romete r . For each compound, t h e r e s idence t i m e was constant but t h e r e a c t o r t empera tu re was va r i ed to give between 5 and 50% decomposition.
332
\ \
A c t i v a t i o n ene rg ie s were then c a l c u l a t e d from a p l o t of l og l c v . 1/T, where X i s t h e f r a c t i o n decomposed a t temperature T ( i n K). Rate c o n s t a n t s ( k ) were Ca lcu la t ed from t h e formula k t = 2 n(1 -Y) . So l id s t a t e 13C spectroscopy was performed on a Bruker CXP300 instrument , u s ing t h e Dixon t o t a l side-band suppres s ion sequence(3) .
RESULTS AND DISCUSSION
Support fo r t h e presence of n-alkyl cha ins is gained from t h e h igh f i e l d s o l i d - s t a t e 1 3 C NMR spectrum of a Condor carbonaceous kerogen (F igu re 1. upper t r a c e ) . The lower t r a c e is t h e s o l u t i o n spectrum of a carbonaceous s h a l e o i l f o r comparison. P a r t i c u l a r l y noteworthy is the correspondence of s i g n a l s A and D between t h e two s p e c t r a , wbich shows t h a t long n-alkyl cha ins , f r e e a t one ( o r each ) end, a r e p re sen t i n t h e kerogen.
Information about t h e si te of attachment of t h e s e cha ins was provided by 13C NMR examination of t h e alkene f r a c t i o n i s o l a t e d from a Condor o i l . Although t h e occurrence o f I-enes i n s h a l e o i l s is wel l documented, t h e r e i s v e r y l i t t l e information on t h e d i s t r i b u t i o n of o t h e r double-bond isomers. F igu re 2 shows t h a t h igh f i e l d 13C NHU is an e x c e l l e n t method f o r de t e rmin ing t h i s d i s t r i b u t i o n , a t least fo r t h e f i r s t f i v e o r s i x carbons along t h e chain, g i v i n g c i s / t r a n s r a t i o s aa we l l . --
The q u a n t i t a t i v e d a t a from t h i s spectrum were b e s t i n t e r p r e t e d as i n d i c a t i n g t h a t I-enes a r e i n f a c t t h e i n i t i a l l y - f o r m e d o l e f i n s and t h a t t h e double bond then mig ra t e s a long t h e chain.* Thus t h e t e rmina l carbon is t h e l i k e l y s i t e of t h e i r o r i g i n a l l i nkage t o t h e kerogen. This is c o n s i s t e n t with t h e widespread occur rence i n t h e biosphere of long-chain f a t t y a c i d s and, t o a l e s s a r e x t e n t , primary a l coho l s and t h e i r i s o l a t i o n from t h e h y d r o l y s i s of kerogens(4) . We have t h e r e f o r e based t h e fol lowing models on t h e s e t w o c l a s s e s of compounds and used t h e benzene r i n g a s t h e s imples t aromatic nucleus.
Hexadecyl dodecanoate - 1. This wax e s t e r pyrolysed r e a d i l y between 430 and 460'C t o g ive almost e x c l u s i v e l y 1-hexadecene and dodecanoic ac id . S i g n i f i c a n t l y , ve ry l i t t l e n-undecane was formed. The r e a c t i o n was shown t o be f i r s t o rde r by va ry ing t h e p a r t i a l p r e s s u r e of s u b s t r a t e between 40 and 600 Pa; except a t t h e lowest concen t r a t ion , no s i g n i f i c a n t change i n t h e f r a c t i o n a l decomposition a t 450'C was observed. The c a l c u l a t e d a c t i v a t i o n energy and r a t e cons t an t at 450'C a r e g iven i n Table 1, t o g e t h e r w i th t h e corresponding parameters f o r t h e e v o l u t i o n of hydrocarbons by p y r o l y s i s of s e v e r a l o i l s h a l e s . As can be seen, n e i t h e r t h e k i n e t i c s nor t h e products of t h i s r e a c t i o n correspond we l l w i th those from o i l s h a l e s .
Octadecyl benzoate - 2. This e s t e r decomposed even more r e a d i l y than t h e p rev ious compound, g i v i n g I-octadecene and benzoic ac id as almost t h e on ly products . However, a small amount of benzene was a l s o formed, presumably from deca rboxy la t ion of t h e benzoic ac id . Thus, t h i s compound cannot be cons ide red a good kerogen model.
Phenyl dodecsnoate - 3. Phenol ic e s t e r s of f a t t y a c i d s have been implicated i n t h e s t r u c t u r e of humic subs t ances (9 ) such as those de r ived from l i g n i n s . I t was t h e r e f o r e i n t e r e s t i n g t o d i scove r t h a t a l though phenyl dodecanoate pyrolysed r a t h e r s lowly, t h e a c t i v a t i o n energy f o r i t s decomposi t ion i s similar t o t h a t
* dehydrogenation o f a lkanes is an a d d i t i o n a l pathway(l) , l ead ing t o a s i g n i f i c a n t p ropor t ion of o l e f i n s wi th a random d i s t r i b u t i o n of double-bond p o s i t i ons .
333
f o r Nagoorin carbonaceous s h a l e , which con ta ins l a r g e q u a n t i t i e s of l i g n i t i c m a t e r i a l s . Furthermore, t h e major products de r ived from the s i d e chain were n-undecane and I-decene (F igu re 3) . P y r o l y s i s of pheno l i c e s t e r s of a n a t u r a l s e r i e s of c a r b o x y l i c a c i d s , where even numbered cha ins predominate. should t h e r e f o r e g e n e r a t e n-alkanes with odd over even p re fe rence and 1-enes with a leas pronounced even over odd p re fe rence . This is o f t e n observed i n s h a l e o i l s .
Phenyl oc t adecy l e t h e r - 4. The decomposition k i n e t i c s o f t h i s compound were complicated. Above about 4 6 0 ' C , t h e r e a c t i o n appeared to have an a c t i v a t i o n energy of less t h a n 200 k J mol-1, whereas at lower temperatures t h e va lue w a s more than 500 k J mol-1. Th i s probably i n d i c a t e s t h a t t h e i n i t i a l bond-cleavage i s n o t t h e rate-determining s t e p below 460'C. but it may be above t h i s t empera tu re . The products were even more complex; t h e i r chromatogram is shown i n F igu re 4.
Note t h e homologous series of n-alkanes dominated by heptadecane, and t h e more abundant series of 1-enes. with 1-octadecene t h e major compound. Phenol and. unexpectedly, benzaldehyde a r e t h e major aromatic products . al though s t y r e n e and v a r i o u s alkylbenaenes i n c l u d i n g n-heptadecylbenzene were a l s o i d e n t i f i e d . In a d d i t i o n , products a r i s i n g from t h e random s c i s s i o n of t he s i d e chain o f 4 a r e p r e s e n t i n s i g n i f i c a n t amounts.
Although t h e p roduc t s and r a t e o f decomposition of t h i s compound correspond we l l t o t h o s e of o i l s h a l e s , t h e complicated a c t i v a t i o n energy precludes a d e c i s i o n about i t s v a l i d i t y as a kerogen model.
Decylbenzene - 5. T h i s compound, which r e p r e s e n t s t he s imples t l i nkage of an a l k y l cha in to a n a romat i c r i n g , pyrolysed extremely s lowly, although i t s a c t i v a t i o n energy was v i r t u a l l y i d e n t i c a l to those r epor t ed f o r t h e decomposi t ion of t y p i c a l o i l s h a l e s . The major products were s t y r e n e , t o luene , e thylbenzene and 1-nonene; on ly very small amounts of n-alkanes were de t ec t ed . A s with t h e p rev ious compound, t h e r e was a l s o cleavage of carbon-carbon bonds a long t h e s i d e cha in .
CONCLUSIONS
Of t h e f i v e compounds pyrolysed i n t h i s s tudy. only phenyl dodecanoate can be considered as a good model o f kerogen s t r u c t u r e , bu t on ly fo r t h e carbonaceous s h a l e s . None of t he o t h e r compounds, with t h e poss ib l e except ion o f phenyl oc t adecy l e t h e r , adequa te ly mimicked e i t h e r t h e high or low a c t i v a t i o n energy p rocesses of o i l s h a l e py ro lyses .
The n a t u r e of t h e h i g h e r a c t i v a t i o n energy process is r a t h e r i n t r i g u i n g . The f a c t t h a t roughly equa l q u a n t i t i e s of n-alkanes and a lkenes are generated by the r ap id p y r o l y s i s of s h a l e s and kerogens sugges t s t h a t t h e two c l a s s e s of compounds have a c o m o n o r i g i n ; indeed k i n e t i c data(7.8) i n d i c a t e t h a t a s i n g l e r a t e -de te rmin ing p rocess is involved i n t h e formation of t h e bulk of t he o i l . We be l i eve t h a t t h i s process involves the gene ra t ion of primary n-alkyl r a d i c a l s which would then d i s p r o p o r t i o n a t e t o g i v e equal q u a n t i t i e s o f n-alkanes and 1-alkenes. C e r t a i n l y , o t h e r have provided evidence fo r t h e involvement of r a d i c a l s i n kerogen p y r o l y s i s ( l 0 ) . However, t he r e a c t i o n which produces t h e s e r a d i c a l s has y e t to be e l u c i d a t e d .
ACKNOWLEDGEnNTS
We thank Ms C. Welters and J. Wymer f o r syn theses of model compounds and NMR measurements, Mr. I. Liepa and Dr. A. Cheffee f o r GC/MS data, Mr. J. Levy
334
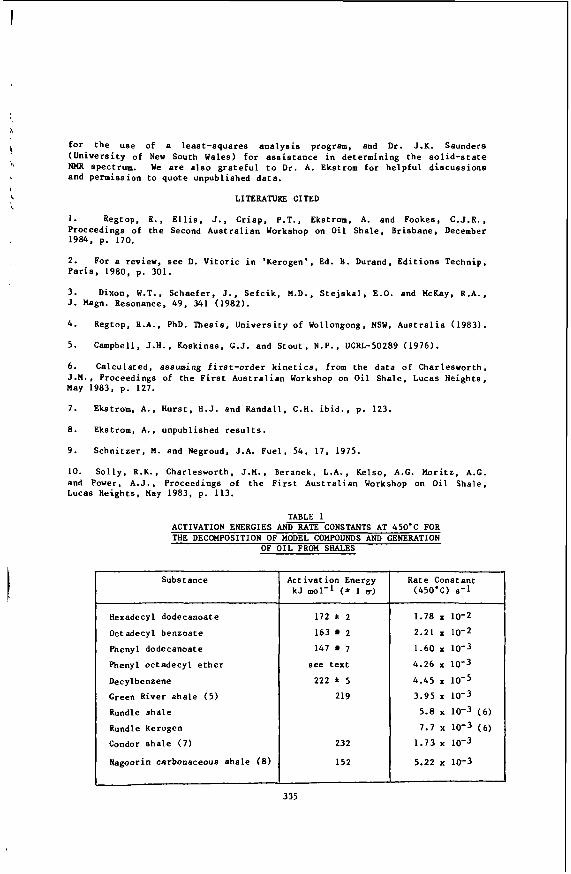
\
\
for t h e use of a l eas t - squa res a n a l y s i s program, and D r . J.K. Saunders (Un ive r s i ty o f New South Wales) f o r a s s i s t a n c e i n determining t h e s o l i d - s t a t e NMR spectrum. We a r e also g r a t e f u l t o D r . A. Ekstrom f o r h e l p f u l d i s c u s s i o n s and permission t o quote unpublished d a t a .
LITERATURE CITED
1. Regtop, R. , E l l i s , J., C r i s p , P.T., Ekstrom, A. and Fookes, C . J . R . , Proceedings of t h e Second A u s t r a l i a n Workshop on O i l Shale , Brisbane, December 1984. p. 170.
2 . For a review, see D. V i t o r i c i n 'Kerogen' , Ed. B . Durand, E d i t i o n s Technip, P a r i s . 1980, p. 301.
3 . Dixon, W.T., Schaefer . J., S e f c i k , M.D., S t e j s k a l . E.O. and McKay, R . A . , J. Magn. Resonance. 4 9 , 341 (1982) .
4 .
5 . Campbell, J.H., Koskinas, G.J. end S t o u t , N.P., UCRL-50289 ( 1 9 7 6 ) .
6 . Calcu la t ed , assuming f i r s t - o r d e r k i n e t i c s , from t h e d a t a o f Charlesworth, J . M . . Proceedings of t h e F i r s t A u s t r a l i a n Workshop on O i l Sha le , Lucas Heights , May 1983. p. 127.
7 . Ekstrom, A. , Hur s t , H.J. and Randal l , C . H . i b id . , p. 123.
8. Ekstrom, A., unpublished r e s u l t s .
9. S c h n i t z e r , M. and Negroud, J.A. Fue l , 54 , 17, 1975.
10. S o l l y , R.K. , Charlesworth, J.M., Beranek, L.A., Kelso, A.G. Mor i t z , A.G. and Power, A . J . , Proceedings of t h e F i r s t A u s t r a l i a n Workshop on O i l Shale , Lucas Heights , May 1983, p. 113.
Regtop, R.A., PhD. Thes i s , U n i v e r s i t y of Wollongong, NSW, A u s t r a l i a ( 1 9 8 3 ) .
TABLE 1
THE DECOMPOSITION OF MODEL COMPOUNDS AND GENERATION OF O I L FROM SHALES
ACTIVATION ENERGIES A N T X ~ T C O N S T A N T S AT 450.c FOR
Substance
Hexadecyl dodecsnoate
Octsdecyl benzoate
Phenyl dodecanoate
Phenyl oc t adecy l e t h e r
Decylbenzene
Green River s h a l e ( 5 )
Rundle s h a l e
Rundle kerogen
Condor s h a l e ( 7 )
Nagoorin carbonaceous s h a l e (8)
Act iva t ion Energy k J mol-l (f 1 a)
172 f 2
163 2
147 7
s e e t e x t
222 f 5
219
232
152
335
Rate Constant (450'C) s-1
1 .78 x 10-2
2 .21 x 10-2
4 . 2 6 10-3
4 . 4 5 10-5
3 . 9 5 10-3
1 . 6 0 x 10-3
5.8 x 10⁻³ ( 6 )
7 .7 x 10-3 ( 6 )
1 . 7 3 10-3
5 .22 x 10-3
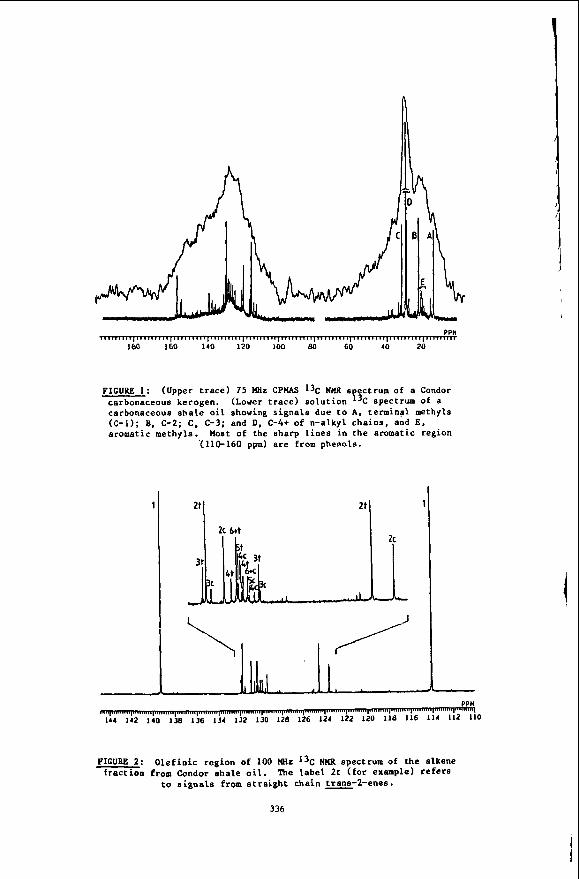
PPIl
180 160 140 120 100 Bo 60 40 20
FIGURE 1: (Upper t r a c e ) 75 IdHz C P W l3C NKR s ectrum of a Condor carbonaceous kerogen. (Lower t r a c e ) s o l u t i o n spectrum Of a carbonaceous s h a l e oil showing s i g n a l s due t o A, t e rmina l methyls (C-1); B. C-2; C, C-3; and D, C-4+ of n-a lkyl c h a i n s , and E. a romat i c methyls . Most of the sharp l i n e s i n t h e aromatic
'(110-160 ppm) a r e from phenols.
21 *+I
region
1
FIGURE 2: O l e f i n i c r eg ion of 100 Wz 1% NKR spectrum of the alkene f r a c t i o n from Condor a h a l e oil. The l a b e l 2 t ( for example) r e f e r s
to s i g n a l s from s t r a i g h t cha in rrans-Z-ene.9.
336
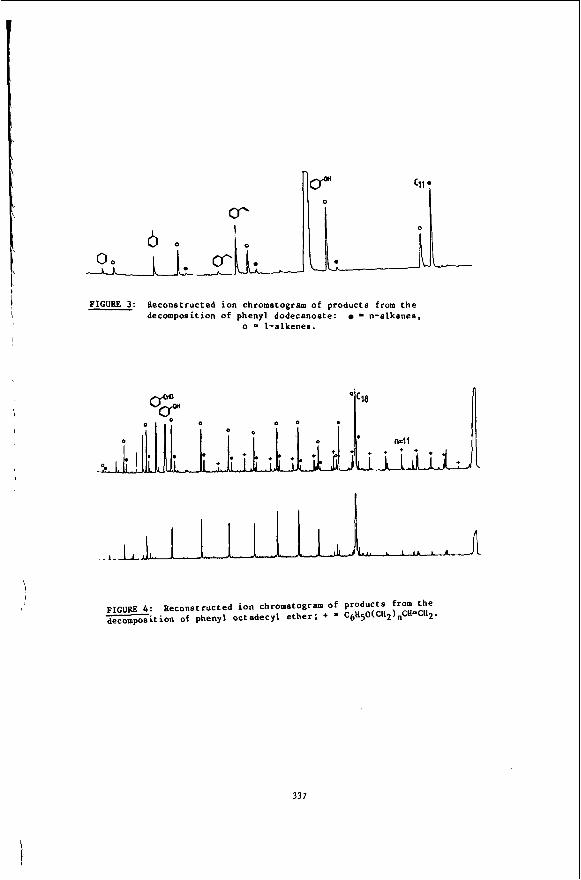
FIGURE 3: Reconstructed i o n chromatogram o f products from t h e decomposit ion of phenyl dodecanoate: = n-a lkanes ,
o I - a l k e n e s .
- FIGURE 4: Becons truc ted i o n chromatogram of products from t h e decomposit ion of phenyl o c t a d e c y l e t h e r ; + * G ~ H s O ( C H ~ ) ~ C H ~ C H ~ .
337
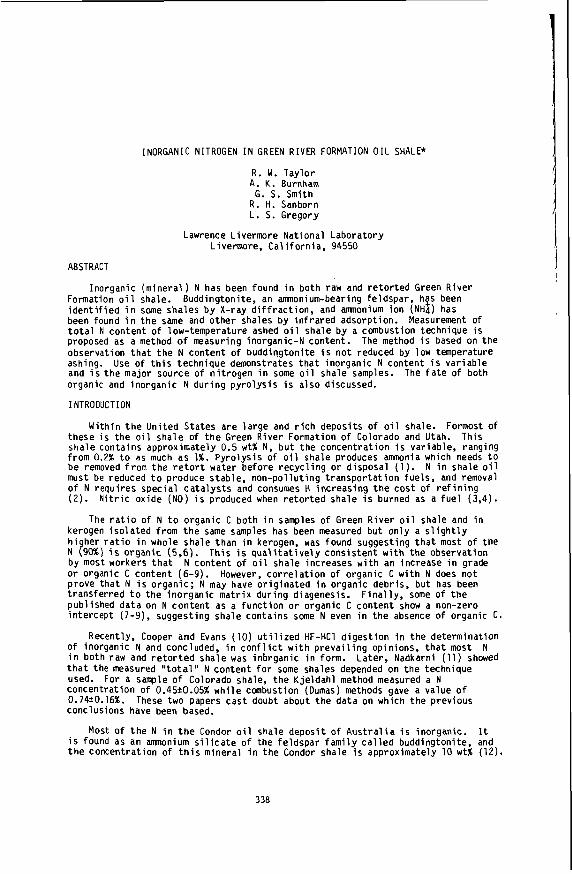
I N O R G A N I C NITROGEN I N GREEN R I V E R FORMATION OIL SHALE*
R. W. Tay lor A. K. Burnham
G. S. Smith R. H. Sanborn L. S. Gregory
Lawrence Livermore Nat ional Laboratory Livermore, C a l i f o r n i a , 94550
ABSTRACT
Inorganic (m ine ra l ) N has been found i n both raw and r e t o r t e d Green R ive r Formation o i l shale. i d e n t i f i e d i n some shales b y X-ray d i f f r a c t i o n , and amnonium i o n (NH4) has been found i n t h e same and o t h e r shales by i n f r a r e d adsorption. Measurement o f t o t a l N content of low-temperature ashed o i l shale by a combustion technique i s proposed as a method o f measuring inorganic-N content. observation t h a t t h e N content o f buddingtoni te i s n o t reduced by low temperature ashing. Use o f t h i s technique demonstrates t h a t inorganic N content i s va r iab le and i s t h e major source o f n i t r o g e n i n some o i l shale samples. The f a t e of both organic and inorganic N du r ing p y r o l y s i s i s a l so discussed.
INTRODUCTION
Buddingtonite, an ammonium-bearing fe ldspar , h$S been
The method i s based on t h e
Wi th in t h e Uni ted States a re l a r g e and r i c h deposi ts o f o i l shale. Formost of these i s t h e o i l sha le o f t h e Green R ive r Formation o f Colorado and Utah. This shale conta ins approximately 0.5 w t % N, b u t t h e concen t ra t i on i s var iab le, ranging from 0.2% t o as much as 1%. Py ro l ys i s o f o i l shale produces ammonia which needs t o be removed f rom t h e r e t o r t water before r e c y c l i n g o r d isposal (1) . N i n shale 011 must be reduced t o produce s tab le, non -po l l u t i ng t r a n s p o r t a t i o n fue l s , and removal o f N requ i res spec ia l c a t a l y s t s and consumes H i nc reas ing t h e c o s t o f r e f i n i n g ( 2 ) . N i t r i c ox ide (NO) i s produced when r e t o r t e d shale i s burned as a f u e l ( 3 , 4 ) .
The r a t i o o f N t o organic C both i n samples o f Green R ive r o i l shale and i n kerogen i s o l a t e d from t h e same samples has been measured bu t on l y a s l i g h t l y h i her r a t i o i n whole shale than i n kerogen, was found suggesting t h a t most o f t he N 990%) i s organic (5,6). T h i s i s q u a l i t a t i v e l y cons is ten t with t h e observat ion by most workers t h a t N content o f o i l shale increases w i t h an increase i n grade o r organic C content (6-9). However, c o r r e l a t i o n o f organic C w i t h N does n o t prove t h a t N i s organic ; N may have o r i g i n a t e d i n organic debris, bu t has been t ransferred t o t h e inorganic ma t r i x du r ing diagenesis. publ ished da ta on N con ten t as a f u n c t i o n o r organic C content show a non-zero i n te rcep t (7-9), suggesting shale conta ins some N even i n t h e absence @f organic c .
Recently, Cooper and Evans (10) u t i l i z e d HF-HCl d i g e s t i o n i n t h e determinat ion Of inorganic N and concluded, i n c o n f l i c t w i t h p r e v a i l i n g opinions, t h a t most N i n both raw and r e t o r t e d shale was inbrganic i n form. Later , Nadkarni (11) showed t h a t t he measured " t o t a l " N content f o r some shales depended on t h e technique used. For a sample of Colorado shale, t h e K je ldah l method measured a N concentrat ion o f 0.45*0.05% w h i l e combustion (Dumas) methods gave a value o f 0.74*0.16%. These two papers cas t doubt about t h e da ta on which t h e prev ious conc~us ions have been based.
Most of t h e N i n t h e Condor o i l shale depos i t o f A u s t r a l i a i s inorganic . i s found as an ammonium s i l i c a t e o f t he fe ldspar f a m i l y c a l l e d buddingtonite, and t h e concentrat ion o f t h i s minera l i n t h e Condor shale i s approximately 10 w t % (12).
F i n a l l y , some of t h e
It
338
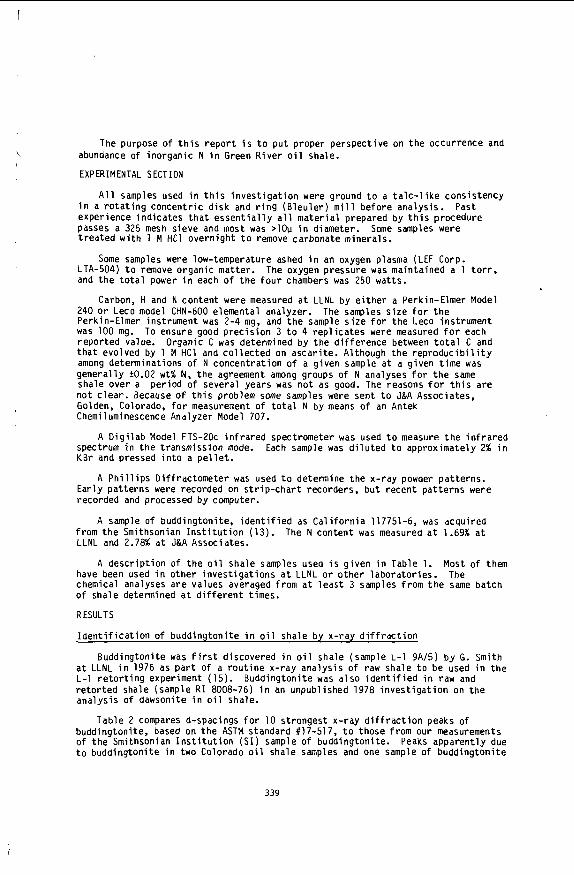
1
The purpose of this report is to put proper perspective on the occurrence and abundance of inorganic N in Green River oil shale. EXPERIMENTAL S ECT ION
All samples used in this investigation were ground to a talc-like consistency in a rotating concentric disk and ring (Bleuler) mill before analysis. experience indicates that essentially all material prepared by this procedure passes a 325 mesh sieve and most was >10~ in diameter. treated with 1 M HC1 overnight to remove carbonate minerals.
Some samples were low-temperature ashed in an oxygen plasma (LEF Corp. LTA-504) to remove organic matter. The oxygen pressure was maintained a 1 torr, and the total power in each of the four chambers was 250 watts.
Carbon, H and N content were measured at LLNL by either a Perkin-Elmer Model 240 or Leco model CHN-600 elemental analyzer. The samples size for the Perkin-Elmer instrument was 2-4 mg, and the sample size for the Leco instrument was 100 mg. To ensure good precision 3 to 4 replicates were measured for each reported value. Organic C was determined by the difference between total C and that evolved by 1 M HC1 and collected on ascarite. Although the reproducibility among determinations of N concentration of a given sample at a given time was generally tO.02 wt% N, the agreement among groups of N analyses for the same shale over a period of several years was not as good. The reasons for this are not clear. Because of this problem some samples were sent to J&A Associates, Golden, Colorado, for measurement of total N by means of an Antek Chemiluminescence Analyzer Model 707.
spectrum in the transmission mode. KBr and pressed into a pellet.
Early patterns were recorded on strip-chart recorders, but recent patterns were recorded and processed by computer.
A sample of buddingtonite, identified as California 117751-6, was acquired from the Smithsonian Institution (13). The N content was measured at 1.69% at LLNL and 2.78% at J&A Associates.
Past
Some samples were
A Digilab Model FTS-20c infrared spectrometer was used to measure the infrared Each sample was diluted to approximately 2% in
A Phillips Diffractometer was used to determine the x-ray powder patterns.
A description of the oil shale samples used is given in Table 1. Most of them have been used in other investigations at LLNL or other laboratories. chemical analyses are values averaged from at least 3 samples from the same batch of shale determined at different times.
RESULTS
Identification of buddingtonite in oil shale by x-ray diffraction
at LLNL in 1976 as part o f a routine x-ray analysis of raw shale to be used in the L-1 retorting experiment (15). retorted shale (sample RI 8008-76) in an unpublished 1978 investigation on the analysis of dawsonite in oil shale.
Table 2 compares d-spacings for 10 strongest x-ray diffraction peaks o f buddingtonite, based on the ASTM standard #17-517, to those from our measurements of the Smithsonian Institution (SI) sample of buddingtonite. Peaks apparently due t o buddingtonite in two Colorado oil shale samples and one sample of buddingtonite
The
Buddingtonite was first discovered in oil shale (sample L-1 9A/5) by G. Smith
Buddingtonite was also identified in raw and
339
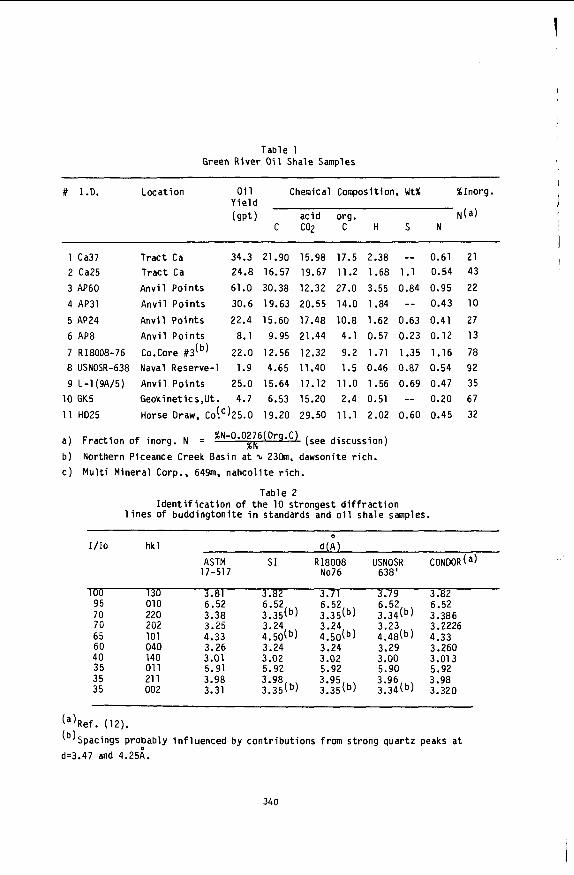
Table 1 Green River O i l Shale Samples
# I.D. Locat ion O i l Chemical Composition, W t l %Inorg. Y i e l d (gp t ) ac id org. N(a)
C C % C H S N
1 Ca37 T rac t Ca 34.3 21-90 15.98 17.5 2.38 -- 0.61 2 Ca25 T rac t Ca 24.8 16.57 19.67 11.2 1.68 1.1 0.54
3 AP60 Anv i l Po in ts 61.0 30.38 12.32 27.0 3.55 0.84 0.95
4 AP31 Anv i l Po in ts 30.6 19.63 20.55 14.0 1.84 -- 0.43
5 AP24 Anv i l Po in ts 22.4 15.60 17.48 10.8 1.62 0.63 0.41 6 AP8 A n v i l Po in ts 8.1 9.95 21.44 4.1 0.57 0.23 0.12
7 RI8008-76 Co.Core #3(b) 22.0 12.56 12.32 9.2 1.71 1.35 1.16 8 USNOSR-638 Naval Reserve-1 1.9 4.65 11.40 1.5 0.46 0.87 0.54
9 L- l (9A/5) Anv i l Po in ts 25.0 15.64 17.12 11.0 1.56 0.69 0.47
11 HD25 Horse Draw, C0!')25.0 19.20 29.50 11.1 2.02 0.60 0.45
a) F rac t i on o f inorg. N = (see discussion)
b ) Northern Piceance Creek Basin a t -t, 23Gm. dawsonite r i c h .
c ) M u l t i Minera l Corp., 649m, nahco l i t e r i c h .
l o GK5 Geokinetics,Ut. 4.7 6.53 15.20 2.4 0.51 -- 0.20
Table 2 I d e n t i f i c a t i o n of t h e 10 s t rongest d i f f r a c t i o n
1 ines of budd ing ton i te i n standards and o i l shale samples.
21 43
22 10
27 13
78 92 35 67 32
1/10 h k l d(A)
ASTM S I R18008 USN0:R CONDOR(a) 17-51 7 No76 638
100 130 3.81 3.82 3.71 3.79 3.82 95 010 6.52 6.52 6.52 6.52 6.52 70 220 3.38 3.35(b) 3.35(b) 3.34(b) 3.386
65 101 4.33 4.50(b) 4.50(b) 4.48(b) 4.33 60 040 3.26 3.24 3.24 3.29 3.260
202 3.25 3.24 3.24 3.23 3.2226 7n I U
. . ~ . .- 40 140 3.01 3.02 3.02 3.00 3.013 35 01 1 5.91 5.92 5.92 5.90 5.92 35 21 1 3.98 3.98 3.95 3.96 3.98 35 002 3.31 3.35(b) 3.35(b) 3.34(b) 3.320
(a)Ref. (12).
(b)Spacings probably i n f l uenced by con t r i bu t i ons f rom st rong quar tz peaks a t d=3.47 and 4.25A.
340
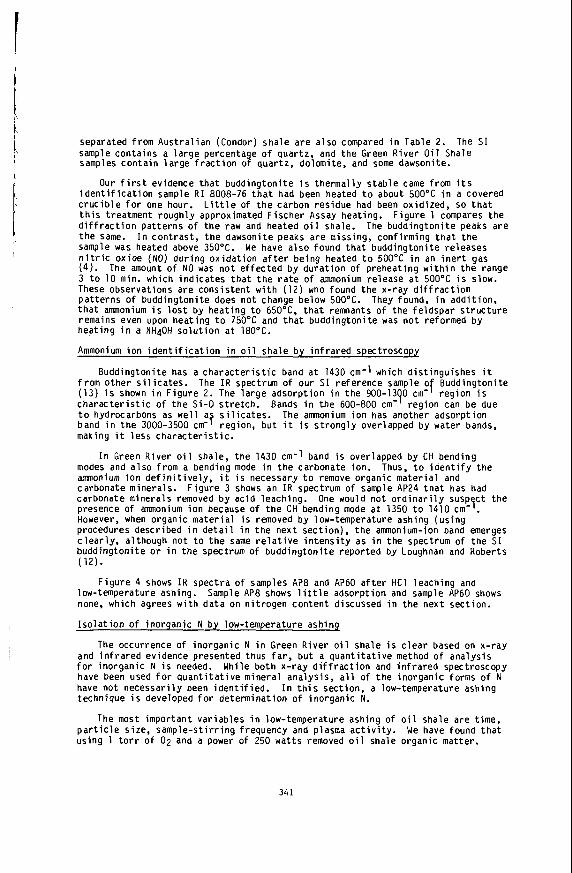
separated f rom Aus t ra l i an (Condor) shale a re a l so compared i n Table 2. sample conta ins a l a r g e percentage o f quartz, and t h e Green River O i l Shale samples con ta in l a r g e f r a c t i o n o f quartz, dolomite, and some dawsonite.
Our f i r s t evidence t h a t buddingtoni te i s thermal ly s tab le came from i t s i d e n t i f i c a t i o n sample R I 8008-76 t h a t had been heated t o about 500°C i n a covered c r u c i b l e f o r one hour. t h i s treatment roughly approximated F ischer Assay heating. F igure 1 compares t h e d i f f r a c t i o n pa t te rns o f t h e raw and heated o i l shale. t h e same. sample was heated above 35OOC. We have a l so found t h a t buddingtoni te re leases n i t r i c ox ide (NO) du r ing o x i d a t i o n a f t e r be ing heated t o 500'C i n an i n e r t gas (4 ) . 3 t o 10 min. which i nd i ca tes t h a t t h e r a t e o f ammonium re lease a t 5OO0C i s slow. These observations are consis tent w i t h (12) who found t h e x-ray d i f f r a c t i o n pa t te rns o f buddingtoni te does no t change below 500'C. They found, i n addi t ion, t h a t annnonium i s l o s t by heat ing t o 65OoC, t h a t remnants o f t he fe ldspar s t r u c t u r e remains even upon heat ing t o 75OOC and t h a t buddingtoni te was n o t reformed by hea t ing i n a NH40H s o l u t i o n a t 180OC.
Ammonium i o n i d e n t i f i c a t i o n i n o i l shale by i n f r a r e d spectroscopy
f rom o the r s i l i c a t e s . The I R spectrum o f our SI re ference sample o Buddingtonite (13) i s shown i n F igu re 2. The l a r g e adsorpt ion i n the 900-1390 cm- reg ion i s c h a r a c t e r i s t i c o f t h e Si -0 s t re tch. t o hydrocarbons as w e l l a s i l i c a t e s . The ammonium i o n has another adsorpt ion
making i t less c h a r a c t e r i s t i c .
modes and a l so f rom a bending mode i n t h e carbonate ion. amnonium i o n d e f i n i t i v e l y , i t i s necessary t o remove organic ma te r ia l and carbonate minerals. carbonate minera ls removed by ac id leaching. One would no t o r d i n a r i l y susp c t t h e presence o f ammonium i o n because o f t h e CH bending mode a t 1350 t o 1410 cm- . However, when organic ma te r ia l i s removed by low-temperature ashing (us ing procedures described i n d e t a i l i n t h e nex t sect ion) , t h e ammonium-ion band emerges c l e a r l y , although n o t t o t h e same r e l a t i v e i n t e n s i t y as i n the spectrum o f t h e SI buddingtoni te o r i n t h e spectrum o f budd ing ton i te repor ted by Loughnan and Roberts
The SI
L i t t l e o f t h e carbon res idue had been ox id ized, so t h a t
The buddingtoni te peaks are I n con t ras t , t h e dawsonite peaks a re missing, conf i rming t h a t t h e
The amount o f NO was n o t e f f e c t e d by du ra t i on o f preheat ing w i t h i n t h e range
Buddingtoni te has a c h a r a c t e r i s t i c band a t 1430 cm-1 which d i s t i ngu ishes i t f : . .
Bands i n t h e 600-800 cm- reg ion can be due
band i n t h e 3000-3500 cm- 7 region, bu t i t i s s t r o n g l y overlapped by water bands,
I n Green R ive r o i l shale, t h e 1430 cm-1 band i s overlapped by CH bending Thus, t o i o e n t i f y t h e
F igure 3 shows an I R spectrum o f sample AP24 t h a t has had
5
(12).
F igu re 4 shows I R spect ra o f samples AP8 and AP60 a f t e r HC1 leaching and low-temperature ashing. none, which agrees w i t h d a t a on n i t rogen content discussed i n t h e n e x t sect ion.
I s o l a t i o n o f inorganic N by low-temperature ashin9
The occurrence o f inorganic N i n Green River o i l shale i s c l e a r based on x-ray and i n f r a r e d evidence presented thus f a r , b u t a q u a n t i t a t i v e method o f ana lys i s f o r inorganic N i s needed. While both x-ray d i f f r a c t i o n and i n f r a r e d spectroscopy have been used f o r q u a n t i t a t i v e minera l analys is , a l l o f t h e inorganic forms o f N have no t necessa r i l y been i d e n t i f i e d . I n t h i s sect ion, a low-temperature ashing technique i s developed f o r determinat ion o f inorganic N.
p a r t i c l e size, samp le -s t i r r i ng frequency and plasma a c t i v i t y . us ing 1 t o r r o f 02 and a power o f 250 wat ts removed o i l shale organic mat ter ,
Sample AP8 shows l i t t l e adsorpt ion and sample AP60 shows
The most impor tant va r iab les i n low-temperature ashing o f o i l shale are time, We have found t h a t
34 1
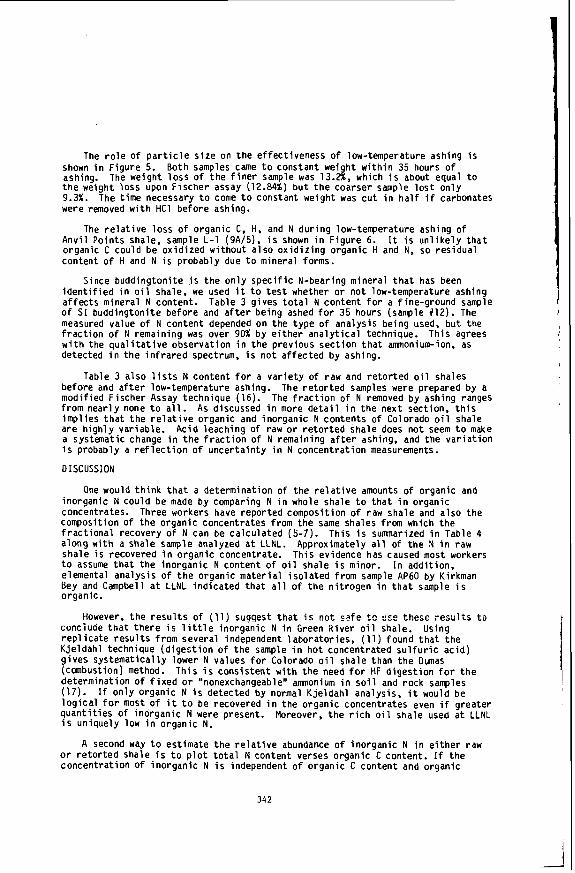
The r o l e o f p a r t i c l e s i z e on t h e ef fect iveness o f low-temperature ashing i s shown i n F igure 5. ashing. The weight l o s s o f t h e f i n e r sample was 13.2%, which i s about equal t o t h e weight loss upon F ischer assay (12.84%) b u t t h e coarser sample l o s t on l y 9.3%. The t ime necessary t o come t o constant weight was c u t i n h a l f i f carbonates were removed w i t h HC1 be fo re ashing.
Anv i l Points shale, sample L-1 (9A/5), i s shown i n F igu re 6. organic C could be ox id i zed wi thout a l so o x i d i z i n g organic H and N, so res idua l content o f H and N i s probably due t o minera l forms.
Since buddingtoni te i s t h e o n l y s p e c i f i c N-bearing minera l t h a t has been i d e n t i f i e d i n o i l shale, we used i t t o t e s t whether o r n o t low-temperature ashing a f f e c t s minera l N content. o f SI buddingtoni te be fo re and a f t e r be ing ashed f o r 35 hours (sample #12). The measured value o f N content depended on t h e t ype o f ana lys i s be ing used, b u t t he f r a c t i o n of N remaining was over 90% b y e i t h e r a n a l y t i c a l technique. w i th the q u a l i t a t i v e observat ion i n t h e prev ious sec t i on t h a t ammonium-ion, as detected i n t h e i n f r a r e d spectrum, i s n o t a f fec ted by ashing.
Table 3 a l so l i s t s N content f o r a v a r i e t y o f raw and r e t o r t e d o i l shales before and a f t e r low-temperature ashing. The r e t o r t e d samples were prepared by a modi f ied F ischer Assay technique (16). The f r a c t i o n o f N removed by ashing ranges from near l y none t o a l l . As discussed i n more d e t a i l i n t h e nex t section, t h i s imp l i es t h a t t h e r e l a t i v e organic and inorganic N contents o f Colorado o i l shale a re h igh l y var iab le. Ac id leaching o f raw o r r e t o r t e d shale does n o t seem t o make a systematic change i n t h e f r a c t i o n o f N remaining a f t e r ashing, and the v a r i a t i o n i s probably a r e f l e c t i o n o f unce r ta in t y i n N concentrat ion measurements.
Both samples came t o constant weight w i t h i n 35 hours o f
The r e l a t i v e l o s s o f organic C, H, and N du r ing low-temperature ashing o f It i s u n l i k e l y t h a t
Table 3 g ives t o t a l N content f o r a f ine-ground sample
This agrees
DISCUSSION
One would t h i n k t h a t a determinat ion o f t h e r e l a t i v e amounts o f organic and inorganic N could be made by comparing N i n whole shale t o t h a t i n organic concentrates. Three workers have repor ted composit ion o f raw shale and a l so t h e composit ion o f t h e organic concentrates from t h e same shales from which t h e f r a c t i o n a l recovery o f N can be ca l cu la ted (5-7) . Th i s i s summarized i n Table 4 a long with a shale sample analyzed a t LLNL. sha le i s recovered i n organic concentrate. Th is evidence has caused most workers t o assume t h a t t h e inorganic N content o f o i l shale i s minor. elemental analys is o f t h e organic ma te r ia l i s o l a t e d f rom sample AP60 by Kirkman Bey and Campbell a t LLNL ind i ca ted t h a t a l l o f t h e n i t r o g e n i n t h a t sample i s organic.
conciuae t n a t t h e r e i s l i t t l e inorganic N i n Green R ive r o i l shale. r e p l i c a t e r e s u l t s f rom severa l independent laborator ies, (11) found t h a t t h e K je ldah l technique (d iges t i on o f t h e sample i n h o t concentrated s u l f u r i c ac id ) g i v e s sys temat i ca l l y lower N values f o r Colorado o i l shale than t h e Dumas (combustion) method. Th is i s cons i s ten t with t h e need f o r HF d i g e s t i o n f o r t h e determinat ion of f i x e d o r "nonexchangeable" amnonium i n s o i l and rock samples (17). If on ly organic N i s detected by normal K je ldah l analys is . i t would be l o g i c a l f o r most Of i t t o be recovered i n t h e organic concentrates even i f greater q u a n t i t i e s of inorganic N were present. Moreover, t h e r i c h o i l shale used a t LLNL i s un iquely low i n organic N.
o r r e t o r t e d shale i s t o p l o t t o t a l N content verses organic C content. If t h e concen t ra t i on Of inorganic N i s independent o f organic C content and organic
Approximately a l l o f t h e N i n raw
I n addi t ion,
However, t h e r e s u l t s o f (11) suggest t h a t i s not. sa fe t c gse these r e s t i l t s t o Using
A second way t o est imate t h e r e l a t i v e abundance o f inorganic N i n e i t h e r raw
342
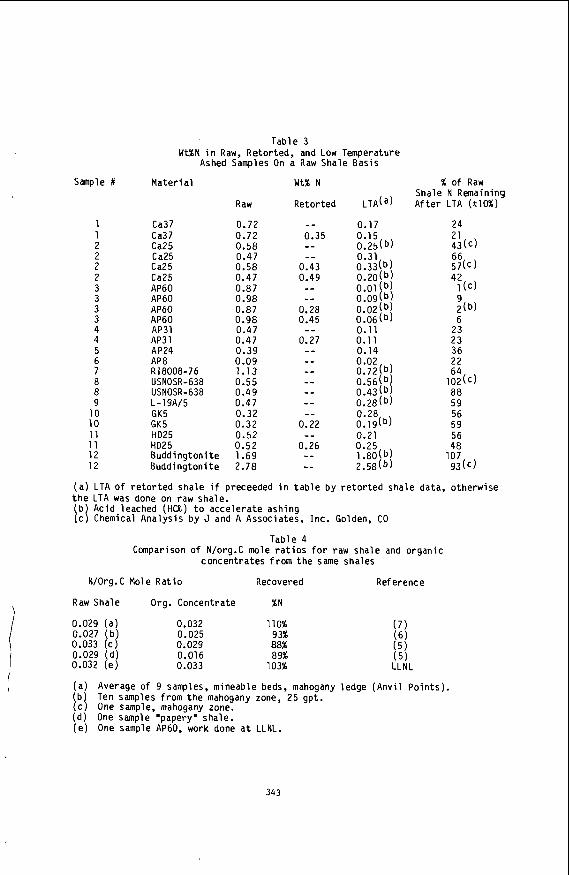
Sample #
1 1 2 2 2 2 3 3 3 3 4 4 5 6 7 8 8 9
10 10 11 11 12 12
Table 3
Ashed Samples On a Raw Shale Basis Wt%N i n Raw, Retorted, and Low Temperature
Mater i a1 W t % N
Raw Retorted LTA(a)
Ca37 0.72 -_ 0.17 Ca37 0.72 0.35 0.15 Ca25 0.58 _- 0.25(b) Ca25 0.47 - - 0.31 Ca25 0.58 0.43 0.33(b) Ca25 0.47 0.49 0.20(b) AP60 0.87 -- 0.01 (b) AP60 0.98 -_ 0.09 ( b ) AP60 0.87 0.28 o.o2(b) AP60 0.98 0.45 0.06(b)
L- 1 9A/ 5 0.47 GK5 0.32 GK5 0.32
AP31 0.47 - - 0.11 AP31 0.47 0.27 0.11 AP24 0.39 -_ AP 8 0.09 -- RI8008-76 1.13 -- USNOSR-638 0.55 -- USNOSR-638 0.49 -- --
-- 0.22
0.26 -- -_ --
0.14 0.02 0.72( b, 0.56(b) 0.43 ( b, 0.28(b)
::::(b) 0.21 0.25 1.80(b) 2.58(b)
HD25 0.52 HD25 0.52 Buddingtoni te 1.69 Buddingtoni te 2.78
% o f Raw Shale N Remaining A f t e r LTA ( t10%)
24 21
66
42
9 2 (b) 6
23 23 36 2 2 64
88 59 56 59 56
107
43(c)
57(c)
1 (c )
102(c)
48
93(c)
( a ) LTA o f r e t o r t e d shale i f preceeded i n t a b l e by r e t o r t e d shale data, o therwise t h e LTA was done on raw shale.
I1 c Chemical Analys is by J and A Associates, Inc. Golden, CO b Ac id leached ( H a ) t o accelerate ashing
Table 4 Comparison o f N/org.C mole r a t i o s f o r r a w shale and organic
concentrates f rom the same shales
N/Org.C Mole R a t i o Recovered Reference
Raw Shale Org. Concentrate %N
0.029 (a ) 0.032 110% 0.027 ( b ) 0.025 9 3% 0.033 (c ) 0.029 88% 0.029 (d ) 0.016 8 9% 0.032 (e ) 0.033 103%
( a ) Average o f 9 samples, mineable beds, mahogany ledge (Anv i l Po in ts ) . Ten samples f rom the mahogany zone, 25 gpt. it] One sample, mahogany zone.
(d ) One sample "papery" shale. ( e ) One sample AP60, work done a t LLNL.
343
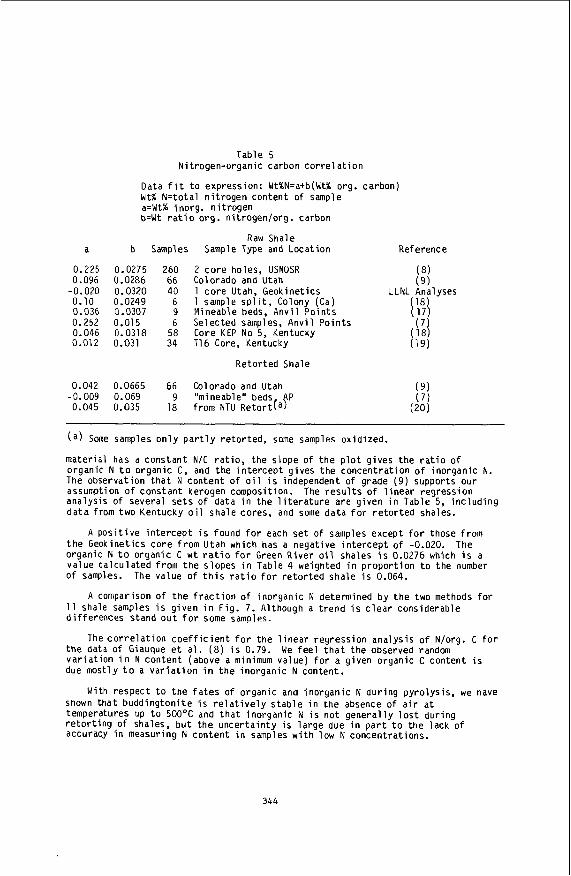
Table 5 Nitrogen-organic carbon correlation
Data f i t t o expression: Wt%N=a+b(Wt% org. carbon) W t % N=total nitrogen content of sample a=Wt% inorg. nitrogen b=Wt r a t i o org. nitrogen/org. carbon
Raw Shale b Samples Sample Type and Location Reference
0.0275 260 2 core holes, USNOSR ( 8 ) 0.0286 66 Colorado and U t a h ( 9 ) 0.0320 40 1 core Utah, Geokinetics L L N L Analyses 0.0249 6 1 sample s p l i t , Colony (Ca) (18)
0.015 6 Selected samples, Anvil Points ( 7 ) 0.0318 58 Core KEP No 5, Kentucky (18) 0.031 34 T16 Core, Kentucky (19)
0.0307 9 Mineable beds, Anvil Points (17)
a
0.225 0.096
-0.020 0.10 0.036 0.252 0.046 0.012
0.042 -0.009 0.045
Retorted Shale
0.0665 66 Colorado and Utah 0.069 9 "mineable" beds 0.035 18 from NTU Retort(a PP
( a ) Some samples only par t ly retorted, some samples oxidized.
material has a constant N/C r a t io , the slope of t h e plot gives the r a t io o f organic N t o organic C , and the intercept gives the concentration of inorganic N . The observation tha t N content of o i l i s independent of grade ( 9 ) supports our assumption of constant kerogen composition. analysis of several s e t s of data in the l i t e r a tu re are given in Table 5, including da ta from t w o Kentucky o i l shale cores, and some data fo r retorted shales.
A positive intercept i s found fo r each s e t of samples except f o r those from the Geokinetics core from Utah which has a negative intercept of -0.020. organic N t o organic C w t r a t i o f o r Green River o i l shales i s 0.0276 which i s a value c a l c u l a t e d from the slopes in Table 4 weighted in proportion t o the number of samples.
11 shale samples i s given in Fig. 7. Although a trend i s c lea r considerable differences stand out f o r some samples.
the data of Giauque e t a l . (8) i s 0.79. We fee l t h a t the observed random variation in N content (above a minimum value) f o r a given organic C content i s due mostly t o a variation in the inorganic N content.
shown tha t buddingtonite i s re la t ive ly s tab le in the absence of a i r a t temperatures u p t o 5OO0C and tha t inorganic N i s n o t generally lo s t during retorting of shales, b u t the uncertainty i s large d u e in par t t o the lack of accuracy in measuring N content in samples with low N concentrations.
The r e su l t s o f l inear regression
The
The value of t h i s r a t i o f o r retorted shale i s 0.064.
A comparison of the f rac t ion o f inorganic N determined by the two methods fo r
The correlation coef f ic ien t f o r the l inear regression analysis of N/org. C f o r
With respect t o t h e f a t e s of organic and inorganic N during pyrolysis, we have
344
CONCLUSIONS
On t h e average, approximately h a l f of t h e N i n t h e Green River Formation i s inorganic, b u t t he d i s t r i b u t i o n i s n o t uniform. remain i n t h e shale a f t e r r ,e tor t ing. been i d e n t i f i e d by means o f x-ray d i f f r a c t i o n i n some o i l shale samples. i ons have been i d e n t i f i e d i n t h e same and o the r samples by means o f i n f ra red adsorption. been found t o remove organic N, but n o t inorganic N i n buddingtonite. Measurement o f t o t a l N a f t e r low-temperature ashing i s proposed as a way o f determining inorganic N content. i s samples w i t h l i t t l e N t h e method i s q u a l i t a t i v e . A second method fo,: t he es t ima t ion o f t h e inorganic N content o f shale i s based on t h e assumption t h a t t h e org. N/org.C r a t i o i s constant. A t present it i s no t c l e a r i f one est imate i s b e t t e r t h a t t h e other .
I n view o f t h e present r e s u l t s , t h e s to i ch iomet ry o f r e t o r t i n g must be revised. l e s s N than p rev ious l y thought. The CH&N composit ion o f organic ma te r ia l in raw shale should be represented by the formula C H I 0 No 0 . The chemical composit ion o f organic m a t e r i a l i n r e t o r t e d s h d e sh6u?$ be represented by t h e
Inorganic N i n raw sha le tends t o
Ammonium Buddingtonite. an ammonium fe ldspar , has
Low-temperature ashing o f o i l shale by means o f an oxygen plasma has
Due i n p a r t t o t h e d i f f i c u l t y o f measuring N concen t ra t i on
Organic m a t e r i a l i n raw shale and i n t h e char i n r e t o r t e d shale conta ins
c b . 4 2 b . 0 6 -
Acknowledgment
We thank J. 5. White, Associate Curator-in-Charge, D i v i s i o n o f Mineralogy, U . S . Nat ional Museum o f Natura l His tory , Smithsonian I n s t i t u t e , f o r p r o v i d i n g us w i t h a re ference sample o f buddingtonite. We a l so acknowledge t h e C-N c o r r e l a t i o n s by D. Fujimoto and T. Coburn o f LLNL.
References
( 1 ) Technology Assessment, U.S. Congress, Washington, D.C. 20402, Stock No.052-003-00759-2, 1980.
(2 ) Related Mater ia ls , H. C. S tau f fe r Ed., ACS Symposium Series 163, 1981.
(3 )
( 4 ) Laboratory, Report UCRL-90155,1985, t o be presented a t t he 18th O i l Shale Symposium.
( 5 ) Forsman, J. P. and J. M. Hunt, Geochem. e t Cosmochim. Acta, V. 15, pp.
(6 ) Smith, J. W.. U.S. Bureau o f Mines, Report o f I nves t i ga t i ons 5725, 1961.
(7) Stanf ie ld , K. E., I . C. Frost , W . S. McAuley and N. H. Smith, U.S. Bureau o f Mines Rept. o f I nves t i ga t i ons , 4825, 1951.
(8) Giauque, R. D., J. P. Fox, and J. W. Smi th , Lawrence Berkeley Nat ional Laboratory Report L8L-10809 UC-91, 1980.
(9 ) Singleton, M. F., G. J. Koskinas, A. K. Burnham. and J. H. Raley, Lawrence L i vermore Nat ional Laboratory Report, UCRL-53273, 1982.
Gibbons, J. H., Director,"An Assessment o f O i l Shale Technologies," O f f i c e o f U.S. Government P r i n t i n g O f f i ce ,
Wasilk, N. J. and E. T. Robinson, i n O i l Shale, pp. 224-235 i n Tar Sands, and
Lyon, R. K. and J. E. Hardy, Combustion and Flame, V. 51, pp. 105-107, 1983.
Taylor, R. W., C. J. Mor r i s and A. K. Burnham, Lawrence Livermore Nat ional
170-182, 1958.
345
I
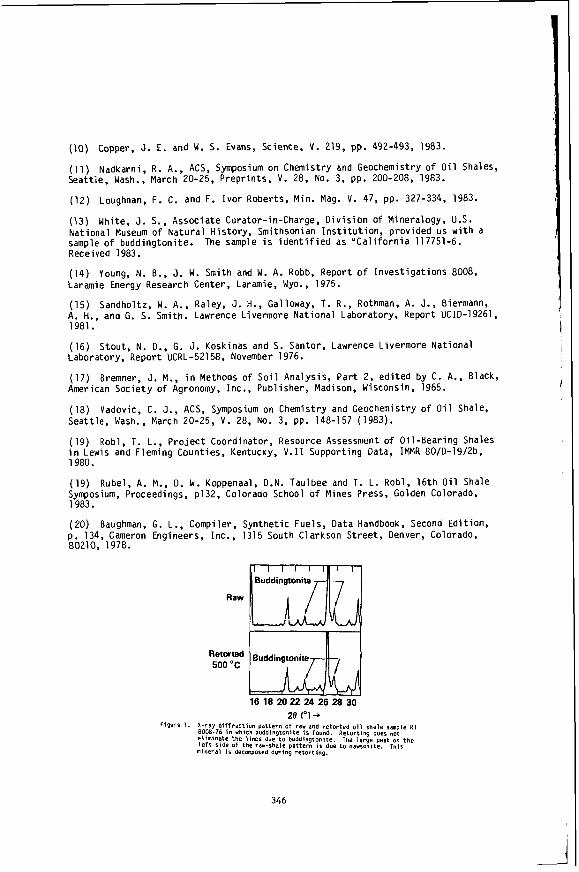
(10) Copper, J. E. and W. 5. Evans, Science, V. 219, pp. 492-493, 1983.
(11) Nadkarni, R. A., ACS, Symposium on Chemistry and Geochemistry o f O i Seatt le, Wash., March 20-25, Prepr in ts , V. 28, No. 3, pp. 200-208, 1983.
(12) Loughnan, F. C. and F. I v o r Roberts, Min. Mag. V. 47, pp. 327-334,
Shales,
983.
(13) White, J. S . , Associate Curator-in-Charge, D i v i s i o n o f Mineralogy, U.S. Nat ional Museum of Na tu ra l His tory , Smithsonian I n s t i t u t i o n , prov ided us w i t h a sample o f buddingtonite. Received 1983.
(14) Young, N. B., J. W . Smith and W. A. Robb, Report o f I nves t i ga t i ons 8008, Laramie Energy Research Center, Laramie, Wyo., 1975.
(15) Sandholtz, W. A., Raley, J. H., Galloway, T. R., Rothman, A. J., Biermann, A. H., and G. 5 . Smith. Lawrence Livermore Nat ional Laboratory, Report UCID-19261, 1981.
(16) Stout, N. D., G. J. Koskinas and S. Santor, Lawrence,Livermore Nat ional Laboratory, Report UCRL-52158, November 1976.
(17) Bremner, J. M., i n Methods o f S o i l Analysis, Pa r t 2, ed i ted by C. A., Black, American Society of Agronomy, Inc., Publisher, Madison, Wisconsin, 1965.
(18) Vadovic, C. J . , ACS, Symposium on Chemistry and Geochemistry o f O i l Shale, Seatt le, Wash., March 20-25, V. 28. No. 3, pp. 148-157 (1983).
(19) Robl, T. L., P r o j e c t Coordinator, Resource Assessment o f Oi l -Bear ing Shales i n Lewis and Fleming Counties, Kentucky, V. I 1 Support ing Data, IMMR 80/D-l9/2b, 1980.
(19) Symposium, Proceedings, p132, Colorado School o f Mines Press, Golden Colorado, 1983.
(20) p. 134, Cameron Engineers, Inc., 1315 South Clarkson Street , Denver, Colorado, 80210, 1978.
The sample i s i d e n t i f i e d as " C a l i f o r n i a 117751-6.
Rubel, A. M., D. W . Koppenaal, D.N. Taulbee and T. L. Robl, 16th O i l Shale
Baughman, G. L. , Compiler, Synthet ic Fuels, Data Handboolc, Second Edi t ion,
Raw
16 18 20 22 24 26 28 30 28 ( O ) -+
Figure 1. X-ray di f fract ion pattern of raw and retorted o i l shale sample R I 8008-76 i n which buddingtonite i s found. Retorting does not e l iminate the l ines due t o buddingtonite. The large peak on the l e f t side of the ran-shale pattern i s due to dawsonlte. This mineral i s decwosed during retort ing.
346
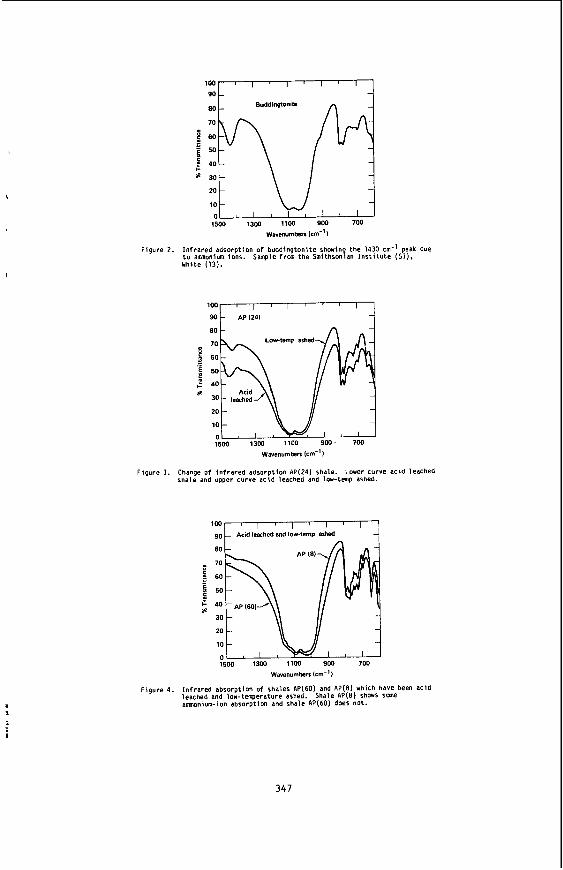
100 I I ! I I I ' I 90 - -
wavenumberr tcm-')
Figure 2. I n f ra red adsorpt ion o f buddingtoni te showing t h e 1430 cm'l peak due t o amonium ions. Sample frm t h e Smithsonian I n s t i t u t e (SI). White (13).
L O W I ~ P ashed
1500 1300 1100 900- 700
F igu re 3 . Change o f i n f r a r e d adsorpt ion AP(24) shale. Lover curve a c i d leached shale and upper curve a c i d leached and low- tmp ashed.
30 t \\ I/ 1 t 1
1 1
~avenurntm tcm-'l
F igu re 4. I n f ra red absorpt ion of shales AP(60) and AP(8) which have been a c i d leached and low-temperature ashed. a m n i u m - i o n absorpt ion and shale AP(60) does not.
Shale AP(8) shows sane
I
347
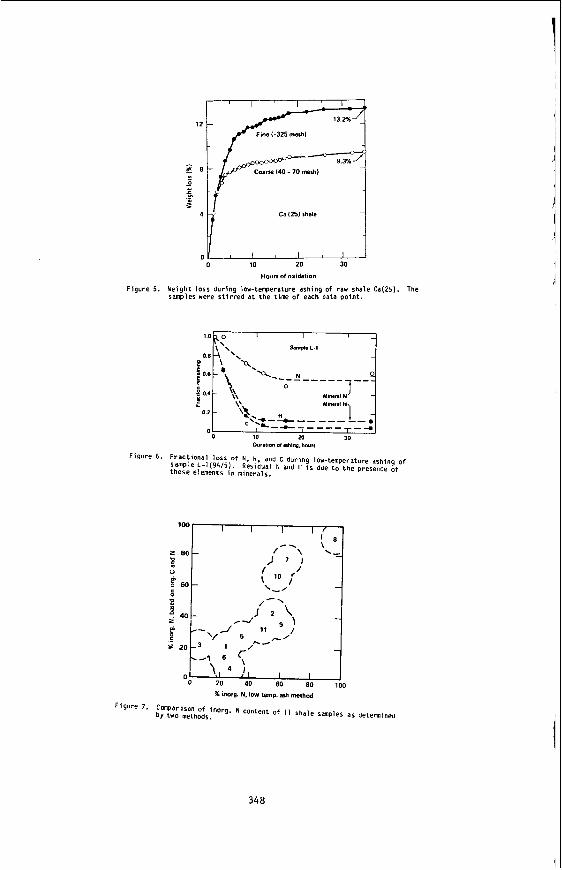
Fine (-325 mesh1 -- 2 8 Come 140 - 70 mesh)
E Ca (25) shale
10 20 30
Hours of oxidation
Figure 5 . Weight loss during low-temperature ashing of raw shale Ca(25). The samples were stirred at the time of each data point.
Figure 6. Fractional loss of N. H. and C during low-temperature ashing of Sample L-l(9A/5). these elements in minerals. Residual N and H is due to the presence of
Figure 7.
' I
determined
348
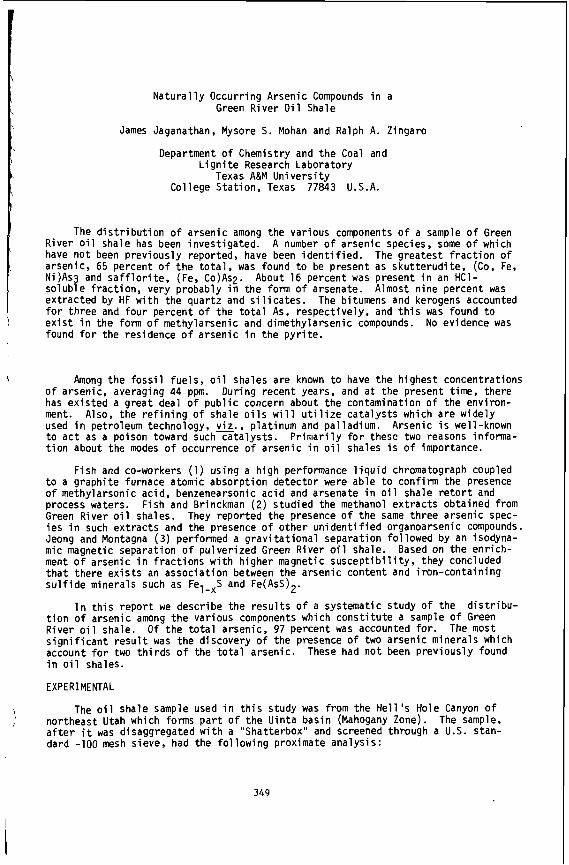
N a t u r a l l y Occurr ing Arsenic Compounds i n a Green R iver O i 1 Shale
James Jaganathan, Mysore S. Mohan and Ralph A. Z ingaro
Department o f Chemistry and t h e Coal and L i g n i t e Research Laboratory
Texas A&M Un ive rs i t y Col lege Sta t ion , Texas 77843 U.S.A.
The d i s t r i b u t i o n o f a rsen ic among the var ious components o f a sample of Green R iver o i l shale has been inves t iga ted . A number o f arsenic species, some o f which have n o t been p rev ious l y reported, have been i d e n t i f i e d . The g rea tes t f r a c t i o n of arsenic, 65 percent o f t h e t o t a l , was found t o be present as sku t te rud i te , (Co, Fe, Ni)As3 and s a f f l o r i t e , (Fe, Co)As2. so lub le f r a c t i o n , very probably i n the form o f arsenate. Almost n ine percent was ex t rac ted by HF w i t h the quar tz and s i l i c a t e s . The bitumens and kerogens accounted f o r t h ree and f o u r percent o f the t o t a l As, respec t ive ly , and t h i s was found t o e x i s t i n the form o f methylarsenic and dimethylarsenic compounds. found fo r t he residence o f a rsen ic i n the p y r i t e .
About 16 percent was present i n an HC1-
No evidence was
Among t h e f o s s i l f ue l s , o i l shales are known t o have the h ighes t concentrat ions of arsenic, averaging 44 ppm. Dur ing recent years, and a t the present t ime, there has ex i s ted a g rea t deal o f p u b l i c concern about the contaminat ion o f t he environ- ment. Also, t he r e f i n i n g o f shale o i l s w i l l u t i l i z e ca ta l ys ts which a re w ide ly used i n petroleum technology, y&. , pla t inum and palladium. Arsenic i s well-known t o a c t as a poison toward such ca ta l ys ts . t i o n about the modes o f occurrence o f a rsen ic i n o i l shales i s o f importance.
F ish and co-workers (1) us ing a h igh performance l i q u i d chromatograph coupled t o a g raph i te furnace atomic absorp t ion de tec to r were ab le t o conf i rm the presence of methylarsonic ac id , benzenearsonic a c i d and arsenate i n o i l shale r e t o r t and process waters. F ish and Brinckman (2 ) s tud ied the methanol e x t r a c t s ob ta ined from Green R iver o i l shales. They repor ted the presence of t he same th ree arsen ic spec- i e s i n such ex t rac ts and the presence o f o the r u n i d e n t i f i e d organoarsenic compounds. Jeong and Montagna (3 ) performed a g r a v i t a t i o n a l separa t ion fo l lowed by an isodyna- mic magnetic separat ion o f pu l ve r i zed Green R iver o i l shale. ment o f arsenic i n f r a c t i o n s w i t h h igher magnetic s u s c e p t i b i l i t y , they concluded t h a t there e x i s t s an assoc ia t ion between the arsen ic conten t and i ron -con ta in ing s u l f i d e minerals such as Fel-xS and Fe(AsS)2.
t i o n o f arsenic among t h e var ious components which c o n s t i t u t e a sample o f Green R iver o i l shale. The most s i g n i f i c a n t r e s u l t was the d iscovery o f the presence o f two arsen ic minera ls which account f o r two t h i r d s o f the t o t a l arsenic. i n o i l shales.
EXPERIMENTAL
The o i l shale sample used i n t h i s study was from the H e l l ' s Hole Canyon o f nor theas t Utah which forms p a r t o f t he U in ta bas in (Mahogany Zone). The sample, a f t e r i t was disaggregated w i t h a "Shatterbox" and screened through a U.S. stan- dard -100 mesh sieve, had the f o l l o w i n g proximate ana lys is :
P r i m a r i l y f o r these two reasons informa-
Based on the enr ich-
In t h i s r e p o r t we descr ibe the r e s u l t s o f a systemat ic study of the d i s t r i b u -
O f t h e t o t a l arsenic, 97 percent was accounted fo r .
These had n o t been p rev ious l y found
349
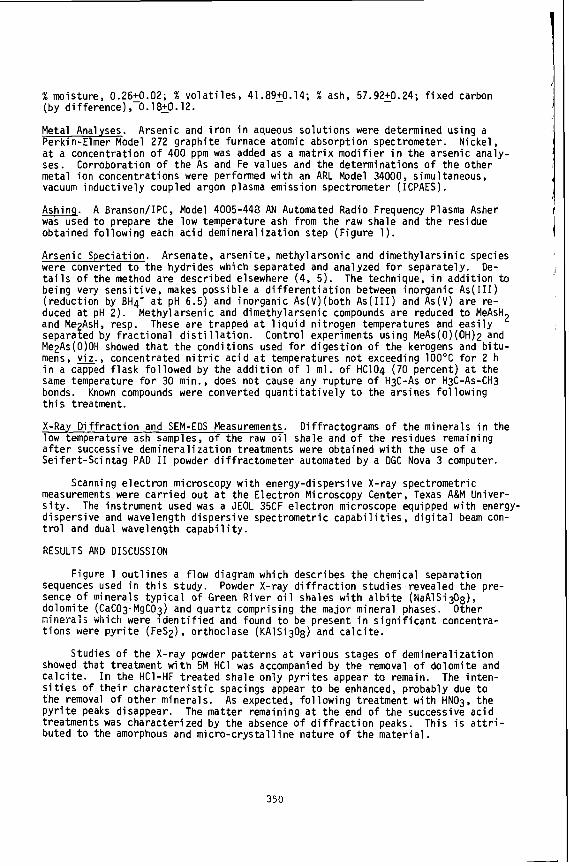
% moisture, 0.26+0.02; % v o l a t i l e s , 41.8950.14; % ash, 57.9220.24; f i x e d carbon (by d i f f e rence ) ,-0.18+0.12.
Metal Analyses. Perkin-Elmer Model 272 g raph i te furnace atomic absorp t ion spectrometer. a t a concentrat ion o f 400 ppm was added as a ma t r i x m o d i f i e r i n the arsen ic analy- ses. Corroborat ion o f the As and Fe values and the determinat ions o f t he o the r metal i o n concent ra t ions were performed w i t h an ARL Model 34000, simultaneous, vacuum i n d u c t i v e l y coupled argon plasma emission spectrometer ( ICPAES) .
Ashinq. was used t o prepare t h e low temperature ash from the raw shale and t h e residue ob ta ined fo l l ow ing each a c i d deminera l i za t ion s tep (F igure 1 ) .
Arsenic Speciat ion. Arsenate, a rsen i te , methylarsonic and d ime thy la rs in i c species were converted t o t h e hydr ides which separated and analyzed f o r separately. De- t a i l s o f the method are descr ibed elsewhere (4, 5). The technique, i n a d d i t i o n t o being very sens i t i ve , makes poss ib le a d i f f e r e n t i a t i o n between inorgan ic As ( I I1 ) ( reduc t ion by BH4- a t pH 6.5) and inorgan ic As(V)(both A s ( I I 1 ) and As(V) a re re- duced a t pH 2). Methy la rsen ic and dimethylarsenic compounds a r e reduced t o MeAsH2 and MezAsH, resp. These are t rapped a t l i q u i d n i t rogen temperatures and e a s i l y separated by f r a c t i o n a l d i s t i l l a t i o n . Control experiments us ing MeAs(O)(OH)z and MezAs(0)OH showed t h a t t he cond i t ions used f o r d iges t i on o f the kerogens and b i t u - mens, v&., concentrated n i t r i c a c i d a t temperatures n o t exceeding 100°C f o r 2 h i n a capped f l a s k fo l l owed by the a d d i t i o n o f 1 m l . o f HClO4 (70 percent ) a t the same temperature f o r 30 min., does no t cause any rup tu re o f H3C-As o r H3C-As-CH3 bonds. t h i s treatment.
X-Ray D i f f r a c t i o n and SEM-EOS Measurements. low temperature ash samples, o f t he raw o i l sha le and o f the residues remaining a f t e r successive deminera l i za t ion treatments were obtained w i t h the use o f a Se i fe r t -Sc in tag PAD I 1 powder d i f f rac tomete r automated by a DGC Nova 3 computer.
Scanning e l e c t r o n microscopy w i t h energy-dispersive X-ray spectrometr ic measurements were c a r r i e d ou t a t t he E lec t ron Microscopy Center, Texas A&M Univer- s i t y . d i spe rs i ve and wavelength d i spe rs i ve spectrometr ic c a p a b i l i t i e s , d i g i t a l beam con- t r o l and dual wavelength c a p a b i l i t y .
RESULTS AND DISCUSSION
Arsen ic and i r o n i n aqueous so lu t i ons were determined us ing a N icke l ,
A Branson/IPC, Model 4005-448 AN Automated Radio Frequency Plasma Asher
Known compounds were converted q u a n t i t a t i v e l y t o the ars ines fo l low ing
D i f f rac tograms o f t he minerals i n the
The ins t rument used was a JEOL 35CF e l e c t r o n microscope equipped w i t h energy-
Figure 1 o u t l i n e s a f low diagram which descr ibes t h e chemical separat ion sequences used i n t h i s study. sence Of minerals t y p i c a l o f Green R iver o i l shales wi th a l b i t e (NaAlSi308), do lomi te (CaC03-MgC03) and quar t z compris ing the major mineral phases. Other mfmi-a?s wiiicii were i d e n t i f i e d and found t o be present i n s i g n i f i c a n t concentra- t i o n s were p y r i t e (FeSz), o r thoc lase (KAlSi308) and c a l c i t e .
showed t h a t t reatment w i t h 5M HC1 was accompanied by the removal o f dolomite and c a l c i t e . I n the HC1-HF t r e a t e d shale o n l y p y r i t e s appear t o remain. The i n t e n - s i t i e s of t h e i r c h a r a c t e r i s t i c spacings appear t o be enhanced, probably due t o the removal of o t h e r minerals. P y r i t e peaks disappear. t reatments was charac ter ized by the absence o f d i f f r a c t i o n peaks. bu ted t o the amorphous and m i c r o - c r y s t a l l i n e na ture o f t h e ma te r ia l .
Powder X-ray d i f f r a c t i o n s tud ies revealed the pre-
Studies of t he X-ray powder pa t te rns a t var ious stages o f deminera l i za t ion
As expected, fo l low ing treatment w i t h HNO3, t h e The mat te r remaining a t t he end o f t he successive a c i d
This i s a t t r i -
350
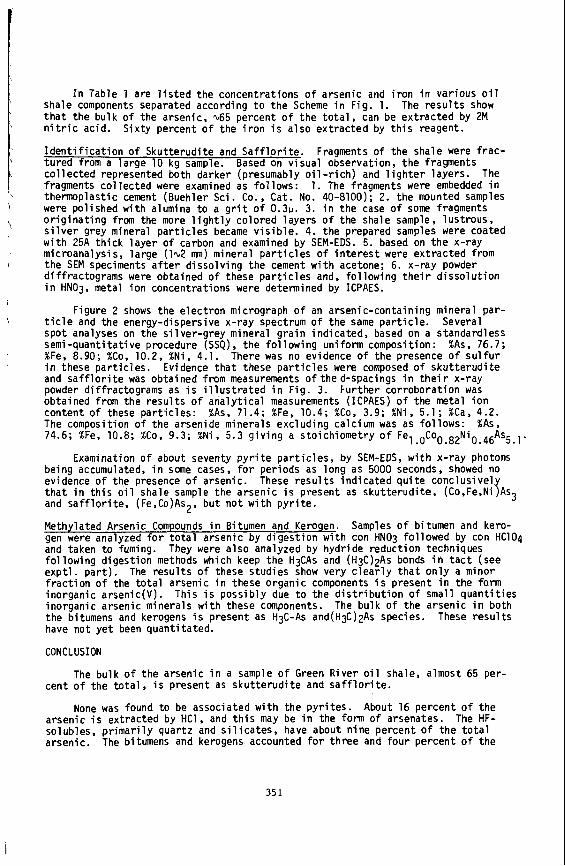
I n Table 1 are l i s t e d the concentrat ions o f a rsen ic and i r o n i n var ious o i l The r e s u l t s show shale components separated according t o the Scheme i n F ig . 1.
t h a t the bu lk o f the arsenic, %65 percent o f the t o t a l , can be ex t rac ted by 2M n i t r i c acid. S i x t y percent o f t he i r o n i s a l s o ex t rac ted by t h i s reagent.
I d e n t i f i c a t i o n o f Sku t te rud i te and S a f f l o r i t e . Fragments o f t he sha le were f rac- t u r e d from a l a rge 10 kg sample. Based on v i sua l observat ion, t h e fragments c o l l e c t e d represented both darker (presumably o i l - r i c h ) and l i g h t e r l aye rs . The fragments co l l ec ted were examined as fo l l ows : 1. The fragments were embedded i n thermop las t ic cement (Buehler Sci. Co., Cat. No. 40-8100); 2. t he mounted Samples were po l i shed w i t h alumina t o a g r i t o f 0.311. 3. i n the case o f some fragments o r i g i n a t i n g from the more l i g h t l y co lo red l aye rs o f the shale sample, l us t rous , s i l v e r grey mineral p a r t i c l e s became v i s i b l e . 4. t he prepared samples were coated w i t h 25A t h i c k l a y e r o f carbon and examined by SEM-EDS. 5. based on t h e x-ray microanalysis, l a rge (1-2 mn) mineral p a r t i c l e s o f i n t e r e s t were ex t rac ted from t h e SEM speciments a f t e r d i sso l v ing the cement w i t h acetone; 6. x-ray powder diffractograms were obtained o f these p a r t i c l e s and, f o l l o w i n g t h e i r d i s s o l u t i o n i n HNO3, metal i o n concentrat ions were determined by ICPAES.
Figure 2 shows the e lec t ron micrograph o f an arsen ic -conta in ing minera l pa r - t i c l e and the energy-dispersive x-ray spectrum o f the same p a r t i c l e . spo t analyses on the s i l ve r -g rey mineral g r a i n i nd i ca ted , based on a standardless semi -quant i ta t i ve procedure (SSQ), t he f o l l o w i n g un i fo rm composition: %As, 76.7; %Fe, 8.90; %Co, 10.2, % N i , 4.1. i n these p a r t i c l e s . and s a f f l o r i t e was ob ta ined f r o m measurements o f thed -spac ings i n t h e i r x-ray powder d i f f rac tograms as i s i l l u s t r a t e d i n F ig . 3. Fur ther co r robo ra t i on was ob ta ined from the r e s u l t s o f a n a l y t i c a l measurements (ICPAES) o f t he metal i o n conten t o f these p a r t i c l e s : %As, 71.4; %Fe, 10.4; %Co, 3.9; % N i , 5.1; %Ca, 4.2. The composition o f t he arsenide minera ls exc lud ing ca lc ium was as fo l l ows : %As, 74.6; %Fe, 10.8; %Co, 9.3; % N i , 5.3 g i v i n g a s to ich iomet ry o f Fel .0C00.82Ni0.46AS5.1
being accumulated, i n some cases, f o r per iods as long as 5000 seconds, showed no evidence o f the presence o f arsenic. These r e s u l t s i n d i c a t e d q u i t e conc lus i ve l y t h a t i n t h i s o i l shale sample the arsen ic i s present as sku t te rud i te , (Co,Fe,Ni)As3 and s a f f l o r i t e , (Fe,Co)As2, b u t n o t w i t h p y r i t e .
Methylated Arsenic Compounds i n Bitumen and Kerogen. gen were analyzed f o r t o t a l a rsen ic by d iges t i on w i t h con HN03 fol lowed by con HClO4 and taken t o fuming. f o l l o w i n g d iges t i on methods which keep the H3CAs and (H3C)zAs bonds i n t a c t (see e x p t l . p a r t ) . f r a c t i o n o f the t o t a l a rsen ic i n these organ ic components i s p resent i n the form inorgan ic arsenic(V). inorgan ic arsenic minera ls w i t h these components. t he bitumens and kerogens i s p resent as H3C-As and(H3C)zAs species. have no t y e t been quant i ta ted .
CONCLUSION
Several
There was no evidence o f t h e presence of s u l f u r Evidence t h a t these p a r t i c l e s were composed o f s k u t t e r u d i t e
Examination o f about seventy p y r i t e p a r t i c l e s , by SEM-EDS, with x - ray photons
Samples o f bitumen and kero-
They were a l s o analyzed by hydr ide reduc t ion techniques
The r e s u l t s o f these s tud ies show very c l e a r l y t h a t o n l y a minor
Th is i s poss ib l y due t o t h e d i s t r i b u t i o n o f smal l q u a n t i t i e s The bu lk o f the arsen ic i n both
These r e s u l t s
The bu lk o f t h e arsen ic i n a sample o f Green R ive r o i l shale, a lmost 65 per -
None was found t o be associated w i t h the p y r i t e s .
cen t o f t he t o t a l , i s p resent as s k u t t e r u d i t e and s a f f l o r i t e .
arsenic i s ex t rac ted by HC1, and t h i s may be i n the form o f arsenates. solubles, p r i m a r i l y quar tz and s i l i c a t e s , have about n ine percent o f t h e t o t a l arsenic.
About 16 percent o f t h e The HF-
The bitumens and kerogens accounted f o r t h r e e and f o u r percent o f t h e
35 1
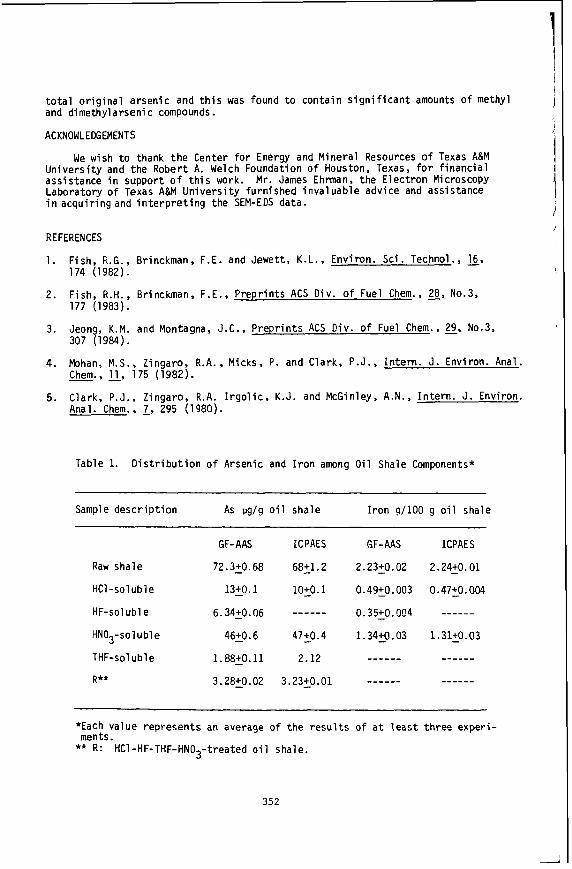
t o t a l o r i g i n a l a rsen ic and t h i s was found t o conta in s i g n i f i c a n t amounts o f methyl and dimethylarsenic compounds.
ACKNOWLEDGEMENTS
We wish t o thank t h e Center f o r Energy and Minera l Resources o f Texas A&M Un ive rs i t y and the Robert A. Welch Foundation o f Houston, Texas, f o r f i n a n c i a l assistance i n support o f t h i s work. Mr . James Ehrman, the E lec t ron Microscopy Laboratory o f Texas A&M U n i v e r s i t y fu rn ished inva luab le advice and assistance i n acqu i r ing and i n t e r p r e t i n g the SEM-EDS data.
REFERENCES
1. Fish, R.G., Brinckman, F.E. and Jewett, K.L., Environ. Sci . Technol., &, 174 (1982).
2. Fish, R.H., Brinckman, F.E., P rep r in t s ACS Div. o f Fuel Chem., 111, No.3, 177 (1983).
3. Jeong, K.M. and Montagna, J.C., P rep r in t s ACS Div. o f Fuel Chem., 29, No.3, 307 (1984).
4. Mohan, M.S., Zingaro, R.A., Micks, P. and Clark, P.J., I n t e r n . J. Environ. Anal. - Chem., 11. 175 (1982).
5. Clark, P.J., Zingaro, R.A. I r g o l i c , K.J. and McGinley, A.N., I n te rn . J. Environ. Anal. Chem., 7, 295 (1980).
Table 1. D i s t r i b u t i o n o f Arsenic and I r o n among O i l Shale Components*
Sample d e s c r i p t i o n As pg/g o i l shale I r o n p / l O O g o i l shale
GF- AAS ICPAES GF-AAS ICPAES
Raw shale 72.3L0.68 6851.2 2.23f_0.02 2.24+0.01
HC1-soluble 1320.1 lO+O. 1 0.49+0.003 0.47+0.004
HF-soluble 6.34k0.06 ------ 0.352G.004 ------ HN03-so1uble 4620.6 4750.4 1.3420.03 1.3120.03
__-_-_ ------ THF-soluble 1.8820.11 2.12
R** 3.2820.02 3.23fp.01 --_--- -_----
*Each value represents an average o f the r e s u l t s o f a t l e a s t t h ree exper i -
** R : HC1-HF-THF-HN03-treated o i l shale. ments.
352
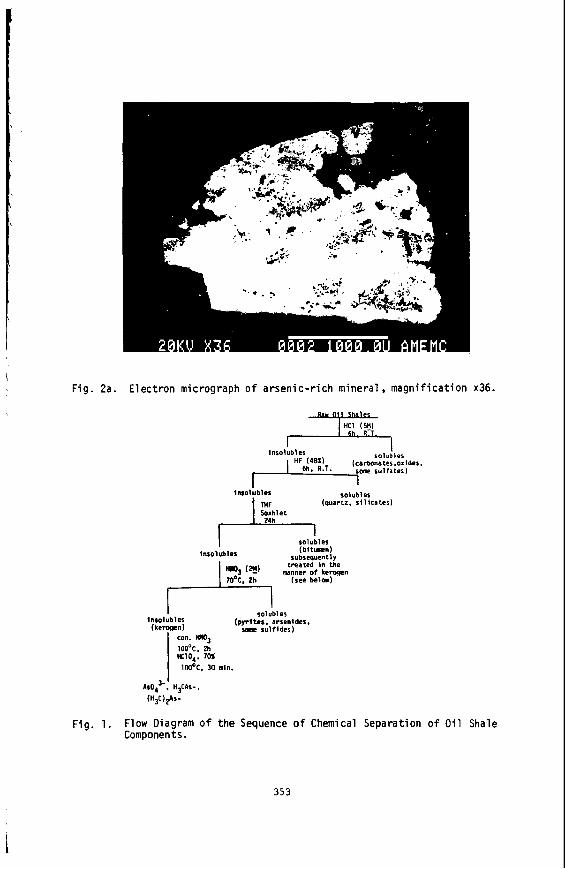
\ F i g . 2a. Electron micrograph o f arsenic-r ich mineral, magnification x36.
I lnsolubler rolubler
1 mol bbl cs solubles I ;:, , (quartz. sillcater) %ahlet
solubles (bituncn)
treated i n the
I lnsolubles subsequently
m3 (a) manner o f kenwen 70%. 2h (see b e l a )
solubles (pyrites. arsenides. 1 ntol ubl e5
O m m e n ) s m sulfides) con. KND3 100°C, 2h K104, 702
100'c. 30 min. I
AsO:-, H3CAs-.
(H3C)ps-
Fig. 1. Flow Diagram of the Sequence of Chemical Separation o f Oil Shale Components.
353
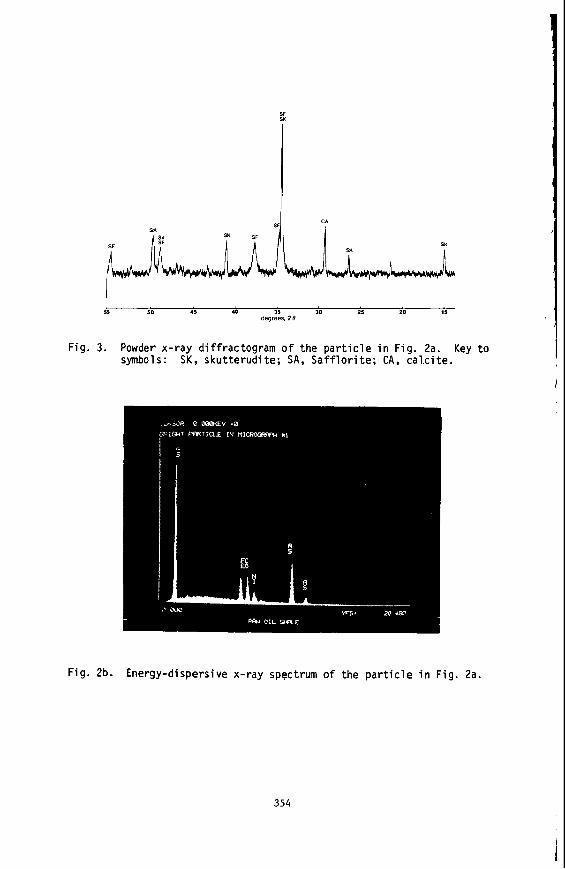
SF SK
Fig. 3 . Powder x-ray diffractogram of the particle in Fig. 2a. Key to symbols: SK, skutterudite; SA, Safflorite; CA, c a k i t e .
Fig. 2b. Energy-dispersive x-ray spectrum of the particle in Fig. 2a
354
Effect o f Acid-Clay Treatment on Ni t rogen Compound D i s t r i b u t i o n i n Fuels from Shale O i l
Steven A. Holmes and Wi l l i am E. B lanton
Western Research I n s t i t u t e P. 0. Box 3395, U n i v e r s i t y S ta t i on
Laramie, Wyoming 82071
INTRODUCTION
The p roper t i es o f f u e l s have been s tud ied ex tens i ve l y i n r e l a t i o n t o the e f fec ts o f processing on them and t h e i r e f f e c t on thermal and/or storage i n s t a b i l i t y . Studies i n d i c a t e n i t rogen species i n hydrot reated f u e l s de r i ved from shale o i l have de le te r i ous e f f e c t s on f u e l s t a b i l i t y (1) . The spec ia t i on o f n i t rogen compounds a t ppn l e v e l s i n f u e l prov ides i n fo rma t ion regard ing f u e l s t a b i l i t y and a l l ows poss ib le s e l e c t i o n o f an t i ox idan t add i t i ves . However, l i t t l e i n fo rma t ion i S a v a i l a b l e regard ing spec ia t i on o f n i t r o g e n compounds a t t r a c e l e v e l s i n fue l s .
Comparing physicochemical p roper t i es o f an o i l before and a f t e r processing has provided i n s i g h t t o processing e f f e c t s . Ni t rogen compound-type d i s t r i b u t i o n s i n crude shale o i l and i n fue l s produced by c a t a l y t i c hydrotreatment have been stud ied (2,3). Cata lyst s e l e c t i v i t y toward hydrodeni t rogenat ion o f d i f f e r e n t n i t r o g e n types has been determined. Other o i l - upg rad ing schemes have incorporated a c i d treatment o f shale o i l s (4). In 1979. Standard O i l o f Ohio (Sohio) hydrot reated shale o i l t o remove 80 percent o f i t s n i t rogen; however, about 3350 ppn n i t r o g e n remained i n the hydrot reated products (5). These products were subsequently t r e a t e d w i t h a c i d and c l a y t o remove res idua l fuel-bound n i t r o g e n and c o l o r bodies, making the f i n i s h e d products storage s tab le. F in ished j e t f u e l conta ined l e s s than one ppll n i t rogen , and f i n i s h e d d iesel f ue l conta ined 23 ppn n i t rogen. Sohio repo r ted t h a t ac id -c lay treatment a l so removed non-nitrogen con ta in ing compounds.
With the development o f high r e s o l u t i o n gas chromatographic c a p i l l a r y columns and computer data base reduc t i on systems, a n a l y t i c a l techniques have al lowed e f f i - c i e n t spec ia t i on o f n i t rogen compounds i n f u e l s (6) . The f o l l o w i n g work presents the spec ia t i on o f n i t rogen compounds i n hydrot reated and f i n i s h e d f u e l s der ived from shale. A comparison o f these compound types i s used t o discuss e f f e c t s o f ac id -c lay treatment o f the fue l s . An ana lys i s o f t he n i t r o g e n types i n the f i n i s h e d f u e l i s discussed i n terms o f t h e i r r e a c t i v i t y toward f u e l i n s t a b i l i t y .
EXPERIMENTAL
Hydroprocessing o f Shale O i l
Shale o i l from t h e Paraho d i r e c t heat r e t o r t was hydroprocessed by Sohio under a con t rac t w i t h the U.S. Departments o f Energy and Defense (5). Whole crude o i l was c a t a l y t i c a l l y hydrot reated over d nickel-molydenum c a t a l y s t and then f r a c t i o n a t e d by d i s t i l l a t i o n t o maximize y i e l d s o f m i l i t a r y t r a n s p o r t a t i o n fue l s , j e t f u e l s (JP-5 and Jp-8) and d iese l f u e l marine (OFM). Each hydrot reated f u e l was t r e a t e d with ac id and c lay. About 10.8 kg o f 93 weight percent s u l f u r i c a c i d was used t o con tac t each bb l of f u e l ; the ac id - t rea ted fue l was separated from the a c i d sludge and passed through c l a y f i l t e r s . a c l a y contactor , and f i n a l f i l t e r t o product storage. An a n t i o x i d a n t was added t o the ac id -c lay t rea ted fue l . The e f f e c t o f a c i d - c l a y t r e a t - ment on n i t rogen compound-type d i s t r i b u t i o n was inves t i ga ted by ana lyz ing the com- pos i t i ons o f the hydrot reated OFM and the f i n i s h e d DFM.
355
F r a c t i o n a t i o n by Adsorpt ion Chromatography
prepara t ive alumina adsorp t ion chromatography was used t o f r a c t i o n a t e the hydro t rea ted OFM and f i n i s h e d DFM i n t o hydrocarbon and n i t rogen f rac t i ons . An accu- r a t e l y weighed amount o f hydrotreated OFM (about 10 grams) was d i l u t e d w i t h 100 m l of hexane and pumped o n t o bas ic alumina i n a 0.9 cm i.d. x 50 cm glass column. An add i t i ona l 100 m l o f hexane e lu ted the hydrocarbon f r a c t i o n from bas ic alumina. The n i t r o g e n f r a c t i o n was backf lushed from t h e column w i t h 40 volume percent ethanol i n to luene. Because some n i t r o g e n compounds remained i n t h e hydrocarbon f r a c t i o n , t h i s f r a c t i o n was chromatographed again on neu t ra l alumina i n t o hydrocarbon and py r id ine . f ract ions. An a c c u r a t e l y weighed amount o f t h e f i n i s h e d DFM (about 174 grams) was d i l u t e d w i th 1800 m l hexane and pumped onto neu t ra l alumina. An add i t i ona l 100 m l o f hexane e lu ted t h e hydrocarbon f r a c t i o n from t h e column and the n i t rogen f r a c t i o n was backf lushed from the n e u t r a l alumina w i t h 40 volume percent methanol i n benzene. Rates for sample charg ing and f r a c t i o n e l u t i o n were 6 ml/min. Solvents were care- f u l l y removed from f r a c t i o n s under reduced pressure. So lvent - f ree f r a c t i o n s were weighed and s to red under n i t r o g e n i n r e f r i g e r a t e d amber g lass conta iners u n t i l compound-type analyses.
Ana ly t i ca l Methods
Elemental n i t rogen i n t h e fue l s and t h e i r f r a c t i o n s was determined by chemi- luminescence de tec t ion . Standard so lu t i ons ranging from 3 x 10⁻² M t o 5 x 10⁻⁵ M 9- methy lcarba to le i n t o l u e n e were used as ca l i b ran ts . Amounts o f bas ic n i t rogen were determined by p o t e n t i o m e t r i c t i t r a t i o n ana lys is us ing acetoni t r i l e-to1 uene and a c e t i c anhydr ide-toluene w i t h pe rch lo r i c ac id i n dioxane as t i t r a n t (3) . These repor ted values are accura te w i t h i n f 3 r e l a t i v e percent. I n f r a r e d spec t ra were obtained with a Perkin-Elmer model 621 g r a t i n g spectrophotometer. The n i t rogen- c o n t a i n i n g f r a c t i o n s were d i l u t e d i n methylene ch lo r ide , and spectra recorded i n t h e absorbance mode us ing s o l v e n t compensation w i t h a matched p a i r o f potassium ch lo r i de i n f r a r e d c e l l s o f path l e n g t h 0.5 mm.
High r e s o l u t i o n gas chromatographic ana lys is (HRGC) o f t h e n i t rogen-conta in ing f rac t i ons was done with an HP model 573DA equipped w i t h a c a p i l l a r y column i n l e t system. A 60-meter DE-1 fused s i l i c a c a p i l l a r y column was used w i t h a g lass e f f l u e n t s p l i t t e r ( 1 : l ) f o r s imultaneous flame i o n i z a t i o n (FID) and nitrogen-phosphorous d e t e c t i o n (NPD). Hel ium was used as c a r r i e r gas. Column l i n e a r f l ow v e l o c i t y was 20 cm/sec. Samples were d i l u t e d w i t h methylene ch lo r i de , and s p l i t l e s s i n j e c t i o n s hav ing a 45-second delay t ime were used w i t h a 3OoC i n i t i a l oven temperature f o r t he n i t rogen-conta in ing f r a c t i o n s from the hydro t rea ted DFM. A 14OOC i n i t i a l oven tem- p e r a t u r e was used f o r t h e n i t rogen f r a c t i o n from the f i n i s h e d DFM. Oven temperature was programed t o 300'C a t Z°C/min.
S i m i l a r gas chromatographic cond i t ions descr ibed above were employed f o r com- pound-type ana lys i s by h i g h r e s o l u t i o n gas chromatography/mass spectrometry (HRGC/- MS). An upgraded HP model 5985 was used w i t h an i n t e r f a c e temperature o f 300OC. Source temperature was 2OO0C, and i o n i z a t i o n vo l tage was 70V. A mass range from 45 t o 500 amu was scanned.
RESULTS AN0 DISCUSSION
Concentrat ion of N i t rogen Compounds by Chromatograph1
The n i t rogen compounds i n t h e f u e l s were concentrated t o f a c i l i t a t e d e t a i l e d compound-type c h a r a c t e r i z a t i o n . Two n i t rogen-conta in ing f r a c t i o n s from the hydro- t r e a t e d DFM and one n i t r o g e n f r a c t i o n from t h e f i n i s h e d DFM were generated by a lu - mina adsorpt ion chromatography. A py r id ine f r a c t i o n from the hydrotreated DFM was i d e n t i f i e d by i t s d i s t i n c t i n f r a r e d absorbances a t 1598 cm-1 (C=C s t r e t c h ) and 1557 cm-l (C=N s t r e t c h ) , suggest ing the presence o f p y r i d i n i c compounds. The absence of these absorbances i n t h e f i n i shed DFM confirmed t h e lack o f a p y r i d i n e f rac t i on
356
\ \
as Well as p y r i d i n i c compounds. The n i t rogen f r a c t i o n s from both f u e l s d i sp layed N- H s t r e t c h i n g a t 3460 cm-1. suggesting the presence o f p y r r o l i c compounds.
Ni t rogen compounds comprised 6 weight percent and 0.13 weight percent o f the hydrot reated DFM and f i n i s h e d DFM (Table 1). respec t i ve l y . The low n i t r o g e n contents i n the p y r i d i n e f r a c t i o n (2.92 weight percent) and i n the n i t r o g e n f r a c t i o n from the f i n i shed OFM ( 1 . 6 2 weight percent) suggest the presence o f non-n i t rogen con ta in ing compounds. However, exce l l en t n i t rogen recovery was obtained. About 99 percent and 91 percent o f the n i t rogen from the hydrot reated DFM and f i n i s h e d DFM. respec t i ve l y , was concentrated i n t h e p y r i d i n e and n i t rogen f rac t i ons .
Amounts o f bas ic n i t rogen were determined i n each o f t he n i t rogen-con ta in ing f r a c t i o n s and are presented i n Table 2. A l l t he n i t rogen i n the p y r i d i n e f r a c t i o n was weak base (pka 7 t o 9). suggesting the presence o f py r id ine de r i va t i ves . The po ten t i omet r i c t i t r a t i o n ana lys i s o f the n i t r o g e n f r a c t i o n from the hydrot reated DFM ind i ca tes no t on l y p y r i d i n i c compounds but a l so the presence o f arylamines and hydrogenated indoles and/or qu ino l ines (pka 2 t o 7), and indo les and carbazoles (nonbasic n i t rogen) . The n i t rogen f r a c t i o n from the f i n i s h e d DFM conta ins predomi- n a t e l y nonbasic n i t rogen which does no t undergo extens ive a c e t y l a t i o n ( 2 7 percent) i n ace t i c anhydride; t h i s suggests the presence o f nonactive hydrogens i n i ndo le - and/or carbazole-type compounds.
HRGC/FID/NPD and HRGC/MS Analysis
HRGC w i t h simultaneous de tec t i on by FID and NPD was used t o e s t a b l i s h opt imal gas chromatographic cond i t i ons f o r the HRGC/MS ana lys i s presented below. Acceptable peak r e s o l u t i o n w i thou t t a i l i n g was achieved on the apolar chromatographic column. I n Figure 1. the one-to-one peak correspondence o f each de tec to r response t o the components i n the n i t royen f r a c t i o n from the hydrot reated DFM suggests t h a t t h i s f r a c t i o n contains compounds w i t h a t l e a s t one n i t rogen atom. Phosphorous i s mot expected t o be present i n these f r a c t i o n s . However, i n Figure 2 the FID/NPD r e - sponses o f the species from the f i n i s h e d DFM i n d i c a t e few n i t r o g e n compounds which have long column r e t e n t i o n times ( i n i t i a l oven temperature, 140°C). FID/NPD r e - sponses f o r species i n the p y r i d i n e f r a c t i o n i n d i c a t e the presence o f non-nitrogen- con ta in ing compounds. The n i t rogen species i n the p y r i d i n e f r a c t i o n a re d i s t r i b u t e d about in termediate column r e t e n t i o n t imes compared w i t h the longer times f o r species i n the n i t royen f rac t i ons .
Ni t rogen i n the p y r i d i n e f r a c t i o n i s p r i m a r i l y found i n the isomers o f a l k y l - subs t i t u ted d ihydropyr id ines, py r id ines , qu ino l ines, and te t rahyd roqu ino l i nes shown i n Table 3. It i s noteworthy t h a t many d i f f e r e n t isomers o f a l ky l t e t rahyd roqu ino - l i n e s are i nd i ca ted r e l a t i v e t o fewer a l ky lqu ino l i nes . The bui ldup o f t e t rahyd ro - qu ino l ines i s i n d i c a t i v e o f t he r a t e determin ing s tep i n the hydrogenation o f quino- l i n e . The la rge number of isomers o f a l k y l p y r i d i n e s has been observed p rev ious l y ( 7 ) . Not l i s t e d f o r the p y r i d i n e f r a c t i o n are non-n i t rogen-conta in ing compounds which i nc lude a l k y l - s u b s t i t u t e d benzenes, naphthenes, b iphenyls , and 9-H f luorenes. Because compound-type s e n s i t i v i t y f a c t o r s were no t a v a i l a b l e a t the t ime o f analy- s i s , q u a n t i t a t i v e data were n o t obtained.
Large numbers of isomers o f alkyltetrahydroquinolines and a l k y l p y r i d i n e s are i nd i ca ted by HRGC/MS ana lys i s o f t he n i t r o g e n f r a c t i o n from hydrot reated DFM. These r e s u l t s are l i s t e d i n Table 3. I n f r a r e d absorbances a t 3375 (N-H s t r e t c h ) and 1612 cm-1 and po ten t i omet r i c t i t r a t i o n ana lys i s (pka 2 t o 7 ) suggest t h a t arylamines a r e a l so i n t h i s f rac t i on . Because chemical i o n i z a t i o n was no t done, ana lys i s by e l e c t r o n impact i o n i z a t i o n cannot d i f f e r e n t i a t e arylamines from py r id ines . Previous work (8) showed about 15 percent o f t he py r id ines may be comprised o f arylamines. In add i t i on , a l k y l - s u b s t i t u t e d pyrro les. i ndo les , and carbazoles are present.
The r e t e n t i o n t ime o f carbazole i n the t o t a l i o n CUffent chromatogram (TICC) of t he n i t rogen f r a c t i o n from the hydrot reated DFM i s i nd i ca ted i n Figure 3. The ex-
357
t r a c t e d i o n cu r ren t p r o f i l e s (EICP) of methylcarbazoles and dimethylcarbazoles are shown i n F i g u r e 4. These compound types have long column r e t e n t i o n times, and they comprise minor amounts o f n i t rogen i n the f u e l as i nd i ca ted by t h e i r i o n i n t e n s i - t i e s .
The HRGC/MS a n a l y s i s o f the n i t rogen f r a c t i o n from the f i n i shed DFM was f a c i l i - t a t e d by matching i t s FID/NPD chromatograms (F igure 2) with t h a t o f i t s T I C C . Mass spec t ra l f ragmentat ion pa t te rns o f t h e few n i t rogen-conta in ing compounds i n t h i s f rac t i on a re t e n t a t i v e l y i d e n t i f i e d as carbazole, methylcarbazoles, and dimethyl- carbazoles. Except f o r t he i o n i n t e n s i t y o f carbazole i n t h e f i n i s h e d DFM, r e l a t i v e i n t e n s i t i e s o f t h e a lky lcarbazo les i n t h e f i n i s h e d DFM agree very we l l w i t h those i n t h e hydrotreated DFM. No o the r n i t rogen types were i d e n t i f i e d ; however, t h i s does not preclude m i nor amounts undetected a t base1 i n e l eve l s . The non-ni t rogen-contain- i n g compounds were a1 k y l - subs t i t u ted naphthalenes and 9-H f luorenes.
E f f e c t o f Acid-Clay Treatment on Nitrogen Compound D i s t r i b u t i o n
A comparison o f t h e n i t r o g e n compound d i s t r i b u t i o n s i n f u e l s be fore and a f t e r acid-clay t reatment demonstrates which n i t rogen types are suscept ib le t o removal. Acid-clay e f f e c t i v e l y removed 99.3% o f t h e n i t rogen from t h e hydro t rea ted DFM. As expected, bas ic n i t r o g e n compounds such as arylamines form s a l t s i n reac t i on w i t h ac id ; py r id ine d e r i v a t i v e s adsorb i n t o a c i d i c medium and/or p a r t i c i p a t e i n e lec t ro - p h i l i c s u b s t i t u t i o n reac t ions , and both compound types are removed as ac id sludge. A py r id ine f r a c t i o n was present only i n t h e hydrotreated f u e l and was completely removed by the a c i d - c l a y treatment. Very weak base and nonbasic n i t rogen compounds such as indo les , which experience adsorp t ion and/or a c i d c a t a l y s i s and po lymer iza t ion r e a c t i o n s , are e f f e c t i v e l y removed by ac id -c lay treatment. I n t e r e s t i n g l y , some carbazo le de r i va t i ves s u r v i v e ac id -c lay t reatment. E a r l i e r work (8 ) showed carbazole d e r i v a t i v e s c o n s t i t u t e d about 66 ppm n i t rogen i n the hydrotreated DFM. Therefore, ac id -c lay removed almost two- th i rds o f t h e carbazole d e r i v a t i v e s f rom t h e hydro t rea ted DFM. Nonbasic carbazoles are s o l u b l e i n mineral acids; t h e i r r e l a t i v e u n r e a c t i v i t y al lows some t o remain i n t h e f i n i s h e d fue l .
I n the a c i d - c l a y t reatment o f j e t f u e l (JP-8), n i t rogen was not detected i n the f i n i s h e d f u e l . High r e s o l u t i o n mass spec t romet r ic ana lys i s o f t h e hydro t rea ted JP-8, which contained 3000 ppm n i t rogen, i nd i ca ted s i m i l a r n i t rogen- type d i s t r i b u t i o n t o t h a t i n the hydro t rea ted DFM, except carbazole d e r i v a t i v e s were no t detected. Acid and c l a y e f f e c t i v e l y removed a l l n i t rogen types from t h e JP-8 fue l . Carbazole de r i v - a t i v e s i n t r a n s p o r t a t i o n f u e l s a re the n i t rogen compounds l e a s t a f fec ted by acid- c l a y treatment.
The importance o f determining res idua l n i t rogen types i n f i n i s h e d fue l s re la tes t o fuel s t a b i l i t y . Aromatic n i t rogen compounds have measurable sediment under low temperature s to rage cond i t ions . Work repor ted (9) on model compounds has i nd i ca ted t h a t s-pwtric.!, h igh ly :ondensed aromatic n i t rogen compounds appear l e s s reac t i ve than the p a r t i a l l y hydrogenated counterparts or h i g h l y a l ky la ted he terocyc l i cs . These model compound s tud ies suggest carbazole d e r i v a t i v e s do no t p a r t i c i p a t e as s i g n i f i c a n t l y i n sediment format ion as do p y r r o l e and indo le de r i va t i ves . Syner- g e s t i c e f fec ts a l so p l a y an important r o l e i n sediment format ion p a r t i c u l a r l y as t h e hydrocarbon m a t r i x becomes more complex: n-decane<jet fue l <d iese l f ue l . The n i t r o g e n d i s t r i b u t i o n s i n t h e f i n i shed DFM and JP-8 f u e l s i n d i c a t e these f u e l s may be Storage s tab le . However, non-ni t rogen compound types i n these f u e l s may very we l l a f fec t fuel s t a b i l i t y .
I n summary, t he a n a l y t i c a l techniques presented have been app l ied success fu l l y t o t h e ana lys is o f moderate and t race q u a n t i t i e s o f n i t rogen i n fue l s . The determi- n a t i o n o f n i t rogen compound d i s t r i b u t i o n s a i d i n understanding t h e e f f e c t s o f fue l processing and i n d i s c u s s i n g f u e l s t a b i l i t y .
358
ACKNOWLEDGMENTS
The authors are indebted t o E. T. Robinson o f Sohio f o r d iscussions of t h i s work. The authors thank the f o l l o w i n g personnel a t W R I f o r t h e i r t e c h n i c a l c o n t r i - but ions: L. F. Thompson, F. A. Barbour, S-L Chong, and M. Harnsberger. They a l s o thank R.E. Robertson f o r reviewing the manuscr ipt and 14. E. Marron f o r e d i t o r i a l suggestions.
1.
2.
3.
4.
5.
6.
7.
8.
9.
LITERATURE CITED
Frankenfeld, J. W., W. F. Taylor, and D. W. Brinkman. Exxon R and E Co., U.S. Department o f Energy Contract Report No. DOE/BC/10045-12 (1981).
Bett . A., T. G. Harney, T. W. Matheson. and K. C. P ra t t . E, 62, 1445 (1983).
Holmes, S. A. and L. F. Thompson. Prepr in ts , Oiv. o f Petrol . Chem., ACS, 29 ( l ) , 269 (1984).
Rei f . H. E., J. P. Schwedock. and A. Schneider. "An Exp lora tory Research and Development Program Leading t o S p e c i f i c a t i o n s f o r Av ia t ion Turbine Fuel From Whole Crude Shale O i l . Par t V," F ina l Report AFWAL-TR-81-2087, March 1982. Ava i lab le from NTIS.
Evin, C. G. and E. T. Robinson. "The Commercial-Scale R e f i n i n g o f Paraho Crude Shale O i l I n t o M i l i t a r y Fuels," O f f i c e o f Naval Research, Navy Contract N0014- 79-C-0061. Sept. 1979.
E l l i s , L. C., and P. T. Crisp. 2. E., 292. 355 (1984).
Cooney, J. V.. E. J. Beal, and R. N. Hazlet t . Prepr in ts , Div. o f Pet ro l . Chem., ACS. 29 ( 1 ) , 247 (1984).
Holmes, S. A., and L. F. Thompson. Fuel. 62, 709 (1983).
Frankenfeld, J. W., W. F. Taylor, and D. W. Brinkman. Exxon R and E Co.. U.S. Department o f Energy Contract Report No. DOE/BC/10045-23 (1982).
DISCLAIMER
Mention o f s p e c i f i c brand names or models o f equipment i s f o r i n f o r m a t i o n o n l y and does no t imply endorsement.
359
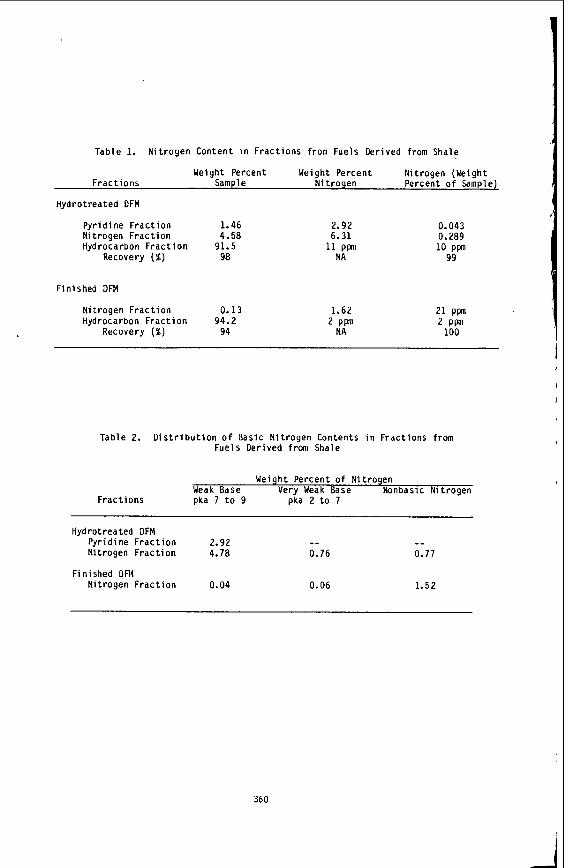
Table 1. N i t rogen Content i n Fract ions from Fuels Derived from Shale
Weight Percent Weight Percent Ni t rogen (Weight F rac t i ons Sample Ni t rogen Percent o f Sampler
Hydrotreated DFM
Pyr id ine F rac t i on 1.46
Hydrocarbon F r a c t i o n 91.5 Nitrogen F rac t i on 4.58
Recovery (I) 98
Finished DFM
Nitrogen F rac t i on 0.13 Hydrocarbon F r a c t i o n 94.2
Recovery (%) 94
2.92 0.043 6.31 0.289
11 P P 10 ppm NA 99
1.62 2 Ppm
NA
2 1 PW 2 Ppm
100
Table 2. D i s t r i b u t i o n o f Basic Ni t rogen Contents i n Fract ions from Fuels Derived from Shale
Weight Percent o f Ni t rogen Weak Base Very Weak Base Nonbasic Ni t rogen
F rac t i ons pka 7 t o 9 pka 2 t o 7
Hydrotreated DFM Pyri d i ne F rac t i on 2.92 Nitrogen .F rac t i on 4.70
_- 0.76
-- 0.77
Finished DF14 Nitrogen F r a c t i o n 0.04 0.06 1.52
360
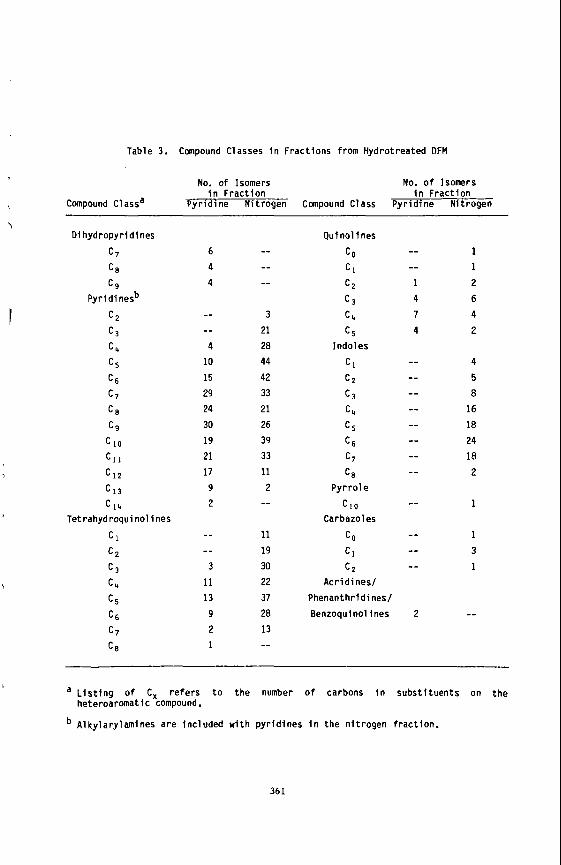
Table 3. Compound Classes i n Frac t ions from Hydrotreated DFM
No. o f Isomers No. o f Isomers i n F rac t i on i n F rac t i on
\ Compound C1 assa Py r id ine N i t rogen Compound Class Py r id ine N i t rogen
\ D i hydropyr id ines
c 7
C 8
C9
c 2
c 3
c 4
c 5
c 7
C 8
C 9
c 10
C l l 1 c 1 2
Pyri d i nesb
c 6
c 1 3
I 4
Tetrahydroquinol i nes
C l
c 2
c 3
c 4
c 5
c 7
C 8
c 6
6 4 4
-- -- 4 10 15 29 24 30 19 21 17 9 2
-- -- 3
11 13 9 2 1
_- -- --
3 21 28 44 42 33 21 26 39 33 11 2
--
11 19 30 22 37 28 13 --
Q u i n o l i n e s
CO
C l c 2
c 3
c 4
c 5
C l
c 2
c 3
c 4
c5
c 7
C 8
P y r r o l e
C I O Carbazoles
CO
C l
c 2
Indo les
c 6
Acr id ines /
Phenanthr id ines/
Benzoquinolines
1 1 2 6 4 2
4 5 8 16 18 24 18 2
1
1 3 1
--
I a L i s t i n g o f C, re fe rs t o t h e number o f carbons i n s u b s t i t u e n t s on t h e
heteroaromat ic compound.
A lky la ry lamines a re inc luded w i t h py r id ines i n t h e n i t rogen f rac t i on .
36 1
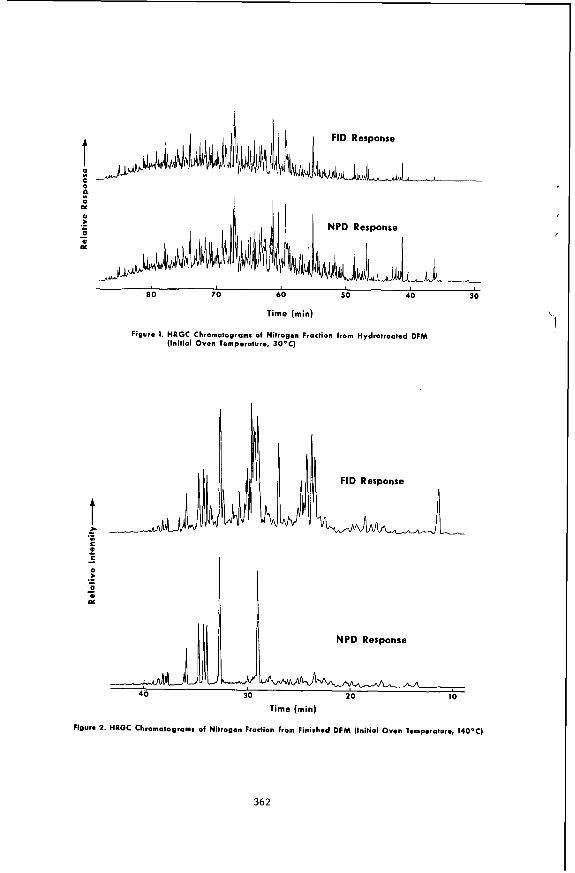
80 7 0 60 5 0 40 30
Time (min)
Figure 1. HRGC Chromatograms of Nitrogen Froction from Hydrotreoted DFM (Initial Oven lemperoturo, 30°C)
FID Response
d NPD Response
Time (min)
Fiaura 2. HRGC Chromatoprams of Nitrogen Fraction from Finirhad DFM (Initial Oven Tomparaturo, 14OPC)
362
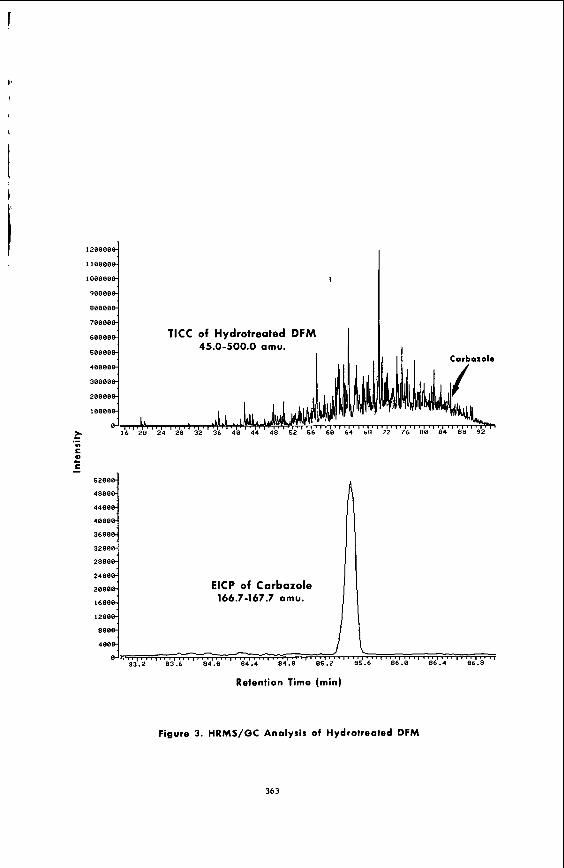
120000
110000
100000
90000
80000
70000
60000
50000
40000
30000
20000
10000
A 4800
4400
4000
3600
3200
2800
2400
2000 ElCP of Carbazole 166.7-167.7 amu. 1600
1200
000
400
I
TlCC of Hydrotreated DFM 45.0-500.0 amu.
Retention Time (min)
Figure 3. HRMS/GC Analysis of Hydrotreated DFM
363
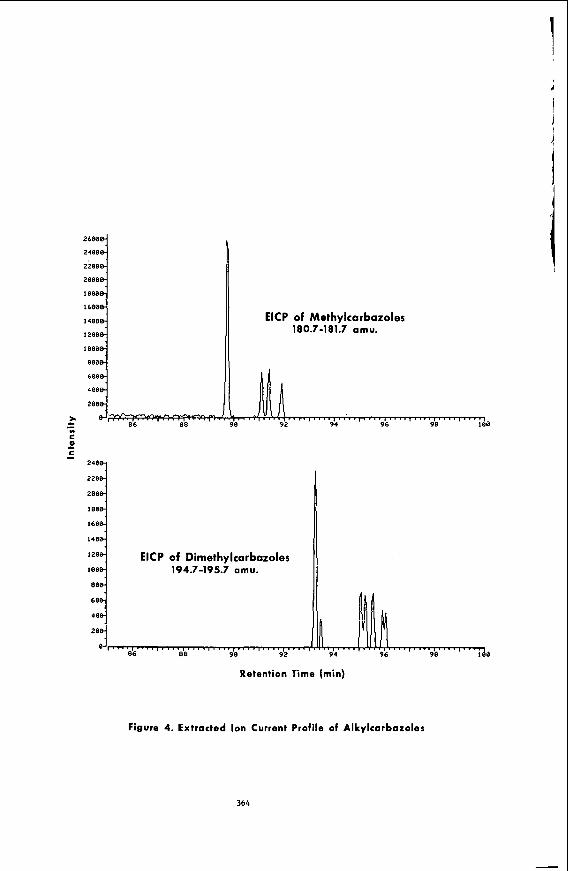
ElCP of Methylcarbazoles 180.7-1 81.7 am u.
240
220
200 I 180
I60
140
120 ElCP of Dimethylcarbazoles I e0 194.7-195.7 amu. 80
60
40 Ill' 1 Y
86 88 90 92 94 96 9$ I Be '3, , , * , , . , , , , . , , , , , , , , , , , , , , , , , . , . , , * , * , , , .a , , , , , !. , !,I, , . , , . , , , , * . . , , , . , Retention Time (min)
Figure 4. Extracted Ion Current Profile of Alkylcarbazoles
364
CHARACTERIZATION OF "HEAVY' CRUDE COMPONENTS
M. M. Boduszynski
Chevron Research Company, P.O. Box 1627, Richmond, California 94802-0627
The current trend toward processing petroleum residua or whole "heavy" crudes requires adequate compositional information to understand the chemistry of reactions that are involved. Monitor- ing compositional changes by a mere comparison of operationally defined fraction9 or by a determination of "average structures" for feedstock and product components provides inadequate and frequently misleading information. (1) Much more detailed compositional data are needed to unravel the structural transformations which occur during processing or to explain product properties.
This paper discusses recent results of characterization work on "heavy" crudes and petroleum residua. The emphasis of this paper is on distribution of homologous series of compounds, their molar mass and structure, all as a function of boiling point. The detailed discussion of the experimental procedures used in this study is beyond the scope of this paper. It is important to note, however, that the unique combination of short-path distillation, high performance liquid chromatography (HPLC), and field ionization mass spectrometry (FIMS) was essential for obtaining the detailed compositional information which was not available before. The nitrogen-rich, 13.6"API gravity, Kern River crude oil (a blend of crudes from San Joaquin Valley, California) is used as an example.
EXPERIMENTAL
Kern River crude oil was first distilled using a Penn State column to produce two distillates, Cut 1 and Cut 2, and atmo- spheric residuum (-650°F+). The residuum was then fractionated into eight distillates, Cut 3 through Cut 10, and the nondistil- lable residuum (-1300°F+) using the short-path distillation. The detailed description of the short-path distillation apparatus, DISTACT, can be found elsewhere. (2, 3) The true boiling point (TBP) distributions of the distillation cuts were determined using a vacuum thermal gravimetric analysis (VTGA) method developed at Chevron Research. (4) The molar mass distributions of all cuts were determined using FIMS and field desorption mass spectrometry (FDMS). ( 5 ) The FIMS data were obtained at SRI International,
Encl. - Table I Figures 1-8
365
Menlo Park, California. Average molecular weights were determined by vapor pressure osmometry (VPO) using toluene as a solvent. Carbon (C), hydrogen (H), sulfur (SI, total nitrogen (Nt), basic nitrogen (Nb), and oxygen (0) were determined using standard proce- dures. Nickel (Ni), vanadium (V), and iron (Fe) were determined by inductively coupled plasma (ICP) emission spectroscopy method.
Chromatographic separations of all distillation cuts involved a two-step procedure. First, a fraction of polar compo- nents (mainly N-, 0-, and metal-containing compounds) was isolated from each distillation cut before further HPLC separation to pre- vent possible damage of high efficiency columns. "Polars" were separated using liquid chromatography on basic alumina. In the second step, the "polars-free" fraction was further separated into saturates, monoaromatics, diaromatics, triaromatics, tetraaro- matics, pentaaromatics, and a fraction designated "hexaaromatics and/or azarenes ."
The HPLC system consisted of two preparative columns, ZORBAX-NH2 and ZORBAX-SIL, connected through a switching valve. The system was calibrated using model compounds. The actual cut points between the aromatic ring-type fractions were determined using ultraviolet (W) spectra collected from 200-400 nm by the W photodiode array detector at 20-sec. intervals. Weight percent yields of the fractions were determined gravimetrically. The HPLC fractions were analyzed by FIMS. The principles of the HPL~/FIMS approach and its application to characterization of coal-derived liquids were reported previously. ( 6 - 8 ) However, a different HPLC system was used in this study. Elemental analysis, infrared spec- trometry, 'H and 13C nuclear magnetic resonance (NMR) spectrometry, and EIMS were used occasionally to aid interpretation of the HPLC/FIMS data.
RESULTS AND DISCUSSION
How Heavy is the "Heavy" Crude Oil?
The adjectives "heavy," "high boiling,' and "high molecu- lar weight" are commonly but inappropriately used as equivalent terms to describe crude oils or their fractions. The term "heavy" refers to crude oil density. Heavy crudes, of which Boscan (10.1OAPI gravity in Figure 1) is a classic example, have high densities (low OAPI gravities) because they are rich in high density naphthene-aromatics and heteroatom-containing compounds and poor in low density alkanes. They are commonly either immature or degraded. (9) Light crudes, which have low densities (high OAPI
366
g r a v i t i e s ) are r i c h i n a l k a n e s . Al tamont crude o i l (42.2OAPI grav- i t y i n F i g u r e l ) , an ex t reme example, h a s an e x c e p t i o n a l l y h i g h a l k a n e c o n t e n t as a r e s u l t of its predominant s o u r c e be ing l a c u s - t r i n e a l g a e , which a l so happens t o have been t h e s o u r c e of t h e nearby Green R i v e r s h a l e . ( 9 )
For each o f t h e c r u d e s c o n s i d e r e d i n F i g u r e 1, t h e "API g r a v i t y d e c r e a s e s w i t h i n c r e a s i n g d e p t h of d i s t i l l a t i o n . Hence t h e term "heavy ends" t e n d s t o correlate w i t h "h igh b o i l i n g ' w i t h i n a g i v e n c rude . However, t h e c o r r e l a t i o n between "heavy" and " h i g h b o i l i n g " does n o t n e c e s s a r i l y ho ld i f d i f f e r e n t c r u d e s are b e i n g compared. For example, t h e n o n d i s t i l l a b l e res iduum (-1300°F+) f rom Al tamont c r u d e h a s a lower d e n s i t y ( h i g h e r OAPI g r a v i t y ) t h a n whole Boscan, Kern R i v e r , or Maya c rude .
The terms "heavy' and "h igh b o i l i n g " are f r e q u e n t l y bu t i n c o r r e c t l y used as i f t h e y were synonymous w i t h "h igh m o l e c u l a r weight: The b o i l i n g p o i n t of a compound a t a g iven p r e s s u r e is a rough measure o f t h e a t t r a c t i v e f o r c e s between t h e molecu le s . These f o r c e s very w i t h t h e s t r u c t u r e of molecu le s , l e a d i n g to t h e g r e a t d i f f e r e n c e s i n b o i l i n g p o i n t f o r compounds of a g i v e n mola r mass b u t a d i f f e r e n t chemica l s t r u c t u r e . T h i s is i l l u s t r a t e d i n F i g u r e 2. Compounds hav ing s i m i l a r molar masses cove r a b r o a d b o i l i n g p o i n t r ange and , c o n v e r s e l y , a narrow b o i l i n g p o i n t c u t c o n t a i n s a wide molar mass r ange . The molar mass r ange i n c r e a s e s r a p i d l y wi th i n c r e a s i n g b o i l i n g p o i n t , as i l l u s t r a t e d by t h e ex tended c u r v e s "A" and " C " a t t h e r i g h t s i d e of F i g u r e 2. Fo r a g i v e n c l a s s o f compounds, t h e b o i l i n g p o i n t i n c r e a s e s wi th molar mass. T h i s is due t o t h e i n c r e a s e o f t h e weak, van d e r Waals a t t r a c t i v e i n t e r m o l e c u l a r f o r c e s as molecu le s of a g i v e n t y p e . become l a r g e r . However, compounds hav ing fused a r o m a t i c r i n g s and f u n c t i o n a l g r o u p s c a p a b l e of hydrogen bonding or o t h e r t y p e s o f p o l a r i n t e r a c t i o n s have a d d i t i o n a l a t t r a c t i v e i n t e r m o l e c u l a r f o r c e s and may have a r e l a t i v e l y l o w molar mass bu t a h igh b o i l i n g p o i n t and t h u s are e x p e c t e d t o c o n c e n t r a t e i n t h e "heavy ends."
F i g u r e 3 shows b o i l i n g p o i n t , molar mass, and h e t e r o a t o m d i s t r i b u t i o n s i n Kern R ive r pe t ro l eum. The a p p a r e n t molar mass d i s t r i b u t i o n s of a l l d i s t i l l a t i o n c u t s , i n c l u d i n g t h e n o n d i s t i l - l a b l e res iduum, were measured by FIMS and FDMS. The r e s u l t s o b t a i n e d by b o t h t e c h n i q u e s were i n v e r y good agreement . The molar mass d i s t r i b u t i o n s are i l l u s t r a t e d i n F i g u r e 3 by u s i n g t h e molar mass s c a l e as a r a d i u s of each "slice." The r a d i u s o f t h e i n n e r c i rc le c o r r e s p o n d s t o t h e lowest molar mass of t h a t c u t w h i l e t h e r a d i u s of t h e o u t e r c i rc le e x t e n d s to t h e h i g h e s t molar mass v a l u e . A s i g n i f i c a n t t r e n d can be obse rved . The molar mass r a n g e of t h e s u c c e s s i v e d i s t i l l a t i o n c u t s widens w i t h i n c r e a s i n g b o i l i n g
367
point in a fashion that is consistent with the trend indicated by the curves in Figure 2 . The low molar mass end of each cut (radius of the "hole" in each slice) shows only a moderate increase with increasing boiling point while the high molar mass end soars. The resulting significant molar mass overlapping between the cuts is mainly due to the increasing concentration of polynuclear aromatic and heteroatom-containing compounds which have high boiling points but relatively low molar masses.
Interestingly, most of these heavy crude components do not exceed a molar mass of about 1500 and only a few have molar masses extending up to about 1900. The molar mass data for Kern River crude oil are in agreement with the previously reported results for other crudes (10-12) and provide further support for the early speculations by Dean and Whitehead (13) who suggested a molecular weight maximum of 2000 for all compounds in petroleum.
Data in Table I give distributions of elements (C, H, N, S , 0, Ni, and V) on a molecular basis. The decreasing 2 value in the general formula C,H2n+ZX for each successive cut indirectly indicates the increasing "aromaticity." The C number range and the concentration of heteroatom-containing molecules also increase with increasing boiling point. For example, the low boiling Cut 1 (385-499OF) consists of molecules having about 10-14 C atoms, with only two molecules in 100 containing S and one in 1000 containing a N atom. The high boiling Cut 5 (795-943'F) involves molecules having about 18-48 C atoms and on the average every other molecule may contain a heteroatom. The nondistillable residuum has the highest concentration of heteroatoms and shows the greatest H deficiency (lowest 2 value) among all distillation cuts. One must bear in mind, however, that the above are only average estimates which cannot reveal the actual distribution of heteroatoms in the diverse molecules present in each cut.
What are the Components of a "Heavy" Crude Oil?
T h e compiexity of petroleum increases rapidly with increasing boiling point as the result of the increasing number of atoms in a molecule and the immense number of their possible struc- tural arrangements. It has long been recognized that compositional analysis of high boiling petroleum fractions by the isolation of individual compounds is a practical impossibility. ( 1 4 ) Instead, many attempts have been made to separate those complex mixtures into groups or classes of compounds. Numerous separation methods and schemes have been developed over the years. (15) One of the most recent systematic studies on composition of petroleum high
' I
368
boiling distillates and residua was the American Petroleum Institute Research Project 60 and the later work based on the char- acterization scheme developed under this project. (10-12, 16-22)
Petroleum components can be viewed as two major groups of compounds, namely, hydrocarbons and nonhydrocarbons. Hydrocarbons include acyclic alkanes (paraffins) and cycloalkanes (naphthenes), both commonly referred to as saturates, and the third group known as aromatics. Most of the aromatics bear normal or branched chains and naphthenic cycles. A molecule containing one aromatic ring is regarded as monoaromatic, a molecule with two aromatic rings-- diaromatic, etc., even if several naphthenic rings and side chains are attached to the aromatic ring. In the same manner, naphthenes containing both saturated rings and chains are defined by the number of rings, i.e., monocyclic, dicyclic, etc. Nonhydrocarbons include compounds which in addition to C and H atoms also involve one or several heteroatoms such as S, N, 0, Ni, V, and Fe.
A complete separation of hydrocarbons from nonhydrocar- bons in high boiling petroleum fractions is not possible. S-containing compounds which during chromatographic separations behave similarly to hydrocarbons of the equivalent molar structure (i.e., dibenzothiophene and fluorene) are commonly found in hydro- carbon fractions. Some N heterocycles (azarenes), particularly those with the N atom sterically hindered or N-substituted, also frequently interfere with hydrocarbons. Nonhydrocarbons having "polar" functional groups such as -COOH, -OH, -NH, C=O or those containing several heteroatoms in a molecule (i.e., metalloporphy- rins) are less difficult to separate from hydrocarbons.
The separation method used in this study produced up to eight "compound-class" fractions from each distillation cut depend- ing on the cut composition. The fraction of "polars" which is regarded as a concentrate of mainly N-, 0-, and metal-containing species was separated from each cut prior to further separations of the remaining "polars-free" portion into saturates, monoaromatics, diaromatics, triaromatics, tetraaromatics, pentaaromatics, and a fraction designated "hexaaromatics and/or azarenes." The last fraction reflects the difficulty in separating polycyclic aromatic hydrocarbons having six or more rings from azarenes.
sophisticated HPLC system cannot provide a complete separation and the adjacent fractions therefore show some overlapping. This, how- ever, is detected by the following FIMS analysis of the fractions. The FIMS provides further "separation" into various homologous series according to the 2 value in the general formula CnH2n+Z and reveals the molar mass (C number) distribution of the components.
It is importan't to note, however, that even the most
369
The structural assignments are based on the HPLC retention data, W spectra (for aromatics), and if necessary are aided by such analyt- ical techniques as 'H and 13C NMR, and EIMS.
Figures 4, 5, and 6 show examples of the HPLC/FIMS analy- ses for distillate Cuts 2, 6 , and 10, respectively. Only a few most prominent homologous series are presented. Most likely struc- tures are shown although various isomers are possible. The exten- sive compositional information provided by this analytical approach is evident. Of particular importance are series of polycyclic molecules many of which are related to steroid and terpenoid struc- tures ranging from the saturated form to various stages of aromatization.
The earlier discussed effect of chemical structure on molar mass distribution for components of a given distillation cut is illustrated in Figure 5 . The molar mass profile of acyclic alkanes shows the maximum at C39 while that of the pentaaromatic CnH2n-30 series has the maximum at C30. "polars" (not shown) were 'shifted" even further toward lower molar mass values than those of the corresponding hydrocarbons but showed similar patterns in terms of wide C number distributions. The interpretation of the FIMS data for "polars" is much more difficult than in the case of hydrocarbons, particularly if more than one heteroatom per molecule is involved. Infrared and NMR data, together with elemental analysis results, provided important addi- tional information. Compounds having pyrrolic NH groups (i.e., carbazoles) and amide types were found to be particularly abundant. Although various homologous series were identified, the results indicate the need for further separation of "polars" to facilitate the interpretation of data.
Figure I shows distributions of various "compound-class" fractions in the heavy Kern River crude oil. The concentration of "polars" increases steadily with increasing boiling point from zero in Cut 1 to about 0 2 wt % in the nondistillable residuum. Notably, "polars" in the distillable portion (Cut 1 through Cut 10) account for over 42% of total "polars" present in this heavy crude oil. i ~ i e IUOIIO- through pentaaromatics and the fraction designated "hexa- aromatics and/or azarenes," together show a peculiar distribution pattern with two minima, one at the top and the other at the bottom of the barrel. The concentrations of individual fractions vary in each Successive distillation cut. The mono- and diaromatics predominate in the low boiling cuts. It is worthwhile noting, however, that the composition of the individual fractions within these classes changes considerably with increasing boiling point. For example, the monoaromatics in Cut 2 are rich in di- and
Molar mass profiles of
-.
370
I
tricyclomonoaromatics (homologous series CnHzn-8 and CnH2n-10) while the monoaromatics in Cut 4 involve mainly tri-, tetra-, and pentacyclomonoaromatics (homologous series CnH2n-10, CnH~n-12, and 'nH2n-14) *
The data in Figure 7 show a dramatic decrease in Satu- rates with increasing boiling point from about 88 wt % in Cut 1 to only about 1 wt % in the nondistillable residuum. Similarly, as with other compound-class fractions, the composition of saturates changes with increasing boiling point. This is illustrated in Figure 8 which shows distributions of the alkane homologous series in the entire Kern River crude oil. Acyclic alkanes (paraffins) are almost completely absent in this degraded heavy crude oil. The concentrations of tetra-, penta-, and hexacyclics increase with increasing boiling point at the expense of mono-, di-, and tri- cyclic alkanes. Steranes and hopanes were found to be particularly abundant in Cuts 3 through 6.
CONCLUSIONS
Data derived from this study dispel many misconceptions about the composition of high boiling components in petroleum. The results presented show that the molecular structure more than molecular weight of petroleum components predominantly determines the boiling point distribution and density ( " A P I gravity) of the crude oil. The majority of compounds found in the "heavy" Kern River crude oil have molar masses not exceeding about 1500 with only a few extending up to about 1900. They involve mainly polycyclic structures with varying degree of aromatization, and many of them contain N and 0 atoms with pyrrolic and am5de types prevailing.
The results of this study also demonstrate the necessity of a high degree of sample fractionation in order to obtain mean- ingful compositional information.
ACKNOWLEDGMENTS
The author expresses his appreciation to Messrs. T. H. Attoe, R. M. Bly, R. J. Brown, M. Karigaca, C. E. Rechsteiner, F. Sur X. Urrutia, and D. M. Wilson of Chevron Research Company; R. Malhotra and G. St. John of SRI International; S. Hughes of uIC Inc.; and W. Fischer of Leybold-Heraceus GmbH for their contri- butions to this study.
Appreciation is also expressed to Messrs. K. H. Altgelt, T. R. Hughes, A. L. McClellan, and J. H. Shinn of Chevron Research Company for helpful suggestions and review of this manuscript.
371
REFERENCES
1. Boduszynski, M. M., "Liquid Fuels Technology," 2 ( 3 ) , 211-232 (1984).
2. Vercier, P., and Mouton, M., "Analusis," 101 (2), 57-70 (1982).
3. Fischer, W., "Decomposition-Free Distillation of Crude Oil Fractions with Boiling Ranges of 350-7OO0C," Leybold-Heraeus GmbH, Hanau, Germany.
4 . Su, F., unpublished results.
5. Rechsteiner, C. E., unpublished results.
6. Boduszynski, M. M.; Hurtubise, R. J.; Allen, T. W.; and Silver, H. F., "Anal. Chem.," 55, 225-231 (1983).
7. Boduszynski, M. M.; Hurtubise, R. J.; Allen, T. W.; and Silver, H. F., "Anal. Chem.," 55, 232-241 (1983).
8. Boduszynski, M. M.; Hurtubise, R. J.; Allen, T. W.; and Silver, H. F., Fuel, in Press.
9. Tissot, B. P., and Welte, D. H., "Petroleum Formation and Occurrence," Springer-Verlag, Berlin, Heidelberg, New York (1978).
10. McKay, J. F., and Latham, D. R., Preprints, ACS, Div. Petrol. Chem., 2 (4), 831-838 (1981).
11. Boduszynski, M. M.; McKay, J. F.; and Latham, D. R., Preprints, ACS, Div. Petrol. Chem., 26 (4), 865-881 (1981).
12. Boduszynski, M. M.; McKay, J. F.; and Latham, D. R., Proc. Assn. Asph. Pav. Technol., 49, 123-142 (1980).
13. Dean, R. A. and Whitehead, E. V., Proc. Sixth World Petroleum Congress, Sec. VI Paper 9, 261-276 (1963).
14. Van Nes, K., and Van Westen, H. A,, "Aspects of the Constitution of Mineral Oils," Elsevier Publishing Co., Inc., New York, Amsterdam, London, Brussels 11951).
372
15. Altgelt, K. H.; Jewell, D. M.; Latham, D. R.; and Selucky, M. L., 'Chromatography in Petroleum Analysis," Chapter 9, 195-214, Altgelt, K. H., and Gouw, T. H., editors, Marcel Dekker, Inc., New York, Basel (1979).
16. Haines, W. E., and Thompson, C. J., "Separating and Characterizing High Boiling Petroleum Distillates: the USBM-API Procedure," Rept. of Inv. LERC/RI-75/5, BERC/RI-75/2, (1975).
17. Thompson, C. J.; Ward, C. C.; and Ball, J. S., "Characteristics of World's Crude Oils and Results of API Research Project 60," Rept. of Inv. BERC/RI-76/8 (1976).
18. McKay, J. F.; Amend, P. J.; Harnsberger, P. M.; Cogswell, T. E.: and Latham, D. R., Fuel,=, 14-16 (1981).
19. McKay, J. F.; Harnsberger, P. M.; Erickson, R, B.; Cogswell, T. E.: and Latham, D. R., Fuel,=, 17-26 (1981).
20. McKay, J. F.; Latham, D. R.; and Haines, W. E., Fuel, 60, 27-32 (1981) .
21. Grizzle, P. L.; Green, J. B.; Sanchez, V.; Murgia, E.: and Lubkowitz, L., Preprints, ACS, Div. Petrol. Chem., 26 (41 839-850 (1981).
22. Sturm, Jr., G. P.; Grindstaff, 8 . G.; Hirsch, D. E.; Scheppele, S. E.; and Hazos, M., Preprints, ACS, Div. Petrol Chem., 26 (4) 851-856 (1981).
373
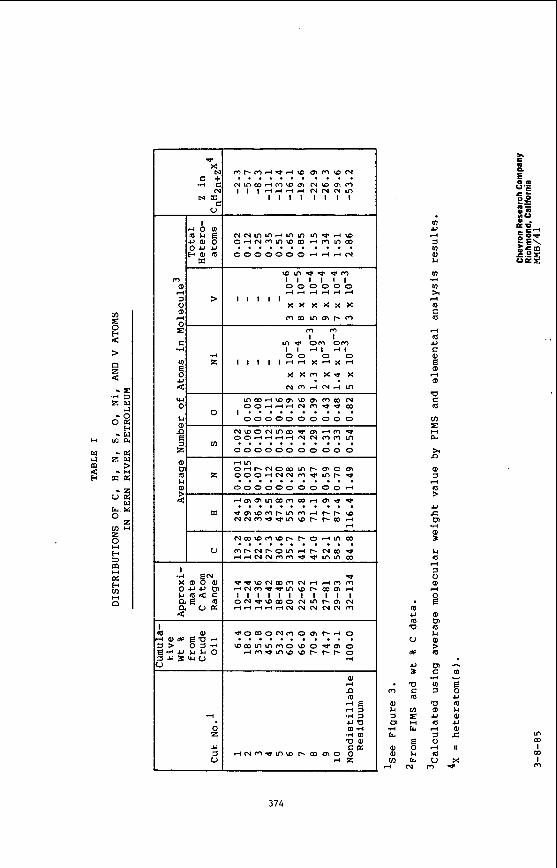
m z 0 w 4 b P z 4 - E
.rl 3 z w cl
-0 o a w - w U-Ja
- a z w b r u
x a -2 v a w
E % 0 z V)H z w 3
a w m H P
E E
m a, rl
0) rl
z C .rl
E: 0 4 w
LI a> a
z al
U
a,
w
c - -rl I
c N E
x,
r ) b
0-
.d m z
- 0
a m -
m z
e - m
- u
w a J m
.A EN
4 v a
x m O @ O U U [I LIa4 c Q E m
0 2 U
u
w m w - r . 4 m I I I I I I 0 0 0 0 0 0 ddrlr l - l r l
I I I I I x x x x x x m m m m t - m
m m I 1
m . 4 Om Om I I d l d l 0 0 0 0
I I I I I r l d X - l X - +
x x m X V x N m d m r l m
. . m w r l w m w m m m ~ 004r ld N m w - 8 w . . . . . . . . . . .
o s r - N O W m P m o m 0 0 0 r l N N m w m t - 1 000000 0 0 0 0 rl . . . . . . . . . . .
- 8 o w o ~ m o m r-rl o w w m m m o w o - a m o . . . . . . . . . . .
d m w m w w P F . P o rl
a, rl
; U m V
V
8
U 3
* v m c
E m
I::
s z C n H 4 E E
E
V ) E r l N
m U rl 3 aJ
m m h rl m m 4 m U C aJ E rl 0,
v m m
k4
>I
a, J rl 4
U c Cn a, 3 LI m 4 3
aJ rl
.d
E n
.d
2 9) Cn LI 0,
m 0 , - c m .rl v
: 5 U v m
0 ) L I 0 0 m u . + a , s c rl II
v x m w
m W I
W I
m
374
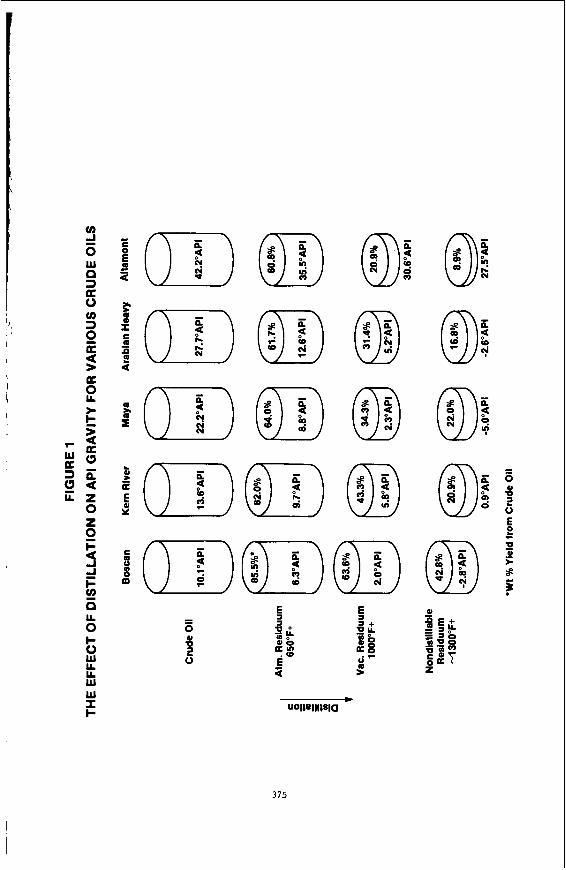
I ' f
375
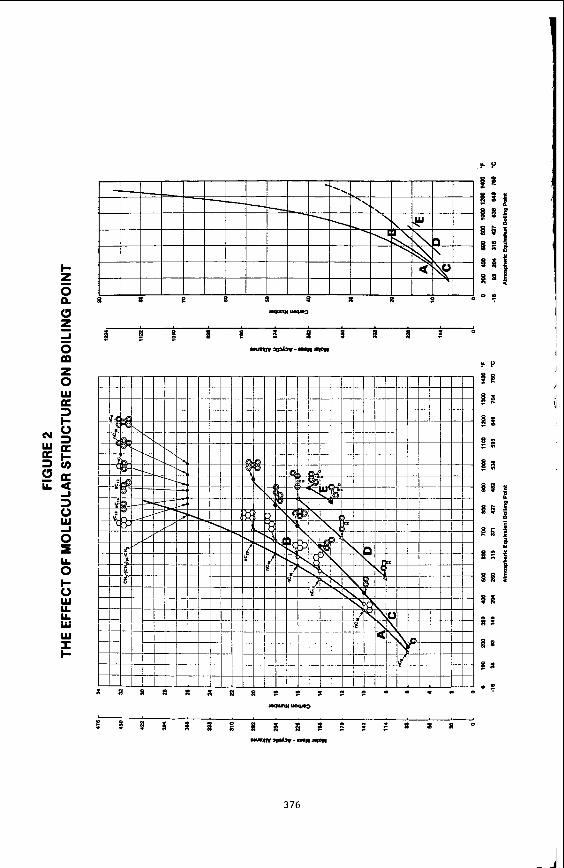
376
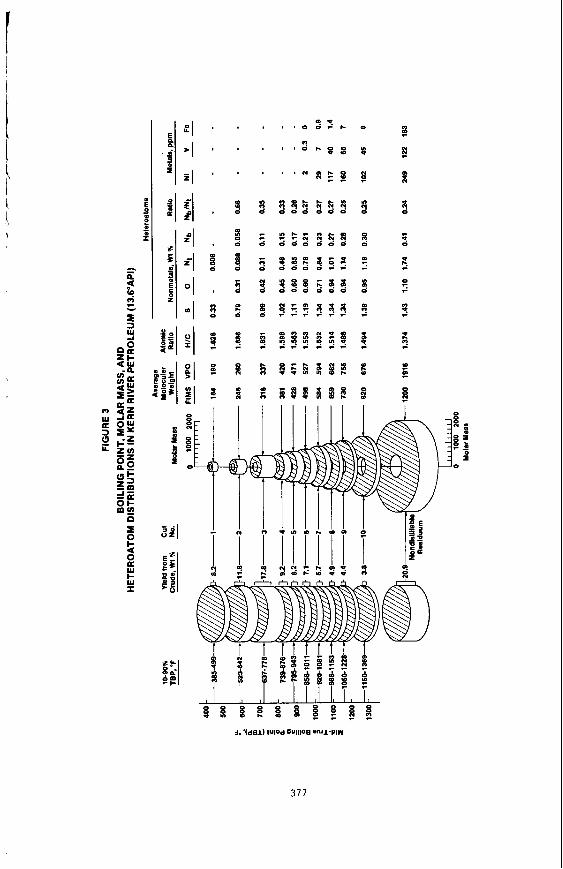
g g f
h P : t
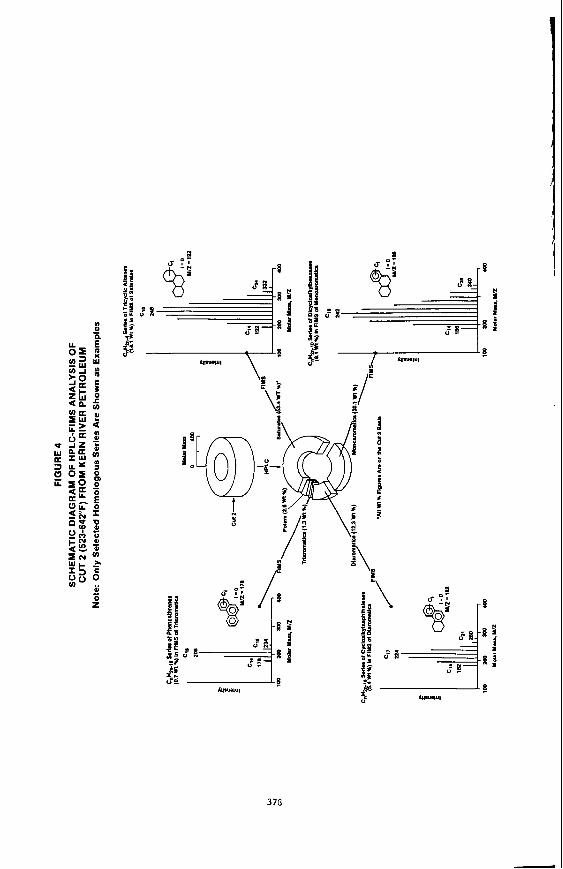
373
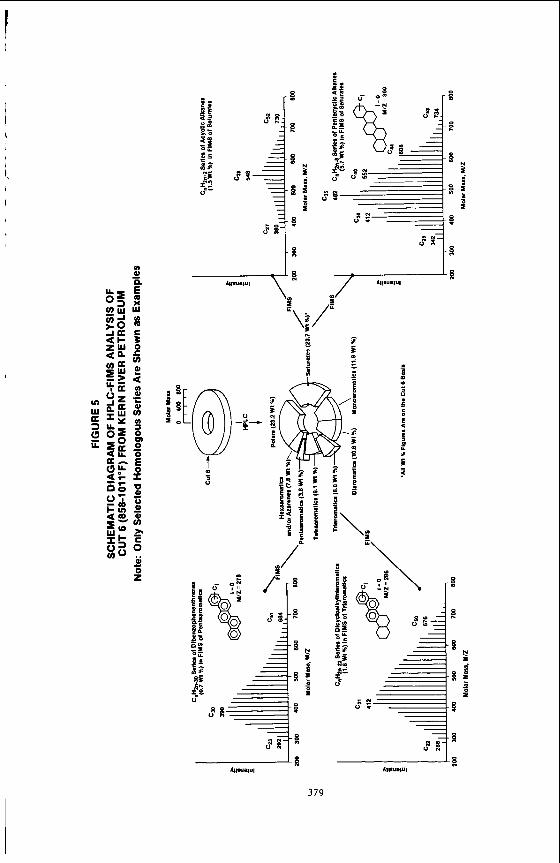
I I
I I
I
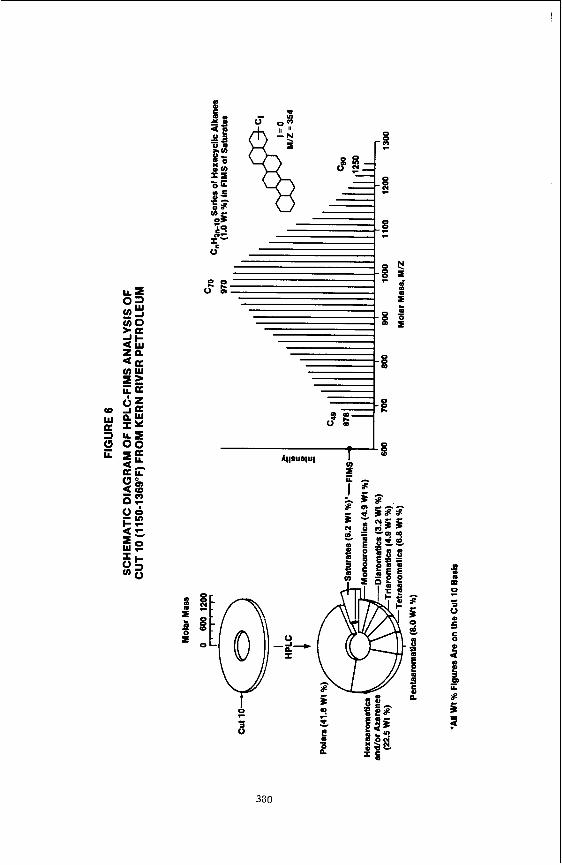
0
I -g-+
300
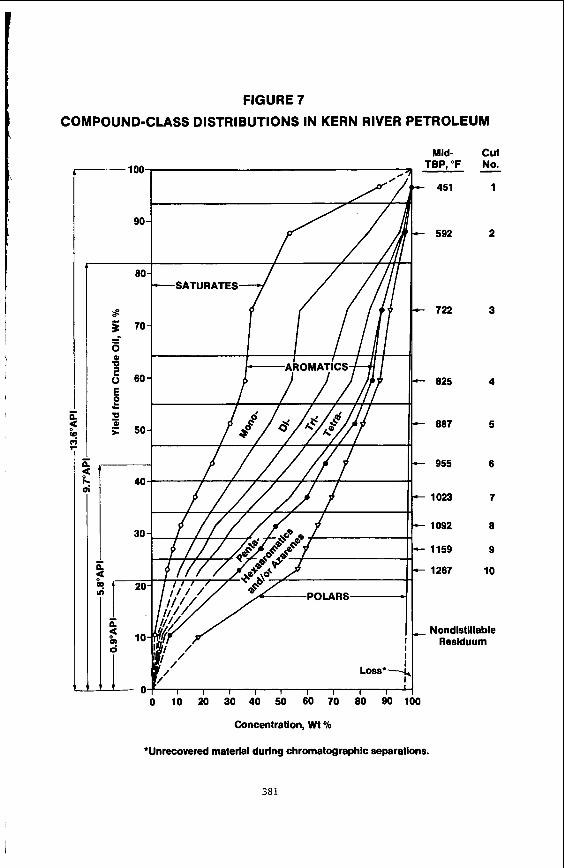
I
FIGURE 7
COMPOUND-CLASS DISTRIBUTIONS IN KERN RIVER PETROLEUM
Mid- TBP, "F 100 ,
cut No.
451
592
722
825
807
955
1023
1092
1159
1267
Nondistillabie Residuum
0 10 20 30 40 50 60 70 80 90 100
Concentration, Wt %
'Unrecovered material during chromatographic separations.
58 1
1
2
3
4
5
6
7
8
9
10
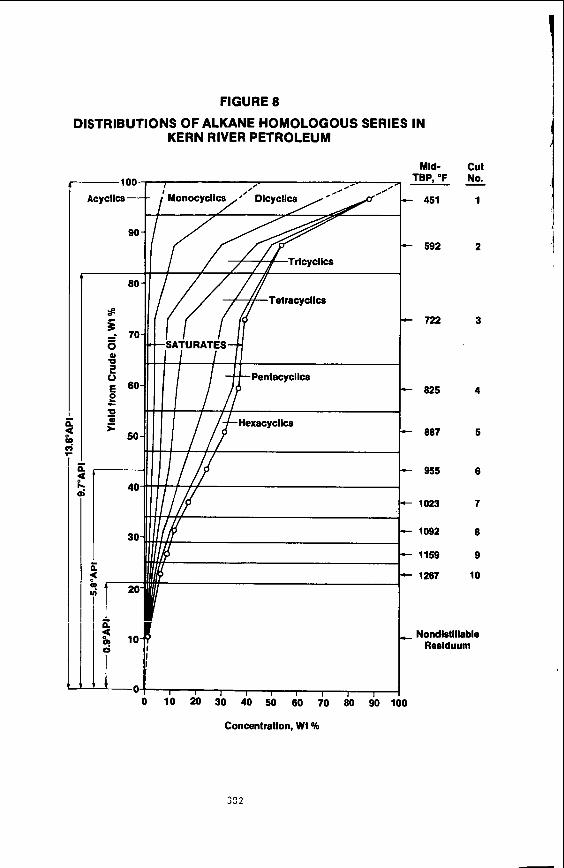
FIGURE 8
DISTRIBUTIONS OF ALKANE HOMOLOGOUS SERIES IN KERN RIVER PETROLEUM
Yld- 100-
AcyCIIc8-
90
80
2ii
h
451
592
722
825
887
955
cut No.
1
-
2
3
4
5
6
7
8
9
10
Nondlstlllable Reslduum t
I I I I 1 I I I I 10 20 30 40 50 60 70 80 90 100
Concentration, Wt %
I
STRUCTURES OF LIQUID-LIKE SYSTEMSI X-RAY DIFFRACTION OF MODEL ORGANIC HYDROCARBONS. \
Lawrence B. Ebert, Joseph C. Scanlon, and Daniel R. Mills Exxon Corporate Research Labs
Route 22 East Annandale, New Jersey 08801
Since the work of T. F. Yen in 1961 (11, there has been much effort in the determination of the structure of petroleum heavy ends. Although x-ray diffraction shows broad lines, indicative of correlation lengths of - 10-30 A, the d values of the peaks have been associated with specific organic functionality: 4.5-4.8 A (aliphatic), 3.4-3.8 (aromatic stacking), and 2.1 A (aromatic diameter).
In two previous papers (2,3), we have performed x-ray diffraction on the liquid phases of model organic hydrocar- bons to obtain additional insights into'these assignments. In contrast to earlier work (l), we found that the "y-band" at 4.6 A was related to intermolecular interference among paraffins, but not to interference among naphthenes, which we found to appear at 5.3 to 5.4 A (2,3). Although the "(002) band" at 3.4 to 3.6 A presumably does arise from the approximately parallel stacking of planar aromatic molecules, we found evidence for (OOL) peaks at lower values of 28, arising from the small stack height of the aromatic clusters. The true identity period became the stack height itself, thereby giving rise to lines at "d value" greater than that of the "(002) band." The above inferences indi- cated that the x-ray diffraction-based method of determining fractional aromaticity, by comparing areas of the 7-band and (002) band, fails for a number of reasons.
In the present paper, we extend our work on the x-ray diffraction of liquid-phase organic hydrocarbons. Analysis of the patterns of the methyl-branched paraffins pristane and phytol shows an intermolecular interference maximum at 4.7 to 4.8 A, slightly higher than that found for n-paraffins, but significantly lower than that found for naphthenes. Diffraction of quinoline shows two (OOL) peaks, exactly the behavior exhibited by 1-methyl naphthalene (2,3). When a given molecule contains both spa and spa hybridized carbon, as in tetralin or tetrahydroquinoline, broadening of the lines results, although when one carbon type predominates (as in n-heptadecyl benzene), that carbon type will dominate the diffraction pattern.
I
1
383
Experimental details
Diffraction experiments on liquids were carried out as described previously (2,3). A cell with Be windows was mounted on $ Siemens Type F diffractomEter, equipped with a divergent 1 slit and a receiving 0.1 slit. Copper radi- ation was used.
Quinoline (99%) was obtained from Aldrich. The methyl branched paraffins pristane (2,6,10,14 tetramethyl pentade- cane, 99% 1 and phytol (3,7,11,15 tetramethyl-2-hexadecen-1-01, 70%) were obtained respective- ly from Wiley Organics and Aldrich. The purity of the qui- noline and pristane was verified by GC/MS; the MS pattern of the major component of the phytol showed peaks at m/e of 71 (I=lOO), 55 (1=56), 57 (I=52), and 81 (I=33), with the high- est detected m/e=278, reflecting a loss of water from the pure phytol (molecular weight = 296.5). A high resolution C-13 NMR pattern of the pristane showed resonances at 19.8 6 (the methyl groups on the 6 and 10 carbons), 22.7 6 (the four equivalent "terminal" methyl groups), 24.6 6 (the cen- tral, 8, methylene carbon), 24.9 6 (the 4 and 12 methylene carbons), 28.16 (the 2 and 14 methylene carbons), 32.9 6 (the 6 and 10 methylene carbons), 37.5 6 (the 7 and 9 methy- lene carbons), and 39.5 6 (the 3 and 13 methylene carbons). The reader should note that the spectrum of this isoprenoid carbon skeleton is quite distinct from that of an n-paraffin (e.g., internal methylenes at 29.8 6, terminal methyl groups at 14.2 6). The remarkable finding reported here is that branched paraffins and normal paraffins show different pat- terns in liquid-phase x-ray diffraction, because of differences in intermolecular packing.
Results and Discussion
The diffraction patterns of the liquids pristane, phytol, and quinoline are given in Figure 1. The "d value" of the single observed interference maximum is 4.8 A for pristane and 4 .7 A for phytol, measureably higher than the 4.6 A that we have found for n-paraffins. This increase is presumably related to the presence of the methyl groups, and confirms the identification of the "7-band" as an intermolecular interference peak of paraffins (2,3).
I n contrast to the paraffins, the diffraction pattern of liquid quinoline contains two peaks in the region 10 - 45' 28. The larger peak is at 3.9 A , with a shoulder at 5.1 to 5.4 A. This behavior is analogous to that previously reported for 1-methyl naphthalene, and confirms our sug- gestion of the presence of high d value (OOL) lines in aromatic clusters of stack height 15 - 25 A (2,3).
2
384
l
X-ray diffraction can, of course, be used for liquids more complex than simple paraffins or aromatics. The nar- rowest diffraction lines, representing the longest corre- lation lengths, seem to occur with spherically symmetric molecules, such as 1, 3 di-methyl adamantane (2,3) or (+I-longifolene (Aldrich 23,517-2), whose pattern is given in Figure 2. The one dimensional order of aromatic stacking can be seen even for the single ring compound, hexafluoro benzene, as seen in Figure 2. Here, the scattered intensity is increased relative to that of benzene by virtue of the fluorine atoms which are co-planar with the carbon atoms. This "assistance" does not extend to perfluoro decalin, in which case the scattering arising from carbon-carbon, carbon-fluorine, and fluorine-fluorine intermolecular dis- tances is more complex.
What happens when one has molecules containing both spa and spa-hybridized carbon? In tetralin, with six aromatic
To see the origin of these lines, one may make an anal-
3
385
and four aliphatic carbons, one observes only a broad dif- fraction envelope, but in n-heptadecyl benzene (six aromatic, seventeen aliphatic) one sees a ./-band much as in liquid n-paraffins (3).
To more systematically study these mixed systems, we have performed reductive alkylation on model aromatic hydro- carbons (6). In the case of perylene, for which we found a potassium consumption of two moles K per mole perylene (7), we quenched with methyl iodide (CD,I) and actually obtained a crystalline product of di-methyl di-hydro perylene, as illustrated in Figure 3. GC/MS analysis of this product showed 72% to be a single isomer of di-methyl di-hydro perylene (parent peak m/e = 288 .21 , with perylene itself, a second isomer of di-methyl di-hydro perylene, and a small amount of tri-methyl di-hydro perylene also present. It is likely that the crystallinity of our product is correlated with the dominance of one isomer of di-methyl di-hydro perylene.
References
(1). T. F. Yen, J. G. Erdman, and S. S. Pollack, Anal. Chem., 33. 1587 (1961).
( 2 ) . L. B. Ebert, J. C. Scanlon, and D. R. Mills, Preprints, Petroleum Division of the American Chemical Soci- ety, 28, 1353 (1983).
(3). L. B. Ebert, J. C. Scanlon, and D. R. Mills, Liq. Fuels Tech., &, 257 (1984).
(4). H. E. Blayden, J. Gibson, and H. L. Riley, Proceedings of the Conference on the Ultra-fine Structure of Coals and Carbons, p. 176 (1944).
(5). P. B. Hirsch, Proc. Roy. SOC. A, 226,143 (1954).
(6). L. B. Ebert, “Reductive Chemistry of Aromatic Hydro- carbons,” in Chemistry of Ensine Combustion DeDOSitS, pp. 303-376, Plenum, 1985.
(7). L. B. Ebert, submitted to Fuel, April, 1985.
4
386
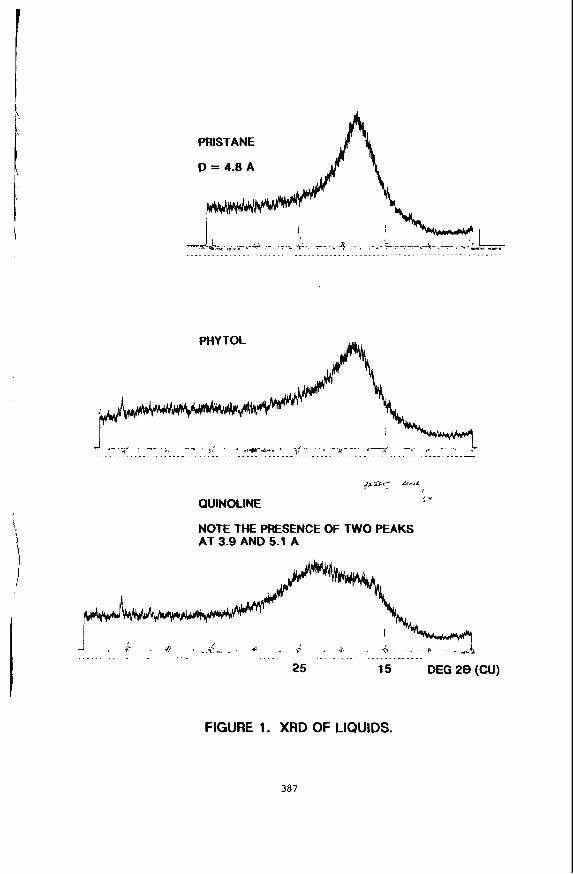
PRISTANE
D = 4.8 A ‘z
........ 4 .T.i $., ~ . , . . ~... L-;.7-.+ ,-, ,.-~ I. I _. ; .........................................................................
PHYTOL
.... , . ;r ..... . - ._* - . Y a , , * , o . + - ._. .,-. i -~ j , 1- $-*-.&-.
..................................................................................... -
QUINOLINE
NOTE THE PRESENCE OF TWO PEAKS AT 3.9 AND 5.1 A
, A‘ a 21 f? .... 2.. . . 4’ . ,- . .+ . 4 . . . . ... , ,.b
...................................... . . . . . . . . . . . . . . . . . . . .
25 15 DEG 2 8 (CUI
rA FIGURE 1. XRD OF LIQUIDS.
387
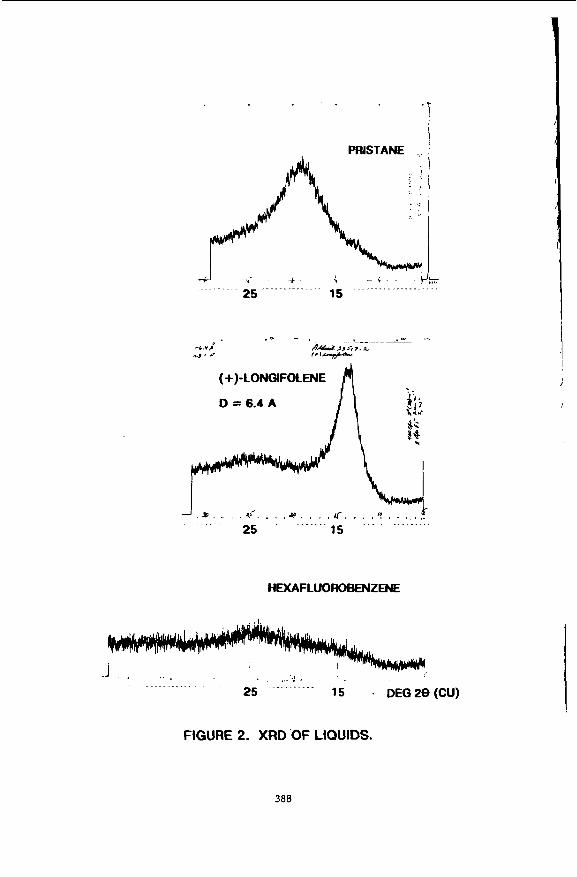
PRISTANE
+ - - ( . . ... .............. _ _ ....................
(+)-LONGIFOLENE A
k . . . . . a / . . . . + . . . . Q . . . .'? . . . . . ._ . . . . ...... . . . . . . . . . . . .
25 15
HEXAFLUOROBENZENE
. ,I.
. . . . . . d .
FIGURE 2. XRD OF LIQUIDS.
388
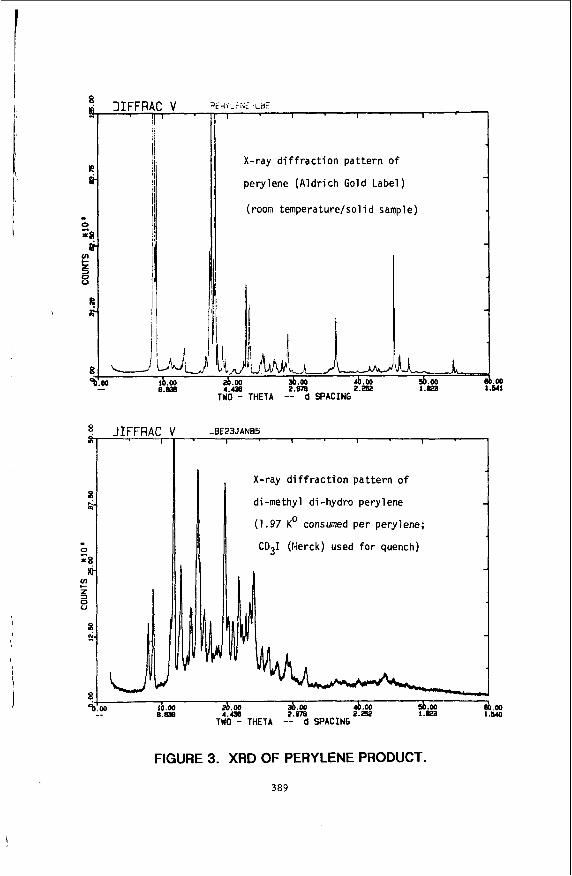
I
1 I I I
X-ray diffraction pattern of
perylene (Aldrich Gold Label)
(room temperature/sol id sample)
JIFFRAC I
-0E23JAN85 I I I I
X-ray diffraction pattern of
di -methyl di -hydro peryl ene
(1 .97 KO consumed per perylene;
CD31 (I4erck) used for quench)
A 0 3b.w 4b.w d .w d.00 2b.m 1b.w _- 8.838 4 . 4 3 2.m 1.825 1.540 2 .2u
Two - THETA -- d SPACING
FIGURE 3. XRD OF PERYLENE PRODUCT.
389
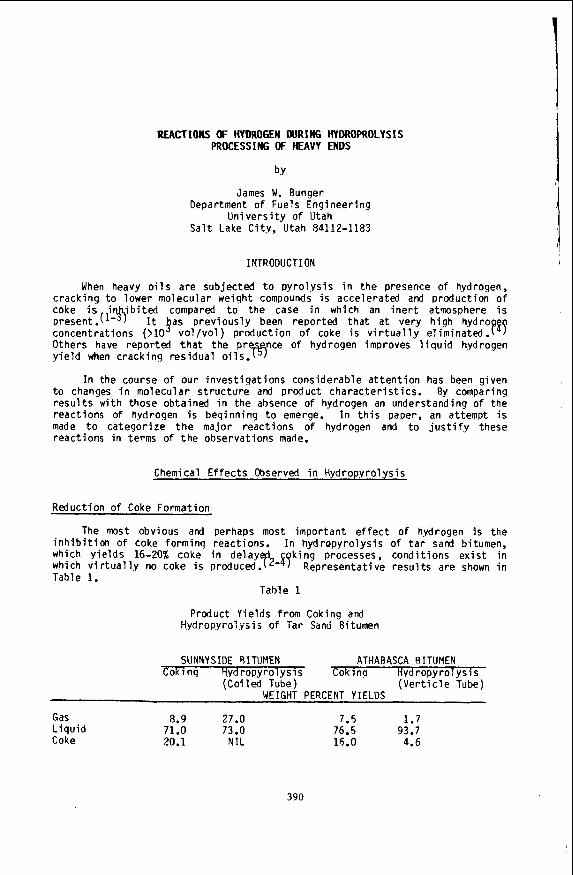
REAGTIONS OF HYDROGEN WRING HYDROPROLYSIS PROCESSING OF HEAVY ENDS
by
James W. Bunger Department o f Fuels Eng ineer ing
U n i v e r s i t y o f Utah S a l t Lake C i t y , Utah 84112-1183
INTRODUCTION
When heavy o i l s a re subjected t o p y r o l y s i s i n t h e presence of hydrogen, c rack ing t o lower mo lecu la r weight compounds i s accelerated and produc t ion o f coke i s i i b i t e d compared t o t h e case i n which an i n e r t atmosphere i s p resent .( It $as p rev ious l y been reported t h a t a t very h igh hydro concent ra t ions (>lo v o l / v o l ) p roduc t ion o f coke i s v i r t u a l l y e l im ina ted . Others have repor ted t h a t t he p r w c e o f hydrogen improves l i q u i d hydrogen y i e l d when c rack ing res idua l o i l s .
I n the course of our i n v e s t i g a t i o n s cons iderab le a t t e n t i o n has been given t o changes i n mo lecu la r s t r u c t u r e and produc t c h a r a c t e r i s t i c s . By comparing r e s u l t s w i th those obtained i n t h e absence o f hydrogen an understanding o f the reac t ions o f h.ydrogen i s beq inn ing t o emerge. I n t h i s paper, an attempt i s made t o ca tegor i ze t h e major reac t i ons o f hydrogen and t o j u s t i f y these reac t ions i n terms of t h e observat ions made.
av
Chemical E f f e c t s Observed i n Hydropyro lys is
Reduct ion o f Coke Format ion
The most obvious and perhaps most impor tan t e f f e c t o f hydrogen i s the i n h i b i t i o n o f coke fo rming react ions. I n hyd ropy ro l ys i s of t a r sand bitumen, which y i e l d s 16-20% coke i n de lay k i n g processes, cond i t i ons e x i s t i n which v i r t u a l l y no coke i s produced. T2-'? Representa t ive r e s u l t s a re shown i n Table 1.
Table 1
Product Yields from Coking and !!ydropyro:yjis af Tar Sand Bitumen
SUNNYSIDE SITUMEN ATHAB4SCA RITUMEN Coki nq Hydropyro lys is T o k i n g Hyd ropy ro l y s i s
WEIGHT PERCENT YIELDS (Co i led Tube) ( V e r t i c l e Tube)
Gas 8.9 27.0 L i q u i d 71.0 73.0 Coke 20.1 NIL
7.5 1.7 76.5 93.7 16.0 4.6
390
Reduction o f Dehydrogenation o f Naphthenes
i It has a l so been observed t h a t d u r i n g hyd ropy ro l ys i s l i t t l e change i n t o t a l aromatic carbon occurs (Ca = .22 f o r products and .19 f o r g y d s t o c k ) wh i l e coking d r a m a t i c a l l y increases the aromat ic carbon (Ca = .30).( It has a l s o been observed t h a t hydropyro lys is p roduc ts possess a h ighe r f a c t i o n
Saturates Monoaromatics Diaromat ics Poly-Polar Aromatics
Coking H yd ropy r ol y s i s
52.4 59.4 8.4 12.0 6.1 4.4
33.0 24.1
Gas/Liquid/Coke (weiqht percent ) 4/81/15 17/ 83/ 0 Avg. M.W. L iqu ids 321 336
*Values qiven are on a feed bas is ; gas produc t ion i s lumped i n t o the sa tura tes p o r t i o n and coke produc t ion i s lumped i n t o the po ly -po la r aromat ics f rac t i on .
From the da ta above i t i s no t poss ib le t o t e l l whether t h e p r i n c i p a l e f f e c t of hydropyro lys is i s t o i n h i b i t t he denydrogenation of naphthenes t o form aromatics o r t h a t hydrogenat ion of condensed aromat ics t o form monoaromatics i s occur ing. As w i l l be shown below both appear t o be happening. NMR data taken on an Athabasca bitumen and the l i q u i d products from hydropyro lys is (93% y i e l d s ) suggests t h a t t h e f r a c t i o n of monoaromatic carbon increases w i t h hyd ropy ro l ys i s processing. For the Athabasca case the f r a c t i o n aromatic carbon ( fa ) dec l i nes from 0.35 t 0.28 wh i l e the f r a c t i o n aromat ic hydrogen (Ha) increases from .04 t o .05, c l e a r l y showing lower l e v e l s condensation and/or a lower degree of a l k y l s u b s t i t u t i o n .
Hydrogenation o f Aromatics and O l e f i n s
The observat ion t h a t t o t a l aromat ic carbon remaines v i r t u a l l y constant ( o r i n some cases dec l i nes ) w h i l e the d i s t r i b u t i o n s h i f t s from polycondensed aromat ics toward monaromatics s t r o n g l y suggests t h a t polycondensed aromatics a re being h.ydrogenated. In hydropyro lys is where coke format ion i s small the amount o f polyaromat ics i n the feed t h a t can be accounted f o r by l o s s t o coke i s l im i ted .
39 1
I n an at tempt t o asce r ta in whether o r no t aromat ics a re i n f a c t being hydrogenated d u r i n g hydropyro lys is , a m ix tu re o f 5% naphthalene i n n- hexadecane was hydropyrolyzed a t 54OOC and 2000 p s i g H and 30 sec residence time. The i d e n t i t y o f t e t r a l i n was confirmed by mass spectroscopy. Ca lcu la t i ons o f the thermodynamic equi 1 i b r i u m between sa tura tes and aromat ics reveal t h a t on ly the mono-aromatics are s t r o n q l y favored a t these cond i t ions . I n t h e t e t r a l i n - naphthalene system and a t t h e reac t i on cond i t i ons given t h e e q u i l i b r i u m concent ra t ion f o r t e t r a l i n i s 0.3 mole f r a c t i o n ( i n the absence o f c rack ing o f t e t r a 1 i n ) .
As w i t h a romat ics t h e r e i s a l s o a t r o n g tendency t o hydrogenate o l e f i n s . It has p r e v i o u s l y been reported( 'S2f t h a t o l e f i n s conten t i s reduced i n hydropyro lys is by as much as 50-80% compared t o thermal c rack inq i n an i n e r t atmosphere. A t h igher Pressure Z 2000 p s i g H2 te rmina l o l e f i n s a re v i r t u a l l y absent from t h e products of hydropyro lys is of n-hexadecane. I t i s
5.7 f o r t he case wlen n-hexadecane was hydropyrolyzed i n the absence o f naphthalene. Th is d a t a suqqests t h a t aromat ics compete w i t h o l e f i n s fo r a v a i l a b l e hydrogen d u r i n g sa tura t ion .
An i n t e r e s t i n g e f f e c t of the presence of naphthalene was t o reduce the conversion o f n-hexadecane a t constant reac t i on cond i t ions . 'rlhen o ther unsaturated bonds such as o l e f i n , carbony l , o r s u l f o x i d e are added t o the system i m i l a r reduc t i on i n the l e v e l o f c rack inq o f n-hexadecane i s
4 1 ~ 0 , t h e g rea te r the concent ra t ion o f unsaturated bonds added, t h e grea ter i s t h e p roduc t i on o f o l e f i n s from n-hexadecane. This inverse r e l a t i o n s h i p between concen t ra t i on o f unsaturated species and c rack ing ra tes of sa tura ted species c l e a r l y suqgests the ex is tence o f compe t i t i ve reac t ions .
Approximately 6% o f t he naphthalene was c o n v e r b t o t e t r a l i n .
noteworthy t h a t i n t h e experiment i n which naphthalene was added t o n- I hexadecane the C5-Ci pa ra f f i ns t o o l e f i n r a t i o n dec l i ned t o 3.0 compared t o 1
Promot i on o f Deal ky 1 a t i on
Hydropyro lys is appears t o promote deal k y l a t i o n reac t ions . Evidence for d e a l k y l a t i o n a t t he r i n g can be seen from NMR da ta f o r the Athabasca case i n which the f r a c t i o n o f a l i p h a t i c hydrogen alpha t o an aromat ic r i n g i s reduced from 0.27 t o 0.21. I n coking, by cont ras t , d e a l k y l a t i o n a t the benzy l i c p o s i t i o n i s genera l l y favored and the f r a c t i o n o f a l i p h a t i c hydrogen alpha t o t h e r i n g tends t o increase. Fur ther , when pentane so lub le maltenes from t a r sand bitumen are subjected t o hy p y r o l y s i s the products are shown t o conta in 11% pentane- inso lub le m a t e r i a l .@f This ma te r ia l i s charac ter ized as h i g h l y dea lky la ted ma te r ia l (H/C Z 0.9).
I n an attemDt t o examine the chemistry o f dea lky la t i on , a m ix tu re o f 20% n-Propyl benzene i n n-hexadecane was subjected t o hyd ropy ro l ys i s a t 2000 psig, 540" and 30 sec res idence time. I n order t o separate the h.ydrogen pressure e f fec ts from the t o t a l pressure e f f e c t s a second run was made w i t h a p a r t i a l Pressure Of 500 p s i H2 and 1500 p s i He. React ion cond i t i ons were otherwise i d e n t i c a l . Resu l ts a re shown i n Table 3. As the concent ra t ion o f aromat ics i s increased or t h e p a r t i a l pressure o f hydroqen i s decreased, the l e v e l of conversion of both reac tan ts i s decreased. These r e s u l t s are cons is ten t w i t h those stated above, which shows t h a t hydrogen acce le ra tes t h e c rack ing react ions.
392
1
I 1 I
The r e s u l t s show t h a t d e a l k y l a t i o n a t t he r i n g p o s i t i o n i s promoted by t h e Dresence o f hydrogen. The r a t i o o f benzene t o to luene va r ies d i r e c t l y w i t h the p a r t i a l pressure o f hydrogen. These r e s u l t s a re cons is ten t w i th hydrodea lky la t ion chemistry i n which a t tack by a hydrogen atom a t an ipso P o s i t i o n r e s u l t s i n cleavage of t h e a l ky l -a romat i c bond.
The pressure o f aromat ic t o t h e system reduces the l e v e l of o l e f i n sa tu ra t i on bu t no t as much as a reduc t i on i n the p a r t i a l pressure of hydrogen. These r e s u l t s a re cons is ten t w i t h those obtained when naphthalene was added t o the system. Thus, t he aromat ic r i n q appears t o ac t as a s ink t o dep le te t h e popu la t ion o f H' i n t h e reac t i on zone.
Hydrop.yrolysis Promotes a Broader D i s t r i b u t i o n o f Products
The reduc t ion i n the C4/C1 r a t i o seen i n Table 3 i s cons i s ten t w i t h an i nc reas ing thermal e f f e c t and decreasing h y d r o p y r o l y t i c e f f e c t . I t i s noteworthy t h a t i n hydropyro lys is C3-C4 gas produc t ion i s enhanc wh i l e methane produc t ion i s g r e a t l y reduced i n r e l a t i o n s h i p t o cokingeQ3) ( a t constant conversion). Fur ther , t h e bo i 1 i ng p o i n t d i s t r i b u t i o n hydropyro lyza te i s broader than w i t h coker d i s t i l l a t e from the same feed.( This i s i l l u s t r a t e d i n Figure-1 which a l so compares t h e b o i l i n g p o i n t d i s t r i b u t i o n o f hydropyro lys is products w i t h v i r g i n crude o i l . These r e s u l t s suggest t h a t hydrogen p lays on impor tan t r o l e i n f r e e r a d i c a l t rans fe r (propogat ion) reac t i ons r e s u l t i n g i n a wider v a r i e t y o f c rack ing events than i s the case w i t h coking.
Table 3
Hydropyro lys is o f n-Propylbenzene i n n-Hexadecane
\
\ I f
Feedstock (Atmosphere) 20% n-propyl
Conversion n-hexadecane 88.5 n-propyl benzene --- 83.6
31 .O 79.4 26.6
Product Y ie ld Product (percent o f n-propyl benzene converted )
benzene 0 t o 1 uene 0 s ty rene 0 e t h v l benzene 0 (un jden t i f i e d 100
o r not l i s t e d ) 100
C8 P a r a f f i n / O l e f i n 4.3 ' 4 l c I 2.1
13.7 14.7 12.7 52.8 6.1
1o010 Other I n d i c a t o r s
3.2 1.9
8.9 16.6
6.4 52.4 15.7
1oo.o
0.9 1.5
393
React ions o f Hydrogen
Molecular Hydrogen - The p r i n c i p a l reactio(l l)of mo lecu la r hydrogen i s as a reac tan t i n the general metathesis reac t i on ( a c t i v a t i o n energies given are f o r t h e a l k y l r a d i c a l ) :
Ea=14-15 K cal /mol +
E z 9 K cal/mol React ion 1 R- ( o r Ar') + H2 +-
a
RH ( o r ArH) + H*
The s i g n i f i c a n c e o f t h i s reac t i on t o hyd ropy ro l ys i s cannot be overstated. It i s through t h i s reac t i on t h a t f r e e r a d i c a l s are saturated. Equa l l y impor tan t i s t h e f a c t t h a t hydrogen atoms are produced. Product ion o f hydrogen atoms i s c r i t i c a l t o hydropyro lys is chemi5tr.y and the mechanism shown i n the above r e a c t i o n prov ides a means f o r p roduc t ion o f hydrogen atoms a t modest temperatures. Good contac t between hydrogen and the f r e e rad i ca l s , i s important and homogeneous, vapor-phase r e a c t i o n cond i t i ons favo r t h i s reac t ion . Hydrogen a b s t r a c t i o n reac t ions are thought t o occur a t apprec iab le ra tes ffl) a l k y l hydrogen a t 410' and fo r aromat ics a t about 425OC dur ing coking. On t h i s bas i s and cons ider ing r e l a t i v e bond d i s s o c i a t i o n energies, i t may be p r e d i c t d t h a t t he forward metathesis r e a c t i o n accurs a t s i g n i f i c a n t ra tes a t temperatures above about 435OC. Indeed many hydrov isb processes operate a t temperture regimes j u s t above t h i s temperature the metathesis r e a c t i o n i s probably impor tan t t o these processes as we l l .
The e f f e c t o f t h e metathesis reac t i on can be seen i n the observat ions 1 i s t e d above. F i r s t , dehydrogenation o f naphthenes i s reduced because molecular hydrogen serves the func t i on of p rov id ing hydrogen t o sa tuara te f ree rad i ca l s . Second, a r y l f r e e rad i ca l s a re sa tura ted be fore they can add t o arenes forming thermodynamical ly s tab le a r y l - a r y l bonds. The r e a c t i o n o f a r a d i c a l s w i t h arenes i s thought t o be an e1ementar.y step i n coke fo rmat ion and suppression o f coke i s due i n p a r t t o react ion-1. Third, a l k y l rad i ca l s a re saturated be fore they can undergo B-SCiSSiOn and overcrack. There i s a c t u a l l y a reverse arguement t o t h i s l a t t e r p o i n t i n which the reverse o f reac t i on -1 r e s u l t s i n accelerated cracking. The net e f f e c t i s t h a t molecular and atomic hydrogen ac t , i n e f f e c t , as veh ic les f o r t he t r a n s f e r o f f ree r a d i c a l r e s u l t i n g i n a more random p o i n t of c rack ing than i s experienced w i th thermal crackinq. Thermal c rack ing i s more e n e r g e t i c a l l y c o n t r o l l e d and as a r e s u l t the products tend t o be more s e l e c t i v e l y d i s t r i b u t e d between very l i g h t gases or heavy gas o i l s . I n hydropyro lys is , s i g n i f i c a n t amounts of LPG and middle d i s t i l l a t e a re generated as discussed above.
i9p k: ,":
FYI
Atomic Hydrogen
Evidence for t he presence o f atomic hydrogen i n hydropyro lys is i s c lea r from the observa t ions presented. Based on react ion-1, t he popu la t ion of hydrogen atoms would tend t o increase as the o v e r a l l popu la t ion o f f ree r a d i c a l s increases and as the concent ra t ion o f hydrogen (gas /o i l r a t i o ) increases. React ions o f atomic hydrogen can be grouped i n t o two general t ypes : ( i ) f r e e r a d i c a l hydrogen a d d i t i o n and ( i i ) f r e e r a d i c a l hydrogen abs t rac t i on reac t i ons .
The hydrogen a d d i t i o n reac t ions are charac ter ized by a t tack on unsaturated bonds, o l e f i n s and aromatics, t o form a l k y l o r cyclohexadienyl- t ype rad ica ls , respec t i ve l y . These r a d i c a l s subsequently undergo metathesis
394
reac t i ons with hydrogen t o sa tu ra te t h e r a d i c a l and regenerate t h e hydrogen atom. The presence o f unsaturated bonds tends t o decrease t h e o v e r a l l popu la t ion of H* as evidenced by the reduced c rack ing ra tes f o r n-hexadecane when unsaturated bonds a re present.
I f hydrogen adds t o a subs t i t u ted aromat ic carbon it i s p robab le t h a t
t he C-C bond. The same e f f e c t i s not t r u e f o r a r y l - a r y l bon owever, which
adds t o an unsubs t i tu ted aromatic carbon and a hydrogen i s e l im ina ted be fore the f ree r a d i c a l can be hydrogenated an unproduct ive event occurs which cannot be observed i n the products. This reac t i on may, however, account f o r t he s ink fo r H' observed when aromat ics are present.
Hydrogen a b s t r a c t i o n reac t i ons are a l s o impor tan t t o hyd ropy ro l ys i s resu l t s . Hydrogen abs t rac t ion , o r t he reverse o f react ion-1, r e s u l t s i n a f ree r a d i c a l which can subsequently undergo @-sc i ss ion t o crack t h e molecule i n two. The f a c t t h a t t he r a t e o f c rack ing o f n-hexadecane depends upon the H' concent ra t ion t e s t i f i e s t o t h e importance o f t h i s reac t ion . The broad d i s t r i b u t i o n o f t he products as we l l as the r e l a t i v e l y h igh concen t ra t i on of LPG range gases i nd i ca tes t h a t a less s e l e c t i v e and more random c rack ing i s occurr ing. This i s probably due t o the less d i s c r i m i n a t i n g na tu re o f H' a b s t r a c t i o n vs. f r e e r a d i c a l abs t rac t i on i n t h e absence o f h,ydrogen.
\ r i n g d e a l k y l a t i o n w i l l occur due t o the r e l a t i v e s t reng th o f t h e C-H bond VS.
\ a re thought t o be s t ronger than t h e corresponding C-H bond. ??'.of If hydrogen '>
SUMMARY
I n summary, both molecular hydrogen and atomic hydrogen are reac tan ts i n hyd ropy ro l ys i s o f res idua l o i l . The reac t ions of hydrogen pos tu la ted can account f o r t he major d i f f e rences between p y r o l y s i s i n an i n e r t atmosphere and hydropyro lys is . Coke i s i n h i b i t e d through s a t u r a t i o n o f a r y l r a d i c a l s by molecular hydrogen and throuqh hydrogenation o f v i n y l aromat ics (and o l e f i n s ) by a d d i t i o n o f H'. Cracking ra tes are enhanced throuqh hydrogen a b s t r a c t i o n react ions. Product d i s t r i b u t i o n i s broadened throuqh l e s s e n e r g e t i c a l l y d i s c r i m i n a t i n g f r e e r a d i c a l format ion. H,ydrogen a l s o seems t o a c t as an e f f e c t i v e heat t rans fe r f l u i d and as a d i l u a n t t o i n h i b i t b imo lecu la r a d d i t i o n o r condensation reac t i ons r e l a t i v e t o unimolecular c rack ing reac t ions . I n time, as t h e r e l a t i v e k i n e t i c s o f these reac t i ons become b e t t e r understood s p e c i f i c process development routes may become apparent. The a p p l i c i b l i t y o f hyd ropy ro l ys i s t o upgrading feedstocks f rom a v a r i e t y of sources and composi t ions should l i k e w i s e become more apparent.
395
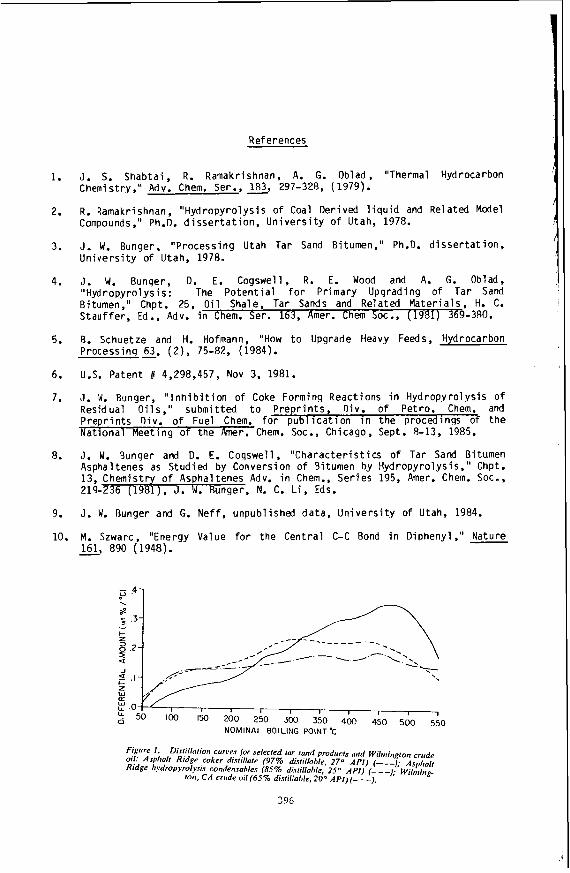
References
1.
2.
3.
4.
5.
6.
7.
8.
9.
J. S . Shabtai , R. Ramakrishnan, A. G. Oblad, "Thermal Hydrocarbon Chemistry," Adv. Chem. Ser., 183, 297-328, (1979).
R. Ramakrishnan, "Hydropyro lys is o f Coal Derived l i q u i d and Related Model Compounds," Ph.D. d i s s e r t a t i o n , U n i v e r s i t y o f Utah, 1978.
J . W. Bunger, "Processing Utah Tar Sand Bitumen," Ph.D. d i s s e r t a t i o n , U n i v e r s i t y o f Utah, 1978.
J. W. Bunqer, 0. E. Cogswell, R. E. Wood and A. G. Oblad, "Hydropyrolysis: The P o t e n t i a l f o r Primary Upgrading o f Tar Sand Bitumen," Chpt. 25, O i l Shale Tar Sands and Related Ma te r ia l s , H. C. S tau f fe r , Ed., Adv. i n Chem. S i r . 163, Amer. Chem Soc., (1981) 369 -380.
R. Schuetze and H. Hofmann, "How t o Upgrade Heavy Feeds, Hydrocarbon Processinq 63, ( Z ) , 75-82, (1984).
U.S. Patent # 4,298,457, NOV 3, 1981.
J. W. Bunger, " I n h i b i t i o n o f Coke Forming Reactions i n Hydropyro lys is of Residual O i ls , " submit ted t o P rep r in t s , Div. o f Petro. Chem. and Prep r in t s Div. o f Fuel Chem. f o r p u b l i c a t i o n i n the procedings of t h e Nat iona l Meet ing o f the Amer. Chem. SOC., Chicago, Sept. 8-13, 1985.
J. W. Bunqer and 0. E. Coqswell, "Charac te r i s t i cs o f Tar Sand Bitumen Asphaltenes as Studied by Conversion o f Bitumen by Hydropyrolysis," Chpt. 13, Chemistry o f Asphaltenes Adv. i n Chem., Ser ies 195, Amer. Chem. Soc., 219--, N. C. L i , Eds.
J. W. Bunger and G. Nef f , unpublished da ta , U n i v e r s i t y o f Utah, 1984.
10. M. Szwarc, "Energy Value f o r the Central C-C Bond i n Diphenyl ," Nature - 161, 890 (1948).
NOMINAL BOILING POINT 'C
Figfrre I . Distilintion curves for selected far sand prodcrcf.r nrrd WLnitlgton crrrde oil: Asphalt Rid,qe coker di.srillare (97% disfillnble. 27" A P I ) (-); Asphalf Ridge 1r.vdropyroly.ris conden.sah1e.r (85% di.rtil/ahle, 25" A P I ) (- - -); Wiiming-
ton, CA cricde oil (65% distillohle, 20" A P I ) ( - . -).
HYDROGEN INCORPORATION IN RESIDUUM CONVERSION
i Samil Beret and John G. Reynolds
Chevron Research Company, Richmond, California 94802-0627 L
\ Introduction
In the last ten years there has been a large increase in residuum hydroconversion capacity in the United States and overseas. This expansion was derived from the expectation that the spread in market values between the high sulfur fuel oil and the light transpor- tation fuels would increase to support the large investments required for these conversion facilities.
The reason for residuum conversion is simple--increasing the hydrogen-to-carbon ratio (H/C) and lowering the molecular weight gen- erates marketable distillate products. Figure 1 illustrates this qualitatively. It shows a Stangeland (1) chart for pure paraffins, aromatics, and a number of petroleum fractions. The residuum is located to the right at higher carbon numbers. From a knowledge of the boiling points of pure paraffins and polycyclic aromatics, extra guidelines are drawn to represent approximate boiling points. This chart is very useful because it shows the extent to which carbon number must be reduced or hydrogen added to generate the desired light stocks. To correct this hydrogen imbalance, various residuum con- version processes either add hydrogen or reject carbon. A partial list of conventional residuum conversion options is shown in Table I. Thermal and extractive processes generally reject carbon while hydro- conversion schemes add hydrogen.
Residuum Hydroconversion
The choice of residuum conversion process depends on the unique set of circumstances for each refinery, for example, feed- stocks, existing equipment, and capital constraints. If the objective is to produce a distillate product slate, then hydroconversion can serve as an efficient process for conversion of lower value hydro- carbon feedstocks and heavy residuum to high quality distillate products.
Figure 2 shows a residuum hydroconversion refinery in its basic form is shown in Figure 2. The residuum feedstock is partially converted to C4-100O0F distillate liquids and C1-C3 gas. The hydrogen necessary for the operation is supplied from an outside source. The hydroconversion reaction system may be thermal, catalytic, or may consist of a series of thermal and/or catalytic steps. Operating conditions, nature of the catalysts, and various processing schemes
Encl. - Tables I-IV Figure 1 (RE 832399) Figures 2-6
397
(for example, "recycle") all affect and define the process severity. The process severity in turn affects conversion, product slate, vol- umetric expansion, and hydrogen consumption.
It should be noted that the operating conditions, catalysts, and processing techniques vary considerably among the commercial hydroconversion processes: but as shown in Figure 3 , both the total hydrogen consumed and the residuum conversion increase invariably with increasing process severity. Figure 3 represents hydrogen consumption and conversion data for Arabian Light residuum processing at different sulfur levels ( 2 ) . This representation is based on Chevron-designed catalysts operating at conditions capable of giving run lengths of at least six months. For maximum conversion, operation at high severi- ties is required.
In this paper, we use total conversion to distillates and the hydrogen consumed by the process as relative measures of process severity. Admittedly, these are relative definitions, but they allow evaluation of hydroconversion processes in general without regard to the details unique to each process (e.g., catalyst, reactor type, tem- perature, etc.). For a given example, referring to Figure 3 , the relative hydrogen consumed at hydrocracking conversion depends upon the desired S specification of the product. Because we are only interested in the relative hydrogen consumed, knowledge of the spe- cific process details are not necessary.
Under the usual hydroconversion conditions (elevated tem- peratures and pressure, high hydrogen-to-feed ratios, and high activ- ity catalysts), many reactions with hydrogen proceed simultaneously. These include: hydrocracking, aromatization, hydrogenation, condensa- tion, hydrodesulfurization, hydrodenitrification, deoxygenation, demetalation, and isomerization. However, these reactions do not all occur at equal ratios. Judicious selection of catalysts and proces- sing conditions favor one or more of these reactions over others. One can learn more about the relative impact of these reactions by study- ing the stoichiometry of hydrogen incorporation.
Stoichiometry of Hydrogen Reactions
We used the same analytical approach as PinSeth et el. ( 3 : in formulating the hydrogen/residuum reactions. Finseth and his col- leagues were interested in coal conversion chemistry and the role of hydrogen during coal liquefaction. However, the same approach with some modifications can be used to study the role of hydrogen during residuum conversion. The fact that it is difficult to understand the molecular level mechanisms of hydrogen incorporation should not pre- clude understanding the overall chemistry.
As Finseth, hydrogen/residuum reactions are classified into six categories:
1. Hydrogenation and dehydrogenation. 2 . Hydrocracking and ( its reverse) condensation.
398
3. Isomerization and hydrogen exchange. 4. Desulfurization. 5. Denitrification and deoxygenation. 6. C1-C3 gas production.
This grouping is done basically to generalize the stoichio- metries of very high number of reactions. Once the stoichiometry is established then it is possible to devise a technique which discrimi- nates among these six hydrogen reaction routes.
We used 'H and 13C NMR to determine the hydrogen distri- bution during hydrogenation/dehydrogenation reactions. We have seen only aromatization as the dehydrogenation reactions. Hydrogenation consumes one hydrogen atom for every carbon reduced. For example, if a residuum sample containing 25 aromatic, 75 aliphatic carbons is hydrogenated to 20 aromatic, 80 aliphatic carbons, 13C NMR should detect the change in aromaticity from 25% to 20%.
The second category of reactions, cracking/condensation, is more difficult to determine. No satisfactory method is available to count the number of cracking reactions occurring during residuum con- version. However, if all of hydrogen involved in the other five cate- gories of reactions are accounted for, then we can calculate the hydrogen consumed due to cracking by difference.
The total change in hydrogen content can be determined by
The third class of reactions, isomerization/exchange, does
classical elemental analysis.
not affect net hydrogen incorporation. Therefore it is not considered here.
The remaining three categories are basically bond scission reactions eliminating heteroatoms and forming C1-C3 gases. Gas pro- duction is easily measured and analyzed with commonly available ana- lytical instruments. Since two hydrogens are incorporated for every molecule of C1-C3 formed (mostly due to alkyl chain cracking reactions), these gas analyses provide a good estimate of hydrogen consumed in gas formation.
It is difficult to quantify accurately hydrogen consumed due to heteroatom (S, N, 0) removal due to the multiplicity of reactions. For simplicity, we assume sulfur in the residuum occurs as thiophenic. Therefore, two hydrogen atoms are incorporated into the residuum for each sulfur removed.
We also assume nitrogen as pyrrolic and oxygen as a mixture 'Therefore, one hydrogen atom is incorpo- of carboxylic and phenolic.
rated into the residuum for each N or 0 removed.
Even though carboxylic acid amides and other compounds have been detected in residua ( 4 ) , the above assumptions should not affect the calculations significantly because no residua studied contained more than 2% N, 0. Furthermore, probably any deviations in
399
s t o i c h i o m e t r y d u e to v e r y l a r g e number o f r e a c t i o n s i n v o l v i n g h e t e r o - atoms t e n d t o c a n c e l e a c h o t h e r and are t h e r e f o r e s e l f - c o r r e c t i n g .
Coking r e a c t i o n s p r o d u c e i n s o l u b l e o r g a n i c material which is n o t accounted f o r i n t h e above a n a l y s i s , p r i m a r i l y r e d u c i n g t h e amount o f m e a s u r a b l e a r o m a t i c i t y o f t h e p r o c e s s e d p r o d u c t s . I n hydroconver- s i o n , t h e s e l e v e l s were a l l u n d e r l%, and g e n e r a l l y less t h a n 0.5%. These l e v e l s s h o u l d h a v e l i t t l e a f f e c t on t h e c a l c u l a t i o n s .
T h e r e f o r e , u s i n g l H and 1 3 C NMR, a s w e l l as e l e m e n t a l a n a l y - s is and q u a n t i t a t i v e g a s a n a l y s i s , one c a n d e t e r m i n e t h e n e t hydrogen i n c o r p o r a t e d d u e t o e a c h o f t h e s i x c a t e g o r i e s o f r e a c t i o n s . F u r t h e r - more, i f t h e s e d e t e r m i n a t i o n s a r e c o u p l e d t o p r o c e s s p a r a m e t e r s , t h e y g r e a t l y enhance t h e u n d e r s t a n d i n g o f res iduum c o n v e r s i o n c h e m i s t r y and hydrogen u t i l i z a t i o n . With t h e s e g o a l s i n mind, w e c o n d u c t e d res iduum h y d r o c o n v e r s i o n e x p e r i m e n t s a t d i f f e r e n t p r o c e s s s e v e r i t i e s and ana- l y z e d b o t h t h e l i q u i d and g a s p r o d u c t s as w e l l as t h e f e e d e x t e n s i v e l y u s i n g t h e t e c h n i q u e d e s c r i b e d h e r e .
E x p e r i m e n t a l
Three C a l i f o r n i a r e s i d u a ( d e s i g n a t e d A, B , and C ) were
The 1 3 C NMR and 'H NMR s p e c t r a were r e c o r d e d on e i t h e r a
o b t a i n e d by s i n g l e - p l a t e d i s t i l l a t i o n of t h e c o r r e s p o n d i n g c r u d e .
Bruker CXP 300 or WH-90 s p e c t r o m e t e r s . The s a m p l e s were p r e p a r e d a s d i l u t e s o l u t i o n s i n d e u t e r a t e d c h l o r o f o r m w i t h t e t r a m e t h y l s i l a n e a s r e f e r e n c e . I n t e g r a t i o n s were per formed by t h e s p e c t r o m e t e r s , and t h e r a t i o s were c a l c u l a t e d by hand. The NMR s p e c t r a were i n t e r p r e t e d by t h e method o f Young a n d G a y l a (5). N o o l e f i n s were o b s e r v e d i n s p e c t r a . Gadol in ium tris(1,1,2,2,3,3-heptafluoro-7,7-dimethyl- 4,6-oc tanedione) was added as a r e l a x a t i o n a g e n t t o e n s u r e a c c u r a t e i n t e g r a t i o n of t h e a r o m a t i c r e g i o n . The aromatic r e g i o n was i n t e - g r a t e d be tween 110-180 ppm. The a l i p h a t i c r e g i o n was i n t e g r a t e d between 0-60 ppm. Each were c a l c u l a t e d as p e r c e n t a g e o f t h e t o t a l i n t e g r a t e d a r e a ( m i n u s t h e s o l v e n t p e a k s ) .
s i t i o n o f t h e g a s . T o t a l aromatic c o n t e n t o f l i q u i d is a d j u s t e d f o r t h e compo-
Elemcnta: a n a l y s e s usre perfor laed by Chevron R e s e a r c n Company A n a l y t i c a l Depar tment . C , H were done by C a r l o E r b a , N by e i t h e r Mettler ( D u m a s ) or Dohrmann (ASTM D 3 4 3 1 ) , S by Dohrmann (ASTM D 3 1 2 0 ) , and metals by e i t h e r X-ray f l u o r e s c e n c e or i n d u c t i v e l y coupled plasma e m i s s i o n s . B o i l i n g p o i n t d i s t r i b u t i o n was d e t e r m i n e d by t h e m o g r a v i m e t r i c a n a l y s i s (TGA). Gas c o m p o s i t i o n w a s d e t e r m i n e d by g a s c h r o m a t o g r a p h y .
Hydroconvers ion E x p e r i m e n t s
H y d r o c o n v e r s i o n e x p e r i m e n t s were c o n d u c t e d i n a f low r e a c t i o n s y s t e m u s i n g t h e heavy r e s i d u a from C a l i f o r n i a c r u d e s . I n s p e c t i o n s of t h e s e r e s i d u a a r e g i v e n i n T a b l e 11. These r e s i d u a are v e r y r i c h i n n i t r o g e n , s u l f u r , and metals. A r a b i a n Heavy 730°F+ o i l
400
is included for comparison. They represent a big challenge for the refining industry in the coming decades.
using different sets of operating variables such as temperature, pres- sure, residence time, hydrogen circulation rate, and catalyst. Total hydrogen consumption varied from 600-2100 SCF/bbl of feed. Residuum conversion (lOOO°F+/lOOOOF-) ranged from 50-95%. Hydrogen consump- tion, 1000°F+ conversions, and the percent aromatic carbon are summa- rized in Table 111.
These feedstocks were processed at different severities t
Hydrogenation, Cracking, and Process Severity
The number of hydrogen atoms incorporated per 100 carbon atoms is compared in Figure 4 for Residuum A, 850°F+ cut point at three different conversion levels (Table 111: Runs ZA, 2B, and 2C). With increasing process severity, the number of hydrogen atoms con- sumed due to cracking and gas formation reactions appears to increase linearly. The bulk of the hydrogen is used to cap the ends of cracked fragments. Since two hydrogens are incorporated for every molecule of C1-C3 gas formed, it is natural that hydrogen consumed in gas for- mation reactions also increases with increasing conversion. On the other hand, the net number of hydrogens involved in aromatic satu- ration remains constant in all three experiments. This may be due to all three experiments were at high levels of 1000"F+ conversion. At these high conversion levels, incremental conversion probably comes from cracking off alkyl branches from already hydrogenated species.
In Figure 5, hydrogen incorporation into Residuum A 850°F+ is compared to that of Residuum A 650°F+. As shown in Tables I1 and 111, 850°F+ is more aromatic and contains more heteroatoms. Due to its hydrogen deficient nature relative to the 650°F+, the 850°F+ con- sumes more hydrogen at roughly equal process severities. Comparing Experiments 1A to 2C in Figure 5, we see that cracking reactions con- sume more hydrogen with 650°F+ compared to the 850°F+. With regard to hydrogenation, this order is reversed, probably because some of the hydrogen deficient species in the 850°F+ have to be hydrogenated before they crack. Due to the high conversion, the number of hydro- gens involved in capping the cracked fragments far exceeds the hydro- gens involved in net aromatic saturation.
In Figure 6, we compare two hydroconversion experiments conducted with Residuum B 650°F+. Experiment 3A was a thermal treat- ment of the feedstock, while the Experiment 3B included a catalytic treatment. The effect of these process differences is very apparent in Figure 6. The number of hydrogens incorporated due to net hydro- genation reactions is negative (-1.8/100 carbons) during Experiment 3A. This suggests that at this particular processing con- dition, aromatization of the residuum is occurring, and it is provid- ing some of the hydrogen consumed for cracking and other hydrogen consuming reactions. During Experiment 38, under different processing conditions, there is no net aromatization (indicated by the number of
401
hydrogens incorporated in hydrogenation). In fact, aromatic satura- tion is the dominant reaction in this case, consuming more hydrogen than cracking. Figure 6 is a good example of how this technique can be used as a sensitive test of the effect of processing conditions On different reaction pathways.
This technique also reveals the sensitivity of hydrocon- version to characteristics of the feedstock. In Table IV, comparing 1B to 4A, total number of hydrogens incorporated is roughly the same, 2 4 per 100 carbons. The gross hydrogen consumption is about the same, about 1600 SCF/bbl. However, the starting feedstocks are very differ- ent. In Experiment 4 A , the feedstock was Residuum C 950°F+, which is very rich in aromatic carbon and hydrogen, but low in sulfur. (See Tables 11 and 111.) On the other hand, the feed in Experiment 1B was Residuum A 650°F+, which is less aromatic but much higher in sulfur (relative to Residuum C 950°F+). Due to the hydrogen deficient nature of the Residuum C 950°F+, more of the hydrogen is consumed in hydro- genating,the aromatic species than for Residuum A 650°F+. Since over- all conversion is the same in both experiments, there was not that much difference in the number of hydrogens involved in cracking and gas make. However, substantially more hydrogen was used to remove sulfur from Residuum A 650°F+ compared to Residuum C 950°F+. There- fore, although the same number of hydrogens were involved in both experiments, the distribution of these hydrogen atoms were radically different.
Conclusions
This approach yields a detailed description of hydrogen incorporation during residuum hydroconversion. Character of the feed- stock, processing conditions, and the catalyst all affect how hydrogen iS incorporated into residuum matrix. The two dominant reaction routes are hydrocracking and hydrogenation.
reactions incorporate hydrogen equally at moderate process severities. At high severities, the bulk of the hydrogen is consumed by capping reactions of cracking fragments. Judicious selection of processing conditions favor one or the other.
Our data analysis suggests hydrogenation and hydrocracking
The feedstock characteristics also influence hydrogen incor- poration. With aromatic feedstocks, hydrogenation reactions compete equally with hydrocracking for hydrogen. With less aromatic feed- stocks, hydrocracking dominates over hydrogenation reactions.
processing conditions to understanding of the overall chemistry and exploiting these processing conditions to tailor the process and the products to the desired product slate.
The technique we presented here is useful in relating these
402
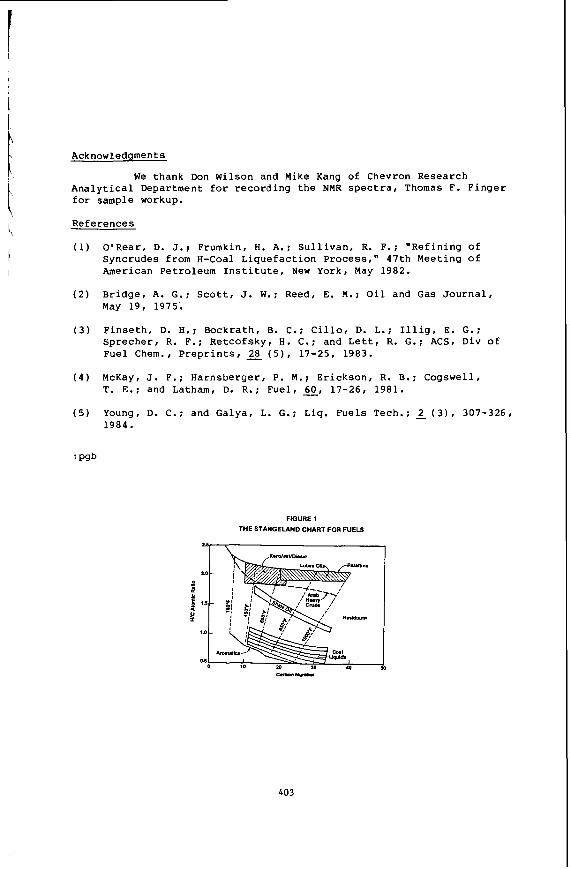
Acknowledgments
We thank Don Wilson and Mike Kang of Chevron Research Analytical Department for recording the NMR spectra, Thomas F. Finger for sample workup.
References
(1) O'Rear, D. J.; Frumkin, H. A . ; Sullivan, R. F.; "Refining of Syncrudes from H-Coal Liquefaction Process," 47th Meeting of American Petroleum Institute, New York, May 1982.
( 2 ) Bridge, A. G.; Scott, J. w.; Reed, E. M.; Oil and Gas Journal, May 19, 1975.
(3) Finseth, D. H.; Bockrath, B. C.; Cillo, D. L.; Illig, E. G.; Sprecher, R. F.; Retcofsky, H. C.; and Lett, R. G.; ACS, Div of Fuel Chem., Preprints, 28 (5), 17-25, 1983.
(4) McKay, J. F.; Harnsberger, P. M.; Erickson, R. B.; Cogswell, T. E.; and Latham, D. R.; Fuel, 60, 17-26, 1981.
(5) Young, D. C.; and Galya, L. G.; Liq. Fuels Tech.; 2 (3), 307-326, 1984.
t
FIGURE 1 THE STANQELAND CHART FOR FUELS
403
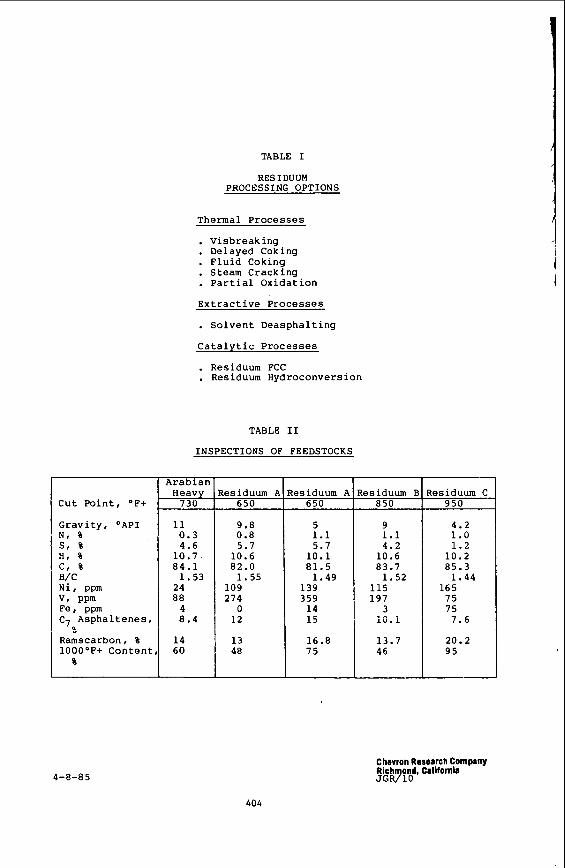
TABLE I
RESIDUUM PROCESSING OPTIONS
C u t P o i n t , OF+
G r a v i t y , OAPI N , % s, % H I % c , % H/C N i , ppm V I PPm Fer ppm C7 A s p h a l t e n e s ,
Ramscarbon, % 1000°F+ C o n t e n t
0,
%
4-8-85
Thermal P r o c e s s e s
. V i s b r e a k i n g . Delayed Coking . F l u i d Coking . Steam C r a c k i n g . P a r t i a l O x i d a t i o n
E x t r a c t i v e P r o c e s s e s
. S o l v e n t D e a s p h a l t i n g
C a t a l y t i c P r o c e s s e s
. Residuum FCC . Residuum Hydroconver s ion
TABLE I1
INSPECTIONS OF FEEDSTOCKS
A r a b i a n
11 0.3 4.6
10.7 84.1
24 88 4 8.4
1.53
9.8 0.8 5.7
10.6 82.0 1.55
109 274
0 12
5 1.1 5.7
10.1 81.5 1.49
139 359 14 15
16.8 75
lesiduum B 850
9 1.1 4.2
10.6 83.7 1.52
115 197
3 i0.i
13.7 46
lesiduum C 950
4.2 1.0 1.2
10.2 85.3 1.44
16 5 75 75 7.6
20.2 95
Chevron Research Company Rich ond, California JGR7lO
404
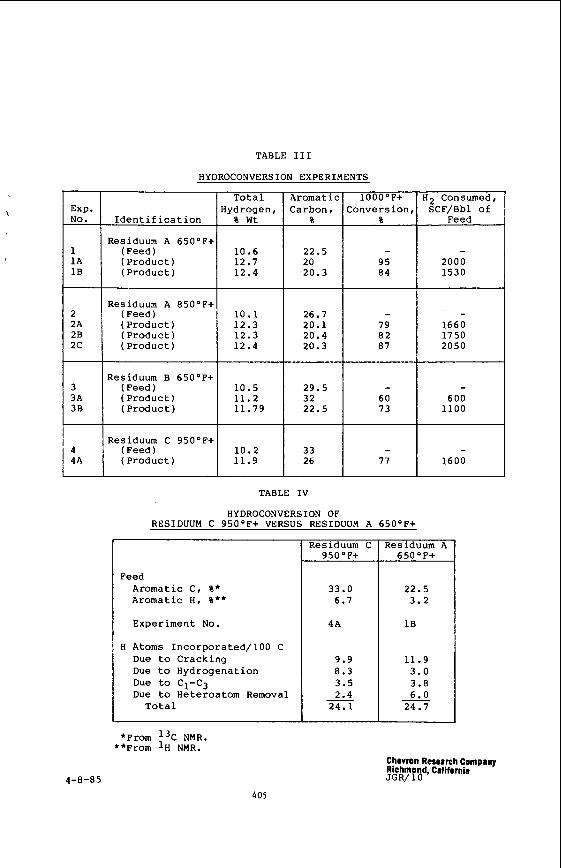
TABLE I11
HYDROCONVERSION EXPERIMENTS
Exp. NO.
Total Aromatic 1000°F+ Hydrogen, Carbon, Conversion,
Identification % Wt % % I
1 1A 1B
2 2A 28 2c
3 3A 38
I
I I I I
Residuum A 650°F+ ( Feed) 10.6 22.5 - ( Product) 12.7 20 95 ( Product ) 12.4 20.3 84
Residuum A 850°F+ ( Feed) 10.1 26.7 - ( Product) 12.3 20.1 79 (Product) 12.3 20.4 82 ( Product) 12.4 20.3 87
Residuum B 650°F+ ( Feed) 10.5 29.5 - ( Product) 11.2 32 60 (Product) 11.79 22.5 73
/Residuum C 950°F+ (Feed )
4A ( Product) - 77
I I I I TABLE IV
HYDROCONVERSION OF RESIDUUM C 950°F+ VERSUS RESIDUUM A 650°F+
Feed Aromatic C, %* Aromatic H, %**
Experiment No.
H Atoms Incorporated/100 C Due to Cracking Due to Hydrogenation Due to C1-C3 Due to Heteroatom Removal Total
Residuum C 950°F+
33.0 6.7
4A
9.9 8.3 3.5 2.4 24.1
x2 Consumed, SCF/Bbl Of
Feed
- 2000 1530
- 1660 1750 2050
- 600 1100
- 1600
Residuum A 650°F+
22.5 3.2
1B
11.9 3.0 3.8 6.0 24.7 -
*From 13C NMR. **From lH NMR.
4-8-85 405
Chevron Research Company Richmond, California JGR/ 1 o
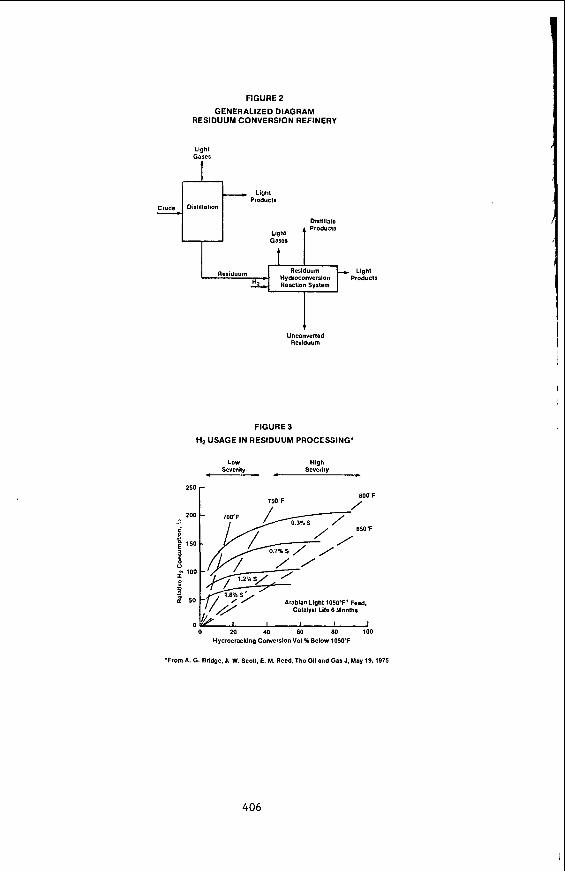
FIGURE 2
GENERALIZED D I A G R A M R E S I D U U M C O N V E R S I O N REFINERY
Lighl Gases
Light Producli
Dlslillate Garor 1 PrOd~cIs Lighl
Unconvened Residuum
F IGURE 3
H? U S A G E I N R E S I D U U M PROCESSING'
LOW High Sfverily SBVCrIly * c - c
- 1.7% S / / '
Arabian Light 1050'F' Feed, Calalysl Llle 6 Months
I I I J 0 20 40 60 BO 100
Hydrocracking Converslon VoI Z Below IOM'F
'From A. G. Bridge. J. W. Scotl. E. M. Reed. Tho Oil and Gas J. May 19.1975
406
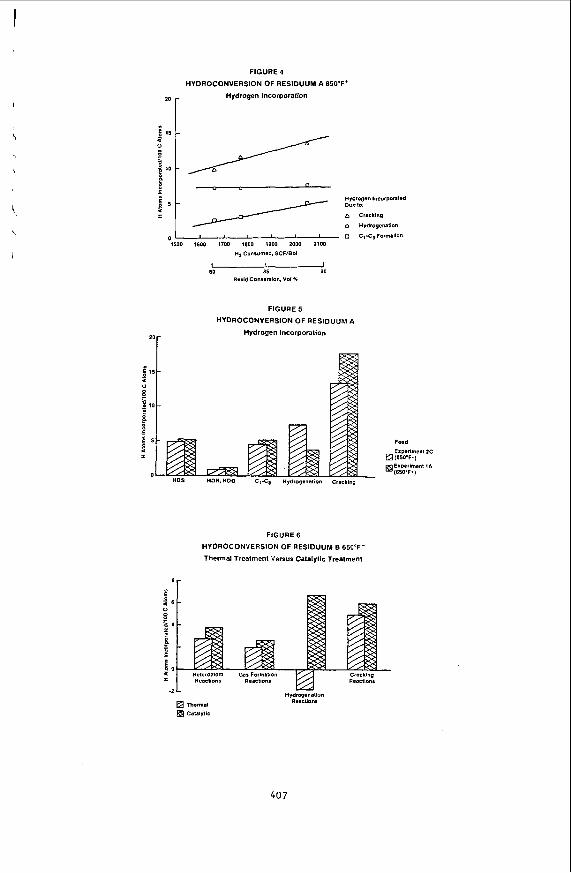
I
FIGURE 4
HYDROCONVERSION OF RESIDUUM A 850'F'
Hydrogen Incorporation
Hydrogen Incorporaled DUO Io: 1 A Cracking 0 Hydrogenslioin
0 C& Formation 0 1500 7600 1700 1600 1900 2000 2100
H p Consumed. SCFlBbl
I ! J 80 85 90
Resid COnveRlOn. Yo1 %
FIGURE 5
HYDROCONVERSION OF RESIDUUM A
Hydrogen Incorporation
FIGURE 6
HYDROCONVERSION OF RESIDUUM B 650'F'
Thermal Treatment Versus Catalytic Treatmenl
407
P E T R O L E U M ASPBALTENE THERMAL R E A C T I O N P A T H W A Y S
P.E. Savage, M.T. Klein, and S.G. Kukes
Depar tment of Chemical Engineering a n d
Center for Catalytic Science and Technology University of Delaware
Newark, D E 19716
Research and Development Center Phillips Pe t ro leum C o m p a n y
Bartlesville, O K 74004
I N T R O D U C T I O N
The industrial trend toward processing comparatively refractory heavy crudes and residua that can contain appreciable portions (10%30%) of asphaltenes assures interest in their thermolysis. Most previous pyrolyses of asphaltunes have been oriented toward either elucidation of their structure (1,2) or the identilicatior. of fragmentation products and the dependence of their yields on pyrolysis temperature (3-6). Pyrolysis kinetics related to global product fractions (e.& asphaltene, maltene, coke) have also been reported (2,7). Little information exists, however, about the variation of the yields of the individual constituents of the product fractions with both time and temperature. Further, operative thermolysis mechanisms, e.g. pericyclic or free radical, are obscured in the complexities of the reactions of actual asphaltenes. The foregoing motivated the present investigation of the pyrolysis of both precipitated asphaltenea and an asphaltene model compound, pentadecylbeniene.
EXPERIMENTAL
The asphaltenes were isolated from an off-shore California crude oil via a standard procedure of precipitation Pentadecylbenaene (PDB), 99.4% by GC analysis, was obtained from M a with 40 volumes of n-heptane.
Products and used as received.
Reac tors
The isothermal, batch pyrolyses were at temperatures between 350'C and 450'C for times ranging from 5 to 180 minutes. Two reactors were used. The rust, used in asphaltenes' thermolyses, consisted of nominal 3/8 in stainless steel capped Swagelok port connectors attached'to'the two ends of a unier! tee. .4 redxer comccted the center port of the tee to a 12 in length of 1/4 in 0.d. stainless steel tubing. A 1/4 in Whitey severe service union bonnet valve interposed in the tubing served as a shut-off valve and also allowed attachment of a gauge for measurement of pressure. The second reactor, used in model compound pyrolyses, was assembled from a nominal 114 in port connector and two 114 in caps.
Procedure
For the asphaltene thermolyses the reactors were typically loaded with 1 g of asphaltene and purged with argon. The shut-ofi valve was then closed, and the reactor plunged into a Tecam fluidued sandbath that had been preheated to the pyrolysis temperature. After the desired reaction time had elapsed the reactor was removed from the sandbath and immediately immersed in ice water to quench the reaction. After the reactor assembly bad cooled and equilibrated at room temperature, the number of moles of gas produced during pyrolysis was estimated by measuring the reactor pressure. The gaseous products were subsequently analyzed by
408
2
gas chromatography. After removing the tubing and the shut-off valve, a small amount of phenylether was
added to the reactor contents to serve as an external standard in the ensuing chromatographic analysis of the heptane-soluble products. The reaction products were next subjected to a series of solvent extractions (8) to separate and coUect the pyrolysis product fractions which were subsequently analyzed gravimetrically and by GC and GGMS.
1 i I During a typical model compound experiment, reactors were loaded with about 50 mg of PDB and then 3 mg
of diphenylmethane was added to serve as an internal standard in the chromatographic analysis. After purging with argon, the reactors were sealed, immersed in the preheated sandbath. and after the desired reaction time had elapsed, removed from the sandbath and quenched in cold water. Once cool, the reaction products were collected in acetone and analyzed by GC.
i
RESULTS AND DISCUSSION
Aaphdtenc Thermolysis
Asphaltene pyrolysis products and global kinetics are summarized in Table 1, which lists, for reactions at 350, 400 and 4SO'C, respectively, holdmg time, product identification, product yields, and the apparent first order rate constant for asphaltene decomposition.
Pyrolyses at 350' C yielded gas, maltene (heptane-soluble), and onreacted asphaltene (heptane-insoluble, benzene soluble) product fractions. Coke (heptane-insoluble, benzene-insoluble) did not form, and mass balance closnre averaged 97%. The ultimate asphaltene conversion was leas than 10%. Within the product fractions listed above, the most abundant of the individual products were the light nonhydrocarbon and hydrocarbon gases H,S, CO,, CHI, C,H,, C3Hs, n-C4HIo, and n-C5H12. The maximnm total gas yield observed was about 1.0% after 150 min. The maltene fraction yield was about 10% by weight of the original asphaltene after 150 min at this temperature. No individual product constituted a major portion of the maltene fraction but a series of n-parafhs was identilied with each present in trace amounts.
Asphaltene thermolysis at 400'C produced coke in addition to gas, maltene, and asphaltene fractions. Mass balance closure varied from 79% to 96%. Major gaseous products at W'C were H,S, CH,, C2Ha, C3Hs, nC4HI0, and nC5HI2 along with lesser amounts of CO, and C2H,. The n-alkanes up t o C,, and various cycloakanes were the m a t abundant products in the maltene fraction at this temperature. The single-ring aromatics toluene and the xylenes were also detected in smaller proportions.
Fqure l a summarines the temporal variation of the yields of pyrolysis product fractions a t 400'C. Maltenes were more abundant than g a w at all times, and the nearly discontinuous rate of generation of coke at 30 min coincided with rapid asphaltene conversion. Note that during this period of apparently rapid asphaltene reaction the yields of gas and maltene did not increase dramatically.
Figure Ib shows the effect of reaction time on the yield of the major gaseons products. H,S was once again the major product and its yield reached an asymptotic value of about 18 mg/g asphaltene after 120 min. This represents abont 23% of the sulfur content of the original aspbaltene.
Figure IC depicts the temporal rariations of selected n-pardfins a t 400'C. The yields of each &me were nearly equal initially, but at longer times yield decreased as carbon number increased. Note that eicosane and tetracame exhibit maximum yields. This behavior indicates that these alkanes underwent secondary
decomposition.
Asphalkne p p l y s i s at 450'C produced gas, maltenes, coke, and unconverted asphaltene. Mass balances Asphaltene conversion, to predominantly coke, was rapid, and was complete after ranged from 60% to 74%.
409
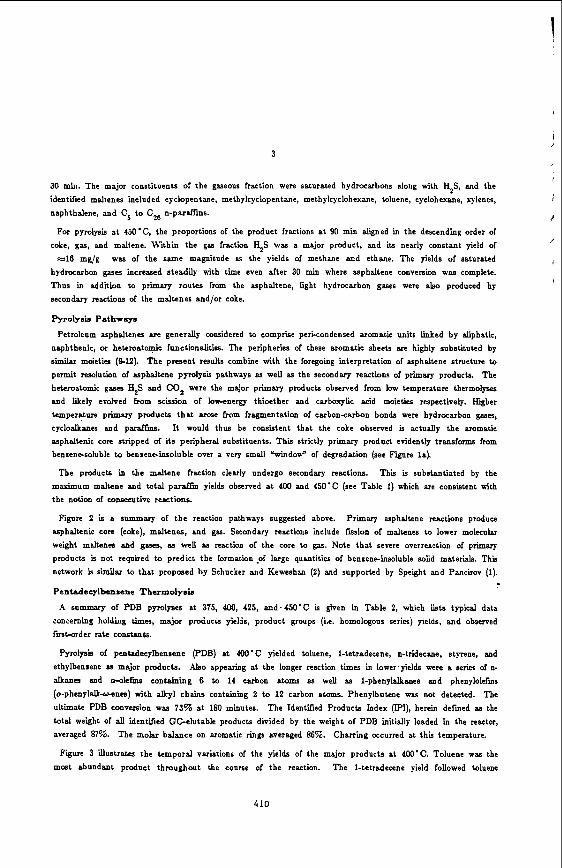
3
30 min. The major constituents of the gaseous fraction were saturated hydrocarbons along with H,S, and the identified maltenes included cyclopentane, methylcyclopentane, methylcyclohexane, toluene, cyclohexane, hylenes, naphthalene, and C, to C,, n-paraffins.
For pyrolysis at N ' C , the proportions of the product fractions a t 90 min aligned in the descending order of coke, gas, and maltene. W t h m the gas fraction H,S was a major product, and its nearly constant yield of
%16 mg/g was of the same magnitude as the yields of methane and ethane. The yields of saturated hydrocarbon gar- increased steadiiy with time even after 30 min where asphaltene conversion was complete. Thus in addition to primary routes from the asphaltene, light hydrocarbon gases were also produced by secondary reactions of the maltenes and/or coke.
F'ymlysis Pathway.
Petroleum asphalten- are generally considered to comprise perkondensed aromatic units linked by aliphatic, naphthenic, or hetematomic functiondities. The peripheries of these aromatic sheets are highly substituted by similar moieties (942). The present results combine with the foregoing interpretation of asphaltene structure to permit resolution of asphaltene pyrolysis pathways as well as the secondary reactions of primary products. The heteroatomic g r w J EzS and CO, were the major primary products observed from low temperature thermolyses and likely evolved from scission of low-energy thioether and carboxylic acid moieties respectively. Higher temperature primary products that a m e from fragmentation of carbou-carbon bonds were hydrocarbon gases,
cycloalkanes and parafGns. It would thus be consistent that the coke observed is actually the aromatic asphaltenic core stripped of its peripheral substituents. This strictly primary product evidently transforms from benzene-soluble ta beniencinsoluble over a very small "window" of degradation (see Figore la).
The products in the maltene fraction clearly undergo secondary reactions. This is substantiated by the m&um mdtene and total paraffin yields observed at 400 and 450'C (see Table 1) which are consistent with the notion of consecutive reactions.
Figure 2 is a summary of the reaction pathways suggested above. Primary asphaltene reactions produce asphaltenic core (coke), maltenes, and gas. Secondary reactions include hsion of maltenes to lower molecular weight maltenes and gases, as well as reaction of the core to gar. Note that severe overreaction of primary products is not required to predict the formation .of large quantities of benrene-insoluble solid materials. Ths network is simikr to that proposed by Schucker and Keweshan (2) and supported by Speight and Pancirov (1).
Pcntadeeylbensene T h e r m o l y s b
A summary of PDB pyrolyses at 375, 400, 425, and.450.C is given in Table 2, which lists typical data eoucrinhg hd&g iimes, major products yields, product groups (Le. homoiogous series) yieids, and observed rustorder rate constants.
Pyrolysis of pentadecylbeniene (PDB) at 400'C yielded toluene, 1-tetradecene, n-tridecane, styrene, and ethylbensene 1u major products. Also appearing at the longer reaction times in lower-yields were a series of n- alkanes and mlefms containiing 6 to 14 carbon atoms as well as 1-phenylalkanes and phenylolefins (a-phenyldk-u-cnes) with alkyl chains containing 2 to 12 carbon atoms. Phenylbutene was not detected. The ultimate PDB conversion was 73% at 180 minutes. The Identified Products Index (PI) , herein def ied as the total weight of all identified GCelutahle products divided by the weight of PDB initially loaded in the reactor, averaged 87%. The molar balance on aromatic rings averaged 86%. Charring occurred at t h s temperature.
Figure 3 illustrates the temporal variations of the yields of the major products at 400'C. Toluene was the mast abundant product thmughout the course of the reaction. The I-tetradecene yield followed toluene
410
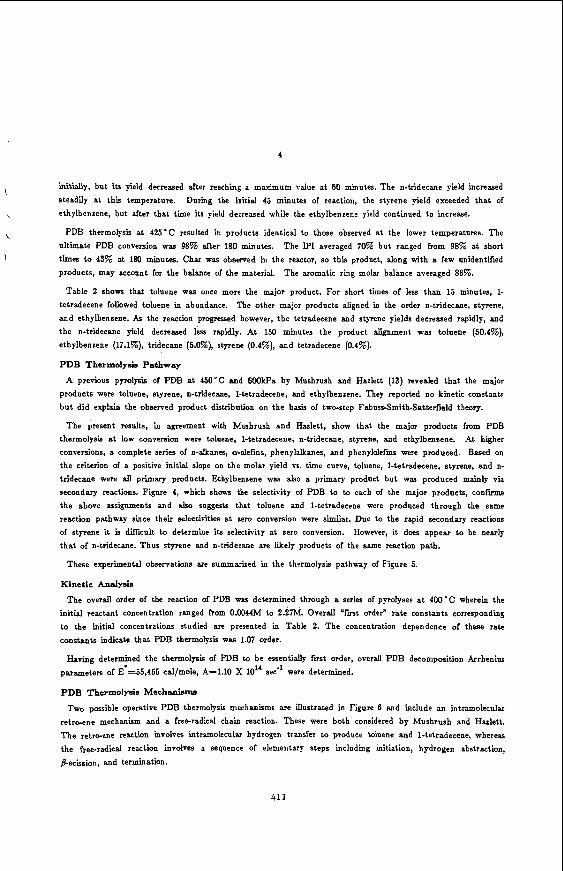
4
\ Xitially, but its neld decreased after reaching a maxjmum value at 60 minutes. The n-tridecane yield increased steadily at this temperature. During the initial 45 minutes of reaction, the styrene yield exceeded that of
\ ethylbenrene, but after that time its yield decreased while the ethylbenzene yield continued to increase.
\ PDB thermolysis at 425'C resulted in products identical to those observed at the lower temperatures. The The PI averaged 70% but ranged from 98% a t short
The aromatic ring molar balance averaged 86%.
ultimate PDB conversion was 98% after 180 minutes. 1 times to 43% at 180 minutes. Char was observed in the reactor, so this product, along with a few unidentified
products, may account for the balance of the material.
Table 2 shows that toluene was once more the major product. For short times of less than 15 minutes, 1- tetradecene followed toluene in abundance. The other major products aligned in the order n-tridecane, styrene, and ethylbenzene. As the reaction progressed however, the tetradecene and styrene yields decreased rapidly, and the n-tridecane yield decreased less rapidb. At 150 minutes the product alignment was toluene (50.4%), ethylbencene (17.1%), tridecane (LO%), styrene (0.4%), and tetradecene (0.4%).
PDB Thermolysis Pathway
A previous pyrolysis of PDB at 450'C and 600kPa by Mushrush and Haelett (13) revealed that the major products mre toluene, styrene, n-tridecane, 1-tetradecene, and ethylbenrene. They reported no kinetic constants hut did explain the observed product distribution on the basis of two-step Fabuss-Smith-Satterfield theory.
The present results, in agreement with Mushrush and h l e t t , show that the major products from PDB thermolysis a t low conversion were toluene, 1-tetradecene, n-tridecane, styrene, and ethylbenzene. At higher conversions, a complete series of n-alkanes, a-olefms, phenylalkanes, and pbenylolefins were produced. Based on the criterion of a positive initial slope on the molar yield VS. time curve, toluene, 1-tetradecene, styrene, and n- tridecane were all primary products. Ethylbenzene was also a primary product but ws produced mainly via secondary reactions. Figure 4, which shows the selectivity of PDB to to each of the major products, c o n f m the above assignments and also suggests that toluene and 1-tetradecene were produced through the same reaction pathway since their mlectiflties at cero conversion were similar. Due to the rapid secondary reactions of styrene it is djEcult to determine its selectivity at zero conversion. However, it does appear to be nearly that of n-tridecane. Thus styrene and n-tridecane are likely products of the same reaction path.
These experimental observations are summarized in the thermolysis pathway of Figure 5.
Kinet ic AnaIysiS
The overall order of the reaction of PDB was determined through a series of pyrolyses at 400 ' C wberein the initial reactant concentration ranged from 0.0044M to 2.27M. Overall "first order" rate constants corresponding to the initial concentrations studied are presented in Table 2. The concentration dependence of these rate constants indicate that PDB thermolysis was 1.07 order.
H a ~ g determined the thermolysis of PDB to be essentially fvst order, overall PDB decomposition Arrheniu parameters of E'=55,455 cd/mole, A=1.10 X 10'' sec-l were determined.
PDB Thermolyms Mechanisms
Two possible operative PDB thermolysis mechanisms are illustrated in Figure 6 and include an intramolecular retr*ene mechanism and a frecradical chain reaction. These were both considered by Mushrush and Hazlett. The retro-ene reaction involves intramolecular hydrogen transfer to produce toluene and 1-tetradecene, whereas the freeradical reaction involves a sequence of elementary steps including initiation, hydrogen abstraction, Bscission, and termination.
411
5
Both mechanisms are consistent with the observed fust order kinetics as well as the observation that toluene and 1-tetradecene initially formed in equal yields. However, the concerted mechanism alone fails to account for the formation of all observed products. In contrs t , the free-radical formed from PDB via hydrogen abstraction at the o-carbon can undergo &scission to produce styrene and n-tridecane, whereas the radical formed via hydrogen abstraction at the Varbon can similarly produce toluene and I-tetradecene. Hydrogen abstraction at other positions can account for the formation of the minor products.
Rationalization of tbe selectivity to toluene exceeding that to styrene requires closer scrutiny. Whereas bydrogen abstraction is likely more rapid at the a-carbon (GH bond energy E;: 85 kcal/mole) (14) than the ?carbon (ca. 95 kcal/mole) , thus suggesting formation of styrene preferably over toluene, the subsequent e i i o n reaction step is more rapid for the ?radical (GC bond energy c 67 kcal/mole) than the a-radical ( ea 80 kcal/mole). Clearly both of these competing effects influence the relative proportions of toluene and styrene in the products. The higher toluene selectivity observed experimentally thus indicates that the favorable energtics of the &scission reaction ontweigh the unfavorable ?hydrogen abstraction. Note, however, that the high toluene selectivity can also be accounted for by an efficacious retrc-ene mechanism occurring in parallel with a fm-radical mechanism.
Implicationa to A a p h d t e n e Reactivity
Plausible extension of these model compound results to asphaltene reactivity follows. The aromatic portions of petroleum asphaltena, in contrast to PDB, contain more than a single ring. A hypothetical average structure based on 12 condensed aromatic rings has been proposed for Athabasca asphaltene (15). Furthermore, several of these large aromatic sheets me joined together in polymeric fashion by aliphatic, naphthenie, or heteroatomic linkages (9,10,12) to form an even larger asphaltene particle. Recall that to account for the high toluene selectivity of PDB, the proposed radical mechanism required that the alkylaromatic benrylic radical be an important intermediate and serve as a chain carrier. The analogous asphaltenic alkylaromatic radicals would be markedly larger and considerably less mobile than the benzylic radical. This diminished mobility will trap the radkah near their point of origin and thus constrain them to react with nearby atoms. Furthermore, at reaction conditions, asphaltene is considerably more viscous than PDB, thus further frustrating radical dflusion and transport. These likely diffusional limitations (she and viscosity), most signilkant at low asphaltene conversion, may increase the initial importance of intramolecular concerted reactions (e.$. re t rwne) and free- radical reactions with neighboring moieties in asphaltene relative to the model compound reactions.
CONCLUSIONS
1. Asphaltene pyrolysis includes primary reactions t o its aromatic core, maltene, and gas product fractions. Components in each of these product fractions undergo secondary degradation to lighter products, gas, and presumably, char.
2. The preent res& indicate that the Schucker and Keweshan asphaltene structural model is a reasonable one, and tha t the observed yields of pyrolysis products and product tractions can be interpreted using their hypothetical average stmcture.
3. PDB thermolysis to toluene, styrene, n-tridecane, and 1-tetradecene as major products likely occurs by a &scission-dominated set of radical steps, but may include a concerted component.
412
6
REFERENCES
1. Speight, J.G.; Pancirov, R.J.
2. Schucker, R.C.; Keweshan, C.F.
3. Cotte, E& Calderon, JL. Am Chem SOC. Diu. Pet. Chcm. Prepr. 1981, 26, 538.
4. Ritchie, R.G.S.; Roche, R.S.; Steedman, W. Fuel 1979, 58, 523.
5. Moschopedi, SE.; Parkash, S.; Speight, J.G.
6. Strausz, 09.; ma, K.N.; Montgomery, D.S.
7. Schocker, R C . A m C h c m SOC. Diu. Pet. Chem Prepr. 1983, 28, 683.
8. Savage, P.E.; Klein, M.T.; Kukes, S.G. h d .
9. Speight, J.G.; Moschopedis, S.E. in ‘Chemistry of Asphaltenes” ; Bunger, J.W. and Li, N.C. Eds.;
Am. Chcm SOC. Diu. Pet. Chem. Prcpr. 1983, 28, 1319.
Am. Chem. SOC. Dic. Fuel Chem. Prepr. 1980, 25, 155.
Fuel 1978, 57, 431.
Fuel 1977, 56, 114.
Eng. Chem. Proe. Der. Deu. accepted.
Am. Chem. Soe. Adv. Chem. Ser. l 9 8 l , 195, 1.
10. Yen, TP. in “Chemistry of Asphdtenes” ; Bunger, J.W. and Li, N.C., Eds.; Am. Chem. Soc. Adv. Chem. Ser. 198% 195, 39.
11. Yen, TP.; Wu, W.EL; Chilingar, G.V.
12. Yen. TP.
13. Mushrush, G.W.; Hazlett, R.N. Ind. Eng. Chem. Fundam. 1984, 23, 288.
14. ‘CRC Handbook of Chemistry and Physics”, 5gth ed.; Weast, R.C., Ed.; CRC Press: Boca Raton,
Energy Source. 1984, 7, 275.
Energy Sourccr 1974, 1, 447.
n, 1978.
15. Speight, J.G. Fuel 1970, 49, 134.
413
0
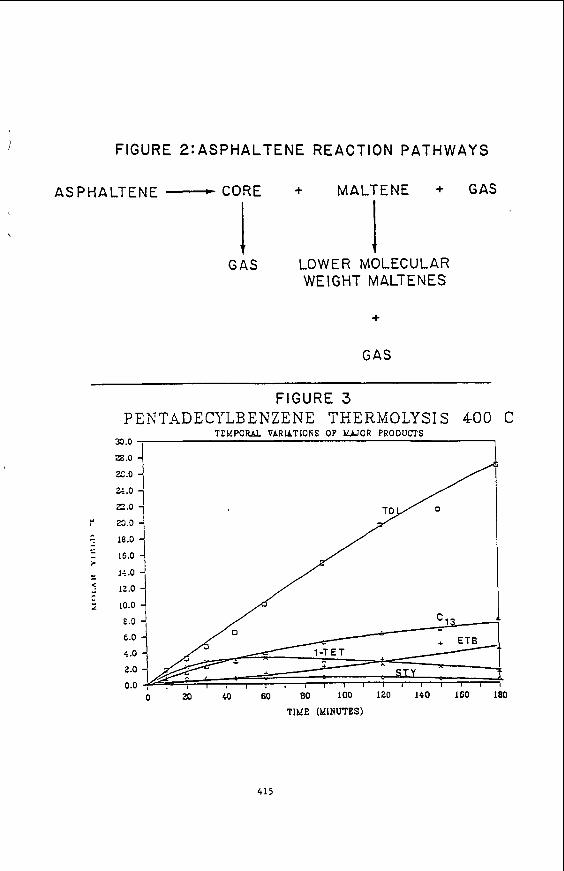
FIGURE 2:ASPHALTENE REACTION PATHWAYS
ASPHALTENE -CORE + MALTENE + GAS
G A S LOWER MOLECULAR WEIGHT MALTENES
+
G A S
FIGURE 3 P E K T,4D E CYLB E NZE NE THE RMOLY S I S 40 0
‘TEKPORbL VdRlkTlORS OF W O R PRODUCTS I 33.0
C
2t.O
23.0
16.0
J 10.0
c .O
0 40 60 80 100 120 140 160 180
TIKE (KINUTES)
415

I F I G U R E 4:PDB SELECTIVITY T O PRODUCTS
3.26
0.24 { 0.22 7
h > 0.20 e 8 0.18 2 0 C.16
O.1L E - 0.12
- - t k 3.1c
y C.S8 1 I-
-I
C.06
C.34
c.c2 c.c3 ? 6 I I I
0.3 0.2 0.4 0.6
CONVERSION -
C.E3 I
C.53
c.20
c.13
I
C.C3 2 0.2 0.4 0.6 0.3
CONVERSION
416

FIGURE 5 PDB THERMOLYSIS PATHWAY
L MINOR PRODUCTS
FIGURE 6 PDB THERMOLYSIS MECHANISMS
CONCERTED P r 1
417

Holding Time (min)
Tempe rat ure
Product Fractions (WtZ)
Asphaltene M a l tene Gas Coke* Mass Balance
n-alkane Yields (ms/9)
n-C8H18 'l-C12H26 n - c l 6H34 n-C20H42 n-C24H 0 ~ o t a l ? ~ 8 - ~ 2 5 )
Pseudo-Fi rst Order k (mi n-1)
Table I Asphaltene Master Table
30 60 90
350°C
95.9 4.9 0.3 0
101.1
0.08 0.06 0.07 - -
-
-
92.6 6.4 0.6 0
99.3
0.61 0.61 0.13 0.05 0.06 0.03 0.09 0.02
87.0 8.1 0.7 0
95.8
2.31 0.69 0.50 0.26 0.22 0.09 0.14 0.03
0.06 0.05 0.06 0.07
0.8
0.000597
30 60 '90
400°C
36.6 22.6 24.6 18.6 14.6 14.3
3.8 3.7 4.5 41.0 59.1 56.6 96.3 79.0 91.8
10.4 19.0 16.9 0.93 1.29 1.18 2.41 6.82 7.21 1.63 5.59 5.70 1.47 4.63 4.45 0.64 1.77 1.92 0.56 1.79 1.74 0.12 0.20 0.19
0.31 1.87 1.53 0.26 1.39 1.25 0.46 1.05 1.00 0.15 0.71 0.63 0.13 0.36 0.33 4.4 18.4 16.8
0.01227
10 60 90
45OOC
8.7 0 0 12.2 9.5 10.0
6.8 12.6 14.0 72.3 77.9 76.0 74.0 66.2 67.2
14.2 14.7 17.3 0.97 0.90 1.23 8.24 15.2 !9:1 6.52 13.2 16.8 4.56 9.49 11.7 2.12 3.50 4.24 2.18 2.65 2.62 0.34 0.53 0.58
2.33 3.70 1.35 1.83 2.12 0.95 1.32 0.85 0.22 0.74 0.23 0.07 0.30 - 0.03
20.9 19.5 7.0
0.24418
*Coke yields are ca lcu la ted by difference.
418

N
N
419

FREE RADICAL CRACKING OF HIGH MOLECULAR WEIGHT BRANCHED ALKANES
Y .V .K i 8s i n
Gulf Research and Development Co. P.O.Drawer 2038, Pittsburgh, PA 15230
S t u d i e s of thermocracking of branched alkanes play an important r o l e in several a reas , including high temperature c a t a l y t i c cracking, delayed coking, manufacture of o le f ins , degradation of polymers, and geochemistry. Although pr incipal chemical reactions involved i n thermo- cracking under r e l a t i v e l y m i l d conditions a r e w e l l known (1-4), detai led information about cracking of large branched molecules is lacking from the l i t e r a t u r e , mostly because of ana ly t ica l problems - ident i f ica t ion of reaction products, various branched alkanes and olef ins , i n the carbon atom number range C 8 - C z 0 + .
This paper discusses pr incipal react ion s tages of thermocracking of pristane, phytane, and squalane i n the l iqu id state under mild conditions (25OoC, 24 h) and presents analysis of r e a c t i v i t i e s of various C-H bonds i n the hydrogen abstract ion react ions a s well as r e a c t i v i t i e s of various C-C bonds i n the @-scission reactions.
EXPERIMENTAL PART
Thermocracking of pr is tane, phytane, and squalane a t 250-3OO0C for 24 h in the l iqu id s t a t e was carr ied out i n small g lass ampoules sealed under vacuum. Under these conditions the reaction yields equimolar mixtures of isoalkanes and o le f ins with branched chains. Addition of a mineral clay (bentoni te) to the ampoules results i n conversion of the olef ins in to a complex mixture of various secondary products while keeping the alkanes formed i n the cracking reaction in tac t . Comparison of the gas chromatograms of the cracking products obtained with and without the clay a s s i s t s i n ident i f ica t ion of branched alkanes.
A Hewlett-Packard 5880A gas chromatograph equipped with the flame ionization detector , operated i n the s p l i t in ject ion mode with a s p l i t r a t i o 100:1, was used to obtain chromatographic data. The column u s e d was a 50 rn, 0.02 mm i .d . , fused s i l i c a capi l la ry coated with 0.50 micron film of cross-linked methyl s i l icone. H e l i u m c a r r i e r gas was used a t a flow of 1 ml/min. The column oven temperature was programmed from 40 C t o 3OO0C a t 5%/min and held a t 3OO0C unt i l complete e lu t ion of a sample. Sample s ize was 1.0 microl i ter . held a t 325OC.
The techniques used f o r assignment of alkane and o le f in peaks in gas chromatograms of the thermocracked products a r e d iscussed elsewhere (5, 6) . They were based on the appl icat ion of a modified addi t iv i ty principle ( 7 ) which allows quant i ta t ive estimation of peak positions of complex molecules (multibranched alkanes and o le f ins ) from the data on peak positions of more simply b u i l t molecules (monobranched alkanes, l inear olef ins) .
for peaks of hydrocarbons Kovats factors (KF) from t h e i r re tent ion times RT ( 8 ) .
0
Detector and in jec tor temperatures were Samples were di luted with CS2 before injection.
A generally used procedure of presentation of re tent ion times i n gas chromatograms is calculat ion of t h e i r
' I
420

For example, the peak of an iso-alkane s i t u a t e d i n the middle between peaks of n-q2lQ6 and n-Cl3H28 has KF 1250. We found i t more convenient to use a d i f fe ren t parameter f o r the purpose - a r e l a t i v e retent ion factor , RRF (5, 6):
RRF = [KF(iso-alkane %%n+2) - KF(n-alkane %H2*+2) ]/lo0 2)
This fac tor i s a negative number representing a normalized r e l a t i v e precedence of the peak of a hydrocarbon with respect to the peak of the normal alkane with the same carbon atom number.
RESULTS AND DISCUSSION
Numbering of carbon atoms i n the skeletons o f the three isoprenoid molecules follows:
Pr is tane (2,6,10,14-tetrame thylpentadecane) 11 1 3 1 5 1 3 5 7 9
c c c c c c c c
c c c c c c c \;\!p[\;\l;\l;\l;
1: 6' 10' 14' I C 2'
Phytane (2,6,10,14-tetramethylhexadecane) c 5 c 7 c 9 cll $3 c 1 5 c1 c 3
' 2'
\ 2/ \ 4/ \ 6 / \ 8/ \ 1; \ 1: \ 1; \ 16 c c c c c c c c
C 6'
Squalane (2,6,10,15,19,23-hewmethyltetracosane) 15' 19' 2 3l
C C
11 1 3 ' 1 5 1 7 ' 1 9 21 I 2 3 c 1 c 3 c 5 c 7 c 9 C
cA \ c 2 4
I 10'
I I C 2' C 6'
0 Conversions i n the thermocracking reactions (250 C, 24 h) were: f o r pr is tane - 6.0%, f o r phytane - 2.7%, for squalane - 6.4%. Under these mi ld conditions only three stages of the r a d i c a l chain react ions should be considered: formation of a parent rad ica l , f i s s ion of the radical with the formation of an o le f in and a smaller a lkyl rad ica l , and the chain t ransfer reaction yielding a low molecular weight alkane. One example of these three reactions involving a rad ica l a t tack on the s ix th position of the pr is tane molecule and the 9-5 bond is:
6-scission of the
421

Formation of a parent rad ica l (hydrogen abstract ion reaction):
R* + 2,6,10,14-tetramethylpentadecane 4
RH + CH3-g-CH2-CH2-CH -pCH -CH -CH2-CH-CH -CH -CH -$H-CH Z c H 2 2 2 2 2 c H 3
3 3 3 3 6-scission reaction:
3)
9
CH3-g-cH2-CH2-cH2-g3I2-CH2-cH2-p-cH2-CH2-CH2-p-m3--3
CH3-~-CH2-CH2-CH~-0CH2 + *~2-CH2-CH-CH2-CH2-CH2-~-CH 3
4) 3 CH
3 CH
3 3
b 3 b 3 CH3 ( 2,6-d?me thyl-1-hep tene)
Chain t ransfer reaction:
'CH2-CH2-p-CH2-CH2-CH + 2,6 ,lo, 14-tetrame thylpentadecane
5) CH3
H CH2-CH2-CH2-qH-CH + Re 3 - CH3-5-L- 3 CH3 ( 2,6-dime thyloctane)
Reactions 3 and 5 are, i n a general sense, the same reaction of hydrogen abs t rac t ion and they a r e separated here to emphasize chemistry of the react ion product formation. I t is generally accepted (2, 4) that rad ica l reac t ions of alkanes a t low temperatures i n the l iqu id state a r e accompanied by intramolecular rad ica l isomerization (hydrogen atom s h i f t s via five- and six-atom cycl ic t rans i t ion s t a t e s ) and by intermolecular hydrogen exchange react ions (reverse of reaction 3 with RH being the substrate molecule). The j o i n t r e s u l t of these two processes is the e q u i l i b r i u m d i s t r i b u t i o n of primary radicals i n terms of rad ica l s i t e positions, with the equilibrium being governed by r e l a t i v e rad ica l stabil i t ies.
formed in the pr incipal thermocracking react ions of pr is tane, phytane, and squalane, experimental and calculated RRF values for the alkanes and o le f ins , and posi t ions of rad ica l a t tacks resu l t ing In the f o r m t i o n of corresponding hydrocarbons. the basis for t h e evaluation of r e a c t i v i t i e s of various bonds i n two reactions - hydrogen abstract ion (Reaction 3) and &scission (Reaction 4).
Tables 1 and 2 l i s t a l l possible alkanes and o le f ins which a r e
Peak areas f o r the products were used a s
6-scission react ions
I n the majority of cases several p s c i s s i o n react ions are possible for a radical formed i n Reaction 3 (except for rad ica ls i n positions 2 i n a l l isoprenoids and i n position 16 f o r phytane). reaction products allows estimation of probabi l i t i es of the sciss ion reactions.
s i tuated i n very symmetrical environments.
Analysis of
Tert iary rad ica ls . Tertiary radicals i n positions 6 and 10 a r e As a consequence,
422

probabi l i t i es of B-scissions f o r the adjacent bonds a r e v i r t u a l l y e q u a l . The r a t i o s of products formed in the C4-C5 and CrCS bond sciss ions ( rad ica ls in position 6 ) are i n the range 1.06-0.98 f o r a l l isoprenoids. The same r a t i o s (1.08-0.99) were found f o r C bond sciss ions in phytane and squalane ( rad ica ls f ~ c ~ o % % ~ ? ? On the other hand, the probabi l i ty of the CH2-CH2 bond ( C l ~ C 1 3 ) sciss ion i n the phytane radical ( i n position 14) is 10.6 t i m e s higher than tha t f o r the CH CH3 bond (cl5-Cl6) which corresponds to the AE,,t difference, ca. 2.fkcal/mol.
r a d i c a l i s s i t u a t e d i n a symmetrical environment (posi t ions 8 in a l l molecules, position 12 i n phytane) the probabi l i ty of the two
expectations. However even a s l i g h t deviation from the symmetry, in posi t ions 4, r e s u l t s i n a deviation from the equality. The r a t i o between the probabi l i t ies for the scisson of %- and C5-% bonds i s ca. 0.63.
phytane and squalane) the sciss ion involves d i f fe ren t chemical bonds. In these cases the r a t i o s of the sciss ion r a t e s for the CH2-CH2 bonds (Cs-5 f o r radicals in positions 7 ) and for the CH2-CH bonds (C 'Cg) a r e ca. 0.71 (+7%). The same r a t i o (sciss ion of %2-C1 vs. 3 f o r the &ytane radical i n posi t ion 11 i s 0.58. However, t te C k 2 s 3 ! ond i n squalane is ca. 10% more react ive i n @-scission than t e - C ~ O bond. D a t a fo r the pristane rad ica l ( i n posi t ion 5 ) provide the most complete information of the r e l a t i v e probabi l i t i es of B-scission reactions. The r a t i o s of the reactions f o r the CH2-CH2 bond (Cg-$1, the CH2-CH bond (%-Cg), and the CH3-CH bond (%-%I) a r e 4.72 : 6.70 : 1 .
Secondary radicals . Similarly t o the previous case, i f a secondary
8-scissions a r e ident ica l (with precision ca. 4 % ) according to
When secondary radicals a r e i n positions 4 (or positions 9 i n
React ivi t ies of C-H bonds i n hydrogen ab8 t ract ion react ions
Tertiary C-H bonds
Tertiary C-H bonds a re the most ac t ive i n radical hydrogen abstract ion reactions as emphasized by t h e i r low bond energies, ca. 90 kcal/mol (2, 4 ) . Our data show tha t r e a c t i v i t i e s of the C-H bonds i n 6 and 10 positions are equal f o r a l l three isoprenoids (corresponding product yields a r e i n the range 1.00-1.03). formed from the end- and internal t e r t i a r y rad ica ls are:
The r a t i o s of products
Internal C' : R-C-%-CH3 : R-C-CH3 - 1 : 0.45 : 0.31
( posi tions (posj t ion 14 (posi t jons 2) CH CH
6 and 1 0 ) i n phytane)
I f one takes into account d i f fe ren t sciss ion p a t t e r n s f o r these radicals (discussed e a r l i e r ) and the exsitence of only one B-scission route f o r the end-tertiary radicals these r a t i o s t rans la te in to the r a t i o s of formation rates for corresponding rad ica ls ca. 1 : 0.7 : 0.8.
Secondary radicals
The isoprenoids studied can form several s t ruc tura l ly d i f f e r e n t secondary r a d i p l s . Radicals -CH7-CH-CH2-- As expected, the radicals i n positions 4 and 12 i n the phytane molecule have the same r e a c t i v i t y ( the corresponding
423

product r a t i o is 1.05). However, these rad ica ls positioned i n the center of the molecules (posi t ions 8) are s l i g h t l y more react ive than s imilar radicals i n posi t ions 4: the reac t iv i ty r a t i o s a r e 1.3 f o r pr is tane, 1.2 f o r phytane, and 1.7 f o r squalane. i n position 12 of squalane is 2.4 times less than that of a s i m i l a r l y s i tuated r a d i q l i n position 8. Radicals -CHrCH-CH-. and 11 i n the molecules are equal within *lo%. Relative r e a c t i v i t i e s of various secondary radicals. rences between r e a c t i v i t i e s of d i f fe ren t ly flanked secondary radicals were found f o r a l l isopFenoids. Radica ls -Cl$-CH-%- are 4.8 times (*lo%) more react ive than C -CH-CH- radicals. The only exception was found
higher than r e a c t i v i t y of the radical i n posi t ion 11.
Reactivity of the secondary rad ica l
React ivi t ies of a l l radicals i n positions 5, 7, 9,
Signif icant diffe-
f o r squalane: r e a c t i v ? t y of the rad ica l i n position 12 is only 2.3 times
Primary radicals
Information on r e l a t i v e reac t iv i ty of primary rad ica ls i s l i m i t e d due to d i f f i c u l t i e s i n ident i f ica t ion of the products of the i r a-scission and due t o low content of the products. In the case of phytane the radical i n posi t ion 6' has the same r e a c t i v i t y a s the rad ica l i n position 14' and i t i s ca. 20% less react ive than the rad ica l i n posi t ion IO'.
The y ie lds of sciss ion products from the primary rad ica ls i n positions 1 a r e ca. 2 times less than those f o r the rad ica ls i n posi t ions 6'. I f one takes into account t h a t only one sciss ion route i s avai lable f o r the f i r s t radicals , i t can be concluded that r e a c t i v i t i e s of a l l primary rad ica ls i n the isoprenoids a r e very close.
ComDarisons of r e a c t i v i t i e s of various rad ica ls
Comparisons of the yields of products from 8-scissions of radicals of various s t ruc tures allows approximate evaluation of the i r re la t ive reac t i v i ties.
radicals -CH -&2-L The pro- d u c t r a t i o f o r sc i ss ion of cor respondiz radicals for2a l l isoprenoids i s ca. 0.067. I f one takes in to account the differences between the numbers of C-H bonds i n these groups, the r a t i o s of r e a c t i v i t i e s of C-H bonds i n
Primary r a d i c a l s &i CH- vs. seconda' 2-
the methyl group (CH -&-)-and the cent ra l methylene group in the sequence CH(CH )-CR2-CH2-CH2-$H(CH3) is ca. 0.045 which corresponds to -3.2 &al/mol.
Uact ca.
Primary radicals k2-CH- VS. secondary radicals -CH2-k-CH-.
Secondary rad ica ls vs. t e r t i a radic%hl;:&CH )-CH
The pro- duct r a t i o f o r sciss ion of corresponding radicals for a l l isoprenoids is ca. 0.27 which t rans la tes in to the difference between r e a c t i v i t i e s of
r a t i o for sciss ion of secondaryyadicals ( i n posm&1c8?-&d that f o r the te r t ia ry rad ica ls i n positions 6 o r 10 is 0.89. This corresponds to the r a t i o of ca. 2.25 f o r C-H bond r e a c t i v i t i e s i n hydrogen abstract ion reactions involving the t e r t i a r y CH3-CH- groups and the cent ra l methylene groups i n the isoprenoids (positions 8). Corresponding AE is ca. 0.8 kcal/mol. As was mentioned before, cen t ra l CH2 groups @-CH2-CH2-CH- sequences a r e less reac t ive than i n -CH2-CH2-CH2- sequences. the corresponding C-H bond reac t iv i ty r a t i o is 11.6 and 2.6 kcal/mol.
corresponding C-H bonde ca; 0.18 and -1.8 kcal/mol. The product
For them A E ~ ~ i s ca.
424

LITERATURE CITED
1. A. Kossiakoff, F. 0. Rice, J. Am. Chem. SOC., 65, 590 (1943). 2. Free Radicals (vols. I and II), J. K. Kochi, Ed., J. Wiley, New York,
1973. 3. S. W. Benson, The Foundations of Chemical Kinetics, M c G r a w - H i l l , New
,York, 1960, p.343. 4. E. Ranzi, M. Dente, S. Pierucci, G. B i a r d i , Ind. Eng. Chem., Pundam.,
22, 132 (1983). 5. E V. Kissin, G. P. Feulmer, J. Chromat. Sci., in press. 6. Y. V. Kissin, J. Chromat. Sci., in press. 7. G.I. Spivakovskii, A.I. Tishchenko, 1.1. Zaslavskii, N.S. Wulfson,
8. E. Kovats, 2. Anal. Chem., 181, 351 (1961). J. Chromatoraphy, 144, 1 (1977).
Table I
ALKlWES PORHED I N THERHOCWACKING REACTIONS OF PRISTANE, PHYTANE, AND SQUALAM AT 25OoC t
Alkane Formed from R R p R R P d R R p Pristane Phytane Qualane (exp.) ( e a l e . ) X ( p o s i t i o n of radical a t t a c k )
n-C . -'I
LSO-C4 2-Me-C4 2-ne-c5
3-Me-cg 3-Me-c~
2-Me-c, 2.6-He & 7
-c 2,6,10,%.19-He5-
-c22
-0.578 -0.568 -0.695 -0.674 -0.833 -0.812 -1.252 -1.175 -0.788 -0.753 -1.199 -1.114 -1.353 -1.254 -1.150 -1.076 -1.430 -1.329 -1.300 -1.210 -1.477 -1.386 -1.531 -1.407 -1.940 -1.788 -1.862 -1.705
0.0%
1.2% -1.5% -1.7% -3.0% -2.5% -6.1% -4.5% -7.1% -7.3% -6.4% -7.1% -7.0% -6.2% -8.1% -7.9% -8.5%
-2.102 -1.880 -10.6% -2.115 -2.063 -2.5% -2.345 -2.464 5.1%
-2.320 -2.408 3.8%
-2.455 -2.608 6.2%
t amounts Of methane, ethane. and propane Cannot be determined q u a n t i t a t i v e l y and are not reported i n the t a b l e .
425

Table 2
OLEFINS FORMED I N THERMOCRACKING REACTIONS OF PRISTANE, PHYTANE, AND SQUAUNE AT 25OoC f
Olef in Formed from RRF RRF ARRF P r i s t a n e Phytane Squalane (exp.) (calc.) % ( p o s i t i o n of r a d i c a l a t t a c k )
*o
-0.228 -0.520 -0.455 -0.896
-0.850 -0.796 -0.915 -0.799 -0.751 -1.047 -1.459 -0.992 -1.436 -1.398 -1.379 -1.505
-1.583 -1.530
-1.712
-2.114
-2.00
-2.11
-0.518 -0.455 -0.880 -0.803 -0.846 -0.785 -0.916 -0.812 -0.740 -1.008 -1.328 -0.920
-1.287 -1.301 -1.420 -1.474
-1.338
-1.409 -1.326 -1.241 -1.241 -1.227 -1.227 -1.494 -1.411
-1.525
-1.562
-1.909
-1.963
-2.19
-2.13
-2.18
0.4% 0.0% 1.8%
0.5% 1.4% 0.1% 1 . 6 X 4.1% 3.7% 9.0% 7.2% 6.8% 7.9% 5.6% 5.6%
5.6% 7.7%
8.8%
9.1%
2.0%
1.9%
t o l e f i n s %6*g i n the products of squa lane t h e m c r a c k i n g were not i d e n t i f i e d q u a n t i t a t i v e l y and are not repor ted i n t h e tab le .
426

USE OF THE STRUCTURE-CHEMICAL REACTIVITY DATA FOR DEVELOPMENT OF NEW METHODS IN PETROLEUM HEAVY ENDS UPGRADING
M. Parcasiu, E. J. Y. Scott and R. B. LaPierre
Mobil Research and Development Corporation Central Research Laboratory
P. 0. Box 1025, Princeton, New Jersey 08540
I NTRODUCT I ON
The chemical structure of the heavy ends of petroleum has been studied extensively (1). However, these studies have had little impact on the processes used commercially to upgrade heavy petroleum fractions. Industrial processes involve thermal (high temperature free radical chemistry) or catalytic routes such as catalytic cracking or hydroprocessing at temperatures greater than 300°C.
Low temperature ionic reactions have not been explored extensively for upgrading petroleum heavy ends. We have examined transalkylation, the transfer of alkyl fragments from high molecular weight components to smaller aromatic acceptor molecules in presence of Priedel Craft catalysts. We present results of transalkylation using catalysts consisting of trifluoromethanesulfonic acid as well as aluminum chloride promoted by water (2). Results are presented for transalkylation to native aromatic compounds present in crude petroleum (whole crude transalkylation) as well as to added aromatic molecules (resid transalkylation).
Most molecules in petroleum heavy ends contain 20 to 40 wt.\ aliphatic groups substituted to aromatic (or heteroaromatic) rings (3). These aliphatic substituents are:
- normal and is0 alkyl groups (we positively identified C2
- cycloalkyl groups (we identified cyclopentyl and to C16 alkyl chains);
cyclohexyl substituents but the presence of larger saturated polycyclic groups cannot be precluded);
- methylene groups linking two aromatic rings.
In the presence of Priedel Crafts catalysts these aliphatic groups can be transferred to small aromatic molecules ( 3 ) . The result of transalkylation is then the formation of new distillable products which contain the small aromatic molecules substituted with normal, iso, and cyclo alkyl groups. Obviously, in such complicated mixtures as the petroleum heavy ends are, under the transalkylation reaction conditions, other reactions w i l l alvo take place; for example, the dialkyl sulfides form mercaptanes and paraffins, and at long reaction times, alkyl substituents with five or more carbons form hydroaromatic rings by cyclization.
The products of the transalkylation and of secondary reactions are mixtures of petroleum like compounds with molecular weights
42 7

(and boiling points) ranging from that of the acceptor (the small aromatic molecule) to that of the resid.
If whole crude oils are treated under the conditions of the transalkylation reaction, alkyl groups from heavy ends are transferred to the light aromatic hydrocarbons present in the crude oil. The result is a change of the boiling point distribution of the whole crude toward medium boiling point fractions . Very early in our work we realized the lack of literature data concerning the transfer of the alkyl substituents between aromatic rings with different degrees of ring condensation. To gain this information we studied the transalkylation reaction with appropriate model compounds ( 3 , 4 ) .
The transalkylation reaction can be applied both to materials Joluble in aromatics and to solids as kerogens (3) or coals ( 5 , 6 ) and coal liquefaction products (6).
RESULTS AND DISCUSSION
The transalkylation reaction can be formulated:
Ar I -Alkyl1 + AI I IH S A r H + Ar I -Alkyl1
In our discussion A? I-AlkylI will denote large aromatic molecules from petroleum heavy ends and Ar'IH will be benzene, toluene or o-xylene.
A. Kinetic and thermodynamic constraints of the transalkylation r eaction
We have shown previously ( 3 , 4 ) that the rate of the transalkylation reaction between polyaromatic and monoaromatic rinys is:
- independent of the chain length (at least for C2-C10 alkyl chains), - dependent on the nature of the aliphatic substituent (cycloalkyls transfer faster than n-alkyls),
- dependent on the structure of the polyaromatic moiety involved in the transalkylation reaction (the rate of transfer of the aliphatic substituent increases for systems with increased degree of aromatic ring condensat ion) .
Concerning the thermodynamics of transalkylation, we found that the thermodynamic equilibrium is:
- independent of the structure of the polyaromatic moiety
- only slightly influenced by temperature in the 27-227'C (Table I),
interval in which we studied the transalkylation reaction (Table 1 1 ) .
Data in Tables I and I 1 show that the equilibrium constant of the
" 1 ~
- I

transalkylation reaction is close to unity (i.e. AG = 0) for any pair of donor-acceptor. That means that at donor-acceptor molar ratio of 1:1, the maximum conversion to be expected is 50% for any of the starting materials. Thus, the only way to push a transalkylation reaction in a desired direction is to work with excess of acceptor. For example, for a molar ratio of 1:4 at equilibrium, 80% of donor will be converted at 127'C (400OK).
In the case of conversion of petroleum heavy ends by a transalkylation reaction, the big differences between the molecular weight of the donor (average molecular weight 1000) and of the acceptor (molecular weight -100) insure an advantageous molar ratio even for a weight ratio resid:aromatic hydrocarbon of 1:l.
These thermodynamic constraints are very important f o r upgrading whole crude (see Section C following).
While the thermodynamic equilibrium is independent of the degree of aromatic ring condensation of the donor, the rates of the transalkylation reaction are faster fo r transfer of aliphatic groups from more to less condensed aromatic systems. The transfer in the opposite direction necessitates larger acid (catalyst) concentration ( 4 ) , which in turn favors some secondary react ions.
B. Transalkylation reactions of vacuum resids
Some transalkylation reactions between Arabian Light vacuum resid and toluene or 0-xylene are given in Table 111. Typical composition of the distillate is shown in Figure 1 for an Alaskan resid. Some properties of the dealkylated resids are given in Table IV. In general, 60-80% of the initial resid remains as dealkylated resid.
If the dealkylated resid is hydrotreated in the presence of CO-MO catalysts (Table V), the hydrogen consumption is similar to that f o r the untreated resid, but the degree of desulfurization is somewhat higher (72%) for the dealkylated resid than for the untreated resid (65% desulfurization). It should be observed that the dealkylated resid ( 7 6 5 of the initial resid) was distilled to a lower average molecular weight (620) than that of untreated resid (average molecular weight 1100).
The saturated hydrocarbon fraction in the hydrotreated Vacuum resid (for the hydrotreating condition see Table V) represents 20.55 of the product and has an average molecular weight of -1000. In the hydrotreated dealkylated resid the saturated hydrocarbons represent 2 4 . 5 % of the product and their average molecular weight is only 386.
C. Transalkylation reactions of whole crude oils
The transfer of aliphatic substituents from the big molecules to lower molecular weight aromatics of a crude oil can be achieved under mild conditions in the presence of a Friedel-Crafts catalyst (Table VI). We used topped (80°C') crude oils because the lowest boiling point acceptor in crude oils is benzene
4 2 9

(b.p.‘8O0C). Work with model compounds ( 4 ) indicated that the transfer of substituents is easier from polyaromatic to monoaromatic rings. This favors the redistribution of aliphatic substituents in whole crudes in the desired direction.
In the case of aromatic crudes (for example the Alaskan crude in Table VI), there are enough low molecular weight natural acceptors in the crude to achieve a substantial transfer. In the case of a paraffinic crude (North Sea crude), the addition of some small aromatic molecules can be helpful (Table V I ) .
The net result of the internal transalkylation is a redistribution of boiling points in the crude with an increase in the quantity of medium range products.
D. Chemical composition and mechanistic limitations of upgrading petroleum heavy ends by the transalkylation r eac t ion
The petroleum heavy ends contain large amounts of aliphatic substituents on polyaromatic rings. This makes the use of the transalkylation reaction an attractive alternative for their upgr ad ing . One element of structure which poses a problem is the presence of basic compounds, especially basic nitrogen compounds in petroleum heavy ends. The basic nitrogen compounds react with the acidic catalysts and form salts.
Another limitation for the use of the transalkylation reaction is the effect of acid concentration on the reaction rate. Our work with model compounds ( 4 ) has shown that the concentration of acid must exceed a certain threshold to obtain an acceptable rate of reaction.
Understanding of the quantitative relationship between the chemical structure of the reactants and the concentration of acid is new chemistry and our initial results ( 4 ) are only a beginning. Certainly, more research in this area is needed because it is likely to be relevant to other acid catalyzed reactions besides transalkylation.
REFERENCES
1. Speight, J. G., “The Chemistry and Technology of Petroleum”, M. Dekker, Inc., New York, 1980, and references therein.
2 . Farcasiu, M., U.S. Patent 4 , 3 1 7 , 7 1 2 , March 2 , 1982.
3 . Farcasiu, M, Forbus, T. R., LaPierre, R. B., ACS Petr. Chem.
4 . Farcasiu, M.,Forbus, T. R., Rubin, B. R., paper submitted to
Div. Preprints 2, 279 (1983).
J. 0rg.Chem.
430

I I
5.
6 .
7.
8.
9.
Benjamin, B. M., Douglas, E. C., Canonico, D. M., Fuel 63, 1130 (1984).
Parcasiu, M., Proceedings of the Symposium on Chemistry of Coal Liquefaction and Catalysis, March 17-20, 1985, Sapporo, Japan.
Stull, D. R., Westrum, Jr., E. F. and Sinke, G. C., "The Chemical Thermodynamics of Organic Compounds", John Wiley (1969).
Benson, S. W., "Thermochemical Kinetics", Chapter 2, John Wiley (1968).
Stein, S. E., Golden, D. M. and Benson, S. W., J. Phys. Chem - 81, 314 (1977).
TABLE I
Equilibrium Constants at 400°K (127OC) for Several Transalkylation Reactions
Aryll-Alkyll + ArylIIH e Aryl'H t ArylII-Alkyll
Aryl I -Alkyl I Aryl I I H AG' 400°K K 4 0 0 0 ~ donor acceptor Kcal/mole
m
-0.11
-0.11
0
+0.11
1.15
1.15
-1
0.87
0 -1
AGO values for 2 n-butyl naphthalene, benzene and o-xylene are experimental values (7). those for 1,2-dimethyl 4-n-butyl benzene and 2-n-butyl pyrene are calculated by the method of "group additivity" (8,9).
431

TABLE I 1
The Influence of Temperature on Thermodynamical
Equilibrium of the Transalkylation Reaction*
Equilibrium Constant at:
300DK 400'K 500°K (27°C) (127OC) (227'C) --- 1.03 1.15 1.21
*All values are experimental values ( 7 )
TABLE I 1 1
Conditions of the Transalkylation Reaction
Vacuum Aromatic Wt.t Distil- Res id Hydro- Wt. Temp. Time latea(based (1050tF) carbon Catalyst Ratio "C Hrs. on resid)
a b C a:b:c
1. Arabian toluene AlCl3 1:6.5:O.S 20 18 10 Light
2 . Arabian 0-xylene AlCl3 1:0.86:0.5 144 3 15.3 Light
3 . Dealky- o-xylene A1C13 1:1.7:O.S 144 6 2s lated Resid Exp . 2
4. Arabian o-xylene CF3SOjH 1:2.6:0.4 144 Light
aThis % includes the light aromatics incorporated by transalkylation.
6 3 4
432

TABLE IV
Properties of Dealkylated Resids
Wt.% Mw C H S VPO/Toluene 0 ar H
AI abian 85.1 10.4 4.0 1100 5.6 L ight
Resid erp. 2 Table IvII
Dealkylated 86.5 9.6 4.1 620 - 11a
Dealkylated 87.3 8.7 3.7 503 Resid exp. 3 Table I 1 1
'The value of 0 ar H (lHNMR) is from'a similar transalkylation run.
--
TABLE V
Chemical and Structural Properties of Hydrotreated Arabian Light Vacuum Resid and Hydrotreated Dealkylated Arabian Light Resid
Hydrotreating Conditions: wt.ratio resid:o-xy1ene:CoMo (HDS1441) catalyst 1:344:0.5; t - 340°C; 1000 psi H2, 1 h
Elem. Analysis AV. H" Wt.\
Mater i a1 %arH C H S (VPO Toluene)
1. Arabian Light 5.6 85.1 10.4 4.0 1110
2. Hydrotreated 1 1.6 86.5 11.7 1.4 1000
Vac. Resid
(yield 90% of 1)
(~lC13 catalyst) Arabian Light Vacuum Resid (76% of initial material)
3. Dealkylated 9.8 84.9 9.1 3.6 620
4. Hydrotreated 3 6.8 88.2 10.5 1.0 477 (yield 90% of 3)
J
433

TABLE VI
Boiling Point Distribution of Topped Whole Crude Oils Before and After Transalkylation in the Presence of
Trifluromethanesolfonic Acid*
Boiling Points, "C
80-215
Topped Alaskan Crude
Initial 7.9 After transalkylation 9.3
+1.4
Topped North Sea Crude
Ini t ial 10.5 After transalkylation 11.7
A +l.2
Topped North Sea Crude 59 o-Xylene
Init ial 15.5 After tr ansalkylat ion 12.6
A -2.9
215-344
26.9 32.0
+5.1
-
35.1 37.1
+2.0
-
33.4 40.2
+6.8
-
349-426
17.0 19.7
+2.7
-
22.0 24.1
+2.1
-
21.0 26.3
+5.3
-
426+
48.2 39.0
-9.2
-
32.4 27.1
-5.3
30.8 20.9
-9.9
-
*Typical transalkylation conditions: ut. ratio oil : CF3S03H lO:l, reaction temperature -1OO"C, reaction time -4 h. After reaction, the mixture was quenched with aqueous NaOH, the organic layer Was separated and dried over MgSO The boiling point distribution in the initial material ani'products was determined by flash distillation over chromosorb followed by simulated distillation by gas chromatography.
434

435

ANALYSIS O F RESIDUUM DEMETALATION BY SIZE EXCLUSION CHROMATOGRAPHY WITH ELEMENT SPECIFIC DETECTION
John G . Reynolds and Wilton R . Biggs
Chevron Research Company Richmond, C A 94802
ABSTRACT
We ana lyzed t h e r m a l l y t r e a t e d heavy r e s i d u a by e lement s p e c i f i c s i z e e x c l u s i o n chromatography (SEC-HPLC-ICP) t o e l u c i d a t e t h e f a t e of t h e V and N i compounds. Thermal t r e a t m e n t , i n a d d i t i o n t o removing m e t a l s , s i g n i f i c a n t l y reduces t h e s i z e of t h e remaining me ta l - con ta in ing compounds.
We the rma l ly t r e a t e d t h e d i s t i l l a b l e and n o n d i s t i l l a b l e meta ls s e p a r a t e l y . The d i s t i l l e d m e t a l s , p r i m a r i l y po rphyr ins , were comple te ly p rocessed ou t . The n o n v o l a t i l e metals, which c o n s t i t u t e d most of t h e Ni and V, were e i t h e r removed, o r reduced i n s i z e .
When t r e a t i n g heavy r e s i d u a ove r commercial f ixed-bed hydroprocess ing c a t a l y s t s , t h e me ta l - con ta in ing molecules i n t h e s i z e r ange of t h e c a t a l y s t p o r e a r e p r e f e r e n t i a l l y removed. Those l a r g e r t han the po re s i z e appea r t o d e m e t a l a t e more s lowly .
The r e s u l t s a r g u e d e m e t a l a t i o n is a f u n c t i o n of t h e l i gand s t r u c t u r e and s i z e of t h e m e t a l - c o n t a i n i n g s p e c i e s and n o t t h e c o o r d i n a t i o n s p h e r e around t h e me ta l c e n t e r .
INTRODUCTION
High me ta l s c o n t e n t is one of t h e i n h i b i t i n g f a c t o r s i n t h e p r o c e s s i n g of heavy crudes and r e s i d u a . These me ta l s , p a r t i c u l a r l y V and N i , a r e d e l e t e r i o u s t o f i x e d bed c a t a l y s t s , caus ing d e a c t i v a t i o n
New technology has r e c e n t l y been developed t o p rocess f e e d s with h igh me ta l s c o n t e n t s . Th i s technology c e n t e r s around metals removal by us ing h igh m e t a l s l o a d i n g c a t a l y s t or guard b e d s ( 2 ) , o r s e p a r a t i o n and r e j e c t i o n of poor q u a l i t y h igh m e t a l s m a t e r i a l s (3).
Understanding t h e mechanism, or mechanisms, by which t h e s e metz ls a r e removed can u l t i m a t e l y l ead t o bet ter p r o c e s s i n g methods. But we a r e l l m i t e d by t h e methods of examinat ion f o r me ta l s . The ino rgan ic compounds a r e a t ppm l e v e l s , which l e a d t o p a r t i c u l a r l y d i f f i c u l t a n a l y t i c a l problems. To c i rcumvent t h i s , we have developed and a p p l i e d s i z e e x c l u s i o n chromatography, w i th i n d u c t i v e l y coupled plasma emiss ion s p e c t r o s c o p y (SEC-HPLC-ICP) t o examine V and N i as a f u n c t i o n of p rocess c o n d i t i o n s . This t echn ique a l l o w s mon i to r ing t h e s i z e environment of a s e l e c t e d e lement , w i thou t t h e compl i ca t ions of o t h e r components.
(1).
EXPERIMENTAL
We ob ta ined C a l i f o r n i a a tmosphe r i c r e s i d u a (AR) No. 1 and No. 2 by s i n g l e p l a t e d i s t i l l a t i o n of t h e co r re spond ing crude t o a 343OC c u t - p o i n t . Both AR a r e h i g h i n me ta l s having over 400 ppm N i + V.
436

The thermal processing was performed in a tubular flow reactor, under high hydrogen partial pressure. The fixed-bed catalytic processing was performed over commercially available metals loaded alumina catalysts at typical hydroprocessing conditions. The samples were collected from the reactors and stored cold, under nitrogen, until use. Care was taken to protect the samples from oxygen, and to analyze them as soon after processing as possible.
The processing conditions were selected based on the apparent thermal reaction threshold temperature of 410°C (see discussion below). Treatment at and above this temperature is referred to thermal processing. Three standard severities were chosen -- low, moderate, and high. Fixed-bed catalytic treatment was done below this temperature.
The fractionation of the California AR No. 1 into a porphyrin-containing distillate cut (454OC to 677OC) and a nonporphyrin-containing residuum (677OC+) was performed using a short-path distillation apparatus (DISTACT). The cut point between the two fractions was based on the earlier results on metals distribution as a function of boiling point [M. M. Boduszynski unpublished results].
We analyzed both feeds and products by SEC-HPLC-ICP. The technique and the equipment have been described in detail previously (4). The feeds and products were prepared and analyzed by the following procedure:
1) dilute the feed or product to a concentration of 1 to 5% by wt mobile phase of %-xylene, %-cresol, and pyridine.
2 ) elute the solution by HPLC on Ultragel 5 0 and 1000 nm analytical columns.
3 ) detect emission profiles of V (292.40 nm) and Ni (231.60 nm) using an ICP source.
The output, or response profile so obtained, measures the selected elemental content as a function of the elution time. Calibration with polystyrene (PS) standards ( 4 ) and model compounds (5,6), changes the response profile from a time domain to a logarithmic size domain. Because we are interested in the relative distribution, and not absolute changes, the profiles shown here are not normalized to absolute metals content.
The porphyrin/nonporphyrin separation methods are also reported elsewhere ( 4 ) . W-vis determinations were performed on alumina and capped-silica column separated fractions by techniques discussed elsewhere (4,7).
METAL STRUCTURES IN THE FEEDS
Figure 1 shows the V and Ni SEC-HPLC-ICP response profiles for California AR No. 1. The V profile exhibits the typical bimodal distribution seen for many other crudes and residua (4-6,8,9). The profiles are generally bimodal in distribution, with maxima at MW around 800 and 9000 (PS standards). The maximum at 800 has been assigned by extraction techniques to be metallopetroporphyrins (4). For the crudes examined, the metallopetroporphyrins are most of the small metal compounds, but account for only a minor amount of the
437

metals i n t h e c rude . 26% and 34% of t h e V i s bound as pe t roporphyr in f o r C a l i f o r n i a AR No. 1 and No. 2 r e s p e c t i v e l y .
We b e l i e v e t h e remain ing me ta l - con ta in ing compounds a r e nonporphyr ins . We have examined, t h e ave rage f i r s t c o o r d i n a t i o n sphe re around t h e V i n t h e nonporphyr in f r a c t i o n u s i n g e l e c t r o n paramagnet ic r e sonance (EPR) spec t roscopy , and have found va r ious combina t ions of N , S and 0. For C a l i f o r n i a AR No. 2, t h e nonporphyr in c o o r d i n a t i o n s p h e r e i s N 0 2s (9).
The N i SEC-HPLC-ICP p r o f i l e i n F igu re 1 e x h i b i t s more n o i s e due t o t h e lower r e sponse f a c t o r of N i i n t h e ICP d e t e r m i n a t i o n i n comparison w i t h V, and t h e lower c o n c e n t r a t i o n of N i i n t h e f e e d . It also shows t h a t t h e r e a r e f a r fewer N i p o r p h y r i n s than V po rphyr ins , as observed f o r o t h e r c rudes and r e s i d u a (5,6). We d i s c u s s t h e f o l l o w i n g r e s u l t s u s i n g on ly t h e V p r o f i l e s . N i p r o f i l e s behaved s i m i l a r l y i n a l l c a s e s .
These r e s u l t s and e x t r a c t i o n d a t a ( 6 ) have l e a d t o a fo rmula t ion of models f o r m e t a l s i n c rude o i l s . We b e l i e v e t h e m e t a l s t o b e of two types : 1) t h e po rphyr ins which have a narrow, bu t w e l l de f ined molecu la r weight r ange due t o homologous s e r i e s s u b s t i t u t i o n s ( l o ) , and 2 ) t h e nonporphyr ins , which span a much b roade r molecular weight and s i z e range . The nonporphyr in molecu la r s i z e range could be due t o small molecu la r weight compounds which are convolu ted i n a t e r t i a r y - a g g l o m e r a t e d s t r u c t u r e . The nonporphyr ins could a l s o have homologous s e r i e s t y p e s t r u c t u r e .
THERMAL PROCESSING: TEMPERATURE BEHAVIOR
F i g u r e 2 e x h i b i t s t h e V r e sponse p r o f i l e s f o r C a l i f o r n i a AR No. 1 the rma l p r o d u c t s . These p roduc t s were g e n e r a t e d from p r o c e s s i n g i n a t u b u l a r r e a c t o r a t moderate the rma l s e v e r i t y and low thermal s e v e r i t y . The p r o f i l e s co r re spond t o 78% and 38% V removal, r e s p e c t i v e l y .
A t modera te the rma l s e v e r i t y , t h e remain ing metal compounds e x h i b i t a d r a m a t i c s h i f t t o smaller molecu la r s izes . The l a r g e r prominent maximum i s s h i f t e d from i t s p o s i t i o n i n t h e f e e d and appears t o be vanady l p e t r o p o r p h y r i n s . Th i s w i l l be d i s c u s s e d i n a subsequent s e c t i o n .
A t low the rma l s e v e r i t y , t h e remain ing me ta l - con ta in ing compounds e x h i b i t s imilar t r e n d s , b u t s h i f t much l e s s t han i n t h e moderate the rma l s e v e r i t y c a s e .
These r e s u l t s combined w i t h h igh the rma l s e v e r i t y product p r o f i l e s ( n o t shown), i n d i c a t e t h e e x t e n t of s i z e r educ t ion appea r s t o be a f u n c t i o n o f t h e the rma l r e a c t o r t empera tu re .
THERMAL PROCESSING: REACTION TIME EFFECT
F i g u r e 3 shows C a l i f o r n i a AR No. 2 p rocessed a t moderate thermal s e v e r i t y i n t h e t u b u l a r r e a c t o r f o r d i f f e r e n t r e a c t i o n t imes . V removal was 70% i n t h e long r e s i d e n c e t i m e , and 50% i n t h e s h o r t r e s i d e n c e t ime . There is l i t t l e d i f f e r e n c e i n t h e p r o f i l e d i s t r i b u t i o n of t h e s e p r o d u c t s . L iqu id r e s i d e n c e t i m e appea r s t o have l i t t l e e f f e c t on t h e amount of s i z e r educ t ion .
438

CATALYTIC PROCESSING
1 was processed downflow in a fixed-bed reactor over commerc ally available hydroprocessing catalysts. The V SEC-HPLC-ICP profiles of products from short residence times and long residence times are shown in Figure 4. The short residence time profile corresponds to 50% V removal. The remaining metal-containing compounds exhibit a conspicuous lack of smaller components. The
I porphyrin and similar size compounds are absent, while some of the
1
! larger, nonporphyrin compounds are still evident.
1' 1
Fixed-bed processing at long residence time also removes the smaller metal-containing compounds. The long residence time profile corresponds to 70% V removal. The profile is very similar to that of the short residence time profile showing the longer reaction time does not appear to affect the size profile of the remaining metal-containing compounds. This is also seen in the thermal treatment results above.
Under fixed-bed processing conditions, the catalyst pore Size appears important. The compounds that are in the size range of the catalyst pore are removed. This behavior has been seen in the studies on the processing of Safaniya asphaltenes (ll), Arabian Light vacuum residuum ( V R ) asphaltenes and maltenes (12), in gel permeation chromatography (GPC) studies of Venezuelan crudes (13), and in demetalation kinetic studies of Boscan and Arabian Light residua (14).
The metal-containing compounds which do not fit in the catalyst pores require more severe processing. Longer residence times were required to remove these metals. The kinetics of metals removal over typical hydrodesulfurization catalysts have been determined in some cases to be second order (15). This has been explained as demetalation by two different first-order rate constants (16). These could be the respective demetalation rates for the metals which can fit into the catalyst pores and those which cannot.
THERMAL PROCESSING: PORPHYRINS AND NONPORPHYRINS To determine the individual fates of the porphyrins and
nonporphyrins during processing, California AR No. 1 was separated into distillable and nondistillable metal fractions by distillation, and each fraction was thermally processed. Figure 5 shows the separation by distillation. The 454OC to 677OC fraction shows only small size metal-containing compounds. The V in this fraction was determined by UV-vis spectroscopy to be 98% porphyrin, and by methanol extraction to be 90% porphyrin. The 677OC+ fraction is primarily the nonporphyrin metal compounds. Methanol extraction indicates only 2% of the V bound as porphyrin, and UV-vis spectroscopy indicates only 2% of the V bound as porphyrin in this fraction.
For thermal treatment at moderate thermal severity both fractions were diluted with appropriate vacuum gas oil components to their original metals concentration in the AR. Figure 6 shows the V SEC-HPLC-ICP profiles of the 454OC to 677OC fraction before and after processing. It is clear from the profiles that the porphyrins are completely removed (as well as the rest of the V).
Figure 7 shows the V SEC-HPLC-ICP profiles for the 677OC+ fraction before and after moderate thermal severity treatment. The remaining metal-containing compounds are shifted to the smaller
439

molecular s i z e , s imilar t o t h o s e of t h e moderate thermal s e v e r i t y p r o c e s s i n g of C a l i f o r n i a AR No. 1.
Nonporphyrins have been thought of as p o r p h y r i n s which have been e n c a p s u l a t e d i n a n a g g l o m e r a t i v e network ( 1 7 ) . They would n o t n e c e s s a r i l y be d e t e c t e d as p o r p h y r i n s because t h e i r s p e c t r o s c o p i c and p h y s i c a l p r o p e r t i e s could be changed by t h i s agglomera t ion . The s i z e r e d u c t i o n s e e n i n t h e t h e r m a l t r e a t m e n t of t h e 677OC+ c u t produces compounds which are smaller t h a n e i t h e r t h e feed p e t r o p o r p h y r i n s , o r p o r p h y r i n model compounds, as evidenced i n F i g u r e 7. Porphyr in e x t r a c t i o n and UV-vis d e t e r m i n a t i o n show less t h a n 3% of t h e V is bound a s p e t r o p o r p h y r i n i n t h i s p r o d u c t . We f e e l t h i s v e r i f i e s t h e e x i s t e n c e of t h e nonporphyr ins which are n o t e n c a p s u l a t e d p o r p h y r i n s .
T h i s argument would be n u l l i f i e d i f t he s t r u c t u r e of t h e m e t a l - c o n t a i n i n g compounds were s u f f i c i e n t l y changed d u r i n g p r o c e s s i n g . For example, t h e p o r p h y r i n s c o u l d be d e m e t a l a t e d , bu t i n s t e a d of f a l l i n g o u t comple te ly , the metals could combine w i t h o t h e r p o l a r o r g a n i c molecules and could r e b i n d h a v i n g a nonporphyr in l i g a n d environment .
DISCUSSION
The r e s u l t s shown h e r e are i m p o r t a n t i n t h e o v e r a l l p i c t u r e of p r o c e s s i n g r e s i d u a and heavy o i l s . Although l i t t l e d a t a e x i s t s on t h e behavior of t h e m e t a l - c o n t a i n i n g compounds monitored by element s p e c i f i c d e t e c t i o n , some s t u d i e s have been done by o t h e r t e c h n i q u e s .
GPC s t u d i e s on t h e o r g a n i c p o r t i o n of Arabian L i g h t VR mal tenes and a s p h a l t e n e s t h e r m a l l y p r o c e s s e d under v i s - b r e a k i n g c o n d i t i o n s showed a d r a m a t i c d e c r e a s e i n t h e a v e r a g e m o l e c u l a r s i z e ( 1 2 ) upon i n c r e a s e of p r o c e s s t e m p e r a t u r e . The same r e s u l t s were found i n t h e heat t r e a t m e n t of S a f a n i y a VR a s p h a l t e n e s (11). T h i s a g r e e s w e l l w i t h o u r thermal p r o c e s s i n g r e s u l t s f o r t h e N 1 and V, where we a l s o see s i z e r e d u c t i o n which i s dependent on thermal t e m p e r a t u r e s .
The e f f e c t of f ixed-bed p r o c e s s i n g under c a t a l y t i c c o n d i t i o n s h a s been s t u d i e d more thoroughly . Arabian L i g h t t r e a t e d under mild hydroprocess ing c o n d i t i o n s e x h i b i t e d metals r e d u c t i o n cor responding t o c a t a l y s t p o r e s i z e ( 1 4 ) . S i m i l a r r e s u l t s f o r t h e o r g a n i c p o r t i o n have been s e e n w i t h Arabian Light VR a s p h a l t e n e s (12), Morichal c rude (13), and a s p h a l t e n e s f rom S a f a n i y a VR (11). T h i s also a g r e e s wel l w i t h our f ixed-bed p r o c e s s i n g r e s u l t s where t h e metals are d i s t i n c t i v e l y -- a f f - * + - d - - - - - - hy the peye s i z e of t h e c a t a l y s t .
One of t h e i m p o r t a n t consequences of t h i s s t u d y i s t h a t t h e p o r p h y r i n s a p p e a r t o be removed f i r s t I n res iduum d e m e t a l a t i o n . T h i s conclus ion h a s been reached p r e v i o u s l y . Porphyr ins have been found t o b e p r e f e r e n t i a l l y removed i n thermal t r e a t m e n t w i t h hydrogen and/or hydrogen s u l f i d e (18). I n a d d i t i o n , the r e a c t i o n t h r e s h o l d t e m e r a t u r e f o r p o r p h y r i n d e m e t a l a t i o n was 4OO0C w i t h o u t , b u t on ly 200 c w i t h a f ixed-bed h y d r o g e n a t i v e c a t a l y s t . O x i d a t i v e t r e a t m e n t s t u d i e s of r e s i d u a have a l so shown t h e same e f f e c t -- t h e p o r p h y r i n s come out f i r s t (19,20).
Our s t u d i e s s u p p o r t t h e s e c o n c l u s i o n s . The r e s u l t s from s e p a r a t e p r o c e s s i n g of t h e p o r p h y r i n s and t h e nonporphyr ins are ev idence t h a t the p o r p h y r i n s are t h e most l a b i l e . I n a d d i t i o n , t h e removal of t h e metals 1s g r e a t l y a s s i s t e d by t h e f ixed-bed h y d r o p r o c e s s i n g c a t a l y s t , which o p e r a t e s a t a s u b s t a n t i a l l y lower t e m p e r a t u r e .
g
440

However, i t is impor t an t t o no te t h a t t h e s e r e s u l t s may n o t be a consequence of t h e po rphyr in or t h e nonporphyrin c o o r d i n a t i o n s p h e r e , b u t s imply a consequence of t h e s i z e of t h e compounds. I n t h e the rma l case , t h e po rphyr ins were removed because they were most of t h e smallest me ta l - con ta in ing molecules . I n t h e f ixed-bed p r o c e s s i n g , t h e po rphyr ins were removed because of t h e m e t a l - c a t a l y s t p o r e s i z e r e l a t i o n s h i p .
S t u d i e s of f e e d s and p roduc t s from t h e ABC p r o c e s s (211 , showed t h e i s o t r o p i c EPR pa rame te r s of t h e vanadyl ion e x h i b i t e d l i t t l e change i n p r o c e s s i n g , and t h e r e f o r e l i t t l e o r no change i n t h e f i r s t c o o r d i n a t i o n s p h e r e abou t t h e metal c e n t e r (22,231. It was concluded from t h i s t h a t t h e r e a c t i v i t y of t h e vanadium is determined by t h e m a c r o s t r u c t u r e of t h e residuum, and n o t by t h e n a t u r e of t h e c o o r d i n a t i n g metal l i g a n d s .
T h i s is a l s o suppor t ed by t h e rates of hydrodemeta l a t ion s t u d i e s of e x t r a c t e d p e t r o p o r p h y r i n s . The f a c i l i t y by which hydrogena t ion of po rphyr ins (24 ) o c c u r s s t r o n g l y a rgues t h e rate of d e m e t a l a t i o n i s no t a f u n c t i o n o f t h e i n t r i n s i c r e a c t i o n ra te of t h e f i r s t c o o r d i n a t i o n s p h e r e around t h e metal i o n , b u t d i f f u s i o n th rough o r d e n a t u r i n g of t h e p o l a r medium around t h e me ta l - cen te r s .
CONCLUSION
We have examined the rma l p r o c e s s i n g and c a t a l y t i c f i x e d bed p r o c e s s i n g by SEC-HPLC-ICP t o de t e rmine d e m e t a l a t i o n mechanisms. Thermal p r o c e s s i n g removes N i and V and r educes t h e s i z e of t h e remaining me ta l - con ta in ing compounds. Fixed-bed p r o c e s s i n g removes metals as a f u n c t i o n o f t h e po re s i z e .
By s e p a r a t i n g t h e po rphyr ins from t h e nonporphyr ins , we have found t h e po rphyr ins p r o c e s s t h e easiest under the rma l c o n d i t i o n s . T h i s could be a r e s u l t of t h e i r i n t r i n s i c r e a c t i v i t y , o r merely a f u n c t i o n o f s i z e o r m a c r o s t r u c t u r e . I t i s o u r c o n t e n t i o n , t h e m a c r o s t r u c t u r e is rate c o n t r o l l i n g f o r a t l e a s t t h e nonporphyrins .
ACKNOWLEDGEMENTS
The a u t h o r s would l i k e t o thank Sue Bezman f o r t h e f ixed-bed p rocessed samples , Mietek M . Boduszynski and T i m A t t o e f o r t h e sho r t -pa th f r a c t i o n a t i o n of t h e AR i n t o po rphyr in -con ta in ing d i s t i l l a t e and nonporphyr in -con ta in ing residuum, Rick Brown and J i m Gano f o r a s s i s t a n c e wi th t h e ICP, Thomas F i n g e r f o r a s s i s t a n c e i n sample work-up, and Chris Kuehler f o r h e l p f u l d i s c u s s i o n s .
REFERENCES
1. T a m , P. W . , Harnsberger , H . F. , and Br idge , A . G . 1981. Ind. Eng. Chem. P rocess Des. Dev., 20:263.
2. Busch, L. E., H e t t i n g e r , W . P.,' Jr., and R . P. Krock. 1984. O i l and Gas J., 82(52):54-56.
3. Bunch, R . A . , K o c i s l c i n , J. J . , Schroede r , H. F. , and G . N. Shaw. 1979. Hydrocarbon P rocess ing , 5 9 ( 9 ) : 136.
4. Biggs , W. R . , F e t z e r , J. C . , Brown, R . J., and J . G . Reynolds. 1985. Liq . F u e l Tech., 3 ( 3 ) , XXX.
441

!
18. Rankel, L . A . 1981. 26(3):689-698.
5. F i s h , R . H. , and Komlenic, J. J . 1984. Anal. Chem.,
6. F ish , R . H. , Komlenlc, J . J., and Wines, B. K . 1984. Anal.
56:510-517. f
A C S Dlv. of P e t r o l . Chem., P r e p r i n t s ,
19. Gould, K . A . 1980. F u e l , 59:733-736.
20. Sug iha ra , J. M. , B ran thave r , J. F. , and Wllcox, W . 1973. ACS Dlv. o f P e t r o l . Chem., P r q p r l n t s , 18:645-647.
21. Asaoka, S. Nakata, S. , S h l r o t o , Y . , and Takeuchi , C . 1983. Ind . Eng. Chem. P r o c e s s Des. Dev. 22:242-248.
22. Dickson, F. E., Kunesch, C . J . , McGlnnls, E. L . , and P e t r a k i s , L. 1972. Anal . Chem. , 41:576.
23. Dickson, F. E . , and Pe t rak is , L. 1974. Anal. Chem., 44:1129.
24. Rankel, L. A . , and Rollmann, L. D. 1983. Fue l , 62:44-46.
4 4 2

FIGURE 1
SEC-HPLC-ICP PROFILES FOR CALIFORNIA AR NO. 1
t 10 13 16 19 12
rime. MI~YIM
FIGURE 2
CHANGES IN VANADIUM DISTRIBUTION FROM THERMAL TREATMENT OF CALIFORNIA AR NO, 1
I I I I I 1 18 20 10 12 14 IS
T l m , Mlnutn
FIGURE 3
CHANGES IN VANADIUM DISTRIBUTION FROM THERMAL PROCESSING OF CALIFORNIA AR
NO. 2 AT DIFFERENT REACTION TIMES

FIGURE 4
CHANGES IN VANADIUM DlSTRlEUTlON FROM FIXEDBED TREATMENT OF CALIFORNIA AR NO. 1 AT
DIFFERENT RESIDENCE TIMES
I I 8 11 14 17 20 23
rim. M~~UU.
I I I I
FIGURE 5 VANADIUM SIZE PROFILES OF CALIFORNIA AR NO. 1. 454% to 677°C DISTILLATION CUT. 677"Ct RESIDUE
I 2 1 6 I 10 12 14
I
Time. Minuin
FIGURE 6 CHANGE IN VANADIUM SIZE DISTRIBUTION OF THE 454°C to 67PC DISTILLATION CUT OF CALIFORNIA
AR NO. 1 UPON THERMALTREATMENT
444

I.
m m I h
445

EFFECT OF TRACE METALS ON FCC COKE Y I E L D
Periaswamy Ramamoorthy Gulf Research and Development Company
P. 0. Drawer 2038 P i t t s b u r g h Pa 15230
An experimental study i s underway a t t h e Gulf Research Center i n H a r m a N i l l e , Pennsylvania, aimed a t d e f i n i n g t h e e f f e c t s of trace meta ls on t h e regenera t ion of f l u i d c racking c a t a l y s t s f o r r e s i d cracking a p p l i c a t i o n s . A s part of t h i s s tudy a benchscale experimental technique was developed f o r coking t h e FCC c a t a l y s t s under well-mixed condi t ions. Coke y i e l d was found t o c o r r e l a t e well with t h e type of metal and its concent ra t ion .
known Voorhies-type c o r r e l a t i o n f o r each metal:
C = AT
When c o n t a c t t i m e was v a r i e d t h e coke y i e l d obeyed t h e well-
n
where C is weight percent carbon on t h e c a t a l y s t , T is contac t t ime i n minutes, A and n are cons tan ts . The experimental technique and r e s u l t s obtained f o r n i c k e l , antimony, and n icke l p a s s i v a t e d wi th antimony a r e discussed i n t h i s paper.
w i t h a d i p l e g a s shown i n Figure 1. The shaker bomb conta in ing a known weight of c a t a l y s t was placed i n a f l u i d i s e d sandbath and heated t o a t y p i c a l t empera ture of 930 F under n i t rogen purge. An o i l feed was added a t a c o n s t a n t r a t e t o t h e c a t a l y s t over a per iod of t i m e requi red 1 minute. The i n t e r n a l c a t a l y s t temperature was measured by a thermocouple placed a t t h e c e n t e r of t h e d ip leg . , A t t h e end of run t h e shaker bomb was t r a n s f e r r e d t o another f l u i d i s e d s a n d b a t h maintained a t room temperature. The c a t a l y s t was t h e n d ischarged and its carbon content determined. I n a d d i t i o n t o carbon, t h e coke was analysed f o r hydrogen, s u l f u r , and n i t rogen .
w i t h antimony are d iscussed here. and i n cnmhinpcl f c m , t o a batch of an e q u i l i b r i m c a t a l y s t a t f o u r G ~ F c e n t r a t i o n l e v e l s .
s teady increase i n c o k e y i e l d with metal conten t . When antimony was added t o p a s s i v a t e n icke l on c a t a l y s t a reduct ion i n coke make of approxi- mately 40% was obta ined . Typical reduct ion of 50% is repor ted f o r commercial un i t s .
affect coke y i e l d , r e g a r d l e s s of i ts concent ra t ion .
t e d i n c o k e y i e l d lower than t h a t p r e d i c t e d by t h e c o r r e l a t i o n developed
The a p p a r a t u s used f o r coking c o n s i s t e d of a shaker bomb
R e s u l t s o b t a i n e d f o r n i c k e l , antimony, and n i c k e l pass iva ted The m e t a l s were added, s e p a r a t e l y
C a t a l y s t s conta in ing f r e s h l y depos i ted n i c k e l a lone showed a
C a t a l y s t s conta in ing f r e s h l y depos i ted antimony alone d id not
Coking runs made on aged c a t a l y s t s of high metal conten t resul-
446

I\ i \ for fresh-metals c a t a l y s t s . f
ACKNOWLEE EMENT
\ The author wi shes t o thank Dr. A. S. Krishna of Gulf Research and Development Company for he lpfu l d i s c u s s i o n s during t h e course of t h i s study.
REFERENCE
1- Voorhies, Jr., A . , Ind. Eng. Chem., 3 7 ( 4 ) , 318 (1945)
Na PURGE
I GAS OIL --+-
I
HERMOCOUPLE
- -- GAS TO BLOWDOWN
1- SHAKER REACTOR FOR COKING
447

THE INFLUENCE OF THE PETROLEUM RESIDUA AND CATALYST TYPE ON COPROCESSING
C h r i s t i n e Id. Cur t i s , Kan-Joe Tsai, and James A. Guin
Chemical Engineering Department Auburn Un ive rs i t y , Alabama 36849
I n t r o d u c t i o n
The goal o f coprocessing heavy petroleum crudes and res idua w i t h coal i s t o simultaneously upgrade bo th ma te r ia l s i n t o h ighe r q u a l i t y l i q u i d products. t h e benef i ts o f coprocessing i s t h a t i t o f f e r s a b r i dge between the present petroleum-based technology and t h e syn the t i c f ue l s coal -based technology o f t h e fu ture, Coal and pet ro leum res idua are both low va lue hydrocarbon resources, which through coprocessing can be transformed i n t o h igher q u a l i t y and h igher value syn the t i c fue ls . The nature o f the s y n t h e t i c f u e l produced from coprocessing would be q u i t e d i f f e r e n t f rom t h a t o f conventional coal l i q u e f a c t i o n us ing a coal -der ived recyc le stream. The h i g h l y aromatic coal -der ived s y n t h e t i c f u e l would already be combined w i t h ample q u a n t i t i e s o f h i g h l y p a r a f f i n i c ma te r ia l s , making t h e product more s i m i l a r t o f u e l s used today. I n add i t i on , the presence of coal -der ived syn the t i c f u e l i n t h e coprocessing product would serve as an octane booster. Another advantage o f coprocessing i s t h e e l i m i n a t i o n o r min imizat ion o f the coal-derived recyc le stream used i n conventional coal l i q u e f a c t i o n technology.
A number o f petroleum mate r ia l s have been surveyed f o r t h e i r a b i l i t y t o so l va te coal and t o p a r t i c i p a t e i n t h e upgrading process. (1-4) subbituminous coals have been success fu l l y used i n combined processing (5,6). Using c a t a l y t i c hydrotreatment w i t h small p a r t i c l e s i z e ca ta l ys ts , coal conversion o f greater than 80% have been achieved f o r both bituminous and subbituminous coals when us ing petroleum solvents.(5) The i n t e r a c t i o n between t h e petroleum solvent and the coal i s complex. S y n e r g i s t i c i n t e r a c t i o n s may e x i s t a t d i f f e r e n t concentrat ion l e v e l s o f coal and petroleum solvent. I n t h i s work the i n t e r a c t i o n between the petroleum solvent and coa l a t d i f f e r e n t so lvent t o coal r a t i o s i s examined i n terms of product y i e l d and coal conversion. The chemical composit ion o f t h e petroleum solvent i s s u b s t a n t i a l l y d i f f e r e n t from coal -der ived so lvents . ( l ) The e f f e c t of improve-ment i n the so l ven t ’ s a b i l i t y t o donate hydrogen through the a d d i t i o n o f hydroaromatic compounds on t h e f i n a l product s l a t e has been invest igated. Because of t h e complexity and d i v e r s i t y o f t h e coal-petroleum system, c a t a l y s t type may s t rong ly in f luence one ma te r ia l w h i l e n o t being p a r t i c u l a r l y e f f e c t i v e w i t h t h e other. Examination of t h e e f f e c t o f c a t a l y s t type on t h e upgrading o f t he petroleum p m i A ,111 m 2nd 3; rnn”nrr r r i^ r - - -
--.-.IUIII lllv vupm vL.saal~gy c a r ~ :sad t o c a t a l y s t s t h a t ar’e s p e c i f i c a l l y t a i i o r e d f o r enhancement of t h e coprocessing product s la te . I n add i t i on , t he coprocessing product may be enhanced through a combination o f a f i r s t stage reac t i on us ing a minera l a d d i t i v e and a second stage w i t h a commercial hydrogenation ca ta l ys t . This concept i s explored i n t h i s work.
Among
Both bituminous and
Experimental
Ma te r ia l s and Feedstocks
Were supplied by C i t i e s Serv ice Research and Development Company. The s p e c i f i c petroleum mate r ia l s used were Maya topper l ong r e s i d (TLR) and West Texas vacuum shor t res id (VSR). A b i tuminous I l l i n o i s #6 coal , suppl ied by W i l s o n v i l l e Advanced
The so lvents used i n t h i s study were heavy petroleum crudes and res idua which
446

Coal L ique fac t i on Research and Development F a c i l i t y , was used as t h e coal teedstock. The elemental analyses of these feedstocks are given i n Table 1. The c a t a l y s t s used i n these react ions were minera log ica l p y r i t e ground t o -200 mesh and powdered p resu l f i ded Shel l 324 NiMo/A1203 t h a t was obtained by g r i n d i n g 1/16 i n c h p r e s u l f i d e d extrudates. For t he hydrogen donor a d d i t i o n experiments, t e t r a l i n , 1.2.3.4-tetrahydroquinol i n e (THQ) and 9.10-dihydrophenanthrene (DHP) were obta ined from Aldr ich.
Equipment
The combined processing react ions were conducted i n s t a i n l e s s s t e e l micro-reactors which have been descr ibed i n a previous work (7) . volume o f 50 cc which was charged w i t h a l i q u i d / s o l i d s l u r r y of 9 g and a hydrogen pressure o f 1250 p s i g a t ambient temperature a t 100% excess hydrogen f o r t h e combined processing react ions. A 69 charge was used f o r t he petroleum upgrading experiments. The pressure o f 1250 p s i g a t ambient temperature corresponds t o approximately 2950 p s i g a t reac t i on temperature ca l cu la ted by means o f t h e i d e a l gas law and igno r ing any s o l u b i l i t y o f t he hydrogen. t h e o r i g i n a l charge was obtained from t h e coprocessing reactions.
The reac to r has a
A recovery o f greater than 97% o f
Experimental Procedures
A ser ies o f experiments were performed us ing I l l i n o i s #6 coal and West Texas VSR i n which t h e so lvent t o coal r a t i o was va r ied from 1 O : l t o 1:4. The percentage coal present i n these reac t i ons ranged from 9.1% t o 80%. For comparison, reac t i ons were a l so performed i n which no coal was present and i n which no so l ven t was present. The reac t i on products were analyzed by a so lvent e x t r a c t i o n procedure i n which the reac t i on products were sequen t ia l l y ex t rac ted w i t h pentane, benzene, and methylene chloride/methanol. so lub le; asphaltenes, pentane inso lub le , benzene so lub le; preasphaltenes, benzene inso lub le , methylene chloride/methanol so lub le; and i n s o l u b l e organic ma t te r (IOM), methylene chloride/methanol i nso lub le . Analyses performed on the products o f t h e coprocessing reac t i ons were: Canon-Manning c a p i l l a r y viscometer, (2) s p e c i f i c g r a v i t y a t 6OoF accord ing t o ASTM D-70 and ASTM D-287, and (3 ) Conradson Carbon according t o ASTM 0-189.
performed a t 425OC. i n a N2 or H2 atmosphere, f o r 30 minutes. reac to r was 3 grams o f I l l i n o i s #6 coal and 6 grams o f t o t a l so lvent . The so lvent was composed o f 0.3 g, 1.1 g or 3.0 g o f hydroaromatic compound w i t h 5.7 g, 4.9 g or 3.0 g o f Maya TLR, respec t i ve l y . The pressure of N2 charged t o the r e a c t o r was 300 p s i g and o f H2 was 1250 psig.
p r e s u l f i d e d 1/16" ext rudates were used t o determine t h e e f f e c t of c a t a l y s t t ype on t h e upgrading o f West Texas VSR and on coprocessing o f I l l i n o i s #6 coal w i t h West Texas VSR and Maya TLR. The reac t i ons were preformed a t 425'C. 30 minutes, w i t h 6 g o f petroleum solvent , 3 g o f coal and 1 g o f ca ta l ys t .
1250 p s i g H2 charge, and 2 grams o f ca ta l ys t . NiMo/Al& and H2S which was generated i n s i t u from the reac t i on o f carbon d i s u l f i d e w i t h hydrogen.
The products obtained were def ined as o i l , pentane
(1) v i s c o s i t y a t 6OoC according t o ASTM D-2171 us ing a
The coprocs,sing reac t i ons w i t h t h e a d d i t i o n o f hydroaromatic so l ven ts were The charge t o the
Minera log ica l p y r i t e and small p a r t i c l e s i z e NiMo/AlzOj, ground from
The reac t i on cond i t i ons f o r s i n g l e stage processing were 60 minutes, 425'C. The c a t a l y s t s used were p y r i t e ,
449

I
The two stage experiments were performed as two sequent ia l 30 minute reac t ions a t 425OC. 1250 ps i9 H2 charge, 9 grams o f petroleum/coal s l u r r y and 1 gram o f c a t a l y s t i n each stage. reac to r was then opened and t h e second stage c a t a l y s t was added.
ca l cu la ted through t h e a d d i t i o n o f t h e gases produced dur ing each stage. stage mineral c a t a l y s t was no t removed and was present i n the second stage react ions. FeS2 i s assumed t o r e a c t completely t o form FeS.
I
The gas weight was determined a f t e r t he f i r s t stage; t he A f t e r
r e p r e s s u r i z i n g w i t h hydrogen, a second reac t i on was performed. The t o t a l gases were / The f i r s t
For the c a l c u l a t i o n s of t h e f i n a l amount Of reacted FeS2 remaining, the
Resul ts and Discussion
To t a i l o r t h e c o a l - r e s i d system f o r maximal y i e l d s o f h igh q u a l i t y l i q u i d products, the i n f l uence of t h e petroleum solvent on the products obtained from coprocessing must be known. A d d i t i o n o f add i t i ves such as hydrogen donors may enhance t h e des i red product y i e l d . c a t a l y s t se lec t i on becomes more complex, f o r a p a r t i c u l a r c a t a l y s t may ca ta lyze reac t ions o f one o f t h e m a t e r i a l s much more s t rong ly than t h e other. c a t a l y s t types may prove feas ib le t o achieve the many d i v e r s e reac t ions needed t o achieve h igh coal conversion and h igh y i e l d s o f l i q u i d product simultaneously.
With two complex and d i v e r s e m a t e r i a l s present,
Combination o f
The E f f e c t o f Solvent t o Coal Rat io on Coprocessing
One o f t h e advantages o f coprocessing i s the e l im ina t i on o r min imiza t ion o f the coal-der ived recyc le stream needed i n convent ional coal l i q u e f a c t i o n technology. I n convent ional l i q u e f a c t i o n t h e so lvent t o coal r a t i o usua l l y ranges from 1:l t o 3 : l w i t h the r a t i o being dependent on t h e ma te r ia l s used and the o p e r a b i l i t y and range o f t he mechanical equipment. I n coprocessing, a l i m i t a t i o n on the so lvent t o coal r a t i o w i l l s t i l l e x i s t due t o physical cons t ra in ts . I n t h i s study, however, we inves t i ga ted a wide range o f solvent t o coal r a t i o s t o observe t h e e f f e c t o f the so lvent concent ra t ion on the f i n a l product d i s t r i b u t i o n s obtained. A t low so lvent t o coal r a t i o s , t he mass t r a n s f e r o f t he hydrogen t o the coal may be i nh ib i t ed . h igh solvent t o coal r a t i o s , t h e coal may serve as an extender or enhancer t o t h e petroleum mater ia l , by s y n e r g i s t i c a l l y promoting the upgrading o f t he petroleum mater ia l .
A t
The range of s o l v e n t t o coal r a t i o s examined was ' l 0 : l t o 1:4. The reac t ions were performed a t t h e coprocessing c o n d i t i o n s given i n t h e Experimental sect ion. these experiments, t h e r e a c t o r l i q u i d p lus s o l i d load ing was kept constant so t h a t n ine (9) grams o f petroleum-coal s l u r r y was in t roduced each time. The amount of c a t a l y s t used i n each r e a c t i o n remained constant a t one gram. percentage so lvent and coal changed i n each react ion, experimental r e s u l t s must be expressed independent ly o f t h e amounts o f petroleum so lvent and coal . The hydrogen consumption and coal conversion can be used d i r e c t l y . The amount o f mater ia l upgraded t o o i l can a l s o be determined independently o f t he system by d e f i n i n g i t as o i l product ion which i s t he grams o f o i l produced ( f i n a l o i l - i n i t i a l o i l ) d i v ided by amount of t he upgradable mater ia l . The upgradable ma te r ia l i s composed o f maf coal and t h e nonpentane s o l u b l e f r a c t i o n o f t h e solvent.
As t h e percentage o f coal increased from 9.1% t o 50%. coal conversion increased from 42.6% t o 87.2% as presented i n F igure 1. A t i nc reas ing l y h igher l e v e l s o f coal, the amount o f coal conversion s t e a d i l y decreased. When no so lvent was present, a coal conversion o f 33% was obtained. Hydrogen consumption, shown i n F i g u r e 2, fo l lowed t h e same trend, g i v i n g a maximum a t 50% coal loading. The percent o i l p roduc t ion achieved a t coal percentages o f 25% t o 50% was constant a t
I n
Since bo th t h e
450

-33% as shown i n F igure 3. A s i m i l a r va lue o f 28% o i l product ion was obta ined a t 9.1% coal loading. A t h igher coal loading, t h e percent o i l product ion decreased rap id l y , f a l l i n g t o -15% a t 80 and 100% coal loading.
The complexity o f t he coprocessing reac t i on system and the many reac t i ons which occur simultaneously make i t d i f f i c u l t t o asce r ta in the reasons f o r t he behavior observed as the so lvent t o coal r a t i o was varied. The i n t e r r e l a t i o n - s h i p among coal conversion, o i l product ion and hydrogen consumption i s evident. Hydrogen consumption i s d i r e c t l y r e l a t e d t o t h e amount o f coal conversion achieved and t h e amount o f o i l product ion observed. The behaviors o f coal conversion and o i l product ion as a f u n c t i o n o f t h e increased weight percentage o f coal i n t h e react ions a r e more d i f f i c u l t t o expla in .
Numerous f a c t o r s may be i n f l u e n c i n g these behaviors and causing i n t e r a c t i v e e f f e c t s . of t he coal and so lvent blends, composit ional e f f e c t o f t he b lend o f l i q u e f i e d ma te r ia l s , c a t a l y s t po isoning and deac t i va t i on and s o l v o l y s i s o f t h e d i s s o l v i n g coal m a t r i x by the l i q u i d phase present. Since i n coprocessing, t he molecular composit ion va r ies r a t h e r d ramat i ca l l y from h igh so l ven t t o coal r a t i o s t o low so lvent t o coal r a t i o s , s o l v o l y s i s o f t h e d i s s o l v i n g coal m a t r i x by the l i q u i d present i n the reac to r may be an impor tant f a c t o r i n t h e observed behavior o f coal conversion and o i l production. The 50% blend o f coal t o petroleum so lven t may prov ide a good coal d i s s o l v i n g so lvent . Mass t r a n s f e r of H2 t o t h e d i s s o l v i n g coal m a t r i x i s most l i k e l y b e t t e r achieved when a h ighe r p ropor t i on o f so l ven t i s present. Therefore, t h e h igher y i e l d s o f o i l and o f coal conversion achieved a t h ighe r so lvent t o coal r a t i o s compared t o the lower r a t i o s may be due t o the increased a v a i l a b i l i t y o f hydrogen t o t h e coal. The d e c l i n e a t h igh coal loadings may be due t o mass t r a n s f e r l i m i t a t i o n s On H2. I n t h i s system, however, i t must be remembered t h a t t h e coal t o c a t a l y s t r a t i o increased as the coal l oad ing increased; o r s ta ted i n another manner, t h e c a t a l y s t loading remained constant as t h e percent coal i n the reac t i on increased. The dec l i ne i n coal conversion and o i l product ion may be due t o c a t a l y s t deac t i va t i on and rap id l o s s o f a c t i v i t y i n t h e concentrated coal matr ix . As s ta ted e a r l i e r , t he exact reasons f o r t h e behavior observed can not be pinpointed. One poss ib le r a t i o n a l e i s t h a t several d i f f e r e n t mechanisms are occu r r i ng and t h a t d i f f e r e n t mechanisms are dominant a t d i f f e r e n t coal concentrat ions.
Analyses o f some o f t he phys ica l p roper t i es of coprocessing r e a c t i o n products have been performed and are compared t o t h e o r i g i n a l coprocessing so lvent , West Texas VSR, and hydrot reated West Texas VSR i n Table 2. Products obta ined from reac t i ons us ing a 1 O : l so lvent t o coal r a t i o and a 2 : l so lvent t o coal r a t i o were examined. The phys ica l p roper t i es evaluated were v i scos i t y , degrees A P I g r a v i t y , s p e c i f i c g r a v i t y and Conradson Carbon. v i s c o s i t y o f the r e s i d a t 60' C decreased from 324.8 t o 1.07 poise; Conradson Carbon decreased by almost h a l f and 'AP I g r a v i t y almost doubled. The v i s c o s i t i e s o f t he ma te r ia l s obtained from coprocessing have much lower v i s c o s i t i e s than t h e o r i g i n a l residuum. I n the coprocessing reac t i on w i t h a 10 t o 1 so lven t t o coal r a t i o t h e v i s c o s i t y was reduced t o 0.363 poise and t h e Conradson Carbon was lowered t o 13.49. The presence of t h e coal may be producing synergy i n t h a t t h e v i s c o s i t y was reduced t o l ess than t h a t o f West Texas VSR hydrot reated i n the presence o f NiMo/A1203 b u t i n the absence o f coal. Increased coal concentrat ion r e s u l t e d i n an increase i n the v i s c o s i t y t o 22.7 po ise and an increase i n Conradson Carbon t o 17.78.
\
Some o f t he f a c t o r s i nvo l ved may be mass t r a n s f e r e f fec ts , concen t ra t i on
I n t h e hydrotreatment o f West Tesas VSR the
Ef fect o f Hydrogen Donor Add i t i on on Coprocessiny
Recent s tud ies have shown t h e importance o f hydrogen donors and t r a n s f e r agents i n the d i s s o l u t i o n Of coal (8-11). The r o l e and importance of hydrogen t r a n s f e r i n
451

coprocessing a re i n v e s t i g a t e d here in by studying t h e e f f e c t o f t he add i t i on o f hydrogen donor compounds such as t e t r a l i n , 1,2,3,4-tetrahydroquinoline (THQ) and 9,10-dihydrophenanthrene (DHP) t o t h e petroleum so lvent used i n coprocessiny. these coprocessing reac t ions , t he coprocessing so lvent was Maya TLR and the coal was I l l i n o i s #6. Three l e v e l s o f donable hydroyen have been studied, 0.15%. 0.55% and 1.5% i n N2 and H2 atmospheres. coal conversion ob ta ined from coprocessing reac t ions i s presented i n Table 3. coprocessing reac t i ons i n which t e t r a l i n was added, bo th coal conversion and o i l product ion increased when comparing N2 t o H2 atmospheres f o r equ iva len t donable hydrogen add i t ion . However, a t t he 0.15% t e t r a l i n a d d i t i o n l e v e l i n t h e H2 atmosphere, t h e product s l a t e was very s i m i l a r t o t h a t obtained i n H2 us ing only Maya TLR. The e f f e c t o f a H2,atmosphere on coal conversion was dramatic, i n c r e a s i n g coal conversion from 19.6% i n N2 t o 58.9% i n H2 a t t he lowest donor hydrogen add i t i on l eve l . When 1.5% donable hydrogen was present i n the t e t r a l i n MayalTLR system, coal conversion i n N2 was 62.1% which was e s s e n t i a l l y equ iva len t t o the coal conversion obtained w i th 0.15% donable hydrogen i n a H2 atmosphere. I n these reac t ions , i t appears t h a t t h e form that t h e hydrogen i s i n , whether molecular hydrogen o r donable hydrogen from hydroaromat ic compounds, i s no t c r i t i c a l . The necessary c r i t e r i o n f o r coal conversion t o be achieved i s f o r t h e hydrogen t o be present i n a form which can be u t i l i z e d by the coa l . The use of a Hp atmosphere t o the t e t r a l i n l n a y a TLR system w i t h 1.5% donable hydrogen f u r t h e r aided i n coal conversion, i n d i c a t i n g t h a t a hydrogen de f i c iency e x i s t e d i n the N2 atmosphere even when a s i g n i f i c a n t amount o f t e t r a l i n was present.
t he THQIMaya TLR system was dramatic. increased from 23.2% i n Ne t o 58.0% i n H2. THQ/Maya TLR system a t t he h ighes t donable hydrogen l e v e l was i n s e n s i t i v e t o atmosphere. The amount o f pentane s o l u b l e mater ia ls produced was t h e same i n Ne regardless o f the amount o f donable hydrogen. I n H2, on ly a small increase i n pentane so lub les was observed by i n c r e a s i n g the amount o f donable hydrogen f r o m 0.15% t o 1.5%.
t o t h e 0.15% t e t r a l i n system. A poss ib le reason f o r t h e increased o i l product ion i s t he a v a i l a b i l i t y of more hydrogen t o t h e d i s s o l v i n g coal m a t r i x r e s u l t i n g i n an increased amount of hydrogenat ion o c c u r r i n g and the produc t ion o f hydrogenated products s o l u b l e i n pentane. of t h e hydroaromatic may a l so be p a r t i a l l y respons ib le f o r t he observed change i n percent o i l product ion. F u r t h e r e luc ida t i on o f t he r o l e o f hydrogen donor compounds i n coprocessing was sought by comparing the e f f e c t o f DHP on t h e product s l a t e t o t h a t of t e t r a l i n and THQ. The choice of DHP was based upon i t s comparable a b i l i t y t o convert coal as THQ (12) and upon t h e fac t t h a t it i s a hydrocarbon w i t h o u t any o f t h e de t r imenta l charac t .e r is t i cs genera l l y associated w i t h n i t rogen conta in ing hydroaromatics. When compared a t a 0.55% donable hydrogen leve l , DHP converted more coal t o s o l u b l e m a t e r i a l than THQ and y i e l d e d a h igher percent o i l p roduc t ion than d i d t e t r a l in.
I n
The e f f e c t o f these add i t i ons on o i l p roduc t ion and I n the
As i n the t e t r a l i n system, the e f fec t of t he H2 compared t o the N2 atmosphere on A t 0.15% donable hydrogen, coal conversion
I n cont ras t , coal conversion i n t h e
In Ne, 89.0% coal conversion was observed wh i le i n Hp, 90.4%, was seen.
O i l p roduc t ion increased i n the 1.5% donable hydrogen t e t r a l i n system compared
The change i n so lvent composi t ion due t o t h e presence
Comparing the low l e v e l s o f donable hydrogen us ing t e t r a l i n and THQ showed remarkably s i m i l a r product d i s t r i b u t i o n s i n bo th H2 and N2 atmospheres. i s observed, however, when comparing these two a t t he h ighes t donor l eve l . markedly lower amount o f pentane so lub le mater ia l was produced than i n t e t r a l i n . percent o i l p roduc t ion i n t h e 1.5% donable hydrogen system i n N2 was -30.7% i n THQ and 15.9% i n t e t r a l i n ; l i kewise , i n H2 t h e values were 4.0% i n THQ and 25.0% i n t e t r a l i n . t h a t f r o m t e t r a l i n .
A con t ras t I n THQ, a
The
The product s l a t e obtained from THQ contained many more asphaltenes than
452

I
These r e s u l t s are i n agreement w i t h those observed i n coal l i q u e f a c t i o n where hydroaromatics having a n i t r o g e n f u n c t i o n a l i t y r e a d i l y d i sso l ve coal. The reasons f o r t h e i r e f fec t i veness r e s u l t e d from t h e i r a b i l i t y t o penetrate and swell coal and t h e i r a b i l i t y t o t rans fe r hydrogen. These good features o f t h e n i t r o g e n con ta in ing compounds were, however, overr idden by t h e i r propensi ty t o form adducts w i t h themselves and w i t h coal -der ived mater ia ls . This adduct format ion has been extens ive ly s tud ied by Cronauer (13). The adduct format ion i s r e a d i l y apparent i n t h e increased l e v e l s o f asphaltenes observed du r ing the coprocessing reac t i on con ta in ing THQ.
Ef fect o f Cata lyst Type on Coprocess i lg
The e f f e c t o f c a t a l y s t t ype on the coprocessing o f heavy crudes and res idua w i th coal has been inves t i ga ted us ing a minera log ica l p y r i t e and a small p a r t i c l e s i z e NiMo on u-Al203. Both o f these c a t a l y s t s were used t o study t h e i r e f f e c t on upgrading res idua and on the product s l a t e from coprocessing. I n t h e r e s i d upgrading experiments, West Texas VSR was ?sed; i n the coprocessing reac t i ons bo th West Texas VSR and Maya TLR were used. compared among the thermal react ion, the reac t i on con ta in ing p y r i t e and t h e reac t i on w i t h small p a r t i c l e s i z e NiMo/A1203 ca ta l ys t . The o r i g i n a l s o l u b i l i t y d i s t r i b u t i o n obta ined p r i o r t o reac t i on i s g iven as a reference. Texas VSR, the thermal reac t i on produced gases and IOM, l o s t o i l , and increased s l i g h t l y the amount o f asphaltenes present. asphaltenes were v i r t u a l l y e l im ina ted from the residuum, producing p r i m a r i l y pentane so lub le o i l . I n con t ras t , the presence of a small p a r t i c l e s i z e NiMo/A120g c a t a l y s t d i d no t change t h e o i l f r a c t i o n but d i d reduce t h e asphaltene f r a c t i o n by 4 0 % producing gas, preasphaltenes and I O M i n almost equal amounts.
The ef fect of P y r i t e and NiMo/A1203 a d d i t i o n on t h e products obta ined from coprocessing are presented i n Table 5. West Texas VSR: (1) thermal r e a c t i o n (2) two react ions w i t h p y r i t e and (3) reac t i on us ing small p a r t i c l e s i z e NiMo/Al20g. The cond i t i ons f o r a l l t h e reac t i ons were the same; bo th p y r i t e and NiMo/Al203 were in t roduced a t the same gram l e v e l . The p y r i t e reac t i on produced the most coal conversion. 87.6%, compared t o 79.3% f o r t he NiMo/Al203 and 55.0% fo r t he thermal react ion. amount produced by the p y r i t e r e a c t i o n f e l l between t h a t obtained by t h e thermal reac t i on and by the commercial ca ta l ys t . Due t o the e f f e c t observed on the residuum alone, pretreatment o f the so l ven t w i t h p y r i t e and hydrogen p r i o r t o us ing as a coprocessing so lvent was thought t o be poss ib l y b e n e f i c i a l i n improving t h e e n t i r e product s la te. However, comparison of t h e product s l a t e us ing the hydrot reated West Texas VSR t o t h a t obtained us ing t h e o r i g i n a l showed l i t t l e improvement t h a t could be a t t r i b u t e d t o hydrotreatment. One poss ib le explanat ion f o r t h i s behavior i s t h a t the primary e f f e c t o f the p y r i t e i s i n the upgrading o f the residuum-asphaltenes t o pentane so lub les and t h a t t h e reac t i on producing pentane so lub les from coal i s no t s u b s t a n t i a l l y a f f e c t e d by t h e presence o f p y r i t e . Thus, the m a j o r i t y o f t h e pentane so lub les produced from the coprocessing reac t i on us ing the o r i g i n a l West Texas VSR was produced most probably from t h e residuum and not from coal. pretreatment case, most o f t he upgrading o f t he residuum had ccurred p r i o r t o t h e coprocessing reac t i on l eav ing l i t t l e m t e r i a l from the residuum f o r f u r t h e r upgrading. Consequently, l i t t l e change i n the product s l a t e was observed between the o r i g i n a l and hydrot reated ma te r ia l . When p y r i t e was used i n coprocessing experiments us ing Maya TLR, s i m i l a r r e s u l t s were obtained.
I n Table 4, upgrading react ions o f West Texas VSR are
Compared t o t h e o r i g i n a l West
When p y r i t e was added as a c a t a l y s t , the
Small amounts o f gases, preasphaltenes and I O M were a l s o produced.
Four d i f f e r e n t react ions a re compared w i t h
I n terms o f pentane so lub le o i l s , the
I n t h e hydrogen
4 5 3

S i n g l e Stage and Two Stage' Coprocessing Reactions
Two stage processing us ing sequent ia l and poss ib ly d i f f e r e n t ca ta l ys ts i n t h e f i r s t and second stages may produce a more favorab le product s l a t e from coprocessing as we l l as a more e f f i c i e n t use o f hydrogen. Two se ts o f experiments were performed t o i nves t i ga te the e f f e c t s o f two stage processing and sequent ia l c a t a l y t i c t reatment on coprocessing. One was a ser ies o f one hour reac t ions i n which p y r i t e , NiMo/A1203 and H2S were used i n d i v i d u a l l y as ca ta l ys ts and i n combination. r e s u l t s are given i n Table 6. I n t h e second se t two stage experiments were run f o r a t o t a l o f one hour bu t a f t e r t h e f i r s t ha l f hour the gases were vented, a new c a t a l y s t was added, and f r e s h hydrogen was charged. The c a t a l y s t charge a t t he end o f both reac t ions was 2 grams.
These
The s ing le stage one hour reac t ions showed s i m i l a r r e s u l t s t o t h a t observed prev ious ly . h ighes t coal conversion; however, t he conversions observed from She1 1 324 NiMo/Al203 were a lso both above 80%. The percent o i l p roduc t ion observed i s given below f o r t h e reac t ions c o n t a i n i n g the d i f f e r e n t c a t a l y s t
The coprocessing reac t i on us ing p y r i t e c a t a l y s t again produced the
NiMo/A1203 > P y r i t e + NiMo/AlzOj > P y r i t e > H2S > Thermal 1)
The small p a r t i c l e s i z e NiMo/A1203 i s by f a r t he most e f f e c t i v e c a t a l y s t i n producing pentane so lub le o i l .
To t e s t t he hypothesis t h a t H2S was the c a t a l y t i c agent ra the r FeS2 i n the reac t ions us ing t h e p y r i t e ca ta l ys t , CS2 which r e a d i l y reac ts w i t h H2 t o form H2S was added t o the reac t ion . The amount of CS2 added was equ iva len t t o t h a t needed t o produce the same amount of H2S as would be generated from FeS2. cond i t ions , the product s l a t e obtained d i d no t vary s i g n i f i c a n t l y from t h e thermal reac t ion . This r e s u l t suggests then t h a t t he important c a t a l y s t i n the reac t ions u s i n g p y r i t e i s t h e p y r i t e i t s e l f o r i t s reduced form, not t he evolved H ~ s .
t h e f i r s t stage and thermal f o r t h e second stage; p y r i t e i n both stages; then p y r i t e i n the f i r s t stage w i t h N i M o / A l m i n t h e second stage and NiMo/A1203 i n both stages. The h ighes t amount o f coal conversion achieved, 92.2%, occurred i n the experiments us ing p y r i t e i n bo th stages. The pyr i te lNiMolA1203 and NiMo/A1203/ NiMo/Al203 reac t ions a l s o produced h igh coal conversions, 85.9% and 84.1%. respec t ive ly . o rder as d i d the s i n g l e stage experiments. The reac t i on w i t h NiMo/Al203 i n both stages produced t h e most o i l w h i l e t h e combination o f p y r i te/NiMo/A1203 was second.
Under these
I n two stage processing, f ou r se ts o f experiments were performed: thermal f o r
The o i l p roduc t ion from t h e two stage coprocessing showed t h e same
Summary and Conclusions.
product d i s t r i b u t i o n , o i l p roduc t ion and coal conversion. The h ighes t coal conversion occurred a t a 50% coal concent ra t ion l eve l and maximal o i l p roduc t ion was achieved a t 30 t o 50% coal concentrat ion. When reacted i n a hydrogen atmosphere, t h e add i t i on o f hydrogen donor compounds t o the coprocessing so lvent d e f i n i t e l y in f luenced the products from coprocessing. A t equ iva len t donable hydrogen leve ls , DHP produced the h i g h e s t coal conversion and o i l production. A t and above the 0.55% donable hydrogen l e v e l , THQ was very e f f e c t i v e i n conver t ing coal bu t was de t r imenta l t o o i l product ion. heteroatoms appear t o be more e f f e c t i v e i n producing oil than t h e n i t rogen conta in ing hydroaromatics.
In coprocessing, t h e so lvent t o coal r a t i o has a d e f i n i t e i n f l uence on t h e
I n general, t he hydrogen donor compounds w i thout
454

1
t
I
The c a t a l y s t t ype i s impor tant i n coprocessing s ince d i f f e r e n t c a t a l y s t s i n f l u e n c e d i f f e r e n t react ions i n t h e two mater ia ls . P y r i t e a f f e c t e d t h e upgrading o f t he res id ium by promoting the conversion o f petroleum asphaltenes i n t o o i l . I n coprocessing, the notable e f f e c t o f p y r i t e was the reduct ion o f t h e I O M l e v e l s and consequent increase i n coal conversion. Compared t o the thermal react ion, p y r i t e was e f f e c t i v e i n i nc reas ing the o i l product ion i n coprocessing. The small p a r t i c l e s i z e NiMo/Al203 ca ta l ys t , however, was s t i l l more e f f e c t i v e i n hydrogenating the d i s s o l v i n g coal m a t r i x and producing pentane so lub le o i l . I n two s tage processing, t h e combination o f p y r i t e i n the f i r s t s tage and NiMo/A1203 i n the second produced a much improved product s l a t e compared t o thermal processing. The h ighes t o i l product ion and coal conversion were, however, s t i l l achieved by us ing N i M o / A l & j i n bo th stages.
1.
2. 3.
4.
5.
6.
7.
8. 9.
10.
11. 12. 13.
References
Cur t is , C. W., Pass, M. C. and Guin, J. A., submitted t o I & EC Process Design and Devel opment, 1984. Yan, T. Y. and Espenschied, W. F.. Fuel Processing Technology, 1, 121, 1983. Shinn, J. H., Dahlberg, A. J., Kuehler, C. W., and Rosenthal, J. W.. "The Chevron Co-Refining Process", present%d a t t h e E P R I Coal L ique fac t i on Contractor 's Meeting, May 1984. Moschopedis, S. E., Hawkins, R. W., Fryer, J. F. and Speight, J. G., m, 2, 647. 1980- - - , ~ ~ - - Cur t is , C. W., Tsai. K. J. and Guin. J. A,, I & EC Process Design and Develo ment, i n press, 1985. + er, Ronald L., "Exploratory Studies i n Co-Processing", E P R I Coal L ique fac t i on Contractor 's Conference, May 1984. Cur t is , C. W., Guin, James A,, Tarrer, Ray and Huang, Wan-Jiao, Fuel Process. Technolow. 1983, 1, 277-291. Neavel, R. C. Ph i l . Trans. R. SOC. Lond., 1981, A300, 141. Brooks, 0. G., Guin, J . A., Cur t is , C. W. and Placek, T. 0.. Ind. Eng. Chem. Proc. Des. Dev. 1983, 2. 343. Curran, G. P., Struck, R. T. and Gorin, E. Ind. Eng. Chem. Proc. Des. Dev., 1967. 6. 166.
I _. ~ - ~.
Neavel, R. C., g, 1976, 55, 234. Cur t is , C. W., Guin. J. A., Kwon, K. C., x, 1984, 63, 1404. Cronauer, 0. ;. H e t e r o f u n c t i o n a l i t y I n t e r a c t i o n w i t h Donor Solvent Coal L iquefact ion, Foss i l Energy F i n a l Report f o r DOEIPC150782-Tl(DE840132-83).
Table 1 Analys is o f Petroleum Solvents
S t a r t i n g Ma te r ia l s O i l Asphaltenes C H N S 0 Ash by
d i f f e r e n c e
I l l i n o i s #6 Coal 68.4 4.4 1.4 3.2 12.0 10.6 Maya TLR 79.5 20.5 85.3 10.8 0.51 4.19 0.082 West Texas VSR 86.2 13.8 86.1 10.4 0.44 3.33 0.012
455

Table 2
Gravi ty, Carbon
West Texas VSR 324.8 7.9 1.015 16.4 Product from 0.363 13.39 0.9766 13.49
6OoC
1 O : l West Texas VSR t o Coal Coprocessi ng Reaction
West Texas VSR t o Coal Coprocessing React ion
Texas VSR
Product from 2: l 22.1 7.1 1.021 17.78
Hydrotreated West 1.07 15.9 0.96 9.34
Table 3
H2 N2 H2 N2
Maya TLR 11.8 -11.6 60.0 24.1 0.15% Oonable Hydrogen Added
T e t r a l i n 11.2 - 9.2 58.9 19.6 THQ 6.7 -12.3 58.0 23.2
0.55% Oonable Hydrogen Added Tet ra l i n 10.5 0.7 58.8 39.3 THQ 2.5 -11.4 75.4 52.7 9.10-DHP 17.5 4.6 81.0 58.8
Tet ra l i n 25.0 15.9 81.0 62.1 THQ 4.0 -30.7 90.4 89.0
1.5% Donabl e Hydrogen Added
Table 4 r d i n q o f Wes-
Cata lys t Coal
West Texas West Texas West Texas West Texas
NA None P y r i t e N i Mo/A12O3 NA None None None
VSR Or i s ina l VSR VSR VSR
Gas 0.0 3.5 1.9 3.9 O i 1 86.2 79.1 95.3 86.6 Asphal tenes 13.8 15.0 0.6 3.1 Preasphal tenes 0.0 0.1 1.2 2.8 I OM 0.0 2.3 1 .o 3.6
H2 Consumption, % NA* 4.9 15.4 31.9
^NA: not a p p l i c a b l e React ion Time: 30 minutes
45 6

Table 5 E f f e c t o f C a t a l y s t on t h e Coprocessing Reactions
s West Texas West Texas West Texas West Texas
VSK Or ig ina l VSR VSR VSR Cata lys t None P y r i t e P y r i t e NiMo/Al203
Gas O i 1 Asphal tenes Preasphal tenes I OM
4.2 3.3 3.0 4.3 58.6 67.1 68.3 72.9 15.2 19.6 16.6 13.4
8.2 6.2 6.6 3.0 13.8 3.8 5.5 6.4
Coal Conversion, % 55.5 87.6 82.3 79.3 H2 Consumption, % 24.2 37 -9 30.0 52.9 O i l Production, % -2.1 18.8 2.25 33.1
*The so lvent was hydro t rea ted i n t h e presence o f p y r i t e . P
Ma a TLR Maya TLR Maya TLR Nifio/Al203
Cata lys t None P y r i t e NiMo/Al203
Gas O i 1 Asphal tenes Preasphal tenes I OM
4.3 60.1 14.7 8.5
12.4
3.3 64.6 19.1
7.1 5.9
4.7 69.7 16.4
2.2 7.1
Coal Conversion, % 60.0 81.0 77.0 H2 Consumption, % 18.9 40.1 55.6 O i l Production, % 11.7 21.5 32.9
Table 6 S ing le Stage Coprocessing Using West Texas VSR
P
s 3 Cata lys t P y r i t e & cs2 N i Mo/A1203
Coal Conversion, % 58.2 57.4 89.2 85.0 83.7 Hydrogen Consumption, % 30.4 33.3 57.1 72.5 66.5 O i l Production, % -8.3 -6.9 23.9 54.3 39.3
Two Stage Coprocessing Using West Texas VSK
F i r s t Stage Cata lys t None P y r i t e P y r i t e NiMo/Al203 Second Stage None P y r i t e NiMo/Al2Og NiMo/Al203 Coal Conversion, % 64.3 92.2 85.9 84.1 Hydrogen Consumption. % 14.5 27.5 35.6 41.1 O i l Production, % -0.4 26.8 43.0 58.5
45 7

-J
0 0
LL
I LL 0 z 0 v)
W > z 0 0
a
a
- a
s
0.0 0.0
1
2 0 4 0 6 0 80 IO0
Wt% COAL
Figure 2. Hydrogen Consumption as a Function o f Coal Concentration

i
5 0
40
z 0 I- I> a 0 U R
- O 30
-f 2o
8
- 0
10
0.0 0
I I I I
I I
I I I
2 0 4 0 - 6 0 8 0
Wt% COAL 0
Figure 3. Oil Production as a Function of Coal Concentration
459

EIGH-PRESSURE CATALYTIC EYDROPROCESSING OF A
SIMOLATED COAL LIQUID
M. J. Girgis , B. C. Gates Center f o r C a t a l y t i c Science and Technology, Department of Chenical Engineering
Univers i ty of Delaware, Newark. Delaware 19716 and
L. P e t r a k i s Gulf Research and Development Company. P i t t sburgh , Pennsylvania 15320
I K R O D U C I ' I O N
The c a t a l y t i c hydroprocessing of coa l -der ived 1 i q u i d s i s p o o r l y u n d e r s t o o d b e c a u s e of t h e c o m p l e x i t y of t h e l i q u i d s and t h e l a r g e number of compet ing reac t ions . The g o a l of t h i s r e s e a r c h was t o c h a r a c t e r i z e q u a n t i t a t i v e l y t h e hydroprocess ing o f a l i q u i d mixture modelling a coa l l i q u i d der ived from Powhatan No. 5 coal i n t h e SRC-I1 p r o c e s s . A s p e c i f i c g o a l v a s t o d e t e r m i n e r e l a t i v e r e a c t i v i t i e s of r e p r e s e n t a t i v e r e a c t a n t s and determine t h e competitive i n h i b i t i o n e f f e c t s of t h e v a r i o u s reac tan ts . The experiments were c a r r i e d out with a m i x t u r e of a t most n i n e compounds r e p r e s e n t i n g t h e major funct ional groups i n t h e coal l iqu id . The r e a c t a n t s included p o l y n u c l e a r a r o m a t i c hydrocarbons , s u l f u r - and o x y g e n - c o n t a i n i n g h e t e r o c y c l i c s . 1 -naphthol , and b a s i c a s w e l l a s n o n b a s i c organonitrogen compounds.
There i s no o n e t y p i c a l coal l iqu id because t h e compounds and t h e i r r e l a t i v e amounts vary with t h e source of t h e coa l and with t h e type and o p e r a t i n g s e v e r i t y o f t h e c o a l l i q u e f a c t i o n p r o c e s s . I n t h i s study, t h e choice of model compounds and t h e i r r e l a t i v e amounts were based on a d e t a i l e d a n a l y s i s of t h e SRC-I1 heavy d i s t i l l a t e ( 1 . 2 ) . The c o n c e n t r a t i o n s o f compounds containing heteroatoms were chosen t o give the same concentrat ions of f u n c t i o n a l groups p r e s e n t i n t h e SRC I1 heavy d i s t i l l a t e ; t h e concent ra t ions of aromatic hydrocarbons were chosen t o g ive a molar r a t i o of 3:2:1 of fused 2-ring, 3-r ing, and &r ing aromatic compounds.
EXPERIHENTAL
Apparatus and Procedure
The experiments were c a r r i e d out wi th a fixed-bed flow microreactor (3) . The feed was prepared by dieeclving the r e a ~ t m : co-pounds ir. cyclohexane t o g i v e a s o l u t i o n w i t h a t o t a l s o l u t e mass f r a c t i o n of 0.0025. Approximately 800 m l of so lu t ion was added t o e i t h e r of two lOOO-ml high-pressure autoclaves equipped w i t h s t i r r e r s . The feed and t h e vapor space above it were purged with hydrogen f o r two h o u r s s t room t e m p e r a t u r e w i t h a hydrogen f l o w r a t e o f 50 m l / m i n . Carbon d i s u l f i d e d i s s o l v e d in another 1 0 ml of feed was then quickly added t o g i v e 0.001 mass f r a c t i o n of carbon d i s u l f i d e i n t h e feed. [The carbon d i s u l f i d e s e r v e d a s a s o u r c e o f hydrogen s u l f i d e v i a t h e r e a c t i o n CSp + 482-282s + CH4, which o c c u r s r a p i d l y u n d e r t h e r e a c t i o n condi t ions (4); t h e CS2 maintained t h e c a t a l y s t in t h e su l f ided s t a t e . ] The autoclave was pressured up t o 137.1 atm with hydrogen a t room tenpera ture , and t h e feed was sa tura ted wi th hydrogen. This resu l ted i n a hydrogen mole f r a c t i o n of approximately 0.05 i n t h e feed ( 5 ) or a 50:l hydrogen t o r e a c t a n t mole r a t i o , which p r e v e n t e d t h e hydrogen mole f r a c t i o n from varying s i g n i f i c a n t l y over t h e length of t h e reac tor .
The s a t u r a t i o n of t h e f e e d wi th hydrogen p r i o r t o i t s in t roduct ion i n t o the reac tor ensured t h a t only two phases were p r e s e n t i n t h e r e a c t o r , which al lowed
460

i,
d e t e r m i n a t i o n of reac t ion k i n e t i c s i n t h e absence of mixing e f f e c t s o r s i g n i f i c a n t r a d i a l gradients i n concentrat ion o r temperature. Because t h e r e a c t o r was h e l d a t a h i g h e r t e m p e r a t u r e and p r e s s u r e t h a n t h e au toc lave , no degassing of t h e feed occurred, as confirmed by thermodynamic ca lcu la t ions .
The r e a c t o r c o n s i s t e d of a v e r t i c a l 316 s t a i n l e s s s t e e l tube 25.4 cm long wi th an i n t e r n a l diameter of 0.95 cm. The bot tom11 em of t h e r e a c t o r were packed w i t h 90-mesh alundum, t h e n e x t 3 cm were packed wi th 0.050 g of c a t a l y s t mixed wi th alundum, and t h e remainder of t h e tube was packed wi th alundum. A d e t a i l e d descr ip t ion of t h e reac tor i s given elsewhere ( 3 ) .
The c a t a l y s t was s u l f i d e d by passing a mixture of 10% E2S i n E2 through t h e c a t a l y s t bed a t 30 cu?/min f o r two hours a t 400OC. The reac tor was then cooled t o t h e r e a c t i o n t e m p e r a t u r e ( u s u a l l y 35OOC) under B2S/B2 and then brought t o t h e reac t ion pressure of 171 a t m . The feed w a s pumped through t h e r e a c t o r by a Waters M-6000A l i q u i d chromatography pump. Liquid samples could be taken from e i t h e r a sampling va lve o r a dead volume cyl inder , both of which were located downstream o f t h e r e a c t o r . F o r each run , t h e r e a c t o r was o p e r a t e d u n t i l s t e a d y - s t a t e w a s reached (usual ly 24-30 h) ; only da ta from steady-state samples are reported.
The a n a l y s e s of t h e l i q u i d samples were performed w i t h a T r a c o r 560 gas chromatograph (GC) equipped wi th a 30-m DE-5 bonded phase c a p i l l a r y column. The GC c o n t a i n e d an o u t l e t s p l i t t e r which permitted t h e column ef f luent t o h e divided i n t o two streams, one going t o a flame ioniza t ion d e t e c t o r (FID) and t h e o t h e r t o a B a l l e l e c t r o l y t i c c o n d u c t i v i t y d e t e c t o r . The l a t t e r was used t o i d e n t i f y nitrogen-containing compounds and t h e f o r m e r was used f o r q u a n t i t a t i v e p r o d u c t a n a l y s i s using =-decane as an i n t e r n a l standard. FID response f a c t o r s r e l a t i v e t o - n-decane were de te rmined f o r a l l t h e r e a c t a n t s . Some of t h e samples were a l s o analyzed by gas chromatography-mass spectrometry.
Mater ia ls
T h e c a t a l y s t u s e d i n t h i s w o r k w a s A m e r i c a n Cyanamid BDS-SA, a NiO-MoO3/Y-A1203 c a t a l y s t , t h e p r o p e r t i e s of which are l i s t e d i n Table 11. P r i o r t o use, t h e c a t a l y s t w a s ground from 1/16" e x t r u d a t e s t o 80-100 mesh p a r t i c l e s . The alundum used t o pack t h e r e a c t o r was Alundum RR ( F i s h e r S c i e n t i f i c , Blue Label). A l l chemicals l i s t e d i n Table I as wel l as t h e cyc lohexane s o l v e n t were o b t a i n e d f rom A l d r i c h Chemical Company and used as r e c e i v e d . n-Decane w a s o b t a i n e d from Eastman Chemical Co. Eigh-pressure hydrogen (3500 psig? and t h e 10% 82s i n E2 were obtained from Linde and Matheson, respec t ive ly .
RESULTS AND DISCUSSION
The f i r s t s e r i e s of experiments was conducted with t h e s imula ted c o a l l i q u i d These experiments had t h e following objec t ives :
a) To d e t e r m i n e t h e r e a c t i v i t i e s of t h e var ious reac tan ts i n a mixture a t d i f f e r e n t t e m p e r a t u r e s and weight h o u r l y s p a c e v e l o c i t i e s (WBSV) .
b) To i d e n t i f y a s many reac t ion products as possible . c) To e s t a b l i s h t h e l i m i t a t i o n s of t h e chromatographic ana lyses of t h e
products (e .&, determine which peaks could not be r e s o l v e d ) . Product chromatograms were expec ted t o be complex, w i t h o v e r l a p p i n g peaks.
kper iments were c a r r i e d out a t each of t h e c o n d i t i o n s shown i n T a b l e 111. I n T a b l e I V . t h e reac t ion products i d e n t i f i e d a r e l i s t e d w i t h t h e methods used t o i d e n t i f y them (mass spectrometry and c o - i n j e c t i o n w i t h a p u r e compound i n t o t h e chromatograph) . Some problems were encountered i n resolving important peaks i n t h e product chromatograms. The major r e s o l u t i o n d i f f i c u l t y o c c u r r e d w i t h d i b e n z o t h i o p h e n e ; a peak of comparable s i z e w a s merged wi th it on i t s down slope, and a small peak from a n i t r o g e n - c o n t a i n i n g compound appeared on i t s up s l o p e . The s m a l l peak o n t h e u p s l o p e was not resolvable from t h e dibenzothiophene peak on t h e FID t r a c e (we d e t e c t e d it w i t h t h e B a l l d e t e c t o r ) ; a s a r e s u l t , t h e c a l c u l a t e d d i b e n z o t h i o p h e n e mas f r a c t i o n was g r e a t e r i n product samples than i n
designated i n Table I.
461

t h e f e e d . T h e r e f o r e , t h e o n l y way t o d e t e r m i n e d i b e n z o t h i o p h e n e h y d r o d e s u l f u r i z a t i o n (HDS) was t o sum t h e m a s s f r a c t i o n s of b i p h e n y l a n d cyc lohexylhenzene i n t h e product and d i v i d e by t h e f e e d dibenzothiophene mass f rac t ion . A s i m i l a r d i f f i c u l t y occurred with phenanthrene, a s t h e H a l l d e t e c t o r i n d i c a t e d a n i t r o g e n - c o n t a i n i n g peak a t approximate ly t h e r e t e n t i o n t ime of phenanthrene, whereas t h e FID t r a c e showed o n l y o n e l a r g e peak. S i n c e t h e H a l l d e t e c t o r was used o n l y f o r q u a l i t a t i v e ana lys i s . it was not poss ib le t o subtract the contr ibut ions of the nitrogen-containing compounds. Hence, we expect t h a t t h e a c t ual phenanthrene c o n v e r s i o n was somewhat h igher than t h e ca lcu la ted r e s u l t s . The addi t iona l a n a l y t i c a l problem occurred w i t h a c r i d i n e . Of t h e approximate ly s i x o r g a n o n i t r o g e n compound peaks expected a s acr id ine products, only one, t h a t f o r 1 , 2 , 3 , 4 , 5 , 6 , 7 , 8-oct a h y d r o a c r i d i n e , was i d e n t i f i e d ; no h y d r o c a r b o n hydrodenitrogenation (EN) products were ident i f ied .
Table V i s a summary- of t h e results f o r rum at constant tenpera ture (35PC) and v a r y i n g WHSV w i t h t h e s i m u l a t e d c o a l l i q u i d d e s i g n a t e d i n T a b l e I. The c o n v e r s i o n s of t h e b a s i c n i t r o g e n compounds, quinol ine and acr id ine , were higher than t h a t of indole , t h e mu-basic ni t rogen compound. However, t h e f r a c t i o n HDN o f q u i n o l i n e ( d e f i n e d a s t h e moles of t h e q u i n o l i n e and n i t r o g e n - c o n t a i n i n g quinol ine d e r i v a t i v e s i n t h e product d i v i d e d by t h e moles of q u i n o l i n e i n t h e f e e d ) was considerably l e s s than t h e quinol ine conversion. It was not possible t o o b t a i n a r e l i a b l e v a l u e f o r a c r i d i n e HDN.
F i g u r e 1 i s a pseudo f i r s t o rder k i n e t i c s p l o t f o r quinol ine and indole EDN ( i . e . , a p lo t of t h e f r a c t i o n of non-dehydroni t rogenated compounds v s . i n v e r s e s p a c e v e l o c i t y ) . Q u i n o l i n e HDN fo l lowed pseudo f i r s t o r d e r k ine t ics . whereas i n d o l e HDN d i d not.
The c o n v e r s i o n o f dibenzofman was t o o low t o be measured r e l i a b l y ; t h i s was t h e l e a s t r e a c t i v e of t h e r e a c t a n t s . I n c o n t r a s t , t h e c o n v e r s i o n o f 5 ,6 ,7 ,E+tetrahydro-l-naphthol was always g r e a t e r than 8ox. No oxygen-containing products of 5,6,7,8-tetrahydro-l-naphthol were found; it i s i n f e r r e d t h a t t h e 5 .6 .7 .6- te t rahydro-1-naphthol c o n v e r s i o n i s i d e n t i c a l t o i s hydrodeoxygenation
Dibemothiophene was converted appreciably only a t t h e lowest space ve loc i ty ; biphenyl and cyclohexylbenzene were de tec ted a s HDS products.
The c o n v e r s i o n s of phenanthrene, f luoranthene, and pyrene were, i n order of decreasing r e a c t i v i t y : f luoranthene > pyrene > phenanthrene. As a consequence of t h e n i t r o g e n compound peak t h a t w a s merged with t h a t of phenanthrene, t h e ac tua l phenanthrene conversion i s i n f e r r e d t o have been h i g h e r t h a n t h a t shown i n Table V. The pseudo f i r s t o r d e r k i n e t i c s p l o t s f o r t h e s e t h r e e hydrocarbons suggest tha t the hydrogenation r e a c t i o n s were r e v e r s i b l e , as expected.
Table V I i s a summary of r u n s made a t constant space v e l o c i t y but wi th the t e m p e r a t u r e v a r i e d from 300 t o 40WC with t h e simulated coal l iqu id designated i n T a b l e I. A s h a r p i n c r e a s e i n q u i n o l i n e HDN was observed from 3 0 0 t o 350OC. y v ~ ~ ~ S A , ~ u r q u i u o i i n e BDN h a r d l y changed from 350 t o 400OC; t h e product q u i n o l i n e mass f r a c t i o n observed i n t h e run a t 40WC was approximately f i v e times t h a t o b s e r v e d a t 3500'2, which i s c o n s i s t e n t w i t h e a r l i e r o b s e r v a t i o n s t h a t qu inol ine hydrogenations a r e r e v e r s i b l e (6).
The HDN t r e n d w i t h i n d o l e was r a t h e r d i f f e r e n t : t h e l a r g e change inHDN o c c u r r e d from 350 t o 4000C. whereas t h e HDN was p r a c t i c a l l y unchanged from 300 t o 350°C; i n s p e c t i o n o f t h e i n d o l e mass f r a c t i o n i n these runs (Table VI) revea ls t h a t t h e i n d o l e c o n v e r s i o n p a r a l l e l e d t h a t o f t h e H D N , s u g g e s t i n g t h a t ni t rogen-containing in te rmedia tes of indole were more r e a c t i v e than indole i t s e l f .
The r e a c t i v i t i e s of the two oxygen compounds were a t ex t remes : d i b e n z o f u r a n c o n v e r s i o n was low. e v e n a t t h e h i g h e s t t e m p e r a t u r e , w h i l e t h e ED0 of 5 , 6 , ? . 8- te t rahydro-naphthol was complete a t 35WC. As f o r dibenzothiophene, t h e EDS i n c r e a s e d w i t h t e m p e r a t u r e , w i t h t h e l a r g e s t change occurr ing from 350 t o 4000 C.
P h e n a n t h r e n e c o n v e r s i o n a l s o i n c r e a s e d w i t h t e m p e r a t u r e . However, f l u o r a n t u n e and p y r e n e gave a d i f f e r e n t r e s u l t : i n e a c h c a s e c o n v e r s i o n
@DO) .
P^..r--..- L L -
462

i n c r e a s e d from 300 t o 350OC but decreased s i g n i f i c a n t l y from 350 t o 400°C. The decrease i n conversion suggests tha t pyrene and f l u o r a n t h e n e h y d r o g e n a t i o n s a r e rapid but l imi ted s t rongly by e q u i l i b r i m a t t h e highest temperature.
From the d a t a presented i n Tables V and V I it i s evident t h a t t h e c o n v e r s i o n s of d ibenzoth iophene . d ibenzof uran. and t h e a r o m s t i c hydrocarbons were a l l low cmpared with those of t h e o t h e r cmpounds. I n addi t ion , organonitrogen compounds and w a t e r (one of t h e p r o d u c t s of 5,6,7,&tetrahydro-l-naphthol HDO) a r e known i n h i b i t o r s (7 , 8). These f i n d i n g s m o t i v s t e d t h e next s e t o f e x p e r i m e n t s u s i n g a n o t h e r s i m u l a t e d coal l iquid,Table V I I . This simulated coal l iqu id conta ins t h e same mass f r a c t i o n s of dibenzofuran, dibenzothiophene, and t h e t h r e e a r o m a t i c s a s t h e o n e d e s i g n a t e d i n T a b l e I, w i t h t h e n i t r o g e n c o m p o u n d s a n d 5,6,7,6-tetrahydro-l-naphthol removed.
Exper iments were c a r r i e d o u t a t 35OOC and a t WHSV with t h e simulated c o d l iqu id designated i n Table V I I , and t h e r e s u l t s a r e summarized i n Table V I I I . The r e s u l t s of F i g u r e 2 s u g g e s t t h a t t h e hydrogenat ions of f l w r a n t h e n e and pyrene were r e v e r s i b l e ; phenanthrene appeared t o f o l l o w pseudo f i r s t o r d e r k i n e t i c s . Dibenzof uran convers ion was again very low, suggesting t h a t i t s low r e a c t i v i t y - r e f e r r e d t o above-was not t h e r e s u l t of i n h i b i t i o n by organonitrogen compounds
and/or water . On t h e o t h e r hand, d i b e n z o t h i o p h e n e HDS was markedly g r e a t e r i n t h i s coal l i q u i d cmpared with the one d e s i g n s t e d i n Table I. It i s e s p e c i a l l y i n s t r u c t i v e t o compare t h e r e s u l t s from Run 6 (Table VII I ) with those from Bun 1 (Table VI) a s both runs s e r e made with t h e same c a t a l y s t Loading, f e e d f l o w r a t e . and t h e same mass f r a c t i o n s of d ibenzof uran , d i b e n z o t h i o p h e n e , phenanthrene. f l w r a n t h e n e , and pyrene. The i n h i b i t i o n e f f e c t of t h e organoni t rogen i n h i b i t o r s a n d l o r t h e 5 , 6 , 7 , E-tetrahydro-1-naphthol was s t rong f o r sll t h e r e a c t a n t s except dibenzof uran.
A d d i t i o n a l exper iments a r e p lanned where 5 , 6 , 7 , &tetrahydro-1-naphthol , indole , and quinol ine w i l l be s u b s e q u e n t l y added t o t h e s i m u l a t e d c o a l l i q u i d s p e c i f i e d i n T a b l e V I I ; t h e s e should g ive addi t iona l information concerning t h e cause of t h e i n h i b i t i o n i n t h e runs with the simulated coal l i q u i d g i v e n i n T a b l e I.
A(XNCWLEDGMINTS
The experimental ass i s tance of S. K. Star ry and S. A. Wikoff i s g r a t e f u l l y acknowledged. This work was supported by DOE.
1.
2.
3. 4.
5.
6.
7.
8.
REFERW (ZS
Petrakis . L.. D. C. Young, R. G. Ruberto, and B. C. G a t e s , Ind. E r g . Qem. Process Des. Dev. 1 9 8 , 22, 298.
Gates, B. C.. J. H. Olson, G. C. A. S c h u i t , A. B. S t i l e s , and L. Petrakis . ' lCinetics.and Mechanism of Q t a l y t i c Eydroprocess ing of Component 8 o f Coal-der ived L i q u i d s . " U n i t e d S t a t e s Department of Energy Report No.
E l i e z e r , K. F. e t a l . , I n d . Eng. Chem. Fundam.. 1 9 7 7 . 16, 380. Sapre, A. V . , Ph.D. d i s s e r t a t i o n , U n i v e r s i t y of Delaware, Newark, Delaware,
Berty, T. E.. H. H. Reamer, and B. H . Sage, J. Chem. Eng. D a t a , 1966, 11
S a t t e r f i e l d , C. N. and S. 8. Yang. Ind. Eng. men. Process Des. Dev., 1984,
Bhinde, M. V., Ph.D. d i s s e r t a t i o n , U n i v e r s i t y o f D e l a w a r e , N e w a r k .
L i p s c h , J. M. J. G . and S c h u i t , G. C. A. . J. Cata l . , 1969, 1 5 , 174.
DE-AC22-79ET14880-17, J a n W V 17, 1984.
1981.
( 1 ) . 25.
23, 11.
Delaware, l m 9 .
463

TABLE I
SIUULATED a N LXOUID
Ou i nollnm
Acridinm
Xndolm
Dlbmnzothiophanr
Dibmazof urrn
S.6.7.8-tmtra- hydro-1-nmphthol
Fluormthrnm
Phmnanthrmnm
Pyrane
k m i c litrogmn
Nonbmic Nitrogmn
(HI
Sulfur Ilrtmrocyclic
Naphthol
F u d thrn-ring Ar0.a t 1 C
PUB& four-ring Aro8atic
STRUCTURE CORPOUYD RELATIVE CLASS HOLE
0.0265
0.0261
0.0384
0.0347
0.0639
0.1133
0.3489
0.2320
0.1163
T l U E I1
PROPERTIES OF ARERICAII C T N A R I D l 8DS-91 CATALTST
110
-3
h 2 0
9.1
m . 3
0.-
0.-
464

s#&z.m h i n o l i n e
I B d O l C
3 ax. 4.14
4 IQ) 1.03
5 ar, 1.10
D i i b . l w t h w p b a
465

TABLE V
N m I I A R T OF RESULT5 O D T A I D W AT T - M C ADD VARIABLE W S V
C E O : SINULATED COAL L I O U I D DESIGIATED I D TABLE I
mu1 e 1 2 3
y ~ u v , cg of rr.et..nt.)/cg of eat h> 0.99 2.17 4.14
PERCEDTAGE W l l V E R S I O W
O V I ~ O L I D E s7.9 90.7 84.2 1-E s . 4 29.9 t2.9 5,6,7.~-mRAWTDRO-I-lAPHTHOL 100 U.4 82.5 DI-I 4.1 7.5 0.0 n x a m x o m m 15.4 0.0 0.0 ._._ PREDADTHRENE 9.9 9.3 7.3 ACRIDIDE 72.3 91.9 92.2 FLOORADTHEIE a1.7 24.9 27.1 PTREDE 20.3 16.6 16.8
W I N O L I D E PEPCENTAGE IID* I I M L E PERCEITAGE BM
59.6 33.0 15.7 27.8 19.7 13.5
TABLE V I
N I I A R T OF RESULT¶ O B T A I I E D AT WSv-1 ADD VARIOUS TmtPERAT'JREs
CEEO: S I I U L A T E D COAL L I O U I D DESIGDAThD I N TABLE I
R U I # 5 1
YRSV, (g of ruet .nt .> l lg af eat h> 1.1 0.99 1.03 TEMPERATURE. C 350 400
PERCEIITAGE C O N R S I O I
001 I O L I I E %.a 97.9 an.4 I X W S a1 .o 46.4 70.5 5 . 6 . 7 . B - T E T R I H ~ O - l - D A P ~ O L %.a 100 99.9 DIBUZOFURAY 0.9 . t ., D I B U r Z M W I O P H E l l E 0.0 PBBlA*THREIE 3.9 ACRIDINE a7.7 FLUORANTHENE PTREDE
ac;4 12.0
_.- 15.4 9.9 72.3 41.7 20.3
1.-
75.9
75.9 16.2 13.6
i3.n
4.2 59.6 54.3 27 .5 27.0 5S.0
-466

TADLE VI11
9UU.llkR.l OF RESULTS 08TnlLED WITH THE SIMULATED cou. UOUID DESIGNATED IN T n s u YII
DI8ENZOFURkII DIBENZOTHIOPHElE VELIAUTIIREUE FLOORAITHEIE PTREIE
2.8 ao.7 33.1 65.6 77.7
2.7 10.3 18.0 US.6 27.6
t
i I
467

A LABORATORY STUDY OF AGGLOMERATION IN COAL GASIFICATION
C. R. Hsieh and P. T. Roberts
Chevron Research Company, Richmond, California 94802-0627
INTRODUCTION
The agglomerating tendencies of coal during gasification, especially during various stages of reaction, is a complex reaction.
Several investigators have studied the behavior of carbon- free ash. Stallmann and Neavel (1) found that the agglomerates of fused ash appear to form at temperatures below the initial defotma- tion temperature, as defined by the ASTM fusibility test (2). Huffman, et al. ( 3 ) observed that significant particle melting of the ashes occurred at temperatures as much as 200-400°C below the ASTM initial deformation temperature. They also noted that melting was greatly accelerated under reducing conditions. Rehmat and Saxena (4) argued that it is not necessary for every reacting par- ticle to attain the ash fusion temperature in order for agglomeration to occur. Only a few particles are required to reach the ash melting temperature. These particles form the nuclei for the formation of the ash agglomerates, and this process will indeed consume the ash produced from other particles.
that the defluidizing tendency or the stickiness of the particles is directly proportional to the area of contact, the adhesive property of the particles, and inversely proportional to their momentum. Mason and Pate1 ( 6 ) felt that agglomeration depends on fluidized bed temperature, bed ash concentration, average particle size, super- ficial velocity, and bed height. Goldberger (7) and Siege11 (8) both found that the ash softening temperature had no efeect on the defluidization characterization for ash samples in their experi- ments. Basu ( 9 ) concluded that defluidization of a fluid bed is governed by the sintering characteristics of the bed material.
In some gasification processes, however, the carbon is only partially gasified in a reducing atmosphere and the remaining carbon is oxidized in a separate combustion zone (10). In addition, an inert Solid is piesent which serves as a heat carrier and a diluent for the coal. The agglomerating tendomies of coal in such a process are different from the behavior of carbon-free ash.
char, and ash during various stages of reaction. This included a range of temperatures, under reducing and oxidizing conditions, and in a mixture with an inert solid.
In a fluidized bed, Langston and Stephens (5) recognized
In this paper, we have evaluated the agglomeration of coai,
EXPERIMENTAL
Sample Preparation - Table I shows the proximate and the ultimate analyses of the three subject coals. Table I1 summarizes the mineral analyses of the ashes which were generated by heating the
468

coa l s i n a i r t o 538-649OC and s c r e e n i n g a l l s a m p l e s t o p a s s b e t w e e n 100-mesh and 200-mesh U . S . s t a n d a r d s c r e e n . was 16-30 mesh.
TABLE I
COAL ANALYSIS
N o r t h D a k o t a L i g n i t e
P r o x i m a t e A n a l y s i s , % M o i s t u r e 1 2 . 3 Vola t i 1 e 34 .5 F i x e d C a r b o n 44.2 Ash 9 . 1
U l t i m a t e A n a l y s i s , % " 2 0 C H N S 0 Ash
1 2 . 3 6 0 . 2
4.2 0.9 1 .0
1 2 . 3 9 . 1
TABLE I1
% of Ash
S i 0 2
T i 0 2 2'3
Fe203 C a O MgO K20
so3
Na 2 0
'2'5 S r O B a O
Mn3O4
When s a n d w a s u s e d , i t
W e s t e r n Subb i t umi n o u s NO. 1 NO. 2 --
11 .3 8 . 0 31.3 1 3 . 0 40.2 60.0 1 7 . 2 19 .0
11.3 8.0 54.8 64.9
4 .1 2.0 1.1 0 .9 0 .8 2.6
10 .8 2.5 17.2 1 9 . 0
MINERAL ANALYSIS O F ASH
w e s t e r n N o r t h Dakota
L i q n i t e
3 9 . 8 1 6 . 4
0.8
8.1 1 3 . 0
3.9 0 . 2 0 .8
1 5 . 9 0.5 0.4 0 . 1 0 . 2
469
S u b b i t u m i n o u s No. 1 N o . 2 --
59.3 23.8 25 .7 9 . 2
0.9 0.5
5.2 1 4 . 3 2 .7 14 .2 1 . 0 4.5 0 .8 0.5 1.9 5.9
2.2 26.6 0.2 0 . 2 0.0 0 .1 0.1 0 . 3 0 .0 0.1

Equipment and Procedures - Figure 1 shows the experimental setup employed. In a typical experiment, the furnace was purged with nitrogen and preheated to 538OC before a 0.5-9 sample of material was placed in a ceramic boat and positioned in the center of the fur- nace. The sample was heated to the desired temperature in nitrogen before either a reducing or an oxidizing gas was passed over the sample for a predetermined time. The gas flow velocity was approxi- mately 0.8 cm/sec. After each experiment, the sample was allowed to cool outside the furnace and seived to determine the extent of agglomeration. The extent of agglomeration is defined as the weight percent retained on a mechanically vibrated 100-mesh screen.
The oxidizing gas was air. The teducing gas consisted of 51.8 vol % H2, 25.8 VOl % C O , 18.8 VOl % H20, 1.7 VOl % HzS, 1.1 vol % C02, and 0.8 vol % NHJ. In some experiments, water was not used.
The average mass balance varied from a low of 96.9% for the North Dakota Lignite ash to a high of 100.8% for the Western Sub- bituminous No. 1, assuming complete decomposition of the sulfate and phosphate from the ash under experimental conditions.
In either a reducing or an oxidizing atmosphere at a given temperature, run lengths between 10 min. and 30 min. caused no sig- nificant difference in agglomeration, indicating that the agglomera- tion is complete by 10 min. Varying the sample size from 0.5-1.5 g showed no significant difference in the results, indicating that there is no particle mass transfer limitation in our tests.
RESULTS
Ash Agqlomeration - Figure 2 shows the results with carbon- free ashes in the reducing gas. At 927OC, there is no significant agglomeration of any of the samples. The Western Subbituminous No. 1 sample developed substantial agglomeration at 982-103R°C, the No. 2 sample at 1038-1093°C, and the North Dakota Lignite ash at 1093-1149OC. A l l three samples were completely agglomerated at 1149OC. Figure 3 shows that in a reducing environment, the agglomer- ates transformed from a loosely packed ash at low temperature to a glassy melt at high temperature.
Figure 4 shows the effects of both reducing and oxidizing environments at 1149OC. Both conditions produce agglomeration, but et t h i s temperature the reducing gas leads to more pronounced agglomeration. There was no agglomeration in a nitrogen environ- ment. Thus, agglomeration is related to reactions between components in the ash and in the surrounding gas environment.
Effect of Carbon Conversion - Western Subbituminous Coal NO. 1 was used to prepare samples of varying carbon content. The samples were tested in a variety of environments. Figure 5 shows that the agglomeration tendency correlates well with carbon con- tent. No agglomeration occurs until more than 80% of the carbon is removed. ,Thus, modest amounts of carbon will retard ash agglomera- tion, even at quite severe conditions. Figure 6 shows that at 6 4 %
470

7
carhon conversion, the sample looks much like the starting coal. At 99% conversion, the sample has agglomerated some, hut still not to the extent as a carbon-free ash.
Effect of Inert Solids - Since carbon-free ash samples agglomerated the most, we mixed them with silica sand at a 1/10 ratio. Table I11 shows that agglomeration decreased in both reducing and oxidizing environments. Figure 7 shows that this decrease in agglomeration is quite dramatic in the reducing atmosphere. The ash samples agglomerated and shrunk: on the other hand, the particles in the ash/sand mixtures are well separated and bulky.
TARLE I11
AGGLOMERATION OF WESTERN SUHRITUMINOUS NO. 1
% Agglomeration 1038'C 1093OC 1149OC ---
Ash Only 0 0 0 74 9 7 100
N2
Oxidizing, 10 Min. 78 98 100 Oxidizing, 30 Min. 14 99 100
1 1 2 64 94 91
N2
Reducing, 30 Min. 65 86 91 Oxidizing, 30 Min. 13 60 87
Reducing, 10 Min.
Ash + Sand
Reducing, 10 Min.
DISCUSSION
Aqqlomeration Temperature - Stallmann and Neavel (2) defined the agglomeration temperature as the 50% point on a curve like those in Figure 2, which corresponds to the steep part of these curves. Figure 8 compares the agglomeration temperature from both our experi- ments and those of Stallmann and Neavel (2) with the ASTM initial deformation temperature. This figure confirms the observations made by Stallmann and Neavel that the agglomeration temperature is a few hundred degrees lower than the ASTM temperature and that the ASTM initial deformation temperature cannot be correlated to the agglomeration temperature.
these three coal ashes decreases linearly with increasing sodium content of the ash. No other ash component showed a consistent rela- tionship to agglomeration.
important in the design and operation of a coal gasification or com- bustion process. We found that agglomeration depends on both coal
Figure 9 indicates that the agglomeration temperature for
Process Implications - The control of agglomeration is
471

p r o p e r t i e s and o n process c o n d i t i o n s . I n p a r t i c u l a r , t h e a g y l o m e r a - t i o n of p a r t i a l l y c o n v e r t e d c o a l is n e g l i g i b l e up t o 8 0 w t % c o n v e r - s i o n . A t h i g h e r c o n v e r s i o n s , a g g l o m e r a t i o n c o u l d b e c o n t r o l l e d by d i l u t i n g t h e r e a c t i n g m a t e r i a l w i t h i n e r t m a t e r i a l s s u c h a s s a n d . T h i s s t u d y a l s o i n d i c a t e d t h a t a g g l o m e r a t i o n occurs o n a s h o r t e r time scale t h a n t h e n o m i n a l r e s i d e n c e t i m e i n a l l b u t t h e m o s t k i n e t i c a l l y r a p i d g a s i f i c a t i o n s y s t e m s . T h e s e o b s e r v a t i o n s s u g g e s t t h a t a g a s i f i c a t i o n process w h i c h r e q u i r e s o n l y p a r t i a l g a s i f i c a t i o n i n a r e d u c i n g a t m o s p h e r e a n d w h i c h e m p l o y s a d i l u e n t i n e r t , s u c h a s t h e o n e d i s c l o s e d by M i t c h e l l , e t a l . ( l o ) , c a n g r e a t l y r e d u c e t h e a g g l o m e r a t i o n p r o b l e m w h i c h may o c c u r i n p r o c e s s i n g c o a l .
LITERATURE CITED
S t a l l m a n n , J. J. and N e a v e l , R. C . , " T e c h n i q u e s t o Measure t h e T e m p e r a t u r e o f A g g l o m e r a t i o n of C o a l Ash , " F u e l , Vol. 5 9 , 5 8 4 ( 1 9 8 0 1 . Am. SOC. T e s t Ma t . , " F u s i b i l i t y o f C o a l and C o k e A s h , " ASTM D 1857-68 ( R e a p p r o v e d 1 9 8 0 ) . t i u f fman , G. P. , H u g g i n s , F. E., a n d Dunmyre, G. R . , " I n v e s t i g a t i o n o f t h e High T e m p e r a t u r e B e h a v i o r o f C o a l Ash i n R e d u c i n g a n d O x i d i z i n g A t m o s p h e r e s , " F u e l , V o l . 60 , 585 ( 1 9 8 1 ) . Rehmet , A. a n d S a x e n a , S. C . , " A g g l o m e r a t i o n o f Ash i n F l u i d i z e d Bed G a s i f i c a t i o n of C o a l by Steam-Oxygen ( o r A i r ) M i x t u r e , " I n d . Eng. Chem., P r o c e s s D e s i g n D e v e l o p . , 19, 223 ( 1 9 8 0 ) . L a n g s t o n , 8. G. a n d S t e p h e n s , F. M . , " S e l f - A g g l o m e r a t i n g F l u i d i z e d Bed R e d u c t i o n , " J. Metals, A p r i l , 3 1 2 ( 1 9 6 0 ) . Mason, D. M. a n d P a t e l , J. G . , " C h e m i s t r y o f Ash A g g l o m e r a t i o n i n t h e U-Gas P r o c e s s , " F u e l P r o c . Tech . , A, 1 8 1 ( 1 9 8 0 ) . G o l d b e r g e r , W. M . , " C o l l e c t i o n o f F l y Ash i n a S e l f - A g g l o m e r a t i n g F l u i d i z e d Bed Coal B u r n e r , " ASME p a p e r , 67 WA/FU-3, November 1967 . S i e g e l l , J. H . , " D e f l u i d i z a t i o n Phenomena i n F l u i d i z e d Beds o f S t i c k y P a r t i c l e s a t H i g h T e m p e r a t u r e , " Ph.D. D i s s e r t a t i o n , The C i t y U n i v e r s i t y of New York, 1976. Rasu , P. , " A S t u d y o f A g g l o m e r a t i o n o f C o a l Ash i n F l u i d i z e d B e d s , " Can. J . Ch.E.. 60, 791 ( 1 9 8 2 ) . M i t c h e l l , D. S. a n d Sageman, D. S., " C o u n t e r c u r r e n t P lug - l i k e Flow o f Two s o l i d s , " U.S. P a t e n t 4 , 1 5 7 , 2 4 5 , J u n e 5 , 1979 .
472

FIGURE 1
ASH AGGLOMERATION TEST
P
Test Material
w Gas - & " f l ~ 4 " " ' f l ' " L
Furnace
Initial Material
Agglomeration
100-200 Mesh
Material Retained on a 100 Mesh Screen After lest Expressed as Wt O/O Ash
FIGURE 2
ASH AGGLOMERATION IN REDUCING GAS
Subbituminous
815 871 927 982 1038 1093 1149 Temperature, "C
4 7 3

FIGURE 3
EFFECT OF TEMPERATURE ON AGGLOMERATION
1038"C, Reducing Gas
1149"C, Reducing Gas
474

FIGURE 4
EFFECT OF GAS ENVIRONMENT ON AGGLOMERATION
Reducing Gas at 1149°C
Oxidizing Gas at 1149°C
4 75

FIGURE 5
ASH AGGLOMERATION USING A WESTERN SUBBITUMINOUS COAL
Ash Agglomeration
Wt %
I
Pure Ash- 8 /
loo[ 80
Carbon Conversion, Wt %
476

FIGURE 6
AGGLOMERATION OF WESTERN SUBBITUMINOUS COAL NO. 2 AT 1149°C
Reducing Gas, 64 Wt O/O Conversion
Steam, 99 Wt YO Conversion
?.si 477

8 Q
‘ I
478
il

9 1149- I i 5 1093 , L E 7 I 1038
982- E" 0
f - 5 871
- ... 927
rn 3 815.
FIGURE 9
ASH AGGLOMERATION THE EFFECT OF SODIUM CONTEF r ON
0 - A
- A*
A
0
Nevael, 1980
- - 0
0 I I I
1100-
1050
1000
950
N. D. Lignite Ash
Subbituminous Ash No. 2
-
-
1 1 1
479