Embed Size (px)
Citation preview
BEST 2015 , IISc Bangalore
STUDY OF TRANSIENT RESPONSE
OF PLANT LEAF USING INFRARED IMAGING
AND EFFECT OF LIGHT ON STOMATAL OPENING
A Project Report Submitted in
Experimental Engineering
WASEEM AHMAD BHAT
IIT GUWAHATI
Dept. of Bioengineering and Biosciences
Department of Mechanical Engineering
Indian Institute of Science
Bangalore -560 012
BEST 2015 , IISc Bangalore
ACKNOWLEDGEMENT:
I take this opportunity to express my
profound gratitude and deep regards to my guide
and mentor, Prof. Jaywant Arakeri for exemplary
guidance, monitoring and constant encouragement
though out my project. He regularly took updates
about the progress of my work and experimental
findings, pointed out fallacies, explained the
intricacies behind practical work and appreciated
genuine results. It was a novel experiencing to work
in the lab which encouraged me to work hard and to
experiment with open perspective.
I am deeply indebted to Navneet Kumar for helping
and encouraging me and sharing his experiences
thought out my project work. Finally, I would like
to thank other members of the lab Deepak,
Shashikant, Tariq, Somya, Subin and Albin for their
guidences and maintainence of positive environment
inside the lab.
BEST 2015 , IISc Bangalore
ABSTRACT:
Infrared thermography can be used as a tool for studying the surface temperature
of a plant leaf non-invasively. The main aim of this project is to study the transient
temperatue response of a leaf towards constant thermal radiation incident upon it.
Knowing the temperature as function of time we can then compare it with
evaporation rates which can be measured with a precision weighing balance. The
main problem in the correct evaluation of stomatal conductance at leaf level is
due to the need of performing a measurement in a completely non-invasive
method. Thermography helps us to know the stomatal conductance indirectly at
different temperatures without actually disturbing the leaf. The main advantage
of thermographic method is the possibility to acquire information about
instantaneous conditions of transpiration over a large number of plants, with no
need of sampling and avoiding any contact with plants.
In my work I also tried to understand how the heating and cooling curves of a
leaf are different than some other materials having approximately same heat
capacity and mass. The behavior is different in the two cases as expected. It turns
out that transpiration is highly effective way of regulating the temperature of leaf.
Lastly, I tried to analyse the effect of visible light on stomatal opening and also
the individual components of light. The results showed that response towards blue
light is as much as ten times more than red light. Stomata barely respond to green
light.
Keywords: Infrared Thermography
Stomata
Transpiration
BEST 2015 , IISc Bangalore
1. Introduction: Now-a-days, the sustainable management of water resources represents a priority
for agriculture, especially in waterless regions, in fact approximately 70% of the
worldwide water use is committed to agriculture [1]. For plants, water is a central
molecule in all physiological processes, and its availability determines the distribution
of plant species and their productivity.Accordingly, drought represents one of the major
constrains to both crop productivity and quality, reducing average yields of 50% and
over [2]. The strategies of plant adaptation to drought stress include different
mechanisms. Thermal imaging by infrared thermography represents a suitable system
for studying the energy balance at both leaf and canopy level and can be used for the
estimation of evapotranspiration rates [3] which in turn can be directly compared with
digital weighing balance. The basic principle of this technique is the relationship
between leaf temperature and leaf transpiration. Authors demonstrated that, for porous
materials, at room temperature, there is a linear relationship between the cooling due
to the evaporation and recorded by IR detector and the flux rate [4]. Therefore,
temperature variations of leaf surface depend strongly on the plant water status, which,
in turn, is a function of the stomatal conductance [5]. Furthermore, infrared
thermography can be a useful approach for both proximal and remote sensing of plant
biotic stresses, for irrigation scheduling in arid environments [6], as well as for
screening the stomatal functionality in different lines of a crop of interest [7–9].
Combined procedures and technologies can improve the plant water-use efficiency
[10]. In this context, under drought conditions, the employ of antitranspirants may
improve the water-use efficiency, often assumed to express the irrigation system
performance and also defined as the ratio between the crop biomass and the amount of
water consumed by the crop itself,including rainfall, irrigation water and plant
transpiration [11]. There have been attempts to know water content of leaf and relate it
to stomatal conductance. One of such attempts is the paper regarding use of leaf
mounted thermal sensor for the measurement of water content of leaf. This paper
describes proof of principle experiments demonstrating a microfabricated thermal
BEST 2015 , IISc Bangalore
sensor capable of detecting changes in the water content of leaves. The device consists
of a resistive heater and 2 thin film thermocouples (TFTCs) formed on a polyimide
substrate. The heater induces a thermal gradient within a sample brought into contact
with the device, which is monitored by the TFTCs. Changes in the thermal gradient can
be related to the properties of the sample. In particular, monitoring the water content
of a leaf has been demonstrated in this paper[12].The problem with the above method
is that the thermal sensors have to come in contact with the leaf itself which may change
the rate of change of water content of the leaf.
This is where thermography has advantage over other techniques. It is a non-invasive
method to know the transient temperature response of a leaf. The results obtained by
infrared thermography are more close to actual values than by any other technique.
There have been attempts to use thermoghaphy in very innovative and efficient ways
over the last few years and this technique has great promise for further findings.
BEST 2015 , IISc Bangalore
2. Theory:
2.1 Thermography
Infrared radiations are emitted by all objects with a temperature above
absolute zero according to Black Body Radiation Law.Thermography makes it
possible to see one’s environment without visible light.The amount of radiation
emitted by an object depends on it temperature.Greater the temperature of the
object ,greater will be the amount of radiations emitted.Thermographic cameras
allow us to differentiate between temperature variations. When viewed through a
thermal imaging camera, warm objects stand out well against cooler backgrounds;
humans and other warm-blooded animals become easily visible against the
environment, day or night. As a result, thermography is particularly useful to the
military and other users of surveillance cameras. In general thermographic cameras
detect radiations in the infrared range of the electromagnetic spectrum (7500-14000
nm).The images taken by thermographic cameras are known as thermograms.
Infrared radiation is energy radiated by the motion of atoms and molecules on the
surface of object, where the temperature of the object is more than absolute zero.
The intensity of the emittance is a function of the temperature of the material. In
other words, the higher the temperature, the greater the intensity of infrared energy
that is emitted. As well as emitting infrared energy, materials also reflect infrared,
absorb infrared and, in some cases, transmit infrared. When the temperature of the
material equals that of its surroundings, the amount of thermal radiation absorbed
by the object equals the amount emitted by the object
Some physiological changes in human beings and other warm-blooded animals
can also be monitored with thermal imaging during clinical diagnostics.
Thermography is often used for lava detection, breast screening, allergy detection,
and in veterinary use. It can also be used to detect swine flu by Airport
BEST 2015 , IISc Bangalore
personnel.Firefighters use thermography to see through smoke, to find persons, and
to localize the base of a fire. Maintenance technicians use thermography to locate
overheating joints and sections of power lines & rail wheels (e.g. Rajdhani Express),
which are a sign of impending failure.Building construction technicians can see
thermal signatures that indicate heat leaks in faulty thermal insulation and can use
the results to improve the efficiency of heating and air-conditioning units.
The appearance and operation of a modern thermographic camera is often
similar to a camcorder.A camcorder is a video device combining a video recorder
and a video camera.
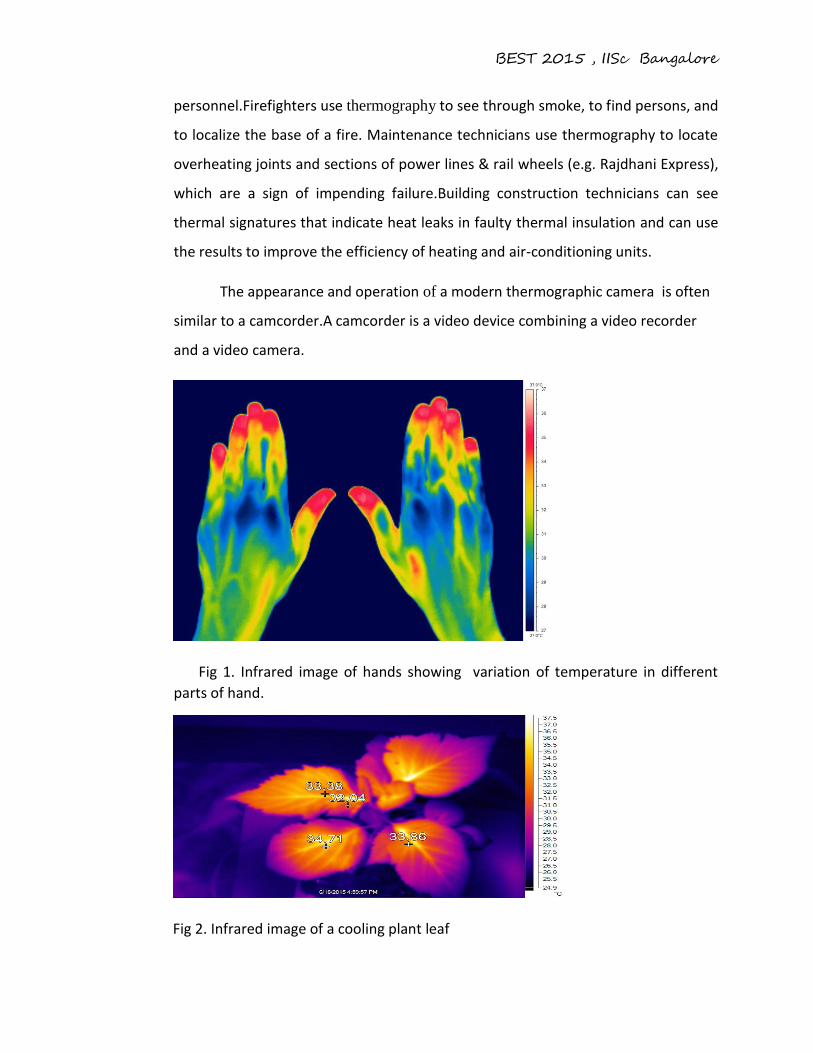
Fig 1. Infrared image of hands showing variation of temperature in different
parts of hand.
Fig 2. Infrared image of a cooling plant leaf
BEST 2015 , IISc Bangalore
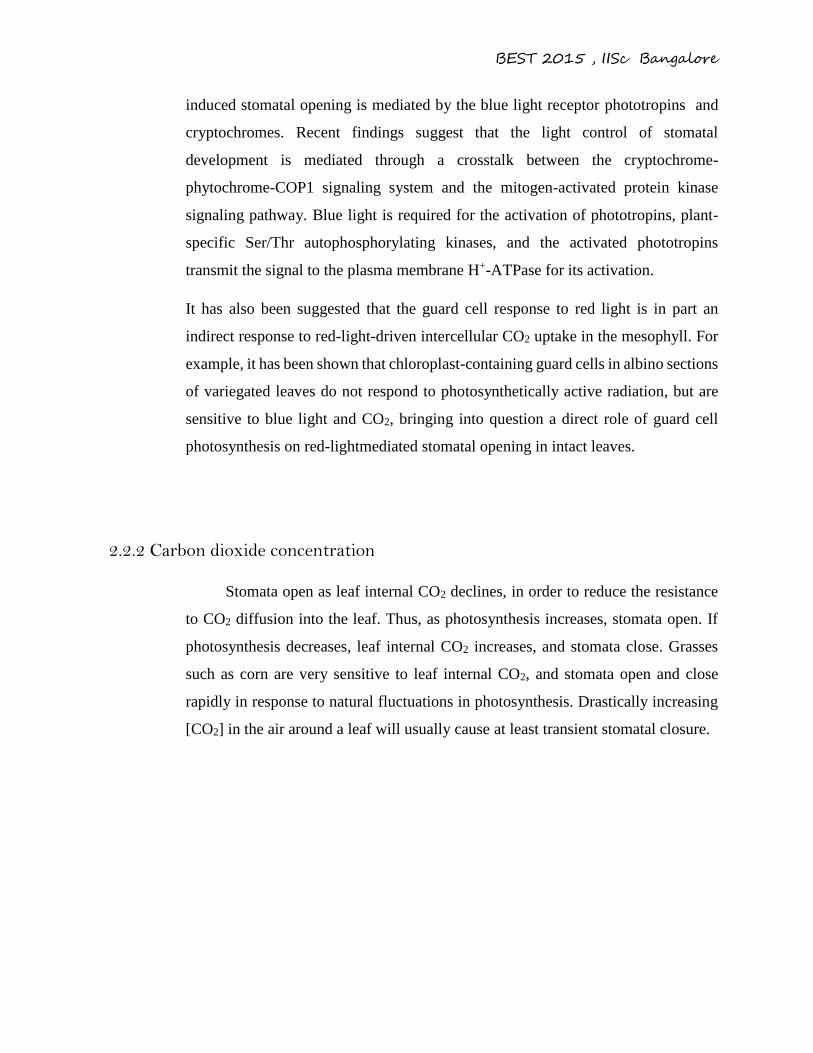
2.2 Stomatal Regulation
How do plants "decide" on the most appropriate stomatal aperture for any given
situation? The physiology of stomatal regulation has been an active area of research
for several decades, but there are still many questions that remain unanswered. It is
clear that there is more than one control system involved. In fact, stomata seem to
sense a variety of environmental parameters and respond accordingly. The precise
response depends on the crop species (and perhaps cultivar) as well as the previous
history of the plant.
Factors affecting stomatal opening: -
Light affects stomatal regulation both directly (blue light perceived by guard cells)
and indirectly (PAR increasing photosynthesis and decreasing leaf internal CO2).
Although the signal transduction pathway is not fully understood, it is known that
these effects cause K+ ions to be actively pumped into guard cells. The resulting
decrease in guard cell solute potential causes water to enter the guard cells, thus
increasing turgor and causing the stomatal pore to increase in size. A decrease in
leaf (or even root) water potential causes the opposite to occur: K+ and water exit
guard cells and the stomata close. Abscisic acid (ABA) is known to play a role in
inducing stomatal closure under water stress.
2.2.1 Light:
Light has both direct and indirect effects on stomata. Blue light
(especially) can bring about stomatal opening directly. The mechanisms by which
the light is perceived, and the subsequent signal transduction pathway, are currently
under investigation. Light can also indirectly cause stomatal opening via
photosynthesis, by decreasing the leaf internal CO2 concentration. Plants have
evolved multiple photoreceptor systems to monitor light quality, quantity and
direction. It is well known that stomatal morphogenesis is controlled by genetic as
well as environmental factors and in general, an increase in light intensity results in
an increase in stomatal. Light is perceived by various photo receptors and stomatal
movements are regulated by both blue and red light.The blue light response of
stomata appears to be strongly affected by red light. It is shown that blue light-
BEST 2015 , IISc Bangalore
induced stomatal opening is mediated by the blue light receptor phototropins and
cryptochromes. Recent findings suggest that the light control of stomatal
development is mediated through a crosstalk between the cryptochrome-
phytochrome-COP1 signaling system and the mitogen-activated protein kinase
signaling pathway. Blue light is required for the activation of phototropins, plant-
specific Ser/Thr autophosphorylating kinases, and the activated phototropins
transmit the signal to the plasma membrane H+-ATPase for its activation.
It has also been suggested that the guard cell response to red light is in part an
indirect response to red-light-driven intercellular CO2 uptake in the mesophyll. For
example, it has been shown that chloroplast-containing guard cells in albino sections
of variegated leaves do not respond to photosynthetically active radiation, but are
sensitive to blue light and CO2, bringing into question a direct role of guard cell
photosynthesis on red-lightmediated stomatal opening in intact leaves.
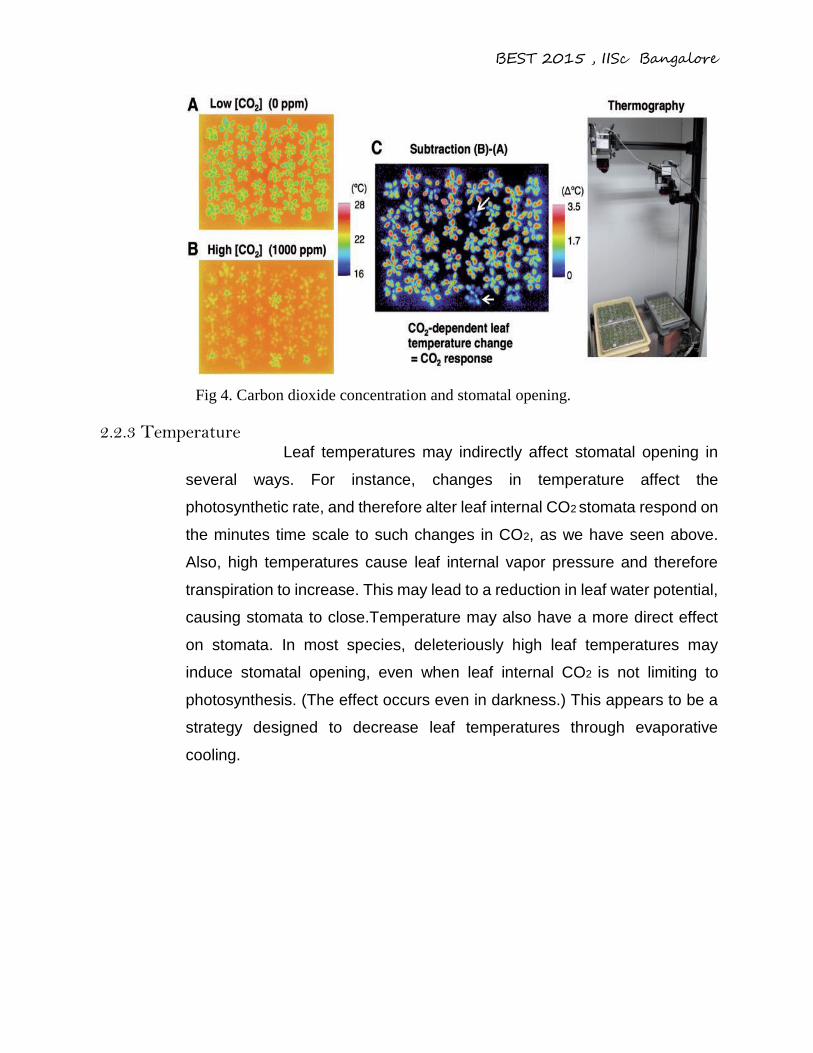
2.2.2 Carbon dioxide concentration
Stomata open as leaf internal CO2 declines, in order to reduce the resistance
to CO2 diffusion into the leaf. Thus, as photosynthesis increases, stomata open. If
photosynthesis decreases, leaf internal CO2 increases, and stomata close. Grasses
such as corn are very sensitive to leaf internal CO2, and stomata open and close
rapidly in response to natural fluctuations in photosynthesis. Drastically increasing
[CO2] in the air around a leaf will usually cause at least transient stomatal closure.
BEST 2015 , IISc Bangalore
Fig 4. Carbon dioxide concentration and stomatal opening.
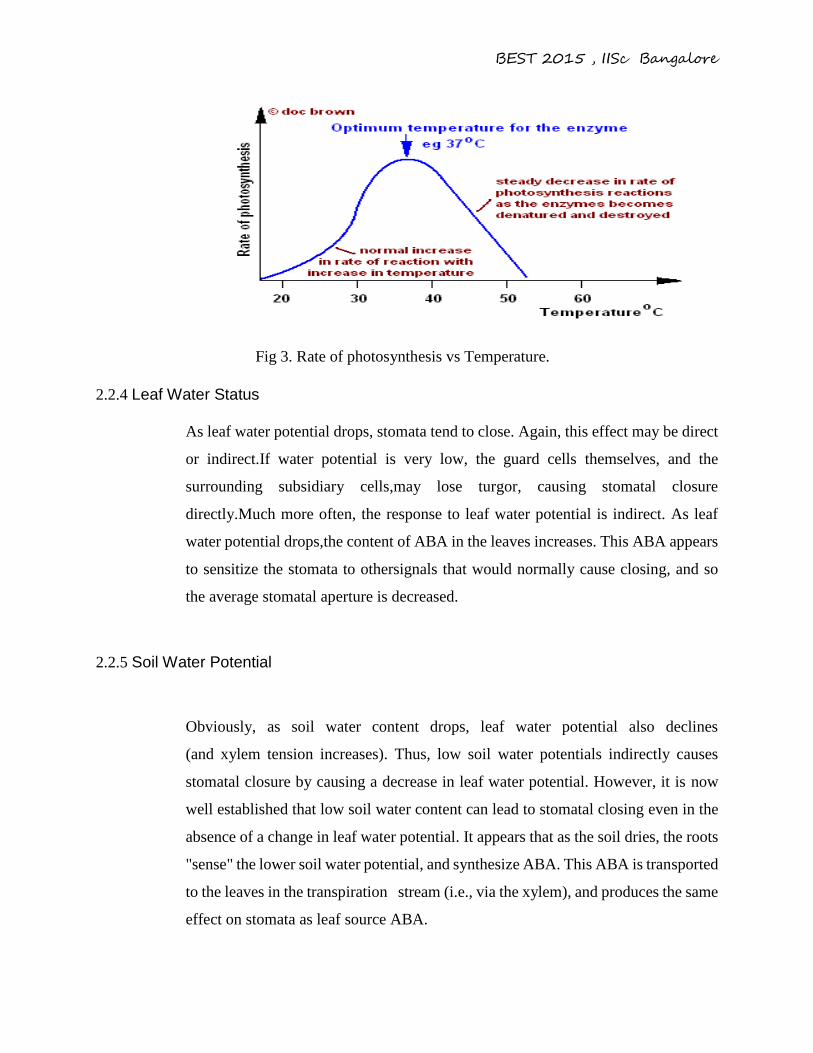
2.2.3 Temperature Leaf temperatures may indirectly affect stomatal opening in
several ways. For instance, changes in temperature affect the
photosynthetic rate, and therefore alter leaf internal CO2 stomata respond on
the minutes time scale to such changes in CO2, as we have seen above.
Also, high temperatures cause leaf internal vapor pressure and therefore
transpiration to increase. This may lead to a reduction in leaf water potential,
causing stomata to close.Temperature may also have a more direct effect
on stomata. In most species, deleteriously high leaf temperatures may
induce stomatal opening, even when leaf internal CO2 is not limiting to
photosynthesis. (The effect occurs even in darkness.) This appears to be a
strategy designed to decrease leaf temperatures through evaporative
cooling.
BEST 2015 , IISc Bangalore
Fig 3. Rate of photosynthesis vs Temperature.
2.2.4 Leaf Water Status
As leaf water potential drops, stomata tend to close. Again, this effect may be direct
or indirect.If water potential is very low, the guard cells themselves, and the
surrounding subsidiary cells,may lose turgor, causing stomatal closure
directly.Much more often, the response to leaf water potential is indirect. As leaf
water potential drops,the content of ABA in the leaves increases. This ABA appears
to sensitize the stomata to othersignals that would normally cause closing, and so
the average stomatal aperture is decreased.
2.2.5 Soil Water Potential
Obviously, as soil water content drops, leaf water potential also declines
(and xylem tension increases). Thus, low soil water potentials indirectly causes
stomatal closure by causing a decrease in leaf water potential. However, it is now
well established that low soil water content can lead to stomatal closing even in the
absence of a change in leaf water potential. It appears that as the soil dries, the roots
"sense" the lower soil water potential, and synthesize ABA. This ABA is transported
to the leaves in the transpiration stream (i.e., via the xylem), and produces the same
effect on stomata as leaf source ABA.
BEST 2015 , IISc Bangalore
This mechanism may allow plants to anticipate drought conditions and
respond accordingly, even before the leaf water potential has been affected.Some
species also open stomata in response to extremely high soil water content. This
can occur even at night, and presumably has the advantage of depleting soil water
and thus preventing root anaerobiosis.
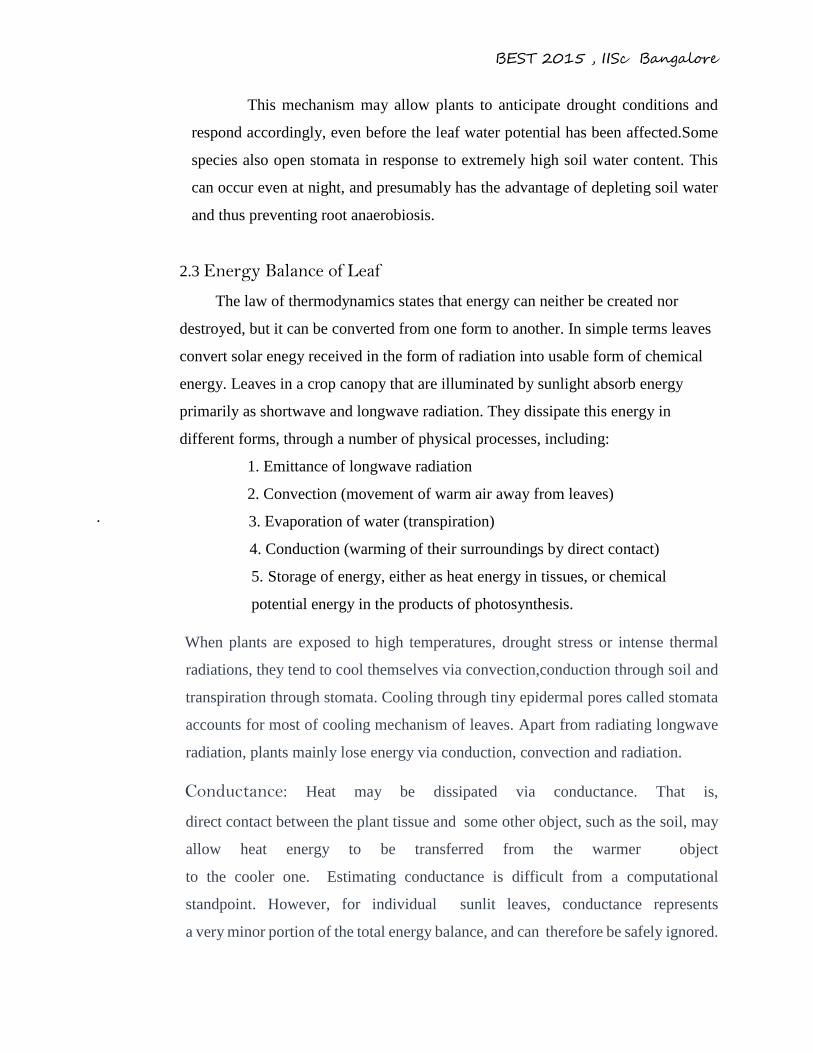
2.3 Energy Balance of Leaf
The law of thermodynamics states that energy can neither be created nor
destroyed, but it can be converted from one form to another. In simple terms leaves
convert solar enegy received in the form of radiation into usable form of chemical
energy. Leaves in a crop canopy that are illuminated by sunlight absorb energy
primarily as shortwave and longwave radiation. They dissipate this energy in
different forms, through a number of physical processes, including:
1. Emittance of longwave radiation
2. Convection (movement of warm air away from leaves)
· 3. Evaporation of water (transpiration)
4. Conduction (warming of their surroundings by direct contact)
5. Storage of energy, either as heat energy in tissues, or chemical
potential energy in the products of photosynthesis.
When plants are exposed to high temperatures, drought stress or intense thermal
radiations, they tend to cool themselves via convection,conduction through soil and
transpiration through stomata. Cooling through tiny epidermal pores called stomata
accounts for most of cooling mechanism of leaves. Apart from radiating longwave
radiation, plants mainly lose energy via conduction, convection and radiation.
Conductance: Heat may be dissipated via conductance. That is,
direct contact between the plant tissue and some other object, such as the soil, may
allow heat energy to be transferred from the warmer object
to the cooler one. Estimating conductance is difficult from a computational
standpoint. However, for individual sunlit leaves, conductance represents
a very minor portion of the total energy balance, and can therefore be safely ignored.
BEST 2015 , IISc Bangalore
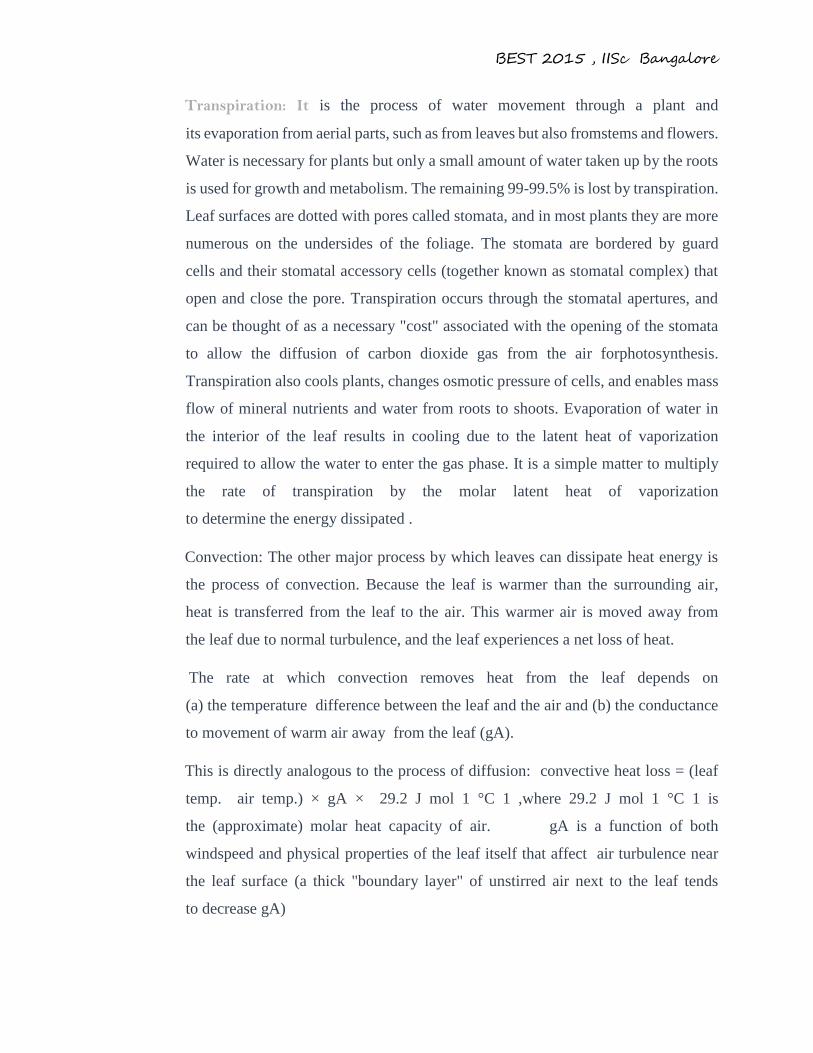
Transpiration: It is the process of water movement through a plant and
its evaporation from aerial parts, such as from leaves but also fromstems and flowers.
Water is necessary for plants but only a small amount of water taken up by the roots
is used for growth and metabolism. The remaining 99-99.5% is lost by transpiration.
Leaf surfaces are dotted with pores called stomata, and in most plants they are more
numerous on the undersides of the foliage. The stomata are bordered by guard
cells and their stomatal accessory cells (together known as stomatal complex) that
open and close the pore. Transpiration occurs through the stomatal apertures, and
can be thought of as a necessary "cost" associated with the opening of the stomata
to allow the diffusion of carbon dioxide gas from the air forphotosynthesis.
Transpiration also cools plants, changes osmotic pressure of cells, and enables mass
flow of mineral nutrients and water from roots to shoots. Evaporation of water in
the interior of the leaf results in cooling due to the latent heat of vaporization
required to allow the water to enter the gas phase. It is a simple matter to multiply
the rate of transpiration by the molar latent heat of vaporization
to determine the energy dissipated .
Convection: The other major process by which leaves can dissipate heat energy is
the process of convection. Because the leaf is warmer than the surrounding air,
heat is transferred from the leaf to the air. This warmer air is moved away from
the leaf due to normal turbulence, and the leaf experiences a net loss of heat.
The rate at which convection removes heat from the leaf depends on
(a) the temperature difference between the leaf and the air and (b) the conductance
to movement of warm air away from the leaf (gA).
This is directly analogous to the process of diffusion: convective heat loss = (leaf
temp. air temp.) × gA × 29.2 J mol 1 °C 1 ,where 29.2 J mol 1 °C 1 is
the (approximate) molar heat capacity of air. gA is a function of both
windspeed and physical properties of the leaf itself that affect air turbulence near
the leaf surface (a thick "boundary layer" of unstirred air next to the leaf tends
to decrease gA)
BEST 2015 , IISc Bangalore
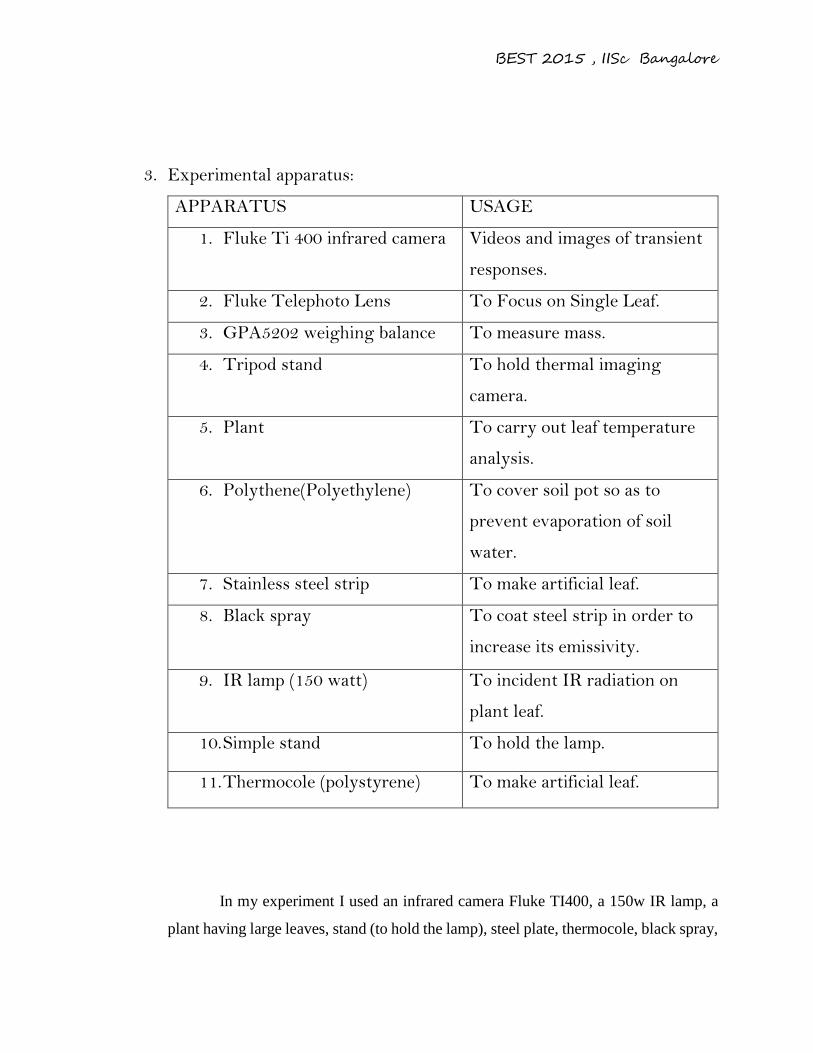
3. Experimental apparatus:
APPARATUS USAGE
1. Fluke Ti 400 infrared camera Videos and images of transient
responses.
2. Fluke Telephoto Lens To Focus on Single Leaf.
3. GPA5202 weighing balance To measure mass.
4. Tripod stand To hold thermal imaging
camera.
5. Plant To carry out leaf temperature
analysis.
6. Polythene(Polyethylene) To cover soil pot so as to
prevent evaporation of soil
water.
7. Stainless steel strip To make artificial leaf.
8. Black spray To coat steel strip in order to
increase its emissivity.
9. IR lamp (150 watt) To incident IR radiation on
plant leaf.
10. Simple stand To hold the lamp.
11. Thermocole (polystyrene) To make artificial leaf.
In my experiment I used an infrared camera Fluke TI400, a 150w IR lamp, a
plant having large leaves, stand (to hold the lamp), steel plate, thermocole, black spray,
BEST 2015 , IISc Bangalore
a tripod (for holding the Infrared camera) and a weighing balance. Further, I needed
software to analyse data. I also had to work with matlab. Thermal camera helped me to
take videos of transient temperature response of plant leaf and also still images. Then I
used software to gather thermal data from the still images. I also measured transpiration
rates by precision weighing balance and tried to relate it with amount and type of the
radiation falling on the leaf.
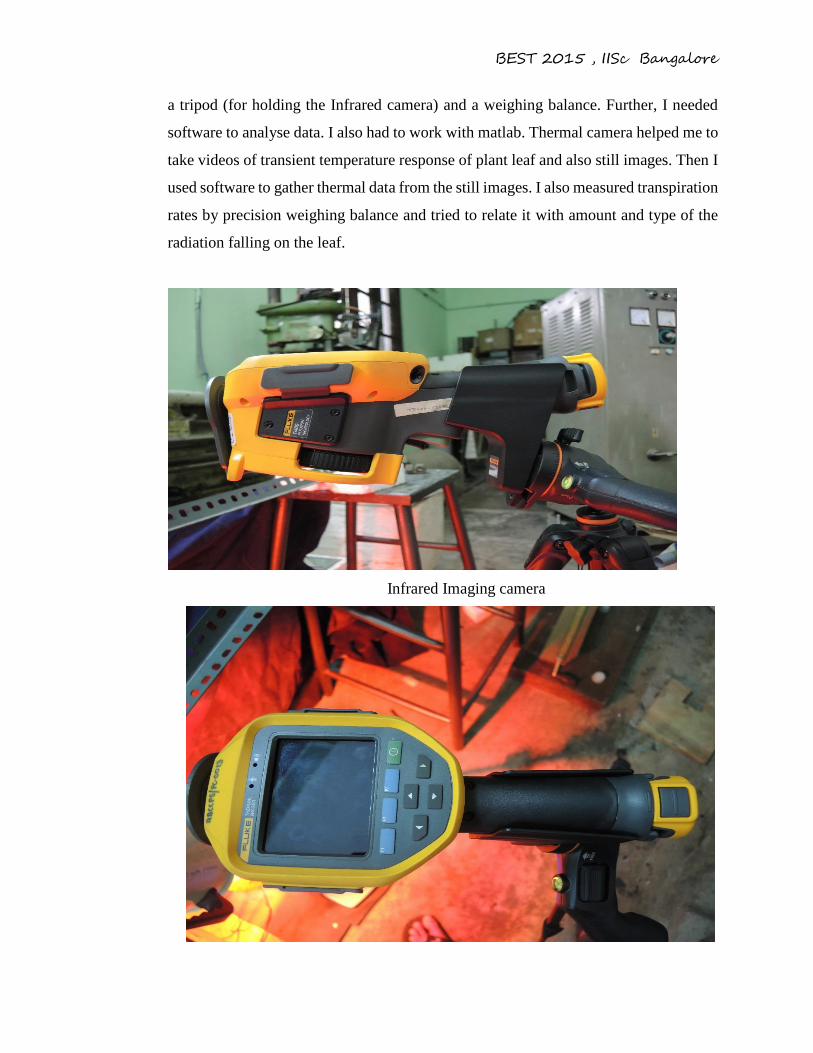
Infrared Imaging camera
BEST 2015 , IISc Bangalore
Infrared Imaging camera
4. Experimental setup:
There are two major targets of my experimental setup. One is to know the
temperature transient response of a plant leaf surface when an incident IR radiation
falls on it till its temperature saturates to a constant value. We further try to compare
the time responses of heating and cooling curves. The other part is to know how light
quality and intensity affect the transpiration rate. It turns out that only some particular
wavelengths affect stomatal opening and closure. The detailed explanation of my
experiments is as follows.
4.1. Transient Temperature Response of leaf surface:
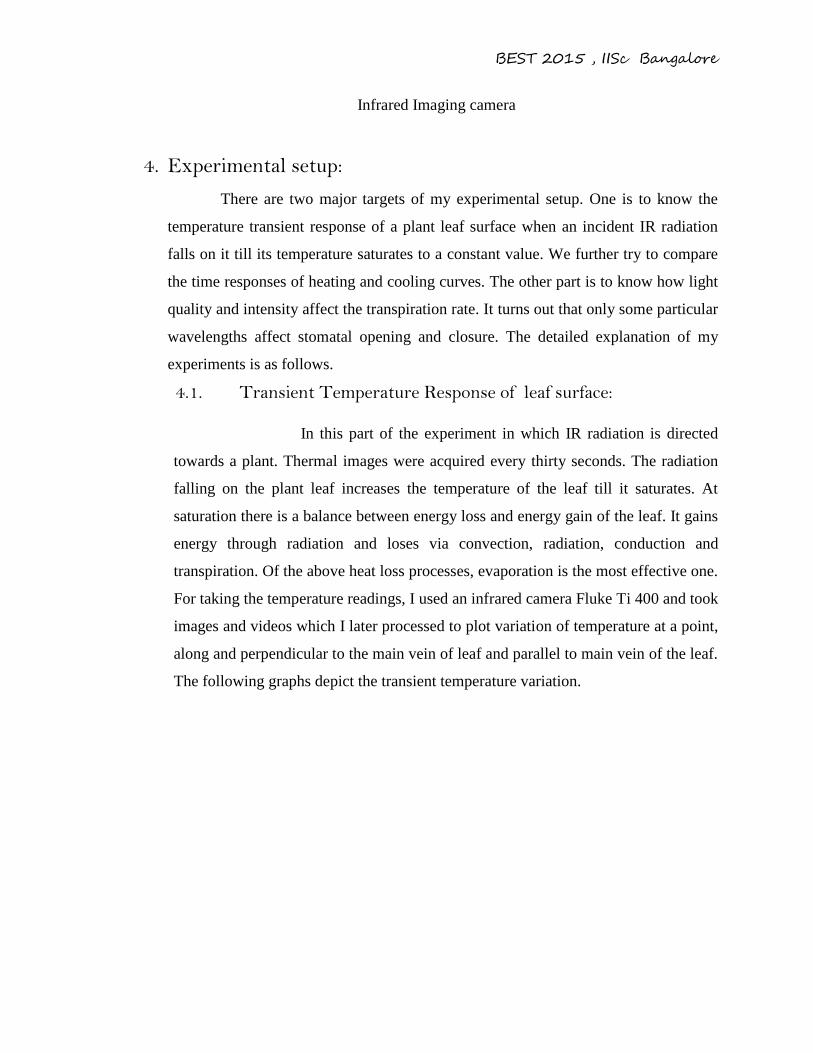
In this part of the experiment in which IR radiation is directed
towards a plant. Thermal images were acquired every thirty seconds. The radiation
falling on the plant leaf increases the temperature of the leaf till it saturates. At
saturation there is a balance between energy loss and energy gain of the leaf. It gains
energy through radiation and loses via convection, radiation, conduction and
transpiration. Of the above heat loss processes, evaporation is the most effective one.
For taking the temperature readings, I used an infrared camera Fluke Ti 400 and took
images and videos which I later processed to plot variation of temperature at a point,
along and perpendicular to the main vein of leaf and parallel to main vein of the leaf.
The following graphs depict the transient temperature variation.
BEST 2015 , IISc Bangalore
Fig 5. Temperature variation of three points on three different leaves of a
plant on which IR radiation from a 150w lamp is incident.
25
30
35
40
45
50
0 50 100 150 200 250 300
Tem
per
atu
re (
0 C)
Time(s)
Temperature Vs Time
P0 P1 P2
BEST 2015 , IISc Bangalore
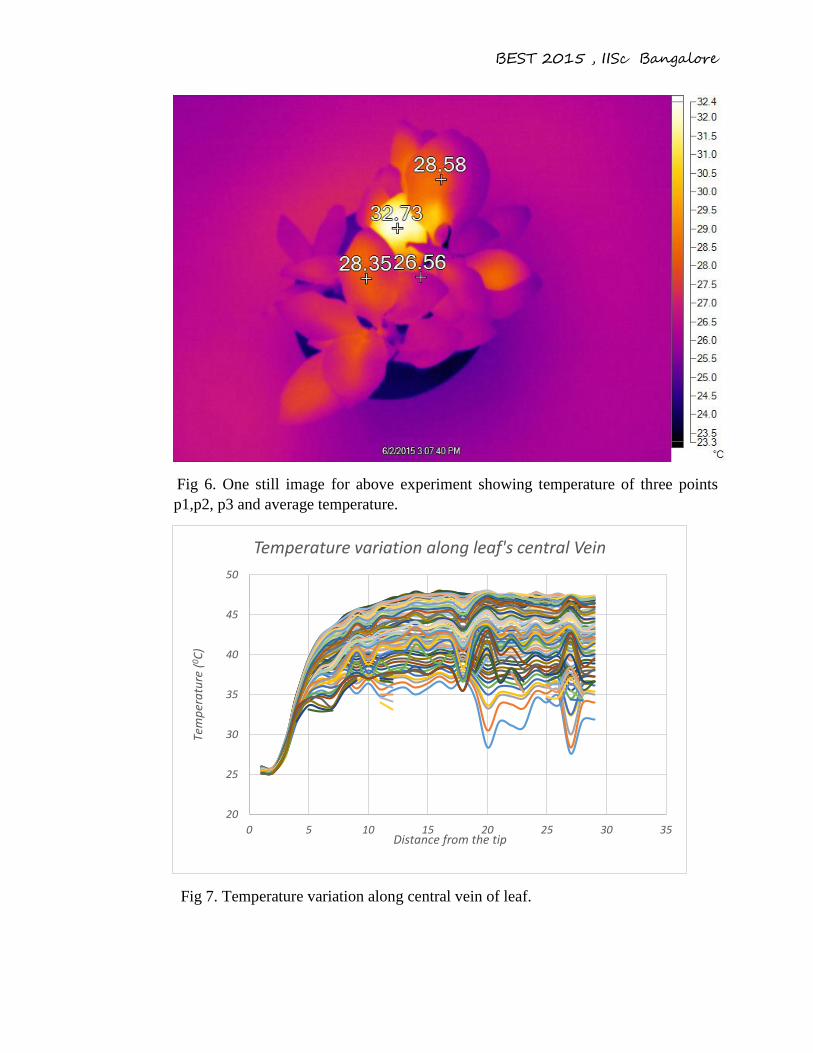
Fig 6. One still image for above experiment showing temperature of three points
p1,p2, p3 and average temperature.
Fig 7. Temperature variation along central vein of leaf.
20
25
30
35
40
45
50
0 5 10 15 20 25 30 35
Tem
per
atu
re (
0 C)
Distance from the tip
Temperature variation along leaf's central Vein
BEST 2015 , IISc Bangalore
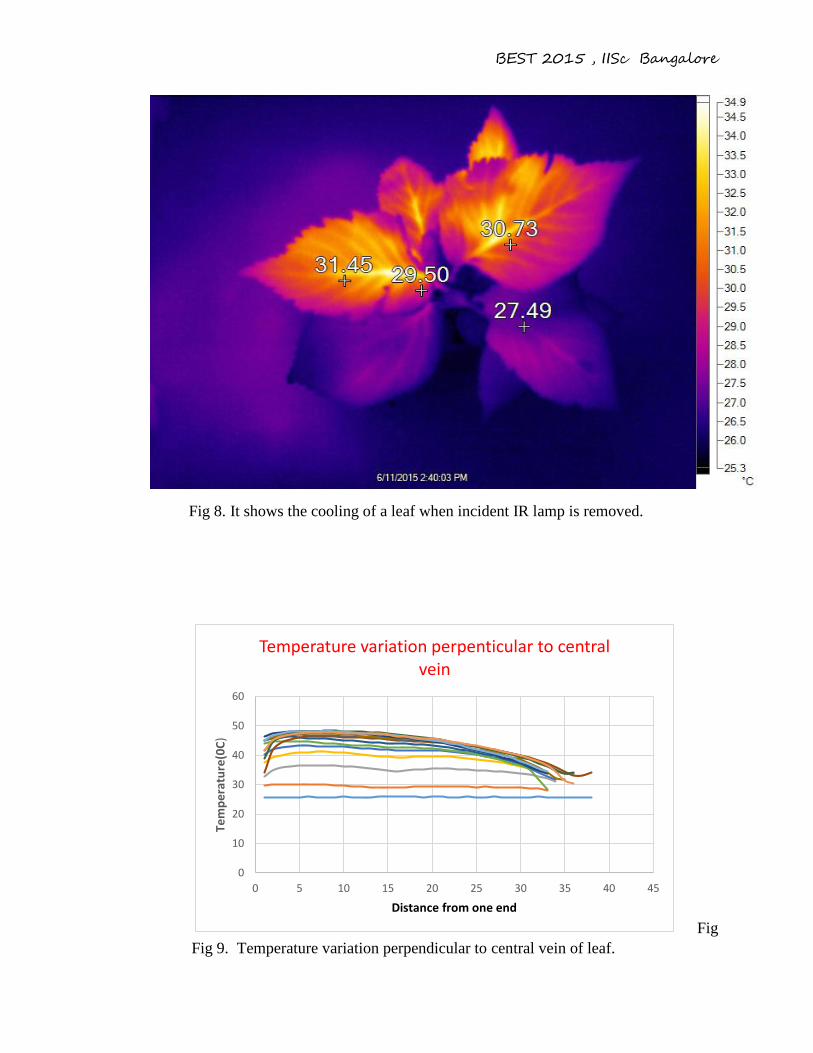
Fig 8. It shows the cooling of a leaf when incident IR lamp is removed.
Fig
Fig 9. Temperature variation perpendicular to central vein of leaf.
0
10
20
30
40
50
60
0 5 10 15 20 25 30 35 40 45
Tem
pe
ratu
re(0
C)
Distance from one end
Temperature variation perpenticular to central vein
BEST 2015 , IISc Bangalore
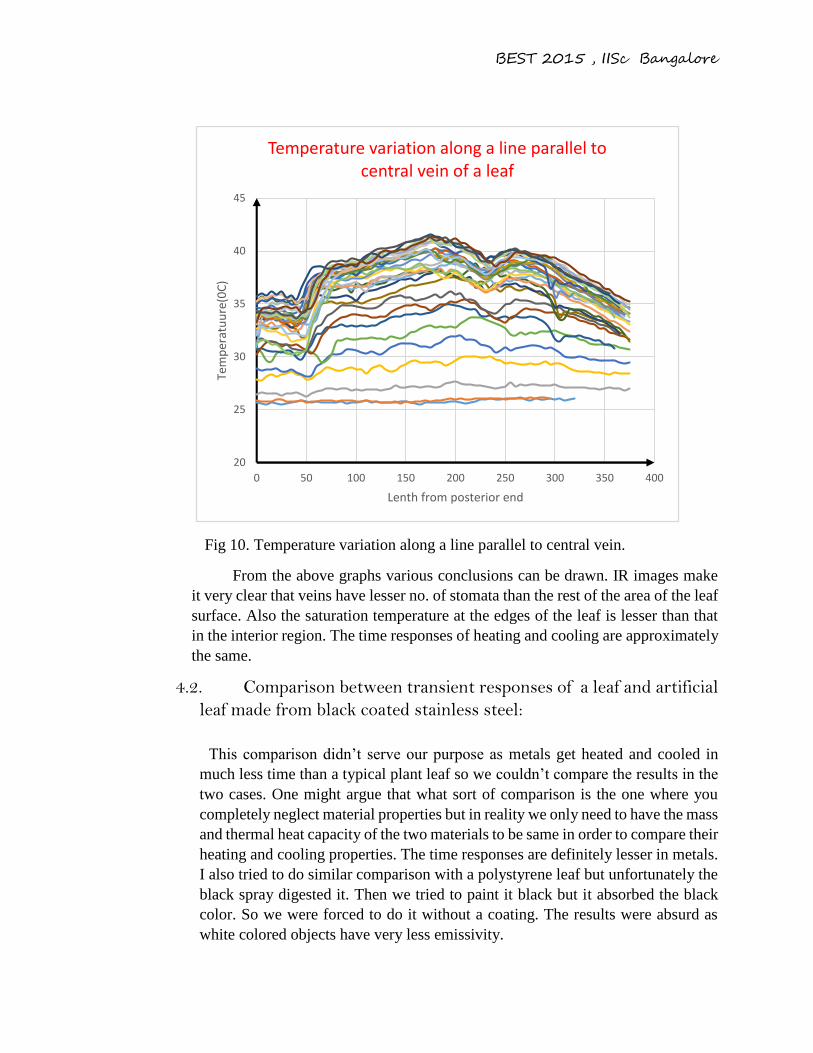
Fig 10. Temperature variation along a line parallel to central vein.
From the above graphs various conclusions can be drawn. IR images make
it very clear that veins have lesser no. of stomata than the rest of the area of the leaf
surface. Also the saturation temperature at the edges of the leaf is lesser than that
in the interior region. The time responses of heating and cooling are approximately
the same.
4.2. Comparison between transient responses of a leaf and artificial
leaf made from black coated stainless steel:
This comparison didn’t serve our purpose as metals get heated and cooled in
much less time than a typical plant leaf so we couldn’t compare the results in the
two cases. One might argue that what sort of comparison is the one where you
completely neglect material properties but in reality we only need to have the mass
and thermal heat capacity of the two materials to be same in order to compare their
heating and cooling properties. The time responses are definitely lesser in metals.
I also tried to do similar comparison with a polystyrene leaf but unfortunately the
black spray digested it. Then we tried to paint it black but it absorbed the black
color. So we were forced to do it without a coating. The results were absurd as
white colored objects have very less emissivity.
20
25
30
35
40
45
0 50 100 150 200 250 300 350 400
Tem
per
atu
ure
(0C
)
Lenth from posterior end
Temperature variation along a line parallel to central vein of a leaf
BEST 2015 , IISc Bangalore
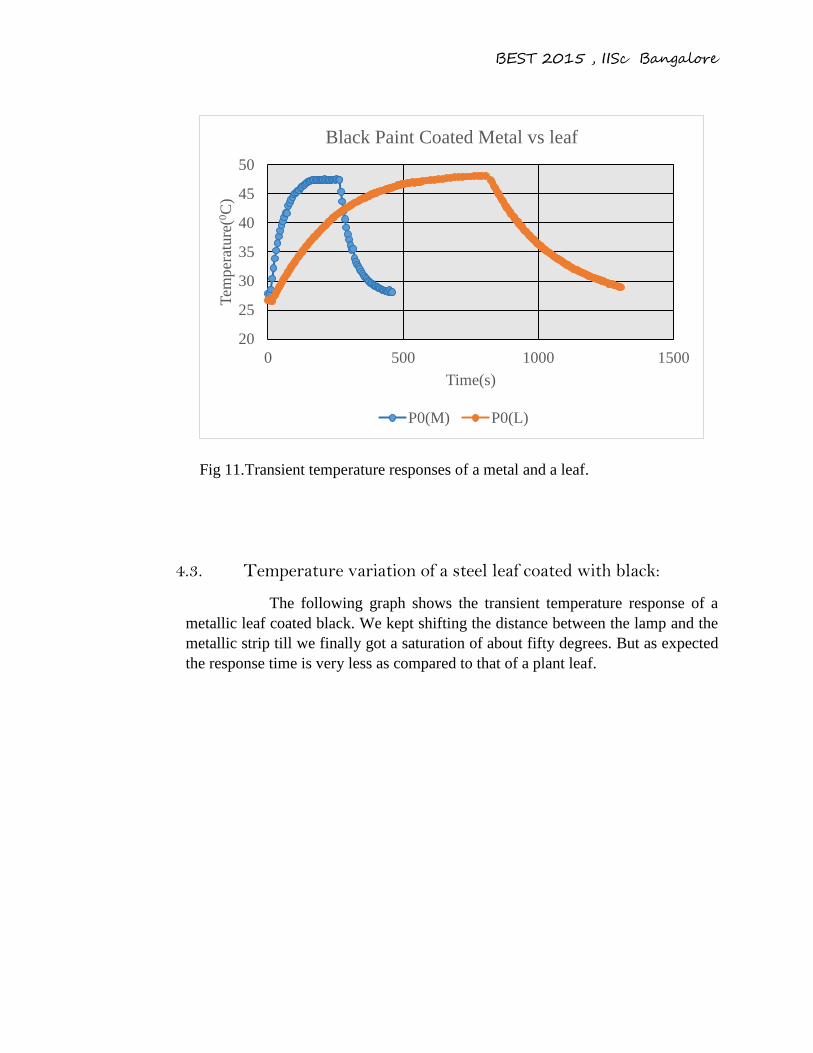
Fig 11.Transient temperature responses of a metal and a leaf.
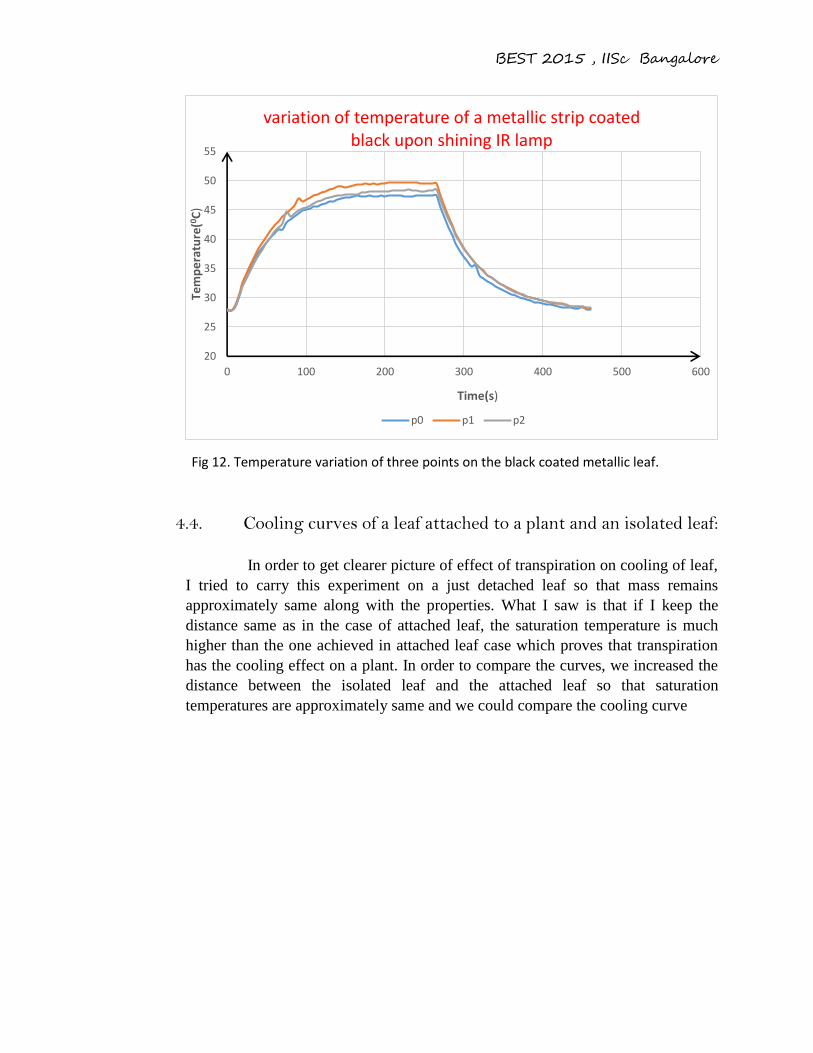
4.3. Temperature variation of a steel leaf coated with black:
The following graph shows the transient temperature response of a
metallic leaf coated black. We kept shifting the distance between the lamp and the
metallic strip till we finally got a saturation of about fifty degrees. But as expected
the response time is very less as compared to that of a plant leaf.
20
25
30
35
40
45
50
0 500 1000 1500
Tem
per
ature
(0C
)
Time(s)
Black Paint Coated Metal vs leaf
P0(M) P0(L)
BEST 2015 , IISc Bangalore
Fig 12. Temperature variation of three points on the black coated metallic leaf.
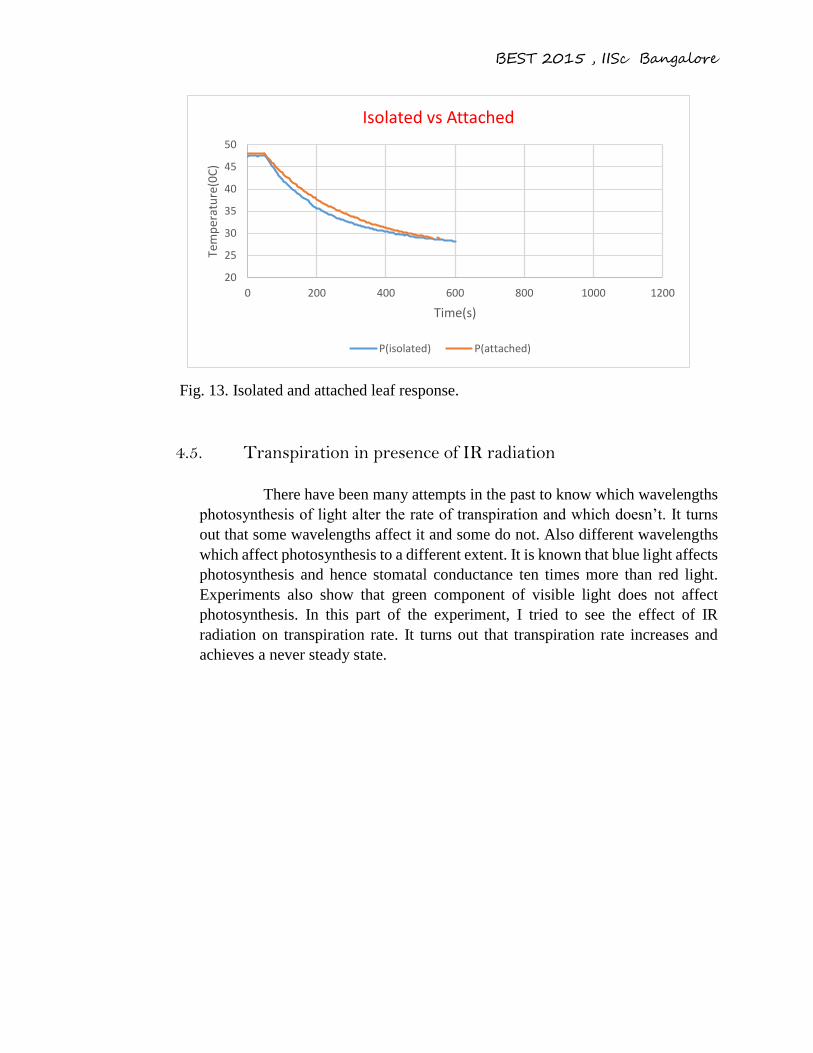
4.4. Cooling curves of a leaf attached to a plant and an isolated leaf: In order to get clearer picture of effect of transpiration on cooling of leaf,
I tried to carry this experiment on a just detached leaf so that mass remains
approximately same along with the properties. What I saw is that if I keep the
distance same as in the case of attached leaf, the saturation temperature is much
higher than the one achieved in attached leaf case which proves that transpiration
has the cooling effect on a plant. In order to compare the curves, we increased the
distance between the isolated leaf and the attached leaf so that saturation
temperatures are approximately same and we could compare the cooling curve
20
25
30
35
40
45
50
55
0 100 200 300 400 500 600
Tem
pe
ratu
re(0 C
)
Time(s)
variation of temperature of a metallic strip coated black upon shining IR lamp
p0 p1 p2
BEST 2015 , IISc Bangalore
Fig. 13. Isolated and attached leaf response.
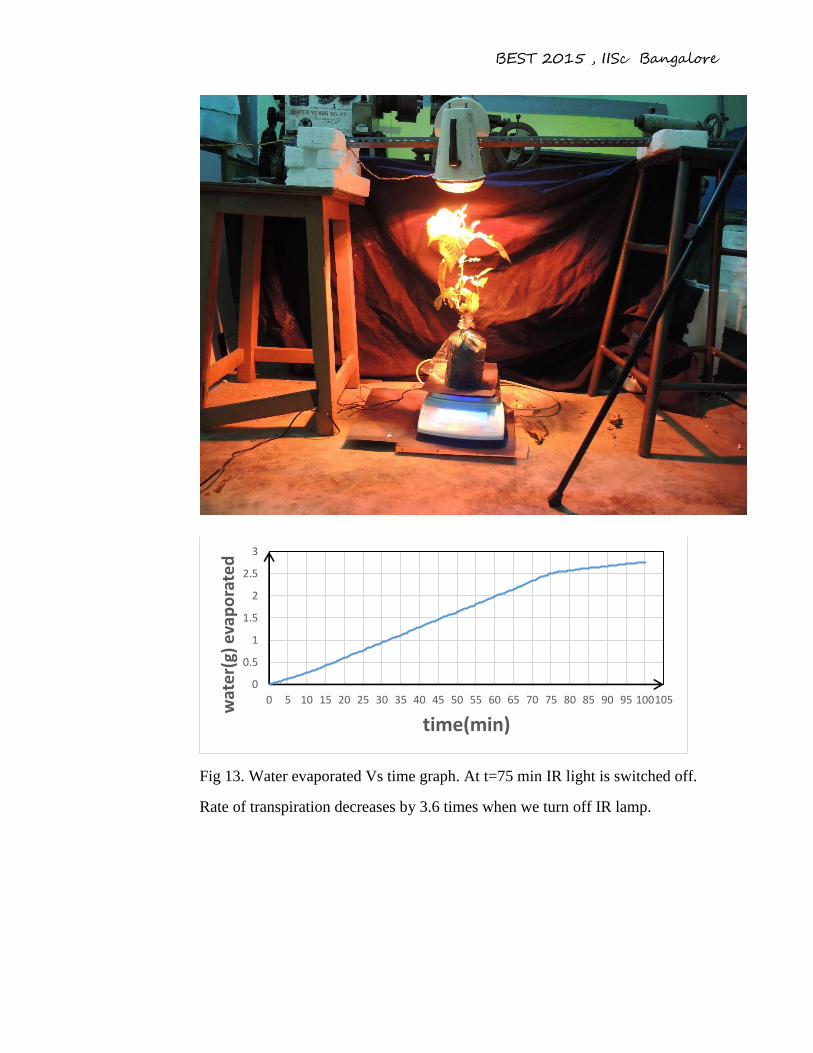
4.5. Transpiration in presence of IR radiation There have been many attempts in the past to know which wavelengths
photosynthesis of light alter the rate of transpiration and which doesn’t. It turns
out that some wavelengths affect it and some do not. Also different wavelengths
which affect photosynthesis to a different extent. It is known that blue light affects
photosynthesis and hence stomatal conductance ten times more than red light.
Experiments also show that green component of visible light does not affect
photosynthesis. In this part of the experiment, I tried to see the effect of IR
radiation on transpiration rate. It turns out that transpiration rate increases and
achieves a never steady state.
20
25
30
35
40
45
50
0 200 400 600 800 1000 1200
Tem
per
atu
re(0
C)
Time(s)
Isolated vs Attached
P(isolated) P(attached)
BEST 2015 , IISc Bangalore
Fig 13. Water evaporated Vs time graph. At t=75 min IR light is switched off.
Rate of transpiration decreases by 3.6 times when we turn off IR lamp.
0
0.5
1
1.5
2
2.5
3
0 5 10 15 20 25 30 35 40 45 50 55 60 65 70 75 80 85 90 95 100105
wat
er(
g) e
vap
ora
ted
time(min)
BEST 2015 , IISc Bangalore
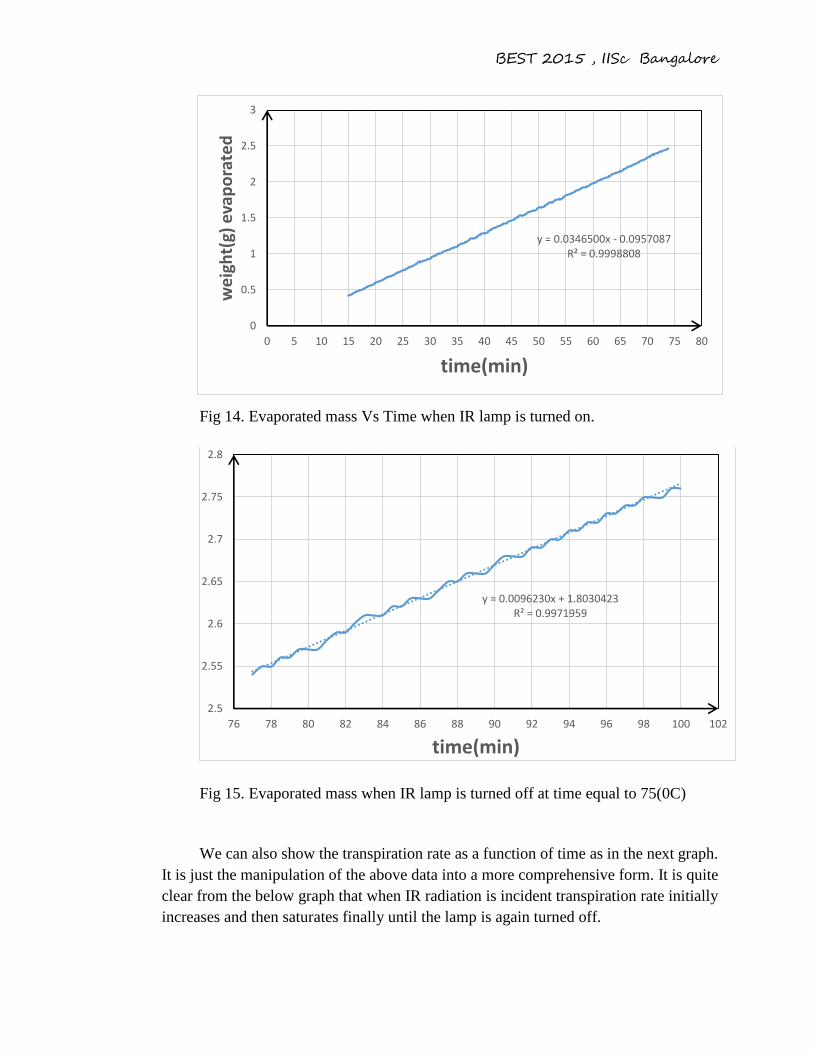
Fig 14. Evaporated mass Vs Time when IR lamp is turned on.
Fig 15. Evaporated mass when IR lamp is turned off at time equal to 75(0C)
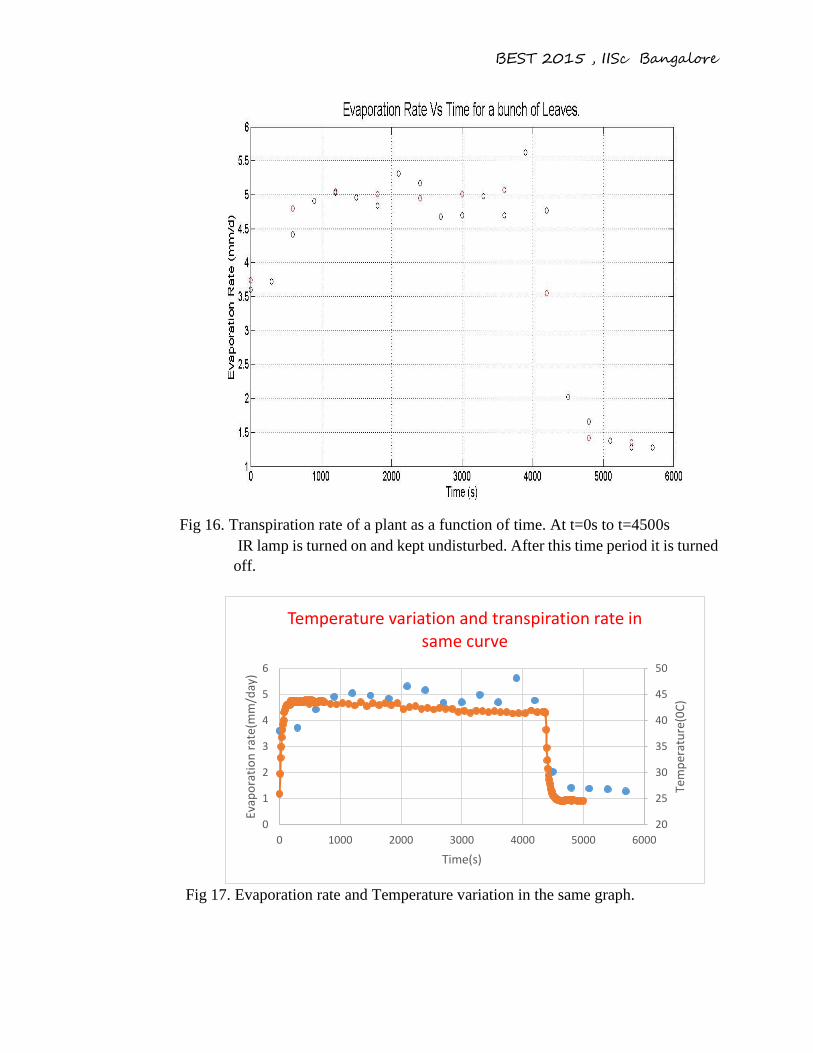
We can also show the transpiration rate as a function of time as in the next graph.
It is just the manipulation of the above data into a more comprehensive form. It is quite
clear from the below graph that when IR radiation is incident transpiration rate initially
increases and then saturates finally until the lamp is again turned off.
y = 0.0346500x - 0.0957087R² = 0.9998808
0
0.5
1
1.5
2
2.5
3
0 5 10 15 20 25 30 35 40 45 50 55 60 65 70 75 80
we
igh
t(g)
eva
po
rate
d
time(min)
y = 0.0096230x + 1.8030423R² = 0.9971959
2.5
2.55
2.6
2.65
2.7
2.75
2.8
76 78 80 82 84 86 88 90 92 94 96 98 100 102
time(min)
BEST 2015 , IISc Bangalore
Fig 16. Transpiration rate of a plant as a function of time. At t=0s to t=4500s
IR lamp is turned on and kept undisturbed. After this time period it is turned
off.
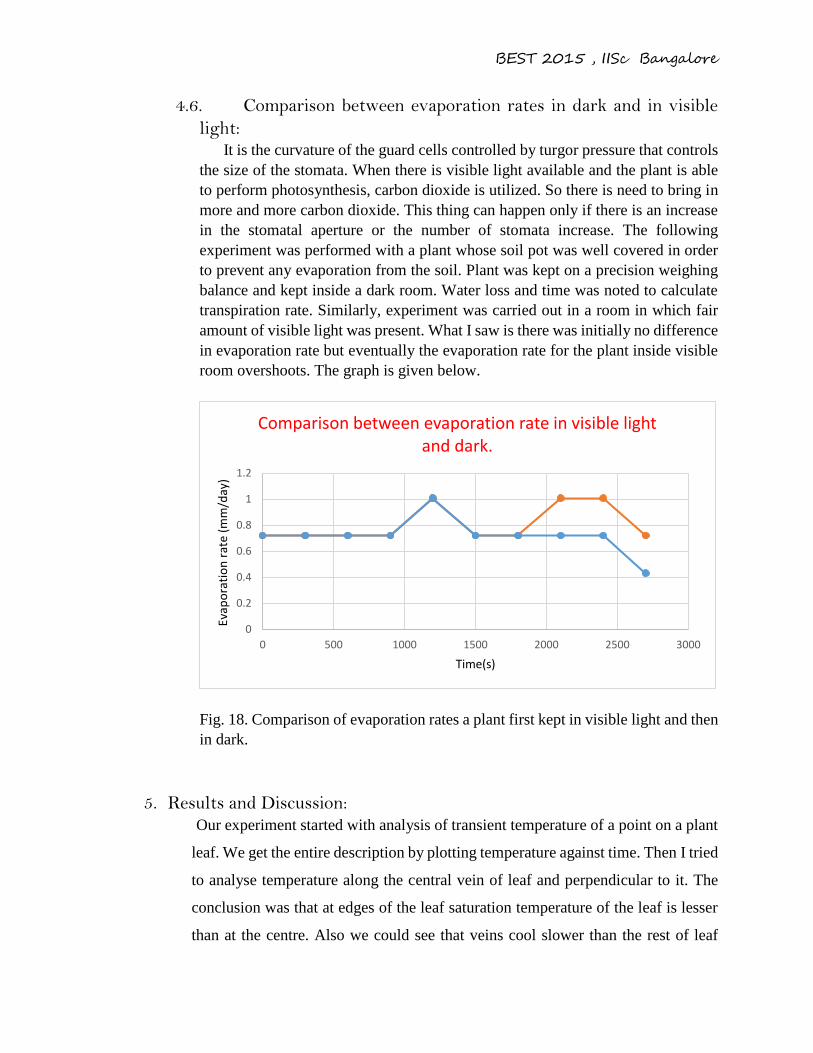
Fig 17. Evaporation rate and Temperature variation in the same graph.
20
25
30
35
40
45
50
0
1
2
3
4
5
6
0 1000 2000 3000 4000 5000 6000
Tem
per
atu
re(0
C)
Evap
ora
tio
n r
ate(
mm
/day
)
Time(s)
Temperature variation and transpiration rate in same curve
BEST 2015 , IISc Bangalore
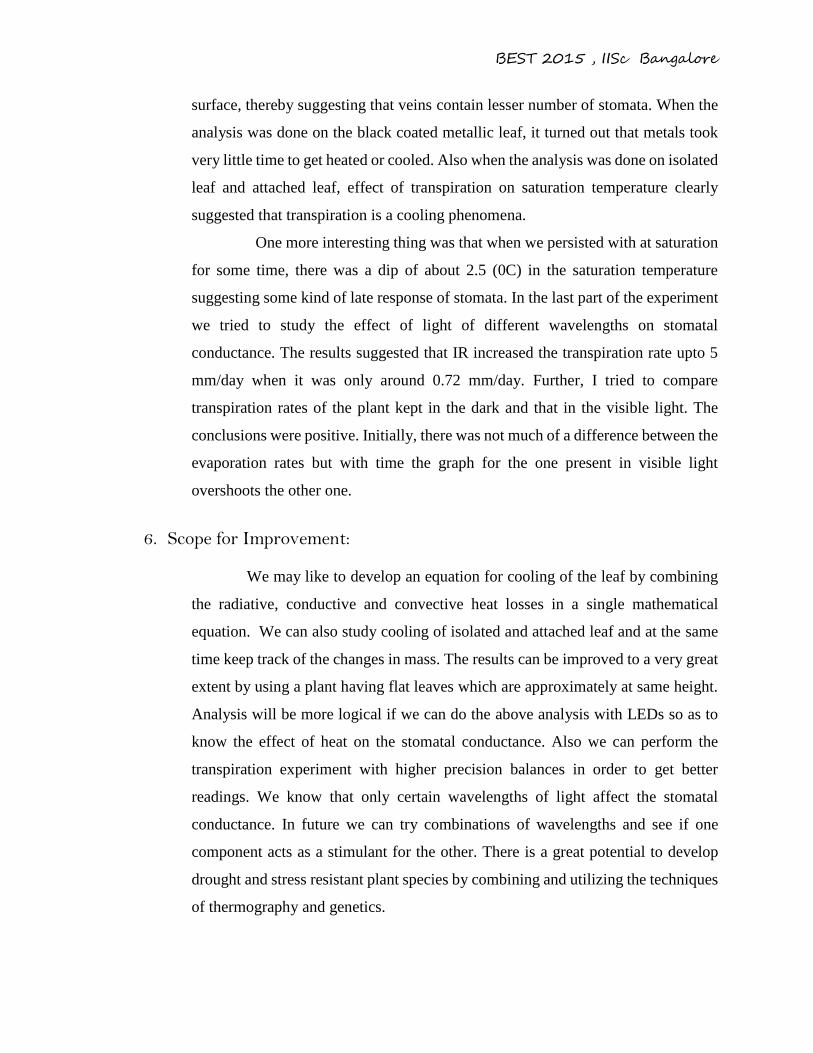
4.6. Comparison between evaporation rates in dark and in visible
light: It is the curvature of the guard cells controlled by turgor pressure that controls
the size of the stomata. When there is visible light available and the plant is able
to perform photosynthesis, carbon dioxide is utilized. So there is need to bring in
more and more carbon dioxide. This thing can happen only if there is an increase
in the stomatal aperture or the number of stomata increase. The following
experiment was performed with a plant whose soil pot was well covered in order
to prevent any evaporation from the soil. Plant was kept on a precision weighing
balance and kept inside a dark room. Water loss and time was noted to calculate
transpiration rate. Similarly, experiment was carried out in a room in which fair
amount of visible light was present. What I saw is there was initially no difference
in evaporation rate but eventually the evaporation rate for the plant inside visible
room overshoots. The graph is given below.
Fig. 18. Comparison of evaporation rates a plant first kept in visible light and then
in dark.
5. Results and Discussion: Our experiment started with analysis of transient temperature of a point on a plant
leaf. We get the entire description by plotting temperature against time. Then I tried
to analyse temperature along the central vein of leaf and perpendicular to it. The
conclusion was that at edges of the leaf saturation temperature of the leaf is lesser
than at the centre. Also we could see that veins cool slower than the rest of leaf
0
0.2
0.4
0.6
0.8
1
1.2
0 500 1000 1500 2000 2500 3000
Evap
ora
tio
n r
ate
(mm
/day
)
Time(s)
Comparison between evaporation rate in visible light and dark.
BEST 2015 , IISc Bangalore
surface, thereby suggesting that veins contain lesser number of stomata. When the
analysis was done on the black coated metallic leaf, it turned out that metals took
very little time to get heated or cooled. Also when the analysis was done on isolated
leaf and attached leaf, effect of transpiration on saturation temperature clearly
suggested that transpiration is a cooling phenomena.
One more interesting thing was that when we persisted with at saturation
for some time, there was a dip of about 2.5 (0C) in the saturation temperature
suggesting some kind of late response of stomata. In the last part of the experiment
we tried to study the effect of light of different wavelengths on stomatal
conductance. The results suggested that IR increased the transpiration rate upto 5
mm/day when it was only around 0.72 mm/day. Further, I tried to compare
transpiration rates of the plant kept in the dark and that in the visible light. The
conclusions were positive. Initially, there was not much of a difference between the
evaporation rates but with time the graph for the one present in visible light
overshoots the other one.
6. Scope for Improvement:
We may like to develop an equation for cooling of the leaf by combining
the radiative, conductive and convective heat losses in a single mathematical
equation. We can also study cooling of isolated and attached leaf and at the same
time keep track of the changes in mass. The results can be improved to a very great
extent by using a plant having flat leaves which are approximately at same height.
Analysis will be more logical if we can do the above analysis with LEDs so as to
know the effect of heat on the stomatal conductance. Also we can perform the
transpiration experiment with higher precision balances in order to get better
readings. We know that only certain wavelengths of light affect the stomatal
conductance. In future we can try combinations of wavelengths and see if one
component acts as a stimulant for the other. There is a great potential to develop
drought and stress resistant plant species by combining and utilizing the techniques
of thermography and genetics.
BEST 2015 , IISc Bangalore
7. References:
[1] C. Davies, Improving plant water use efficiency by physiological measures, J.Exp.
Bot. 55 (3) (2004).
[2] W. Wang, B. Vinocur, A. Altman, Plant responses to drought salinity andextreme
temperatures: towards genetic engineering for stress tolerance,Planta 218 (2003) 1–
14.
[3] R. Avissar, Observations of leaf stomatal conductance at the canopy scale An
atmospheric modeling perspective, Journal Boundary-Layer Meteorology,
Springer, 1993.
[4] M. Milazzo, N. Ludwig, V. Redaelli, in: Evaluation of evaporation flux in
building materials by infrared thermography, Proc. 6th Int. Conf. Quantitative
Infrared Thermography, QIRT 2002, Dubrovnik, 2002, pp. 150–155.
[5] P. Bajons, G. Klinger, V. Schlosser, Determination of stomatal conductance by
means of infrared thermography, Infrared Phys. Technol. 46 (2005) 429–439.
[6] C. S.Garbe, U. Schimpf, U. Schurr, and B. Jähne, Thermographic measurements
in environmental and bio sciences,in: Proc. 6th Int. Conf. Quantitative Infrared
Thermography, QIRT 2002, Dubrovnik, 2002, pp. 24–27.
[7] H.J. Hellebrand, H. Beuche, M. Linke, Thermal imaging: a promising high-tech
method in agriculture and horticulture, in: J. Blahovec, M. Kutílek (Eds.),
Physical Methods in Agriculture Approach to Precision and Quality, Kluwer
Academic/Plenum Publishers, New York, 2002, pp. 411–427.
[8] J.H. Lenthe, E.C. Oerke, H.W. Dehne, Digital infrared thermography for
monitoring canopy health of wheat, Precis. Agr. 8 (15) (2007) 1–2.
[9] L. Chaerle, F. De Boever, D. Van Der Straeten, Infrared detection of early biotic
and wound stress in plants, Thermology Int. 12 (2002) 100–106.
[10] C.N. Charalambous, Water management under drought conditions,
Desalination 138 (2001) 3–6.
[11] L.S. Pereira, T. Oweis, A. Zairi, Irrigation management under water scarcity,
Agric. Water
[12] Joseph J. Atherton∗, Mark C. Rosamond, Dagou A. Zeze A leaf-mounted
thermal sensor for the measurement of water content


![Evolution of the Stomatal Regulation of Plant Water ...Update on Stomatal Evolution Evolution of the Stomatal Regulation of Plant Water Content[OPEN] Timothy J. Brodribb* and Scott](https://img.pdfslide.us/doc/110x75/5e87e202c27a1d71d24f112b/evolution-of-the-stomatal-regulation-of-plant-water-update-on-stomatal-evolution.jpg)


![Stomatal Defense a Decade Later1[OPEN] - Plant Physiology · Update on Stomatal Defense Stomatal Defense a Decade Later1[OPEN] Maeli Melotto*, Li Zhang, Paula R. Oblessuc, and Sheng](https://img.pdfslide.us/doc/110x75/5eddc0a3ad6a402d6668efaa/stomatal-defense-a-decade-later1open-plant-update-on-stomatal-defense-stomatal.jpg)