Embed Size (px)
Citation preview
Study of Thermal Effect on Calibration of an Ultrasonic Flow Meter
Ching-Yi Kuo, Jiunn-Haur Shaw and Chun-Min Su Center for Measurement Standards, Industrial Technology Research Institute, Taiwan
Tel: +886-3-574-1206, Fax: +886-3-571-0335, e-mail: [email protected] Toralf Dietz
SICK AG, Germany Tel: +49-35205-524-13, Fax: +49-35205-524-22, e-mail: [email protected]
Tsai-Wang Huang, Jyh-Rong Wu and Jen-Tsung Luo Chinese Petroleum Corporation, Taiwan
Abstract
A primary high pressure air flow measurement standard was constructed at Center for Measurement Standards (CMS) in Taiwan with a capacity of 18000 m3/h and pressure range of 1 to 60 bar. With present calibration setup, the temperature of air flowing through the meter under test (MUT) decreased significantly during a test. To reduce thermal effect during meter calibration, improvements have been made by expanding the upstream air storage tank from 19 m3 to 34 m3, and installing a new compact sonic nozzle array (CSNA) downstream of the MUT as a new working standard (WS). A re-circulating loop at CMS was retrofitted and completed at the end of 2012. The calibration results of an ultrasonic flow meter (USM) between two different facilities and two different CSNA were compared. Results showed that after expanding the capacity of the upstream air storage tank, the change rate of air temperature during calibration could be reduced. With such decreasing rate, the time-delay problem of temperature measurement at the meter has been alleviated. The calibration of a DN 150 SICK USM showed good comparison between the two different facilities and the two different CSNA as working standard.
1. Introduction To increase the efficiency of energy consumption and decrease the emission of carbon dioxide, the government of Taiwan has adopted natural gas as a fuel source for power generation since the 1980s. Today the amount of liquefied natural gas imported from Indonesia and Qatar adds up to more than 3 million tons per year and it is estimated that the power generation on the basis of natural gas will be around 25 % by 2020. If a metering error of the natural gas consumption goes up by 1 %, the cost risk exceeds 40 million USD yearly. Thus, to assure quality control and measurement accuracy for energy transaction, the Chinese Petroleum Corporation (CPC) has constructed a high pressure air flow calibration laboratory with the assistance of CMS in 2005 to provide calibration services for flow meters with nominal diameters ranging from DN 50 to DN 300. It is an air re-circulating loop with a capacity of 4000 m3/h and pressure range of 1 to 60 bar. The master meter method is used to calibrate the custody transfer meters from natural gas distribution stations and power plants. Four DN 150 USMs (Elster-Instromet Q.Sonic-4 Series-IV QL) combined in parallel are served as their working standard. These four USMs have traceable calibrations by the CSNA of the national flow standard at CMS. Since all custody transfer meters from
natural gas distribution stations and power plants are finally traced back to these four Elster-Instromet USMs, the calibration of these meters at CMS is very important. During a flow meter calibration with the blow-down type high pressure gas flow facility at CMS, large temperature gradients and temporal temperature changes of the air flowing through the meter occur. This is due to decreasing pressure of the upstream air storage tank, and the additional Joule-Thomson effect at the sonic nozzle. The rate of temperature change of the air through the MUT during a test increases with the increasing flowrate and operating pressure. Research has shown that the calibration of USMs could be influenced by pressure and temperature in several ways [1]. In our case, the temperature gradient through the MUT resulting in a non-representative temperature measurement and an unstable flow profile shape influenced due to the density gradient during calibration.
CMS has conducted a series of tests to study the thermal effect on the calibration of a meter. Results have shown that the installation location of the meter corresponding to the CSNA influenced the temperature gradient through the meter and the flow profile as well. A time-delay of the temperature measurement at the meter compared to the calculation based on the speed of sound has also been seen [2]. To reduce the thermal effect during a meter calibration, the upstream air storage tank has been expanded from 19 m3 to 34 m3, and a new CSNA downstream of the MUT was installed. This new working standard is used to calibrate meters which are more sensitive to flow profile change instead of the upstream CSNA. A thermocouple which has faster response than a platinum resistor temperature (PRT) sensor implemented for line temperature measurement at the national flow standard was used to investigate the time-delay of the temperature measurement for further correction. Since the change of air temperature during calibration could also be reflected through the aid of speed of sound (SOS) measurement, a DN 150 USM with a chordal 4 path layout (SICK FLOWSIC 600) was used to compare the acoustic temperature measurements with the PRT and thermocouple sensors.
In addition, according to calibration results of the four Elster-Instromet USMs at CMS during recent years, it was found that the calibration curve of each Elster-Instromet USM differed from year to year. Thus, the SICK USM was installed downstream of each Elster-Instromet USM as a check meter to verify stable operation during calibration. It should be noted that the SICK USM was, before sending to CMS, calibrated with atmospheric air
only. CMS did not implement an adjust factor to this meter, thus, the calibration results presented in this paper are as found data.
The re-circulating loop at CMS was retrofitted and completed at the end of 2012. Tests were conducted for the DN 150 SICK USM at the re-circulating loop as well and compared the results with those obtained from the blow down type facility under the same operating conditions. A calibration of the two-USM package with two different CSNA as working standard was also performed and been compared.
2. Calibration Facility at CMS and Experimental Details
2.1 Primary Calibration Facility
A primary high pressure air flow measurement standard was constructed in Taiwan with a capacity of 18000 m3/h and pressure range of 1 to 60 bar [3]. It is a blow down type facility with a gyroscopic weighing scale suitable for high precision gravimetric measurements. The facility has an expanded uncertainty (k = 2) of 0.18 %. The CSNA installed upstream of the MUT, composed of seven sonic nozzles with different throat diameters in a large plenum, is used as the reference standard meter and provides flexibility in the mass flow control. Another CSNA downstream of the MUT consisting of 13 sonic nozzles, each with nominal flowrate of 40 m3/h, and a single sonic nozzle with nominal flowrate of 500 m3/h, was installed downstream of the MUT for back pressure adjustment.
At the end of 2012, the 500 m3/h single sonic nozzle was replaced by a new CSNA consisting of 3 sonic nozzles, each with nominal flowrate of 170 m3/h, providing more flexibility in the flowrate adjustment. Since previous studies have proven that the installation location of the meter corresponding to the CSNA influences the temperature gradient and the flow profile at the MUT, CMS decided to use the downstream CSNA as the working standard to calibrate MUT which are sensitive to flow profile change during calibration resulting from thermal effect. The downstream CSNA was calibrated by the upstream CSNA, and then it was used to calibrate the two-USM package. The calibration results of the two-USM package by two different CSNA will be described later.
2.2 Re-circulating Loop
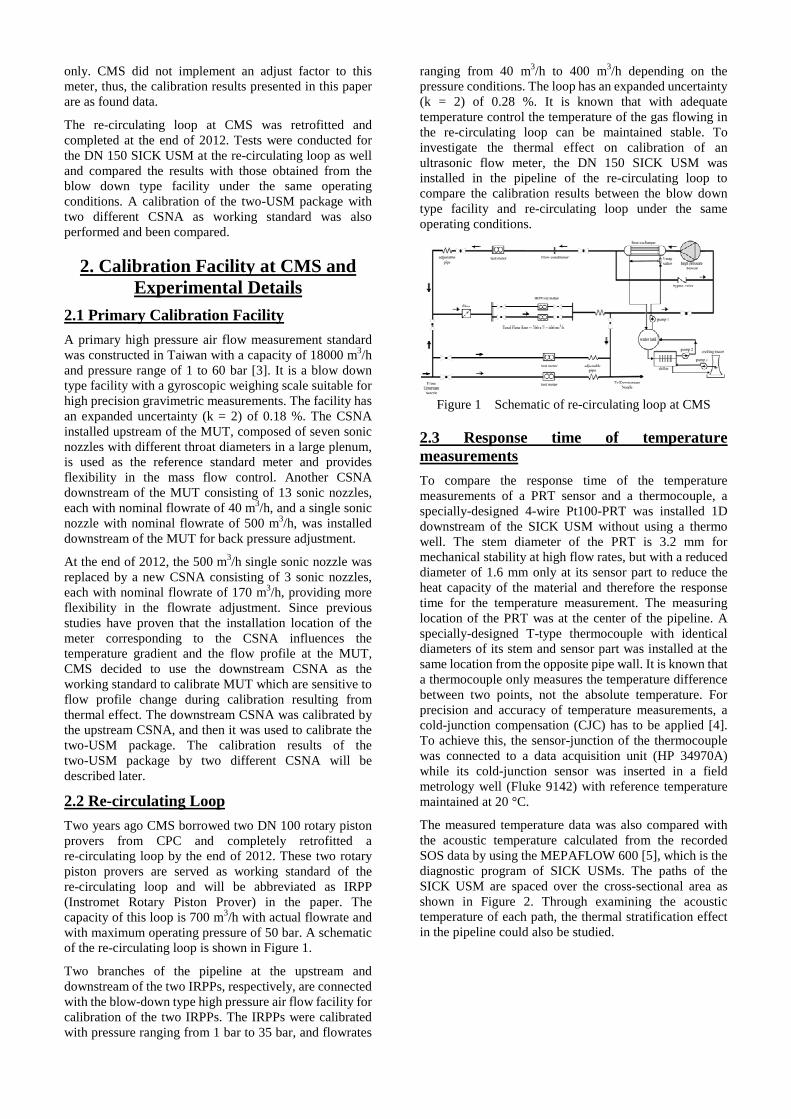
Two years ago CMS borrowed two DN 100 rotary piston provers from CPC and completely retrofitted a re-circulating loop by the end of 2012. These two rotary piston provers are served as working standard of the re-circulating loop and will be abbreviated as IRPP (Instromet Rotary Piston Prover) in the paper. The capacity of this loop is 700 m3/h with actual flowrate and with maximum operating pressure of 50 bar. A schematic of the re-circulating loop is shown in Figure 1.
Two branches of the pipeline at the upstream and downstream of the two IRPPs, respectively, are connected with the blow-down type high pressure air flow facility for calibration of the two IRPPs. The IRPPs were calibrated with pressure ranging from 1 bar to 35 bar, and flowrates
ranging from 40 m3/h to 400 m3/h depending on the pressure conditions. The loop has an expanded uncertainty (k = 2) of 0.28 %. It is known that with adequate temperature control the temperature of the gas flowing in the re-circulating loop can be maintained stable. To investigate the thermal effect on calibration of an ultrasonic flow meter, the DN 150 SICK USM was installed in the pipeline of the re-circulating loop to compare the calibration results between the blow down type facility and re-circulating loop under the same operating conditions.
Figure 1 Schematic of re-circulating loop at CMS
2.3 Response time of temperature measurements
To compare the response time of the temperature measurements of a PRT sensor and a thermocouple, a specially-designed 4-wire Pt100-PRT was installed 1D downstream of the SICK USM without using a thermo well. The stem diameter of the PRT is 3.2 mm for mechanical stability at high flow rates, but with a reduced diameter of 1.6 mm only at its sensor part to reduce the heat capacity of the material and therefore the response time for the temperature measurement. The measuring location of the PRT was at the center of the pipeline. A specially-designed T-type thermocouple with identical diameters of its stem and sensor part was installed at the same location from the opposite pipe wall. It is known that a thermocouple only measures the temperature difference between two points, not the absolute temperature. For precision and accuracy of temperature measurements, a cold-junction compensation (CJC) has to be applied [4]. To achieve this, the sensor-junction of the thermocouple was connected to a data acquisition unit (HP 34970A) while its cold-junction sensor was inserted in a field metrology well (Fluke 9142) with reference temperature maintained at 20 °C.
The measured temperature data was also compared with the acoustic temperature calculated from the recorded SOS data by using the MEPAFLOW 600 [5], which is the diagnostic program of SICK USMs. The paths of the SICK USM are spaced over the cross-sectional area as shown in Figure 2. Through examining the acoustic temperature of each path, the thermal stratification effect in the pipeline could also be studied.
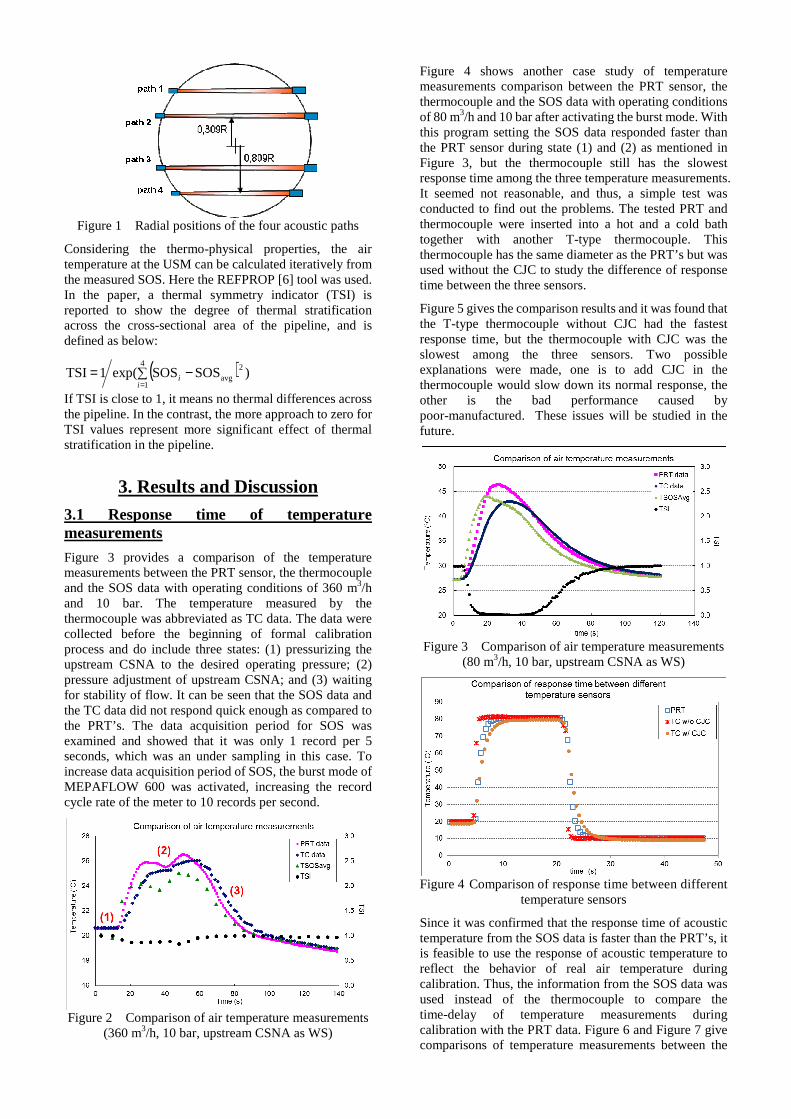
Figure 1 Radial positions of the four acoustic paths
Considering the thermo-physical properties, the air temperature at the USM can be calculated iteratively from the measured SOS. Here the REFPROP [6] tool was used. In the paper, a thermal symmetry indicator (TSI) is reported to show the degree of thermal stratification across the cross-sectional area of the pipeline, and is defined as below:
( ) )SOSSOSexp(1 TSI4
1
2avg∑ −=
=ii
If TSI is close to 1, it means no thermal differences across the pipeline. In the contrast, the more approach to zero for TSI values represent more significant effect of thermal stratification in the pipeline.
3. Results and Discussion
3.1 Response time of temperature measurements
Figure 3 provides a comparison of the temperature measurements between the PRT sensor, the thermocouple and the SOS data with operating conditions of 360 m3/h and 10 bar. The temperature measured by the thermocouple was abbreviated as TC data. The data were collected before the beginning of formal calibration process and do include three states: (1) pressurizing the upstream CSNA to the desired operating pressure; (2) pressure adjustment of upstream CSNA; and (3) waiting for stability of flow. It can be seen that the SOS data and the TC data did not respond quick enough as compared to the PRT’s. The data acquisition period for SOS was examined and showed that it was only 1 record per 5 seconds, which was an under sampling in this case. To increase data acquisition period of SOS, the burst mode of MEPAFLOW 600 was activated, increasing the record cycle rate of the meter to 10 records per second.
Figure 2 Comparison of air temperature measurements
(360 m3/h, 10 bar, upstream CSNA as WS)
Figure 4 shows another case study of temperature measurements comparison between the PRT sensor, the thermocouple and the SOS data with operating conditions of 80 m3/h and 10 bar after activating the burst mode. With this program setting the SOS data responded faster than the PRT sensor during state (1) and (2) as mentioned in Figure 3, but the thermocouple still has the slowest response time among the three temperature measurements. It seemed not reasonable, and thus, a simple test was conducted to find out the problems. The tested PRT and thermocouple were inserted into a hot and a cold bath together with another T-type thermocouple. This thermocouple has the same diameter as the PRT’s but was used without the CJC to study the difference of response time between the three sensors.
Figure 5 gives the comparison results and it was found that the T-type thermocouple without CJC had the fastest response time, but the thermocouple with CJC was the slowest among the three sensors. Two possible explanations were made, one is to add CJC in the thermocouple would slow down its normal response, the other is the bad performance caused by poor-manufactured. These issues will be studied in the future.
Figure 3 Comparison of air temperature measurements
(80 m3/h, 10 bar, upstream CSNA as WS)
Figure 4 Comparison of response time between different
temperature sensors
Since it was confirmed that the response time of acoustic temperature from the SOS data is faster than the PRT’s, it is feasible to use the response of acoustic temperature to reflect the behavior of real air temperature during calibration. Thus, the information from the SOS data was used instead of the thermocouple to compare the time-delay of temperature measurements during calibration with the PRT data. Figure 6 and Figure 7 give comparisons of temperature measurements between the
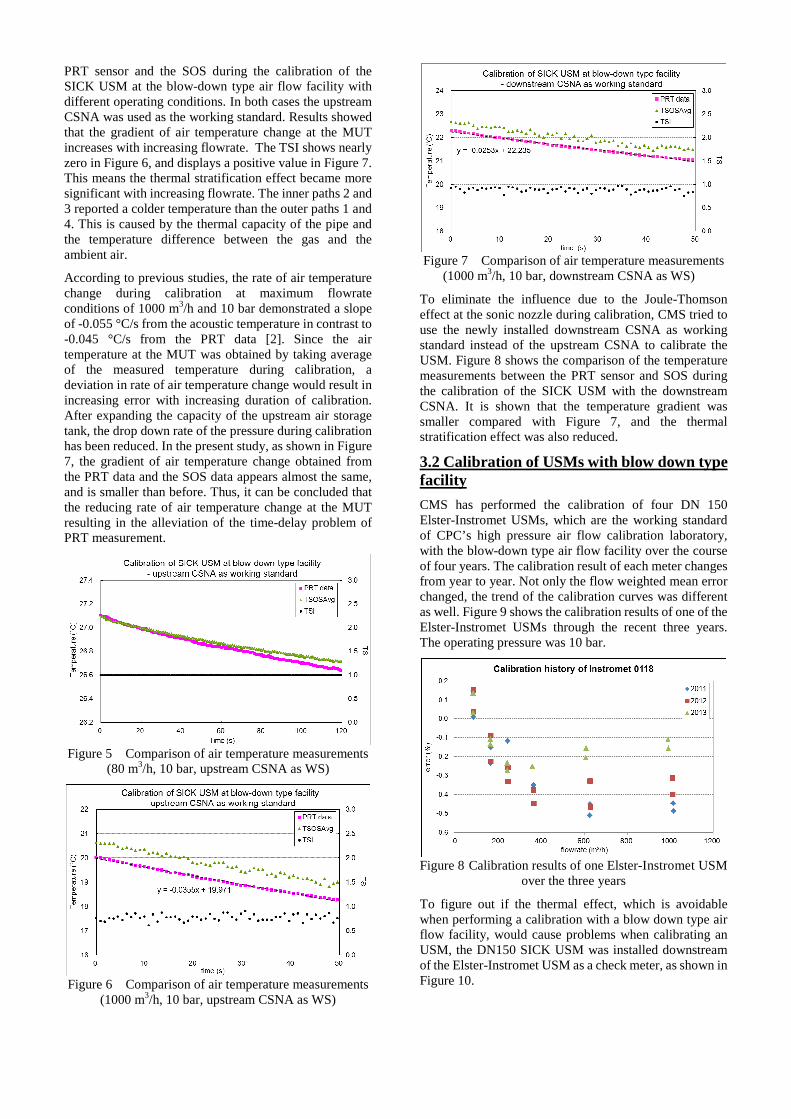
PRT sensor and the SOS during the calibration of the SICK USM at the blow-down type air flow facility with different operating conditions. In both cases the upstream CSNA was used as the working standard. Results showed that the gradient of air temperature change at the MUT increases with increasing flowrate. The TSI shows nearly zero in Figure 6, and displays a positive value in Figure 7. This means the thermal stratification effect became more significant with increasing flowrate. The inner paths 2 and 3 reported a colder temperature than the outer paths 1 and 4. This is caused by the thermal capacity of the pipe and the temperature difference between the gas and the ambient air.
According to previous studies, the rate of air temperature change during calibration at maximum flowrate conditions of 1000 m3/h and 10 bar demonstrated a slope of -0.055 °C/s from the acoustic temperature in contrast to -0.045 °C/s from the PRT data [2]. Since the air temperature at the MUT was obtained by taking average of the measured temperature during calibration, a deviation in rate of air temperature change would result in increasing error with increasing duration of calibration. After expanding the capacity of the upstream air storage tank, the drop down rate of the pressure during calibration has been reduced. In the present study, as shown in Figure 7, the gradient of air temperature change obtained from the PRT data and the SOS data appears almost the same, and is smaller than before. Thus, it can be concluded that the reducing rate of air temperature change at the MUT resulting in the alleviation of the time-delay problem of PRT measurement.
Figure 5 Comparison of air temperature measurements
(80 m3/h, 10 bar, upstream CSNA as WS)
Figure 6 Comparison of air temperature measurements
(1000 m3/h, 10 bar, upstream CSNA as WS)
Figure 7 Comparison of air temperature measurements
(1000 m3/h, 10 bar, downstream CSNA as WS)
To eliminate the influence due to the Joule-Thomson effect at the sonic nozzle during calibration, CMS tried to use the newly installed downstream CSNA as working standard instead of the upstream CSNA to calibrate the USM. Figure 8 shows the comparison of the temperature measurements between the PRT sensor and SOS during the calibration of the SICK USM with the downstream CSNA. It is shown that the temperature gradient was smaller compared with Figure 7, and the thermal stratification effect was also reduced.
3.2 Calibration of USMs with blow down type facility
CMS has performed the calibration of four DN 150 Elster-Instromet USMs, which are the working standard of CPC’s high pressure air flow calibration laboratory, with the blow-down type air flow facility over the course of four years. The calibration result of each meter changes from year to year. Not only the flow weighted mean error changed, the trend of the calibration curves was different as well. Figure 9 shows the calibration results of one of the Elster-Instromet USMs through the recent three years. The operating pressure was 10 bar.
Figure 8 Calibration results of one Elster-Instromet USM
over the three years
To figure out if the thermal effect, which is avoidable when performing a calibration with a blow down type air flow facility, would cause problems when calibrating an USM, the DN150 SICK USM was installed downstream of the Elster-Instromet USM as a check meter, as shown in Figure 10.
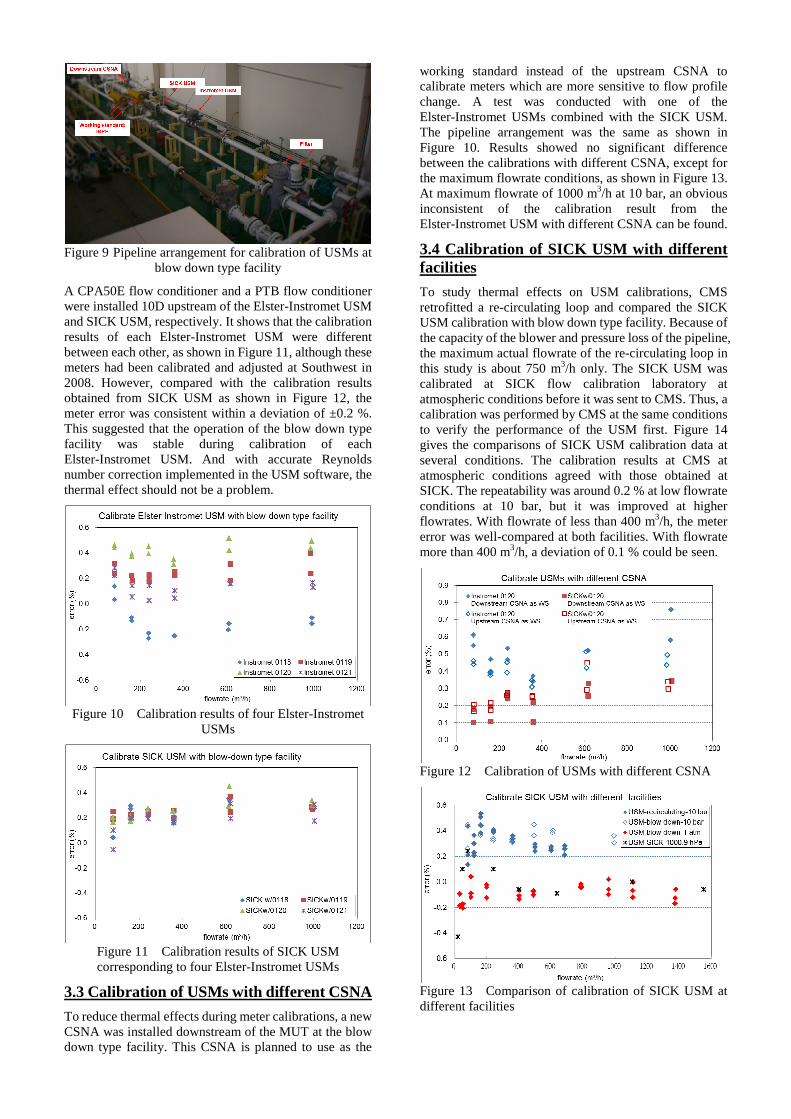
Figure 9 Pipeline arrangement for calibration of USMs at
blow down type facility
A CPA50E flow conditioner and a PTB flow conditioner were installed 10D upstream of the Elster-Instromet USM and SICK USM, respectively. It shows that the calibration results of each Elster-Instromet USM were different between each other, as shown in Figure 11, although these meters had been calibrated and adjusted at Southwest in 2008. However, compared with the calibration results obtained from SICK USM as shown in Figure 12, the meter error was consistent within a deviation of ±0.2 %. This suggested that the operation of the blow down type facility was stable during calibration of each Elster-Instromet USM. And with accurate Reynolds number correction implemented in the USM software, the thermal effect should not be a problem.
Figure 10 Calibration results of four Elster-Instromet
USMs
Figure 11 Calibration results of SICK USM corresponding to four Elster-Instromet USMs
3.3 Calibration of USMs with different CSNA
To reduce thermal effects during meter calibrations, a new CSNA was installed downstream of the MUT at the blow down type facility. This CSNA is planned to use as the
working standard instead of the upstream CSNA to calibrate meters which are more sensitive to flow profile change. A test was conducted with one of the Elster-Instromet USMs combined with the SICK USM. The pipeline arrangement was the same as shown in Figure 10. Results showed no significant difference between the calibrations with different CSNA, except for the maximum flowrate conditions, as shown in Figure 13. At maximum flowrate of 1000 m3/h at 10 bar, an obvious inconsistent of the calibration result from the Elster-Instromet USM with different CSNA can be found.
3.4 Calibration of SICK USM with different facilities
To study thermal effects on USM calibrations, CMS retrofitted a re-circulating loop and compared the SICK USM calibration with blow down type facility. Because of the capacity of the blower and pressure loss of the pipeline, the maximum actual flowrate of the re-circulating loop in this study is about 750 m3/h only. The SICK USM was calibrated at SICK flow calibration laboratory at atmospheric conditions before it was sent to CMS. Thus, a calibration was performed by CMS at the same conditions to verify the performance of the USM first. Figure 14 gives the comparisons of SICK USM calibration data at several conditions. The calibration results at CMS at atmospheric conditions agreed with those obtained at SICK. The repeatability was around 0.2 % at low flowrate conditions at 10 bar, but it was improved at higher flowrates. With flowrate of less than 400 m3/h, the meter error was well-compared at both facilities. With flowrate more than 400 m3/h, a deviation of 0.1 % could be seen.
Figure 12 Calibration of USMs with different CSNA
Figure 13 Comparison of calibration of SICK USM at different facilities
4. Conclusion and Future Works 4.1 Conclusion
To reduce thermal effects during meter calibrations, CMS made some improvements include expanding the upstream air storage tank from 19 m3 to 34 m3, installing a new CSNA downstream of the MUT as a new working standard, and has retrofitted the re-circulating loop. Results showed that with larger capacity of upstream air storage tank, the drop down rate of air pressure during calibration could be reduced, resulting in lower drop down rate of air temperature at the MUT. Under present calibration condition, the time-delay problem of PRT measurement has been alleviated.
When performing calibration of the two-USM package at blow down type facility with the upstream CSNA as working standard, four Elster-Instromet USMs gave different calibration curves, but the calibration results from SICK USM appeared almost the same values.
When performing calibration of the two-USM package at blow down type facility with different CSNA as working standard, no significant difference was found, except for the maximum flowrate conditions. At maximum flowrate of 1000 m3/h at 10 bar with downstream CNSA as working standard, the Elster-Instromet USM showed an obvious deviation from its calibration curve, while the SICK USM remained the same result.
4.2 Future Works
There are two main purposes for CMS to retrofit the re-circulating loop, one is to study the thermal effect on calibration of USMs, and the other is to study the pressure effect on USM calibrations. Because the capacity limitation of the blow down type facility, to calibrate a 150mm USM with a maximum flowrate of 1000 m3/h, the operating pressure cannot excess 10 bar. However, the operating pressure for all custody transfer meters from natural gas distribution stations and power plants are higher than 10 bar, and some of them even operated at 50 bar. Thus, the CPC’s high pressure air flow calibration laboratory should have capability to calibrate these USMs at these flow conditions for a specific accuracy requirement. At present, the working standards of CPC’s high pressure air flow calibration laboratory are traced back to CMS at 10 bar, and are used to calibrate meters according to their field conditions by changing the density settings in the meter to the corresponding values. CMS will study if this is a feasible way in the future.
Acknowledgements
This work was supported by SICK AG with providing great technical assistance; CMS would also like to thank CPC for lending two IRPPs to help retrofit the re-circulating loop.
References [1] Hallanger, A., Frøysa, K.-E. and Lunde, P. Pressure and Temperature Effects for Ormen Lange Ultrasonic Gas Flow Meters 25th International North Sea Flow Measurement Workshop (Gardermoen, Norway, 16 - 19 October 2007).
[2] Kuo, C.-Y., Ho, Y.-L., Dietz T., Wang, W.-B., Yang, F.-R., Su, C.-M. and Shaw, J.-H. Calibration of Ultrasonic Flow Meter Using Blow-down Type High Pressure Gas Flow Standard 8th ISFFM (Colorado Spring, CO, USA, June 20-22, 2012).
[3] Yang, F.-R., Ho, Y.-L., Wang, W.-B., Shaw, J.-H., Huang, T.-W., Wu J.-R., Chen, Z.-Y., Cheng, Y.-H., Su, Z.-X. and Li, T. Traceable Calibrations from Primary Standard to On-Site Ultrasonic Flowmeter 15th Flow Measurement Conf. (Taipei, Taiwan, October 13-15, 2010).
[4] Kerlin, T.W. and Johnson M.P. (September/October 2011) Thermocouples: What One Needs To Know InTech. Retrieved 2012-09-04.
[5] FLOWSIC600 Ultrasonic Gas Flow Meter: Ultrasonic Gas Flow Meter for Custody Transfer and Process Applications, Technical Information 8010125 V2.0 SICK MAIHAK GmbH.
[6] NIST Reference Fluid Thermodynamic and Transport Properties Database (REFPROP): Version 9.0.