Embed Size (px)
Citation preview
Study of the interactionS and dependencieS of Balancing MarketS, intraday trade and autoMatically activated reServeStren/c2/84/2007
September 2008
Final report


MVV-TA/4NT/107166/000/01 • 10.02.09 Final report
This
doc
umen
t is
the
prop
erty
of S
uez-
Trac
tebe
l s.a
. An
y du
plic
atio
n or
tran
smis
sion
to th
ird p
artie
s is
forb
idde
n w
ithou
t its
prio
r app
rova
l.
STUDY ON INTERACTION AND DEPENDENCIES OF BALANCING MARKETS, INTRADAY TRADE AND AUTOMATICALLY ACTIVATED RESERVES
FINAL REPORT
FEBRUARY 2009

MVV-TA/4NT/107166/000/01 • 10.02.2009 Final report 1⏐80
TABLE OF CONTENTS
EXECUTIVE SUMMARY.........................................................................................................................5
1. INTRODUCTION..........................................................................................................................9 1.1. BACKGROUND AND PURPOSE OF THE STUDY .........................................................................9 1.2. CONTENT AND STRUCTURE OF THE REPORT ..........................................................................9
2. BASICS OF REAL-TIME BALANCING......................................................................................11 2.1. TSO RESPONSIBILITY TO GUARANTEE POWER SYSTEM SECURITY...................................11
2.1.1. Different approaches to maintaining system security ......................................11 2.1.2. System operation with Preventive Security Margins .......................................12 2.1.3. Maintaining system security in stand-alone systems.......................................12 2.1.4. Maintaining system security in interconnected systems..................................12
2.2. REAL-TIME BALANCING IN A LIBERALISED MARKET CONTEXT ............................................14 2.2.1. Procurement of balancing services..................................................................15 2.2.2. Imbalance settlement .......................................................................................21 2.2.3. Relation between real-time and wholesale markets ........................................24
3. ISSUES RELATED TO A LACK OF HARMONISATION AND CENTRALISATION.................27 3.1. DISTORTIONS IN CROSS-BORDER WHOLESALE (DAY-AHEAD AND INTRA-DAY) TRADE ..27 3.2. INEFFICIENCIES IN GRID SECURITY MANAGEMENT...............................................................28
3.2.1. Decentralised calculation of cross-border transfer capacities .........................29 3.2.2. Impact of increased cross-border power flows ................................................31 3.2.3. Impact of increased variability of generation dispatch.....................................32 3.2.4. Impact of inaccurate information exchange .....................................................33 3.2.5. What is actually the biggest problem? .............................................................33
4. PREREQUISITES FOR CROSS-BORDER BALANCING IMPLEMENTATION.......................37 4.1. DIFFERENT APPROACHES TO CROSS-BORDER BALANCING IMPLEMENTATION ..............37
4.1.1. TSO-BSP versus TSO-TSO trading.................................................................37 4.1.2. TSO-TSO real-time energy trading ..................................................................38 4.1.3. TSO-TSO reserve trading ................................................................................38 4.1.4. One regional control area.................................................................................38
4.2. MINIMUM HARMONISATION OF REAL-TIME MARKET DESIGNS.............................................38
MVV-TA/4NT/107166/000/01 • 10.02.2009 Final report 2⏐80
4.3. POTENTIAL BARRIERS TO IMPLEMENTING A MORE ADVANCED CROSS-BORDER BALANCING APPROACH ................................................................................................................................... 39
4.4. INTERCONNECTION CAPACITY RESERVATIONS .................................................................... 40 4.4.1. Exchange of security insurance services conditional on interconnection capacity
reservations ......................................................................................................41 4.4.2. Exchange of real-time energy delivery services conditional to real-time
interconnection availability ...............................................................................42 4.5. POTENTIAL BENEFITS AND COSTS OF IMPLEMENTING CROSS-BORDER BALANCING .... 44
5. RECOMMENDATIONS ON HARMONISATION AND CENTRALISATION ..............................49 5.1. NEED FOR MARKET-BASED REAL-TIME ENERGY PRICES..................................................... 50 5.2. MEANING OF MARKET-BASED: ALLOCATION OF ENERGY PAYMENTS ............................... 50
5.2.1. Separate imbalance settlement to counteract the side effects of two-price systems..........................................................................................................................53
5.3. MEANING OF MARKET-BASED: ALLOCATION OF CAPACITY PAYMENTS ............................ 53 5.3.1. Reason for the existence of capacity payments ..............................................54 5.3.2. Allocation of capacity payments via real-time energy price.............................55
5.4. IMPLICATIONS OF MARKET- BASED.......................................................................................... 59 5.4.1. Need for restrictions on the amount of reserves..............................................59 5.4.2. Infeasibility of market-based design at national level ......................................60 5.4.3. Different market designs for security insurance and real-time energy delivery
services.............................................................................................................61 5.5. NEED FOR INCREASED GRID MANAGEMENT INTEGRATION ................................................ 61
5.5.1. Adequate information exchange ......................................................................62 5.5.2. Sufficient situational awareness.......................................................................62 5.5.3. Coordinated and integrated security analysis..................................................63 5.5.4. Efficient transfer capacity calculation and allocation .......................................63
6. CONCLUDING OVERVIEW.......................................................................................................65
ANNEX 1: NEGATIVE SIDE EFFECTS OF TWO-PRICE SYSTEMS WITH PENALTIES ..................69 A. IMPACT OF IMBALANCE PRICING ON WHOLESALE TRADE................................................... 70 B. IMPACT OF IMBALANCE SETTLEMENT ON THE PROVISION OF BALANCING SERVICES... 72 C. IMPACT OF IMBALANCE SETTLEMENT ON NOMINATIONS .................................................... 73
ANNEX 2: INTERFERENCE OF CONGESTION WITH THE REAL-TIME ENERGY PRICE.............75
ANNEX 3: IMBALANCES WITHIN SETTLEMENT PERIOD................................................................77
ANNEX 4: FREQUENCY VARIATIONS DUE TO PERIODIC ORGANISATION OF INTERNATIONAL TRADE .........................................................................................................79
MVV-TA/4NT/107166/000/01 • 10.02.2009 Final report 3⏐80
LIST OF FIGURES AND TABLES
Figure 1: Balancing services procurement and imbalance settlement by TSO .................................. 15
Figure 2: TSO versus BRP balancing responsibility in UCTE .......................................................... 21
Figure 3: BRP imbalances versus system imbalance ......................................................................... 23
Figure 4: Relation between real-time and wholesale markets............................................................ 24
Figure 5: Possible distortions following non-harmonised imbalance settlement ............................... 28
Figure 6: Historical evolution of electricity exchanges within UCTE (blue) and with third countries (red).................................................................................................................................................... 31
Figure 7: Evolution of simultaneous cross-border power flows in the UCTE grid for 3rd Wednesday of the month – peak and off-peak situations ...................................................................................... 32
Figure 8: Possible distortions resulting from non-harmonised procurement ..................................... 40
Figure 9. Common merit order BE-FR on 29 November 2008.......................................................... 46
Figure 10: Volatility of revenues in wholesale versus real-time markets .......................................... 54
Figure 11: Allocation of costs caused by congestion ......................................................................... 75
Figure 12: Intra-settlement period imbalances................................................................................... 77
Figure 13: UCTE frequency average - profile 2003 to 2007 (January to March) .............................. 79
Table I: Categorisation of balancing services .................................................................................... 18
Table II: Activated volumes of primary and secondary reserves in Belgium (2007)........................ 19
Table III: Procurement and remuneration of services in some EU countries..................................... 20
Table IV: Use of penalties in imbalance pricing in the Central West Region.................................... 28
Table V: Potential benefits and limitations of cross-border balancing on 29 November 2008 (9.00 a.m. - 2.00 p.m.) ................................................................................................................................. 47
Table VI: Imbalance settlement through a typical one-price system ................................................. 51
Table VII: Imbalance settlement through a typical two-price system................................................ 52

MVV-TA/4NT/107166/000/01 • 10.02.2009 Final report 4⏐80
Table VIII: Allocation of capacity payments via the real-time energy price......................................58
Table IX: Market-based design for security insurance and real-time energy delivery services .........61
Table X: Input data for examples – One-price system .......................................................................70
Table XI: Input data for examples – Two-price system .....................................................................70
Table XII: Example on the impact of imbalance pricing on wholesale trade.....................................71
Table XIII: Example impact of imbalance pricing on provision of balancing services......................72
Table XIV: Example on the impact of imbalance pricing on nominations.........................................74
MVV-TA/4NT/107166/000/01 • 10.02.2009 Final report 5⏐80
EXECUTIVE SUMMARY Since the launch of electricity sector liberalisation in the EU, the creation of the Internal Electricity Market (IEM) has been high on the agenda of the European Commission (EC) and European energy regulators. Considerable effort has been put into integrating national electricity markets, prompting a number of successful regional initiatives. Balancing markets spanning national frontiers are an important step towards completing the IEM.
Against this backdrop, the EC (DG TREN) commissioned this study with the purpose of deriving practical recommendations on the optimal design and effective implementation of cross-border balancing or real-time markets. To ensure the compatibility of market-oriented recommendations with the physical reality of interconnected power systems, the study was conducted by an integrated team of engineers and economists from Tractebel Engineering and the Katholieke Universiteit Leuven (K.U. Leuven).
ROADMAP TO CROSS-BORDER BALANCING
The main recommendations developed in this report have been arranged into a practical roadmap that should facilitate the gradual, efficient implementation of cross-border balancing in the EU. This roadmap comprises the following three consecutive phases:
PHASE 1: Implementation with minimum prerequisites
It is often claimed that implementing cross-border balancing without harmonising national real-time market designs and centralising grid security management entails various distorting effects and inefficiencies. However, to a certain extent such distortions already exist today – due to an increasingly integrated day-ahead and intra-day trade – and will only aggravate if cross-border balancing is implemented without further harmonisation and centralisation. In addition, current national real-time markets are often more regulated than market-based. The dominant positions held by key regulating power providers and the lack of liquidity simply make some real-time markets incapable of functioning properly on a national scale. Consequently, real-time markets should be enlarged first through implementing cross-border balancing trade before national market designs can be harmonised in a market-based way. Finally, the implementation of cross-border balancing yields significant benefits that can be achieved without imposing unrealistic or overly expensive preconditions.
Accordingly, the recommendation is to proceed with cross-border balancing implementation that only takes account of minimum prerequisites, for this will ensure that implementation is both fast and smooth. A similar approach has proven successful for the Nordic cross-border balancing initiative and the Trilateral Day-Ahead Market Coupling between Belgium, France and the Netherlands. Both initiatives have proven capable of triggering harmonisation and centralisation, rather than requiring them from the start.
Minimum prerequisites are both market- and technically oriented. To begin with, the technical characteristics of balancing services need to be harmonised. In addition, harmonisation of gate closure times is recommended as well, right from the outset, since different gate closure times will give rise to asymmetric market opportunities and varying imbalance exposures on either side of the respective borders. Limiting cross-border balancing trade solely to excess services is acceptable in this phase, since national differences in the remuneration method for balancing services may act as a barrier to exchanging all services via a common merit order.
MVV-TA/4NT/107166/000/01 • 10.02.2009 Final report 6⏐80
The second type of prerequisites concerns reserving interconnection capacity for cross-border exchange of balancing services. Here, a distinction should be drawn between the exchange of security insurance services, on the one hand, being services mainly deployed for capacity purposes and delivering only a marginal amount of energy in the real-time, and real-time energy delivery services on the other, these being mainly deployed to supply energy, delivering a substantial quantity of energy in the real-time. Cross-border trade in the former type of services, to stabilise frequency following major incidents (e.g. automatically activated primary control), requires a mandatory reservation of dedicated interconnection capacity. Being vital to system security, it is extremely important that such activation does not cause any perverse effects that undermine the security of the interconnected grid. On the other hand, reservation of cross-border capacity is not recommended for the exchange of the second type of services, as it would interfere with wholesale energy trade. Consequently, these cross-border services can only be activated subject to grid availability. If energy cannot be exchanged across borders in real-time, adequate reserves must be committed locally (either in the form of redundant local reserves or by implementing dedicated system protection schemes such as interruptible loads). If the activation of real-time energy delivering services is automatic, Automatic Generation Control (AGC) needs to be organised in such a way that resources outside the control area are only used conditional on transfer capacity availability. Finally, for both types of services, preventive security rules applied in Europe require that the feasibility of grid operations is guaranteed and checked in advance.
PHASE 2: Harmonisation of remuneration for services
As indicated above, national differences in the method for remunerating balancing services – i.e. capacity and/or energy payments – may hamper the exchange of services via common merit order in the first phase. More specifically, TSOs reserving relatively more services using capacity payments may be reluctant to exchange their services as they fear ‘losing’ their reserves, the costs of which are often borne by their own grid users.
Thus, to extend the cross-border procurement of balancing services from excess services only to all services – via the use of a common merit order – this second phase includes harmonising the way in which services are remunerated.
Recommendations on the harmonisation of service remuneration are linked with and can be derived from the recommendations on the harmonisation of imbalance settlements listed under PHASE 3.
PHASE 3: Harmonisation of imbalance settlement
While the initial phase enables benefiting from cross-border balancing at minimal cost, it does not eliminate the distorting effects of insufficiently harmonised imbalance settlements on day-ahead and intra-day trade or any inefficiencies stemming from a lack of centralisation. For this reason, the initial implementation of cross-border balancing should be further optimised in this final phase.
Two main recommendations need to be taken into account here. Firstly, with respect to harmonising real-time market designs, a distinction should again be drawn between security insurance and real-time energy delivery services. The former should be procured using capacity payments only, and their costs should be socialised, whereas the latter should preferably be remunerated solely through energy payments. Capacity payments can be allowed for a transitional period, but should ultimately be phased out. The costs of procuring these services should be passed on to imbalanced Balance Responsible Parties (BRPs) via the imbalance settlement. This imbalance settlement should be cost-reflective
MVV-TA/4NT/107166/000/01 • 10.02.2009 Final report 7⏐80
and market-based, implying that no other components such as power exchange prices or penalties are included in the real-time energy price. An additive component is however needed to settle possible capacity payments. To limit the impact of this additive component on overall real-time energy prices, the volume of real-time energy delivery services contracted using capacity payments should be limited – and abolished in the long run – so that real-time energy prices are based mainly on balancing services procured in real-time, rather than dominated by the capacity component.
Secondly, with respect to the integration of grid security management, an information exchange system should be developed that is capable of providing a full picture of the power system state and enables the identification of necessary and the most efficient control actions. TSOs must have a way of gaining sufficient situational awareness at any time, enabling them to identify with a high degree of certainty the effects of different actions on the power system as a whole. Next, security analyses need to be performed in a coordinated and integrated way, to make sure that actions taken by TSOs are screened from the grid security point of view. Finally, efficient cross-border transfer capacity calculation and allocation schemes should be implemented, to guarantee that due account is taken of the interdependencies of power flows in the meshed, interconnected grid.

MVV-TA/4NT/107166/000/01 • 10.02.2009 Final report 8⏐80
MVV-TA/4NT/107166/000/01 • 10.02.2009 Final report 9⏐80
1. INTRODUCTION
1.1. BACKGROUND AND PURPOSE OF THE STUDY
Since the launch of electricity sector liberalisation in the EU, the European Commission (EC) and the European energy regulating institutions CEER and ERGEG have pursued – and continue to pursue – the creation of an Internal Electricity Market (IEM). So far, a number of stakeholders have made various suggestions regarding the implementation of cross-border balancing trade. An overview of the most relevant documents is provided in Box A. Several practical initiatives have also been put forward in the context of the regions established under the Congestion Management (CM) Guidelines amending Regulation 1228/2003. In addition, following the approval of the third legislative package, Regulation 1228/2003 will – similar to the CM Guidelines – allow for the adoption of binding guidelines on the integration of balancing and reserve markets.
Against this backdrop, the EC (DG TREN), in cooperation with ERGEG, commissioned this study with the purpose of deriving practical recommendations on the optimal design and effective implementation of cross-border balancing or real-time markets. The work in this report was carried out by an integrated team of engineers and economists from Tractebel Engineering and Katholieke Universiteit Leuven (KUL) – Research group Electa: Ronnie Belmans, Jacques Deuse, Leonardo Meeus, Konrad Purchala, Marc Stubbe and Leen Vandezande. Moreover, to ensure a broad base, this study was drafted independently while consulting and seeking input from ERGEG, ETSO, Eurelectric, NORDEL and UCTE and was reviewed by Prof. Jean Michel Glachant and Dr. Marcelo Saguan from Université Paris XI – Groupe Réseaux – Jean Monnet.
1.2. CONTENT AND STRUCTURE OF THE REPORT
The report is organised as follows:
• Section 2 explains the basics of real-time balancing, taking into account both technical and market-related aspects.
• Section 3 discusses issues arising from a lack of harmonisation and centralisation of real-time balancing within Europe. The distorting effects of insufficiently harmonised real-time market designs on –increasingly integrated – wholesale trade are identified, as are inefficiencies resulting from a lack of centralisation of security management.
• Section 4 identifies minimum prerequisites – both from a security and market-related point of view – and potential barriers for the implementation of cross-border balancing trade. Given that inefficiencies related to insufficient harmonisation and centralisation of real-time balancing also occur without cross-border balancing trade taking place, it is recommended to proceed with implementing cross-border balancing, taking into account only minimum prerequisites, and further harmonise and centralise at a later stage. A similar approach has proven successful for the Nordic cross-border balancing initiative and the Trilateral Day-Ahead Market Coupling between Belgium, France and the Netherlands. Although market parties initially only agreed upon a decentralised approach, a natural tendency towards more harmonisation and centralisation has been gradually emerging since its implementation. This section also includes a case study illustrating the potential benefits and costs of implementing cross-border balancing.
MVV-TA/4NT/107166/000/01 • 10.02.2009 Final report 10⏐80
• Section 5 sets out recommendations aiming to reduce inefficiencies resulting from insufficient harmonisation and centralisation and achieve optimally functioning cross-border balancing implementation. Harmonisation towards a real-time market design ensuring cost-reflective real-time prices and increased integration of grid management are also recommended.
• Section 6 recapitulates the main conclusions and recommendations formulated in this report, which can serve as concrete input for the adoption of future guidelines under the amendments to Regulation 1228 proposed in the third legislative package. Furthermore, a practical roadmap is outlined to guide cross-border balancing implementation.
Box A: Overview of most relevant stakeholder documents
European Commission (DG TREN) Available at http://ec.europa.eu/energy • Benefits and Practical Steps towards the Integration of Intraday Electricity Markets
and Balancing Mechanisms, December 2005.
European Energy Regulators (ERGEG & CEER) Available at http://www.ergeg.org • Guidelines of Good Practice for Electricity Balancing Markets Integration,
December 2006.
ETSO Available at http://www.etso-net.org • Current State of Balance Management in Europe, December 2003. • Current state of trading tertiary reserves across borders in Europe, November 2005. • Key Issues in Facilitating Cross-border Trading of Tertiary Reserves and Energy
Balancing, May 2006. • Current State of Balance Management in South-East Europe, June 2006. • Balance management harmonisation and Integration. 4th Report, January 2007 • Current State of Intraday Markets in Europe, May 2007. • Reference Model for Cross-border Intraday Markets, April 2008.
Eurelectric Available at http://www.eurelectric.org • Towards European intra-day and balancing markets, October 2006. • Towards integration of reserves and balancing markets, July 2008.
NORDEL Available at http://www.nordel.org • Balance Management - Common principles for cost allocation and settlement, April
2006. • Harmonization of the balance management, February 2007. • Proposed principles for common balance management, November 2007. • Description of balance regulation in the Nordic countries, March 2008.
UCTE Available at http://www.ucte.org • Ad hoc group ‘Geographical Distribution of Reserves’, July 2005. • Ad hoc group ‘Frequency quality investigation’. Draft final report, April 2008.
MVV-TA/4NT/107166/000/01 • 10.02.2009 Final report 11⏐80
2. BASICS OF REAL-TIME BALANCING Maintaining a real-time balance between electrical energy generated and consumed1 is essential for safeguarding system security. Because of the non-storability of electricity, disturbances of equilibrium between generation and load cause the system frequency to deviate from its set value, which can affect the behaviour of electrical equipment and – in the case of large deviations - may lead to protective disconnection of generation units and eventually a system black-out. For this reason, aberrations in demand, generation and transmission must be handled instantly. Imbalances are initially offset by the kinetic energy of the rotating generating sets and motors connected to the system. The more generators and motors are coupled to the grid, the more kinetic energy the system has and the larger the system’s inertia is. However, regardless of the size of the system’s inertia, it can only slow down frequency deviations and is not in the least able to restore the power balance. Transmission system operators (TSOs), which are entrusted with the task of guaranteeing system security, procure balancing services in the balancing or real-time market accordingly.
This section first outlines how TSOs discharge their system security responsibility and comments upon different possible approaches to maintaining system security. It then provides a basic insight into the technical characteristics of balancing services as well as an introduction to their procurement and settlement in a liberalised market context.
2.1. TSO RESPONSIBILITY TO GUARANTEE POWER SYSTEM SECURITY
All over Europe, TSOs are in charge of maintaining power system security. This task has the highest priority for system operation, since degrading conditions in part of a synchronous system can cause overall system instability. However, as discussed in this section, the way this task is performed differs between countries.
2.1.1. Different approaches to maintaining system security
Maintaining power system security mainly consists in the ability to cope with contingencies, with respect to which two main philosophies exist:
• operating the system with Preventive Security Margins (i.e. N-1), meaning that the system is able to sustain a normative event without causing overloads or other operational problems.
• operating the system without Preventive Security Margins, implying that transiently ‘’insecure’ situations are allowed, and design System Protection Schemes to cope with them.
The two options differ significantly. Operation with Preventive Security Margins entails more security for the TSO as in case of unexpected ‘normative’ events the post-contingency state remains stable. However, the margins also imply that part of the assets is not fully used. Operation with System Protection Schemes, on the contrary, allows exploitation of the assets to a larger extent – there is a lower margin – but, in the event of
1 Note that electrical energy is consumed both by end users and the grid itself- together, this is known as the system load. The system consumes this energy since losses arise during transmission and distribution. For reasons of clarity, a distinction between the two is not made in the remainder of this report.
MVV-TA/4NT/107166/000/01 • 10.02.2009 Final report 12⏐80
contingencies, system security depends on automatic actions and the effectiveness of the system protection schemes.
Making a choice between both philosophies is not always straightforward. In some power systems, Preventive Security Margins are not economically viable - for instance, in the Russian system, with its very long transmission lines connecting generation with load centres. Hence System Protection Schemes remain the only possibility. However, as system security in Europe is primarily based on Preventive Security Margins, only this approach will be further considered in this report.
2.1.2. System operation with Preventive Security Margins
In order to safeguard system security, TSOs perform a feasibility check of the dispatch in their control zone for different time horizons. Time horizons range from months and weeks ahead – i.e. for planning and coordination of power plants’ maintenance and transmission lines – to day-ahead – i.e. for checking feasibility of the scheduled dispatch – and real-time – i.e. the operational stage.
For maintenance planning purposes, TSOs’ actions mainly aim to identify possible problems under standard conditions. At the day-ahead stage, specific information on the dispatch of power plants – collected from the schedules of grid users – becomes available. Feasibility with respect to the grid is checked, taking into account physical constraints and Preventive Security Margins. To this end, security analysis tools are used, checking all the time horizons requested against normative contingencies. The list of contingencies is predefined, based on years of experience and the best knowledge of the TSOs. Due to the time gap between day-ahead system planning and real-time, the actual system state can be different to that expected. Security analyses are therefore run continuously to identify potential system weaknesses and take preventive countermeasures when needed.
2.1.3. Maintaining system security in stand-alone systems
In a stand-alone power system, security is entirely in the hands of the TSO. It must keep sufficient operational reserves to meet security standards. For instance, the reserves must be large enough to cope with the most severe incident, which is usually the loss of the largest generator. Without interconnections, all reserves must be kept local and need to react fast enough to prevent the frequency from dropping to an unacceptable level. The generation-load equilibrium must be restored in a matter of seconds – depending on the dynamic behaviour of the frequency and the severity of the incident – by activating reserves. This is done either by increasing generation or decreasing load (i.e. interruptible loads). The contribution of generation versus load mainly depends on availability and quality, e.g. whether the available generation reserves are fast enough. Following this initial action, reserves must be restored to prepare the system for another incident.
In a stand-alone system, no outside event can cause security degradations. Moreover, predictions of post-contingency states are more accurate.
2.1.4. Maintaining system security in interconnected systems
With technical advancements enabling the construction of larger generation units (i.e. nuclear power plants), the need for reserves within control zones has increased. This has resulted in the interconnection of stand-alone control zones to form larger synchronous areas, allowing reserves to be pooled. Thanks to this development, units with sizes exceeding 1,000 MW could be built since the relative importance of the most severe
MVV-TA/4NT/107166/000/01 • 10.02.2009 Final report 13⏐80
incident – i.e. the loss of the largest generator – decreased as system size increased. This is especially important during low load conditions as the frequency drop for an equivalent incident is higher during off-peak than peak conditions due to lower system inertia. The larger the size of the synchronous area, the larger the system inertia and the more easily a frequency drop following a contingency can be contained without the need for curative load shedding, even during less favourable system conditions such as low demand.
One of the negative consequences of synchronous interconnections is that incidents in one control zone can affect the whole synchronous area. Coherent security rules are therefore essential. However, they are implemented in a decentralised way. Two fundamental principles underpin this system:
• Solidarity: control areas help each other in the event of disturbances.
• Responsibility: each control area is responsible for managing its system in a technically and economically sound manner2.
The main rule of this decentralised security management structure consists in the TSO of each control zone being responsible for the security of its own system, for instance by implementing preventive N-1 security, ensuring that there are enough reserves, etc. However, such ‘local’ actions by TSOs guarantee that all participating control zones are secure under normal and post-contingency conditions.
In the moments directly following a disturbance – for instance, the loss of a large generator – all control zones provide help to compensate for the load-generation disequilibrium according to the principle of Solidarity. This is a fully automated procedure aiming to restore the balance using a control variable that is identical3 for all control zones, allowing as such for an instantaneous and coordinated reaction by the system. Overall system security is, however, based on the local responsibilities of individual TSOs. According to the principle of Responsibility, the affected TSO is therefore obliged to restore preventive security by compensating for the lost unit and bearing the associated costs. Thanks to the limited time horizon in which the control zone must compensate for generation loss (up to 15 minutes), financial flows between the control zones are limited.
The scheme described above lies at the core of security planning in all control areas. It presumes that the post-contingency state for control areas, other than the one where the disturbance took place, is usually more or less equal to the pre-contingency state. Though the internal dispatch of the affected system is most likely different, it is assumed that this will not have a significant impact on other control areas. Furthermore, the scheme assumes that decentralised management of a synchronous zone is feasible. Although the supposition has never been theoretically demonstrated, it has been empirically confirmed by decades of operations in UCTE and NORDEL. Box B indicates how the principles of Solidarity and Responsibility are currently applied in both synchronous areas.
2 In the past, system operators were also responsible for security of supply or energy self-sufficiency. This has changed following liberalisation and unbundling. 3 At least in steady state conditions
MVV-TA/4NT/107166/000/01 • 10.02.2009 Final report 14⏐80
2.2. REAL-TIME BALANCING IN A LIBERALISED MARKET CONTEXT
In order to safeguard system security, TSOs procure balancing services from Balancing Service Providers (BSP). The specific characteristics of these services and the way in which they are typically contracted are discussed in Section 3.2.1.
As frequency control arrangements and related balancing obligations lie at the core of power system security, TSOs discourage market parties from relying on the real-time delivery of balancing services or, in other words, deviating from their announced generation and consumption schedules. They therefore transfer part of their balancing obligation to market participants or their chosen representatives – known as Balance Responsible Parties (BRP) – by making them responsible for keeping their own portfolio balanced over a given timeframe via the imbalance settlement. The BRP concept and the way in which imbalances are typically settled are dealt with in Section 3.2.2.
Figure 1 gives a graphic representation of procurement and settlement and the central role of TSOs in both, and further explanations are provided below.
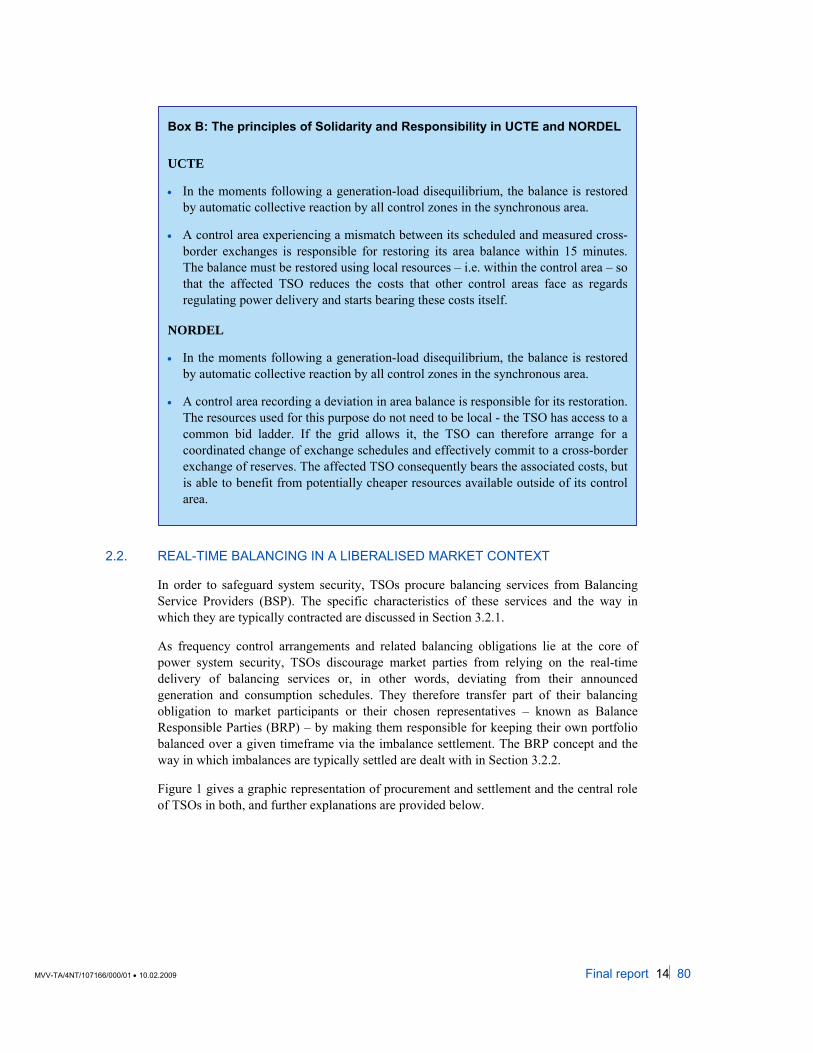
Box B: The principles of Solidarity and Responsibility in UCTE and NORDEL
UCTE
• In the moments following a generation-load disequilibrium, the balance is restored by automatic collective reaction by all control zones in the synchronous area.
• A control area experiencing a mismatch between its scheduled and measured cross-border exchanges is responsible for restoring its area balance within 15 minutes. The balance must be restored using local resources – i.e. within the control area – so that the affected TSO reduces the costs that other control areas face as regards regulating power delivery and starts bearing these costs itself.
NORDEL
• In the moments following a generation-load disequilibrium, the balance is restored by automatic collective reaction by all control zones in the synchronous area.
• A control area recording a deviation in area balance is responsible for its restoration. The resources used for this purpose do not need to be local - the TSO has access to a common bid ladder. If the grid allows it, the TSO can therefore arrange for a coordinated change of exchange schedules and effectively commit to a cross-border exchange of reserves. The affected TSO consequently bears the associated costs, but is able to benefit from potentially cheaper resources available outside of its control area.

MVV-TA/4NT/107166/000/01 • 10.02.2009 Final report 15⏐80
Figure 1: Balancing services procurement and imbalance settlement by TSO BSP = balancing service provider; BRP = balancing responsible party; RT = real-time
2.2.1. Procurement of balancing services
TYPES OF AVAILABLE BALANCING SERVICES
Since the liberalisation of the electricity market, TSOs no longer hold generation resources in direct ownership (in principle) and are consequently forced to procure balancing services to maintain the system balance. These balancing services are mainly provided by generation but load is increasingly contributing to balancing through contractual switching-off schemes. However, technical limitations including the lack of enabling infrastructure such as automatic measurement and the possibility of switching off individual consumer loads still limits the latter’s role in the balancing market.
Typically, a distinction is made between several types of balancing services. These differ mainly in terms of activation method and response speed. The reason for this consists in the technical limitations of generating units, entailing a trade-off between speed (dynamics) and sustainability of response (steady state efficiency). The terminology and the technical prerequisites of balancing services vary widely between and within synchronous zones, partly because of the underlying structural differences, such as generation mix and inertia of the system. Box C provides an overview of different generation technologies and their capabilities and limitations with respect to the provision of balancing services.
MVV-TA/4NT/107166/000/01 • 10.02.2009 Final report 16⏐80
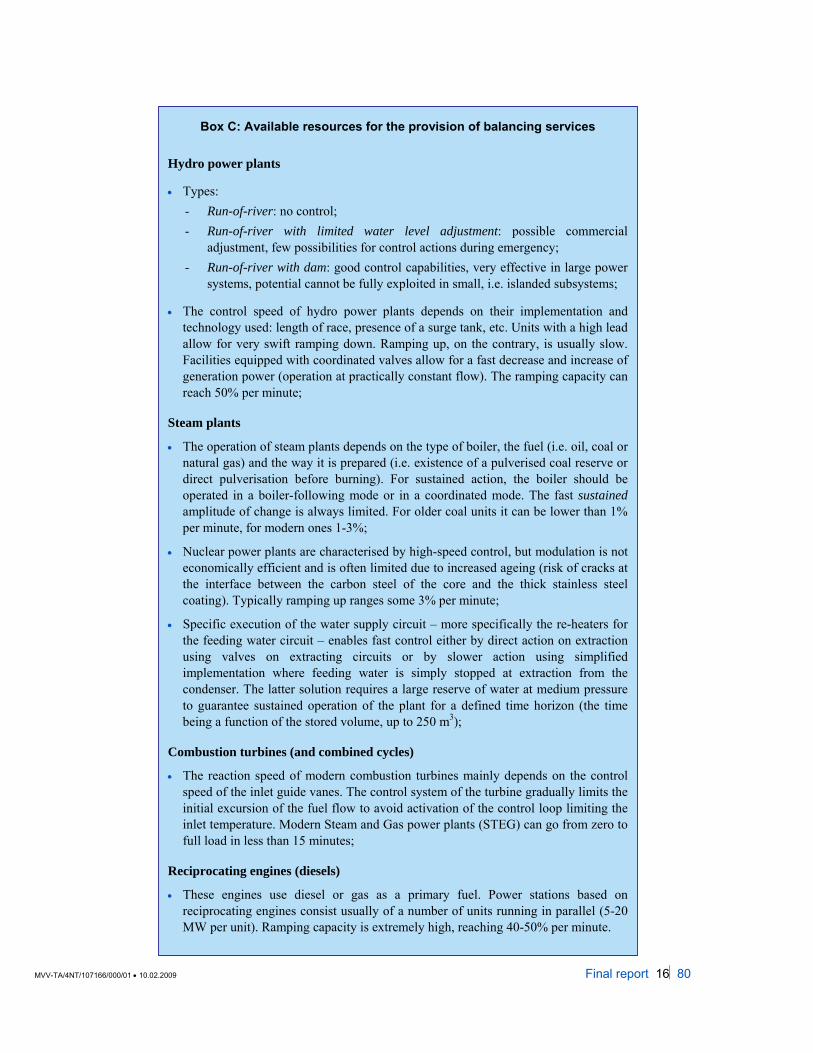
Box C: Available resources for the provision of balancing services
Hydro power plants
• Types: - Run-of-river: no control; - Run-of-river with limited water level adjustment: possible commercial
adjustment, few possibilities for control actions during emergency; - Run-of-river with dam: good control capabilities, very effective in large power
systems, potential cannot be fully exploited in small, i.e. islanded subsystems;
• The control speed of hydro power plants depends on their implementation and technology used: length of race, presence of a surge tank, etc. Units with a high lead allow for very swift ramping down. Ramping up, on the contrary, is usually slow. Facilities equipped with coordinated valves allow for a fast decrease and increase of generation power (operation at practically constant flow). The ramping capacity can reach 50% per minute;
Steam plants
• The operation of steam plants depends on the type of boiler, the fuel (i.e. oil, coal or natural gas) and the way it is prepared (i.e. existence of a pulverised coal reserve or direct pulverisation before burning). For sustained action, the boiler should be operated in a boiler-following mode or in a coordinated mode. The fast sustained amplitude of change is always limited. For older coal units it can be lower than 1% per minute, for modern ones 1-3%;
• Nuclear power plants are characterised by high-speed control, but modulation is not economically efficient and is often limited due to increased ageing (risk of cracks at the interface between the carbon steel of the core and the thick stainless steel coating). Typically ramping up ranges some 3% per minute;
• Specific execution of the water supply circuit – more specifically the re-heaters for the feeding water circuit – enables fast control either by direct action on extraction using valves on extracting circuits or by slower action using simplified implementation where feeding water is simply stopped at extraction from the condenser. The latter solution requires a large reserve of water at medium pressure to guarantee sustained operation of the plant for a defined time horizon (the time being a function of the stored volume, up to 250 m3);
Combustion turbines (and combined cycles)
• The reaction speed of modern combustion turbines mainly depends on the control speed of the inlet guide vanes. The control system of the turbine gradually limits the initial excursion of the fuel flow to avoid activation of the control loop limiting the inlet temperature. Modern Steam and Gas power plants (STEG) can go from zero to full load in less than 15 minutes;
Reciprocating engines (diesels)
• These engines use diesel or gas as a primary fuel. Power stations based on reciprocating engines consist usually of a number of units running in parallel (5-20 MW per unit). Ramping capacity is extremely high, reaching 40-50% per minute.
MVV-TA/4NT/107166/000/01 • 10.02.2009 Final report 17⏐80
Within UCTE, there are typically three types of balancing services. To start with, primary frequency control is a local automatic control, adjusting generation and consumption levels to stabilise system frequency following a disturbance (i.e. a deviation larger than 20 mHz). This response must be fully activated in less than 30 seconds. The amount of primary reserves corresponds to the reference disturbance of 3000 MW, implying that a generation-load imbalance of that size can be absorbed without frequency deviations exceeding 200 mHz. The proportion of real-time energy delivered by these services is relatively small compared to the services mentioned hereafter. Secondary frequency control is a centralised Automatic Generation Control system (AGC) that alters the generation output of the participating units according to the Area Control Error (ACE), which is the difference between the scheduled cross-border exchanges and the actually measured ones. The main role of secondary frequency control is to restore inter-area exchanges (and consequently overall frequency) to their target values following an imbalance within a timeframe of under 15 minutes. In other words, while primary control restricts and halts frequency excursions, secondary control aims to bring the frequency back to its target value4. Contrary to primary control, whose provision is a joint action of generating units and loads spread evenly across the interconnected network, secondary control within UCTE is only supplied by the generating units located in the control area where the imbalance originated. Finally, tertiary frequency control refers to all automatic or manual changes in generation and load levels in the aim of assisting secondary control in performing its task, restoring secondary control reserves or optimally re-dispatching secondary control power according to economic considerations.
Frequency control reserves within NORDEL are based on similar principles to those used within UCTE. Two main types of reserves exist. Firstly, frequency-controlled reserves are activated automatically in case of frequency deviations exceeding 100 mHz (normal operational reserve) or 500 mHz (disturbance reserve). The volume of frequency-controlled reserves in the NORDEL area amounts to some 600 MW and 1,000 MW respectively. Secondly, fast reserves are activated manually to restore the frequency-controlled reserves in a timeframe of up to 15 minutes. Two types of fast reserves can be distinguished: they restore the normal operational reserve and the disturbance reserve respectively. Using a common Nordic bid ladder, TSOs can procure fast reserves located locally and – conditional on grid availability – located in other Nordic countries.
SECURITY INSURANCE VERSUS REAL-TIME ENERGY DELIVERY SERVICES
The terminology of balancing services varies widely between and within synchronous zones. To avoid any confusion and abstract from local differences, the remainder of this report will only make a distinction between the following two comprehensive categories of services:
• Security insurance services: services mainly deployed for capacity purposes and delivering only a marginal amount of energy the real time.
• Real-time energy delivery services: services mainly deployed for energy delivery purposes and delivering a substantial amount of energy in real time.
4 However, secondary reserves are not usually extensive enough to deal with a large generation outage. Typically, tertiary reserves also need to be activated to reach the frequency’s target value and restore the power balance. For instance, France’s secondary reserve of at least 500 MW is insufficient to counter the imbalance caused by an outage of one of its larger nuclear power plants.
MVV-TA/4NT/107166/000/01 • 10.02.2009 Final report 18⏐80
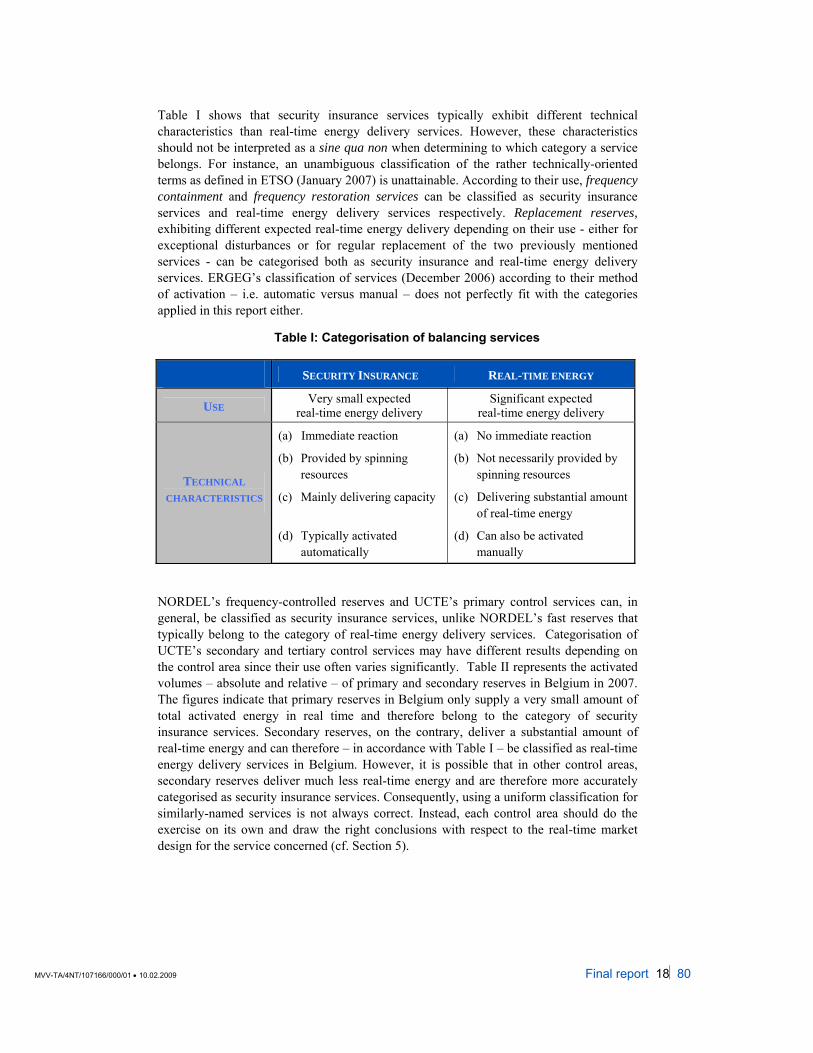
Table I shows that security insurance services typically exhibit different technical characteristics than real-time energy delivery services. However, these characteristics should not be interpreted as a sine qua non when determining to which category a service belongs. For instance, an unambiguous classification of the rather technically-oriented terms as defined in ETSO (January 2007) is unattainable. According to their use, frequency containment and frequency restoration services can be classified as security insurance services and real-time energy delivery services respectively. Replacement reserves, exhibiting different expected real-time energy delivery depending on their use - either for exceptional disturbances or for regular replacement of the two previously mentioned services - can be categorised both as security insurance and real-time energy delivery services. ERGEG’s classification of services (December 2006) according to their method of activation – i.e. automatic versus manual – does not perfectly fit with the categories applied in this report either.
Table I: Categorisation of balancing services
SECURITY INSURANCE REAL-TIME ENERGY
USE Very small expected real-time energy delivery
Significant expected real-time energy delivery
TECHNICAL CHARACTERISTICS
(a) Immediate reaction
(b) Provided by spinning resources
(c) Mainly delivering capacity
(d) Typically activated
automatically
(a) No immediate reaction
(b) Not necessarily provided by spinning resources
(c) Delivering substantial amount of real-time energy
(d) Can also be activated manually
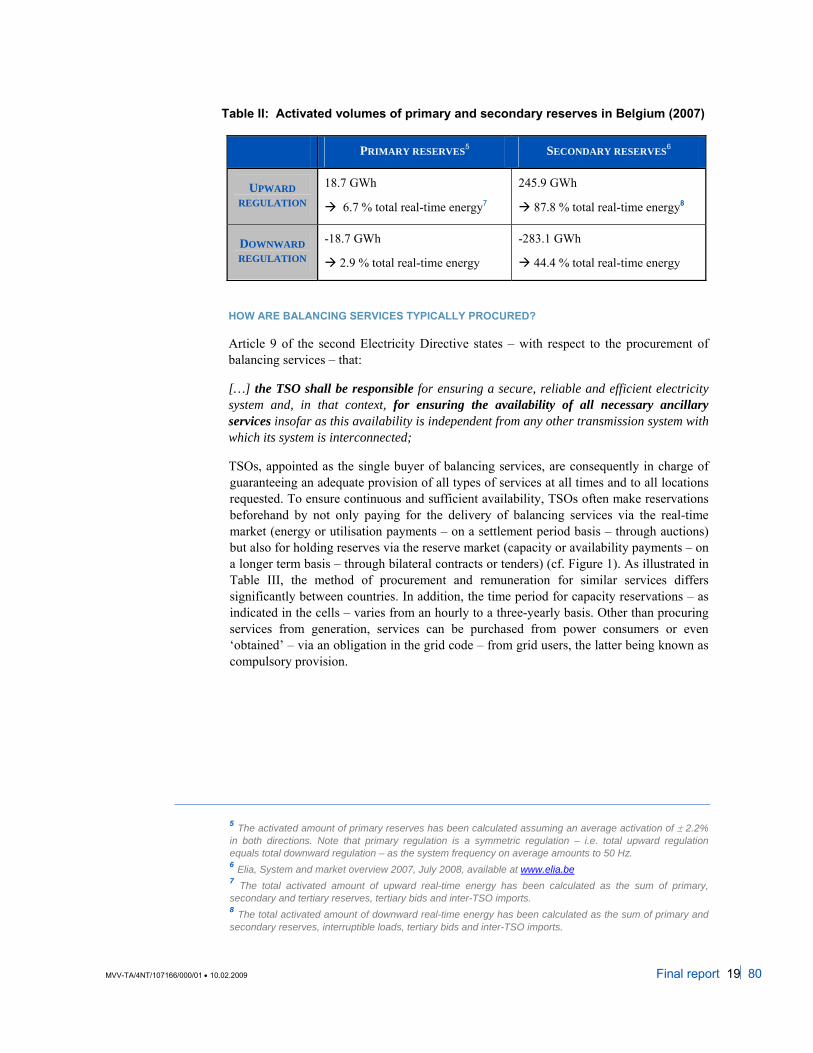
NORDEL’s frequency-controlled reserves and UCTE’s primary control services can, in general, be classified as security insurance services, unlike NORDEL’s fast reserves that typically belong to the category of real-time energy delivery services. Categorisation of UCTE’s secondary and tertiary control services may have different results depending on the control area since their use often varies significantly. Table II represents the activated volumes – absolute and relative – of primary and secondary reserves in Belgium in 2007. The figures indicate that primary reserves in Belgium only supply a very small amount of total activated energy in real time and therefore belong to the category of security insurance services. Secondary reserves, on the contrary, deliver a substantial amount of real-time energy and can therefore – in accordance with Table I – be classified as real-time energy delivery services in Belgium. However, it is possible that in other control areas, secondary reserves deliver much less real-time energy and are therefore more accurately categorised as security insurance services. Consequently, using a uniform classification for similarly-named services is not always correct. Instead, each control area should do the exercise on its own and draw the right conclusions with respect to the real-time market design for the service concerned (cf. Section 5).
MVV-TA/4NT/107166/000/01 • 10.02.2009 Final report 19⏐80
Table II: Activated volumes of primary and secondary reserves in Belgium (2007)
PRIMARY RESERVES5 SECONDARY RESERVES6
UPWARD REGULATION
18.7 GWh
6.7 % total real-time energy7
245.9 GWh
87.8 % total real-time energy8
DOWNWARD REGULATION
-18.7 GWh
2.9 % total real-time energy
-283.1 GWh
44.4 % total real-time energy
HOW ARE BALANCING SERVICES TYPICALLY PROCURED?
Article 9 of the second Electricity Directive states – with respect to the procurement of balancing services – that:
[…] the TSO shall be responsible for ensuring a secure, reliable and efficient electricity system and, in that context, for ensuring the availability of all necessary ancillary services insofar as this availability is independent from any other transmission system with which its system is interconnected;
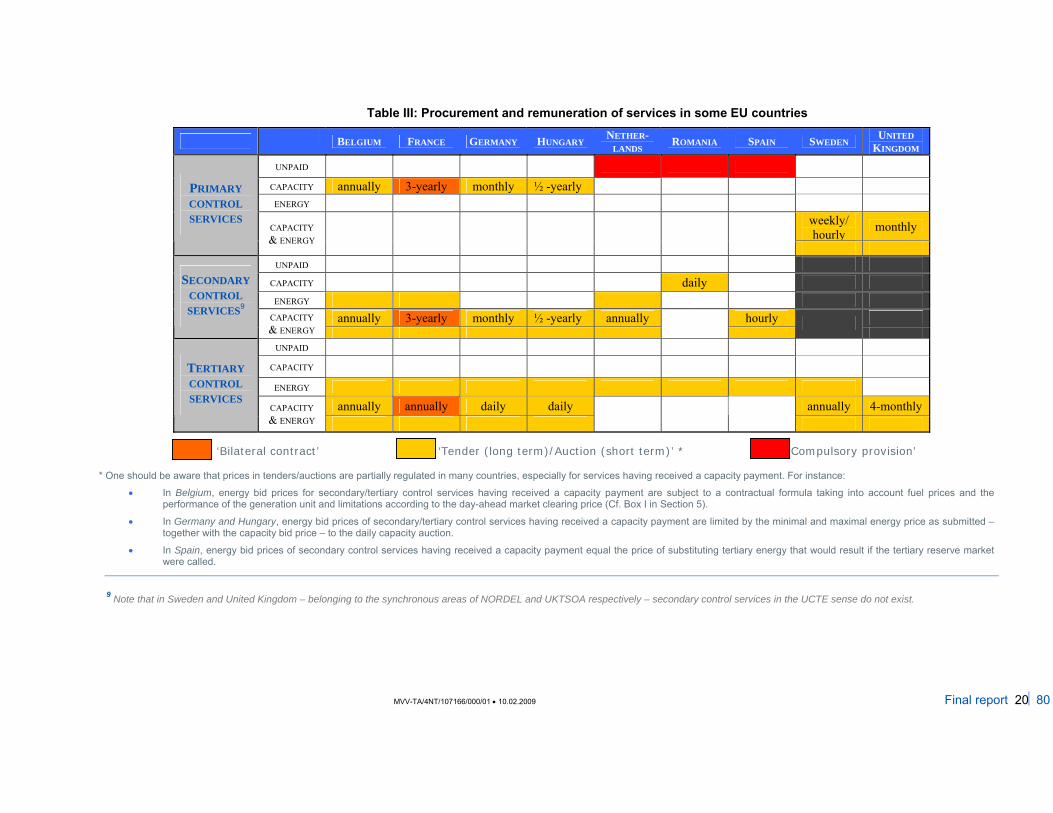
TSOs, appointed as the single buyer of balancing services, are consequently in charge of guaranteeing an adequate provision of all types of services at all times and to all locations requested. To ensure continuous and sufficient availability, TSOs often make reservations beforehand by not only paying for the delivery of balancing services via the real-time market (energy or utilisation payments – on a settlement period basis – through auctions) but also for holding reserves via the reserve market (capacity or availability payments – on a longer term basis – through bilateral contracts or tenders) (cf. Figure 1). As illustrated in Table III, the method of procurement and remuneration for similar services differs significantly between countries. In addition, the time period for capacity reservations – as indicated in the cells – varies from an hourly to a three-yearly basis. Other than procuring services from generation, services can be purchased from power consumers or even ‘obtained’ – via an obligation in the grid code – from grid users, the latter being known as compulsory provision.
5 The activated amount of primary reserves has been calculated assuming an average activation of ± 2.2% in both directions. Note that primary regulation is a symmetric regulation – i.e. total upward regulation equals total downward regulation – as the system frequency on average amounts to 50 Hz. 6 Elia, System and market overview 2007, July 2008, available at www.elia.be 7 The total activated amount of upward real-time energy has been calculated as the sum of primary, secondary and tertiary reserves, tertiary bids and inter-TSO imports. 8 The total activated amount of downward real-time energy has been calculated as the sum of primary and secondary reserves, interruptible loads, tertiary bids and inter-TSO imports.
MVV-TA/4NT/107166/000/01 • 10.02.2009 Final report 20⏐80
Table III: Procurement and remuneration of services in some EU countries
BELGIUM FRANCE GERMANY HUNGARY NETHER-LANDS ROMANIA SPAIN SWEDEN UNITED
KINGDOM UNPAID
CAPACITY annually 3-yearly monthly ½ -yearly ENERGY
weekly/ hourly monthly
PRIMARY CONTROL SERVICES
CAPACITY & ENERGY
UNPAID CAPACITY daily ENERGY
annually 3-yearly monthly ½ -yearly annually hourly
SECONDARY CONTROL SERVICES9
CAPACITY & ENERGY
UNPAID
CAPACITY
ENERGY
annually annually daily daily annually 4-monthly
TERTIARY CONTROL SERVICES
CAPACITY & ENERGY
9 Note that in Sweden and United Kingdom – belonging to the synchronous areas of NORDEL and UKTSOA respectively – secondary control services in the UCTE sense do not exist.
‘Bilateral contract’ ‘Tender (long term)/Auction (short term)’ * ‘Compulsory provision’
* One should be aware that prices in tenders/auctions are partially regulated in many countries, especially for services having received a capacity payment. For instance:
• In Belgium, energy bid prices for secondary/tertiary control services having received a capacity payment are subject to a contractual formula taking into account fuel prices and the performance of the generation unit and limitations according to the day-ahead market clearing price (Cf. Box I in Section 5).
• In Germany and Hungary, energy bid prices of secondary/tertiary control services having received a capacity payment are limited by the minimal and maximal energy price as submitted – together with the capacity bid price – to the daily capacity auction.
• In Spain, energy bid prices of secondary control services having received a capacity payment equal the price of substituting tertiary energy that would result if the tertiary reserve market were called.
MVV-TA/4NT/107166/000/01 • 10.02.2009 Final report 21⏐80
2.2.2. Imbalance settlement
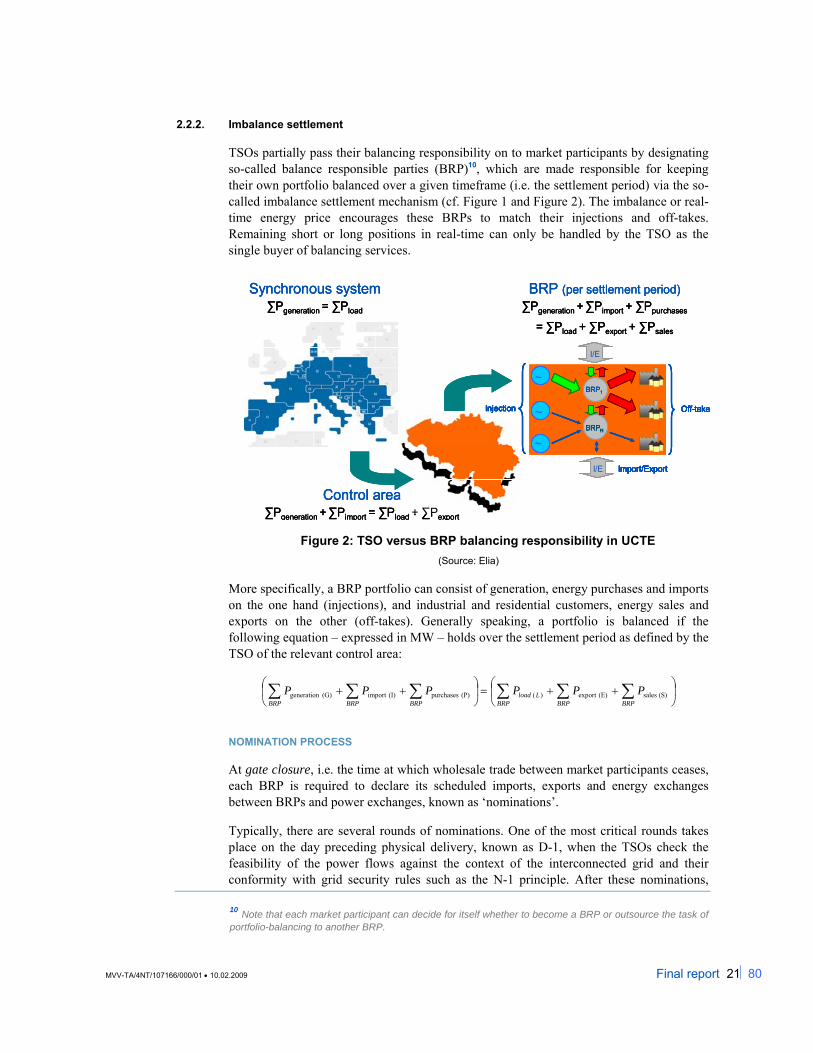
TSOs partially pass their balancing responsibility on to market participants by designating so-called balance responsible parties (BRP)10, which are made responsible for keeping their own portfolio balanced over a given timeframe (i.e. the settlement period) via the so-called imbalance settlement mechanism (cf. Figure 1 and Figure 2). The imbalance or real-time energy price encourages these BRPs to match their injections and off-takes. Remaining short or long positions in real-time can only be handled by the TSO as the single buyer of balancing services.
Synchronous system∑Pgeneration = ∑Pload
Control area∑Pgeneration +∑Pimport = ∑Pload + ∑Pexport
Injection ~
~
~BRP1
BRPN
Off-take
I/E
I/E
Import/Export
BRP (per settlement period)∑Pgeneration +∑Pimport + ∑Ppurchases
= ∑Pload + ∑Pexport + ∑Psales
Synchronous system∑Pgeneration = ∑Pload
Synchronous system∑Pgeneration = ∑Pload
Control area∑Pgeneration +∑Pimport = ∑Pload + ∑Pexport
Control area∑Pgeneration +∑Pimport = ∑Pload + ∑Pexport
Injection ~
~
~BRP1
BRPN
Off-take
I/E
I/E
Import/Export
BRP (per settlement period)∑Pgeneration +∑Pimport + ∑Ppurchases
= ∑Pload + ∑Pexport + ∑Psales
Injection ~
~
~BRP1
BRPN
Off-take
I/E
I/E
Import/Export
Injection ~
~
~BRP1
BRPN
Off-take
I/E
I/E
Import/Export
Injection ~
~
~BRP1
BRPN
Off-take
I/E
I/E
Import/Export
Injection ~
~
~BRP1
BRPN
Off-take
I/E
I/E
Import/Export
Injection ~
~
~BRP1
BRPN
Off-take
I/E
I/E
Import/Export
Injection ~
~
~BRP1
BRPN
Off-take
I/E
I/E
Import/Export
Injection ~
~
~BRP1
BRPN
Off-take
I/E
Injection ~~
~~
~~BRP1
BRPN
Off-take
I/EI/E
I/E
Import/Export
I/EI/E
Import/Export
BRP (per settlement period)∑Pgeneration +∑Pimport + ∑Ppurchases
= ∑Pload + ∑Pexport + ∑Psales
Figure 2: TSO versus BRP balancing responsibility in UCTE (Source: Elia)
More specifically, a BRP portfolio can consist of generation, energy purchases and imports on the one hand (injections), and industrial and residential customers, energy sales and exports on the other (off-takes). Generally speaking, a portfolio is balanced if the following equation – expressed in MW – holds over the settlement period as defined by the TSO of the relevant control area:
⎟⎠
⎞⎜⎝
⎛++=⎟
⎠
⎞⎜⎝
⎛++ ∑∑∑∑∑∑
BRPBRPBRPLload
BRPBRPBRPPPPPPP (S) sales(E)export )((P) purchases(I)import (G) generation
NOMINATION PROCESS
At gate closure, i.e. the time at which wholesale trade between market participants ceases, each BRP is required to declare its scheduled imports, exports and energy exchanges between BRPs and power exchanges, known as ‘nominations’.
Typically, there are several rounds of nominations. One of the most critical rounds takes place on the day preceding physical delivery, known as D-1, when the TSOs check the feasibility of the power flows against the context of the interconnected grid and their conformity with grid security rules such as the N-1 principle. After these nominations,
10 Note that each market participant can decide for itself whether to become a BRP or outsource the task of portfolio-balancing to another BRP.
MVV-TA/4NT/107166/000/01 • 10.02.2009 Final report 22⏐80
there are typically a number of intra-day spots allowing BRPs to make last-minute corrections to the submitted schedules. Finally, after the closure of the last intra-day gate, the submitted nominations are fixed and BRPs are supposed to respect them.
Nominations have to be balanced in all control zones11. According to economic literature on virtual bidding12, imposing balanced nominations does yet not make much sense as it encourages BRPs to lie whenever they want to exploit price differences between the wholesale and real-time markets, thus making nomination information less reliable for TSOs. However, from the point of view of power system security, the equilibrium between generation and load is not only a guarantee for frequency stability, but also serves as a backbone for the distributed security management as described in 2.1.4.
IMBALANCE CALCULATION
Remaining short or long positions in real time are described as the BRP’s imbalances. The way in which these imbalances are calculated varies between control areas. Imbalances are mostly calculated in one step – i.e. including both generation and load – equalling:
⎟⎠
⎞⎜⎝
⎛++−⎟
⎠
⎞⎜⎝
⎛++ ∑∑∑∑∑∑ −−−−−−
BRPBRPBRPBRPBRPBRPPPPPPP nominatedSnominatedImeasuredLnominatedPnominatedEmeasuredG
In some control areas – including the Nordic countries, United Kingdom and Spain – imbalances are calculated in two steps – in other words, generation and load are settled separately13:
⎟⎠
⎞⎜⎝
⎛+=
⎟⎠
⎞⎜⎝
⎛+=
∑∑
∑∑
−−
−−
BRPBRP
BRPBRP
PPB
PPA
nominatedLmeasuredL
nominatedGmeasuredG
Other differences in nomination and imbalance calculation methods include variations in the treatment of intermittent resources (e.g. full or partial release from balance responsibility for wind in Germany) and freedom of dispatch up to real time in some countries (e.g. Netherlands) versus an obligation to stick to final nodal notifications in others (e.g. United Kingdom). These variations entail a distinct division of risks and responsibilities between TSOs and BRPs in different control areas.
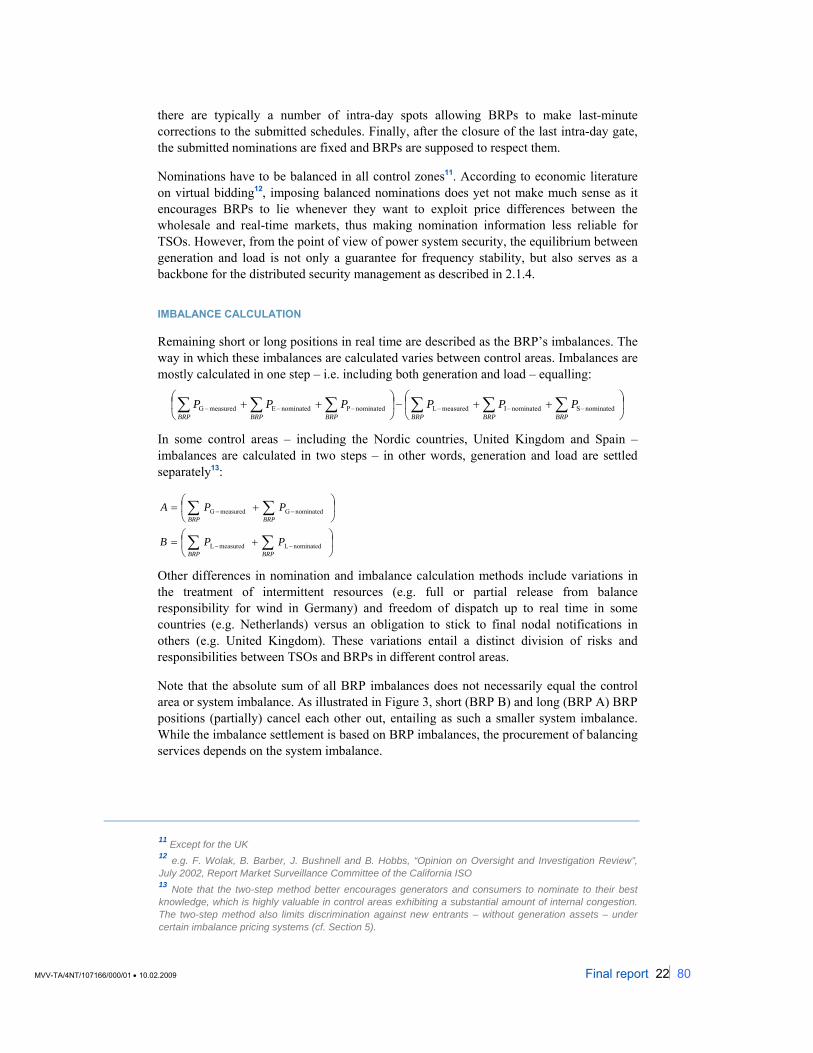
Note that the absolute sum of all BRP imbalances does not necessarily equal the control area or system imbalance. As illustrated in Figure 3, short (BRP B) and long (BRP A) BRP positions (partially) cancel each other out, entailing as such a smaller system imbalance. While the imbalance settlement is based on BRP imbalances, the procurement of balancing services depends on the system imbalance.
11 Except for the UK 12 e.g. F. Wolak, B. Barber, J. Bushnell and B. Hobbs, “Opinion on Oversight and Investigation Review”, July 2002, Report Market Surveillance Committee of the California ISO 13 Note that the two-step method better encourages generators and consumers to nominate to their best knowledge, which is highly valuable in control areas exhibiting a substantial amount of internal congestion. The two-step method also limits discrimination against new entrants – without generation assets – under certain imbalance pricing systems (cf. Section 5).
MVV-TA/4NT/107166/000/01 • 10.02.2009 Final report 23⏐80
1 settlement period
⎯ Within settlement period imbalances−− Settlement period imbalance
IMBALANCE BRP A
+10 MWh
0 MWh
1 settlement period
⎯ Within settlement period imbalances−− Settlement period imbalance
IMBALANCE BRP A
+10 MWh
0 MWh
1 settlement period
⎯ Within settlement period imbalances−− Settlement period imbalance
IMBALANCE BRP A
+10 MWh
0 MWh
IMBALANCE BRP B
1 settlement period
0 MWh
⎯ Within settlement period imbalances−− Settlement period imbalance
-20 MWh
IMBALANCE BRP B
1 settlement period
0 MWh
⎯ Within settlement period imbalances−− Settlement period imbalance
-20 MWh
IMBALANCE BRP B
1 settlement period
0 MWh
⎯ Within settlement period imbalances−− Settlement period imbalance
-20 MWh
1 settlement period
0 MWh
⎯ Within settlement period imbalances−− Settlement period imbalance
-20 MWh
1 settlement period
0 MWh
⎯ Within settlement period imbalances−− Settlement period imbalance
-20 MWh
0 MWh
1 settlement period
SYSTEM IMBALANCE
−− Settlement period imbalance
-10 MWh
+10 MWh
-20 MWh
0 MWh
1 settlement period
SYSTEM IMBALANCE
−− Settlement period imbalance
-10 MWh
+10 MWh
-20 MWh
1 settlement period
SYSTEM IMBALANCE
−− Settlement period imbalance
-10 MWh
+10 MWh
-20 MWh
1 settlement period
SYSTEM IMBALANCE
−− Settlement period imbalance
-10 MWh
+10 MWh
-20 MWh
Figure 3: BRP imbalances versus system imbalance
IMBALANCE CHARGES
Depending on the BRP imbalances incurred, an imbalance charge (€/MWh) is imposed per settlement period on the BRPs concerned. Consequently, BRPs can weigh up whether to maximise hedging against imbalances by purchasing energy in the wholesale market or pay for imbalances in real time. However, given the higher volatility and unpredictability of real-time prices, BRPs exhibit a natural tendency to contract beforehand via wholesale markets rather than relying on the real-time market. The relation between real-time and wholesale markets is further outlined in Section 2.2.3.
As indicated in Article 11 of the second Electricity Directive, the imbalance charge should be cost-reflective:
[…] rules adopted by TSOs for balancing the electricity system shall be objective, transparent and non discriminatory, including rules for the charging of system users of their networks for energy imbalance. Terms and conditions, including rules and tariffs,
MVV-TA/4NT/107166/000/01 • 10.02.2009 Final report 24⏐80
for the provision of such services by transmission system operators shall be established pursuant to a methodology compatible with Article 23(2) in a non-discriminatory and cost-reflective way and shall be published;
To ensure that the real-time market design meets the above requirement, cost-reflective real-time energy prices are taken as the main point of departure in Section 5, in which recommendations on the harmonisation of real-time market designs are formulated.
2.2.3. Relation between real-time and wholesale markets
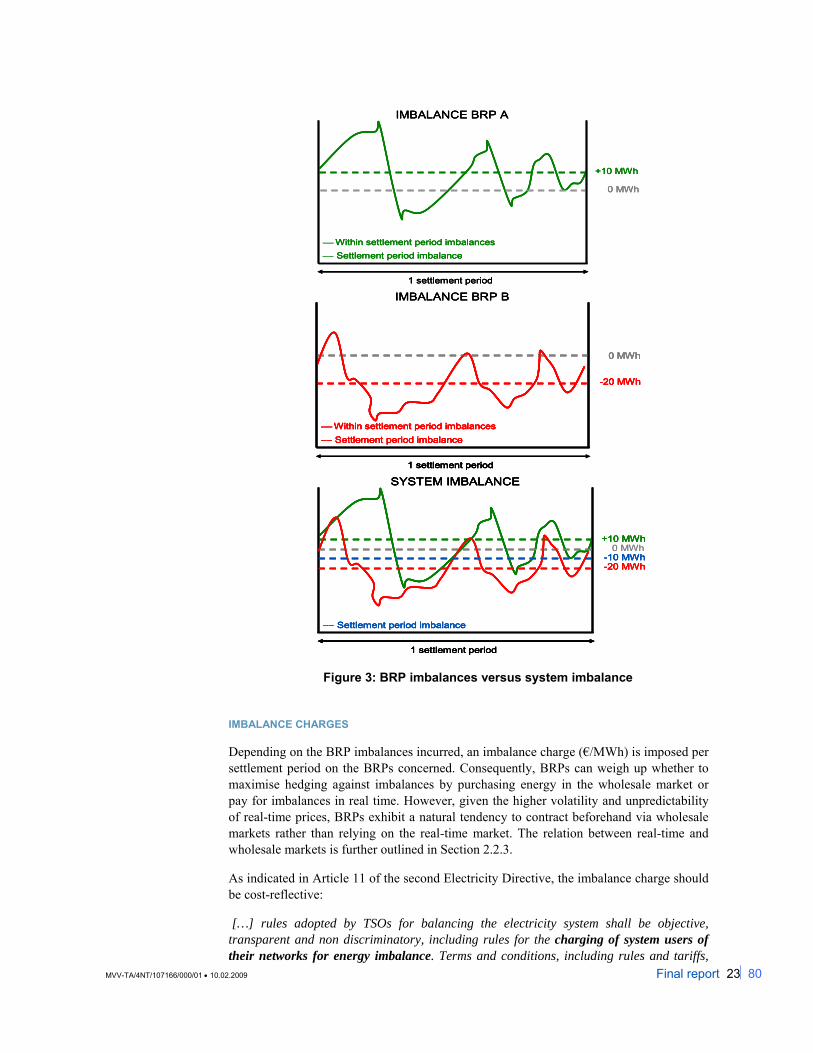
Just as imbalance charges affect the extent to which BRPs want to be in balance, the functioning and liquidity of wholesale markets influences to what extent BRPs can be in balance. The relation between the wholesale and real-time markets in time is depicted in Figure 4.
DA market ID marketFORWARD markets
RESERVE marketsREAL-TIME market
procurement &
activation
imbalancesettlement
Day (D-1)
DA gate closure
ID gate closures
TimeDay (D)
DA market ID marketFORWARD markets
RESERVE marketsREAL-TIME market
procurement &
activation
imbalancesettlement
Day (D-1)
DA gate closure
ID gate closures
TimeDay (D)
DA market ID marketFORWARD markets
RESERVE marketsREAL-TIME market
procurement &
activation
imbalancesettlement
Day (D-1)
DA gate closure
ID gate closures
TimeDay (D)
DA market ID marketFORWARD markets
RESERVE marketsREAL-TIME market
procurement &
activation
imbalancesettlement
DA market ID marketFORWARD markets
RESERVE marketsREAL-TIME market
procurement &
activation
imbalancesettlement
Day (D-1)
DA gate closure
ID gate closures
TimeTimeDay (D)
Figure 4: Relation between real-time and wholesale markets DA = day-ahead; ID = intra-day
Typically, BRPs have the opportunity to manage their portfolios by trading on wholesale markets across a number of different time scales. Most energy is traded via the forward markets. Market participants will typically aim to cover their physical positions – e.g. purchase electricity to cover their forecasted customer demand or sell electricity from their generation units – through multi-year to monthly base load contracts, i.e. contracts for production or delivery over the whole day for a certain period. One day ahead of delivery (Day D-1), participants have access to a substantial amount of information with respect to their generation and/or consumption. Suppliers have a picture what their customer demand is likely to be and generators have an approximate idea of the planned operation schedule for their units for the next day14. The day-ahead market allows participants to fine-tune their portfolios in line with this information by adjusting their contract positions on an hour-by-hour basis.
After day-ahead gate closure, participants anticipating inaccuracies in their forecasted positions may continue to fine-tune them via the intra-day (Day D) market in line with new information on their own generation/consumption position as well as the overall system position.
14 NB: Although a lot of information is available at the day-ahead stage, there is still a significant scope for errors in all forecasts. Demand and generation conditions can easily change within a day, the latter either through generation unit operational issues or increasingly as a result of wind forecast errors.
MVV-TA/4NT/107166/000/01 • 10.02.2009 Final report 25⏐80
The existence of well-functioning intra-day markets is important for two reasons:
• Day-ahead markets – organised on an hourly basis – are very simple and do not allow all the technical characteristics of power plants to be taken into account. The day-ahead market clearing might therefore result in infeasible schedules. Intra-day markets partly allow generation to deal with these infeasibilities.
• Intra-day markets can partly cushion the uncertainty inherent to real time, including power plant outages and changes in wind forecasts or demand.
As indicated before, open positions after intra-day gate closure can only be resolved by the TSO – through activation of services procured beforehand via the reserve market and/or in real-time via the real-time market – and are settled accordingly. It should be clear that the timing of this gate closure will affect BRPs’ flexibility in following up their positions. The shorter the delay between the intra-day gate closure and real time, the less uncertainty BRPs are confronted with when deciding on the final composition of their portfolios.

MVV-TA/4NT/107166/000/01 • 10.02.2009 Final report 26⏐80
MVV-TA/4NT/107166/000/01 • 10.02.2009 Final report 27⏐80
3. ISSUES RELATED TO A LACK OF HARMONISATION AND CENTRALISATION Cross-border balancing implementation without harmonisation and centralisation is often said to entail several distorting effects and inefficiencies from the point of view of both markets and security. However, these distortions already exist to a certain extent today and will only aggravate in case of cross-border balancing implementation without further harmonisation and centralisation.
This section first identifies actual distorting effects of insufficiently harmonised real-time market designs on – increasingly integrated – wholesale trade. It then analyses the additional pressure currently put on system security due to a lack of centralisation in security management.
3.1. DISTORTIONS IN CROSS-BORDER WHOLESALE (DAY-AHEAD AND INTRA-DAY) TRADE
At the moment, real-time market designs differ significantly between European countries (see Table III for differences in the procurement and remuneration of balancing services). Cross-border balancing trade without harmonisation of these national designs may involve several distorting effects. However, certain design differences are already causing distortions today because wholesale trade is increasingly integrated.
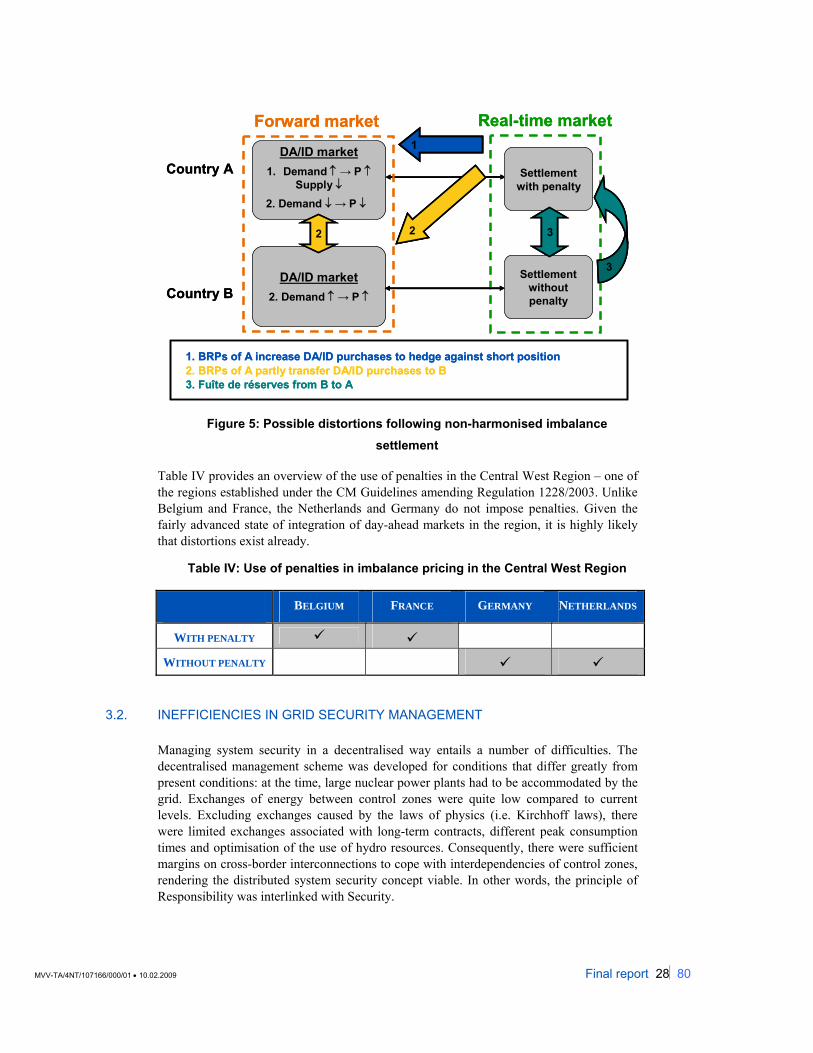
Figure 5 illustrates potential distortions resulting from insufficient harmonisation of imbalance pricing methods in different countries. Assume country A settles imbalances through a price system with penalties. Penalties are added to the imbalance or real-time price in many countries for several reasons, including as a means of motivating BRPs to avoid negative imbalances. Penalties are typically larger for short positions than for long ones (cf. Section 5). Country B, on the other hand, relies on a price system without penalties. Because of the penalties, BRPs in country A will be more inclined to hedge against short positions by purchasing on forward markets – which has the effect of increasing associated market prices – and/or by keeping services for own use – which has the effect of reducing the supply of balancing services (1). If the forward markets of countries A and B are integrated, the impact on forward market prices is spread over both (2). The latter indicates that distortions already exist to a certain extent today. Consequently, the more day-ahead and intra-day markets are integrated across borders, the more important harmonisation of balancing market designs becomes. Following cross-border balancing implementation, distortions might become worse and manifest as a so-called ‘fuite de réserves’ from country B to country A - in other words, migration of imbalances from country A to country B (3).
MVV-TA/4NT/107166/000/01 • 10.02.2009 Final report 28⏐80
1
2
Forward market Real-time market
1. BRPs of A increase DA/ID purchases to hedge against short position2. BRPs of A partly transfer DA/ID purchases to B3. Fuîte de réserves from B to A
Country A
Country B
Settlement with penalty
DA/ID market1. Demand ↑ → P ↑
Supply ↓2. Demand ↓ → P ↓
Settlement without penalty
DA/ID market2. Demand ↑→ P ↑
3
32
11
22
Forward market Real-time market
1. BRPs of A increase DA/ID purchases to hedge against short position2. BRPs of A partly transfer DA/ID purchases to B3. Fuîte de réserves from B to A
Country A
Country B
Settlement with penalty
DA/ID market1. Demand ↑ → P ↑
Supply ↓2. Demand ↓ → P ↓
Settlement without penalty
DA/ID market2. Demand ↑→ P ↑
33
3322
Figure 5: Possible distortions following non-harmonised imbalance settlement
Table IV provides an overview of the use of penalties in the Central West Region – one of the regions established under the CM Guidelines amending Regulation 1228/2003. Unlike Belgium and France, the Netherlands and Germany do not impose penalties. Given the fairly advanced state of integration of day-ahead markets in the region, it is highly likely that distortions exist already.
Table IV: Use of penalties in imbalance pricing in the Central West Region
BELGIUM FRANCE GERMANY NETHERLANDS
WITH PENALTY
WITHOUT PENALTY
3.2. INEFFICIENCIES IN GRID SECURITY MANAGEMENT
Managing system security in a decentralised way entails a number of difficulties. The decentralised management scheme was developed for conditions that differ greatly from present conditions: at the time, large nuclear power plants had to be accommodated by the grid. Exchanges of energy between control zones were quite low compared to current levels. Excluding exchanges caused by the laws of physics (i.e. Kirchhoff laws), there were limited exchanges associated with long-term contracts, different peak consumption times and optimisation of the use of hydro resources. Consequently, there were sufficient margins on cross-border interconnections to cope with interdependencies of control zones, rendering the distributed system security concept viable. In other words, the principle of Responsibility was interlinked with Security.

MVV-TA/4NT/107166/000/01 • 10.02.2009 Final report 29⏐80
3.2.1. Decentralised calculation of cross-border transfer capacities
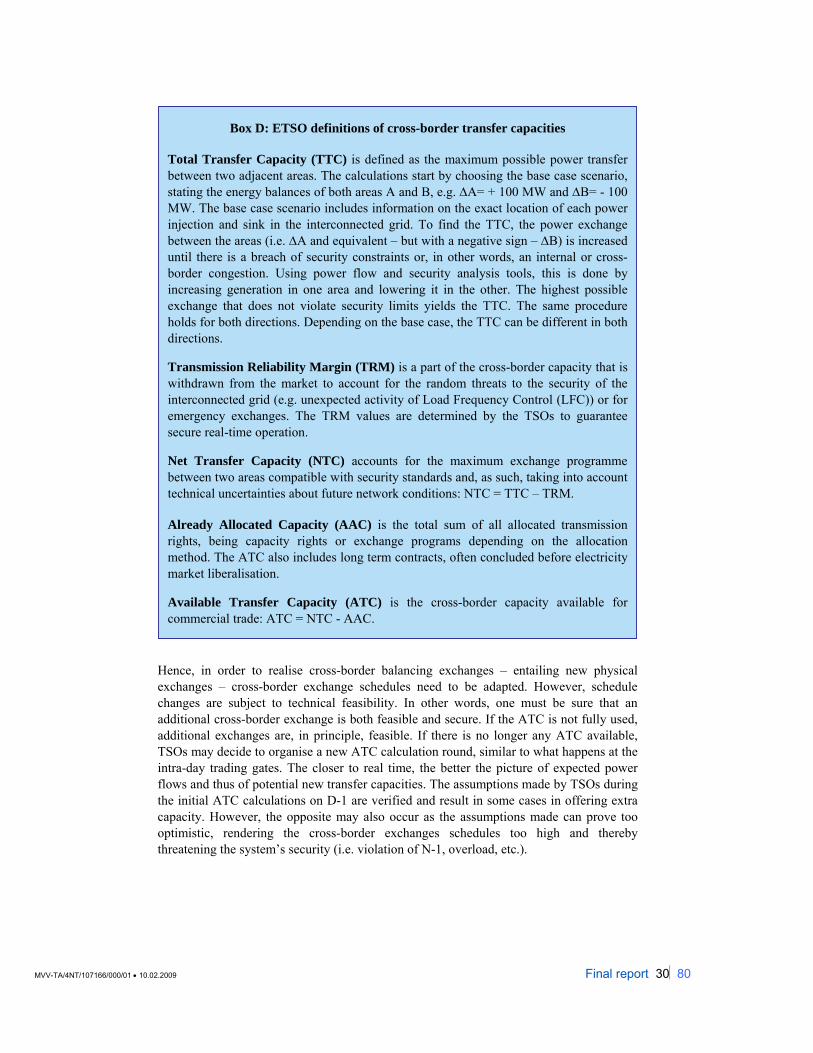
In zonal markets such as Europe, interconnection or cross-border transfer capacity is defined as the maximum secure energy exchange between two control areas. This transfer capacity is not physical, but results from a kind of aggregation of physical capacities of transmission lines connecting these areas. It is a rather crude approximation of the complex constraints on maximal power transfers allowed between the control areas and transmission security rules applied in both control areas. This aggregated capacity can be calculated based on different principles, one of the possibilities being the method proposed by the European Association of Transmission System Operators (ETSO). Box D briefly introduces these definitions.
The bottom line of the transfer capacity estimation is that it needs to take place before the actual schedules of BRPs are known The TSOs must therefore anticipate the possible behaviour of the grid users and, based on this, propose possibilities for cross-border trade. This process is carried out on a border-by-border basis, making it difficult to take the interdependencies of power flows into account. Consequently, allocation of these cross-border capacities is also done border-by-border, based on contract paths. In other words, grid users who trade across control zones are able to choose the path for their transactions, even though the actual physical power flows could be different.
The above implies that there is a certain degree of risk in this process. If the behaviour of grid users is different from that expected by the TSOs, the obtained Transfer Capacities could be either too conservative or too optimistic, creating both threats and opportunities. According to the discussion above and in Section 2.1, cross-border exchanges between control areas have two origins: they are either an effect of the Kirchhoff laws and the meshed nature of the interconnected grid – in other words, there would be some power flows between control areas even in the absence of exports and imports – or of the commercial energy exchanges – in other words, exports and imports. Applying this to ETSO’s transfer capacity definitions (Box D), it could be said that ATC accounts for commercial exchanges and the difference between NTC and ATC reflects the Kirchhoff power flows.
Cross-border wholesale trade and balancing exchanges are realised using ATC. This is obvious also for intra-day exchanges as they can only be realised by BRPs on condition they obtain the ATC (following the nomination process). For cross-border balancing, this is somehow also the case. Again, the basis for this conclusion lies in the principle of distributed frequency and security control. As discussed in Section 2.1, TSOs are responsible for maintaining the equilibrium between cross-border exchange schedules and physical power flows (Area Control Error - ACE). Any ACE disequilibrium will result in regulation actions by the units providing balancing reserves, either manually or automatically15.
15 Note that in UCTE, regulation takes place automatically, based on the action of AGC (i.e. secondary frequency control), and is possibly followed by manual commitment of tertiary reserves if the disequilibrium is too high. In NORDEL, regulation is manual and resources do not have to be local. This implies that on some occasions, where two areas are in identical disequilibrium – but in opposite directions – and there is no grid congestion, no regulation actions occur. Imbalances are only settled financially, i.e. the deficit area remunerates the surplus area.
MVV-TA/4NT/107166/000/01 • 10.02.2009 Final report 30⏐80
Hence, in order to realise cross-border balancing exchanges – entailing new physical exchanges – cross-border exchange schedules need to be adapted. However, schedule changes are subject to technical feasibility. In other words, one must be sure that an additional cross-border exchange is both feasible and secure. If the ATC is not fully used, additional exchanges are, in principle, feasible. If there is no longer any ATC available, TSOs may decide to organise a new ATC calculation round, similar to what happens at the intra-day trading gates. The closer to real time, the better the picture of expected power flows and thus of potential new transfer capacities. The assumptions made by TSOs during the initial ATC calculations on D-1 are verified and result in some cases in offering extra capacity. However, the opposite may also occur as the assumptions made can prove too optimistic, rendering the cross-border exchanges schedules too high and thereby threatening the system’s security (i.e. violation of N-1, overload, etc.).
Box D: ETSO definitions of cross-border transfer capacities
Total Transfer Capacity (TTC) is defined as the maximum possible power transfer between two adjacent areas. The calculations start by choosing the base case scenario, stating the energy balances of both areas A and B, e.g. ΔA= + 100 MW and ΔB= - 100 MW. The base case scenario includes information on the exact location of each power injection and sink in the interconnected grid. To find the TTC, the power exchange between the areas (i.e. ΔA and equivalent – but with a negative sign – ΔB) is increased until there is a breach of security constraints or, in other words, an internal or cross-border congestion. Using power flow and security analysis tools, this is done by increasing generation in one area and lowering it in the other. The highest possible exchange that does not violate security limits yields the TTC. The same procedure holds for both directions. Depending on the base case, the TTC can be different in both directions.
Transmission Reliability Margin (TRM) is a part of the cross-border capacity that is withdrawn from the market to account for the random threats to the security of the interconnected grid (e.g. unexpected activity of Load Frequency Control (LFC)) or for emergency exchanges. The TRM values are determined by the TSOs to guarantee secure real-time operation.
Net Transfer Capacity (NTC) accounts for the maximum exchange programme between two areas compatible with security standards and, as such, taking into account technical uncertainties about future network conditions: NTC = TTC – TRM.
Already Allocated Capacity (AAC) is the total sum of all allocated transmission rights, being capacity rights or exchange programs depending on the allocation method. The ATC also includes long term contracts, often concluded before electricity market liberalisation.
Available Transfer Capacity (ATC) is the cross-border capacity available for commercial trade: ATC = NTC - AAC.
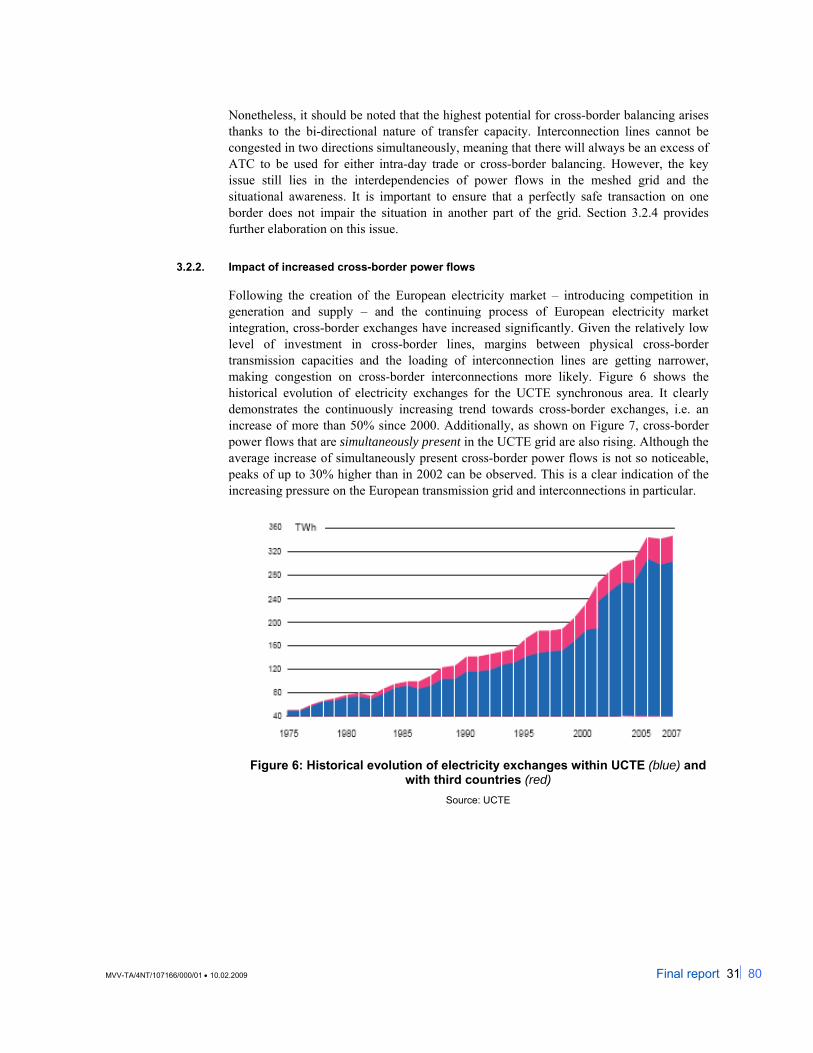
MVV-TA/4NT/107166/000/01 • 10.02.2009 Final report 31⏐80
Nonetheless, it should be noted that the highest potential for cross-border balancing arises thanks to the bi-directional nature of transfer capacity. Interconnection lines cannot be congested in two directions simultaneously, meaning that there will always be an excess of ATC to be used for either intra-day trade or cross-border balancing. However, the key issue still lies in the interdependencies of power flows in the meshed grid and the situational awareness. It is important to ensure that a perfectly safe transaction on one border does not impair the situation in another part of the grid. Section 3.2.4 provides further elaboration on this issue.
3.2.2. Impact of increased cross-border power flows
Following the creation of the European electricity market – introducing competition in generation and supply – and the continuing process of European electricity market integration, cross-border exchanges have increased significantly. Given the relatively low level of investment in cross-border lines, margins between physical cross-border transmission capacities and the loading of interconnection lines are getting narrower, making congestion on cross-border interconnections more likely. Figure 6 shows the historical evolution of electricity exchanges for the UCTE synchronous area. It clearly demonstrates the continuously increasing trend towards cross-border exchanges, i.e. an increase of more than 50% since 2000. Additionally, as shown on Figure 7, cross-border power flows that are simultaneously present in the UCTE grid are also rising. Although the average increase of simultaneously present cross-border power flows is not so noticeable, peaks of up to 30% higher than in 2002 can be observed. This is a clear indication of the increasing pressure on the European transmission grid and interconnections in particular.
Figure 6: Historical evolution of electricity exchanges within UCTE (blue) and with third countries (red)
Source: UCTE
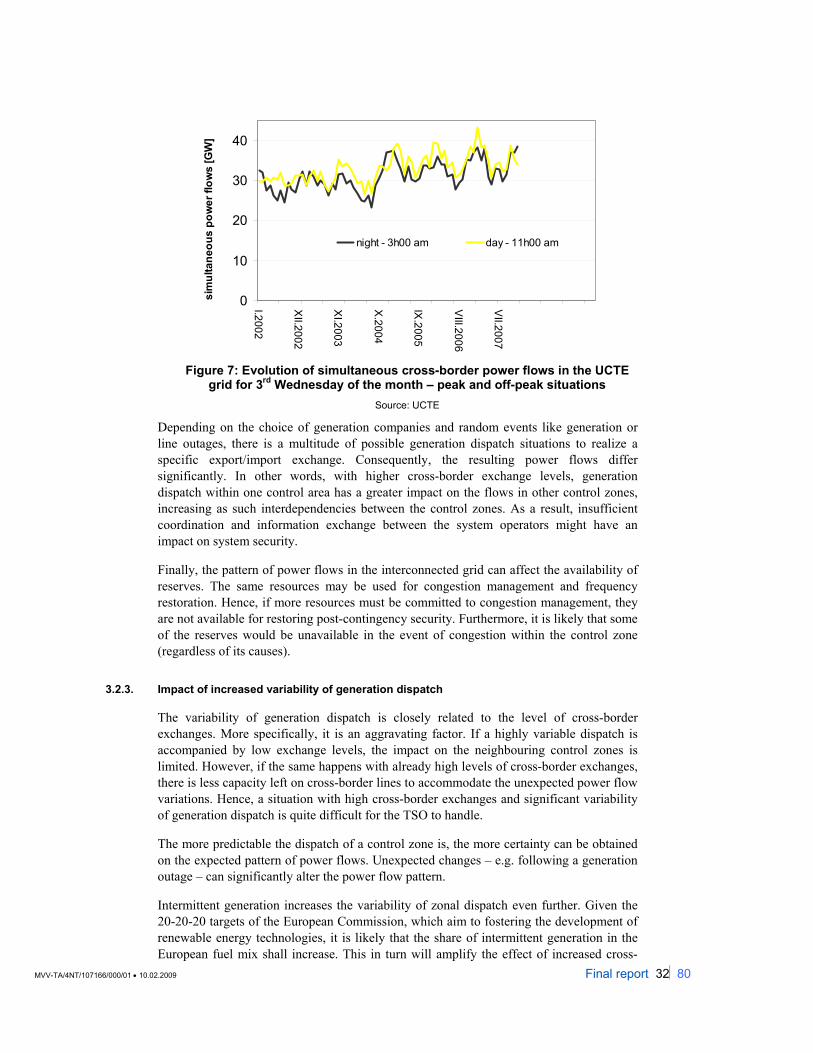
MVV-TA/4NT/107166/000/01 • 10.02.2009 Final report 32⏐80
0
10
20
30
40
I.2002
XII.2002
XI.2003
X.2004
IX.2005
VIII.2006
VII.2007
sim
ulta
neou
s po
wer
flow
s [G
W]
night - 3h00 am day - 11h00 am
Figure 7: Evolution of simultaneous cross-border power flows in the UCTE
grid for 3rd Wednesday of the month – peak and off-peak situations Source: UCTE
Depending on the choice of generation companies and random events like generation or line outages, there is a multitude of possible generation dispatch situations to realize a specific export/import exchange. Consequently, the resulting power flows differ significantly. In other words, with higher cross-border exchange levels, generation dispatch within one control area has a greater impact on the flows in other control zones, increasing as such interdependencies between the control zones. As a result, insufficient coordination and information exchange between the system operators might have an impact on system security.
Finally, the pattern of power flows in the interconnected grid can affect the availability of reserves. The same resources may be used for congestion management and frequency restoration. Hence, if more resources must be committed to congestion management, they are not available for restoring post-contingency security. Furthermore, it is likely that some of the reserves would be unavailable in the event of congestion within the control zone (regardless of its causes).
3.2.3. Impact of increased variability of generation dispatch
The variability of generation dispatch is closely related to the level of cross-border exchanges. More specifically, it is an aggravating factor. If a highly variable dispatch is accompanied by low exchange levels, the impact on the neighbouring control zones is limited. However, if the same happens with already high levels of cross-border exchanges, there is less capacity left on cross-border lines to accommodate the unexpected power flow variations. Hence, a situation with high cross-border exchanges and significant variability of generation dispatch is quite difficult for the TSO to handle.
The more predictable the dispatch of a control zone is, the more certainty can be obtained on the expected pattern of power flows. Unexpected changes – e.g. following a generation outage – can significantly alter the power flow pattern.
Intermittent generation increases the variability of zonal dispatch even further. Given the 20-20-20 targets of the European Commission, which aim to fostering the development of renewable energy technologies, it is likely that the share of intermittent generation in the European fuel mix shall increase. This in turn will amplify the effect of increased cross-
MVV-TA/4NT/107166/000/01 • 10.02.2009 Final report 33⏐80
border exchanges by making the resulting cross-border power flows less stable (i.e. more intermittent).
Last but not least, according to the frequency control arrangements in the UCTE grid, the TSO is obliged to restore the control area balance following a discrepancy between the scheduled and measured exchanges. The more variability in there is in generation - due either to contingencies or inherent intermittency of the generation technology - the more often the area balance is not respected, resulting in additional cross-border flows. Although this area imbalance has a short duration for typical contingencies, a TSO’s ability to restore the balance under a large share of intermittent generation will greatly depend on the availability of significant reserves.
3.2.4. Impact of inaccurate information exchange
The factors discussed in Sections 3.2.2 and 3.2.3 increase pressure on the transmission grid. System operators therefore look for tools and procedures to cope with the variability of power flows that they do not control. Phase-shifting transformers and other power flow control devices are considered to be a means of regaining control over the power flows in the interconnected system and a possible remedy against transmission constraints. However, though their effectiveness cannot be disputed, flow control devices are another degree of freedom influencing the power flows in the control area guarded by a specific TSO. Consequently, power flows in all areas will be influenced by the settings of these devices. This means it is extremely important to have a good understanding of the impact of these device settings on power flows in the transmission grid and take them into account in security analyses.
In recognition of this problem, TSOs exchange power flow data for each hour of the following day. This allows them to identify possible insecure situations before they actually occur and leaves some time for preventive security measures. However, in real time, the situation can be different from that expected at the operational planning stages, e.g. due to intermittent renewables. The security analysis running in real time must take into account this changing dispatch to guarantee that the power system is indeed operated securely.
However, there still remains a problem of information with respect to foreign control zones. Typically, the models used in security analysis view the outside world in a simplified manner. This means that although TSOs have a detailed picture of their own control zones, neighbouring control zones are modelled with a lower level of detail. These models are set to display behaviour as similar as possible to actual system behaviour. The underlying assumption is that the contribution of the primary response from foreign systems is quite stable and does not depend on dispatch changes within individual control areas.
In recent years, data exchange between TSOs has been significantly improved, implying increased situational awareness – thanks to the exchange of real-time measurements – and an improved level of detail in the modelling of foreign systems. This increases the representativeness and effectiveness of the security analysis.
3.2.5. What is actually the biggest problem?
Now that the factors influencing system security have been identified, this section will try to quantify the extent of their impact.
MVV-TA/4NT/107166/000/01 • 10.02.2009 Final report 34⏐80
INCREASED CROSS-BORDER TRADE
To determine the ATC available for commercial cross-border exchanges over a specific border, TSOs estimate the maximal possible additional exchange, based on security-constrained power flow studies. These consider both the physical capacities of the transmission infrastructure and a list of secured normative events ensuring preventive security margins in case of contingencies. The more cross-border commercial transfer capacity is offered to market participants, the more stress there is on the grid.
The amount of trade allowed is known in advance and defined by nominations of the commercially available Transfer Capacity. Depending on the way this trade is performed – i.e. which generators will produce the traded energy – the difference between the nominated cross-border exchanges and the physical power flows can reach 1,000 MW. Moreover, as the power flows resulting from this trade are often transit flows, they can cause fluctuations on all borders of the control zone. In extreme cases, two borders may experience a significant mismatch between nominations and physical power flows. For instance, for a control area importing -1,000 MW, instead of the nominated -1,500 MW on one border and +500 MW on the other, one can see completely different power flows on the relevant borders, i.e. -500 MW and -500 MW respectively. Depending on the expected loading of the lines, additional power flows can cause overloads requiring corrective action by the TSOs.
Therefore, in order to determine the way this trade will be realised physically, a Day Ahead Congestion Forecast (DACF) procedure is applied between the TSOs concerned. Information is exchanged on the expected dispatch by the control zones for each hour of the following day, allowing a better overview of the expected power flows. DACF is quite effective: it significantly reduces uncertainties on the evolution of cross-border power flows.
INCREASED INTERMITTENCY OF GENERATION DISPATCH
This factor is quite similar to the previous one and comes down to the plurality of possibilities for carrying out a certain trade. However, an extra issue is the intermittency of renewables, implying that – due to variations of generation – the system reserves could be significantly stressed. In the event of a sudden loss of significant wind generation, the primary control is expected to react. For very large shares of installed wind capacity, imbalances could largely exceed the size of the most severe incident considered. Moreover, restoring preventive security could be a challenge as unavoidable regional dispatch shifts – wind and conventional generation are rarely closely connected to each other in the grid – will most likely affect the power flows on internal and cross-border lines and, as such, other control areas. Expected effects depend on the installed wind capacity as wind power injection changes can reach 30-50% of the installed wind power capacity. Though an increased share of wind capacity gives rise to a smoothening effect limiting the per cent fluctuation, this fluctuation will still be important in actual terms, i.e. exceeding 1,000 MW per border.
INFORMATION EXCHANGE AND INSUFFICIENT REPRESENTATIVENESS OF SECURITY ANALYSIS TOOLS
This issue is already largely being addressed by European TSOs. Though it can indeed be expected that incorrect estimates of primary response will have an impact on the power flows in the system, this impact is typically quite small. In the event of a 1,000 MW contingency, a significant part of it will enter the control zone from outside in the moments directly following the incident, implying a variation of the loading on the cross-border

MVV-TA/4NT/107166/000/01 • 10.02.2009 Final report 35⏐80
lines. Incorrect estimation of the primary response may be responsible for some mismatches between the expected and actual power flows, but it is unlikely that the mismatch would be higher than 100-200 MW per line. Moreover, the effect is temporary as the preventive security margin must be restored within 15 minutes.

MVV-TA/4NT/107166/000/01 • 10.02.2009 Final report 36⏐80
MVV-TA/4NT/107166/000/01 • 10.02.2009 Final report 37⏐80
4. PREREQUISITES FOR CROSS-BORDER BALANCING IMPLEMENTATION As discussed in Section 3, inefficiencies and distorting effects related to insufficient harmonisation and centralisation of real-time balancing also occur without cross-border balancing trade taking place. For this reason, it is recommended to proceed with cross-border balancing implementation taking into account only minimum prerequisites – ensuring fast but functioning implementation – and further harmonise and centralise at a later stage. A similar approach has proven successful for the Nordic cross-border balancing initiative and the Trilateral Day-Ahead Market Coupling between Belgium, France and the Netherlands. Both initiatives have proven to trigger harmonisation and centralisation rather than requiring them from the start.
This section identifies absolute prerequisites –from both a security and market-related point of view – for the implementation of cross-border balancing trade. Firstly, an overview of different approaches to cross-border balancing implementation is provided as harmonisation and centralisation prerequisites depend on the implementation approach chosen. Secondly, minimum harmonisation requirements with regard to real-time market designs are considered, as are potential barriers to a more advanced cross-border balancing implementation. The necessity of cross-border capacity reservations is then discussed. Finally, potential costs and benefits of implementing cross-border balancing are assessed by means of a simple case study.
4.1. DIFFERENT APPROACHES TO CROSS-BORDER BALANCING IMPLEMENTATION
So far, DG TREN (2005), ERGEG (2006) and ETSO (2005-2006-2007) have proposed several approaches for the implementation of cross-border balancing, each entailing a different degree of real-time market harmonisation prerequisites. An overview of all proposals is provided below.
4.1.1. TSO-BSP versus TSO-TSO trading
A distinction can generally be made between two approaches. The first approach (TSO-BSP trading) consists in enabling Balancing Service Providers (BSP) to contract for the provision of balancing services directly with the TSO of the neighbouring control zone. The second approach (TSO-TSO trading) involves the exchange of balancing services between neighbouring TSOs.
Due to the short-term nature of real-time balancing and the lack of system overview of each individual market participant, the exchange of services can be most easily optimised between TSOs by using the TSO-TSO approach. Under the TSO-BSP approach, BSPs have to identify the best possible allocation of their services – either to their own control areas or abroad. Furthermore, notification of schedule changes has to be performed by BSPs, making cross-border balancing supplies difficult in practice as the amount of time needed to nominate production and cross-border exchange programmes exceeds the balancing timeframe. For this reason, it would be preferable to aim for implementation according to the second approach (TSO-TSO) rather than the first (TSO-BSP). Different implementation proposals for TSO-TSO trading are set out below.
MVV-TA/4NT/107166/000/01 • 10.02.2009 Final report 38⏐80
4.1.2. TSO-TSO real-time energy trading
This approach only concerns the cross-border exchange of real-time energy delivery services. Its implementation enables TSOs to procure real-time energy – through energy payments – from neighbouring TSOs. Exchanges can either be limited to services in excess of those needed to maintain the balance in the TSO’s own control area or can include all services via the use of a common merit order. Potential benefits include the activation of the cheapest available resources as well as a reduction of total energy payments.
4.1.3. TSO-TSO reserve trading
This approach is applicable to both security insurance and real-time energy delivery services. Its implementation enables TSOs to procure reserves – through capacity payments – from neighbouring TSOs, bilaterally or via the use of a common merit order. With respect to security insurance services, it also allows the fulfilment of Solidarity principle requirements through variable – rather than fixed – reserve sharing between TSOs. Potential benefits include the procurement of the cheapest resources as well as a reduction of total capacity payments.
4.1.4. One regional control area
This approach involves the transition from several existing control areas to one global control area. In fact, such a transition can be interpreted in two ways. Firstly, existing control areas could be joined into one overall control area while preserving balance responsibility of each control area. Put differently, each control area would become a BRP and imbalances of control areas would be cancelled out as far as possible. The remaining overall net imbalance would be compensated for by those countries whose imbalances were not yet completely levelled out. Secondly, existing control areas could be joined into one control area, together with a transfer of balance responsibilities to one supervisory body that would be appointed for maintaining a balance at an overall regional level. Potential benefits include a reduction of total required reserve volumes at regional level as resources would be activated for regional balance only. Accordingly, implementing this approach does not make much sense for security insurance services contributing to the frequency of the whole synchronous area since the required (regional) reserve volumes of such services cannot be reduced.
Given the high level of harmonisation and centralisation prerequisites for this approach (both the regulatory and technical ones), its implementation should be an end goal rather than a starting point.
4.2. MINIMUM HARMONISATION OF REAL-TIME MARKET DESIGNS
Following on the above discussion of possible cross-border balancing implementation approaches, initial cross-border balancing implementation should reflect the suggestions made in Sections 4.1.2 and 4.1.3 should initially be aimed for.
With a view to identifying associated harmonisation prerequisites, the Nordic cross-border balancing initiative can serve as a valuable reference. With initial implementation in 2002, harmonisation of real-time market designs was kept to a minimum and mainly concentrated on the technical characteristics of balancing services, including activation time and time to full activation. During the first years of cross-border balancing trade, calls for more harmonisation gradually emerged. As a result, further steps towards
MVV-TA/4NT/107166/000/01 • 10.02.2009 Final report 39⏐80
harmonisation will be implemented in early 2009. These steps are mainly connected to imbalance settlement (including imbalance volume calculation, imbalance pricing and cost allocation), gate closure times (the introduction of the intra-day market Elbas in Norway will lead to a common gate closure time of H-1 for the whole region) and the time interval for the submission of real-time energy bids in the real-time market (to be harmonised to H-45 min).
The Nordic experience shows that prerequisites can be limited to harmonisation of the technical characteristics of balancing services. However – building on the Nordic experience – it is advisable to a harmonise of gate closure times from the outset, given that different gate closure times will lead to asymmetric market opportunities and different imbalance exposures at each side of the border.
Prerequisites for harmonisation are summarised in Box E. In the long run, harmonisation of main procurement (including remuneration for services and rules determining the necessary amount and appropriate use of reserves) and imbalance settlements (including the calculation of imbalance volumes, imbalance pricing and settlement periods) should be the main aim. Specific recommendations on the harmonisation of real-time market designs are outlined in Section 5.
4.3. POTENTIAL BARRIERS TO IMPLEMENTING A MORE ADVANCED CROSS-BORDER BALANCING APPROACH
Although the prerequisites identified above are enough to enable cross-border balancing, a lack of further harmonisation might hinder a transition towards full and well-functioning implementation as described in Sections 4.1.2 and 4.1.3 .
Figure 8 depicts potential obstacles associated with cross-border balancing trade between countries remunerating similar services differently. Assume country A procures a service merely on the basis of energy payments, while neighbouring country B also pays for capacity. As a result, the real-time energy price of country B might be – depending on the size of capacity payments – relatively lower than in country A. Consequently, the TSO of country A may be tempted to procure balancing services in country B16(1), resulting in a ‘fuite de réserves’ from country B to country A or, in other words, a migration of imbalances from country A to country B (2).
16 Similarly, in case cross-border balancing trade is implemented according to the TSO-BSP approach (cf. supra) – enabling BSPs to offer their services directly to neighbouring TSOs – providers of country B might be encouraged to offer their services rather in country A.
Box E: Prerequisites with respect to real-time market design harmonisation
• Harmonisation of technical characteristics of balancing services (e.g. activation time)
• Harmonisation of gate closure times
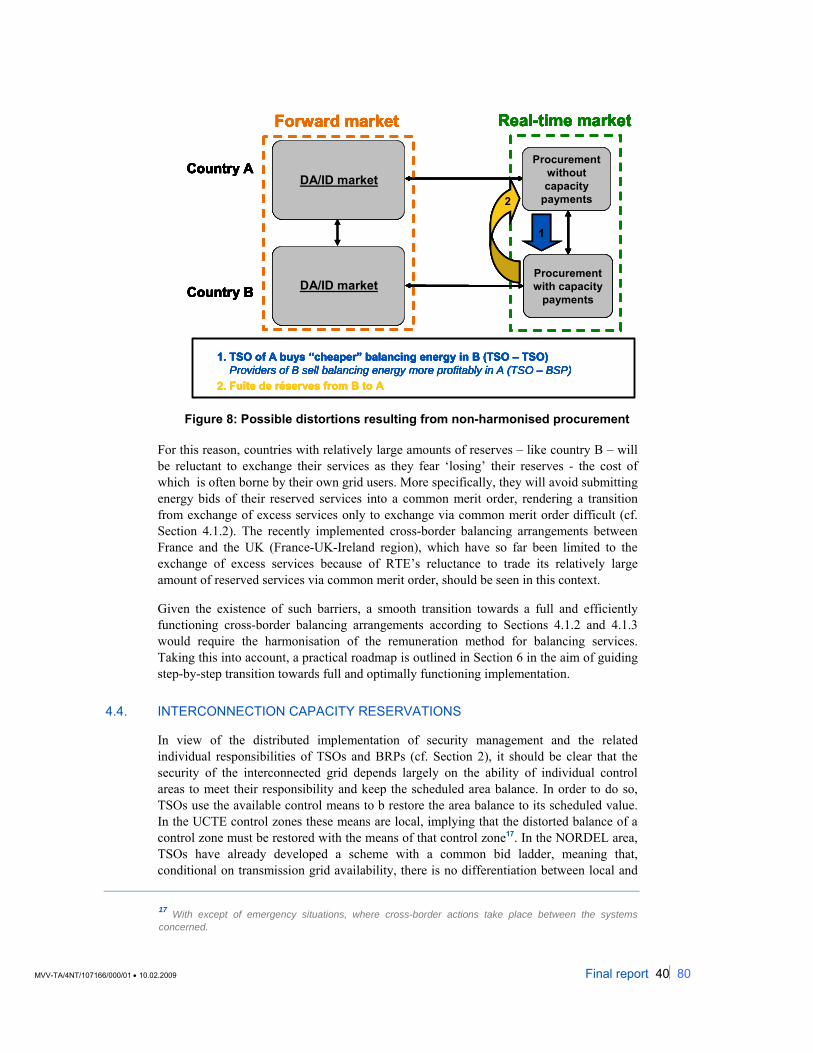
MVV-TA/4NT/107166/000/01 • 10.02.2009 Final report 40⏐80
1. TSO of A buys “cheaper” balancing energy in B (TSO – TSO) Providers of B sell balancing energy more profitably in A (TSO – BSP)
2. Fuîte de réserves from B to A
Forward market Real-time market
Country A
Country B
Procurement without capacity
paymentsDA/ID market
Procurementwith capacity
paymentsDA/ID market
1
2
1. TSO of A buys “cheaper” balancing energy in B (TSO – TSO) Providers of B sell balancing energy more profitably in A (TSO – BSP)
2. Fuîte de réserves from B to A
Forward market Real-time market
Country A
Country B
Procurement without capacity
paymentsDA/ID market
Procurementwith capacity
paymentsDA/ID market
1
1. TSO of A buys “cheaper” balancing energy in B (TSO – TSO) Providers of B sell balancing energy more profitably in A (TSO – BSP)
2. Fuîte de réserves from B to A
Forward market Real-time market
Country A
Country B
Procurement without capacity
paymentsDA/ID market
Procurementwith capacity
paymentsDA/ID market
Forward market Real-time market
Country A
Country B
Procurement without capacity
paymentsDA/ID market
Procurementwith capacity
paymentsDA/ID market
Procurement without capacity
paymentsDA/ID market
Procurementwith capacity
paymentsDA/ID market
11
2
Figure 8: Possible distortions resulting from non-harmonised procurement
For this reason, countries with relatively large amounts of reserves – like country B – will be reluctant to exchange their services as they fear ‘losing’ their reserves - the cost of which is often borne by their own grid users. More specifically, they will avoid submitting energy bids of their reserved services into a common merit order, rendering a transition from exchange of excess services only to exchange via common merit order difficult (cf. Section 4.1.2). The recently implemented cross-border balancing arrangements between France and the UK (France-UK-Ireland region), which have so far been limited to the exchange of excess services because of RTE’s reluctance to trade its relatively large amount of reserved services via common merit order, should be seen in this context.
Given the existence of such barriers, a smooth transition towards a full and efficiently functioning cross-border balancing arrangements according to Sections 4.1.2 and 4.1.3 would require the harmonisation of the remuneration method for balancing services. Taking this into account, a practical roadmap is outlined in Section 6 in the aim of guiding step-by-step transition towards full and optimally functioning implementation.
4.4. INTERCONNECTION CAPACITY RESERVATIONS
In view of the distributed implementation of security management and the related individual responsibilities of TSOs and BRPs (cf. Section 2), it should be clear that the security of the interconnected grid depends largely on the ability of individual control areas to meet their responsibility and keep the scheduled area balance. In order to do so, TSOs use the available control means to b restore the area balance to its scheduled value. In the UCTE control zones these means are local, implying that the distorted balance of a control zone must be restored with the means of that control zone17. In the NORDEL area, TSOs have already developed a scheme with a common bid ladder, meaning that, conditional on transmission grid availability, there is no differentiation between local and
17 With except of emergency situations, where cross-border actions take place between the systems concerned.
MVV-TA/4NT/107166/000/01 • 10.02.2009 Final report 41⏐80
foreign means. The current UCTE approach of Solidarity – i.e. shared primary reserves and no compensation between control zones – and Responsibility – i.e. no exchanges of secondary reserves and no compensation between control zones – will have to be adapted to follow the example of NORDEL and allow the use of foreign reserves for balancing.
Note that there is a fundamental difference between security insurance services (primary control services) and real-time energy delivery services (secondary and tertiary control services). Their different characteristics require different treatment in terms of cross-border capacity reservation.
4.4.1. Exchange of security insurance services conditional on interconnection capacity reservations
Security insurance services (primary control in UCTE terms) react automatically to frequency deviations in a matter of seconds. It is therefore obvious that such services, if contracted in a foreign control area, should require a capacity reservation contract. Otherwise they may cause an insecure situation – i.e. overloads18 – in the event of a frequency deviation. The key feature of security insurance services is their reaction speed, which is obtained through the Solidarity principle: all control zones contribute to the overall ability to cope with contingencies and reserves are spread uniformly over a large number of units.
If the current sharing principle – based on the ratio between the energy generated in a given control and the total of the synchronous area – is abandoned, there are a number of important issues that need to be considered:
• the change must not result in a deterioration of the primary response quality. If the number of contributing units is limited, they must be able to deliver the required ramping capability.
• the geographical share of reserves must be such that the synchronous interconnection is able to cope with a possible split. To this end, all islands must keep a certain degree of frequency control ability.
Another consequence of stepping away from the equal sharing approach is that security analysis as performed today must be revisited. Each time a control area’s participation in the primary reserve is changed, all the TSOs in the synchronous area – at least in the neighbourhood – must be informed. If there are major geographical shifts, all control zones must be aware which control zones are participating in the provision of primary reserves and to what extent – i.e. the current contribution of the area concerned – so they can take this into account in their security planning. It is currently assumed that contributions to primary control are evenly distributed among generators within a control zone, making them reasonably stable. Changing these contributions will result in less predictable consequences in the event of contingencies. If such geographical redistribution is fixed (e.g. country A and B respectively increasing and decreasing their contribution by 20%), the resulting effect can, in principle, be estimated with about the same level of accuracy as
18 NB The delivery of primary control is only temporary (i.e. 15 minutes) and as such, overloads would not be sustained. Elements of the transmission system are, in principle, able to withstand overloads for a short period. However, as the security of the interconnected grid is an extremely important issue, the system is not pushed to its utter limits by keeping a small potential security margin as an extra buffer.
MVV-TA/4NT/107166/000/01 • 10.02.2009 Final report 42⏐80
in the current situation. However, if sharing is variable in time, estimating the effects of contingencies will become more difficult and may lead to greater and more frequent inaccuracies in security analysis. Even more problematic is that each time the primary control settings are changed, the changing response of the system after a disturbance will make it impossible for TSOs – more specifically the dispatchers in the control room – to rely on experience.
In other words, the effects of contingencies – at least for the direct neighbourhood – must be known to all TSOs to allow them to take this into account in their operational system planning.
Changing contributions to the provision of primary reserves also have a direct impact on the Transmission Reliability Margin (TRM). Control zones that increase their provision of primary control will have to increase their TRM. On the contrary, control zones that decrease their participation should also decrease their TRM. This follows directly from the principles of cross-border transfer capacity estimations. When calculating the Total Transfer Capacity (TTC) of a given interconnection, TSOs check the maximum allowed transfer between the areas concerned, provided all the grid security rules are respected (i.e. N-1). This analysis implies sufficient reserve receiving transfer capacity in the event of local generation loss, which is ensured by the difference between the physical capacity of the interconnection lines and the actual TTC. Reserve delivering transfer capacity, i.e. the ability to send energy outside of the control zone following a generation deficit somewhere else, is not taken into account in TTC calculations. It should therefore be guaranteed by reserving a proportion of the transfer capacity corresponding to the control area’s contribution to the overall primary response. In other words, capacity reserved for emergency exchanges constitutes a part of the TRM.
In conclusion, cross-border capacity must be reserved for security insurance services. Moreover, when altering control areas’ contributions to the primary response, a sufficient geographic spread must remain19. All in all, it can be expected that the effect an unequal spread of primary reserves would have on the power flows in the synchronous area would not be very significant compared to other issues, such as difficulties arising with changes to the geographical contribution of secondary control, international trade or an intermittent zonal dispatch with associated loop flows.
4.4.2. Exchange of real-time energy delivery services conditional to real-time interconnection availability
The picture looks different for real-time energy delivery services (secondary and tertiary control). These services have a response time of up to 15 minutes or longer, meaning that they can, in principle, be activated manually, though in UCTE, this process is automated under the Automatic Generation Control (AGC) system. The time lag provides an opportunity to check the impact of their activation on the grid and weigh up whether to activate locally-available resources or foreign ones. However, as these services deliver a significant amount of real-time energy, the resulting power flows are sustainable. The new dispatch – i.e. violation of one control area equilibrium compensated by an equivalent area mismatch in another area – must therefore be feasible, meaning that, when activating a foreign real-time energy delivery resource, one must be sure that there is transmission capacity available to accommodate the new grid situation. If this transmission capacity is not available, the foreign resources cannot be activated and the area imbalance – causing
19 UCTE Ad hoc Group “Geographical Distribution of Reserves”, 2005.
MVV-TA/4NT/107166/000/01 • 10.02.2009 Final report 43⏐80
an imbalance of the whole synchronous area and thus reducing the overall system security – must be restored with local means. However, this comes down to reserving more than 100% of actual needs (100% locally plus outside)20. Otherwise, there is a risk that the TSO will not be able to use all of the required resources and can only hope that it will never be necessary to activate the full 100% of reserves. In a worst-case scenario, one is bound to turn to curative means such as disconnection of a portion of the load (i.e. contracted interruptible load or, in extreme cases, forced load shedding).
In addition to availability of transmission capacity, another prerequisite is the security of the new situation resulting from restoration of local area balance using foreign resources, (which would imply an effective change of the scheduled exchanges between the control areas). At present, this requirement is met implicitly as it is assumed that local restoration of the area balance introduces no significant differences between the pre- and post-contingency state, at least for the neighbouring control areas. However, if control zones are not obliged to restore the balance locally, the post-contingency state may be quite different from the pre-contingency state as exchanging foreign resources will be equivalent to coordinated cross-border re-dispatching or changing the pre-agreed exchange schedules. This will surely have an impact on the cross-border power flows.
At this point, it should be noted that there are obvious similarities between intra-day cross-border trade and cross-border balancing. The former is already organised between some control zones, so there are no fundamental obstacles to cross-border balancing. However, as with cross-border intra-day trade, changing cross-border exchange schedules requires a new system security analysis in the areas concerned, as previous computations are no longer valid in the new system state. Consequently, bearing in mind that the system state is extensively checked on D-1, care should be taken when the pre-agreed schedules can be changed significantly. Hence, in the absence of a new round of information exchanges similar to that taking place on D-1, it is recommended to limit the volume of cross-border balancing trade compared to the scheduled cross-border energy trade.
In conclusion, it is not recommended to reserve cross-border capacity for services delivering real-time energy. However, this choice entails their usability being subject to availability of transmission capacity. Control areas choosing to reserve real-time energy delivery services across the border must be sure that in case these cannot be used, local means are available. Additionally, as the post-contingency state will be different from the pre-contingency state, foreign events will have a noticeable sustained impact on the control zones. This will imply that an increased number of contingencies will need checked by each TSO.
Finally, where the activation process of the real-time energy delivering services is automatic, the organisation of AGC would need to be adopted by making use of resources outside the control zone, conditional on available transfer capacity. The mathematical fundamentals of this are quite straightforward and had already been proposed over 20 years ago21.
A summary of all prerequisites with respect to cross-border capacity is given in Box F.
20 Although more than 100% of the necessary resources would have to be reserved (contracted for availability), only the required amount will be actually activated. The benefit lies in potential lower costs when foreign reserves can be activated. .
21 Cf. M. Ilic and S. Liu, “Hierarchical Power System Control, its value in a changing industry: Advances in Industrial Control”, Springer-Verlag London Limited, 1996.
MVV-TA/4NT/107166/000/01 • 10.02.2009 Final report 44⏐80
4.5. POTENTIAL BENEFITS AND COSTS OF IMPLEMENTING CROSS-BORDER BALANCING
To obtain some basic insight into the extent of potential benefits associated with the implementation of cross-border balancing as well as potential constraints due to limited cross-border capacity, this section estimates the gains that could have been made following cross-border balancing trade between Belgium and France on a random day in 2008, 29 November. Due to restrictions in the availability of bidding volumes and prices of balancing services, only a few hours are considered, more specifically the morning period from 9.00 a.m. to 2.00 p.m.
DATA DESCRIPTION AND METHODOLOGY
Calculations are made based on the following data22 and assumptions:
• Net regulation volumes (NRV) of Elia (Belgium) and RTE (France):
NRVs are assumed to represent the amount of services both TSOs had to activate per settlement period. In practice, however, TSOs sometimes regulate up- and downwards within the same settlement period, implying actual activations – and associated costs – can differ from the NRV.
• Bid volumes and prices of balancing services of Elia and RTE:
RTE’s bid data are not published per settlement period but on a morning/evening peak period basis (on 29 November, the peak period was 9.00 a.m. – 2.00 p.m.). As such,
22 All data used can be found on http://www.elia.be and http://www.rte-france.com/.
Box F: Prerequisites with respect to cross-border capacity reservations
• Cross-border capacity must be reserved for security insurance services (i.e. primary control).
• It is not recommended to reserve cross-border capacity for real-time energy delivery services (i.e. secondary and tertiary control). However, this choice renders their usefulness subject to grid availability.
• Availability of a reserve as seen from a given control area must be checked in advance, meaning that the scope of monitored events in security analysis must be enlarged.
• If no cross-border capacity is reserved for real-time energy delivery services, control zones contracting foreign reserves must ensure sufficient local means (redundant resources) or establish adequate system protection schemes such as interruptible loads.
• If the activation process of the real-time energy delivering services is automatic, the organisation of AGC needs to be adopted by making use of resources outside the control zone, conditional on available transfer capacity.
MVV-TA/4NT/107166/000/01 • 10.02.2009 Final report 45⏐80
only the bids that can be made active throughout the whole peak period are taken into account. Bid prices are accurate to within 5€.
Bid data published by Elia are limited to the marginal prices of bids that would be activated for certain predetermined volumes, i.e. +/- 100 MW, +/- 300 MW, +/- 600 MW and +/- maximum volume (representing the last offer activated).
• Bid data are based on D-1 submissions.
• Bids are assumed to be activated based purely on merit order.
• Given the different settlement period in Belgium (1/4 hour) and France (1/2 hour) and the prerequisite of harmonised settlement periods to enable cross-border balancing (cf. Section 4.2), data for Belgium are averaged on a 1/2 hourly basis (this being the least common multiple) for the calculation of costs with cross-border balancing
• Available cross-border capacities between Belgium and France at the intra-day stage are equivalent to intra-day cross-border capacities available at the 1.00 p.m. intra-day gate closure.
For each 1/2 hour considered the following analyses are made:
• calculation of balancing costs without cross-border balancing – i.e. balancing services are procured in Belgium and France separately and netting of opposed imbalances is not allowed
• calculation of balancing costs with cross-border balancing – i.e. balancing services can be procured cross-border through a common merit order and netting of opposed imbalances is allowed; all netting and cross-border procurement opportunities are verified against the available cross-border capacities23
23 Abstraction is however made of national network constraints.
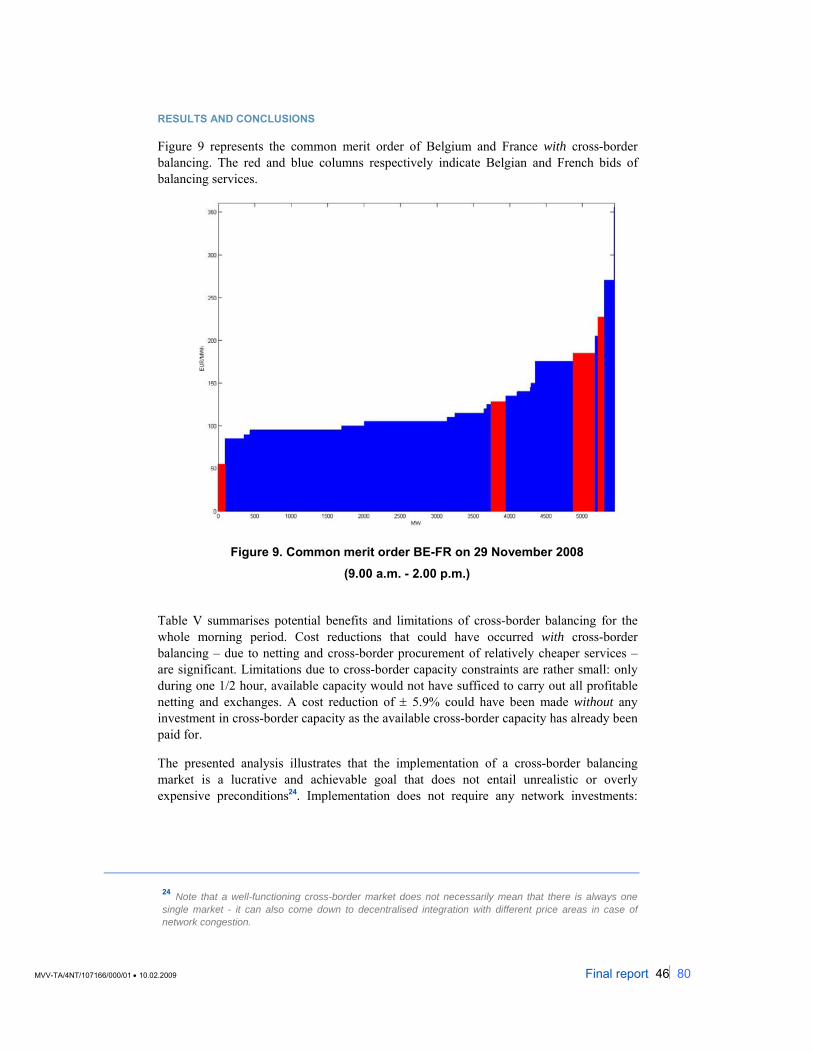
MVV-TA/4NT/107166/000/01 • 10.02.2009 Final report 46⏐80
RESULTS AND CONCLUSIONS
Figure 9 represents the common merit order of Belgium and France with cross-border balancing. The red and blue columns respectively indicate Belgian and French bids of balancing services.
Figure 9. Common merit order BE-FR on 29 November 2008
(9.00 a.m. - 2.00 p.m.)
Table V summarises potential benefits and limitations of cross-border balancing for the whole morning period. Cost reductions that could have occurred with cross-border balancing – due to netting and cross-border procurement of relatively cheaper services – are significant. Limitations due to cross-border capacity constraints are rather small: only during one 1/2 hour, available capacity would not have sufficed to carry out all profitable netting and exchanges. A cost reduction of ± 5.9% could have been made without any investment in cross-border capacity as the available cross-border capacity has already been paid for.
The presented analysis illustrates that the implementation of a cross-border balancing market is a lucrative and achievable goal that does not entail unrealistic or overly expensive preconditions24. Implementation does not require any network investments:
24 Note that a well-functioning cross-border market does not necessarily mean that there is always one single market - it can also come down to decentralised integration with different price areas in case of network congestion.
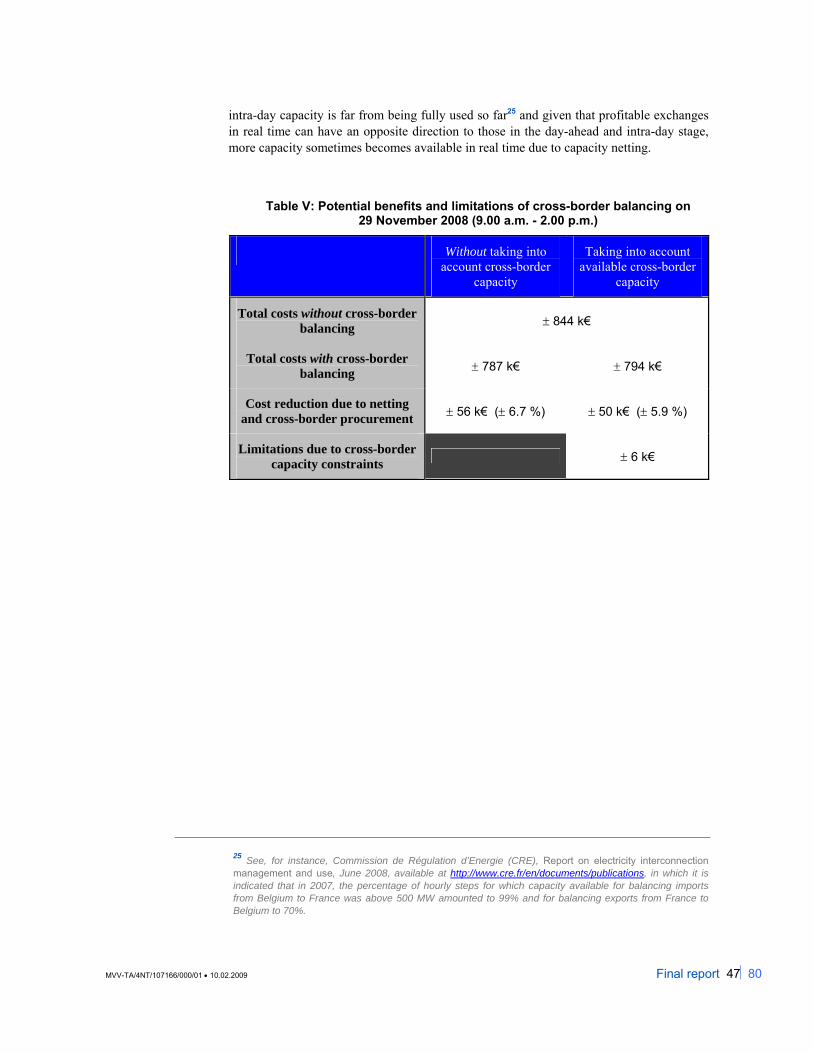
MVV-TA/4NT/107166/000/01 • 10.02.2009 Final report 47⏐80
intra-day capacity is far from being fully used so far25 and given that profitable exchanges in real time can have an opposite direction to those in the day-ahead and intra-day stage, more capacity sometimes becomes available in real time due to capacity netting.
Table V: Potential benefits and limitations of cross-border balancing on 29 November 2008 (9.00 a.m. - 2.00 p.m.)
Without taking into account cross-border
capacity
Taking into account available cross-border
capacity
Total costs without cross-border balancing ± 844 k€
Total costs with cross-border balancing ± 787 k€ ± 794 k€
Cost reduction due to netting and cross-border procurement ± 56 k€ (± 6.7 %) ± 50 k€ (± 5.9 %)
Limitations due to cross-border capacity constraints ± 6 k€
25 See, for instance, Commission de Régulation d’Energie (CRE), Report on electricity interconnection management and use, June 2008, available at http://www.cre.fr/en/documents/publications, in which it is indicated that in 2007, the percentage of hourly steps for which capacity available for balancing imports from Belgium to France was above 500 MW amounted to 99% and for balancing exports from France to Belgium to 70%.

MVV-TA/4NT/107166/000/01 • 10.02.2009 Final report 48⏐80
MVV-TA/4NT/107166/000/01 • 10.02.2009 Final report 49⏐80
5. RECOMMENDATIONS ON HARMONISATION AND CENTRALISATION
While the minimum prerequisites defined in Section 4 ensure fast and functioning implementation of cross-border balancing trade, they do not eliminate the inefficiencies and distorting effects resulting from a lack of harmonisation and centralisation, as discussed in Section 3. Initial cross-border balancing implementation therefore requires further optimisation. Current practice in the Nordic countries – which initially implemented cross-border balancing trade in 2002 and decided to take further steps towards harmonisation in early 2009 – proves the applicability of such an approach.
This section gives recommendations on further optimisation of cross-border balancing. First, suggestions on the harmonisation of real-time market designs are put forward. Given that current national real-time designs are often more regulated than market-based designs – which is understandable as some real-time markets simply cannot function properly on a national scale – emphasis is placed on the importance of harmonising towards a more market-based implementation of cross-border real-time trade. A discussion of the developments in the area of grid management integration follows.
Box G: Final recommendations on real-time market design harmonisation
• Real-time energy prices should be market-based.
• Market-based means that: - Imbalances in real time are settled at a price that fully reflects the costs of
delivering energy in real time. Even though there are grounds to socialise part of the cost of reserves, the
total procurement costs of reserves that deliver a significant amount of energy in real time should be fully reflected in the imbalance settlement.
An imbalance settlement based on other components such as power exchange prices and penalties is not market-based, but an additive component is necessary to settle capacity payments of reserve procurement.
Capacity payments for real-time energy delivery services are only transitional and should preferably be phased out.
• Market-based implies that: - a cap should be imposed on the amount of reserves contracted so that:
their share in real-time energy deliveries is marginal the real-time energy price is mainly based on balancing services
procured in real-time and is not dominated by the capacity payment component
- there should be sufficient liquidity in the real-time market - as market-based solutions are not always feasible on a national scale,
cross-border balancing implementation should precede market design harmonisation.
MVV-TA/4NT/107166/000/01 • 10.02.2009 Final report 50⏐80
5.1. NEED FOR MARKET-BASED REAL-TIME ENERGY PRICES
Real-time markets provide market parties with a ‘last resort’ for energy transactions. The prices expected to be brought forth by this market are reflected in wholesale prices and consequently affect market parties’ decisions at the forward stage. For this reason, efficient functioning of electricity markets is conditional on market-based or cost-reflective real-time energy prices.
The recommendations in Box G were developed and expanded taking market-based, real-time energy prices as the point of departure.
5.2. MEANING OF MARKET-BASED: ALLOCATION OF ENERGY PAYMENTS
Real-time energy prices are market-based insofar as they fully reflect all procurement expenses incurred by the TSO for delivering energy in real time. As such, real-time energy prices should, in principle, correctly pass on both energy and capacity payments (cf. Section 5.3).
Real-time energy or imbalance prices are usually based on up- and downward regulating power offers accepted by the TSO for real-time balancing. They are based on either the price of the marginally accepted up- or downward regulating offer or the average price of all accepted up- or downward regulating offers, depending on how BSPs are remunerated. A discussion on the pros and cons of remunerating BSPs by means of marginal pricing versus average or pay-as-bid pricing is included in Box H.
Apart from the choice between marginal and average pricing, a difference also exists between single and double imbalance pricing schemes. Tables VI and VII represent typical one- and two- price systems.
Under a single imbalance pricing scheme or ‘one-price system’, real-time energy or imbalance prices correspond to the marginal procurement price of balancing services, i.e. either upward or downward regulating services depending on the overall status of the system. The same imbalance price – perhaps with a different sign – is applied for remaining short and long positions, making the imbalance settlement theoretically26 a zero-sum game for the TSO.
26 Note that in practice – even under a one price system – a perfect zero-sum game is unattainable. This may be because of regulation being activated in the same direction as the system imbalance or because the need to settle exchange programme errors (e.g. in UCTE, these are compensated for ‘in natura’ on a weekly basis).
Recommendation: imbalance settlement based on other components, such as power exchange prices and penalties, is not market-based.
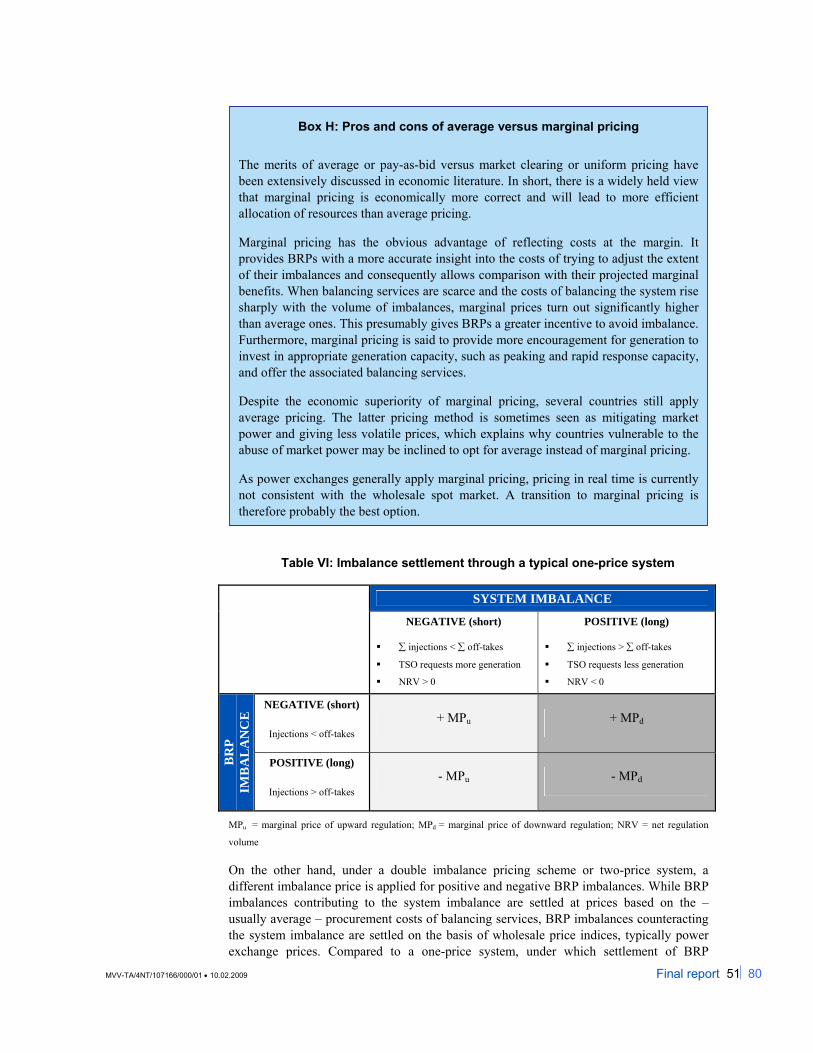
MVV-TA/4NT/107166/000/01 • 10.02.2009 Final report 51⏐80
Table VI: Imbalance settlement through a typical one-price system
SYSTEM IMBALANCE
NEGATIVE (short)
∑ injections < ∑ off-takes
TSO requests more generation
NRV > 0
POSITIVE (long)
∑ injections > ∑ off-takes
TSO requests less generation
NRV < 0
NEGATIVE (short)
Injections < off-takes + MPu + MPd
BR
P IM
BA
LA
NC
E
POSITIVE (long)
Injections > off-takes - MPu - MPd
MPu = marginal price of upward regulation; MPd = marginal price of downward regulation; NRV = net regulation
volume
On the other hand, under a double imbalance pricing scheme or two-price system, a different imbalance price is applied for positive and negative BRP imbalances. While BRP imbalances contributing to the system imbalance are settled at prices based on the – usually average – procurement costs of balancing services, BRP imbalances counteracting the system imbalance are settled on the basis of wholesale price indices, typically power exchange prices. Compared to a one-price system, under which settlement of BRP
Box H: Pros and cons of average versus marginal pricing
The merits of average or pay-as-bid versus market clearing or uniform pricing have been extensively discussed in economic literature. In short, there is a widely held view that marginal pricing is economically more correct and will lead to more efficient allocation of resources than average pricing.
Marginal pricing has the obvious advantage of reflecting costs at the margin. It provides BRPs with a more accurate insight into the costs of trying to adjust the extent of their imbalances and consequently allows comparison with their projected marginal benefits. When balancing services are scarce and the costs of balancing the system rise sharply with the volume of imbalances, marginal prices turn out significantly higher than average ones. This presumably gives BRPs a greater incentive to avoid imbalance. Furthermore, marginal pricing is said to provide more encouragement for generation to invest in appropriate generation capacity, such as peaking and rapid response capacity, and offer the associated balancing services.
Despite the economic superiority of marginal pricing, several countries still apply average pricing. The latter pricing method is sometimes seen as mitigating market power and giving less volatile prices, which explains why countries vulnerable to the abuse of market power may be inclined to opt for average instead of marginal pricing.
As power exchanges generally apply marginal pricing, pricing in real time is currently not consistent with the wholesale spot market. A transition to marginal pricing is therefore probably the best option.
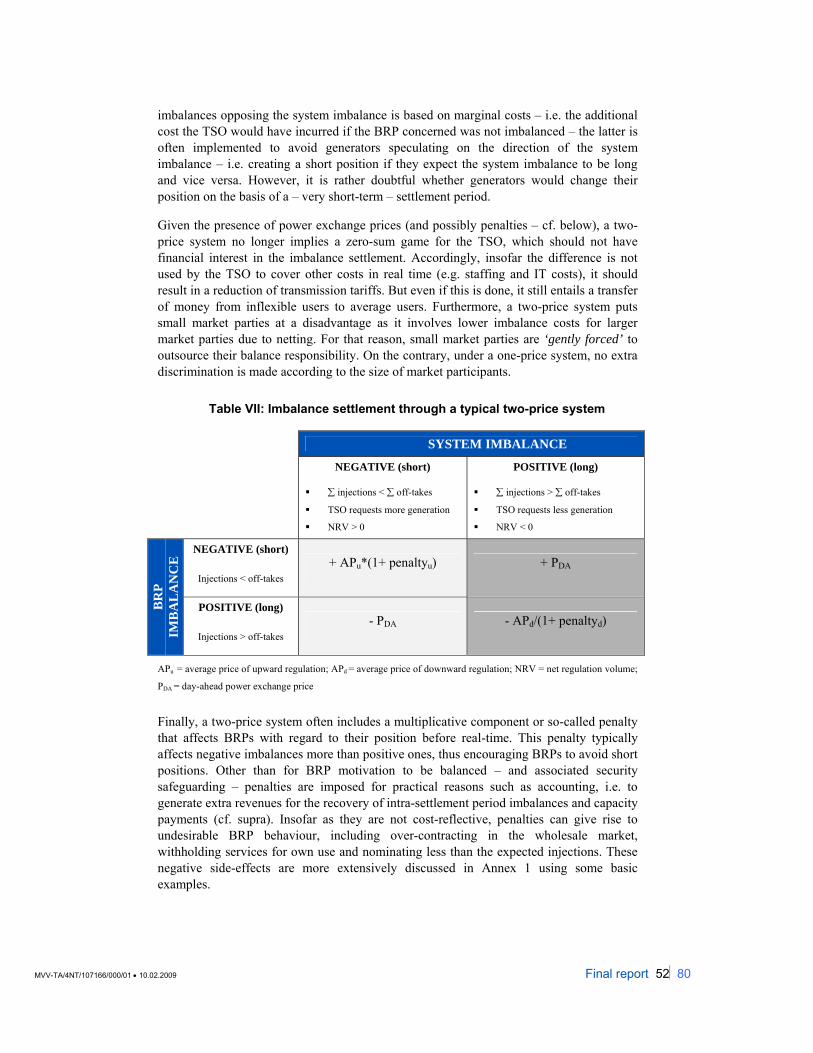
MVV-TA/4NT/107166/000/01 • 10.02.2009 Final report 52⏐80
imbalances opposing the system imbalance is based on marginal costs – i.e. the additional cost the TSO would have incurred if the BRP concerned was not imbalanced – the latter is often implemented to avoid generators speculating on the direction of the system imbalance – i.e. creating a short position if they expect the system imbalance to be long and vice versa. However, it is rather doubtful whether generators would change their position on the basis of a – very short-term – settlement period.
Given the presence of power exchange prices (and possibly penalties – cf. below), a two-price system no longer implies a zero-sum game for the TSO, which should not have financial interest in the imbalance settlement. Accordingly, insofar the difference is not used by the TSO to cover other costs in real time (e.g. staffing and IT costs), it should result in a reduction of transmission tariffs. But even if this is done, it still entails a transfer of money from inflexible users to average users. Furthermore, a two-price system puts small market parties at a disadvantage as it involves lower imbalance costs for larger market parties due to netting. For that reason, small market parties are ‘gently forced’ to outsource their balance responsibility. On the contrary, under a one-price system, no extra discrimination is made according to the size of market participants.
Table VII: Imbalance settlement through a typical two-price system
SYSTEM IMBALANCE
NEGATIVE (short)
∑ injections < ∑ off-takes
TSO requests more generation
NRV > 0
POSITIVE (long)
∑ injections > ∑ off-takes
TSO requests less generation
NRV < 0
NEGATIVE (short)
Injections < off-takes + APu*(1+ penaltyu) + PDA
BR
P IM
BA
LA
NC
E
POSITIVE (long)
Injections > off-takes - PDA - APd/(1+ penaltyd)
APu = average price of upward regulation; APd = average price of downward regulation; NRV = net regulation volume;
PDA = day-ahead power exchange price
Finally, a two-price system often includes a multiplicative component or so-called penalty that affects BRPs with regard to their position before real-time. This penalty typically affects negative imbalances more than positive ones, thus encouraging BRPs to avoid short positions. Other than for BRP motivation to be balanced – and associated security safeguarding – penalties are imposed for practical reasons such as accounting, i.e. to generate extra revenues for the recovery of intra-settlement period imbalances and capacity payments (cf. supra). Insofar as they are not cost-reflective, penalties can give rise to undesirable BRP behaviour, including over-contracting in the wholesale market, withholding services for own use and nominating less than the expected injections. These negative side-effects are more extensively discussed in Annex 1 using some basic examples.
MVV-TA/4NT/107166/000/01 • 10.02.2009 Final report 53⏐80
5.2.1. Separate imbalance settlement to counteract the side effects of two-price systems
The above section discussed potential negative side effects of a two-price system assuming a one-step imbalance volume calculation or, in other words, a single settlement for generation and load. However, some European countries settle generation and load separately. Depending on its implementation, a separate imbalance settlement can partly counteract the negative side effects of a two-price system.
For instance, the projected implementation of a harmonised imbalance settlement in the Nordic region in early 2009– which settles generation using a two-price system and load using a one-price system – may have the following side effects27:
• TSO gains under a two-price system – which should be redistributed by reducing transmission tariffs – result in a transfer from average to inflexible users rather than the other way around.
• Small market participants owning only load will not be discriminated against compared to larger ones as generation and load are settled separately.
• BRPs owning only load will not be inclined to over-contract in the wholesale market as settlement occurs on the basis of a one-price system.
• BRPs owning both generation and load will have no incentive to hold back services for own use as generation and load are settled separately.
• BRPs owning only generation will still have a tendency to nominate less than their expected injections as settlement occurs on the basis of a two-price system.
5.3. MEANING OF MARKET-BASED: ALLOCATION OF CAPACITY PAYMENTS
If one wishes to identify a market-based method for the allocation of capacity payments, one must first have a basic understanding of why they exist. This section therefore begins with a general justification of their use.
27 NB There is not yet any evidence of this.
Recommendations:
- Capacity payments for real-time energy delivery services are only transitional and should preferably be phased out.
- Even though there are grounds to socialise part of the cost of reserves co, the total procurement costs of reserves that deliver a significant amount of energy in real time should be fully reflected in the imbalance settlement.
- An additional component is necessary for settling capacity payments for the procurement of real-time energy delivery services.
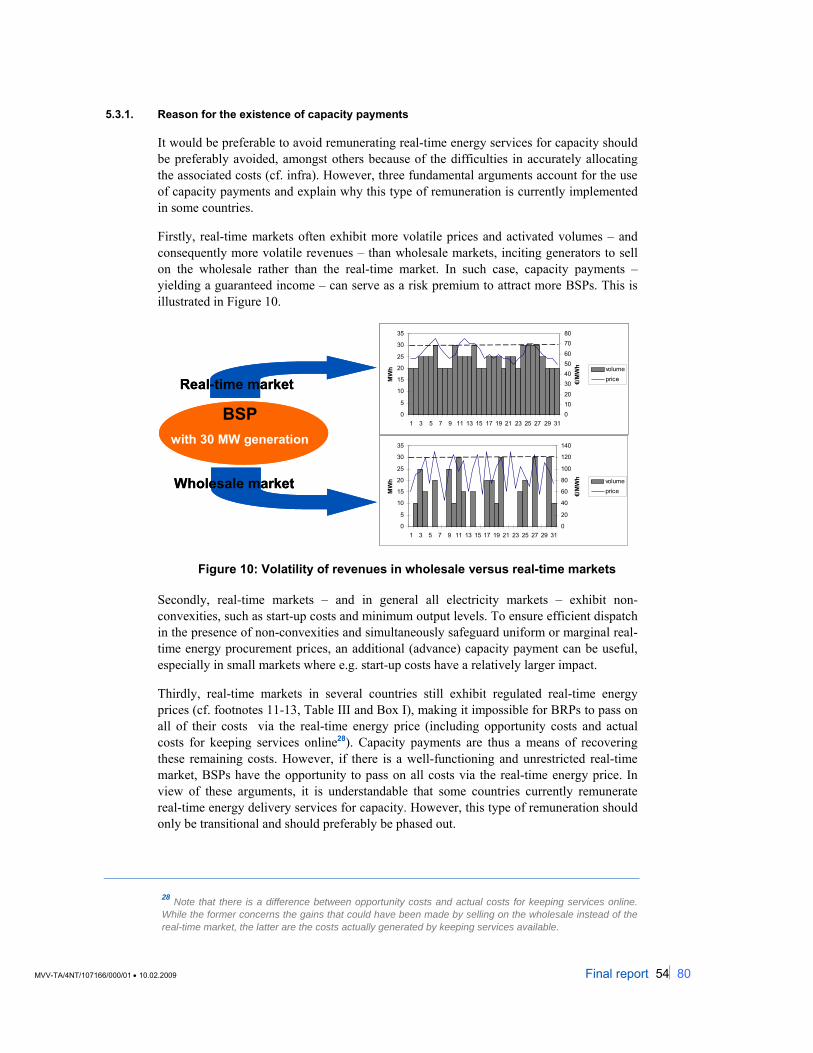
MVV-TA/4NT/107166/000/01 • 10.02.2009 Final report 54⏐80
5.3.1. Reason for the existence of capacity payments
It would be preferable to avoid remunerating real-time energy services for capacity should be preferably avoided, amongst others because of the difficulties in accurately allocating the associated costs (cf. infra). However, three fundamental arguments account for the use of capacity payments and explain why this type of remuneration is currently implemented in some countries.
Firstly, real-time markets often exhibit more volatile prices and activated volumes – and consequently more volatile revenues – than wholesale markets, inciting generators to sell on the wholesale rather than the real-time market. In such case, capacity payments – yielding a guaranteed income – can serve as a risk premium to attract more BSPs. This is illustrated in Figure 10.
BSPwith 30 MW generation
Real-time market
Wholesale market
0
5
10
15
20
25
30
35
1 3 5 7 9 11 13 15 17 19 21 23 25 27 29 31
MW
h
01020
30405060
7080
€/M
Wh volume
price
0
5
10
15
20
25
30
35
1 3 5 7 9 11 13 15 17 19 21 23 25 27 29 31
MW
h
0
20
40
60
80
100
120
140
€/M
Wh volume
price
BSPwith 30 MW generation
Real-time market
Wholesale market
0
5
10
15
20
25
30
35
1 3 5 7 9 11 13 15 17 19 21 23 25 27 29 31
MW
h
01020
30405060
7080
€/M
Wh volume
price
0
5
10
15
20
25
30
35
1 3 5 7 9 11 13 15 17 19 21 23 25 27 29 31
MW
h
0
20
40
60
80
100
120
140
€/M
Wh volume
price
Figure 10: Volatility of revenues in wholesale versus real-time markets
Secondly, real-time markets – and in general all electricity markets – exhibit non-convexities, such as start-up costs and minimum output levels. To ensure efficient dispatch in the presence of non-convexities and simultaneously safeguard uniform or marginal real-time energy procurement prices, an additional (advance) capacity payment can be useful, especially in small markets where e.g. start-up costs have a relatively larger impact.
Thirdly, real-time markets in several countries still exhibit regulated real-time energy prices (cf. footnotes 11-13, Table III and Box I), making it impossible for BRPs to pass on all of their costs via the real-time energy price (including opportunity costs and actual costs for keeping services online28). Capacity payments are thus a means of recovering these remaining costs. However, if there is a well-functioning and unrestricted real-time market, BSPs have the opportunity to pass on all costs via the real-time energy price. In view of these arguments, it is understandable that some countries currently remunerate real-time energy delivery services for capacity. However, this type of remuneration should only be transitional and should preferably be phased out.
28 Note that there is a difference between opportunity costs and actual costs for keeping services online. While the former concerns the gains that could have been made by selling on the wholesale instead of the real-time market, the latter are the costs actually generated by keeping services available.
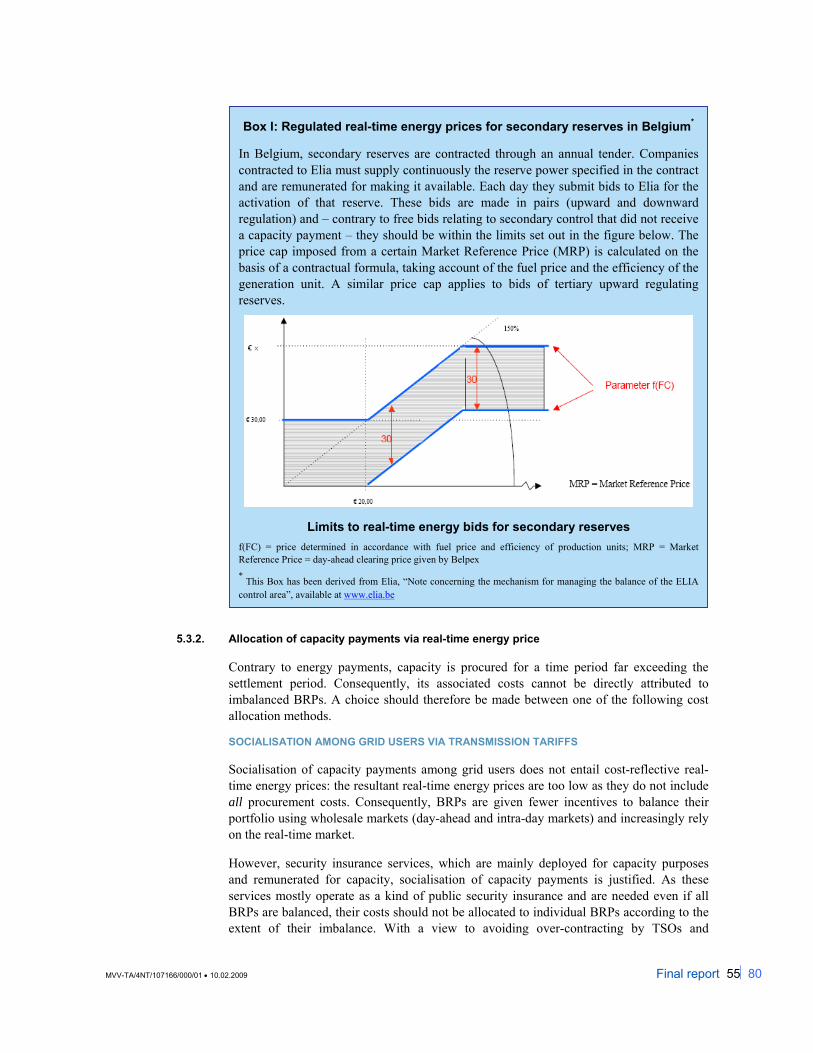
MVV-TA/4NT/107166/000/01 • 10.02.2009 Final report 55⏐80
5.3.2. Allocation of capacity payments via real-time energy price
Contrary to energy payments, capacity is procured for a time period far exceeding the settlement period. Consequently, its associated costs cannot be directly attributed to imbalanced BRPs. A choice should therefore be made between one of the following cost allocation methods.
SOCIALISATION AMONG GRID USERS VIA TRANSMISSION TARIFFS
Socialisation of capacity payments among grid users does not entail cost-reflective real-time energy prices: the resultant real-time energy prices are too low as they do not include all procurement costs. Consequently, BRPs are given fewer incentives to balance their portfolio using wholesale markets (day-ahead and intra-day markets) and increasingly rely on the real-time market.
However, security insurance services, which are mainly deployed for capacity purposes and remunerated for capacity, socialisation of capacity payments is justified. As these services mostly operate as a kind of public security insurance and are needed even if all BRPs are balanced, their costs should not be allocated to individual BRPs according to the extent of their imbalance. With a view to avoiding over-contracting by TSOs and
Box I: Regulated real-time energy prices for secondary reserves in Belgium*
In Belgium, secondary reserves are contracted through an annual tender. Companies contracted to Elia must supply continuously the reserve power specified in the contract and are remunerated for making it available. Each day they submit bids to Elia for the activation of that reserve. These bids are made in pairs (upward and downward regulation) and – contrary to free bids relating to secondary control that did not receive a capacity payment – they should be within the limits set out in the figure below. The price cap imposed from a certain Market Reference Price (MRP) is calculated on the basis of a contractual formula, taking account of the fuel price and the efficiency of the generation unit. A similar price cap applies to bids of tertiary upward regulating reserves.
Limits to real-time energy bids for secondary reserves
f(FC) = price determined in accordance with fuel price and efficiency of production units; MRP = Market Reference Price = day-ahead clearing price given by Belpex * This Box has been derived from Elia, “Note concerning the mechanism for managing the balance of the ELIA control area”, available at www.elia.be
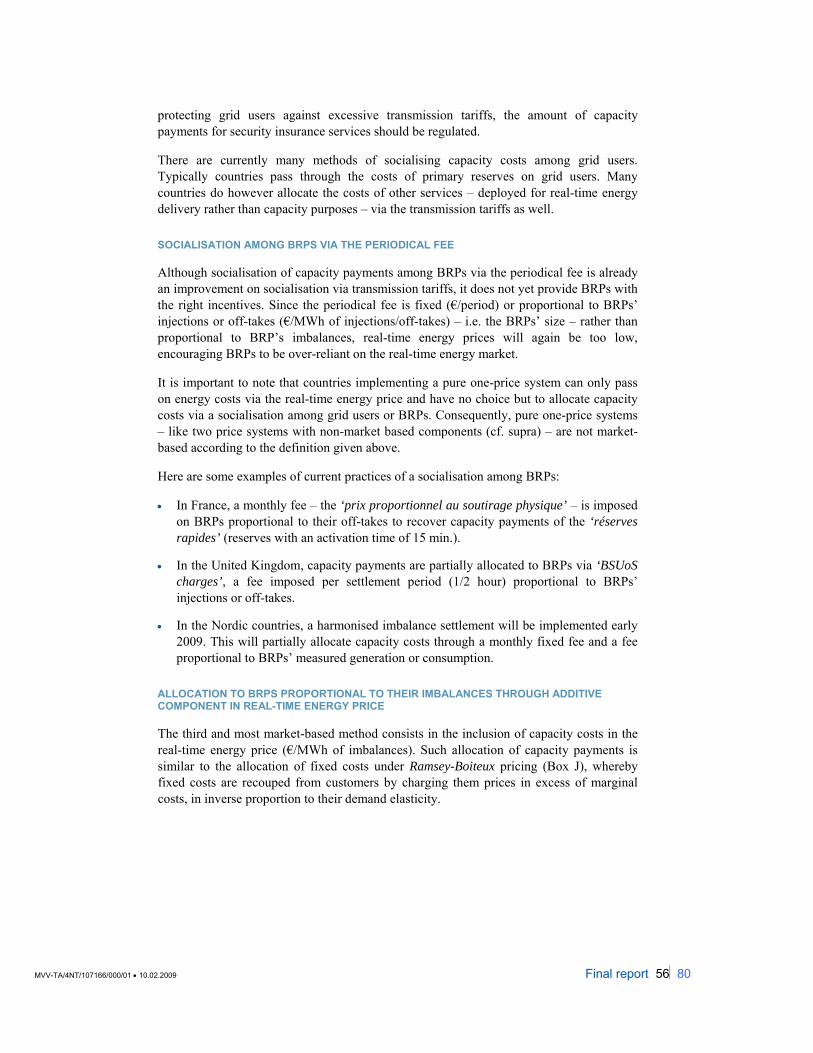
MVV-TA/4NT/107166/000/01 • 10.02.2009 Final report 56⏐80
protecting grid users against excessive transmission tariffs, the amount of capacity payments for security insurance services should be regulated.
There are currently many methods of socialising capacity costs among grid users. Typically countries pass through the costs of primary reserves on grid users. Many countries do however allocate the costs of other services – deployed for real-time energy delivery rather than capacity purposes – via the transmission tariffs as well.
SOCIALISATION AMONG BRPS VIA THE PERIODICAL FEE
Although socialisation of capacity payments among BRPs via the periodical fee is already an improvement on socialisation via transmission tariffs, it does not yet provide BRPs with the right incentives. Since the periodical fee is fixed (€/period) or proportional to BRPs’ injections or off-takes (€/MWh of injections/off-takes) – i.e. the BRPs’ size – rather than proportional to BRP’s imbalances, real-time energy prices will again be too low, encouraging BRPs to be over-reliant on the real-time energy market.
It is important to note that countries implementing a pure one-price system can only pass on energy costs via the real-time energy price and have no choice but to allocate capacity costs via a socialisation among grid users or BRPs. Consequently, pure one-price systems – like two price systems with non-market based components (cf. supra) – are not market-based according to the definition given above.
Here are some examples of current practices of a socialisation among BRPs:
• In France, a monthly fee – the ‘prix proportionnel au soutirage physique’ – is imposed on BRPs proportional to their off-takes to recover capacity payments of the ‘réserves rapides’ (reserves with an activation time of 15 min.).
• In the United Kingdom, capacity payments are partially allocated to BRPs via ‘BSUoS charges’, a fee imposed per settlement period (1/2 hour) proportional to BRPs’ injections or off-takes.
• In the Nordic countries, a harmonised imbalance settlement will be implemented early 2009. This will partially allocate capacity costs through a monthly fixed fee and a fee proportional to BRPs’ measured generation or consumption.
ALLOCATION TO BRPS PROPORTIONAL TO THEIR IMBALANCES THROUGH ADDITIVE COMPONENT IN REAL-TIME ENERGY PRICE
The third and most market-based method consists in the inclusion of capacity costs in the real-time energy price (€/MWh of imbalances). Such allocation of capacity payments is similar to the allocation of fixed costs under Ramsey-Boiteux pricing (Box J), whereby fixed costs are recouped from customers by charging them prices in excess of marginal costs, in inverse proportion to their demand elasticity.
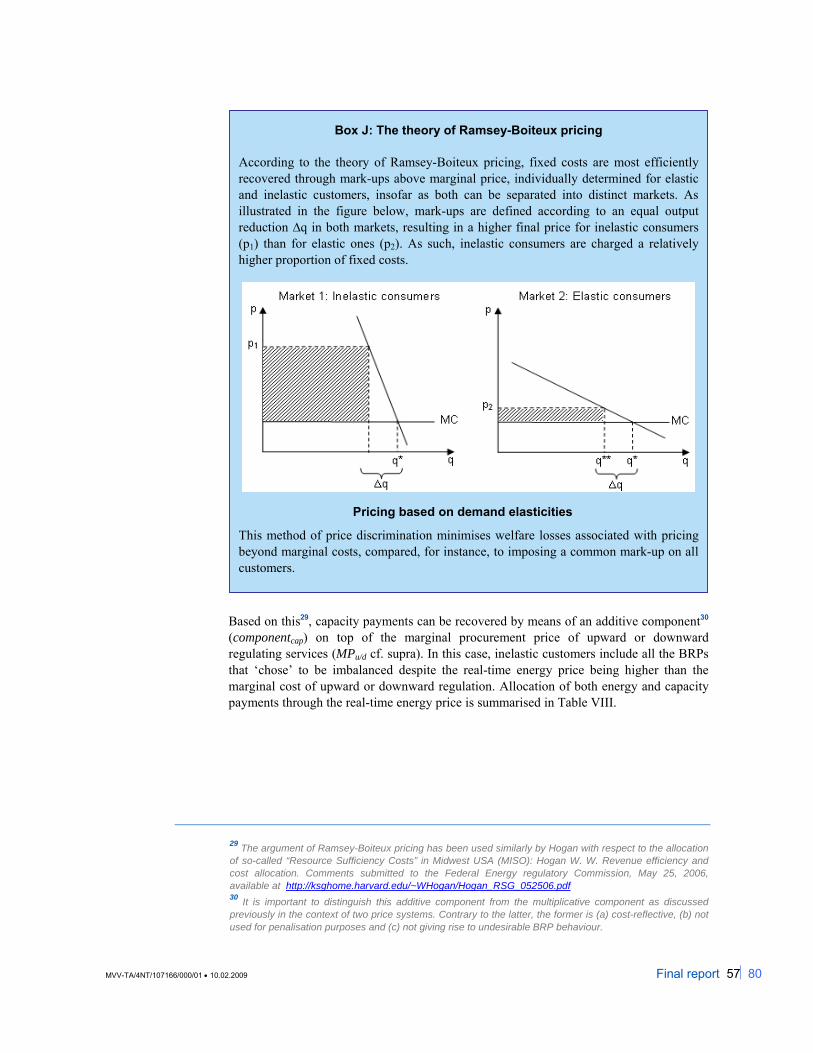
MVV-TA/4NT/107166/000/01 • 10.02.2009 Final report 57⏐80
Based on this29, capacity payments can be recovered by means of an additive component30 (componentcap) on top of the marginal procurement price of upward or downward regulating services (MPu/d cf. supra). In this case, inelastic customers include all the BRPs that ‘chose’ to be imbalanced despite the real-time energy price being higher than the marginal cost of upward or downward regulation. Allocation of both energy and capacity payments through the real-time energy price is summarised in Table VIII.
29 The argument of Ramsey-Boiteux pricing has been used similarly by Hogan with respect to the allocation of so-called “Resource Sufficiency Costs” in Midwest USA (MISO): Hogan W. W. Revenue efficiency and cost allocation. Comments submitted to the Federal Energy regulatory Commission, May 25, 2006, available at http://ksghome.harvard.edu/~WHogan/Hogan_RSG_052506.pdf 30 It is important to distinguish this additive component from the multiplicative component as discussed previously in the context of two price systems. Contrary to the latter, the former is (a) cost-reflective, (b) not used for penalisation purposes and (c) not giving rise to undesirable BRP behaviour.
Box J: The theory of Ramsey-Boiteux pricing
According to the theory of Ramsey-Boiteux pricing, fixed costs are most efficiently recovered through mark-ups above marginal price, individually determined for elastic and inelastic customers, insofar as both can be separated into distinct markets. As illustrated in the figure below, mark-ups are defined according to an equal output reduction ∆q in both markets, resulting in a higher final price for inelastic consumers (p1) than for elastic ones (p2). As such, inelastic consumers are charged a relatively higher proportion of fixed costs.
Pricing based on demand elasticities
This method of price discrimination minimises welfare losses associated with pricing beyond marginal costs, compared, for instance, to imposing a common mark-up on all customers.
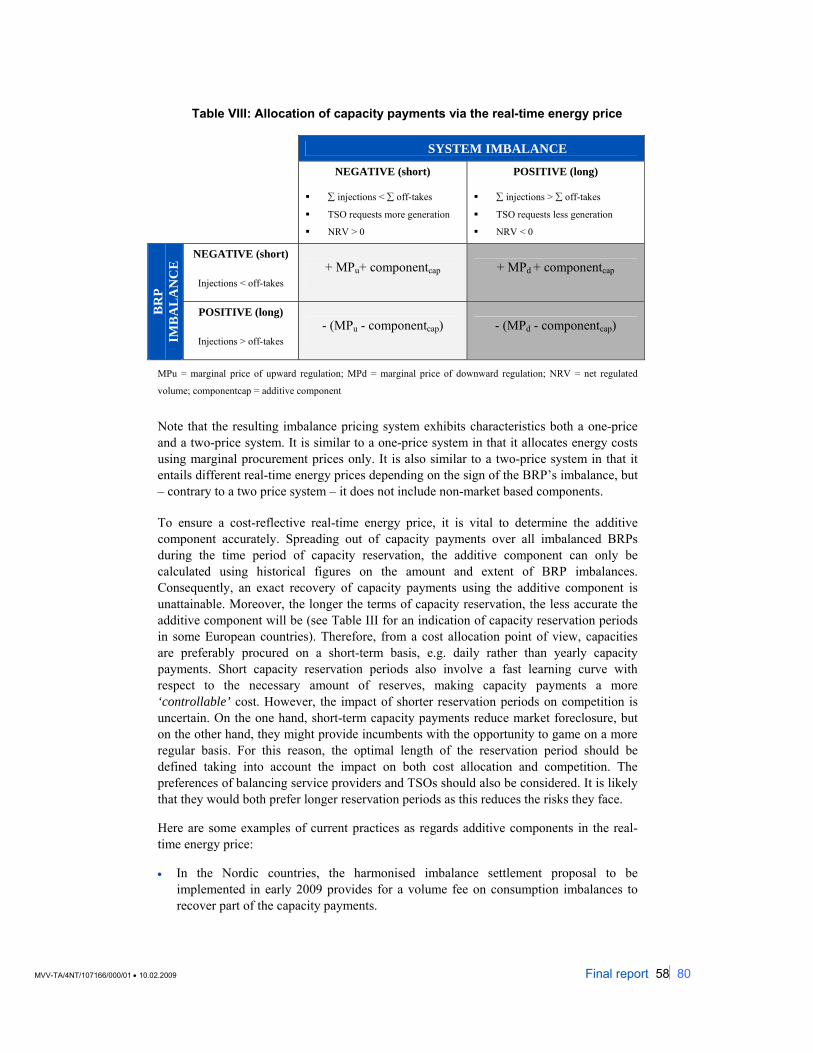
MVV-TA/4NT/107166/000/01 • 10.02.2009 Final report 58⏐80
Table VIII: Allocation of capacity payments via the real-time energy price
SYSTEM IMBALANCE
NEGATIVE (short)
∑ injections < ∑ off-takes
TSO requests more generation
NRV > 0
POSITIVE (long)
∑ injections > ∑ off-takes
TSO requests less generation
NRV < 0
NEGATIVE (short)
Injections < off-takes + MPu+ componentcap + MPd + componentcap
BR
P IM
BA
LA
NC
E
POSITIVE (long)
Injections > off-takes - (MPu - componentcap) - (MPd - componentcap)
MPu = marginal price of upward regulation; MPd = marginal price of downward regulation; NRV = net regulated
volume; componentcap = additive component
Note that the resulting imbalance pricing system exhibits characteristics both a one-price and a two-price system. It is similar to a one-price system in that it allocates energy costs using marginal procurement prices only. It is also similar to a two-price system in that it entails different real-time energy prices depending on the sign of the BRP’s imbalance, but – contrary to a two price system – it does not include non-market based components.
To ensure a cost-reflective real-time energy price, it is vital to determine the additive component accurately. Spreading out of capacity payments over all imbalanced BRPs during the time period of capacity reservation, the additive component can only be calculated using historical figures on the amount and extent of BRP imbalances. Consequently, an exact recovery of capacity payments using the additive component is unattainable. Moreover, the longer the terms of capacity reservation, the less accurate the additive component will be (see Table III for an indication of capacity reservation periods in some European countries). Therefore, from a cost allocation point of view, capacities are preferably procured on a short-term basis, e.g. daily rather than yearly capacity payments. Short capacity reservation periods also involve a fast learning curve with respect to the necessary amount of reserves, making capacity payments a more ‘controllable’ cost. However, the impact of shorter reservation periods on competition is uncertain. On the one hand, short-term capacity payments reduce market foreclosure, but on the other hand, they might provide incumbents with the opportunity to game on a more regular basis. For this reason, the optimal length of the reservation period should be defined taking into account the impact on both cost allocation and competition. The preferences of balancing service providers and TSOs should also be considered. It is likely that they would both prefer longer reservation periods as this reduces the risks they face.
Here are some examples of current practices as regards additive components in the real-time energy price:
• In the Nordic countries, the harmonised imbalance settlement proposal to be implemented in early 2009 provides for a volume fee on consumption imbalances to recover part of the capacity payments.
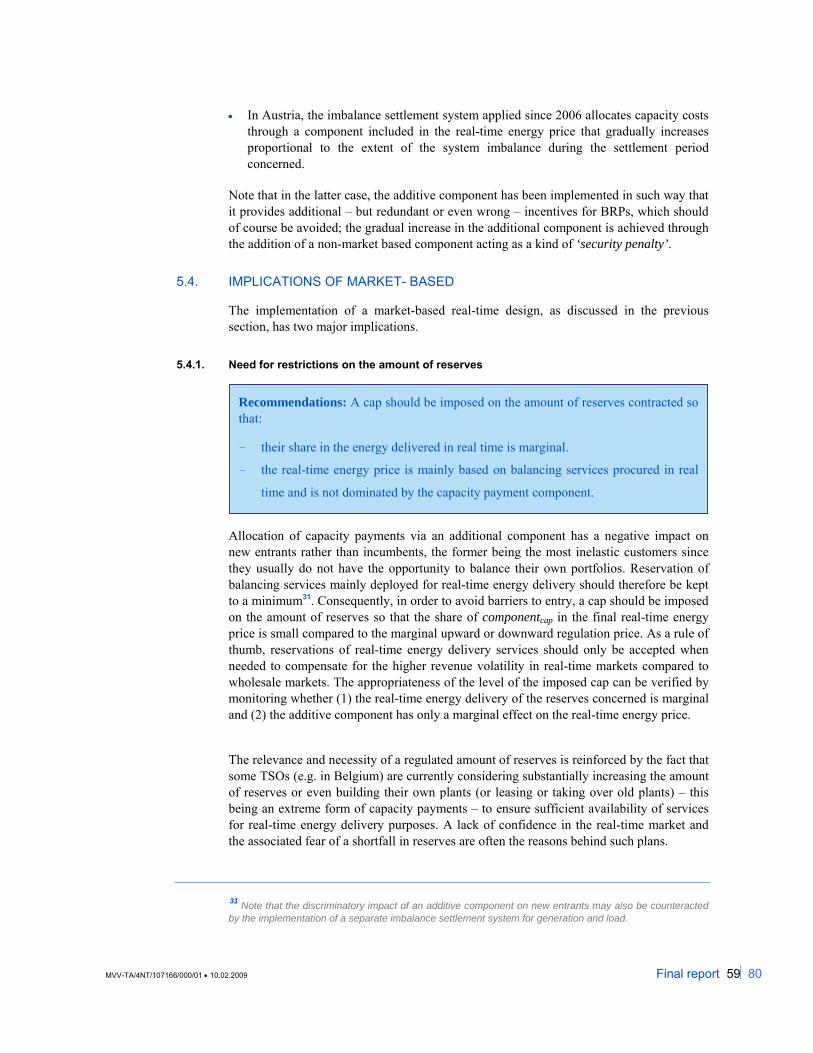
MVV-TA/4NT/107166/000/01 • 10.02.2009 Final report 59⏐80
• In Austria, the imbalance settlement system applied since 2006 allocates capacity costs through a component included in the real-time energy price that gradually increases proportional to the extent of the system imbalance during the settlement period concerned.
Note that in the latter case, the additive component has been implemented in such way that it provides additional – but redundant or even wrong – incentives for BRPs, which should of course be avoided; the gradual increase in the additional component is achieved through the addition of a non-market based component acting as a kind of ‘security penalty’.
5.4. IMPLICATIONS OF MARKET- BASED
The implementation of a market-based real-time design, as discussed in the previous section, has two major implications.
5.4.1. Need for restrictions on the amount of reserves
Allocation of capacity payments via an additional component has a negative impact on new entrants rather than incumbents, the former being the most inelastic customers since they usually do not have the opportunity to balance their own portfolios. Reservation of balancing services mainly deployed for real-time energy delivery should therefore be kept to a minimum31. Consequently, in order to avoid barriers to entry, a cap should be imposed on the amount of reserves so that the share of componentcap in the final real-time energy price is small compared to the marginal upward or downward regulation price. As a rule of thumb, reservations of real-time energy delivery services should only be accepted when needed to compensate for the higher revenue volatility in real-time markets compared to wholesale markets. The appropriateness of the level of the imposed cap can be verified by monitoring whether (1) the real-time energy delivery of the reserves concerned is marginal and (2) the additive component has only a marginal effect on the real-time energy price.
The relevance and necessity of a regulated amount of reserves is reinforced by the fact that some TSOs (e.g. in Belgium) are currently considering substantially increasing the amount of reserves or even building their own plants (or leasing or taking over old plants) – this being an extreme form of capacity payments – to ensure sufficient availability of services for real-time energy delivery purposes. A lack of confidence in the real-time market and the associated fear of a shortfall in reserves are often the reasons behind such plans.
31 Note that the discriminatory impact of an additive component on new entrants may also be counteracted by the implementation of a separate imbalance settlement system for generation and load.
Recommendations: A cap should be imposed on the amount of reserves contracted so that:
- their share in the energy delivered in real time is marginal.
- the real-time energy price is mainly based on balancing services procured in real
time and is not dominated by the capacity payment component.
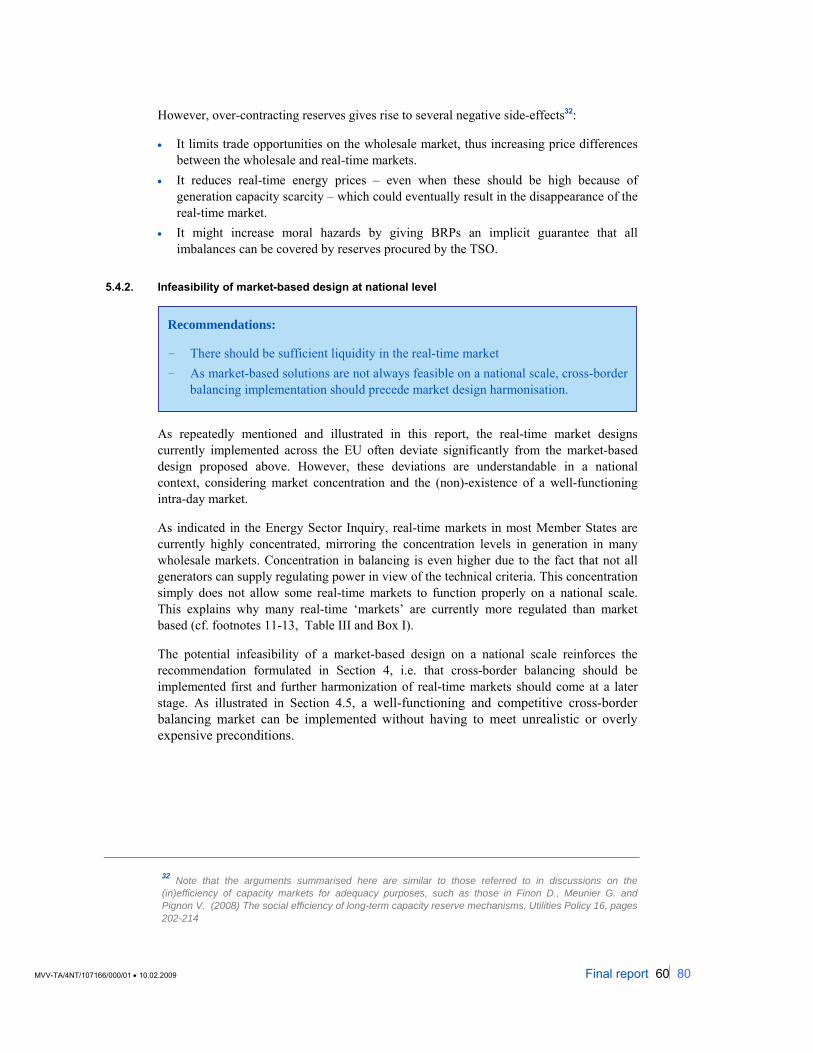
MVV-TA/4NT/107166/000/01 • 10.02.2009 Final report 60⏐80
However, over-contracting reserves gives rise to several negative side-effects32:
• It limits trade opportunities on the wholesale market, thus increasing price differences between the wholesale and real-time markets.
• It reduces real-time energy prices – even when these should be high because of generation capacity scarcity – which could eventually result in the disappearance of the real-time market.
• It might increase moral hazards by giving BRPs an implicit guarantee that all imbalances can be covered by reserves procured by the TSO.
5.4.2. Infeasibility of market-based design at national level
As repeatedly mentioned and illustrated in this report, the real-time market designs currently implemented across the EU often deviate significantly from the market-based design proposed above. However, these deviations are understandable in a national context, considering market concentration and the (non)-existence of a well-functioning intra-day market.
As indicated in the Energy Sector Inquiry, real-time markets in most Member States are currently highly concentrated, mirroring the concentration levels in generation in many wholesale markets. Concentration in balancing is even higher due to the fact that not all generators can supply regulating power in view of the technical criteria. This concentration simply does not allow some real-time markets to function properly on a national scale. This explains why many real-time ‘markets’ are currently more regulated than market based (cf. footnotes 11-13, Table III and Box I).
The potential infeasibility of a market-based design on a national scale reinforces the recommendation formulated in Section 4, i.e. that cross-border balancing should be implemented first and further harmonization of real-time markets should come at a later stage. As illustrated in Section 4.5, a well-functioning and competitive cross-border balancing market can be implemented without having to meet unrealistic or overly expensive preconditions.
32 Note that the arguments summarised here are similar to those referred to in discussions on the (in)efficiency of capacity markets for adequacy purposes, such as those in Finon D., Meunier G. and Pignon V. (2008) The social efficiency of long-term capacity reserve mechanisms, Utilities Policy 16, pages 202-214
Recommendations:
- There should be sufficient liquidity in the real-time market - As market-based solutions are not always feasible on a national scale, cross-border
balancing implementation should precede market design harmonisation.
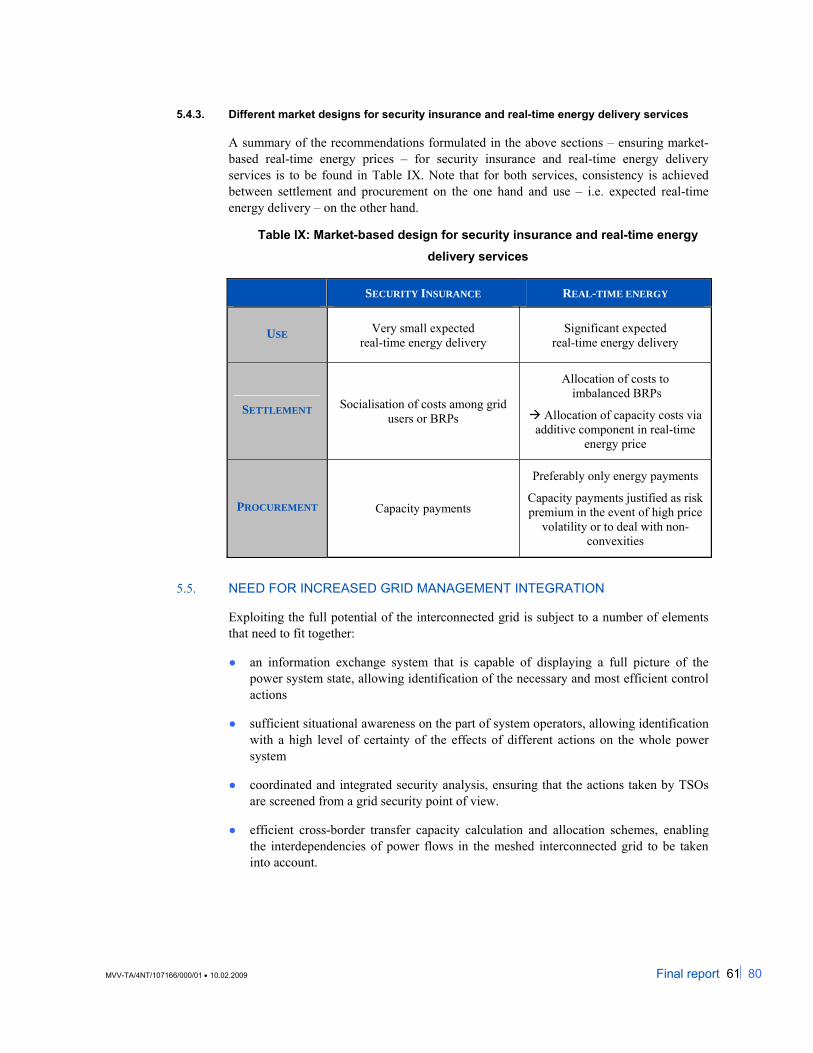
MVV-TA/4NT/107166/000/01 • 10.02.2009 Final report 61⏐80
5.4.3. Different market designs for security insurance and real-time energy delivery services
A summary of the recommendations formulated in the above sections – ensuring market-based real-time energy prices – for security insurance and real-time energy delivery services is to be found in Table IX. Note that for both services, consistency is achieved between settlement and procurement on the one hand and use – i.e. expected real-time energy delivery – on the other hand.
Table IX: Market-based design for security insurance and real-time energy delivery services
SECURITY INSURANCE REAL-TIME ENERGY
USE Very small expected real-time energy delivery
Significant expected real-time energy delivery
SETTLEMENT Socialisation of costs among grid users or BRPs
Allocation of costs to imbalanced BRPs
Allocation of capacity costs via additive component in real-time
energy price
PROCUREMENT Capacity payments
Preferably only energy payments
Capacity payments justified as risk premium in the event of high price
volatility or to deal with non-convexities
5.5. NEED FOR INCREASED GRID MANAGEMENT INTEGRATION
Exploiting the full potential of the interconnected grid is subject to a number of elements that need to fit together:
● an information exchange system that is capable of displaying a full picture of the power system state, allowing identification of the necessary and most efficient control actions
● sufficient situational awareness on the part of system operators, allowing identification with a high level of certainty of the effects of different actions on the whole power system
● coordinated and integrated security analysis, ensuring that the actions taken by TSOs are screened from a grid security point of view.
● efficient cross-border transfer capacity calculation and allocation schemes, enabling the interdependencies of power flows in the meshed interconnected grid to be taken into account.
MVV-TA/4NT/107166/000/01 • 10.02.2009 Final report 62⏐80
All of the points mentioned above can contribute to more effective use of the interconnected grid for cross-border exchanges close to real time. Potential improvements include reduction of uncertainties in transmission planning, increased system security and more efficient use of the transmission grid. The analysis below does not imply that some aspects of these areas are not currently being addressed by the European TSOs. Rather, it aims to illustrate an ideal situation that should be seen as the end goal.
5.5.1. Adequate information exchange
The key factor for efficient grid management is information. One needs information to be able to make good decisions. In the context of the electricity transmission grid, this implies that state estimates must at least be carried out at regional level, though preferably at pan-European level. The goal should be a full picture of the power system state, consistent in all control areas and taken at regular intervals.
Real-time data should be gathered and exchanged between the TSOs concerned. With respect to cross-border intra-day markets, this could create additional trading opportunities. With respect to cross-border balancing markets, this could enable a better identification of situations where balancing actions are needed. During times of local control area imbalances accompanied by global generation-load equilibrium, regulation actions could be sometimes avoided.
This can only be realised subject to grid security conditions. However, having a global picture of the system gives an insight into grid security that is not bound to national frontiers. Moreover, with more information exchanged in real time, it becomes possible to assess the system conditions dynamically and, as such, anticipate dangerous system state evolutions.
5.5.2. Sufficient situational awareness
Situational awareness on the part of TSOs is a key aspect in managing the power system. In the context of constantly increasing cross-border exchanges and intermittency of generation dispatch, TSOs must be very aware of the system conditions and the causes driving their evolution. This implies that if there is a change in power flows on a given border, the TSOs concerned must immediately be able to identify the source of this change, possible threats for their grid and prepare counter-measures.
Increased exchange of information is a first step towards this goal as it would allow local TSOs to see the bigger picture. However, what is even more important is to understand the drivers behind the system state evolution. Especially for small control zones, seeing the problem is not equivalent to solving it. Such control zones simply do not have the means or ability to alter their situation (i.e. overloads caused by exchanges between other control zones). Additionally, in the same way that local TSOs know much more about their own grid than any other entity, a body dedicated to the operation and coordination of the ultra-high voltage transmission system (i.e. 380 kV) would be in the best position to guard power system security at supra-national level. Such a supra-national body could be in charge of coordinating the different national control centres and informing them about relevant events and possible remedial actions. This would allow it to predict the evolution of the power state, identify the threats and weak points and consequently apply the most efficient remedial actions. Moreover, coordinating the operation of power flow control devices organised at this upper level would most likely be much more efficient than leaving it in the hands of the local TSOs concerned.
MVV-TA/4NT/107166/000/01 • 10.02.2009 Final report 63⏐80
It is indisputable that information exchange and coordination between TSOs is extremely important. With the implementation of cross-border balancing markets, which operate very close to real time, the feasibility of new cross-border exchanges committed in real time is key. Starting with increased regional coordination and cooperation, one could gradually converge towards a higher degree of coordination, possibly spanning the whole synchronous interconnection.
5.5.3. Coordinated and integrated security analysis
TSOs are currently enlarging the scope of their security analysis to monitor events in foreign systems. The interdependency of power flows is indeed one of today’s major challenges. Another step in the same direction is a security analysis run at a coordinative level by a virtual regional TSO. The opportunities created by such a coordination body are quite impressive. Firstly, in addition to having a more global view of the interdependencies between different contingencies and their impact on the grid, the coordination body would be in the best position to monitor the implementation of system protection schemes. Such schemes would allow stepping away from full N-1 by coupling some contingencies to semi-automated corrective actions. This in turn could result in more available transfer capacity on the existing grid, implying more effective market integration (intra-day, balancing, etc).
5.5.4. Efficient transfer capacity calculation and allocation
Calculation of transfer capacities can be organised in a different manner than it is the case today. Especially the developments towards a flow based allocation present a high potential. From a grid security management point of view, it is extremely important that the physical aspects of energy trade are also considered. Any development aiming to reduce the gap between commercial and physical realities is therefore an improvement.
Ideally, the grid dispatch should reflect a unit commitment based on a security-constrained optimal power flow. Decoupling transmission and generation should, in principle, not change this paradigm, as the dispatch should still reflect the same characteristics (i.e. commitment of the most efficient units). However, in the context of liberalised electricity markets, appreciating the costs of different generators is a complex issue making generation prices and consequently generation dispatch not always that stable and transparent. Nonetheless, transmission constraints should be accounted for in market outcomes in quite a similar way to optimal power flow calculations, where one overloaded line is enough to cause nodal price differences. In Europe, with zonal markets assuming the absence of intra-zonal constraints, it would be possible to implement a similar approach based on flow-based allocation of cross-border transfer capacities. Although there are many issues related to estimating the impact of transactions on different borders (expressed by Power Transfer Distribution Factors), estimating new transfer capacities, etc33, the concept of flow-based cross-border capacity allocation is very interesting and regional initiatives have already been taken by the European TSOs34.
33 Some of these issues are discussed in Section 3.2. 34 Flow-based Market Coupling (FMC), A Joint ETSO-EuroPEX Proposal for Cross-Border Congestion Management and Integration of Electricity Markets in Europe, September 2004

MVV-TA/4NT/107166/000/01 • 10.02.2009 Final report 64⏐80
MVV-TA/4NT/107166/000/01 • 10.02.2009 Final report 65⏐80
6. CONCLUDING OVERVIEW
Implementing cross-border balancing without harmonising national real-time market designs and centralising grid security management is often said to entail several distorting effects and inefficiencies. However, these distortions already exist to a certain extent today – due to increasingly integrated day-ahead and intra-day trade – and will only worsen in the event of cross-border balancing implementation without further harmonisation and centralisation. It is therefore recommended to proceed with cross-border balancing implementation taking into account only minimum prerequisites – ensuring fast but functioning implementation. At a later stage, barriers hindering transition towards more advanced implementation as well as distorting effects and inefficiencies should be eliminated through further harmonisation and centralisation.
This approach to the implementation of cross-border balancing has been converted into a practical roadmap. The roadmap consists of three consecutive phases35 that should enable a smooth transition from initial to full implementation:
PHASE 1: Implementation with minimum prerequisites
The objective of this first phase is to enable cross-border balancing trade quickly. Given that national differences in the remuneration method for balancing services may act as a barrier to exchanging all services via common merit order, limiting cross-border balancing procurement to excess services only is acceptable in this phase.
Minimum prerequisites with respect to market design harmonisation include:
• harmonisation of technical characteristics of balancing services (e.g. activation time).
• harmonisation of gate closure times.
With respect to interconnection capacity reservations, the minimum prerequisites are as follows:
• Cross-border capacity must be reserved for security insurance services (i.e. primary control).
• Cross-border capacity does not need to be reserved for real-time energy delivering services (i.e. secondary of tertiary control) but such choice renders their usefulness subject to grid availability.
• Availability of the reserve, as seen from a given control area, must be checked in advance, meaning that the scope of monitored events in security analysis must be enlarged.
35 Note that a fourth step, namely transition towards one regional area, may be added to these three steps.
MVV-TA/4NT/107166/000/01 • 10.02.2009 Final report 66⏐80
• If no cross-border capacity is reserved for real-time energy delivering services, the control zone making such a choice must guarantee sufficient local means (redundant resources) or establish adequate system protection schemes such as interruptible load.
• If the activation process of the real-time energy delivering services is automatic, the organisation of AGC needs to be adopted by making use of resources outside the control zone, conditional on available transfer capacity availability.
PHASE 2: Harmonisation of remuneration for services
With a view to extending cross-border procurement of balancing services from excess services only to all services – via the use of a common merit order – this phase includes harmonising the way in which services are remunerated (i.e. capacity and/or energy payment).
Recommendations on the harmonisation of service remuneration are linked with and can be derived from the recommendations listed under step 3 on the harmonisation of imbalance settlements.
PHASE 3: Harmonisation of imbalance settlement
The objective of this final phase is to optimise initial cross-border balancing implementation and eliminate the distorting effects of insufficiently harmonised imbalance settlements on day-ahead and intra-day trade.
Recommendations to be taken into account in this phase are as follows:
• Real-time energy prices should be market-based.
• Market-based means that:
Imbalances in real time are settled at a price that fully reflects the costs of delivering energy in real time.
Even though there are grounds to socialise part of the cost of reserves, the total procurement costs of reserves that deliver a significant amount of energy in real time should be fully reflected in the imbalance settlement.
An imbalance settlement based on other components such as power exchange prices and penalties is not market-based, but an additive component is necessary for settling capacity payments for reserves procurement.
Capacity payments for real-time energy delivery services are only transitional and should preferably be phased out.
• Market-based implies that:
− a cap should be imposed on the amount of reserves contracted so that:
• their share in the energy delivered in real-time is marginal;
• the real-time energy price is mainly based on balancing services procured in real-time and is not dominated by the capacity payment component.
− there should be sufficient liquidity in the real-time market.
− as market-based solutions are not always feasible on a national scale, cross-border balancing implementation should precede market design harmonisation.
MVV-TA/4NT/107166/000/01 • 10.02.2009 Final report 67⏐80
Finally, apart from harmonising the imbalance settlement, an optimally functioning cross-border balancing implementation also requires a certain level of grid security management integration. Recommendations with respect to this point include:
• an information exchange system that is capable of displaying a full picture of the power system state, allowing identification of the necessary and most efficient control actions;
• sufficient situational awareness on the part of the system operators, allowing identification with a high level of certainty of the effects of different actions on the whole power system;
• coordinated and integrated security analysis, ensuring that the actions taken by TSOs are screened from a grid security point of view.
• efficient cross-border transfer capacity calculation and allocation schemes, enabling the interdependencies of power flows in the meshed interconnected grid to be taken into account.

MVV-TA/4NT/107166/000/01 • 10.02.2009 Final report 68⏐80
MVV-TA/4NT/107166/000/01 • 10.02.2009 Final report 69⏐80
ANNEX 1: NEGATIVE SIDE EFFECTS OF TWO-PRICE SYSTEMS WITH PENALTIES
This annex discusses the potential negative side effects of penalties – applied for e.g. over-contracting in the wholesale market, withholding services for own use and nominating less than the expected injections – by means of some simple examples. Note that these examples have been kept simple for purposes of clarification and do not aim to be exhaustive.
More specifically, the following assumptions are made:
• Both the one- and two-price systems are based on marginal procurement prices (MP).
• Marginal procurement prices are expressed as a percentage of the day-ahead price: e.g. MPu = 1.5*PDA and MPd = 0.5*PDA. While marginal prices for upward regulation are higher than day-ahead prices, marginal prices for downward regulation are lower. Note that in practice, the supply curve for balancing services is typically not linear: as downward regulation is relatively easier, these services are typically cheaper – i.e. their marginal price deviates less from the day-ahead price compared to upward-regulating services. Because of this, BRPs already exhibit a natural tendency to strive for long rather than balanced positions36.
• For the moment, marginal procurement prices for upward regulation are usually higher than day-ahead prices. However, the better markets continue to function – and the more arbitrage opportunities are exploited –the more day-ahead and real-time prices will converge. Note, however, that even if both prices are equal, BRPs would still make a difference between buying energy on the wholesale market or the real-time market. They would rather buy wholesale to hedge against typically higher and more volatile real-time energy prices. This is the case as not all generation resources can be controlled fast enough to deliver energy in the real-time.
• For simplification, the day-ahead price equals 1 (PDA = 1).
• Penalties under the two-price system are higher for short positions than for long ones: Penaltyu = 0.4 and Penaltyd = 0.25.
• BRPs are unaware of the system imbalance: 50% of time positive/negative
In Table X and Table XI, the above assumptions are applied to the one- and two-price system respectively.
36 In other words, assuming for instance that MPu = 1.3*PDA and MPd = 0.8* PDA, over-contracting in the wholesale market and under-nominating of injections would also occur in a one-price system in the examples below – though to a lesser extent than in a two-price system – and this effect would be completely due to the relatively higher prices for upward regulation. This ‘natural tendency’ should not be reinforced through the introduction of additional penalties.
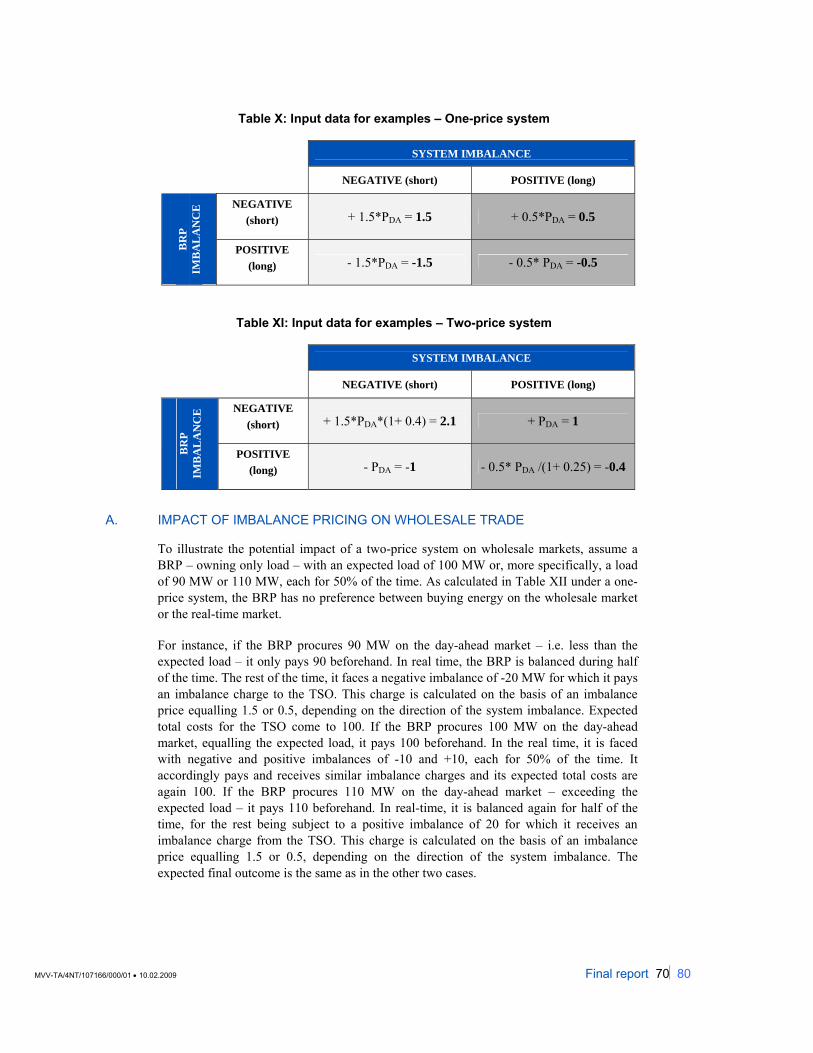
MVV-TA/4NT/107166/000/01 • 10.02.2009 Final report 70⏐80
Table X: Input data for examples – One-price system
SYSTEM IMBALANCE
NEGATIVE (short) POSITIVE (long)
NEGATIVE (short) + 1.5*PDA = 1.5 + 0.5*PDA = 0.5
BR
P
IMB
AL
AN
CE
POSITIVE (long) - 1.5*PDA = -1.5 - 0.5* PDA = -0.5
Table XI: Input data for examples – Two-price system
SYSTEM IMBALANCE
NEGATIVE (short) POSITIVE (long)
NEGATIVE (short) + 1.5*PDA*(1+ 0.4) = 2.1 + PDA = 1
BR
P IM
BA
LA
NC
E
POSITIVE (long) - PDA = -1 - 0.5* PDA /(1+ 0.25) = -0.4
A. IMPACT OF IMBALANCE PRICING ON WHOLESALE TRADE
To illustrate the potential impact of a two-price system on wholesale markets, assume a BRP – owning only load – with an expected load of 100 MW or, more specifically, a load of 90 MW or 110 MW, each for 50% of the time. As calculated in Table XII under a one-price system, the BRP has no preference between buying energy on the wholesale market or the real-time market.
For instance, if the BRP procures 90 MW on the day-ahead market – i.e. less than the expected load – it only pays 90 beforehand. In real time, the BRP is balanced during half of the time. The rest of the time, it faces a negative imbalance of -20 MW for which it pays an imbalance charge to the TSO. This charge is calculated on the basis of an imbalance price equalling 1.5 or 0.5, depending on the direction of the system imbalance. Expected total costs for the TSO come to 100. If the BRP procures 100 MW on the day-ahead market, equalling the expected load, it pays 100 beforehand. In the real time, it is faced with negative and positive imbalances of -10 and +10, each for 50% of the time. It accordingly pays and receives similar imbalance charges and its expected total costs are again 100. If the BRP procures 110 MW on the day-ahead market – exceeding the expected load – it pays 110 beforehand. In real-time, it is balanced again for half of the time, for the rest being subject to a positive imbalance of 20 for which it receives an imbalance charge from the TSO. This charge is calculated on the basis of an imbalance price equalling 1.5 or 0.5, depending on the direction of the system imbalance. The expected final outcome is the same as in the other two cases.
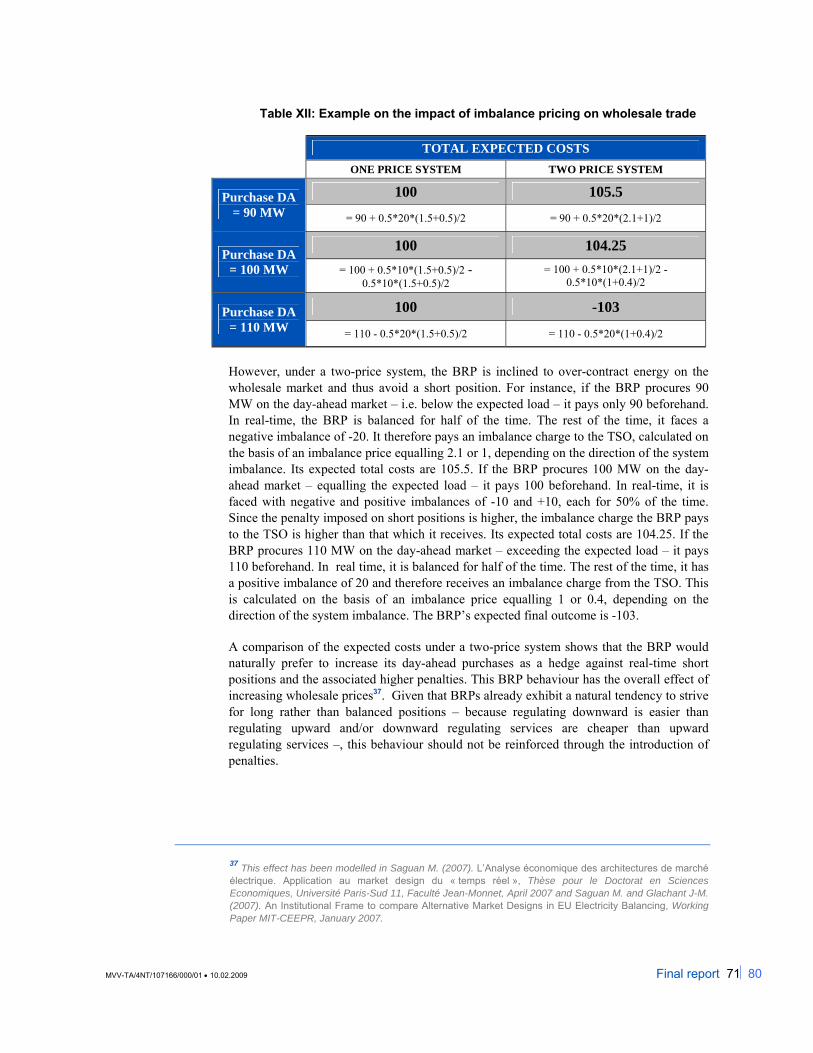
MVV-TA/4NT/107166/000/01 • 10.02.2009 Final report 71⏐80
Table XII: Example on the impact of imbalance pricing on wholesale trade
TOTAL EXPECTED COSTS ONE PRICE SYSTEM TWO PRICE SYSTEM
100 105.5 Purchase DA = 90 MW = 90 + 0.5*20*(1.5+0.5)/2 = 90 + 0.5*20*(2.1+1)/2
100 104.25 Purchase DA = 100 MW = 100 + 0.5*10*(1.5+0.5)/2 -
0.5*10*(1.5+0.5)/2 = 100 + 0.5*10*(2.1+1)/2 -
0.5*10*(1+0.4)/2
100 -103 Purchase DA = 110 MW = 110 - 0.5*20*(1.5+0.5)/2 = 110 - 0.5*20*(1+0.4)/2
However, under a two-price system, the BRP is inclined to over-contract energy on the wholesale market and thus avoid a short position. For instance, if the BRP procures 90 MW on the day-ahead market – i.e. below the expected load – it pays only 90 beforehand. In real-time, the BRP is balanced for half of the time. The rest of the time, it faces a negative imbalance of -20. It therefore pays an imbalance charge to the TSO, calculated on the basis of an imbalance price equalling 2.1 or 1, depending on the direction of the system imbalance. Its expected total costs are 105.5. If the BRP procures 100 MW on the day-ahead market – equalling the expected load – it pays 100 beforehand. In real-time, it is faced with negative and positive imbalances of -10 and +10, each for 50% of the time. Since the penalty imposed on short positions is higher, the imbalance charge the BRP pays to the TSO is higher than that which it receives. Its expected total costs are 104.25. If the BRP procures 110 MW on the day-ahead market – exceeding the expected load – it pays 110 beforehand. In real time, it is balanced for half of the time. The rest of the time, it has a positive imbalance of 20 and therefore receives an imbalance charge from the TSO. This is calculated on the basis of an imbalance price equalling 1 or 0.4, depending on the direction of the system imbalance. The BRP’s expected final outcome is -103.
A comparison of the expected costs under a two-price system shows that the BRP would naturally prefer to increase its day-ahead purchases as a hedge against real-time short positions and the associated higher penalties. This BRP behaviour has the overall effect of increasing wholesale prices37. Given that BRPs already exhibit a natural tendency to strive for long rather than balanced positions – because regulating downward is easier than regulating upward and/or downward regulating services are cheaper than upward regulating services –, this behaviour should not be reinforced through the introduction of penalties.
37 This effect has been modelled in Saguan M. (2007). L’Analyse économique des architectures de marché électrique. Application au market design du « temps réel », Thèse pour le Doctorat en Sciences Economiques, Université Paris-Sud 11, Faculté Jean-Monnet, April 2007 and Saguan M. and Glachant J-M. (2007). An Institutional Frame to compare Alternative Market Designs in EU Electricity Balancing, Working Paper MIT-CEEPR, January 2007.

MVV-TA/4NT/107166/000/01 • 10.02.2009 Final report 72⏐80
B. IMPACT OF IMBALANCE SETTLEMENT ON THE PROVISION OF BALANCING SERVICES
To illustrate the potential impact of a two-price system on balancing services supply, assume a BRP – owning both generation and load – with generation of 110 MW and an expected load of 100 MW or, more specifically, a load of 90 MW or 110 MW, each for 50% of the time. As calculated in Table XIIII, under a one-price system, the BRP sees no difference between providing balancing services to the TSO via the real-time market or keeping services for own use. Note that in this example, the activation cost of balancing services is taken into account. This activation cost is assumed to be equal to the marginal procurement price of upward regulating services, being 1.5.
For instance, if the BRP offers 10 MW to the TSO, its services have a 50% chance of being activated in real time – given a negative system imbalance for half of the time. It therefore receives remuneration based on the marginal price for upward regulation, i.e. 1.5, which exactly compensates it for the activation cost. Furthermore, the BRP is exposed to negative and positive imbalances of -10 and +10, each for 50% of the time. The BRP pays and receives similar imbalance charges accordingly. Its expected final income is 0. However, if the BRP keeps its 10 MW for its own use, it can avoid short positions in real time. It will however only activate its services on the condition that the imbalance charge for short positions exceeds the activation cost. With imbalance prices of 1.5 and 0.5 – depending on the system imbalance – and an activation cost of 1.5, the BRP will never activate its 10 MW and will prefer to be short instead. As a result, the BRP is exposed to negative and positive imbalances of -10 and +10, each for 50% of the time. It accordingly pays and receives similar imbalance charges and its expected final income is again zero.
Table XIII: Example impact of imbalance pricing on provision of balancing services
TOTAL EXPECTED INCOME ONE-PRICE SYSTEM TWO-PRICE SYSTEM
0 -4.25 Sell 10 MW to TSO = 0.5*10*(1.5-1.5) - 0.5*10*(1.5+0.5)/2
+ 0.5*10*(-1.5+(-0.5))/2 = 0.5*10*(1.5-1.5) - 0.5*10*(2.1+1)/2 +
0.5*10*(1+0.4)/2
0 -2.75 Keep 10 MW for own use = -0.5*10*(1.5+0.5)/2 +
0.5*10*(1.5+0.5)/2 = -0.5*10*(1.5+1)/2 + 0.5*10*(1+0.4)/2
However, under a two-price system, the BRP is inclined to keep its excess generation for its own use, thus avoiding a short position if the load is higher than expected and the imbalance charge for short positions exceeds the activation cost. For instance, if the BRP offers 10 MW to the TSO, its services have a 50% chance of being activated in real time – given a negative system imbalance for half of the time. It therefore receives remuneration based on the marginal price for upward regulation, i.e. 1.5, which exactly compensates it for the activation cost. Furthermore, the BRP is exposed to negative and positive imbalances of -10 and +10, each for 50% of the time. Since the penalty imposed on short positions is higher, the imbalance charge the BRP pays to the TSO is higher than that which it receives. Its expected final income amounts to -4.25. However, if the BRP keeps its 10 MW for its own use, it can avoid short positions in real time. It will only activate its services on the condition that the imbalance charge for short positions exceeds the
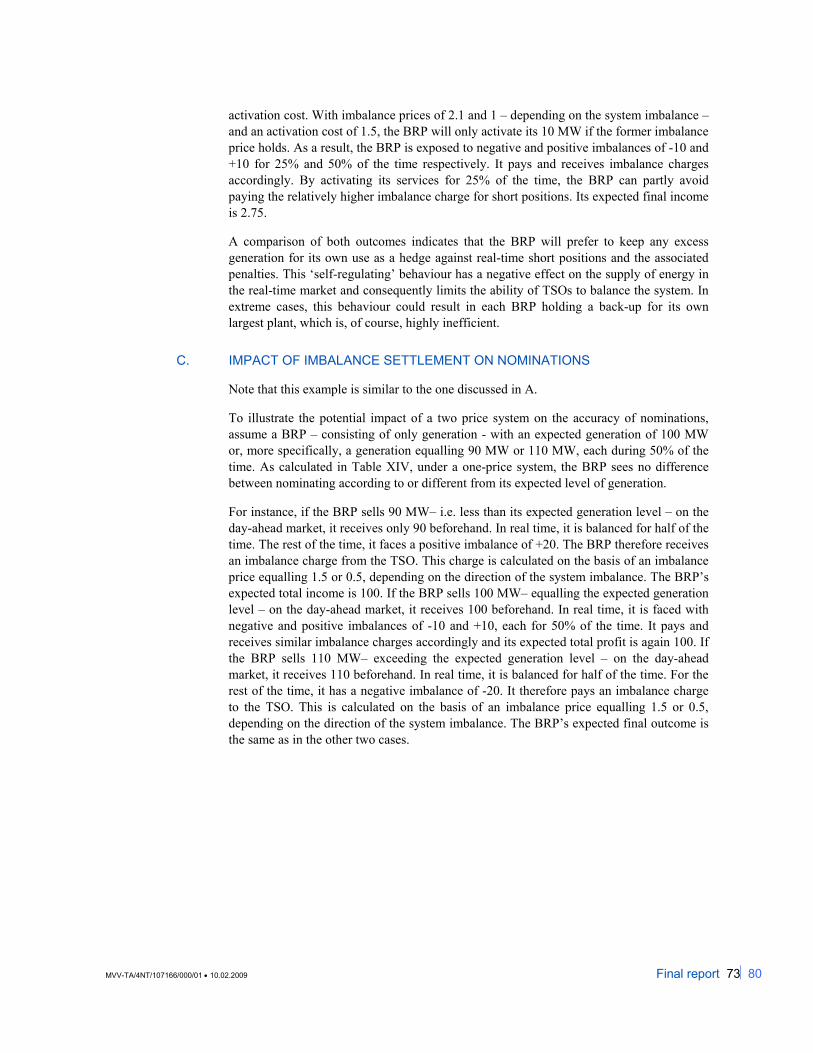
MVV-TA/4NT/107166/000/01 • 10.02.2009 Final report 73⏐80
activation cost. With imbalance prices of 2.1 and 1 – depending on the system imbalance – and an activation cost of 1.5, the BRP will only activate its 10 MW if the former imbalance price holds. As a result, the BRP is exposed to negative and positive imbalances of -10 and +10 for 25% and 50% of the time respectively. It pays and receives imbalance charges accordingly. By activating its services for 25% of the time, the BRP can partly avoid paying the relatively higher imbalance charge for short positions. Its expected final income is 2.75.
A comparison of both outcomes indicates that the BRP will prefer to keep any excess generation for its own use as a hedge against real-time short positions and the associated penalties. This ‘self-regulating’ behaviour has a negative effect on the supply of energy in the real-time market and consequently limits the ability of TSOs to balance the system. In extreme cases, this behaviour could result in each BRP holding a back-up for its own largest plant, which is, of course, highly inefficient.
C. IMPACT OF IMBALANCE SETTLEMENT ON NOMINATIONS
Note that this example is similar to the one discussed in A.
To illustrate the potential impact of a two price system on the accuracy of nominations, assume a BRP – consisting of only generation - with an expected generation of 100 MW or, more specifically, a generation equalling 90 MW or 110 MW, each during 50% of the time. As calculated in Table XIV, under a one-price system, the BRP sees no difference between nominating according to or different from its expected level of generation.
For instance, if the BRP sells 90 MW– i.e. less than its expected generation level – on the day-ahead market, it receives only 90 beforehand. In real time, it is balanced for half of the time. The rest of the time, it faces a positive imbalance of +20. The BRP therefore receives an imbalance charge from the TSO. This charge is calculated on the basis of an imbalance price equalling 1.5 or 0.5, depending on the direction of the system imbalance. The BRP’s expected total income is 100. If the BRP sells 100 MW– equalling the expected generation level – on the day-ahead market, it receives 100 beforehand. In real time, it is faced with negative and positive imbalances of -10 and +10, each for 50% of the time. It pays and receives similar imbalance charges accordingly and its expected total profit is again 100. If the BRP sells 110 MW– exceeding the expected generation level – on the day-ahead market, it receives 110 beforehand. In real time, it is balanced for half of the time. For the rest of the time, it has a negative imbalance of -20. It therefore pays an imbalance charge to the TSO. This is calculated on the basis of an imbalance price equalling 1.5 or 0.5, depending on the direction of the system imbalance. The BRP’s expected final outcome is the same as in the other two cases.
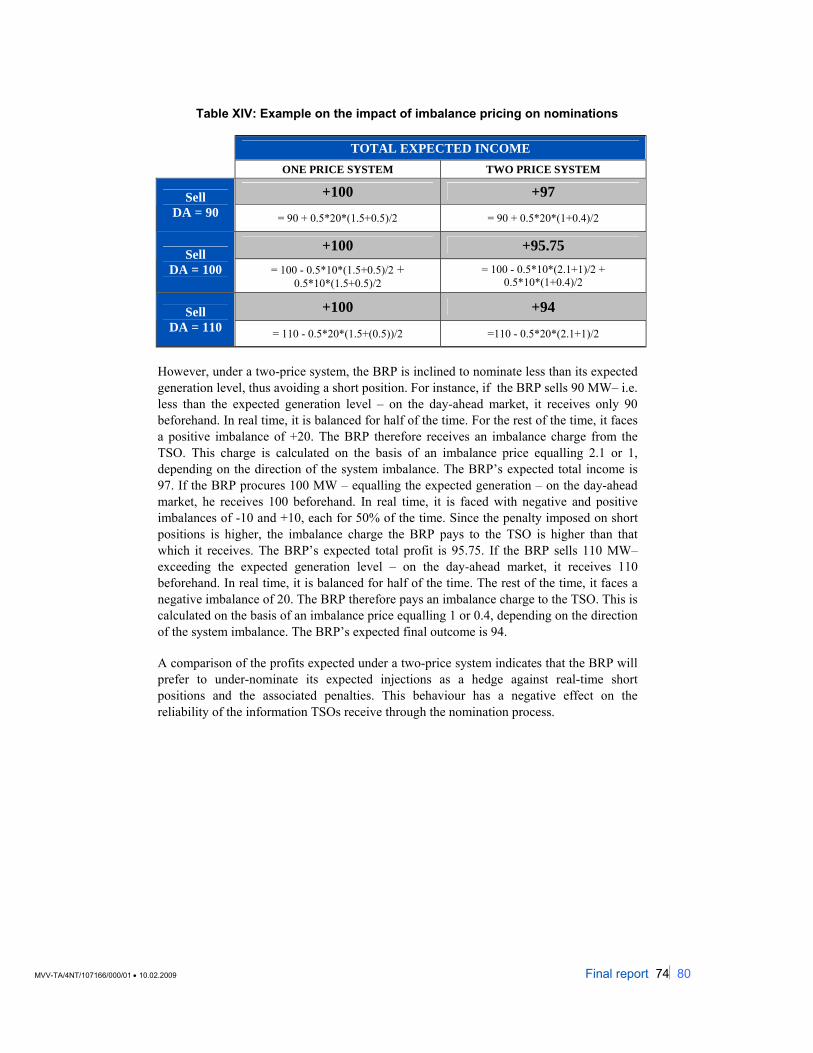
MVV-TA/4NT/107166/000/01 • 10.02.2009 Final report 74⏐80
Table XIV: Example on the impact of imbalance pricing on nominations
TOTAL EXPECTED INCOME ONE PRICE SYSTEM TWO PRICE SYSTEM
+100 +97 Sell DA = 90 = 90 + 0.5*20*(1.5+0.5)/2 = 90 + 0.5*20*(1+0.4)/2
+100 +95.75 Sell DA = 100 = 100 - 0.5*10*(1.5+0.5)/2 +
0.5*10*(1.5+0.5)/2 = 100 - 0.5*10*(2.1+1)/2 +
0.5*10*(1+0.4)/2
+100 +94 Sell DA = 110 = 110 - 0.5*20*(1.5+(0.5))/2 =110 - 0.5*20*(2.1+1)/2
However, under a two-price system, the BRP is inclined to nominate less than its expected generation level, thus avoiding a short position. For instance, if the BRP sells 90 MW– i.e. less than the expected generation level – on the day-ahead market, it receives only 90 beforehand. In real time, it is balanced for half of the time. For the rest of the time, it faces a positive imbalance of +20. The BRP therefore receives an imbalance charge from the TSO. This charge is calculated on the basis of an imbalance price equalling 2.1 or 1, depending on the direction of the system imbalance. The BRP’s expected total income is 97. If the BRP procures 100 MW – equalling the expected generation – on the day-ahead market, he receives 100 beforehand. In real time, it is faced with negative and positive imbalances of -10 and +10, each for 50% of the time. Since the penalty imposed on short positions is higher, the imbalance charge the BRP pays to the TSO is higher than that which it receives. The BRP’s expected total profit is 95.75. If the BRP sells 110 MW– exceeding the expected generation level – on the day-ahead market, it receives 110 beforehand. In real time, it is balanced for half of the time. The rest of the time, it faces a negative imbalance of 20. The BRP therefore pays an imbalance charge to the TSO. This is calculated on the basis of an imbalance price equalling 1 or 0.4, depending on the direction of the system imbalance. The BRP’s expected final outcome is 94.
A comparison of the profits expected under a two-price system indicates that the BRP will prefer to under-nominate its expected injections as a hedge against real-time short positions and the associated penalties. This behaviour has a negative effect on the reliability of the information TSOs receive through the nomination process.
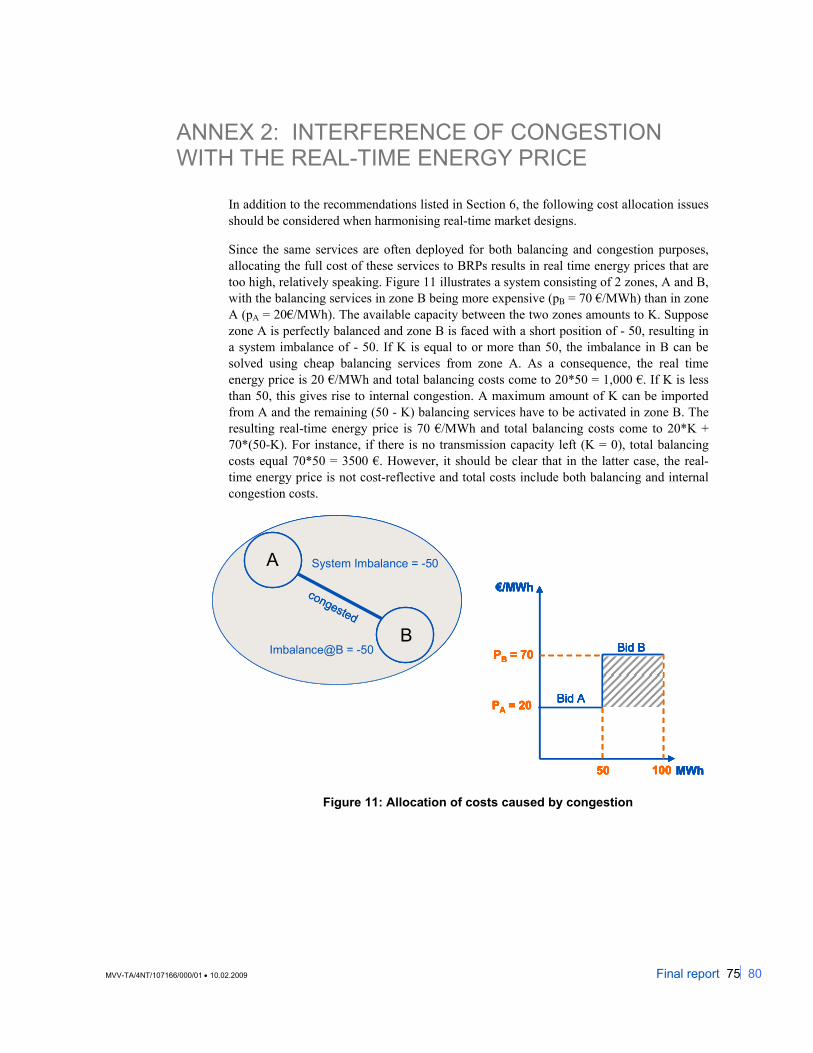
MVV-TA/4NT/107166/000/01 • 10.02.2009 Final report 75⏐80
ANNEX 2: INTERFERENCE OF CONGESTION WITH THE REAL-TIME ENERGY PRICE
In addition to the recommendations listed in Section 6, the following cost allocation issues should be considered when harmonising real-time market designs.
Since the same services are often deployed for both balancing and congestion purposes, allocating the full cost of these services to BRPs results in real time energy prices that are too high, relatively speaking. Figure 11 illustrates a system consisting of 2 zones, A and B, with the balancing services in zone B being more expensive (pB = 70 €/MWh) than in zone A (pA = 20€/MWh). The available capacity between the two zones amounts to K. Suppose zone A is perfectly balanced and zone B is faced with a short position of - 50, resulting in a system imbalance of - 50. If K is equal to or more than 50, the imbalance in B can be solved using cheap balancing services from zone A. As a consequence, the real time energy price is 20 €/MWh and total balancing costs come to 20*50 = 1,000 €. If K is less than 50, this gives rise to internal congestion. A maximum amount of K can be imported from A and the remaining (50 - K) balancing services have to be activated in zone B. The resulting real-time energy price is 70 €/MWh and total balancing costs come to 20*K + 70*(50-K). For instance, if there is no transmission capacity left (K = 0), total balancing costs equal 70*50 = 3500 €. However, it should be clear that in the latter case, the real-time energy price is not cost-reflective and total costs include both balancing and internal congestion costs.
A
B
congested
Imbalance@B = -50
System Imbalance = -50
€/MWh
MWh50
PA = 20
PB = 70
100
Bid A
Bid B
A
B
congested
Imbalance@B = -50
System Imbalance = -50A
B
congested
AA
BB
congested
Imbalance@B = -50
System Imbalance = -50
€/MWh
MWh50
PA = 20
PB = 70
100
Bid A
Bid B
€/MWh
MWh50
PA = 20
PB = 70
100
Bid A
Bid B
€/MWh
MWh50
PA = 20
PB = 70
100
Bid A
Bid B
€/MWh
MWh50
PA = 20
PB = 70
100
Bid A
Bid B
Figure 11: Allocation of costs caused by congestion

MVV-TA/4NT/107166/000/01 • 10.02.2009 Final report 76⏐80
To ensure transparent and cost-reflective prices for balancing and re-dispatching, costs due to congestion should be isolated and allocated separately. Applied to Figure 11 and assuming that K = 0, this means that BRPs are charged balancing costs of 20*50 = 1000 € and are faced with a real-time energy price of 20 €/MWh. Re-dispatching costs, equal to (70-20)*50 = 2500 € (shaded area), are recovered separately. Different cost allocation depending on the use of services can be achieved in practice by carrying out a two-step imbalance price calculation – similar to the system applied in ERCOT (USA)38 –determining the imbalance price with and without taking account of congestion constraints. However, implementing this solution in practice could entail technical difficulties. Note that establishing separate markets for balancing and re-dispatch services is not feasible as it would lead to market segmentation and associated liquidity problems and a risk of insufficient supply in the market for congestion purposes because of the TSOs’ tendency to keep these services for internal use.
38 Within ERCOT, a 2 step price calculation is implemented to allocate the costs of zonal and local congestion separately. The costs of zonal congestion – i.e. congestion on the interconnections between the 5 zones of which ERCOT is comprised – are directly allocated to so-called Qualified Scheduling Entities (QSEs), a concept similar to the European BRP. The costs of local congestion – i.e. congestion within a zone – on the contrary are socialised ERCOT-wide. For more information about the ERCOT system, see for instance Baldick R. and Niu H. Lessons learned: the Texas experience, in Griffin J. and Puller S., Electricity Deregulation: Where to from here?, University of Chicago press, 2005.
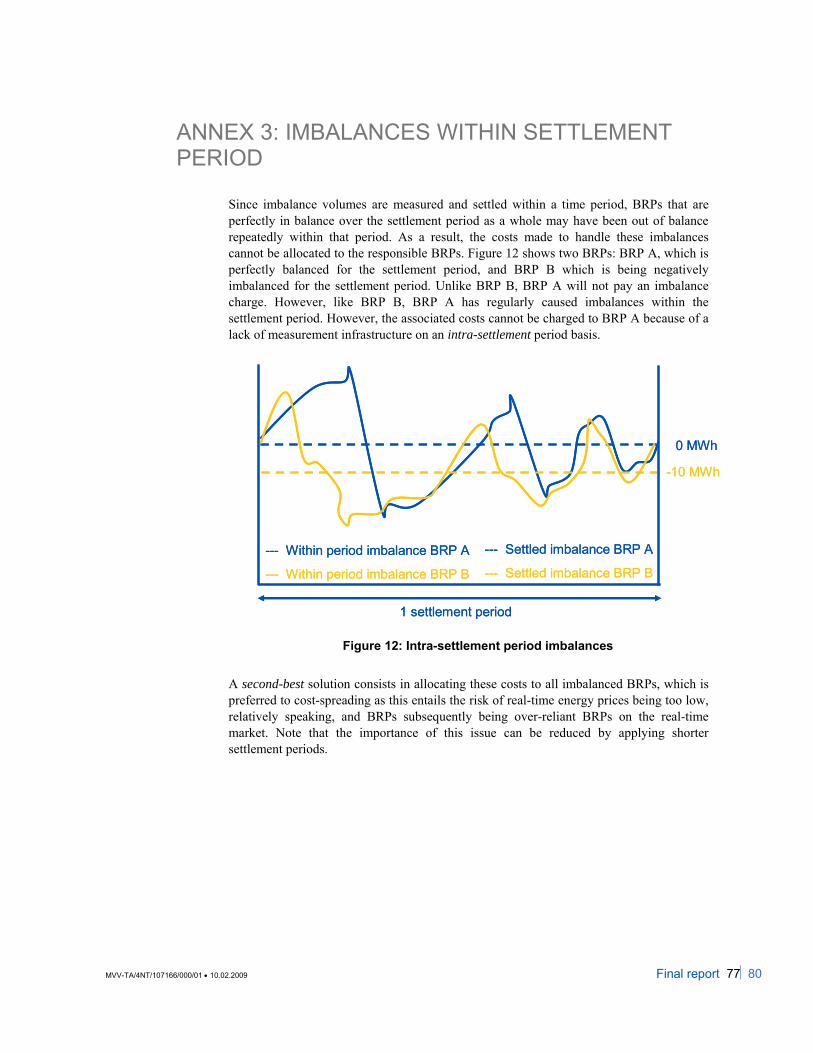
MVV-TA/4NT/107166/000/01 • 10.02.2009 Final report 77⏐80
ANNEX 3: IMBALANCES WITHIN SETTLEMENT PERIOD
Since imbalance volumes are measured and settled within a time period, BRPs that are perfectly in balance over the settlement period as a whole may have been out of balance repeatedly within that period. As a result, the costs made to handle these imbalances cannot be allocated to the responsible BRPs. Figure 12 shows two BRPs: BRP A, which is perfectly balanced for the settlement period, and BRP B which is being negatively imbalanced for the settlement period. Unlike BRP B, BRP A will not pay an imbalance charge. However, like BRP B, BRP A has regularly caused imbalances within the settlement period. However, the associated costs cannot be charged to BRP A because of a lack of measurement infrastructure on an intra-settlement period basis.
--- Within period imbalance BRP A
--- Within period imbalance BRP B
--- Settled imbalance BRP A
--- Settled imbalance BRP B
1 settlement period
0 MWh
-10 MWh
--- Within period imbalance BRP A
--- Within period imbalance BRP B
--- Settled imbalance BRP A
--- Settled imbalance BRP B
1 settlement period
0 MWh
-10 MWh
Figure 12: Intra-settlement period imbalances
A second-best solution consists in allocating these costs to all imbalanced BRPs, which is preferred to cost-spreading as this entails the risk of real-time energy prices being too low, relatively speaking, and BRPs subsequently being over-reliant BRPs on the real-time market. Note that the importance of this issue can be reduced by applying shorter settlement periods.

MVV-TA/4NT/107166/000/01 • 10.02.2009 Final report 78⏐80
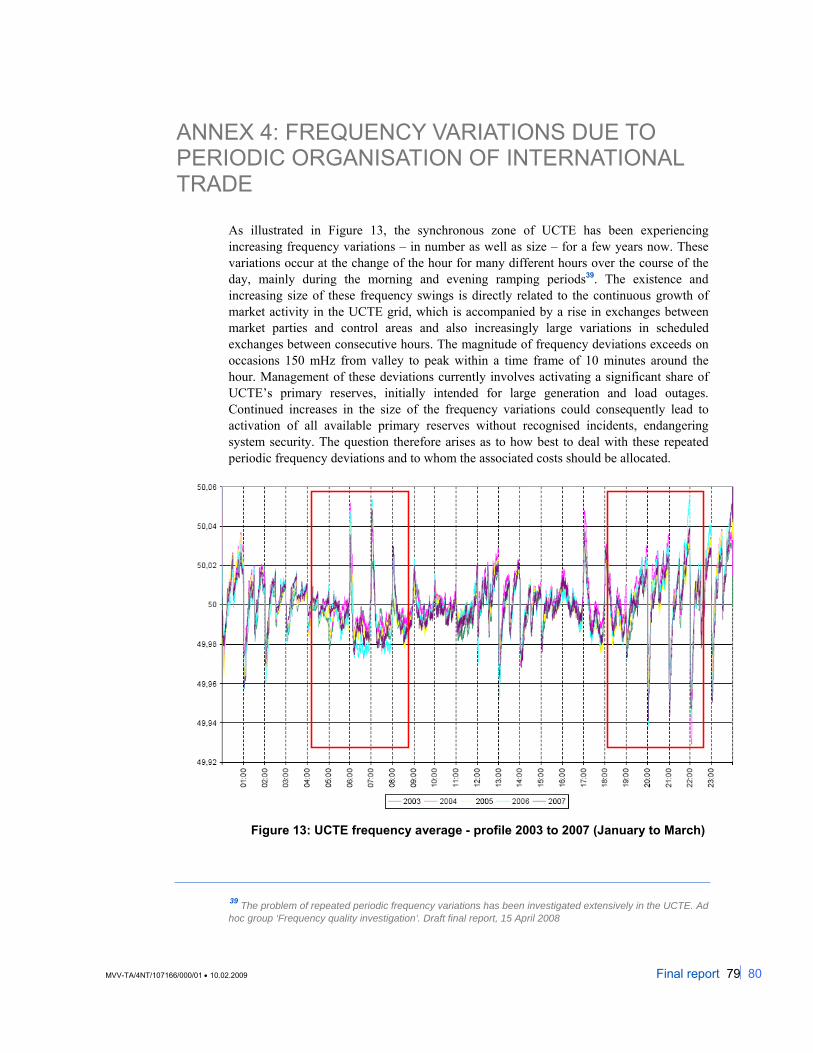
MVV-TA/4NT/107166/000/01 • 10.02.2009 Final report 79⏐80
ANNEX 4: FREQUENCY VARIATIONS DUE TO PERIODIC ORGANISATION OF INTERNATIONAL TRADE
As illustrated in Figure 13, the synchronous zone of UCTE has been experiencing increasing frequency variations – in number as well as size – for a few years now. These variations occur at the change of the hour for many different hours over the course of the day, mainly during the morning and evening ramping periods39. The existence and increasing size of these frequency swings is directly related to the continuous growth of market activity in the UCTE grid, which is accompanied by a rise in exchanges between market parties and control areas and also increasingly large variations in scheduled exchanges between consecutive hours. The magnitude of frequency deviations exceeds on occasions 150 mHz from valley to peak within a time frame of 10 minutes around the hour. Management of these deviations currently involves activating a significant share of UCTE’s primary reserves, initially intended for large generation and load outages. Continued increases in the size of the frequency variations could consequently lead to activation of all available primary reserves without recognised incidents, endangering system security. The question therefore arises as to how best to deal with these repeated periodic frequency deviations and to whom the associated costs should be allocated.
Figure 13: UCTE frequency average - profile 2003 to 2007 (January to March)
39 The problem of repeated periodic frequency variations has been investigated extensively in the UCTE. Ad hoc group ‘Frequency quality investigation’. Draft final report, 15 April 2008
MVV-TA/4NT/107166/000/01 • 10.02.2009 Final report 80⏐80
A first option could consist in the implementation of shorter trading periods (e.g. trading on a quarter-hourly instead of an hourly basis) in the wholesale market. However, these shorter periods could give rise to such high transaction costs that market parties would continue to trade on an hourly basis. The success of the solution therefore depends on the transaction costs.
As a second option, frequency swings could – at least partially – be handled through the grid code. This could be done by imposing maximum gradients (i.e. the speed of power output change) on hydro plants since the ramp rates of these power plants are much higher than for other generation technologies, creating a mismatch that primary and secondary control services are often unable to cope with.
A third option consists in managing frequency deviations through the real-time market, for instance by allowing increased procurement of primary reserves40. However, the associated capacity payments should not be allocated to imbalanced BRPs – they should rather be socialised among all grid users. This option entails both an additional cost per grid user and a reduction of the Available Transfer Capacity (ATC) through the need to increase the TRM margin.
Finally, a fourth option finally involves extending the application of the UCTE ramping rules (-5/+5 ramping period) to all BRPs. Such arrangements were in place before unbundling, when transmission and generation activities were integrated with. Now that these activities are separate, previous arrangements are no longer binding for the power plant operators or BRPs. However, this option generates increased measuring and transaction costs. A minimum of 6 measurements per hour would be needed to check BRPs’ imbalances – given a settlement period of 15 minutes – and actual ramp rate – given a -5/+5 ramping period. The measuring infrastructure that would be installed for this purpose would enable measurement every 5 minutes, which opens the door for reduction of the settlement period to 5 minutes. This option would also have dramatic effects on the design of the real-time market since it requires a settlement covering both imbalances and ramp rate deviations.
Given this impact, this last option is more a question of market repair than market design and should therefore be avoided.
40 For UCTE, this option involves adapting the formula currently used for determining the appropriate amount of primary reserves.


TRACTEBEL ENGINEERING
7, avenue Ariane - B-1200 Brussels - BELGIUMwww.tractebel-engineering.com
KONRAD PURCHALAphone +32 2 773 99 35telefax +32 2 773 78 30e-mail [email protected]