Embed Size (px)
Citation preview

Study of the Influence of 3D Printing Parameters on the Mechanical Properties of PLA
João Francisco Miranda Fernandes
Instituto Superior Técnico, Universidade de Lisboa, Portugal
Abstract This paper aims to determine the influence that some 3D printing parameters (Filling Density,
Extrusion Temperature, Raster Angle and Layer Thickness) have in some of the mechanical properties (Ultimate Tensile Strength, Yield Tensile Strength, Modulus of Elasticity, Elongation at Break and Toughness) of PLA, after it goes through the printing process. It is also the aim to find the scale of the amount of water that it’s absorbed by the PLA, and find a way to reduce this absorption.
It begins with a brief introduction of all the procedures used. In terms of results, the influences of each printing parameter are determined for each mechanical property. All of this is accomplished by using the ANOVA statistical analysis. Regarding water absorption test, two coating materials were tested, to find out which one promotes better protection. Finally, two different methods were used, to try to improve the mechanical properties obtained previously.
We conclude that, individually, there is influence of all parameters in each of the mechanical properties, but the same cannot be said about the parameter combinations. It was also found out that for each parameter value, each mechanical property reacts differently. For the water absorption test, one of the coatings stood out, and is clearly the best. In terms of the methods for improvement of the properties it was also concluded that one of them was clearly more efficient.
Key-Words: FDM, PLA, Mechanical Properties, Water Absorption, Printing Parameters.
1. Introduction In recent years, the use of 3D printers has
increased significantly, and a continuation of this phenomenon is foreseen. A 3D printer can be used either in the prototyping phase of a product or in the final stage of production of the same product. The 3D printer is used for the manufacture of a diverse array of products, which can range from leisure articles to medical components.
From all the 3D printing technologies, the one that is more accessible to the public (and therefore the most used) is the Fused Deposition Molding (FDM). This happens not only because of the vast number of companies that develop and market this kind of printers, but also because of the relative low cost of these printers.
2. Literature Review 2.1. FDM’s Technical Process
The material used in the FDM printers comes in the form of filament, packed in a coil fashion. The first step is to unwind the filament, and using rollers driven by stepping motors, feed it to the extrusion head [1].
The extrusion head is the component responsible for the transformation of a solid material in a malleable one. The material enters (at one end of this component) in the solid state, and by the heat generated by an electric resistance, the material is molten. Finally it’s extruded through a nozzle (subcomponent
which is at the other end of the extruding head) [1].
At the same time that the material is being extruded by the nozzle, the extrusion head and/or the printing bed moves in the Cartesian plane (X, Y, Z) with the aid of a mechanical system, building an object layer by layer [1].
2.2. Printing Parameters There are various 3D printing parameters
which can be changed, to obtain different mechanical properties. The following are some of the important ones:
Infill Density: a percentage of the interior volume of the object, which id filled with material. The remaining percentage is occupied by air. The extreme cases are 0% and 100%, which is hollow object and completely filled object, respectively;
Raster Angle: the angle in which the material filaments are oriented within the object;
Layer Thickness: in the printing process, the height of the object is divided into several slices. The layer Thickness is the height of one of those slices;
Extrusion Temperature: the temperature of the material in the moment of extrusion.
2.3. Design of Experiments When analyzing a certain process, it’s often
necessary to carry out experiments in order to determine the impact that the various inputs
have the outputs. The Design of Experiments (DOE) is used to plan the experiments, in a way that we have all the information to execute the experiments properly, and obtain trustworthy results [2].
There’s a need to define the three main aspects of the DOE, being them the following [2]:
Factor: input of the experiment. Variable that may or may not influence the final result of the experiment. The number of factors may be more than one;
Level: they are the settings for each factor. At least two levels are required;
Response: output of the experiment. Parameter that can be obtain from the results of the experiment. The number of responses may be more than one.
A Design Matrix is a table that has all the combinations of levels between the different factors. To simplify this table, a letter is attributed to represent each factor.
2.4. Analysis of Variance After the experiments are carried out, the
information gathered from the responses must be processed in some way, then analyzed, and finally it must be drawn some conclusion about the influence that the factor has on the response. In order to do this, the Analyses of Variance (ANOVA) can be used. The ANOVA is used as a tool to determine the relationships between factors (and its levels) and responses [3].
One of the tasks of the ANOVA is to set a Null Hypothesis (H0). It states that there’s no relationship between two phenomena, or in this case between a factor and a response. If the H0 can be rejected, then it can be concluded that there’s in fact a relationship between the two phenomena [3].
In the ANOVA, a Type I Error is the incorrect rejection of a true H0, or in another words, when it’s concluded that there’s a relationship between two phenomena, but in reality there’s not. The probability of committing a Type I Error is represented by α. In some of the calculations done in the ANOVA, there’s a need to define a confidence level, and it’s usually 1-α [4].
3. Preparing the Experiments 3.1. Selecting the Experimental Tests
One of the goals of the present project is to understand the relationship between some of the 3D printing parameters and the mechanical behavior of a certain printed object. Given the broad variety of mechanical tests, there could only be selected a few. So the chosen ones were the tensile test and Charpy impact test. It
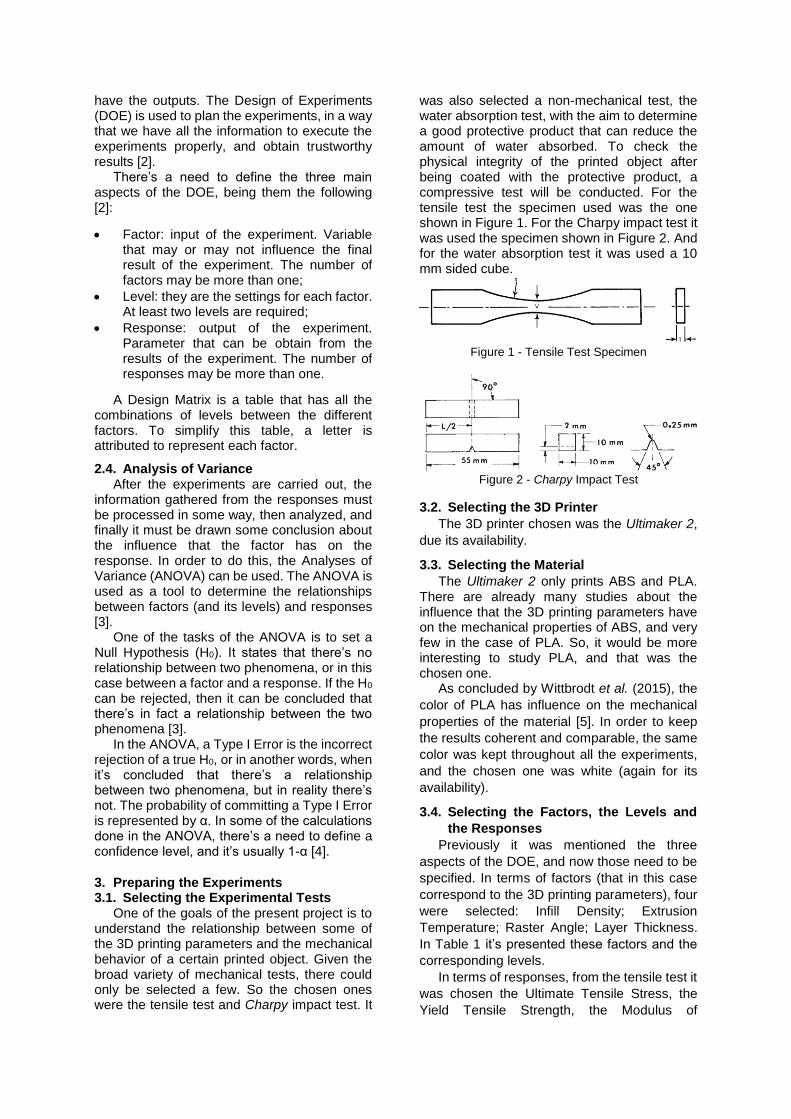
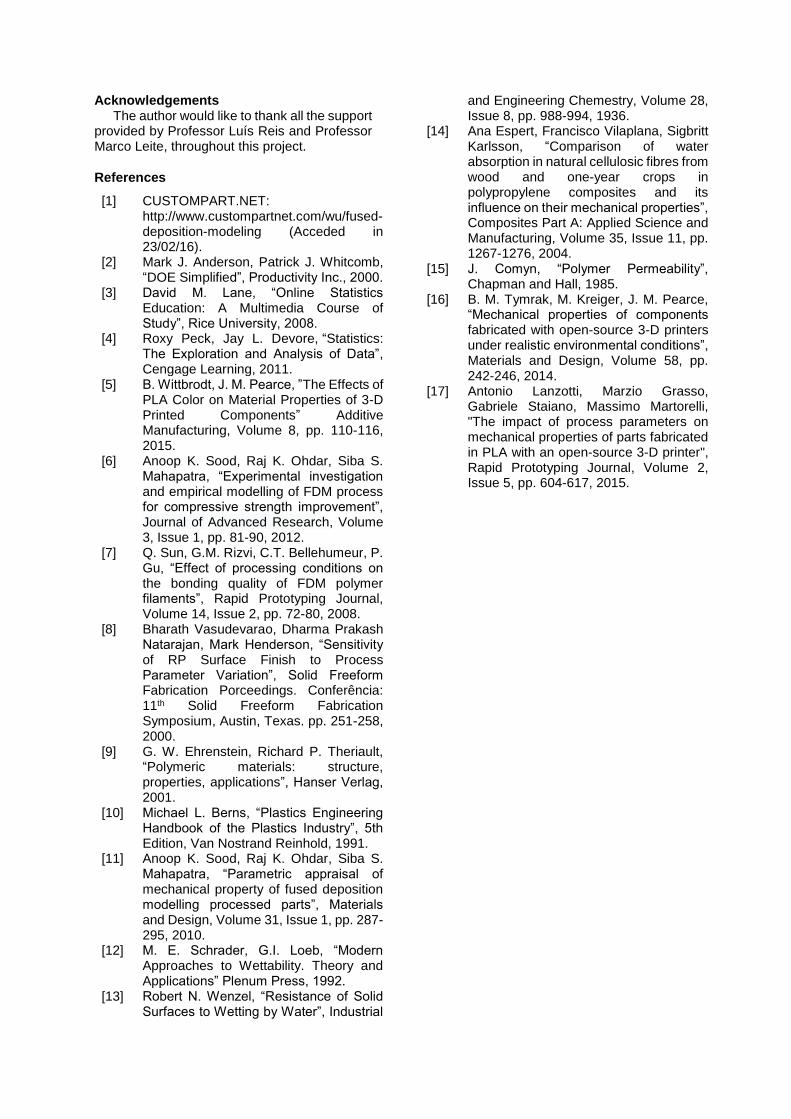
was also selected a non-mechanical test, the water absorption test, with the aim to determine a good protective product that can reduce the amount of water absorbed. To check the physical integrity of the printed object after being coated with the protective product, a compressive test will be conducted. For the tensile test the specimen used was the one shown in Figure 1. For the Charpy impact test it was used the specimen shown in Figure 2. And for the water absorption test it was used a 10 mm sided cube.
Figure 1 - Tensile Test Specimen
Figure 2 - Charpy Impact Test
3.2. Selecting the 3D Printer
The 3D printer chosen was the Ultimaker 2,
due its availability.
3.3. Selecting the Material
The Ultimaker 2 only prints ABS and PLA. There are already many studies about the influence that the 3D printing parameters have on the mechanical properties of ABS, and very few in the case of PLA. So, it would be more interesting to study PLA, and that was the chosen one.
As concluded by Wittbrodt et al. (2015), the
color of PLA has influence on the mechanical
properties of the material [5]. In order to keep
the results coherent and comparable, the same
color was kept throughout all the experiments,
and the chosen one was white (again for its
availability).
3.4. Selecting the Factors, the Levels and
the Responses
Previously it was mentioned the three
aspects of the DOE, and now those need to be
specified. In terms of factors (that in this case
correspond to the 3D printing parameters), four
were selected: Infill Density; Extrusion
Temperature; Raster Angle; Layer Thickness.
In Table 1 it’s presented these factors and the
corresponding levels.
In terms of responses, from the tensile test it
was chosen the Ultimate Tensile Stress, the
Yield Tensile Strength, the Modulus of

Elasticity, the Elongation at Break and the
Toughness. From the Charpy impact test it was
chosen the Absorbed Energy.
Table 1 – Factores and its Levels
Levels
Factors 0 1 2
Infill Density (%) 20 40 60
Extrusion Temperature (ºC) 200 220
Raster Angle (º) 0/90 -45/+45 Layer Thickness (mm) 0.1 0.2
3.5. Establishing the Design Matrix
Given the number of levels in each factor, there are 3 × 2 × 2 × 2 = 24 experiments.
The letters for each factor are the following:
A – Infill Density;
B – Extrusion Temperature;
C – Raster Angle;
D – Layer Thickness.
In Table 2 it’s presented the Design Matrix.
Table 2 - Design Matrix
FACTOR LEVELS FACTOR LEVELS
EXPERIMENT # A B C D EXPERIMENT # A B C D
1 0 0 0 0 13 1 1 0 0 2 0 0 0 1 14 1 1 0 1
3 0 0 1 0 15 1 1 1 0
4 0 0 1 1 16 1 1 1 1
5 0 1 0 0 17 2 0 0 0
6 0 1 0 1 18 2 0 0 1
7 0 1 1 0 19 2 0 1 0
8 0 1 1 1 20 2 0 1 1
9 1 0 0 0 21 2 1 0 0
10 1 0 0 1 22 2 1 0 1
11 1 0 1 0 23 2 1 1 0
12 1 0 1 1 24 2 1 1 1
4. Responses from the Experiments
The tensile tests were performed in a
Universal Testing Machine (the Instron 3369)
according to the ASTM D638-02a norm. The
experimental values from this test are force and
elongation of the specimen. From this two, the
stress and the strain can be calculated. And
finally from this last two we can obtain the
Ultimate Tensile Strength (σUTS), the Elongation
at Break (εf), the Modulus of Elasticity (E), the
Yield Tensile Strength (σYld) and the Toughness
(T). In Figure 3 there’s an example of a Stress
Vs. Strain curve obtain from one of the tensile
tests. In Figure 4 there’s a photo of the
specimens after the test.
The Charpy impact tests were performed on
a Zwick equipment, according to the ASTM
E23-02a norm. From this tests it was obtained
the Absorbed Energy (AE). In Table 3 there are
all the responses from the two kinds of tests.
Figure 3 - Stress Vs. Strain Curve
Figure 4 – Tensile Specimen after Test

Table 3 - Experimental Values of Every Response of the Tensile Test and the Charpy Impact Test
Experiment # σUTS [MPa] εf [%] E [GPa] σYld [MPa] T [J/cm3] AE [J/cm2]
1 20.71 3.33 1.04 17.27 0.46 0.10
2 19.09 3.36 0.94 15.71 0.53 0.13
3 20.20 4.16 0.93 15.32 0.69 0.10
4 17.67 4.40 0.72 10.96 0.74 0.10
5 22.63 3.59 1.01 16.49 0.40 0.10
6 19.79 3.69 0.93 14.14 0.47 0.10
7 21.36 4.33 0.89 12.78 0.58 0.10
8 18.20 4.40 0.78 12.73 0.61 0.10
9 24.18 4.08 0.95 14.49 0.59 0.10
10 22.35 4.61 0.97 14.97 0.67 0.13
11 19.91 4.65 1.01 16.74 0.78 0.13
12 22.24 4.49 0.91 15.18 0.89 0.10
13 24.97 3.51 1.13 19.09 0.49 0.13
14 26.14 3.59 1.19 20.07 0.53 0.17
15 25.31 4.56 1.06 17.76 0.65 0.13
16 24.32 4.46 0.96 15.94 0.74 0.13
17 26.23 4.28 1.22 19.05 0.76 0.17
18 26.55 5.01 1.23 20.61 0.81 0.20
19 29.43 4.87 1.25 21.07 0.95 0.10
20 25.22 5.51 1.00 15.99 1.19 0.10
21 30.22 4.21 1.32 21.31 0.72 0.20
22 28.67 4.45 1.20 19.42 0.77 0.17
23 29.43 4.40 1.21 21.27 0.85 0.10
24 26.71 4.77 1.09 17.85 1.07 0.10
5. Discussion of the Results from the Mechanical Tests All the calculations for the ANOVA were
done by software (Minitab). It was chosen 5% for the value of α.
It wasn’t possible to apply the ANOVA to the
Absorbed Energy, because its values weren’t
valid, according to the ANOVA rules. Even
though it wasn’t possible to draw any
conclusions from this response, it is possible to
conclude somethings from the Toughness,
which is in some ways an equivalent parameter
(since both measure the energy absorbed by
the material during its deformation).
5.1. Factors
The best values of the Ultimate Tensile Strength, the Yield Tensile Strength and the Modulus of Elasticity correspond to the same experiment (number 21), with: an Infill Density of 60%; an Extrusion Temperature of 220ºC; a Raster Angle of 0º/90º; a Layer Thickness of 0.1 mm.
In terms of the best values of the Elongation
at Break and the Toughness, they also both
correspond to the same experiment, but in this
case the number 20, with: an Infill Density of
60%; an Extrusion Temperature of 200ºC; a
Raster Angle of -45º/+45º; a Layer Thickness of
0.2 mm.
5.1.1. Infill Density
It was observed an increase of every response, with the increase of the Infill Density. This is an expected result, since if there’s more material in the specimen, the mechanical properties will, in general, be better.
The main goal in studying the Infill Density
was to determine if, for a certain level of this
factor, the responses would stop improving
significantly, compared to a previous level. But
this was not the case. In every response, there’s
a bigger increase when going from 40% to 60%,
than when going from 20% to 40%.
5.1.2. Extrusion Temperature
With the results obtain by Anoop et al. (2012), Sun et al. (2008) and Bharath et al. (2000), it can be concluded that adhesion between layers improves when there’s a higher temperature [6] [7] [8]. But with an increase of temperature, the material tends to become

more fragile, as concluded by Ehrenstein et al. (2001) [9].
The facts reported in the previous paragraph
might explain why the best results of the
Ultimate Tensile Strength, the Yield Tensile
Strength and the Modulus of Elasticity were
observed for the higher Extrusion Temperature
(220ºC), and why the best results of the
Elongation at Break and the Toughness were
observed for the lower Extrusion Temperature
(200ºC).
5.1.3. Raster Angle
Depending on the angle of the filaments relative to the direction of the force applied, the distribution of stress in the filaments will be different. In some cases the filaments are in a pure tensile stress state (0º), and in other cases they are in a mix of tensile stress and shear stress (-45º and +45º). The optimal case is the one of pure tensile stress [10].
The Information presented before might explain why the best results of the Ultimate Tensile Strength and the Yield Tensile Strength were observed for a Raster Angle of 0º/90º.
Observing Figure 5, which is a FEM simulation of the two Rater Angles, it can be
seen that the 0º/90º orientation was “harder” to deform from its original state (since the amount of deformation is not that much), compared to the -45º/+45º orientation. In other words, the 0º/90º Raster Angle provides a stiffer structure. This might explain the fact that the best results for the Modulus of Elasticity was observed for the 0º/90º Raster Angle. It’s worth noting that stiffness mention in this paragraph is geometry stiffness, and not a material stiffness. But since the Raster Angle is a geometry parameter, the facts presented might still be valid.
This easiness in deforming the structure,
provided by the -45º/+45º Raster Angle might
explain the fact that the best results for the
Elongation at Break and the Toughness were
observed for this orientation.
In Figure 6 there’s a FEM simulation of the
stress distribution for both Raster Angles. As it
can be observed, the higher stress is located in
the filaments’ intersections. Figure 7 is a SEM
photograph of a tensile test specimen after
rupture, and it can be seen that rupture occurred
on the filaments’ intersections, as predicted by
the FEM simulation.
Figure 5 - FEM Simulation of the Structure’s Deformation for Both Raster Angles: 0º/90º (left); -45º/+45º (right)
Figure 6 - FEM Simulation of the Stress Distribution for Both Raster Angles: 0º/90º (left); -45º/+45º (right)

Figure 7 - SEM Photograph of the Rupture Zone of the Tensile Test Specimen: 0º/90º (left); -45º/+45º (right)
5.1.4. Layer Thickness
The lower the Layer Thickness, the better the adhesion between layers [11] This information might explain the fact that the best results of the Ultimate Tensile Strength, the Yield Tensile Strength and the Modulus of Elasticity were observed for the lower Layer Thickness (0.1 mm).
But the better the connection between layers
is, the more “solid” the specimen is, and
consequently it can become less flexible. This
fact might explain why the best results for the
Elongation at Break and the Toughness were
observed for the higher Layer Thickness (0.2
mm).
6. Water Absorption Tests
It’s known that the water content in a polymeric material can affect its mechanical properties. A way of dealing with this problem is by coating the base material with a protective one (more permeable to water than the base one). To choose the right protective material, water absorption tests need to be performed.
This tests won’t be performed for every
experiment, but only for the ones that showed
the best results for the responses, in the tensile
tests. So, the specimens for water absorption
tests will have the factors (printing parameters)
corresponding to the experiments number 20
and 21.
6.1. Initial Information About the Water
Absorption Tests
The water absorption tests were performed according the ASTM D570-98 norm. There were selected two different protective materials, one being a polyurethane wood selante, Lakeone, and the other being an acrylic aqueous varnish, Luxens. The first was only applied one time, and for the second, two coats were needed.
The weighting of the cubes was done in
intervals of 30 minutes, for the first 4 hours, in
intervals of 1 hour, for the next 4 hours, and in
intervals of 24 hours, for the next 4 days. In
total, the cubes spent 104 hours inside water.
6.2. Results from the Water Absorption
Tests
The three properties that can be obtain from
this type of test are: Weight Gain (WG); Porosity
(P); Absorption Coefficient (AC). The first two
can be calculated by the following equations:
𝐴𝑃 =𝑚𝑠𝑎𝑡 − 𝑚𝑠𝑒𝑐
𝑚𝑠𝑒𝑐
× 100% (1)
𝑃 =
(𝑚𝑠𝑎𝑡 − 𝑚𝑠𝑒𝑐)/𝜌𝐻2𝑂
𝑉× 100% (2)
Where msat is the saturated mass (the mass
at the end of the experiment), mdry is the dry
mass (the mass at the beginning of the
experiment), ρH2O is the density of water and V
is the volume of the cube. The Absorption
Coefficient is calculated graphically. The X axis
of the graph is the square root of the immersion
time, and the Y axis is the Weight Gain per Unit
of Area of the cube, and this last ratio can be
calculated by the following equation:
𝑊𝑒𝑖𝑔ℎ𝑡 𝐺𝑎𝑖𝑛
𝑈𝑛𝑖𝑡 𝐴𝑟𝑒𝑎=
𝑚𝑤𝑒𝑡 − 𝑚𝑑𝑟𝑦
𝐴 (3)
Where mwet is the mass of the cube in a
certain instant of time, and A is the area of one
of the faces of the cube. The Absorption
Coefficient is the initial slop of this graph. In
Figure 8 and Figure 9 there’s the graphs
obtained from this experiments.
It can be seen that in both cases, the
protective of polyurethane is the best in
preventing the absorption of water by the PLA,

since at any given time it has the lowest weight
gain. In Table 4 it’s shown the results of the
three properties. From the values of this table,
we can conclude that there is in fact a reduction
in the water absorbed, when using a protective
material. It’s also confirmed that the
polyurethane protection is the best one, since
all three of the properties show the lowest
values.
Figure 8 - Evolution of the Weight Gain in Function of the Squared Root of the Immersion Time for the Experiment
20
Figure 9 - Evolution of the Weight Gain in Function of the Squared Root of the Immersion Time for the Experiment
21
Table 4 - Experimental Values of the Weight Gain, the Porosity and the Absorption Coefficient for Experiments Number 20 and 21
Experiment #20 Experiment #21
Protection WG [%] AC [g.cm-2.min-1/2] P [%] WG [%] AC [g.cm-2.min-1/2] P [%] None 0.308 1.157×10⁻⁴ 0.277 0.326 1.369×10⁻⁴ 0.315
Polyurethane 0.175 5.974×10⁻⁵ 0.161 0.208 7.333×10⁻⁵ 0.205 Acrylic 0.245 1.095×10⁻⁴ 0.234 0.266 1.213×10⁻⁴ 0.264
6.3. Analysis of the Results from the Water
Absorption Tests
The wettability is the ability that a liquid has to stay in contact with a solid surface. And the better the wettability, the more prone is the
surface to absorb water [12]. Its also known that the rougher the surface, the better the wettability is [13].
The lower the Layer Thickness, the more
“ups” and “downs” there’s on the surface per
0
0,001
0,002
0,003
0 20 40 60 80
WG
/UA
[g/
cm2 ]
√t [min1/2]
Without ProtectionPolyurethaneAcrylic
0
0,001
0,002
0,003
0 20 40 60 80
WG
/UA
[g/
cm2 ]
√t [min1/2]
Without ProtectionPolyurethaneAcrylic

unit of length, making the surface more rough.
Has it can be observed in Table 4, the higher
values of all three properties correspond to the
experiment number 21, which has the lowest
Layer Thickness (0.1 mm). In Figure 10 there’s
a SEM photograph proving that the lower Layer
Thickness provides the rougher surface.
The main mechanism for water penetration
in polymers is by diffusion of water molecules in
the micro-cracks of the polymeric chain [14]. it
is also known that the processing temperature
of the polymer is responsible for the creation of
this micro-cracks [15]. An increase in micro-
cracks leads to an increase of the water
absorbed. In a way this is linked to the porosity
of the material. In this case, the Extrusion
Temperature of 220ºC was responsible for the
highest Porosity, and consequently the highest
amount of water absorbed, since this values
correspond to the experiment number 21 (which
has the Extrusion Temperature of 220ºC).
Figure 10 - SEM Photograph Evidencing the Layer Thickness: 0.1 mm (left); 0.2 mm (right)
6.4. Compression Tests After the compression tests, it was verified
that the integrity of the PLA wasn’t compromised by the protective material, because the Stress Vs. Strain curves where very similar, in the cases with and without the protective material, as it can be seen in
Figure 11 (and there was even an improvement in the mechanical properties in the case o the experiment number 20).
With this last information, and the one from
the water absorption tests, it can be confirmed
that, in this case, the polyurethane protective
material is the best.
Figure 11 - Stress Vs. Strain Curves from the Compression Test for the Experiments: 20 (left); 21 (right)
7. Improving the Mechanical Properties There were used two different methods to
improve the mechanical properties obtained previously. Since it was already found the printing parameters that led to the best mechanical properties, those were used. In other words, the parameters of experiments
number 20 (for best Elongation at Break and Toughness) and 21 (for best Ultimate Tensile Strength, Yield Tensile Strength and Modulus of Elasticity).
The first method consisted in keeping the levels of all factors the same, except for the Infill Density, which was raised to its maximum,
0
10
20
30
40
50
60
70
80
0 20 40 60
Stre
ss [
MP
a]
Strain [%]
Without ProtectionPolyurethaneAcrylic
0
10
20
30
40
50
60
70
80
0 20 40 60
Stre
ss [
MP
a]
Strain [%]
Without ProtectionPolyurethaneAcrylic

100%. In theory, more material equals better mechanical properties.
The second method consisted in coating the specimens in the polyurethane protective material. In theory, the polyurethane will penetrate the base material and fill in the cracks left by the printing process, solidifying the structure, and improving the mechanical properties.
One of the drawbacks of improving the
mechanical properties is the extra weight
imposed on the specimen. And this gained
weight is different for both methods. So, to
properly compare this two methods, we’re going
to compare the mechanical properties per unit
of (extra) weight (of the specimen). In Table 5
there are the values for the first method, and in
Table 6 there are the values for the second
method.
As it can be seen, except for Elongation at
Break, the best results come from the first
method, or, by increasing the Infill Density.
Table 5 - Improvement of the Mechanical Properties per Unit of Weight for the Increasing of the Infill Density Method
Experiment # σUTS [MPa/g] σYld [MPa/g] E [GPa/g] εf [%/g] T [(J/cm3)/g]
20 - - - 2.80 1.55
21 40.65 11.40 0.74 - -
Table 6 - Improvement of the Mechanical Properties per Unit of Weight for Coating with Polyurethane Method
Experiment # σUTS [MPa/g] σYld [MPa/g] E [GPa/g] εf [%/g] T [(J/cm3)/g]
20 - - - 9.63 1.18
21 36.05 8.66 0.49 - -
8. Comparing Results
It’s interesting to compare the results obtained in this study, with the ones from other researchers.
Wittbrodt et al. (2015) concluded that there’s an increase of the Ultimate Tensile Strength and the Yield Tensile Strength with the increase of the Extrusion Temperature. The same was observed in the present study [5].
Tymrak et al. (2014) concluded that there’s an increase of the Ultimate Tensile Strength with the decrease of the Layer Thickness. They also concluded that the Ultimate Tensile Strength is higher for a Raster Angle of 0º/90º. Both these results were observed in the present study [16].
Lanzotti et al. (2015) concluded that there’s an increase of the Ultimate Tensile Strength and the Modulus of Elasticity with the decrease of the Layer Thickness, and there’s an increase of the Elongation at Break with the increase of the Layer Thickness. Both these results were observed in the present study [17].
9. Conclusion For the Infill Density, it was observed that the
increase of the responses is bigger and bigger, the grater the value of this factor is. If there’s availability of material and time, it’s highly recommended to use the highest Infill Density possible. Still regarding this factor, all the responses showed their best values for the same value of Infill Density (60%). But the same can´t be said about the other factors. The
Ultimate Tensile Strength, the Yield Tensile Strength and Modulus of Elasticity show its best values for an Extrusion Temperature of 220ºC, a Raster Angle of 0º/90º and a Layer Thickness of 0.1 mm. On the other hand, the Elongation at Break and the Toughness show its best results for an Extrusion Temperature of 200ºC, a Raster Angle of -45º/+45º and a Layer Thickness of 0.2 mm.
Regarding the water absorption tests, the configuration that led to the least amount of water absorbed corresponds to the Extrusion Temperature of 200ºC, and the Layer Thickness of 0.2 mm. Nothing can be concluded about the Infill Density, because this factor was kept constant throughout all the experiments. As for the Raster Angle, there are no scientific evidence of its influence on the amount of water absorbed. There were used two protective materials to prevent the water absorption, an acrylic based and a polyurethane based, and the second one provided the best protection.
There were used two different methods to improve the mechanical properties. One consisted in raising the Infill Density to 100%, and the other consisted in coating the specimens with the protective material (polyurethane). In both methods the mechanical properties improved, but the first method provided the better results (the improvement was higher).
Acknowledgements The author would like to thank all the support
provided by Professor Luís Reis and Professor Marco Leite, throughout this project.
References
[1] CUSTOMPART.NET: http://www.custompartnet.com/wu/fused-deposition-modeling (Acceded in 23/02/16).
[2] Mark J. Anderson, Patrick J. Whitcomb, “DOE Simplified”, Productivity Inc., 2000.
[3] David M. Lane, “Online Statistics Education: A Multimedia Course of Study”, Rice University, 2008.
[4] Roxy Peck, Jay L. Devore, “Statistics: The Exploration and Analysis of Data”, Cengage Learning, 2011.
[5] B. Wittbrodt, J. M. Pearce, ”The Effects of PLA Color on Material Properties of 3-D Printed Components” Additive Manufacturing, Volume 8, pp. 110-116, 2015.
[6] Anoop K. Sood, Raj K. Ohdar, Siba S. Mahapatra, “Experimental investigation and empirical modelling of FDM process for compressive strength improvement”, Journal of Advanced Research, Volume 3, Issue 1, pp. 81-90, 2012.
[7] Q. Sun, G.M. Rizvi, C.T. Bellehumeur, P. Gu, “Effect of processing conditions on the bonding quality of FDM polymer filaments”, Rapid Prototyping Journal, Volume 14, Issue 2, pp. 72-80, 2008.
[8] Bharath Vasudevarao, Dharma Prakash Natarajan, Mark Henderson, “Sensitivity of RP Surface Finish to Process Parameter Variation”, Solid Freeform Fabrication Porceedings. Conferência: 11th Solid Freeform Fabrication Symposium, Austin, Texas. pp. 251-258, 2000.
[9] G. W. Ehrenstein, Richard P. Theriault, “Polymeric materials: structure, properties, applications”, Hanser Verlag, 2001.
[10] Michael L. Berns, “Plastics Engineering Handbook of the Plastics Industry”, 5th Edition, Van Nostrand Reinhold, 1991.
[11] Anoop K. Sood, Raj K. Ohdar, Siba S. Mahapatra, “Parametric appraisal of mechanical property of fused deposition modelling processed parts”, Materials and Design, Volume 31, Issue 1, pp. 287-295, 2010.
[12] M. E. Schrader, G.I. Loeb, “Modern Approaches to Wettability. Theory and Applications” Plenum Press, 1992.
[13] Robert N. Wenzel, “Resistance of Solid Surfaces to Wetting by Water”, Industrial
and Engineering Chemestry, Volume 28, Issue 8, pp. 988-994, 1936.
[14] Ana Espert, Francisco Vilaplana, Sigbritt Karlsson, “Comparison of water absorption in natural cellulosic fibres from wood and one-year crops in polypropylene composites and its influence on their mechanical properties”, Composites Part A: Applied Science and Manufacturing, Volume 35, Issue 11, pp. 1267-1276, 2004.
[15] J. Comyn, “Polymer Permeability”, Chapman and Hall, 1985.
[16] B. M. Tymrak, M. Kreiger, J. M. Pearce, “Mechanical properties of components fabricated with open-source 3-D printers under realistic environmental conditions”, Materials and Design, Volume 58, pp. 242-246, 2014.
[17] Antonio Lanzotti, Marzio Grasso, Gabriele Staiano, Massimo Martorelli, "The impact of process parameters on mechanical properties of parts fabricated in PLA with an open-source 3-D printer", Rapid Prototyping Journal, Volume 2, Issue 5, pp. 604-617, 2015.