Embed Size (px)
Citation preview

STUDY OF THE IMPACT OF THE ACA IMPLEMENTATION IN KENTUCKY
Quarterly Snapshot: July - September 2016
The Study of the Impact of the Affordable Care Act (ACA) on Health Coverage,
Access, Quality, Cost, and Outcomes in Kentucky, funded by the Foundation for
a Healthy Kentucky, is a three-year mixed methods study conducted by the State
Health Access Data Assistance Center (SHADAC), a health policy research institute
at the University of Minnesota. As part of the Study, the research team produces
Quarterly Snapshots to track ACA implementation indicators in a timely way.
Sources and technical notes are included on page 5. Please visit us at:
http://healthy-ky.org or follow us on Twitter @healthyky and @shadac.

2
Kentucky has experienced one of the largest drops in uninsurance since implementation of the ACA.1 Currently, 7.3% of Kentuckians (all ages) reported being uninsured in early 2016, compared to the U.S. rate of 9.6%.
COVERAGE3rd Quarter 2016
This is the seventh Quarterly Snapshot produced under the Study of the Impact of the ACA Implementation in Kentucky. All sections have been updated with new data and/or data points since the previous Quarterly Snapshot. Indicators on this page are from a SHADAC analysis of the U.S. Census Bureau’s Current Population Survey. The analysis uses questions asking about people’s current health insurance coverage at a point-in-time during early 2016 (February-April). Except where noted, the data presented represent Kentuckians of all ages.
Kentucky’s Remaining Uninsured
Early 2016 Uninsured Rate by Income LevelKentucky’s uninsurance rate for lower-income people (0-138% of FPG or less) was significantly lower than states that haven’t expanded their Medicaid programs (MO, TN, VA) and Indiana, which expanded a year later than Kentucky (2015) via a waiver. It was not significantly different from neighboring states that expanded their Medicaid programs in 2014 (AR, IL, OH, WV), including Arkansas, which expanded via a waiver. Among those with moderate (139-400% of FPG) and higher incomes (401% of FPG or higher), Kentucky’s uninsurance rate was not significantly different from most comparison states.
0%
5%
10%
15%
20%
KY US OHINAR VAIL MO TNWV
0-138% FPG
139-400% FPG
401% FPG
10.9%
7.3%
3.0%
16.3%*
9.7%
4.3%*
14.1%
9.8%
6.1%
12.0%
7.6%
2.6%
16.3%*
9.2%
5.9%*
11.7%
7.0%
2.0%
8.6%
8.5%
4.1%
17.4%*
10.8%
3.1%
19.3%*
8.8%
6.2%*
20.9%*
12.3%*
3.5%
Medicaid Expansion States Non-expansion States
Nearly half (48.6%) had incomes low enough to qualify for Medicaid (0-138% of the Federal Poverty Guidelines). Chil-dren are eligible for KCHIP up to 218% of FPG. More than a quarter (28.4%) were children age 18 and younger, and more than a third (34.5%) were adults age 19-34.
Almost two-thirds (62.8%) had a high school diploma or less education. More than two-thirds of uninsured adult Ken-tuckians (70.4%) were working, either part- or full-time.
11.3%401%+ FPG
40.1%139-400% FPG
48.6%0-138% FPG Income
28.4%Ages 0-18
13.8%Ages 19-25
20.7%Ages 26-34
17.1%Ages 35-44
19.6%Ages 45-64
Age
0.4%Ages 65+
17.9%Less than High School
44.9%High School Degree
37.3%Some College or College Degree Education
70.4%Working (Part-or Full-�me)
29.6%Not Working
Work Status
Of approximately 320,000 uninsured Kentucky children and adults.
Among the nearly 234,000 adult Kentuckians without insurance.
* Statistically significant difference from KY rate at 95% level.

3
GreaterLexington
WesternKentucky
GreaterLouisville
NorthernKentucky
EasternKentucky
0-9.9%10-19.9%
30%+20-29.9%
MEDICAIDMedicaid Enrollment
This map shows the distribution of all non-elderly (ages 19-64) traditional income-based and ACA Medicaid expansion enrollees across Kentucky.
Medicaid Services
During the past quarter (July-September 2016), Medicaid covered thousands of needed services for traditional income-based and ACA Medicaid expansion enrollees ages 19-64.
3rd Quarter 2016
Diabetes Screening
Preventive Dental Services
44,065
Breast Cancer Screening
10,143
ENROLLMENT METRICS
Diabetes screenings were covered by Medicaid for traditional income-based and expansion enrollees ages 19-64.
ACA Medicaid Expansion 12,319Traditional Income-Based Medicaid 4,472
Breakout of Substance Use TreatmentMedicaid Enrollment by Age
Enrollment by Age and Medicaid CategoryNewborn
Births
7,039
4,495
Hepatitis C Screening
6,159
In the third quarter of 2016 (July-September 2016), Medicaid covered 650,867 adult Kentuckians (ages 19-64) through tra-ditional income-based and expansion eligibility.
*These data exclude children and elderly adults, and people enrolled through other eligibility categories.
KHIP Region % of Medicaid enrollees
% of Kentucky population
Eastern Kentucky 31.0% 21.6%
Greater Lexington 16.1% 18.8%
Greater Louisville 19.5% 22.7%
Northern Kentucky 7.6% 10.3%
Western Kentucky 25.8% 26.5%
22.7%Ages 19-25
28.0%Ages 26-3423.0%
Ages 35-44
16.6%Ages 45-54
9.7%Ages 55-64
Enrollment by Age
61,585
96,388
111,284
128,221
108,839
1,455
11,683
38,539
53,787
39,086
55-64
45-54
35-44
26-34
19-25
Expansion Tradi�onal income-based
4
3rd Quarter 2016
MARKETPLACE
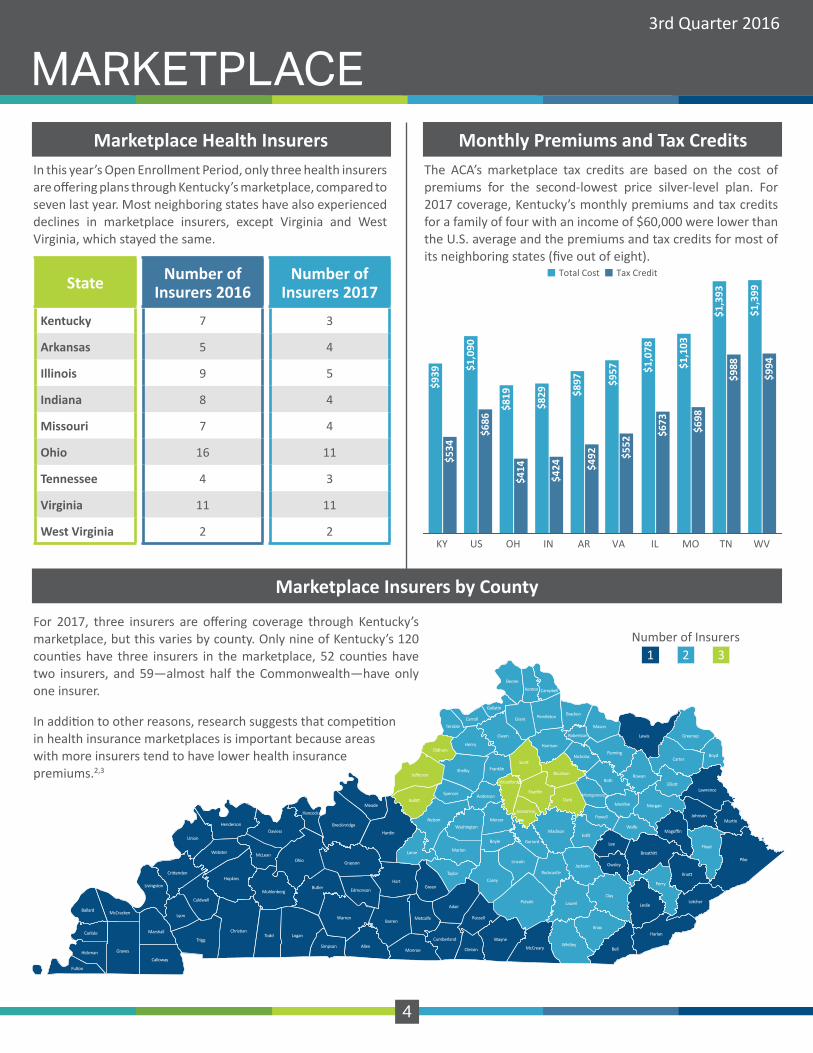
Marketplace Insurers by County
In this year’s Open Enrollment Period, only three health insurers are offering plans through Kentucky’s marketplace, compared to seven last year. Most neighboring states have also experienced declines in marketplace insurers, except Virginia and West Virginia, which stayed the same.
The ACA’s marketplace tax credits are based on the cost of premiums for the second-lowest price silver-level plan. For 2017 coverage, Kentucky’s monthly premiums and tax credits for a family of four with an income of $60,000 were lower than the U.S. average and the premiums and tax credits for most of its neighboring states (five out of eight).
Marketplace Health Insurers Monthly Premiums and Tax Credits
Fulton
Hickman
Carlisle
Ballard McCracken
Graves
Calloway
Marshall
Livingston
Lyon
Chris�an
Trigg
Hopkins
MetcalfeWarren
Allen
Muhlenberg
HartButler
Ohio
Logan
Simpson
McLeanWebster
Caldwell
Todd
Cri�enden
Edmonson
Johnson
Breckinridge
Floyd
Henderson
Marion
WashingtonNelson
Daviess
MeadeHancock
UnionHardin
Larue
Monroe
Barren
Grayson
Lee
Breathi�
Leslie
Owsley
Harlan
Bell
Knox
Clay
JacksonRockcastle
LaurelPulaski
Casey
WhitleyMcCreary
Wayne
Clinton
Cumberland
Russell
Adair
Taylor
Green Perry
Morgan
Magoffin
Menifee
Letcher
Wolfe
Kno�
Harrison
Nicholas
Bourbon
Clark
Faye�e
Jessamine
Mercer
Boyle
Lincoln
Garrard
Madison
Powell
Es�ll
Mar�n
Pike
Robertson
Fleming
Lewis Greenup
CarterBoyd
LawrenceEllio�
RowanBath
Montgomery
Franklin
Anderson
Woodford
Mason
Sco�
Kenton Campbell
Pendleton
Owen
Grant
Galla�n
CarrollTrimble
Jefferson
OldhamHenry
Shelby
SpencerBulli�
Boone
Bracken
Number of Insurers1 2 3
For 2017, three insurers are offering coverage through Kentucky’s marketplace, but this varies by county. Only nine of Kentucky’s 120 counties have three insurers in the marketplace, 52 counties have two insurers, and 59—almost half the Commonwealth—have only one insurer.
In addition to other reasons, research suggests that competition in health insurance marketplaces is important because areas with more insurers tend to have lower health insurance premiums.2,3
$939
$5
34
KY
$1,0
90
$686
US
$819
$4
14
OH$8
29
$424
IN
$897
$4
92
AR
$957
$5
52
VA
$1,0
78
$673
IL
$1,1
03
$698
MO
$1,3
93
$988
TN
$1,3
99
$994
WV
Total Cost Tax CreditState Number of
Insurers 2016Number of
Insurers 2017Kentucky 7 3
Arkansas 5 4
Illinois 9 5
Indiana 8 4
Missouri 7 4
Ohio 16 11
Tennessee 4 3
Virginia 11 11
West Virginia 2 2

5
3rd Quarter 2016
This is the seventh Quarterly Snapshot produced under the “Study of the Impact of the ACA Implementation in Kentucky”. All sections have been updated with new data and/or data points since the previous Quarterly Snapshot.
COVERAGEKentucky’s Remaining Uninsured, and Uninsured by Income Level: SHADAC analysis of data from the Current Population Survey’s Annual Social and Economic Supplement, which is conducted between February-April, regarding point-in-time insurance coverage in 2016. The uninsurance estimates are derived from survey questions asking about whether respondents have coverage at the time they are being surveyed. They are considered “uninsured” if they had no coverage under any type of health insurance at the time of the survey. Notes: The estimates presented here are for individuals of all ages, except where noted otherwise. While Indiana is described as a Medicaid-expansion state, its expansion did not begin until February 2015, compared to the expansions that began January 2014 in Arkansas, Illinois, Kentucky, Ohio and West Virginia. Footnote No.1: SHADAC. “Health Insurance Coverage in 2014.”
MEDICAIDMedicaid Enrollment and Services Indicators: SHADAC analysis of data provided by the Kentucky Cabinet for Health and Family Services (CHFS). Notes: For the map, we include only traditional income-based and ACA expansion Medicaid enrollees ages 19-64. For service utilization counts, we include only traditional income-based Medicaid and ACA expansion Medicaid enrollees ages 19-64. We exclude the following special enrollee categories: Medicare-Medicaid dual eligible; foster, former foster, and kinship care; intermediate care facility, nursing home, and hospice populations; Medicare savings and special populations; SSI recipients; waiver populations, or incomplete claims that do not show enrollee category. Dental services represent preventive dental visits only; other dental visits are excluded. Services are calculated based on claims data with dates of service from 7/1/16-9/30/16, retrieved on 1/10/17 by CHFS.
MARKETPLACEMarketplace Health Insurers: Obtained from the U.S. Department of Human Services, Office of the Assistant Secretary for Planning and Evaluation (ASPE) Research Brief: “Plan Choice and Premiums in the 2017 Health Insurance Marketplace” (October 24, 2016) and the Kentucky Health Benefit Exchange’s “Plans offered on kynect in 2016” (October 27, 2015).
Premiums and Tax Credits: Obtained from the U.S. Department of Human Services, Office of the Assistant Secretary for Planning and Evaluation (ASPE) Research Brief: “Plan Choice and Premiums in the 2017 Health Insurance Marketplace” (October 24, 2016). Note: This report presents the monthly premiums for the second-lowest cost silver-level plan, which is used to determine the size of tax credits for eligible people. In this example, the family of four is one 40-year-old adult, one 38-year-old adult, and two children under the age of 21 with an income of $60,000. For households eligible for premium tax credits, premiums are capped at a given percentage of household income after the inclusion of tax credits. Calculations of premiums after tax credits assume that all members of the family of four would be eligible for premium tax credits; however in states with higher Medicaid/CHIP thresholds, the children would be eligible for Medicaid/CHIP and not eligible for tax credits. The U.S. data are the average of the 39 states using the Healthcare.gov federal platform for enrollment.
Marketplace Insurers by County: Plans offered in the marketplace for Kentucky in the 2017 plan year, obtained from Healthcare.gov’s data set “2017 QHP Landscape Individual Market Medical.” Footnote No. 2: National Bureau of Economic Research Paper “More Insurers Lower Premiums: Evidence From Initial Pricing in the Health Insurance Marketplaces.” Footnote No. 3: National Bureau of Economic Research Paper “The Impact of Market Size and Composition on Health Insurance Premiums: Evidence from the First Year of the ACA.”
Note on Comparing Data Across Quarterly Snapshots: Quarterly Snapshots are designed to present a “snapshot” analysis of recently available data. To do this, they often use different data sources to provide similar information (e.g., uninsurance rates from different surveys). However, because data sources vary by report, it typically is not possible to accurately compare data from across different snapshots in the “Coverage and Cost” and “kynect” or “Marketplace” sections. An exception are the “Medicaid” section data on service utilization and enrollment, which are comparable.
Quarterly Snapshot Technical Notes