Embed Size (px)
Citation preview

Study of the effects of wettability on pool boiling conditions in a quiescent medium
T.Valente, [email protected]
IN+ - Instituto Superior Técnico, Universidade de Lisboa, Av. Rovisco Pais, 1049-001 Lisbon, Portugal
ABSTRACT
This study focuses on the detailed description of the heat transfer and bubble dynamics processes occurring for the boiling of water on surfaces with extreme wetting regimes, namely hydrophilicity and superhydrophobicity. The wettability is changed at the expense of modifying the surface chemistry and without significant variations in the mean surface roughness. Furthermore, a detailed analysis is presented, showing the temporal evolution of the bubble growth diameter together with bubble dynamics, which may be useful for comparison with numerical simulations.
The results show a particular trend of the boiling curve obtained for the superhydrophobic surfaces, as the heat flux increases almost linearly with the superheat, although with a much lower slope than the hydrophilic surfaces. This occurs because a large bubble is formed over the entire surface just at 1K superheat, as a result of the almost immediate coalescence of the bubbles generated on the surface. This behaviour is in agreement with the so-called “quasi-Leidenfrost” regime recently reported in the literature.
Detailed analysis of bubble dynamics focuses on the temporal evolution of the bubble growth diameter together with
bubble contact angle. This analysis shows substantial differences between the boiling over the hydrophilic vs the
hydrophobic surfaces. Hence, besides the much slower departure frequency and larger bubble diameter of the bubbles
generated on the superhydrophobic surface, the bubble contact angle does not vary much during the bubble growth
process. As for the bubble growth over hydrophilic surfaces, the bubble diameter does not follow any obvious trend with
increasing heat flux, but the emission frequency has a general decreasing trend, which is in agreement with that proposed
by (Zuber, 1963). The contact line velocity profiles obtained for the bubbles growing on the superhydrophobic surfaces was
shown to be highly unstable, contrasting to the stable growing process depicted by the bubbles on the hydrophilic surfaces.
This instability is attributed to the large bubble size, to the vapor layer resulting from the “quasi-Leidenfrost” reported by
(Malavasi, et al., 2015) and to the slowness of the growth process, which allows that the bubble is affected by pressure
variations, occurring within minutes.
KEYWORDS
Pool Boiling, Two-phase systems, Wettability, Boiling onset, Boiling Curve, Bubble dynamics
INTRODUCTION
Enhancement of pool boiling heat transfer is often achieved by altering surface properties. The evolution observed in micro and nano fabrication techniques within the last decade provides the researchers the opportunity to test a wide range of surface treatments, which quickly evolved from the micro-patterned surfaces with structures of the order of hundreds of microns, as obtained for instance by (Klein & Westwater, 1971) to nano-coatings (e.g. (Takata, et al., 2006), (Phan, et al., 2009)). However, many of these treatments simultaneously alter surface topography and wettability in a non-systematic way, turning difficult to understand dominant effects on the boiling mechanisms, which lead to the actual enhancement on the heat flux that is often reported in these studies. In fact the wettability is affected by the chemistry of the surface (and of the working fluid) and by the surface topography. However, it is possible and desirable to separate them at some extent, as recently shown by (Bourdon, et al., 2012) and (Bourdon, et al., 2013). The surface wettability is usually roughly quantified by the apparent equilibrium contact angle 𝜃𝑒, which is obtained at the thermodynamic equilibrium between the interfacial tensions acting at liquid-solid-vapor contact interfaces (often measured on a sessile drop deposited on the surface). Based on this apparent angle, it is widely accepted that a surface is lyophilic (i.e. promotes the liquid spreading) for 0<𝜃𝑒<90
o and
lyophobic (i.e. repels the liquid) for 𝜃𝑒>90o. The terms hydrophilic/hydrophobic, which are commonly used for liquid
attractive/repellent surfaces, derive from the specific attraction/repellence of water. The boundaries for extreme wetting scenarios, namely superhydrophilicity and superhydrophobicity are still debated in the most recent literature, as universal criteria to determine stable extreme wetting regimes are not easily defined. It is known that the heterogeneous wetting regime associated to superhydrophobicity may not be stable and may not hold, as an activation energy barrier is transposed, and the contact line slowly moves (e.g. (He, et al., 2003)). Hence, the most representative measures are given by the quasi-static advancing or receding contact angles and by the hysteresis, which is basically the difference between the advancing and the receding angles. So, based on this, several authors, such as (Bhushan & Jung, 2011) consider that a
surface is superhydrophobic for 𝜃𝑎𝑑𝑣>135o, as long as the hysteresis is lower than 10
o. These advancing and receding angles
are also argued to be more representative of dynamic processes, which has been demonstrated for drop impacts (for example (Antonini, et al., 2012)), but may be important also for bubble dynamics (e.g. (Mukherjee & Kandlikar, 2007)).
The various experiments performed on pool boiling over superhydrophobic surfaces vs hydrophilic surfaces (e.g. (Takata, et al., 2006), (Takata, et al., 2012), (Phan, et al., 2009), (Betz, et al., 2013)) are consistent in the description of the main trends observed: bubble nucleation starts at lower superheat values on a superhydrophobic surface, as the energy barrier necessary for nucleus generation is smaller. However, despite nucleation is favoured, rewetting is not, so the superhydrophobic surface inhibits bubble release. On the contrary, a superhydrophilic surface requires larger superheat to start bubble nucleation, but find it easier to release the vapour bubble. As a result, the onset of boiling starts at very low superheat values on superhydrophobic surfaces, but then the force balance does not favour the bubble release from the surface, so large bubbles stay for longer attached on the surface and coalesce, leading to a Critical Heat Flux condition at low superheat values. The opposite trend is observed for the boiling curves for hydrophilic surfaces. Based on these observations, several authors promptly evolved to an “optimum” surface, considering an adequate superhydrophilic/superphydrophobic patterning of the surface. However, the basic governing mechanisms occurring at these extreme wetting regimes are far to be understood. Detailed description of the nucleation process and of bubble dynamics such as those performed for instance by (Phan, et al., 2009), (McHale & Garimella, 2010) and (Moita, et al., 2015) are still scarce and do not allow establishing the accurate relation between bubble dynamics and the aforementioned trends of the boiling curves. Also, the basic nucleation mechanisms were never properly related to the wettability, as it is still unclear which is the accurate quantity to use. Hence, several authors consider a rough approximation of the equilibrium angle to be representative of the contact angle at bubble growth in the expressions to predict the bubble departure diameter, such for example the Fritz equation (Fritz, 1935). The accuracy of Fritz equation has been debated several times, particularly when dealing with hydrophobic and superhydrophobic surfaces (e.g. (Matkovic & Koncar, 2012)) and (Phan, et al., 2009) even report an opposite trend of the bubble growth with the contact angle, when compared to that given by the Fritz equation. These authors proposed instead that the macro-angle defined during bubble growth is more appropriate to estimate the bubble diameter, including it on the so-called energy factor, which basically accounts for the ratio between the volume of a sphere which has a macro-contact angle and the surface of the full sphere with the same diameter. (Phan, et al., 2009) further show that this angle is actually very small at nucleation and then increases during bubble growth for hydrophilic surfaces, occurring the opposite for hydrophobic surfaces. Then, based on geometrical arguments the authors show that the energy required to activate the nucleation site and initiate the following bubble generation is actually larger for a lower macro-contact angle. However, when building up the whole model, (Phan, et al., 2010) argue similarity between the macro and the apparent or equilibrium contact angles at bubble departure, for particular conditions.
In this context, the present work aims at contributing with additional information to allow a more adequate description of bubble dynamics and discusses which are the most adequate parameters relating these dynamic processes with surface wettability. Hence, boiling curves obtained for extreme wetting scenarios (hydrophilic vs superhydrophobic) are discussed in detail, together with the temporal evolution of several quantities used to describe bubble dynamics, namely bubble diameter, bubble emission frequency and bubble contact angle. The surface topography is varied within these extreme wetting conditions, in a systematic and controlled way to assess on its role in a situation for which the wettability is mainly controlled by the chemical modification of the surface. The quantification of these variables is supporting further numerical simulations of the boiling process.
EXPERIMENTAL ANALYSIS
Experimental set-up
The set-up is mainly composed by a boiling chamber, where the experiments are performed, a degassing system in which the fluid is degassed, pressurized and constantly heated and a filling and an evacuating circuit which connects the boiling chamber respectively to the degassing station and to the waste fluid container, being the latter at ambient pressure. The pressure and the temperature inside the boiling chamber are accurately controlled (the temperature is controlled with a precision of 1
oC and for the pressure control the precision is 1,6 mbar). The entire heating block of the pool boiling test
section is isolated with Teflon, from the outside and the pool boiling chamber is isolated with rubber. Heaters disposed inside and on the outer surfaces of the boiling chamber are controlled by a PID controller to assure that the liquid remains inside the chamber at saturation temperature. The pressure is controlled by means of two electronic valves are actuated based on the measures given by a pressure transducer (OMEGA DYNE Inc) inside the pool, using a home-made software based loop control. This control system reacts to pressure variations in the order of 5mbar. The refilling and the entire measurement processes are automatically controlled by this routine. The temperatures are sampled using type K thermocouples. The signal is acquired and amplified by a National Instruments DAQ board plus a BNC2120. The acquisition frequency is 100Hz. The heating block, which heats and accommodates the different surfaces comprises a copper cylinder inside which a cartridge heater (up to 315W) is placed. As aforementioned, also the cylinder is isolated with Teflon. The surfaces are positioned into the heating block using a custom made system with bolts and springs, to assure the perfect thermal contact. The bolts contacting the surface are made from PEEK (polyether ether ketone) to minimize heat that is dissipated from the surface to the bolts. The heat flux is measured using a thin heat flux meter (Captec Entreprise ®) custom
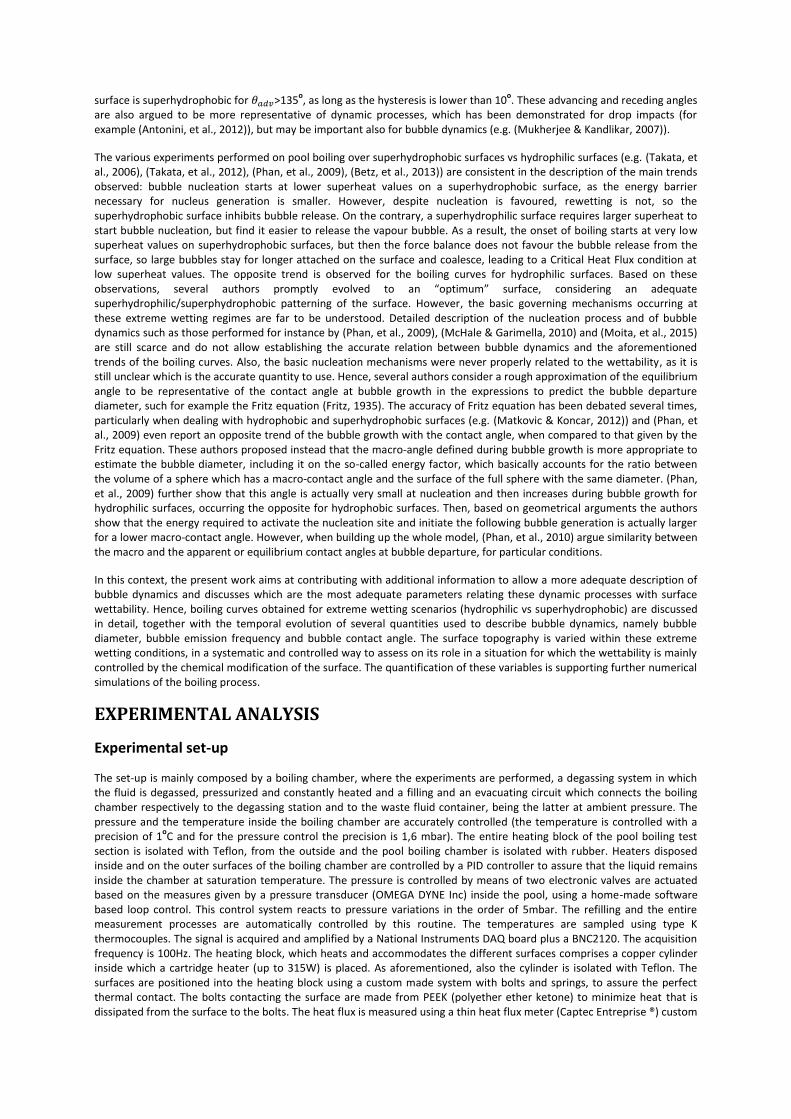
made to fit perfectly to the heating block. This heat flux meter, which is placed between the copper cylinder and the surface has a sensitivity of 2,21mV/(W/m2). A schematic representation of the experimental set-up is depicted in Figure 1
Figure 1 - Schematic representation of the experimental set-up
Methodology and diagnostic techniques
The test surfaces are characterized in terms of their superficial topography and wettability, as detailed in the following paragraphs. The quasi-static advancing and receding angles are evaluated, together with the hysteresis, before and after each test (corresponding to a single boiling curve) for each surface used. Surface topography is also checked. This procedure ensures the exact definition of the boundary conditions related to the wettability and allows inferring the effect of surface ageing on the wettability and, consequently on the pool boiling curves. Then, pool boiling curves are constructed for each test surface, which are obtained by slowly imposing the heat flux in small increasing power steps. For each power step increased, bubble dynamics and nucleation mechanisms are also characterized based on high-speed visualization, using a high-speed camera (Phantom v4.2 from Vision Research Inc., with 512x512pixels@2200fps). Quantitative information regarding bubble dynamics is further obtained by image post-processing procedures. The working fluid used is degassed distilled water. The thermo-physical properties relevant to this study are summarized in Table 1.
Table 1 – Thermo-physical properties of water, taken at saturation at 1.013x10⁵ Pa
Property Value
Tsat (°C) 99,7
ρl (kg/m3) 957,8
ρv (kg/m3) 0,5956
µl (mN m/s2) 0,279
cpl (J/kgK) 4217 kl (W/mK) 0,68
hfg (kJ/kg) 2257
σ (N/m)x10-3
58
Surface preparation
Stainless steel surfaces are prepared to have dissimilar topographic and wetting properties. The numerous surfaces used in this study (nearly 40) are categorized in 4 main groups: RAW – “smooth” hydrophilic surfaces, ROUGH – “rough” hydrophilic surfaces, RAW SHS and ROUGH SHS, representing superhydrophobic surfaces with identical roughness amplitude as that of the hydrophilic ones. The superhydrophobic surfaces are obtained at the expense of a chemical coating (a commercial compound called Glaco Mirror Coat Zero, from Soft99 Co, which is mainly a perfluoroalkyltrichlorosilane combined with perfluoropolyether carboxylic acid and a fluorinated solvent). All the surfaces are first cleaned, following the main steps: a) 30 min in an ultrasonic bath in water at 40
oC, b) drying with compressed air and c) 30 min in an ultrasonic bath in acetone
at 40oC. Then the coating is applied as in (Malavasi, et al., 2015). The aforementioned cleaning procedure must be repeated
for each surface and for all the boiling curves.
Characterization of the surfaces
The homogeneity of surface topography and morphology is checked by Laser Scanning Confocal Microscopy (Leica SP8 Confocal Microscope) using the reflection mode. Then, the stochastic roughness profiles are measured using a Dektak 3
profile meter (Veeco) with a vertical resolution of 200Angstroms. These profiles are further processed to obtain the mean roughness (determined according to standard BS1134) and the mean peak-to-valley roughness (determined following standard DIN4768). Average representative values of Ra and Rz are taken from 10 measurements distributed along the entire surface.
Wettability is quantified by the apparent quasi-static advancing and receding angles. Hysteresis is also evaluated for the coated surfaces to assure that it was lower than 10
o (following the criterion presented in the Introduction). The
measurements are performed at room temperature (20oC), using an optical tensiometer (TETA from Attension). The angles
are evaluated from the images taken within the tensiometer, using a camera adapted to a microscope. The images (with resolution of 15,6 μm/pixel, for the optical configuration used) are post-processed by a drop detection algorithm based on Young-Laplace equation (One Attension software). The accuracy of these algorithms is argued to be of the order of ± 0.1
o
(Cheng, 1990). A more realistic value of ±1o is considered as contact angle measurement accuracy. The precision is limited
by the repeatability and the homogeneity of the surface treatments. Table 2 depicts the main characteristics of the four categories of surfaces defined for the present study. The contact angles were quite reproducible. The values presented here are taken as an average of 3 representative measurements distributed along the surface. Deviations in Ra were admitted around 10% within each category.
Table 2 - Surface characteristics
Category Surface material Ra [μm] Rz [μm] θadv [o] θrec [
o]
Hysteresis [
o]
RAW Stainless steel 0,06 0,09 85,3 <20 >10
ROUGH Stainless steel 1,20 1,58 90,75 <20 >10
RAW SHS Stainless steel
coated with Glaco
0,06 0,09 166 164 2
ROUGH SHS Stainless steel
coated with Glaco
1,20 1,58 166 164 2
Pool boiling curves
The boiling curves are obtained under imposed heat flux conditions on the surface, with continuous control and monitoring of the surface temperature, liquid temperature and pressure inside the pool boiling chamber. The curves were obtained at 1 bar ± 10mbar for each surface by varying the imposed heat flux in steps. Each curve is averaged from 4 experiments.
Image post-processing for the characterization of the nucleation mechanisms and bubble dynamics
The characterization of the nucleation mechanisms and bubble dynamics is based on the measurement of several quantities obtained from high-speed visualization and image post-processing. The images are recorded with a frame rate of 2200fps. For the optical configuration used here, the spatial resolution is 31,85 μm/pixel. A home-made code developed in MATLAB enables determining the temporal evolution of the bubble diameter (until detachment), bubble contact angle, velocity of the bubble centroid, velocity of the contact line and bubble departure frequency. The temporal evolution of bubble growth is measured for each test condition, from the entire bubble growth period until detachment. Then, averaged values are taken, for the instant of bubble detachment for various detachment events. The bubble departure frequency is estimated by counting the number of events for a defined time interval.
Uncertainties
The following tables provide a summary of all the errors of the measurements herein presented.
Table 3 - Uncertainties in temperature and heat flux measurements
Temperature[K] Heat flux[W/cm2]
Variable value - 0 3 6 9
Error ±0,949 0,116 0,147 0,214 0,294

Table 4 - Uncertainties in bubble dynamics parameters
Parameter Values Relative error (%) Absolute error
Bubble diameter (mm) 3 9,86 ±0,2958
10 5,61 ±0,561
Contact angle (o) - - ±11,31
Contact line velocity - 10 -
RESULTS
Changing the wettability within extreme scenarios leads to significant differences in bubble dynamics, covering various
phenomena which occur at different temporal and spatial scales. Hence for water boiling on the hydrophilic surfaces, at low
heat fluxes, corresponding to a wall superheat of 21K, the nucleation sites are sparsely located within the heated area
(Φ20mm) and very few sites are active. Bubble size remains almost constant (Figure 2a), while the emission frequency
shows a general decreasing trend, as depicted in Figure 2b, which is in agreement to the trend proposed by (Zuber, 1963).
At high heat fluxes, the bubbles merge into large mushroom shaped vapour slugs and fluid motion becomes chaotic. This
behavior contrasts with the boiling process observed on the superhydrophobic surfaces: even at superheat values of 1-2K,
an immediate coalescence of bubbles in the near surface region occurs, generating an insulating vapor layer, from which a
single big bubble starts to grow and depart. This behavior is in agreement with the results recently reported by (Malavasi,
et al., 2015). Little difference is observed in this boiling morphology, for higher imposed heat fluxes, except for an increase
of the bubble size and emission frequency, as clearly shown in Figure 2.
a) b)
Figure 2- a) Average bubble departure diameters and b) emission frequencies, as a function of the imposed heat flux
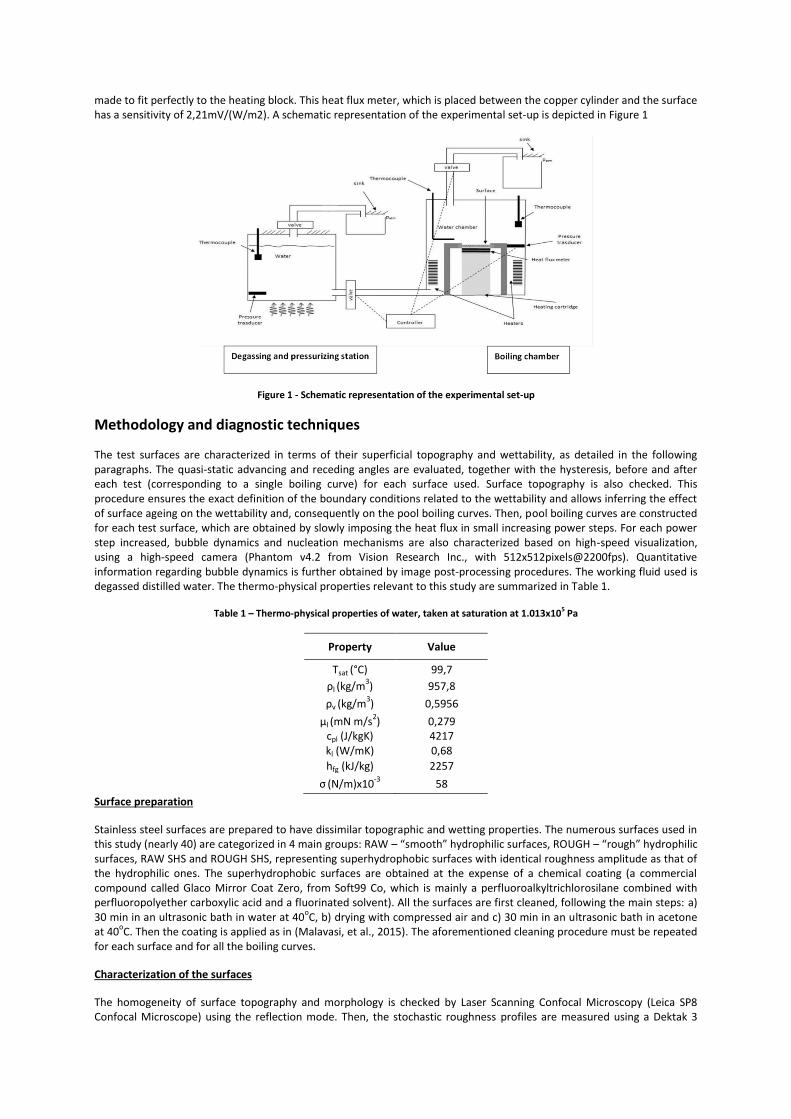
These extreme differences observed between the boiling on the hydrophilic and on the superhydrophobic surfaces affect the heat transfer process, and consequently the boiling curves, as depicted in Figure 3.
The onset of boiling for the hydrophilic surface occurs approximately for a superheating of 12K, followed by the typical increase in the curve slope, caused by triggering of the nucleate boiling regime. On the other hand, the boiling curve obtained for the superhydrophobic surface has a quite atypical trend. The onset of boiling occurs usually during the first power step, at about 1-2 K of wall superheat. After that, the heat flux increases almost linearly with surface superheating, with much lower slope than that of the hydrophilic surface. It is clear then that the superhydrophobic surface has a much poorer heat transfer performance than that of the hydrophilic one, considering this performance as the heat flux that is removed at the same wall superheat.
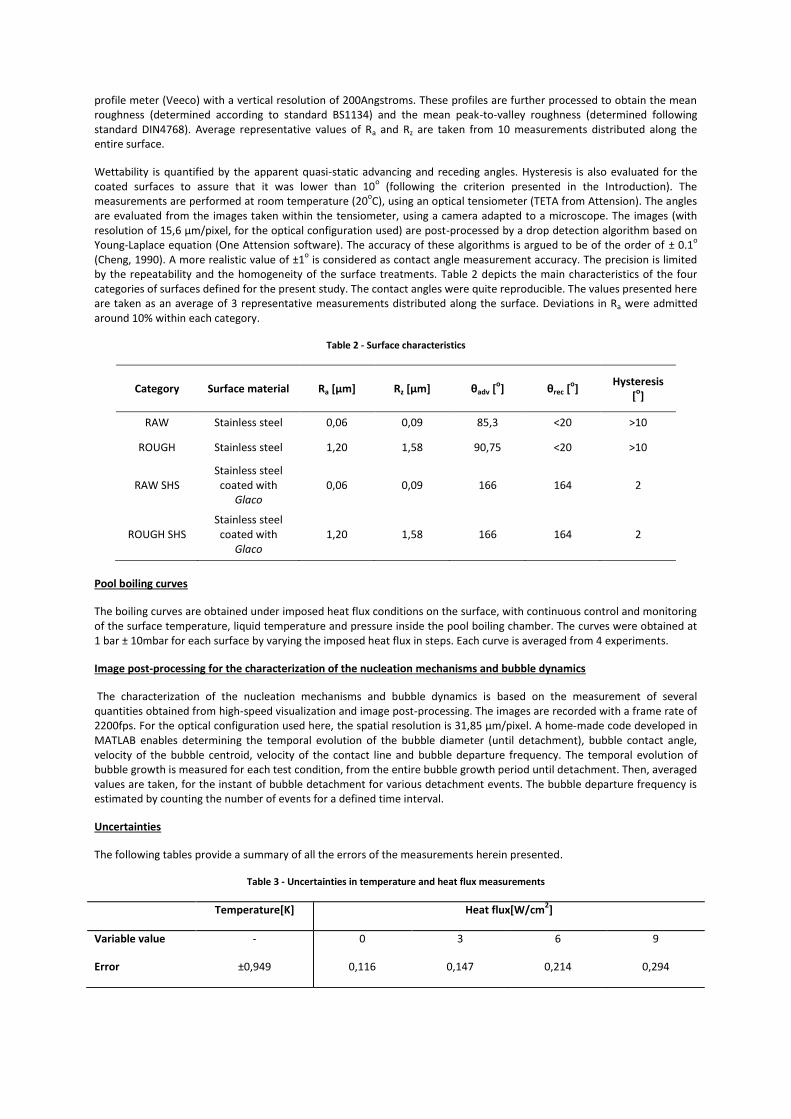
It is known form the literature that the surface topography affects the wettability and the bubble behavior. However, for such extreme wetting regimes, the surface topography clearly plays a secondary role, as the mild increase of the surface roughness does not introduce significant changes in the boiling curves, either in the hydrophilic or in the superhydrophobic surfaces, as shown in Figure 4. In fact, a mild increase of the mean roughness is not likely to introduce a significant modification in the wettability, at least in a monotonic and quantifiable way, which can be related to the equilibrium angles as stated by (Valente, et al., 2015). Given that, within the range of roughness amplitude considered here, the increase of the mean roughness does not significantly change the apparent contact angles, it is more likely that the roughness will at most affect the pool boiling heat transfer by promoting the potential increase of the number of active nucleation sites. However, even this effect is not significant, as the difference obtained for the curves with different roughness amplitude is minimal, almost within the range of uncertainty of the experimental data.
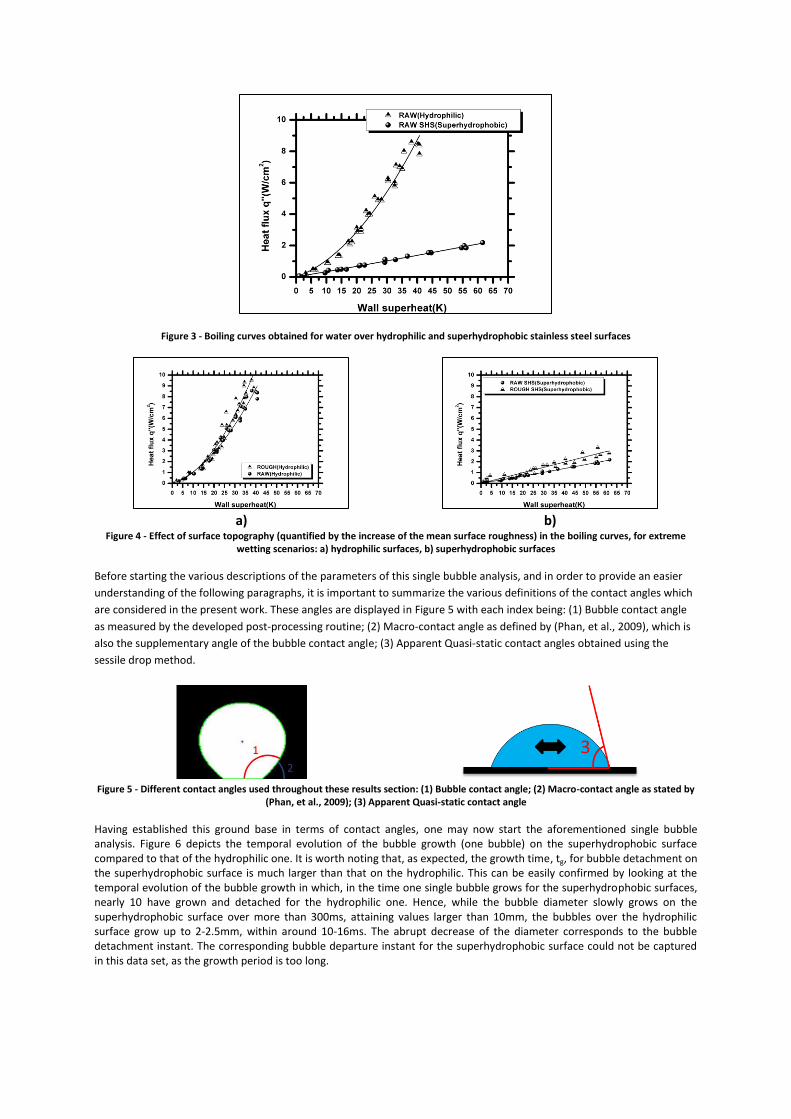
Figure 3 - Boiling curves obtained for water over hydrophilic and superhydrophobic stainless steel surfaces
a) b)
Figure 4 - Effect of surface topography (quantified by the increase of the mean surface roughness) in the boiling curves, for extreme wetting scenarios: a) hydrophilic surfaces, b) superhydrophobic surfaces
Before starting the various descriptions of the parameters of this single bubble analysis, and in order to provide an easier
understanding of the following paragraphs, it is important to summarize the various definitions of the contact angles which
are considered in the present work. These angles are displayed in Figure 5 with each index being: (1) Bubble contact angle
as measured by the developed post-processing routine; (2) Macro-contact angle as defined by (Phan, et al., 2009), which is
also the supplementary angle of the bubble contact angle; (3) Apparent Quasi-static contact angles obtained using the
sessile drop method.
Figure 5 - Different contact angles used throughout these results section: (1) Bubble contact angle; (2) Macro-contact angle as stated by
(Phan, et al., 2009); (3) Apparent Quasi-static contact angle
Having established this ground base in terms of contact angles, one may now start the aforementioned single bubble analysis. Figure 6 depicts the temporal evolution of the bubble growth (one bubble) on the superhydrophobic surface compared to that of the hydrophilic one. It is worth noting that, as expected, the growth time, tg, for bubble detachment on the superhydrophobic surface is much larger than that on the hydrophilic. This can be easily confirmed by looking at the temporal evolution of the bubble growth in which, in the time one single bubble grows for the superhydrophobic surfaces, nearly 10 have grown and detached for the hydrophilic one. Hence, while the bubble diameter slowly grows on the superhydrophobic surface over more than 300ms, attaining values larger than 10mm, the bubbles over the hydrophilic surface grow up to 2-2.5mm, within around 10-16ms. The abrupt decrease of the diameter corresponds to the bubble detachment instant. The corresponding bubble departure instant for the superhydrophobic surface could not be captured in this data set, as the growth period is too long.
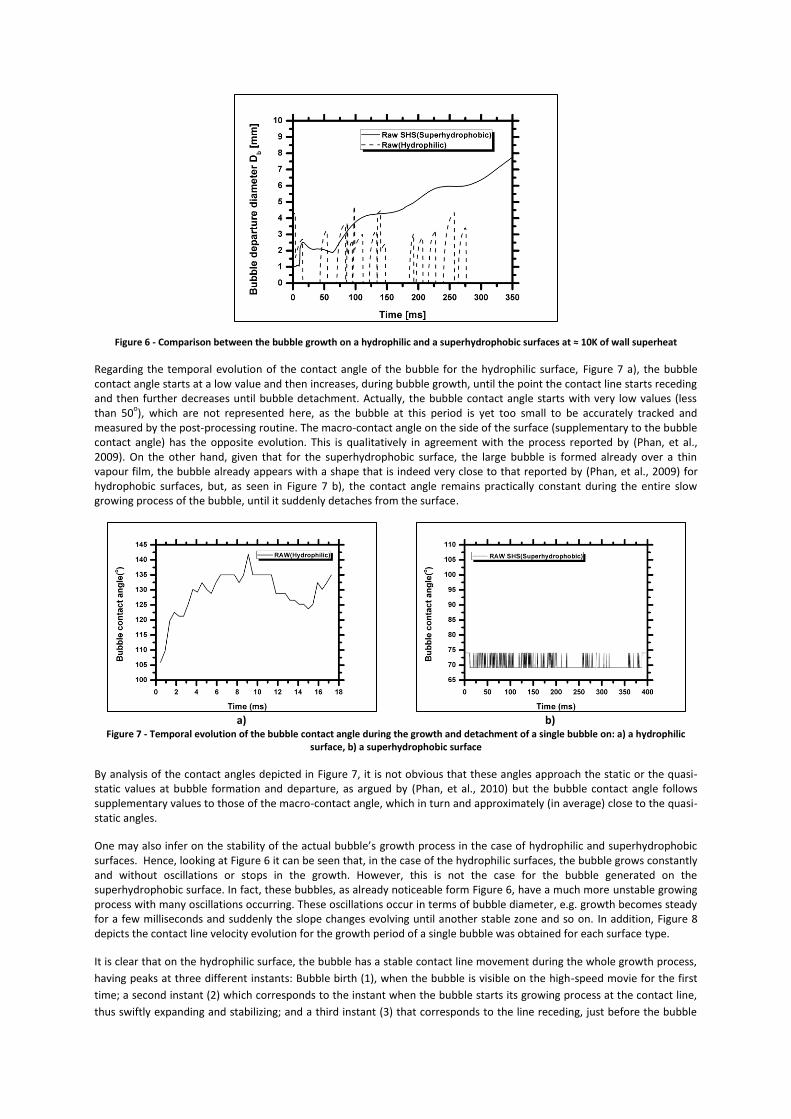
Figure 6 - Comparison between the bubble growth on a hydrophilic and a superhydrophobic surfaces at ≈ 10K of wall superheat
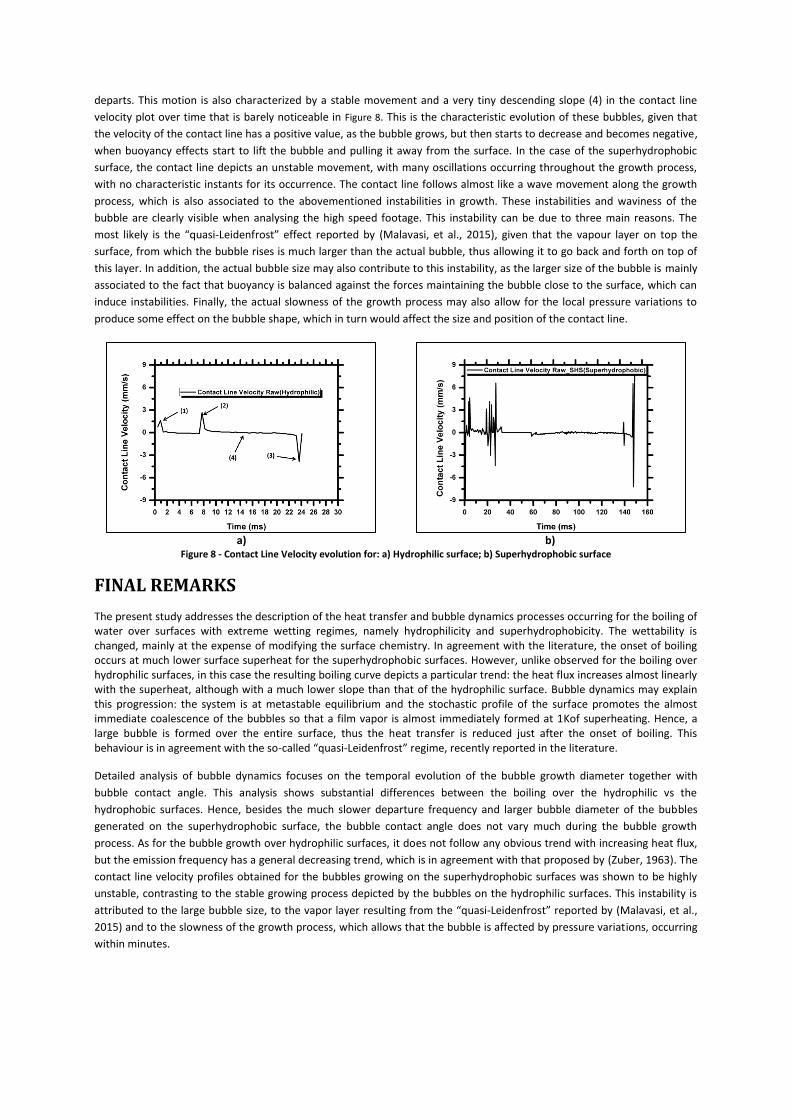
Regarding the temporal evolution of the contact angle of the bubble for the hydrophilic surface, Figure 7 a), the bubble contact angle starts at a low value and then increases, during bubble growth, until the point the contact line starts receding and then further decreases until bubble detachment. Actually, the bubble contact angle starts with very low values (less than 50
o), which are not represented here, as the bubble at this period is yet too small to be accurately tracked and
measured by the post-processing routine. The macro-contact angle on the side of the surface (supplementary to the bubble contact angle) has the opposite evolution. This is qualitatively in agreement with the process reported by (Phan, et al., 2009). On the other hand, given that for the superhydrophobic surface, the large bubble is formed already over a thin vapour film, the bubble already appears with a shape that is indeed very close to that reported by (Phan, et al., 2009) for hydrophobic surfaces, but, as seen in Figure 7 b), the contact angle remains practically constant during the entire slow growing process of the bubble, until it suddenly detaches from the surface.
a) b)
Figure 7 - Temporal evolution of the bubble contact angle during the growth and detachment of a single bubble on: a) a hydrophilic surface, b) a superhydrophobic surface
By analysis of the contact angles depicted in Figure 7, it is not obvious that these angles approach the static or the quasi-static values at bubble formation and departure, as argued by (Phan, et al., 2010) but the bubble contact angle follows supplementary values to those of the macro-contact angle, which in turn and approximately (in average) close to the quasi-static angles.
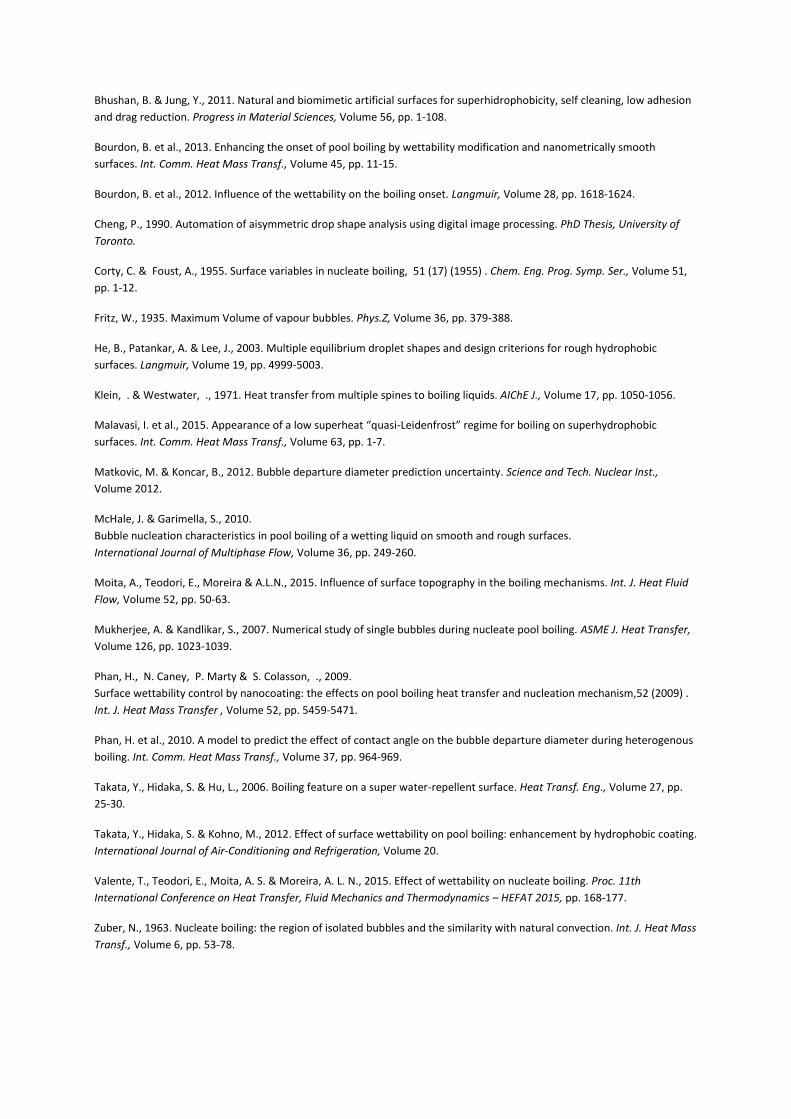
One may also infer on the stability of the actual bubble’s growth process in the case of hydrophilic and superhydrophobic surfaces. Hence, looking at Figure 6 it can be seen that, in the case of the hydrophilic surfaces, the bubble grows constantly and without oscillations or stops in the growth. However, this is not the case for the bubble generated on the superhydrophobic surface. In fact, these bubbles, as already noticeable form Figure 6, have a much more unstable growing process with many oscillations occurring. These oscillations occur in terms of bubble diameter, e.g. growth becomes steady for a few milliseconds and suddenly the slope changes evolving until another stable zone and so on. In addition, Figure 8 depicts the contact line velocity evolution for the growth period of a single bubble was obtained for each surface type.
It is clear that on the hydrophilic surface, the bubble has a stable contact line movement during the whole growth process,
having peaks at three different instants: Bubble birth (1), when the bubble is visible on the high-speed movie for the first
time; a second instant (2) which corresponds to the instant when the bubble starts its growing process at the contact line,
thus swiftly expanding and stabilizing; and a third instant (3) that corresponds to the line receding, just before the bubble
departs. This motion is also characterized by a stable movement and a very tiny descending slope (4) in the contact line
velocity plot over time that is barely noticeable in Figure 8. This is the characteristic evolution of these bubbles, given that
the velocity of the contact line has a positive value, as the bubble grows, but then starts to decrease and becomes negative,
when buoyancy effects start to lift the bubble and pulling it away from the surface. In the case of the superhydrophobic
surface, the contact line depicts an unstable movement, with many oscillations occurring throughout the growth process,
with no characteristic instants for its occurrence. The contact line follows almost like a wave movement along the growth
process, which is also associated to the abovementioned instabilities in growth. These instabilities and waviness of the
bubble are clearly visible when analysing the high speed footage. This instability can be due to three main reasons. The
most likely is the “quasi-Leidenfrost” effect reported by (Malavasi, et al., 2015), given that the vapour layer on top the
surface, from which the bubble rises is much larger than the actual bubble, thus allowing it to go back and forth on top of
this layer. In addition, the actual bubble size may also contribute to this instability, as the larger size of the bubble is mainly
associated to the fact that buoyancy is balanced against the forces maintaining the bubble close to the surface, which can
induce instabilities. Finally, the actual slowness of the growth process may also allow for the local pressure variations to
produce some effect on the bubble shape, which in turn would affect the size and position of the contact line.
a) b)
Figure 8 - Contact Line Velocity evolution for: a) Hydrophilic surface; b) Superhydrophobic surface
FINAL REMARKS
The present study addresses the description of the heat transfer and bubble dynamics processes occurring for the boiling of water over surfaces with extreme wetting regimes, namely hydrophilicity and superhydrophobicity. The wettability is changed, mainly at the expense of modifying the surface chemistry. In agreement with the literature, the onset of boiling occurs at much lower surface superheat for the superhydrophobic surfaces. However, unlike observed for the boiling over hydrophilic surfaces, in this case the resulting boiling curve depicts a particular trend: the heat flux increases almost linearly with the superheat, although with a much lower slope than that of the hydrophilic surface. Bubble dynamics may explain this progression: the system is at metastable equilibrium and the stochastic profile of the surface promotes the almost immediate coalescence of the bubbles so that a film vapor is almost immediately formed at 1Kof superheating. Hence, a large bubble is formed over the entire surface, thus the heat transfer is reduced just after the onset of boiling. This behaviour is in agreement with the so-called “quasi-Leidenfrost” regime, recently reported in the literature.
Detailed analysis of bubble dynamics focuses on the temporal evolution of the bubble growth diameter together with
bubble contact angle. This analysis shows substantial differences between the boiling over the hydrophilic vs the
hydrophobic surfaces. Hence, besides the much slower departure frequency and larger bubble diameter of the bubbles
generated on the superhydrophobic surface, the bubble contact angle does not vary much during the bubble growth
process. As for the bubble growth over hydrophilic surfaces, it does not follow any obvious trend with increasing heat flux,
but the emission frequency has a general decreasing trend, which is in agreement with that proposed by (Zuber, 1963). The
contact line velocity profiles obtained for the bubbles growing on the superhydrophobic surfaces was shown to be highly
unstable, contrasting to the stable growing process depicted by the bubbles on the hydrophilic surfaces. This instability is
attributed to the large bubble size, to the vapor layer resulting from the “quasi-Leidenfrost” reported by (Malavasi, et al.,
2015) and to the slowness of the growth process, which allows that the bubble is affected by pressure variations, occurring
within minutes.

NOMENCLATURE
Latin letters
"q [W/cm
2] Heat flux
Db [Hz] Bubble departure diameter
Cp [J/kgK] Specific heat
fb [Hz] Bubble emission frequency
hfg [kJ/kg] Latent heat of evaporation
K [W/(mK)] Thermal conductivity
Lc [mm] Characteristic length (capillary length)
Ra [μm] Surface mean roughness
Rz [μm] Surface peak-to-valley roughness
T [oC] Temperature
Greek symbols
μ [Ns/m2] Dynamic viscosity
θadv [o] Quasi-static advancing contact angle
θrec [o] Quasi-static receding contact angle
θe [o] Apparent equilibrium contact angle
ρ [kg/m3] Density
σ [N/m] Liquid surface tension
Subscripts
B Bubble
e Equilibrium
L Liquid
V Vapour
ACKNOWLEDGEMENTS
The authors are grateful to Fundação para a Ciência e a Tecnologia (FCT) for partially financing the research under the framework of the project RECI/EMS-SIS/0147/2012 and for supporting T. Valente with a research fellowship.
REFERENCES
Antonini, C., Amirfazli, A. & Marengo, M., 2012. Drop impact and wettability:from hydrophilic to superhydrophobic
surfaces. Phys. Fluids, Volume 24.
Betz, A., Jenkins, J., Kim, C. & Attinger, D., 2013. Boiling heat transfer on superhydrophobic, superhydrophilic, and
superbiphilic surfaces. Int. J. Heat Mass Transf., Volume 57, pp. 733-741.
Bhushan, B. & Jung, Y., 2011. Natural and biomimetic artificial surfaces for superhidrophobicity, self cleaning, low adhesion
and drag reduction. Progress in Material Sciences, Volume 56, pp. 1-108.
Bourdon, B. et al., 2013. Enhancing the onset of pool boiling by wettability modification and nanometrically smooth
surfaces. Int. Comm. Heat Mass Transf., Volume 45, pp. 11-15.
Bourdon, B. et al., 2012. Influence of the wettability on the boiling onset. Langmuir, Volume 28, pp. 1618-1624.
Cheng, P., 1990. Automation of aisymmetric drop shape analysis using digital image processing. PhD Thesis, University of
Toronto.
Corty, C. & Foust, A., 1955. Surface variables in nucleate boiling, 51 (17) (1955) . Chem. Eng. Prog. Symp. Ser., Volume 51,
pp. 1-12.
Fritz, W., 1935. Maximum Volume of vapour bubbles. Phys.Z, Volume 36, pp. 379-388.
He, B., Patankar, A. & Lee, J., 2003. Multiple equilibrium droplet shapes and design criterions for rough hydrophobic
surfaces. Langmuir, Volume 19, pp. 4999-5003.
Klein, . & Westwater, ., 1971. Heat transfer from multiple spines to boiling liquids. AIChE J., Volume 17, pp. 1050-1056.
Malavasi, I. et al., 2015. Appearance of a low superheat “quasi-Leidenfrost” regime for boiling on superhydrophobic
surfaces. Int. Comm. Heat Mass Transf., Volume 63, pp. 1-7.
Matkovic, M. & Koncar, B., 2012. Bubble departure diameter prediction uncertainty. Science and Tech. Nuclear Inst.,
Volume 2012.
McHale, J. & Garimella, S., 2010.
Bubble nucleation characteristics in pool boiling of a wetting liquid on smooth and rough surfaces.
International Journal of Multiphase Flow, Volume 36, pp. 249-260.
Moita, A., Teodori, E., Moreira & A.L.N., 2015. Influence of surface topography in the boiling mechanisms. Int. J. Heat Fluid
Flow, Volume 52, pp. 50-63.
Mukherjee, A. & Kandlikar, S., 2007. Numerical study of single bubbles during nucleate pool boiling. ASME J. Heat Transfer,
Volume 126, pp. 1023-1039.
Phan, H., N. Caney, P. Marty & S. Colasson, ., 2009.
Surface wettability control by nanocoating: the effects on pool boiling heat transfer and nucleation mechanism,52 (2009) .
Int. J. Heat Mass Transfer , Volume 52, pp. 5459-5471.
Phan, H. et al., 2010. A model to predict the effect of contact angle on the bubble departure diameter during heterogenous
boiling. Int. Comm. Heat Mass Transf., Volume 37, pp. 964-969.
Takata, Y., Hidaka, S. & Hu, L., 2006. Boiling feature on a super water-repellent surface. Heat Transf. Eng., Volume 27, pp.
25-30.
Takata, Y., Hidaka, S. & Kohno, M., 2012. Effect of surface wettability on pool boiling: enhancement by hydrophobic coating.
International Journal of Air‐Conditioning and Refrigeration, Volume 20.
Valente, T., Teodori, E., Moita, A. S. & Moreira, A. L. N., 2015. Effect of wettability on nucleate boiling. Proc. 11th
International Conference on Heat Transfer, Fluid Mechanics and Thermodynamics – HEFAT 2015, pp. 168-177.
Zuber, N., 1963. Nucleate boiling: the region of isolated bubbles and the similarity with natural convection. Int. J. Heat Mass
Transf., Volume 6, pp. 53-78.


![Flow boiling heat transfer of HFO1234yf and HFC32 ... boiling heat transfer of... · boiling heat transfer coefficient is calculated from the pool boiling correlation of Cooper [7]](https://img.pdfslide.us/doc/110x75/6060f16e796df51c036c4972/flow-boiling-heat-transfer-of-hfo1234yf-and-hfc32-boiling-heat-transfer-of.jpg)