Embed Size (px)
Citation preview

Study of the different strategies implemented by
Ethanol Europe Renewable ltd in order to strive
in the European fast-changing political framework
A thesis submitted to the Department of Environmental Sciences and Policy
of Central European University in part fulfilment of the Degree of
Master of Science
Bruno Deremince
Mentor
Dr Michael Labelle
Academic year
2015 - 2016
CE
UeT
DC
olle
ctio
n

Notes on copyright and the ownership of
intellectual property rights
• Copyright in text of this thesis rests with the Author. Copies (by any process) eitherin full, or of extracts, may be made only in accordance with instructions given bythe Author and lodged in the Central European University Library. Details may beobtained from the Librarian. This page must form part of any such copies made.Further copies (by any process) of copies made in accordance with such instructionsmay not be made without the permission (in writing) of the Author.
• The ownership of any intellectual property rights which may be described in this thesisis vested in the Central European University, subject to any prior agreement to thecontrary, and may not be made available for use by third parties without the writtenpermission of the University, which will prescribe the terms and conditions of any suchagreement.
• For bibliographic and reference purposes this thesis should be referred to as:
Deremince, B. 2016. Study of the different strategies implemented by EthanolEurope Renewable ltd in order to strive in the European fast-changing po-litical framework. Master of Science thesis, Central European University,Budapest.
Further information on the conditions under which disclosures and exploitation may takeplace is available from the Head of the Department of Environmental Sciences and Policy,Central European University
ii
CE
UeT
DC
olle
ctio
n

Author’s declaration
No portion of the work referred to in this thesis has been submitted in support of an appli-cation for another degree or qualification of this or any other university or other institute oflearning.
Bruno Deremince
iii
CE
UeT
DC
olle
ctio
n

Acknowledgements
My year at CEU was one of the greatest year of my life, and a truly life-changing experience.I met so many great people, made so many new experiences! I also had the opportunity tolive in Budapest, a unique and romantic city in Eastern Europe. I am very grateful to thosewho helped and supported me in order to make it happen: I would like to thank EmmelineE. in particular, for all the support and gratitude she provides me every day, and GilbertD., for believing in me.
Bruno
iv
CE
UeT
DC
olle
ctio
n

The Central European University
ABSTRACT OF THESIS submitted by Bruno DEREMINCE for the degree of Master of Science andentitled:
Study of the different strategies implemented by Ethanol Europe Renewable ltd in order to strive
in the European fast-changing political framework
Month and Year of submission: July 2016
Road transportation is still today largely dependent on fossil fuels, and has grown to become one ofthe sector releasing the most GHG emissions in the EU. There are only a few alternatives to decarbonisetransport, of which biofuels is the only available on the market today. Biofuels production has been stimulatedin the EU starting in 2003 with the biofuels directive and minimum quotas. However the political frameworkrapidly changed and imposed maximum targets for conventional biofuels with the CEP (Climate and EnergyPackage) amendments in 2012 and the ILUC (Indirect Land Use Change) directive in 2015. These capsinclude all conventional biofuels in an undifferentiated manner, which is in direct contrast of their extremelyvariable economic and environmental performances. Conventional biofuels producers have been largelyimpacted by this political shift. This thesis analyses the impact of EU policies on Ethanol Europe, one ofthe largest producer of renewable ethanol in Europe. It then identifies and analyses the different strategiesimplemented by Ethanol Europe and contextualises them within the biofuel debate via interviews of EthanolEurope’s representatives, EU policy-makers and representatives of environmental NGOS active at the EUlevel.
This work identifies two main strategies implemented by Ethanol Europe: lobbying activities in Brussels,and research & development. Concerning lobbying activities, five arguments in favour of bioethanol areidentified and then confronted with the opinions of policy-makers and eNGO. The unknowns and complexitiesof implementing a more efficient policy framework are then addressed. Concerning research and development,identified activities include the valorisation of existing by-products in ethanol production, the conquest ofnew sectors other than biofuels (bioplastics, pharmaceutics) as well as the development of advanced biofuels.The strategy adopted by Ethanol Europe is then discussed in relation with different elements of the biofueldebate such as the complexity of science concerning biofuels, public image of the industry, timing of futurelegislation and predictions, and relation with other industries. This thesis concludes that the current politicalframework threatens Ethanol Europe and the bioethanol industry, and that this is the result of a sharedresponsibility between policy-makers (not able to protect biofuels with great environmental performance),NGO (delivering oversimplified messages) and the bioethanol industry (shares interests with the BD industryand is not willing to differentiate itself from it). Other threats identified include the scarcity of diesel inEurope and global competition. Ethanol Europe in particular is threatened by the inherent variability ofits technological development, which might prove unsuccessful. This work identifies the carbon intensityapproach as a potential fix for the current political framework, but estimates it as unlikely because of thepolitical difficulties it creates, the lack of coordination between bioethanol producers, and the complexity ofthe biofuel debate.
Keywords: biofuels, bioethanol, renewable fuel, Ethanol Europe, Pannonia Ethanol, policy, lobbyingactivities, technological patents
v
CE
UeT
DC
olle
ctio
n

Contents
Notes on copyright and the ownership of intellectual property rights . . . . . . . . iiAuthor’s declaration . . . . . . . . . . . . . . . . . . . . . . . . . . . . . . . . . . iiiAcknowledgements . . . . . . . . . . . . . . . . . . . . . . . . . . . . . . . . . . . ivAbstract . . . . . . . . . . . . . . . . . . . . . . . . . . . . . . . . . . . . . . . . . vList of Abbreviations . . . . . . . . . . . . . . . . . . . . . . . . . . . . . . . . . . viii
List of Figures ix
List of Tables x
1 Introduction 11.1 Background . . . . . . . . . . . . . . . . . . . . . . . . . . . . . . . . . . . . 11.2 Aims and objectives . . . . . . . . . . . . . . . . . . . . . . . . . . . . . . . 31.3 Structure outline . . . . . . . . . . . . . . . . . . . . . . . . . . . . . . . . . 4
2 Literature review 62.1 What are biofuels . . . . . . . . . . . . . . . . . . . . . . . . . . . . . . . . . 7
2.1.1 Renewable Ethanol . . . . . . . . . . . . . . . . . . . . . . . . . . . . 92.2 The policy background . . . . . . . . . . . . . . . . . . . . . . . . . . . . . . 10
2.2.1 The main policy drivers . . . . . . . . . . . . . . . . . . . . . . . . . 102.2.1.1 Energy security . . . . . . . . . . . . . . . . . . . . . . . . . 112.2.1.2 Rural development . . . . . . . . . . . . . . . . . . . . . . . 122.2.1.3 Environmental preservation . . . . . . . . . . . . . . . . . . 12
2.2.1.3.1 indirect land use change . . . . . . . . . . . . . . . 132.2.1.4 the food vs fuel debate . . . . . . . . . . . . . . . . . . . . . 15
2.2.2 The European political evolution concerning biofuels . . . . . . . . . 172.2.2.1 The emergence of biofuels policy in Europe . . . . . . . . . 172.2.2.2 The biofuels directive (2003/30/EC) . . . . . . . . . . . . . 202.2.2.3 The evolution of the biofuel directive . . . . . . . . . . . . . 222.2.2.4 The Climate and Energy package . . . . . . . . . . . . . . . 24
2.2.2.4.1 The renewable energy directive (2009/28/EC) . . . 242.2.2.4.2 The fuel quality directive (2009/30/EC) . . . . . . 28
2.2.2.5 The evolution of the Climate and Energy package . . . . . . 292.2.2.6 The amendments of the RED and FQD . . . . . . . . . . . 312.2.2.7 The ILUC directive (2015/1513) . . . . . . . . . . . . . . . 342.2.2.8 Summary . . . . . . . . . . . . . . . . . . . . . . . . . . . . 352.2.2.9 The state of the European biofuel policy framework today . 37
vi
CE
UeT
DC
olle
ctio
n

CONTENTS vii
3 Methodology 393.1 Field methods . . . . . . . . . . . . . . . . . . . . . . . . . . . . . . . . . . . 40
3.1.1 Data gathering . . . . . . . . . . . . . . . . . . . . . . . . . . . . . . 403.1.1.1 Interviews . . . . . . . . . . . . . . . . . . . . . . . . . . . . 403.1.1.2 Policy review . . . . . . . . . . . . . . . . . . . . . . . . . . 433.1.1.3 Other document and events . . . . . . . . . . . . . . . . . . 43
3.1.2 Analysis . . . . . . . . . . . . . . . . . . . . . . . . . . . . . . . . . . 443.1.3 Quality of data . . . . . . . . . . . . . . . . . . . . . . . . . . . . . . 44
3.2 Deficiencies and limitations of the study . . . . . . . . . . . . . . . . . . . . 45
4 Results 474.1 Background informations . . . . . . . . . . . . . . . . . . . . . . . . . . . . . 474.2 Ethanol Europe’s story . . . . . . . . . . . . . . . . . . . . . . . . . . . . . . 484.3 Ethanol Europe’s reaction . . . . . . . . . . . . . . . . . . . . . . . . . . . . 51
4.3.1 Lobbying activities . . . . . . . . . . . . . . . . . . . . . . . . . . . . 524.3.1.1 ePURE . . . . . . . . . . . . . . . . . . . . . . . . . . . . . 524.3.1.2 Direct lobbying . . . . . . . . . . . . . . . . . . . . . . . . . 54
4.3.2 The argument of the bioethanol industry . . . . . . . . . . . . . . . . 554.3.2.1 GHG savings . . . . . . . . . . . . . . . . . . . . . . . . . . 554.3.2.2 The use of irrelevant and outdated data . . . . . . . . . . . 574.3.2.3 The EU’s unbalanced fuel taxation . . . . . . . . . . . . . . 604.3.2.4 Economic benefits . . . . . . . . . . . . . . . . . . . . . . . 624.3.2.5 The generalised approach towards conventional biofuels . . . 64
4.3.3 The perfect policy framework . . . . . . . . . . . . . . . . . . . . . . 674.3.4 Other strategies . . . . . . . . . . . . . . . . . . . . . . . . . . . . . . 71
4.3.4.1 Research and development . . . . . . . . . . . . . . . . . . . 714.3.4.2 Valorisation of ethanol production by-products . . . . . . . 744.3.4.3 Conquest of sectors external to biofuels production . . . . . 76
5 Discussion 77
6 Conclusion 87
A Additional figure 95
B Continuation of the calculation of biofuels greenhouse gas impact 96
C Platt’s Index 97
D Example of a questions list for an interview 98
CE
UeT
DC
olle
ctio
n
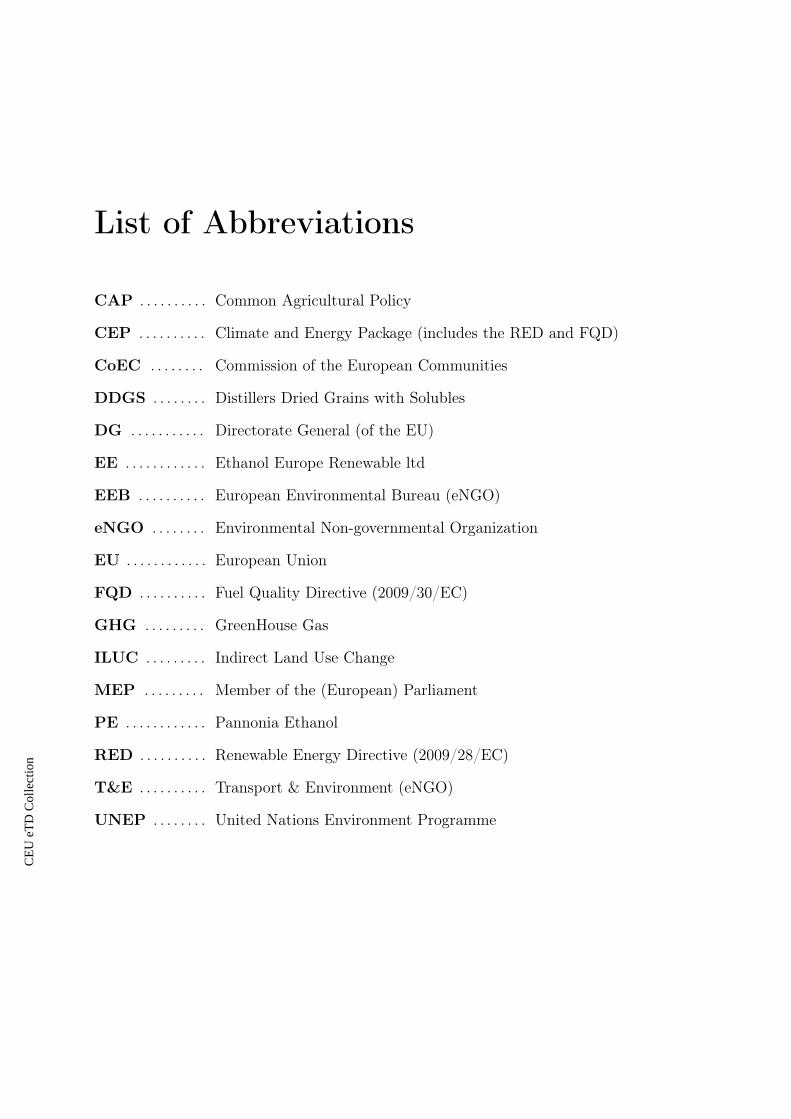
List of Abbreviations
CAP . . . . . . . . . . Common Agricultural Policy
CEP . . . . . . . . . . Climate and Energy Package (includes the RED and FQD)
CoEC . . . . . . . . Commission of the European Communities
DDGS . . . . . . . . Distillers Dried Grains with Solubles
DG . . . . . . . . . . . Directorate General (of the EU)
EE . . . . . . . . . . . . Ethanol Europe Renewable ltd
EEB . . . . . . . . . . European Environmental Bureau (eNGO)
eNGO . . . . . . . . Environmental Non-governmental Organization
EU . . . . . . . . . . . . European Union
FQD . . . . . . . . . . Fuel Quality Directive (2009/30/EC)
GHG . . . . . . . . . GreenHouse Gas
ILUC . . . . . . . . . Indirect Land Use Change
MEP . . . . . . . . . Member of the (European) Parliament
PE . . . . . . . . . . . . Pannonia Ethanol
RED . . . . . . . . . . Renewable Energy Directive (2009/28/EC)
T&E . . . . . . . . . . Transport & Environment (eNGO)
UNEP . . . . . . . . United Nations Environment Programme
CE
UeT
DC
olle
ctio
n

List of Figures
2.1 Share of global renewable ethanol production in 2014 (ePURE 2015) . . . . . 72.2 Illustration of the industrial process of Pannonia Ethanol (data from (Sievers
2016; PE 2016b)) . . . . . . . . . . . . . . . . . . . . . . . . . . . . . . . . . 102.3 EU renewable ethanol production by end-use (ePURE 2015) . . . . . . . . . 112.4 EU28 greenhouse gas emissions by sector and mode of transport in 2012 (EC
2016) . . . . . . . . . . . . . . . . . . . . . . . . . . . . . . . . . . . . . . . . 122.5 Impact Assessment accompanying the ILUC proposal (Defossez et al. 2014) . 152.6 Forecast change in greenhouse gas emissions for EU25, period 2005-2020 (Mt
per year, CO2 only) (CoEC 2007a) . . . . . . . . . . . . . . . . . . . . . . . 232.7 GHG emissions related to land-use change for maize bioethanol and soya
biodiesel (EU 2010) . . . . . . . . . . . . . . . . . . . . . . . . . . . . . . . . 302.8 Origin of final biofuels consumed in the EU in 2010 (EU 2013) . . . . . . . . 34
4.1 A view of Pannonia Ethanol’s biorefinery in Dunaföldvár, Hungary (PE 2016) 484.2 The aborted biorefinery project of Ethanol Europe in Mohács, Hungary (Reng
2016) . . . . . . . . . . . . . . . . . . . . . . . . . . . . . . . . . . . . . . . . 504.3 Internal working structure of ePURE (adapted from (ePURE’s rep. 2016;
ePURE 2016) . . . . . . . . . . . . . . . . . . . . . . . . . . . . . . . . . . . 534.4 Average oil and ethanol GHG emission in Europe along with the associated
GHG savings and their predicted evolution (data adapted from (PE 2016b;Sievers 2016)) . . . . . . . . . . . . . . . . . . . . . . . . . . . . . . . . . . . 56
4.5 Taxation of transport fuels by energy content (ePURE 2015) . . . . . . . . . 614.6 Emissions from biofuels made from different feedstocks, composed of direct
emissions (from Renewable Energy Directive) and land-use change emissions(from Mirage and Globiom studies) (T&E 2016d) . . . . . . . . . . . . . . . 65
4.7 Schematisation of the two different processes of the patent ‘Production ofbiofuels from tissue culture sources’ filed by Naturally Scientific ltd in 2009 . 73
A.1 Greenhouse gas savings of biofuels compared to fossil fuels (UNEP 2009) . . 95
C.1 Evolution of the Platt’s index concerning ethanol since 2006 (data obtainedvia Ethanol Europe) . . . . . . . . . . . . . . . . . . . . . . . . . . . . . . . 97
CE
UeT
DC
olle
ctio
n

List of Tables
2.1 The different factors included in the calculation of biofuels GHG emissions(EU 2009a) . . . . . . . . . . . . . . . . . . . . . . . . . . . . . . . . . . . . 27
4.1 The production of Ethanol Europe (Reng 2016) . . . . . . . . . . . . . . . . 51
x
CE
UeT
DC
olle
ctio
n

Chapter 1
Introduction
1.1 Background
‘Biofuels’ is a generic term that refers to ‘gas and liquid fuels produced from biomass that
can be used in combustion engines’ (Demirbas 2008). Biofuels have been considered as a
suitable fuel for cars since a long time in Europe: peanut oil for example was used in late
XVIII by Rudolf Diesel in order to run his new engine, while Henry Ford used ethanol to run
its model T (Ackrill and Kay 2014). However biofuels were abandoned due to the abundance
of cheap fossil fuels, starting in the 1960s. Since then, the use of biofuels in Europe has been
informally re-introduced in 1992 in a CAP directive (the Council of European Communities
1992), and their production truly started in 2003 after the introduction of the biofuel directive
(EU 2003). Biofuels were at that moment considered a prominent mean in order to help
Europe to reach its climatic goals in the 2009 Climate and Energy package (EU 2009a; EU
2009b).
Since then however, the political framework rapidly changed: major amendments to the
Climate and Energy package emerged in 2012, imposing an undifferentiated cap of 5% on
all food-based biofuels (including bioethanol and biodiesel) (EU 2009a). Those amendments
were formulated to avoid two potential consequences related to food-based biofuels produc-
tion: the first one is the influence those biofuels might have on food prices, known as the
1
CE
UeT
DC
olle
ctio
n

CHAPTER 1. INTRODUCTION 2
‘the food vs fuel’ debate. Because of the correlation between the start of biofuel production
(the Climate and Energy package was formulated in 2009) and the food crisis of 2008-2009
and its rapidly raising food prices, the impact of biofuel on feedstock prices was considered
significant by many (Nikos 2008; Alavi Hojjat 2009). Even if now the impact is considered
marginal by the EU (a few percent, (EC 2012)), the food crisis made the issue politically sen-
sitive and highly controversial. The second consequence is related to the compensating effect
of reallocating arable lands in Europe from food to biofuel production. This phenomenon
creates an incentive for farmers to compensate for this lack of food on the global market by
using new lands to produce food. This effect is happening mainly in third countries with
lower environmental standards, which often results in deforestation (Defossez et al. 2014).
This effect is known as ‘Indirect Land Use Change’, or ILUC.
The influence of biofuel production on food prices and the ILUC effect both lead to the
so-called ILUC directive in 2015, which set a cap of 7% on conventional biofuel production
within the 10% target of renewable energy in the transportation sector, which Member
States are free to restrict even further (EU 2015). In 12 years biofuels have thus gone from
a promising tool to decarbonise transport to a technology with huge potential risks that
needs to evolve in order to not be phased-out in the near future. Such a quick political shift
has had devastating consequences on the European biofuel industries: since 2012 the sector
is showing little to no sign of new investments (Sievers 2016). Even though the European
Commission is strongly promoting the development of advanced biofuels, which are less
prone to influencing food prices and provoke ILUC, it did not introduce mandatory targets
for advanced biofuels as a share in the energy used for transportation in Europe yet. The
European biofuel industry is thus paralysed by the uncertainty about whether or not there
will be a market for biofuels and advanced biofuels after 2020 (Reng 2016).CE
UeT
DC
olle
ctio
n

CHAPTER 1. INTRODUCTION 3
1.2 Aims and objectives
This thesis focuses on Ethanol Europe Renewable ltd, a major bioethanol industry based in
Hungary. It aims to answer the following question:
How does the bioethanol-producer Ethanol Europe Renewable ltd (referred to later
as ‘Ethanol Europe’) adapt to the quickly changing regulatory framework in Eu-
rope in order to strive in the future?
This research question involves many objectives, listed below:
• a thorough review of the political evolution in Europe concerning biofuels, starting in
1985;
• the identification of the main drivers of the political change in Europe concerning
conventional biofuels and advanced biofuels;
• an analysis of the impact of the political change on Ethanol Europe and its develop-
ment;
• the identification and analysis of the different strategies implemented by Ethanol Eu-
rope in reaction to the new legislative framework;
• the contextualisation of Ethanol Europe’s strategies within the biofuel debate.
Many studies and books analysed the European political evolution concerning biofuels,
some of them are used in this thesis such as (Ackrill and Kay 2014; Domingos Padula et al.
2014; Demirbas 2008; Kutas et al. 2007). However there is little research on the practical
incidence that such a quick political change has had on specific industries. Furthermore
no academic study concerning Ethanol Europe and its adaptations strategies has been con-
ducted yet. This thesis aims to fill that gap.
The study of practical consequences of political changes is crucial in the European biofuels
market. Indeed transportation in Europe is the only sector which saw its GHG emissions
CE
UeT
DC
olle
ctio
n

CHAPTER 1. INTRODUCTION 4
rise during last years: GHG emissions increased by 36% between 1990 and 2007, while GHG
emissions from other sectors decreased by 15% during the same period (EC 2016). Given
that biofuels and especially bioethanol can provide significant GHG emissions reduction
compared to their fossil equivalent, biofuels could therefore bioethanol a suitable option to
decarbonise transport in the short and mid-term. This is especially true since biofuels can
be used in internal combustion engines, which are by far predominant today compared to
the alternatives such as electric engines (Domingos Padula et al. 2014). Failing to seriously
consider options such as bioethanol to decrease emissions originating from transport might
threaten the EU’s ability to reach its climatic objectives. A thorough understanding of the
practical consequences of past political actions on specific industry such as Ethanol Europe
is thus crucial to improve our understanding and create a more efficient political framework
in the future. This is especially true today, as the revision of the Renewable Energy Directive
(RED) is expected later this year (2016). This revision is expected to clarify the EU opinion
towards conventional and advanced biofuels, via the creation or the absence of mandatory
goals for advanced and conventional biofuels for the horizon 2030.
1.3 Structure outline
In order to achieve the aim of this thesis as well as its different objectives, this work is
structured in the following way.
A literature review is conducted in chapter two. The literature review starts with a
short review of the technical specificities between the different types of biofuels, crucial
to understand the thesis development (a special focus on bioethanol is also provided). In
order to contextualise and understand the reaction of Ethanol Europe towards the changing
political framework, the chapter continues with a thorough review of the political evolution
concerning biofuels, including the concerns expressed about incidence on industries if any. A
summary of the political evolution in Europe concerning biofuels policy and a description of
the current state of the policy framework are included at the end of the chapter to facilitate
CE
UeT
DC
olle
ctio
n

CHAPTER 1. INTRODUCTION 5
reading and understanding.
Based on the literature review, the chapter three outlines the methods used during this
work to gather data and carry out the analysis. Connections to the literature review and
the thesis’ aim and objectives are drawn in order to highlight how the latter will bioethanol
reached. The chapter also highlights the study’s limitations.
The results section (chapter four) is based on data gathered in the field (see the methodol-
ogy section for more details). It aims to analyse the data and link it to the literature review,
in order to achieve the thesis’ aim and objectives. It starts with a short background section
about Ethanol Europe’s situation, and then continues with the story of Ethanol Europe
and its reaction towards the political changes. It then identifies and analyses the strategies
implemented by Ethanol Europe in order to adapt for the future. The analysis is based on a
thorough literature review as well as on the confrontation between Ethanol Europe’s opinion
with EU policy-makers and eNGOs’ opinion. Those points of view external from the firm
help to analyse the influence of Ethanol Europe on the European policy evolution and help
to get practical insights about the bigger forces at play in the biofuel sector.
Based on both the literature review and the results section, the discussion (chapter five)
section aims to discuss the current position of Ethanol Europe, as well as its potential future.
In order to achieve that goal, the chapter discusses different major elements of the biofuel
debate, their interactions with Ethanol Europe and the bioethanol industry in general. The
final chapter (chapter six) identifies key findings and draws conclusions of the work, in
relation to the thesis’ aim and objectives.
CE
UeT
DC
olle
ctio
n

Chapter 2
Literature review
In order to understand the different strategies put in place by Ethanol Europe to adapt to
the rapidly changing EU political framework, it is crucial to understand the evolution of
the political framework first. This literature review starts with identifying the three main
political drivers of biofuel policies (and their relative importance within the EU), and then
focuses on the political framework evolution when it comes to biofuels in the EU, starting
in 1986 until today. As this thesis focuses practical consequences from political change on a
single company (Ethanol Europe), concerns about potential economic incidence formulated
by the policy-makers in the different documents are included if any.
As the issues concerning biofuels include technical specificities which are crucial to under-
stand the political evolution, a short introduction about biofuels and the technical differences
existing between the different kinds and generations of biofuels is provided. An extensive
review of specific environmental issues such indirect land use change (ILUC) and the food
vs fuel debate, central in the biofuel political debate (as highlighted in the introduction), is
provided as well.
6
CE
UeT
DC
olle
ctio
n

CHAPTER 2. LITERATURE REVIEW 7
2.1 What are biofuels
Biofuels can be defined as ‘fuels extracted or fermented from organic matter’ (Ackrill and Kay
2014), or ‘liquid or gaseous fuel for transport produced from biomass’ (EU 2003). Biofuels
include a large range of products, from biodiesel to bioalcohol, biochar, synthetic oils, bio-
hydrogen and biogas (Liew, Hassim, and Ng 2014). While biofuels include a wide range of
different products, the two dominant ones today are bioethanol and biodiesel.
Ethanol and biodiesel have similar chemical properties, but ethanol is derived from sugars,
while biodiesel originates from oil (Fazal, Haseeb, and Masjuki 2011). Ethanol production in
the world is dominated by the US and Brazil, produced respectively from corn and sugarcane.
In comparison Europe is a rather small market for ethanol, where it is produced from corn
and beetroot (see figure 2.1). Ethanol is typically blended with petrol and sold as such: a
mix 10% ethanol with 90% petrol for example is called ’E10’, and is already widely available
in France, Germany, and some Nordic countries (Ethanol Nu 2016).
Figure 2.1: Share of global renewable ethanol production in 2014 (ePURE 2015)
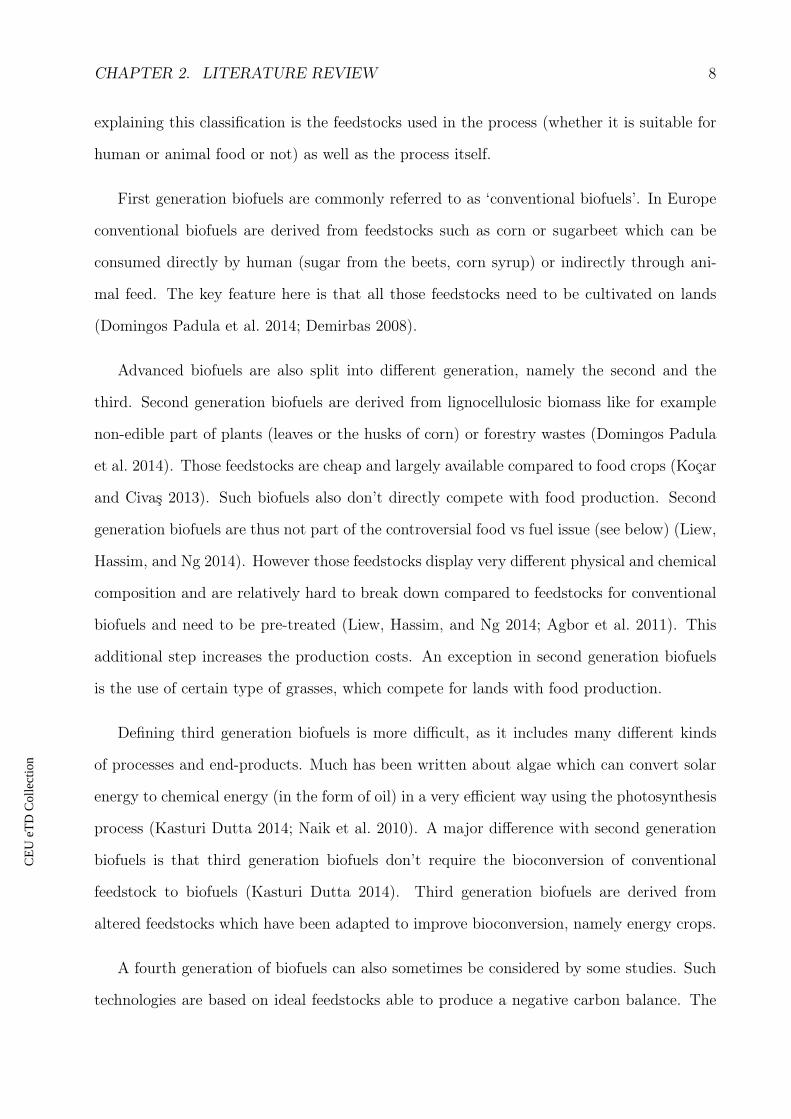
Biofuels are usually divided into first generation and advanced biofuels. The differences
CE
UeT
DC
olle
ctio
n
CHAPTER 2. LITERATURE REVIEW 8
explaining this classification is the feedstocks used in the process (whether it is suitable for
human or animal food or not) as well as the process itself.
First generation biofuels are commonly referred to as ‘conventional biofuels’. In Europe
conventional biofuels are derived from feedstocks such as corn or sugarbeet which can be
consumed directly by human (sugar from the beets, corn syrup) or indirectly through ani-
mal feed. The key feature here is that all those feedstocks need to be cultivated on lands
(Domingos Padula et al. 2014; Demirbas 2008).
Advanced biofuels are also split into different generation, namely the second and the
third. Second generation biofuels are derived from lignocellulosic biomass like for example
non-edible part of plants (leaves or the husks of corn) or forestry wastes (Domingos Padula
et al. 2014). Those feedstocks are cheap and largely available compared to food crops (Koçar
and Civaş 2013). Such biofuels also don’t directly compete with food production. Second
generation biofuels are thus not part of the controversial food vs fuel issue (see below) (Liew,
Hassim, and Ng 2014). However those feedstocks display very different physical and chemical
composition and are relatively hard to break down compared to feedstocks for conventional
biofuels and need to be pre-treated (Liew, Hassim, and Ng 2014; Agbor et al. 2011). This
additional step increases the production costs. An exception in second generation biofuels
is the use of certain type of grasses, which compete for lands with food production.
Defining third generation biofuels is more difficult, as it includes many different kinds
of processes and end-products. Much has been written about algae which can convert solar
energy to chemical energy (in the form of oil) in a very efficient way using the photosynthesis
process (Kasturi Dutta 2014; Naik et al. 2010). A major difference with second generation
biofuels is that third generation biofuels don’t require the bioconversion of conventional
feedstock to biofuels (Kasturi Dutta 2014). Third generation biofuels are derived from
altered feedstocks which have been adapted to improve bioconversion, namely energy crops.
A fourth generation of biofuels can also sometimes be considered by some studies. Such
technologies are based on ideal feedstocks able to produce a negative carbon balance. The
CE
UeT
DC
olle
ctio
n

CHAPTER 2. LITERATURE REVIEW 9
technology developments aim to produce crops with a high carbon storage capacity, and
to capture and store the carbon released during the process (Carbon Capture and Storage
technology, aka CCS) (Ackrill and Kay 2014). CCS is a key feature for delivering negative
carbon balance. It is however important to notice that such technologies hardly exist on
paper for now. Fourth generation biofuels are thus not considered in this work.
2.1.1 Renewable Ethanol
Ethanol, or ethyl-alcohol (C2H5OH), is a colourless, volatile and flammable liquid with
an alcoholic content ranging from 80 to 99.9% (ePURE 2016). Ethanol can be qualified
as renewable when it is issued from processed crops and organic material (ePURE 2016).
Ethanol is a commodity, so an economic good with no qualitative differentiation on a given
market. The main indicator to evaluate its value on a daily basis is the Platts index (the
evolution of ethanol’s price can be observed in Appendix C).
The process for producing bioethanol is complex and include many different steps: in the
case of Ethanol Europe, bioethanol is produced from corn exclusively grown in Hungary (PE
2015c). When the crops are harvested, the maize is brought to the biorefinery, then corn
grains are separated from the rest of the plant: they are then cooked and liquefied in order
to be fermented (PE 2015b). The yeast used in the fermentation process releases pure CO2,
and the solution obtained after fermentation is distilled to obtain a solution highly rich in
ethanol. The industrial process is then separated in two sections: part of the solution will
go through a molecular sieve, in order to produce ethanol at the purity needed for to export
for the market. The other part of the solution is centrifuged in order to separate the solids
lefts in the solution, which will become the Distiller’s dried grains with solubles (DDGS).
The liquid will be concentrated in an evaporator to create distillers corn oil (DCO) (PE
2015b). The input and outputs of the process are schematised in figure 2.2. The ethanol
production process of Pannonia Ethanol is ISO 9001 and 14001 certified. It is also part of
the voluntary biofuels sustainability certification scheme (Bühg) and the GMP+ feed safety
assurance scheme (PE 2016b).
CE
UeT
DC
olle
ctio
n

CHAPTER 2. LITERATURE REVIEW 10
Figure 2.2: Illustration of the industrial process of Pannonia Ethanol (data from (Sievers2016; PE 2016b))
Ethanol can be used in a multitude of way such as in the beverages and industrial sector.
In the transportation sector, it can be used as a renewable fuel. It is then usually blended
with gasoline: E5 for example is a mixture of 5% of ethanol and 95% of petrol. This is the
option mainly considered in this work and largely preferred on the market (see figure 2.3).
2.2 The policy background
2.2.1 The main policy drivers
Before exploring the lobbying activities and commercial strategies of Ethanol Europe, it
is important to understand the different drivers that stimulated the political evolution in
Europe concerning biofuel production. Three main factors are widely recognised in the
literature as the drivers for the development of biofuel policies in the world: energy security,
rural development and environmental preservation (Ackrill and Kay 2014; FAO 2008; Kutas
CE
UeT
DC
olle
ctio
n

CHAPTER 2. LITERATURE REVIEW 11
Figure 2.3: EU renewable ethanol production by end-use (ePURE 2015)
et al. 2007). Other minor drivers can also be distinguished such as agricultural development
(distinct from the rural development), technological progress and other economic concerns
such as the unknowns around the interactions between food and biofuel prices (the famous
food vs fuel debate) and biofuel competitiveness (IEA 2010).
2.2.1.1 Energy security
Road transport in Europe still depends today on fossil fuels for 96% of its energy need today
(EU 2016; EEA 2016), making the transportation field one of the major GHG emitter sector
of the European Union (see figure 2.4). However fossil fuels such as diesel need to be imported
in the EU, decreasing the energy security of supply. Given that biofuels are produced and
consumed locally, developing biofuels in order to substitute for oil in the transportation
sector (as illustrated on figure 2.3) might thus fix the situation. In Europe, officials also
stress the diversification of type of transport fuel, as it provokes a diversification of source
countries as well and thus entail the security of supply (Ackrill and Kay 2014). Please notice
CE
UeT
DC
olle
ctio
n

CHAPTER 2. LITERATURE REVIEW 12
that while Europe imports diesel, it is also a net exporter of petrol, a situation known as the
‘EU diesel deficit’. The EU diesel deficit is a crucial element in the analysis of the bioethanol
situation in Europe, as developed in the results and discussion section.
Figure 2.4: EU28 greenhouse gas emissions by sector and mode of transport in 2012 (EC2016)
2.2.1.2 Rural development
As a renewable energy, biofuel production is a part of the development of a new and decen-
tralised way of energy production. Biofuel crops such as first and second generation biofuels
are land-based and needed all year long for biofuel production, constituting guaranteed out-
comes for farmers in the form of cash crops’. In addition, biorefineries are created where
biofuels crops are grown, creating jobs in those rural areas. It was indeed estimated that for
the same energy output, the biofuel industry requires 100 times more labour than the fossil
fuel industry, more capital-intensive (Domingos Padula et al. 2014). This is mainly related to
the variety of jobs needed in the biofuel industry. Biofuel production is thus a major incentive
for rural development. Notice that according to the Organisation for Economic Cooperation
and Development (OECD) Nomenclature of Territorial Units for Statistics (NUTS), a region
is predominantly rural if the share of population living in a zone with a density below 150
inhabitants per km2 is above 50% (Eurostat 2015).
2.2.1.3 Environmental preservation
Biofuels are thought to substitute fossil fuels, cut GHG emissions and tackle climate change.
But surprisingly not all biofuels produce less GHG than their fossil fuel equivalent, and
CE
UeT
DC
olle
ctio
n

CHAPTER 2. LITERATURE REVIEW 13
those who do might see their emissions vary in time. From all three biofuel policy drivers,
the environmental one is thus considered as the more ambiguous and controversial in the
literature (Ackrill and Kay 2014; Domingos Padula et al. 2014).
There are three main reasons explaining why GHG emissions from biofuels are so hard
to accurately define. The first one is due to the large variety of technological pathways,
potential feedstocks and type of biofuels (as illustrated above). The second one is the con-
stant enhancement of the industrial processes used. The third one is different environmental
consequences biofuel production can provoke, such as land-use change. Land-use change
is a very controversial aspect of biofuel. It comes in two aspects: direct and indirect, the
latter being the most controversial. Direct land-use change, or DLUC, is defined by the
European Commission as a change of land-use according to the IPCC classification (grass-
land, wetlands, forest-land, cropland, other) plus a category for perennial crops (Ackrill and
Kay 2014). Notice that land-use change doesn’t include crop-use change, meaning that if a
European farmer growing wheat for food decides to switch and grow wheat for biofuels, it
is not considered a DLUC in the European classification.
2.2.1.3.1 indirect land use change indirect land use change, or ILUC, is a thorny
subject for academics and policy-makers especially in Europe, where its controversial aspect
was so strong that it influenced policy makers (Ackrill and Kay 2014). Indeed ILUC is not
specifically addressed in the US or Brazil. ILUC is best described as an example: if a sig-
nificant group of European farmers decide to switch from food to energy crop production,
it might create a shortage of food on the market, increasing the food prices. Farmers some-
where else in Europe might thus be tempted to clear new areas like forest or pastures to
produce food, following this new economic incentive. In this case EU biofuels policy would
have a direct effect on land-use change, but also an indirect land use change somewhere else
in Europe. As food markets are globalised, ILUC might even be provoked anywhere in the
world due to economic incentives originating form Europe. Biofuels production might thus
create economic incentives for deforestation in countries with more flexible environmental
CE
UeT
DC
olle
ctio
n

CHAPTER 2. LITERATURE REVIEW 14
legislation like Indonesia or Malaysia, antagonising de facto green political parties and envi-
ronmental NGOs across Europe as illustrated in ‘the little book of Biofuels’ (Defossez et al.
2014).
ILUC is thus challenging in many ways: indeed establishing a clear and direct causality
between an economic incentive and its practical consequences is more than challenging,
let alone the potential distance between the two occurrences. Many external factors like
droughts, flooding or wars in foreign countries can strongly influence the prices of the food
market as well, making any causality link unprovable. However, ILUC is crucial in the sense
that if the newly cleared areas were storing carbon (like forest or peatlands), then the release
of carbon from the soil has to be accounted in order to reduce the carbon intensity of fuels
used in Europe effectively.
Given that ILUC is an economic phenomenon, it is quantified through economic models
focusing on price transmission effects between food, biofuels and land markets. But there
is no established methodology to quantify ILUC, contrary to DLUC (as explained above).
As a result the study of ILUC is based on assumptions on key economic linkages, and thus
always up for debate as no scientific certainty can be reached. This difficulty crystallised
the opposition to biofuels and thus provoked a strong polarisation of the debate between pro
and opponents to biofuels (Ackrill and Kay 2014).
For the different reasons outlined above, the results of the different studies about bio-
fuels GHG emissions greatly vary in the literature. In the European framework, ILUC was
formalised by the European Union in order to amend the Renewable Energy Directive (see
below) three years after it was filed. One of the figure of the impact assessment backing
up the amendment can be seen below (figure 2.5). As seen on the figure, the European
Commission estimated the GHG savings of for example corn bioethanol above 50% in 2012.
UNEP estimated them between -5% (more pollutant than its fossil equivalent) and 60% in
2009 (UNEP’s figure can be seen in appendix A). GHG savings from sugarcane bioethanol,
widely produced in Brazil, is estimated around 60% by the European Commission in 2012,
CE
UeT
DC
olle
ctio
n

CHAPTER 2. LITERATURE REVIEW 15
Figure 2.5: Impact Assessment accompanying the ILUC proposal (Defossez et al. 2014)
and from 70 to 143% by UNEP in 2009. It is also interesting to notice that ILUC is very
variable within a group of biofuel (for example first generation biofuels, which includes
bioethanol and biodiesel), in addition of being variable between the different studies and
models, such as illustrated on figure 2.5. This high variability makes drawing conclusions
difficult, and fosters oversimplification.
2.2.1.4 the food vs fuel debate
The food vs fuel debate is hard to classify: it is intrinsically economic, but it also has strong
environmental and political implications. As we saw, biofuel production (and especially
conventional biofuels) involves land use and thus directly competes with food production.
CE
UeT
DC
olle
ctio
n

CHAPTER 2. LITERATURE REVIEW 16
This triggers DLUC and ILUC, the latter being especially controversial in terms of negative
externalities for the environment.
However, it is challenging to directly link biofuel production to food prices evolution
(Ackrill and Kay 2014; Domingos Padula et al. 2014). Indeed the food and energy sector
were already tied long before biofuels were produced through for example fertilisers and
mechanical traction. As the energy market is much larger than the agricultural one, a small
change in energy prices usually involves a large change in agricultural feedstocks demand
(FAO 2008). Increasing crude oil prices will thus drive up food prices, whether biofuels
are involved or not. The rise of biofuels only ties the energy and food sector more closely
together.
Still, the link between food and biofuel prices is not always as straightforward as explained
above. The biofuels production process usually creates different by-products as well, which
can be transformed to bioethanol used as animal feed. Leftover from ethanol production
such as corn residues for example can be dried and sold as Distillers Dried Grains with
Solubles (DDGS) (Stein 2007). This massive by-products of ethanol production decreases
significantly the prices of animal feed on the market, undermining the relevance of the food
vs fuel argument.
But in the same way that the considerable variation within biofuels production (techno-
logical pathways, potential feedstocks) and biofuels themselves obstructs an accurate descrip-
tion of their GHG emissions, those variations also harden an assessment of their economic
competitiveness. The economic sector in itself is very variable: fossil fuel prices have been
very volatile in the last decade, as a result of geopolitical instabilities and other economic
factors. A comparison between biofuels prices and their fossil equivalent in order to evaluate
biofuels competitiveness will thus need to be constantly updated to keep its relevance.
CE
UeT
DC
olle
ctio
n

CHAPTER 2. LITERATURE REVIEW 17
2.2.2 The European political evolution concerning biofuels
The EU was created in 1986 with the Single European Act and the creation of a unified
market with a strong identity, even if the common market for coal and steel (ECSC) and
the European Economic Community (EEC) existed already respectively in 1951 and 1958.
The European Union is rapidly growing and seen by many as a major actor on the global
stage. The development of Green Parties in the nineties (Green Parties were part of 11 out of
15 national parliaments in the late nineties) and environmental policy in different State led
Europe to take the lead for environment preservation and climate change tackling (Kelemen
2010).
The first major environmental discussion to which the European Union took part as a
whole was the United Nations Conference on Environment and Development, more widely
known as the Rio summit, in 1992 (Kelemen 2010). The summit led to the creation of the
United Nations Framework Convention on Climate Change (UNFCCC) as well as to the
Kyoto protocol (enforced in 2005), for which the European Union made the most ambitious
plea of GHG emissions cutting of all developed countries. Ambitions climatic targets were
also renewed during the Paris agreement in 2015 (EC 2015a).
The political drivers identified above can be identified for every major biofuel producer
(Europe, the US and Brazil), but their relative importance may vary over time. In Europe,
the environmental driver and the desire to tackle climate change was the strongest influ-
ence explaining the development of biofuels policies, far ahead energy security and rural
development (Ackrill and Kay 2014).
2.2.2.1 The emergence of biofuels policy in Europe
As explained in the introduction, biofuels were widely used in the XIXth century but were
abandoned due to the abundance of cheap fossil fuels starting in the 1960s (Ackrill and Kay
2014). The first European policy concerning biofuels (without citing them) was filed in 1985
by the Council of European Communities (CEC). Indeed the directive 85/536/EEC specifi-
CE
UeT
DC
olle
ctio
n

CHAPTER 2. LITERATURE REVIEW 18
cally addresses the need for ‘crude-oil savings through the use of substitute fuel components
in petrol’ in order to reach ‘a continuous and balanced expansion and an increase in stabil-
ity’. Those substitute should be produced from ‘raw materials other than crude oil’ that
can be blended with petrol with ‘only minor modifications to existing (...) systems’. This
directive thus directly aims for energy security (‘broadening the raw materials base for the
production of fuels’) without expressing any concerns about rural and environmental issues
(the Council of European Communities 1985).
However, biofuels production really began in the nineties, with an emphasis on biodiesel
(a substitute for diesel) given that the EU imported diesel and exported gasoline (which can
be substituted by ethanol), which is known as the EU diesel deficit. The first legislation in
favour of biofuel at the European level was filed by the Common Agricultural Policy (CAP),
and were not biodiesel-specific (Kutas et al. 2007). Indeed in 1992 the CAP introduced
the obligation to set aside at least 15% of the areas dedicated to conventional agricultural
commodities (oilseeds and cereals) to avoid agricultural surpluses that were hard to export.
However on those lands farmers could grow non-food crops such as oilseed rape, which can
easily be used to produce biodiesel (Kutas et al. 2007). In 1992 a new directive (92/81/EEC)
allowed Member States to ‘apply total or partial exemptions or (fiscal) reductions’ in the
field of ‘more environmentally-friendly products and in particular in relation to fuels from
renewable resources’ (the Council of European Communities 1992).
A proposal about motor fuels from agricultural sources is passed in 1994. The main focus
is to limit ‘harmful emissions’ when ‘fuels produced from renewable agricultural sources have
been identified in general as beneficial to the environment’. The directive also identifies the
ability of biofuels to ‘create new demand for agricultural products’ and ‘reduce unemploy-
ment’ (the Council of European Communities 1994). The focus of the directive has thus
shifted from energy security to environmental and rural development issues.
The White Paper called ‘An Energy Policy for the European Union’ identifies in 1995
all three political drivers: it is considered that ‘an increased share of renewables in the
CE
UeT
DC
olle
ctio
n

CHAPTER 2. LITERATURE REVIEW 19
Community’s energy balance would make a contribution to both its security of supply and
environmental protection’. The Commission also estimates that renewables could ‘play a role
in reinforcing economic and social cohesion in the Community’, and also that ‘Rural areas
could also play an important role in the production of energy based on biofuels and could
thereby make an important contribution not only to the achievement of energy objectives,
but also to their own economic viability’, hence highlighting the potential rural development
associated with biofuels (CoEC 1995). During the same year the introduction of two countries
with strong environmental legislation (Finland and Sweden) in the European Union tilted
the European politics even more in favour of environmental issues. During the nineties the
development of biodiesel standards by the industry also helped to secure the supply and
stabilise the market (Kutas et al. 2007).
The European Commission discussed in 1997 the different options available to progress
towards the target that would be proposed during the Kyoto climate negotiations via a key
report called ‘Energy for the Future: Renewable Sources of Energy’. It is indicated that
a ‘significant increase of biofuel in transport fuel use by 2010’ is an important element for
‘achieving the overall Union objective’. It is noted that this objective should be accomplished
‘whatever the precise outcome of the Kyoto Conference’ (EC 1997). Given that the paper
was drafted before the Kyoto negotiations, environmental and climatic concerns are the key
drivers of this text. However references are made to rural development and energy security
as well. The European Union ended proposing a cut of 8% of its GHG emissions in Kyoto,
the most ambitious savings within developed countries.
Prior to the Gothenburg summit in May 2001, the Commission of the European Commu-
nities acknowledges in a proposal that in order to achieve sustainable development, ‘economic
growth, social cohesion and environmental protection must go hand in hand’. More specif-
ically to biofuels, the document states that ‘Alternative fuels, including biofuels, should
account for at least 7% of fuel consumption of cars and trucks by 2010, and at least 20% by
2020’. It is also specified in the same paragraph that ‘The Commission will make a proposal
CE
UeT
DC
olle
ctio
n

CHAPTER 2. LITERATURE REVIEW 20
in 2001 for adoption in 2002’ (CoEC 2001b).
The next proposal was made by the Commission the same year in November. In the
introduction it is mentioned that ‘the objective of 20% substitution by alternative fuels in
the road transport sector by the year 2020 (has) the dual purpose of improving security of
supply and reducing greenhouse gas emissions’. Rural development is assessed as well: ‘the
production of raw materials for biofuels would help to create new sources of income and to
maintain employment in rural areas’. Three alternative fuels are identified, namely biofuels,
natural gas and hydrogen (in this order). Within biofuels, biodiesel and bioethanol are firstly
identified. Cooking oils and other alternatives such as biomethanol are also mentioned (CoEC
2001a).
2.2.2.2 The biofuels directive (2003/30/EC)
The first legislation targeting specifically biofuels was reached in 2003 with the so-called
Biofuels Directive (2003/30/EC). This directive can be considered as the formal starting
point of biofuels policy at the European level, even if biofuels policy were already formalised
at the national level by some Member States like Germany or the UK prior to 2003 (Ackrill
and Kay 2014). In a general manner, as we have seen, biofuels have been considered for a
long time within broader agendas like the environment.
All three pillars that stimulated biofuel policies in the past can be found in the Biofuels
Directive. Indeed the article 1 of the directive ‘aims at promoting the use of biofuels or other
renewable fuels to replace diesel or petrol for transport purposes in each Member State,
with a view to contributing to objectives such as meeting climate change commitments,
environmentally friendly security of supply and promoting renewable energy sources’ (EU
2003).
Environmental concerns is the most assessed pillar: it is thought by the European Com-
mission that ‘CO2 emissions from transport (will) rise by 50% between 1990 and 2010’.
Therefore, a ‘greater use of biofuels for transport forms a part of the package of measures
CE
UeT
DC
olle
ctio
n

CHAPTER 2. LITERATURE REVIEW 21
needed to comply with the Kyoto Protocol’ given that ‘most vehicles currently in circulation
in the European Union are capable of using a low biofuel blend without any problem’. The
European Union also acknowledges the ‘wide range of biomass that could be used to produce
biofuels, deriving from agricultural and forestry products, as well as from residues and waste
from forestry and the forestry and agrifoodstuffs industry’, highlighting the environmental
benefits of second generation biofuels without naming them (EU 2003).
The energy security issues are also addressed: the European Commission acknowledges
that the ‘increased use of biofuels for transport (...) is one of the tools by which the Commu-
nity can reduce its dependence on imported energy and (...) influence the security of energy
supply in the medium and long term’. Rural development is only assessed once in the di-
rective. The directive explicitly says that ‘promoting the use of biofuels (...) could create
new opportunities for sustainable rural development in a more market-orientated common
agriculture policy’ (EU 2003).
The European Union also expresses doubts about the economic viability of biofuels com-
pared to environmental and security benefits. The article 3 explicitly states that ‘Member
States should (...) give priority to the promotion of those fuels showing a very good cost-
effective environmental balance, while also taking into account competitiveness and security
of supply’. It is also noted in the directive that ‘Alternative fuels will only be able to achieve
market penetration if they are widely available and competitive’ (EU 2003).
It is interesting to compare the biofuels directive with the amended proposal that led to
its creation. The concerns expressed a few months before the proposal were mainly focusing
on environmental concerns around biofuels. Additions that found their way to the directive
includes paragraph 24, which states that ‘Research and technological development in the
field of the sustainability of biofuels should be promoted’. Paragraph 25 was also added,
stating that ‘An increase in the use of biofuels should be accompanied by a detailed analysis
of the environmental, economic and social impact in order to decide whether it is advisable
to increase the proportion of biofuels in relation to conventional fuels’ (EU 2003). More
CE
UeT
DC
olle
ctio
n

CHAPTER 2. LITERATURE REVIEW 22
importantly, some paragraphs of text from the amended proposal didn’t find their way to
the directive. One of them was trying to enforce ‘a set of clear environmental criteria for the
production of liquid biofuels’ in order to ‘to ensure sustainable farming practices’ (EU 2003).
Thus even the growing environmental concerns didn’t allow the premise of the sustainability
criteria (see below) to be accepted in 2003.
The Commission thus proposed indicative (non binding) targets of 2% in 2005 and e.
Moreover Member States are obliged to report annually on ‘the measures taken to promote
the use of biofuels (...) for transport purposes’, ‘the national resources allocated to the
production of biomass for energy uses other than transport’ and ‘the total sales of transport
fuel and the share of biofuels (...) placed on the market’ (EU 2003).
2.2.2.3 The evolution of the biofuel directive
During the period 2004-2006, biofuels are mainly considered by the European Union through
the larger issue of renewable energy promotion. Little progress has been recorded for bio-
fuels development during this period time. In December 2005, two years after the Biofuels
Directive, the Biomass Action Plan acknowledges that biofuels share at the European level
will be at best of 1.4% for 2005 given the ‘substantial variation in Member States’ efforts’.
It is also stated that between 2003 and 2005 a number of Member States switched from fuel
tax exemptions to biofuels obligations enforced via an obligatory biofuel blending percentage
in the fossil fuels on the market, mainly to achieve the desired targets more ‘cost-effectively’.
Second generation biofuels are explicitly mentioned by the Commission which estimates that
they should get ‘favourable treatment’ in the future (CoEC 2005).
In 2006 the ‘EU Strategy for Biofuels’ summarises the work already achieved and high-
lights the unchanged EU goals for biofuels, mainly ‘reducing greenhouse gas emissions, boost-
ing the decarbonisation of transport fuels, diversifying fuel supply sources and developing
long-term replacements for fossil oil’ (CoEC 2006). Biofuels are also expected to ‘offer new
opportunities to diversify income and employment in rural areas’. The EU Strategy for
CE
UeT
DC
olle
ctio
n

CHAPTER 2. LITERATURE REVIEW 23
biofuel sets three aims: ‘to further promote biofuels in the EU and developing countries’, ‘to
prepare for the large-scale use of biofuels by improving their cost-competitiveness through
the optimised cultivation of dedicated feedstocks, research into ‘second generation’ biofuels’
and ‘to explore the opportunities for developing countries’ including those affected by the
reform of the EU sugar regime ‘for the production of biofuel feedstocks and biofuels’ (CoEC
2006).
In January 2007 the ‘Biofuels Progress Report’ updates the progress made in the use
of biofuels in the European Union. The Commission estimates that biofuels have ‘proved
themselves a credible alternative to oil’, and that since ’energy diversity is rather low’ in
the transportation field, there is ‘a pressing need for the Union to send a clear signal of
its determination to reduce its dependence on oil use in transport’ (see figure 2.6) (CoEC
2007a). However the Commission estimates that the targets set by the Biofuel Directive for
2010 will not be achieved, and that the reasons for that are not ‘justified’ or ‘related to new
scientific evidence’ (CoEC 2007a).
Figure 2.6: Forecast change in greenhouse gas emissions for EU25, period 2005-2020 (Mt peryear, CO2 only) (CoEC 2007a)
More importantly, the Commission filed also in 2007 a ‘Renewable Energy Road Map’
aiming to increase ‘security of energy supply’ and reduce ‘greenhouse gas emissions’ by
CE
UeT
DC
olle
ctio
n

CHAPTER 2. LITERATURE REVIEW 24
making a ‘better use (...) of renewables’ (CoEC 2007b). In order to achieve those ambitious
objectives, the Commission proposes ‘a mandatory target of 20% for renewable energy’s
share of energy consumption in the EU by 2020’ as well as a new and ambitions objective of
a ‘mandatory minimum target of 10% for biofuels’. The target of 10% of biofuels will need
to be achieved through the Directive 98/70/EC on fuel quality, those new objectives will
thus need the creation of a ‘new legislative framework to enhance the promotion and use of
renewable energy’ (CoEC 2007b).
2.2.2.4 The Climate and Energy package
All the work achieved between 2003 and 2007 by the European Commission led to a game-
changer in the EU renewable energy policy: the Climate and Energy package (CEP). The
package includes a revised Fuel Quality Directive (FQD) and the Renewable Energy Di-
rective (RED), as well as ideas introduced previously in order to promote biofuels in the
European Union. Overall the package introduces the so-called 20-20-20 targets: a 20% re-
duction of GHG emissions, a 20% share of renewable in final energy consumption and a 20%
improvement in energy efficiency by 2020 in the European Union.
2.2.2.4.1 The renewable energy directive (2009/28/EC) The Renewable Energy
Directive (RED) has multiple goals. Generally, it aims to promote ‘the security of energy
supply and (...) technological development and innovation’ as well as providing ‘opportunities
for employment and regional development, especially in rural and isolated areas’ (EU 2009a).
More specifically it formalises a target of 20% ‘for the overall share of energy from renewable
source’ and of 10% for energy from renewable sources in transport, two goal first raised in
2007 in the Renewable Energy Road Map (see above).
The 20% target will vary at the national level, according to the ‘starting point, potential
(...) and GDP’ of the different countries (EU 2009a). However the 10% target in the
transport sector will be the same in every country in order to ‘ensure consistency in transport
fuel specifications and availability’. Member States struggling to meet their targets always
CE
UeT
DC
olle
ctio
n

CHAPTER 2. LITERATURE REVIEW 25
have the opportunity to import renewable energy from neighbouring countries. Member
States will have to notify the Commission of their achievement in that matters annually (EU
2009a).
Environmental concerns
The Commission fears that the growing global demand for agricultural commodities ‘will
be met through an increase in the amount of land devoted to agriculture’ (EU 2009a). The
Commission expresses thus concerns about the potential environmental impact of increased
biofuels production, even if the 10% target has to be achieved ‘from renewable sources as a
whole, and not from biofuels alone’ (EU 2009a). In order to avoid any potential environ-
mental impact provoked by biofuels, the Commission created sustainability criteria.
Sustainability criteria were designed to avoid ‘encouraging the destruction of biodiverse
lands’ via an an increased demand of biofuels (EU 2009a). Biodiverse areas have been
defined by the Food and Agriculture Organisation (FAO) in the Global Forest Resource
Assessment since 1946 (FAO 2015). Such areas include primary forests, as well as certain
types of ‘grasslands, steppes, scrublands and prairies’ (FAO 2015). The conversion of lands
with ‘high stocks of carbon in its soil or vegetation’ such as wetlands should also be avoided
for biofuel production (EU 2009a). If such an area is considered, the carbon released in
the atmosphere during the clearance has to be accounted in the total GHG emissions of the
biofuel. As a rule of thumb, ‘land should not be converted for the production of biofuels if its
carbon stock loss upon conversion could not, within a reasonable period, (...) be compensated
by the greenhouse gas emission saving resulting from the production of biofuels or bioliquids’
(EU 2009a). In order to avoid increasing the pressure on European lands, the Commission
estimates ‘both likely and desirable that the (biofuel) target will in fact be met through a
combination of domestic production and imports’ (EU 2009a).
The Commission also expresses concerns about how the rise of biofuels production in third
countries ‘might not respect minimum environmental or social requirements’, and encourages
the ‘development of multilateral and bilateral agreements and voluntary international or
CE
UeT
DC
olle
ctio
n

CHAPTER 2. LITERATURE REVIEW 26
national schemes that cover key environmental and social considerations’ (EU 2009a). To
avoid such potential effects of biofuels, the Commission considers ‘the inclusion of a factor for
indirect land use changes in the calculation of greenhouse gas emissions’ in the near future
(EU 2009a).
Sustainability criteria impose a target of GHG savings for biofuels of at least 35% starting
in 2013 (EU 2009a). This target will be 50% by 2017 and 60% by 2018. The ‘biofuels and
bioliquids that do not fulfil sustainability criteria (...) shall not be taken into account’ in the
targets. The data used in calculation should be ‘obtained from independent, scientifically
expert sources and to be updated as appropriate as those sources progress their work’ (EU
2009a).
Economic concerns
The Commission expresses concerns about the industrial sector. To guarantee industrial
stimulation and thriving, the Commission created a framework with mandatory targets at
the European level in order to ‘provide the business community with the long-term stability it
needs to make rational, sustainable investments in the renewable energy sector’ (EU 2009a).
Mandatory targets are also introduced at the national level, to ‘provide certainty for investors
and to encourage continuous development of technologies which generate energy from all
types of renewable sources’ (EU 2009a). Second generation biofuels, which were ‘becoming
commercially available’ at that time, and ‘adequate levels of blending’ were available to
industries in order to reach the new goals. By aligning the industrial interests with its own,
the Commission probably hopes to achieve its goals in a win-win situation (EU 2009a).
Indeed the Commission assumes that ‘innovation and a sustainable competitive energy
policy’ will create economic growth, or the so-called green growth (EU 2009a). It is also
assumed that this new green growth will create a switch from centralised to decentralised
energy production, a switch favoured by the Commission since it increases energy security at
the local level. However promising the green growth concept is, the Commission warns that it
is ‘desirable that energy prices reflect external costs of energy production and consumption,
CE
UeT
DC
olle
ctio
n

CHAPTER 2. LITERATURE REVIEW 27
including, as appropriate, environmental, social and healthcare costs’ (EU 2009a). Energy
companies will thus have to face the challenge of internalising environmental and social costs.
Calculation of biofuels greenhouse gas impact
The total GHG emissions of a biofuel has to be accounted following the formula below,
as explained in the annex V of the RED (EU 2009a). The term E equals the total emissions
from the use of the fuel. The different terms are expressed in gCO2eq/MJ, i.e. grams of
carbon dioxide per MegaJoule of fuel.
E = eec + el + ep + etd + eu � esca � eccs � eccr � eee
Table 2.1: The different factors included in the calculation of biofuels GHG emissions (EU2009a)
Emissions released from Emissions saved throughThe extraction or cultivation Soil carbon accumulation via
of raw materials (eec) improved agricultural management (esca)annualised carbon stock changes Carbon capture andcaused by land-use change (el) geological storage (eccs)
Processing (ep)Carbon capture andreplacement (eccr)
Transport and distribution (etd)Excess electricity
from cogeneration (eee)Fuel in use (eu)
The formula to calculate the term el can be found in the Appendix B. Notice that
Member States base their typical greenhouse gas emissions from cultivation of agricultural
raw materials on the nomenclature of territorial units for statistics (NUTS), as explained
above. The calculations also include Nitrous oxide (N2O) and methane (CH4) emissions,
after being transformed as CO2 equivalent via a factor of respectively 296:1 and 23:1.
The resulting savings are normalised via the use of a fossil fuel equivalent calculated
according to the formula below:
CE
UeT
DC
olle
ctio
n

CHAPTER 2. LITERATURE REVIEW 28
Savings =EF � EB
EF
Where:
• EB = total emissions from the biofuel or bioliquid; and
• EF = total emissions from the fossil fuel comparator.
2.2.2.4.2 The fuel quality directive (2009/30/EC) The Fuel Quality Directive (FQD)
relies heavily on the RED. In this directive the Commission focuses on the transportation
sector, responsible for ‘around 20% of Community greenhouse gas emissions’ in 2009. In
order to reach the 20-20-20 targets, a gradual ‘decarbonisation of transport fuel’ is needed
(EU 2009b). The Commission estimates that the transportation sector specifically should
‘reduce life cycle greenhouse gas emissions by up to 10% per unit of energy from fuel and
energy supplied’ by end 2020 (EU 2009b). The Commission is giving multiple to the indus-
trial sector means to achieve this ambitious goal: by 2020 only 6% of actual GHG reduction
has to be achieved ‘compared to the EU-average level of life cycle greenhouse gas emissions
per unit of energy from fossil fuels in 2010’ via the use of ‘biofuels, alternative fuels and
reductions in flaring and venting at production sites’ (EU 2009b). Within those 6%, 2% has
to be achieved by end 2014 and 4% by end 2017. The last 4% reduction is divided in two:
2% can be ‘obtained through the use of environmentally friendly carbon capture and storage
technologies and electric vehicles’ and the last 2% can be obtained ‘through the purchase of
credits under the Clean Development Mechanism of the Kyoto Protocol’. The two additional
targets, accounting for 4%, are not legally binding (EU 2009b).
The Commission expresses the same environmental concerns as the one in the RED. In
this directive biofuels are subject to the same sustainability criteria, explained above as part
of the RED. The methodology estimates that the GHG impact of biofuels is similar to the
one included in the RED as well. Notice that the Commission expresses specific concerns
CE
UeT
DC
olle
ctio
n

CHAPTER 2. LITERATURE REVIEW 29
about the blending of ethanol in petrol, which ‘increases the vapour pressure of the resulting
fuel’ in a non-linear manner (EU 2009b).
2.2.2.5 The evolution of the Climate and Energy package
Reaching a 10% share from renewable sources in the transportation sector transport is one
of the many ambitious goals set by the CEP, and the Commission expects the private sector
to reach this target by using biofuels massively (EU 2009a; EU 2009b). However the CEP
doesn’t include any binding targets for biofuels specifically, let alone specific objectives for the
different generations of biofuels. Although this is a clear policy incentive in favour of biofuels
because ‘the contribution of biofuels towards these targets is expected to be significant’ (EU
2009a), it is only a weak one since it doesn’t stimulate innovation in the field by establishing
clear production goals for more advanced types of biofuels (second and third generation).
The message can thus be considered ambiguous by the private sector and might deteriorate
the secured environment needed for long-term investment.
Another issue is the way the European Commission is handling the potential environ-
mental issues of biofuels. About ILUC for example, in the RED the Commission estimates
that it should ‘develop a concrete methodology to minimise greenhouse gas emissions caused
by indirect land use changes’, but doesn’t elaborate on how it’s supposed to be done. As
we already saw ILUC can’t be observed directly. Its quantification is thus based on as-
sumptions that need to assess how far and how indirect the quantification should be. Such
questions are by nature uncertain, and are strongly expected to divide the opinion. Any
miscommunication could also rapidly polarise the public debate revolving around biofuels.
In 2010 the ILUC issue was becoming a symbol for the opponents to biofuels, allowing
them to group behind the problematic (Ackrill and Kay 2014). The Commission assessed
the ILUC issue and created a method to quantify it in a report about ‘indirect land use
change related to biofuels and bioliquids’ (EC 2010). In the report the Commission acknowl-
edges that ‘estimating the greenhouse gas impact due to indirect land use change requires
CE
UeT
DC
olle
ctio
n

CHAPTER 2. LITERATURE REVIEW 30
projecting impacts into the future, which is inherently uncertain’ and that estimated ILUC
‘can never be validated, as indirect land use change is a phenomenon that is impossible to
directly observe or measure’.
Figure 2.7: GHG emissions related to land-use change for maize bioethanol and soya biodiesel(EU 2010)
The document is based on many different reports from Europe and the US, as well
as an extensive literature review. Two of those reports also included modelling exercises:
the first one is the AGLINK-COSIMO model, developed by the Institute for Prospective
Technological Studies (IPTS). Under an assumption of 7% of conventional biofuels and 1.5%
of advanced biofuels (double-counted) to reach the 10% target of renewable energy, the model
estimated the additional demand would result in a release of 21 Mtoe which would result
in ‘an increase of the total land area required for crops of 5.2 million hectares globally, one
quarter of which is in the EU’. This model didn’t include a calculation of GHG impact (EC
2010).
The second model is the MIRAGE, developed by the International Food Policy Research
Institute (IFPRI). Under an assumption of 5,6% of conventional biofuels and 1.5% of ad-
vanced biofuels (the rest of the 10% being filled by other means), the model predicts that an
CE
UeT
DC
olle
ctio
n

CHAPTER 2. LITERATURE REVIEW 31
output of 8 Mtoe, which would result in ‘an increase of total land area required for crops of
0.8 and 1 million hectares globally’ (EC 2010). In a 45/55 ratio of bioethanol/biodiesel, this
would result in a GHG release of 18gCO2eq per MegaJoule for land-use emissions. In the
case of a 8,6% share of conventional biofuels, the model predicts a GHG release of 30g/MJ.
Notice that the ratio of bioethanol/biodiesel has a strong influence on the land-use emis-
sions: as explained a ratio 45/55 will release 18g/MJ of GHG, where a ratio of 25/75 would
theoretically release 45g/MJ.
The results of the report are thus very variable, as the models are based on different as-
sumptions such as ‘the treatment of co-products, existing and marginal yields, food and feed
consumption, classification of land, elasticities, carbon stock values, type of land converted,
modelling of pasture and the drivers of deforestation’ (EC 2010). Figure 2.7 represents the
different GHG release that would theoretically be provoked by land-use change for soya
biodiesel and corn bioethanol. For the latter, the estimations vary on a scale from 21 to 156
g/MJ, making any conclusion difficult. The variability in the models are ‘based on economic
principles, where decision making on e.g. land-use change, is reduced to a least-cost opti-
mization problem’, neglecting any ‘several non-economic factors (...) like political choices
(land-use and agricultural policy, land rights, etc.)’ that might influence land-use change but
are hardly quantifiable (EC 2010). The Commission also acknowledges that ‘the geograph-
ical origin of the feedstock could also be a significant variable in estimating the (indirect)
land-use change impact of a specific biofuel’, but that ‘none of the modelling done so far has
explored this variability’ (EC 2010).
2.2.2.6 The amendments of the RED and FQD
In order to address the environmental concerns underlined above and specifically ILUC, the
European Commission amended the RED and the FQD in 2012. In the introduction of the
proposal the Commission acknowledges that ‘emissions from indirect land use change (...)
can negate some or all of the greenhouse gas savings of individual biofuels relative to the
fossil fuels they replace’ (EC 2012). The proposal has multiple aims, the principal being the
CE
UeT
DC
olle
ctio
n

CHAPTER 2. LITERATURE REVIEW 32
‘introduction of a limit to the contribution made from biofuels (...) produced from food crops
(...) to current consumption levels’, aka 5% (EC 2012). New refineries will have to achieve
greater GHG savings more quickly (60% by 2014 compared to 2017 in the original directive).
Refineries in operation before 2014 will have until 2018 (an additional extra year) to reach
50% of GHG savings, but they will have to include ‘estimated emissions from carbon stock
changes caused by indirect land use change’ (EC 2012).
The Commission explicitly aims to ‘protect existing investments until 2020’, but estimates
that ‘biofuels which do not lead to substantial greenhouse gas savings (when emissions from
indirect land use change are included) (...) and are produced from crops used for food and
feed should not be subsidised’ (EC 2012). The Commission thus wish to encourage greater
production of ‘advanced biofuels (...) (that) provide high greenhouse gas savings with low
risk of causing indirect land use change and do not compete directly for agricultural land for
the food and feed markets’ (EC 2012). It estimates as well that those kind of fuels are not yet
commercially available due to ‘competition for public subsidies with established food crop
based biofuel technologies’. To stimulate the production of advanced biofuels production,
the Commission wishes to adopt a new accounting system based on the feedstocks used in
the process: biofuels produced from algae (as well as from non-biological origin) would be
accounted for four times their energy content, biofuels made from mixed municipal waste
would be accounted for two times their energy content (EC 2012).
Stormy debates about ILUC quantification and a potential cap on conventional biofuels
took place between 2012 and 2014, creating a climate of uncertainty around the future of
biofuels. In the ‘Renewable energy progress report’ of 2013 the Commission acknowledges
some deviations from national and European targets in the transportation field for 22 Mem-
ber States which ‘failed to achieve their indicative 2010 target of 5.75%’ (EC 2013). The
Commission estimates that the 4.7% share of biofuels in the European transportation sector
generated 25.5 Mt CO2eq, but that when ILUC or agricultural intensification effects are
considered those ‘estimated savings are significantly reduced’ (EC 2013). The Commission
CE
UeT
DC
olle
ctio
n

CHAPTER 2. LITERATURE REVIEW 33
thus suggests that a new amendment should ‘include (a limit of) the contribution that food-
based biofuels can make towards the 10% target to 5%, enhanced incentives to encourage the
development of second generation biofuels from non-food feedstock’ to clarify EU biofuels
policy (EC 2013).
About the biofuels sustainability criteria, the Commission acknowledges its lack of en-
forcement in some Member States, and has started ‘legal proceedings (...) to ensure that
effective sustainability regimes are in place in all Member States’ (EC 2013). Key countries
involved in deforestation issue and exporting biofuels to Europe like Indonesia, Brazil, Ar-
gentina and Malaysia have also recently improved their environmental practices related to
biofuels production. Indeed respectively 80% and 83% of bioethanol and biodiesel consumed
in Europe are produced domestically, the rest being imported from countries like Argentina,
the US and Brazil (see figure 2.8). Notice that the import shares from Brazil, internationally
famous for the intense deforestation of the Amazonian forest, has ‘almost halved (in 2013)
in comparison to 2008’ and only reached 8.4% in 2013 (EC 2013).
The Commission also assesses the controversial ‘food vs fuel’ argument in the 2013 report.
The Commission estimates that the use of agricultural commodities like grains for ethanol
production was only amounted to 3% of the total cereal use in the period 2010-2011, with a
minor impact on price effect on international markets (between 1 and 2%). The Commission
estimated the impact of EU biodiesel consumption on food prices around a few percents as
well (4%) (EC 2013). The Commission notices that ‘biofuel demand is more price sensitive
than the food market and so demand declines more in response to rising prices’. The in-
teractions between biofuels production and other economic sectors still need to be assessed
(EC 2013).
According to the Commission, this situation is mainly due to the economic crisis of 2008-
2009 that strongly affects the renewable energy sector and ‘particularly its cost of capital’
(EC 2013). The Commission fears that this ‘increase the regulatory risk faced by investors
and barriers that should, but have not yet been addressed’, thus deterring any potential
CE
UeT
DC
olle
ctio
n

CHAPTER 2. LITERATURE REVIEW 34
Figure 2.8: Origin of final biofuels consumed in the EU in 2010 (EU 2013)
investors interested in biofuels development in Europe when ‘further efforts are needed to
achieve the 2020 targets’ (EC 2013). A deficit of biofuels production is thus expected in
Europe starting in 2013.
2.2.2.7 The ILUC directive (2015/1513)
In 2015 the European Commission acknowledges that ILUC in biofuels production can ‘lead
to significant greenhouse gas emissions’ (EU 2015). Given that most of the biofuel production
for 2020 is ‘expected to come from crops grown on land that could be used to satisfy food and
feed markets’, this could thus ‘negate (...) the greenhouse gas emission savings of individual
biofuels’ (EU 2015). However the Commission acknowledges the complexity of quantifying
ILUC, a phenomenon depending of ‘trends in agricultural yields and productivity, co-product
allocation and observed global land-use change and deforestation rates’, factors which are
not under control of biofuels producers (EU 2015). The Commission also recognises that the
consequences of ILUC are mostly expected outside of the European Union ‘in areas where
the additional production is likely to be realised at the lowest cost’. The conversion of peat
lands or tropical forest for example would have disastrous consequences on GHG savings
induced from biofuel production. ILUC quantification has thus not yet been fully formalised
(EU 2015).
However, the Commission has set a limit of 7% of conventional biofuels in the final en-
ergy consumption in the European transportation sector by 2020. Member States are free to
CE
UeT
DC
olle
ctio
n

CHAPTER 2. LITERATURE REVIEW 35
set more stringent limits, in order to arrange their own trajectory to comply with the 10%
target of renewable energy in the transportation sector (EU 2015). On the other hand the
Commission strongly encourages the production of advanced biofuels (based on algae and
waste) that do not compete with food production for agricultural lands, hoping to reach ‘a
significantly higher level of consumption’ by 2020 (EU 2015). In this sense the accounting
factors developed to foster advanced biofuels are maintained, but no mandatory targets are
set for advanced biofuels (an indicative target of 0.5% accounted twice is mentioned). The
Commission also recognises that energy crops developed for second and third generation
biofuels have ‘the potential to contribute to the restoration of severely degraded and heavily
contaminated land’, but that the knowledge of the matter is still limited (EU 2015). How-
ever the Commission acknowledges that such biofuels are still ‘currently not commercially
available in large quantities’ and might counter effect the trend of ‘increase(d) recycling and
the efficient and sustainable use of available resources’ actually developing in Europe (EU
2015).
2.2.2.8 Summary
Biofuels have been considered a viable option for road transportation in the EU starting in
XIXth century, as illustrated in this literature review. However the EU policy framework
concerning biofuels has considerably changed since its informal introduction in 1992 via a
CAP directive. This is mainly due to the evolution of the importance of the different political
drivers, namely energy security, rural development and environmental preservation. Indeed
the first main concern to justify biofuel development was energy security. It rapidly switched
to rural development and especially environmental issues, in line with the Kyoto negotiations
in the second half of the nineties.
This lead in 2003 to the formal starting point of biofuel policy in Europe: the biofuel
directive. The biofuel directive stresses all three political drivers, but is mainly focusing on
environmental concerns. The European policy-making process is clearly pro-biofuel at that
point, with the European Commission proposing a non-binding target of 20% substitution
CE
UeT
DC
olle
ctio
n

CHAPTER 2. LITERATURE REVIEW 36
of conventional fuels by alternative fuels in the road transport sector by the year 2020.
However, the controversial aspect of biofuels is already present in the discussion, but not
directly mentioned as the amendments calling for environmental criteria did not find their
way in the final directive.
In 2009, the EU shows its will to address climatic issues via the Climate and Energy
Package (CEP) and its 20-20-20 targets: a 20% reduction of GHG emissions, a 20% share
of renewable in final energy consumption and a 20% improvement in energy efficiency by
2020 in the European Union. The CEP includes the Renewable Energy Directive (RED)
and the FQD (Fuel Quality Directive). The RED has multiple goals, but mainly formalises
the 10% target of energy from renewable sources in road transport by 2020. Even though
the contribution of biofuels towards these targets is expected to be significant, the European
Commission fears their land use impact inside and outside Europe, and thus creates sus-
tainability criteria to prevent this from happening. The CEP also includes the FQD, which
rather than impose quotas (such as the RED) tries to implement a carbon approach: it aims
to reduce life cycle greenhouse gas emissions by up to 10% per unit of energy from fuel and
energy supplied by end 2020 in order to gradually decarbonise transport.
Even though biofuel production is fostered by the CEP, the industry is at that point
slowed down, showing no sign of new investments. Indeed while the European Commis-
sion is trying to provide the business community with the long-term stability it needs to
make rational, sustainable investments in the renewable energy sector, the industry fears
the land-use debate and feels the EU officials hesitating about the right move to do. Those
fears are materialised by the Indirect Land Use Change (ILUC) debate, which leads to ma-
jor amendments of the CEP in 2012. Even though the European Commission still wishes
protect existing investments until 2020, the directives include now an undifferentiated cap
of 5% on food-based biofuels (thus not all land-based biofuels) in order to prevent potential
environmental damages. This is mainly done in order to make room in the future for ad-
vanced biofuels (advanced biofuels), thought to have much less impact on land use and food
CE
UeT
DC
olle
ctio
n
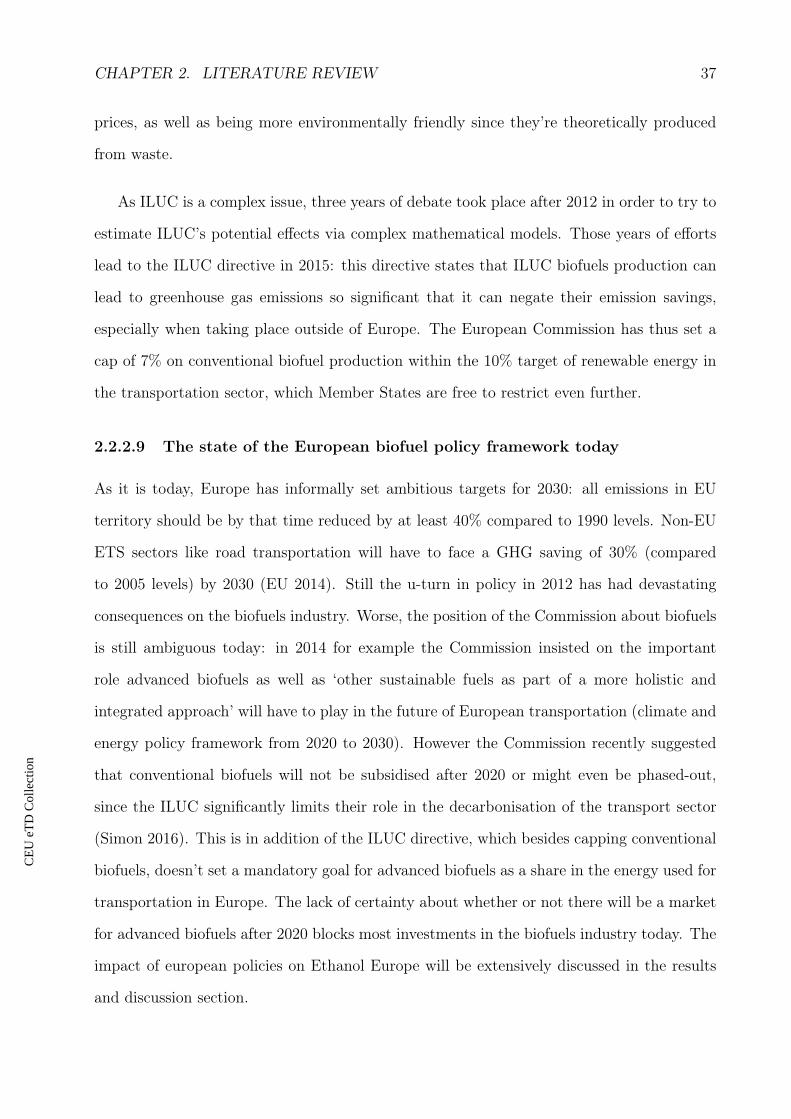
CHAPTER 2. LITERATURE REVIEW 37
prices, as well as being more environmentally friendly since they’re theoretically produced
from waste.
As ILUC is a complex issue, three years of debate took place after 2012 in order to try to
estimate ILUC’s potential effects via complex mathematical models. Those years of efforts
lead to the ILUC directive in 2015: this directive states that ILUC biofuels production can
lead to greenhouse gas emissions so significant that it can negate their emission savings,
especially when taking place outside of Europe. The European Commission has thus set a
cap of 7% on conventional biofuel production within the 10% target of renewable energy in
the transportation sector, which Member States are free to restrict even further.
2.2.2.9 The state of the European biofuel policy framework today
As it is today, Europe has informally set ambitious targets for 2030: all emissions in EU
territory should be by that time reduced by at least 40% compared to 1990 levels. Non-EU
ETS sectors like road transportation will have to face a GHG saving of 30% (compared
to 2005 levels) by 2030 (EU 2014). Still the u-turn in policy in 2012 has had devastating
consequences on the biofuels industry. Worse, the position of the Commission about biofuels
is still ambiguous today: in 2014 for example the Commission insisted on the important
role advanced biofuels as well as ‘other sustainable fuels as part of a more holistic and
integrated approach’ will have to play in the future of European transportation (climate and
energy policy framework from 2020 to 2030). However the Commission recently suggested
that conventional biofuels will not be subsidised after 2020 or might even be phased-out,
since the ILUC significantly limits their role in the decarbonisation of the transport sector
(Simon 2016). This is in addition of the ILUC directive, which besides capping conventional
biofuels, doesn’t set a mandatory goal for advanced biofuels as a share in the energy used for
transportation in Europe. The lack of certainty about whether or not there will be a market
for advanced biofuels after 2020 blocks most investments in the biofuels industry today. The
impact of european policies on Ethanol Europe will be extensively discussed in the results
and discussion section.
CE
UeT
DC
olle
ctio
n

CHAPTER 2. LITERATURE REVIEW 38
In order to clarify the future of biofuels in Europe, the future directive on renewable
energy will need to be ‘substantially revised for the period after 2020’ in order to meet the
2030 target, which will happen in late 2016 (EC 2014). The revision will be preceded by
a communication on decarbonising transport, which will be released in July 2016 by the
European Commission. The Commission will also submit a report by late 2017 to estimate
the quantity of advanced cost-efficient biofuels needed by 2020, as well as an update of ILUC
quantification knowledge to strengthen the sustainability criteria and analyse the possibility
of new environmental criteria. In 2018 the Commission will also submit a Renewable Energy
Roadmap for the post-2020 period (EU 2015).
CE
UeT
DC
olle
ctio
n

Chapter 3
Methodology
This study aims to assess the different strategies put in place by Ethanol Europe in order to
strive in the rapidly moving European sector of biofuels. In order to achieve that goal, this
thesis is mainly based on:
• an extensive literature review of the evolution of European policies concerning biofuels;
• an in-depth analysis of the lobbying activities (formal and informal interactions) of
Ethanol Europe at the European level with the other main stakeholders of the biofu-
els debate, namely the policy-makers and environmental NGOs, via semi-structured
interviews
As technical insights are needed in order to understand the nuances of the biofuel debate,
a short introduction about technical specificities of the different biofuels generations is given
in the introduction.
39
CE
UeT
DC
olle
ctio
n

CHAPTER 3. METHODOLOGY 40
3.1 Field methods
3.1.1 Data gathering
3.1.1.1 Interviews
This thesis is based on 16 semi-structured interviews of an average 70 minutes length. All
interviews have been conducted in person in Brussels or Budapest. Small series of questions
answered via telephone or email have also been conducted, but are not considered as inter-
views and are thus not enumerated below. As the biofuel debate is still controversial, most of
the interviewees’ names have not been given. This standard practice in sociological research
has also encouraged interviewees to be more explicit about their personal views (especially
when it contradicts the view of the society they work in). It also helped revealing more
sensitive issues. Notice that the genre used to refer to anonymous interviewees is always
masculine, in order to protect their privacy. The interviewees from Ethanol Europe and
Pannonia Ethanol did not wish to hide their names or opinions.
Most interviewees have been chosen based on their professional background and the
firms they were working in. The first interviews were conducted with representatives of
Ethanol Europe, since this firm is at the core of this thesis. The informations arising from
those interviews helped to frame the people needed to nuance the views of the industry.
To improve this process, the method of snowball sampling was adopted: interviewees were
asked during the interview to help identify other subjects which might be relevant to the
topic. Many subjects were assessed during the interviews, including the general opinions
of interviewees about biofuels (and then specifically about renewable ethanol), their feeling
about the revision of the RED coming in late 2016 and Miss Donnelly’s statement (about
how we should get rid of conventional biofuels, see (Simon 2016)), their role relating to policy
evolution and their relations with the industry (and especially Ethanol Europe), eNGOs and
policy-makers. An example of an interview question lists is given in Appendix D.
CE
UeT
DC
olle
ctio
n

CHAPTER 3. METHODOLOGY 41
Concerning the conduct of the interviews, a semi-structured framework has been consid-
ered. In practice this means that interviews are conducted within a more general framework
which is used as a base for the following discussion. Contrary to structured interviews, semi-
structured interviews do not restrict the themes assessed during the interview: the intervie-
wees are free to make connections with themes or subjects originally unexpected. The general
framework for an interview thus continuously evolves based on knowledge brought by the
previous research. Notice that the general framework is adapted to the interviewee’s general
background (industry, environmental NGOs, sustainability consultancy, policy-makers) and
individual deeds (scientific/opinion papers, past professional experience, potential connec-
tions, etc). The addition of flexibility provided by semi-structured interviews also prevents
the researcher of failing to investigate a crucial subject as an unexperienced and external
observer.
Industry representatives
In order to assess the impact of the political shift on Ethanol Europe as well as Ethanol
Europe’s reaction towards the rapidly moving political framework, different Ethanol Eu-
rope’s and Pannonia Ethanol’s representatives were interviewed from March until May 2016.
Interviewees include:
• Eric Sievers, CEO of Ethanol Europe renewable ltd since June 2010 (two interviews
were conducted);
• Zoltan Reng, CEO of Pannonia Ethanol Zrt since March 2012;
• Dick Roche, a former Irish Minister for the Environment, now part-time PE’s repre-
sentative in charge of its relation with the European Parliament and the Council of
Europe via the independent consultancy ‘the Skill Set’ (Transparency Register 2016);
• James Cogan, a technology, industry and policy analyst working as part-time represen-
tative for Ethanol Europe on advocacy and public affairs at the European Commission
(Transparency register 2016);
CE
UeT
DC
olle
ctio
n

CHAPTER 3. METHODOLOGY 42
• Zoltan Szabo, an independent environmental consultant at LátensDimenzió Bt unof-
ficially in charge of the interactions between Ethanol Europe and European eNGOs
(two interviews were conducted).
A representative of ePURE has also been interviewed. ePURE, or the European renew-
able ethanol association, is an association aiming to promote renewable ethanol use in Europe
as the ‘unified voice of the European renewable ethanol industry’ (ePURE 2016). It protects
the interests of major European renewable ethanol producers at the European level, as well
as towards the academia, media and public. ePURE is based in Brussels and represents 58
member companies, including 24 ethanol producers based in 16 European countries which
accounts for 90% of the renewable ethanol production in Europe (ePURE 2016). ePURE
officially represents the interests of Pannonia Ethanol at the European level.
EU officials
In order to deepen the analysis, interviews of European policy-makers have been con-
ducted. The interviews were conducted between mid-May and Mid-June 2016. The inter-
views included representatives from:
• Directorate General for Energy (DG ENER), section C1 (Renewables and CCS policy)
and C2 (New energy technologies, innovation and clean coal)
• Directorate General for Mobility and Transport (DG MOVE), section C1 (Clean trans-
port & sustainable urban mobility)
• Environment Directorate-General (DG ENVI), section F1 (Resource Efficiency & Eco-
nomic Analysis)
Representatives from DG AGRI and DG CLIMA were also contacted but could not be
interviewed for this work because of their tight schedules.
NGOs representatives
CE
UeT
DC
olle
ctio
n

CHAPTER 3. METHODOLOGY 43
In order to contextualise Ethanol Europe’s strategies in the biofuel debate, interviews of
environmental NGOs and environmental consultancies have been conducted between mid-
May and Mid-June 2016 as well. Interviewees include biofuel specialists from:
• Transport & Environment (T&E). T&E is an environmental NGO which tries to pro-
mote a European transport policy based on the principles of sustainable development
to minimise harmful impacts on environment and health (T&E 2016a);
• the European Environmental Bureau (EEB), an environmental NGO representing the
voice of European citizens and tries to influence EU policymaking and implementation
based on various principles such as environmental justice or sustainable development
(EEB 2016);
• the Institute for European Environmental Policy (IEEP) (two interviews), a non-profit
research organisation ‘dedicated to advancing an environmentally sustainable Europe
through the analysis and development of policy, and dissemination of research results’
(IEEP 2016).
Representatives from Oxfam, Fern and Birdlife were also contacted but could not be
interviewed due to their tight schedules.
3.1.1.2 Policy review
Documents issued by the CEC (the Council of European Communities), the CoEC (Commis-
sion of the European Communities), the European Commission (European Commission) and
the official journal of the EU have been used. Different books and reports (Kutas et al. 2007;
FAO 2008; Ackrill and Kay 2014; UNEP 2009) were also analysed to provide information
about the general background of the biofuel debate.
3.1.1.3 Other document and events
Other documents provided by European policy-makers, industries as well as environmental
NGOs and environmental consultancy during the interviews have also been considered in
CE
UeT
DC
olle
ctio
n

CHAPTER 3. METHODOLOGY 44
this thesis. Examples include the ‘State of the industry 2015’ (ePURE 2015), the ‘Globiom
study’ (ePURE 2015) and the ‘State of the Art on Alternative Fuels Transport Systems in
the European Union’ (EC 2015b).
This thesis is also based on informations received the Sustainable Energy Week, organ-
ised by the European Commission in Brussels. Two different conferences concerning the
decarbonisation of transport were attended:
• ‘Smart energy solutions for transport - anticipating future challenges’, on the 14th of
June 2016. Speakers included mainly Mr Cacciaguerra (Head of Energy Unit in the
Environment and Energy Directorate) and Mr Van Honacker (Senior Expert Team
Leader for Clean transport European Commission)
• ‘Decarbonising transport & advanced renewable fuels’, on the 16th of June 2016.
Speakers included Miss Donnelly (Director of section C within DG ENER), Miss
Kopczynska (Director of section C of DG MOVE) and Mr Runge-Metzger (Director of
section C of DG CLIMA)
3.1.2 Analysis
All interviewees but one allowed to be recorded. Interview recordings were later transcribed
and extensively analysed. The analysis include confrontation of the different interviewee’s
arguments, as well as thorough research in differentiate scientific facts from assumptions and
political statements.
3.1.3 Quality of data
A research is of high quality if the data collected are representative of the phenomena they
describe (Silvermann 2006). To make sure the research is valid, data from the three main
stakeholders of the biofuels debate (industries, policy-makers, NGOs) have been considered.
This triangulation of data-sources, in addition with other types of data sources (policy
CE
UeT
DC
olle
ctio
n

CHAPTER 3. METHODOLOGY 45
document, reports, books, scientific articles) helps the research to gain a fuller picture of
the different strategies put in place by Ethanol Europe in order so strive in the European
market, as well as their consequences. The constant update of the interview protocol on the
base of the information collected also helps increasing the validity of the research.
3.2 Deficiencies and limitations of the study
There are many limitation to this study, the first being the large variety of subjects of rele-
vance when it comes to biofuels issues. Indeed biofuels constitute a large sector: even when
restricted only to Europe, the numbers of factors of significant relevance can be overwhelm-
ing. A biofuel study is by definition transdisciplinary and in relation with several sectors
such as energy, agriculture, transport, climate and environment. The interactions between
those sectors are complex and each one of them could require a thorough analysis in itself.
Another problem is the still highly controversial aspect of biofuels: most interviewees
wanted to keep their anonymity in order to avoid troubles with collaborating partners. Some
interviewees also had views directly contradicting the more general way of thinking of their
work place, making them in some case hesitant to communicate where relevant background
informations could be found to support their opinion.
Another limitation is the professional secrecy: Ethanol Europe Renewable ltd has to re-
strain informations going public in order to avoid competition issues. Many crucial numbers
like the GHG savings have not been publicly displayed for a few years (see for example figure
4.4), making fact-checking difficult. Lobbying activities can also be quite secretive, as some
interactions are informal. This limitation is worsened by the lack of time for travelling out
of Budapest and the difficulty to match this short time with the highly busy agenda of some
people.
A last limitation is the complexity of the European policy-making process: this research
is especially focusing on the influence between industries, eNGO and the European Com-
CE
UeT
DC
olle
ctio
n

CHAPTER 3. METHODOLOGY 46
mission, thus on the technical aspect of the biofuels issue. The European Parliament and
the Council of Ministers are mentioned in this thesis but are not extensively assessed, since
the influences there are mainly political. To extensively analyse the evolution of biofuels
policy in Europe, further research might explore the significant influence of the European
Parliament and the Council of Ministers, as well as the different political games and lobbying
happening within the two.
CE
UeT
DC
olle
ctio
n

Chapter 4
Results
This chapter focuses on answering the thesis’ aim, aka how did Ethanol Europe adapt to the
political change in Europe. In order to answer this question, this chapter is going through
two main objectives: an analysis of the impact of the political shift on Ethanol Europe, and
an extensive analysis of how Ethanol Europe’s reacted to this change. The latter includes an
analysis of the different Ethanol Europe’s strategies and implementation, as well as of how
Ethanol Europe’s reaction is perceived in Brussels by other stakeholders. This is mainly done
via interviews of EU policy-makers and eNGO’s representatives active at the EU level. Both
analyses are discussed based on the thorough political review from the literature review.
4.1 Background informations
Ethanol Europe, or Ethanol Europe Renewables Ltd., is a holding company based in Ireland
which owns Pannonia Ethanol as well as other biofuels-related investments and facilities such
as companies responsible for corn trading in Hungary. Pannonia Ethanol built and owns a
biorefinery producing bioethanol from corn in Dunaföldvár, a small town of around a 1000
inhabitants 100km south of Budapest (figure 4.1). Pannonia Ethanol’s administration office
is based in Budapest, Hungary. Pannonia Ethanol Hungary for its refinery since it is one of
the country with the highest corn surplus in Europe, with a production of about 8 million
tons of corn a year and a yearly surplus of around 5-10% on average (Jessen 2012; HBT
47
CE
UeT
DC
olle
ctio
n

CHAPTER 4. RESULTS 48
2012).
Figure 4.1: A view of Pannonia Ethanol’s biorefinery in Dunaföldvár, Hungary (PE 2016)
4.2 Ethanol Europe’s story
The influence of EU’s policy framework concerning biofuels on Ethanol Europe’s development
is highly significant. Ethanol Europe was created in 2009, and directly created Pannonia
Ethanol, which started the building of its biorefinery project in Dunaföldvár (Hungary) the
same year (PE 2015a). This quick development was made following the incentive of the
CEP, formulated in 2009. As outlined in the literature review, the CEP created a clear
policy incentive in favour of biofuel: the RED formalised a target of 10% for energy from
renewable sources in transport, while the FQD promoted the use of biofuels to decrease GHG
emissions by up to 10% per unit of energy from fuel and energy supplied (EU 2009a; EU
2009b). The EU ambition was then to clearly stimulate the production of renewable energy,
and the contribution of biofuels towards (...) was expected to be significant’ (EU 2009a).
The building of Pannonia Ethanol’s plant took place starting in July 2010, and the facility
started being producing bioethanol in April 2012 (PE 2015a). However during this period the
European Commission is handling the potential environmental issues of biofuels (influence
CE
UeT
DC
olle
ctio
n

CHAPTER 4. RESULTS 49
on food prices and ILUC effect), pushed by the growing opposition to biofuels in Europe.
Even if the two ILUC models created at that time did not create a scientific consensus,
the growing concerns about potential ILUC effect made biofuels opponent gather behind
the argument (see policy review for more details). The future of biofuels became uncertain,
especially since there are no binding targets for biofuels specifically within the CEP (EU
2009a; EU 2009b). In 2012 the amendments for the CEP such as an undifferentiated cap on
all conventional biofuels and stronger environmental criteria were formulated. Thus, between
the beginning and the end of Pannonia Ethanol’s plant building process, biofuels went from a
promising tool to decarbonise transport to a technology with potentially enormous social and
environmental consequences such as deforestation (via ILUC) and starvation (via influence
on food prices), especially in third countries.
This political shift created a significant impact on Ethanol Europe’s development: while
Pannonia Ethanol’s biorefinery was built in April 2012, the CEP amendments were only
formulated in October 2012. Between April and October, Ethanol Europe announced in June
2012 its intention of building a new biorefinery based on its success (Jessen 2016). The plant
was supposed to be roughly the same size as the one in Dunaföldvár, and located in Mohács
(Hungary). By August 2012, E. Sievers (CEO of Ethanol Europe) was supposed to even
present a third project in Hungary (Jessen 2016). The foresight of the CEP’s amendments
crushed this dynamic: in order to minimise Ethanol Europe’s losses, the two projects were
abandoned in late 2012 (Reng 2016). According to Mr Sievers and Mr Reng, 10 millions had
already been wasted on the Mohács site (see picture 4.2) before it was definitely stopped
(Sievers 2016; Reng 2016). Ethanol Europe also projected to build what would have been
the largest cellulosic ethanol plant in the world in Prilep (Macedonia) in collaboration with
the chemical industry DuPont. The project, located in a poor area of Macedonia, requires
300 million euros of investment and could create up to a thousand jobs (Sievers 2016). The
biorefinery would use a sorghum and switchgrass as main crops in an area where actually
low yield tobacco is grown. However the project is currently on hold for an indefinite period,
due to changing legislation concerning energy crops (Reng 2016).
CE
UeT
DC
olle
ctio
n

CHAPTER 4. RESULTS 50
Figure 4.2: The aborted biorefinery project of Ethanol Europe in Mohács, Hungary (Reng2016)
The brutal political shift between 2009 and 2012 blocked nearly all kind of investments in
the biofuel sector (Sievers 2016). It is however important to notice that Pannonia Ethanol
was able to expand its only existing biorefinery in Dunaföldvár in late 2014 thanks to a
33.8 million euro loan from the Hungarian Export/Import bank in collaboration with the
Canadian investment fund Cordiant Capital (Cordiant 2011). Pannonia Ethanol is in this
sense one of the only biofuel industry that could develop its activities after the 2012 political
shift in Europe (Sievers 2016). The expansion was completed in 2015, year of the ILUC
directive and its 7% cap on all conventional biofuels.
Ethanol Europe is today one of the largest renewable ethanol producers in Europe: from
a production of 220.000 liters of ethanol in 2012, it went to more than 450.000 in 2015 (see
table 4.1). The plant can nowadays handle up to 1,000,000 tons of corn annually. With the
CE
UeT
DC
olle
ctio
n

CHAPTER 4. RESULTS 51
expansion included, the amount of money invested in the facility reach roughly 200 million
euro. As Zoltan Reng, the CEO of Pannonia Ethanol, puts it: ‘We’re very pleased to be
able to deliver on our original business plan and commitments to this community made in
2010, even despite a challenging regulatory climate and the closure of other ethanol plants
in Europe’ (Jessen 2014).
Table 4.1: The production of Ethanol Europe (Reng 2016)
2012 2013 2014Ethanol (liters) 220.000 270.000 450.000DDGS (tons) 165.000 200.000 330.000Corn oil (tons) 0 5.000 15.000
4.3 Ethanol Europe’s reaction
As highlighted above, Ethanol Europe was strongly impacted by the political shift of 2012.
The political change was quick and unexpected: Mr Sievers claims that Ethanol Europe’s
investors were the ‘furthest thing from Brussels’ in 2012, and ‘intrinsically not interested in
regulatory affairs and government relations’ (Sievers 2016). Ethanol Europe and Pannonia
Ethanol representatives considered the CEP before October 2012 as a robust and long-lasting
framework. Mr Sievers recalls this approach today as ‘stupid and completely wrong’ (Sievers
2016).
To adapt as promptly as possible to the new regulatory framework, Ethanol Europe
started two strategies in 2012. The first one is happening outside of the firm: Ethanol Eu-
rope started investing in lobbying activities in Brussels in order to fight for a more favourable
political framework for bioethanol. Internally, Ethanol Europe started to diversify its activ-
ities in order to increase its resilience towards the changing political framework. The two
strategies are extensively reviewed below.
CE
UeT
DC
olle
ctio
n

CHAPTER 4. RESULTS 52
4.3.1 Lobbying activities
Ethanol Europe pursues two lobbying activities in Brussels. The first one is directly via three
of its own lobbyists: James Cogan, Dick Roche and Zoltan Szabo. The second lobbying
activity is indirect via a representation in ePURE, an association representing the vast
majority of renewable ethanol producers at the European level (see the methodology section
for more details).
4.3.1.1 ePURE
ePURE is an association representing Ethanol Europe at the EU level as well as the vast
majority of bioethanol producers’ representation in Europe (ePURE 2016). Created in 2010
after the merging of eBIO and UEPA (the European Union of Ethanol Producers), ePURE
directly started to influence the policy-making process in Brussels in order to avoid a too
radical political shift in 2012.
To influence the policy-making process efficiently, ePURE’s first step is making sure that
the European renewable ethanol industry has a common position on important subjects,
which was a process described by ePURE’s representative as ‘long and exhausting’ (ePURE’s
rep. 2016). The process of creating a common opinion for all ePURE’s members starts in the
working groups and special task forces which are handled by the different ethanol producers
on a voluntary basis. The drafts opinions are then brought up to the board of directors,
which will adopt a ‘position of principles’. The board of directors then meets a few times
a year (at least four times) and is responsible for determining the positions, strategies, and
the actions/representations of the association (ePURE 2016). ePURE’s internal structure is
schematised on figure 4.3.
Once the industry has a common position, ePURE can start lobbying in Brussels. As
explained by ePURE’s representative (2016), this is a two step process: the first is to identify
opportunities/threat in the upstream legislation process, so stay in contact with members of
the different DG (ePURE’s rep. 2016). In this sense ePURE influences policy-makers before
CE
UeT
DC
olle
ctio
n

CHAPTER 4. RESULTS 53
Figure 4.3: Internal working structure of ePURE (adapted from (ePURE’s rep. 2016; ePURE2016)
any legislative proposal is made by the EC. This is crucial since the interviewee estimates
that approximately 85% of the legislative proposal made by the European Commission will
stay in the definitive legislation (ePURE’s rep. 2016). The second step is the major piece of
work: influencing the European Parliament in order to get a legislation more in favour to
bioethanol industry. In order to achieve this ePURE begins by influencing the attribution of
the draft legislation by mobilising MEPs (Member of Parliament) that previously expressed
interests in biofuels matters. ePURE then focuses on each MEP appointed on the matter
by its political group in order to influence discussions (ePURE’s rep. 2016). To convince
MEPs, ePURE is calibrating specific arguments for each ones of them, preferably linked to
their respective country such as national industrial interests. When a MEP is favourable
to ePURE’s opinion, ePURE even draft specific amendments for the MEP to use. Finally
ePURE influences the repartition of the amendments for the vote and tries to include as many
CE
UeT
DC
olle
ctio
n

CHAPTER 4. RESULTS 54
favourable policy elements as possible in the so-called ‘compromise amendments’ (which are
agreed by all appointed MEPs). When the amendments version is final, ePURE sends
voting recommendations to the different MEPs favourable to bioethanol’s industry interests
(ePURE’s rep. 2016).
4.3.1.2 Direct lobbying
Ethanol Europe’s own lobbyists have a less formal way of working compared to ePURE. Mr
Roche for example mainly aims at occupying space on the political stage with bioethanol
issues while highlighting the inconstancies of the political framework concerning conventional
biofuels such as an undifferentiated cap on the whole variety of conventional biofuels (Roche
2016). In order to achieve this Mr Roche uses its political background and former contacts
to help moving forward the issues in a more favourable way for the bioethanol industry.
Mr Cogan has a more specific way of working which is close to ePURE’s method: first
determining the specific legislative processes being designed, second identifying and meeting
the people in charge of those processes, third carefully targeted communications with those
individuals (Cogan 2016). In order to communicate with EU policy-makers, Mr Cogan is in
close contact via emails and meetings if possible. Another channel of communication is the
consultation process of the European Commission, which allows people from different sector
to express their views on specific topics. A last way of communicating is via the publication of
articles in the main news channel read by the policy-makers, which then spreads in different
forms such as newsletters within the European Commission (Cogan 2016).
The last Ethanol Europe’s lobbyists, Mr Szabo, achieves its lobbying activities via digital
communications and the review of scientific papers as well as of policy documents since he is
based in Budapest and not Brussels like Mr Cogan and Mr Roche. If meeting with eNGOs,
Mr Szabo uses the latest studies concerning bioethanol in particular in order to influence
the different representatives (Szabo 2016).
CE
UeT
DC
olle
ctio
n

CHAPTER 4. RESULTS 55
4.3.2 The argument of the bioethanol industry
In order to improve the current political framework, Ethanol Europe’s representatives (Mr
Sievers, Mr Reng, Mr Cogan, Mr Roche and Mr Szabo) and ePURE’s representative put
forward multiple arguments, listed below. The arguments are contextualised within the EU
policy framework, and then confronted with the opinions of EU policy-makers and eNGOS
active at the EU level.
4.3.2.1 GHG savings
The key argument in favour of bioethanol is of course its significant savings of GHG compared
to its fossil equivalent (petrol). The evolution of GHG emission savings allowed by the use
of ethanol as a renewable fuel are illustrated in figure 4.4. We can see that since 2009
the industry has made significant improvement, going from around 50% of GHG savings
to almost 60% in 2013. Notice that data on GHG savings and ethanol GHG emissions for
specific company are not public since 2013 because they are considered sensitive informations
(Sievers 2016). Eric Sievers (2016), the CEO of Ethanol Europe, estimates that the GHG
savings achieved in late 2015 and early 2016 by Pannonia Ethanol were close to 70%, and
expects them to be close to 90% by the end of the decade (see dotted lines on figure 4.4).
The performance and expectations of Pannonia Ethanol and Ethanol Europe are considered
‘consistent with the rest of the (European) industry’ by Mr Sievers (Sievers 2016).
It is interesting to compare those numbers to the evolution of the different environmental
criteria implemented in Europe. The first sustainability criteria was implemented via the
RED in 2009 (EU 2009a). These sustainability criteria imposed a GHG savings target for
biofuels of at least 35%, starting in 2013. This target is then of 50% for 2017 and 60%
for 2018. This means that in 2009, bioethanol was 15% more environmentally efficient than
what was required. The minimal goal of the FQD, the second part of the CEP with the RED,
was in 2009 a 6% reduction of actual GHG per unit of energy from fuel and energy supplied
by 2020 (EU 2009b). This means that in 2009, if only bioethanol is used to decarbonise
CE
UeT
DC
olle
ctio
n

CHAPTER 4. RESULTS 56
Figure 4.4: Average oil and ethanol GHG emission in Europe along with the associated GHGsavings and their predicted evolution (data adapted from (PE 2016b; Sievers 2016))
transport, a minimum of 12% of bioethanol blending (E12) was needed to achieve a 6%
GHG savings.
The development of the ILUC concept between 2009 and 2012 via different mathemati-
cal models such as Aglink-Cosimo and Mirage makes the GHG emissions accounting more
complex. As the models are based on different assumptions, the variability in the results
increases. To prevent potential devastating consequences, the European Commission decides
to make the environmental criteria of the CEP more stringent in 2012: newly built refineries
will have to reach a 60% GHG savings by 2014 (so in two years) (EC 2012). Refineries built
before 2014 gain an extra year to reach 50% of GHG savings (so in 2018), but will they have
to include estimates of ILUC effect. Notice that the impact assessment accompanying the
2012 amendments (see figure 2.5) estimate that corn-based bioethanol a little bit above 50%
of GHG savings (including ILUC effects). Ethanol Europe estimates the GHG savings of
corn-based bioethanol around 55% (PE 2016b). Given that the ILUC effect of corn-based
bioethanol is low (around 20% in figure 2.5), the variability is low as well. Corn-based
bioethanol is in 2012 already respecting the more stringent environmental criteria of 2018.
Mr Sievers’ even estimated GHG savings for corn-based bioethanol around 70% for 2016 and
90% for 2020 (Sievers 2016). If Mr Sievers’ expectations are met, by 2020 a blending of only
CE
UeT
DC
olle
ctio
n

CHAPTER 4. RESULTS 57
6.7% will be required to achieve a 6% GHG savings per unit of energy from fuel and energy
supplied.
The good environmental performance of corn-based ethanol (high GHG savings and low
ILUC) is thus a key argument for Ethanol Europe in order to protect the bioethanol in-
dustry. This argument was shared by all policy-makers interviewed during this work: they
were all in favour of biofuels, or at least considering the option seriously, because of their
significant GHG savings (DG ENER C1 rep. 2016; DG ENER C2 rep. 2016; DG ENVI F1
rep. 2016; DG MOVE C1 rep. 2016). The interviewees estimate that biofuels constitutes
a good transition solution to a greener economy, since they display significant GHG sav-
ings and need low infrastructure/engines modification. This is while other more sustainable
options such as electrification are being developed for the longer term. The argument was
however nuanced by the interviewee from the DG ENVI, which estimates that while biofuels
originating from agricultural surplus or increased yields might have a positive impact, other
negative environmental consequences such as land use competition and the negative impact
on soil and biodiversity needs to be considered as well (DG ENVI F1 rep. 2016).
However recent reports about bioenergy are not as optimistic as Mr Sievers. In 2016
a key study, the Globiom report, estimated corn-based ethanol around 50 gCO2/MJ, so a
GHG savings of around 42% (including ILUC emissions from the most updated science, see
figure 4.6) (Valin et al. 2015). Those numbers put the industry in jeopardy since the industry
might not reach the minimum of 50% GHG savings by 2018. Given that the RED makes
sure that ‘biofuels and bioliquids that do not fulfil the sustainability criteria (...) shall not
be taken into account’ in the targets (EU 2009a), the bioethanol industry might lose their
subsidies in the near future if those numbers were accurate.
4.3.2.2 The use of irrelevant and outdated data
The discrepancies between the data from the Globiom report and Ethanol Europe’s numbers
about GHG savings and ILUC effect is an illustration of how technical and complex the
CE
UeT
DC
olle
ctio
n

CHAPTER 4. RESULTS 58
discussions about biofuels can be.
This argument is highlighted by the interviewee DG ENER C1 (2016), which estimates
that fact-based discussion about biofuels are very difficult due to ‘lack of facts and misun-
derstanding of the complexity and linkages between different sectors’. This interviewee also
highlights the large variety of sectors involved and the strong interactions between some of
them such as agriculture, oil and car sectors. The interviewee thus concludes oversimplifica-
tion in populistic statements are very common (DG ENER C1 rep. 2016).
Oversimplification and populistic statements including the use of outdated or irrelevant
data thus logically constitute another major argument put forward by Ethanol Europe’s
representatives. This is supposedly mainly done by biofuels opponents in order to send con-
tradictory messages and harm the reputation of biofuels. Mr Szabo for example strongly
criticises the inability or unwillingness of eNGO to create a clear differentiation within con-
ventional biofuels (Szabo 2016). He argues that since the ILUC impact analysis of 2012
and more recently the Globiom study in 2016, biodiesel and bioethanol have significantly
different environmental impacts (as illustrated on figure 2.5 and 4.6) and should therefore
not be considered as equal under the denomination of bioenergy. He argues that this non-
distinction has dramatic consequences for ethanol and push policy-makers to ‘throw out the
baby (ethanol and other promising conventional biofuels) with the bathwater’ (Szabo 2016).
He also estimates that palm oil-based biodiesel, demonstrated a numerous times as environ-
mentally inefficient, is used as a scapegoat by environmentalists while the fraction of palm oil
used for biofuels is small (around 10%) compared to the fraction used by the food industry
(Szabo 2016). Mr Szabo argues that because of opinion papers publicly released years ago,
eNGO can no longer nuance their opinion without directly contradicting themselves and
appear publicly unreliable. This argument is supported by the interviewee from T&E for
example, which estimates that its main aim is to ‘eliminate biodiesel’ from the European
market even if it means giving up more promising technologies in the process (T&E rep.
2016).
CE
UeT
DC
olle
ctio
n

CHAPTER 4. RESULTS 59
The tendency of NGO to take informations out of context to support their case is an
argument shared by different interviewees from the DGs (DG ENER C2 rep. 2016; DG ENER
C1 rep. 2016; DG MOVE C1 rep. 2016). Even though all interviewees from the European
Commission were concerned about being equally accessible to industry and NGOs, many
were quite critical about NGOs. The interviewee DG ENER C1 for example argues that
NGOs don’t have a practical view about what is feasible, and that they focus on should be
done. He argues that it’s easy to blame biofuels for everything, even though ‘biofuels have
done more for palm oil security than all the food sector all together’ via the sustainability
criteria and GHG methodology (DG ENER C1 rep. 2016). The interviewee DG ENER C2
qualifies the NGOs as ‘aggressive’ and ‘extreme’ in their attitude towards BF, and estimates
that the majority of politicians is influenced negatively because of NGOs’ tendency to take
sentences out of context (DG ENER C2 rep. 2016).
ePURE’s interviewee (2016) estimate that eNGO do not have any interest in supporting
a particular biofuel such as bioethanol in the future, as it would greatly weaken their main
message about biofuels (ePURE’s rep. 2016). As Mr Szabo, the interviewee argues that
it would also directly contradicts their prior releases about conventional biofuels and make
them appear unreliable. However the interviewee nuanced NGO’s attitude: even though
NGOs campaigned for many years against all kind of biofuels, creating a clear schism with
ePURE, he estimates the relations between ePURE and NGOs has got better in the last
years (ePURE’s rep. 2016). The interviewee estimates that NGOs are currently adjusting
their message accordingly to the latest science by for example targeting palm oil-based
biodiesel more compared to conventional biofuels in general. However ePURE’s interviewee
estimates that eNGO will rather move on and find another enemy to fight such as palm oil
than acknowledging a potential misinterpretation and nuance their discourse (ePURE’s rep.
2016). While this shift in attitude has been confirmed by T&E’s representative, the latter
also estimates that the bioethanol industry should clearly position itself against the biodiesel
industry in order to definitely stabilise the relations between NGOs and the bioethanol
industry (T&E rep. 2016). This position is shared by the EEB’s representative as well,
CE
UeT
DC
olle
ctio
n

CHAPTER 4. RESULTS 60
which further argues that ePURE’s ambiguous position indirectly lead to the ILUC directive
in 2015 and its undifferentiated cap on all types of conventional biofuels (EEB rep. 2016).
On the other hand, it is important to notice that even though relations between Ethanol
Europe and NGO can be chaotic, all interviewees from the European Commission highlighted
their good relationship with Ethanol Europe and the bioethanol industry in general. The
interviewee DG ENER C2 (2016) for example argues that its top priority is to ‘know how
the different actors in the market think’ (DG ENER C2 rep. 2016). The interviewee has had
many open discussions with Ethanol Europe’s and Pannonia Ethanol’s representatives, and
is aware for example of the advancements made at the biorefinery in Dunaföldvár (see ‘other
strategies’ below for more informations). Meetings between industry representatives are
mainly formal via planned meetings and experts conferences, as highlighted by interviewee
from DG MOVE (DG MOVE C1 rep. 2016). Meetings are used to confront DG’s opinion
with the experience of other stakeholders, as well as to gather new elements and data, as
argued by the representative of DG ENVI (DG ENVI F1 rep. 2016).
The interviewees from the European Commission also highlighted the role played by
associations such as ePURE, which has a more holistic view of the sector compared to single
companies such as Ethanol Europe. An interviewee even claims to complement Eurostat
numbers with statistics compiled by ePURE given their great clarity and completeness (DG
ENER C1 rep. 2016). It is interesting however to notice that since European Commission
interviewee meet directly with the industry, some estimate that independent lobbyists (such
as Mr Roche and Mr Cogan) are completely ineffective and useless (DG ENER C2 rep. 2016).
4.3.2.3 The EU’s unbalanced fuel taxation
There is a tendency from the different Ethanol Europe’s representatives to portray the
bioethanol industry as a victim of bigger forces. As seen above, a good illustration of this
is the argument of Mr Szabo, which displays the bioethanol industry as a victims of its
association with less environmentally efficient conventional biofuels such as palm oil-based
CE
UeT
DC
olle
ctio
n

CHAPTER 4. RESULTS 61
biodiesel. Another ‘victimisation argument’ put forward is the unbalanced EU’s fuel taxation
(Szabo 2016).
Many Ethanol Europe’s representatives such as Mr Roche have indeed brought up the
EU’s fuel taxation and its preferential treatment towards diesel rather than renewable energy
such as biofuel (Roche 2016). Bioethanol is indeed heavily taxed compared to its energy
content, as illustrated on figure 4.5. Mr Cogan argues that the taxation originates from
the lobby of the huge oil companies in collaboration with huge car companies, in order to
create a system with enormous inertia which prevents the biofuel industry from growing
in the European market (Cogan 2016). Mr Roche argues that this system is twisted and
counter-intuitive, especially after the dieselgate and the public leaks demonstrating how the
car manufacturers were cheating on the diesel emissions. Mr Roche concludes by denouncing
a ‘continuum of guilt across the whole spectrum of EU policies’ in this matter (Roche 2016).
Figure 4.5: Taxation of transport fuels by energy content (ePURE 2015)
It is interesting to notice that the argument about preferential taxation treatment towards
diesel, one of the most polluting liquid fuels, is also controversial within the different DGs.
The interviewee DG ENER C1 (2016) for example strongly denounces the current system
(DG ENER C1 rep. 2016). However there are a few reasons explaining the taxation systems:
CE
UeT
DC
olle
ctio
n

CHAPTER 4. RESULTS 62
the first one is that taxation is a member state competence and not an EU one, as pointed
out by an interviewee from DG ENER (DG ENER C1 rep. 2016). The interviewee argues
that member states are not ready to give up preferential treatment to diesel because of its
extensive use in heating and cooling, which is a very sensitive political question because of
its social aspect (DG ENER C1 rep. 2016).
Another reason explaining the EU taxation treatment is the so-called ‘European diesel
deficit’ (see the introduction for more details). The interviewee DG ENER C1 (2016) argues
that while gasoline is on average more abundant in the rest of the world compared to diesel,
the situation is the opposite in Europe (DG ENER C1 rep. 2016). The EU diesel deficit thus
fostered gasoline exportation from the EU and diesel importation to the EU. In this sense,
biodiesel produced in Europe theoretically can increase energy security and help to reach
environmental targets in Europe by replacing fossil diesel imports from outside of Europe.
This might explain why the biodiesel is less taxed compared to bioethanol in Europe, the
latter being of less use. It is important to notice however that in practice biodiesel doesn’t
display significant GHG savings and can even be more pollutive than its fossil equivalent
because of its high ILUC effects (see figure 4.6). While Mr Roche (2016) argues that the
European diesel deficit has been caused by the EU taxation framework, it is thus more likely
that the unbalanced taxation system is just the reflection of physical scarcity of resources
such as diesel in Europe. In this sense, bioethanol industry is thus indeed victim of other
forces such as disparate physical resources in Europe and social aspects of other fuels such
as diesel. It is also important to notice that the development of shale gas in the US and
the massive production of bioethanol in the US and Brazil might threaten the market for
EU gasoline exportation in the future, decreasing the demand for bioethanol in Europe even
more compared to biodiesel.
4.3.2.4 Economic benefits
Another argument put forward by Ethanol Europe’s representatives is the large economic
benefits bioethanol production creates. As biofuels are produced all year long, growing
CE
UeT
DC
olle
ctio
n

CHAPTER 4. RESULTS 63
crops for biofuel production brings economic stability to farmers as ‘cash crops’ especially
for farmers in Eastern Europe countries such as Hungary or Romania (Roche 2016; Sievers
2016). In practice Ethanol Europe is under contract with many farmers, guaranteeing a
fixed price for grown corn (PE 2015c). As the leading ethanol producer in CCE, Pannonia
Ethanol has an estimated impact of 500 millions euro on Hungary’s GDP (PE 2015c). The
plant in Dunaföldvár has created 2000 long-term jobs, mostly in the rural areas around
the plant. As the mayor of Dunaföldvár puts it: ‘As a stable, large employer operating a
pollution-free industrial asset, Pannonia (Ethanol) has given this community the income and
anchor investment necessary to enable our transition to a sustainable future based on the
rural bioeconomy’ (Jessen 2014).
This argument is also shared by some DGs such as the DG AGRI and DG ENER. As
argued by the EEB’s interviewee, the DG AGRI is pro-biofuels as it has blocked the amend-
ments of the CEP in 2012 in order to protect the additional steam of income for the farmers
originating from biofuels (EEB rep. 2016). The DG AGRI is thus less concerned by environ-
mental issues, compared to the DG ENVI. The bioethanol industry also displays agricultural
benefits: by stabilising the farmer’s incomes, farmers can invest more in equipment and com-
modities and increase the productivity of their agricultural lands.
In this sense Mr Roche argues that the cap on conventional biofuels might lead to the
loss of a huge economic opportunity for Eastern Europe countries (Roche 2016). Indeed
he estimates that those countries ‘have important unused lands’ which could be used for
biofuels production, but that ‘their interests have not been properly defended and looked
at’ (Roche 2016). This argument is not agreed upon by EU policy-makers and eNGOs.
Interviewee DG ENER C2 (2016) for example argues that it is more about how proactive
EU countries are (DG ENER C2 rep. 2016). Interviewee DG ENER C2 also argues that the
7% undifferentiated cap from the ILUC directive on conventional biofuels doesn’t match the
actual production, which leaves room for more investments (DG ENER C2 rep. 2016). On
the other hand all the eNGOS interviewed for this work highlights the potential risks for
CE
UeT
DC
olle
ctio
n

CHAPTER 4. RESULTS 64
biodiversity resulting from growing crops on currently ‘unused land’ (T&E rep. 2016; EEB
rep. 2016; IEEP 2016). Those interviewees argues that aiming for energy efficiency would
be a far better solution, which might also end up being a greater economic opportunity in
the long term.
4.3.2.5 The generalised approach towards conventional biofuels
A last argument widely used by Ethanol Europe’s representatives is the critique of the undif-
ferentiated cap formulated in the CEP amendments in 2012 and then the ILUC directive in
2015 (Sievers 2016; Reng 2016; Cogan 2016; Szabo 2016). Those caps make the bioethanol
industry face a clear regulatory risk for the period post-2020, by tying the bioethanol in-
dustry to less environmentally efficient type of conventional biofuels such as biodiesel. This
discriminating approach towards conventional biofuels has thus been strongly criticised by
all Ethanol Europe’s representatives interviewed for this work. The lack of differentiation
between bioethanol and biodiesel in EU policies, two biofuels diverging by the process and
environmental performance, has for example been qualified ‘as the most frustrating part of
the policies’ by Mr Szabo (Szabo 2016).
However EU policy-makers and eNGO’s representatives are well aware of the differences
within conventional biofuels. An extensive distinction between the different types of biofuels
can be found in many different official EU documents such as the RED (Annex III), the
FQD (Annex IV), the impact assessment accompanying the ILUC amendments in 2012 or
the Globiom study requested by the European Commission in 2015 (Valin et al. 2015).
In addition, the policy-makers met during this work all stressed the crucial need to meet
regularly with the industry to update their knowledge, getting insights about practicalities,
and more generally argue about how to improve the current situation. Qualifying EU officials
and eNGO representatives as not knowledgeable/competent enough is thus more of a political
statement than a practical reality.
In practice, an element that might have lead to the undifferentiated cap between conven-
CE
UeT
DC
olle
ctio
n

CHAPTER 4. RESULTS 65
Figure 4.6: Emissions from biofuels made from different feedstocks, composed of directemissions (from Renewable Energy Directive) and land-use change emissions (from Mirageand Globiom studies) (T&E 2016d)
tional biofuels is the ambiguous position of the bioethanol industry. Indeed while bioethanol
and biodiesel are biofuels with very different environmental performances (as highlighted by
Ethanol Europe’s representatives), the interests of the two industries are tied in practice be-
cause they share common interests. bioethanol’s industry ambiguous approach is especially
apparent within ePURE: indeed the association also includes agricultural cooperatives with
interests in the biodiesel industry. When asked about the issue, ePURE’s representative
explains that ‘the bioethanol industry can’t fight the biodiesel industry since it is basically
the same people’ (ePURE’s rep. 2016). When it comes to Ethanol Europe, the development
CE
UeT
DC
olle
ctio
n

CHAPTER 4. RESULTS 66
of advanced biofuels at the Dunaföldvár biorefinery is also a good illustration of the blurry
boundary between bioethanol and biodiesel industry’s interests: while Ethanol Europe is
specialised in bioethanol production (as its name indicates), it is today developing a process
via Naturally Scientific which will be involved in (advanced) biodiesel production (see the
‘Research and Development’ section below).
Because bioethanol and biodiesel are very different products, they call for different lobby-
ing strategies. Biodiesel has proved many times to have a great environmental consequences
with high ILUC effect (creating deforestation in third countries because of palm oil produc-
tion) which resulted in low or even negative GHG savings (see figure 4.6). The biodiesel
industry is thus involved in more aggressive lobbying activities that include denial of sci-
entific evidence (EBB 2016a; EBB 2016b) and obstruction of the release of new scientific
studies such as the Globiom study (EEB rep. 2016). This is in clear contrast with Ethanol
Europe’s representatives, who push for a GHG quota approach, the acknowledgement of
new science study and especially the Globiom study, which is more in favour of bioethanol
than biodiesel (Sievers 2016; Szabo 2016). However the bioethanol industry do not issue
statements publicly backing up new science, which contrasts with how strongly the Globiom
study is publicly antagonised by the biodiesel industry.
The love-hate relationship between the biodiesel and the bioethanol industries has dev-
astating effect for the latter. ePURE and the bioethanol industry are stuck: the nasty game
played by the biodiesel industry is poisoning the biofuel debate, and leading a potential
phase-out of subsidies for conventional biofuels for the period post-2020 (such as suggested
by Marie Donnelly, the director of Directorate C of DG ENER, see (Simon 2016)). Biodiesel’s
bad environmental performance is the main reason of eNGOs opposition to a conventional
biofuels development in Europe. Indeed phasing-out biodiesel is the top priority of eNGOs’,
and especially palm oil-based biodiesel, which is evaluated as 3 times worse than its fos-
sil equivalent in the Globiom study (see figure 4.6). In the NGO’s sense, palm oil-based
biodiesel is sufficiently bad to justify the loss of other better performing product such as
CE
UeT
DC
olle
ctio
n

CHAPTER 4. RESULTS 67
bioethanol (T&E rep. 2016). This statement is even clearer after one of T&E’s latest release
in May 2015 highlighting that 45% of imported palm oil in EU is used for biodiesel pro-
duction, as opposed to the traditional 10% number advanced by the industry (T&E 2016c).
As explained by an EEB’s representative, the EEB and ePURE were ‘close to a common
position, but that it did not materialise because of ePURE’s lack of will to differentiate itself
from the biodiesel industry’ (EEB rep. 2016).
4.3.3 The perfect policy framework
Ethanol Europe’s representatives are lobbying in Brussels in order to shape a policy frame-
work more favourable to bioethanol. Such a perfect (or at least better) policy framework
would in their sense recognise the role ethanol could play in reducing GHGs and stop assimi-
lating ethanol to other kind of less performant conventional biofuels such as biodiesel (Sievers
2016; Szabo 2016; Cogan 2016). In this sense, a policy framework based on a carbon inten-
sity approach such as the FQD’s (see policy review for more details), has been praised by
all Ethanol Europe’s representatives. Such an approach, combined with a phase-out of sub-
sidies, would let the markets differentiate the different biofuels based on the environmental
performance and economic cost. This might thus theoretically foster bioethanol compared
to biodiesel in a free market, given bioethanol’s far better environmental performance (see
Globiom estimations on figure 4.6).
Fostering the carbon intensity approach of the FQD in the period post-2020 compared to
the RED approach has been praised by all interviewees from the European Commission and
eNGO’s representatives as well. However T&E and the EEB (2016) would support such an
approach at the strict condition that the environmental criteria are strengthened even more
(T&E rep. 2016; EEB rep. 2016). This means that GHG accounting should includes all types
of GHG emissions originating from biofuels production, especially the ones originating from
ILUC effect, in order to not go back to the legislation of 2009 before the ILUC debate (T&E
rep. 2016; EEB 2016). This framework would in their sense develop advanced biofuels by
limiting biomass overexploitation and decreasing ILUC effect in third countries by penalising
CE
UeT
DC
olle
ctio
n

CHAPTER 4. RESULTS 68
high ILUC biofuels such as biodiesel. In order to smooth the transition, T&E’s interviewee
argues that gradual indicative targets for advanced biofuels (such as in 2025) are needed as
well as an explicit long-term objective to stabilise the investments (T&E rep. 2016). The
indicative targets would be constantly reevaluated in order to make sure that the advanced
biofuels produced are not environmentally disruptive.
However many interviewees argue that lots of unknowns remain about the most efficient
way to reach a carbon-free transportation sector in the long term. The interviewee DG
ENER C2 (2016) for example argues that the likely policy approach post-2020 is the trans-
fer of quotas (so an extension of the RED approach) from member states to market operators
(oil companies) (DG ENER C2 rep. 2016). The interviewee agrees that a carbon approach
would be more effective, but argues that it would be hardly doable politically speaking. On
the other hand eNGOS are strictly against the quotas approach such as volume/blending
mandate for biofuels (T&E rep. 2016; EEB 2016). T&E’s interviewee for example estimates
that biofuels mandates is a risky option since advanced biofuels might also hide great poten-
tial environmental risks (T&E rep. 2016). The interviewee argues that the ILUC effect came
as a surprise for conventional biofuels, and that a new environmental threat might create a
new u-turn in European policies.
There are thus discrepancies between what would be environmentally desirable and what
is politically doable, respectively a carbon intensity approach associated with strong en-
vironmental criteria and a quota approach. Even if policy-makers, Ethanol Europe’s and
eNGO’s representatives praise an ‘improved FQD approach’ for the period post-2020, the
likely approach for the future is a transfer of quotas from the European to the national level,
as pointed out by one interviewee of DG ENER and the interviewee from DG ENVI (DG
ENER C2 rep. 2016; DG ENVI F1 rep. 2016). This is mainly due to the extreme political
difficulty originating from the complexity of the biofuel debate. While all European Com-
mission interviewees push for the development of advanced biofuels and the electrification of
road transport in the mid and long term, the interviewees also acknowledge that the future
CE
UeT
DC
olle
ctio
n

CHAPTER 4. RESULTS 69
of biofuels in Europe is too complex to predict. The variability originates from a variety of
factors: the first one is the differences between the technological development of the different
advanced biofuels. While the ILUC directive has an indicative target of 0.5% of advanced
biofuels for 2020 (EU 2015), it is quite difficult to predict the amount of advanced biofuels
that will be available on the markets by 2030, as highlighted by an interviewee from DG
ENER (DG ENER C2 rep. 2016). The interviewee DG ENER C1 (2016) highlights that
a good policy framework would foster diversification of feedstocks needed for the different
advanced biofuels in order to stabilise energy security in Europe (DG ENER C1 rep. 2016).
The successful transition of advanced biofuels through the so-called valley of death and their
introduction in markets is also a difficult step, as explained by an interviewee from DG
ENER (DG ENER C1 rep. 2016).
Another major source of uncertainty is the shift of paradigm in the biofuel debate during
the last ten years, from ‘biofuels vs oil industry’ to ‘internal combustion engines vs electrical
engines’, as explained by the interviewee DG MOVE (DG MOVE C1 rep. 2016). The
interviewee indeed estimates that the future of biofuel might be threatened in the near
future by a technological breakthrough in electrical battery development, which will greatly
accelerate the development of cheap electric cars. In this sense, the interviewee estimates
that the decarbonisation of transport has become more of a technological than a political
challenge, and is thus uncertain as well as out of politicians’ hands (DG MOVE C1 rep. 2016).
It is however important to notice that breaking down a European target into national targets
might create a legal system too soft to succeed, as pointed out by the interviewee from DG
ENVI (DG ENVI F1 rep. 2016). The interviewee argues that in such a case success will
depend on the will and efforts of the European Member States to promote renewables, as
well as on more general framework conditions such as oil price or the cost of renewable energy
development. The interviewee concludes that the EU ‘won’t be able to hold the Member
States legally accountable’ in the case of failure (DG ENVI F1 rep. 2016). Such an approach
might thus threaten bioethanol industry’s future.
CE
UeT
DC
olle
ctio
n

CHAPTER 4. RESULTS 70
Apart from the political difficulty, another reason explaining the success of the quota
approach compared to the carbon intensity (even though the latter is praised by all inter-
viewees in this work) is the lack of coordination of bioethanol producers. Many Ethanol
Europe’s representatives estimate that the vast majority of ePURE members are neglecting
their representation at the European level, or at least not investing enough effort and money
to allow ePURE to have a significant impact on the policy-making process (Sievers 2016;
Cogan 2016). Ethanol Europe’s representatives also argue that ePURE lacks efficiency, am-
bition and a long-term vision. Those are mainly caused by the variety of point of views
within ePURE’s members about the most efficient strategy to adopt in order to protect
the renewable ethanol industry. Some interviewee then describes ePURE as a mirror of the
ambient disorganisation in the ethanol sector. This lack of efficiency from both ethanol pro-
ducers and ePURE is the reason that pushed Ethanol Europe to invest unilaterally and send
its own lobbyists to Brussels (Mr Cogan and Roche), in addition of being heavily involved
within all the different regular and special working groups of ePURE (see ePURE’s internal
structure on figure 4.3).
ePURE’s lack of efficiency is nuanced by its representative, which argues that effective
lobbying activities on the national level are crucial as well since the Council of Ministers is a
crucial element of the European decision-making (ePURE’s rep. 2016). Indeed the Council
is out of ePURE reach, and a usual obstacle to a legislation more in favour of biofuels. In
2012 for example ePURE succeeded in introducing a sub-target specific for ethanol in the
proposal for the CEP amendments, which was voted by the European Parliament (ePURE’s
rep. 2016). The proposal was however unfortunately rejected when analysed by the Council
of Europe, mainly because of a lack of lobbying from ePURE’s members at the national level
(ePURE’s rep. 2016). ePURE’s representative estimates that the climate-friendly argument
of the bioethanol industry can compete with oil companies within the European Parliament,
but its influence is greatly reduced within the Council, which is thus where bioethanol needs
the most support. Furthermore he argues that national lobby is crucial when it comes to
implement European decisions: they shape the national public opinion and help to smooth
CE
UeT
DC
olle
ctio
n

CHAPTER 4. RESULTS 71
the transition from fossil to renewable fuels such as in France (ePURE’s rep. 2016). Lobbying
activities at the national level also prevent or at least counter-balance anti-biofuel lobbies,
which can have devastating consequences such as during the E10 implementation in France
(ePURE’s rep. 2016).
4.3.4 Other strategies
Apart from its lobbying activities, Ethanol Europe is also heavily involved in a variety of
technical developments. This strategy has been implemented starting in 2012 in reaction
to the changing political framework in the EU. The different technological developments
include research and development of advanced biofuels as well as the diversification of ex-
isting production methods, in order to increase Ethanol Europe’s inertia towards any future
political shift. The different projects are reviewed below.
4.3.4.1 Research and development
As explained above, Ethanol Europe’s development was greatly impacted by the political
shift in Europe in 2012. In reaction, Ethanol Europe greatly developed its research and
development section in addition of its lobbying activities. The technological development
is so significant that Mr Sievers (CEO of Ethanol Europe) estimates that the firm moved
from a ‘development and operating company’, generating incomes from ‘buy(ing) someone
else’s technology’ to a technology company (Sievers 2016). Mr Sievers claims that Ethanol
Europe might diversify so much in the future that ethanol would not constitute its core
income anymore, considering such a scenario a ‘success’ (Sievers 2016).
Ethanol Europe has been testing more than ten new technologies in Dunaföldvár starting
in 2012, the year of the CEP amendments (Sievers 2016). Mr Sievers claims that the majority
of those investments turned out to be economically profitable. An example is corn oil:
after developing an original system to produce corn oil, the technology paid off within a
year (Sievers 2016). Corn oil industrial production started in 2014 with a production of
5.000 tons (see table 4.1). An example of commercial failure is the attempt to convert the
CE
UeT
DC
olle
ctio
n

CHAPTER 4. RESULTS 72
fibers originating from the ethanol production process into cellulosic ethanol. The enormous
amount of fibers from the ethanol production process could have resulted in 20 millions liters
of cellulosic ethanol, but the technology proved unsuccessful (Sievers 2016).
Naturally Scientific technologies limited
In order to boost its research capacities even more, Ethanol Europe also bought the
firm Naturally Scientific technologies limited (referred to later as ‘Naturally Scientific’), a
promising R&D company focusing its efforts on the development of advanced biofuels (Sievers
2016). The advancements achieved by Naturally Scientific ltd are illustrated by the filing of
two main patents: the first one is entitled ‘Production of biofuels from tissue culture sources’
and has been filed in 2009 (Whitton, Dixon, and Merrel 2009). The second one is called
‘The photosynthesis process’ and has been filed in 2012 (Whitton 2012). The two patents
make use of the photosynthesis process while trying to optimise its conditions (lightening,
nutrient and medium composition, etc).
In the 2009 patent, Naturally Scientific aims to produce Pure Vegetable Oil (PVO) via
a suspension culture of cells in a strictly controlled environment. The process either use
both photosynthetic and mesoderm cells (in which case the only inputs needed are light
and water), or only mesoderm cells (with artificial inputs of sugar and oxygen). The newly
created PVO can then later be converted via a trans-esterification into Fatty Acid Methyl
Ester (FAME), the main component biodiesel, or ‘in any other product that comprises
FFA and vegetable oils’ (Whitton, Dixon, and Merrel 2009). Naturally Scientific discovered
that maintaining a pH between 4.5 and 5 provokes the acidification of the cytoplasm of
the grown cells, causing the release of the oils/FFA from the intracellular storage into the
cytosol of the cells and then into the culture medium, creating a micro-emulsion. A pH
above 4.5 then breaks down the emulsion and allows the oil/FFA to bioethanol collected in
a very east way: on the surface of the culture medium as a discrete layer. Using enzyme
inhibitors (to help the transesterification) as well as antibacterial and anti-fungi compounds
(to prevent contamination), Naturally Scientific can ‘keep cell populations healthy for over
CE
UeT
DC
olle
ctio
n

CHAPTER 4. RESULTS 73
a year’ (Sievers 2016). The whole process is illustrated in figure 4.7.
Figure 4.7: Schematisation of the two different processes of the patent ‘Production of biofuelsfrom tissue culture sources’ filed by Naturally Scientific ltd in 2009
The 2012 patent describes two improvements done to the conventional photosynthetic
process (Whitton 2012). The major one is the use of carbonic acid instead of gaseous CO2 to
feed the autotrophic plant cells. This increases of a factor 1000 the concentration of carbonic
compounds reaching the plants compared to CO2 present in ambient air. This approach was
never considered before since such high levels of carbonic acid were thought to be toxic. The
second improvement is the low pH used during the process: Naturally Scientific discovered
that a decrease in pH lowers the energy requirements for photosynthesis (Whitton 2012).
The main advantage of the third generation biofuels produced via the two patents ex-
plained above is its lack of competition with conventional food production: as the advanced
CE
UeT
DC
olle
ctio
n

CHAPTER 4. RESULTS 74
biofuels is produced in a batch via cell culture, the process doesn’t require arable lands.
Furthermore, given that the process only requires light and water and thus no feedstock,
it doesn’t compete with other industries. The low amount of resource needed to run the
process also makes it cheap on paper, compared to conventional agriculture processes. For
example cells in a controlled medium culture grow at a much faster pace than plants do
in natural conditions (soil) (Whitton 2012). It was theoretically determined by Naturally
Scientific that the two-culture system of the two patents requires 20 times less energy to
produce sugars than what would be needed by plants planted in soil (Whitton 2012). Com-
pared to previous published work of oil-producing algae (which requires energy to lyse the
cells and for the recovery of the oil produced), the improvement of energetic efficiency is
about 35% (Whitton 2012). The use of solar energy as light input might decrease the costs
of the process even further.
The strictly controlled medium also impact the quality of the product: biofuels originating
from this new process present a very uniform distribution of chain lengths compared to the
ones produced by agricultural means (Whitton 2012). The product can be thus considered
more reliable than conventional biofuels. Other improvements were achieved during the
research of Naturally Scientific: the amount of methanol required for the transesterification
for example has been greatly lowered. Beforehand, a ratio of 6:1 of methanol was needed
in addition to PVO to create FFA (Whitton 2012). In this process, the ratio is only 1/7.5,
therefore a 4500% improvement of efficiency in methanol use (Whitton 2012). This lowers the
final price of the product even more by decreasing the price of the input needed of methanol.
However as this new process is currently being tested in Ethanol Europe’s biorefinery in
Dunaföldvár, there is no empirical evidence to demonstrate that process is feasible in practice,
or that the energetic balance is profitable yet.
4.3.4.2 Valorisation of ethanol production by-products
In addition to the research and development of advanced biofuels, Ethanol Europe also
started to optimise its production process of bioethanol and valorise its by-products. This
CE
UeT
DC
olle
ctio
n

CHAPTER 4. RESULTS 75
strategy has three advantages: firstly it increases the benefits from the process, making it
possible for Ethanol Europe to lower the price of the ethanol sold on the market, making
renewable fuel production more competitive in Europe on global markets. Secondly, the
process produce less waste and sewage as well as more desirable commodities which can be
used efficiently by other industries, on a circular economy model. Thirdly, it creates addi-
tional streams of incomes for the company, making it more resilient to changes in European
policies such as the amendment of the CEP in 2012.
As illustrated in the introduction with figure 2.2, there are currently three main products
created during ethanol production. The first one Distiller’s Dried Grains with Solubles, or
DDGS. DDGS production started in 2012 and is branded as ‘Pannonia Gold’, a ‘superior
(animal) feed ingredient produced from Hungarian maize’ which is GMO and antibiotics free
as well as GMP+ certified (PE 2016a). Research is being made to take the fibers out of
the product to reduce transportation costs (Sievers 2016). The second ethanol by-product
is corn oil. Corn oil is being valorised as an ‘ideal for feeding swine and poultry’, with a
digestibility in the swine digestive tract of 94% and more (PE 2016b). The production of
corn oil started in 2014.
A last ethanol by-product is the CO2 released during by the yeasts during the fermenta-
tion process. The CO2 released in the process is still not being valorised for the moment, as
pointed out by Mr Sievers (Sievers 2016). However the CO2 released is pure and thus doesn’t
need to be filtrated or concentrated in order to be sold (Sievers 2016). The CO2 could be
used for example by beverages company, but this option is considered ‘not very inspiring ei-
ther from an environmental standpoint or revenues standpoint’ by Mr Sievers (Sievers 2016).
Other options are being considered as we speak in order to valorise its output of pure CO2
on the market.
CE
UeT
DC
olle
ctio
n

CHAPTER 4. RESULTS 76
4.3.4.3 Conquest of sectors external to biofuels production
As a commodity, bioethanol can also be used in industries external to the biofuel sector such
as the pharmaceutical industry. The mixture of ethanol with additives in order to make
an undrinkable solution has for example a wide range of industry uses as a general purpose
solvent (PE 2015b). Another application in the pharmaceutical industry is the use of DDGS
fibers, one of the by-products from ethanol production. According to Mr Sievers, fibers do
provide an immune benefit when degraded the right way in swines’ intestinal tract (Sievers
2016). If this market can be reached, Ethanol Europe might valorise its yearly production
of 100.000 tons of fibers a year, which have currently a very low economic value.
In the future Mr Sievers has also potential plans to team up with the bioplastic industry
(Sievers 2016). Plastic bottles for example are partially made of PET (mono-ethylene glycol),
which is a derivative of ethanol (Lligadas et al. 2013). The production of poly-amides is made
possible as well, based on the process developed by Naturally Scientific (see the two patents
above). Beverages producers or car manufacturers could use those compounds traditionally
produced via fossil fuels, without any significant transformation to their industrial process
(Sievers 2016). It is also important to notice that the use of renewable input in the bioplastics
industry could also benefit the image of the companies using them as a marketing argument
(see Coca Cola green for example).
CE
UeT
DC
olle
ctio
n

Chapter 5
Discussion
This chapter aims to discuss the position of Ethanol Europe and its strategies in the current
context of the biofuel debate, based on the literature review and the results section of this
work. In addition, this chapter seeks to identify the different major elements of the biofuel
debate, analyse how they interact with the bioethanol industry (and Ethanol Europe in par-
ticular) in order to predict different future scenarios for Ethanol Europe and the bioethanol
industry. Based on the analysis, some recommendations are given as well.
As we saw, the political framework concerning biofuels quickly changed in Europe: in
2003, the biofuels directive was formulated and the European Commission informally aimed
to reach a 20% substitution of conventional fuels by 2020 (EU 2003). Biofuels were meant to
increase energy security, while helping environmental preservation and stimulate rural devel-
opment, the three drivers that have lead the biofuels policy evolution since 1985. However
from a logic of minimum target in 2003 (in order to stimulate as much as possible the pro-
duction), biofuels went to an undifferentiated cap on all conventional biofuels in 2012 (with
the amendments of the CEP) and then in 2015 (with the ILUC directive) (EU 2015; EU
2009a). Biofuels went thus from crucial tools for decarbonising EU transport while helping
Europe to reach its climatic target and green its EU economy, to technologies with potential
disastrous environmental consequences. As highlighted in the policy review and the results
section, this shift in attitude towards biofuels in EU legislation originates from two potential
77
CE
UeT
DC
olle
ctio
n

CHAPTER 5. DISCUSSION 78
environmental consequences of biofuel: their influence on food prices (an effect famous as
the ‘food vs fuel’ debate) and the ILUC effect.
Ethanol Europe reacted to this political shift in different ways. The first is starting lobby-
ing activities, which are extensively reviewed in the results section. As highlighted, Ethanol
Europe’s representatives used five main arguments during their direct (via its Ethanol Eu-
rope’s own lobbyists) and indirect lobbying (via ePURE) at the EU level. The key argument
used is the significant GHG savings that allows ethanol use. While the quality of this argu-
ment is dependent of the feedstock to produce bioethanol (the Globiom report for example
estimates that wheat-based bioethanol doesn’t create significant GHG savings, see figure
4.6), the GHG savings originating from corn-based bioethanol has always proved significant.
This is especially true for Ethanol Europe, since the corn it uses is in vast majority origi-
nating from Hungary, a country with vast areas of unused lands an ILUC effect with low
environmental consequences, if any. Another irrefutable argument in favour of bioethanol
is the large economic benefits it creates: Ethanol Europe has an estimated impact of 500
millions euro on Hungary’s GDP, as highlighted in the results section. In the current time
of growing urban migration, this wealth creation is even more positive since it benefits rural
communities and allow them to develop. Ethanol Europe’s production of biofuels in a de-
centralised way is also increasing energy security in Europe. Bioethanol is thus increasing
energy security (local energy production), environmental preservation (via GHG savings)
and rural development (significant impact of the biorefinery in the Dunaföldvár region).
Why then would a policy framework put a cap on conventional biofuels? The answer
to this question is complex. As highlighted in the results section, the biofuels debate is
by definition transdisciplinary. Each sector involved have interacts differently and adds
its own layer of complexity to the debate. The ILUC effect, one of the two environmental
consequences of biofuels that lead to the shift of attitude in the EU policy, is a good example
of how long and exhausting trying to solve a biofuel issue can be. The concerns about ILUC
effects were introduced in the biofuels directive proposal (EU 2003), but were removed from
CE
UeT
DC
olle
ctio
n

CHAPTER 5. DISCUSSION 79
the final version, as highlighted in the policy review. They were formally issued in 2009,
the debate took place during 6 years to find a common ground, which lead to the CEP
amendments in 2012 (EU 2009a), and the final ILUC directive in 2015 (EU 2015). Creating
a science around ILUC robust enough to lead the European Commission and European
Parliament revealed a difficult task, as illustrated by the great variability in results between
the Mirage and the Aglink-Cosimo models, or more recently the Globiom model (Valin et al.
2015). Apart from science complexity, finding a common ground around biofuels was made
even more pressing by biofuels opponents such as eNGO, which were strongly polarising
the public opinion about biofuels, increasing the pressure even more on bureaucrats and
politicians.
Given the intense complexity of the ILUC debate, the resulting policy from such a contro-
versial debate could not be satisfactory. Indeed policy-makers met during this work explicitly
acknowledge that the 5% cap of the CEP amendments, and then the 7% cap of the ILUC
directive, are not great solutions. But they were the only solutions doable at that time in
order to restrain biofuel production in order to make time to understand their consequences
a little more. It was just a precaution to prevent catastrophic consequences originating from
biofuels production.
However understandable, the EU legislation went only in three years from stimulating
biofuels growth (CEP) to restrain it (CEP amendments). A three years period is extremely
short in a policy environment: policies are indeed supposed to be time-consistent guidelines
in order to stimulate investments. As highlighted in the results section, Ethanol Europe’s
biorefinery in Dunaföldvár took three years to be built. The investments based on the 2009
CEP were thus compromised because of political uncertainty, and investors such as Ethanol
Europe felt that they were cheated.
Policy-makers however are well aware of the huge consequences such a rapid political
shift has had on the conventional biofuels sector. As highlighted in the results section,
policy-makers are still today largely in favour of biofuels production. In order to smooth
CE
UeT
DC
olle
ctio
n

CHAPTER 5. DISCUSSION 80
the transition as much as possible, the emphasis in EU policies has been put on advanced
biofuels. In that sense, policy-makers can safely push for increasing biofuels production,
since advanced biofuels theoretically avoid environmental consequences: because created
from waste of without lands, advanced biofuels display no ILUC and no influence on food
price (see the literature review for more details). In order to publicly display it and stimulate
investments again, a large push for advanced biofuels development has been made available
throughout the years, without real success. Because they are no mandatory targets for
advanced biofuels yet, investors in the biofuel sector are still on hold today.
Summer 2016 is a crucial period for conventional biofuels producers: a communication
about goals for decarbonising transport is expected in July 2016. This communication
precedes a new revision of the RED in late 2016. The new legislation is expected to clarify
the future of advanced biofuels, and confirm or not the drawback of subsidies for conventional
biofuels for the period post-2020. There is a strong controversy currently going on about
what such a revision might include. Marie Donnelly, director of section C within the DG
ENER, has for example displayed various and sometimes contradictory statements about
biofuels future. While the DG ENER is traditionally more in favour of biofuels (since it
increases energy security, one of the DG’s main concern) compared to other DGs (such as
DG ENVI, more concerned by environmental impact of biofuels), Marie Donnelly has claimed
that the 10% target for renewable energy in Europe might disappear in the newly revised
RED (Simon 2016). Even if such a radical statement has later been denied by representatives
from DG ENER, the confusion revolving around biofuels’ future is higher than ever. However
the new policy framework turns out, it will need to be time-consistent in order to gain back
the trust of investors. Such a situation is for the moment unlikely.
As highlighted in the results section, a privileged approach by policy-makers, eNGOs and
the bioethanol industry is the carbon intensity approach. Such an approach would focus on
reducing the amount of carbon used per unit of energy, as in the FQD (EU 2009b). This
is in opposition of implementing fixed quotas of renewable energy, as in the RED. If this
CE
UeT
DC
olle
ctio
n

CHAPTER 5. DISCUSSION 81
‘extended FQD’ approach is coupled to strong environmental criteria (to avoid ILUC and
influence on food prices), it would allow the different biofuels to compete with each other,
based on their ratio ‘price per unit of energy/GHG savings’. This would in theory lead to
the most cost-competitive way for the EU to decarbonise its transport sector with minimum
environmental consequences. In such an approach, given that bioethanol is one the cheapest
biofuels available on the market and display significant GHG savings (see figure 4.4 and 4.6),
it might in theory dominate the competition compared to biodiesel for example.
In practice, things might go a different way for the bioethanol industry. As highlighted
in the results section, the European market is in diesel deficit. Given that ethanol can only
be blended in gasoline (and biodiesel in diesel), this gives a clear advantage to biodiesel.
Increasing biodiesel production will help to reduce the EU diesel deficit, and thus increase
the energy security significantly. Bioethanol however is of less use since gasoline is in over-
production and thus exported, mainly to the US. Diesel is also used extensively for heating
and cooling, as well as for trucks in the EU. Those two usage are politically highly sensi-
tive subjects. The diesel deficit and its extensive usage in activities with a strong social
aspect lead to a preferential taxation treatment towards diesel, which increases even more
the advantage of biodiesel compared to bioethanol. If left in free competition in the EU
market, bioethanol might be crushed by biodiesel even if it displays better economic and
environmental performances.
Counter-intuitively, another advantage to biodiesel is given by the bioethanol industry
itself. As highlighted in the results section, the boundaries between the bioethanol’s and
biodiesel’s industries interests are very often blurry. Bioethanol and biodiesel are both
conventional biofuels, and thus based on feedstocks. Both industries differ mainly differ by
the feedstocks they use, and later by the process is involved. The interests of the bioethanol
industry can thus sometimes be shared with the biodiesel industry: some producers might
be involved in both bioethanol and biodiesel, as some investors.
However as highlighted throughout this work, bioethanol and biodiesel display very dif-
CE
UeT
DC
olle
ctio
n

CHAPTER 5. DISCUSSION 82
ferent economic and environmental performance. Biodiesel displays way lower environmen-
tal performance, which can sometimes be worse than the fossil equivalent it is supposed
to replace. This is especially true for palm oil-based biodiesel, which can be three times
more pollutive than the diesel (see figure 4.6). Those bad environmental performance made
biodiesel and especially palm oil-based biodiesel the number one target for environmental
NGOs: in addition of consuming food perfectly suitable for humans and thus influencing its
price, biodiesel often don’t even deliver GHG savings, which is its original goal (the envi-
ronmental driver is the strongest driver in the EU, as highlighted in the literature review).
As summarised by T&E, when it comes to biodiesel, the ‘cure can worse than the disease’
(T&E 2016b).
Phasing-out biodiesel and its subsidies in future legislation has thus become a priority
target for eNGOs. This attitude is largely understandable: the biodiesel industry is playing
a dirty game such as withholding of new scientific evidence when they disclose biodiesel’s
bad environmental performance and the denial of existing evidence. Describing the current
science about biofuels as not robust and denying biodiesel’s (and especially palm oil-based
biodiesel) bad environmental performance (see (EEB 2016; EBB 2016b)) is intellectually
dishonest: it reminds of the attitude that cigarettes manufacturers adopted towards the
growing evidence between tobacco consumption and lung cancer. This kind of lobbying only
aims to slow down the debate by poisoning it, in order to gain time and make more profits.
The reaction of Ethanol Europe towards this trend is contradictory: as highlighted in the
results section, many Ethanol Europe’s representatives were quite critique towards biodiesel
and especially palm oil-based biodiesel. Ethanol Europe’s representatives were strongly in
favour of new scientific evidence, as it was confirming the good environmental performance of
bioethanol. Ethanol Europe supports a carbon intensity approach, stronger environmental
criteria to limit ILUC and the influence of biofuels on food prices. They share some opinions
of the NGO, as illustrated by the recent convergence between ePURE and T&E in the
results section. However, the bioethanol industry never went publicly against biodiesel and
CE
UeT
DC
olle
ctio
n

CHAPTER 5. DISCUSSION 83
its excesses. The silence of bioethanol’s industry in the media about biodiesel and especially
palm oil-based biodiesel speaks volume when compared to how harshly the biodiesel industry
antagonises the current scientific evidence.
The bioethanol industry has thus not been able to clearly position itself in the biofuel
debate, and especially publicly clarify its position towards the biodiesel industry. In addition
to shared interests, this is probably also a consequence of the disorganisation of the bioethanol
industry, not being able to decide a clear strategy. As summarised by Mr Cogan: the more
you are, the less impact you have’ (Cogan 2016). The bioethanol industry, by its passivity
when it comes to confront the biodiesel industry, is thus likely to be associated with the
other conventional biofuels in a potential future phase-out post-2020. The ambiguity of
bioethanol’s industry position towards the biodiesel industry might have thus taken the lead
over its great environmental performance.
It is interesting to notice that the bioethanol’s industry ambiguous attitude might have
greater consequences than expected on its activities. While a phase-out of the current
production of conventional biofuels for the period post-2020 is possible but unlikely to happen
during the revision of the RED in late 2016, a phase-out of subsidies is very likely to take
place in order to stimulate the development of advanced biofuels even more. This phase-
out of subsidies will not affect the bioethanol and the biodiesel industries in the same way:
because of the EU diesel deficit and the preferential taxation treatment towards diesel, the
bioethanol industry might well be crushed if left in market in free competition with biodiesel.
If environmental criteria are not strengthened, the biodiesel industry might also use more
and more palm oil, a very cheap feedstock compared to the one used for ethanol.
While less extensively reviewed during this work, it is also important to consider the
influence of the lobbying activities from oil producers. Those are logically negative in ma-
jority: as the biofuel sector tries to develop, it takes part of the market formerly acquired
by oil producers. However the oil producers strategies can be ambiguous: some for exam-
ple invested in biofuels development. While this may be done to destroy biofuels industry
CE
UeT
DC
olle
ctio
n

CHAPTER 5. DISCUSSION 84
from the inside (as suggested by ePURE’s representative), the companies goal are for the
moment unclear. It however already leads to interesting consequences, because the shale
gas production in the US threatens the gasoline exportation market from the EU, some oil
companies transform existing refineries into biorefineries. Total for example transform in
France an existing refinery into a biorefinery producing biodiesel based on palm oil-residues
(Biofuelstp 2016). This might increase the competition towards the EU bioethanol industry
even more. The development of palm oil use in biodiesel production is indeed currently
growing, as illustrated by T&E in the results section: the use of palm oil for the biodiesel
industry in Europe has gone from 10% to 45%, far more than food industry share (T&E
2016c). In addition of greatly reducing biodiesel’s prices, this massive use of palm oil will
also affect the conventional biofuels image even more. In addition of being outcompeted, the
bioethanol’s industry might thus see its public image even more deteriorated.
In order to fix the current situation, there is only one solution in Ethanol Europe’s hands:
cut its ties with biodiesel industry, and publicly antagonise its strategy towards scientific
evidence in general as well as ILUC modelling in particular. External factors negatively
impacting bioethanol’s position such as the preferential taxation towards diesel or the EU
diesel deficit are indeed unfairly distorting the competition between bioethanol and biodiesel.
However such factors are for the main part out of politicians’ hands, and are not likely to
change anytime soon.
Apart from distancing itself from the biodiesel industry, another way of moving forward
for Ethanol Europe is to diversify its activities. Rather than trying to change the current
political framework, Ethanol Europe is thus also trying to increase its inertia towards any
political change that might happen in the future. Ethanol Europe moved successfully down
this path: since 2013, Ethanol Europe has invested in technological development, as illus-
trated in the results section. Ethanol Europe’s change of strategy is so intense that its CEO
estimates that the firm is gradually chaining its core activities from an operating company
to a technology company.
CE
UeT
DC
olle
ctio
n

CHAPTER 5. DISCUSSION 85
The technological development has taken two forms with different time-frames: on the
short-term Ethanol Europe aims to valorise the by-products originating from bioethanol
production. This strategy was successful: it provoked the creation of DDGS and corn oil,
two products implemented in the agricultural sector as animal feed since respectively 2012
and 2014 (see table 4.1). In addition to economic valorisation, the development of corn
oil and DDGS from waste to agricultural commodities helps Ethanol Europe to develop
strong linkages with the agricultural sector, in a circular economy logic. While this improves
bioethanol’s environmental performance even more, it also makes bioethanol more affordable
by diversifying the revenues of Ethanol Europe.
Ethanol Europe also prepares its long term future by investing in advanced biofuels
development. As illustrated in the results section, Ethanol Europe bought Naturally Sci-
entific and its ground-breaking technological process based on the photosynthetic process.
In addition, Ethanol Europe is also testing new process in its Dunaföldvár plant. Such in-
vestments are however economically uncertain: the Naturally Scientific process is currently
tested at Dunaföldvár, and was supposed to create results in April 2016. During this work,
results were delayed until June 2010, and are now expected in late 2016. The crucial need
of Ethanol Europe for inherently uncertain ground-breaking technological development add
thus another layer of unknown on the future of the firm.
The situation of Ethanol Europe and the bioethanol industry is thus complex. It is
currently not clear whether the great environmental performance of corn-based bioethanol
might be sufficient to overcome the negative influence of the biodiesel industry. The develop-
ment of new technologies might help Ethanol Europe to differentiate itself from the biodiesel
industry, but the process is inherently uncertain and might prove unsuccessful. In such a
case, Ethanol Europe and the bioethanol industry in general might end up being crushed by
the biodiesel industry in the period post-2020, for different reasons such as preferential tax-
ation treatment towards diesel or the EU diesel deficit (see above). Such an outcome would
result in the loss of one of the best performing biofuel currently available on the market,
CE
UeT
DC
olle
ctio
n

CHAPTER 5. DISCUSSION 86
and will greatly slow down the decarbonisation of the EU transport sector. Given that the
transportation sector is one of the most pollutive EU sector, with no available technological
solution to decrease its emissions in the near future (electrification is not ready to be im-
plemented for at least one or two decades at best), such a scenario might threaten the EU’s
capacity to reach its ambitious climatic target by 2030. A better political framework, such
as a carbon-intensity approach, is thus needed but might not be politically doable. This
politically issue will hopefully be addressed by the revision of the RED in late 2016, in order
to clarify the future of conventional and advanced biofuels.
CE
UeT
DC
olle
ctio
n

Chapter 6
Conclusion
The EU political framework has rapidly evolved in the last 15 years. It first started promoting
all kind of biofuels in 2003 with the biofuel directive, than it lead to the CEP in 2009 and
its 10% of renewable energy target for transport in 2020. However the political framework
drastically changed in 2012 with the introduction of ILUC calculations in the GHG savings
of BF, which lead the European Commission to put a cap of 7% on all kind of conventional
biofuels in 2015 for 2020 via the ILUC directive. This undifferentiated cap has had significant
consequences on Ethanol Europe and its development strategies, such as the construction
abort of a bioethanol biorefinery in Mohács (Hungary) and a cellulosic ethanol plant in Prilep
(Macedonia). In this study, the case of Ethanol Europe and its different strategies to adapt
to the changing market is considered.
This work identifies different reaction of Ethanol Europe towards this unstable policy
framework. The major one considered in this work is its lobbying activities in Brussels, in
order to try to shape the EU policy-making process. Ethanol Europe is represented directly
via three of its own lobbyists (J. Cogan, D. Roche, Z. Szabo) and indirectly via the EU
association of renewable ethanol producers (ePURE). The lobbying activities are based on
five arguments, which are then discussed. The first one is the significant GHG savings of
bioethanol as a renewable fuel: this study argues that while GHG savings of corn-based
bioethanol were proved significant, they might however not fill the strengthened criteria in
87
CE
UeT
DC
olle
ctio
n

CHAPTER 6. CONCLUSION 88
the near future. A second argument is the use of irrelevant and outdated data in the biofuel
debate, which this work relates to the technical complexities of the biofuel debate. A third
argument is the unbalanced EU’s taxation towards bioethanol, which this study links to
external factors such as a favourable treatment towards diesel and the EU diesel deficit. A
fourth argument is the significant economic benefits of ethanol production, which in the case
of Ethanol Europe proved significant in Dunaföldvár, where Ethanol Europe’s biorefinery is
located.
The last argument considered is the generalised approach towards all conventional biofu-
els, in contrast of their very different environmental performances. This work suggests that
the non-differentiation between conventional biofuels in the CEP amendments and the ILUC
directive is a policy adopted mainly because it was the only political compromise remaining
on the table after the long (six years) and exhausting ILUC debate. In contrast of Ethanol
Europe’s opinion, this work suggests the three stakeholders of the biofuel debate share the
responsibility of this the cap and its devastating consequences. Firstly, the bioethanol indus-
try, as it is not willing to differentiate itself from other more harmful conventional biofuels
industry such as biodiesel because of strong common interests. Secondly eNGO, which were
not willing to water down their main message towards bioethanol by nuancing their mes-
sages in order to keep their political impact high at the EU level. Thirdly policy-makers,
which were not able to influence the EU policy-making process enough to guarantee a better
outcome for the corn-based bioethanol out of a political difficult situation, even if it displays
great environmental performance (high GHG savings, low ILUC). This work suggests that
the generalised approach towards conventional biofuels creates a regulatory risk for Ethanol
Europe and the bioethanol industry.
Apart from the regulatory risk, this work identifies two major others threats for Ethanol
Europe and the bioethanol industry. The first one is the European diesel deficit. In order
to reduce diesel imports and increase its energy security, the EU is thus in need of biodiesel
(which can be blended with diesel) and not bioethanol (which is blended with gasoline). As
CE
UeT
DC
olle
ctio
n

CHAPTER 6. CONCLUSION 89
the subsidies for bioethanol are likely to be phased-out post-2020, this work suggests that
bioethanol risks to be crushed by the biodiesel demand in an open market. The second threat
is global competition: in contrast of the EU, the rest of the world is in gasoline deficit and
is thus developing its ethanol industry. This work suggests that the EU bioethanol industry,
already minor within the EU, would not be able to compete on the global scale with other
huge bioethanol industries from the USA and Brazil. The development of shale gas in the
US, by threatening the market for EU gasoline, might boost this dynamic.
To face the three threats explained above, this study identifies other reactions of Ethanol
Europe. The first one is the valorisation of ethanol production by-products, such as DDGS
and corn oil which can used as animal feed, and pure CO2, which can be sold for example
to beverages company. Ethanol Europe is also involved in the testing and development
of new promising technologies in the advanced biofuels sector. This is illustrated in this
work by the two patents developed by Naturally Scientific technologies ltd (a technologic
company owned by Ethanol Europe) which aim to produce pure vegetable oil from two cell
cultures via a boosted photosynthetic process. Those strategies aim to increase the inertia of
Ethanol Europe towards a rapidly changing political framework by diversifying its activities
and incomes. This work however suggests that this strategy might prove unsuccessful in the
near future due to the inherent variability in technological developments.
The complexity and unknowns of a potential reform of the current political framework
are then addressed. This work identifies the carbon intensity approach of the FQD with a
strengthened environmental criteria as the most efficient option. However this solution is
considered unlikely because of political difficulties and uncertainties, the lack of coordination
between bioethanol producers, and the complexity of the biofuel debate.
CE
UeT
DC
olle
ctio
n

Bibliography
Ackrill, Robert, and Adrian Kay. 2014. The Growth of Biofuels in the 21st Century: PolicyDrivers and Market Challenges. Volume 978–0–230–22150–5 of Energy, Climate and theEnvironment. Palgrave Macmillan (St Martin’s Press LLC).
Agbor, Valery B., Nazim Cicek, Richard Sparling, Alex Berlin, and David B. Levin. 2011.“Biomass pretreatment: Fundamentals toward application.” Biotechnology Advances 29(6): 675–685.
Alavi Hojjat, Tahereh. 2009. “Global Food Crisis - Food versus Fuels.” Competition Forum7, no. 2.
Biofuelstp. 2016. HVO/HEFA. http://www.biofuelstp.eu/hvo.html.CoEC. 1995, December. White Paper - an Energy Policy for the European Union: 12.
. 2001a. COMMUNICATION FROM THE COMMISSION TO THE EUROPEANPARLIAMENT, THE COUNCIL, THE ECONOMIC AND SOCIAL COMMITTEEAND THE COMMITTEE OF THE REGIONS on alternative fuels for road transporta-tion and on a set of measures to promote the use of biofuels Proposal for a DIRECTIVEOF THE EUROPEAN PARLIAMENT AND OF THE COUNCIL on the promotion ofthe use of biofuels for transport.
. 2001b. A Sustainable Europe for a Better World: A European Union Strategy forSustainable Development.
. 2005, December. Biomass action plan.
. 2006, February. An EU Strategy for Biofuels.
. 2007a, January. Biofuels Progress Report Report on the progress made in the useof biofuels and other renewable fuels in the Member States of the European Union.
. 2007b, February. Renewable Energy Road Map.Cogan, James. 2016. Interview of James Cogan.Cordiant. 2011. Cordiant funds a 214$m renewables plant in Hungary.
http://cordiantcap.com/press_release/cordiant-funds-a-214m-renewables-plant-in-hungary/.
Defossez, Faustine, Nusa Urbancic, Pietro Caloprisco, Laura Buffet, and Trees Robijns.2014, October. The Little Book of Biofuels.
Demirbas, A. 2008. Biodiesel: a realistic fuel alternative for diesel engines. Springer.DG ENER C1 rep. 2016. Interview of a DG ENER representative (section C1: Renewables
and CCS policy).
90
CE
UeT
DC
olle
ctio
n

Bibliography 91
DG ENER C2 rep. 2016. Interview of a DG ENER representative (section C2: New energytechnologies, innovation and clean coal).
DG ENVI F1 rep. 2016. Interview of a DG ENVI (Section F1: Resource Efficiency &Economic Analysis).
DG MOVE C1 rep. 2016. Interview of a DG MOVE representative (Section C1: CleanTransport & Sustainable Urban Mobility).
Domingos Padula, Antonio, Manoela Silveira dos Santos, Omar Inácio Benedetti Santos,and Denis Borenstein. 2014. Liquid Biofuels: Emergence, Development and Prospects.Lecture Notes in Energy. Springer London.
EBB. 2016a. ILUC impact modelization lacks transparency, academic value EBB:ILUC impact modelization lacks transparency, academic value EBB: ILUC impactmodelization lacks transparency, academic value ILUC impact modelization lackstransparency, academic value. http://biodieselmagazine.com/articles/901917/ebb-iluc-impact-modelization-lacks-transparency-academic-value.
. 2016b, April. New biased anti-biodiesel campaign set up by Green Communi-cation Group T&E. http://www.ebb-eu.org/EBBpressreleases/EBB_PR_BiasedAnti-biodieselCampaign_25April2016rgFINAL.pdf.
EC. 1997, November. ENERGY FOR THE FUTURE: RENEWABLE SOURCES OFENERGY. White Paper for a Community Strategy and Action Plan COM(97)599.
. 2010. Report from the commission on indirect land-use change related to biofuelsand bioliquids.
. 2012, October. Proposal for a DIRECTIVE OF THE EUROPEAN PARLIAMENTAND OF THE COUNCIL amending Directive 98/70/EC relating to the quality of petroland diesel fuels and amending Directive 2009/28/EC on the promotion of the use ofenergy from renewable sources.
. 2013, March. REPORT FROM THE COMMISSION TO THE EUROPEAN PAR-LIAMENT, THE COUNCIL, THE EUROPEAN ECONOMIC AND SOCIAL COM-MITTEE AND THE COMMITTEE OF THE REGIONS Renewable energy progressreport.
. 2014, January. COMMUNICATION FROM THE COMMISSION TO THE EU-ROPEAN PARLIAMENT, THE COUNCIL, THE EUROPEAN ECONOMIC ANDSOCIAL COMMITTEE AND THE COMMITTEE OF THE REGIONS A policy frame-work for climate and energy in the period from 2020 to 2030.
. 2015a. Paris Agreement. http://ec.europa.eu/clima/policies/international/negotiations/paris/index_en.htm.
. 2015b, July. State of the Art on Alternative Fuels Transport Systems in theEuropean Union.
. 2016. Reducing emissions from transport.http://ec.europa.eu/clima/policies/transport/index_en.htm.
EEA. 2016. Transport in the EU. http://www.eea.europa.eu/themes/transport/intro.EEB. 2016. About EEB. http://www.eeb.org/index.cfm/about-eeb/.EEB rep. 2016. Interview of a European Enviromnetal Bureau’s representative.
CE
UeT
DC
olle
ctio
n

Bibliography 92
ePURE. 2015, June. State of the Industry report.ePURE. 2016. About ePURE. http://epure.org/about/who-we-are/.ePURE. 2016. About ethanol. http://epure.org/about-ethanol/.ePURE’s rep. 2016. Interview of an ePURE’s representative.Ethanol Nu. 2016. Database of ethanol filling stations in Europe.
http://etanol.nu/tanka.php.EU. 2003, May. DIRECTIVE 2003/30/EC OF THE EUROPEAN PARLIAMENT AND
OF THE COUNCIL on the promotion of the use of biofuels or other renewable fuels fortransport.
. 2009a, June. DIRECTIVE 2009/28/EC OF THE EUROPEAN PARLIAMENTAND OF THE COUNCIL of 23 April 2009 on the promotion of the use of energy fromrenewable sources and amending and subsequently repealing Directives 2001/77/EC and2003/30/EC.
. 2009b, April. DIRECTIVE 2009/30/EC OF THE EUROPEAN PARLIAMENTAND OF THE COUNCIL of 23 April 2009 amending Directive 98/70/EC as regardsthe specification of petrol, diesel and gas-oil and introducing a mechanism to monitorand reduce greenhouse gas emissions and amending Council Directive 1999/32/EC asregards the specification of fuel used by inland waterway vessels and repealing Directive93/12/EEC.
. 2015, September. DIRECTIVE (EU) 2015/1513 OF THE EUROPEAN PARLIA-MENT AND OF THE COUNCIL of 9 September 2015 amending Directive 98/70/ECrelating to the quality of petrol and diesel fuels and amending Directive 2009/28/ECon the promotion of the use of energy from renewable sources.
. 2016. EU transport policy. http://europa.eu/pol/trans/index_en.htm.Eurostat. 2015. Urban-rural typology. http://ec.europa.eu/eurostat/statistics-
explained/index.php/Urban-rural_typologyThe_OECD_methodology.FAO. 2008. The State of Food and Agriculture. Biofuels: prospects, risks and opportunities.
. 2015. Global Forest Resources Global Forest Resources Assessment 2015.Fazal, M.A., A.S.M.A. Haseeb, and H.H. Masjuki. 2011. “Biodiesel feasibility study: An
evaluation of material compatibility; performance; emission and engine durability.” Re-newable and Sustainable Energy Reviews 15 (2): 1314–1324.
HBT. 2012. Project description of the biorefinery in Helvécia from (Helvéciai BioetanolTermelő és Kereskedő Kft.).
IEA. 2010. Bioenergy, land use change and climate change mitigation.IEEP. 2016. About IEEP. http://www.ieep.eu/about-us/about-ieep/.Jessen, Holly. 2012. Hungary for Ethanol. http://www.ethanolproducer.com/articles/8782/hungary-
for-ethanol.. 2014. Hungarian ethanol plant to expand capacity above 100 MMgy.
http://ethanolproducer.com/articles/11757/hungarian-ethanol-plant-to-expand-capacity-above-100-mmgy.
CE
UeT
DC
olle
ctio
n

Bibliography 93
. 2016. Construction completed at Hungarian ethanol plant.http://www.icminc.com/icm-media/whats-new-at-icm/24-icm-in-the-news/99-construction-completed-at-hungarian-ethanol-plant.html.
Kasturi Dutta, Achlesh Daverey, Jih-Gaw Lin. 2014. “Evolution retrospective for alternativefuels: First to fourth generation.” Renewable Energy 69:114–122.
Kelemen, Daniel. 2010. “Globalizing European Union Environmental Policy.” Journal ofEuropean Public Policy 17 (3): 335–349.
Koçar, Günnur, and Nilgün Civaş. 2013. “An overview of biofuels from energy crops: Cur-rent status and future prospects.” Renewable and Sustainable Energy Reviews 28:900–916.
Kutas, Geraldine, Carina Lindberg, Ronald Steenblik, International Institute for Sustain-able Development, and Global Subsidies Initiative. 2007. Biofuels–at what cost?: gov-ernment support for ethanol and biodiesel in the European Union. International Institutefor Sustainable Development.
Liew, Weng Hui, Mimi H. Hassim, and Denny K.S. Ng. 2014. “Review of evolution,technology and sustainability assessments of biofuel production.” Journal of CleanerProduction 71:11–29.
Lligadas, Gerard, Juan C. Ronda, Marina Galià, and Virginia Cádiz. 2013. “Renewablepolymeric materials from vegetable oils: a perspective.” Materials Today 16 (9): 337–343.
Naik, S.N., Vaibhav V. Goud, Prasant K. Rout, and Ajay K. Dalai. 2010. “Production of firstand second generation biofuels: A comprehensive review.” Renewable and SustainableEnergy Reviews 14 (2): 578–597.
Nikos, Alexandratos. 2008. “Food Price Surges: Possible Causes, Past Experience, andLonger Term Relevance.” Population and Development Review 34 (4): 663–697 (De-cember).
PE. 2015a. History of Pannonia Ethanol. http://www.pannoniaethanol.com/en/about.. 2015b. Pannonia Ethanol: Ethanol facts.
http://www.pannoniaethanol.com/en/facts.. 2015c. Pannonia Ethanol for farmers. http://www.pannoniaethanol.com/en/for-
farmers.. 2016a. Pannonia Gold of Pannonia Ethanol. http://www.pannoniagold.com/.. 2016b. Products of Pannonia Ethanol.
http://www.pannoniaethanol.com/en/products.Reng, Zoltan. 2016, March. Interview of Zoltan Reng (CEO of Pannonia Ethanol).Roche, Dick. 2016. Interview of Dick Roche.Sievers, Eric. 2016, March. Interview of Eric Sievers (CEO of Ethanol Europe).Silvermann. 2006. Interpreting qualitative data: methods for analysing talk, texts and
interaction. Sage publications.
CE
UeT
DC
olle
ctio
n

Bibliography 94
Simon, Frederic. 2016. Green transport target will be scrapped post-2020, EU con-firms. http://www.euractiv.com/section/transport/news/green-transport-target-will-be-scrapped-post-2020-eu-confirms/.
Stein, Hans H. 2007. Distillers dried grains with solubles (DDGS) in diets fed to swine.University of Illinois at Urbana-Champaign (Department of Animal Sciences).
Szabo, Zoltan. 2016. Interview with Zoltan Szabo.T&E. 2016a. About Transport and Environment.
https://www.transportenvironment.org/about-us.. 2016b, April. Biodiesel’s impact: emissions of an extra 12m cars on our roads,
latest figures show. https://www.transportenvironment.org/press/biodiesel. 2016c. Cars and trucks burn almost half of palm oil used in Europe.
https://www.transportenvironment.org/sites/te/files/publications/2016_05_TE_EU_vegetable_oil_biodiesel_market_FINAL_0_0.pdf.. 2016d, April. Globiom: the basis for bio-
fuel Globiom: the basis for biofuel policy post-2020.https://www.transportenvironment.org/sites/te/files/publications/2016_04_TE_Globiom_paper_FINAL_0.pdf.
T&E rep. 2016. Interview of a Transport and Environment’s representative.the Council of European Communities. 1985, December. Council Directive 85/536/EEC of
5 December 1985 on crude-oil savings through the use of substitute fuel components inpetrol.
. 1992, October. COUNCIL DIRECTIVE 92/81/EEC on the harmonization of thestructures of excise duties on mineral oils.
. 1994, July. C209 (Information and Notices).Transparency Register. 2016. European Transparency Register.
http://ec.europa.eu/transparencyregister/public/consultation/displaylobbyist.do?id=48084848642-01.
Transparency register. 2016. European Transparency Register.http://ec.europa.eu/transparencyregister/public/consultation/displaylobbyist.do?id=031898021694-59.
UNEP. 2009. Towards sustainable production and use of resources: assessing biofuels.Valin, Hugo, Daan Peters, Maarten van den Berg, Stephan Frank, Petr Havlik, Nicklas
Forsell, and Carlo Hamelinck. 2015, August. The land use change impact of biofuelsconsumed in the EU: Quantification of area and greenhouse gas impacts.
Whitton, Peter. 2012. Photosynthetic Process.http://patents.justia.com/patent/20140287458.
Whitton, Peter, Geoffrey Dixon, and William Merrel. 2009. Production of biofuels fromtissue culture sources. http://patents.justia.com/patent/20110054027.
CE
UeT
DC
olle
ctio
n

Appendix A
Additional figure
Figure A.1: Greenhouse gas savings of biofuels compared to fossil fuels (UNEP 2009)
95
CE
UeT
DC
olle
ctio
n

Appendix B
Continuation of the calculation of
biofuels greenhouse gas impact
el = (CSR � CSA) ⇤ 3, 664 ⇤1
20⇤ 1
P� eB
Where:
• el = annualised greenhouse gas emissions from carbon stock change due to land-usechange (measured as mass of CO2-equivalent per unit biofuel energy);
• CSR = the carbon stock per unit area associated with the reference land use (measuredas mass of carbon per unit area, including both soil and vegetation). The referenceland use shall be the land use in January 2008 or 20 years before the raw material wasobtained, whichever was the later;
• CSA = the carbon stock per unit area associated with the actual land use (measured asmass of carbon per unit area, including both soil and vegetation). In cases where thecarbon stock accumulates over more than one year, the value attributed to CSA shallbe the estimated stock per unit area after 20 years or when the crop reaches maturity,whichever the earlier;
• P = the productivity of the crop (measured as biofuel or bioliquid energy per unit areaper year);
• eB = bonus of 29 gCO2eq/MJ biofuel or bioliquid if biomass is obtained from restoreddegraded land under the conditions provided for in point 8.
96
CE
UeT
DC
olle
ctio
n

Appendix C
Platt’s Index
Figure C.1: Evolution of the Platt’s index concerning ethanol since 2006 (data obtained viaEthanol Europe)
97
CE
UeT
DC
olle
ctio
n

Appendix D
Example of a questions list for an
interview
(First question) Could you describe your precise role within T&E?
Interactions with industries and policy-makers
• How would you describe your relations with the industrial sector?
– how do NGO interact with policy-makers in general and you specifically? (Formalor informal?)
– How do you interact back to them? Do you set regular meetings with the differentparties of the debate?
– Do you estimate the biofuel lobby significant compared to the size of the industry?Is it efficient in influencing the debate or influencing you?
– When was the last time that you were contacted by the biofuel industry? do youhave any relation with ePURE or Ethanol Europe in particular (James Cogan,Dick Roche, Eric Sievers or Zoltan Reng?)
– What are the main conflicts/agreement that you experienced with the industries?
• How would you describe your relations with the policy-makers?
– How would you describe your relations with the different DG when it comes tobiofuels?
– What are the main conflicts/agreements that you experienced with the policy-makers ?
• Apart from the industries and the NGOs, do you estimate that are there any otherimportant stakeholders in the biofuels debate which are invisible for an external ob-server?
The future of Biofuels in Europe
98
CE
UeT
DC
olle
ctio
n

APPENDIX D. EXAMPLE OF A QUESTIONS LIST FOR AN INTERVIEW 99
• Do you think that biofuels will constitute a credible alternative for road transportationin the future?
• What do you think will happen after 2020? (An abandonment of all biofuels? A shiftfrom the European to the national level (without targets)? Feed-in tariffs?)
• What would be in your opinion the perfect policy framework for biofuels?
• Do you think that advanced biofuels will be commercially available soon and mightsolve the controversial debate around BF?
• What do you think about Marie C. Donnelly statement: in your opinion should wereally get rid of conventional biofuels by 2020?
• Are you aware of the technical advanced being made in Hungary for example foradvanced biofuels?
CE
UeT
DC
olle
ctio
n