Embed Size (px)
Citation preview

Article J. Braz. Chem. Soc., Vol. 20, No. 10, 1841-1848, 2009.
Printed in Brazil - ©2009 Sociedade Brasileira de Química0103 - 5053 $6.00+0.00
*e-mail: [email protected]; [email protected]
Study of the Copper Corrosion Mechanism in the Presence of Propionic Acid Vapors
Alejandro Echavarría,* Felix Echeverría, Carlos Arroyave and Harveth Gil
Corrosion and Protection Group, University of Antioquia, Calle 62 No. 52-59, Lab. 330, Sede de Investigación Universitaria, Medellín, Colombia
O mecanismo da interação entre o cobre e os vapores do ácido propiônico é apresentado. As exposições foram realizadas em diferentes tempos e concentração de poluentes. Varredura Catódica, XRD e SEM foram usados para quantificar o grau de deterioração. Os resultados obtidos foram explicados pelo seguinte mecanismo: Uma camada do cuprita (Cu
2O) é formada imediatamente.
Este composto, na presença da água adsorvida é oxidado a tenorita (CuO) com aumento do pH. A hidratação da camada de tenorita beneficia a formação de um hidróxido CuO•xH
2O. Enquanto
o nível do poluente é aumentado, o propionato básico insolúvel é formado (Cu(OH)x(Pro)
2-x).
Concentrações mais elevadas de ácido propiônico acidificam as mono camadas e um composto novo Cu (Pro)
2•H
2O começa a se precipitar em pH baixo. Este é o constituinte principal da pátina verde-
oliva formada nessas condições. Este mecanismo concorda, em termos gerais, com os propostos em trabalhos precedentes visando estudar a interação entre o cobre e os ácidos acético e fórmico.
The interaction mechanism between copper and propionic acid vapors is shown. Exposures were carried out to various pollutant concentrations and times. Cathodic scan, x-ray diffraction (XRD) and scanning electrode microscope (SEM) were used to quantify the degree of deterioration. The results obtained were explained by the following mechanism: A cuprite (Cu
2O) layer covers
the copper surface immediately; this compound in presence of adsorbed water is oxidized to tenorite (CuO). The hydration of the tenorite layer benefits the formation of a hydroxide compound such as CuO•xH
2O. As the pollutant level is increased, insoluble basic propionate is formed
(Cu(OH)x(CH
3CH
2COO)
2-x). Higher concentrations of propionic acid acidify the monolayers
and a new compound Cu(CH3CH
2COO)
2•H
2O begins to precipitate at low pH, this is the main
constituent of the green olive patina formed under these conditions. This mechanism agrees, in general terms, with those proposed in previous works to study the interaction between copper and the acetic and formic acids.
Keywords: atmospheric corrosion, copper, organic acids, propionic acid, tropicorr
Introduction
Organic compounds are present in different phases in the atmosphere, and the most important organic acids that have been found are the formic, acetic, propionic, butyric and oxalic acids. The corrosion originated by these vapors on different metals and their alloys (lead, steel, nickel, copper, cadmium, magnesium, zinc) is a phenomenon that has been observed for some time.1 Copper is corroded in presence of these compounds such as formic, acetic and butyric.2-9
Several studies has been performed to follow copper corrosion in presence of organic acids, and it has been
found that the corrosivity of the organic acids vapors in ppmv (parts per million in volume) on copper is given by the following order (from the highest to the lowest level of aggressiveness) acetic > formic > butyric.6,8,9 At the same time, the mechanism of degradation of copper in these acids includes the formation of a basic copper acetate and an hydrate copper acetate, copper formate and copper butyrate.6,8,9 The effect of these acids is enhanced during indoor conditions, were small quantities of this type of acids are found and can produce deterioration on copper and its alloys. The aim of this study is to evaluate and provided a better understanding by which copper is corroded in presence of propionic acid vapors. The work has been carried out by mean of electrochemical methods and characterization techniques such as XRD and SEM.

Study of the Copper Corrosion Mechanism in the Presence of Propionic Acid Vapors J. Braz. Chem. Soc.1842
Experimental
To study of the mechanism between copper and the propionic acid vapors two corrosive atmospheres were used: the first one was carried out in a climatic chamber with a pollutant level of ppb (parts per billion), under dynamic conditions. The second one was carried out under high concentration levels (parts per millions, ppm), using a closed chamber under static conditions.
Exposures in the climatic chamber
The climatic chamber is attached to an “oil-less” compressor used for dentistry; it provides air to a pretreatment system made of an activated carbon filter, a “PEAK” air purifier and two particulate material filters (0.25 and 0.05 µm). The purified air is separated in two streams that go to the humidifier, to the emission tube containing pure propionic acid or directly to the chamber for further air mixing. Different ratios of dry/humid air are regulated by needle valves to get the desired relative humidity (RH), and the mixing is performed in the chamber. Usually values of 90 ± 2% RH and 70 ± 2.5% RH were obtained. The chamber has a temperature control, and the polluted air goes through a desiccator where the samples were located. A constant air flow of 4 L min-1 was used. Emission tubes for the liquid propionic acid were used with different emission rates, gravimetrically certificated. The tubes were made of Pyrex of 3 mm of diameter and 90 mm high. They were sealed in one side and were made a tiny hole of approximately 10-50 mm at the other side of the tube. This allows small emission rates of the acid, following the procedure describe by Lucero.10 The tubes were weighted before and after the exposure in order to estimate the actual emission rate of the acid. To obtain the concentration of the propionic acid as a vapor, an ideal gas behavior was assumed for the air of the system,11 the concentration of propionic acid in the vapor phase, can be calculated as:
(1)
Where, Cv is the concentration of the propionic acid, expressed in parts per billion in volume (ppbv), ER is the emission rate of the glass tubes containing pure propionic acid (2650 ± 70, 3750 ± 80 and 6950 ± 100 ng min-1), 29.5 is the molar volume (L mol-1) of the air at laboratory conditions, 30 °C and 640 mm Hg is the local atmospheric pressure (Medellin, Colombia 1450 ASL), 4 is the nominal air flow (L min-1) and 74.08 is the molecular weight (g mol-1) of the propionic acid (CH
3CH
2COOH).
Copper coupons were plates sized 1.0 × 1.5 × 0.01 cm, Merck (< 0.002% Ag, 0.05% Pb, 0.01% Sn, 0.005% Fe, 0.005% Mn, 0.0002% As), polished with different abrasive papers up to 600 mesh and then degreased with acetone, dried with air and immediately placed in the exposure chamber. The coupons were hanging vertically perpendicular to the air flow inside a glass vessel and exposed to propionic acid for 7, 14, and 21 days. Three concentrations of propionic acid were used (260, 380 and 690 ppbv).
Exposures in closed chamber
Static conditions experiments were performed under 4, 20, 40, and 120 ppmv propionic acid concentration at 30 ± 0.8 °C during 21 days. For low relative humidity conditions, it was employed in the desiccator a saturated solution of K
2CO
3•2H
2O and NH
4Cl to obtain 40% RH
and 80% RH according to the ASTM E104-85 standard.7 The relative humidity condition near 100% was obtained placing a recipient with 500 mL of propionic acid solution at the bottom of the desiccator. In these experiments the propionic acid vapor was produced, following the procedure described in previous works2-9 and in any case, solutions were renewed weekly to prevent degradation of the organic compound.
The concentration (in volume) of the propionic acid vapor in closed atmosphere was calculated using the relationship of partial pressures and Raoult´s law.2-9
(2)
Where: the term is the vapor partial pressure of pure propionic acid (mm Hg), pH
(Pro) is the
partial pressure of the propionic acid in the desiccator atmosphere, T is the temperature in K, G is the mass of the propionic acid in grams in a 1000 mL solution, MH2O and M
H (Pro) are the molecular weights of water and propionic
acid and PT is the total pressure under the laboratory
conditions (640 mm Hg). For exposures in atmospheres with 4, 20, 40, and
120 ppmv (Cv), the amounts of propionic acid and water used for a volume of 500 mL solution are shown in Table 1.
Table 1. Amount of propionic acid added to 500 mL of water to obtain the different concentrations used in this study: 4, 20, 40, and 120 ppmv
Concentration of the acid in the air / ppmv 4 20 40 120
Amount of propionic acid / mL 0.9 4.6 9.3 27.9
Amount of water / mL 499.1 495.4 490.7 472.1

Echavarría et al. 1843Vol. 20, No. 10, 2009
Characterization techniques
Cathodic scan, XRD and SEM were used to characterize the corrosion products. Cathodic scan experiments were carried out with a BAS ZAHNER potenciostat at a scan rate of 0.001 V s-1 between the corrosion potential and -1.5 V
SCE.
The reductions were performed by using three electrodes with the saturated calomel electrode (SCE) as reference and platinum as counter electrode. A solution of 0.1 mol L-1 KCl was used as support electrolyte purged with N
2 grade 5
for 30 min before the test and keeping bubbling during the scans. Cathodic scan curves of the coupons exposed to the different atmospheres were compared with those obtained from ex situ conditions. The ex situ compounds were produced by anodic polarizations to different potentials and a scan rate of 1 mV s-1. Polarizations were performed in 0.01 and 0.1 mol L-1 NaOH until 0.2 and 0.9 V
SCE; 0.01 mol L-1
Cu(CH3CH
2COO)
2.H
2O until 0.9 V and 0.01 and 0.1 mol L-1;
CH3CH
2COOH until 0.2 and 0.9 V
SCE. Once the polarization
reaches the desired potential, the sample was took out and immediately placed in the electrochemical cell where the reduction was performed. Each anodic polarization was made by triplicate. The corrosion products of coupons exposed to 40 and 120 ppmv pollutant concentration and 100% RH, were analyzed by XRD. The diffractograms were performed in a Bruker D8 Advance diffractometer and SEM micrographs were obtained in a Hitachi S-500 electronic scan microscope.
Results and Discussion
Figure 1 shows the appearance of the copper coupons surfaces after exposure during 21 days to different conditions of pollutant concentration and relative humidity. As it can be observed, the color surface varies from a pale yellow to an olive green, typical of the copper propionate patinas obtained in more polluted atmospheres (120 ppmv) and 100% RH. An important characteristic of these green patinas is their solubility in watery solutions. The outer part of the patina containing hydrated or basic copper propionates is very soluble but the inner part is usually composed of copper oxides or hydroxides that remain on the surface being possible to detect them by electrochemical reduction.
In Figure 2 the cathodic scans of copper coupons exposed to 260 ppbv, 70% RH during 21 are compared with the anodic compounds formed in 0.01 and 0.1 mol L-1 NaOH solutions obtained from polarization up to 0.2 V
SCE
(right axis), all curves were obtained using 0.1 mol L-1 KCl as supporting electrolyte. It can be observed that the corrosion products in the 260 ppbv and 70% RH condition
are more similar to the anodic compound formed in the 0.01 mol L-1 NaOH solutions than the one obtained in 0.1 mol L-1 NaOH. In this sort of conditions, compounds such as Cu
2O/Cu(OH)
2/CuO are found.11,12 The peak seen
in propionic acid exposures scans at -0.48 VSCE
is related to amorphous copper (I) oxide13-16 (Cu
2O)
am and the peak
around -0.8VSCE
is related to crystalline copper (I) oxide (Cu
2O)
cr.13,17-20
Figure 3 compares cathodic scan curves of copper coupons exposed to 680 ppbv at 90% RH during 21 days with those obtained by anodic polarizations in 0.01 mol L-1 NaOH (polarized up to 0.2 V
SCE) and 0.01 mol L-1
Cu(CH3CH
2COO)
2 (polarized up to 0.2V
SCE and 0.9 V
SCE)
solutions. The corresponding curve of the anodic compound obtained in 0.01 mol L-1 CH
3CH
2COOH polarized up
to 0.9 VSCE
is also shown. It is observed that the anodic compound formed in 0.01 mol L-1 Cu(CH
3CH
2COO)
2
Figure 1. Appearance of the copper coupons of an unexposed sample (a), and exposed to different conditions during 21 days: 260 ppbv-70% RH (b); 380 ppbv-90% RH (c); 4 ppmv-40% RH (d); 40 ppmv-40% RH (e); 120 ppmv-40% RH (f); 4 ppmv-80% RH (g); 40 ppmv-80% RH (h); 120 ppmv-80% RH (i); 4 ppmv-100% RH (j); 40 ppmv-100% RH (k); 120 ppmv-100% RH (l).
Study of the Copper Corrosion Mechanism in the Presence of Propionic Acid Vapors J. Braz. Chem. Soc.1844
solution (pH 4.8) and polarized up to 0.9 VSCE
shows two reduction peaks located in -0.62 V
SCE and -0.88 V
SCE. These
are attributed to intermediate and crystalline copper (I) oxide, respectively.21 The intermediate copper (I) oxides is a phase formed through transformation of the amorphous oxide into the crystalline oxide. Likewise, the compound formed in 0.01 mol L-1 CH
3CH
2COOH solutions (pH 3.5)
is close to the peak observed at 0.9 VSCE
from the 680 ppbv and 90% RH coupons. According with these results, the compound that appear at 0.9 V
SCE is related to the anodic
compound that form in propionate solutions, with or without the presence of cupric ions. This compound12 is probably a crystalline copper (I) oxide produced by the formation of a copper propionate that remains in the inner side of the patina. Therefore, in this type of conditions a Cu/Cu
2O layer is found.22
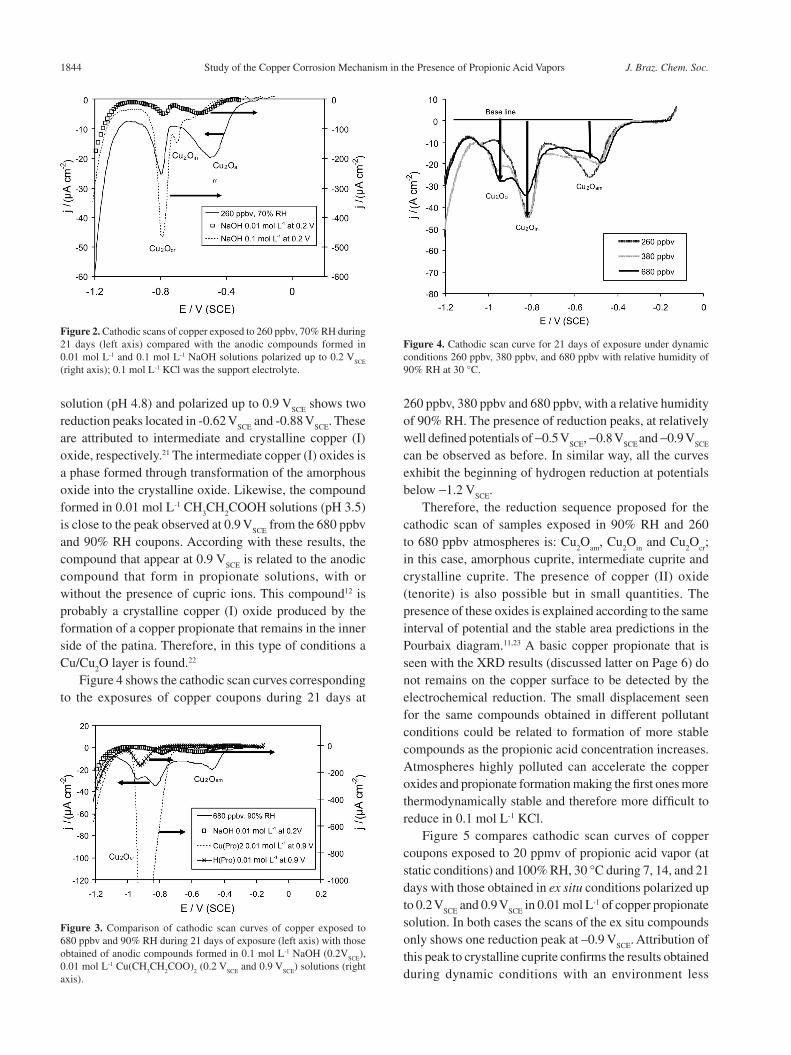
Figure 4 shows the cathodic scan curves corresponding to the exposures of copper coupons during 21 days at
260 ppbv, 380 ppbv and 680 ppbv, with a relative humidity of 90% RH. The presence of reduction peaks, at relatively well defined potentials of -0.5 V
SCE, -0.8 V
SCE and -0.9 V
SCE
can be observed as before. In similar way, all the curves exhibit the beginning of hydrogen reduction at potentials below -1.2 V
SCE.
Therefore, the reduction sequence proposed for the cathodic scan of samples exposed in 90% RH and 260 to 680 ppbv atmospheres is: Cu
2O
am, Cu
2O
in and Cu
2O
cr;
in this case, amorphous cuprite, intermediate cuprite and crystalline cuprite. The presence of copper (II) oxide (tenorite) is also possible but in small quantities. The presence of these oxides is explained according to the same interval of potential and the stable area predictions in the Pourbaix diagram.11,23 A basic copper propionate that is seen with the XRD results (discussed latter on Page 6) do not remains on the copper surface to be detected by the electrochemical reduction. The small displacement seen for the same compounds obtained in different pollutant conditions could be related to formation of more stable compounds as the propionic acid concentration increases. Atmospheres highly polluted can accelerate the copper oxides and propionate formation making the first ones more thermodynamically stable and therefore more difficult to reduce in 0.1 mol L-1 KCl.
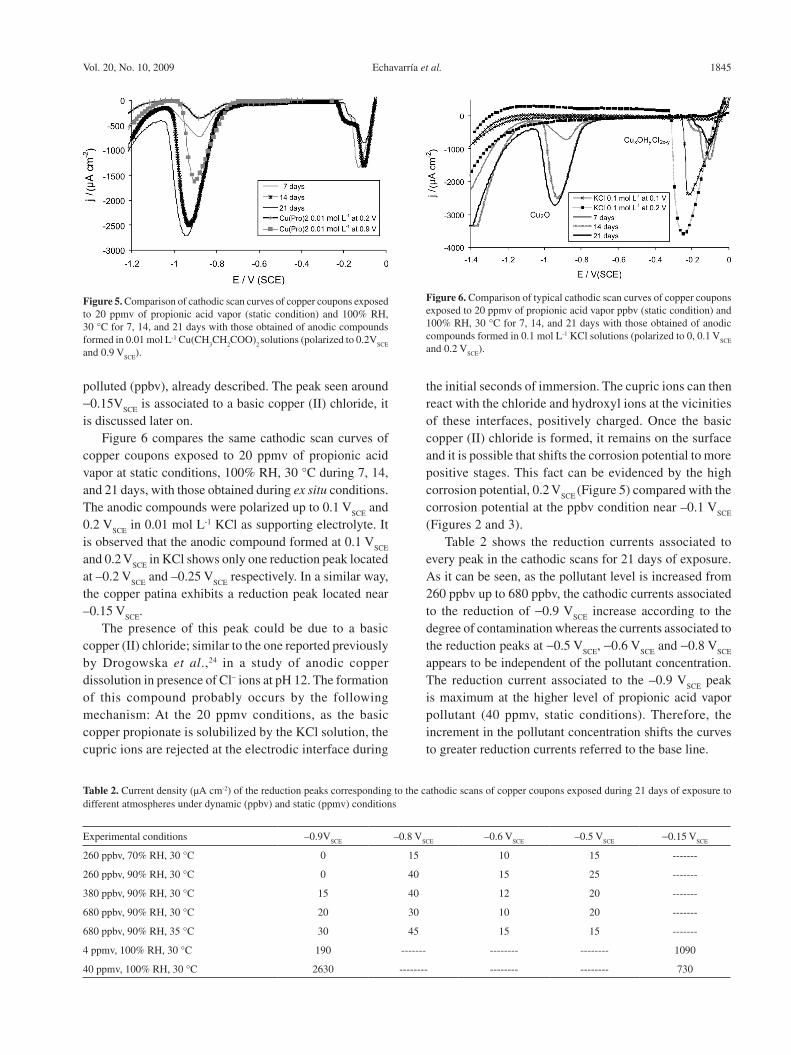
Figure 5 compares cathodic scan curves of copper coupons exposed to 20 ppmv of propionic acid vapor (at static conditions) and 100% RH, 30 °C during 7, 14, and 21 days with those obtained in ex situ conditions polarized up to 0.2 V
SCE and 0.9 V
SCE in 0.01 mol L-1 of copper propionate
solution. In both cases the scans of the ex situ compounds only shows one reduction peak at –0.9 V
SCE. Attribution of
this peak to crystalline cuprite confirms the results obtained during dynamic conditions with an environment less
Figure 2. Cathodic scans of copper exposed to 260 ppbv, 70% RH during 21 days (left axis) compared with the anodic compounds formed in 0.01 mol L-1 and 0.1 mol L-1 NaOH solutions polarized up to 0.2 V
SCE
(right axis); 0.1 mol L-1 KCl was the support electrolyte.
Figure 3. Comparison of cathodic scan curves of copper exposed to 680 ppbv and 90% RH during 21 days of exposure (left axis) with those obtained of anodic compounds formed in 0.1 mol L-1 NaOH (0.2V
SCE),
0.01 mol L-1 Cu(CH3CH
2COO)
2 (0.2 V
SCE and 0.9 V
SCE) solutions (right
axis).
Figure 4. Cathodic scan curve for 21 days of exposure under dynamic conditions 260 ppbv, 380 ppbv, and 680 ppbv with relative humidity of 90% RH at 30 °C.
Echavarría et al. 1845Vol. 20, No. 10, 2009
polluted (ppbv), already described. The peak seen around -0.15V
SCE is associated to a basic copper (II) chloride, it
is discussed later on. Figure 6 compares the same cathodic scan curves of
copper coupons exposed to 20 ppmv of propionic acid vapor at static conditions, 100% RH, 30 °C during 7, 14, and 21 days, with those obtained during ex situ conditions. The anodic compounds were polarized up to 0.1 V
SCE and
0.2 VSCE
in 0.01 mol L-1 KCl as supporting electrolyte. It is observed that the anodic compound formed at 0.1 V
SCE
and 0.2 VSCE
in KCl shows only one reduction peak located at –0.2 V
SCE and –0.25 V
SCE respectively. In a similar way,
the copper patina exhibits a reduction peak located near –0.15 V
SCE.
The presence of this peak could be due to a basic copper (II) chloride; similar to the one reported previously by Drogowska et al.,24 in a study of anodic copper dissolution in presence of Cl- ions at pH 12. The formation of this compound probably occurs by the following mechanism: At the 20 ppmv conditions, as the basic copper propionate is solubilized by the KCl solution, the cupric ions are rejected at the electrodic interface during
the initial seconds of immersion. The cupric ions can then react with the chloride and hydroxyl ions at the vicinities of these interfaces, positively charged. Once the basic copper (II) chloride is formed, it remains on the surface and it is possible that shifts the corrosion potential to more positive stages. This fact can be evidenced by the high corrosion potential, 0.2 V
SCE (Figure 5) compared with the
corrosion potential at the ppbv condition near –0.1 VSCE
(Figures 2 and 3).
Table 2 shows the reduction currents associated to every peak in the cathodic scans for 21 days of exposure. As it can be seen, as the pollutant level is increased from 260 ppbv up to 680 ppbv, the cathodic currents associated to the reduction of -0.9 V
SCE increase according to the
degree of contamination whereas the currents associated to the reduction peaks at -0.5 V
SCE, -0.6 V
SCE and -0.8 V
SCE
appears to be independent of the pollutant concentration. The reduction current associated to the –0.9 V
SCE peak
is maximum at the higher level of propionic acid vapor pollutant (40 ppmv, static conditions). Therefore, the increment in the pollutant concentration shifts the curves to greater reduction currents referred to the base line.
Figure 5. Comparison of cathodic scan curves of copper coupons exposed to 20 ppmv of propionic acid vapor (static condition) and 100% RH, 30 °C for 7, 14, and 21 days with those obtained of anodic compounds formed in 0.01 mol L-1 Cu(CH
3CH
2COO)
2 solutions (polarized to 0.2V
SCE
and 0.9 VSCE
).
Figure 6. Comparison of typical cathodic scan curves of copper coupons exposed to 20 ppmv of propionic acid vapor ppbv (static condition) and 100% RH, 30 °C for 7, 14, and 21 days with those obtained of anodic compounds formed in 0.1 mol L-1 KCl solutions (polarized to 0, 0.1 V
SCE
and 0.2 VSCE
).
Table 2. Current density (µA cm-2) of the reduction peaks corresponding to the cathodic scans of copper coupons exposed during 21 days of exposure to different atmospheres under dynamic (ppbv) and static (ppmv) conditions
Experimental conditions –0.9VSCE
–0.8 VSCE
–0.6 VSCE
–0.5 VSCE
-0.15 VSCE
260 ppbv, 70% RH, 30 °C 0 15 10 15 -------
260 ppbv, 90% RH, 30 °C 0 40 15 25 -------
380 ppbv, 90% RH, 30 °C 15 40 12 20 -------
680 ppbv, 90% RH, 30 °C 20 30 10 20 -------
680 ppbv, 90% RH, 35 °C 30 45 15 15 -------
4 ppmv, 100% RH, 30 °C 190 ------- -------- -------- 1090
40 ppmv, 100% RH, 30 °C 2630 -------- -------- -------- 730

Study of the Copper Corrosion Mechanism in the Presence of Propionic Acid Vapors J. Braz. Chem. Soc.1846
Figure 7 shows the XRD diffractograms of copper coupons exposed to 4, 20, 40, and 120 ppmv of propionic acid vapors and 100% RH during 21 days. The non marked peaks, with a maximum intensity arounf eight degrees correspond to the Cu(CH
3CH
2COO)
2•H
2O according
with the results obtained by Gómez et al.25 During the exposures at 120 ppmv it was found that the copper propionate monohydrate constitutes most of thecorrosion products, with smaller amounts of the “x” compound (not identified in this work, probably a basic copper propionate), cuprite and paramelaconite. At 40 ppmv, the copper propionate monohydrate is the compound that appears to be more abundant, followed in importance by cuprite and paramelaconite. At 20 ppmv, the copper propionate monohydrate is still the most predominant compound, but another compound appears (“y”, non identified) with smaller amounts of cuprite and paramelaconite.
In figure 8 the scanning electron micrograph of the structure of the superficial corrosion products is evidenced. When copper is exposed at 40 ppmv of propionic acid vapors the cuprite crystals appear in aggregates, with crystalline habits in form of lengthened prisms. In this case, the granular surface is composed by the copper propionate. With exposures at 120 ppmv of propionic acid vapors, the scanning electron micrograph shows cuprite crystals (2%) with its characteristic habit in form of diamonds or cuboids. However, the increase in crystallinity of Cu(CH
3CH
2COO)
2•H
2O, detected by the XRD data, does
not become evident and it also appears as granular form.
Interaction mechanism between pure copper and propionic acid vapors
A cuprite layer (Cu2O) is instantly formed on the copper
surface by air exposure. The temperature and relative humidity of the atmospheric air can cause the condensation of water vapor on the copper surface. The thickness of the aqueous layer is increased when increasing the air relative humidity. At low concentrations of propionic acid in environment, oxidation of cuprite to tenorite is carried out with the reduction of the oxygen in the water, according to the following reactions:
Cu2O + H
2O → 2 CuO + 2 H+ + 2 e- (3)
½O2 + H
2O + 2 e- → 2OH- (4)
To produce the net reaction:
Cu2O + ½ O
2 → 2 CuO (5)
The positively charged anodic areas where the CuO formation occurs, attract towards the metal-monolayer interface, the hydroxyl ions negatively charged (OH-) causing an increase of the local pH. Under these conditions, the CuO can be hydrolyzed and forms copper hydroxide:
CuO + H2O → Cu(OH)
2 (6)
Therefore, the first corrosion products that are formed correspond to a stratified mixture of Cu
2O-CuO-Cu(OH)
2
Figure 7. XRD diffractogram (CuKa) of copper exposed to 4, 20, 40, and
120 ppmv of propionic acid vapors and 100% RH during 21 days. The non marked peaks correspond to the Cu(CH
3CH
2COO)
2.H
2O.
Figure 8. SEM micrograph of copper exposed to propionic acid vapors at 120 ppmv for 21 days.

Echavarría et al. 1847Vol. 20, No. 10, 2009
or CuO·xH2O.9,22 This structure goes from the internal
interface metal-patina up to the external interface patina-atmosphere. The cathodic scan curves of copper coupons exposed to 680 ppbv, 90% RH for 21 days, (Figure 3) show the reduction peaks corresponding to three copper (I) oxides, namely amorphous at -0.5 V
SCE, intermediate at
-0.8 VSCE
and crystalline at -0.9 VSCE
. The last one is well correlated with the anodic compound formed in propionate solutions with or without cupric ions, probably cuprite produced after dissolution of a basic copper propionate. The presence of a basic organic compound on copper has been seen before during studies of atmospheric corrosion of copper with acetic acid vapors.2
The previous result can be explained in the following way: When increasing the concentration of propionic acid in the air, the aqueous monolayers seek for equilibrium with the new pollutant concentration, consequently rising the propionic acid content in the monolayers (in equilibrium with the aqueous propionate) and progressively diminishing the pH. In this way, the hydroxide initially present in the exposed copper surface is the base for a basic copper propionate, according to the following reaction:
CuO•xH2O + (2-x) CH
3CH
2COOH →
Cu(OH)x(CH3CH2COO)
2-x + H
2O (7)
At higher propionic acid concentrations in the air (more than 4 ppmv), the amount of propionate in the aqueous monolayers is also increased, and this solution reaches the deepest layers through cracks (as observed by SEM), making lower the pH and leading to the conversion of basic propionate to copper propionate monohydrate (Cu(CH
3CH
2COO)
2•H
2O). This compound is the main
constituent of the patinas formed with high concentrations of pollutant. The formation of the copper propionate can be given through the reaction shown in equation 10.9
Cu(OH)x(CH
3CH
2COO)
2-x + xCH
3CH
2COOH + (1.2 – x)
H2O → Cu(CH
3CH
2COO)
2•1.2H
2O (8)
The final constituents of the soluble patina are the cuprite and the aqueous copper propionate. The arrangement of the cathodic layers (rich in Cu
2O) and the anodic layers
Cu(OH)x(CH
3CH
2COO)
2-x and Cu(CH
3CH
2COO)
2•H
2O are
shown in figure 9. Therefore, in these coupons the mixtures are Cu
2O
am/Cu
2O
in/Cu
2O
cr/Cu(OH)
x(CH
3CH
2COO)
2-x.
Finally, cathodic reduction curves evidence the high solubility of the propionate compounds and shows that the main constituents obtained in the inner part of the patina is crystalline copper (I) oxide.
Conclusions
From the results obtained here, the deterioration of copper in presence of propionic acid vapors can be explained through the following mechanism: The first oxide layer that covers the surface of copper and which is instantly formed is cuprite (Cu
2O). This compound,
in presence of adsorbed water is oxidized to tenorite (CuO) simultaneously with pH increase. The hydration of the tenorite layer induces the formation of a hydroxide such as CuO.xH
2O. As the pollutant level increased
in the atmosphere, a basic propionate of the type Cu(OH)
x(CH
3CH
2COO)
2-x is formed. Higher concentrations
of propionic acid in the atmosphere acidify further the monolayers and a new compound Cu(CH
3CH
2COO)
2•H
2O
begins to precipitate at low pH. This is the main constituent of the green olive soluble patina formed under these conditions.
Acknowledgments
The authors express their gratefulness to the project COLCIENCIAS 1115 - 11500 and to TROPICORR-Tropicalización de Materiales Electro-Electrónicos for the financial support of the study. Special thanks to Dr. J. Calderón for portuguese translation.
References
1. Echavarría, A.; Echeverria, F.; Arroyave, C.; Cano, E.; Bastidas,
J. M.; Corros. Rev. 2004, 21, 395.
2. Cano, E.; Bastidas, J. M.; Can. Metall. Q. 2002, 41, 327.
3. Lopez-Delgado, J. E.; Cano, E.; Bastidas, J. M.; López, F. A.;
J. Electrochem. Soc. 1998, 145, 4140.
4. Bastidas, J. M.; López-Delgado, A.; Cano, E.; Polo, J. L.; López,
F. A.; J. Electrochem. Soc. 2000, 147, 999.
5. Cano, E.; López, F. M.; Simancas, J.; Bastidas, J. M.;
J. Electrochem. Soc. 2001, 148, E26.
Figure 9. Schematic model of the cathodic and anodic regions for copper coupon exposed to 20 ppmv for 21 days and 100% RH.
Study of the Copper Corrosion Mechanism in the Presence of Propionic Acid Vapors J. Braz. Chem. Soc.1848
6. Cano, E.; Mora, E. M.; Ascaray, H.; Bastidas, J. M.;
J. Electrochem. Soc. 2004, 151, B207.
7. Cano, E.; Bastidas, J. M.; Polo, J. L.; Mora, N.; J. Electrochem.
Soc. 2001, 148, B431.
8. Cano, E.; Mora, E.; Ascaray, H.; López-Caballero, J.; Bastidas,
J. M.; Proceedings of Latincorr 2003, Santiago de Chile, Chile,
2003.
9. Cano, E.; Polo, J.; Kong, D.; Mora, E.; López-Caballero, J.;
Bastidas, J. M.; Proceedings of the IX Conference of Materials
Science & Technology, Madrid, España, 2003.
10. Lucero, D.; Atmos. Environ. 1972, 6, 943.
11. Pourbaix, M.; Atlas of Electrochemical Equilibria in Aqueous
Solutions, 2nd ed., NACE: Houston, 1974.
12. Echavarría, A.; PhD Thesis, Universidad de Antioquia,
Colombia, 2004.
13. Deutscher, R. L; Woods. R; J. Appl. Electrochem. 1986, 16,
413.
14. Rickett, B. I; Payer,J. H.; J. Electrochem. Soc. 1995, 142, 3713.
15. Itoh, J; Sasaki, T; Ohtsuka, T; Corros. Sci. 2000, 42, 1539.
16. Lee, S; Staehle, R. W.; J. Electrochem. Soc. 1995,142, 2189.
17. Persson, D; Leygraf, C; J. Electrochem. Soc. 1993, 140, 1256.
18. Lenglet, M.; Kartouni, K.; Delahaye, D.; J. Appl. Electrochem.
1991, 21, 697.
19. Perrin, C.; Simon, D.; Mollimard, M.T.; Baillif, P.; Bardolle,
J.; J. Chimie Phys. 1984, 81, 39.
20. Rice, D. W.; Peterson, P.; Rigby, E. B.; Phipps, P. B.; Cappell,
R. J.; Tremoureux, R.; J. Electrochem. Soc. 1981, 128, 275.
21. Tran, T.; Fiaud, C.; Sutter, E.; Villanova, A.; Corros. Sci. 2003,
45, 2787.
22. Kunze, J.; Maurice, V.; Klein, L.; Strehblow, H.; Marcus, P.;
Corros. Sci. 2004, 46, 245.
23. Pourbaix, M.; Lecciones de Corrosión Electroquímica, Instituto
Español de Corrosión y Protección: Madrid, 1987.
24. Drogowska, M.; Brossard, L.; Menard, H.; Corrosion 1987, 43,
549.
25. Gómez, J; Castaño, J; Echavarría, A; Palacio, L; Echeverría,
F; Arroyave, C; Bastidas, J. M; Proceedings of 5th Latincorr
Corrosion Congress, Santiago de Chile, Chile, 2003.
Received: February 22, 2008
Web Release Date: November 6, 2009


![Anodic Corrosion of Copper in Presence of Organic CompoundsOrganic compounds containing polar groups including nitrogen, sulfur, oxygen [14-22] and heterocyclic compounds with polar](https://img.pdfslide.us/doc/110x75/60b30c7fb90de02c262ccb89/anodic-corrosion-of-copper-in-presence-of-organic-organic-compounds-containing-polar.jpg)