Embed Size (px)
Citation preview
Study of the Apparent Kinetics of Biomass
Gasification Using High-Temperature
Steam
ALIAKSANDR ALEVANAU
Licentiate Thesis in Energy and Furnace
Technology Stockholm, Sweden 2010
Study of the Apparent Kinetics of Biomass Gasification Using High-Temperature Steam
Aliaksandr Alevanau
Licentiate Thesis
Stockholm 2010
Royal Institute of Technology
School of Industrial Engineering and Management
Department of Material Science and Engineering
Division of Energy and Furnace Technology
SE-100 44 Stockholm
Sweden
Akademisk avhandling som med tillstånd av Kungliga Tekniska Högskolan I
Stockholm framlägges för offentlig granskning för avläggande av teknologie
licentiatexamen onsdagen den 29 November 2010, kl. 13 i sal V3, Teknikringen 72,
Kungliga Tekniska Högskolan, Stockholm.
ISRN KTH/MSE--10/65--SE+ENERGY/AVH
ISBN 978-91-7415-793-2

Aliaksandr Alevanau. Study of the Apparent Kinetics of Biomass Gasification Using
High-Temperature Steam
Royal Institute of Technology
School of Industrial Engineering and Management
Department of Material Science and Engineering
Division of Energy and Furnace Technology
SE-100 44 Stockholm
Sweden
ISRN KTH/MSE--10/65--SE+ENERGY/AVH
ISBN 978-91-7415-793-2
The author

I
Abstract
Among the latest achievements in gasification technology, one may list the
development of a method to preheat gasification agents using switched ceramic honey
combs. The best output from this technology is achieved with use of water steam as a
gasification agent, which is heated up to 1600 °C. The application of these
temperatures with steam as a gasification agent provides a cleaner syngas (no nitrogen
from air, cracked tars) and the ash melts into easily utilised glass-like sludge. High
hydrogen content in output gas is also favourable for end-user applications.
Among the other advantages of this technology is the presumable application of fixed-
bed-type reactors fed by separately produced and preheated steam. This construction
assumes relatively high steam flow rates to deliver the heat needed for endothermic
reactions involving biomass. The biomass is to be heated uniformly and evenly in the
volume of the whole reactor, providing easier and simpler control and operation in
comparison to other types of reactors. To provide potential constructors and exploiters
of these reactors with the kinetic data needed for the calculations of vital parameters
for both reactor construction and exploitation, basic experimental research of high-
temperature steam gasification of four types of industrially produced biomass has
been conducted.
Kinetic data have been obtained for straw and wood pellets, wood-chip charcoal and
compressed charcoal of mixed origin. Experiments were conducted using two
experimental facilities at the Energy and Furnace Division of the Department of
Material Science and Engineering (MSE) at the School of Industrial Engineering and
Management (ITM) of the Royal Institute of Technology (KTH) and at the
Combustion Laboratory of the Mechanical Engineering Department of the University
of Maryland (UMD), USA.

II
The experimental facility at the Energy and Furnace Division has been improved with
the addition of several constructive elements, providing better possibilities for
thermo-gravimetric measurements.
The obtained thermo-gravimetric data were analysed and approximated using several
models described in the literature. In addition, appropriate software based on the
Scilab package was developed. The implementation of the isothermal method based
on optimisation algorithms has been developed and tested on the data obtained under
the conditions of a slow decrease of temperature in experiments with the char
gasification in small-scale experimental facilities in the Energy and Furnace Division.
The composition of the gases generated during the gasification of straw and wood
pellets by high-temperature steam has been recorded and analysed for different
experimental conditions.

III
Acknowledgement
I give my sincere thanks for such a wonderful opportunity to conduct this research to
both of my supervisors, Docent Weihong Yang and Professor Wlodzimierz Blasiak.
Special thanks go to Professor Pär Jönsson, Eva Sundén, Jan Bång, Henry Waldell
and other MSE collaborators for all their help.
I would also like to express my personal gratitude to the Docent of Belarussian
National Technical University, N.S. Nazarov. It was because of him that I started to
study gasification using high-temperature steam.
My best wishes and deepest gratitude go to Professor Ashvani K. Gupta and Assistant
Professor Islam Ahmed, who helped me with research at the University of Maryland.
I give my sincere thanks to Hatem, Pawel, Amit, Kentaro, Efthymios and other
friends I met during this research project and to my family, who has always supported
me.
I also would like to express my sincere gratitude to Vetenskaprådet for financial
support of this research.
My deepest faithful thanks as a Bahá'í to the One to Whom all the thanks should be
brought and for Whom all work should be done with the greatest devotion and
attitude.

IV
Papers included in the Thesis
Supplement I. Aliaksandr Alevanau, Pawel Donaj, Weihong, Yang, Wlodzimierz
Blasiak, High temperature steam gasification of straw pellets, submitted to
ELSEVIER Journal Fuel in October 2010.
Contribution to the paper: participated in all experiments, performed the modelling,
wrote the simulation section of the paper.
Supplement II. Aliaksandr Alevanau, Islam Ahmed, Ashwani K. Gupta, Weihong
Yang, Wlodzimierz Blasiak, Parameters of high temperature steam gasification of
original and pulverised wood pellets, submitted to ELSEVIER Journal of Fuel
Processing Technology in October 2010.
Contribution to the paper: participated in all experiments, wrote the entire paper.

1
Contents
1. Introduction ............................................................................................................ 2
2. Literature review .................................................................................................... 5
3. Objectives of this work .......................................................................................... 9
4. Methodology ........................................................................................................ 10
4.1. Experimental facilities, materials and methods ................................................ 10
4.1.1. Small-scale gasification facility at MSE/ITM, KTH .................................... 10
4.1.1.1. Gasification of two types of charcoal ........................................................ 13
4.1.1.2. Gasification of straw pellets ...................................................................... 16
4.1.2. Small-scale gasification facility at UMD ...................................................... 17
4.1.2.1. Gasification of wood pellets ...................................................................... 19
5. Models.................................................................................................................. 19
5.1. Hypothesis......................................................................................................... 19
5.2. Models applied .................................................................................................. 20
5.3. Error analysis .................................................................................................... 21
6. Results and discussion ......................................................................................... 23
6.1. Gasification of two types of charcoal ............................................................... 23
6.1.1. Kinetic data obtained by the isothermal method ........................................... 23
6.1.2. Kinetic data obtained by the modified isothermal method ........................... 24
6.1.3. Experimental-setup applicability notes ......................................................... 29
6.2. Gasification of straw pellets.............................................................................. 31
6.3. Gasification of wood pellets ............................................................................. 35
7. Conclusions .......................................................................................................... 40
8. Future work .......................................................................................................... 43
9. References ............................................................................................................ 44
List of Tables ............................................................................................................... 48
List of Figures .............................................................................................................. 48

2
1. Introduction
The problem of an efficient use of available energy resources is currently considered
to be one of the most crucial problems facing societies in all parts of the world.
Threats linked with the impending depletion of coal, oil and gas natural resources,
political crises related to their sales and distribution and global ecological problems
linked with their use are among the factors motivating societies to search for and use
ecologically clean and renewable energy resources. Among these resources, wastes of
different kinds, including naturally, agriculturally and industrially produced biomass,
are potential sources for energy generation with a reduced ecological impact.
The actual demand for an efficient use of biomass is based on the constantly growing
portion of the world-wide energy production that involves energy extraction from
biomass. In 2005, this portion was 10,1 % of the overall consumption, and a constant
increase is projected. By 2030, the overall amount of biomass consumed for energy
production will rise to the equivalent of over 2 billion tonnes of oil. With appropriate
technology, these resources are renewable.
To achieve energy generation that is more environmentally friendly from these
resources, gasification needs to be considered as a possible alternative to combustion.
Research into gasification during the last few decades has resulted in the development
of several highly advanced technological applications of biomass gasification,
including the construction and exploitation of several fluidised bed-type reactors in
Europe and rotary kiln reactors. These reactors use different gasification agents and
different constructive solutions to provide users with both electricity and heat
generation. Minimal environmental impact is obtained by the use of wastes with the

3
assistance of these reactors and by cleaner power generation due to the intrinsic
characteristics of the technologies used.
Among the latest achievements in gasification technology is the development of a
method to preheat gasification agents using switched ceramic honey combs [1][2][3]
[4]. The best outputs from this technology are achieved with the use of water steam as
a gasification agent, which is heated up to 1600 °C. The application of these
temperatures with steam as a gasification agent provides a cleaner syngas (no nitrogen
from air, cracked tars) and ash melted into easily utilised glass-like sludge. High
hydrogen content in the output gas is also favourable for end-user applications.
Among the other advantages of this technology is the presumable application of fixed-
bed-type reactors fed by separately produced and preheated steam. This reactor
construction assumes relatively high steam flow rates to deliver the heat needed for
endothermic reactions with biomass. The biomass is to be heated uniformly in the
entire reactor volume, thus providing easier and simpler control and operation
compared to other reactor types. To provide the potential constructors and exploiters
of these reactors with the kinetic data needed for the calculations of the parameters
vital for both reactor construction and exploitation, basic experimental research of
high-temperature steam gasification of four types of industrially produced biomass
has been conducted. These four types of biomass are publicly sold straw, wood
pellets, wood-chip charcoal and compressed charcoal of mixed origin. The first two
types of biomass are useful both for feeding small-scale gasifiers sold for domestic
use [5] and for feeding industrial-scale gasifiers analogous to the gasifier developed
and built at the Energy and Furnace Division at MSE/ITM, KTH [1][2][3] [4].
The other two types of biomass are meant to be used for gasifiers operating without
an active pyrolysis phase. The author of this thesis took part in the design and
4
development of this type of small-scale gasifier fed by charcoal and high-temperature
(up to 950 °C) steam [6][7]. Experiments at MSE on this type of industrially produced
biomass were conducted with the aim of testing the applicability of improved
experimental facility for the measurements of kinetic parameters of char gasification
applicable for the design of gasifiers that use only high-temperature steam, as
described in [6] and [7].

5
2. Literature review
The term “gasification” has very wide meaning in application to biomass, which in
turn is comprised of many different materials of an organic nature. Due to this broad
nature of subjects for scientific analysis, the volume of scientific publications on the
subject is enormous. The consideration of gasification with a single gasification agent
makes the analysis more focused and adds some peculiarities linked with available
types of interactions between the biomass and high-temperature steam. Except for the
two well-known and well-researched phases in the thermal degradation of biomass,
i.e., the pyrolysis and gasification of residual char, one has to consider the reactions of
steam with pyrolysis products in the gas phase.
Another aspect of study is linked to the approximate character of kinetic
measurements conducted with devices that are not specially designed for such
measurements. The small particles used for a TGA apparatus are not applicable for
measurements in simpler experimental setups. Most exact measurements of
gasification kinetics require the smallest possible particles of the researched materials,
which are not possible with the available experimental setups and necessitate the
consideration of effects of diffusion resistances and concentration, pressure and
temperature gradients for disperse volumes of the researched materials.
This objectivity has a positive effect with regard to enforcing a more engineering-like
approach to scientific research. One has to consider such theories as developed by
G.A. Simons in [8] and [9], S.K. Bhattia and D.D. Perlummer in [10] and [11], J.
Szekely and J.W. Evans in [12] and [13] and J.W. Evans and S. Song in [14]. These
theories consider the formation and disappearance of pores in the porous structures of
solids that are subjected to gasification or pyrolysis reactions. These considerations,

6
together with the analysis of diffusion resistances and transport properties for gases
and reaction products in the porous structures of solids, have a direct impact on the
accuracy of simulations of the processes occurring in gasified particles of different
characteristic sizes.
The theory developed by G.A. Simons in [8] and [9] considers the formation and
development of tree-like pore structures during pyrolysis with the consequent analysis
of the transport of different species in the structure. S.K. Bhattia and D.D. Perlummer
in [10] and [11] developed the random-pore model, which takes to account the
nonlinear character of the evolution of an internal surface in the porous structure of
solids. This theory considers the coalescence of pores with correspondent growth of
the surface area competing with the decrease in the number of pores during
gasification.
Another well known theory developed by J. Szekely and J.W. Evans in [12] and [13]
considers the structure of solids comprised of grains. The surface of the solid grains
reacts with gas. The unreacted grain core shrinks during this process. Therefore, these
theories, which consider the reaction progress in the whole system, are known as
shrinking core theories.
The approach developed by G.A. Simons in [8] and [9] considers a tree-like structure
of pores dynamically growing during the pyrolysis and gasification of char. This
theory is less well known but has some analogies in modern theories analysing
reactions and transport on fractal-like catalyst networks in gasified pellets [15][16].
Common characteristics of the theories listed above are their sound applicability to
the relatively large structures of porous solids (pellets) subjected to gasification. In
contrast to the volumetric model, described by D.L. Pyle and C.A. Zaror in [17], the
7
size limit of the analysed particles in reactions considered to be controlled by
chemical kinetics is not so strict. The computational properties of the functions
derived based on these theories allow variation of the parameters, taking into account
such pellet properties as form factors and integral porosity characteristics. The
variation of these parameters may lead to the applicability of the simplified final
expressions of the theories for the prediction of the conversion extents for pellets of
different sizes. This approach to the use of the random-pore model regarding its
structural parameter is recommended by K. Miura and others in [18].
The other important aspect is related to the practical engineering questions of the
operation of the fixed-bed reactors and other reactor types. This aspect concerns the
resistances of the flow of the gasification agent and the products of its reaction with
pellets or fine particles in the entire reactor volume. The corresponding transport
phenomena represent another scale level that must be considered for the creation of
accurate simulations of the gasification process in the whole reactor. An attempt to
build such a model for reactors with the same parameters as the reactor researched at
KTH in [1][2][3][4] was made by X. Wang and others in [19]. The model is based on
the smoothed-particle-hydrodynamics (SPH) method developed in astrophysics to
simulate the dynamics of particles subjected to the action of different types of fields.
The particles may be of different types and properties, may appear and disappear, may
interact and contract in a gravity field or may be moved by the flow of other particles.
The model built in [19] may incorporate the outputs of the lower-scale model of one
pellet to model the whole reactor on a larger scale. The possibility of simulating the
behaviour of particles with different properties allows the easy modelling of catalytic
effects from insertions of alkali metals and other catalysts into the pellets. These
possibilities make the method highly appropriate for gasification simulations.

8
Another method similar to SPH with regard to its particle-based approach was
presented by T. Yamashita and others in [20]. This method is based on statistical
simulations, including the random-walk and Monte-Carlo approaches. A random walk
of micro volumes of the gasification agent is modelled inside a char particle in the
form of a cube with a complicated internal structure. The inclusions of ash particles in
the char form agglomerates and may play catalytic role during the process.
This approach, however, is applicable only for char gasification. The rates of the
thermo-chemical conversion of biomass during pyrolysis might be simulated using
small particles and the volumetric model with the simplified final expression
presented by J. Fermoso and others in [21]. The other models referenced in [21] are
mainly applicable for char gasification.

9
3. Objectives of this work
The correct simulations and control of reactors using integral and multi-scale models
described above require information about the basic kinetic properties of the
conversion of different materials fed into the reactors. Therefore, the main objectives
of this work include the following interconnected tasks:
1. To perform experiments on the chosen biomass types to determine the
apparent gasification kinetics using high-temperature steam.
2. To apply the random-pore, grain and volumetric kinetic models to the
experimental data on the high-temperature conversion of the researched
biomass.
3. To analyse the applicability of the models in the applied experimental
conditions.
The types of biomass chosen for the experiments are two types of industrially
produced pellets (straw and wood) and two types of charcoal (wood chips and
compressed bricks of arbitrary origin).

10
4. Methodology
In general, the methodology of the study of the applicability of the three different
kinetic models depends on the model and available sample parameters. In addition,
the possibilities of control over and change of the experimental conditions play a
significant role in the applicability of the obtained results.
For the volumetric model, the materials must be prepared as the smallest particles
possible for the easy access of the gasification agents. The pressure and temperature
conditions and the gasification-agent flow rates must be stable for reliable
measurements of gasification kinetics. Additionally, a certain accuracy of the mass-
loss measurements is needed to obtain kinetic parameters with minimal errors.
For the random-pore and grain models, the most important factor is the availability of
data about the internal porosity and effective diffusion coefficients characterising the
particles of interest. If these data are unavailable, variations of particle size and form
factors followed by variations of the corresponding model parameters must be applied
to obtain the apparent kinetic parameters.
4.1. Experimental facilities, materials and methods
4.1.1. Small-scale gasification facility at MSE/ITM, KTH
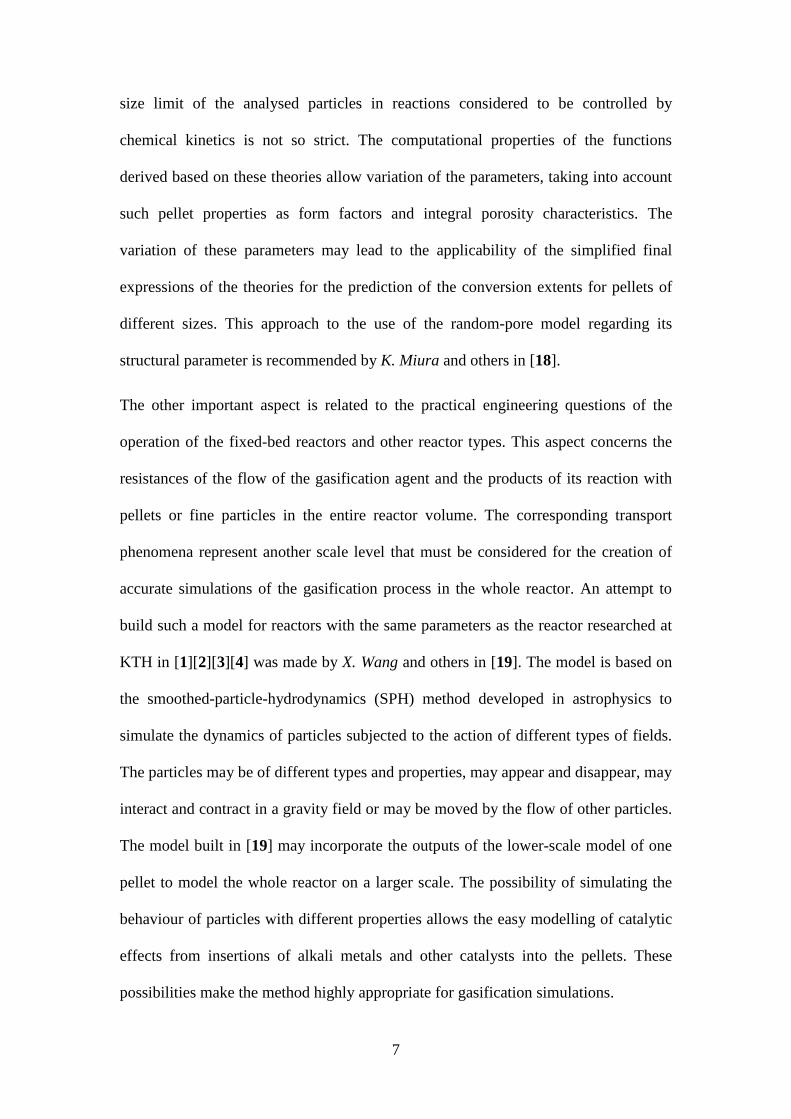
The schematics of the small-scale gasification facility are presented in Figure 1.
11
Figure 1. Schematics of the mini test facility at the Energy and Furnace Division of
MSE/ITM, KTH
The sample holder depicted in the schematics may be used for experiments of two
different designs. The first design is applied in measurements using relatively heavy
metallic baskets filled by the sample materials with the possibility of measuring the
temperature inside the basket using an S-type thermocouple. Both the thermocouple
and the basket are hung on a wire attached to digital scales.
Because this construction is relatively heavy, the accuracy of the mass-loss
measurements is insufficient for the use of the volumetric model for mass-loss
measurements during char gasification. The accuracy is also reduced by the wiring to
the thermocouple used for the temperature measurement inside the basket.
To improve the accuracy of the measurements of the char-gasification parameters, a
second sample-holder design was developed. Its use with light samples hung on tiny
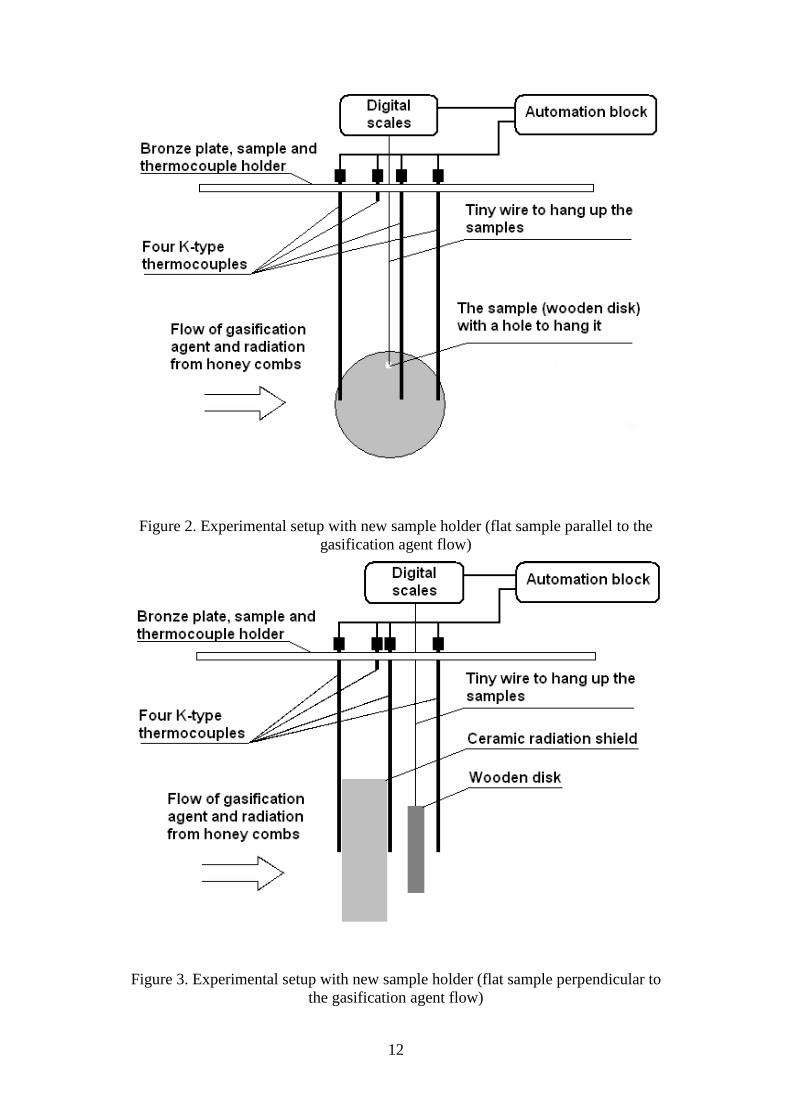
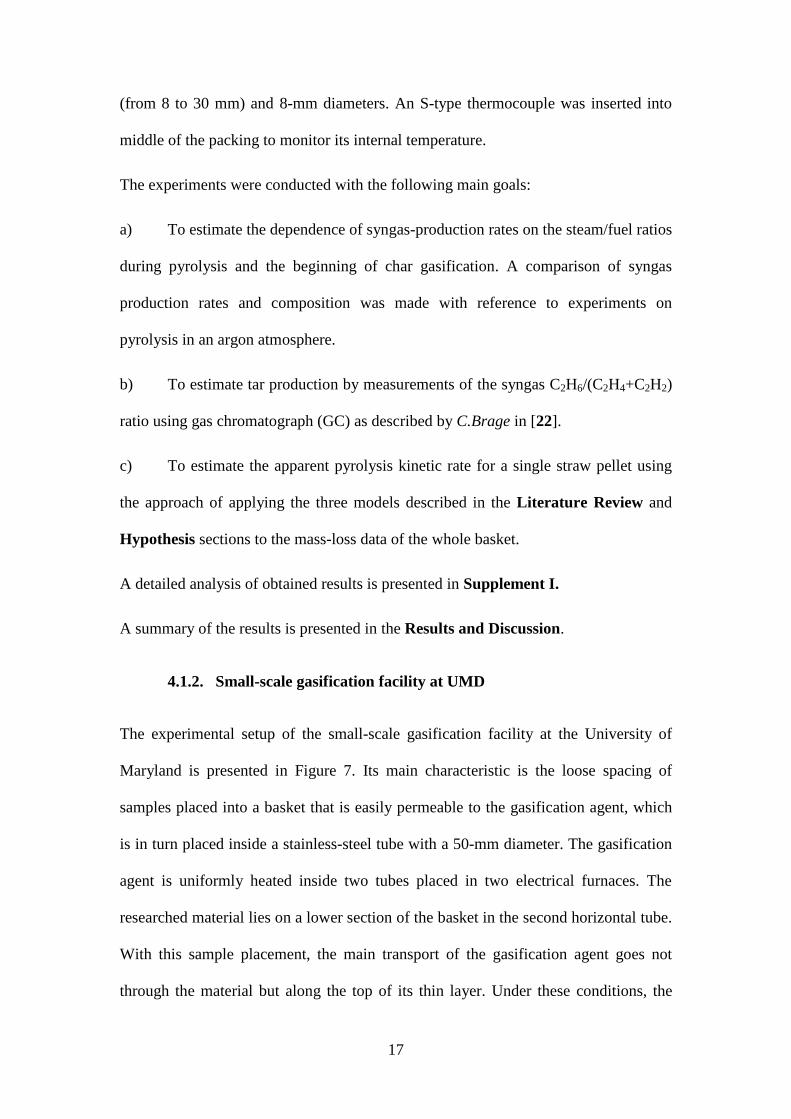
wires and surrounded by K-type thermocouples is depicted in Figure 2 and Figure 3.
12
Figure 2. Experimental setup with new sample holder (flat sample parallel to the
gasification agent flow)
Figure 3. Experimental setup with new sample holder (flat sample perpendicular to
the gasification agent flow)

13
The four K-type thermocouples that are able to bend are ideal for measuring
temperatures during sample cooling and during active gasification in the reaction
chamber.
It is possible to limit the influence of hydrodynamic instabilities on the accuracy of
mass-loss measurements by bending the thermocouples to hold the samples in a flow
setup.
The other advantage of the use of these thermocouples is the possibility of installing
protective shields between the thermocouples to create the desired conditions of
irradiation and flow of the agents around the samples.
4.1.1.1. Gasification of two types of charcoal
Experiments with compressed charcoal of mixed origin and with charcoal produced
from wood chips were conducted to test the applicability of the new experimental
setup for kinetic measurements with small char particles. The particles were obtained
by the mechanical milling of the original charcoals. The pulverised mixture was
filtered using two mesh types to obtain particle sizes in the ranges 0.5 mm to 1 mm
and 0.1 mm to 0.5 mm. Two corresponding types of baskets were designed for these
two types of particles. The baskets were made from one type or two types of the
meshes used for filtering, and the experiments were conducted with two physical
forms of the baskets. One basket type was cylindrical (8 mm in diameter, 5 cm in
height), and the other was a rectangular flat layer (50x80x3 mm). The baskets are
presented in Figure 4, Figure 5 and Figure 6. A summary of the experimental
parameters and conditions for selected cases is presented in Table 1.

14
Group
of cases Type of sample
Size of
particles
(mm)
Mass in a
basket (g)
Type of
basket
Temperature of
agent (K)
1 Compressed
charcoal 0,5-1 0,9-2,0 Cylinder 1109-1023
2 Compressed
charcoal 0,1-0,5 4,47-5,03 Flat layer 1100-1010
3 Compressed
charcoal 0,5-1 3,58-4,97 Flat layer 1059-988
4 Charcoal of wood
chips 0,1-0,5 3,09-3,21 Flat layer 1108-1015
5 Charcoal of wood
chips 0,5-1 2,65-3,35 Flat layer 1148-994
Table 1. Summary of the conditions of the conducted experiments
Figure 4. Cylindrical basket with visible ash particles on the surface of the char after
gasification
Figure 5. Basket made up of a rough wire mesh with contracted layer of char particles
after gasification

15
Figure 6. Basket with the finer mesh inserted into the rough mesh
Because the kinetics of char gasification is relatively slow compared to the delivery
time of the gasification agents via honey combs at a stable temperature, the conditions
of the slowly decreasing temperature of the agents must be used to determine the
Arrhenius parameters for the main heterogeneous (gas-solid) reaction.
(1)
The method applied for analysis is the straightforward application of the isothermal
method [17][21] to determine the Arrhenius parameters for a reaction using the
measured data of the main reactant mass loss observed under different temperatures.
Because the rate of temperature decrease for the reaction is of the same order as the
rate of the mass loss of the main reactant, one may select the corresponding parts of
the graphs for the calculation of the Arrhenius parameters by applying the assumption
of pseudo-isothermal conditions for each part. The average temperatures of selected
parts of the graphs are applied to determine the activation energy and frequency factor
for a reaction with masses observed for those parts.
The main condition of the applicability of this method is being in the regime of a
kinetically controlled reaction.

16
According to [17], in such a regime, one may describe the reaction by
(2)
where is the time-dependent reactant density, is its final density and is set to
zero, is its initial density, t is time (s), A is the frequency factor (s-1
), E is the
reaction activation energy (J/mol), R is the molar gas constant (JK-1
mol-1
), and T is
reaction temperature (K).
With =0, the reactant density may be changed to mass in the basket, and equation
(2) can be rewritten as
(3)
Here, k(T) is the temperature-dependent Arrhenius constant, t is the reaction time,
is the reaction-time- and temperature-dependent reactant mass in the basket,
and is initial reactant mass.
If one neglects the presence and effects of ash during gasification and takes X=1-
m(t,T)/m0, equation (3) becomes equivalent to the final expression of the volumetric
model (11).
To correctly estimate the applicability of the new experimental setup for kinetic
experiments, the mass-loss data in the Results and Discussion section are presented
“as is” along with the approximations from equation (3).
4.1.1.2. Gasification of straw pellets
The experiments with straw pellets were conducted using the former experimental
setup with relatively large wire mesh baskets in form of slabs with dimensions of
30x50x80 mm. The basket was randomly packed straw pellets of random lengths
17
(from 8 to 30 mm) and 8-mm diameters. An S-type thermocouple was inserted into
middle of the packing to monitor its internal temperature.
The experiments were conducted with the following main goals:
a) To estimate the dependence of syngas-production rates on the steam/fuel ratios
during pyrolysis and the beginning of char gasification. A comparison of syngas
production rates and composition was made with reference to experiments on
pyrolysis in an argon atmosphere.
b) To estimate tar production by measurements of the syngas C2H6/(C2H4+C2H2)
ratio using gas chromatograph (GC) as described by C.Brage in [22].
c) To estimate the apparent pyrolysis kinetic rate for a single straw pellet using
the approach of applying the three models described in the Literature Review and
Hypothesis sections to the mass-loss data of the whole basket.
A detailed analysis of obtained results is presented in Supplement I.
A summary of the results is presented in the Results and Discussion.
4.1.2. Small-scale gasification facility at UMD
The experimental setup of the small-scale gasification facility at the University of
Maryland is presented in Figure 7. Its main characteristic is the loose spacing of
samples placed into a basket that is easily permeable to the gasification agent, which
is in turn placed inside a stainless-steel tube with a 50-mm diameter. The gasification
agent is uniformly heated inside two tubes placed in two electrical furnaces. The
researched material lies on a lower section of the basket in the second horizontal tube.
With this sample placement, the main transport of the gasification agent goes not
through the material but along the top of its thin layer. Under these conditions, the

18
gasification process is controlled by its chemical kinetics, temperature, and molecular
and Knudsen diffusion.
The gases used were nitrogen and steam with molar fractions of 0.59 and 0.41,
respectively, under a pressure slightly exceeding atmospheric pressure. These gases,
together with the product gases, flow via the basket with samples to a separate outlet
instantiated before the open-ventilated exhaust. The outlet provides the gases for
analysis. The steam is condensed, the tars are filtered, and the product gases are
pumped into a gas collection system consisting of intermediate volumes used for more
frequent sampling of gases further processed by GC. The timed summation of the GC-
measured mole fractions of methane, carbon oxide and dioxide produced after the
completion of the active pyrolysis (4 min) gives the timed conversion extent of carbon
in char and residues of volatiles in its structure in the reaction with steam. These data
allow the applications of the random-pore, grain and volumetric models to obtain the
best apparent kinetic parameters of the gasification of the studied materials.
Figure 7. Experimental setup used for gasification experiments (1-electronically
regulated gas supply; 2-hydrogen combustor; 3-first electric furnace; 4-second electric
furnace; 5-basket with biomass; 6-mechanical joint; 7-gas exhaust; 8-filter, condenser,
pump; 9-input valves; 10-intermediate volumes for gases; 11-output valves; 12-
Agilent Micro GC)

19
4.1.2.1. Gasification of wood pellets
Experiments at the small-scale gasification facility in the Combustion Laboratory of
the Department of Mechanical Engineering of the University of Maryland were
conducted with pulverised and original wood pellets. The whole mass of the pellets
was 35 grams.
The particle sizes of the pulverised pellets were 0.1 to 1.0 mm. The diameter of the
original pellets was 8 mm, and the average length was 20 mm. The proximate,
ultimate and ash analysis of the pellets are presented in Supplement II. Due to the
fact that the mass-loss measurements in the applied experimental setup were
conducted with help of GC with an injection period of 3 minutes, the obtained data
are only applicable for the analysis of the char-gasification stage. A comparative
analysis of the gases produced during this stage with respect to the gasification
efficiency of pulverised and original pellets is presented in the Results and
Discussion and in Supplement II.
5. Models
5.1. Hypothesis
From a hypothetical point of view, the rapid pyrolysis rate of relatively large particles
(comprised of random pellet packing) observed at high temperatures and high flow
agent rates might be applicable to the random-pore and grain models. This application
might be possible due to a direct analogy between the processes of the transfer of
gasification agent into porous solid particles and the processes of heat transfer into
pellet bundles with random packing. In both pyrolysis and gasification, the heat and
the gaseous agent play the roles of active agents initiating chemical reactions, which
20
change the parameters of porosity and correspondent resistances for transfer of the
agents.
For the random-pore model, one may vary the structural parameter at different
temperatures and parameters of the frequency factor and apparent activation energy.
The optimisation procedure for the grain model must consider the variation of the
form factor along with variation of the frequency factor and apparent activation
energy.
The volumetric model may be applied for the estimation of the apparent kinetic
parameters for a single pellet in a bundle with the assumption that resistance for heat
transfer to each pellet in such a bundle is negligible. The results of its application
should be compared with the presumably more exact results from the random-pore
and grain models, which take to account the resistance to heat transfer in random
pellet packings.
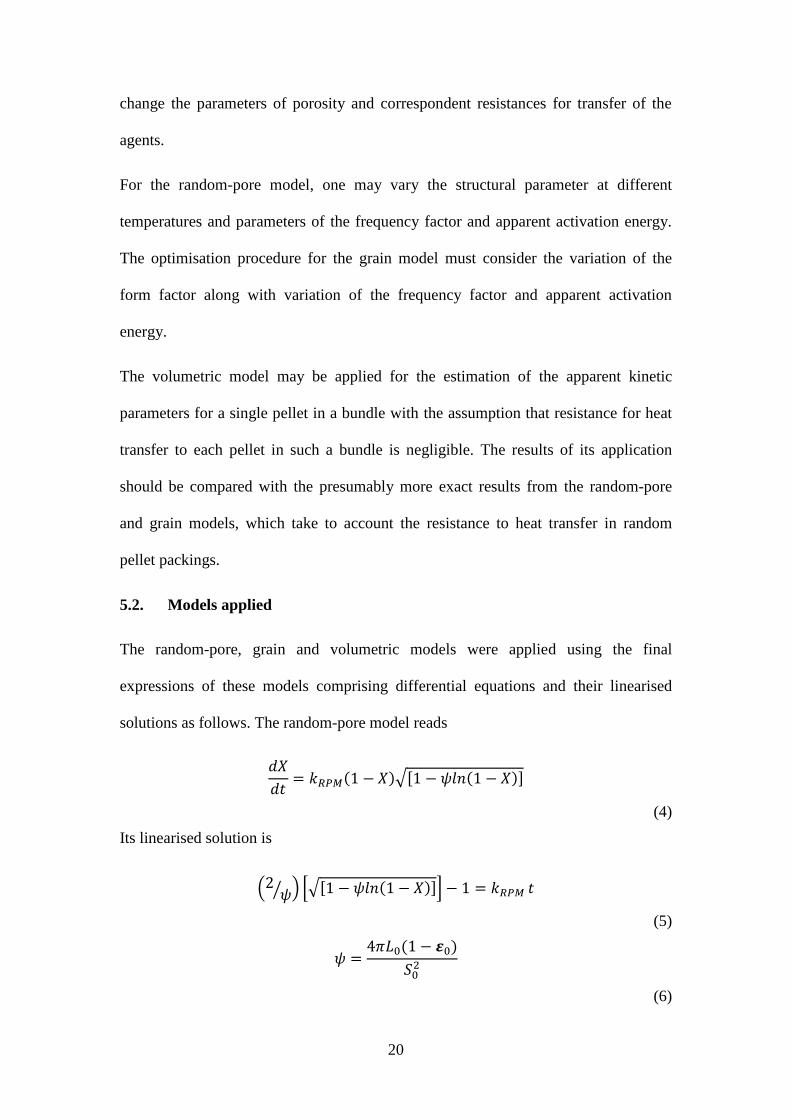
5.2. Models applied
The random-pore, grain and volumetric models were applied using the final
expressions of these models comprising differential equations and their linearised
solutions as follows. The random-pore model reads
(4)
Its linearised solution is
(5)
(6)

21
Here, X is the degree of conversion, and Ψ is the parameter of the random-pore model
related to pore surface S0, length L0 and the solid porosity ε0 of the unreacted
particles; kRPM is the kinetic rate constant of the reaction presented by the Arrhenius
equation (7).
(7)
The grain model for a spherical particle reads
(8)
Its linearised solution is
(9)
The volumetric model reads
(10)
Its linearised solution is
(11)
These models have been implemented in software using the free software package
Scilab.
5.3. Error analysis
The main sources of errors in the measurements at the small-scale gasification facility
(see Figure 1) are described in the discussions of the results of the charcoal-
gasification experiments. All of the approximations of the mass-loss measurements
obtained during the experiments at this facility and the facility at UMD (see Figure 7)
22
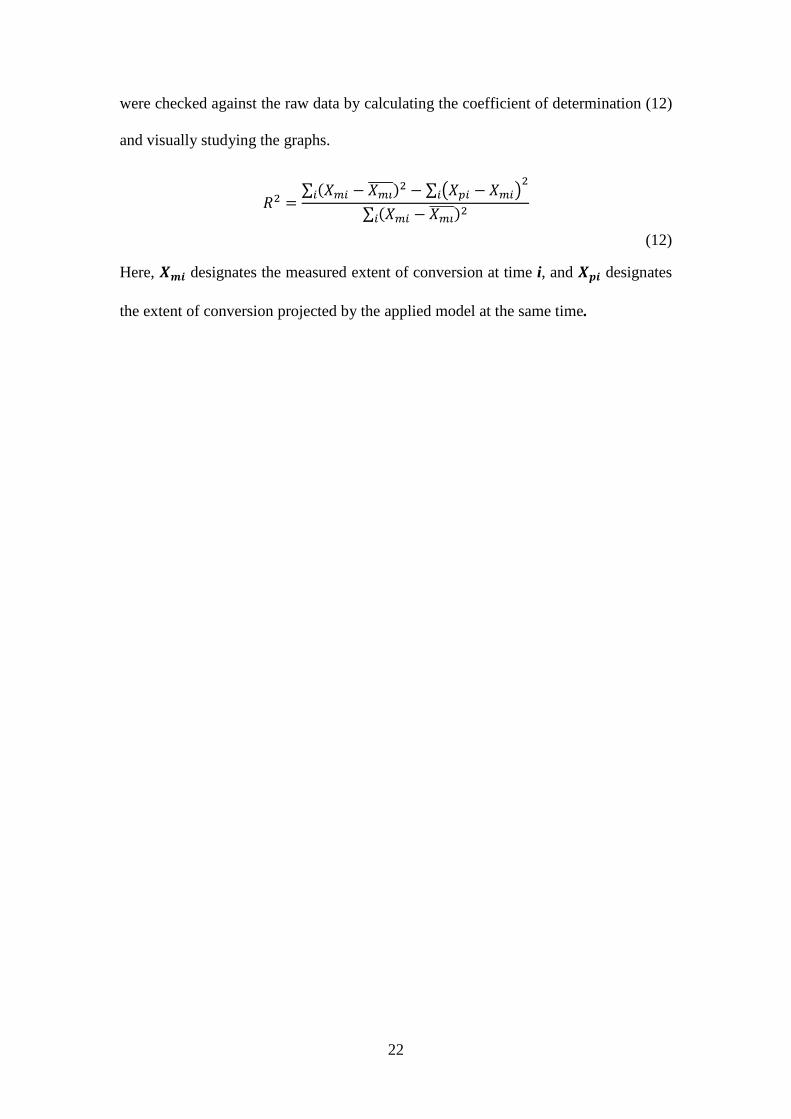
were checked against the raw data by calculating the coefficient of determination (12)
and visually studying the graphs.
(12)
Here, designates the measured extent of conversion at time i, and designates
the extent of conversion projected by the applied model at the same time.

23
6. Results and discussion
6.1. Gasification of two types of charcoal
6.1.1. Kinetic data obtained by the isothermal method
The charcoal chosen for experiments was in the form of rounded pressed bricks and
wooden chips of different sizes and forms. The charcoal was milled to make two
distinct particle sizes for the two types of meshes used in the baskets. The accuracy of
the calculations of the kinetic parameters for the main reaction with carbon of the
charcoals was significantly reduced due to the relatively long duration of the
experiments and the drop of initial temperatures by up to 20 % of the absolute
magnitude. Due to these factors, the temperatures under the conditions of a slow
decrease were averaged, and a standard procedure [21] [23] was applied to calculate
the activation energy and frequency factor for the initial parts of the mass loss curves.
A Scilab program was written and used to process the requested number of raw Excel
files with the recorded mass loss and averaged temperature curves. The results of the
calculations are presented in Table 2.
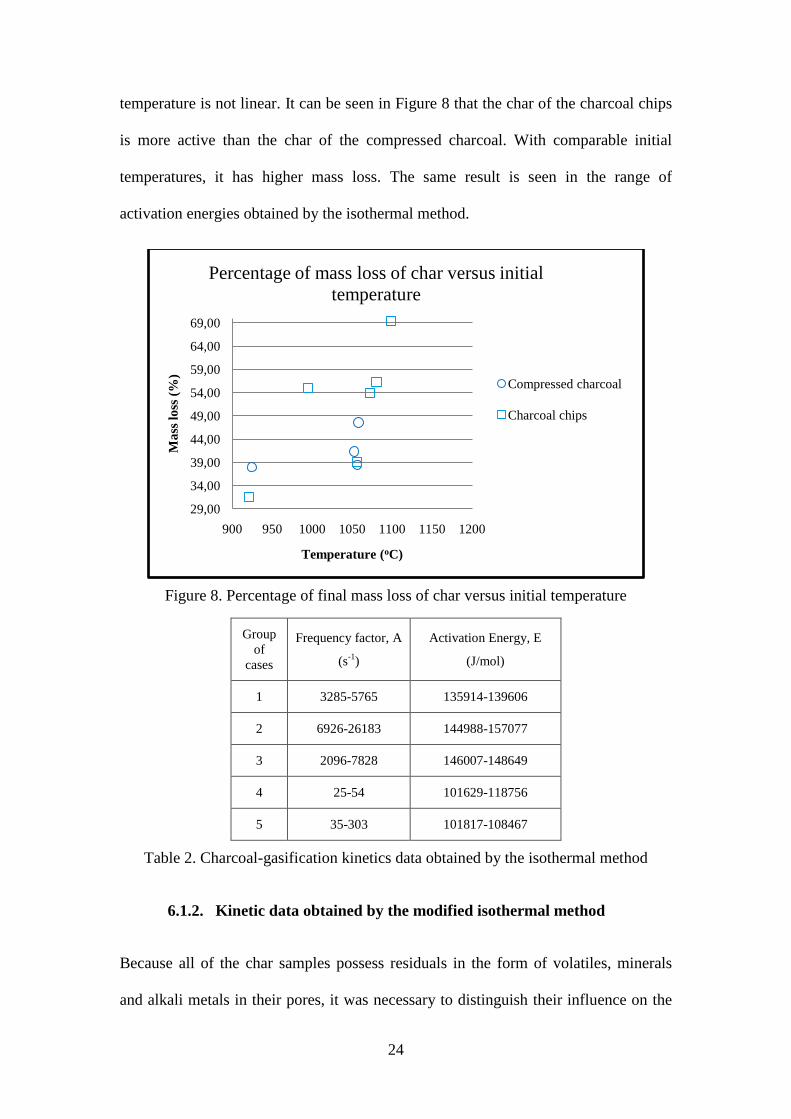
Additionally, the initial masses of the cold char and the final masses of the char after
gasification were measured. These measurements showed superior correlation
between the initial temperature in the reaction chamber and the percentage of mass
loss for the charcoal chips than for the compressed charcoal.
Several attempts with initially high temperatures were unsuccessful with regard to
cooling the char using nitrogen. For these cases, the data of the final mass loss are
absent. Because the initial temperature drop depends on many such factors, such as
the temperature of the surroundings and delays of sample-holder insertion, the
correlation between the initial temperature and the successive effective gasification
24
temperature is not linear. It can be seen in Figure 8 that the char of the charcoal chips
is more active than the char of the compressed charcoal. With comparable initial
temperatures, it has higher mass loss. The same result is seen in the range of
activation energies obtained by the isothermal method.
Figure 8. Percentage of final mass loss of char versus initial temperature
Group
of
cases
Frequency factor, A
(s-1
)
Activation Energy, E
(J/mol)
1 3285-5765 135914-139606
2 6926-26183 144988-157077
3 2096-7828 146007-148649
4 25-54 101629-118756
5 35-303 101817-108467
Table 2. Charcoal-gasification kinetics data obtained by the isothermal method
6.1.2. Kinetic data obtained by the modified isothermal method
Because all of the char samples possess residuals in the form of volatiles, minerals
and alkali metals in their pores, it was necessary to distinguish their influence on the
29,00
34,00
39,00
44,00
49,00
54,00
59,00
64,00
69,00
900 950 1000 1050 1100 1150 1200
Ma
ss l
oss
(%
)
Temperature (oC)
Percentage of mass loss of char versus initial
temperature
Compressed charcoal
Charcoal chips

25
reaction kinetics at the beginning of gasification. According to the findings of G.
Chen and others in [24] and H. Wu and others in [25], the gasification of char is
fastest during the first 150 to 200 seconds of the process. A.K. Gupta and others in
[26] point to causes such as the rapid structural changes in the percolation structure of
char. The authors of [27] and [25] explain the same phenomenon by the catalytic
effects of alkali metals with further annealing [27] or further inactivation and
devolatilisation [28].
The discrepancies of the fits observed near the end of the char gasification may be
interpreted as the effects of ash agglomeration in char, providing a catalytic effect due
to the increased relative content of ash.
Additional sources of the rate differences may come from a bias of the process by
sharp gradients existent in the reaction chamber at the beginning of gasification.
Due to the experimental impossibility of determining the possible causes of the
discrepancies between the kinetic reaction parameters at beginning of the process and
during its later stages, the Scilab program processing the raw data files was modified
to provide two sets of parameters for every mass loss curve, which was accomplished
by the corresponding temperature readings. The first set of parameters was calculated
for a part chosen by two mouse clicks on mass loss curve; the second part is selected
by the same procedure.
The part of the data obtained for cases with kinetic reaction control are presented in
Table 3 through Table 6. For each case in the tables, the first chosen part of the curve
is represented by the upper graph and row in the table and the second by the lower
ones.
26
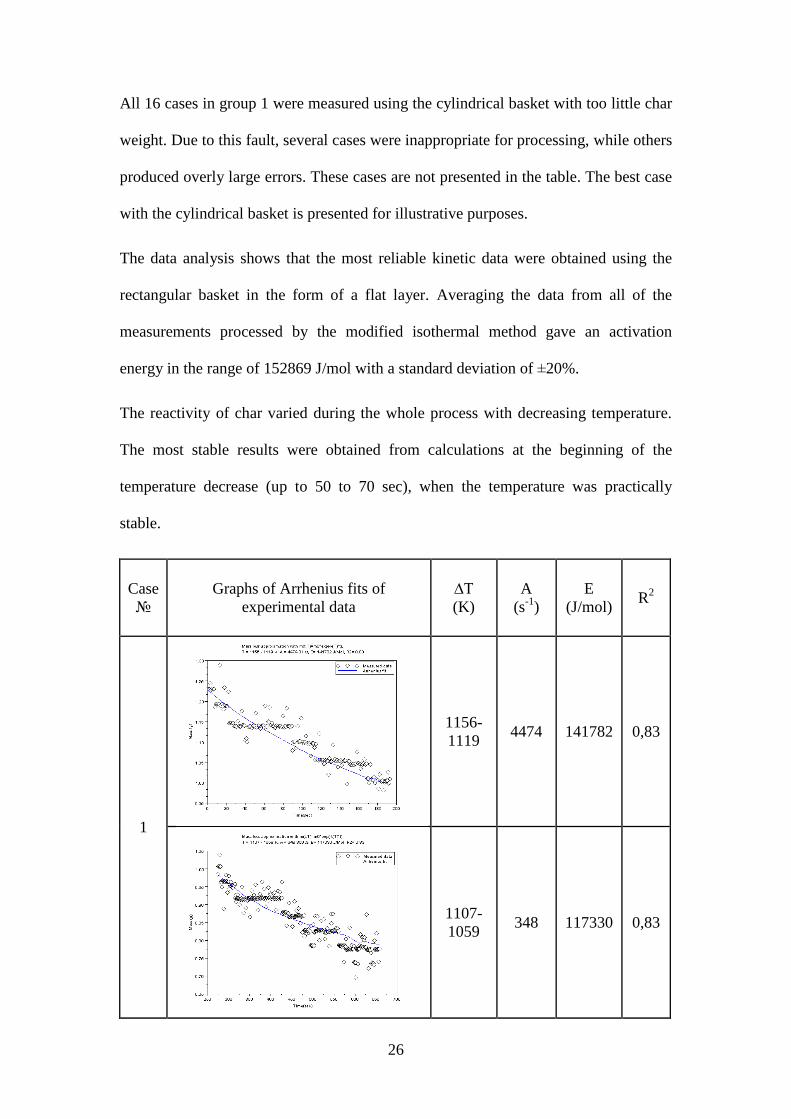
All 16 cases in group 1 were measured using the cylindrical basket with too little char
weight. Due to this fault, several cases were inappropriate for processing, while others
produced overly large errors. These cases are not presented in the table. The best case
with the cylindrical basket is presented for illustrative purposes.
The data analysis shows that the most reliable kinetic data were obtained using the
rectangular basket in the form of a flat layer. Averaging the data from all of the
measurements processed by the modified isothermal method gave an activation
energy in the range of 152869 J/mol with a standard deviation of ±20%.
The reactivity of char varied during the whole process with decreasing temperature.
The most stable results were obtained from calculations at the beginning of the
temperature decrease (up to 50 to 70 sec), when the temperature was practically
stable.
Case
№
Graphs of Arrhenius fits of
experimental data
∆T
(K)
A
(s-1
)
E
(J/mol) R
2
1
1156-
1119 4474 141782 0,83
1107-
1059 348 117330 0,83

27
Table 3. Selected experiments in Group 1
Case
№
Graphs of Arrhenius fits of
experimental data
∆T
(K)
A
(s-1
)
E
(J/mol) R
2
1
1040-
1032 697065 168303 0,95
1032-
967 54 100678 0,91
2
1068-
1056 800 122507 0,93
1069-
990 3593 137153 0,93
Table 4. Selected experiments in Group 2
28
Case
№
Graphs of Arrhenius fits of
experimental data
∆T
(K)
A
(s-1
)
E
(J/mol) R
2
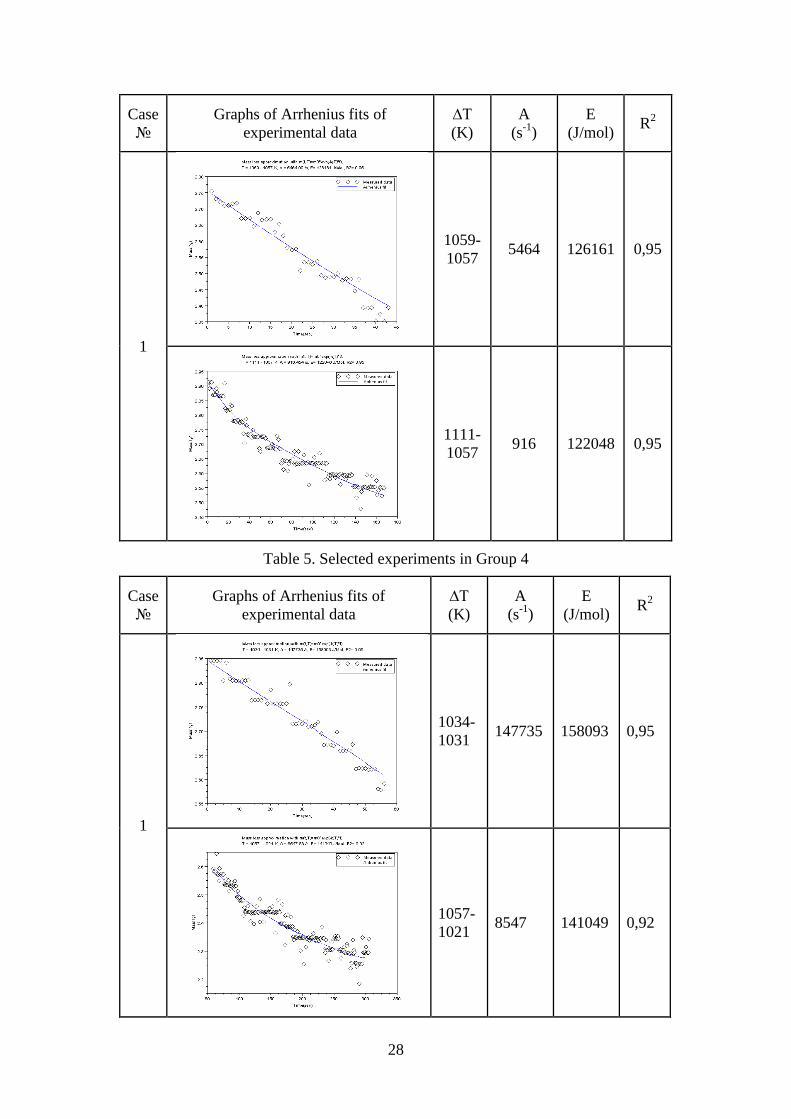
1
1059-
1057 5464 126161 0,95
1111-
1057 916 122048 0,95
Table 5. Selected experiments in Group 4
Case
№
Graphs of Arrhenius fits of
experimental data
∆T
(K)
A
(s-1
)
E
(J/mol) R
2
1
1034-
1031 147735 158093 0,95
1057-
1021 8547 141049 0,92

29
2
1047-
1037 21611 140477 0,97
1047-
1001 28500 151680 0,93
Table 6. Selected cases in Group 5
6.1.3. Experimental-setup applicability notes
Because the measurements were conducted with the main purpose of investigating the
applicability of the improved experimental setup for the kinetic measurements of char
gasification, the following notes concerning this applicability are listed:
a) In the current conditions, the setup has significant disadvantages preventing its
application for measurements of char-gasification kinetics.
The main disadvantage is in the application of digital scales, which are
intended for use with weights up to 750 g. With weights below 1 g, the scales
give errors in the range of 3% in addition to the error of equilibration. The
range of latter error is difficult to estimate because of its dependence on the
weight of the hanging wire and the weight of the inertial elements inside the
scales. The appearance of this error is most visible on the graphs in Table 6 as
horizontal lines of variable length with aggravated densities. Despite the fact

30
that the char weight decreases constantly, the inertial equilibration mechanism
of the scales shows its weight decreasing in discrete steps.
b) An additional source of errors is given by the electronic noise of the
microprocessor device converting readings from the scales to a voltage
measured by a Keithley digital voltmeter. This error gives an additional 10%
of the errors, making the effective accuracy of the weight measurements below
1 g ±0.05 g.
c) Two additional sources of errors are provided by hydrodynamic instabilities.
The first source is the instability of the steam delivery to provide the baskets
with char with gyration. The effects of this instability may be prevented by the
application of shields hanged on bendable thermocouples. Example readings
of mass loss during the pyrolysis of thin wooden disks (6 g, 4-mm thickness,
50-mm diameter) shielded in this way are shown on Figure 9. The disk was
hung behind a thick ceramic block. The block provides shielding against direct
exposure to radiation from the honey comb and against flow instabilities
appearing due to the throttling of steam in pressure drops and control valves.
The application of this shield might also be useful for protection against
condensation drops, which may directly hit the samples or the bottom of the
reactor from its top. These drops provide relatively large and long fluctuations
in measurements.
d) The second type of hydrodynamic instability is provided by convection drag
forces due to the flow of hot air around the scales, which causes relatively long
fluctuations of weight measurements, as observed at the end of the mass loss
curve presented in Figure 9.

31
Figure 9. Mass loss during pyrolysis of a wooden disk
To provide better accuracy of mass-loss measurements during char gasification, it is
reasonable to update the setups with new digital scales, as referenced in [29].
To avoid errors from electronic noise, one should use a direct RS232 connection from
the digital scales to the PC.
6.2. Gasification of straw pellets
Measurements of the concentrations of gases produced during the pyrolysis of straw
pellets and during subsequent gasification in two different steam/fuel ratios revealed
that steam reacts with volatiles produced during pyrolysis and delayed in the porous
structures formed by pellets that are randomly packed into the basket. The ratio of
C2H6/(C2H4+C2H2), which indicates the amounts of tar produced according to
C.Brage in [22], is lowest at the highest steam/fuel ratio (3.2). It is also lower than the
ratio measured for pyrolysis in an argon atmosphere. This finding is illustrated in
Figure 10.

32
Figure 10. Effect of the S/F ratio and temperature on tar evolution based on
ethane/(ethene+ethyne) content.
This result might be due to the superior delivery of heat and gasification agents into
the structure because of the higher steam/fuel ratio used. In this case, the amount of
tar may be comparable to that at higher external temperatures (shown on the graph for
the S/F ratio of 3.2).
This assumption is supported by the estimations of the apparent kinetic parameters
obtained for the pellet mass loss in a basket considered to be a porous particle gasified
by a heat flux, which meets resistances due to the porous structure dynamically
changing during pyrolysis.
The application of the random-pore and grain models, which are supposed for
application to such a particle, gives lower apparent activation energies than the
volumetric model for all cases, as was expected from the tested hypothesis.
This finding is shown by the parameters summarised in Table 7.
0
1
2
3
4
5
6
7
600 650 700 750 800 850 900 950 1000
Agent temperature [oC]
10
*C2
H6
/(C
2H
4+
C2
H2
) [m
ol/
mo
l]
pyrolysis
S/F 1.875
S/F 3.2

33
S/F
Agent
T
(°C)
RPM GM VM
R2 Ψ
k0
(s-1
)
Ea
(J/mol) R
2 FF
k0
(s-1
)
Ea
(J/mol) R
2
k0
(s-1
)
Ea
(J/mol)
1,875
767 0,996 0,56 84 90023 0,995 0,33 82 90069 0,994 9367 130000
830 0,992 2,34 55 90024 0,991 0,33 63 90067 0,986 5381 130000
913 0,985 0,1 75 90020 0,967 0,33 58 90062 0,984 4508 130000
3,2
795 0,985 0,1 108 90021 0,969 0,33 686 108012 0,986 1485 113000
876 0,993 10,42 30 90024 0,976 0,33 385 108037 0,935 790 113000
906 0,994 7,41 40 90023 0,975 0,33 430 108032 0,935 868 113000
Argon
789 0,975 0,1 120 90521 0,983 0,33 621 106018 0,973 3067 119000
830 0,991 400,0 7 90999 0,986 1,0 770 106004 0,815 1951 119000
917 0,995 10,53 27 90523 0,989 0,56 375 106036 0,921 1179 119000
Table 7. Parameters of mass-loss approximations using the RPM, GM and volumetric
models
The difference between the models is most visible at the lowest applied steam/fuel
ratio. The sample approximations for this steam/fuel ratio are shown in Figure 11,
Figure 12, and Figure 13.

34
Figure 11. Conversion fits for the pyrolysis of straw pellets under 767 °C
Figure 12. Conversion fits for the pyrolysis of straw pellets under 830 °C

35
Figure 13. Conversion fits for the pyrolysis of straw pellets under 913 °C
6.3. Gasification of wood pellets
Due to the absence of direct mass-loss measurements in experiments with wood
pellets and due to the rare sampling of the molar flow rates by GC, a main analysis
has been made regarding carbon mass loss during char gasification. The production of
gases and mass-flow rates is noticeably dependent on the pellet form. The layer of
pulverised pellets was gasified more rapidly, as illustrated in Figure 14 and Figure 15,
which present the hydrogen and carbon-dioxide molar flow rates.

36
Figure 14. Hydrogen flow rates for two types of gasified materials
Figure 15. Carbon-dioxide flow rates for two types of gasified materials
Because the main reason for this difference is the higher diffusion resistances for
gases in original pellets than in pulverised ones, approximations of the apparent
conversion rates of the original and pulverised pellets were made using the random-
pore and grain models rather than the volumetric model. The best applicability for
approximations was found for the random-pore model.
The obtained apparent kinetic parameters are summarised in Table 8 and Table 9.
0
0,02
0,04
0,06
0,08
0,1
0,12
0 20 40 60 80 100
Mo
l/m
in
Time (min)
Pulverised at 950 oC Pulverised at 900 oC
Pulverised at 800 oC Original at 950 oC
Original at 900 oC Original at 800 oC
-0,01
0
0,01
0,02
0,03
0,04
0,05
0,06
0,07
0,08
0,09
0 20 40 60 80 100
Mo
l/m
in
Time (min)
Pulverised at 950 oC Pulverised at 900 oC
Pulverised at 800 oC Original at 950 oC
Original at 900 oC Original at 800 oC

37
T
°C
RPM GM VM
R2 Ψ k0(s-1) E(J/mol) R2 k0(s
-1) E(J/mol) R2 k0(s-1) E(J/mol)
Char of pulverised pellets
800 0.807
15,42 246 125650
0,736
1814 137850
0,813
1405 132700 900 0,985 0,970 0,929
950 0,739 0,634 0,406
Char of original pellets
800 0,610
41,25 295 135100
0,500
657 132512
0,443
1081 135800 900 0,996 0,940 0,832
950 0,883 0,843 0,667
Table 8. Parameters of the Arrhenius approximations for char mass-loss data of
pulverised and original pellets
T
°C
RPM GM VM
R2 Ψ k0(s-1) E(J/mol) R2 k0(s
-1) E(J/mol) R2 k0(s-1) E(J/mol)
Char of pulverised pellets
800 0,974 0,21 999 125650 0,935 2576 137850 0,960 2580 132700
900 0,933 100,0 99 125650 0,981 1931 137850 0,603 2281 132700
950 0,995 100,0 80 125650 0,844 1485 137850 0,064 1755 132700
Char of original pellets
800 0,976 8,07 1004 135100 0,978 1350 132500 0,754 3422 135800
900 0,996 100,0 191 135100 0,914 811 132500 0,346 2187 135800
950 0,959 100,0 181 135100 0,748 759 132504 0,093 1983 135800
Table 9. Parameters of the optimised approximations for the char mass-loss data of
pulverised and original pellets
The application of original work [11] with derivations of the random-pore model
considering diffusion resistances in the original pellets is problematic due to the
completely different porosity character inside the char of the pellets on different
scales. For example, to apply equation (13) used in the derivations, one has to assume

38
that porosity ε and tortuosity γ(ε) along with the diffusivity D are initially in the same
range for the entire particle. Because the pellets are created by pressed small particles,
the parameters of the pores between the particles are very different from those of the
pores inside the particles. Thus, both the effective diffusion coefficient and the
structural parameter must be considered as gaining some artificial, average or
effective values. Due to this consideration, it is reasonable to follow the
recommendation of K. Miura and others in [18] of varying the structural parameter of
the model to estimate the apparent kinetic parameters applicable for the best
approximations of the conversion rates with RPM.
(13)
This variation seems generally reasonable after the application of the standard
Arrhenius procedure to obtain kinetic parameters using temperature changes. This
result can be seen in the graphs and tables in Supplement II, which represent the
quality of the approximations of the conversion rates at different temperatures using
the same structural parameters and frequency factor for all of the temperatures. The
approximation procedure, which uses the independent variation of all three
parameters (for the grain model, the form factor is also varied) gives better
coefficients of determination.
The same procedure is applicable for the approximations calculated for mass-loss data
obtained during pyrolysis at different external temperatures (see the Supplement I).
This theory is generally correct because different heating rates during pyrolysis yield
chars with different parameters of porosity and different reactivity. The chars
39
produced at different temperatures must be characterised by different apparent kinetic
parameters.
The common property of all of the cases and obtained approximations was the same
activation energy that was obtained for each temperature. The frequency factor and
parameters linked with the nonlinear change of porosity varied noticeably. The latter
was not applicable to the analysis of experiments on gasification of char prepared in
the form of small particles of two types of charcoal. The accuracy of measurements
was not sufficient for the application of the corresponding models. However, despite
the low accuracy, it was possible to notice significant differences in the kinetics of the
char reaction with steam at the beginning and end of the process. Lower activation
energies obtained at the end of char gasification might be attributed to the
agglomeration of ash and to the increase of its catalytic activity joined with the
extensive character of the temperature difference between the sample and gasification
agent. The latter difference in temperatures caused by the faster cooling of the honey
combs compared to the char might provide a bias of the reaction rate due to the
gradient.

40
7. Conclusions
In general, the objective of this work is related to the tasks of obtaining kinetic
parameters of gasification processes for simulations and control of reactors using
high-temperature steam. The appropriate experiments were conducted, and several
models were applied to fulfil this objective in regard to the mass-loss data obtained
during the gasification of different materials under different experimental conditions.
All of the interconnected objectives were fulfilled.
It is possible to use the random-pore, grain and volumetric models to approximate the
mass loss of relatively large amounts of straw pellets (up to 78 g) in random packing,
considered as one porous particle changing its porosity during pyrolysis.
The application of these models to the chars obtained at different heating rates from
wood pellets reveal the best optimisation algorithms, taking into account the
difference of the char porosity parameters for chars obtained under different
conditions. These differences are large enough to require the variation of the
structural parameter and form factor for the random-pore and grain models and the
variation of the activation energy and frequency factor for the volumetric model to
obtain accurate approximations.
The following is a summary of the results of the conducted experiments and
approximations:
1. The application of the random-pore, grain and volumetric models to approximate
the results of gasification experiments with several types of biomass revealed that
the random-pore model exhibits the best usability and superior computational
properties [11].

41
2. The experimental setup at MSE/ITM, KTH needs to be improved for more
accurate mass-loss measurements to be applicable for the measurements of the
kinetic parameters of char gasification. The apparent kinetic parameters obtained
for charcoal of wood chips and compressed charcoal are A=25-303 s-1
and
E=101629-118756 J/mol and A=3285-26183 s-1
and E=135914-148649 J/mol,
respectively. The application of the modified isothermal method gave an average
activation energy for both types of charcoal of 152000 J/mol. The estimated error
range was ±20%.
3. The gasification of straw pellets in the same setup yielded average calorific gas of
LHV between 8 and 13 MJ/nm3.
4. There is a strong relationship between the steam temperature and conversion rate,
which is also observed for gas composition and tar reduction. The conversion of
solid fuel into gaseous and liquid products increased from 65% to almost 90%.
5. The higher steam-to-fuel ratio increases the syngas hydrogen content and the
reduction of gaseous hydrocarbons and tars, even at relatively low steam
temperatures.
6. The production of gas is 0.2 to 0.35 L/g for pyrolysis and 0.25 to 0.35 and 0.2 to
0.44 L/g for steam/fuel ratios of 1.875 and 3.2, respectively, and it increases with
increasing temperature.
7. The application of the three different models to fit the data of mass loss during
pyrolysis inside the basket with a random packing of straw pellets revealed the
significance of accounting for the resistance for heat transfer into the packing.
The apparent kinetic parameters of the process obtained with the help of the
random-pore and grain models are in the same range for the lowest steam/fuel

42
ratio (1.875): A=55-84 s-1
, E=90020-90069 J/mol. The application of the random-
pore model to fit the data of mass loss during pyrolysis with the higher steam/fuel
ratio (3.2) gave nearly the same kinetic parameters: A=30-108 s-1
, E=90021-
90024 J/mol. The same values were obtained for pyrolysis in argon. The
parameters obtained with the grain and volumetric models are higher than those
from the random-pore model. The highest values were obtained by a volumetric
model and the lowest steam/fuel ratio: A=4508-9367 s-1
, E=130000 J/mol.
8. The application of the models to the experimental data of the gasification of char
from wood pellets at the experimental setup in University of Maryland showed
the best applicability of the random-pore model. To obtain the best possible fits,
variation of the structural parameters and activation factors was necessary.
Arrhenius-based approximations with fixed parameters for the three different
temperatures yielded fits with differing qualities, which is explained by the
difference in char porosity and reactivity parameters due to the different heating
rates during pyrolysis and due to pyrolysis in an argon atmosphere at the highest
experimental temperature. The obtained activation energy for the reaction of both
the original and pulverised pellets with char is in the range of 125000 to 137000
J/mol.
43
8. Future work
The obtained apparent kinetic data for gasification simulations may be applied in
reactors using high-temperature steam as a single gasification agent. These
simulations require the development and application of the integral and multi-scale
models referenced above.

44
9. References
[1] Sylwester Kalisz, Wlodzimierz Blasiak Ponzio Anna, "High Temperature
Air/steam Gasification (HTAG)," in 6th HITACG Symposium, GWI
Essen/Germany, October 17-19, 2005.
[2] Sylwester Kalisz, Wlodzimierz Blasiak Ponzio Anna, "High Temperature
Air/steam Gasification (HTAG): Experiences from large scale continuous
experiments," in Swedish-Finnish Flame Days, Borås, Oct. 18-19, 2005.
[3] Yang Weihong, Lucas C., Blasiak W. Ponzio Anna, "Development of a
Thermal Homogenous Gasifier System using High Temperature Agent,"
CLEAN AIR - International Journal on Energy for a Clean Environment, vol. 7,
no. 4, 2007.
[4] Anna Ponzio, Carlos Lucas, Wlodzimierz Blasiak Weihong Yang,
"Performance analysis of a fixed-bed biomass gasifier using high-temperature
air," Fuel Processing Technology, vol. 87, pp. 235-245, 2006.
[5] http://www.gekgasifier.com.
[6] N.S. Nazarov, A.Yu. Alevanau L.I. Kiselev, "Water-coal gasogeneratorny gas,"
in International Conference in Honour of 50th Anniversary of Auto-Tractor
Faculty of National Technical University of Belarus, Minsk, 2006.
[7] A.Yu. Alevanau N.S. Nazarov, "Splitting of Water by Carbon of Solid Fuels,"
Vestnik BNTU, vol. 2, pp. 19-22, 2008.
[8] G.A. Simons, "Coal Pyrolysis I. Pore Evolution Theory," COMBUSTION AND
FLAME, vol. 53, pp. 83-92, 1983.
[9] G.A. Simons, "Coal Pyrolysis II. Species Transport Theory," COMBSUTION
AND FLAME, vol. 55, pp. 181-194, 1984.
[10] S.K. Bhatia and D.D. Perlummer, "A Random Pore Model for Fluid-Solid
Reactions: I. Isothermal, kinetic Control," AIChE Journal, vol. 26, no. 3, pp.
379-385, May 1980.
[11] S.K. Bhatia and D.D. Perlmutter, "A Random Pore Model for Fluid-Solid
Reactions: II. Diffusion and Transport Effects," AIChE Journal, vol. 27, no. 2,
pp. 247-254, March 1981.
[12] J. Szekely and J.W. Evans, "A Structural Model for Gas-Solid Reactions with a
Moving Boundary," Chem. Eng. Sci., vol. 25, pp. 1091-1107, 1970.
[13] J. Szekely and J.W. Evans, "A Structural Model for Gas-Solid Reactions with a
Moving Boundary: Part II. The Effect of Grain Size, Porosity and Temperature
45
on the Reaction of Porous Pellets," Chem. Eng. Sci., vol. 26, pp. 1901-1913,
1971.
[14] J.W. Evans and S. Song, "A Model for the Design of Gas-Solid Reactors,"
Metallurgical and Materials Transactions B, vol. 4, no. 7, pp. 1701-1707, 1973.
[15] Michel Pons, Jacques Villermaux Pascal Mougin, "Reaction and diffusion at an
artificial fractal interface: Evidence for a new diffusional regime," Chemical
Engineering Science, vol. 51, no. 10, pp. 2293-2302, May 1996.
[16] R. Gutfraind and S. Sheintuch, "Scaling approach to study diffusion and
reaction processes on fractal catalysts," Chem. Engng Sci, vol. 47, no. 17/18,
pp. 4425–4433, 1992.
[17] D.L. and Zaror, C.A. Pyle, "Heat transfer and kinetics in the low temperature
pyrolysis of solids," Chem. Eng. Sci., vol. 39(1), p. 147, 1984.
[18] H. Nakamura and K. Hashimoto K. Miura, "Analysis of two-step reaction
observed in air gasification of coal through a temperature-programmed reaction
technique," Energy Fuels, vol. 5, pp. 47–51, 1990.
[19] Hui Zhang, and Lili Zheng Xiaolin Wang, "Novel Modeling Tool for Fixed-
Bed Biomass Gasification Using High-Temperature Air," Ind. Eng. Chem. Res.,
vol. 46, pp. 8852-8856, 2007.
[20] Yuuko Fujii, Yoshio Morozumi, Hideyuki Aoki, Takatoshi Miura Takuya
Yamashita, "Modeling of gasification and fragmentation behavior of char
particles having complicated structures," Combustion and Flame, vol. 146, pp.
85–94, 2006.
[21] B. Arias, C. Pevida, M.G. Plaza, F. Rubiera and J.J. Pis J. Fermoso, "KINETIC
MODELS COMPARISON FOR STEAM GASIFICATION OF DIFFERENT
NATURE FUEL CHARS," Journal of Thermal Analysis and Calorimetry, vol.
28, no. 3, pp. 779–786, 2008.
[22] Q. Yu and K. Sjöström C. Brage, "Characteristics of evolution of tar from wood
pyrolysis in a fixed-bed reactor," Fuel, vol. 75, pp. 213-219, January 1996.
[23] J.F. Janssens, H.O. Desseyn R.R. Keuleers, "Comparison of some methods for
activation energy determination of thermal decomposition reaction by
thermogravimetry," Thermochemica Acta, vol. 385, pp. 127-142, 2002.
[24] Krister Sjostrom, and Emilia Bjornbom Guanxing Chen,
"Pyrolysis/Gasification of Wood in a Pressurized Fluidized Bed Reactor," Ind.
Eng. Chem. Res, vol. 31, pp. 2164-2168, 1992.
[25] Kongvui Yip, Fujun Tian, Zongli Xie and Chun-Zhu Li Hongwei Wu,
"Evolution of Char Structure during the Steam Gasification of Biochars
Produced from the Pyrolysis of Various Mallee Biomass Components," Ind.

46
Eng. Chem. Res., vol. 48, pp. 10431–10438, 2009.
[26] I. I. Ahmed and A. K. Gupta, "Kinetics of steam and carbon dioxide
gasification of woodchips char," Applied Energy, p. in press, 2009.
[27] Byung Ho Songa and Sang Done Kima, "Catalytic activity of alkali and iron
salt mixtures for steam-char gasification," Fuel, vol. 72, no. 6, pp. 797-803,
June 1993.
[28] Jun-ichiro Hayashi, Taihei Shimada, Chirag Sathe, Chun-Zhu Li, Atsushi
Tsutsumi, Tadatoshi Chiba Bazardorj Bayarsaikhan, "Kinetics of steam
gasification of nascent char from rapid pyrolysis of a Victorian brown coal,"
Fuel, pp. 1612-1621, 2005.
[29] Sagitta AB. Sagitta Web Butik. [Online]. http://sagitta.se/cgi-
bin/butik/db.pl?lang=se&sok=&id=481&kid=137&q=1&s=5&o=0&l=12&mall
=db_lista.html&template_file=db_artikel.html
[30] C. Bergins and K. Strauss T. Wild, "Physical properties of wood pellets from a
novel pelletising process," Int. J. Global Energy Issues, vol. 28, no. 2/3, pp.
225-240, 2007.
[31] Ramazan Kahraman, and Muhammad Q. Syed Mehmet A. Hastaoglu, "Pellet
Breakup Due to Pressure Generated during Wood Pyrolysis," Ind. Eng. Chem.
Res., vol. 39, pp. 3255-3263, 2000.
[32] P. Narducci, L. Tognotti E. Biagini, "Size and structural characterization of
lignin-cellulosic fuels after the rapid devolatilization," Fuel, vol. 87, pp. 177–
186, 2008.
[33] R. S. Miller and J. Bellan, "Numerical Simulation of Vortex Pyrolysis Reactors
for Condensable Tar Production from Biomass," Energy & Fuels, vol. 12, pp.
25-40, 1998.
[34] Truils Liliedahl and Krister Sjostrom, "HEAT TRANSFER CONTROLLED
PYROLYSIS KINETICS OF A BIOMASS SLAB, ROD OR SPHERE,"
Biomass and Bioenergy, vol. 15, no. 6, pp. 503-509, 1998.
[35] Jeremy Moon and Veena Sahajwalla, "Derivation of Shrinking Core Model for
Finite Cylinder," ISIJ International, vol. 41, no. 1, pp. 1-9, 2001.
[36] F.Golfier, S.Salvador, L.Van de Steene, J.L. Dirion F.Mermoud, "Experimental
and numerical study of steam gasification of a single charcoal particle,"
Combustion and Flame, vol. 145, pp. 59-79, 2006.
[37] F. Golfier et al., "Impact of peripheral fragmentation on the steam gasification
of an isolated wood charcoal particle in a diffusion-controlled regime," Fuel,
vol. 88, no. 8, pp. 1498-1503, August 2009.

47
[38] Gremyachkin V.M., "To the Interaction of Porous carbon Particle with Steam,"
in Proceeding of 29-th Meeting on Combustion, Pisa, June 2006.
[39] Fanor Mondragon, Thanh N. Truong Juan F. Espinal, "Thermodynamic
evaluation of steam gasification mechanisms of carbonaceous materials,"
Carbon, vol. 47, pp. 3010-3018, 2009.

48
List of Tables
Table 1. Summary of the conditions of the conducted experiments ............................ 14
Table 2. Charcoal-gasification kinetics data obtained by the isothermal method ....... 24
Table 3. Selected experiments in Group 1 ................................................................... 27
Table 4. Selected experiments in Group 2 ................................................................... 27
Table 5. Selected experiments in Group 4 ................................................................... 28
Table 6. Selected cases in Group 5 .............................................................................. 29
Table 7. Parameters of mass-loss approximations using the RPM, GM and volumetric
models .......................................................................................................................... 33
Table 8. Parameters of the Arrhenius approximations for char mass-loss data of
pulverised and original pellets ..................................................................................... 37
Table 9. Parameters of the optimised approximations for the char mass-loss data of
pulverised and original pellets ..................................................................................... 37
List of Figures
Figure 1. Schematics of the mini test facility at the Energy and Furnace Division of
MSE/ITM, KTH ........................................................................................................... 11
Figure 2. Experimental setup with new sample holder (flat sample parallel to the
gasification agent flow)................................................................................................ 12
Figure 3. Experimental setup with new sample holder (flat sample perpendicular to
the gasification agent flow) .......................................................................................... 12
Figure 4. Cylindrical basket with visible ash particles on the surface of the char after
gasification ................................................................................................................... 14
Figure 5. Basket made up of a rough wire mesh with contracted layer of char particles
after gasification........................................................................................................... 14
Figure 6. Basket with the finer mesh inserted into the rough mesh ............................. 15
Figure 7. Experimental setup used for gasification experiments (1-electronically
regulated gas supply; 2-hydrogen combustor; 3-first electric furnace; 4-second electric
furnace; 5-basket with biomass; 6-mechanical joint; 7-gas exhaust; 8-filter, condenser,
pump; 9-input valves; 10-intermediate volumes for gases; 11-output valves; 12-
Agilent Micro GC) ....................................................................................................... 18
Figure 8. Percentage of final mass loss of char versus initial temperature .................. 24
Figure 9. Mass loss during pyrolysis of a wooden disk ............................................... 31
Figure 10. Effect of the S/F ratio and temperature on tar evolution based on
ethane/(ethene+ethyne) content. .................................................................................. 32
Figure 11. Conversion fits for the pyrolysis of straw pellets under 767 °C ................ 34
Figure 12. Conversion fits for the pyrolysis of straw pellets under 830 °C ................ 34
Figure 13. Conversion fits for the pyrolysis of straw pellets under 913 °C ................ 35
Figure 14. Hydrogen flow rates for two types of gasified materials ........................... 36
Figure 15. Carbon-dioxide flow rates for two types of gasified materials .................. 36