Embed Size (px)
Citation preview

Study of Structural, Magnetic and Dielectric Properties
of Ferrite/Chromite Nanoparticles
By:
Muhammad Kamran
(22-FBAS/PHDPHY/S-13)
Supervisor:
Dr. Kashif Nadeem
Assistant Professor
Department of Physics, FBAS, IIUI
Co-Supervisor:
Dr. Muhammad Mumtaz Associate Professor
Department of Physics, FBAS, IIUI
Department of Physics
Faculty of Basic and Applied Sciences
International Islamic University, Islamabad
(2018)

i i
Study of Structural, Magnetic and Dielectric Properties of
Ferrite/Chromite Nanoparticles
By:
Muhammad Kamran (22-FBAS/PHDPHY/S13)
A thesis is submitted to
Department of Physics
for the award of the degree of
Doctor of Philosophy in Physics
Signature_________________________________________
Chairman, Department of Physics
International Islamic University, Islamabad
Signature__________________________________________
Dean Faculty of Basic and Applied Science
International Islamic University, Islamabad
Department of Physics
Faculty of Basic and Applied Sciences
International Islamic University, Islamabad
(2018)

ii ii
Final Approval
It is certified that the work printed in this thesis entitled “Study of Structural, Magnetic
and Dielectric Properties of Ferrite/Chromite Nanoparticles” by Muhammad
Kamran, registration No. 22-FBAS/PHDPHY/S-13 is of sufficient standard in scope and
quality for award of degree of PhD Physics from Department of Physics, International
Islamic University, Islamabad, Pakistan.
Viva Voce Committee
Dean (FBAS) ________________________________________
Chairman (Physics) ___________________________________
Supervisor ___________________________________________
Co-Supervisor ________________________________________
External Examiner 1 ___________________________________
External Examiner 2 ___________________________________
Internal Examiner _____________________________________

iii

iv
DEDICATED
To
My elder brother
Muhammad Usman

v
Declaration
It is hereby declared that the work presented in this thesis has not been copied out from any
source, neither as a whole nor a part. Furthermore, work presented in this dissertation has
not been submitted in support of any publication other than those included in this thesis,
any other degree or qualification to any other university or institute and is considerable
under the plagiarism rules of Higher Education Commission (HEC) Pakistan.
Muhammad Kamran
(22-FBAS/PHDPHY/S-13)
Date

vi
Certificate
The thesis entitled “Study of Structural, Magnetic and Dielectric Properties of
Ferrite/Chromite Nanoparticles” submitted by Muhammad Kamran in partial
fulfilment of PhD degree in Physics has been completed under my guidance and
supervision. I am satisfied with the quality of student’s research work and allow him to
submit this thesis for further process to graduate with Doctor of Philosophy degree from
Department of Physics, as per IIU rules and regulations.
Dated:_____________________
Co-Supervisor Supervisor
Dr. Muhammad Mumtaz Dr. Kashif Nadeem
Associate Professor (TTS) Assistant Professor (TTS)
Department of Physics, Department of Physics,
International Islamic University, International Islamic University,
Islamabad. Islamabad.
.

vii
ACKNOWLEDGMENTS
First, I owe my deepest gratitude to Almighty Allah for all of his countless
blessings. I offer my humblest words of thanks to his most noble messenger Hazrat
Muhammad (P.B.U.H), who is forever, a torch of guidance and knowledge for all
humanity. By virtue of his blessings today I am able to carry out our research work and
present it.
I would like to acknowledge the worth mentioning supervision of Dr. Kashif
Nadeem and co-supervision of Dr. Muhammad Mumtaz who guided me and supported
me during my whole research work. Frankly speaking without effort of Dr. Kashif
Nadeem, it was impossible to complete this hard task of my life. Almighty Allah blessed
him in every part of life. Moreover, I would like to express my sincere thanks to all the
faculty members of Department of Physics IIU Islamabad especially to Dr. Mushtaq
Ahmed (Chairman, Physics). I express my thanks to all staff of Physics Department, IIUI,
for their various services. It is a matter of great pleasure and honor to express my gratitude
to Prof. Dr. Heinz Krenn, Prof. Xianggang Qiu, Dr. Dorothee-Vinga Szabó, Dr.
Iftikhar Gul for valuable discussion and measurements. I shall express my heartiest thanks
to all my research colleagues Faisal Zeb, Asmat Ullah, Yasir Mehmood and Aaqib
Javed for being very supportive and co-operative all throughout my research work.
I would like to acknowledge the efforts of my sweet wife Irram Kamran, without
her support and everlasting love; I would not have been the person I am. My dana always
motivates and supports me during my whole study. I especially want to acknowledge my
brothers, sisters and bhabhies for their indescribable encouragement during my whole
studies especially to my younger brother Muhammad Furqan for his financial support. I
would like to thank my nephew Muhammad Talha Qamar for his moral sport. Finally, I
am thankful to my parents for their love, care and support in my life, which has been
directly encouraging me for my study. My parents’ prayers have always been a big support
in solving my problems.
Muhammad Kamran

viii
CONTENTS
1 Chapter 1: Introduction……...……………………………….…………..…..……...1
1.1 Nanoparticles...……………………………….....………………………………...1
1.2 Magnetism ………………………………………………....……………………...1
1.3 Classifications of magnetism……………………………………………..……….2
1.3.1 Diamagnetism………….………………………..…………………….......2
1.3.2 Paramagnetism…………………………………………………………….2
1.3.3 Ferromagnetism…………………………………………………...............3
1.3.4 Antiferromagnetism……………………………………………………….3
1.3.5 Ferrimagnetism…………………………………………………………....3
1.4 Anisotropy………………………………………..………………………………..4
1.4.1 Magneto crystalline anisotropy………….…………………………...........4
1.4.2 Magneto static anisotropy……………………………………...………….4
1.4.3 Surface anisotropy…………………………………………………………5
1.4.4 Exchange and dipolar anisotropy………………………………………….5
1.5 Spin glass-state…………………………………………………..………………...6
1.5.1 Super spin-glass state……………………………………………...............6
1.5.2 Surface spin-glass state……………………………………………………6
1.6 Dielectrics…………………………………………………………………………7
1.6.1 Polarization mechanism……………………………………………..…….7
1.6.2 Electronics polarization……………………………………………………8
1.6.3 Ionic polarization…………………………………………………………..8
1.6.4 Dipolar polarization………………………………………………………..8
1.6.5 Interfacial polarization…………………………………………………….9
1.7 Spinel crystal structure..……………………………………………..…………….9
1.7.1 Normal spinel…………………………………………………………….11
1.7.2 Inverse spinel……………………………………………………………..11
1.7.3 Mixed spinel……………………………………………………………...11
1.8 Spinel chromites..………………………………………………………………...11
1.9 Cobalt chromite………………………………………………………………….12

ix
1.10 Spinel ferrites…………………………………………………………………...13
1.11 Maghemite……………………………………………………………………...14
1.12 Nickel ferrite……………………………………………………………………15
1.13 Statement of problem…………………………………………………………...15
1.14 Aim and objectives……………………………………………………………...17
2 Chapter 2: Literature Review of Chromite and Ferrite Nanoparticles……...….18
3 Chapter 3: Characterization and Synthesis Techniques…………...…………….23
3.1 Characterization techniques……………………………………………………...23
3.2 X-ray diffraction…………………………….………………………....…………23
3.3 Fourier transform infrared spectroscopy………………………………………... 25
3.4 Superconducting quantum interference device……………………..…................26
3.5 Transmission electronic microscopy……………………………………………..28
3.6 LRC meter ..……………………………………………………………………..29
3.7 Synthesis of nanoparticles………………………………………………………..31
3.7.1 Top down approach………………………………………………………31
3.7.2 Bottom up approach……………………………………………………...31
3.8 Synthesis of chromite and ferrite nanoparticles………………………………….32
3.8.1 Sol-gel method…………………………………………………………...32
3.8.2 Microwave plasma synthesis……………………………………………..35
4 Chapter 4: Structural, Dielectric and Magnetic Properties of Chromite
Nanoparticles………………………………………………………………………..37
4.1 Introduction……………………………………………………………………..37
4.2 Results and discussion of low temperature magnetic response of CoCr2O4
nanoparticles……………………………………………………………………40
4.2.1 X-Ray diffraction ………………………………………………………..40
4.2.2 Transmission electron microscopy ……….……………………………...41
4.2.3 Fourier transform infrared spectroscopy …..……………………………..42
4.2.4 Magnetic properties…………………......………………………………..43
4.3 Results and discussion of effect of Mg doping on structural, magnetic and
dielectric properties of CoCr2O4………………………………………………..49
x
4.3.1. X-Ray diffraction …… ……………………………….…………………49
4.3.2. Transmission electron microscopy …………...………………………….51
4.3.3. Raman spectroscopy……………………………………………………...53
4.3.4. Fourier transform infrared spectroscopy ……………………....…………55
4.3.5. Magnetic properties……………………...……………………………….57
4.3.6. Dielectric properties…...………………………………………………....60
4.4 Results and discussion of effect of SiO2 coating on structural and magnetic
properties of CoCr2O4 nanoparticles…………………………………………....65
4.4.1 X-Ray diffraction ………………………………………..……………….65
4.4.2 Transmission electron microscopy …………...………………………….67
4.4.3 Magnetic measurements………………...………………………………..68
4.5 Conclusion……………………………………………………………………...74
5 Chapter 5: Structural, Dielectric and Magnetic Properties of Ferrite
Nanoparticles……………………………………………………………………….75
5.1 Introduction………………………………………………………………………75
5.2 Results and discussion of effect of surface spins on magnetization of Cr2O3 coated
γ-Fe2O3 nanoparticles………………………………………………………………...77
5.2.1 X-Ray diffraction…………………………………………..…………….77
5.2.2 Transmission Electron Microscopy……………………....………………78
5.2.3 Magnetic properties………………………………………………………79
5.3 Results and discussion of study of Cr doping on structural, dielectric and magnetic
properties NiFe2O4 nanoparticles…………………………………………………….88
5.3.1 X-Ray diffraction…………………………………………..…………….88
5.3.2 Transmission Electron Microscopy……………………....………………90
5.3.3 Magnetic properties………………………………………………………91
5.3.4 Dielectric properties………………...……………………………………93
5.4 Conclusion………………………………………………………………………..98
6 General conclusion..………………………………..……….……............................99
References…………………………………………………………………….………..102

xi
List of Figures
Fig. 1.1: Super spin glass. ...................................................................................................6
Fig. 1.2: Surface spin glass. ................................................................................................7
Fig. 1.3: Schematic diagram of electronic, ionic, dipolar and interfacial polarization. .....9
Fig. 1.4: Schematic diagram of tetrahedral site ................................................................10
Fig. 1.5: Schematic diagram of octahedral site ................................................................10
Fig. 1.6: Crystal structure of CoCr2O4 ..............................................................................13
Fig. 1.7: Crystal structure of maghemite ..........................................................................14
Fig. 1.8: Crystal structure of NiFe2O4 ..............................................................................15
Fig. 3.1: Bragg’s law representation .................................................................................24
Fig. 3.2: Experimental arrangement of Michelson interferometer ...................................26
Fig. 3.3: Superconducting coil in the SQUID magnetometer ..........................................27
Fig. 3.4: SQUID-magnetometer facility at the Institute of Physics, Karl-Franzens
University, Graz, Austria ..................................................................................................28
Fig. 3.5: Working principle of TEM ................................................................................29
Fig. 3.6: Working principle of LRC meter .......................................................................30
Fig. 3.7: Flow chart for synthesis process of ferrite and chromite nanoparticles .............33
Fig. 3.8: Schematic diagram of microwave plasma synthesis ..........................................36
Fig. 4.1: XRD pattern of CoCr2O4 nanoparticles .............................................................40
Fig. 4.2: TEM image of CoCr2O4 nanoparticles at 100 nm scale .....................................41
Fig. 4.3: FTIR spectrum of CoCr2O4 nanoparticles .........................................................42
Fig. 4.4: ZFC/FC curves of CoCr2O4 nanoparticles at 50, 500, and 1000 Oe ..................44
Fig. 4.5: (a) M-H loops at 5, 25, 50, 75, and 100 K, (b) Variation of MS with temperature
(solid line just showed the trend) and (c) Variation of HC with temperature (black solid
line) of CoCr2O4 nanoparticles fitted with modified Kneller’s law (dashed red line). ......47

xii
Fig. 4.6: (a) Zero field cooled (FC) relaxation curve of CoCr2O4 nanoparticles under field
H = 100 Oe at temperature T = 5 K, orange solid line shows the best fit of stretched
exponential law, (b) Field cooled (FC) relaxation curve of CoCr2O4 nanoparticles under
field H = 100 Oe at temperature T = 5 K, red solid line shows the best fit of stretched
exponential law. ................................................................................................................49
Fig. 4.7: (a-g) Rietveld refinement fitting results of the XRD of Co1-xMgxCr2O4
nanoparticles at 300 K, showing the observed pattern (diamonds in red colour), reflection
markers (vertical bars), the best fit Rietveld profiles (black solid line) and difference plot
(blue solid line at the bottom), (h) the variation of lattice constant and (i) average crystallite
size plotted as a function of Mg concentration (x). ...........................................................51
Fig. 4.8: TEM images at (a) 110 nm and (b) 70 nm scales for Co0.2Mg0.8Cr2O4
nanoparticles .....................................................................................................................52
Fig. 4.9: Raman spectra of Co1-xMgxCr2O4 nanoparticles. ................................................54
Fig. 4.10: Fourier transform infrared spectroscopy of Co1-xMgxCr2O4 nanoparticles. ......56
Fig. 4.11: (a-e) ZFC/FC curves of Co1-xMgxCr2O4 nanoparticles under field H = 50 Oe 58
Fig. 4.12: (a-d) FC curves of Co1-xMgxCr2O4 nanoparticles with applied field 5 T ........59
Fig. 4.13: Variation in dielectric constants; (a) real and (b) imaginary part with frequency
for Co1-xMgxCr2O4 nanoparticles ......................................................................................62
Fig. 4.14: (a) Tangent loss and (b) ac conductivity of Co1-xMgxCr2O4 nanoparticles .....64
Fig. 4.15: (a) XRD patterns of CoCr2O4/(SiO2)y nanoparticles, (b) variation of average
crystallite size and (c) lattice parameter with SiO2 concentration. Dashed lines just show
the trends. ...........................................................................................................................67
Fig. 4.16: TEM image of CoCr2O4/(SiO2)y, y = 0 % nanoparticles at 50 nm scale .......68
Fig. 4.17: (a) ZFC and FC of CoCr2O4/(SiO2)y nanoparticles (b) variation in TF, TS and TC
value with SiO2 concentration. Dashed lines just show the trends. ...................................70
Fig. 4.18: (a) M-H loops of CoCr2O4/(SiO2)y nanoparticles at T = 25 K and (b) variation
of MS and HC with SiO2 concentration. Dashed lines just show the trends. ......................72
Fig. 4.19: ZFC AC susceptibility (in-phase part) of CoCr2O4/(SiO2) nanoparticles. ........73

xiii
Fig. 5.1: X-ray diffraction patterns for Cr2O3 coated γ-Fe2O3 nanoparticles.....................77
Fig. 5.2: (a) TEM image at 10 nm scale (b) STEM-image at 50 nm scale (inset shows the
results of red marked area by STEM-EELS) of Cr2O3 coated γ-Fe2O3 nanoparticles and (c)
STEM-EELS spectra of γ-Fe2O3 core (red color)-Cr2O3 shell (green color) nanoparticles.
............................................................................................................................................79
Fig. 5.3: ZFC/FC experimental (blue solid triangles) and simulated (red open squares) dc
susceptibility curves of Cr2O3 coated γ-Fe2O3 nanoparticles under 50 Oe .......................81
Fig.5.4: (a) M-H loop at 5 K, (b) MS at different temperatures (Bloch’s law fitting is in
form of red dashed line) and (c) HC at different temperatures (Kneller’s law fitting is in
form of red dashed line) for Cr2O3 coated maghemite nanoparticles. ..............................85
Fig. 5.5: (a) In-phase ac susceptibility of Cr2O3 coated γ-Fe2O3 nanoparticles. The f-
dependent TB is fitted with (b) Arrhenius law (c) Vogel-Fulcher law and (d) dynamic
scaling law. .......................................................................................................................88
Fig 5.6: (a) XRD patterns and (b) lattice constant and average crystallite size of NiCrxFe2-
xO4 nanoparticles ...............................................................................................................89
Fig. 5.7: TEM images of NiCr2O4 nanoparticles at (a) 20 nm and (b)100 nm scale .......91
Fig. 5.8: (a) M-H loops at T = 5 K, (b) MS variation and (c) HC variation for NiCrxFe2-xO4
nanoparticles with Cr concentration (x). solid lines just reveal the trend. .........................93
Fig. 5.9: (a) Real and (b) Imaginary part of NiCrxFe2-xO4 nanoparticles. ........................95
Fig. 5.10: Tangent loss of NiCr2Fe2-xO4 nanoparticles. ....................................................96
Fig. 5.11: AC conductivity of NiCrxFe2-xO4 nanoparticles. ..............................................97

xiv
List of Tables
Table 4.1: Vibrational bands in Raman spectra of Co1-xMgxCr2O4 nanoparticles. ..........55
Table 4.1: Vibrational bands in infrared spectra of Co1-xMgxCr2O4 nanoparticles. .........56

xv
List of Publications
[1]. “Structural, magnetic, and dielectric properties of multiferroic Co1-xMgxCr2O4
nanoparticles”
M. Kamran, A. Ullah, S. Rahman, A. Tahir, K. Nadeem, M. Anis ur Rehman, and S. Hussain
Journal of Magnetism and Magnetic Materials 433, 178-186 (2017). Impact Factor: 2.630
[2]. “Negative and anomalous T-dependent magnetization trend in CoCr2O4 nanoparticles”
M. Kamran, K. Nadeem and M. Mumtaz
Solid State Sciences 72, 21-27 (2017). Impact Factor: 1.811
[3]. “Role of SiO2 coating in multiferroic CoCr2O4 nanoparticles”
M. Kamran, Asmat Ullah, Y. Mehmood, K. Nadeem, and H. Krenn
AIP Advances 7, 025011 (2017). Impact Factor: 1.568
[4]. “Role of surface spins on magnetization of Cr2O3 coated γ-Fe2O3 nanoparticles”
K. Nadeem, M. Kamran, A. Javed, F. Zeb, S.S. Hussain, H. Krenn, D. V. Szabo, and U. Brossmann
Solid State Sciences 83, 43-48 (2018). Impact Factor: 1.811
[5]. “Surface spins disorder in uncoated and SiO2 coated maghemite nanoparticles”
F. Zeb, K. Nadeem, S. K. A. Shah, M. Kamran, I. H. Gul, and L. Ali
Journal of Magnetism and Magnetic Materials 429, 270-275 (2017). Impact Factor: 2.630
[6]. “Effect of air annealing on structural and magnetic properties of Ni/NiO nanoparticles”
K. Nadeem, Asmat Ullah, M. Mushtaq, M. Kamran, S.S. Hussain, and M. Mumtaz
Journal of Magnetism and Magnetic Materials 417 (2016) 6-10. Impact Factor: 2.630
[7]. “Surface spin-glass in cobalt ferrite nanoparticles dispersed in silica matrix”
F. Zeb, W. Sarwer, K. Nadeem, M. Kamran, M. Mumtaz, H. Krenn, and I. Letofsky-Papst
Journal of Magnetism and Magnetic Materials 407 (2016) 241–246. Impact Factor: 2.630
[8]. “Dielectric properties of (CuO, CaO2, and BaO)y/CuTl-1223 composites”
M. Mumtaz, M. Kamran, K. Nadeem, Abdul Jabbar, Nawazish A. Khan, Abida Saleem, S. Tajammul
Hussain, and M. Kamran
Low Temperature Physics, 39, 622-629 (2013). Impact Factor = 0.881

xvi
Abstract
This thesis is schematically based on synthesis and characterization of cobalt
chromite (CoCr2O4), maghemite (γ-Fe2O3) and nickel ferrite (NiFe2O4) nanoparticles, as
well as selective coating and doping in host compounds in order to tune its structural,
dielectric and magnetic properties. CoCr2O4 and NiFe2O4 nanoparticles were synthesized
by sol-gel method, while γ-Fe2O3 nanoparticles were synthesised by microwave plasma
technique. For chromite nanoparticles, the low temperature magnetic response of CoCr2O4
nanoparticles, magnetic and dielectric properties of Mg doped CoCr2O4 nanoparticles and
magnetic properties of SiO2 coated CoCr2O4 nanoparticles have been studied in detail. X-
ray diffraction revealed the cubic spinel structure of the nanoparticles. Zero field cooled
and field cooled (ZFC/FC) curves revealed a paramagnetic (PM) to ferromagnetic (FiM)
transition at TC = 97-100 K with conical spiral state at TS = 27 K and lock-in state at TL =
13 K. Negative magnetization is observed in the ZFC curve under 50 Oe applied field,
which gets suppressed upon the application of higher field due to reorientation of the
nanoparticles magnetization in the direction of applied field. The TC was shifted towards
higher temperature with the application of higher field, while TS and TL remain unaffected
which was attributed to strong B-B interactions which act as a frozen spins or canted spins
at surface. M-H loops showed an abnormal decrease in MS which may be due to presence
of stiffed/strong conical spin spiral and lock in states at low temperatures. Modified
Kneller’s law showed a good fit for temperature dependent HC at higher temperature and
deviated at low temperature (< 25 K) which was attributed to frozen disordered surface
spins. Nanoparticles showed slow spin relaxation in both ZFC and FC protocols at 5 K,
which signifies the presence of spin-glass like behavior at low temperatures. Mg doped
CoCr2O4 nanoparticles showed non-monotonous trend in the average crystallite size and
showed a peak behaviour with maxima at x = 0.6. The members CoCr2O4 (x = 0) and
MgCr2O4 (x = 1) are FiM and antiferromagnetic (AFM), respectively. TC and TS showed
decreasing trend with increasing x, followed by an additional AFM transition at TN = 15 K
for x = 0.6. The system finally stabilized and changed to highly frustrated AFM structure
at x = 1 due to formation of pure MgCr2O4. Dielectric parameters showed a non-
monotonous behaviour with Mg concentration and were explained with the help of
Maxwell-Wagner model and Koop’s theory. Dielectric properties were improved for
xvii
nanoparticles with x = 0.6 and is attributed to their larger average crystallite size. SiO2
coated CoCr2O4 nanoparticles showed decreasing trend of the average crystallite size and
cell parameter with increasing SiO2 concentration. The decrease in average crystallite size
is due to SiO2 coating which limits the growth of nanoparticles by generating more
nucleation sites. All the magnetic transitions of CoCr2O4 nanoparticles shifted towards low
temperatures which is due to decrease in average crystallite size. SiO2 concentration also
decreased saturation magnetization (MS), which was enhanced surface disorder in smaller
nanoparticles.
In study of structural, magnetic and dielectric properties of ferrite nanoparticles,
chromium oxide (Cr2O3) coated γ-Fe2O3 nanoparticles and NiCrxFe2-xO4 ferrite
nanoparticles have been studied in detail. Simulated ZFC/FC curves exhibited large value
of effective anisotropy of Cr2O3 coated γ-Fe2O3 nanoparticles as compared to bulk γ-Fe2O3
but less than bare γ-Fe2O3 nanoparticles which is may be due to weak interface anisotropy
between ferrimagnetic γ-Fe2O3 core and antiferromagnetic Cr2O3 shell. Bloch’s law was
fitted on T-dependent MS data and revealed the higher value of Bloch’s constant and lower
value of Bloch’s exponent as compared to bulk γ-Fe2O3. Spin glass behaviour was
investigated by using different physical laws for f-dependent ac susceptibility and they
confirmed the presence of spin glass behaviour which is due to disordered frozen surface
spins. XRD analysis of Cr doping at B site in NiFe2O4 nanoparticles confirmed the cubic
spinel structure for all samples with x = 0, 0.2, 0.4, 0.8, 2.0 concentration. Saturation
magnetization depicts decreasing trend with addition of Cr3+ concentration which is
attributed to replacement of large magnetic moment of Fe3+ by smaller magnetic moment
of Cr3+. HC reveals minimum value for NiFe2O4 nanoparticles and showed increasing trend
with addition of Cr3+. This increase in HC may be attributed to change in magneto
crystalline anisotropy. Dielectric constant showed increasing trend with the Cr+3
concentration due to less conductive nature of Cr as compared to Fe. In summary, a detail
study of structural, dielectric and magnetic properties of chromite and ferrite nanoparticles
have explored with tremendous results that will open a new insight in device applications
such as automatic switching, magnetic memory and targeted nanotherapeutic.
Chapter No.1 Introduction
1
Chapter No. 1
Introduction
1.1 Nanoparticles
Nano is a Greek word which means very small. A nanoparticle is a quasi-zero-
dimensional nano-object in which all dimensions are of the same order of magnitude (not
more than 100 nm). The nanoparticles behave differently to their bulk counterpart due to
increase of surface-to-volume ratio and occurrence of quantum mechanical effects at
nanoscale [1]. For example, the gold is very stable in the bulk state while it is reactive at
nanoscale. In bulk materials, the energy band gap is continuous while it is discrete at
nanoscle. Electrical conductivity in the bulk material is also continuous and in
nanoparticles, charge transfers through tunnelling process. Nanoparticles have amazing
and useful properties with many structural and non-structural applications. For example,
Carbon nanoparticles add strength, flexibility, heat protection to metals, ceramics and
plastics [2]. There are different applications of nanoparticles which are used in various
fields of life such as aerospace, automotive, consumers, environmental to control pollution,
industrial coating, power transformers, solar panels, microbial fuel cells, and information
storage devices [3].
1.2 Magnetism
Repulsion and attraction force of magnetic material by prearrangement of atoms is
called magnetism. The magnetism phenomenon is closely related to response of material
with application of applied external field. The magnetism of material is due to spin and
orbital motion of electrons within atoms of materials. Magnetization can be defined as
‘‘orientation of magnetic dipole moments along or versus the direction of applied external
field’’. Mathematically magnetization can be written as [4]
M =𝜇𝑡𝑜𝑡𝑎𝑙
V (1.1)

Chapter No.1 Introduction
2
Where, µtotal, V and M represent total magnetic dipole moments, volume and magnetization
of material, respectively.
1.3 Classifications of Magnetism
Classifications of magnetism in different materials are:
• Diamagnetism
• Paramagnetism
• Ferromagnetism
• Antiferromagnetism
• Ferrimagnetism
1.3.1 Diamagnetism
Diamagnetism is present in materials which have completely filled shells having no
unpaired electron. It is present in all materials but very weak. These materials usually
induce the magnetization due to flux change in the current loops in presence of external
magnetic field. Lens’s law uses to describe the induced magnetization which explains that
magnetic moments oppose the applied magnetic field which reduces the magnetic flux
density. Diamagnetic material can be described by negative magnetic susceptibility due to
the opposite direction of magnetization as compared to applied field. No permanent
magnetic dipole moments are present in the diamagnetic materials. The induced magnetic
moments disappear upon the removal of applied field. The examples of the diamagnetic
materials are: Nitrogen, Helium, Neon, Sulphur, Hydrogen etc. [5].
1.3.2 Paramagnetism
The paramagnetism arises due to the spinning of unpaired electrons. Atomic
moments are random in alignment in paramagnetic materials and these materials show zero
net magnetization [6]. In presence of magnetic field, magnetic moments of these materials
get align along field direction and exhibit net magnetization. When the applied field is
removed, the magnetic moments again randomly distributed and net magnetization
becomes vanishes. Paramagnetic materials have permanent magnetic dipole moment and

Chapter No.1 Introduction
3
exhibit magnetic susceptibility greater than zero. The paramagnetic materials are alkali,
alkaline earth metals, potassium, platinum, manganese etc.
1.3.3 Ferromagnetism
In the term of domains having spontaneous magnetization is responsible for
ferromagnetism. In the ferromagnetic material, each domain has about 1015 or 1016 of atoms
and magnetic moments are align parallel with each other. Ferromagnetism produces due to
the spinning of unpaired electron even without existence of applied field. Quantum
mechanically, the magnetic dipole moments have strong coupling force and overlapping of
wave functions of electrons in ferromagnetic materials create an exchange interaction
called direct exchange. The adjustment between the domain is about 100 atoms in the
transition region are called domain walls. The direction of domain is randomly oriented in
the absence of applied magnetic field and aligned themselves within the wall of the
magnetic domain when we applied the external magnetic field [7]. In domains spontaneous
magnetization maintain at certain temperature and after that temperature ferromagnetic
transferred to paramagnetic materials is called Curie temperature. The iron and nickel have
Curie temperature 770 and 1135 0C respectively.
1.3.4 Anti-ferromagnetism
The material in which magnetic moments are equal in magnitude and opposite
aligned without applied field which results zero magnetization called antiferromagnetic
materials. In these materials, two sub lattices occurred with oppositely aligned magnetic
moments. At specific temperature, these materials turn into paramagnetic material is
known as “Neel temperature”. Magnetic susceptibility of anti-ferromagnetic materials
increases inversely with temperature above Neel temperature and decreases inversely
below this temperature [8].
1.3.5 Ferrimagnetism
Ferrimagnetic materials reveal almost same behaviour as a ferromagnetic material.
In ferrimagnetism, magnetic moments are oppositely aligned with unequal magnitude and
partially cancelled magnetic moment results in a net magnetization. In these magnetic

Chapter No.1 Introduction
4
materials, two sublattices A and B with unequal and opposite spins occur and are
responsible for net magnetization. These materials also contain spontaneous magnetization
due to unequal and opposite spins at two sub lattices. The magnetic moments in a
ferrimagnetic material modify their orientation in direction of applied field and increase
the net magnetization. Usually, this type of magnetization occurs in ionic compounds [9,
10].
1.4 Anisotropy
The direction of single crystal indicates the difference between its physical and
mechanical properties. A material is said to be anisotropic if its properties changes at
different crystallographic orientations. Magnetic anisotropy determines specific spatial
directions in which magnetization of the sample is different. Therefore, magnetic
anisotropy is an important ingredient to keep the magnetization vector in a preferred
direction. There are easy and hard axes to magnetize the magnetic material. Different types
of magnetic anisotropy are given as:
1.4.1 Magneto crystalline anisotropy
It is also known as crystal anisotropy and intrinsic property of magnetic material.
Its origin lies in spin-orbit coupling. In this anisotropy, the magnetization is coupled to
certain crystallographic directions. This anisotropy affects very effectively on magnetic
properties of materials, such as the magnitude of coercive force, the shape of hysteresis
loops, the domain structure, magnetization processes and permeability [11].
1.4.2 Magneto static anisotropy
This anisotropy is due to inside magnetic field of the system. It arises from the
magnetic poles which are present on the surface of magnetized material. This magnetic
field is also called demagnetizing field. Magneto static anisotropy strongly depends on the
shape of particle. For example, a non-spherical shape particle with finite magnetization has
large magneto static energy for orientation of the magnetic moments as compared to
spherical. Thus, the shape has strongly impact for determining the magnitude of magneto
static energy as a function of magnetization orientation. Therefore, magneto static

Chapter No.1 Introduction
5
anisotropy is also named shape anisotropy [12]. In bulk systems, the magneto crystalline
anisotropy is important while at nanoscale shape and surface anisotropy pay an additional
contribution very well in the magnetic properties.
1.4.3 Surface anisotropy
The surface of nanoparticles is very important in determining magnetic properties
due to a possible change of state and disorder of surface spins. The surface atoms have
broken symmetry which is responsible for surface anisotropy. The magnitude of this
anisotropy increases with the decrease of particle size. This effect is attributed to large
surface to volume ratio of nanoparticles [11]. The surface of a nanoparticle contains atoms
with bond deficiencies creating frustration and disorder on the surface. This frustration and
disorder on the surface of nanoparticles causes a disorientation of magnetization vectors
for surface spins unlike those in the core. Neel has shown that the surface contribution
becomes relevant only for particle smaller than ~ 10 nm. If the surface anisotropy is
different from the core anisotropy, then the core spin vector prefers a different
magnetization direction with respect to the surface spins.
1.4.4 Exchange and dipolar anisotropy
Two magnetic particles in a close proximity have a magnetic interaction. The
orientation for relative two interacting magnetic moments gives information about the easy
direction. When the magnetic spins come very close to each other, their wave functions
overlap and the dominant interactions are direct exchange interactions. If the magnetic
moments are coupled via electron hopping across an intermediate oxygen ion, exchange
interactions are super exchange interactions. Exchange interactions are of short range and
much stronger than dipolar interactions. Dipolar interactions are weak and long range.
These interactions lead to an additional anisotropy energy. In most cases, it is assumed that
the sum of all contributions to the magnetic anisotropy energy results in an effective
uniaxial anisotropy [13].
Chapter No.1 Introduction
6
1.5 Spin Glass-State
Surface functionalization tuning is very significant in nanoparticles which can alter
their physical properties. In term of magnetic nanoparticle, surface spins become very
significant in controlling magnetism of individual nanoparticle [14]. Spin-glass state was
first determined by V. Cannela and J. A. Mydosht in 1970, while observing AC-
susceptibility of gold iron alloy [15]. Magnetic frustration and disorder are the main causes
for spin glass state. [16]. In spin-glass system, there is a distribution and randomness of the
exchange constant. Distribution of exchange constants and competing interactions among
spins cause disorder and frustration in the system. There are two types for spin glass states
in case of nanoparticles as given below.
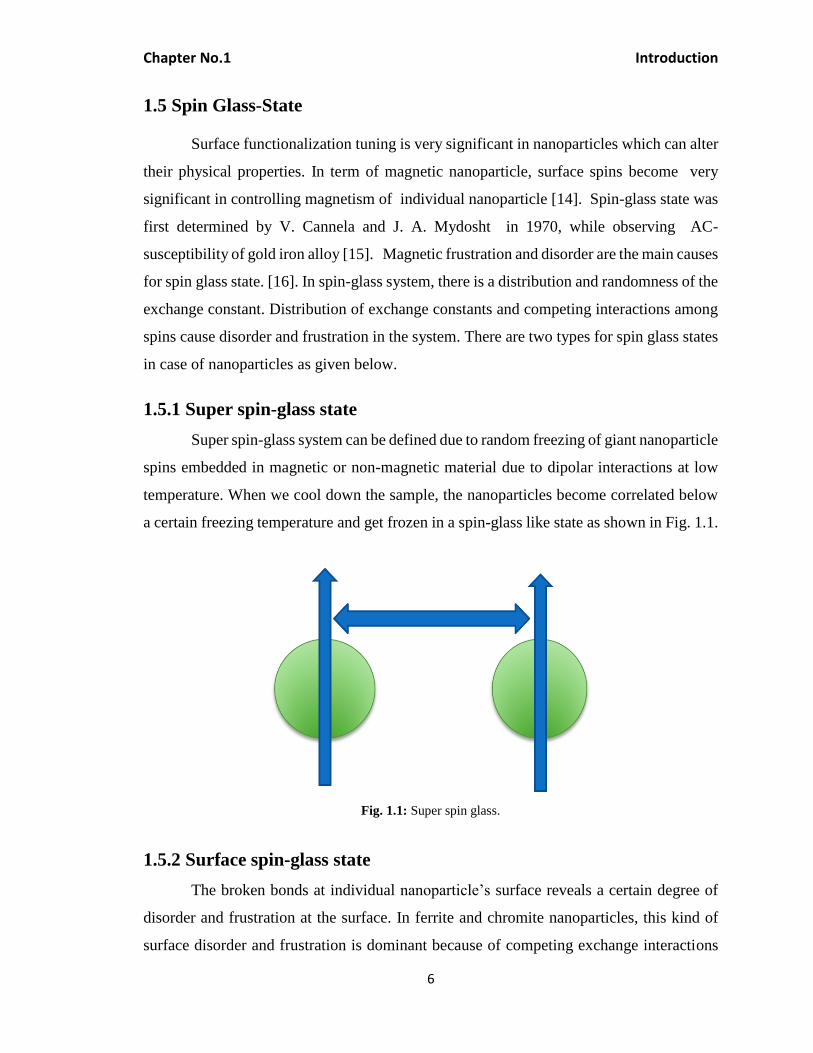
1.5.1 Super spin-glass state
Super spin-glass system can be defined due to random freezing of giant nanoparticle
spins embedded in magnetic or non-magnetic material due to dipolar interactions at low
temperature. When we cool down the sample, the nanoparticles become correlated below
a certain freezing temperature and get frozen in a spin-glass like state as shown in Fig. 1.1.
Fig. 1.1: Super spin glass.
1.5.2 Surface spin-glass state
The broken bonds at individual nanoparticle’s surface reveals a certain degree of
disorder and frustration at the surface. In ferrite and chromite nanoparticles, this kind of
surface disorder and frustration is dominant because of competing exchange interactions

Chapter No.1 Introduction
7
among coupled spins on the nanoparticle’s surface. It is called surface spin glass state or
surface spin glass system as shown in Fig. 1.2.
Fig. 1.2: Surface spin glass.
1.6 Dielectrics
Generally dielectric is a non-conducting or insulating material. The dielectric
phenomenon arises due to electric force which occurs due to the attraction and repulsion
of the electric charges. If the strength of the dielectric material is higher than it is important
for different applications such as in parallel plate capacitor. These dielectrics become
polarized in presence of applied electric field. These materials are widely used in electrical
circuits due to high resistance. The ferrite and chromite compounds have very large
resistance and behave just like as an insulator. Due to this proper, ferrite and chromite
compounds are very useful for electrical circuits [17].
1.6.1 Polarization mechanism
The dielectric materials redistribute charges with application of applied electric
field. As a result, dipoles formation occurs. Consider a dipole having dipole moment “µ”
which is given as
Surface spins
Ferrimagnetic core

Chapter No.1 Introduction
8
qd (1.2)
Where “q” is the magnitude of the charge and “d” be the separation between the
charges. When the electric field is applied on materials, they polarized due to alignment of
an induced and the permanent dipoles along with applied field. Then the polarization will
become
P Nqd (1.3)
Where “N” represents number of dipoles. In dielectric materials four types of polarizations
occur. The essential requirements of all these polarization mechanisms are the time i.e. the
time variation of the electric field. There are four types of polarization [18].
1.6.2 Electronic polarization
In electronic polarization, the electron displaces relative to nucleus when material
is inserted in an applied electric field. In this polarization the atoms behave as a
momentarily induced dipole. It is the important phenomenon for the pure materials because
in the pure material there will be no formation of the covalent bonds.
1.6.3 Ionic polarization
When an ionic material is inserted in an applied electric field then ionic polarization
will occur. These bonds are elastically deformed. This type of polarization occurs mainly
in the ceramic materials. The cation and the anions are moving either closer together or
move apart from each other with the applied field direction. This mechanism contains
usually very small dipole moment. NaCl and KCl are best examples of ionic polarization.
1.6.4 Dipolar polarization
This polarization occurs in those materials which have permanent dipoles. These
dipoles are in random direction and give net polarization zero in absence of applied field.
When we apply electric field, the electric dipoles arrange themselves in field direction and
result a polarization. The example of dipolar polarization is water.

Chapter No.1 Introduction
9
1.6.5 Interfacial polarization
There will be impurities occurs in the crystal structure. Due to the impurities the
charge will be developed at the interfaces of the material. The charges move on the surface
of the material by placing it an external magnetic field. This type of polarization usually
occurs in ferrites, chromites and semiconductors.
The total polarization of materials is sum of these four polarizations. The schematic
diagram of these four types of polarization is given in Fig. 1.3.
Fig. 1.3: Schematic diagram of electronic, ionic, dipolar and interfacial polarization [18].
1.7 Spinel crystal structure
Spinel crystal structure is the most diverse, useful and common type of cubic system
with space group Fd3m. Spinel compounds generally follow AB2O4 formula. In this
formula, A is a metallic divalent ion i.e. Ni2+, Fe2+, Mg2+ and Co2+etc and B is trivalent ion
i.e. Fe3+, Cr3+ and Al3+ etc. These compounds have FCC structure and 32 ions of oxygen
forming close packed structure unit cell. There are two lattice sites in these compounds:

Chapter No.1 Introduction
10
• Tetrahedral lattice sites
• Octahedral lattice sites.
Tetrahedral lattice site contains of five atoms, with four oxygen atoms and one metal ion.
Three atoms of oxygen are joined with each other in same line while forth atoms are on top
of symmetric position of metal ion. A whole unit cell of these compounds consists of 64
sites, where 8 sites are occupied only. The tetrahedral lattice site of face centered cubic,
hexagonal closed packed and body centered cubic is shown in Fig. 1.4 in which oxygen
ions are presented by purple colour and metal ions are presented by green colour.
Fig. 1.4: Schematic diagram of tetrahedral site [19].
Octahedral lattice site contains of seven atoms, with six oxygen atoms and one metal ion.
Four atoms of oxygen are joined with each other in same line while two atoms are on top
and bottom of symmetric position of metal ion. A whole unit cell of these compounds
consists of 32 sites, where 16 sites are occupied only. The octahedral lattice site of face
centered cubic, hexagonal closed packed and body centered cubic is shown in Fig. 1.5 in
which oxygen ions are presented by purple colour and metal ions are presented by green
colour.
Fig. 1.5: Schematic diagram of octahedral site [19].

Chapter No.1 Introduction
11
The spinel structures have mainly three types given as
• Normal spinel
• Inverse spinel
• Mixed spinel
Let tetrahedral lattice sites as A-sites and octahedral lattice sites as B-sites
1.7.1 Normal spinel
General formula for Normal spinel structure is [D2+]A[T3+]BO4. All the [D2+] ions
are divalent which present at A-sites and all the [T3+] ions are trivalent which present at B-
sites. Normal spinel ferrite unit cell contains of 16 octahedral sites and 8 tetrahedral sites.
Zinc ferrite (ZnFe2O4) shows normal spinel structure.
1.7.2 Inverse spinel
General formula of inverse spinel structures is [D3+]A[T2+D3+]BO4. Both A and B
sites are engaged by trivalent cations in equal part and divalent cations are engaged by B-
sites. Cobalt ferrite (CoFe2O4) is the best example for it, in which divalent Co2+cations are
at B-sites and trivalent Fe3+cations are at A and B-sites equally.
1.7.3 Mixed spinel
When Inverse and normal spinel structure are mixed is called as mixed or
transitional spinel structure. General formula of mixed spinel structure is [T2+δD
3+1-
δ]A[T2+1- δ D
3+1+ δ]BO4, where sigma (δ) is inversion factor. For inverse spinel structure δ =
0, for normal spinel structure δ = 1 and for mixed spinel structure δ fluctuated from 0 to 1.
The divalent and trivalent cations engaged by B-sites are equal in mixed spinel ferrites
[19]. MnFe2O4 is example of mixed spinel structure.
1.8 Spinel chromites
A spinel prototype system ACr2O4, in which Chromium (Cr) is essential element at
octahedral site is known as chromite. More recently, multi-ferroicity has been found in
these types of materials. The magneto-electric effect was discovered in spinel chromites in
19th century. The magneto-electric effect is: magnetization tuning with help of an applied
electric field and polarization tuning with help of applied magnetic field [20]. A significant

Chapter No.1 Introduction
12
interest for magneto-electrics has boosted recently for various technological potential
applications [21]. The field of magneto-electrics is closely relating to multiferroics:
combining ferroelectric and ferromagnetic properties, although not limited to them.
Chromites with cubic normal spinel type are very attracting materials due to their
multiferroic properties [22]. Multiferroic cobalt chromite and nickel chromite
nanoparticles belong to normal spinel structure and study of magneto-structural coupling
in these compounds are very interesting. Mohanty et al. [23] studied the magneto-structural
coupling in (Ni1xCox)Cr2O4 nanoparticles synthesized by co-precipitation method. They
observed the high value of transition temperature for nickel chromite and cobalt chromite
nanoparticles as compared to reported value with replacement of Ni by Co.
(Ni0.5Co0.5)Cr2O4 showed high coercivity and M-H loop shifted under field cooling
condition.
1.9 Cobalt Chromite
Cobalt chromite (CoCr2O4) is one of the very important ferrimagnetic material in
nature. It has normal spinel structure in which A site contains Co2+ ions in form of yellow
colour and B site contains magnetic Cr3+ ions in form of blue colour as shown in Fig. 1.6
[24]. The magnetic order is controlled by the strong AB and BB interactions mediated by
non-magnetic oxygen [25]. In this compound, spins lie on the conical surfaces and named
as ferrimagnetic spiral. The magnetic order of CoCr2O4 is mostly studied in bulk and single.
Menyuk et al. [26] studied the magnetic ordering of bulk CoCr2O4 through neutron
diffraction and observed short range order of spiral and ferrimagnetic component below
transition temperature TC. At nanoscale, CoCr2O4 usually shows a paramagnetic to
ferrimagnetic transitions at Curie temperature at 100 K along with two other magnetic
orders at low temperatures such as spiral spin state (TS) and lock in state (TL) at 31 K and
8 K respectively [27].

Chapter No.1 Introduction
13
Fig. 1.6: Crystal structure of CoCr2O4 [24].
1.10 Spinel ferrites
Ferrites especially ferri/ferromagnetic oxides with iron as their vital metallic
component at B site in general formula of spinel structure. It gives numerous and mostly
interesting new applications of magnetic materials in electrical appliances. Ferrites are used
in electromagnetic material due to very high performance at very low cost [28]. Their
properties can be enhanced by addition of certain divalent elements. These divalent
elements are Co, Ni, Mn, Zn etc. The research of ferrites in conventional bulk preparation
is getting to their limits because of high electrical conductivity and resonance of domain
walls. Due to above reason, ferrite research changed its direction to nano-metric scale to
investigate their properties at nano-scale [29, 30]. According to formula (Aδ B1−δ) [A1−δ Bδ]2
O4 with δ = 1, Zinc ferrite nanoparticles (ZnFe2O4) belong to a normal spinel. Zinc ferrite
have very weak B–B interactions. The Zinc ferrite shows antiferromagnetic long-range
ordering at Neel temperature (TN) = 9 –11 K [31]. Due to reduction of grain size, the
magnetization increases in this compound. This feature is usually related with the reduction
of the size of the grains and with the change of the cation inversion [32]. Nickel–Zinc
ferrites shows low loss due to eddy current losses and high value of electrical resistivity.
Due to these properties, Ni–Zn ferrite are used in the electromagnetic fields at very high
frequencies. With low dielectric losses and high mechanically strength, these magnetic
materials show very high magnetization and magnetic permeability. It is quite interesting

Chapter No.1 Introduction
14
to synthesis nano-sized Nickel–Zinc ferrites to minimize energy losses in the bulk powder.
The preparation of Ni–Zn ferrites at nano-scale is achieved successfully at room
temperature [33].
1.11 Maghemite
Maghemite (γ-Fe2O3) is a spinel structure which belongs to ferrites and contains iron
vacancies at B sites. The formula of maghemite is (FeIII8)A [FeIII
40/3 “Θ”8/3]B O32, where
“Θ” represents the vacancy at octahedral site [34]. In spinel structure, two third of the
octahedral sites are normally occupied by divalent metal ions but in maghemite these are
occupied by Fe3+ ions and the remainder is vacant. This produces an equal charge like by
divalent metal ions but creates an imbalance among Fe3+ ions at A and B lattice sites.
Crystal structure of maghemite with tetrahedral and octahedral coordination along with
vacancies are shown in Fig. 1.7. The net magnetic moment assigned to maghemite (γ-
Fe2O3) is 2.5 μB. Due to octahedral vacancies, fine maghemite nanoparticles can also
exhibit disorder in the core magnetization in addition to surface spin disorder. Maghemite
nanoparticles have also many applications in industry, e.g. magnetic data storage, ferro-
fluids and contrast agents [35].
Fig. 1.7: Crystal structure of maghemite [36, 37].
Chapter No.1 Introduction
15
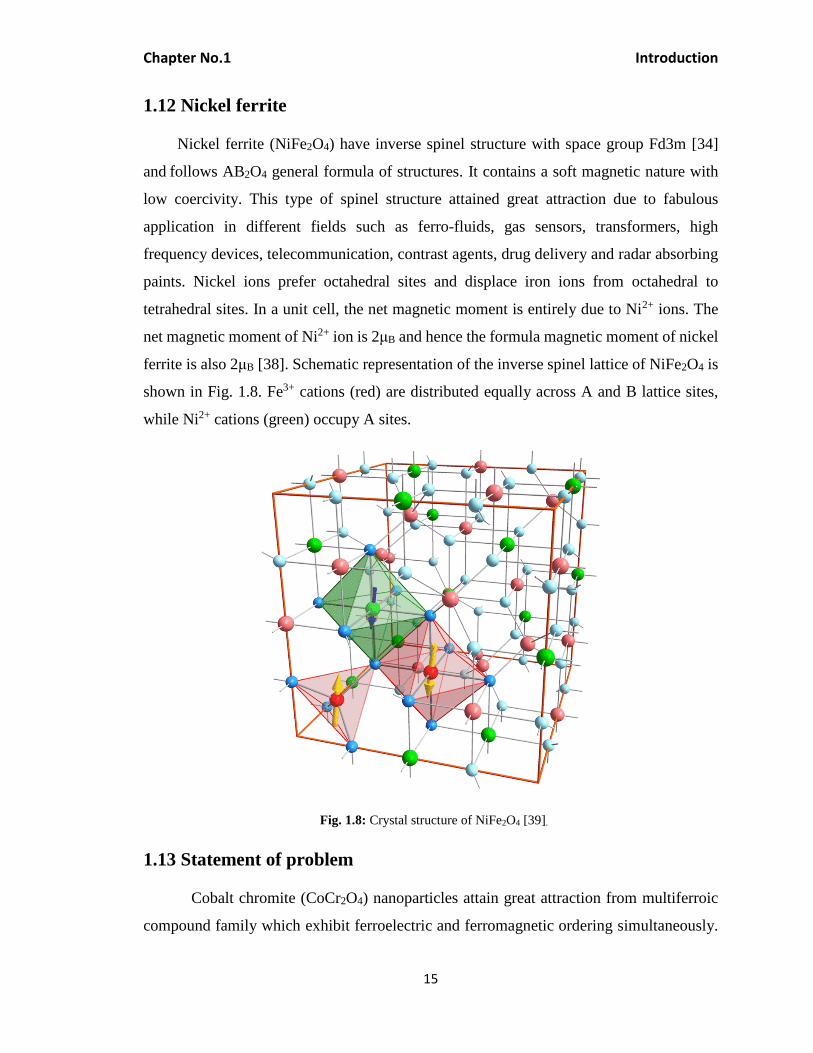
1.12 Nickel ferrite
Nickel ferrite (NiFe2O4) have inverse spinel structure with space group Fd3m [34]
and follows AB2O4 general formula of structures. It contains a soft magnetic nature with
low coercivity. This type of spinel structure attained great attraction due to fabulous
application in different fields such as ferro-fluids, gas sensors, transformers, high
frequency devices, telecommunication, contrast agents, drug delivery and radar absorbing
paints. Nickel ions prefer octahedral sites and displace iron ions from octahedral to
tetrahedral sites. In a unit cell, the net magnetic moment is entirely due to Ni2+ ions. The
net magnetic moment of Ni2+ ion is 2μB and hence the formula magnetic moment of nickel
ferrite is also 2μB [38]. Schematic representation of the inverse spinel lattice of NiFe2O4 is
shown in Fig. 1.8. Fe3+ cations (red) are distributed equally across A and B lattice sites,
while Ni2+ cations (green) occupy A sites.
Fig. 1.8: Crystal structure of NiFe2O4 [39].
1.13 Statement of problem
Cobalt chromite (CoCr2O4) nanoparticles attain great attraction from multiferroic
compound family which exhibit ferroelectric and ferromagnetic ordering simultaneously.

Chapter No.1 Introduction
16
Multiferroic CoCr2O4 nanoparticles due to coupling between electric and magnetic order
parameters show unprecedented physical properties. From ferrite family, Maghemite (γ-
Fe2O3) and Nickel ferrite (NiFe2O4) nanoparticles are promising candidate for different
applications such as in biomedical therapy and diagnostic, ferro-fluids, magnetic tunneling
barrier for spin filter devices and magnetic data recording. The main problem in utilizing
of ferrites and chromite nanoparticles efficiently in functional devices are their
agglomeration. It decreases the surface energy, reduces the superficial surface area and
interfaces with neighboring particles. Therefore, proper surface coating or developing
effective protection is used to minimize surface energy and to prepare stable nanoparticles
for potential applications. In-situ coating controls surface effects, particle size and
interparticle interactions. Coating not only stabilizes nanoparticles but can also lead to
surface functionalization. Different approaches for coating have been used so far which
include coating with polymer, biomolecules, surfactants, magnetic and non-magnetic etc.
I have preferred non-magnetic coating for chromite nanoparticles and antiferromagnetic
coating for ferrite nanoparticles. In this thesis, I have focused on effect of non-magnetic
Silica coating on CoCr2O4 nanoparticles and Chromium oxide coating on γ-Fe2O3
nanoparticles.
The ferrite and chromite are ferrimagnetic materials having opposite magnetic
moments at tetrahedral and octahedral lattice sites. Their magnetic and dielectric properties
strongly depend upon the cationic distribution between two sites. Doping mechanism is
very interesting tool to tune dielectric and magnetic properties of these nanoparticles by
altering the cationic distribution. I have preferred the doping of non-magnetic Mg2+ ions at
A site for chromite nanoparticles and Cr+3 doping at B site for ferrite nanoparticles. These
suitable doping can reduce magnetic anisotropy and controls the structural stability, which
can result in enhanced physical properties of these nanoparticles. The motivation of Mg
doping comes from our previous work on Mg doped zinc ferrite [40] in which increase in
Mg content increases magnetization. It was explained on the basis of preference of Mg ions
and they distributed in such a way that overall magnetization is increased. The doping of
non-magnetic Mg2+ ions in cobalt chromite controls the magnetic anisotropy and the
structural stability of nanoparticles. Therefore, I have also emphasized on the structural,
magnetic and dielectric properties of Mg doped CoCr2O4 nanoparticles and Chromium

Chapter No.1 Introduction
17
doped NiFe2O4 nanoparticles in this thesis. There is some significant interest in magnetism
of CoCr2O4 nanoparticles at low temperature due to surface effects, inter particle
interactions and finite size effects.
1.14 Aim and Objectives
Followings are the aims and objectives of this proposed thesis research work;
❖ Chromites have TC below room temperature with several magnetic transitions.
These transitions are not well understood at nanoscale.
❖ To fabricate and study the temperature dependent magnetic transitions of
CoCr2O4 nanoparticles,
❖ Doping in these materials can control their physical properties,
❖ To fabricate and study the structural, dielectric and magnetic properties of Mg
doped CoCr2O4 nanoparticles,
❖ Insitu coating restricts the growth of nanoparticles,
❖ To study the role of SiO2 coating on magnetic transitions of CoCr2O4
nanoparticles,
❖ Ferrites have high TC above room temperature, therefore magnetic blocking and
surface effects in ferrite nanoparticles are interesting to study for application
point of view,
❖ Surface coating of the nanoparticles plays important role in controlling their
physical properties, also important to study the properties of individual
nanoparticles,
❖ To fabricate and study the role of antiferromagnetic Cr2O3 surface coating on
ac and dc magnetic properties of γ-Fe2O3 nanoparticles,
❖ To fabricate and study the structural, dielectric and magnetic properties of Cr
doped NiFe2O4 nanoparticles.

Chapter No. 2 Literature Review of Chromite and Ferrite Nanoparticles
18
Chapter No. 2
Literature Review of Chromite and Ferrite Nanoparticles
Akyol et al. [41] prepared spinel multiferroic CoCr2O4 nanoparticles using sol-gel
method. They investigated briefly structural and magnetic experimental results along with
their modeling. Their reported temperature dependent magnetic transitions of CoCr2O4
nanoparticles are: ferrimagnetic transition at 96 K, spiral magnetic transition at 27 K and
lock-in transition at 16 K. Exchange bias phenomenon was observed in these nanoparticles
at 5 K with 350 Oe due to exchange interactions in randomly distributed structure and
showed decreasing trend as temperature increases from 5 to 50 K and vanished after 50 K.
The decrease of exchange bias effect is due to decrease in exchange coupling at higher
temperatures. The magnetic entropy was also performed for these nanoparticles around
the transition temperature and found maximum change-0.87 J/kg.K in entropy under 6 T
field.
Chandana et al. [42] synthesized the pure CoCr2O4 nanoparticles by co-
precipitation method having particle size between 8-12 nm. Temperature dependent
magnetization plot shows transition from paramagnetic state to superparamagnetic state.
Usually, CoCr2O4 nanoparticles reveal paramagnetic to ferrimagnetic transition at Curie
temperature. Blocking temperature of these superparamagnetic nanoparticles was 50-60 K.
These nanoparticles also showed loop shifting and an enhancement in coercivity at 10 K
on cooling the sample under 10 kOe field. The disordered surface spins configuration and
distribution of nanoparticle sizes are responsible for that effect. Exchange bias
phenomenon vanished at 50 K which confirms the blocking temperature of
superparamagnetic phase.
Gingasu et al. [43] synthesized CoCr2O4 nanoparticles by tartarate and gluconate
precursor routes. X-ray diffraction (XRD) pattern revealed cubic phase CoCr2O4
nanoparticles and average crystallite size was 14 and 21 nm. CoCr2O4 nanoparticles shows
paramagnetic to ferrimagnetic transition below the curie temperature (TC) 97 K and a phase
transition spiral spin ordering (TS) at ~26 K which is due to long-range spiral magnetic

Chapter No. 2 Literature Review of Chromite and Ferrite Nanoparticles
19
order. They also observed the best catalytic activity of CoCr2O4 nanoparticles as prepared
by gluconate precursor route by using the total methane oxidation.
Mindru et al. [44] prepared CoCr2O4 nanoparticles using precursor compound
oxalate through thermal decomposition. The structural characteristics had been performed
with help of X-ray diffraction, Raman and infrared spectroscopy and scanning electron
microscopy. Average crystallite size calculated by using Scherer’s equation and was found
between 38 and 58 nm. Both CoCr2O4 samples show ferrimagnetic ordering below TC at
97 K and a phase transition at TS ~20 K which is attributed to the onset of long range spiral
magnetic order.
Choudhary et al. [45] studied the effects of Zn, Mg and Cu doping on structural,
magnetic and dielectric properties of CoCr2O4 as prepared using auto-combustion sol-gel
technique. Structural information was obtained with help of XRD which showed single-
phase crystalline nature. Crystal structure was transformed from cubic to tetragonal with
addition of Cu. Dielectric measurements were explained with help of hoping phenomenon.
The maximum value for dielectric constant was observed in case of Zn doping and
attributed to enhanced space charge polarization. Grains and Grain boundaries both were
active at low frequency in this chromite which was confirmed by impedance analysis.
Kumar et al. [46] studied the doping effect of Fe doping on B site in CoCr2O4
nanoparticles prepared by using co-precipitation method. Particle size was found in 16-20
nm range and for x = 0.1 to x = to 0.2 particle size was 6-10 nm. Magnetic measurements
revealed that TC increases with the increasing Fe concentration. Specific heat versus
temperature shows a sharp transition TS in both x = 0.1 and x = 0.2 samples. By adding Fe
in the sample, interaction between Cr-Cr becomes unbalanced and hence it causes an
increase in TC and TS.
Afzal et al. [47] synthesized MnCr2O4 and Cr2O3 by using sol-gel technique. Crystal
structure was identified by XRD. Phase transformation was observed with Mn
incorporation in Cr2O3, from rhombohedral symmetry of Cr2O3 to spinel cubic symmetry
of MnCr2O4. Scanning electron microscope revealed uniformly distributed and well-
shaped nanoparticles in range of 30–70-nm. Magnetic behaviour of these nanoparticles was

Chapter No. 2 Literature Review of Chromite and Ferrite Nanoparticles
20
investigated as a function of temperature and applied field. Paramagnetic behaviour was
observed at both 5 K and room temperature for Cr2O3 nanoparticles, while a
ferromagnetism to paramagnetism magnetic phase transition was observed for
MnCr2O4 nanoparticles at a ~ 50 K Curie temperature TC.
Zakutna et al. [48] studied CoCr2O4 nanoparticles prepared at different
temperatures using hydrothermal treatment of chromium and cobalt oleates. CoCr2O4
nanoparticles annealed at 300o to 500oC temperature range. XRD, high-resolution TEM,
SEM, thermogravimetric and magnetic measurements performed to analyze these
nanoparticles. The observed particle size was 4.4 to 11.5 nm range as calculated from XRD
and TEM. Tendency of aggregation in these nanoparticles found to increase as annealing
temperature increases. Magnetic measurements of CoCr2O4 nanoparticle revealed
suppressed typical behavior of long range magnetic order.
Nadeem et al. [49] prepared maghemite nanoparticles having size 6 nm by using
microwave plasma synthesis method. SEM and XRD were used for structural
characterization of these nanoparticles. Zero field cooled and field cooled (ZFC/FC)
magnetization curves as function of temperature showed maximum magnetization at 75 K
for these nanoparticles. Experimental ZFC and FC data was simulated with help of uniaxial
anisotropy Neel-Brown relaxation model to figure out anisotropy constant of these
nanoparticles. The value of anisotropy constant of these nanoparticles was lager as
compared to bulk maghemite. The ac susceptibility data as function of frequency was fitted
with physical laws and dynamic scaling law confirmed the spin glass behavior.
Thermoremanent magnetization and memory effect were also performed which also
confirm the existence of spin glass behavior. Exchange bias and temperature dependent
coercivity revealed sharp increase due to frozen surface spins at low temperature.
Koseoglu et al. [50] synthesized Mn doped cobalt ferrite nanoparticles with the
formula MnxCo1-xFe2O4 where value of x was varied from x = 0.0 to x = 1.0. Debye-
Scherer’s formula used to estimate the average crystallite size and it was found between 14
to 22 nm. SEM was used to study the morphological information of nanoparticles.
Magnetic measurement shows that sample possess both ferromagnetic and
superparamagnetic phases distinguished by blocking temperature. Blocking temperature of

Chapter No. 2 Literature Review of Chromite and Ferrite Nanoparticles
21
sample starts decreasing by increasing the Mn ratio in the sample. Other magnetic
parameters such as coercivity and ramanent magnetization decreases as concentration of
Mn goes on increasing in the cobalt ferrite nanoparticles.
Wei et al. [51] studied the silica-coated manganese ferrite nanoparticles prepared
by chemical solution phase method which have capability of Radio-frequency-heating.
Transmission electron microscopy showed well dispersed in an aqueous solution coated
nanoparticle having size 7 nm, 12 nm and 18 nm. Energy dispersive X-ray analysis
confirmed the stoichiometry composition of MnFe2O4. They analysed the magnetic
properties of these coated nanoparticles with the help of VSM. Saturation magnetization
showed decreasing trend due to silica coating because it creates spin disordered surface.
They also observed the capability of the heat production in these nanoparticles which
directly depends upon the particle size and radio frequency field strength. In conclusion,
they suggested that silica coated manganese ferrite nanoparticles have great potential for
controlled drug releases and cancer treatments.
Zeb et al. [52] studied the temperature and time dependent magnetization of
uncoated and silica-coated maghemite nanoparticles. Surface spin disorder in these sol gel
prepared nanoparticles were analysed briefly. The average crystallite size was found 29 nm
for uncoated and 12 nm for coated maghemite nanoparticles. The decrease in average
crystallite size was due to silica coating which produce hinder in growth of nanoparticles.
The silica coated nanoparticles showed low value of average blocking temperature and
saturation magnetization and as compared to uncoated nanoparticles which attributed to
smaller average crystallite size. The Bloch's law fitting on experimental temperature
dependent saturation magnetization of coated nanoparticles revealed lower value of b and
higher value of B as compared to uncoated maghemite nanoparticles which was attributed
to finite size effects and weaker exchange coupling due to enhanced surface disorder. The
stretched exponential law fit on experimental FC data of coated nanoparticles showed slow
relaxation which suggest the surface spin glass behaviour in coated nanoparticles.
Yadav et al. [53] investigated the structural, dielectric, electrical and magnetic
properties of NiFe2O4 nanoparticles. The nanoparticles were synthesized using sol gel
honey-mediated combustion technique and annealed at different temperatures (800C and

Chapter No. 2 Literature Review of Chromite and Ferrite Nanoparticles
22
1100C). They reported increased MS and decreased HC with increasing average crystallite
size. The dielectric constant of these nanoparticles revealed maximum value at low
frequency. Frequency independent behaviour was showed by these nanoparticles at higher
frequency. This was due to active grain boundaries at low frequency and active grains at
higher frequency according to Wagner model. At constant frequency, dielectric constant
revealed increasing trend with increasing average crystallite size. AC conductivity of these
nanoparticles were explained with help of hoping mechanism in ferrite and ac conductivity
showed maximum value at higher frequency. The variation in electrical properties and
dielectric constant were due to variation in grain size which were revealed in cole-cole plot.
Hirthna et al. [54] reported the fabrication of magnetically separable and highly
conductive Ni1−xMgxFe2O4 nanoparticles with different concentration of (x) via co-
precipitation technique. The structural, dielectric and magnetic properties of these
nanoparticles were analysed using XRD, FTIR, SEM and VSM. The crystal structure of
Ni1−xMgxFe2O4 nanoparticle was face centred cubic as found by XRD and the average
crystallite size was in range 10 – 28 nm. The average crystallite size revealed decreasing
trend and lattice constant revealed increasing trend with increasing Mg concentration
which was due to replacement of small ionic radii of Ni2+ by large ionic radii of Mg2+. MS
found to increase with Mg doping up to x = 0.6 which was due to misbalance of Fe+3 ions
among lattice sites because of Mg content, non-collinear nature and super-exchange
interactions in magnetic moments which lead to enhanced magnetization.

Chapter No. 3 Characterization and Synthesis Techniques
23
Chapter No. 3
Characterization and Synthesis Techniques
3.1 Characterization techniques
There are many methods and process which can be used for the characterization of
nanoparticles. We have used X-ray diffraction for the study and determination of crystal
structure, parameters of the unit cell and average crystallite size of nanoparticles. Fourier
transform infrared and Raman spectroscopy were selected for getting information about
vibrational bands. Transmission electron microscopy was selected for getting information
about shape and particle size of the nanoparticles. LCR meter was used for dielectric
measurements. Super conducting quantum interference device magnetometer was used for
ac and dc magnetic characterization. These techniques are discussed as coming sections.
3.2 X-Ray diffraction
The electromagnetic radiations with around 10 nm wavelength are known as X-
rays. The interatomic distance between the molecules of different materials is also of the
order of nanometer range, so a comparable wavelength can be used to detect or observe
diffraction patterns. The benefits by using X-rays diffraction (XRD) is that, it is non-
destructive and helpful in determining the wide range properties of the materials such as
lattice constants, geometry of planes, orientation of atoms, identification of unknown
materials, defects, grain size and stresses in the crystalline structures. The radiation emitted
from transition of electrons from L to K shell or M to K shell are called soft X-rays whereas
the radiations emitted from all other transitions are known as hard X-rays [55]. Bragg’s
law is used to study the diffraction pattern and analyze materials properties.
Bragg’s diffraction depends on the wavelength of incident X-rays and the space
between two atoms. A comparable distance and the wavelength produce diffraction pattern
by the constructive interference of diffracted X-rays. The method of constructive
interference and destructive interference can be explained through Bragg’s law. Bragg’s
law gives a mathematical interpretation for analyzing orientations of different planes of a

Chapter No. 3 Characterization and Synthesis Techniques
24
material. Radiation strikes on a parallel series planes which are equally spaced. The
reflected radiation rays will have a path difference [56]:
nλ = 2dsinθ (3.1)
where “λ” is notation for wavelength, “n” is the integer number and “d” is the inter planer
distance of the crystal lattice.
Fig. 3.1: Bragg’s law representation [57].
A beam of X-ray is incident on a surface of crystal with parallel planes as shown in
Fig. 3.1. On the upper plane radiation beam strikes with atom, while the second beam of
radiation strikes with another atom on the lower plane. On reflection, the second beam
travels extra distance than the first beam. It can be judge that an extra or more distance is
traveled by the second ray. This is done due to the reflection at suitable angles which allows
the reflection of electromagnetic radiation from two consecutive planes [57]. The reflected
beams interfere constructively as the path difference of two beams reflected from two
successive planes is the integral multiple of the wavelength “λ’. By using this law in X-ray
diffraction, we can find the crystalline phase, crystalline orientation, grain size, phase
composition and strain [55].

Chapter No. 3 Characterization and Synthesis Techniques
25
3.3 Fourier transform infrared spectroscopy
A fourier transform infrared spectroscopy (FTIR) is a very basic tool in
characterizing the chemical species of an unknown material. Everybody with finite
temperature emits infrared radiation, and a molecule selectively absorbs radiation
according to its optical active modes of vibrations and electronic transitions. FTIR-
spectroscopy deals with the interaction of radiation of proper wavelength (like infrared)
with matter. It detects in the mid-infrared the vibrational modes of groups of chemical
elements. From the specific absorbed wavelengths, the various modes of the molecular
structure are investigated. FTIR operation is based on the principle of a Michelson
interferometer in which the movable mirror creates a phase delay for all wavelengths of a
splitted infrared beam passing through the specimen as shown in Fig. 3.2. The scattered
infrared radiation is detected by sensitive infrared detectors. Direct detection of the signal
as a function of the mirror displacement gives raw data in the form of an “interferogram”.
FTIR spectrum is usually plotted as absorbance or transmittance spectrum as a function of
wave number. First the background spectrum of the infrared broadband source without
sample is recorded and then the same spectrum with the sample is recorded [58]. Infrared
spectroscopy is useful for following investigations.
i) Recognize anonymous materials
ii) Chemical bonding
iii) Find out the quality sample
iv) Find out the number of components in a mixture.

Chapter No. 3 Characterization and Synthesis Techniques
26
Fig. 3.2: Experimental arrangement of Michelson interferometer [59].
3.4 Superconducting quantum interference device magnetometer
A superconducting quantum interference device (SQUID) is used the most sensitive
device to measure the magnetic moment of small quantity of samples. These devices
consist of mainly two parts one is superconducting material and other is insulator. SQUID
operates in the range of about 4.2- 400 K temperature [60]. There are two modes to set the
desired temperature, one is the settle mode and the other is the sweep mode. When a settle
mode is selected, the system will stay at the desired temperature and one can record
magnetic moment. While in sweep mode the system will pass slowly through the desired
temperature and magnetic moment can be recorded during the slow ramping of the system
through the desired temperature [61]. There are also three different control modes to set
the magnetic field: (1) oscillating mode, (2) no-overshoot mode and (3) hysteresis mode.
In oscillating mode, the magnetic field quickly approaches the desired magnetic field value
but oscillates back and forth with decreasing amplitude around the desired magnetic field.
In no-overshoot mode, the field is ramped quickly up to the desired magnetic field and then
it slowly approaches the desired magnetic field without any overshoot. The no-overshoot
mode is highly recommended for samples which are sensitive to any history of external
magnetic field excitation. In hysteresis mode, the magnet works in the non-persistent mode
Chapter No. 3 Characterization and Synthesis Techniques
27
and takes current directly from the external power supply to set the desired magnet field in
the fastest way, but with less accuracy. This mode is recommended for fast hysteresis loop
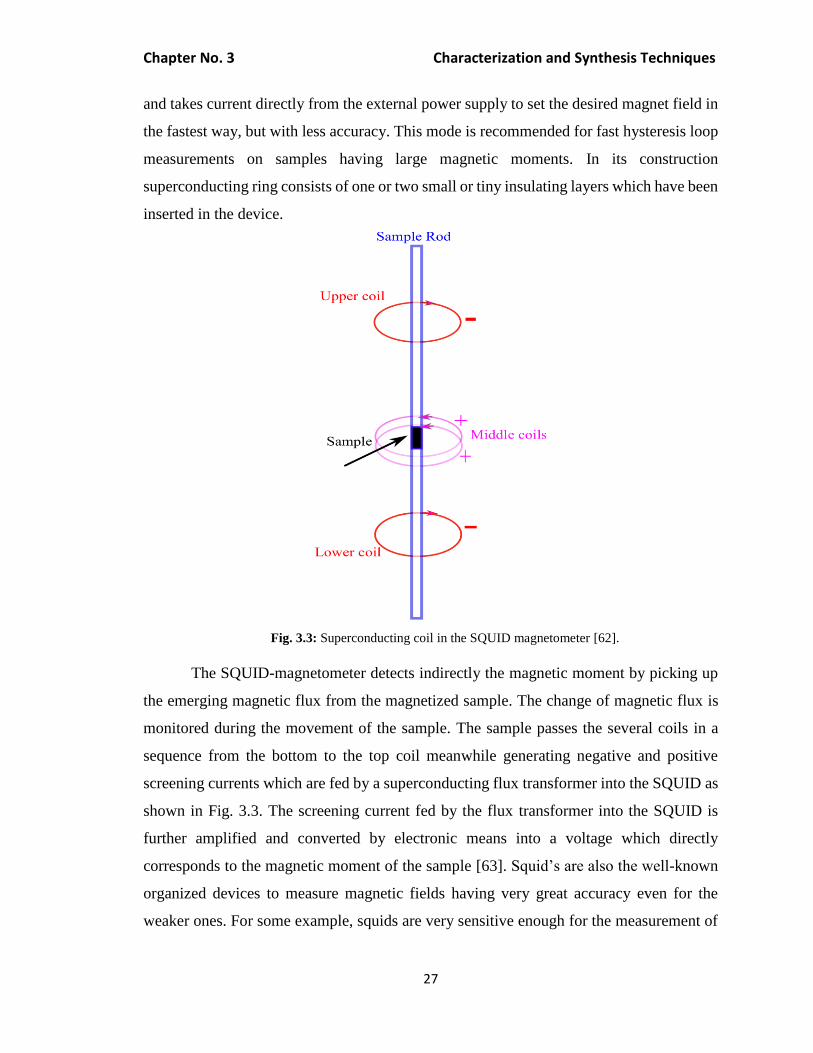
measurements on samples having large magnetic moments. In its construction
superconducting ring consists of one or two small or tiny insulating layers which have been
inserted in the device.
Fig. 3.3: Superconducting coil in the SQUID magnetometer [62].
The SQUID-magnetometer detects indirectly the magnetic moment by picking up
the emerging magnetic flux from the magnetized sample. The change of magnetic flux is
monitored during the movement of the sample. The sample passes the several coils in a
sequence from the bottom to the top coil meanwhile generating negative and positive
screening currents which are fed by a superconducting flux transformer into the SQUID as
shown in Fig. 3.3. The screening current fed by the flux transformer into the SQUID is
further amplified and converted by electronic means into a voltage which directly
corresponds to the magnetic moment of the sample [63]. Squid’s are also the well-known
organized devices to measure magnetic fields having very great accuracy even for the
weaker ones. For some example, squids are very sensitive enough for the measurement of

Chapter No. 3 Characterization and Synthesis Techniques
28
the magnetic activities such as human brain. The SQUID-magnetometer which was used
for magnetic measurements of our samples is shown in Fig. 3.4.
Fig. 3.4: SQUID-magnetometer facility at the Institute of Physics, Karl-Franzens University, Graz, Austria.
3.5 Transmission electronic microscopy
Transmission electron microscopy (TEM) is a versatile tool in nanoscience research
for determining shape, crystalline quality and the lattice parameter of small objects. For
nanoparticles, TEM additionally provides information about the size distribution and the
average particle size which are mandatory for investigating their integral physical
properties. A TEM schematic diagram is shown in Fig. 3.5 [64]. High energy electrons of
60 – 400 keV are used for electron diffraction while they traverse the thinned specimen.
The main part of a transmission electron microscope is the electron gun. Electrons from
the cathode are accelerated by at least two anodes. Behind the anodes, there is a condenser
lens system to focus the electron beam on the specimen. The specimen should be thin
enough so that the incoming high energy electrons can pass through it. After passing
through the specimen, the diffracted electrons are imaged on a photographic film or on a
fluorescent screen by a sophisticated arrangement of projection lenses [65]. We can

Chapter No. 3 Characterization and Synthesis Techniques
29
observe specimen to the angstrom level. For example, we can observe small structural
details in the cell or other specimens to the atomic levels.
Fig. 3.5: Working principle of TEM [64].
3.6 LCR Meter
An inductance, capacitance and resistance (LCR) meter is a very useful instrument
to measure rapid and accurate frequency dependent measurements of samples. LCR
contains a power supply to generate the ac voltage. As according to the requirement, the
frequency and the voltage amplitude can be adjusted. Two operational amplifiers worked

Chapter No. 3 Characterization and Synthesis Techniques
30
in it. The operational amplifier provides a signal at its output which is proportional to the
current. Four Kelvin wires for connections use in LCR meter to measure voltage across the
sample and current through the sample. Multiplying the current and voltage signals from
sample with in phase voltage reference signal of power supply, we can obtain real signals,
and those power supply voltage signals which shift 90⁰ give out of phase signals. A
microprocessor is used to read the signals. Finally, the microprocessor converts the
receiving signals into proper data points.
Using LCR meter, we can calculate the dielectric constant with the help of given
formulas i.e.
ℇ′ =cd
Aℰ˳ (3.2)
ℇ′′ = ℇ′ 𝑡𝑎𝑛𝛿 (3.3)
Here ‘C’, ‘d’ ‘A’ and ‘ℰ˳’correspond for the capacitance in farad, the thickness in meter,
cross-sectional area of pellet and permittivity of free space, respectively. Dielectric loss
(𝑡𝑎𝑛 𝛿) is calculated by following formula,
𝑡𝑎𝑛 𝛿 = 1
2𝜋ƒ𝐶𝑃𝑅𝑃 (3.4)
where ‘f’, ‘δ’, ‘Cp’ and ‘Rp’ are notations for frequency, the loss angle, equivalent parallel
capacitance and equivalent parallel resistance respectively [66]. The LCR meter from
National University of Science and Technology, Islamabad which was used for dielectric
measurements. The working principle of LCR meter is shown in Fig. 3.6.
Fig. 3.6: Working principle of LRC meter.

Chapter No. 3 Characterization and Synthesis Techniques
31
3.7 Synthesis of nanoparticles
In nanostructured materials, controlled synthesis and processing are the key factors
to obtain the material at the nanometer scale. Synthesis technique plays an important role
to get nanoparticles of desired properties. Properties of material strongly depend on the
synthesis route followed for the preparation of nanoparticle. There are two methods used
for the synthesis and creation of nanostructured materials which are top down and bottom
up approach.
3.7.1 Top down approach
A physical approach, in which bulk materials are broken down to give small features
at nano scale is called top down approach. This technique is not favorable for the synthesis
of nanoparticles because the product formed in this case have structural defects also non-
homogenous nanoparticles are obtained through this synthesis approach. Synthesis routes
that are used in top down approach are as follows:
➢ Ball Milling
➢ Lithography
➢ Laser ablation method
3.7.2 Bottom up approach
Bottom up is a chemical approach used for the synthesis of nanoparticles. In this
method, chemical routes are used to produce nanoparticles. Small building blocks are
joined together to form a large structure [67]. Nanoparticles obtained through this process
are homogenous and have less structural defects. Synthesis routes that are used in bottom
up approach are as follows:
➢ Sol-gel
➢ Co-precipitation
➢ Hydrothermal
➢ Thin film deposition

Chapter No. 3 Characterization and Synthesis Techniques
32
➢ Self-assembly
➢ Microwave Plasma synthesis method
➢ Colloidal aggregation
3.8 Synthesis of ferrite and chromite nanoparticles
There are different experimental methods that can be utilized for the synthesis of
nanoparticles, but I have chosen sol-gel method and microwave plasma synthesis method
for the synthesis of Co1-xMnxCr2O4 nanoparticles.
i) Sol-gel method
ii) Microwave plasma synthesis method
3.8.1 Sol-gel method
Sol-gel synthesis of ferrite and chromite nanoparticles is a chemical method and
appropriate for producing coated/uncoated metal oxide nanoparticles. It gives a rather
mono-disperse and narrow particle size distribution as compared to other chemical methods
e.g. by the co-precipitation technique. In sol-gel method, first precursors are mixed with
their respective molar ratios in a solvent. Then a specific amount of citric acid is added as
gelatin and firing agent. Ammonia can be used to stabilize the pH value. After stirring for
some time, a gel will be formed with a network of metal ions. Afterwards, the gel is dried
at 80°C to remove the solvent. The dried gel is fired at some temperature for some specific
time to get the required crystalline quality of the nanoparticles. A flow chart of Sol-gel
process to synthesize ferrite and chromite nanoparticles is shown in Fig. 3.7.
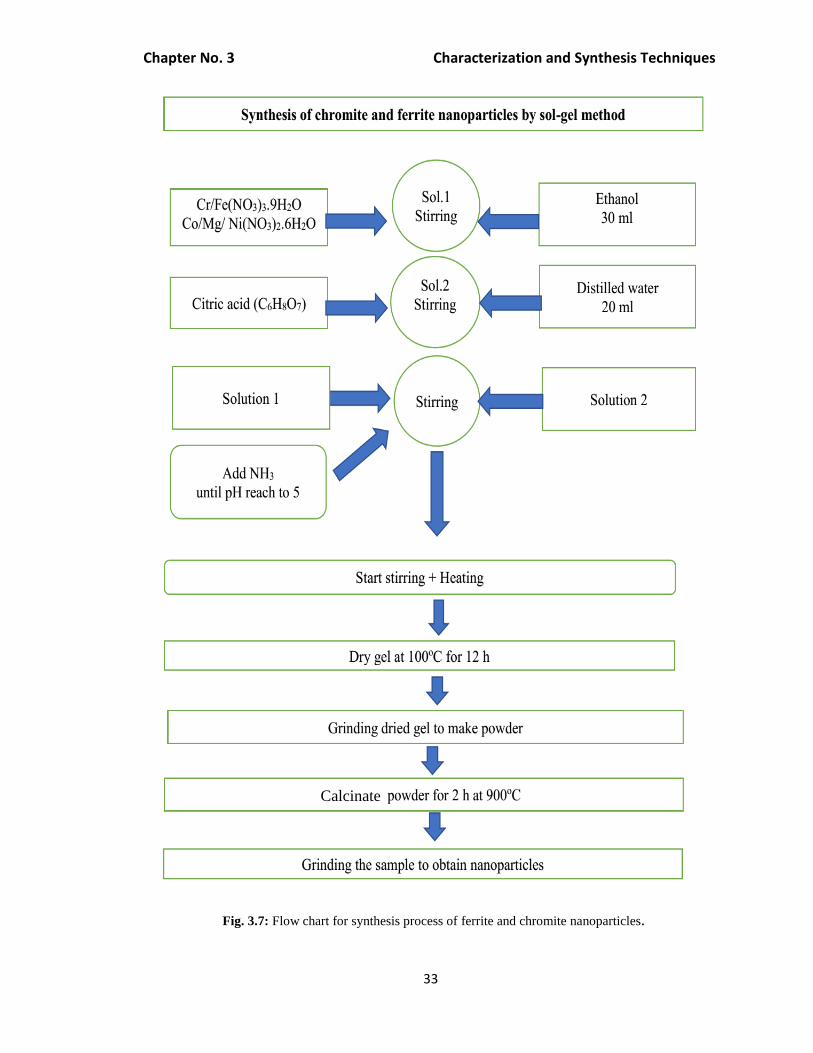
Chapter No. 3 Characterization and Synthesis Techniques
33
Fig. 3.7: Flow chart for synthesis process of ferrite and chromite nanoparticles.
Calcinate

Chapter No. 3 Characterization and Synthesis Techniques
34
The chemicals which used for the preparation of chromite and ferrite nanoparticles are:
a) Cobalt Nitrate (Co(NO3)2.6H2O)
b) Magnesium Nitrate (Mg(NO3)2.6H2O)
c) Chromium Nitrate (Cr(NO3)3.9H2O)
d) Nickel Nitrate (Ni(NO3)2.6H2O)
e) Iron Nitrate (Fe(NO3)3.9H2O),
f) Tetraethyl orthosilicate (SiC8H20O4)
g) Ethanol (C2H6O),
h) Ammonium Hydroxide (NH4OH),
i) Citric Acid (C6H8O7.H2O),
j) Distilled Water.
The CoCr2O4, Mg doped CoCr2O4, SiO2 coated CoCr2O4 and Cr doped NiFe2O4
nanoparticles synthesized by using sol-gel method. Co(NO3)2.6H2O, NH4OH,
Cr(NO3)3.9H2O, C6H8O7.H2O and C2H6O are taken for preparation of CoCr2O4
nanoparticles. Mg(NO3)2.6H2O, Co(NO3)2.6H2O, C2H6O, Cr(NO3)3.9H2O, C6H8O7.H2O
and NH4OH are taken for preparation of Mg doped CoCr2O4 nanoparticles.
Co(NO3)2.6H2O, NH4OH, Cr(NO3)3.9H2O, C6H8O7.H2O, C2H6O and SiC8H20O4 (as a
precursor for SiO2) are taken for preparation of SiO2 coated CoCr2O4 nanoparticles. The
chemical reagents like Ni(NO3)2.6H2O, Fe(NO3)3.9H2O, Cr(NO3)3.9H2O, C6H8O7.H2O and
NH4OH are taken for preparation of Cr doped NiFe2O4 nanoparticles. All the chemical
reagents were purchased from Sigma-Aldrich and used in their stoichiometric ratios.
For chromite nanoparticles, the first homogeneous solution is obtained by putting
the mixture of Mg(NO3)2.6H2O/Co(NO3)2.6H2O, Cr(NO3)3.9H2O) and 30 ml ethanol in
beaker and stirred with constant rate. Second solution is made by adding citric acid into
distilled water. Tetraethyl orthosilicate is also mixed in second solution just for coating of
nanoparticles. Citric acid and nitrates are mixed with 1:1 molar ratio. Afterwards, second
solution is dropped in first solution and obtained combined solution.
For Cr doped NiFe2O4 nanoparticles, the first homogeneous solution is obtained by
putting the mixture of Ni(NO3)2.6H2O), Cr(NO3)3.9H2O, Fe(NO3)3.9H2O and 30 ml

Chapter No. 3 Characterization and Synthesis Techniques
35
ethanol in beaker and stirred with constant rate. Second solution is made by adding citric
acid into distilled water. Citric acid and nitrates are mixed with 1:1 molar ratio. Afterwards,
second solution is dropped in first solution and obtained combined solution.
The next procedure is same after getting the combined solution for chromite and
ferrite nanoparticles preparation. Ammonia is dropped into the combined solution to set a
pH value to 5. After that, solution is heated at 70oC till the gel formation. The formed gel
is dried at 100oC in an oven for 12 h. To acquire the powder form, dried gel is grinded. The
powder is calcined at 900oC for 2 h to obtain the required nanoparticles.
3.8.2 Microwave plasma synthesis
Microwave plasma synthesis is a gas-phase synthesis for preparing nanoparticles.
As compared to liquid-phase synthesis e.g. sol-gel method and co-precipitation, microwave
plasma synthesis produces nanoparticles with a highly mono-dispersed and very narrow
particle size distribution. This method involves a gas-phase reaction of the evaporated
precursor materials. It is also a low temperature process because a large amount of energy
for nucleation and growth of nanoparticles provided by the plasma itself. A plasma is
believed to be a degenerate state of (gaseous) matter being ionized and charged. The total
charge of the plasma is zero. A plasma is also conductive due to mobile charged ions and
it responds strongly to electromagnetic radiation. Nanoparticles produced by this method
repel each other which shows very less tendency of agglomeration due to the residual
surface charge on them.
Cr2O3 and poly methyl methacrylate (PMMA) coated γ-Fe2O3 core-shell
nanoparticles synthesised using microwave plasma synthesis method under a 2.45 GHz
Magnetron with 2 consecutively arranged plasma zones, as shown in Fig. 3.8 by one of our
collaborators Dr. Dorothée Vinga Szabó [68] at the Institute for Materials Research III,
Karlsruhe Institute of Technology, Karlsruhe, Germany. Fe(CO)5 has been used as the
precursor for Fe2O3 formation with a feeding rate of 7.5 ml/h, and Cr(CO)6 as the precursor
for Cr2O3 formation. The respective amount of precursor was selected to yield a volume
ratio Fe2O3:Cr2O3 equal 1:1. Methylmethacrylic acid was used for the organic coating,
yielding a monolayer of PMMA on top of each particle. The PMMA coating was used just
for protection of core-shell nanoparticles. Microwave power was set to 1500 W, the

Chapter No. 3 Characterization and Synthesis Techniques
36
Ar/20vol% O2 reaction gas flow was adjusted to 10 l/min, yielding a system pressure of
10 mbar. The -Fe2O3 cores are formed in the first plasma zone, acting as nuclei for the
crystallization of the Cr2O3 shell in the second plasma zone. Polymer coating is performed
immediately behind the second plasma zone. The principles of this synthesis process are
reported elsewhere [69].
Fig. 3.8: Schematic diagram of microwave plasma synthesis [68].

Chapter No.4 Structural, Dielectric and Magnetic Properties of Chromite Nanoparticles
37
Chapter No. 4
Structural, Dielectric and Magnetic Properties of Chromite
Nanoparticles
4.1 Introduction
Recently, spinel type magnetic nanoparticles signify a great attraction due to their
better magnetic, electrical, opto-magnetic and catalytic properties than their bulk
counterpart [70-72]. A small size and high surface area of magnetic nanoparticles reveal
novel chemical and physical properties which lead to various potential applications [73-
75]. The spinel materials generally follow the AB2O4 formula, where A and B are notations
for divalent and trivalent metallic cation, respectively. The oxygen surrounds the A site as
tetrahedral and B site as octahedral [76]. If Fe+3 resides at B site, the material will be called
ferrite and if Cr+3 is at B site, it will be chromite. The chromite spinels are useful for
biomedicine, data storage, electronics, dye, catalyst and magneto-capacitive devices. In
chromite spinel unit cell, there are 16 trivalent Cr cations, 8 divalent metallic cations and
32 Oxygen anions. In chromite spinel, there is antiparallel arrangement of magnetic
moments between two lattice sites [77, 78].
Among such magnetic chromite nanoparticles, Cobalt chromite (CoCr2O4) has
recently attracted a great interest as a multiferroic material due to its potential applications
in modern technology [79]. Bulk CoCr2O4 has normal cubic spinel type crystal structure in
which Co2+ and Cr3+ ions reside at A and B sites, respectively. Bulk CoCr2O4 exhibit
paramagnetic (PM) to ferromagnetic (FiM) transition (TC) at 94 K, conical long range spiral
ordering (TS) at 27 K and lock-in transition (TL) at 15 K [80]. Menyuk et al. [26] reported
that magnetic order of bulk CoCr2O4 comprises of FiM and spin spiral state below TC by
using by neutron diffraction. FiM component shows long range order at all temperature
below TC while spiral component shows short range order at 86 K which finally transforms
into long range order at 31 K (TS). They calculated cone angles for FiM spiral long range
order in term of parameter u, where u is defined as [3],

Chapter No.4 Structural, Dielectric and Magnetic Properties of Chromite Nanoparticles
38
𝑢 = 4𝑆𝐵 𝐽𝐵𝐵
3𝑆𝐴 𝐽𝐴𝐵 ……………………………………(4.1)
Here, JBB is nearest exchange integral spins between B- B sites, JAB is nearest exchange
integral spins between lattice sites, SB is magnitude of spin at B site and SA is magnitude
of spin at A site. They found cone angles u = 2 experimentally for FiM long range spiral
order. JBB interactions (between two chromium ions) are very strong interactions and play
a significant role in cone angles of long range spiral state (TS) and usually controls the
magnetic order in bulk CoCr2O4 [77]. At nano-scale, the low temperature magnetic
response of CoCr2O4 nanoparticles is not well understood in the literature. Galivarapu et
al. [27] examined colossal and unusual magnetic transitions in CoCr2O4 nanoparticles and
reported TC =100 K, TS = 31 K and TL = 8 K. It is noticed that TS remained same in bulk
as well as in CoCr2O4 nanoparticles which was attributed to strong B-B interactions. Long
range spiral state indicates a dominancy of B-B interactions over A-B interactions in
CoCr2O4.
In fine chromite nanoparticles, disordered and frustrated magnetization such as
spin-glass behaviour is also reported which can also change the physical properties of these
nanoparticles. Tian et al. [81] observed the dynamic behaviour of cluster spin-glass in
CoCr2O4 nanoparticles (D ≤ 5.4 nm) and found glassy transition temperature Tg at 16.3 K
which decreases with reducing the particle size of nanoparticles. Below Tg, exchange bias
effect in CoCr2O4 nanoparticles is also reported which was attributed to pinning force from
some frozen spins to rotatable spins of spin-glass phase [76]. At nano-scale, surface spins
have dominant role in controlling magnetic properties of chromite nanoparticles which
causes reduction in saturation magnetization. Kodama et al. [82] reported that surface spins
in ferrite nanoparticles which do not follow the core anisotropy direction due to presence
of exchange and broken bonds at nanoparticle’s surface. Such particles are known as core-
shell nanoparticles which consist of FM/FiM core and disordered shell. Therefore, the
magnetic properties of core-shell chromite nanoparticles also depend upon surface spins
anisotropy in addition to aligned core spins.
In addition to surface properties of chromite nanoparticles, doping can also
significantly change the physical properties of these nanoparticles. Researchers are doping
suitable cations at A or B sites in chromite nanoparticles to obtain nanoparticles with

Chapter No.4 Structural, Dielectric and Magnetic Properties of Chromite Nanoparticles
39
desired properties for the different practical applications. Bush et al. [83] studied the
dielectric properties of Co1– xNixCr2O4 (0 ≤ x ≤ 1) samples. With increasing concentration
of Ni ions in CoCr2O4, all samples show an increase in magnitudes of tanδ and 1/ρ. Above
literature proved that doping has very interesting role in controlling the dielectric properties
of CoCr2O4 nanoparticles. The type of doped cations and along their cationic distribution
between A and B sites strongly influenced on dielectric and magnetic properties of nano-
sized CoCr2O4. The doping of non-magnetic Mg2+ ions in CoCr2O4 can reduce the magnetic
anisotropy and controls the structural stability resulting in enhanced properties of
nanoparticles [84].
Nanoparticle’s surface spins play important role in controlling its magnetic
properties for various applications and surface functionalization [85, 86]. Due to magnetic
nature of chromites, they have high tendency to agglomerate and one can get their
collective magnetic response [87]. To avoid agglomeration, nanoparticles can be coated or
disperse in non-magnetic matrix to get separate individual nanoparticles. Tsoukatos et al.
[88] reported that SiO2 acts as the best serving non-magnetic material in sputtering
deposition method than any other such type of materials as Al2O3 and TiO2. There are
various advantages of SiO2 such as its excellent stability, controlling particle size,
controlling surface effects, and control of interparticle interactions through its shell
thickness [89]. SiO2 can be used to prepare nanoparticles with smaller size of single phase
because it provides large number of nucleation sites during synthesis process, which finally
restrict the growth of nanoparticles [90-92]. Consequently, it can be used to control the
magnetic properties of multiferroic nanoparticles which will finally affects the magneto-
electric coupling [93]. Therefore, it is interesting to study the effect of non-magnetic SiO2
coating on the structural and magnetic properties CoCr2O4 nanoparticles.
In this chapter, I have focused on the study of magnetic response of CoCr2O4
nanoparticles at low temperatures, effects of Mg+2 doping on and SiO2 coating on the
physical properties of CoCr2O4 nanoparticles.

Chapter No.4 Structural, Dielectric and Magnetic Properties of Chromite Nanoparticles
40
4.2 Results and discussion of low temperature magnetic response of
CoCr2O4 nanoparticles
4.2.1 X-ray diffraction
X-ray diffraction (XRD) is basic characterization tool which is used for getting
structural information of CoCr2O4 nanoparticles such as phase, average crystallite size and
lattice parameter. XRD pattern of CoCr2O4 nanoparticles is shown in Fig. 4.1. This
obtained XRD data was analysed by software the Philips X´pert High Score, which
completely followed (PDF#22-1084) standard patterns [94]. The diffraction peaks at 2θo =
18.4, 30.3, 35.7, 43.4, 57.5, and 63.1 indexed with (111), (220), (311), (400), (511) and
(440) crystal planes which shows cubic normal spinel crystal structure having space group
Fd3m (227). The intense and sharp XRD peaks point out well crystallized structure.
Fig. 4.1: XRD pattern of CoCr2O4 nanoparticles.
Lattice parameter of CoCr2O4 nanoparticles was calculated by using relation,
a = d √ℎ2 + 𝑘2 + 𝑙2…………..………………………… (4.2)
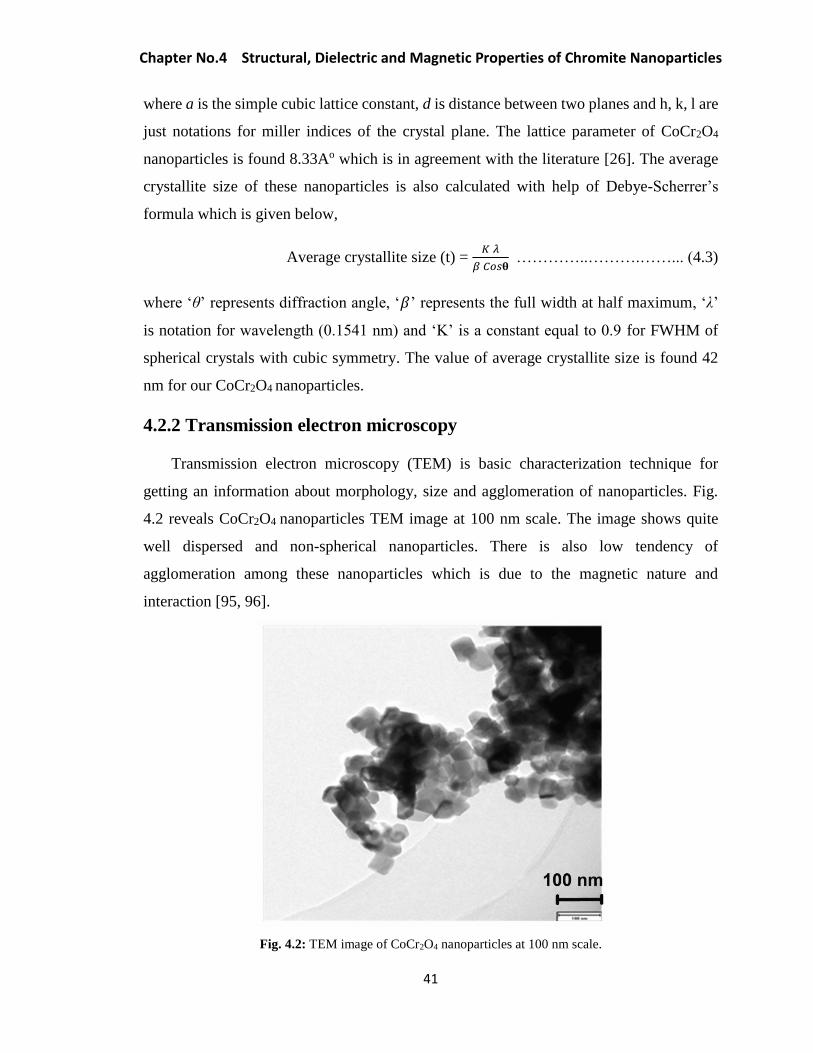
Chapter No.4 Structural, Dielectric and Magnetic Properties of Chromite Nanoparticles
41
where a is the simple cubic lattice constant, d is distance between two planes and h, k, l are
just notations for miller indices of the crystal plane. The lattice parameter of CoCr2O4
nanoparticles is found 8.33Ao which is in agreement with the literature [26]. The average
crystallite size of these nanoparticles is also calculated with help of Debye-Scherrer’s
formula which is given below,
Average crystallite size (t) = 𝐾 𝜆
𝛽 𝐶𝑜𝑠𝛉 …………..……….……... (4.3)
where ‘θ’ represents diffraction angle, ‘𝛽’ represents the full width at half maximum, ‘λ’
is notation for wavelength (0.1541 nm) and ‘K’ is a constant equal to 0.9 for FWHM of
spherical crystals with cubic symmetry. The value of average crystallite size is found 42
nm for our CoCr2O4 nanoparticles.
4.2.2 Transmission electron microscopy
Transmission electron microscopy (TEM) is basic characterization technique for
getting an information about morphology, size and agglomeration of nanoparticles. Fig.
4.2 reveals CoCr2O4 nanoparticles TEM image at 100 nm scale. The image shows quite
well dispersed and non-spherical nanoparticles. There is also low tendency of
agglomeration among these nanoparticles which is due to the magnetic nature and
interaction [95, 96].
Fig. 4.2: TEM image of CoCr2O4 nanoparticles at 100 nm scale.

Chapter No.4 Structural, Dielectric and Magnetic Properties of Chromite Nanoparticles
42
4.2.3 Fourier transform infrared spectroscopy
The vibrational properties of CoCr2O4 nanoparticles were studied at ambient
conditions using Fourier transform infrared (FTIR) spectroscopy. CoCr2O4 belongs to the
normal cubic spinel having space group O7h(Fd3m). The atoms of CoCr2O4 reside at the
8a, 16d, and 32e (oxygen) Wyckoff sites. FTIR spectroscopy is basic tool to explore the
vibrational modes of chemical bonds in CoCr2O4 nanoparticles. Fig. 4.3 shows FTIR
absorption spectrum of CoCr2O4 nanoparticles which confirms the corresponding
vibrational modes of normal spinel structure of these nanoparticles. The IR spectra reveals
two absorption bands at 537 cm−1 assigned to v2 and 446 cm−1 assigned to v3 vibrations.
Torgashev et al. [97] studied IR spectrum of bulk CoCr2O4 and discussed briefly about the
assignment of IR vibrational modes in bulk CoCr2O4. According to their study, Cr–O bonds
at 537 cm-1, on the basis of character and strength assigned primarily to the bands v2. The
IR band at 446 cm-1, formed due to complex translation of both divalent and trivalent ions,
assigned to v3 [98].
Fig. 4.3: FTIR spectrum of CoCr2O4 nanoparticles.

Chapter No.4 Structural, Dielectric and Magnetic Properties of Chromite Nanoparticles
43
4.2.4 Magnetic Properties
To find out the low temperature magnetic response of these nanoparticles, we have
done zero field cooled/field cooled (ZFC/FC) magnetization curves, temperature
dependent M-H loops and ZFC/FC magnetic relaxation. Fig. 4.4 shows the ZFC/FC curves
of CoCr2O4 nanoparticles under 50, 500 and 1000 Oe applied field. At 50 Oe, CoCr2O4
nanoparticles showed PM to FiM transition at 98 K, along with two other low temperature
magnetic transitions; the long range conical spiral state (TS) at 27 K and the lock-in
transition (TL) at 13 K, which are in accordance to the literature [99]. The ZFC curve
exhibits negative magnetization which persisted up to 87 K under applied field of 50 Oe.
This negative magnetization has been reported by Lawes et al.[80] in bulk CoCr2O4
polycrystalline samples which was attributed to uncompensated spins at the grain
boundaries. Kumar et al. [100] studied the negative magnetization in bulk CoCr2O4 and
attributed to a small trapped field in magnetometers and a superconducting magnet under
ZFC condition. Negative magnetization in CoCr2O4 nanoparticles was also reported by
Dutta et al.[101] and they attributed it to the presence of uncompensated spins at the
nanoparticle’s surface. However, Galivarapu et al. [27] did not observe the phenomenon
of negative magnetization in CoCr2O4 nanoparticles. Ohkoshi et al.[102] also observed
negative magnetization in molecular based ferrimagnets which was attributed to
magnetization reversal in ferromagnetic component at compensation temperature, which
describes the change of sign of net magnetization in spinel compound due to different
temperature dependent magnetization of A and B sites [103]. Choi et al. [104] studied the
CoCr2O4 single crystal and did not observe negative magnetization. In our case, the
negative magnetization is only observed at 50 Oe which may be due to uncompensated
spins at the nanoparticle’s surface and/or small trapped field in magnetometers. The
negative magnetization gets vanished at higher fields such as 500 and 1000 Oe due to
reorientation of the nanoparticles magnetization in applied field direction. The peak
associated with TC was found at 98 K at 50 Oe which is shifted towards higher temperature
with increasing applied field such as 500 and 1000 Oe [105]. The dip associated with the
TS was found at 27 K at 50 Oe belongs to a structural transition in which short range spiral
component of spins produced conical magnetic structure [26]. No changes were seen in TS
at 500 and 1000 Oe which was attributed to strong B-B interactions which act as a frozen

Chapter No.4 Structural, Dielectric and Magnetic Properties of Chromite Nanoparticles
44
spins or canted spins at surface [27]. A dip associated to lock-in state was observed at TL
= 13 K, describes a state at which period of spiral spins becomes commensurate to lattice
parameter [106, 107]. No changes were seen in TL at 500 and 1000 Oe which was attributed
to strong spin lattice coupling [108, 109].
Fig. 4.4: ZFC/FC curves of CoCr2O4 nanoparticles at 50, 500, and 1000 Oe.
Temperature dependent M-H loops have been taken to study the magnetic
transitions and surface effects on saturation magnetization (MS) and coercivity (HC) [110,
111]. Fig. 4.5 (a) reveals M-H loops of CoCr2O4 nanoparticles at temperature 5, 25, 50, 75
and 100 K under ± 5T maximum field and inset shows the HC region. M-H loops show
typical ferrimagnetic behaviour at 5, 25, 50 and 75 K but paramagnetic behaviour at 100 K
which is consistent with our ZFC/FC data. The loops are not saturated even at ± 5T due to
random surface spins of nanoparticles which need rather high field to get saturated [38].
Fig. 4.5 (b) exhibits the variation of MS with temperature from 100 - 5 K. The maximum
value of MS = 8 emu/g is found at 75 K. Below 75 K, the MS shows decreasing trend with
decreasing temperature down to 5 K. This abnormal trend deviates from Bloch’s law

Chapter No.4 Structural, Dielectric and Magnetic Properties of Chromite Nanoparticles
45
prediction for ferrimagnetic system [112] and is attributed to presence of stiffed/strong
conical spin spiral and lock-in states at low temperatures in these nanoparticles. Fig. 4.5
(c) reveals the HC variation with temperature. The HC shows an increasing trend with
decrease in temperature. This effect is due to decreasing thermal fluctuations. A sharp
increase in HC below 25 K is observed which is attributed to frozen disordered spins at
surface of these nanoparticles at low temperatures [113]. These disordered surface spins
give addition contribution to effective anisotropy as surface anisotropy. Due to surface
defects in nanoparticles, surface anisotropy is different from the core anisotropy of the
nanoparticles. The surface spins get blocked/frozen in random directions at low
temperatures and provide hinderers to the magnetization reversal of the core spins which
results in sharp increase in HC at low temperatures. The temperature dependence HC data
of CoCr2O4 nanoparticles can be fitted by using Kneller’s law [114],
𝐻𝑐(T) = 𝐻˳[1 − (𝑇
𝑇𝐶)𝛼] ………………………(4.4)
Here Ho is coercivity at 0 K and can be estimated by extrapolating the HC (T) curve, and
TC is the curie temperature of the nanoparticles. Value of 𝛼 is considered 0.5 for non-
interacting single domain and uniaxial ferromagnetic nanoparticles. The less value of 𝛼 in
Eq. 4.4 is named as modified Kneller’s law. The red dashed line in Fig. 4.5 (c) shows the
best fit of modified Kneller’s law to HC vs. T data. The TC and 𝛼 are set as fitting
parameters. The fit is reasonable in higher temperature regime (25 to 100 K) but deviates
below 25 K. The fitting parameters came out as TC = 100 K and modified 𝛼 = 0.3. The
decrease in 𝛼 = 0.3 is attributed to interparticle interactions, finite size effects and
disordered surface spins [115]. As obvious from the Fig. 4.5(c), HC data of CoCr2O4
nanoparticles deviated from thermal activation model (Kneller’s law) at low temperature.
In literature, a deviation of Kneller’s law fit at low temperature for cobalt ferrite (CoFe2O4)
nanoparticles is reported and attributed to frozen surface spins in their random states which
prevents further alignment of spins along applied field and saturates the HC at low
temperatures [113]. Thus in our case, sharp increase of HC is due to additional surface
anisotropy at low temperature.

Chapter No.4 Structural, Dielectric and Magnetic Properties of Chromite Nanoparticles
46

Chapter No.4 Structural, Dielectric and Magnetic Properties of Chromite Nanoparticles
47
Fig. 4.5: (a) M-H loops at 5, 25, 50, 75, and 100 K, (b) Variation of MS with temperature (solid line just
showed the trend) and (c) Variation of HC with temperature (black solid line) of CoCr2O4 nanoparticles fitted
with modified Kneller’s law (dashed red line).
Magnetic relaxation gives information about magnetic dynamics of the system.
Usually magnetic relaxation can be done in two different protocols such as under ZFC and
FC conditions. Both ZFC and FC protocols show slow magnetic relaxation for spin-glass
systems [116]. Here magnetic relaxation has been performed also in both protocols to
investigate the magnetic dynamics of the nanoparticles. Fig. 4.6 (a) and (b) with black solid
line show time dependence ZFC and FC magnetic relaxation curves at temperature T = 5
K under field H = 100 Oe for CoCr2O4 nanoparticles, respectively. It is evident that
CoCr2O4 nanoparticles exhibit slow spin relaxation in both ZFC and FC protocols at 5 K,
which signifies the presence of spin-glass behaviour at low temperatures. Widely used
stretched exponential law is used to confirm spin-glass behaviour [117],
𝑀(𝑡) = 𝑀2 + (𝑀1 − 𝑀2)exp [− ( 𝑡
𝜏 )𝛽]……..……………….(4.5)
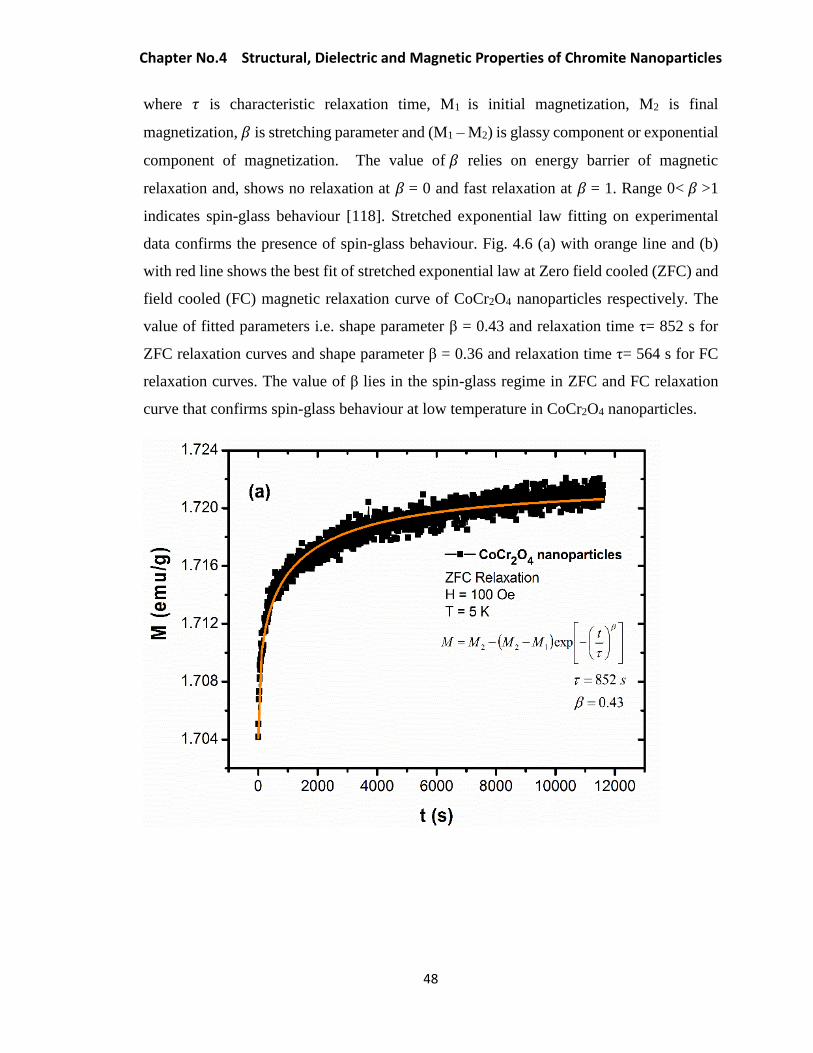
Chapter No.4 Structural, Dielectric and Magnetic Properties of Chromite Nanoparticles
48
where 𝜏 is characteristic relaxation time, M1 is initial magnetization, M2 is final
magnetization, 𝛽 is stretching parameter and (M1 – M2) is glassy component or exponential
component of magnetization. The value of 𝛽 relies on energy barrier of magnetic
relaxation and, shows no relaxation at 𝛽 = 0 and fast relaxation at 𝛽 = 1. Range 0< 𝛽 >1
indicates spin-glass behaviour [118]. Stretched exponential law fitting on experimental
data confirms the presence of spin-glass behaviour. Fig. 4.6 (a) with orange line and (b)
with red line shows the best fit of stretched exponential law at Zero field cooled (ZFC) and
field cooled (FC) magnetic relaxation curve of CoCr2O4 nanoparticles respectively. The
value of fitted parameters i.e. shape parameter β = 0.43 and relaxation time τ= 852 s for
ZFC relaxation curves and shape parameter β = 0.36 and relaxation time τ= 564 s for FC
relaxation curves. The value of β lies in the spin-glass regime in ZFC and FC relaxation
curve that confirms spin-glass behaviour at low temperature in CoCr2O4 nanoparticles.

Chapter No.4 Structural, Dielectric and Magnetic Properties of Chromite Nanoparticles
49
Fig. 4.6: (a) Zero field cooled (FC) relaxation curve of CoCr2O4 nanoparticles under field H = 100 Oe at
temperature T = 5 K, orange solid line shows the best fit of stretched exponential law, (b) Field cooled (FC)
relaxation curve of CoCr2O4 nanoparticles under field H = 100 Oe at temperature T = 5 K, red solid line
shows the best fit of stretched exponential law.
4.3 Results and discussion of effect of Mg doping on structural, magnetic,
and dielectric properties of CoCr2O4 nanoparticles
4.3.1 X-ray diffraction
The inspection of the structural and pure phase formation information of the
nanoparticles was obtained by the Rietveld analysis of X-ray diffraction data. The Rietveld
method has made it possible today to routinely make accurate refinements of structure from
powder diffraction data. In this study, the GSAS software suite and its graphical interface
EXPGUI was used for structure refinement. The Bragg peaks have been modelled with
pseudo-Voigt function and the background was modelled by a shifted Chebyschev function
with nine terms [119, 120]. Panels (a-g) in Fig. 4.7 show the Rietveld refinement fitting
results of XRD scans of CoCr2O4 nanoparticles with Mg concentration (x) = 0, 0.2, 0.4,

Chapter No.4 Structural, Dielectric and Magnetic Properties of Chromite Nanoparticles
50
0.5, 0.6, 0.8, and 1. Intensive and sharp peaks of XRD indicate their well crystallized
structure. Both MgCr2O4 and CoCr2O4 nanoparticles show simple cubic-type crystal
structure. All the samples are checked carefully for other impurity phases e.g., Cr2O3, MgO,
and Co3O4 etc. using quantitative Rietveld refinements technique and found no impurity
phases which signifies the formation of single phase Co1-xMgxCr2O4 nanoparticles. The fit
parameter (χ2) for refinement of the structural parameters is around 1.0, which implies that
the fitting is very good. Both MgCr2O4 and CoCr2O4 nanoparticles belong to normal spinel
crystal structure. In this crystal structure, Co2+ and Mg2+ cations reside at tetrahedral sites
and Cr3+ cation at octahedral sites. The diffraction peaks at 2θo = 18.4, 30.3, 35.7, 43.4,
57.5, and 63.1 indexed with (111), (220), (311), (400), (511) and (440) crystal planes which
shows cubic normal spinel crystal structure having space group Fd3m (227) for CoCr2O4
or MgCr2O4 nanoparticles. The peaks at (622) and (331) are observed in XRD scan of
MgCr2O4 nanoparticles, which get prominent with increasing Mg concentration [83].
Fig. 4.7 (h) reveals the variation of lattice parameter (a) as a function of Mg
concentration (x). The lattice parameter shows a non-monotonic behaviour with increasing
x. It first decreases from 8.3310 Ǻ to 8.3231 Ǻ for x = 0 to 0.6 and after that shows
anomalously increasing trend for x = 1 sample. This decreasing trend up to x = 0.6 can be
attributed to smaller ionic radius of Mg2+ (0.65 Å) ion as compared to Co2+ (0.72 Å) ion
[121] but the subsequent increase may be attributed to various uncontrolled parameters (pH
value, dopant’s lattice preference and accumulation to an interstitial sites etc.) in chemical
synthesis techniques like sol-gel method as employed in this study. A convenient method
for calculating average crystallite size of nanoparticles is the broadening of the XRD peaks.
The calculated average crystallite size of these nanoparticles after Rietveld refinement of
samples are shown in Fig. 4.7 (i) as a function of Mg concentration (x). The average
crystallite size shows an increasing trend up to x = 0.6 and then decreases down to x = 1.

Chapter No.4 Structural, Dielectric and Magnetic Properties of Chromite Nanoparticles
51
Fig. 4.7: (a-g) Rietveld refinement fitting results of the XRD of Co1-xMgxCr2O4 nanoparticles at 300 K,
showing the observed pattern (diamonds in red colour), reflection markers (vertical bars), the best fit Rietveld
profiles (black solid line) and difference plot (blue solid line at the bottom), (h) the variation of lattice constant
and (i) average crystallite size plotted as a function of Mg concentration (x).
4.3.2 Transmission electron microscopy
Transmission electron microscopy (TEM) is basic characterization technique to get
the information about morphology, agglomeration and crystal size. TEM images of
Co0.8Mg0.2Cr2O4 nanoparticles are shown in Fig. 4.8 (a) and (b) at 110 and 70 nm scales,

Chapter No.4 Structural, Dielectric and Magnetic Properties of Chromite Nanoparticles
52
respectively. The shape of quite well dispersed nanoparticles is spherical/non-spherical.
Some degree of agglomeration is also present in these nanoparticles due to their magnetic
nature. The estimated crystallite size as obtained by XRD results is consistent with the
TEM images.
Fig. 4.8: TEM images at (a) 110 nm and (b) 70 nm scales for Co0.2Mg0.8Cr2O4 nanoparticles.

Chapter No.4 Structural, Dielectric and Magnetic Properties of Chromite Nanoparticles
53
4.3.3 Raman spectroscopy
The Co1-xMgxCr2O4 series provide a good opportunity to examine by Raman
spectroscopy that how the vibrational modes of a normal spinel can be affected as only the
divalent cation such as magnetic Co is exchanged with a non-magnetic Mg, while the
octahedral sites are occupied by the trivalent Cr cations for all values of x in the series.
Near-IR laser with wavelength 785 nm is used for Raman spectroscopy. The atoms of
CoCr2O4 and MgCr2O4 occupy the 8a, 16d, and 32e (oxygen) Wyckoff sites. The modes
which predicted by factor group analysis for CoCr2O4 and MgCr2O4 are given as:
A1g(R) + Eg(R) + F1g + 3F2g(R) + 2A2u + 2Eu + 4F1u(IR) + F1u + 2F2u
where R and IR are notations for Raman and infrared active modes respectively, and the
remaining modes (F1g + 2A2u + 2Eu + F1u) are silent or acoustic modes. Selection rules
indicate that in an ideal normal spinel, only five modes (A1g + Eg + 3F2g) are active Raman
modes and 4F1u are four infrared active modes. Fig. 4.9 shows the Raman spectra of the
Co1-xMgxCr2O4 nanoparticles in the range of 100 to 1200 cm-1 at ambient conditions. The
different Raman modes for various Mg contents have been listed in Table 4.1. The F2g(3)
mode shows an overall linear increase in wavenumber with increasing Mg concentration.
However, the Eg, F2g(2) and F2g(1) modes exhibit nonlinear behaviour with a maximum
around 0.5 and 0.6. The largest overall change in Raman phonon frequencies is found in
the lower frequency modes, F2g (3), Eg, and F2g (2). The lowest frequency F2g(3) mode
significantly depends on the tetrahedral cation. It is one of the sharpest mode in case of
CoCr2O4 which is at 192 cm-1 [43, 86] but it’s very weak in MgCr2O4 [122]. Evidence of
this feature is supported by examining the entire Co1-xMgxCr2O4 series and noticing that
the lowest F2g(3) mode increases from 191.6 cm−1 at x = 0 to 203 cm−1 at x = 0.8. This
F2g(3) mode shift towards higher wavenumber with increasing Mg concentration and
attributed to smaller ionic radii and atomic weight of Mg2+ (0.65 Å and 24.312 amu) as
compared to Co2+ (0.72 Å and 58.933 amu), respectively. Therefore, from a simple mass
on a spring model, replacement of the Co atoms with the lighter Mg atoms should lead to
higher vibrational frequencies that confirm the successful doping of Mg at tetrahedral site.
Most literature suggests that the F2g(3) mode is a translational motion of the entire
tetrahedral AO4 unit within the lattice [123-125]. A very small change is observed in A1g

Chapter No.4 Structural, Dielectric and Magnetic Properties of Chromite Nanoparticles
54
mode, which mainly belongs to vibration at octahedral site. This supports the claim put
forth by Preudhomme et al. [126] that the higher and lower frequency vibrations depend
more strongly upon the octahedral and tetrahedral cations, respectively. Malezieux et al.
[127] shows an increase of 11% in the wavenumber of A1g mode by replacing the
octahedral cation in the MgCrxAl2−xO4 series. The slight change in A1g mode signify that
the vibration at octahedral site is not affected by Mg doping due to preference of Mg cations
at tetrahedral site. The F2g(2) mode, located in the 500-550 cm−1 range, has a slight
dependence on the tetrahedral cation [128]. This shift from the peak position in MgCr2O4,
again showing a greater dependence on the octahedral cation. The fifth mode was predicted
by the theoretical calculations at 597 cm-1 or 523 cm-1 [129]. Our results show that observed
F2g mode is very clear and broad band at 590-593 cm-1. In addition, two extra broad bands
are observed only for MgCr2O4 nanoparticles at 351 and 851 cm-1. The bands at 351 cm-1
and 851 cm-1 can be reasonably assigned to an overtone mode [122].
Fig. 4.9: Raman spectra of Co1-xMgxCr2O4 nanoparticles.

Chapter No.4 Structural, Dielectric and Magnetic Properties of Chromite Nanoparticles
55
Table 4.1: Vibrational bands in Raman spectra of Co1-xMgxCr2O4 nanoparticles.
x = 0 x = 0.2 x = 0.4 x = 0.5 x = 0.6 x = 0.8 x = 1 Vibration
mode Symmetry
191.6 190 190 191.25 192 203 203 F2g (3) δ (O – Co
/Mg - O)
447 447 449 478.5 459 473 430 Eg Vs (Cr - O),
Vs (Co/Mg - O)
509 516.25 526 522 535 527 528 F2g(2) V (Cr - O)
593 615 621 629 633 590 590 F2g(1) Vs (Cr - O)
677 667 667.7 672.6 677 672 671 A1g Vs (Cr - O)
4.3.4 Fourier transform infrared spectroscopy
Fourier transform infrared (FTIR) technique is used for getting information about
the vibrational modes of chemical bond present in the Co1-xMgxCr2O4 nanoparticles. Fig.
4.10 shows FTIR spectra of these nanoparticles, which confirms the spinel crystal structure
of these nanoparticles. There are three main absorption bands which observed in mid-
infrared (IR) spectra. The ranges of these bands are 688-680 cm−1 which belong to v1,
544–537 cm−1 which belong to the v2 and 455–446 cm−1 which belong to v3 vibrations.
The all vibrational bands in infrared spectra of Co1-xMgxCr2O4 nanoparticles are arranged
in Table 4.2. Torgashev et al. [97] governed primary bands v1 and v2 for CoCr2O4 by the
character and strength of the Cr–O bonds [98, 126, 130]. The band at 379 cm−1 of these
nanoparticles shifted towards higher wavenumber which contains the complex translation
of Cr+3 and Co+2 ions. Co1-xMgxCr2O4 nanoparticles have not so sharp IR bands spectra
which is probably due to the nano-sized particles. Shifting of bands of the spectra towards
higher wavenumber occurs until Mg content x = 0.6, which is consistent with our Raman
studies.

Chapter No.4 Structural, Dielectric and Magnetic Properties of Chromite Nanoparticles
56
Fig. 4.10: Fourier transform infrared spectroscopy of Co1-xMgxCr2O4 nanoparticles.
Table 4.2: Vibrational bands in infrared spectra of Co1-xMgxCr2O4 nanoparticles.
x = 0 x = 0.2 x = 0.4 x = 0.5 x = 0.6 x = 0.8 x = 1 Assignment Symmetry
446 450 451 452 453 452 430 F1u (V3) (Co-O) &
(Cr-O)
537 540 540 538 544 542 534 F1u (V2) V(Cr-O)
680 683 687 681 687 686 676 F1u (V1) Vas(Cr-O)

Chapter No.4 Structural, Dielectric and Magnetic Properties of Chromite Nanoparticles
57
4.3.5 Magnetic properties
Fig. 4.11 (a-e) shows the zero field cooled/field cooled (ZFC/FC) curves under 50
Oe applied field of selected samples. Paramagnetic (PM) behaviour for all concentration
of Mg is observed at higher temperatures. Co1-xMgxCr2O4 nanoparticles show initially
negative magnetization (in ZFC curve) just for with x = 0 concentration which persisted
till 80 K and x = 0.2 concentration which persisted till 20 K. This negative magnetization
is attributed to uncompensated spin which presents at grain boundaries [80, 104]. ZFC/FC
of CoCr2O4 nanoparticles revealed a transition from paramagnetic (PM) to ferrimagnetic
(FiM) state at Curie temperature (TC) = 97 K and a spiral state (TS) at 30 K, which is
consistent with literature [131, 132]. On the other hand, MgCr2O4 is a highly geometric
frustration AFM which contains Cr3+ ions at tetrahedron lattice. It reveals a complex
magnetic order below a Neel temperature (TN), which is evident by an antiferromagnetic
(AFM) transition at TN = 15 K for nanoparticles with x = 1. Nanoparticles with x = 0.2
show decrease in TC from 97 to 65 K and TS from 30 to 25 K. With further increase in Mg
concentration up to x = 0.4, nanoparticles show more decreasing magnetization and
depicted TC at 45 K and TS at 20 K. The shifting towards lower temperatures of TC and TS
with increasing x are attributed to change of low frustrated magnetic state to highly
frustrated magnetic sate. Ratclif et al. [133] reported that the highly frustrated magnetic
structure instead of general magnetization contains individual magnetized macroscopic
zones. It usually forms cluster of ions which are responsible for decreasing magnetization.
Anomalous behaviour of these nanoparticles is observed in ZFC/FC curves with x = 0.6. It
shows a change of magnetic state from FiM to Neel type antiferromagnetic (AFM) at low
temperature (TN = 15 K) in addition to high temperature FiM state (as evidence by open
ZFC/FC curves up to high temperatures).

Chapter No.4 Structural, Dielectric and Magnetic Properties of Chromite Nanoparticles
58
Fig. 4.11: (a-e) ZFC/FC curves of Co1-xMgxCr2O4 nanoparticles under field H = 50 Oe.

Chapter No.4 Structural, Dielectric and Magnetic Properties of Chromite Nanoparticles
59
The nanoparticles with x = 0.6 contain competing Co2+ and Mg2+ contents at this
composition but still we get clear AFM transition. The early dominance of AFM state (TN)
over FiM state (TC) in nanoparticles with x = 0.6 as compared to other lower x values is
attributed to large crystallite size as related to other values of x. Here at x = 0.6, crystallite
size effect is dominant than the competing FiM and AFM magnetic order. Therefore,
nanoparticles with x = 0.6 composition exhibit both FiM and AFM due to CoCr2O4 and
MgCr2O4, respectively. Melot et al. [134] studied Zn1-xCoxCr2O4 system and also observed
the switching magnetic phase from weak FiM structure to highly frustrated AFM at x =
0.6. For x > 0.6 (60% of Mg), Néel-type AFM is stabilized. Nanoparticles with x = 1
(MgCr2O4) show clear AFM structural transition at TN = 15 K as evidence in both ZFC and
FC curves, which is agreement with the literature [135].
Fig. 4.12: (a-d) FC curves of Co1-xMgxCr2O4 nanoparticles with applied field 5 T.
K
K

Chapter No.4 Structural, Dielectric and Magnetic Properties of Chromite Nanoparticles
60
Fig. 4.12 (a-d) shows high field FC curves of selected samples (x = 0, 0.2, 0.6 and
1). Magnetization of FC curve for all the samples has been increased with application of
field which is due to magnetic moments alignment in applied field direction. High field
does not effect on spiral state of x = 0, and 0.2 concentration at 30 K and 25 K, respectively
which is due to strong exchange interactions of JB-B as compared to JA-B [108]. Tsurkan et
al. [109] also observed the field independent spiral state at 27 K in CoCr2O4 with reasoning
strong spin lattice coupling. Ferrimagnetic transition at TC gets broadened, which is typical
FiM system’s behaviour under high field. Nanoparticles with x = 1 show AFM transition
below the TN under applied field of 5 T. Spiral state temperature is decreased only with
increasing Mg concentration and even strong 5 T applied field does not shows any effect
on it and just enhanced net magnetization of Co1-xMgxCr2O4 nanoparticles is observed.
4.3.6 Dielectric properties
The dielectric properties of materials depend on temperature, crystal structure,
cation substitution, density, grain size, frequency of applied field etc. [136]. Fig. 4.13 (a)
and (b) reveal real (Ɛ′) and imaginary (Ɛ′′) part of dielectric constant of Co1-xMgxCr2O4
nanoparticles where x = 0, 0.2, 0.4, 0.5, 0.6, 0.8 and 1, respectively. Dielectric response of
these nanoparticles is measured at room temperature under 20 Hz - 3 M Hz frequency
range. In range of low frequency region, Ɛ′ and Ɛ′′ reveal maximum value and gradually
decrease to low value increasing frequency of applied field. This behaviour in chromite
can be justified by polarization effect. There are basically four types of polarization:
dipolar, ionic, electronic and interfacial polarization depending upon frequency of external
field. Dipolar and interfacial polarizations are dominant in frequency range of 20 Hz to 3
M Hz and contribute in our dielectric properties of chromites nanoparticles. In chromite
spinel structure, the polarization mechanism is explained on basis of electrical conduction
process. The electrical conduction process in spinel structure is explained by Heikes and
Johnston with help of electron hopping model which explain transferring of electrons
within adjacent sites in spinel structures [137]. The applied field displaces electrons and
these displacements in chromite nanoparticles provide information about polarization. The
Ɛ′ and Ɛ′′ of dielectric constant are calculated by the Eqs. 3.2 and 3.3, respectively. The
observed behaviour of Ɛ′ and Ɛ′′ are explained using Maxwell Wagner model. This model

Chapter No.4 Structural, Dielectric and Magnetic Properties of Chromite Nanoparticles
61
describes that dielectric material is composed of well conducting grains and their poorly
conducting grain boundaries. Electrons pile up at grain boundaries at low frequency due
highly resistive nature of grain boundaries which cause to produce polarization [136].
Therefore, dielectric constant show maximum value at low frequency. The real and
imaginary part show decreasing trend as frequency increases. This effect is attributed to
space charge carriers which are lagging to frequency and do not role play in accumulate
polarization. Hence, dielectric constant show decreasing trend gradually with continuous
increase in frequency [138]. Ɛ′ and Ɛ′′ values at lower frequencies show non-monotonous
behaviour as Mg concentration increases and peaks at x = 0.6 as shown in inset of Fig. 4.13
(a) and (b). This effect is attributed to more formation of resistive grain boundaries with
optimum doping of Mg which shows more polarizability and results in a higher value of
dielectric constant [139].

Chapter No.4 Structural, Dielectric and Magnetic Properties of Chromite Nanoparticles
62
Fig. 4.13: Variation in dielectric constants (a) real and (b) imaginary part with frequency for Co1-
xMgxCr2O4 nanoparticles.
Tangent loss or dielectric loss factor (tan δ) is ratio of dielectric constants
(imaginary to real part). Fig. 4.14 (a) shows the variation of tan δ as function of frequency
for Co1-xMgxCr2O4 nanoparticles. At lower frequency, tangent loss shows maximum value
where the storing charge ability is minimum. Tan δ also exhibits non-monotonous
behaviour with Mg doping and maximum is found at x = 0.6 as shown in inset of Fig. 4.14
(a). This variation in frequency dependent tangent loss is also described by using Maxwell
Wagner model [140-142]. Ac conductivity (σac) of chromite nanoparticles was calculated
by following formula,
𝜎𝑎𝑐 = ℇ′ ℰ˳ 𝜔 𝑡𝑎𝑛 𝛿………………….……………. ..(4.6)
where ℇ′represents dielectric constant (real component), ℰ˳ represents permittivity of free
space, tan δ is tangent loss and ω is angular frequency. Fig. 4.14 (b) exhibits σac variation
for Co1-xMgxCr2O4 nanoparticles as function of frequency. σac shows nearly frequency
independent response in low frequency region while increases sharply in high frequency
region. The variation in frequency dependent σac can be also explained using Koop’s

Chapter No.4 Structural, Dielectric and Magnetic Properties of Chromite Nanoparticles
63
theory. This theory suggested that dielectric medium composes of multilayer capacitor
containing grains along with their grain boundaries [143]. The grain boundaries role plays
actively in conduction mechanism at low frequency. At this stage, grain boundaries provide
obstacle due to resistive nature and hinders the electrons which results decrease in mobility
of space charge carriers. Hence, chromite nanoparticles show minimum value of
conductivity at lower frequencies due to decrease in electron hopping mechanism. At
higher frequencies, only grains role plays actively in conduction mechanism. The nature of
grains is less resistive as compared to grains boundaries. As a result, ac conductivity reveals
increasing trend sharply at higher frequencies due to increase in electron hopping
mechanism. Maximum σac is observed at x = 0.6 Mg concentration as shown in Fig. 4.14
(b) inset which is due to large crystallite size.

Chapter No.4 Structural, Dielectric and Magnetic Properties of Chromite Nanoparticles
64
Fig. 4.14: (a) Tangent loss and (b) ac conductivity of Co1-xMgxCr2O4 nanoparticles.
From this dielectric study, it is concluded that the dielectric properties are enhanced
for nanoparticles with x = 0.6 Mg concentration. This effect is not due to Mg concentration,
but it is related to the average crystallite size (as the variation of dielectric parameters with
x nearly follow the average crystallite size trend with x as evident in Fig. 4.7 (i)). Therefore,
the dielectric properties of these Mg doped CoCr2O4 nanoparticles are more effected by the
average crystallite size than Mg concentration.
The above study demonstrate that the Mg doping and average crystallite size on
structural, magnetic and dielectric properties of Co1-xMgxCr2O4 nanoparticles have
significant effects . The Mg concentration significantly affects the structural and magnetic
properties of these nanoparticles, however average crystallite size also competes with it.
On the other hand, dielectric properties are mainly determined by average crystallite size
than the Mg concentration.

Chapter No. 4 Structural, Dielectric and Magnetic Properties of Chromite Nanoparticles
65
4.4 Results and discussion of effect of SiO2 coating on structural and
magnetic properties of CoCr2O4 nanoparticles
4.4.1 X-ray diffraction
XRD is a powerful technique to determine the crystal structure of the material. Fig.
4.15 (a) shows the XRD diffraction patterns of CoCr2O4/(SiO2)y nanoparticles with
different SiO2 concentration (y) = 0, 45 and 80 wt.%. The data was analysed by using
PANalytical X´pert High Score software, which was in good agreement with the standard
pattern JCPDS No. 22-1084. All the diffraction peaks are well indexed and correspond to
single phase spinel CoCr2O4 structure. No other impurity phases are found. The Debye-
Scherrer’s formula using Eq. 4.3 is used to calculate average crystallite size from the most
intense diffraction peak (311) for all the samples. Fig. 4.15 (b) shows the variation of
average crystalline size with increasing SiO2 concentration. The average crystallite size of
samples with y = 0, 45, and 80 wt.% come out to be 28, 22, and 19 nm, respectively. The
crystallite size reduces with increasing the SiO2 concentration. The decreasing crystallite
size with increasing SiO2 concentration is due to the formation of large number of
nucleation sites during synthesis process which restrict the further growth of nanoparticles
[144]. The lattice parameter “a” was calculated by using Bragg's equation which came out
to be 8.325 Å, 8.314 Å, 8.299 Å for samples with y = 0, 45 and 80 wt.%, respectively. Fig.
4.15 (c) demonstrate the variation of lattice parameter (a) with SiO2 concentration, which
proves the lattice contraction of nanoparticles with increasing SiO2 concentration or
decreasing crystallite size.

Chapter No. 4 Structural, Dielectric and Magnetic Properties of Chromite Nanoparticles
66

Chapter No. 4 Structural, Dielectric and Magnetic Properties of Chromite Nanoparticles
67
Fig. 4.15: (a) XRD patterns of CoCr2O4/(SiO2)y nanoparticles, (b) variation of average crystallite size and
(c) lattice parameter with SiO2 concentration. Dashed lines just show the trends.
4.4.2 Transmission electron microscopy
Transmission electron microscopy (TEM) was used to analyse the shape and size
of nanoparticles. Fig. 4.16 shows the TEM image of uncoated CoCr2O4/(SiO2)y
nanoparticles (y = 0) at 50 nm scale. It is observed that the nanoparticles are non-spherical
and quite well dispersed. However, nanoparticles show some degree of agglomeration due
to magnetic interactions. The nanoparticles look larger than their average crystallite size as
obtained by XRD analysis.

Chapter No. 4 Structural, Dielectric and Magnetic Properties of Chromite Nanoparticles
68
Fig. 4.16: TEM image of CoCr2O4/(SiO2)y, y = 0 % nanoparticles at 50 nm scale.
4.4.3 Magnetic properties
Fig. 4.17 shows the zero field cooled (ZFC) and field cooled (FC) curves of
CoCr2O4/(SiO2)y nanoparticles with y = 0, 45 and 80 wt.% under magnetic field of 50 Oe.
The ZFC curve of uncoated nanoparticles exhibits negative magnetization which is very
similar to the data obtained by Lawes et al. [80] and Kahn et al. [145] for polycrystalline
material. The ZFC negative magnetization decreases for 45 and 80% SiO2 coated
nanoparticles. In nanoparticles, broken surface bonds alter exchange interaction and form
different surface spins structure as compared to bulk material. The negative magnetization
also refers to the existence of uncompensated spin at the grain boundaries. Molecular based
ferrimagnets also exhibits negative magnetization due to direction reversal of ferrimagnet
components at a certain temperature known as compensation temperature [102].

Chapter No. 4 Structural, Dielectric and Magnetic Properties of Chromite Nanoparticles
69

Chapter No. 4 Structural, Dielectric and Magnetic Properties of Chromite Nanoparticles
70
Fig. 4.17: (a) ZFC and FC of CoCr2O4/(SiO2)y nanoparticles (b) variation in TF, TS and TC value with SiO2
concentration. Dashed lines just show the trends.
Panel 4.17 (b) shows the variation of TF, TS and TC value with increasing
SiO2 concentration or decreasing crystallite size. The transition temperatures were obtained
from FC curves. The uncoated (y = 0%) nanoparticles exhibit a transition from
paramagnetic to ferrimagnetic and conical spin state at TC = 101 K and TS = 27 K,
respectively, which are very near to TC = 99 K and TS = 26 K values as obtained by Plocek
et al. [146]. The CoCr2O4 nanoparticles with y = 45% SiO2 coating concentration have TC

Chapter No. 4 Structural, Dielectric and Magnetic Properties of Chromite Nanoparticles
71
= 97 K and TS at 25.2 K [107]. The CoCr2O4 nanoparticles with y = 80% SiO2 coating
concentration have TC = 95 K and TS at 20 K. The TC and TS show decreasing trend with
increasing SiO2 concentration. The TS and TF transitions are rather weak in coated
nanoparticles which is due to the fact that SiO2 highly disturbs the surface of nanoparticles
and may create distortions on the surface. The shift of TC and TS towards lower temperature
with increasing SiO2 concentration can be attributed to decreasing crystallite size with SiO2
concentration. In addition to these transitions, a lock-in transition (TF) which usually occurs
in pure CoCr2O4 at 14 K as observed by Choi et al. [104] and Yamasaki et al. [22], is also
observed in our samples but at TF = 12 K (for uncoated nanoparticles). The TF value slightly
decreases with decreasing crystallite size which is also due to finite size effects [106].
Fig. 4.18 (a) shows the M-H loops of CoCr2O4/(SiO2)y nanoparticles with y
= 0, 45 and 80 wt.% under maximum applied field of ± 5T at T = 25 K. M-H loops show
typical ferrimagnetic behaviour for all the samples. The loops are not saturated even at ± 5
T which is typical for nanoparticles due to disordered surface spins. The non-saturation
behaviour of the loops increases with decreasing crystallite size or increasing SiO2
concentration. Fig. 4.18 (b) shows the variation of saturation magnetization (MS) and
coercivity (HC) with increasing SiO2 concentration. We ascribe variation of MS to the non-
magnetic amorphous behaviour of SiO2 which enhances surface spins disorder by creating
a surrounding layer around nanoparticle and leads to decrease in MS value. The surface to
volume ratio becomes also high with the decrease in particle size [147, 148]. It is also
observed that the MS value of bare (y = 0) nanoparticles is greater than coated nanoparticles
which is due to their large average crystallite size of uncoated nanoparticles as compared
to coated nanoparticles [149]. Similar phenomenon was also reported for NiFe2O4 and
CoFe2O4 ferrite nanoparticles [150, 151]. The variation of coercivity (HC) with SiO2
concentration depends upon the anisotropy of nanoparticles. The coercivity shows
maximum value for nanoparticles with y = 45 %. The HC value is related with the
magnetization reversal of the nanoparticles which may be affected by surrounding SiO2
coating material. This anomalous behaviour was also reported by Georgea et al. [152].

Chapter No. 4 Structural, Dielectric and Magnetic Properties of Chromite Nanoparticles
72
Fig. 4.18: (a) M-H loops of CoCr2O4/(SiO2)y nanoparticles at T = 25 K and (b) variation of MS and HC with
SiO2 concentration. Dashed lines just show the trends.

Chapter No. 4 Structural, Dielectric and Magnetic Properties of Chromite Nanoparticles
73
Fig. 4.19 shows the in-phase part of AC susceptibility (ZFC) as a function of
temperature for CoCr2O4/(SiO2)y nanoparticles with y = 0, 45 and 80 wt.% under applied
AC field of amplitude (HAC) = 5 Oe and frequency (f) = 1 Hz.
Fig. 4.19: ZFC AC susceptibility (in-phase part) of CoCr2O4/(SiO2) nanoparticles.
A sharp peak in χ' is associated with the ferrimagnetic transition temperature at 94 K for
uncoated CoCr2O4 nanoparticles (y = 0%) which is nearly the same as observed by Lawes
et al. [80] and Mantlikova et al. [153]. However, Zakutna et al. [154] and Rath et al. [155]
reported lower T values in the vicinity of 76 K. It can be seen clearly that transition peak
decreases with increasing SiO2 concentration and gets broadened and these findings are
consistent with the dc ZFC/FC magnetization curves. The obvious reason for decreasing
transition peak temperature and its broadening is the presence of amorphous SiO2 which
enhances surface spins disorder and decreases crystallite size. Anomalies associated with
TS and TF are also observed in ZFC AC susceptibility but very weak due to very low applied
AC field.
Chapter No. 4 Structural, Dielectric and Magnetic Properties of Chromite Nanoparticles
74
4.5 Conclusion
Magnetic response of CoCr2O4 nanoparticles at low temperatures have been studied
in detail. XRD and FTIR spectroscopy confirm the spinel structure of CoCr2O4
nanoparticles. ZFC/FC curves revealed a PM to FiM transition at TC =97-101 K with a
pronounced spin spiral state TS at 27 K and lock-in state TL at 13 K. The TC is shifted
towards higher temperature with applying higher fields while TS and TL remain unaffected.
A negative magnetization is observed in ZFC curve at 50 Oe which is suppressed at higher
fields. An abnormal decreasing MS trend with decreasing temperature is observed and
attributed to presence of disordered stiffed/strong conical spin spiral and lock in states at
low temperatures. Modified Kneller’s law for HC showed a good fit but deviated from
experimental data at 5 K due to sharp increase in HC at low temperatures which is ascribed
to increased surface anisotropy at low temperatures. These nanoparticles showed also slow
spin relaxation at 5 K in ZFC and FC curves, which signifies the presence of spin-glass
behaviour at low temperatures. XRD of Mg doped CoCr2O4 nanoparticles showed no
impurity phases which confirmed single phase Co1-xMgxCr2O4 nanoparticles. The average
crystallite size exhibited a non-monotonic behaviour with peak value of 109 nm for
nanoparticles with Mg concentration x = 0.6. Both TC and TS decrease as Mg concentration
increases and finally system undergoes a frustrated AFM transition at TN for nanoparticles
with Mg concentration x = 1 (pure MgCr2O4 phase). The dielectric measurements of these
nanoparticles were improved with Mg concentration x = 0.6 and is attributed to their larger
average crystallite size. The SiO2 coating on CoCr2O4 nanoparticles reveals decreasing
trend of average crystallite size and lattice parameter. All magnetic transitions tend to lower
temperatures as SiO2 coating concentration increases. This was due to finite size effects
caused by SiO2 coating. M-H loops reveal decreasing trend in MS value as coating
concentration of SiO2 increases due to small size of coated nanoparticles. The ZFC ac
susceptibility with temperature also indicated that TC deceases from 94 K to 85 K as coating
concentration of SiO2 increases.

Chapter No. 5 Structural, Dielectric and Magnetic Properties of Ferrite Nanoparticles
75
Chapter No 5
Structural, Dielectric and Magnetic Properties of Ferrite
Nanoparticles
5.1 Introduction
In ferrite nanoparticles, surface effects arises due to high surface to volume ratio
which can directly influenced on the magnetization reversal and relaxation of magnetic
nanoparticles [156]. Spin disorder, surface anisotropy and weak exchange coupling near
and at the surface can modify the physical properties of ferrite nanoparticles. The enhanced
surface anisotropy, high field irreversibility and high coercivity, non-saturation
magnetization at low temperature provide clear evidence of spin glass behaviour at low
temperature [38, 157-160]. Among such ferrite nanoparticles, Nickel ferrite (NiFe2O4) and
maghemite (γ-Fe2O3) nanoparticles are very promising due to practical applications in
different fields such as data storage, biomedical therapy and diagnostic, ferro-fluids, and
transformers cores.
γ-Fe2O3 nanoparticles are ferrimagnetic in nature and exhibit spinel structure along
with cation vacancies present at octahedral (B) sites. These vacancies along with competing
surface interactions can lead to surface spins disorder and spin glass behavior in γ-Fe2O3
nanoparticles [161-163]. Fiorani et al. [164] studied the dynamical and static magnetic
response of γ-Fe2O3 nanoparticles which are governed by surface effects and interparticle
interactions. These effects also decrease overall magnetization of nanoparticles as
compared to bulk. Herlitschke et al. [165] observed 44% less magnetization in γ-Fe2O3
nanospheres and 58% less magnetization in γ-Fe2O3 nanocubes than bulk, which is due to
spin disorder as analysed by using nuclear resonant scattering and polarized neutrons.
γ-Fe2O3 nanoparticles are highly reactive which leads to non-functionalized surface
and easily losses their magnetic properties. Therefore, proper surface coating or developing
effective protection is used to minimize surface energy and to prepare stable nanoparticles
for potential applications [116]. Coating not only stabilizes nanoparticles but can also lead
to surface functionalization. Different approaches for coating have been used so far which

Chapter No. 5 Structural, Dielectric and Magnetic Properties of Ferrite Nanoparticles
76
include coating with polymer, biomolecules, surfactants, magnetic and non-magnetic etc.
Prado et al. [166] reported an improvement in the magnetic anisotropy of γ-Fe2O3
nanoparticles via surface coordination of molecular complexes. Azhdarzadeh et al. [167]
prepared gold coated iron oxide nanoparticles which are useful for photo thermal therapy
of colan cancer and magnetic resonance imaging.
In this thesis, we prepared core-shell Cr2O3 coated γ-Fe2O3 nanoparticles are
prepared by microwave plasma technique. Selection of antiferromagnetic Cr2O3 coating is
due to high hardness, mechanical strength, chemical inertness and low friction coefficient
[168]. These properties make Cr2O3 coating very useful in the field of corrosion protection,
wear resistance and surface modification [169]. Sahan et al. [170] observed surface
modification of spinel LiMn2O4 by Cr2O3 coating and reported enhanced electrochemical
properties for potential application. This study showed that Cr2O3 coating can be used for
surface modification. Therefore, it is interesting to study the effects of Cr2O3 surface
coating on magnetic response of γ-Fe2O3 nanoparticles.
Doping in ferrite nanoparticles have very interesting role in tuning the physical
properties and structure stability of ferrite nanoparticles. Doping at B site may cause the
cationic distribution between two lattice sites of spinel ferrites nanoparticles which can
alter the physical properties of these nanoparticles [171]. Doping of antiferromagnetic Cr+3
at B site in NiFe2O4 nanoparticles can control structure stability which can enhance
physical properties of NiFe2O4 nanoparticles. So, the aim of this interesting research is to
better understand the effect of Cr doping on structural, magnetic and dielectric properties
of NiFe2O4 nanoparticles. We have synthesized these nanoparticles by sol-gel method.
In this chapter, I have emphasized on the surface effects in Cr2O3 coated γ-Fe2O3
nanoparticles and effect of Cr doping at B site on structural, magnetic and dielectric
properties of NiFe2O4 nanoparticles.

Chapter No. 5 Structural, Dielectric and Magnetic Properties of Ferrite Nanoparticles
77
5.2 Results and discussion of effect of surface spins on magnetization of
Cr2O3 coated γ-Fe2O3 nanoparticles
5.2.1 X-ray diffraction
Powder X-ray diffraction (XRD) is a unique characterization technique for getting
structural information of samples. Fig. 5.1 reveals the XRD scans of Cr2O3 coated γ-Fe2O3
nanoparticles. Broadened peaks in this XRD exhibit the well crystalline nature of γ-Fe2O3
nanoparticles. The indexed peaks (220), (311), (400), (422), (511) and (440) at angles 2θ
= 30˚, 36˚, 43˚, 54˚, 57˚ and 63˚, respectively verify the inverse spinel structure of γ-Fe2O3.
While, the indexed peaks (012), (104), (110), (113), (024), (116), (214) and (1010) at
angles 2θ = 24˚, 33˚, 36˚, 41˚, 50˚, 54˚, 63˚ and 72˚, respectively correspond to the Cr2O3
phase [172, 173]. High intensity diffracted peaks in XRD scans are for aluminium substrate.
The absence of impurity peaks in XRD scan confirms that the synthesized materials have
very high purity.
Fig. 5.1: X-ray diffraction patterns for Cr2O3 coated γ-Fe2O3 nanoparticles.

Chapter No. 5 Structural, Dielectric and Magnetic Properties of Ferrite Nanoparticles
78
The average crystallite size of these nanoparticles is also calculated with help of
Debye-Scherrer’s formula [174] using Eq. 4.3. The average crystallite size of γ-Fe2O3 core-
nanoparticles is 13 nm. The intensive peaks of Cr2O3 in XRD indicate the higher
concentration of Cr2O3 phase in the sample.
5.2.2 Transmission electron microscopy
Transmission electron microscopy (TEM) is used for getting information about
nanoparticle’s morphology. Fig. 5.2 (a) shows a TEM image of the nanoparticles at 10 nm
scale. Most of the nanoparticles are spherical with moderate degree of agglomeration [175].
Their size ranges from 5 to 20 nm. A core-shell structure is hardly to detect in these
nanoparticles, due to the weak difference in mass contrast of the phases Fe2O3 and Cr2O3,
respectively. Fig. 5.2 (b) shows a STEM-image. Also here, the contrast difference of the
two phases of interest is very weak. The red marked area was analyzed by STEM-EELS,
and the results are shown in the insets. In detail, the insets show the color-coded
composition map (red: Fe, green: Cr), the detailed STEM image, and the STEM-EELS
images from the Cr-L edge, the Fe-L edge. Fig. 5.2 (c) shows the corresponding STEM-
EELS spectra from the core-region and the shell-region, marked by arrows. This analysis
demonstrates that core-shell nanoparticles are present. Nevertheless, the presence of bare
Fe2O3 and bare Cr2O3 nanoparticles cannot be excluded.

Chapter No. 5 Structural, Dielectric and Magnetic Properties of Ferrite Nanoparticles
79
Fig. 5.2: (a) TEM image at 10 nm scale (b) STEM-image at 50 nm scale (inset shows the results of red
marked area by STEM-EELS) of Cr2O3 coated γ-Fe2O3 nanoparticles and (c) STEM-EELS spectra of γ-Fe2O3
core (red color)-Cr2O3 shell (green color) nanoparticles.
5.2.3 Magnetic properties
Zero-field cooled and field cooled (ZFC/FC) protocols were taken to study the
magnetization with temperature of these nanoparticles. Fig. 5.3 shows experimental (solid
triangles) and simulated (open squares) ZFC/FC dc susceptibility curves of Cr2O3 coated
γ-Fe2O3 nanoparticles at 50 Oe. The maximum magnetization is observed at 75 K in ZFC
experimental curve. This temperature is named as the average blocking temperature (TB).
Just below the TB, experimental FC curve turns out to be flat because magnetic moments
of nanoparticles get frozen and could not aligned themselves in a direction of applied field

Chapter No. 5 Structural, Dielectric and Magnetic Properties of Ferrite Nanoparticles
80
[116] which is clue for presence of interparticle interactions or surface disorder in γ-Fe2O3
nanoparticles [159].
To get information of structural parameter and intrinsic magnetic properties of
nanoparticles, ZFC/FC curves are simulated according to the model of non-interacting
particles. For simulation, we have used Neel-Brown expression for relaxation time ( )
assuming uniaxial anisotropy [176, 177]. The temperature at which = m for a system of
particles with average volume V, is known as blocking temperature TB. Log-normal
distribution function for TB is extracted from log-normal distribution function for particle
size and given as,
B
T
B
B
BT
BB dTT
T
TdTTf
BB
2
2
2 2
ln
exp1
2
1)(
(5.1)
Since, average TB is related to average volume V and given as,
V
k
Tm
B
eff
B
K
0
ln
(5.2)
Where Keff is effective anisotropic constant and is atomic precession time. The ZFC dc
susceptibility according to the model of non-interacting particles consists of two
contributions (i) and (ii) given as [178],
)()(
00
2
)()(ln3
)(
ii
TB
TTB
BB
i
TTB
TB
BBBms
ZFC dTTfdTTfT
T
K
MT
(5.3)
Where contribution (i) is due to superparamagnetic particles and contribution (ii) is for
blocked particles. FC dc susceptibility is given below using the same model [178],

Chapter No. 5 Structural, Dielectric and Magnetic Properties of Ferrite Nanoparticles
81
)()(
00
2
)()(1
ln3
)(
ii
TB
TTB
BB
i
TTB
TB
BBBms
FC dTTfdTTfTTK
MT
(5.4)
Using Eq. 5.3 and 5.4, we have fitted ZFC/FC susceptibility curve with Keff = 1.4 x 10⁵
erg/cc. Fitted Keff value is greater than bulk γ-Fe2O3 (4.7 x 10⁴ erg/cc) which is due to
additional surface anisotropy offered by frozen disordered surface spins [164]. The Keff of
Cr2O3 coated γ-Fe2O3 nanoparticles is less than bare nanoparticles of γ-Fe2O3 (9.8 x 10⁵
erg/cc) [49] which is due to relatively big particle size of coated nanoparticles. Moreover,
big particle size with antiferromagnetic surface layer may produce small value of interface
anisotropy between core-shell nanoparticles which results decrease in fitted Keff. Simulated
curves also infer about moderate particle size distribution (σD = 0.23). A difference occurs
between experimental FC and simulated curves at low temperatures. This is because real
nanoparticles system contains interparticle interactions and model considers only non-
interacting nanoparticles. FC simulated curve does not flat immediately just below the TB
and flattens at very low temperature.
Fig. 5.3: ZFC/FC experimental (blue solid triangles) and simulated (red open squares) dc susceptibility
curves of Cr2O3 coated γ-Fe2O3 nanoparticles under 50 Oe.

Chapter No. 5 Structural, Dielectric and Magnetic Properties of Ferrite Nanoparticles
82
Fig. 5.4 (a) shows M-H loop at temperature 5 K for Cr2O3 coated γ-Fe2O3
nanoparticles whereas inset reveals expanded region of coercivity under field of ± 5 T.
Measured value of HC and MS is 214 Oe and 19.7 emu/g, respectively which are nearly
equal to reported value of HC and MS by Tzitzios et al. [179] of same size γ-Fe2O3
nanoparticles embedded in a laponite synthesized via one step chemical route. The
measured MS has lower value than bulk γ-Fe2O3 (MS = 80 emu/g) which is attributed to
dangling and broken bonds at the surface. At nano scale, the dangling and broken bonds
produce less coordination neighbours at surface which are responsible for decrease in
exchange interactions and as a result, MS decreases [164]. The MS of Cr2O3 coated γ-Fe2O3
nanoparticles is also less than bare γ-Fe2O3 nanoparticles MS = 51 emu/g at same
temperature [49]. The lower value of MS of Cr2O3 coated nanoparticles is due to presence
of antiferromagnetic Cr2O3. The observed value of HC is low due to soft magnetic nature
of γ-Fe2O3 nanoparticles [180]. The HC of Cr2O3 coated γ-Fe2O3 nanoparticles is less than
bare nanoparticles of γ-Fe2O3 (HC = 546 Oe) [49]. The possible reason is bigger particle
size of coated nanoparticles. The size of γ-Fe2O3 core-nanoparticles (13 nm) produced with
high feeding rate and with additional high concentration of an antiferromagnetic Cr2O3
shell is larger than uncoated nanoparticles size (6 nm). The larger coated nanoparticles have
weak interface anisotropy between γ-Fe2O3 ferrimagnetic core and Cr2O3
antiferromagnetic shell which refers to lower effective anisotropy of coated nanoparticles
than bare nanoparticles. Thus, antiferromagnetic Cr2O3 shell and interfacial interactions
play critical role in controlling the magnetization of γ-Fe2O3 nanoparticles. Size dependent
HC is remarkable and Trohidou et al. [181] observed the same phenomena in Monte Carlo
studies of ferromagnetic core and antiferromagnetic shell nanocomposites.
We have also studied the temperature dependent saturation magnetization and
coercivity for our nanoparticles. I have taken partial M-H loops under field of ± 5 T at
temperatures; 5 K, 25 K, 50 K, 100 K, 150 K and 250 K for these nanoparticles. Loops are
not saturated even at high field of 5 T due to random surface spins. Fig. 5.4(b) exhibits MS
variation with temperature (solid spheres) and fitting of Bloch’s law (red dashed line).
Increasing trend of MS with decreasing temperature is due to decreasing thermal
fluctuations [182] which is according to prediction of Bloch’s law. The Bloch’s law
equation is,

Chapter No. 5 Structural, Dielectric and Magnetic Properties of Ferrite Nanoparticles
83
b
SS BTMTM 10 (5.5)
Where MS (T) is measured magnetization as function of temperature, MS (0) is extrapolated
magnetization at 0 K, b and B are Bloch’s exponent and Bloch’s constant respectively
which are used as fitting parameters. The value of B strongly depends on structure of
materials and closely relates to exchange integral J as (B ̴ 1/J) [183]. Bloch’s law is valid
for bulk ferromagnetic materials with b = 3/2 but for nanomaterials, the value of b changes
due to surface spins disorder, finite size effects and inter-particles interactions [184]. We
have fitted Bloch’s law on our experimental MS data, which provides the value of b = 1.10
and B = 3.523 x 10⁻⁴ K-b. Higher value of B in these nanoparticles than bulk γ-Fe2O3 is due
to decrease of particle size which results in weaker exchange coupling J (B ̴ 1/J) due to
surface disorder. Lower value of b is due to no spin wave excitation at low temperatures in
presence of large energy band gap at nano-scale due to finite size effects [185].
Fig. 5.4 (c) shows the variation of coercivity (HC) (solid spheres) with temperature
for these nanoparticles. The observed HC reveals increasing trend with decreasing
temperature which is due to decreasing thermal fluctuations and increased effective
anisotropy at low temperatures [180]. HC reveals sharp increase below 25 K due to
disordered surface spins which got frozen at lower temperatures and contributes to effective
anisotropy in the form of surface anisotropy [159]. Molina et al. [186] also reported the
sharp increase in HC in (Fe0.69Co0.31)B0.4 nanoparticles which was due to increase in
effective anisotropy. The temperature dependent HC data can be fitted using Kneller’s law
as given in Eq. 5.6,
B
CCT
THTH 10 (5.6)
Where HC (0), TB and α are extrapolated coercivity at 0 K, average blocking temperature
and constant having value 0.5 for bulk ferromagnetic material, respectively. Values of TB
and α were got from the best fit. Fig. 5 shows Kneller’s law fit (red dashed line) on
experimental HC data for the Cr2O3 coated γ-Fe2O3 nanoparticles with fitting parameters
TB = 120 K and α = 0.13. Lower value of α for these nanoparticles is due to finite size
effects, interparticle interactions and surface disorder [115]. The fit is reasonable at high

Chapter No. 5 Structural, Dielectric and Magnetic Properties of Ferrite Nanoparticles
84
temperatures but deviates at low temperatures due to sharp increase in HC (contribution of
surface anisotropy below 25 K) which is not considered in Kneller’s law. HC vanishes
above 50 K because of superparamagnetic de-blocking nature and it is consistent with
experimental and simulation ZFC/FC results [187]. Above TB, the huge-core spin thermally
de-block and therefore HC vanishes due to onset of superparamagnetic behaviour of the
nanoparticles [188].

Chapter No. 5 Structural, Dielectric and Magnetic Properties of Ferrite Nanoparticles
85
Fig. 5.4: (a) M-H loop at 5 K, (b) MS at different temperatures (Bloch’s law fitting is in form of red
dashed line) and (c) HC at different temperatures (Kneller’s law fitting is in form of red dashed line) for
Cr2O3 coated maghemite nanoparticles.

Chapter No. 5 Structural, Dielectric and Magnetic Properties of Ferrite Nanoparticles
86
DC field magnetic measurements of these coated nanoparticles indicate the
presence of surface spins disorder at low temperature and it is considered as fingerprint for
surface spin glass. A system in which randomly alignment of magnetic spins exists with
their frustrated magnetic interactions, is named as spin-glass system. In temperature regime
of spin-glass system, TB shows variation with changing frequency of applied ac magnetic
field. To study the surface spin glass, I measured frequency dependent ac susceptibility at
temperature range 5 to 300 K. Fig. 5.5 (a) depicts the ac-susceptibility (in-phase) of these
coated nanoparticles in 1 to1000 Hz frequency range under Hac = 5 Oe amplitude. The
curves show increasing trend of TB (95 to 115 K) with increasing frequency (1 to 1000 Hz).
A reasonable shift of TB with frequency is observed in these nanoparticles. This f-shift of
TB can be analysed through various types of physical laws. Arrhenius, Vogel-Fulcher and
Dynamics scaling law are used for getting information about interparticle interactions and
spin-glass state. Arrhenius law is used for non-interacting single domain particles [189].
Arrhenius law is,
BB
a
Tk
E
e (5.7)
Where τo, kB and Ea are atomic spin flip time (10-9 to 10-12 s), Boltzmann constant and
activation energy, respectively. The activation energy is defined as Ea = KeffV (V is volume
and Keff is an anisotropic constant of particles) [190]. Fig 5.5 (b) shows fitting of Arrhenius
law on f- dependent ac susceptibility of coated maghemite nanoparticles. In this fit, τo and
Ea /kB are used as fitting parameters and obtained Ea /kB = 3763 K and τo = 6.71 x 10⁻¹⁸ s.
A very small value of τo and high value of Ea/kB for these nanoparticles are unphysical.
With these inadequate fitting parameters, Neel-Arrhenius law failed to analyze our system
which may be due to interparticle interactions. To find out the possible interparticle
interactions strength, we have used Vogel-Fulcher law [191] having general formula,
TTk
E
BB
a
e (5.8)
Where an additional parameter To represents the strength of interaction between particles
[192, 193]. Fig 5.5 (c) exhibit the fitting of Vogel-Fulcher law at same f-dependent ac

Chapter No. 5 Structural, Dielectric and Magnetic Properties of Ferrite Nanoparticles
87
susceptibility data. Obtained fitting parameters are Ea /kB = 679 K and τo = 9.84 x 10⁻⁹ s
with To = 59 K. Now, both fitting parameters Ea /kB and τo show reasonable values. High
value of To confirms the interactions between these nanoparticles. This may be due to
disordered surface spins and interparticle interactions which leads to surface spin glass.
Dynamic scaling law usually preferred to investigate spin-glass system and general formula
is [49],
zv
B TT
T
(5.9)
Where τ* is coherence time, τ is relaxation time, TB is peak value of (T) curve, To is
freezing temperature and zv is critical exponent. Value of zv for typical different spin glass
systems lies between 4 to 12. I have also fitted Dynamic scaling’s law for possible spin
glass system. Fig 5.5 (d) shows dynamic scaling law fit for Cr2O3 coated γ-Fe2O3
nanoparticles with fitting parameters zv = 10.9 and τ* = 1.3 x 10⁻⁵ s. Present value of zv
confirms the spin glass system in these nanoparticles. Value of τ* is high and attributed to
frozen surface spins relaxation. The obtained value of To = 70 K by fitting is consistent to
TB obtained by ZFC experimental result [194, 195].

Chapter No. 5 Structural, Dielectric and Magnetic Properties of Ferrite Nanoparticles
88
Fig. 5.5: (a) In-phase ac susceptibility of Cr2O3 coated γ-Fe2O3 nanoparticles. The f- dependent TB is fitted
with (b) Arrhenius law (c) Vogel-Fulcher law and (d) dynamic scaling law.
5.3 Results and discussion of study of Cr doping on structural, magnetic
and dielectric properties of NiFe2O4 nanoparticles
5.3.1 X-Ray diffraction
Fig. 5.6 (a) shows XRD pattern of NiCrxFe2-xO4; x = 0, 0.2, 0.4, 0.6, 0.8 and 2
nanoparticles. The observed indexed diffracted peaks for NiCrxFe2-xO4 nanoparticles at
angles, 2θ = 18.5˚, 30.4˚, 35.7˚, 37.4˚, 43.4˚, 54˚, 57.5˚, 63.1˚ and 74.6 ˚ are (1 1 1), (2 2
0), (3 1 1), (2 2 2), (4 0 0), (4 2 2), (5 1 1), (4 4 0) and (5 3 3) respectively for all samples.
Cubic spinel crystal structure is observed for all samples [196]. All the major peaks of
NiFe2O4 remain unchanged after the Cr dopant. The absence of impurity peaks in XRD
confirm the high purity of the single phase NiCrxFe2-xO4 nanoparticles.

Chapter No. 5 Structural, Dielectric and Magnetic Properties of Ferrite Nanoparticles
89
Fig 5.6: (a) XRD patterns and (b) lattice constant and average crystallite size of NiCrxFe2-xO4
nanoparticles.

Chapter No. 5 Structural, Dielectric and Magnetic Properties of Ferrite Nanoparticles
90
Fig. 5.6 (b) shows value of lattice parameter (red star) and average crystallite size
(blue solid square) for NiCrxFe2-xO4 nanoparticles. The lattice constant of these
nanoparticles was calculated using Eq. 4.2 [197]. The calculated lattice parameter of Cr
doped nanoparticles revealed decreasing trend with increasing concentration of Cr ions at
B site. Decreasing trend of lattice constant is attributed to replacement of smaller ionic
radius of Cr3+ (0.64 Å) with larger ionic radius of Fe3+ (0.67 Å) [198]. Trivalent Cr3+ ions
have strong preference for octahedral site which would replace Fe3+ ions at octahedral site.
This replacement has not impacted on cubic spinal structure of NiCrxFe2-xO4 nanoparticles
for all samples.
The average crystallite size of these nanoparticles is also calculated with help of
Debye-Scherrer’s formula [196] using Eq. 4.3. The calculated average crystallite size of
NiCrxFe2-xO4 nanoparticles are in 28 - 44 nm range for different concentration of x. The
maximum average crystallite size is obtained for x = 0 and depicted the decreasing trend
as Cr concentration increases which is due to reduction in unit cell.
5.3.2 Transmission electron microscopy
Fig. 5.7 shows TEM images of NiCr2O4 nanoparticles at 20 and 100 nm scale. TEM
scans depicts well dispersed spherical/non-spherical nanoparticles but most of them are
irregular shape. The nanoparticles show less tendency of agglomeration. The average
particle size was also calculated 47 nm from TEM image which supports well our from
XRD calculated size of 44 nm [199].

Chapter No. 5 Structural, Dielectric and Magnetic Properties of Ferrite Nanoparticles
91
Fig. 5.7: TEM images of NiCr2O4 nanoparticles at (a) 20 nm and (b)100 nm scale.
5.3.3 Magnetic properties
The shape of M-H loop depends on porosity, chemical composition of compound
and grain size, etc. Here, M-H loops are presented to explore the effect of antiferromagnetic
Cr concentration on magnetic properties of NiFe2O4 nanoparticles. Fig. 5.8 (a) reveals the
M-H loops of all concentration of NiCrxFe2-xO4 nanoparticles at T = 5 K under field of ±
5T and inset reveals the expanded region of coercivity. M-H loops for all samples exhibit
(a)
(b)

Chapter No. 5 Structural, Dielectric and Magnetic Properties of Ferrite Nanoparticles
92
ferrimagnetic nature. All loops do not saturate even at maximum field (5 T) which may be
disordered surface spins. Fig. 5.8 (b) exhibits saturation magnetization (MS) variation in
NiFe2O4 nanoparticles as Cr concentration increases. MS reveals maximum value for
NiFe2O4 nanoparticles and depicts decreasing trend with addition of Cr3+ ion concentration
in ferrites nanoparticles. This reduction may be attributed to large magnetic moment of
Fe3+ (5 μB) are replaced by smaller magnetic moment of Cr3+ (3 μB) at octahedral sites of
the NiFe2O4 nanoparticles sublattice. Fe3+(B)/Fe2+(A) ratio decreases with addition of
Cr3+ ion concentration, as a result A-B super exchange interaction also decreases [200].
Fig. 5.8 (c) shows the variation of coercivity (HC) in NiFe2O4 nanoparticles with increasing
Cr concentration. HC reveals minimum value for NiFe2O4 nanoparticles and depicts
increasing trend with addition of Cr3+ ion concentration in ferrites nanoparticles. This
increase in HC may be due to change in magneto crystalline anisotropy. The reason in
magneto crystalline anisotropy transformation may be magnetic coupling. Magnetic
coupling enhances with replacement of quenched orbital angular momentum Fe3+ by
unquenched orbital angular momentum Cr3+ which lead to higher magneto crystalline
anisotropy, as a result coercivity increases [201].

Chapter No. 5 Structural, Dielectric and Magnetic Properties of Ferrite Nanoparticles
93
Fig. 5.8: (a) M-H loops at T = 5 K, (b) MS variation and (c) HC variation for NiCrxFe2-xO4 nanoparticles
with Cr concentration (x). solid lines just reveal the trend.
5.3.4 Dielectric properties
Dielectric properties of nanoparticles depend on different factors mainly chemical
composition, process of preparation, annealing temperature, ratio of dopant particles and

Chapter No. 5 Structural, Dielectric and Magnetic Properties of Ferrite Nanoparticles
94
sizes of prepared particles etc. I have studied effect of Cr+3 doping at octahedral B-site on
the dielectric properties of NiFe2O4 nanoparticles. The dielectric response of these
nanomaterials was measured using LCR meter. Frequency range of available LCR meter
is 100 Hz to 4 MHz. I have calculated real and complex (imaginary) dielectric constants,
dissipation factor and ac conductivity for these nanoparticles.
Fig. 5.9 (a) and (b) show the real and imaginary part of dielectric constant of Cr
doped NiFe2O4 nanoparticles for all samples. Real and imaginary part of dielectric
constants are calculated using Eqs. 3.2 and 3.3, respectively. In range of low frequency
region, the dielectric constants (real and imaginary part) reveal maximum value and
gradually decrease to low value increasing frequency of applied field. This frequency
dependent real and imaginary part behaviour is typical in ferrite and chromite system. This
behaviour is due to accumulation of polarization. There are basically four types of
polarization: dipolar, ionic, electronic and interfacial polarization depending upon
frequency of external field. These types of polarization active very well at low frequency
and relaxed at high frequency, resulting in decreasing the real ad imaginary part of
dielectric constant at higher frequency [202]. Koop’s theory and Maxwell-Wigner and
model are used which further explains this behaviour [143]. This model suggested that
ferrites and chromites consist of highly conducing region grains and poorly conductive
grain boundaries. The grain boundaries are more active, and role play in producing
polarization at low frequencies because electrons pile up at resistive grain boundary and
enhances polarization. At higher frequencies, the lagging behind of charge carriers of
grains cannot contribute in polarization of dielectric constant. As a result, real part of
dielectric constants decreases at high frequency [203]. In our frequency range, mostly space
charge polarization occur and play role in dielectric constant [204].
The real and imaginary part of Cr doped NiFe2O4 nanoparticles show increasing
trend of dielectric constant with increasing concentration of Cr+3 dopant. The maximum
value of real and imaginary part of dielectric constant are observed at x = 2. This increasing
trend is attributed to less conductive nature of Cr as compare to Fe. The conductivity of Fe
is 1×10⁷ S/m and the conductivity of Cr is 6.7×10⁶ S/m.
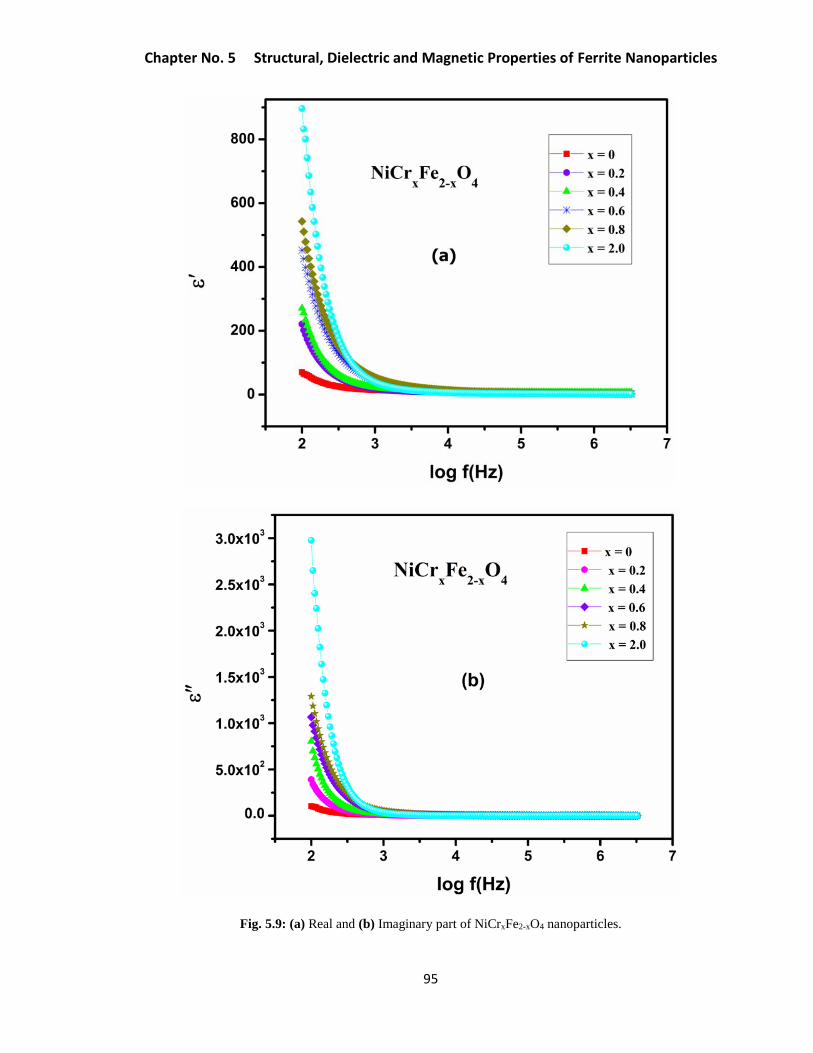
Chapter No. 5 Structural, Dielectric and Magnetic Properties of Ferrite Nanoparticles
95
Fig. 5.9: (a) Real and (b) Imaginary part of NiCrxFe2-xO4 nanoparticles.

Chapter No. 5 Structural, Dielectric and Magnetic Properties of Ferrite Nanoparticles
96
Fig. 5.10 reveals the dissipation factor of NiCrxFe2-xO4 nanoparticles. Dielectric
loss tangent has maximum value at low frequency region and reveals decreasing trend with
increasing value of frequency. This decreasing trend is described with the help of Koop’s
model [143]. The grain boundaries are resistive at low frequency and needed more energy
to move the electron. The dissipation factor with increasing doping concentration of Cr+3
on octahedral site depicts increasing trend. This increasing trend is attributed to less
conductive nature of chromium as compare to iron. The conductivity of iron is 1*107S/m
and the conductivity of chromium is 6.7*106 S/m [89]. The maximum value of dissipation
factor is at x = 2 Cr concentration.
Fig. 5.10: Tangent loss of NiCr2Fe2-xO4 nanoparticles.
With the help of AC conductivity using Eq. 4.6, we can understand the mechanism
of conduction for these nanoparticles. Fig. 5.11 reveals ac conductivity of NiCrxFe2-xO4
nanoparticles for all values of x. AC conductivity of nanoparticles increases with increasing
frequency. At low frequency grains boundaries are effective, so electrons cannot overcome
the barrier, therefor ac conductivity is minimum. While at high frequency area grains
t

Chapter No. 5 Structural, Dielectric and Magnetic Properties of Ferrite Nanoparticles
97
become effective, therefore electrons move easily, and ac conductivity show increasing
trend. As a result charge career hopping rises with increasing applied field and ac
conductivity also increases [205]. Ac conductivity NiFe2O4 nanoparticles has decreased
with increasing concentration of Cr. This decreasing trend is attributed to less conductive
nature of chromium as compare to iron. The hopping of electrons taking place in
mechanism of conduction also decreases. That’s way ac conductivity revealed decreasing
trend.
Fig. 5.11: AC conductivity of NiCrxFe2-xO4 nanoparticles.

Chapter No. 5 Structural, Dielectric and Magnetic Properties of Ferrite Nanoparticles
98
5.4 Conclusion
Surface effects of Cr2O3 coated γ-Fe2O3 nanoparticles have been analysed by using
detailed magnetic measurements. Microwave plasma method is used for synthesis of these
nanoparticles. XRD result revealed the inverse spinel crystal structure for γ-Fe2O3
nanoparticles. Simulated ZFC/FC data exhibited the lower value of effective anisotropy
constant of Cr2O3 coated γ-Fe2O3 nanoparticles than bare nanoparticles of γ-Fe2O3 which
is due to relatively big particle size of coated nanoparticles and weak interface anisotropy
between ferrimagnetic core and antiferromagnetic shell. Saturation magnetization shows
increasing trend with decreasing temperature and fitted with Bloch’s law which provides
the value of b = 1.10 and B = 3.523 x 10⁻⁴ K-b. Higher value of B in these nanoparticles
than bulk γ-Fe2O3 is due to decrease of particle size which results in weaker exchange
coupling J (B ̴ 1/J) due to surface disorder. The sharp increase of coercivity is similar to
bare nanoparticles and is attributed to enhanced surface disorder and high surface
anisotropy below 25 K. Frequency dependent ac susceptibility showed shifting of TB which
was due to interparticle interactions and surface spins disorder. Frequency dependent TB
shift was fitted by using theoretical models. Dynamic scaling law fit to the data confirmed
the existence of spin-glass behaviour which is originated by disordered surface spins
disorder system and in accordance with the dc magnetic measurements. Structural analyses
of sol-gel prepared Cr doped NiFe2O4 nanoparticles were confirmed using XRD analysis.
Saturation magnetization (MS) of coated nanoparticles depicted decreasing trend with
addition of Cr3+ concentration which is attributed to replacement of large magnetic moment
of Fe3+ by smaller magnetic moment of Cr3+. HC revealed increasing trend with addition of
Cr3+. This increase in HC may be due to change in magneto crystalline anisotropy. The
frequency dependent dielectric constants show decreasing trend with frequency which is
due to decrease in polarization. The dielectric constant of NiFe2O4 nanoparticles was
enhanced with concentration of Cr.

99
6 General Conclusion
In conclusion, chromite and ferrite ultrafine and homogeneously distributed
nanoparticles have been synthesized by Sol-gel and Microwave plasma method. Their
properties have been investigated in detail by XRD, FTIR, TEM, LCR meter and SQUID-
magnetometry. Temperature dependent magnetic response of CoCr2O4 nanoparticles shifts
TC towards higher temperature with applying higher fields while TS and TL remain
unaffected due to strong B-B interactions which act as a frozen spins or canted spins at
surface. A negative magnetization is observed in ZFC curve due to presence of
uncompensated spins at the nanoparticle’s surface which is suppressed due to higher fields,
Mg doping and SiO2 coating. There is no role of small trapped magnetic field in
magnetometer in this negative magnetization. MS shows an abnormal decreasing trend with
decreasing temperature due to presence of disordered stiffed/strong conical spin spiral and
lock in states at low temperatures. Modified Kneller’s law for HC showed a good fit but
deviated from experimental data at low temperatures due to sharp increase in HC which is
ascribed to increased surface anisotropy. CoCr2O4 nanoparticles showed slow spin
relaxation in both ZFC and FC protocols, which signifies the presence of spin-glass
behaviour at low temperatures. Non-magnetic Mg doping along with variation in average
crystallite size have also significant effects on structural, magnetic, and dielectric
properties of CoCr2O4 nanoparticles. Both TC and TS decreased as Mg concentration
increases and finally system undergoes a frustrated AFM transition. High field FC curves
showed nearly no effect on the TS due to strong B-B magnetic interactions. The dielectric
properties are improved for nanoparticles with Mg concentration due to larger average
crystallite size. The SiO2 coating on these nanoparticles is very effective and useful in
controlling the average crystallite size and tuning the magnetic properties of the CoCr2O4
nanoparticles. The SiO2 coating on CoCr2O4 nanoparticles reveals decreasing trend of
average crystallite size and lattice parameter. All magnetic transitions tend to lower
temperatures as SiO2 coating concentration increases. This was due to finite size effects
caused by SiO2 coating. M-H loops reveal decreasing trend in MS value as coating
concentration of SiO2 increases which was due to small size of coated nanoparticles. The

100
ZFC ac susceptibility with temperature also indicated that TC deceases as coating
concentration of SiO2 increases.
Surface spin-glass freezing in ferrite nanoparticles can be a promising tool to
control the particle core magnetization which is very useful for applications e.g., for
magnetic data storage. The lower value of effective anisotropy constant (Keff) is observed
for Cr2O3 coated γ-Fe2O3 nanoparticles than bare nanoparticles of γ-Fe2O3 which is due to
relatively big average particle size of coated nanoparticles and weak interface anisotropy
between ferrimagnetic core and antiferromagnetic shell. Dc magnetic measurements of
these ferrite nanoparticles indicate the presence of surface spins disorder and interparticle
interactions at the surface. The surface effects in ferrite nanoparticles are very prominent.
Frequency dependent ac susceptibility showed shifting of TB which was due to interparticle
interactions and surface spins disorder. Frequency dependent TB shift was fitted by using
theoretical models which ensures the presence of interparticle interactions and surface
disorder. Cr2O3 coated γ-Fe2O3 nanoparticles revealed surface spin glass with low HC, MS
and Keff as compared to bare γ-Fe2O3 nanoparticles which is probably due to weak core-
shell interface interactions and enhanced surface disorder supported by Cr2O3 surface
coating. Cr doped NiFe2O4 nanoparticles show strong influence of Cr+3concentration on
the structural, dielectric and magnetic properties of these nanoparticles. MS depicted
decreasing trend with addition of Cr3+ concentration which is attributed to replacement of
large magnetic moment of Fe3+ by smaller magnetic moment of Cr3+. HC revealed
increasing trend with addition of Cr3+. This increase in HC may be due to change in magneto
crystalline anisotropy. Dielectric studies of frequency dependent NiCrxFe2-xO4
nanoparticles shows decreasing trend in dielectric constants with increasing frequency.
This effect is attributed to decreasing polarization because the dipoles cannot follow up the
field variation. The dielectric properties are enhanced with Cr doping in these ferrite
nanoparticles due to less conductive nature of Cr. In this thesis, above finding in chromite
and ferrite nanoparticles reveal that doping and coating has tailored the structural, magnetic
and dielectric properties which make it highly potential for future applications e.g. in bio-
magnetism, ferro-fluids, magnetic data storage and targeted drug delivery.

101
In future, preparation side emphasis should be put on a clear separation between
surface effects on individual, core/shell nanoparticles and interparticle interactions keeping
the size distribution as narrow as possible. By refining preparation methods, experimental
conditions should be better controlled for a systematic study of low temperature magnetic
transitions, freezing and interaction phenomena. The solution of these problems partly
addressed in this thesis could be of vivid interest not only for a basic understanding but
also for future applications.

102
Reference
[1] A. Rodríguez-Martínez, M.Á. de la Casa-Lillo, L. Svilainis and T.E.G. Álvarez-Arenas,
Characterization of Nanoparticles Doped Composites Using Ultrasound, Ultrasonics., 83
(2018) 68-79.
[2] F. Ran, W. Lei, Y. Cui, J. Jiao, Y. Mao, S. Wang and S. Wang, Size Effect on Oral
Absorption in Polymer-Functionalized Mesoporous Carbon Nanoparticles, J. Colloid
Interface Sci., 511 (2018) 57-66.
[3] X. Wang, L. Yang, Z.G. Chen and D.M. Shin, Application of Nanotechnology in
Cancer Therapy and Imaging, CA Cancer J Clin., 58 (2008) 97-110.
[4] R. Resnick, D. Halliday and K.S. Krane, Physics, Vol. 1, in, New York: Wiley, 1992.
[5] R.C. O'handley, Modern Magnetic Materials: Principles and Applications, Wiley New
York, 2000.
[6] A. Hiess, J. Boucherle, F. Givord, J. Schweizer, E. Lelievre-Berna, F. Tasset, B. Gillon
and P. Canfield, Magnetism in Intermediate-Valence YbAl3: A Polarized Neutron
Diffraction Study, J. Phys. Condens. Matter., 12 (2000) 829.
[7] R.M. Bozorth, Ferromagnetism, Ferromagnetism, by Richard M Bozorth, pp 992 ISBN
0-7803-1032-2 Wiley-VCH, August 1993.
[8] B.D. Cullity and C.D. Graham, Introduction to Magnetic Materials, John Wiley & Sons,
2011.
[9] R.M. Cornell and U. Schwertmann, The Iron Oxides: Structure, Properties, Reactions,
Occurrences and Uses, John Wiley & Sons, 2003.
[10] M. Bruce, Domain Theory, Hitchhiker’s Guide to Magnetism for the Environmental
Magnetism Workshop, Institute for Rock Magnetism http://www irm umn
edu/hg2m/hg2m_d/hg2m_d html, (1991).
[11] S. Chikazumi and C.D. Graham, Physics of Ferromagnetism 2e, Oxford University
Press on Demand, 2009.
[12] J. Osborn, Demagnetizing Factors of the General Ellipsoid, Phys. Rev., 67 (1945) 351.
[13] A. Aharoni, Introduction to the Theory of Ferromagnetism, Clarendon Press, 2000.

103
[14] F. Zeb, W. Sarwer, K. Nadeem, M. Kamran, M. Mumtaz, H. Krenn and I. Letofsky-
Papst, Surface Spin-Glass in Cobalt Ferrite Nanoparticles Dispersed in Silica Matrix, J.
Magn. Magn. Mater., 407 (2016) 241-246.
[15] V. Cannella and J. Mydosh, Magnetic Ordering in Gold-Iron Alloys, Phys. Rev. B., 6
(1972) 4220.
[16] C. Huang, Some Experimental Aspects of Spin Glasses: A Review, J. Magn. Magn.
Mater., 51 (1985) 1-74.
[17] W.B. Weir, Automatic Measurement of Complex Dielectric Constant and
Permeability at Microwave Frequencies, Proc. IEEE., 62 (1974) 33-36.
[18] M. Gupta and E.W.W. Leong, Microwaves and Metals, John Wiley & Sons, 2008.
[19] D.S. Mathew and R.-S. Juang, An Overview of the Structure and Magnetism of Spinel
Ferrite Nanoparticles and Their Synthesis in Microemulsions, Chem. Eng. J., 129 (2007)
51-65.
[20] W. Eerenstein, N. Mathur and J.F. Scott, Multiferroic and Magnetoelectric Materials,
Nature, 442 (2006) 759.
[21] J. Junquera and P. Ghosez, First-Principles Study of Ferroelectric Oxide Epitaxial
Thin Films and Superlattices: Role of the Mechanical and Electrical Boundary Conditions,
J. Comput. Theor. Nanosci., 5 (2008) 2071-2088.
[22] Y. Yamasaki, S. Miyasaka, Y. Kaneko, J.-P. He, T. Arima and Y. Tokura, Magnetic
Reversal of the Ferroelectric Polarization in a Multiferroic Spinel Oxide, Phys. Rev. Lett.,
96 (2006) 207204.
[23] P. Mohanty, C. Sheppard, A. Prinsloo, W. Roos, L. Olivi and G. Aquilanti, Effect of
Cobalt Substitution on the Magnetic Properties of Nickel Chromite, J. Magn. Magn.
Mater., 451 (2018) 20-28.
[24] A.B. Van Groenou, P. Bongers and A. Stuyts, Magnetism, Microstructure and Crystal
Chemistry of Spinel Ferrites, Mater. Sci. Eng. C., 3 (1969) 317-392.
[25] T. Kaplan, K. Dwight, D. Lyons and N. Menyuk, Classical Theory of the Ground Spin
State in Spinels, J. Appl. Phys., 32 (1961) S13-S20.
[26] N. Menyuk, K. Dwight and A. Wold, Ferrimagnetic Spiral Configurations in Cobalt
Chromite, Eur. Phys. J., 25 (1964) 528-536.

104
[27] J.K. Galivarapu, D. Kumar, A. Banerjee, V. Sathe, G. Aquilanti and C. Rath, Effect
of Size Reduction on Cation Distribution and Magnetic Transitions in CoCr2O4
Multiferroic: Exafs, Magnetic and Diffused Neutron Scattering Measurements, RSC Adv.,
6 (2016) 63809-63819.
[28] H. Wijn, Alloys and Compounds of 3d Elements with Main Group Elements, in:
Magnetic Properties of Metals, Springer, 1991, pp. 95-158.
[29] P.A. Kumar, J. Shrotri, S. Kulkarni, C. Deshpande and S. Date, Low Temperature
Synthesis of Ni0.8Zn0.2Fe2O4 Powder and Its Characterization, Mater. Lett., 27 (1996) 293-
296.
[30] J. Smit and H.P.J. Wijn, Ferrites, ICON Group International, 1959.
[31] F. Burghart, W. Potzel, G. Kalvius, E. Schreier, G. Grosse, D. Noakes, W. Schäfer,
W. Kockelmann, S. Campbell and W. Kaczmarek, Magnetism of Crystalline and
Nanostructured ZnFe2O4, Physica B Condens Matter., 289 (2000) 286-290.
[32] M. Anantharaman, S. Jagatheesan, K. Malini, S. Sindhu, A. Narayanasamy, C.
Chinnasamy, J. Jacobs, S. Reijne, K. Seshan and R. Smits, On the Magnetic Properties of
Ultra-Fine Zinc Ferrites, J. Magn. Magn. Mater., 189 (1998) 83-88.
[33] S.A. Morrison, C.L. Cahill, E.E. Carpenter, S. Calvin, R. Swaminathan, M.E.
McHenry and V.G. Harris, Magnetic and Structural Properties of Nickel Zinc Ferrite
Nanoparticles Synthesized at Room Temperature, J. Appl. Phys., 95 (2004) 6392-6395.
[34] A. Goldman, Modern Ferrite Technology, Springer Science & Business Media, 2006.
[35] C. Sun, J.S. Lee and M. Zhang, Magnetic Nanoparticles in Mr Imaging and Drug
Delivery, Adv. Drug Deliv. Rev., 60 (2008) 1252-1265.
[36] X. Mou, X. Wei, Y. Li and W. Shen, Tuning Crystal-Phase and Shape of Fe2O3
Nanoparticles for Catalytic Applications, CrystEngComm, 14 (2012) 5107-5120.
[37] M. Setvín, M. Wagner, M. Schmid, G.S. Parkinson and U. Diebold, Surface Point
Defects on Bulk Oxides: Atomically-Resolved Scanning Probe Microscopy, Chem. Soc.
Rev., 46 (2017) 1772-1784.
[38] R.H. Kodama, A.E. Berkowitz, E. McNiff Jr and S. Foner, Surface Spin Disorder in
NiFe2O4 Nanoparticles, Phys. Rev. Lett., 77 (1996) 394.

105
[39] M. Hoppe, S. Döring, M. Gorgoi, S. Cramm and M. Müller, Enhanced Ferrimagnetism
in Auxetic NiFe2O4 in the Crossover to the Ultrathin-Film Limit, Phys. Rev. B, 91 (2015)
054418.
[40] S. Rahman, K. Nadeem, M. Anis-ur-Rehman, M. Mumtaz, S. Naeem and I. Letofsky-
Papst, Structural and Magnetic Properties of ZnMg-Ferrite Nanoparticles Prepared Using
the Co-Precipitation Method, Ceram. Int., 39 (2013) 5235-5239.
[41] M. Akyol, İ. Adanur, A.O. Ayaş and A. Ekicibil, Magnetic Field Dependence of
Magnetic Coupling in CoCr2O4 Nanoparticles, Physica B Condens Matter., 525 (2017)
144-148.
[42] C. Rath, P. Mohanty and A. Banerjee, Magnetic Properties of Nanoparticles of Cobalt
Chromite, J. Magn. Magn. Mater., 323 (2011) 1698-1702.
[43] D. Gingasu, I. Mindru, D.C. Culita, L. Patron, J.M. Calderon-Moreno, P. Osiceanu, S.
Preda, O. Oprea, V. Parvulescu and V. Teodorescu, Structural, Magnetic and Catalytic
Properties of Cobalt Chromite Obtained through Precursor Method, Mater. Res. Bull., 62
(2015) 52-64.
[44] I. Mindru, D. Gingasu, G. Marinescu, L. Patron, J.M. Calderon-Moreno, C. Bartha, C.
Andronescu and A. Crisan, Cobalt Chromite Obtained by Thermal Decomposition of
Oxalate Coordination Compounds, Ceram. Int., 40 (2014) 15249-15258.
[45] P. Choudhary and D. Varshney, Structural, Vibrational and Dielectric Behavior of
Co1-xMxCr2O4 (M= Zn, Mg, Cu and x = 0.0, 0.5) Spinel Chromites, J Alloys Compd., 725
(2017) 415-424.
[46] D. Kumar, P. Mohanty, V. Singh, J.K. Galivarapu, A. Banerjee, V. Ganesan and C.
Rath, Tuning of Magnetic Transition Temperatures in Nanoparticles of CoCr2O4
Multiferroic by B-Site Mixing, Mater. Res. Bull., 54 (2014) 78-83.
[47] A. Afzal, S. Atiq, M. Saleem, S.M. Ramay, S. Naseem and S.A. Siddiqi, Structural
and Magnetic Phase Transition of Sol–Gel-Synthesized Cr2O3 and MnCr2O4
Nanoparticles, J. Sol-Gel Sci. Technol., 80 (2016) 96-102.
[48] D. Zákutná, A. Repko, I. Matulkova, D. Nižňanský, A. Ardu, C. Cannas, A.
Mantlíková and J. Vejpravova, Hydrothermal Synthesis, Characterization, and Magnetic
Properties of Cobalt Chromite Nanoparticles, J. Nanopart. Res., 16 (2014) 2251.

106
[49] K. Nadeem, H. Krenn, T. Traussnig, R. Würschum, D. Szabó and I. Letofsky-Papst,
Spin-Glass Freezing of Maghemite Nanoparticles Prepared by Microwave Plasma
Synthesis, J. Appl. Phys., 111 (2012) 113911.
[50] Y. Köseoğlu, F. Alan, M. Tan, R. Yilgin and M. Öztürk, Low Temperature
Hydrothermal Synthesis and Characterization of Mn Doped Cobalt Ferrite Nanoparticles,
Ceram. Int., 38 (2012) 3625-3634.
[51] Q. Qing-Wei, X. Xiao-Wen, H. Mang and Z. Hong-Wang, Radio-Frequency-Heating
Capability of Silica-Coated Manganese Ferrite Nanoparticles, Chin. Phys. B, 24 (2015)
067503.
[52] F. Zeb, K. Nadeem, S.K.A. Shah, M. Kamran, I.H. Gul and L. Ali, Surface Spins
Disorder in Uncoated and SiO2 Coated Maghemite Nanoparticles, J. Magn. Magn. Mater.,
429 (2017) 270-275.
[53] R.S. Yadav, I. Kuřitka, J. Vilcakova, J. Havlica, J. Masilko, L. Kalina, J. Tkacz, V.
Enev and M. Hajdúchová, Structural, Magnetic, Dielectric, and Electrical Properties of
NiFe2O4 Spinel Ferrite Nanoparticles Prepared by Honey-Mediated Sol-Gel Combustion,
J. Phys. Chem. Solids, 107 (2017) 150-161.
[54] S. Sendhilnathan, Enhancement in Dielectric and Magnetic Properties of Mg2+
Substituted Highly Porous Super Paramagnetic Nickel Ferrite Nanoparticles with
Williamson-Hall Plots Mechanistic View, Ceram. Int., 43 (2017) 15447-15453.
[55] B. Fultz and J.M. Howe, Transmission Electron Microscopy and Diffractometry of
Materials, Springer Science & Business Media, 2012.
[56] S. Bhukal, T. Namgyal, S. Mor, S. Bansal and S. Singhal, Structural, Electrical,
Optical and Magnetic Properties of Chromium Substituted Co–Zn Nanoferrites Co0.6Zn0.4
CrxFe2−xO4 (0⩽ x⩽ 1.0) Prepared Via Sol–Gel Auto-Combustion Method, J. Mol. Struct.,
1012 (2012) 162-167.
[57] A.H. Compton and S.K. Allison, X-Rays in Theory and Experiment, (1935).
[58] S. Nasir, G. Asghar, M.A. Malik and M. Anis-ur-Rehman, Structural, Dielectric and
Electrical Properties of Zinc Doped Nickel Nanoferrites Prepared by Simplified Sol–Gel
Method, J. Sol-Gel Sci. Technol., 59 (2011) 111-116.
[59] P.R. Griffiths and J.A. De Haseth, Fourier Transform Infrared Spectrometry, John
Wiley & Sons, 2007.

107
[60] M. Faley, K. Pratt, R. Reineman, D. Schurig, S. Gott, C. Atwood, R. Sarwinski, D.
Paulson, T. Starr and R. Fagaly, High Temperature Superconductor Dc Squid Micro-
Susceptometer for Room Temperature Objects, Supercond. Sci. Technol., 17 (2004) S324.
[61] B.D. Josephson, Possible New Effects in Superconductive Tunnelling, Phys. Lett., 1
(1962) 251-253.
[62] http://www.geocities.ws/pranab_muduli/squid.html.
[63] T. Van Duzer and C.W. Turner, Principles of Superconductive Devices and Circuits,
(1981).
[64] D.B. Williams, C.B. Carter and P. Veyssiere, Transmission Electron Microscopy: A
Textbook for Materials Science, Springer, 1998.
[65] M. De Graef, Introduction to Conventional Transmission Electron Microscopy,
Cambridge University Press, 2003.
[66] M. Atmanand, V.J. Kumar and V.G. Murti, A Microcontroller-Based Quasi-Balanced
Bridge for the Measurement of L, C and R, IEEE transactions on instrumentation and
measurement, 45 (1996) 757-761.
[67] V.M. Rotello, Nanoparticles: Building Blocks for Nanotechnology, Springer Science
& Business Media, 2004.
[68] D.V. Szabó and S. Schlabach, Microwave Plasma Synthesis of Materials—from
Physics and Chemistry to Nanoparticles: A Materials Scientist’s Viewpoint, Inorganics, 2
(2014) 468-507.
[69] D. Vollath and D.V. Szabó, The Microwave Plasma Process–a Versatile Process to
Synthesise Nanoparticulate Materials, J. Nanopart. Res., 8 (2006) 417-428.
[70] M. Valan, A. Manikandan and S.A. Antony, A Novel Synthesis and Characterization
Studies of Magnetic Co3O4 Nanoparticles, J. Nanosci. Nanotechnol., 15 (2015) 4580-4586.
[71] G. Mathubala, A. Manikandan, S.A. Antony and P. Ramar, Photocatalytic
Degradation of Methylene Blue Dye and Magneto-Optical Studies of Magnetically
Recyclable Spinel NixMn1-xFe2O4 (x = 0.0 – 1.0) Nanoparticles, J. Mol. Struct., 1113
(2016) 79-87.
[72] A. Manikandan, R. Sridhar, S.A. Antony and S. Ramakrishna, A Simple Aloe Vera
Plant-Extracted Microwave and Conventional Combustion Synthesis: Morphological,

108
Optical, Magnetic and Catalytic Properties of CoFe2O4 Nanostructures, J. Mol. Struct.,
1076 (2014) 188-200.
[73] V.M. Teresita, A. Manikandan, B.A. Josephine, S. Sujatha and S.A. Antony,
Electromagnetic Properties and Humidity-Sensing Studies of Magnetically Recoverable
LaMgxFe1−xO3−Δ Perovskites Nano-Photocatalysts by Sol-Gel Route, J. Supercond. Novel
Magn., 29 (2016) 1691-1701.
[74] B.A. Josephine, A. Manikandan, V.M. Teresita and S.A. Antony, Fundamental Study
of LaMgxCr1-xO3-δ Perovskites Nano-Photocatalysts: Sol-Gel Synthesis, Characterization
and Humidity Sensing, Korean J. Chem. Eng., 33 (2016) 1590-1598.
[75] A. Manikandan, M. Durka, M. Amutha Selvi and S. Arul Antony, Sesamum Indicum
Plant Extracted Microwave Combustion Synthesis and Opto-Magnetic Properties of Spinel
MnxCo1-xAl2O4 Nano-Catalysts, J. Nanosci. Nanotechnol., 16 (2016) 448-456.
[76] C. Zhu, Z. Tian, L. Wang and S. Yuan, Exchange Bias Effect in Spin Glass CoCr2O4
Nanoparticles, J. Magn. Magn. Mater., 393 (2015) 116-120.
[77] C. Rath and P. Mohanty, Magnetic Phase Transitions in Cobalt Chromite
Nanoparticles, J. Supercond. Novel Magn., 24 (2011) 629-633.
[78] A. Kochur, A. Kozakov, K. Googlev, S. Kubrin, A. Nikolskii, V. Torgashev, A. Bush,
V.Y. Shkuratov and S. Shevtsova, Valence State of Transition Metal Ions in Co1−xFexCr2O4
(X = 0.1, 0.2, 0.5) Ceramics from X-Ray Photoelectron and Mössbauer Spectroscopy Data,
J Alloys Compd., 636 (2015) 241-248.
[79] L. Wang, C. Zhu, L. Chen and S. Yuan, Exchange Bias Effect in CoCr2O4/NiO System
Prepared by Two-Step Method, Solid State Commun., 251 (2017) 39-42.
[80] G. Lawes, B. Melot, K. Page, C. Ederer, M. Hayward, T. Proffen and R. Seshadri,
Dielectric Anomalies and Spiral Magnetic Order in CoCr2O4, Phys. Rev. B, 74 (2006)
024413.
[81] Z. Tian, C. Zhu, J. Wang, Z. Xia, Y. Liu and S. Yuan, Size Dependence of Structure
and Magnetic Properties of CoCr2O4 Nanoparticles Synthesized by Hydrothermal
Technique, J. Magn. Magn. Mater., 377 (2015) 176-182.
[82] R. Kodama, A. Berkowitz, E. McNiff Jr and S. Foner, Surface Spin Disorder in Ferrite
Nanoparticles, J. Appl. Phys., 81 (1997) 5552-5557.

109
[83] A. Bush, V.Y. Shkuratov, K. Kamentsev and V. Cherepanov, Preparation and X-Ray
Diffraction, Dielectric, and Mössbauer Characterization of Co1−xNixCr2O4 Solid Solutions,
Inorg. Mater., 49 (2013) 296-302.
[84] J. Xu, D. Xie, C. Teng, X. Zhang, C. Zhang, Y. Sun, T.-L. Ren, M. Zeng, X. Gao and
Y. Zhao, Enhancement in Magnetic Properties of Magnesium Substituted Bismuth Ferrite
Nanoparticles, J. Appl. Phys., 117 (2015) 224101.
[85] D.-J. Huang, J. Okamoto, S.-W. Huang and C.-Y. Mou, Magnetic Transitions of
Multiferroic Frustrated Magnets Revealed by Resonant Soft X-Ray Magnetic Scattering,
J. Phys. Soc. Jpn., 79 (2010) 011009.
[86] A. Knyazev, M. Mączka, E. Bulanov, M. Ptak and S. Belopolskaya, High-
Temperature Thermal and X-Ray Diffraction Studies, and Room-Temperature
Spectroscopic Investigation of Some Inorganic Pigments, Dyes Pigm, 91 (2011) 286-293.
[87] C.-C. Chen, A. Herhold, C. Johnson and A. Alivisatos, Size Dependence of Structural
Metastability in Semiconductor Nanocrystals, Science, 276 (1997) 398-401.
[88] A. Tsoukatos, H. Wan, G. Hadjipanayis, V. Papaefthymiou, A. Kostikas and A.
Simopoulos, Origin of Coercivity in (Fe, Co)‐Based Granular Films, J. Appl. Phys., 73
(1993) 6967-6969.
[89] K. Nadeem, L. Ali, I. Gul, S. Rizwan and M. Mumtaz, Effect of Silica Coating on the
Structural, Dielectric, and Magnetic Properties of Maghemite Nanoparticles, J. Non-Cryst.
Solids, 404 (2014) 72-77.
[90] A. Ahagon, E. Ahmad, J. Ahn, A.G. Young, A. Hyo-Sung, A.J. Seon, S. Aiba and K.
Aimuta, Preconditioning, Write Width, and Recording Properties of Co-Cr-Pt-O
Perpendicular Media with Various Underlayer Designs; T-Mag 05 (2005)581.
[91] K.H. Wu, Y.C. Chang and G.P. Wang, Preparation of NiZn Ferrite/SiO2
Nanocomposite Powders by Sol–Gel Auto-Combustion Method, J. Magn. Magn. Mater.,
269 (2004) 150-155.
[92] A. Chaudhuri, M. Mandal and K. Mandal, Preparation and Study of NiFe2O4/SiO2
Core–Shell Nanocomposites, J. Alloy. Comp., 487 (2009) 698-702.
[93] S. Zhang, D. Dong, Y. Sui, Z. Liu, H. Wang, Z. Qian and W. Su, Preparation of Core
Shell Particles Consisting of Cobalt Ferrite and Silica by Sol–Gel Process, J. Alloy. Comp.,
415 (2006) 257-260

110
[94] J. Hu, W. Zhao, R. Hu, G. Chang, C. Li and L. Wang, Catalytic Activity of Spinel
Oxides MgCr2O4 and CoCr2O4 for Methane Combustion, Mater. Res. Bull., 57 (2014) 268-
273.
[95] D. Manimegalai, A. Manikandan, S. Moortheswaran and S.A. Antony, Magneto-
Optical and Photocatalytic Properties of Magnetically Recyclable MnxZn1−xS (x= 0.0, 0.3,
and 0.5) Nanocatalysts, J. Supercond. Novel Magn., 28 (2015) 2755-2766.
[96] A. Manikandan, M. Durka, K. Seevakan and S.A. Antony, A Novel One-Pot
Combustion Synthesis and Opto-Magnetic Properties of Magnetically Separable Spinel
MnxMg1−xFe2O4 (0.0≤ x≤ 0.5) Nanophotocatalysts, J. Supercond. Novel Magn., 28 (2015)
1405-1416.
[97] V. Torgashev, A. Prokhorov, G. Komandin, E. Zhukova, V. Anzin, V. Talanov, L.
Rabkin, A. Bush, M. Dressel and B. Gorshunov, Magnetic and Dielectric Response of
Cobalt-Chromium Spinel CoCr2O4 in the Terahertz Frequency Range, Phys. Solid State,
54 (2012) 350-359.
[98] B.D. Hosterman, J.W. Farley and A.L. Johnson, Spectroscopic Study of the
Vibrational Modes of Magnesium Nickel Chromite, MgxNi1−xCr2O4, J. Phys. Chem.
Solids, 74 (2013) 985-990.
[99] M. Ptak, M. Mączka, K. Hermanowicz, A. Pikul and J. Hanuza, Particle Size Effects
on the Magnetic and Phonon Properties of Multiferroic CoCr2O4, J. Solid State Chem., 199
(2013) 295-304.
[100] N. Kumar and A. Sundaresan, On the Observation of Negative Magnetization under
Zero-Field-Cooled Process, Solid State Commun., 150 (2010) 1162-1164.
[101] D.P. Dutta, J. Manjanna and A. Tyagi, Magnetic Properties of Sonochemically
Synthesized CoCr2O4 Nanoparticles, J. Appl. Phys., 106 (2009) 43915.
[102] S.-i. Ohkoshi, S. Yorozu, O. Sato, T. Iyoda, A. Fujishima and K. Hashimoto,
Photoinduced Magnetic Pole Inversion in a Ferro-Ferrimagnet:(Fe0.40IIMn0.60
II)1.5CrIII
(CN)6, Appl. Phys. Lett., 70 (1997) 1040-1042.
[103] L. Neel, Magnetic Properties of Ferrites: Ferrimagnetism and Antiferromagnetism,
Ann. Phys., 3 (1948) 137-198.

111
[104] Y. Choi, J. Okamoto, D. Huang, K. Chao, H. Lin, C. Chen, M. Van Veenendaal, T.
Kaplan and S. Cheong, Thermally or Magnetically Induced Polarization Reversal in the
Multiferroic CoCr2O4, Phys. Rev. Lett., 102 (2009) 067601.
[105] D. Kumar, J. Galivarapu, A. Banerjee, K. Nemkovski, Y. Su and C. Rath, Size-
Dependent Magnetic Transitions in CoFe0.1Cr1.9O4 Nanoparticles Studied by Magnetic and
Neutron-Polarization Analysis, Nanotechnology, 27 (2016) 175702.
[106] A. Pronin, M. Uhlarz, R. Beyer, T. Fischer, J. Wosnitza, B. Gorshunov, G.
Komandin, A. Prokhorov, M. Dressel and A. Bush, B-T Phase Diagram of CoCr2O4 in
Magnetic Fields up to 14 T, Phys. Rev. B, 85 (2012) 012101.
[107] K. Tomiyasu, J. Fukunaga and H. Suzuki, Magnetic Short-Range Order and
Reentrant-Spin-Glass-Like Behavior in CoCr2O4 and MnCr2O4 by Means of Neutron
Scattering and Magnetization Measurements, Phys. Rev. B, 70 (2004) 214434.
[108] N. Mufti, A. Nugroho, G. Blake and T. Palstra, Magnetodielectric Coupling in
Frustrated Spin Systems: The Spinels MCr2O4 (M= Mn, Co and Ni), J. Phys. Condens.
Matter, 22 (2010) 075902.
[109] V. Tsurkan, S. Zherlitsyn, S. Yasin, V. Felea, Y. Skourski, J. Deisenhofer, H.-A.K.
von Nidda, J. Wosnitza and A. Loidl, Unconventional Magnetostructural Transition in
CoCr2O4 at High Magnetic Fields, Phys. Rev. Lett., 110 (2013) 115502.
[110] A. Manikandan, J.J. Vijaya, M. Sundararajan, C. Meganathan, L.J. Kennedy and M.
Bououdina, Optical and Magnetic Properties of Mg-Doped ZnFe2O4 Nanoparticles
Prepared by Rapid Microwave Combustion Method, Superlattices Microstruct., 64 (2013)
118-131.
[111] A. Manikandan, L.J. Kennedy, M. Bououdina and J.J. Vijaya, Synthesis, Optical and
Magnetic Properties of Pure and Co-Doped ZnFe2O4 Nanoparticles by Microwave
Combustion Method, J. Magn. Magn. Mater., 349 (2014) 249-258.
[112] F. Bloch, Zur Theorie Des Ferromagnetismus, Z. Phys, 61 (1930) 206-219.
[113] K. Maaz, M. Usman, S. Karim, A. Mumtaz, S. Hasanain and M. Bertino, Magnetic
Response of Core-Shell Cobalt Ferrite Nanoparticles at Low Temperature, J. Appl. Phys.,
105 (2009).
[114] E. Kneller and F. Luborsky, Particle Size Dependence of Coercivity and Remanence
of Single‐Domain Particles, J. Appl. Phys., 34 (1963) 656-658.

112
[115] K. Maaz, S. Karim, K.J. Lee, M.-H. Jung and G.-H. Kim, Effect of Temperature on
the Magnetic Characteristics of Ni0.5Co0.5Fe2O4 Nanoparticles, Mater. Chem. Phys., 133
(2012) 1006-1010.
[116] F. Zeb, K. Nadeem, S.K.A. Shah, M. Kamran, I.H. Gul and L. Ali, Surface Spins
Disorder in Uncoated and SiO2 Coated Maghemite Nanoparticles, J. Magn. Magn. Mater.,
429 (2017) 270-275.
[117] T. Taniyama and I. Nakatani, Magnetic Relaxation in Ga0.6Mo2S4 Spinel, J. Appl.
Phys., 83 (1998) 6323-6325.
[118] M. Sasaki, P. Jönsson, H. Takayama and H. and Mamiya, Aging and Memory Effects
in Superparamagnets and Superspin Glasses, Phys. Rev. B, 71 (2005) 104405.
[119] B.H. Toby, Expgui, a Graphical User Interface for Gsas, J. Appl. Crystallogr., 34
(2001) 210-213.
[120] A.C. Larson and R.B. Von Dreele, Gsas, General Structure Analysis System
LANSCE, MS-H805, Los Alamos, New Mexico, (1994).
[121] X. Tan, G. Li, Y. Zhao and C. Hu, The Effect of Cu Content on the Structure of Ni1−x
CuxFe2O4 Spinels, Mater. Res. Bull., 44 (2009) 2160-2168.
[122] Z. Wang, H. O'Neill, P. Lazor and S. Saxena, High Pressure Raman Spectroscopic
Study of Spinel MgCr2O4, J. Phys. Chem. Solids, 63 (2002) 2057-2061.
[123] J. Himmrich and H. Lutz, Normal Coordinate Analyses and Lattice Dynamical
Calculations of Spinel-Type ZnCr2O4, Solid State Commun., 79 (1991) 447-452.
[124] T. Yamanaka and M. Ishii, Raman Scattering and Lattice Vibrations of Ni2SiO4
Spinel at Elevated Temperature, Phys. Chem. Miner., 13 (1986) 156-160.
[125] J.L. Verble, Temperature-Dependent Light-Scattering Studies of the Verwey
Transition and Electronic Disorder in Magnetite, Phys. Rev. B, 9 (1974) 5236.
[126] J. Preudhomme and P. Tarte, Infrared Studies of Spinels—III: The Normal II–III
Spinels, Spectrochim. Acta A, 27 (1971) 1817-1835.
[127] J. Malézieux, J. Barbillat, B. Cervelle, J. Coutures, M. Couzi and B. Piriou, Study of
synthetic spinels of the Mg(CrxAl2-x)O4 series and of natural chromites by Raman-Laser
microprobe, Tschermaks Min. Petr. Mitt., 32 (1983) 171-185.
[128] H. Lutz, B. Müller and H. Steiner, Lattice Vibration Spectra. Lix. Single Crystal
Infrared and Raman Studies of Spinel Type Oxides, J. Solid State Chem., 90 (1991) 54-60.

113
[129] A. Kushwaha, Study of Interatomic Interactions in Chromite Spinel CoCr2O4, Chin.
J. Phys., 47 (2009) 355-360.
[130] I. Jastrzębska, J. Szczerba, P. Stoch, A. Błachowski, K. Ruebenbauer, R. Prorok and
E. Śnieżek, Crystal Structure and Mössbauer Study of FeAl2O4, Nukleonik, 60 (2015) 47-
49.
[131] D.P. Dutta, G. Sharma, P. Manna, A. Tyagi and S. Yusuf, Room Temperature
Ferromagnetism in CoO Nanoparticles Obtained from Sonochemically Synthesized
Precursors, Nanotechnology, 19 (2008) 245609.
[132] S. Li, G. Zhao, H. Bi, Z. Huang, H. Lai, R. Gai and Y. Du, Synthesis and Anomalous
Magnetic Properties of CoCr2O4 Nanocrystallites with Lattice Distortion, J. Magn. Magn.
Mater., 305 (2006) 448-451.
[133] I. W Ratcliff, S.-H. Lee, C. Broholm, S.-W. Cheong and Q. Huang, Freezing of Spin
Correlated Nanoclusters in a Geometrically Frustrated Magnet, Phys. Rev. B, 65 (2002)
220406.
[134] B.C. Melot, J.E. Drewes, R. Seshadri, E. Stoudenmire and A.P. Ramirez, Magnetic
Phase Evolution in the Spinel Compounds Zn1−xCoxCr2O4, J. Phys. Condens. Matter, 21
(2009) 216007.
[135] K. Tomiyasu, H. Suzuki, M. Toki, S. Itoh, M. Matsuura, N. Aso and K. Yamada,
Molecular Spin Resonance in the Geometrically Frustrated Magnet MgCr2O4 by Inelastic
Neutron Scattering, Phys. Rev. Lett., 101 (2008) 177401.
[136] G. Kumar, R. Rani, S. Sharma, K.M. Batoo and M. Singh, Electric and Dielectric
Study of Cobalt Substituted Mg-Mn Nanoferrites Synthesized by Solution Combustion
Technique, Ceram. Int., 39 (2013) 4813-4818.
[137] R. Heikes and W. Johnston, Mechanism of Conduction in Li‐Substituted Transition
Metal Oxides, J. Chem. Phys., 26 (1957) 582-587.
[138] S. Mazen, S. Mansour and H. Zaki, Some Physical and Magnetic Properties of Mg‐
Zn Ferrite, Cryst. Res. Technol., 38 (2003) 471-478.
[139] R. Zamiri, B. Singh, I. Bdikin, A. Rebelo, M.S. Belsley and J. Ferreira, Influence of
Mg Doping on Dielectric and Optical Properties of ZnO Nano-Plates Prepared by Wet
Chemical Method, Solid State Commun., 195 (2014) 74-79.
114
[140] R. Kharabe, R. Devan, C. Kanamadi and B. Chougule, Dielectric properties of mixed
Li–Ni–Cd ferrites, Smart Mater. Struct., 15 (2006) N36.
[141] S. Mazen and H. Zaki, Effect of Tetra Ionic Substitution on the Dielectric Properties
of Cu‐Ferrite, Phys. Status Solidi A, 199 (2003) 305-320.
[142] S. Mazen, Infrared Absorption and Dielectric Properties of Li–Cu Ferrite, Mater.
Chem. Phys., 62 (2000) 139-147.
[143] C. Koops, On the Dispersion of Resistivity and Dielectric Constant of Some
Semiconductors at Audio frequencies, Phys. Rev., 83 (1951) 121.
[144] K. Nadeem, H. Krenn, M. Shahid and I. Letofsky-Papst, Influence of SiO2 Matrix
and Annealing Time on Properties of Ni-Ferrite Nanoparticles, Solid State Sci., 19 (2013)
27-31.
[145] O. Kahn, Condensed-Matter Physics: The Magnetic Turnabout, Nature, 399 (1999)
21-22.
[146] J. Plocek, P. Holec, S. Kubickova, B. Pacakova, I. Matulkova, A. Mantlikova, I.
Nemec, D. Niznansky and J. Vejpravova, Stabilization of Transitionmetal Chromite
Nanoparticles in Silica Matrix (2014).
[147] B. Aslibeiki and P. Kameli, Magnetic Properties of MnFe2O4 Nano-Aggregates
Dispersed in Paraffin Wax, J. Magn. Magn. Mater., 385 (2015) 308-312.
[148] S. Xu, Y. Ma, G. Zheng and Z. Dai, Simultaneous Effects of Surface Spins: Rarely
Large Coercivity, High Remanence Magnetization and Jumps in the Hysteresis Loops
Observed in CoFe2O4 Nanoparticles, Nanoscale, 7 (2015) 6520-6526.
[149] S. Chandra, H. Khurshid, W. Li, G. Hadjipanayis, M. Phan and H. Srikanth, Spin
Dynamics and Criteria for Onset of Exchange Bias in Superspin Glass Fe/γ-Fe2O3 Core-
Shell Nanoparticles, Phys. Rev. B, 86 (2012) 014426.
[150] A. Morr and K. Haneda, Magnetic Structure of Small NiFe2O4 Particles, J. Appl.
Phys., 52 (1981) 2496-2498.
[151] Y. Kinemuchi, K. Ishizaka, H. Suematsu, W. Jiang and K. Yatsui, Magnetic
Properties of Nanosize NiFe2O4 Particles Synthesized by Pulsed Wire Discharge, Thin
Solid Films, 407 (2002) 109-113.

115
[152] M. George, A.M. John, S.S. Nair, P. Joy and M. Anantharaman, Finite Size Effects
on the Structural and Magnetic Properties of Sol–Gel Synthesized NiFe2O4 Powders, J.
Magn. Magn. Mater., 302 (2006) 190-195.
[153] A. Mantlikova, J.P. Vejpravova, P. Holec, J. Plocek and D. Niznansky, Magnetic
Properties of TCr2O4 (T= Co, Ni) Fine Powders and TCr2O4/SiO2 Nanocomposites, in:
IOP Conference Series: Materials Science and Engineering, IOP Publishing, 2011, pp.
032022.
[154] D. Zákutná, A. Repko, I. Matulková, D. Nižňanský, A. Ardu, C. Cannas, A.
Mantlíková and J. Vejpravová, Hydrothermal Synthesis, Characterization, and Magnetic
Properties of Cobalt Chromite Nanoparticles, J. Nanopart. Res., 16 (2014) 1-14.
[155] R. Darrie, W. Doyle and I. Kirkpatrick, Spectra and Thermal Decomposition of
Chromates (Vi) of Magnesium, Lanthanum, Neodymium and Samarium, J. Inorg. Nucl.
Chem., 29 (1967) 979-992.
[156] M. Ushakov, M. Oshtrakh, I. Felner, A. Semenova, D. Kellerman, V. Šepelák, V.
Semionkin and P. Morais, Magnetic Properties of Iron Oxide-Based Nanoparticles: Study
Using Mössbauer Spectroscopy with a High Velocity Resolution and Magnetization
Measurements, J. Magn. Magn. Mater., 431 (2017) 46-48.
[157] R.H. Kodama and A.E. Berkowitz, Atomic-Scale Magnetic Modeling of Oxide
Nanoparticles, Phys. Rev. B, 59 (1999) 6321.
[158] A. Berkowitz and K. Takano, Exchange Anisotropy—a Review, J. Magn. Magn.
Mater., 200 (1999) 552-570.
[159] B. Martinez, X. Obradors, L. Balcells, A. Rouanet and C. Monty, Low Temperature
Surface Spin-Glass Transition in γ-Fe2O3 Nanoparticles, Phys. Rev. Lett., 80 (1998) 181.
[160] E. Tronc, A. Ezzir, R. Cherkaoui, C. Chanéac, M. Nogues, H. Kachkachi, D. Fiorani,
A. Testa, J. Greneche and J. Jolivet, Surface-Related Properties of γ-Fe2O3 Nanoparticles,
J. Magn. Magn. Mater., 221 (2000) 63-79.
[161] C. Letti, L. Paterno, M. Pereira-da-Silva, P. Morais and M. Soler, The Role of
Polymer Films on the Oxidation of Magnetite Nanoparticles, J. Solid State Chem., 246
(2017) 57-64.
116
[162] G.S. An, S.W. Choi, D.H. Chae, H.S. Lee, H.-J. Kim, Y. Kim, Y.-G. Jung and S.-C.
Choi, γ-Fe2O3@ SiO2 Core-Shell Structured Nanoparticle: Fabrication Via Surface
Treatment, Ceram. Int. 43 (2017) 12888-12892.
[163] K. Brymora and F. Calvayrac, Surface Anisotropy of Iron Oxide Nanoparticles and
Slabs from First Principles: Influence of Coatings and Ligands as a Test of the Heisenberg
Model, J. Magn. Magn. Mater., 434 (2017) 14-22.
[164] D. Fiorani, A. Testa, F. Lucari, F. D’orazio and H. Romero, Magnetic Properties of
Maghemite Nanoparticle Systems: Surface Anisotropy and Interparticle Interaction
Effects, Physica B Condens Matter., 320 (2002) 122-126.
[165] M. Herlitschke, S. Disch, I. Sergueev, K. Schlage, E. Wetterskog, L. Bergström and
R.P. Hermann, Spin Disorder in Maghemite Nanoparticles Investigated Using Polarized
Neutrons and Nuclear Resonant Scattering, in: Journal of Physics: Conference Series, IOP
Publishing, 2016, pp. 012002.
[166] Y. Prado, N. Daffé, A. Michel, T. Georgelin, N. Yaacoub, J.-M. Greneche, F.
Choueikani, E. Otero, P. Ohresser and M.-A. Arrio, Enhancing the Magnetic Anisotropy
of Maghemite Nanoparticles Via the Surface Coordination of Molecular Complexes, Nat.
Commun., 6 (2015) 10139.
[167] M. Azhdarzadeh, F. Atyabi, A.A. Saei, B.S. Varnamkhasti, Y. Omidi, M. Fateh, M.
Ghavami, S. Shanehsazzadeh and R. Dinarvand, Theranostic Muc-1 Aptamer Targeted
Gold Coated Superparamagnetic Iron Oxide Nanoparticles for Magnetic Resonance
Imaging and Photothermal Therapy of Colon Cancer, Colloids Surf. B, 143 (2016) 224-
232.
[168] K. Girisha, K.S. Rao, K. Anil and S. Sanman, Experimental Investigation on Erosive
Wear Behaviour of Plasma Spray Coated Stainless Steel, in: IOP Conference Series:
Materials Science and Engineering, IOP Publishing, 2017, pp. 012022.
[169] N. He, H. Li, L. Ji, X. Liu, H. Zhou and J. Chen, Reusable Chromium Oxide Coating
with Lubricating Behavior from 25 to 1000° C Due to a Self-Assembled Mesh-Like
Surface Structure, Surf. Coat. Technol., 321 (2017) 300-308.
[170] H. Şahan, H. Göktepe, Ş. Patat and A. Ülgen, Effect of the Cr2O3 Coating on
Electrochemical Properties of Spinel LiMn2O4 as a Cathode Material for Lithium Battery
Applications, Solid State Ionics, 181 (2010) 1437-1444.

117
[171] L. Sun, J. Guo, R. Zhang, E. Cao, Y. Zhang, W. Hao and L. Ju, Influence of Cu2+
Doping on the Structure, Dielectric and Magnetic Properties of NiFe2O4 Prepared by the
Sol-Gel Method, J. Magn. Magn. Mater., 449 (2018) 545-551.
[172] S. Rajput, L.P. Singh, C.U. Pittman and D. Mohan, Lead (Pb2+) and Copper (Cu2+)
Remediation from Water Using Superparamagnetic Maghemite (γ-Fe2O3) Nanoparticles
Synthesized by Flame Spray Pyrolysis (FSP), J. Colloid Interface Sci., 492 (2017) 176-
190.
[173] K. Mohanapandiana and A. Krishnanb, Synthesis, Structural, Morphological and
Optical Properties of Cu+2 Doped Cr2O3 Nanoparticles, Int J Adv Engg Tech., 273 (2016)
279.
[174] M. Kamran, A. Ullah, Y. Mehmood, K. Nadeem and H. Krenn, Role of SiO2 Coating
in Multiferroic CoCr2O4 Nanoparticles, AIP Adv., 7 (2017) 025011.
[175] M. Kamran, A. Ullah, S. Rahman, A. Tahir, K. Nadeem, M.A. ur Rehman and S.
Hussain, Structural, Magnetic, and Dielectric Properties of Multiferroic Co1− xMgCr2O4
Nanoparticles, J. Magn. Magn. Mater., 433 (2017) 178-186.
[176] L. Néel, Théorie Du Traînage Magnétique De Diffusion, J. phys. radium, 13 (1952)
249-264.
[177] W.F. Brown Jr, Thermal Fluctuations of a Single-Domain Particle, Phys. Rev., 130
(1963) 1677.
[178] J.C. Denardin, A. Brandl, M. Knobel, P. Panissod, A. Pakhomov, H. Liu and X.
Zhang, Thermoremanence and Zero-Field-Cooled/Field-Cooled Magnetization Study of
Cox(SiO2)1− x Granular Films, Phys. Rev. B, 65 (2002) 064422.
[179] V. Tzitzios, G. Basina, A. Bakandritsos, C.G. Hadjipanayis, H. Mao, D. Niarchos,
G.C. Hadjipanayis, J. Tucek and R. Zboril, Immobilization of Magnetic Iron Oxide
Nanoparticles on Laponite Discs–an Easy Way to Biocompatible Ferrofluids and
Ferrogels, J. Mater. Chem., 20 (2010) 5418-5428.
[180] J. Smit and H.P.J. Wijn, Ferrites: Physical Properties of Ferrimagnetic Oxides in
Relation to Their Technical Applications, Wiley, 1959.
[181] K. Trohidou, Monte Carlo Studies of Surface and Interface Effects in Magnetic
Nanoparticles, Surface Effects in Magnetic Nanoparticles, Springer, Boston (2005) 45-74.

118
[182] M.U. Rahman, M. Usman, S.K. Hasanain, A. Ullah and I.W. Kim, Static Magnetic
Properties of Maghemite Nanoparticles, J. Korean Phys. Soc., 65 (2014) 1925-1929.
[183] R. Aragón, Magnetization and Exchange in Nonstoichiometric Magnetite, Phys. Rev.
B, 46 (1992) 5328.
[184] D.T.T. Nguyet, N.P. Duong, L.T. Hung, T.D. Hien and T. Satoh, Crystallization and
Magnetic Behavior of Nanosized Nickel Ferrite Prepared by Citrate Precursor Method, J.
Alloys Compd., 509 (2011) 6621-6625.
[185] D. Zhang, K. Klabunde, C. Sorensen and G. Hadjipanayis, Magnetization
Temperature Dependence in Iron Nanoparticles, Phys. Rev. B, 58 (1998) 14167.
[186] B. Molina-Concha, R.D. Zysler and H. Romero, Anomalous Magnetization
Enhancement and Frustration in the Internal Magnetic Order on (Fe0.69Co0.31)B0.4
Nanoparticles, Applied Sciences, 2 (2012) 315-326.
[187] S. Chen and P. Andre, Colloidal Syntheses of FePt Nanoparticles, Int J Nanotechnol.,
9 (2012) 39-68.
[188] C. Chinnasamy, A. Narayanasamy, N. Ponpandian, R.J. Joseyphus, B. Jeyadevan, K.
Tohji and K. Chattopadhyay, Grain Size Effect on the Néel Temperature and Magnetic
Properties of Nanocrystalline NiFe2O4 Spinel, J. Magn. Magn. Mater., 238 (2002) 281-
287.
[189] V. Singh, M. Seehra and J. Bonevich, Ac Susceptibility Studies of Magnetic
Relaxation in Nanoparticles of Ni Dispersed in Silica, J. Appl. Phys., 105 (2009) 07B518.
[190] D. Kim, Y. Zhang, W. Voit, K. Rao and M. Muhammed, Synthesis and
Characterization of Surfactant-Coated Superparamagnetic Monodispersed Iron Oxide
Nanoparticles, J. Magn. Magn. Mater., 225 (2001) 30-36.
[191] B. Aslibeiki, P. Kameli, H. Salamati, M. Eshraghi and T. Tahmasebi, Superspin Glass
State in MnFe2O4 Nanoparticles, J. Magn. Magn. Mater., 322 (2010) 2929-2934.
[192] S. Shtrikman and E. Wohlfarth, The Theory of the Vogel-Fulcher Law of Spin
Glasses, Phys. Lett. A, 85 (1981) 467-470.
[193] S. Mørup, Superparamagnetism and Spin Glass Ordering in Magnetic
Nanocomposites, EPL, 28 (1994) 671.
[194] K. Fischer and J. Hertz, Spin-Glasses, Volume 1 of Cambridge Studies in Magnetism,
in, Cambridge university press, Cambridge, 1991.

119
[195] J. Mohapatra, A. Mitra, D. Bahadur and M. Aslam, Superspin Glass Behavior of
Self-Interacting CoFe2O4 Nanoparticles, J. Alloys Compd., 628 (2015) 416-423.
[196] T. Shinde, A. Gadkari and P. Vasambekar, Dc Resistivity of Ni–Zn Ferrites Prepared
by Oxalate Precipitation Method, Mater. Chem. Phys., 111 (2008) 87-91.
[197] P. Luo and T. Nieh, Preparing Hydroxyapatite Powders with Controlled Morphology,
Biomaterials, 17 (1996) 1959-1964.
[198] E. El-Ghazzawy and S. Alamri, NiCrxFe2−xO4 Ferrite Nanoparticles and Their
Composites with Polypyrrole: Synthesis, Characterization and Magnetic Properties, Bull.
Mater. Sci., 38 (2015) 915-924.
[199] S. Son, M. Taheri, E. Carpenter, V. Harris and M. McHenry, Synthesis of Ferrite and
Nickel Ferrite Nanoparticles Using Radio-Frequency Thermal Plasma Torch, J. Appl.
Phys., 91 (2002) 7589-7591.
[200] M. Raghasudha, D. Ravinder and P. Veerasomaiah, Magnetic Properties of Cr-
Substituted Co-Ferrite Nanoparticles Synthesized by Citrate-Gel Autocombustion Method,
J Nanostruct Chem., 3 (2013) 63.
[201] W. Zhang, X. Zuo, D. Zhang, C. Wu and S.R.P. Silva, Cr3+ Substituted Spinel Ferrite
Nanoparticles with High Coercivity, Nanotechnology, 27 (2016) 245707.
[202] D. Han, J. Wang and H. Luo, Crystallite Size Effect on Saturation Magnetization of
Fine Ferrimagnetic Particles, J. Magn. Magn. Mater., 136 (1994) 176-182.
[203] T. Krieg and D.J. Mogul, Transcranial Magnetic Stimulation, in: Neural Engineering,
Springer, 2013, pp. 405-453.
[204] K.W. Wagner, Dielectric Relaxation in Distributed Dielectric Layers, Ann. Phys, 40
(1913) 817.
[205] E. Verwey, P. Haayman and F. Romeijn, Physical Properties and Cation
Arrangement of Oxides with Spinel Structures II. Electronic Conductivity, J. Chem. Phys.,
15 (1947) 181-187.