Embed Size (px)
Citation preview
International Journal of Scientific Engineering and Applied Science (IJSEAS) – Volume-7, Issue-8, August 2021 ISSN: 2395-3470
www.ijseas.com
329
Study of Specific Capacitance of Graphene-Pani Based Nanocomposites as Electrodes of Supercapacitors
Suma NP
1P, Uma VP
2
1 Mount Carmel College, Bengaluru, India 2 Mount Carmel College, Bengaluru, India
Abstract:
Graphene-Pani nanocomposites were prepared by a simple physical mixing method. Different weight percentages of PANI were mixed with Graphene. As synthesized nanocomposites were used to fabricate the electrodes for supercapacitor application. Graphene which was synthesized using Modified Hummer’s Method was characterized using Raman spectroscopy, and SEM. PANI which was synthesized using interfacial polymerization was characterized using Uv-vis spectroscopy, and SEM. Graphene-Pani nanocomposites were also characterized by SEM.
The electrochemical measurements were carried out for the fabricated electrodesusing cyclic voltammetry. Results revealed that the sample with the 15% PANI exhibited the least specific capacitance of 253.25F/g compared to that of the sample with 5% PANI which resulted in 401.66F/g and 10% PANI which showed the highest specific capacitance of 593.8F/g. These data clearly illustrate that the simple method of physical mixing of two nanomaterials to produce the nanocomposites turned out to yield a specific capacitance as high as 593.8F/g.
Keywords: Graphene, PANI, nanocomposites, Supercapacitors, Specific Capacitance
1. Introduction:
Owing to the high power density and rapid charge-discharge rate, supercapacitors are becoming popular
and drawing the attention of the researchers. They find their immense potential applications in different
fields starting from transport to military, from medicine to aviation, and from energy recovery to
renewable energy technologies[1].
Depending on the energy storage mechanism, “supercapacitors are classified into three classes:
Pseudocapacitors, Electrochemical Double-Layer Capacitors (EDLCs), and hybrid supercapacitors”[2].
Supercapacitors store energy electrostatically by charge segregation in Helmholtz double layer at the
electrode-electrolyte interface[1]. This is a non-faradic action. Because there is no electron transport over
the electrode-electrolyte interface, no chemical changes occur in the electrode. In pseudocapacitors, the
charge storage is due to the faradic process resulting from the redox reactions at the surface, referred to as
International Journal of Scientific Engineering and Applied Science (IJSEAS) – Volume-7, Issue-8, August 2021 ISSN: 2395-3470
www.ijseas.com
330
electrosorption of ions. Electron movement takes place across the current collector and the active
material[3].
The capacitive behavior of graphene is mainly due to the electrical double layer. The specific capacitance
of graphene is not considerably high. “The restacking of graphene sheets hinders the increase in the
specific capacitance”[4]. In order to obtain better capacitive performance, graphene is composited with
pseudocapacitive materials[5].
Among the conducting polymers, Polyaniline (PANI) has become the popular option for the fabrication
of energy storage devices as it has high conductivity, high specific capacitance, multi-redox reactions,
low cost, and high thermal stability [6].
The increased specific capacitance and improved stability can be obtained by using graphene PANI
nanocomposites. The role of Graphene is to provide the conducting lane for the high-speed movement of
ionic species and electric charges all over the composite electrode[7]. Whereas, PANI nanofibers
preclude the stacking and agglomeration of graphene sheets[8]. This provides a huge available surface
and excessive electrochemical consumption of the electrode[8].
Mazhar B. Tayelet al.fabricated the supercapacitor electrode using a stainless steel current
collector, by depositing a layer of graphene and spraying a layer of polyaniline on that graphene
layer[9].
Kang Li et al.prepared electrodes by electrochemically exfoliating graphene on A4 size paper as
ink and then PANI was electrochemically deposited on it[5].
Zhe-Fei Li et al. prepared composites of Graphene-Polyaniline (PANI) nanoparticle by reducing
GO in the presence of the various substance of PANI nanoparticles[4].
A Maddu et al. synthesized Graphene-PANI nanocomposite by in situ polymerization of aniline in
graphene suspension, with a difference of graphene mass to aniline molarity[10].
Formerly, many researchers have reported various methods used to synthesize Graphene/Polyaniline
nanocomposites. As prepared nanocomposites were used in the fabrication supercapacitor electrode.
In this work, Graphene-PANI nanocomposites were prepared using a simple physical mixing method
which is unique, simple, and cost-effective.
The objective of this work is to fabricate electrodes by mixing different weight percentages of PANI to
Graphene and to study their electrochemical behavior and calculate the specific capacitance in each case.
The electrochemical behavior of such electrodes was studied using cyclic voltammetry (CV).
International Journal of Scientific Engineering and Applied Science (IJSEAS) – Volume-7, Issue-8, August 2021 ISSN: 2395-3470
www.ijseas.com
331
2. Experimental:
2.1 Graphene synthesis
Graphene was synthesized using Modified Hummer's Method [11][12].
All the required chemicals were purchased from Vasa scientific, Bengaluru, India.
0.5g of graphite powder and 0.5g of Sodium Nitrate were added into 23ml of Sulphuric Acid in a flask
and stirred constantly for 4 Hours maintaining a low temperature. 3g of Potassium Permanganate was
added to the compound by maintaining the low temperature and the compound was stirred for an hour at
ambient temperature. 45 ml of distilled water was added gradually to the mixture and was heated to high
temperature for 2hrs. To this 10ml of Hydrogen Peroxide solution was added and stirred for an hour. The
resultant solution is Graphene Oxide (GO) solution[11].
Finally, the precipitates were treated with HCl and distilled water, and the mixture was filtered and dried
to obtain GO nanoparticles[12].
Reduction of GO to rGO
Ascorbic acid was mixed with 0.25g of GO in distilled water and heated at 70 P
0PC. The resulting brownish
solution was washed with water and ethanol to get reduced Graphene oxide [13].
2.2 PANI synthesis
PANI was synthesized using the interfacial polymerization method[14]. “Two varieties of mixtures were
prepared: (i)120 mL hydrochloric acid with 4 mmole Ammonium Persulfate; and (ii) 20 mL chloroform
containing 4 mmole aniline. Boththe solutions were stirred witha magnetic stirrer for an hour. The
oxidant solution was slowly transferred to the aniline solution. After 24 hours, due to the reaction, green
Polyaniline nanofibers were formed. The obtained black-green Polyaniline nanofibers were cleaned and
dried at ambient temperature for 24 hours”[14].
2.3 Graphene PANI nanocomposites:
Graphene and PANI powders were milled and mixed at different weight ratios along with Polyvinylidene
fluoride (PVDF) to obtain the Graphene PANI nanocomposites. This mixture was coated on the cleaned
stainless steel substrates using the Doctor blade(or tape casting) method to obtain theelectrodes with
three different concentrations for comparison.
Graphene was taken as the main material and 5%, 10%, and 15% of PANI were added to get GP1, GP2,
and GP3 electrodes respectively.
International Journal of Scientific Engineering and Applied Science (IJSEAS) – Volume-7, Issue-8, August 2021 ISSN: 2395-3470
www.ijseas.com
332
2.4 Material characterization and electrochemical measurements
The morphologies of the Graphene/Pani samples were found by applying the Field-Emission Scanning
Electron Microscopy (FE-SEM, Nova NanoSEM 230, FEI, Oregon, USA) the UV-vis
spectrophotometer, and Raman spectroscopy. “The cyclic voltammetry (CV) plots were obtained by
using a potentiostat/galvanostat (PGSTAT 204, Autolab, Eco–Chemie, the Netherlands) carried out with
a three-electrode electrochemical system, where the Graphene/PANI composites were used as the
working electrode, a Platinum wire was used as the counter electrode, and an Ag/AgCl/saturated KCl
electrode was used as the reference electrode in a 1 M KCl solution”. The electrolyte used is 1 M KOH.
3. Results and discussion:
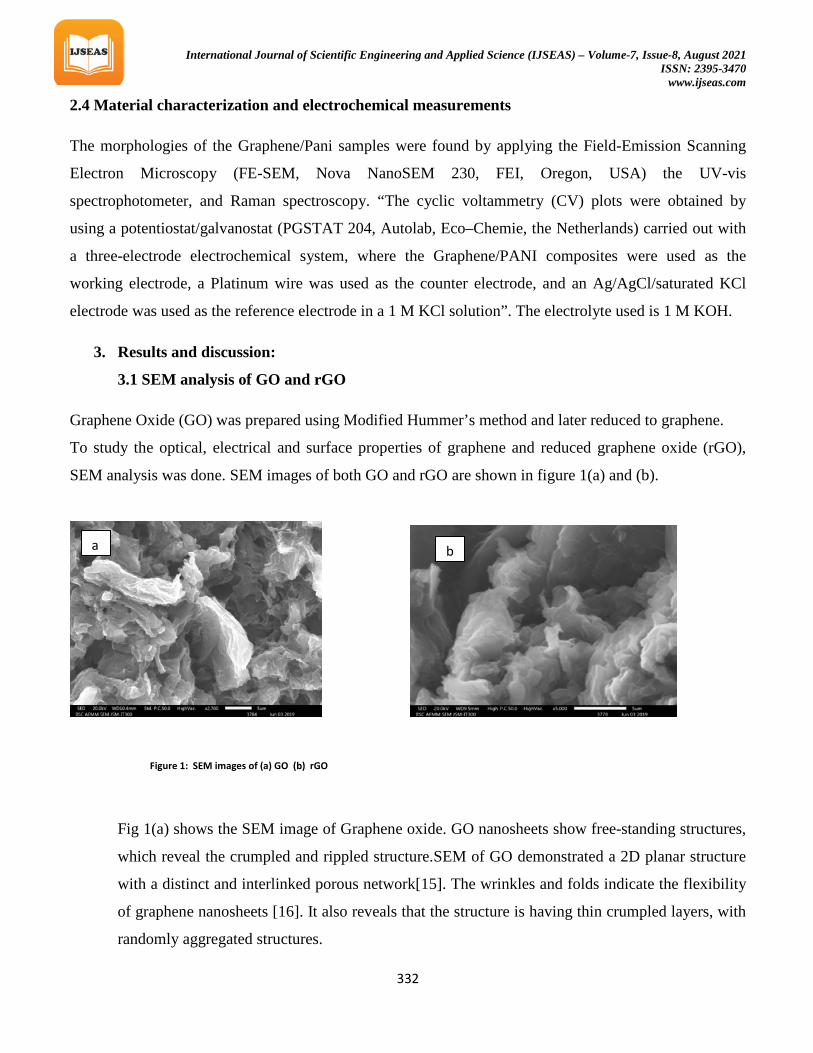
3.1 SEM analysis of GO and rGO
Graphene Oxide (GO) was prepared using Modified Hummer’s method and later reduced to graphene.
To study the optical, electrical and surface properties of graphene and reduced graphene oxide (rGO),
SEM analysis was done. SEM images of both GO and rGO are shown in figure 1(a) and (b).
Fig 1(a) shows the SEM image of Graphene oxide. GO nanosheets show free-standing structures,
which reveal the crumpled and rippled structure.SEM of GO demonstrated a 2D planar structure
with a distinct and interlinked porous network[15]. The wrinkles and folds indicate the flexibility
of graphene nanosheets [16]. It also reveals that the structure is having thin crumpled layers, with
randomly aggregated structures.
Figure 1: SEM images of (a) GO (b) rGO
a b
International Journal of Scientific Engineering and Applied Science (IJSEAS) – Volume-7, Issue-8, August 2021 ISSN: 2395-3470
www.ijseas.com
333
SEM images (Figure 1(b)) show the morphology of reduced graphene oxide. “It indicates the
randomly oriented crumpled silk veil waves. The nanosheets are found to be rippled and
entangled with each other. The lamella-like structure of wrinkled rGO nanosheets is because of
the Van-der Waal's interactions”[17].
3.2 Raman Spectroscopy
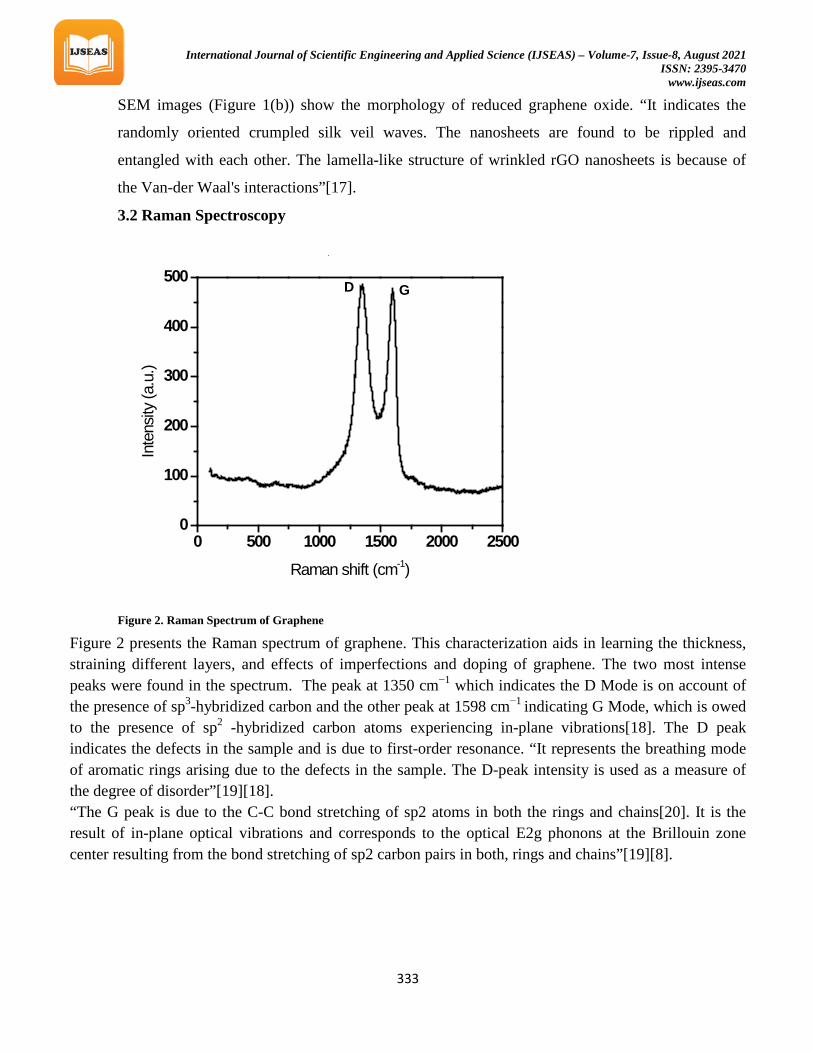
Figure 2. Raman Spectrum of Graphene
Figure 2 presents the Raman spectrum of graphene. This characterization aids in learning the thickness, straining different layers, and effects of imperfections and doping of graphene. The two most intense peaks were found in the spectrum. The peak at 1350 cm P
−1P which indicates the D Mode is on account of
the presence of sp P
3P-hybridized carbon and the other peak at 1598 cm P
−1 Pindicating G Mode, which is owed
to the presence of sp P
2P -hybridized carbon atoms experiencing in-plane vibrations[18]. The D peak
indicates the defects in the sample and is due to first-order resonance. “It represents the breathing mode of aromatic rings arising due to the defects in the sample. The D-peak intensity is used as a measure of the degree of disorder”[19][18]. “The G peak is due to the C-C bond stretching of sp2 atoms in both the rings and chains[20]. It is the result of in-plane optical vibrations and corresponds to the optical E2g phonons at the Brillouin zone center resulting from the bond stretching of sp2 carbon pairs in both, rings and chains”[19][8].
0 500 1000 1500 2000 25000
100
200
300
400
500GD
Inte
nsity
(a.u
.)
Raman shift (cm-1)
International Journal of Scientific Engineering and Applied Science (IJSEAS) – Volume-7, Issue-8, August 2021 ISSN: 2395-3470
www.ijseas.com
334
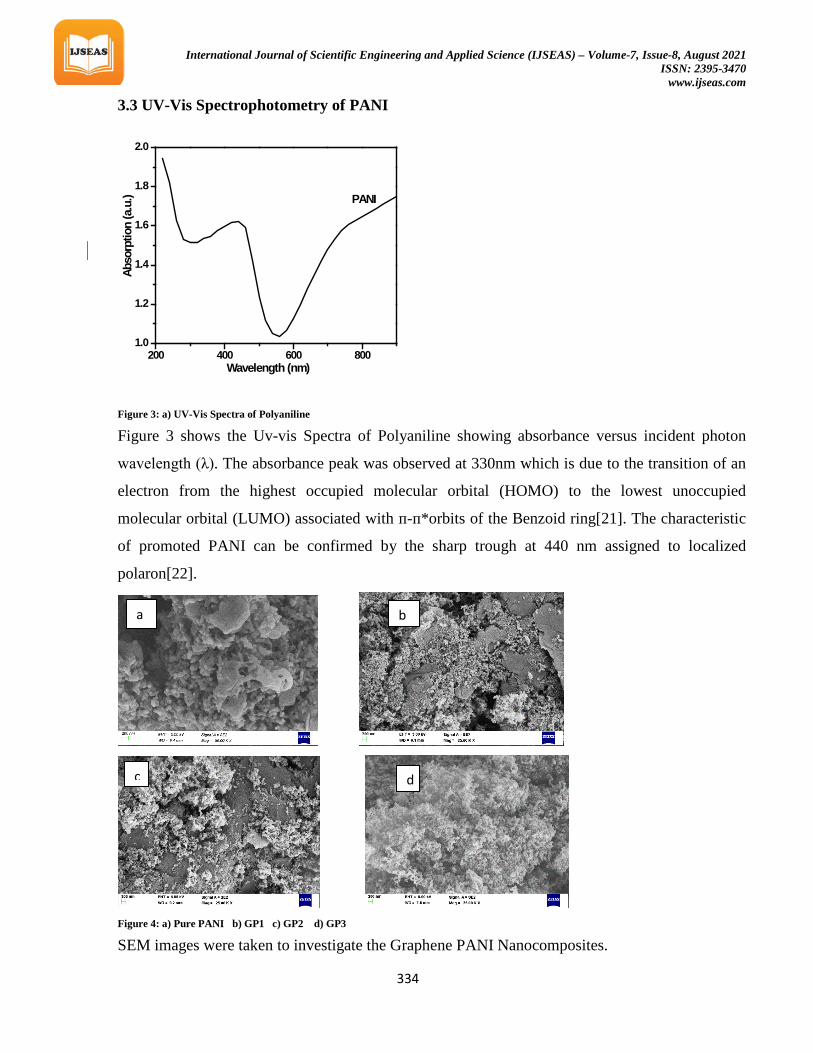
3.3 UV-Vis Spectrophotometry of PANI
Figure 3: a) UV-Vis Spectra of Polyaniline
Figure 3 shows the Uv-vis Spectra of Polyaniline showing absorbance versus incident photon
wavelength (λ). The absorbance peak was observed at 330nm which is due to the transition of an
electron from the highest occupied molecular orbital (HOMO) to the lowest unoccupied
molecular orbital (LUMO) associated with ᴨ-ᴨ*orbits of the Benzoid ring[21]. The characteristic
of promoted PANI can be confirmed by the sharp trough at 440 nm assigned to localized
polaron[22].
Figure 4: a) Pure PANI b) GP1 c) GP2 d) GP3
SEM images were taken to investigate the Graphene PANI Nanocomposites.
200 400 600 8001.0
1.2
1.4
1.6
1.8
2.0
PANI
Ab
sorp
tion
(a.u
.)
Wavelength (nm)
a b
c d
International Journal of Scientific Engineering and Applied Science (IJSEAS) – Volume-7, Issue-8, August 2021 ISSN: 2395-3470
www.ijseas.com
335
Figure 4 shows, FESEM images of pure PANI and rGO/PANI composite with different concentrations of
PANI in Graphene. Fig 4. a shows SEM image for Pure PANI which reveals an amorphous structure with
fiber-like morphology[23].The addition of PANI to rGO changes the surface morphology of the
composite. Fig (b) to (d) show the rGO/PANI composites, which indicate the rough and porous surface
morphology. The porous structure of the composite aids in the perforation of electrolyte which, facilitates
in improving the contact area that lies between the electrode and electrolyte. This inturn changes the
specific capacitance. The cascading structure of PANI results in Mace-like morphology. This kind of
structure facilitates in enhancing the specific surface area and electrical conductivity of the composite.
Different compositions lead to change in composite morphologies, influencing the electrochemical
behaviors of the supercapacitor electrodes[24].
3.4 Electrochemical Analysis of rGO/PANI composite electrodes
“Electrochemical characterizations were performed on a regular three-electrode setup consisting of
saturated calomel electrode (SCE), Platinum (Pt) wire, and graphene/PANI nanocomposite coated
electrode used as a reference, counter, and working electrodes, respectively”. All experiments were
carried out at room temperature in ambient conditions with an aqueous 1M Potassium Hydroxide (KOH)
electrolyte.
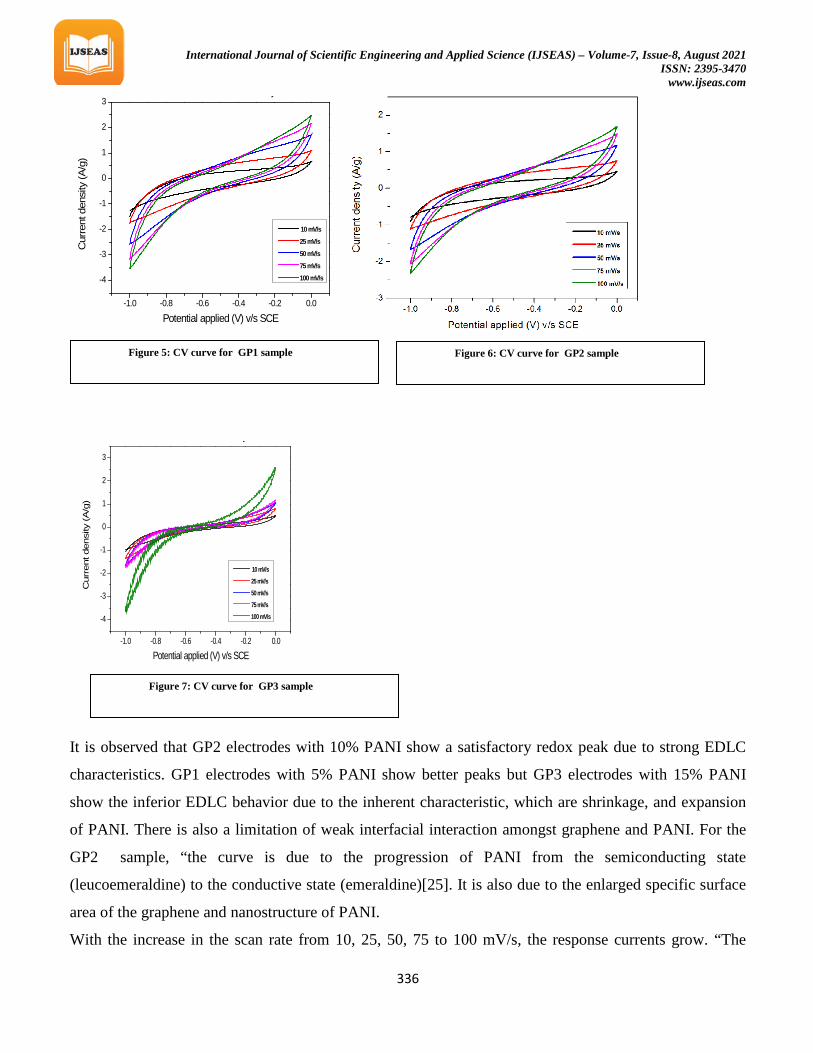
Cyclic Voltammetry (CV) measurements were carried out for all the samples in the potential window of
0V to -1.0V. The effect of scan rates (from 10mV/s to 100 mV/s) was found. Figure 6, 7, and 8 show the
CV curves of GP1, GP2, and GP3 electrodes respectively at different scan rates. The specific capacitance
for all the samples was calculated using the following formula
𝐶𝑠 =1
𝑉𝑚 (𝑉𝑎 − 𝑉𝑐)� 𝐼𝑑𝑉𝑉𝑐
𝑉𝑎
where Cs is the specific capacitance,
V is the scan rate (V/s),
m is the active mass of electrode (g),
Va-Vc is the voltage window (V).
International Journal of Scientific Engineering and Applied Science (IJSEAS) – Volume-7, Issue-8, August 2021 ISSN: 2395-3470
www.ijseas.com
336
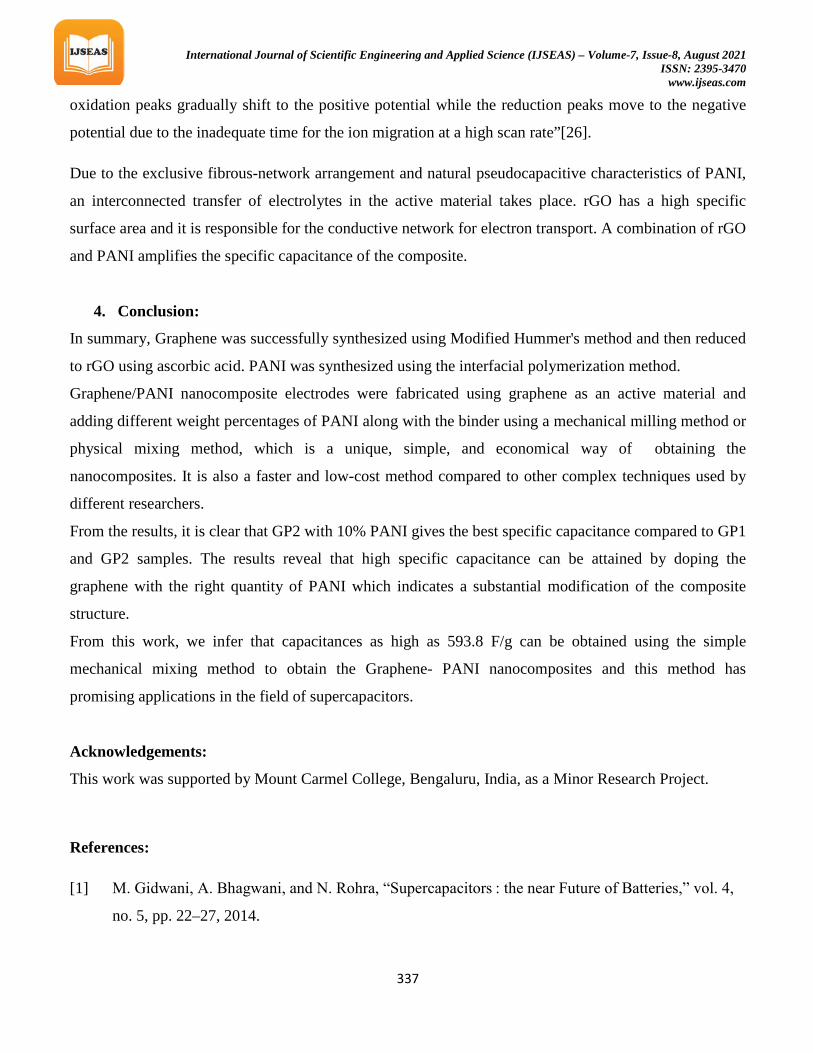
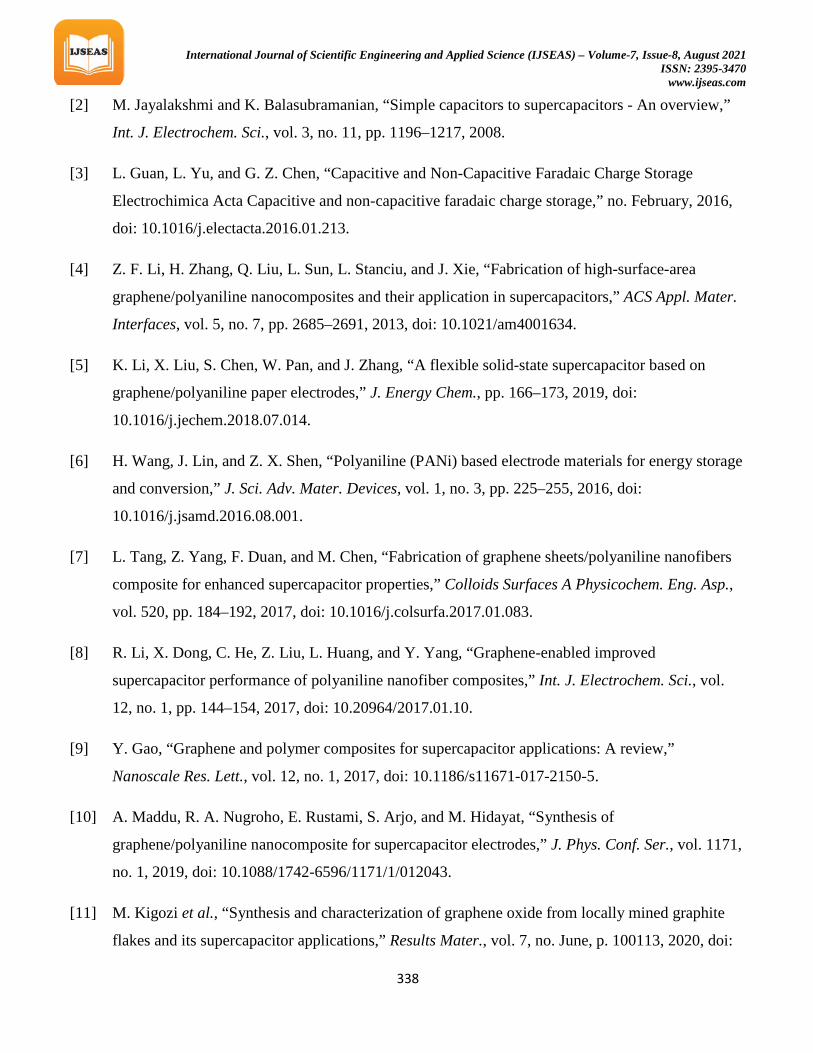
It is observed that GP2 electrodes with 10% PANI show a satisfactory redox peak due to strong EDLC
characteristics. GP1 electrodes with 5% PANI show better peaks but GP3 electrodes with 15% PANI
show the inferior EDLC behavior due to the inherent characteristic, which are shrinkage, and expansion
of PANI. There is also a limitation of weak interfacial interaction amongst graphene and PANI. For the
GP2 sample, “the curve is due to the progression of PANI from the semiconducting state
(leucoemeraldine) to the conductive state (emeraldine)[25]. It is also due to the enlarged specific surface
area of the graphene and nanostructure of PANI.
With the increase in the scan rate from 10, 25, 50, 75 to 100 mV/s, the response currents grow. “The
-1.0 -0.8 -0.6 -0.4 -0.2 0.0
-4
-3
-2
-1
0
1
2
3
C
urre
nt d
ensi
ty (A
/g)
Potential applied (V) v/s SCE
10 mV/s 25 mV/s 50 mV/s 75 mV/s 100 mV/s
y
-1.0 -0.8 -0.6 -0.4 -0.2 0.0
-4
-3
-2
-1
0
1
2
3
Cur
rent
den
sity
(A
/g)
Potential applied (V) v/s SCE
10 mV/s 25 mV/s 50 mV/s 75 mV/s 100 mV/s
y
Figure 5: CV curve for GP1 sample
Figure 6: CV curve for GP2 sample
Figure 7: CV curve for GP3 sample
International Journal of Scientific Engineering and Applied Science (IJSEAS) – Volume-7, Issue-8, August 2021 ISSN: 2395-3470
www.ijseas.com
337
oxidation peaks gradually shift to the positive potential while the reduction peaks move to the negative
potential due to the inadequate time for the ion migration at a high scan rate”[26].
Due to the exclusive fibrous-network arrangement and natural pseudocapacitive characteristics of PANI,
an interconnected transfer of electrolytes in the active material takes place. rGO has a high specific
surface area and it is responsible for the conductive network for electron transport. A combination of rGO
and PANI amplifies the specific capacitance of the composite.
4. Conclusion:
In summary, Graphene was successfully synthesized using Modified Hummer's method and then reduced
to rGO using ascorbic acid. PANI was synthesized using the interfacial polymerization method.
Graphene/PANI nanocomposite electrodes were fabricated using graphene as an active material and
adding different weight percentages of PANI along with the binder using a mechanical milling method or
physical mixing method, which is a unique, simple, and economical way of obtaining the
nanocomposites. It is also a faster and low-cost method compared to other complex techniques used by
different researchers.
From the results, it is clear that GP2 with 10% PANI gives the best specific capacitance compared to GP1
and GP2 samples. The results reveal that high specific capacitance can be attained by doping the
graphene with the right quantity of PANI which indicates a substantial modification of the composite
structure.
From this work, we infer that capacitances as high as 593.8 F/g can be obtained using the simple
mechanical mixing method to obtain the Graphene- PANI nanocomposites and this method has
promising applications in the field of supercapacitors.
Acknowledgements:
This work was supported by Mount Carmel College, Bengaluru, India, as a Minor Research Project.
References:
[1] M. Gidwani, A. Bhagwani, and N. Rohra, “Supercapacitors : the near Future of Batteries,” vol. 4,
no. 5, pp. 22–27, 2014.
International Journal of Scientific Engineering and Applied Science (IJSEAS) – Volume-7, Issue-8, August 2021 ISSN: 2395-3470
www.ijseas.com
338
[2] M. Jayalakshmi and K. Balasubramanian, “Simple capacitors to supercapacitors - An overview,”
Int. J. Electrochem. Sci., vol. 3, no. 11, pp. 1196–1217, 2008.
[3] L. Guan, L. Yu, and G. Z. Chen, “Capacitive and Non-Capacitive Faradaic Charge Storage
Electrochimica Acta Capacitive and non-capacitive faradaic charge storage,” no. February, 2016,
doi: 10.1016/j.electacta.2016.01.213.
[4] Z. F. Li, H. Zhang, Q. Liu, L. Sun, L. Stanciu, and J. Xie, “Fabrication of high-surface-area
graphene/polyaniline nanocomposites and their application in supercapacitors,” ACS Appl. Mater.
Interfaces, vol. 5, no. 7, pp. 2685–2691, 2013, doi: 10.1021/am4001634.
[5] K. Li, X. Liu, S. Chen, W. Pan, and J. Zhang, “A flexible solid-state supercapacitor based on
graphene/polyaniline paper electrodes,” J. Energy Chem., pp. 166–173, 2019, doi:
10.1016/j.jechem.2018.07.014.
[6] H. Wang, J. Lin, and Z. X. Shen, “Polyaniline (PANi) based electrode materials for energy storage
and conversion,” J. Sci. Adv. Mater. Devices, vol. 1, no. 3, pp. 225–255, 2016, doi:
10.1016/j.jsamd.2016.08.001.
[7] L. Tang, Z. Yang, F. Duan, and M. Chen, “Fabrication of graphene sheets/polyaniline nanofibers
composite for enhanced supercapacitor properties,” Colloids Surfaces A Physicochem. Eng. Asp.,
vol. 520, pp. 184–192, 2017, doi: 10.1016/j.colsurfa.2017.01.083.
[8] R. Li, X. Dong, C. He, Z. Liu, L. Huang, and Y. Yang, “Graphene-enabled improved
supercapacitor performance of polyaniline nanofiber composites,” Int. J. Electrochem. Sci., vol.
12, no. 1, pp. 144–154, 2017, doi: 10.20964/2017.01.10.
[9] Y. Gao, “Graphene and polymer composites for supercapacitor applications: A review,”
Nanoscale Res. Lett., vol. 12, no. 1, 2017, doi: 10.1186/s11671-017-2150-5.
[10] A. Maddu, R. A. Nugroho, E. Rustami, S. Arjo, and M. Hidayat, “Synthesis of
graphene/polyaniline nanocomposite for supercapacitor electrodes,” J. Phys. Conf. Ser., vol. 1171,
no. 1, 2019, doi: 10.1088/1742-6596/1171/1/012043.
[11] M. Kigozi et al., “Synthesis and characterization of graphene oxide from locally mined graphite
flakes and its supercapacitor applications,” Results Mater., vol. 7, no. June, p. 100113, 2020, doi:
International Journal of Scientific Engineering and Applied Science (IJSEAS) – Volume-7, Issue-8, August 2021 ISSN: 2395-3470
www.ijseas.com
339
10.1016/j.rinma.2020.100113.
[12] N. I. Zaaba, K. L. Foo, U. Hashim, S. J. Tan, W. W. Liu, and C. H. Voon, “Synthesis of Graphene
Oxide using Modified Hummers Method: Solvent Influence,” Procedia Eng., vol. 184, pp. 469–
477, 2017, doi: 10.1016/j.proeng.2017.04.118.
[13] E. Andrijanto, S. Shoelarta, G. Subiyanto, and S. Rifki, “Facile synthesis of graphene from
graphite using ascorbic acid as reducing agent,” AIP Conf. Proc., vol. 1725, no. April 2016, 2016,
doi: 10.1063/1.4945457.
[14] A. Abdolahi, E. Hamzah, Z. Ibrahim, and S. Hashim, “Synthesis of uniform polyaniline nanofibers
through interfacial polymerization,” Materials (Basel)., vol. 5, no. 8, pp. 1487–1494, 2012, doi:
10.3390/ma5081487.
[15] L. Lu, H. Tian, J. He, and Q. Yang, “Graphene-MnO2 Hybrid Nanostructure as a New Catalyst for
Formaldehyde Oxidation,” J. Phys. Chem. C, vol. 120, no. 41, pp. 23660–23668, 2016, doi:
10.1021/acs.jpcc.6b08312.
[16] M. Hu, Z. Yao, and X. Wang, “Characterization techniques for graphene-based materials in
catalysis,” AIMS Mater. Sci., vol. 4, no. 3, pp. 755–788, 2017, doi: 10.3934/matersci.2017.3.755.
[17] H. Saleem, M. Haneef, and H. Y. Abbasi, “Synthesis route of reduced graphene oxide via thermal
reduction of chemically exfoliated graphene oxide,” Mater. Chem. Phys., vol. 204, no. October,
pp. 1–7, 2018, doi: 10.1016/j.matchemphys.2017.10.020.
[18] A. S. Lemine, M. M. Zagho, T. M. Altahtamouni, and N. Bensalah, “Graphene a promising
electrode material for supercapacitors—A review,” Int. J. Energy Res., vol. 42, no. 14, pp. 4284–
4300, 2018, doi: 10.1002/er.4170.
[19] S. N. Alam, N. Sharma, and L. Kumar, “Synthesis of Graphene Oxide (GO) by Modified
Hummers Method and Its Thermal Reduction to Obtain Reduced Graphene Oxide (rGO)*,”
Graphene, vol. 06, no. 01, pp. 1–18, 2017, doi: 10.4236/graphene.2017.61001.
[20] N. Pradeep, A. Upendra Raju, and U. Venkataraman, “Influence of probe amplitude on the
preparation of graphene scroll by probe ultrasonicator technique,” Mater. Today Proc., no. xxxx,
2020, doi: 10.1016/j.matpr.2020.09.640.
International Journal of Scientific Engineering and Applied Science (IJSEAS) – Volume-7, Issue-8, August 2021 ISSN: 2395-3470
www.ijseas.com
340
[21] V. Chaitra, N. Pradeep, A. Nirmala Grace, V. Uma, “Electrodeposition and Characterization of
Polyaniline Films for the Detection of Staphylococcus Aureus Bacteria in Food Products,” Sens.
Lett., vol. 14, no. xx, pp. 1–6, 2016, doi: 10.1166/sl.2016.3739.
[22] A. G. Shrivas, N. S. Patil, and L. S. Patil, “Optimization of Electrical and Optical Properties of
Polyaniline for the Electronics Applications,” vol. 10, no. 12, pp. 53–56, 2020, doi: 10.9790/9622-
1012025356.
[23] M. M. Abutalib, “Insights into the structural, optical, thermal, dielectric, and electrical properties
of PMMA/PANI loaded with graphene oxide nanoparticles,” Phys. B Condens. Matter, vol. 552,
no. September 2018, pp. 19–29, 2019, doi: 10.1016/j.physb.2018.09.034.
[24] D. Gui, C. Liu, F. Chen, and J. Liu, “Preparation of polyaniline/graphene oxide nanocomposite for
the application of supercapacitor,” Appl. Surf. Sci., vol. 307, pp. 172–177, 2014, doi:
10.1016/j.apsusc.2014.04.007.
[25] Z. Gao et al., “Electrochemical synthesis of layer-by-layer reduced graphene oxide
sheets/polyaniline nanofibers composite and its electrochemical performance,” Electrochim. Acta,
vol. 91, pp. 185–194, 2013, doi: 10.1016/j.electacta.2012.12.119.
[26] X. Wang, D. Wu, X. Song, W. Du, X. Zhao, and D. Zhang, “Review on carbon/polyaniline
hybrids: Design and synthesis for supercapacitor,” Molecules, vol. 24, no. 12, 2019, doi:
10.3390/molecules24122263.


![Research Article Fabrication of PANI/C-TiO Composite ...PANI and MoOx, which exhibits high speci c capacitance and excellent cycle stability [ , ]. In this work, we demonstrated another](https://img.pdfslide.us/doc/110x75/60ac592aad1259173a37bd1d/research-article-fabrication-of-panic-tio-composite-pani-and-moox-which-exhibits.jpg)