Embed Size (px)
Citation preview
International Journal of Business Marketing and Management (IJBMM)
Volume 3 Issue 2 February 2018, P.P.01-12
ISSN: 2456-4559
www.ijbmm.com
International Journal of Business Marketing and Management (IJBMM) Page 1
Study of Service Quality and Patient Satisfaction to Trust
And Loyalty in Public Hospital, Indonesia
Titin Lestariningsih1, Ernani Hadiyati
2, Rini Astuti
3
1Master’s Graduates Gajayana University, Malang, East Java, Indonesia 2Lecturer Gajayana University, Malang, East Java, Indonesia 3Lecturer Gajayana University, Malang, East Java, Indonesia
ABSTRACT : Test and prove the relationship of service quality, patient satisfaction, trust, and loyalty directly
and through mediation. Population 6088 patients who had received inpatient service at public hospital Batu,
East Java, Indonesia. Questionnaire was given to 100 respondents. The data were processed with SPSS 21 and
SmartPLS 3.0. Hypothesis testing with Structural Equation Modeling-Partial Least Square (SEM-PLS) model
showed a significant and insignificant relationship between the variables. Service quality is not significant to
loyalty, but there are moderating variables that is trust. Trust strengthens the influence of service quality on
loyalty.
KEYWORDS –service quality, patient satisfaction, trust, loyalty
I. INTRODUCTION Health development is an effort to improve the health of the nation, so it needs the cooperation of all
society elements. The government of Indonesia opens an opportunity for private parties to involve in investing
in health sectors so there will bea competition between state-owned and private companies. Private hospitals
have convenient amenities, high standard service quality, and have comfortable atmosphere. Nowadays, public
hospitals recognize the importance of service quality where should be implemented for patients satisfaction,
trust, and may impacton their loyalty. Consumers will re-use hospital services if they get services according to
their needs. On the contrary, consumers who do not get good quality service will feel dissatisfied and may
switch to other health service organizations.
II. LITERATURE REVIEW 2.1 Service Quality
Kotler and Keller (2009: 143) states that the service quality is the number of features and products or
services characteristics that depend on the ability to meet consumers needs. According to Parasuraman, Berry,
and Zeithmal (1988) service quality (SERVQUAL) dimensions consist of 1) tangible, where this dimension
devided into: physical facilities, equipment, and personnel appearance; 2) reliability means ability to perform promised service performance; 3) responsiveness means willingness to provide services; 4) assurance means the
knowledge and honesty of employees that will foster trust; 5) empathy means caring, individual attention, and
company to the consumer. Furthermore, Hadiyati (2010) states that SERVQUAL dimension have significant
effect on customer loyalty.
Service quality is characteristic of service in providing quality and able to fulfill consumers
expectation. The dimensions of service quality are: 1) reliability: ease of understanding procedure; 2)
responsiveness: responsive to consumer complaints; 3) assurance: skills and responsibilities; 4) empathy:
attention and concern; 5) physical evidence: cleanliness of the room, environment, waiting room, and
convenient parking.
2.2 Patient Satisfaction Kotler and Keller (2007:177) states that customer satisfaction is a feeling of pleasure and
disappointment after comparing the results (performance) of the product with the expected results. Mowen and
Study of Service Quality and Patient Satisfaction to Trust and Loyalty......
International Journal of Business Marketing and Management (IJBMM) Page 2
Minor (2002:94) express that satisfaction and consumer dissatisfaction is the effect of comparing between
expectations before and after purchasing.
Customer satisfaction is a feeling of satisfaction after getting a service as the result of comparing
between the service performance and the desired expectations. Several customer satisfaction indicators are:
getting a good experience, satisfied service, service received is accordance with the cost incurred, and services
that exceed customer expectations.
2.3 Trust
Morgan and Hunt (1994) express that customers experience trust when there is comfort, reliability, and
integrity in partnering. Doney and Cannon (1997) express that trust is the sustainable ability to meet consumers
and generate positive outcomes in the future. In addition, Zerei et al. (2015) states the following dimensions of
hospital service confidence: claims that hospital services are good, fulfillment of commitments promised by hospitals, honest trustworthiness, caring, staffing commitments, staff require patient needs, and commitment
based on patient needs.
Trust is the ability to reference comfort, experience and build communication constantly to produce
good relationships in the future. Trust indicators consist of: commitment to problem solving, fulfillment of
promised commitments, and given service claims are good.
2.4 Loyalty
According to Mowen and Minor (2002:109), brand loyalty is "the actual wisdom of a customer who
exhibits a positive attitude toward a brand, is committed to the brand and intends to continue to buy it in the
future". Srivastava (2015) defines customer loyalty as a multidimension concept that built from basic behavioral
perspective in regards to re-purchasing by maintaining good relationship with sevice providers. Lupiyoadi (2001) divides loyalty dimensions into: sharing products or services advantage to others, recommending the
products or services to others, encouraging friends to do business, and considering being the primary choice in
buying products or services.
Loyalty is a behavior that is formed from experience, satisfaction, trust, commitment to a product or
service by repurchasing. Loyalty indicators are: reuse of products or services, convey positive things to
relatives, recommend, and encourage others to buy the same products or services.
2.5 Relationship Between Service Quality and Customer Satisfaction
Lupiyoadi (2001) suggests customers will feel satisfied if they get good service as they expected.
Arsanam et al. (2014) state that service quality adds patient satisfaction. Azizan & Mohammed (2013) state that
service quality variant fits customer satisfaction model.
2.6 Relationship Between Service Quality and Trust
Zarei et al. (2015) state that the interaction quality and process quality is the key determinant of patient
confidence in private hospitals. Kaffashi et al. (2014) suggest a strong correlation between service quality and
loyalty. Khan & Khan (2014) state that quality dimensions such as doctors service orientation, nurses service
orientation, hospitals, staff, and treatment costs have a positive effect on patient confidence in private hospitals.
2.7 Relationship Between Customer Satisfaction and Trust Astuti and Nagase (2014) state that customer satisfaction has significant effect on customer loyalty.
Zarei et al. (2015) state that the average score of patient's confidence perceptions was 3.80 and 4.01 for service
quality, 38% of the variance was patient confidence, explained by service quality dimensions. The quality of
interactions and processes is the strongest factor in predicting patient confidence.
2.8 Relationship Between Service Quality and Loyalty Patawayati et al. (2013) argue that the interaction between service performance and customer
satisfaction contributes customer loyalty. Patient satisfaction, trust and commitment act as the mediation
between service quality and loyalty. Kesuma et al. (2013) state that the existence of significant influence service
quality and loyalty.
2.9 Relationship Between Customer Satisfaction and Loyalty
According to Kotler and Keller (2007) customer satisfaction with disproportionate customer loyalty,
satisfied customers tend to buy back and give praise. High satisfaction or pleasure creates an emotional bond
with the brand or company, not merely a rational overload.
Study of Service Quality and Patient Satisfaction to Trust and Loyalty......
International Journal of Business Marketing and Management (IJBMM) Page 3
2.10 RelationshipBetween Trust andLoyalty
Patawayati et al. (2013) state that trust affects loyalty in a significantly positive manner, the higher the
trust the higher the patient loyalty will be.
2.11 Relationship Between Service Quality and Loyalty through Trust
Alrubaiee and Alkaa'da (2011) suggest that patient perceptions of health quality have a strong and
positive impact on patient satisfaction and patient confidence, and patient satisfaction also has a significant
impact on loyalty. Khan and Khan (2014) argue that the dimensions of service quality consist of: services
orientation of doctors, nurses, and hospitals.
2.12 Relationship Between Customer Satisfaction and Loyalty through Trust Akhbar and Parvez (2009) believe that 1) trust plays a role in loyalty, 2) trust and satisfaction are
significantly and positively relate to loyalty, 3) trust and customer satisfaction positively relate to customer
loyalty. Customer satisfaction becomes an important mediation between service quality and loyalty. Patawayati
et al. (2013) state that trust is a variable that mediates patient satisfaction and loyalty which indicates that there
is a significant positive relationship amongs customer satisfaction, trust, and loyalty.
III. RESEARCH AND METHODOLOGY
This type of research is an explanatory or explanation with causal prediction to test the one-way
strength amongs the latent variables. The data was collected, tabulated, and analyzed to test the hypothesis.The
population used were patients who have received treatment as inpatient inpublic hospital. As many as 6088
people with a samples of 100 respondents were used in this research as respondents.The research location is in a public hospital in Batu, East Java, Indonesia. Samples were taken with the following characteristics: the patient
has been hospitalized for a minimum of 2 days, the patient with the type of public service or paying cash, the
patient with the type of BPJS (government health insurance) service, other insurance with the cost according
with the class, the patient was conscious and communicate well, and patient was not health staff family or
hospital staff.
Quantitative data were processed using statistics. Data was collected from primary and secondary data.
Primary data was collected trough questionnaire based on the determined characteristics. Secondary data was
collected from hospitals (research institutes, public relations, and medical records). The sampling technique
were used purporsive sampling. Responses of perceptions, attitudes, and actions of respondents were measured
using Likert scale, consist of strongly agree (5 point), agree (4 point), neutral (3 point), disagree (2 point), and
strongly disagree (1 point). The data is tabulated and processed by SPSS 21 and SmartPLS 3.0 analysis tools to
test the formulated hypothesis.
3.1 Research Model and Hypothesis
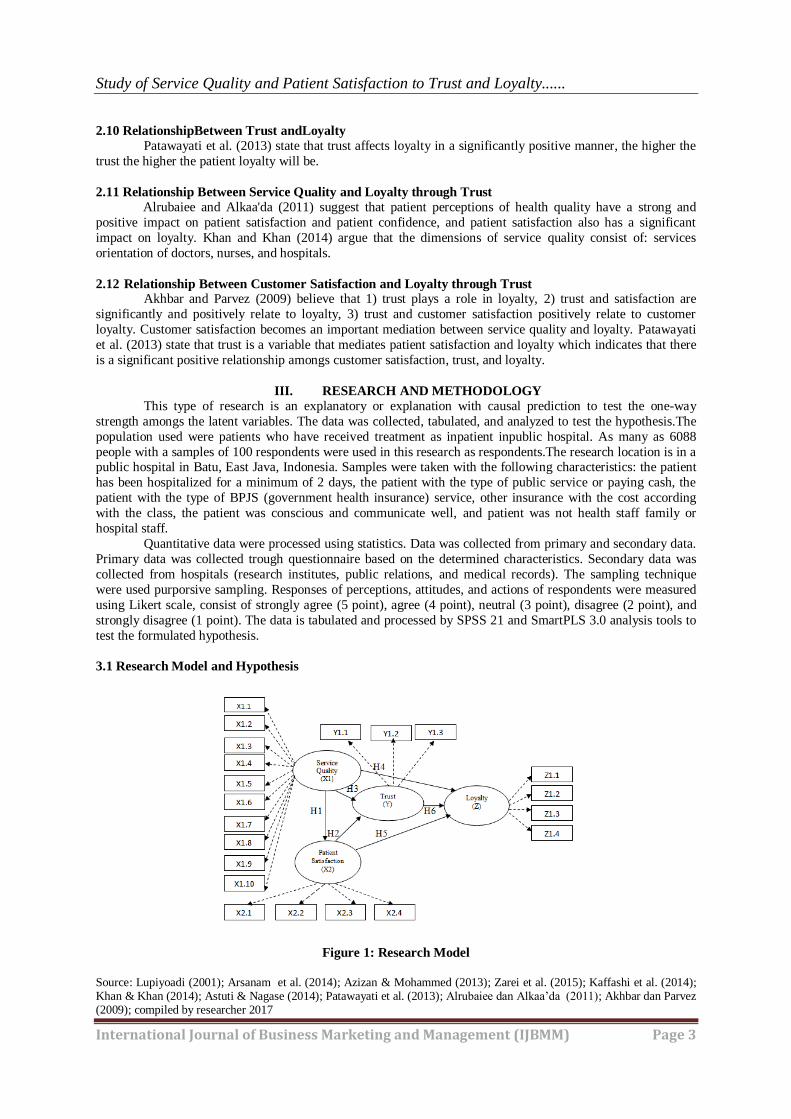
Figure 1: Research Model
Source: Lupiyoadi (2001); Arsanam et al. (2014); Azizan & Mohammed (2013); Zarei et al. (2015); Kaffashi et al. (2014); Khan & Khan (2014); Astuti & Nagase (2014); Patawayati et al. (2013); Alrubaiee dan Alkaa’da (2011); Akhbar dan Parvez (2009); compiled by researcher 2017
Study of Service Quality and Patient Satisfaction to Trust and Loyalty......
International Journal of Business Marketing and Management (IJBMM) Page 4
In Figure 1, the hypothesis can be described as follows: H1: Service quality directly affects patient satisfaction. H2: Patient satisfaction directly affects trust. H3: Service quality directly affects trust. H4: Service quality directly affects loyalty. H5: Patient satisfaction directly affects loyalty. H6: Trust affects loyalty. H7: Service quality affects loyalty through trust..
H8: Patient satisfaction affects loyalty through trust.
IV. RESULT AND ANALYSIS
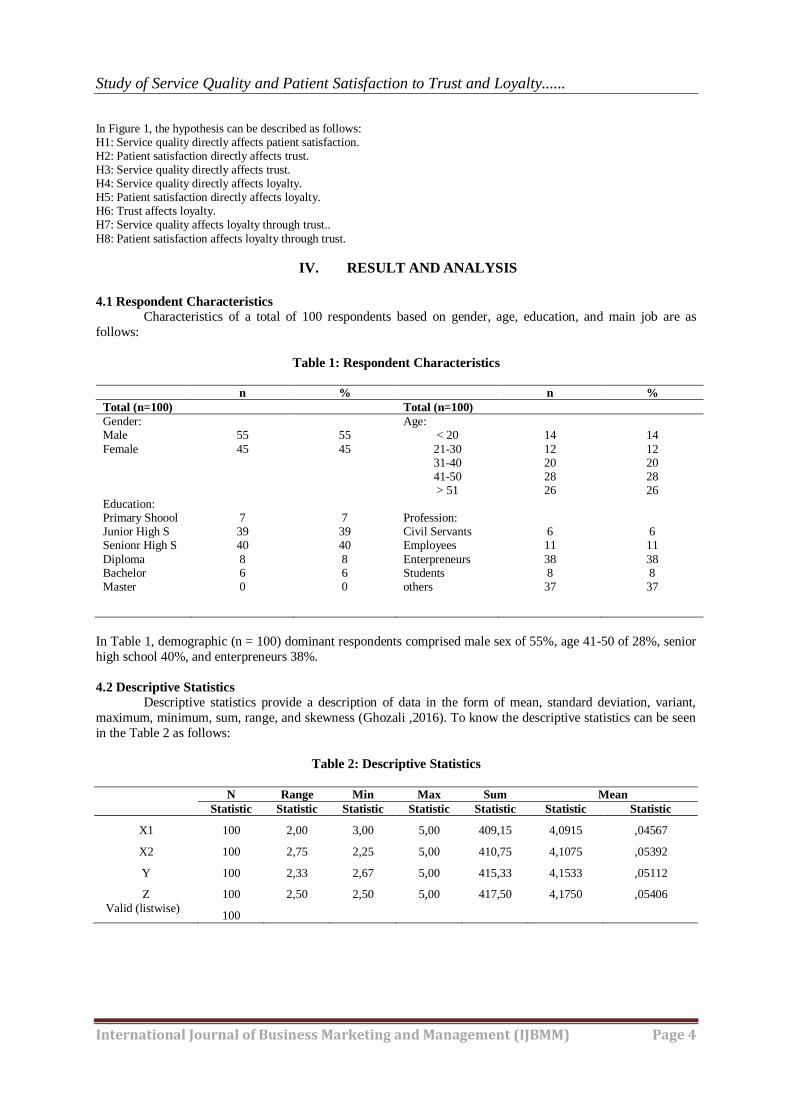
4.1 Respondent Characteristics
Characteristics of a total of 100 respondents based on gender, age, education, and main job are as
follows:
Table 1: Respondent Characteristics
n % n %
Total (n=100) Total (n=100)
Gender: Male
Female Education: Primary Shoool Junior High S Senionr High S
Diploma Bachelor Master
55
45
7 39 40
8 6 0
55
45 7 39 40
8 6 0
Age: < 20
21-30 31-40 41-50 > 51
Profession: Civil Servants Employees
Enterpreneurs Students others
14
12 20 28 26 6 11
38 8 37
14
12 20 28 26 6 11
38 8 37
In Table 1, demographic (n = 100) dominant respondents comprised male sex of 55%, age 41-50 of 28%, senior
high school 40%, and enterpreneurs 38%.
4.2 Descriptive Statistics
Descriptive statistics provide a description of data in the form of mean, standard deviation, variant,
maximum, minimum, sum, range, and skewness (Ghozali ,2016). To know the descriptive statistics can be seen
in the Table 2 as follows:
Table 2: Descriptive Statistics
N Range Min Max Sum Mean
Statistic Statistic Statistic Statistic Statistic Statistic Statistic
X1 100 2,00 3,00 5,00 409,15 4,0915 ,04567
X2 100 2,75 2,25 5,00 410,75 4,1075 ,05392
Y 100 2,33 2,67 5,00 415,33 4,1533 ,05112
Z 100 2,50 2,50 5,00 417,50 4,1750 ,05406
Valid (listwise) 100
Study of Service Quality and Patient Satisfaction to Trust and Loyalty......
International Journal of Business Marketing and Management (IJBMM) Page 5
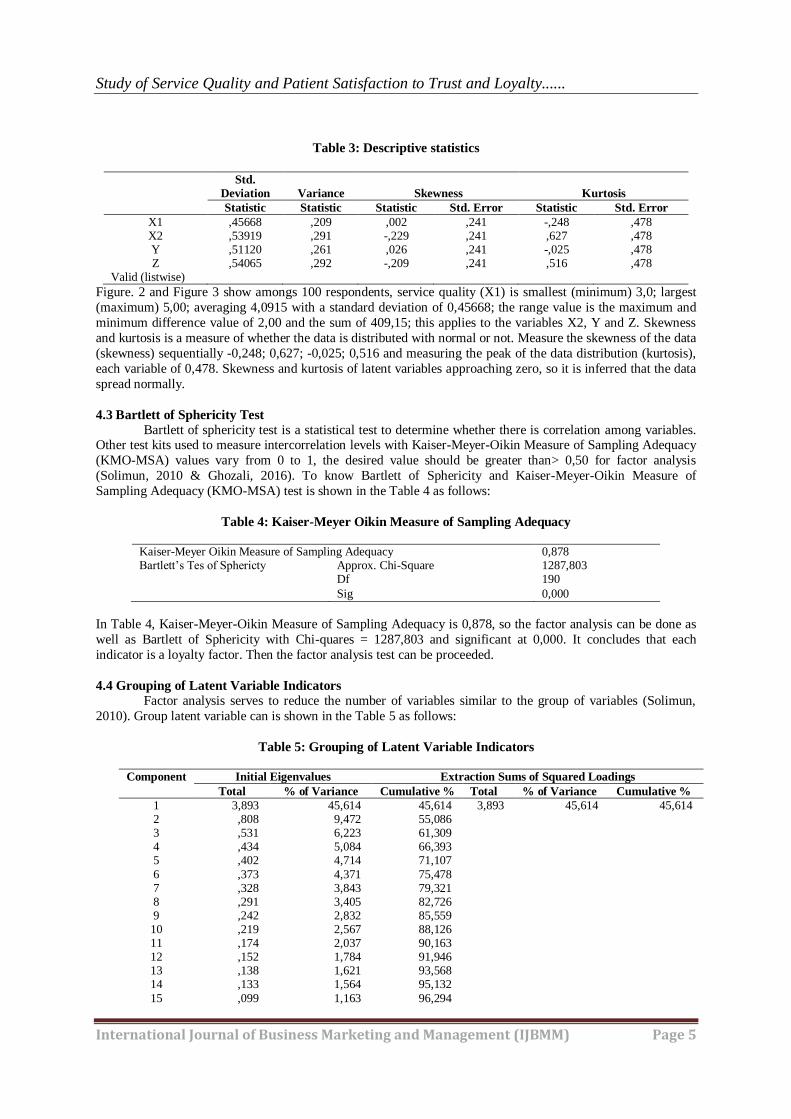
Table 3: Descriptive statistics
Std.
Deviation Variance Skewness Kurtosis
Statistic Statistic Statistic Std. Error Statistic Std. Error
X1 ,45668 ,209 ,002 ,241 -,248 ,478 X2 ,53919 ,291 -,229 ,241 ,627 ,478 Y ,51120 ,261 ,026 ,241 -,025 ,478 Z ,54065 ,292 -,209 ,241 ,516 ,478
Valid (listwise)
Figure. 2 and Figure 3 show amongs 100 respondents, service quality (X1) is smallest (minimum) 3,0; largest
(maximum) 5,00; averaging 4,0915 with a standard deviation of 0,45668; the range value is the maximum and
minimum difference value of 2,00 and the sum of 409,15; this applies to the variables X2, Y and Z. Skewness
and kurtosis is a measure of whether the data is distributed with normal or not. Measure the skewness of the data
(skewness) sequentially -0,248; 0,627; -0,025; 0,516 and measuring the peak of the data distribution (kurtosis),
each variable of 0,478. Skewness and kurtosis of latent variables approaching zero, so it is inferred that the data
spread normally.
4.3 Bartlett of Sphericity Test
Bartlett of sphericity test is a statistical test to determine whether there is correlation among variables. Other test kits used to measure intercorrelation levels with Kaiser-Meyer-Oikin Measure of Sampling Adequacy
(KMO-MSA) values vary from 0 to 1, the desired value should be greater than> 0,50 for factor analysis
(Solimun, 2010 & Ghozali, 2016). To know Bartlett of Sphericity and Kaiser-Meyer-Oikin Measure of
Sampling Adequacy (KMO-MSA) test is shown in the Table 4 as follows:
Table 4: Kaiser-Meyer Oikin Measure of Sampling Adequacy
Kaiser-Meyer Oikin Measure of Sampling Adequacy 0,878 Bartlett’s Tes of Sphericty Approx. Chi-Square 1287,803
Df 190
Sig 0,000
In Table 4, Kaiser-Meyer-Oikin Measure of Sampling Adequacy is 0,878, so the factor analysis can be done as
well as Bartlett of Sphericity with Chi-quares = 1287,803 and significant at 0,000. It concludes that each
indicator is a loyalty factor. Then the factor analysis test can be proceeded.
4.4 Grouping of Latent Variable Indicators Factor analysis serves to reduce the number of variables similar to the group of variables (Solimun,
2010). Group latent variable can is shown in the Table 5 as follows:
Table 5: Grouping of Latent Variable Indicators
Component Initial Eigenvalues Extraction Sums of Squared Loadings
Total % of Variance Cumulative % Total % of Variance Cumulative %
1 3,893 45,614 45,614 3,893 45,614 45,614 2 ,808 9,472 55,086 3 ,531 6,223 61,309 4 ,434 5,084 66,393 5 ,402 4,714 71,107
6 ,373 4,371 75,478 7 ,328 3,843 79,321 8 ,291 3,405 82,726 9 ,242 2,832 85,559 10 ,219 2,567 88,126 11 ,174 2,037 90,163 12 ,152 1,784 91,946 13 ,138 1,621 93,568 14 ,133 1,564 95,132
15 ,099 1,163 96,294
Study of Service Quality and Patient Satisfaction to Trust and Loyalty......
International Journal of Business Marketing and Management (IJBMM) Page 6
16 ,083 ,977 97,271
17 ,073 ,860 98,131 18 ,071 ,833 98,964 19 ,052 ,615 99,579 20 ,036 ,421 100,000
In Table 5, the groupings of latent variable consist of 20 indicators which devided into 9 indicators of service
quality, 4 patient satisfaction indicators, 3 trust indicators, and 4 loyalty indicators which have value of eigen >
1, with eigen value of 3,893. This factor is able to explain the variation of 45,614%.
The validity and reliability of each construct are analyzed using Structural Equation Modeling Partial-
Least Squares (SEM-PLS) by conducting a construct evaluation based on the level of abstraction by assessing
convergen and discriminant validity and evaluating the goodness of fit model.
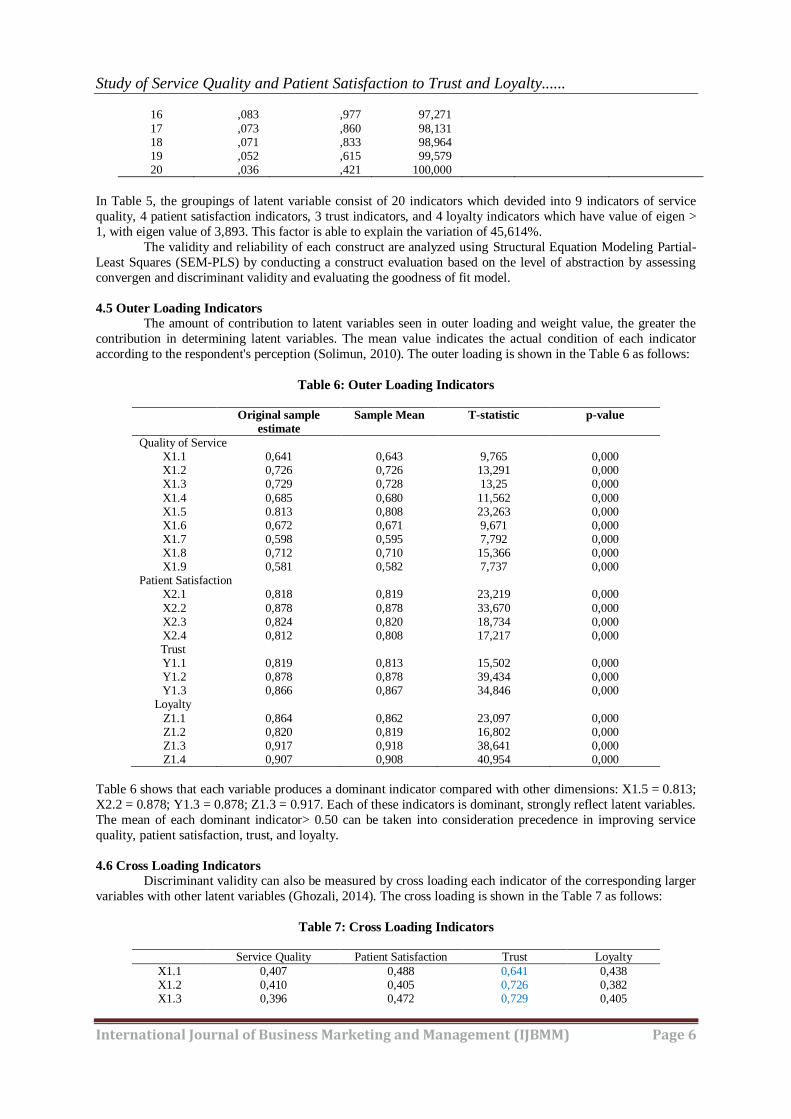
4.5 Outer Loading Indicators
The amount of contribution to latent variables seen in outer loading and weight value, the greater the
contribution in determining latent variables. The mean value indicates the actual condition of each indicator
according to the respondent's perception (Solimun, 2010). The outer loading is shown in the Table 6 as follows:
Table 6: Outer Loading Indicators
Original sample
estimate
Sample Mean T-statistic p-value
Quality of Service X1.1 0,641 0,643 9,765 0,000 X1.2 0,726 0,726 13,291 0,000 X1.3 0,729 0,728 13,25 0,000
X1.4 0,685 0,680 11,562 0,000 X1.5 0.813 0,808 23,263 0,000 X1.6 0,672 0,671 9,671 0,000 X1.7 0,598 0,595 7,792 0,000 X1.8 0,712 0,710 15,366 0,000 X1.9 0,581 0,582 7,737 0,000
Patient Satisfaction X2.1 0,818 0,819 23,219 0,000
X2.2 0,878 0,878 33,670 0,000 X2.3 0,824 0,820 18,734 0,000 X2.4 0,812 0,808 17,217 0,000
Trust Y1.1 0,819 0,813 15,502 0,000 Y1.2 0,878 0,878 39,434 0,000 Y1.3 0,866 0,867 34,846 0,000
Loyalty
Z1.1 0,864 0,862 23,097 0,000 Z1.2 0,820 0,819 16,802 0,000 Z1.3 0,917 0,918 38,641 0,000 Z1.4 0,907 0,908 40,954 0,000
Table 6 shows that each variable produces a dominant indicator compared with other dimensions: X1.5 = 0.813;
X2.2 = 0.878; Y1.3 = 0.878; Z1.3 = 0.917. Each of these indicators is dominant, strongly reflect latent variables.
The mean of each dominant indicator> 0.50 can be taken into consideration precedence in improving service
quality, patient satisfaction, trust, and loyalty.
4.6 Cross Loading Indicators
Discriminant validity can also be measured by cross loading each indicator of the corresponding larger
variables with other latent variables (Ghozali, 2014). The cross loading is shown in the Table 7 as follows:
Table 7: Cross Loading Indicators
Service Quality Patient Satisfaction Trust Loyalty
X1.1 0,407 0,488 0,641 0,438 X1.2 0,410 0,405 0,726 0,382 X1.3 0,396 0,472 0,729 0,405
Study of Service Quality and Patient Satisfaction to Trust and Loyalty......
International Journal of Business Marketing and Management (IJBMM) Page 7
X1.4 0,350 0,507 0,685 0,263
X1.5 0,552 0,545 0,813 0,453 X1.6 0,430 0,417 0,671 0,381 X1.7 0,389 0,500 0,672 0,374 X1.8 0,494 0,531 0,712 0,439 X1.9 0,367 0,459 0,581 0,432 X2.1 0,480 0,818 0,595 0,571 X2.2 0,623 0,878 0,608 0,536 X2.3 0,551 0,824 0,524 0,623
X2.4 0,597 0,812 0,646 0,565 Y1.1 0,819 0,544 0,419 0,608 Y1.2 0,878 0,576 0,555 0,631 Y1.3 0,866 0,613 0,603 0,706 Z1.1 0,752 0,613 0,598 0,864 Z1.2 0,615 0,549 0,466 0,820 Z1.3 0,627 0,610 0,503 0,917 Z1.4 0,664 0,637 0,466 0,907
Table 7 indicates that the indicator of the endogenous variable (affected) has a greater cross loading of the exogenous variable (affecting). Loyalty has a value of cross loading (0.864, 0.820; 0.917; 0.907) greater than the
correlation of variables that affect it (service quality, patient satisfaction, and trust), as well as other influenced
variables. In this study, cross loading of each endogenous variable meet the criteria of discriminant validation.
4.7 Composite Reliability
To prove consistency and accuracy of the instrument of the construct, can be done in two ways,
namely composite reliability and cronbach's alpha. The composite reliability is shown in the Table 8 as follows:
Table 8: Composite Reliability of the Latent Variables
Latent Variable Composite Reliability Expanation
Service Quality 0.890 Reliabel Patient Satisfaction 0.901 Reliabel Trust 0.889 Reliabel Loyalty 0.930 Reliabel
In Table 8, each variable instrument yields excellent composite reliability> 0.80. Then all indicators are declared
reliable.
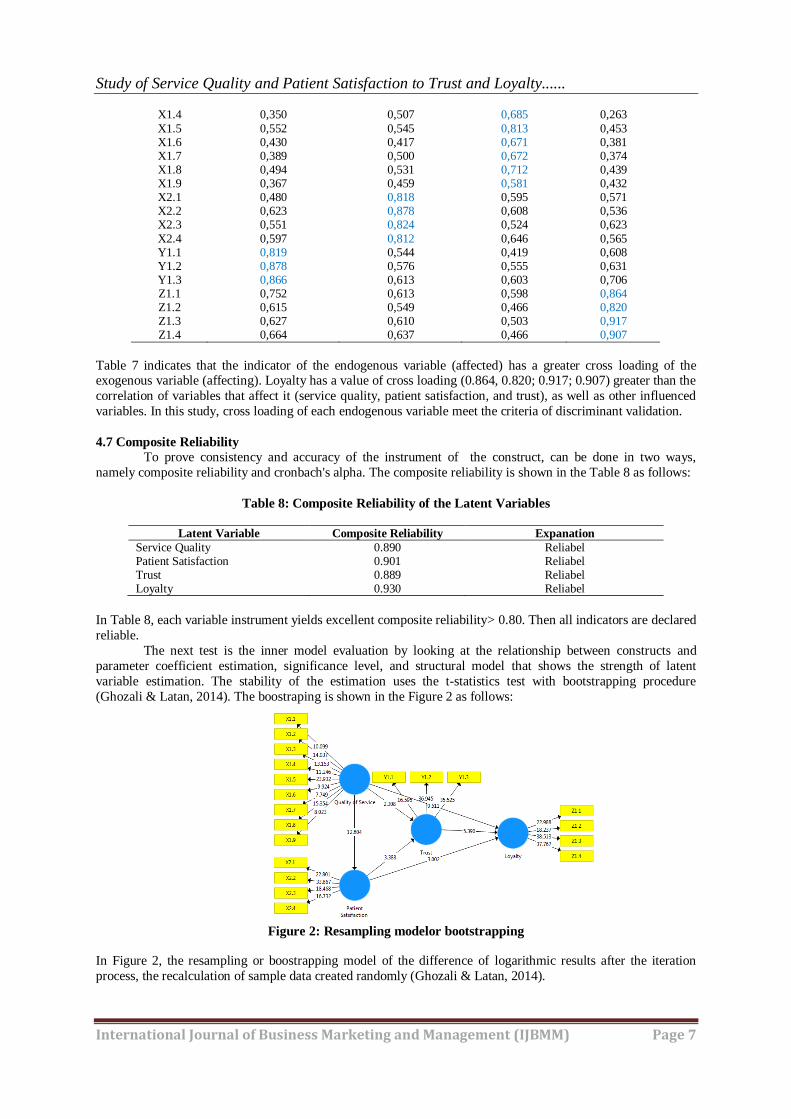
The next test is the inner model evaluation by looking at the relationship between constructs and
parameter coefficient estimation, significance level, and structural model that shows the strength of latent
variable estimation. The stability of the estimation uses the t-statistics test with bootstrapping procedure
(Ghozali & Latan, 2014). The boostraping is shown in the Figure 2 as follows:
Figure 2: Resampling modelor bootstrapping
In Figure 2, the resampling or boostrapping model of the difference of logarithmic results after the iteration
process, the recalculation of sample data created randomly (Ghozali & Latan, 2014).
Study of Service Quality and Patient Satisfaction to Trust and Loyalty......
International Journal of Business Marketing and Management (IJBMM) Page 8
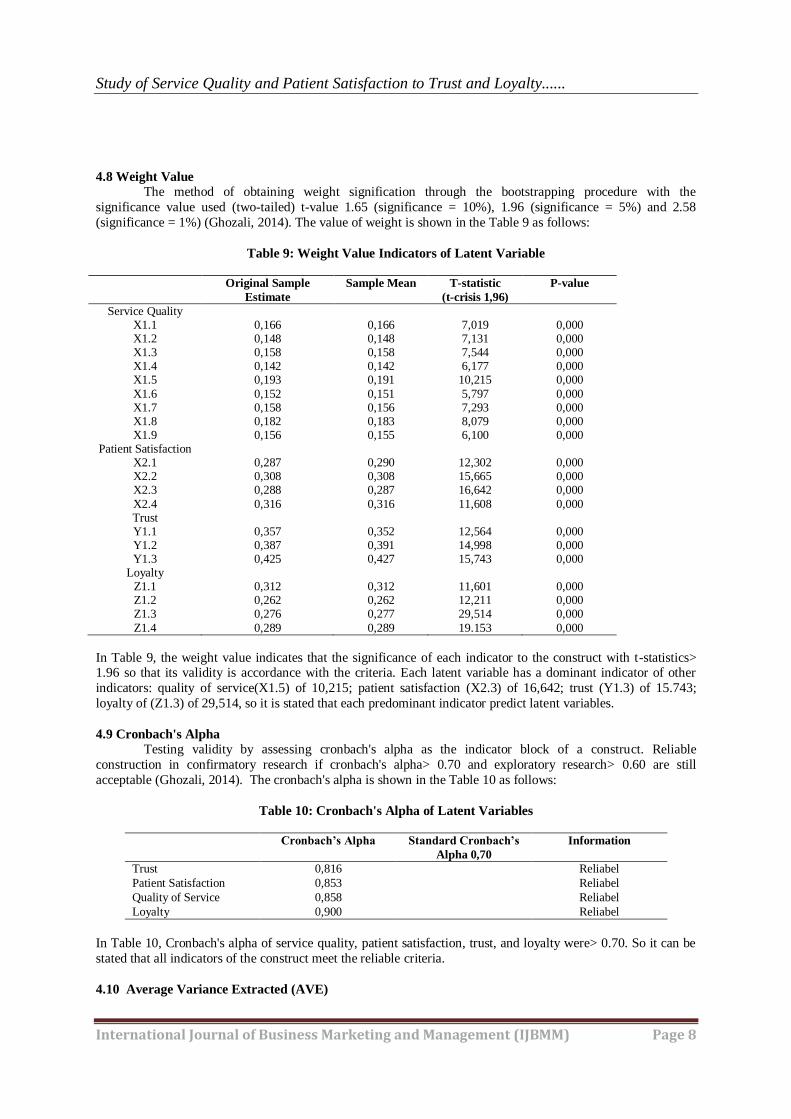
4.8 Weight Value
The method of obtaining weight signification through the bootstrapping procedure with the
significance value used (two-tailed) t-value 1.65 (significance = 10%), 1.96 (significance = 5%) and 2.58
(significance = 1%) (Ghozali, 2014). The value of weight is shown in the Table 9 as follows:
Table 9: Weight Value Indicators of Latent Variable
Original Sample
Estimate
Sample Mean T-statistic
(t-crisis 1,96)
P-value
Service Quality X1.1 0,166 0,166 7,019 0,000 X1.2 0,148 0,148 7,131 0,000 X1.3 0,158 0,158 7,544 0,000 X1.4 0,142 0,142 6,177 0,000 X1.5 0,193 0,191 10,215 0,000
X1.6 0,152 0,151 5,797 0,000 X1.7 0,158 0,156 7,293 0,000 X1.8 0,182 0,183 8,079 0,000 X1.9 0,156 0,155 6,100 0,000
Patient Satisfaction X2.1 0,287 0,290 12,302 0,000 X2.2 0,308 0,308 15,665 0,000 X2.3 0,288 0,287 16,642 0,000
X2.4 0,316 0,316 11,608 0,000 Trust Y1.1 0,357 0,352 12,564 0,000 Y1.2 0,387 0,391 14,998 0,000 Y1.3 0,425 0,427 15,743 0,000
Loyalty Z1.1 0,312 0,312 11,601 0,000 Z1.2 0,262 0,262 12,211 0,000 Z1.3 0,276 0,277 29,514 0,000
Z1.4 0,289 0,289 19.153 0,000
In Table 9, the weight value indicates that the significance of each indicator to the construct with t-statistics> 1.96 so that its validity is accordance with the criteria. Each latent variable has a dominant indicator of other
indicators: quality of service(X1.5) of 10,215; patient satisfaction (X2.3) of 16,642; trust (Y1.3) of 15.743;
loyalty of (Z1.3) of 29,514, so it is stated that each predominant indicator predict latent variables.
4.9 Cronbach's Alpha
Testing validity by assessing cronbach's alpha as the indicator block of a construct. Reliable
construction in confirmatory research if cronbach's alpha> 0.70 and exploratory research> 0.60 are still
acceptable (Ghozali, 2014). The cronbach's alpha is shown in the Table 10 as follows:
Table 10: Cronbach's Alpha of Latent Variables
Cronbach’s Alpha Standard Cronbach’s
Alpha 0,70
Information
Trust 0,816 Reliabel
Patient Satisfaction 0,853 Reliabel
Quality of Service 0,858 Reliabel
Loyalty 0,900 Reliabel
In Table 10, Cronbach's alpha of service quality, patient satisfaction, trust, and loyalty were> 0.70. So it can be
stated that all indicators of the construct meet the reliable criteria.
4.10 Average Variance Extracted (AVE)
Study of Service Quality and Patient Satisfaction to Trust and Loyalty......
International Journal of Business Marketing and Management (IJBMM) Page 9
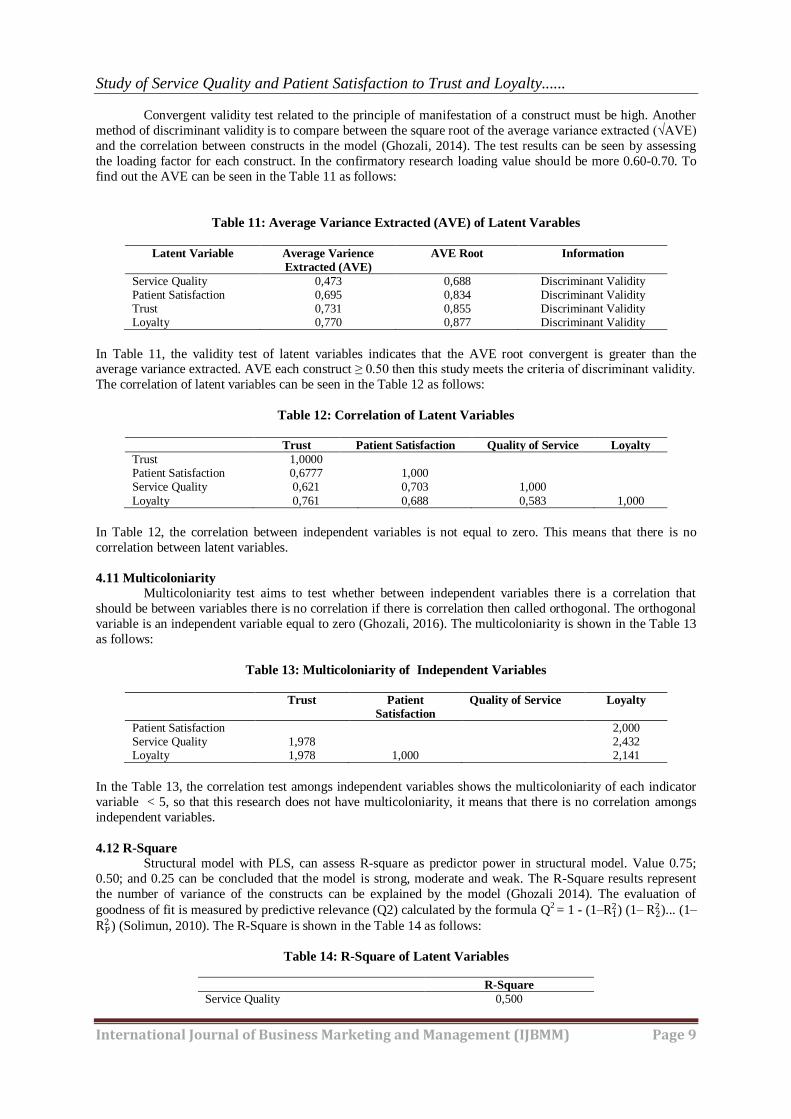
Convergent validity test related to the principle of manifestation of a construct must be high. Another
method of discriminant validity is to compare between the square root of the average variance extracted (√AVE)
and the correlation between constructs in the model (Ghozali, 2014). The test results can be seen by assessing
the loading factor for each construct. In the confirmatory research loading value should be more 0.60-0.70. To
find out the AVE can be seen in the Table 11 as follows:
Table 11: Average Variance Extracted (AVE) of Latent Varables
Latent Variable Average Varience
Extracted (AVE)
AVE Root Information
Service Quality 0,473 0,688 Discriminant Validity Patient Satisfaction 0,695 0,834 Discriminant Validity Trust 0,731 0,855 Discriminant Validity Loyalty 0,770 0,877 Discriminant Validity
In Table 11, the validity test of latent variables indicates that the AVE root convergent is greater than the average variance extracted. AVE each construct ≥ 0.50 then this study meets the criteria of discriminant validity.
The correlation of latent variables can be seen in the Table 12 as follows:
Table 12: Correlation of Latent Variables
Trust Patient Satisfaction Quality of Service Loyalty
Trust 1,0000 Patient Satisfaction 0,6777 1,000 Service Quality 0,621 0,703 1,000
Loyalty 0,761 0,688 0,583 1,000
In Table 12, the correlation between independent variables is not equal to zero. This means that there is no
correlation between latent variables.
4.11 Multicoloniarity
Multicoloniarity test aims to test whether between independent variables there is a correlation that
should be between variables there is no correlation if there is correlation then called orthogonal. The orthogonal
variable is an independent variable equal to zero (Ghozali, 2016). The multicoloniarity is shown in the Table 13
as follows:
Table 13: Multicoloniarity of Independent Variables
Trust Patient
Satisfaction
Quality of Service Loyalty
Patient Satisfaction 2,000 Service Quality 1,978 2,432 Loyalty 1,978 1,000 2,141
In the Table 13, the correlation test amongs independent variables shows the multicoloniarity of each indicator
variable < 5, so that this research does not have multicoloniarity, it means that there is no correlation amongs
independent variables.
4.12 R-Square
Structural model with PLS, can assess R-square as predictor power in structural model. Value 0.75;
0.50; and 0.25 can be concluded that the model is strong, moderate and weak. The R-Square results represent
the number of variance of the constructs can be explained by the model (Ghozali 2014). The evaluation of
goodness of fit is measured by predictive relevance (Q2) calculated by the formula Q2 = 1 - (1–R12) (1– R2
2)... (1–
RP2 ) (Solimun, 2010). The R-Square is shown in the Table 14 as follows:
Table 14: R-Square of Latent Variables
R-Square
Service Quality 0,500
Study of Service Quality and Patient Satisfaction to Trust and Loyalty......
International Journal of Business Marketing and Management (IJBMM) Page 10
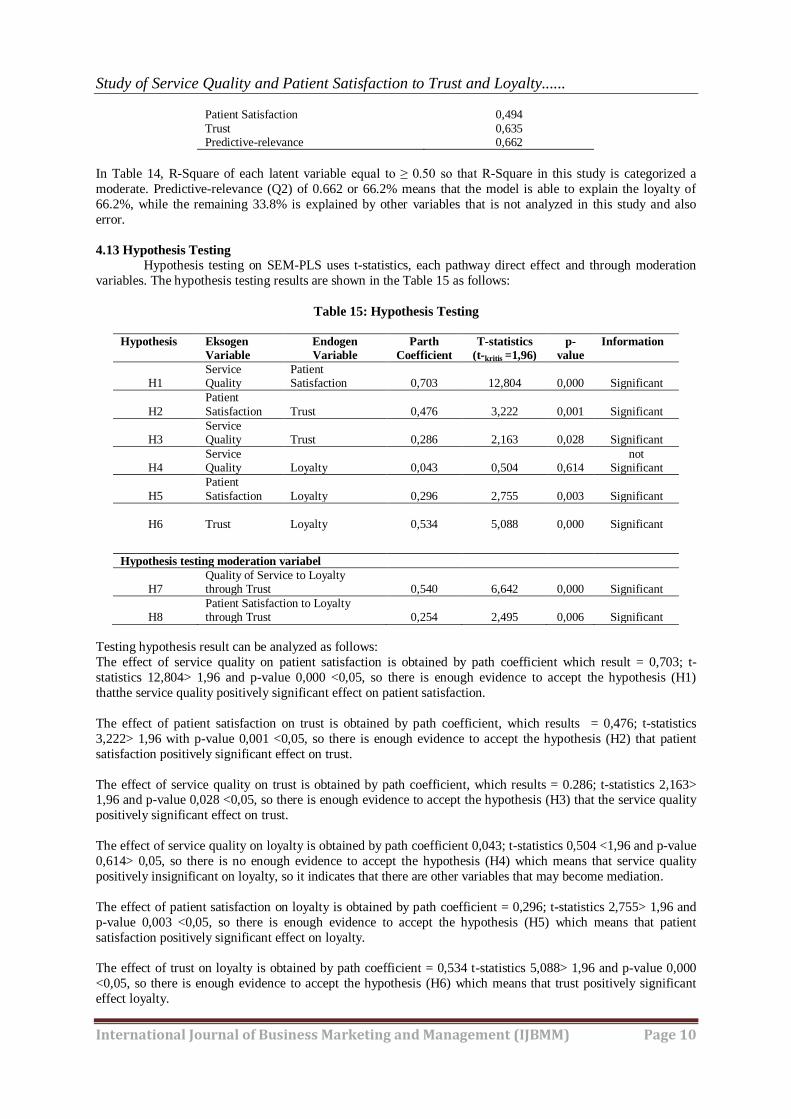
Patient Satisfaction 0,494
Trust 0,635 Predictive-relevance 0,662
In Table 14, R-Square of each latent variable equal to ≥ 0.50 so that R-Square in this study is categorized a
moderate. Predictive-relevance (Q2) of 0.662 or 66.2% means that the model is able to explain the loyalty of
66.2%, while the remaining 33.8% is explained by other variables that is not analyzed in this study and also
error.
4.13 Hypothesis Testing
Hypothesis testing on SEM-PLS uses t-statistics, each pathway direct effect and through moderation
variables. The hypothesis testing results are shown in the Table 15 as follows:
Table 15: Hypothesis Testing
Hypothesis Eksogen
Variable
Endogen
Variable
Parth
Coefficient
T-statistics
(t-kritis =1,96)
p-
value
Information
H1
Service Quality
Patient Satisfaction
0,703
12,804
0,000
Significant
H2
Patient
Satisfaction
Trust
0,476
3,222
0,001
Significant
H3
Service Quality
Trust
0,286
2,163
0,028
Significant
H4
Service Quality
Loyalty
0,043
0,504
0,614
not Significant
H5
Patient
Satisfaction
Loyalty
0,296
2,755
0,003
Significant
H6
Trust
Loyalty
0,534
5,088
0,000
Significant
Hypothesis testing moderation variabel
H7
Quality of Service to Loyalty through Trust
0,540
6,642
0,000
Significant
H8
Patient Satisfaction to Loyalty through Trust
0,254
2,495
0,006
Significant
Testing hypothesis result can be analyzed as follows:
The effect of service quality on patient satisfaction is obtained by path coefficient which result = 0,703; t-
statistics 12,804> 1,96 and p-value 0,000 <0,05, so there is enough evidence to accept the hypothesis (H1)
thatthe service quality positively significant effect on patient satisfaction.
The effect of patient satisfaction on trust is obtained by path coefficient, which results = 0,476; t-statistics
3,222> 1,96 with p-value 0,001 <0,05, so there is enough evidence to accept the hypothesis (H2) that patient
satisfaction positively significant effect on trust.
The effect of service quality on trust is obtained by path coefficient, which results = 0.286; t-statistics 2,163> 1,96 and p-value 0,028 <0,05, so there is enough evidence to accept the hypothesis (H3) that the service quality
positively significant effect on trust.
The effect of service quality on loyalty is obtained by path coefficient 0,043; t-statistics 0,504 <1,96 and p-value
0,614> 0,05, so there is no enough evidence to accept the hypothesis (H4) which means that service quality
positively insignificant on loyalty, so it indicates that there are other variables that may become mediation.
The effect of patient satisfaction on loyalty is obtained by path coefficient = 0,296; t-statistics 2,755> 1,96 and
p-value 0,003 <0,05, so there is enough evidence to accept the hypothesis (H5) which means that patient
satisfaction positively significant effect on loyalty.
The effect of trust on loyalty is obtained by path coefficient = 0,534 t-statistics 5,088> 1,96 and p-value 0,000
<0,05, so there is enough evidence to accept the hypothesis (H6) which means that trust positively significant
effect loyalty.
Study of Service Quality and Patient Satisfaction to Trust and Loyalty......
International Journal of Business Marketing and Management (IJBMM) Page 11
Quality of service affect loyalty through trust obtained path coefficient with mediation 0,540; t-statistics 6,642>
1,96 and p-value 0,000 <0,05, so enough evidence to accept hypothesis (H7) quality of service positively
significant relation to loyalty through trust. Trust plays a role of strengthening (moderating) the influence of
service quality on loyalty.
The effect of patient satisfaction on loyalty through trust obtained path coefficient with mediation 0,254; t-
statistics 2,495> 1,96 and p-value 0.006 <0.05, so there is enough evidence to accept the hypothesis (H8) which
means that patient satisfaction positively significant effect on loyalty through trust. Trust acts as strengthening
(moderating) variable between patient satisfaction on loyalty.
V. CONCLUSION 1. The analysis result shows that the direct effect of independent variables on dependent variables have fulfilled
the creteria of SEM-PLS test.
2. Hypotesis test result on the quality service against loyalty is not significant, while the effect of service quality
on loyalty through trust is significant.
VI. RECOMENDATION, LIMITATION AND FUTURE RESEARCH This research can be used by: 1) goverment as evaluation of public service, 2) hospital, as information material
to make decision, 3) academic, can be used as reference for further research.
This study has limitations, because it only uses the service quality with nine indicators. The researchers can
further add more indicators.The effect of service quality on loyalty through trust does not support enough
references. Researchers can develop this research by using other analysis tool and different research object.
REFERENCES
[1] A. Parasuraman, V. Zeithmal and L. Berry SERVQUAL: A multiple item scale for measuring consumer perseption of service quality, Journal of Retail, 1, 1988. pp12-40.
[2] Azizan & Mohamed, The effects of perceived service quality on patient satisfaction at a publict hospital in State Pahang,
Malaysia, Asian Journal of Social Sciences & Humanities ISSN: 2186-8492, ISSN: 2186-8484 Print Vol. 2 No. 3 August 2013.
[3] E. Zarei, Daneshkohan, A. R. Khabiri,M Arab, An emperical study of the impact of service quality on patient satisfaction in
private hospitals, Iran, Global Journal of Health Science; vol. 7, N. 1; 2015 ISSN 1916-9736 E-ISSN 1916-9744 Published by Canadian Center of Science and Education.
[4] E. Hadiyati, Analysis of service quality and its impact on customer (case study at PT Pos (Persero) Post Office Lawang, 2010.
[5] H.J. Astuti, & K. Nagase, Patient loyalty to healthcare organization: relationship marketing and satisfaction, International Journal
of Management and Marketing Research Vol. 7, No. 2, 2014, pp. 39-56 ISSN: 1933-3153 (print) ISSN: 2157-0205 (online).
[6] I.A.W. Kesuma, D.Hadiwidjoyo, N.L.P.Wiagustin, & F.Rohman, Service influence on patients loyalty: consumer relation
management as mediation variable (Study on private hospital industry in Denpasar), www.ijbcnet.com. International Journal of Business and Commerce Vol. 2, No.12: Aug 2013[01-14] (ISSN: 2225-2436).
[7] I. Ghozali, Structural equation modeling. Alternative methode with partial least Squares (PLS) (Semarang: University Publisher,
2014).
[8] I. Ghozali, Application of multivariate analysis with SPSS program 23, Issue 4 (Semarang: Diponegoro University Publisher, 2016).
[9] I. Ghozali and Latan, Partial least squares consepts, techniques and programs SmartPLS 3.0 for emperical research (Semarang.Diponegoro University, 2014).
[10] J. C. Mowen & M. Minor, Consumer behavior (Bandung, volume 2: Erlangga, 2002).
[11] L. Alrubaiee & F. Alkaa’da, The mediating of patient satisfaction in the patients’ perceptions of healthcare quality-patient trust
relationship, www.ccsenet.org/ijms International Journal of Marketing Studies, 2011, Vol. 3, No. 1.
[12] M. Akbar, & N. Parvez, Impact of service quality, trust and customer satisfaction on consumer loyalty. ABAC Journal Vol. 29, No. 1 (January-April 2009, pp.24-38).
Study of Service Quality and Patient Satisfaction to Trust and Loyalty......
International Journal of Business Marketing and Management (IJBMM) Page 12
[13] M.M. Khan, & A.H. Khan, Impact of service quality on patient’s trust; A case of health-care in Pakistan. Journal of Quality and
Technology Management. Volume X, Issue I, June 2014, Page 35 – 57.
[14] M. Srivastava, Influence of customer-satisfaction-consumer loyalty relationship: A Conseptual Research Model. IMJ.2015.
[15] P. Arsanam. & K. Yousapronpaiboon,The relationship between service quality and customer satisfaction of pharmacy departements in public hospitals, International Journal of Innovation, Management and Technology, Vol. 5, No. 4, August 2014.
[16] P.M. Doney & J.P Cannon, An exemination of nature of trust in buyer-seller relationship, Journal of Marketing, 1997, 61(April), 35-51.
[17] P. Kotler & K. K, Lane, Marketing management (12th edition volume 2, Jakarta. PT Macanan Jaya Cemerlang, 2007).
[18] P. Kotler & K. K, Lane, Marketing management (12th edition volume 2, translation, M. Benyamin. Jakarta. Airlangga, 2009).
[19] Patawayati, Z.Djumilah, S. Margono, & R. Mintarti, Patient satisfaction, trust and commitment: mediator of service quality and its
impact on loyality (An emperical study in Southeast Sulawesi public hospital)". IOSR Journal of Business and Management (IOSR-JBM) e-ISSN: 2278-487X. Volume 7, Issue 6 (Jan. - Feb. 2013), PP 01-14.
[20] R. M. Morgan & S. D. Hunt, The commitement trust theory of relationship marketing, Journal of Marketing 58 (Juli), 1994, 20-38).
[21] R. Lupiyoadi, Management of marketing services, theory and practice (Jakarta: PT Salemba Emban Patria, 2001).
[22] S. Kaffashi, A. Keshtkaran, A.Pourtaleb, Z. Nejatzadhegan, & M. Raadabadi, Health service quality; comment on ‘How outpatient
service quality in hospitals affect patients’ loyalty?Jundishapur J Health Sci 2014;6(2):335-342.
[23] Solimun, Multivarite analysis of structural modeling-partial least squares model PLS (Malang: CV Citra Malang. 2010).