Embed Size (px)
Citation preview


STUDY OF SELECTEDPETROLEUM REFINING RESIDUALS
INDUSTRY STUDY
Part 1
August 1996
U.S. ENVIRONMENTAL PROTECTION AGENCYOffice of Solid Waste
Hazardous Waste Identification Division401 M Street, SW
Washington, DC 20460

Petroleum Refining Industry Study 2 August 1996
TABLE OF CONTENTS Page Number
1.0 INTRODUCTION . . . . . . . . . . . . . . . . . . . . . . . . . . . . . . . . . . . . . . . . . . . . . . . . . . . . 11.1 BACKGROUND . . . . . . . . . . . . . . . . . . . . . . . . . . . . . . . . . . . . . . . . . . . . . . . 11.2 OTHER EPA REGULATORY PROGRAMS IMPACTING THE
PETROLEUM REFINING INDUSTRY . . . . . . . . . . . . . . . . . . . . . . . . . . . . . 21.3 INDUSTRY STUDY FINDINGS . . . . . . . . . . . . . . . . . . . . . . . . . . . . . . . . . . 3
2.0 INDUSTRY DESCRIPTION . . . . . . . . . . . . . . . . . . . . . . . . . . . . . . . . . . . . . . . . . . . 82.1 PETROLEUM REFINING INDUSTRY PROFILE . . . . . . . . . . . . . . . . . . . . . 82.2 INDUSTRY STUDY . . . . . . . . . . . . . . . . . . . . . . . . . . . . . . . . . . . . . . . . . . . 10
2.2.1 Site Selection . . . . . . . . . . . . . . . . . . . . . . . . . . . . . . . . . . . . . . . . . 112.2.2 Engineering Site Visits . . . . . . . . . . . . . . . . . . . . . . . . . . . . . . . . . . 132.2.3 RCRA §3007 Questionnaire . . . . . . . . . . . . . . . . . . . . . . . . . . . . . . 132.2.4 Familiarization Sampling . . . . . . . . . . . . . . . . . . . . . . . . . . . . . . . . 142.2.5 Record Sampling . . . . . . . . . . . . . . . . . . . . . . . . . . . . . . . . . . . . . . . 152.2.6 Split Samples Analyzed by API . . . . . . . . . . . . . . . . . . . . . . . . . . . 202.2.7 Synthesis . . . . . . . . . . . . . . . . . . . . . . . . . . . . . . . . . . . . . . . . . . . . . 20
3.0 PROCESS AND WASTE DESCRIPTIONS . . . . . . . . . . . . . . . . . . . . . . . . . . . . . . . 213.1 REFINERY PROCESS OVERVIEW . . . . . . . . . . . . . . . . . . . . . . . . . . . . . . 213.2 CRUDE OIL DESALTING . . . . . . . . . . . . . . . . . . . . . . . . . . . . . . . . . . . . . . 25
3.2.1 Process Description . . . . . . . . . . . . . . . . . . . . . . . . . . . . . . . . . . . . . 253.2.2 Desalting Sludge . . . . . . . . . . . . . . . . . . . . . . . . . . . . . . . . . . . . . . . 26
3.3 HYDROCRACKING . . . . . . . . . . . . . . . . . . . . . . . . . . . . . . . . . . . . . . . . . . . 343.3.1 Process Description . . . . . . . . . . . . . . . . . . . . . . . . . . . . . . . . . . . . . 343.3.2 Spent Hydrocracking Catalyst . . . . . . . . . . . . . . . . . . . . . . . . . . . . . 35
3.4 ISOMERIZATION . . . . . . . . . . . . . . . . . . . . . . . . . . . . . . . . . . . . . . . . . . . . 433.4.1 Isomerization Process Description . . . . . . . . . . . . . . . . . . . . . . . . . . 433.4.2 Isomerization Catalyst . . . . . . . . . . . . . . . . . . . . . . . . . . . . . . . . . . . 463.4.3 Isomerization Treating Clay . . . . . . . . . . . . . . . . . . . . . . . . . . . . . . 54
3.5 EXTRACTION . . . . . . . . . . . . . . . . . . . . . . . . . . . . . . . . . . . . . . . . . . . . . . . 583.5.1 Extraction Process Description . . . . . . . . . . . . . . . . . . . . . . . . . . . . 583.5.2 Extraction Treating Clay . . . . . . . . . . . . . . . . . . . . . . . . . . . . . . . . . 59
3.6 ALKYLATION . . . . . . . . . . . . . . . . . . . . . . . . . . . . . . . . . . . . . . . . . . . . . . . 663.6.1 Sulfuric Acid Alkylation Process Description . . . . . . . . . . . . . . . . . 663.6.2 Hydrofluoric Acid Alkylation Process Description . . . . . . . . . . . . . 673.6.3 Spent Treating Clay from Alkylation . . . . . . . . . . . . . . . . . . . . . . . 693.6.4 Catalyst from Hydrofluoric Acid Alkylation . . . . . . . . . . . . . . . . . . 753.6.5 Acid Soluble Oil from Hydrofluoric Acid Alkylation . . . . . . . . . . . 77
3.7 POLYMERIZATION . . . . . . . . . . . . . . . . . . . . . . . . . . . . . . . . . . . . . . . . . . 823.7.1 Process Descriptions . . . . . . . . . . . . . . . . . . . . . . . . . . . . . . . . . . . . 823.7.2 Spent Phosphoric Acid Polymerization Catalyst . . . . . . . . . . . . . . . 843.7.3 Spent Dimersol Polymerization Catalyst . . . . . . . . . . . . . . . . . . . . . 87
3.8 RESIDUAL UPGRADING . . . . . . . . . . . . . . . . . . . . . . . . . . . . . . . . . . . . . . 923.8.1 Process Descriptions . . . . . . . . . . . . . . . . . . . . . . . . . . . . . . . . . . . . 923.8.2 Off-specification Product from Residual Upgrading . . . . . . . . . . . . 96
Petroleum Refining Industry Study 3 August 1996
3.8.3 Process Sludge from Residual Upgrading . . . . . . . . . . . . . . . . . . . . 973.9 LUBE OIL PROCESSING . . . . . . . . . . . . . . . . . . . . . . . . . . . . . . . . . . . . . . 103
3.9.1 Process Descriptions . . . . . . . . . . . . . . . . . . . . . . . . . . . . . . . . . . . . 1033.9.2 Treating Clay from Lube Oil Processing . . . . . . . . . . . . . . . . . . . . . 107
3.10 H S REMOVAL AND SULFUR COMPLEX . . . . . . . . . . . . . . . . . . . . . . . . 1122
3.10.1 Process Description . . . . . . . . . . . . . . . . . . . . . . . . . . . . . . . . . . . . . 1123.10.2 Off-Specification Product from Sulfur Complex and H S2
Removal Facilities . . . . . . . . . . . . . . . . . . . . . . . . . . . . . . . . . . . . . 1173.10.3 Off-Specification Treating Solution from Sulfur Complex and
H S Removal Facilities . . . . . . . . . . . . . . . . . . . . . . . . . . . . . . . . . . 1242
3.11 CLAY FILTERING . . . . . . . . . . . . . . . . . . . . . . . . . . . . . . . . . . . . . . . . . . . . 1323.11.1 Process Description . . . . . . . . . . . . . . . . . . . . . . . . . . . . . . . . . . . . . 1323.11.2 Treating Clay from Clay Filtering . . . . . . . . . . . . . . . . . . . . . . . . . . 134
3.12 RESIDUAL OIL TANK STORAGE . . . . . . . . . . . . . . . . . . . . . . . . . . . . . . . 1423.12.1 Residual Oil Storage Tank Sludge . . . . . . . . . . . . . . . . . . . . . . . . . . 142
Petroleum Refining Industry Study 4 August 1996
LIST OF TABLES Page Number
Table 1.1. Petroleum Refining Residuals Identified in the EDF/EPAConsent Decree . . . . . . . . . . . . . . . . . . . . . . . . . . . . . . . . . . . . . . . . . . . . . . . . 2
Table 1.2. Overview of 15 Study Residuals of Concern as Managed in 1992 . . . . . . . . . . 5Table 2.1. Engineering Site Visit Facilities . . . . . . . . . . . . . . . . . . . . . . . . . . . . . . . . . . 12Table 2.2. Study Residuals Volume Statistics . . . . . . . . . . . . . . . . . . . . . . . . . . . . . . . . 15Table 2.3. Residuals Collected for Record Analysis . . . . . . . . . . . . . . . . . . . . . . . . . . . . 16Table 2.4. Descriptions of Samples Collected for Record Analysis . . . . . . . . . . . . . . . . 17Table 3.2.1. Generation Statistics for Desalting Sludge, 1992 . . . . . . . . . . . . . . . . . . . . . . 27Table 3.2.2. Desalter Sludge: Physical Properties . . . . . . . . . . . . . . . . . . . . . . . . . . . . . . 30Table 3.2.3. Desalting Sludge Record Sampling Locations . . . . . . . . . . . . . . . . . . . . . . . . 30Table 3.2.4. Desalting Sludge Characterization . . . . . . . . . . . . . . . . . . . . . . . . . . . . . . . . . 31Table 3.3.1. Generation Statistics for Hydrocracking Catalyst, 1992 . . . . . . . . . . . . . . . . . 37Table 3.3.2. Hydrocracking Catalyst Physical Properties . . . . . . . . . . . . . . . . . . . . . . . . . 38Table 3.3.3. Spent Hydrocracking Catalyst Record Sampling Locations . . . . . . . . . . . . . . 39Table 3.3.4. Spent Hydrocracking Catalyst Characterization . . . . . . . . . . . . . . . . . . . . . . . 40Table 3.4.1. Generation Statistics for Catalyst from Isomerization, 1992 . . . . . . . . . . . . . 48Table 3.4.2. Catalyst from Isomerization: Physical Properties . . . . . . . . . . . . . . . . . . . . . 49Table 3.4.3. Spent Isomerization Catalyst Record Sampling Locations . . . . . . . . . . . . . . . 49Table 3.4.4. Residual Characterization Data for Spent Isomerization Catalyst . . . . . . . . . 51Table 3.4.5. Generation Statistics for Treating Clay from Isomerization, 1992 . . . . . . . . . 55Table 3.4.6. Treating Clay from Isomerization: Physical Properties . . . . . . . . . . . . . . . . . 57Table 3.4.7. Isomerization Spent Sorbent Record Sampling Locations . . . . . . . . . . . . . . . 57Table 3.5.1. Generation Statistics for Treating Clay from Extraction, 1992 . . . . . . . . . . . 61Table 3.5.2. Treating Clay from Extraction: Physical Properties . . . . . . . . . . . . . . . . . . . 63Table 3.5.3. Extraction Spent Sorbent Record Sampling Locations . . . . . . . . . . . . . . . . . 63Table 3.5.4. Residual Characterization Data for Spent Treating Clay from
Extraction/Isomerization . . . . . . . . . . . . . . . . . . . . . . . . . . . . . . . . . . . . . . . . 64Table 3.6.1. Generation Statistics for Treating Clay from Alkylation, 1992 . . . . . . . . . . . 70Table 3.6.2. Treating Clay from Alkylation: Physical Properties . . . . . . . . . . . . . . . . . . . 72Table 3.6.3. Alkylation Treating Clay Record Sampling Locations . . . . . . . . . . . . . . . . . . 72Table 3.6.4. Alkylation Treating Clay Characterization . . . . . . . . . . . . . . . . . . . . . . . . . . 73Table 3.6.5. Generation Statistics for Catalyst from HF Alkylation, 1992 . . . . . . . . . . . . . 76Table 3.6.6. Catalyst from HF Alkylation: Physical Properties . . . . . . . . . . . . . . . . . . . . 76Table 3.6.7. Generation Statistics for Acid Soluble Oil, 1992 . . . . . . . . . . . . . . . . . . . . . . 78Table 3.6.8. Acid Soluble Oil: Physical Properties . . . . . . . . . . . . . . . . . . . . . . . . . . . . . 79Table 3.6.9. Acid Soluble Oil Record Sampling Locations . . . . . . . . . . . . . . . . . . . . . . . . 79Table 3.6.10. Acid Soluble Oil Characterization . . . . . . . . . . . . . . . . . . . . . . . . . . . . . . . . . 80Table 3.7.1. Generation Statistics for Phosphoric Acid Catalyst from
Polymerization, 1992 . . . . . . . . . . . . . . . . . . . . . . . . . . . . . . . . . . . . . . . . . . 85Table 3.7.2. Phosphoric Acid Catalyst from Polymerization: Physical
Properties . . . . . . . . . . . . . . . . . . . . . . . . . . . . . . . . . . . . . . . . . . . . . . . . . . . 86Table 3.7.3. Phosphoric Acid Polymerization Catalyst Record Sampling
Locations . . . . . . . . . . . . . . . . . . . . . . . . . . . . . . . . . . . . . . . . . . . . . . . . . . . 86Table 3.7.4. Generation Statistics for Spent Dimersol Polymerization
Catalyst, 1992 . . . . . . . . . . . . . . . . . . . . . . . . . . . . . . . . . . . . . . . . . . . . . . . . 88

Petroleum Refining Industry Study 5 August 1996
Table 3.7.5. Spent Dimersol Polymerization Catalyst Physical Properties . . . . . . . . . . . . . 89Table 3.7.6. Dimersol Polymerization Catalyst Record Sampling Locations . . . . . . . . . . . 89Table 3.7.7. Polymerization Catalyst Characterization . . . . . . . . . . . . . . . . . . . . . . . . . . . 90Table 3.8.1. Generation Statistics for Off-Specification Product from Residual
Upgrading, 1992 . . . . . . . . . . . . . . . . . . . . . . . . . . . . . . . . . . . . . . . . . . . . . . 96Table 3.8.2. Off-Specification Product from Residual Upgrading: Physical
Properties . . . . . . . . . . . . . . . . . . . . . . . . . . . . . . . . . . . . . . . . . . . . . . . . . . . 97Table 3.8.3. Generation Statistics for Process Sludge from Residual
Upgrading, 1992 . . . . . . . . . . . . . . . . . . . . . . . . . . . . . . . . . . . . . . . . . . . . . . 98Table 3.8.4. Process Sludge from Residual Upgrading: Physical Properties . . . . . . . . . . . 100Table 3.8.5. Process Sludge from Residual Upgrading Record Sampling
Locations . . . . . . . . . . . . . . . . . . . . . . . . . . . . . . . . . . . . . . . . . . . . . . . . . . . 100Table 3.8.6. Process Sludge from Residual Upgrading Characterization . . . . . . . . . . . . . . 101Table 3.9.1. Generation Statistics for Treating Clay from Lube Oil, 1992 . . . . . . . . . . . . 108Table 3.9.2. Treating Clay from Lube Oil: Physical Properties . . . . . . . . . . . . . . . . . . . . 109Table 3.9.3. Treating Clay from Lube Oil Processing Record Sampling
Locations . . . . . . . . . . . . . . . . . . . . . . . . . . . . . . . . . . . . . . . . . . . . . . . . . . . 109Table 3.9.4. Treating Clay from Lube Oil Processing Characterization . . . . . . . . . . . . . . . 110Table 3.10.1. Sulfur Removal Technologies Reported in RCRA §3007
Questionnaire . . . . . . . . . . . . . . . . . . . . . . . . . . . . . . . . . . . . . . . . . . . . . . . . 112Table 3.10.2. Generation Statistics for Off-Spec Sulfur, 1992 . . . . . . . . . . . . . . . . . . . . . . 119Table 3.10.3. Off-Specification Sulfur: Physical Properties . . . . . . . . . . . . . . . . . . . . . . . . 121Table 3.10.4. Off-Specification Sulfur Record Sampling Locations . . . . . . . . . . . . . . . . . . 121Table 3.10.5. Residual Characterization Data for Off-Specification Sulfur . . . . . . . . . . . . . 122Table 3.10.6. Generation Statistics for Spent Amine for H S Removal, 1992 . . . . . . . . . . . 1252
Table 3.10.7. Generation Statistics for Stretford Solution for H S Removal,2
1992 . . . . . . . . . . . . . . . . . . . . . . . . . . . . . . . . . . . . . . . . . . . . . . . . . . . . . . . 126Table 3.10.8. Spent Amine: Physical Properties . . . . . . . . . . . . . . . . . . . . . . . . . . . . . . . . 127Table 3.10.9. Spent Stretford Solution: Physical Properties . . . . . . . . . . . . . . . . . . . . . . . . 128Table 3.10.10. Off-Specification Treating Solution Record Sampling Locations . . . . . . . . . 128Table 3.10.11. Characterization Data for Off-Specification Treating Solution
from Sulfur Complex and H S Removal . . . . . . . . . . . . . . . . . . . . . . . . . . . . 1302
Table 3.11.1. Generation Statistics for Treating Clay from Clay Filtering, 1992 . . . . . . . . . 136Table 3.11.2. Treating Clay from Clay Filtering: Physical Properties . . . . . . . . . . . . . . . . 137Table 3.11.3. Treating Clay Record Sampling Locations . . . . . . . . . . . . . . . . . . . . . . . . . . 137Table 3.11.4. Residual Characterization Data for Treating Clay . . . . . . . . . . . . . . . . . . . . . 139Table 3.12.1. Generation Statistics for Residual Oil Tank Sludge, 1992 . . . . . . . . . . . . . . . 144Table 3.12.2. Residual Oil Tank Sludge: Physical Properties . . . . . . . . . . . . . . . . . . . . . . . 146Table 3.12.3. Residual Oil Tank Sludge Record Sampling Locations . . . . . . . . . . . . . . . . . 146Table 3.12.4. Residual Oil Tank Sludge Characterization . . . . . . . . . . . . . . . . . . . . . . . . . . 147

Petroleum Refining Industry Study 6 August 1996
LIST OF FIGURES Page Number
Figure 2.1. Geographical Distribution of U.S. Refineries . . . . . . . . . . . . . . . . . . . . . . . . . 9Figure 3.1. Simplified Refinery Process Flow Diagram . . . . . . . . . . . . . . . . . . . . . . . . . 22Figure 3.2.1. Desalting Process Flow Diagram . . . . . . . . . . . . . . . . . . . . . . . . . . . . . . . . . . 25Figure 3.3.1. Hydrocracking Process Flow Diagram . . . . . . . . . . . . . . . . . . . . . . . . . . . . . 35Figure 3.4.1. Isomerization Process Flow Diagram . . . . . . . . . . . . . . . . . . . . . . . . . . . . . . 43Figure 3.5.1. Extraction Process Flow Diagram . . . . . . . . . . . . . . . . . . . . . . . . . . . . . . . . . 58Figure 3.6.1. H SO Alkylation Process Flow Diagram . . . . . . . . . . . . . . . . . . . . . . . . . . . 662 4
Figure 3.6.2. HF Alkylation Process Flow Diagram . . . . . . . . . . . . . . . . . . . . . . . . . . . . . . 68Figure 3.7.1. Process Flow Diagram for Phosphoric Acid Polymerization
Process . . . . . . . . . . . . . . . . . . . . . . . . . . . . . . . . . . . . . . . . . . . . . . . . . . . . . 83Figure 3.7.2. Dimersol Polymerization Process Flow Diagram . . . . . . . . . . . . . . . . . . . . . 84Figure 3.8.1. Solvent Deasphalting Process Flow Diagram . . . . . . . . . . . . . . . . . . . . . . . . 93Figure 3.8.2. Asphalt Oxidation Process Flow Diagram . . . . . . . . . . . . . . . . . . . . . . . . . . . 94Figure 3.8.3. Supercritical Extraction Process Flow Diagram . . . . . . . . . . . . . . . . . . . . . . 95Figure 3.9.1. Lube Oil Processing Flow Diagram . . . . . . . . . . . . . . . . . . . . . . . . . . . . . . . 104Figure 3.10.1. Amine Sulfur Removal Process Flow Diagram . . . . . . . . . . . . . . . . . . . . . . . 113Figure 3.10.2. Claus Sulfur Recovery Process Flow Diagram . . . . . . . . . . . . . . . . . . . . . . . 114Figure 3.10.3. SCOT Tail Gas Sulfur Removal Process Flow Diagram . . . . . . . . . . . . . . . 115®

Petroleum Refining Industry Study 1 August 1996
1.0 INTRODUCTION
1.1 BACKGROUND
The U.S. Environmental Protection Agency (EPA) is directed in section 3001(e)(2) ofthe Resource Conservation and Recovery Act (RCRA) (42 U.S.C. §6921 (e)(2)) to determinewhether to list as hazardous wastes a number of different wastes including those of thepetroleum refining industry. A lawsuit by the Environmental Defense Fund (EDF) in 1989resulted in a consent decree approved by the court, that sets out an extensive series of deadlinesfor making the listing determinations required by Section 3001 (e)(2). The deadlines includethose for making final listing determinations as well as for concluding various related studies orreports on the industries of concern. With respect to the refining industry, the consent decreeidentifies 14 specific residuals for which the Agency must make listing determinations and anadditional 15 residuals for which the Agency must conduct a study. These 29 residuals,subsequently referred to as the Residuals of Concern (RCs), are listed in Table 1.1. As a resultof the consent decree, the Agency embarked on a project to determine whether these 29 RCspose a threat to human health and the environment and to develop a basis for making such adetermination. As a result of the preliminary evaluation of the waste subject to the listingdetermination, EPA proposed a rule in which eleven wastes were not to be listed and threewastes were to be listed as hazardous wastes: K169, K170, and K171 (clarified slurry oil storagetank sediments and/or filter/separation solids from catalytic cracking, catalyst fromhydrotreating, and catalyst from hydrorefining, respectively) (60 FR 57747, November 20,1995). The final determination will be issued under the applicable terms of the consent decree. This report is the result of the Agency's study of the remaining 15 residuals.
The Petroleum Refining Industry was previously studied by OSW in the 1980s. Thisoriginal effort involved sampling and analysis of a number of residuals at 19 sites, distribution ofa RCRA §3007 questionnaire to 180 refineries (characterizing the industry as of 1983), and,ultimately, a listing determination effort focused on wastewater treatment sludges, culminatingin the promulgation of hazardous waste listings F037 and F038 (respectively, primary andsecondary oil/water/solids separation sludges from petroleum refining).
As part of the Agency's current investigation of residuals from petroleum refining, theAgency conducted engineering site visits at 20 refineries to gain an understanding of the presentstate of the industry. These 20 refineries were randomly selected from the 185 refineriesoperating in the continental United States in 1992. Familiarization samples of various residualswere collected at 3 of the 20 refineries to obtain data on the nature of the RCs and to identifypotential problems with respect to future analysis. The Agency then conducted record samplingand analysis of the RCs. During the record sampling timeframe, an additional 6 facilities wererandomly selected to increase sample availability. Approximately 100 record samples werecollected and analyzed. Concurrently, the Agency developed, distributed and evaluated a RCRA§3007 survey to the 180 refineries in the U.S.

Petroleum Refining Industry Study 2 August 1996
Listing Residuals
Clarified slurry oil sludge from catalytic crackingUnleaded storage tank sludgeCrude storage tank sludge Process sludge from sulfur complex and H S removal facilities (sulfur complex sludge)2
Sludge from HF alkylationSludge from H SO alkylation2 4
Catalyst from catalytic hydrotreatingCatalyst from catalytic reformingCatalyst and fines from catalytic cracking (FCC catalyst and FCC fines)Catalyst from catalytic hydrorefiningCatalyst from H SO alkylation2 4
Catalyst from sulfur complex and H S removal facilities (Claus and tail gas treating catalysts)2
Off-spec product and fines from thermal processes (Off-spec coke and fines)Spent caustic from liquid treating
Study Residuals
Desalting sludge from crude desaltingResidual oil storage tank sludgeProcess sludge from residual upgradingCatalyst from extraction/isomerization processes*Catalyst from catalytic hydrocrackingCatalyst from polymerizationCatalyst from HF alkylation Off-spec product and fines from residual upgradingOff-spec product from sulfur complex and H S removal facilities (Off-spec sulfur)2
Off-spec treating solution from sulfur complex and H S removal facilities (Spent amine and spent2
Stretford solution)Acid-soluble oil from HF alkylation (ASO)Treating clay from clay filteringTreating clay from lube oil processingTreating clay from the extraction/isomerization processTreating clay from alkylation
*As described in Section 3.5 Extraction, catalyst used for extraction does not exist. The Agency believes it has beenclassified as a residual of concern inappropriately based on erroneous old data. Therefore, only catalyst fromisomerization will be discussed in this study.
Table 1.1. Petroleum Refining Residuals Identified in the EDF/EPA Consent Decree
1.2 OTHER EPA REGULATORY PROGRAMS IMPACTING THE PETROLEUMREFINING INDUSTRY
Each of EPA's major program offices has long-standing regulatory controls tailored tothe petroleum refining industry. Some of the more significant programs with some relevance toOSW's listing determinations and industry study include:
• The Clean Air Act's Benzene National Emissions Standards for Hazardous AirPollutants (NESHAPS), designed to control benzene releases from process and wastemanagement units.

Petroleum Refining Industry Study 3 August 1996
• The Clean Air Act's National Ambient Air Quality Standards (NAAQS), whichprescribe limits for sulfur oxides (SOx), carbon monoxide (CO), particulates, nitrogenoxides (NOx), volatile organic compounds (VOCs), and ozone.
• The Clean Air Act's NESHAPs for Petroleum Refineries (40 CFR Part 63, SubpartCC, see 60 FR 43244, August 18, 1995), designed to control hazardous air pollutants(HAPs).
• The Clean Water Act sets specific technology-based limits and water quality-basedstandards for discharges to surface waters and publically-owned treatment works(POTWs) including standards designed specifically for discharges from the petroleumrefining industry.
• The Toxicity Characteristic, particularly for benzene, in combination with the F037/F038 sludge listings, has had a significant impact on the industry's wastewatertreatment operations, forcing closure of many impoundments and redesign of tank-based treatment systems.
• The Land Disposal Restrictions (LDR) Program, including the ongoing Phase III andIV development work.
1.3 INDUSTRY STUDY FINDINGS
This document describes EPA's approach to conducting the industry study required bythe EDF/EPA consent decree. The consent decree requires that EPA “fully characterize” thestudy residuals and how they are managed. “The report shall include a discussion of theconcentration of toxic constituents in each waste, the volume of each waste generated, and themanagement practices for each waste (including plausible mismanagement practices).”
The statutory definition of “hazardous waste” is waste that may cause harm or pose ahazard to human health or the environment “when improperly treated, stored, transported, ordisposed of, or otherwise managed.”
To implement this section of the statute, EPA considers available information on currentmanagement practices, and also exercises judgment as to plausible ways the waste could bemanaged in addition to those practices actually reported. EPA then judges which managementpractices have the potential to pose the greatest risk to human health or the environment andthose practices would be assessed in a risk assessment.
As EPA explained in the preamble to the dyes and pigments proposed listing [59 FR66072], EPA generally assumes that placement in an unlined landfill is a reasonably plausiblemanagement scenario for solids that potentially poses significant risks and thus would be“mismanagement” that should be examined by further risk assessment. For liquid wastes,unlined surface impoundments are such a presumptive mismanagement scenario. In past riskassessment work, EPA has found that these two scenarios are generally the scenarios most likelyto pose a risk to ground water and thus would be mismanagement scenarios for a hazardouswaste. In some cases, EPA has also found it appropriate to examine waste piles for solids prone

Petroleum Refining Industry Study 4 August 1996
to transport by wind or erosion and to look at an aerated tank for volatile hazardous constituentsin waste waters.
EPA also considers other scenarios, such as land application without Federal regulatorycontrols, as possible mismanagement scenarios and, where there is evidence that such practicesoccur for a particular waste stream, would consider whether further evaluation is appropriate. IfEPA determines that a presumptive mismanagement scenario, such as disposal in an unlinedsurface impoundment, does not occur and would not reasonably be expected to occur, EPA mayconsider it implausible and instead use a more likely scenario as the plausible mismanagementscenario for subsequent analysis.
In the recent proposal to list petroleum residuals, EPA found the following wastemanagement practices to pose the greatest risk and be the basis for judging whether these wastesposed a potential risk to human health or the environment when mismanaged:
• Unlined landfills• Unlined surface impoundments• Land application units not subject to Federal regulations
With respect to the residuals in this study, EPA found that the following managementpractices and their associated residuals (see Table 1.2) were reported and thus would bemismanagement scenarios EPA would further evaluate to ascertain if there were a potential risk:
• Unlined landfills
- Residual oil storage tank sludge- Process sludge from residual upgrading- Catalyst from catalytic hydrocracking- Catalyst from polymerization- Off-spec product from sulfur complex and H S removal facilities (off-spec sulfur)2
- Off-spec treating solution from sulfur complex and H S removal facilities (spent2
amine and spent Stretford solution)

Petroleum
Refining Industry S
tudy5
August 1996
Table 1.2. Overview of 15 Study Residuals of Concern as Managed in 1992
Management Practice mt mt mt mt mt mt mt mt mt mt mt mt mt mt mt MT
Residuals of Concern: Study Residuals
ASO Isom HF Polymer Desalting Hydro- Off-spec Off-spec Sludge Resid Oil Off-spec Treating Treating Treat Clay Treating TOTALS PercentCatalystt Catalyst Catalyst Sludge Cracking Prod. Resid Sulfur Resid Tank Treating Clay Clay Isom/ Clay from of Total
Catalyst Upgrading Product Upgrad Sludge Solution Alkylation Clay Filter Extract Lube Oil
DISPOSAL
Disposal offsite Subtitle D landfill 1,429 29 1,593 5,043 138 6,458 200 634 3,641 937 37 20,138 16.8%
Disposal offsite Subtitle C landfill 44 65 221 992 3,576 0 622 39 24 1,735 516 79 7,913 6.6%
Disposal onsite Subtitle C landfill 349 289 62 4 67 52 58 5 886 0.7%
Disposal onsite Subtitle D landfill 256 102 226 7 30 711 626 1,032 496 3,485 2.9%
Disposal onsite or offsite underground injection 2 673 675 0.6%
Storage or disposal onsite surface impoundment 0 132 1 133 0.1%
Other disposal onsite/roadbed mixing 0 4 16 138 158 0.1%
Use as cover in onsite landfill 7 7 0.0%
Use as cap for onsite landfarm, fill material, or vent 20 20 0.0%
TOTAL DISPOSED 0 44 0 2,099 354 2,584 0 9,133 207 7,254 1,624 1,355 6,497 2,145 120 33,417 27.9%
DISCHARGED
Discharge to onsite wastewater treatment facility 1,258 128 3 47 205 0 7 1,648 1.4%
Discharge to POTW 647 1 0 648 0.5%
Discharge to surface water under NPDES 3,600 152 1,266 6,849 507 12,374 10.3%
Discharge to offsite POTW 1,566 1,566 1.3%
TOTAL DISCHARGED 3,600 0 152 0 1,913 0 0 0 1 0 8,415 0 507 0 0 14,588 12.2%
RECOVERED, RECYCLED, REUSED, REGENERATED
Metals Reclamation
Transfer metal catalyst for reclamation or regeneration 293 13,185 5,127 91 89 33 18,819 15.7%
Recycle to Processes
Recovery onsite via distillation, coker, or cat cracker 50 0 16 310 376 0.3%
Onsite reuse 20 20 0.0%
Other recycling, reclamation or reuse/sulfur recov. unit 2 13 15 0.0%
Recovery onsite in catalytic cracker 3,641 0 1,150 4,791 4.0%
Recovery onsite in coker 1,019 749 52 0 20 1,840 1.5%
Other recovery onsite/alky 1,300 1,300 1.1%
Other recovery onsite/hydroprocessing 510 510 0.4%
Other recovery onsite/reuse in extraction process 800 800 0.7%
Miscellaneous On-site Recycling
Reuse onsite as replacement catalyst for another unit 159 159 0.1%
Other recovery onsite 370 354 724 0.6%
Other recycling, reclamation or reuse/offsite reuse 30 38 68 0.1%
Other recycling, reclamation or reuse/cement plant 771 161 28 249 1,210 1.0%
TOTAL RECYCLED 6,890 293 0 749 52 13,345 800 2 16 310 6,290 892 329 62 603 30,633 25.6%
STORAGE
Storage in pile 0 30 128 20 178 0.1%
TOTAL STORED (interim) 0 0 0 0 0 0 0 0 0 0 0 30 128 20 0 178 0.1%

Petroleum
Refining Industry S
tudy6
August 1996
Table 1.2. Overview of 15 Study Residuals of Concern as Managed in 1992 (continued)
Management Practice mt mt mt mt mt mt mt mt mt mt mt mt mt mt mt MT
Residuals of Concern: Study Residuals
ASO Isom HF Polymer Desalting Hydro- Off-spec Off-spec Sludge Resid Oil Off-spec Treating Treating Treat Clay Treating TOTALS PercentCatalystt Catalyst Catalyst Sludge Cracking Prod. Resid Sulfur Resid Tank Treating Clay Clay Isom/ Clay from of Total
Catalyst Upgrading Product Upgrad Sludge Solution Alkylation Clay Filter Extract Lube Oil
TRANSFER
Transfer of acid or caustic for recycle, reuse, reclamation 2,475
Transfer for use as ingredient in products placed on land 543 15 35 176 768 0.6%
Transfer to N.O.S. offsite entity and final management 0 0 14 14 0.0%
Transfer to another petroleum refinery 2,100 927 3,027 2.5%
Transfer for direct use as a fuel or to make a fuel 741 1,938 95 2,773 2.3%
Transfer with coke product or other refinery product 3,731 7 5 5 3,747 3.1%
Transfer to other offsite entity/carbon regeneration 54 54 0.0%
Transfer to other offsite entity/amine reclaimer 166 166 0.1%
Transfer to other offsite entity/alumina manufacturer 405 405 0.3%
Transfer to other offsite entity/smelter 155 155 0.1%
Transfer to other offsite entity/used as a raw material feed 488 488 0.4%
TOTAL TRANSFERRED 4,472 0 0 543 1,938 2,100 0 509 5 962 2,641 560 329 14 0 14,073 11.8%
TREATMENT
Evaporation* 8 8 0
Bioremediation* 21 21 0
Neutralization 11,388 0 0 0 11,388 9.5%
Offsite incineration, stabilization, or reuse 0 0 56 1 9 42 108 0.1%
Onsite boiler 2,610 9 2,619 2.2%
Onsite industrial furnace 3,274 3,274 2.7%
Onsite land treatment 728 346 530 59 923 231 10 2,827 2.4%
Offsite land treatment 53 1 4 198 256 0.2%
TOTAL TREATED (interim) 17,272 0 0 728 455 0 0 2 9 534 9 59 1,193 231 10 20,502 17.1%
GRAND TOTAL 33,493 337 152 4,119 4,841 18,029 800 9,647 242 9,107 23,881 2,895 8,990 2,471 733 119,738
28.0% 0.3% 0.1% 3.4% 4.0% 15.1% 0.7% 8.1% 0.2% 7.6% 19.9% 2.4% 7.5% 2.1% 0.6%
* To avoid double counting, these intermediate steps were not included in the total.
Petroleum Refining Industry Study 7 August 1996
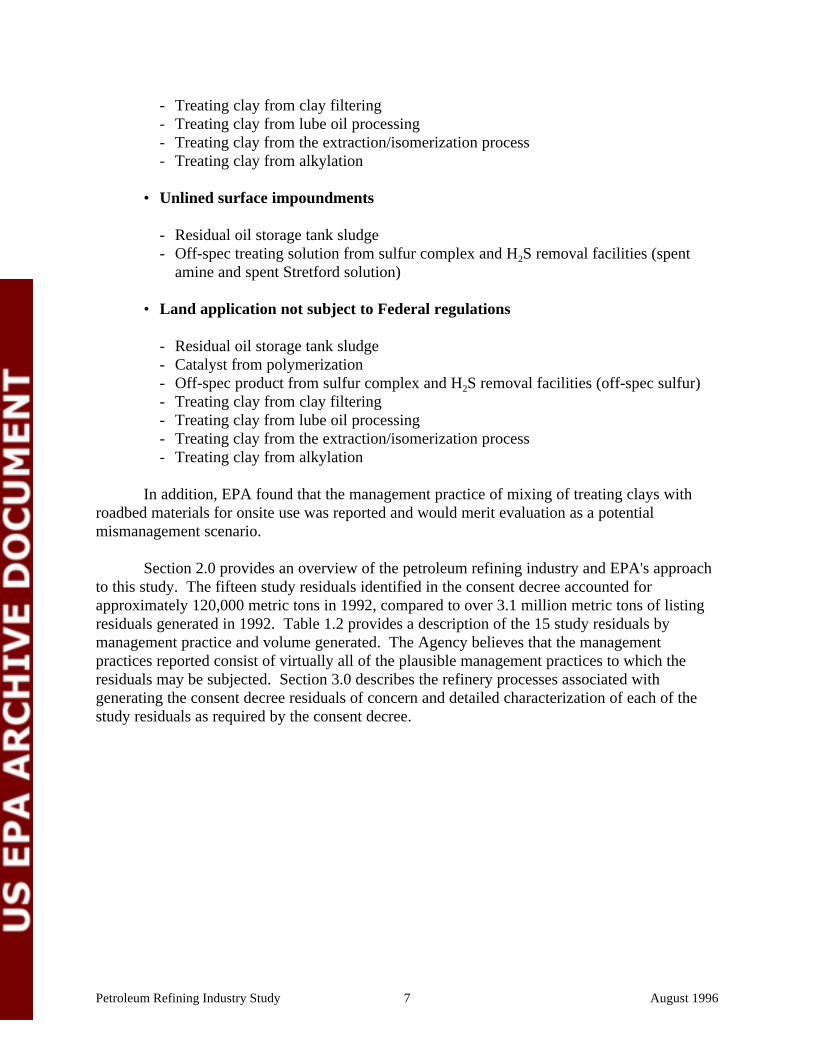
- Treating clay from clay filtering- Treating clay from lube oil processing- Treating clay from the extraction/isomerization process- Treating clay from alkylation
• Unlined surface impoundments
- Residual oil storage tank sludge- Off-spec treating solution from sulfur complex and H S removal facilities (spent2
amine and spent Stretford solution)
• Land application not subject to Federal regulations
- Residual oil storage tank sludge- Catalyst from polymerization- Off-spec product from sulfur complex and H S removal facilities (off-spec sulfur)2
- Treating clay from clay filtering- Treating clay from lube oil processing- Treating clay from the extraction/isomerization process- Treating clay from alkylation
In addition, EPA found that the management practice of mixing of treating clays withroadbed materials for onsite use was reported and would merit evaluation as a potentialmismanagement scenario.
Section 2.0 provides an overview of the petroleum refining industry and EPA's approachto this study. The fifteen study residuals identified in the consent decree accounted forapproximately 120,000 metric tons in 1992, compared to over 3.1 million metric tons of listingresiduals generated in 1992. Table 1.2 provides a description of the 15 study residuals bymanagement practice and volume generated. The Agency believes that the managementpractices reported consist of virtually all of the plausible management practices to which theresiduals may be subjected. Section 3.0 describes the refinery processes associated withgenerating the consent decree residuals of concern and detailed characterization of each of thestudy residuals as required by the consent decree.

The Agency conducted its industry-wide survey in 1993-1994, characterizing residual generation in 1992. 1
Thus, 1992 was considered the Agency's baseline year. The Agency has no reason to conclude that 1992 was not representative of industry management practices. EPA’s risk assessment modeling used as input the 1992 data for theRCs as a “snap shot” of the industry’s management practices. However, information for years other than 1992 isprovided in the pertinent sections of the study.
Petroleum Refining Industry Study 8 August 1996
2.0 INDUSTRY DESCRIPTION
2.1 PETROLEUM REFINING INDUSTRY PROFILE
In 1992 , the U.S. petroleum refining industry consisted of 185 refineries (of which 1711
were fully active during the year) owned by 91 corporations. Atmospheric crude oil distillationcapacity totaled 15,120,630 barrels per calendar day (bpcd) (DOE, 1993). As of January 1,1996, U.S. capacity totaled 15,341,000 bpcd, showing little change in the Nation's refiningcapacity since the Agency's baseline year. Figure 2.1 illustrates the distribution of refineriesacross the country. Refineries can be classified in terms of size and complexity of operations. Forty-four percent of the refineries operating in 1992 processed less than 50,000 barrels per dayof crude, while the 20 largest companies account for 77 percent of the nation's total refiningcapacity.
The simplest refineries use distillation to separate gasoline or lube oil fractions fromcrude, leaving the further refining of their residuum to other refineries or for use in asphalt. Approximately 18 percent of the U.S.'s refineries are these simple topping, asphalt, or lube oilrefineries. More sophisticated refineries will have thermal and/or catalytic cracking capabilities,allowing them to extract a greater fraction of gasoline blending stocks from their crude. Thelargest refineries are often integrated with chemical plants, and utilize the full range of catalyticcracking, hydroprocessing, alkylation and thermal processes to optimize their crude utilization. Section 3.1 describes the major unit operations typically found in refining operations.
The refining industry has undergone significant restructuring over the past 15 years. Much of this restructuring has been in response to the price allocation programs of the 1970s andindustry deregulation in the 1980s. While the total national refining capacity dropped 17 percentsince 1980 to 15 million barrels per day, the number of refineries dropped 45 percent from 311in 1980 to approximately 171 active in 1992 (and 169 as of 1/1/96). Refinery utilization ratesover the 1980 to 1992 period rose from 75 percent to 90 percent. (API, 1993). Very few newrefineries have been constructed in the past decade; the industry instead tends to focus onexpansions of existing plants.
The facilities closed tended to be smaller, inefficient refineries. Larger existing facilitieswith capacities over 100,000 bbl/day have increased production to off-set the facility closings.
The data presented above indicates that the petroleum refining industry has been goingthrough a consolidation, which has resulted in a large decrease in the number of refineries in theUnited States, but only a slight decrease in production. It is expected that this trend will

Petroleum Refining Industry Study 9 August 1996
Fig
ure
2.1.
Geo
grap
hica
l Dis
trib
utio
n of
U.S
. Ref
iner
ies
Figure 2.1. Geographical Distribution of U.S. Refineries

Petroleum Refining Industry Study 10 August 1996
continue, with refineries continuing to close, but expansions occurring at others, keeping thetotal refinery capacity in line with demand for refinery products.
In addition to restructuring, the industry is adding and changing production operations. Many of these process changes are being implemented as a result of two factors: (1) today'scrudes tend to be heavier and contain higher levels of sulfur and metals, requiring processmodifications, and (2) a series of important pollution control regulations have beenimplemented, including new gasoline reformulation rules designed to reduce the amount ofvolatile components in gasoline, and new regulations requiring low-sulfur diesel fuels. Theseheavier crudes and new rules have caused refineries to make process modifications to theirgasoline production units such as catalytic cracker units, installing additional sulfur removalhydrotreaters, and constructing unit processes to manufacture additives such as oxygenates.
Many of the process modifications in response to the reformulated gasoline and lowsulfur diesel fuels have been implemented since 1992. The Oil and Gas Journal (December,1993, 1994, and 1995) reports the following major processing capacity changes from year end1992 to year end 1995:
• 5.5 percent capacity increase in thermal operations (forecast to further increase by newconstruction scheduled to be completed in 1996)
• 8.7 percent capacity increase in hydrocracking operations
• 9.8 percent capacity increase in combined hydrorefining and hydrotreating operations(there was a 16 percent increase in hydrotreating capacity offset by a 12 percentdecrease in hydrorefining capacity).
• 13.8 percent increase in aromatic and isomerization unit capacity.
• 5.6 percent increase in alkylation capacity
• 11.3 percent increase in lube production capacity
• 7.7 percent decrease in asphalt production
• Small capacity increases for crude distillation, reforming, and catalytic cracking(increases of 0.9, 0.7, and 1.6 percent, respectively).
2.2 INDUSTRY STUDY
OSW's current listing determination and industry study for the petroleum refiningindustry has been underway since 1992 and can be characterized in terms of two major avenuesfor information collection: field work and survey evaluation. As part of the Agency's fieldwork, site selection, engineering site visits, familiarization sampling, and record sampling wereconducted. The survey effort included the development, distribution, and assessment of anextensive industry-wide RCRA §3007 survey. Each of these elements is described furtherbelow, reflecting the relative order in which these activities were conducted.

Upon initial contact with several of the randomly selected refineries, it was determined that they were2
inappropriate candidates for site visits because they had stopped operation and were not generating any residuals ofinterest to the Agency. Replacement facilities were then selected randomly from the same stratum.
The list of refineries slated for field investigations was expanded in June, 1994 to allow the Agency to fill outcertain categories of samples that proved to be difficult to find in the field. The final list presented in Table 2.1represents those refineries at which site visits actually occurred.
Petroleum Refining Industry Study 11 August 1996
2.2.1 Site Selection
EPA's field work activities were focussed on a limited number of refineries, allowing theAgency to establish strong lines of communication with the selected facilities, and maximizingefficiency of information collection. After considering logistical and budgetary constraints, theAgency determined that it would limit its field work to 20 refineries.
The Agency defined a site selection procedure that was used in selecting the 20 site visitsfrom the population of 185 domestic refineries in the continental U.S.. The objectives of theselection procedure were:
• to ensure that the characterization data obtained from residuals at the 20 selectedfacilities could be used to make valid, meaningful statements about those residualsindustry-wide.
• to give the Agency first-hand exposure to both large and small refineries.
• to be fair to all domestic refineries.
The Agency chose to select facilities randomly rather than purposefully. Although arandomly selected group of refineries did not offer as many sampling opportunities as a hand-picked group (e.g., focusing on those larger refineries that generate most of the RCs), theAgency favored random selection because it did not require subjective input, and also because itlends itself to statistical analysis, which is useful in making general statements about thepopulation of residuals.
The Agency broke the industry into two strata based on atmospheric distillation capacityand made random selections from each stratum independently. The high-capacity stratum (thosewith a crude capacity of 100,000 bpcd or greater) contains the top 30 percent of refineries, whichtogether account for 70 percent of the refining industry's capacity. The stratification enables theAgency to weigh the selection toward the larger facilities on the basis that they produce largervolumes of residuals, and that they offer a larger number of residual streams per site visit. TheAgency chose to select 12 of the 20 site visits, 60 percent, from the high-capacity stratum. Thesmaller facilities had a lower chance of being selected, but not as low as they would have if thelikelihood of selection was based strictly on size. The selected facilities are presented in Table2.1 .2

Petroleum Refining Industry Study 12 August 1996
Refinery Location Initial Site Visit Date
Amoco Oil Texas City, Texas March 29, 1993
Arco Ferndale, Washington June 9, 1993
Ashland Canton, Ohio May 24, 1993
Ashland Catlettsburg, Kentucky March 22, 1993
BP Oil Belle Chasse, Louisiana May 3, 1993
BP Oil Toledo, Ohio May 26, 1993
Chevron (purchased by Clark)1 Port Arthur, Texas August 31, 1994
Chevron1 Salt Lake City, Utah February 21, 1995
Conoco 1 Commerce City, Colorado To be determined
Exxon Billings, Montana June 9, 1993
Koch St. Paul, Minnesota May 19, 1993
Little America Evansville, Wyoming June 8, 1993
Marathon Garyville, Louisiana April 22, 1993
Murphy Superior, Wisconsin May 17, 1993
Pennzoil Shreveport, Louisiana May 5, 1993
Phibro Energy1 Houston, Texas April 20, 1995
Rock Island (purchased by Marathon) Indianapolis, Indiana April 26, 1993
Shell Deer Park, Texas March 31, 1993
Shell Norco, Louisiana April 20, 1993
Shell Wood River, Illinois May 28, 1993
Star Enterprise1 Convent, Louisiana August 30, 1994
Star Enterprise1 Port Arthur, Texas September 21, 1994
Sun Philadelphia, Pennsylvania May 12, 1993
Texaco Anacortes, Washington June 10, 1993
Total Ardmore, Oklahoma June 23, 1993
Young Douglasville, Georgia June 21, 1993
Refinery selected to augment record sample availability.1
Table 2.1. Engineering Site Visit Facilities

Petroleum Refining Industry Study 13 August 1996
2.2.2 Engineering Site Visits
The field activities were initiated with a series of engineering site visits to the selectedfacilities. The purpose of these trips was to:
• Develop a firm understanding of the processes associated with the RCs
• Understand how, when, why, and where each residual is generated and managed
• Establish a schedule of sampling opportunities
• Establish a dialogue with the refinery personnel to ensure optimal sampling andcollection of representative samples.
An engineering site visit report was developed for each of the trips; these are available inthe CBI and non-CBI dockets, as appropriate. For the later site visits conducted in 1994 and1995, the engineering site visit reports were combined with the analytical data reports preparedfor each facility. The site visit reports included the following elements:
• Purpose of the site visit
• Refinery summary, including general information gathered during the site visit, as wellas data gleaned from telephone conversations and reviews of EPA files, the refinery'sprocess flow diagram, and expected residual availability
• A discussion of the processes used at the refinery generating the residuals of concern
• Source reduction and recycling techniques employed by the refinery
• A description of onsite residual management facilities
• A chronology of the site visit.
2.2.3 RCRA §3007 Questionnaire
EPA developed an extensive questionnaire under the authority of §3007 of RCRA fordistribution to the petroleum refining industry. A blank copy of the survey instrument isprovided in the RCRA docket. The questionnaire was organized into the following areas:
I. Corporate and facility informationII. Crude oil and product informationIII. Facility process flow diagramIV. Process units: general informationV. Process units: flow diagrams and process descriptionsVI. Residual generation and managementVII. Residual and contaminated soil and debris characterizationVIII. Residual management units: unit-specific characterizationIX. Unit-specific media characterization

Petroleum Refining Industry Study 14 August 1996
X. General facility characterization (focusing on exposure pathway characterization)XII. Source reduction effortsXIII. Certification.
The survey was distributed in August 1993 to all refineries identified as active in 1992 inthe DOE Petroleum Supply Annual. Of the 185 surveys distributed, completed responses wereobtained for 172 refineries. Thirteen refineries notified EPA that they had stopped operations atsome point in or after 1992 and thus were unable to complete the survey due to no staffing orinaccessible or unavailable data.
The survey responses were reviewed by SAIC chemical engineers for completeness andthen entered into a relational data base known as the 1992 Petroleum Refining Data Base(PRDB). The entries were subjected to a series of automated quality assurance programs toidentify inappropriate entries and missing data links. An exhaustive engineering review of eachfacility's response was then conducted, resulting in follow-up letters to most of the industryseeking clarifications, corrections, and additional data where needed. The responses to thefollowup letters were entered into the data base. A wide variety of additional quality assurancechecks were run on the data to ensure that the residuals of concern were characterized ascompletely and accurately as possible. Follow-up telephone interviews were conducted asnecessary to address remaining data issues. After extensive review, the Agency believes that thedata are reliable and represent the industry's current residual generation and managementpractices.
Table 2.2 describes the survey results for each of the study residuals of concern, sortedby total volume generated in metric tons (MT).
2.2.4 Familiarization Sampling
The early phases of the analytical phase of this listing determination consisted of thedevelopment of a Quality Assurance Project Plan (QAPjP) for sampling and analysis, followedby the collection and analysis of six “familiarization” samples (five listing residuals and onestudy residual). The purpose of collecting these samples was to assess the effectiveness of themethods identified in the QAPjP for the analysis of the actual residuals of concern. Due to thehigh hydrocarbon content of many of the RCs, there was concern at the outset of the project thatanalytical interferences would prevent the contracted laboratory from achieving adequatequantitation limits; familiarization analysis allowed the laboratories to experiment with theanalytical methods and waste matrices and optimize operating procedures.
In addition, the first version of the QAPjP identified a list of target analytes that wasderived from previous Agency efforts to characterize refinery residuals. These included theDelisting Program's list of analytes of concern for refinery residuals, the “Skinner List”, anevaluation of compounds detected in the sampling and analysis program for listing refineryresiduals in the 1980s, and the judgment of EPA and SAIC chemists who evaluated the processchemistry of the residuals of concern. During familiarization sample analysis, particularattention was paid to the tentatively identified compounds to determine whether they should beadded to the target analyte list.

The Agency determined that one listing residual, catalyst from sulfuric acid alkylation, would not be sampled3
due to the existing regulatory exemption for sulfuric acid destined for reclamation, and that one study residual,catalyst from HF alkylation, could not be sampled due to its extremely rare generation.
Petroleum Refining Industry Study 15 August 1996
Study Residual Description
# ofReportedResiduals
Total Volume(MT)
Acid Soluble Oil 80 33,493
Hydrocracking Catalyst 83 18,029
Off-specification Product from Sulfur Complex and H S Removal2 93 9,647
Residual Oil Tank Sludge 62 9,107
Treating Clay from Clay Filtering 244 8,990
Desalting Sludge 141 4,841
Off-specification Treating Solution from Sulfur Complex and H S2
Removal (spent amine and spent Stretford solution)76 23,881
Catalyst from Polymerization (phosphoric acid and Dimersol) 42 4,119
Treating Clay from Alkylation 88 2,895
Treating Clay from Isomerization/Extraction 43 2,472
Off-specification Product from Residual Upgrading 3 800
Treating Clay from Lube Oil 19 733
Catalyst from Isomerization 21 337
Sludge from Residual Upgrading 34 242
Catalyst from HF Alkylation 3 152
Total 1,061 119,738
Table 2.2. Study Residuals Volume Statistics
Samples of five listing residuals were collected for familiarization analysis: crude oiltank sediments, hydrotreating catalyst, sulfur complex sludge, H SO alkylation catalyst, and2 4
spent caustic. One study residual, acid soluble oil, was analyzed under this program. The resultsof the familiarization effort essentially confirmed the techniques identified in the QAPjP andindicated that the laboratories generally would be able to achieve adequate quantitation of thetarget analytes. The familiarization and final QAPjPs are provided in the docket to theNovember 20, 1995 proposed rulemaking.
2.2.5 Record Sampling
Upon completion of the familiarization sampling and analysis effort, the Agency initiatedrecord sampling and analysis of the listing and study residuals. Given budgetary constraints, theAgency set a goal of collecting 4-6 samples of each of the listing residuals, and 2-4 samples ofthe study residuals for a total of 134 samples . Table 2.3 shows the 103 samples that were3
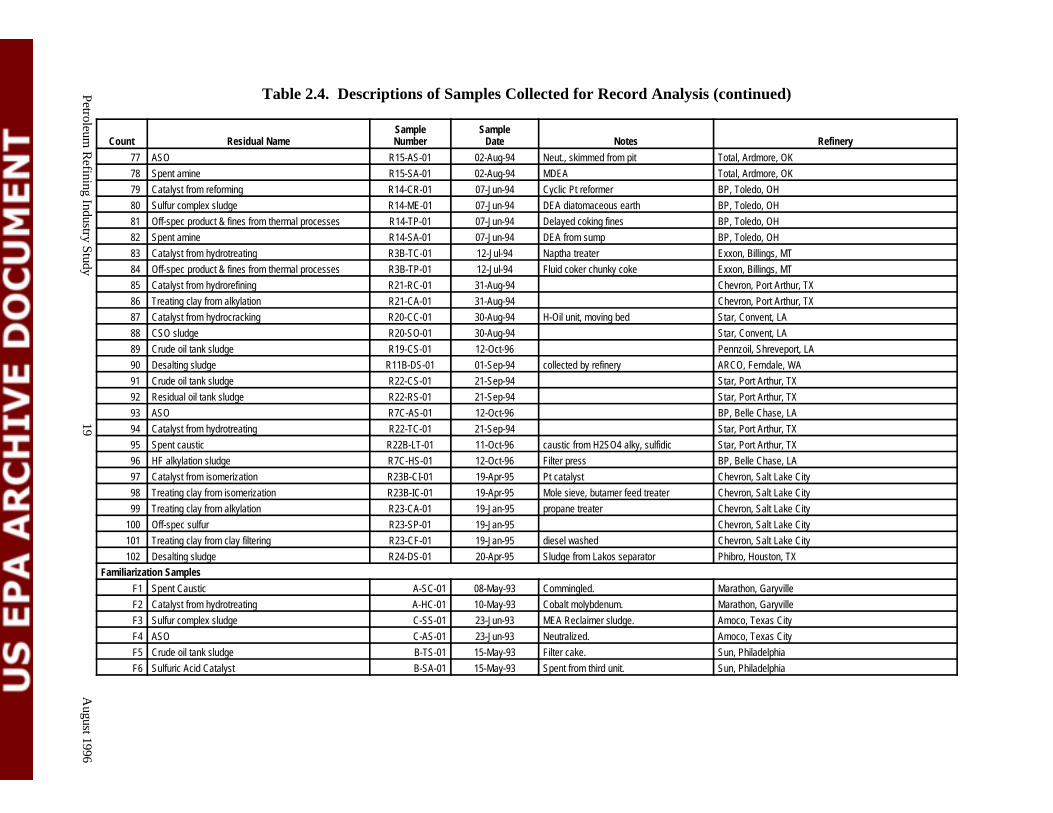
actually collected. The numbers in the darkened boxes refer to Table 2.4 which lists each of thesample numbers, sample dates, facility names, and other information describing the residualsamples.

Petroleum Refining Industry Study 16 August 1996
Listing Residuals
Record SamplesFamiliarization
Samples
1 2 3 4 5 6 1
Crude oil tank sludge 33 67 73 53 89 91 F5
Unleaded gasoline tank sludge 34 42 65
CSO sludge 14 49 72 88
FCC catalyst and fines 1 12 13 26 27 28
Catalyst from hydrotreating 6 44 55 83 94 69 F2
Catalyst from hydrorefining 21 36 85
Catalyst from reforming 3 22 37 56 79 75
Sulfuric acid alkylation sludge 46
HF alkylation sludge 19 47 51 74 96
Sulfur complex sludge 10 25 29 80 70 F3
Catalyst from sulfur complex 9 15 23 24 52 54
Off-spec product & fines/thermal process 30 45 59 63 81 84
Spent caustic 16 17 32 62 64 95 F1
Study Residuals 1 2 3 4
Residual oil tank sludge 41 92
Desalting sludge 5 50 90 102
Hydrocracking catalyst 4 43 87
Catalyst from isomerization 39 48 71 97
Treating clay from isomerization/extraction 68 98
Catalyst from polymerization 35 66A 66B
Treating clay, alkylation (HF and H2S04) 20 76 86 99
ASO 18 38 77 93 F4
Off-spec sulfur product 2 8 40 100
Spent treating solution (amine) 61 58 82 78
Process sludge from residual upgrading 11
Off-spec product, residual upgrading
Treating clay from lube oil 60
Treating clay from clay filtering 7 31 57 101
Notes: Sulfuric Acid Alkylation catalyst is not presented in this figure. One familiarization sample of sulfuricacid catalyst was captured and analyzed. HF catalyst is constant boiling mixture (CBM) and is notshown in this figure.
Table 2.3. Residuals Collected for Record Analysis
The sampling team maintained monthly phone contact with the targeted refineries tomaintain an optimized sampling schedule. Despite careful coordination with the refineries andbest efforts to identify and collect all available samples, there were several categories of studyresiduals for which the targeted minimum number of samples could not be collected:
• Two samples of residual oil tank sludge were collected. This residual is available onlyfor a brief period during tank turnarounds, which may occur only every 10 years. Inseveral cases, refineries mixed their residual oil and clarified slurry oil (CSO) in thesame tank.

Petroleum
Refining Industry S
tudy17
August 1996
Table 2.4. Descriptions of Samples Collected for Record Analysis
Count Residual Name Number Date Notes RefinerySample Sample
1 FCC catalyst and fines R2-FC-01 30-Sep-93 ESP Fines. Shell, Wood River, Illinois
2 Off-spec sulfur R2-SP-01 30-Sep-93 Taken from low spots on the unit. Shell, Wood River, Illinois
3 Catalyst from reforming R2-CR-01 01-Oct-93 Platinum catalyst. Shell, Wood River, Illinois
4 Catalyst from hydrocracking R2-CC-02 04-Oct-93 2nd stage, Ni/W. Shell, Wood River, Illinois
5 Desalting sludge R1-DS-01 26-Oct-93 Removed from vessel. Marathon, Indianapolis
6 Catalyst from hydrotreating R1-TC-01 26-Oct-93 Naphtha reformer pretreat, CoMo. Marathon, Indianapolis
7 Treating clay R1-CF-01 27-Oct-93 Kerosene. Marathon, Indianapolis
8 Off-spec sulfur R1-SP-01 27-Oct-93 From product tank. Marathon, Indianapolis
9 Catalyst from sulfur complex R1-SC-01 27-Oct-93 Al2O3. Marathon, Indianapolis
10 Sulfur complex sludge R1-ME-01 27-Oct-93 MEA reclaimer bottoms. Marathon, Indianapolis
11 Process sludge from residual upgrading R1-RU-01 27-Oct-93 ROSE butane surge tank sludge. Marathon, Indianapolis
12 FCC catalyst and fines R4-FC-01 16-Nov-93 Equilibrium cat. from hopper. Little America, Evansville, Wy
13 FCC catalyst and fines R4-FC-02 16-Nov-93 ESP fines. truck trailer comp. Little America, Evansville, Wy
14 CSO sludge R4-SO-01 16-Nov-93 Tank sludge from pad. Little America, Evansville, Wy
15 Catalyst from sulfur complex R4-SC-01 16-Nov-93 Claus unit alumina, super sack comp. Little America, Evansville, Wy
16 Spent caustic R3-LT-01 18-Nov-93 Tank samp. Cresylic, concentrated. Exxon, Billings, Montana
17 Spent caustic R3-LT-02 18-Nov-93 Tank samp. Sulfidic, concentrated. Exxon, Billings, Montana
18 ASO R3-AS-01 18-Nov-93 Non-neutralized, separator drum sample Exxon, Billings, Montana
19 HF alkylation sludge R3-HS-01 18-Nov-93 Not dewatered. Dredge from pit. Exxon, Billings, Montana
20 Treating clay from alkylation R3-CA-01 18-Nov-93 HF. Propane treater. Drum composite. Exxon, Billings, Montana
21 Catalyst from hydrorefining R5-TC-01 07-Feb-94 Heavy Gas Oil, CoMo Marathon, Garyville, LA
22 Catalyst from reforming R5-CR-01 07-Feb-94 CCR fines, Pt Marathon, Garyville, LA
23 Catalyst from sulfur complex R5-SC-01 07-Feb-94 Claus Marathon, Garyville, LA
24 Catalyst from sulfur complex R5-SC-02 07-Feb-94 Tail gas, CoMo Marathon, Garyville, LA
25 Sulfur complex sludge R5-ME-02,03 07-Feb-94 Refinery MDEA filter cartridge Marathon, Garyville, LA
26 FCC catalyst and fines R5-FC-02 07-Feb-94 Wet Scrubber Fines Marathon, Garyville, LA
27 FCC catalyst and fines R6-FC-01 09-Feb-94 Equil. from unit Shell, Norco, LA
28 FCC catalyst and fines R6-FC-02 09-Feb-94 Wet scrubber fines Shell, Norco, LA
29 Sulfur complex sludge R6-ME-01 09-Feb-94 Refinery DEA filter cartridge Shell, Norco, LA
30 Off-spec product & fines from thermal process R6-TP-01 09-Feb-94 Coke fines. Shell, Norco, LA
31 Treating clay R6-CF-01 09-Feb-94 Kerosene Shell, Norco, LA
32 Spent caustic R6-LT-01 09-Feb-94 Naph. Comb. Gas oil & Kero Shell, Norco, LA
33 Crude oil tank sludge R6B-CS-01 15-Mar-94 Mix of centrifuge and uncentrifuged Shell, Norco, LA
34 Unleaded gasoline tank sludge R6B-US-01 31-Mar-94 Water washed solids, collected by refinery Shell, Norco, LA
35 Catalyst from polymerization R6B-PC-01 15-Mar-94 Dimersol. filter Shell, Norco, LA
36 Catalyst from hydrorefining R7B-RC-01 14-Mar-94 Diesel hydrorefiner BP, Belle Chase, LA
37 Catalyst from reforming R7B-CR-01 14-Mar-94 Platinum BP, Belle Chase, LA
38 ASO R5B-AS-01 16-Mar-94 Acid regen settler bottoms, not neutralized Marathon, Garyville, LA

Petroleum
Refining Industry S
tudy18
August 1996
Table 2.4. Descriptions of Samples Collected for Record Analysis (continued)
Count Residual Name Number Date Notes RefinerySample Sample
39 Catalyst from isomerization R5B-1C-01 16-Mar-94 Butamer, platinum Marathon, Garyville, LA
40 Off-spec sulfur R7B-SP-01 14-Mar-94 From cleaned out tank BP, Belle Chase, LA
41 Residual oil tank sludge R8A-RS-01 30-Apr-94 CSO and Resid. Amoco, Texas City
42 Unleaded gasoline tank sludge R8A-US-01 14-Apr-94 Collected by refinery Amoco, Texas City
43 Catalyst from hydrocracking R8A-CC-01 30-Mar-94 Hydroproc., 1st stage cracker, CoMo Amoco, Texas City
44 Catalyst from hydrotreating R8A-TC-01 30-Mar-94 NiMo, landfilled Amoco, Texas City
45 Off-spec product & fines from thermal processes R8A-TP-01 30-Mar-94 Fines, F&K processed Amoco, Texas City
46 H2SO4 alkylation sludge R8B-SS-01 30-Apr-94 From Frog pond, not dewatered Amoco, Texas City
47 HF alkylation sludge R8B-HS-01 30-Apr-94 Not dewatered, dredged Amoco, Texas City
48 Catalyst from isomerization R8B-IC-01 30-Apr-94 Butamer, Pt Amoco, Texas City
49 CSO sludge R9-SO-01,02 17-May-94 Filters (and blank) Murphy, Superior, WI
50 Desalting sludge R9-DS-01 17-May-94 Murphy, Superior, WI
51 HF alkylation sludge R9-HS-01 17-May-94 Murphy, Superior, WI
52 Catalyst from sulfur complex R7B-SC-01 14-Mar-94 SCOT catalyst BP, Belle Chase, LA
53 Crude oil tank sludge R10-CS-01 26-Aug-94 Ashland, Catletsburg, KY
54 Catalyst from sulfur complex R11-SC-01 10-May-94 SCOT, CoMo ARCO, Ferndale, WA
55 Catalyst from hydrotreating R11-TC-01 10-May-94 NiMo, naphtha treater ARCO, Ferndale, WA
56 Catalyst from reforming R11-CR-01 10-May-94 Pt/Rh ARCO, Ferndale, WA
57 Treating clay R11-CF-01 10-May-94 Reformer sulfur trap ARCO, Ferndale, WA
58 Spent amine R11-SA-01 10-May-94 DEA ARCO, Ferndale, WA
59 Off-spec product & fines from thermal processes R11-TP-01 10-May-94 Coke fines ARCO, Ferndale, WA
60 Treating clay from lube oil R13-CL-01 30-Apr-94 Clay dust Shell, Deer Park, TX
61 Spent amine R13-SA-01 30-Apr-94 DEA Shell, Deer Park, TX
62 Spent caustic R13-LT-01 30-Apr-94 Sulfidic Shell, Deer Park, TX
63 Off-spec product & fines from thermal processes R12-TP-01 12-May-94 Coke fines, from trap Texaco, Anacortes, WA
64 Spent caustic R12-LT-01 12-May-94 Cresylic Texaco, Anacortes, WA
65 Unleaded gasoline tank sludge R16-US-01 03-Aug-94 Koch
66 Catalyst from polymerization R16-PC-01,02 03-Aug-94 2 catalysts from Dimersol and H2PO4 Koch
67 Crude oil tank sludge R8C-CS-01 01-Jul-94 collected by refinery from tank bottom Amoco, Texas City
68 Treating clay from extraction R8D-CI-01 15-Nov-96 collected by refinery Amoco, Texas City
69 Catalyst from hydrotreating R18-TC-01 20-Oct-94 naptha Ashland, Canton, OH
70 Sulfur complex sludge R18-ME-01 14-Oct-94 MEA sludge, collected by refinery Ashland, Canton, OH
71 Catalyst from isomerization R18-IC-01 20-Oct-94 Penex Ashland, Canton, OH
72 CSO sludge R1B-CS-01 26-Aug-94 mixed CSO/resid Marathon, Indianapolis
73 Crude oil tank sludge R4B-CS-01 26-Aug-94 Filter cake sludge Little America
74 HF alkylation sludge R15-HS-01 02-Aug-94 Dredged from pit Total, Ardmore, OK
75 Catalyst from reforming R15-CR-01 02-Aug-94 CCR fines Total, Ardmore
76 Treating clay from alkylation R15-CA-01 02-Aug-94 Butane Total, Ardmore
Petroleum
Refining Industry S
tudy19
August 1996
Table 2.4. Descriptions of Samples Collected for Record Analysis (continued)
Count Residual Name Number Date Notes RefinerySample Sample
77 ASO R15-AS-01 02-Aug-94 Neut., skimmed from pit Total, Ardmore, OK
78 Spent amine R15-SA-01 02-Aug-94 MDEA Total, Ardmore, OK
79 Catalyst from reforming R14-CR-01 07-Jun-94 Cyclic Pt reformer BP, Toledo, OH
80 Sulfur complex sludge R14-ME-01 07-Jun-94 DEA diatomaceous earth BP, Toledo, OH
81 Off-spec product & fines from thermal processes R14-TP-01 07-Jun-94 Delayed coking fines BP, Toledo, OH
82 Spent amine R14-SA-01 07-Jun-94 DEA from sump BP, Toledo, OH
83 Catalyst from hydrotreating R3B-TC-01 12-Jul-94 Naptha treater Exxon, Billings, MT
84 Off-spec product & fines from thermal processes R3B-TP-01 12-Jul-94 Fluid coker chunky coke Exxon, Billings, MT
85 Catalyst from hydrorefining R21-RC-01 31-Aug-94 Chevron, Port Arthur, TX
86 Treating clay from alkylation R21-CA-01 31-Aug-94 Chevron, Port Arthur, TX
87 Catalyst from hydrocracking R20-CC-01 30-Aug-94 H-Oil unit, moving bed Star, Convent, LA
88 CSO sludge R20-SO-01 30-Aug-94 Star, Convent, LA
89 Crude oil tank sludge R19-CS-01 12-Oct-96 Pennzoil, Shreveport, LA
90 Desalting sludge R11B-DS-01 01-Sep-94 collected by refinery ARCO, Ferndale, WA
91 Crude oil tank sludge R22-CS-01 21-Sep-94 Star, Port Arthur, TX
92 Residual oil tank sludge R22-RS-01 21-Sep-94 Star, Port Arthur, TX
93 ASO R7C-AS-01 12-Oct-96 BP, Belle Chase, LA
94 Catalyst from hydrotreating R22-TC-01 21-Sep-94 Star, Port Arthur, TX
95 Spent caustic R22B-LT-01 11-Oct-96 caustic from H2SO4 alky, sulfidic Star, Port Arthur, TX
96 HF alkylation sludge R7C-HS-01 12-Oct-96 Filter press BP, Belle Chase, LA
97 Catalyst from isomerization R23B-CI-01 19-Apr-95 Pt catalyst Chevron, Salt Lake City
98 Treating clay from isomerization R23B-IC-01 19-Apr-95 Mole sieve, butamer feed treater Chevron, Salt Lake City
99 Treating clay from alkylation R23-CA-01 19-Jan-95 propane treater Chevron, Salt Lake City
100 Off-spec sulfur R23-SP-01 19-Jan-95 Chevron, Salt Lake City
101 Treating clay from clay filtering R23-CF-01 19-Jan-95 diesel washed Chevron, Salt Lake City
102 Desalting sludge R24-DS-01 20-Apr-95 Sludge from Lakos separator Phibro, Houston, TX
Familiarization Samples
F1 Spent Caustic A-SC-01 08-May-93 Commingled. Marathon, Garyville
F2 Catalyst from hydrotreating A-HC-01 10-May-93 Cobalt molybdenum. Marathon, Garyville
F3 Sulfur complex sludge C-SS-01 23-Jun-93 MEA Reclaimer sludge. Amoco, Texas City
F4 ASO C-AS-01 23-Jun-93 Neutralized. Amoco, Texas City
F5 Crude oil tank sludge B-TS-01 15-May-93 Filter cake. Sun, Philadelphia
F6 Sulfuric Acid Catalyst B-SA-01 15-May-93 Spent from third unit. Sun, Philadelphia

Petroleum Refining Industry Study 20 August 1996
• Two samples of treating clay from isomerization/extraction were collected. Thisresidual is available only for a brief period during unit turnarounds, which may occuronly every 3-5 years. This residual was not readily available from the set of facilitiesselected for sampling.
• One sample of treating clay from lube oil processes was collected. Due to thespecialty of the processes, a limited number of refineries produce lube oils and not allof these facilities use clay filtering. This residual is not readily available, and wasextremely difficult to find from the facilities randomly selected for sampling.
• One sample of residual upgrading sludge was collected. This residual is not readilyavailable from the set of facilities selected for sampling.
• No samples of off-specification product from residual upgrading were collected. As isdiscussed further in Section 3.7.2, the Agency believes that this residual wasinappropriately classified as a residual due to the evaluation of inaccurate old data. This residual was reported as being generated by only one facility in the 1992 §3007Survey.
Each of the samples collected was analyzed for the total and Toxicity CharacteristicsLeaching Procedure (TCLP) concentrations of the target analytes identified in the QAPjP. Inaddition, certain residuals were tested for different characteristics based on the Agency'sunderstanding of the residuals developed during the engineering site visits. Each sample wasalso analyzed for the ten most abundant nontarget volatile and the 20 most abundant nontargetsemi-volatile organics in each sample. These tentatively identified compounds (TICs) were notsubjected to QA/QC evaluation (e.g., MS/MSD analyses) and thus were considered tentative.
2.2.6 Split Samples Analyzed by API
The American Petroleum Institute (API) accompanied the EPA contractor (SAIC) onvirtually all sampling trips and collected split samples of many of the record samples. API'sanalytical results for a number of the samples were made available to EPA for comparisonpurposes. In general, the Agency found that the API and EPA split sample analyses had verygood agreement. Appendix B of the Listing Background Document, available in the RCRAdocket for the 11/20/95 proposal, presents the Agency's comparison of the split sample results.
2.2.7 Synthesis
The results of the Agency's four year investigation have been synthesized in this reportand in the Listing Background document for the November 20, 1995 proposed rulemaking. Additional supporting documents are available in the docket for that rulemaking.

Petroleum Refining Industry Study 21 August 1996
3.0 PROCESS AND WASTE DESCRIPTIONS
3.1 REFINERY PROCESS OVERVIEW
Refineries in the United States vary in size and complexity and are generally geared to aparticular crude slate and, to a certain degree, reflect the demand for specific products in thegeneral vicinity of the refinery. Figure 3.1 depicts a process flow diagram for a hypotheticalrefinery that employs the major, classic unit operations used in the refinery industry. These unitoperations are described briefly below, and in more detail in the remainder of this section. Eachsubsection is devoted to a major unit operation that generates one or more of the study residualsof concern and provides information related to the process, a description of the residual and howand why it is generated, management practices used by the industry for each residual, the resultsof the Agency's characterization of each residual, and summary information regarding sourcereduction opportunities and achievements.
Storage Facilities: Large storage capacities are needed for refinery feed and products. Sediments from corrosion and impurities accumulate in these storage tanks. The consent decreeidentifies sludges from the storage of crude oil, clarified slurry oil, and unleaded gasoline forconsideration as listed wastes. Residual oil storage tank sludge was identified as a studyresidual.
Crude Desalting: Clay, salt, and other suspended solids must be removed from thecrude prior to distillation to prevent corrosion and deposits. These materials are removed bywater washing and electrostatic separation. Desalting sludge is a study residual.
Distillation: After being desalted, the crude is subjected to atmospheric distillation,separating the crude by boiling point into light ends, naphtha, middle distillate (light and heavygas oil), and a bottoms fraction. The bottoms fraction is frequently subjected to further distilla-tion under vacuum to increase gas oil yield. No residuals from distillation are underinvestigation.
Catalytic Cracking: Catalytic cracking converts heavy distillate to compounds withlower boiling points (e.g., naphthas), which are fractionated. Cracking is typically conducted ina fluidized bed reactor with a regenerator to continuously reactivate the catalyst. Crackingcatalysts are typically zeolites. The flue gas from the regenerator typically passes through dry orwet fines removal equipment and carbon monoxide oxidation prior to being released to theatmosphere. Catalyst and fines, as well as sediments from storage of and solids removal fromclarified slurry oil (the bottoms fraction from catalytic cracking), are listing residuals of concern.
Hydroprocessing: Hydroprocessing includes (1) hydrotreating and hydrorefining (orhydrodesulfurization), which improve the quality of various products (e.g., by removing sulfur,nitrogen, oxygen, metals, and waxes and by converting olefins to saturated compounds); and (2)hydrocracking, which cracks heavy materials, creating lower-boiling, more valuable products. Hydrotreating is typically less severe than hydrorefining and is applied to lighter cuts. Hydro-cracking is a more severe operation than hydrorefining, using higher temperature and longercontact time, resulting in significant reduction in feed molecular size. Hydroprocessing catalysts

Petroleum Refining Industry Study 22 August 1996
Fig
ure
3.1.
Sim
plif
ied
Ref
iner
y P
roce
ss F
low
Dia
gram
Figure 3.1. Simplified Refinery Process Flow Diagram

Petroleum Refining Industry Study 23 August 1996
are typically some combination of nickel, molybdenum, and cobalt. Typical applications ofhydroprocessing include treating distillate to produce low-sulfur diesel fuel, treating naphthareformer feed to remove catalyst poisons, and treating catalytic cracking unit feed to reducecatalyst deactivation. Hydrotreating and hydrorefining catalysts are listing residuals, whilehydrocracking catalyst is a study residual.
Thermal Processes: Thermal cracking uses the application of heat to reduce high-boiling compounds to lower-boiling products. Delayed (batch) or fluid (continuous) coking isessentially high-severity thermal cracking and is used on very heavy residuum (e.g., vacuumbottoms) to obtain lower-boiling cracked products. (Residuum feeds are not amenable tocatalytic processes because of fouling and deactivation.) Products are olefinic and include gas,naphtha, gas oils, and coke. Visbreaking is also thermal cracking; its purpose is to decrease theviscosity of heavy fuel oil so that it can be atomized and burned at lower temperatures thanwould otherwise be necessary. Other processes conducting thermal cracking also would bedesignated as thermal processes. Off-spec product and fines is a listing residual from theseprocesses.
Catalytic Reforming: Straight run naphtha is upgraded via reforming to improve octanefor use as motor gasoline. Reforming reactions consist of (1) dehydrogenation of cycloparaffinsto form aromatics and (2) cyclization and dehydrogenation of straight chain aliphatics to formaromatics. Feeds are hydrotreated to prevent catalyst poisoning. Operations may besemiregenerative (cyclic), fully-regenerative, or continuous (moving bed) catalyst systems. Precious metal catalysts are used in this process. Spent reforming catalyst is a listing residual.
Polymerization: Polymerization units convert olefins (e.g., propylene) into higheroctane polymers. Two principal types of polymerization units include fixed-bed reactors, whichtypically use solid-supported phosphoric acid as the catalyst, and Dimersol® units, whichtypically use liquid organometallic compounds as the catalyst. Spent polymerization catalyst is astudy residual.
Alkylation: Olefins of 3 to 5 carbon atoms (e.g., from catalytic cracking and coking)react with isobutane (e.g., from catalytic cracking) to give high octane products. Sulfuric(H SO ) or hydrofluoric (HF) acid act as catalysts. Spent sulfuric acid, sulfuric acid alkylation2 4
sludges, and HF sludges are listing residuals, while spent HF acid, acid soluble oil and treatingclays are study residuals.
Isomerization: Isomerization converts straight chain paraffins in gasoline stocks intohigher octane isomers. Isomer and normal paraffins are separated; normal paraffins are thencatalytically isomerized. Precious metal catalysts are used in this process. Spent catalysts andtreating clays are study residuals from this process.
Extraction: Extraction is a separation process using differences in solubility to separate,or extract, a specific group of compounds. A common application of extraction is the separationof benzene from reformate. Treating clay is a study residual from this process.
Lube Oil Processing: Vacuum distillates are treated and refined to produce a variety oflubricants. Wax, aromatics, and asphalts are removed by unit operations such as solvent extrac-

Petroleum Refining Industry Study 24 August 1996
tion and hydroprocessing; clay may also be used. Various additives are used to meet productspecifications for thermal stability, oxidation resistances, viscosity, pour point, etc. Treatingclay is a study residual from this process.
Residual Upgrading: Vacuum tower distillation bottoms and other residuum feeds canbe upgraded to higher value products such as higher grade asphalt or feed to catalytic crackingprocesses. Residual upgrading includes processes where asphalt components are separated fromgas oil components by the use of a solvent. It also includes processes where the asphalt value ofthe residuum is upgraded (e.g., by oxidation) prior to sale. Off-spec product and fines, as wellas process sludges, are study residuals from this category.
Blending and Treating: Various petroleum components and additives are blended todifferent product (e.g., gasoline) specifications. Clay and caustic may be used to remove sulfur,improve color, and improve other product qualities. Spent caustic is a listing residual, whiletreating clay is a study residual.
Sulfur Recovery: Some types of crude typically contain high levels of sulfur, whichmust be removed at various points of the refining process. Sulfur compounds are converted toH S and are removed by amine scrubbing. The H S often is converted to pure sulfur in a Claus2 2plant. Off-gases from the Claus plant typically are subject to tail gas treating in a unit such as aSCOT® treater for additional sulfur recovery. Process sludges and spent catalysts are listingresiduals; off-spec product and off-spec treating solutions are study residuals.
Light Ends (Vapor) Recovery: Valuable light ends from various processes arerecovered and separated. Fractionation can produce light olefins and isobutane for alkylation, n-butane for gasoline, and propane for liquid petroleum gas (LPG). Caustic may be used toremove sulfur compounds. Spent caustic is a listing residual of concern.
Petroleum Refining Industry Study 25 August 1996
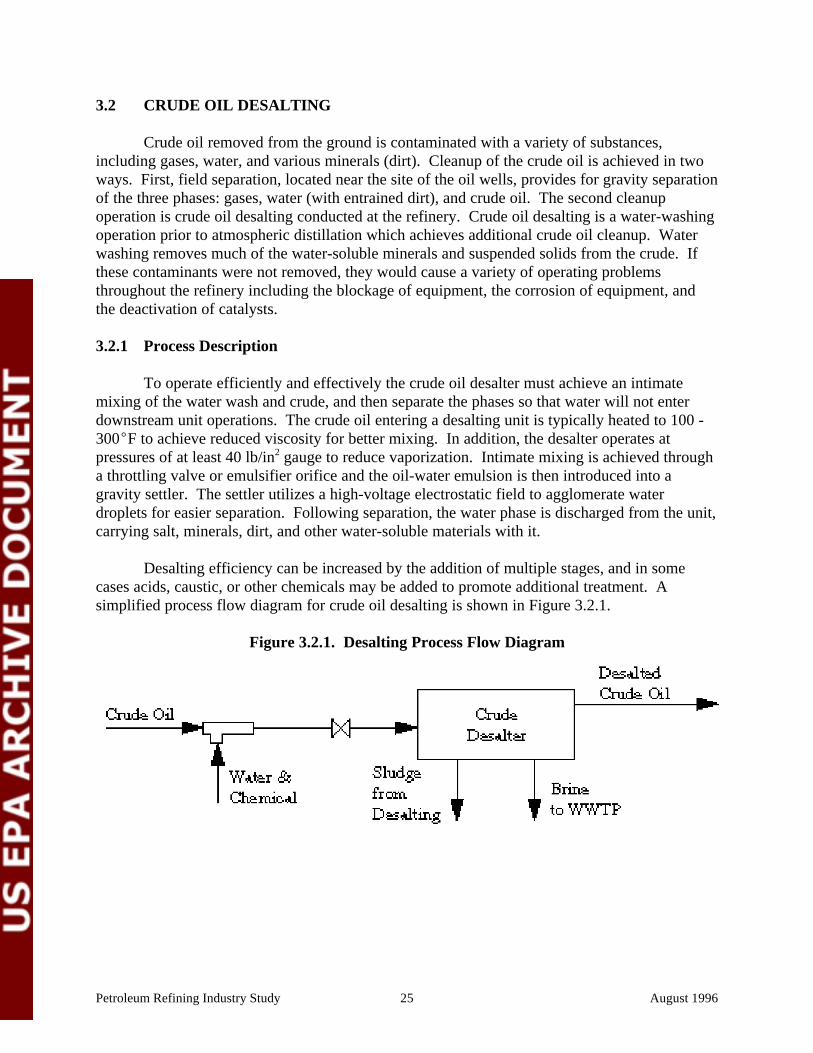
Figure 3.2.1. Desalting Process Flow Diagram
3.2 CRUDE OIL DESALTING
Crude oil removed from the ground is contaminated with a variety of substances,including gases, water, and various minerals (dirt). Cleanup of the crude oil is achieved in twoways. First, field separation, located near the site of the oil wells, provides for gravity separationof the three phases: gases, water (with entrained dirt), and crude oil. The second cleanupoperation is crude oil desalting conducted at the refinery. Crude oil desalting is a water-washingoperation prior to atmospheric distillation which achieves additional crude oil cleanup. Waterwashing removes much of the water-soluble minerals and suspended solids from the crude. Ifthese contaminants were not removed, they would cause a variety of operating problemsthroughout the refinery including the blockage of equipment, the corrosion of equipment, andthe deactivation of catalysts.
3.2.1 Process Description
To operate efficiently and effectively the crude oil desalter must achieve an intimatemixing of the water wash and crude, and then separate the phases so that water will not enterdownstream unit operations. The crude oil entering a desalting unit is typically heated to 100 -300 F to achieve reduced viscosity for better mixing. In addition, the desalter operates atpressures of at least 40 lb/in gauge to reduce vaporization. Intimate mixing is achieved through2
a throttling valve or emulsifier orifice and the oil-water emulsion is then introduced into agravity settler. The settler utilizes a high-voltage electrostatic field to agglomerate waterdroplets for easier separation. Following separation, the water phase is discharged from the unit,carrying salt, minerals, dirt, and other water-soluble materials with it.
Desalting efficiency can be increased by the addition of multiple stages, and in somecases acids, caustic, or other chemicals may be added to promote additional treatment. Asimplified process flow diagram for crude oil desalting is shown in Figure 3.2.1.
Petroleum Refining Industry Study 26 August 1996
3.2.2 Desalting Sludge
3.2.2.1 Description
Desalting sludge is continuously separated from the crude oil and settles to the bottom ofthe desalter with the water wash. The majority of the sludge is removed from the desalter withthe water wash and is discharged to the facility's wastewater treatment plant. The sludge thenbecomes part of the wastewater treatment sludges. On a regular basis (e.g., weekly), water jetsat the bottom of the desalter are activated, stirring up sludge that has built up on the bottom ofthe unit and flushing it to wastewater treatment. This process is known as “mud washing” andallows the units to continue to operate without shutting down for manual sludge removal.
Desalting sludge is removed from the unit during unit turnarounds, often associated withturnarounds of the distillation column. These turnarounds are infrequent (e.g., every severalyears). Some refineries operate enough desalters in parallel to allow for turnarounds while thedistillation columns continue to operate.
At turnaround, the sludge can be removed in several different ways. Based on the resultsof the questionnaire, approximately half of the total number of desalting sludge waste streamsare removed from the desalter using a vacuum truck, permanent or portable piping, or othersimilar means where the sludge is removed in a slurry state. Another 25 percent of the sludgesare removed manually by maintenance workers while the removal method for the remaining 25percent of the sludges was not clear. The questionnaire data further indicated that half of thedesalting sludge streams are further piped or stored in tanker trucks following removal, while theremaining half are stored in drums or a dumpster.
As with some tank sludges, some facilities remove their desalting sludge using a vacuumtruck or similar slurring device, then centrifuge the material and store the solids in a drum ordumpster. Such procedures would explain the apparent discrepancy between the number ofstreams removed as solid and the number of streams stored in containers (presumably also assolid). Questionnaire data indicate that approximately 10 percent of the streams generated in1992 underwent dewatering or a similar volume reduction procedure.
3.2.2.2 Generation and Management
Eighty facilities reported generating a total quantity of 4,841 MT of desalting sludge in1992, according to the 1992 RCRA §3007 Survey. Desalting sludge includes material generatedfrom turnaround operations; materials continuously flushed to wastewater treatment aregenerally omitted. The survey contained a residual identification code for “desalter sludge”. Allresiduals assigned this code, and any misidentified residual determined to be desalter sludgegenerated from a process assigned process code for “desalting” were considered “desaltersludge” residuals. This corresponds to residual code 02-A in Section VII.2 of the survey andprocess code 01-A, 01-B, 01-C, and 01-D in Section IV-1.C. Quality assurance was conductedto ensure that all desalting sludge residuals were correctly identified and coded.

These percentages do not match up directly with any one of the management scenarios because the number of4
streams and the volume are a combination of several management scenarios (i.e., managed in WWTP, Subtitle Clandfill, transfer as a fuel, etc.).
Petroleum Refining Industry Study 27 August 1996
Final Management# of
Streams
# of Streamsw/ Unreported
VolumeTotal Volume
(MT)Average
Volume (MT)
Discharge to onsite wastewatertreatment facility
25 9 2,041.62 81.66
Disposal in onsite or offsiteunderground injection
1 0 2.00 2.00
Disposal in offsite Subtitle D landfill 14 1 28.80 2.06
Disposal in offsite Subtitle C landfill 15 5 221.40 14.76
Disposal in onsite Subtitle D landfill 2 0 102.00 51.00
Offsite incineration 8 1 56.00 7.00
Offsite land treatment 4 0 53.20 13.30
Onsite land treatment 8 0 345.76 43.22
Recovery onsite in a coker 3 3 52.40 17.47
Transfer for direct use as a fuel or tomake a fuel
17 1 1,937.60 113.98
TOTAL 97 20 4,840.78 49.90
Table 3.2.1. Generation Statistics for Desalting Sludge, 1992
Based on the results of the survey, 148 facilities use desalting units and are thus likely togenerate desalting sludge. Due to the infrequent generation of this residual, not all of these 148facilities generated desalting sludge in 1992. In addition, some facilities do not generatedesalting sludge at all because they do not conduct unit turnarounds, or do not find any settledsludge when conducting maintenance. However, there was no reason to expect that 1992 wouldnot be a typical year with regard to desalting sludge generation and management. Table 3.2.1provides a description of the quantity generated, number of streams reported, number of streamsnot reporting volumes (data requested was unavailable and facilities were not required togenerate it), total and average volumes.
Note that 42 percent of desalting sludge volumes are discharged to onsite wastewatertreatment. During engineering site and sampling visits, it was observed that refineries wouldsimply flush the sludge to wastewater treatment during desalter turnarounds in a manner similarto mud washing.
Over half of the desalting sludge residuals (48) were reported to be managed ascharacteristically hazardous (most commonly D018), accounting for 40 percent of the sludgevolume. Twenty seven of these streams were managed with F or K listed wastes, reflecting4
their frequent management in wastewater treatment systems.

Petroleum Refining Industry Study 28 August 1996
3.2.2.3 Plausible Management
EPA believes that most of the plausible management practices for this residual werereported in the 1992 RCRA §3007 Survey, as summarized above in Table 3.2.1. The Agencygathered information suggesting other management practices had been used in other yearsincluding: “disposal in onsite Subtitle C landfill” (86 MT), “disposal in onsite surfaceimpoundment” (1 MT), and “recovery onsite via distillation” (0.5 MT). These non-1992practices are generally comparable to practices reported in 1992 (i.e., off-site Subtitle Clandfilling and recovery in a coker). The very small volume reported to have been disposed in asurface impoundment reflects the management of this residual with the refinery’s wastewater ina zero discharge wastewater treatment facility with a final evaporation pond; this managementpractice is comparable to the 1992 reported practice of “disposal in onsite wastewater treatmentfacility”. EPA also compared management practices reported for desalting sludge to thosereported for crude oil tank sediment because of expected similarities in composition andmanagement. Similar land disposal practices were reported for both residuals.
3.2.2.4 Characterization
Two sources of residual characterization data were developed during the industry study:
• Table 3.2.2 summarizes the physical properties of desalting sludge as reported inSection VII.A of the RCRA §3007 survey.
• Four record samples of desalting sludge were collected and analyzed by EPA. Thesesludges represent the various types of desalting operations and sludge generationmethods typically used by the industry and are summarized in Table 3.2.3. Thesamples represent sludges generated during turnaround operations (the most commonway desalting sludge is generated), and also represents sludges both with and withoutundergoing interim deoiling or dewatering steps.
Table 3.2.4 provides a summary of the characterization data collected under thissampling effort. The record samples are believed to be representative of desalting sludge astypically generated by the industry. All four record samples were analyzed for total and TCLPlevels of volatiles, semivolatiles, and metals. Two of three samples analyzed for TCLP Benzeneexhibited the toxicity characteristic for benzene (i.e., the level of benzene in these samples'TCLP extracts exceeded the corresponding regulatory level). Only constituents detected in atleast one sample are shown in Table 3.2.4.
3.2.2.5 Source Reduction
The electrostatic desalter removes most of the solids, salts and water present in the crudeoil. Minimizing the introduction or recycling of solids to the crude unit will assist the reductionof desalting sludge, since solids attract oil and produce emulsions.

Petroleum Refining Industry Study 29 August 1996
The amount of desalting sludge formed is a function of the efficiency of the desalter butmore fundamentally is a characteristic of the crude oil. Methods of managing desalting sludgecenter on increasing the efficiency of the desalter and de-emulsifiers which increase thecapability of separating the oil, water and solid phases.
Reference Waste Minimization/Management Methods
”New Process Effectively Recovers Oil From Refinery Enhanced separation of oil, water and solids.Waste Streams.” Oil & Gas Journal. August 15, 1994.
”Filtration Method Efficiently Desalts Crude in Alternative process: single-stage filtration.Commercial Test.” Oil & Gas Journal. May 17, 1993.
D.T. Cindric, B. Klein, A.R. Gentry and H.M. Gomaa. Includes topic of more effective separation of“Reduce Crude Unit Pollution With These Technologies.” phases in desalter.Hydrocarbon Processing. August, 1993.
”Waste Minimization in the Petroleum Industry: A Practices described: 1. Shear mixing usedCompendium of Practices.” API. November, 1991. to mix desalter wash water and crude. 2.
Turbulence avoided by using lower pressurewater to prevent emulsion formation.

Petroleum Refining Industry Study 30 August 1996
Properties# of
Values
# ofUnreported
Values1 10th % 50th % 90th %
pH 118 144 6.10 7.00 8.40
Reactive CN, ppm 60 202 0.15 1.00 250.00
Reactive S, ppm 67 195 0.80 82.00 500.00
Flash Point, C 73 189 43.89 60.00 94.44
Oil and Grease, vol% 103 159 5.00 16.00 70.00
Total Organic Carbon, vol% 47 215 1.00 15.00 35.00
Vapor Pressure, mm Hg 14 248 0.00 10.50 150.00
Vapor Pressure Temperature, C 9 253 20.00 30.00 40.00
Viscosity, lb/ft-sec 3 259 0.00 0.00 1500.00
Viscosity Temperature, C 5 257 0.00 30.00 50.00
Specific Gravity 69 193 0.90 1.10 1.70
BTU Content, BTU/lb 56 206 270.00 3,590.00 10,000.00
Aqueous Liquid, % 157 105 0.00 30.00 78.00
Organic Liquid, % 151 111 0.00 15.00 50.00
Solid, % 170 92 9.00 45.00 100.00
Other, % 111 151 0.00 0.00 30.00
Particle >60 mm, % 10 252 0.00 0.00 50.00
Particle 1-60 mm, % 9 253 0.00 90.00 100.00
Particle 100 µm-1 mm, % 12 250 0.00 10.00 100.00
Particle 10-100 µm, % 9 253 0.00 0.00 100.00
Particle <10 µm, % 8 254 0.00 0.00 0.00
Median Particle Diameter, microns 7 255 0.00 200.00 2,000.00
Facilities were not required to do additional testing, therefore information provided was based on previously collected1
data or engineering judgment.
Table 3.2.2. Desalter Sludge: Physical Properties
Sample No. Facility Description
R1-DS-01 Marathon, Indianapolis, IN From electrostatic precipitator turnaround. Sludge/slurry removed directly from unit
R9-DS-01 Murphy, Superior, WI Turnaround sludge/slurry taken from drums
R11-DS-01 ARCO, Ferndale, WA Dewatered sludge from turnaround taken frombins
R24-DS-01 Phibro, Houston, TX Continuously generated “solids” from brineseparator; sample mostly aqueous
Table 3.2.3. Desalting Sludge Record Sampling Locations

Petroleum
Refining Industry S
tudy31
August 1996
Table 3.2.4. Desalting Sludge Characterization
Volatile Organics - Method 8260A µg/kg ( µg/L )
CAS No. R1-DS-01 R9-DS-01 R11B-DS-01 R24-DS-01 Conc Maximum Conc CommentsAverage
Acetone 67641 200,000 < 625 < 1,250 160 67,292 200,000 Benzene 71432 230,000 22,000 28,000 36 93,333 230,000
n-Butylbenzene 104518 < 62,500 42,000 31,000 < 5 36,500 42,000 1sec-Butylbenzene 135988 < 62,500 24,000 19,000 < 5 21,500 24,000 1
Ethylbenzene 100414 180,000 150,000 48,000 J 7 126,000 180,000 Isopropylbenzene 98828 < 62,500 36,000 27,000 < 5 31,500 36,000 1
p-Isopropyltoluene 99876 < 62,500 25,000 18,000 < 5 21,500 25,000 1Methylene chloride 75092 J 49,000 < 625 < 1,250 < 5 16,958 49,000
Methyl ethyl ketone 78933 < 62,500 < 625 < 1,250 41 NA NAn-Propylbenzene 103651 < 62,500 74,000 44,000 < 5 60,167 74,000
Toluene 108883 660,000 220,000 61,000 77 313,667 660,000 1,2,4-Trimethylbenzene 95636 350,000 230,000 68,000 35 216,000 350,000
1,3,5-Trimethylbenzene 108678 140,000 85,000 34,000 12 86,333 140,000 o-Xylene 95476 290,000 190,000 54,000 38 178,000 290,000
m,p-Xylenes 108383 / 950,000 380,000 67,000 70 465,667 950,000 106423
Naphthalene 91203 < 62,500 55,000 54,000 32 54,500 55,000 1TCLP Volatile Organics - Methods 1311 and 8260A µg/L
CAS No. R1-DS-01 R9-DS-01 R11B-DS-01 R24-DS-01 Average Maximum Conc CommentsConc
Acetone 67641 770 < 50 B 260 NA 360 770
Benzene 71432 5,200 1,700 280 NA 2,393 5,200 Ethylbenzene 100414 550 340 120 NA 337 550
Toluene 108883 5,200 2,000 760 NA 2,653 5,200 1,2,4-Trimethylbenzene 95636 < 250 190 J 69 NA 130 190 1
1,3,5-Trimethylbenzene 108678 < 250 J 54 J 22 NA 38 54 1Methylene chloride 75092 1,000 1,200 J 23 NA 741 1,200
o-Xylene 95476 1,100 540 200 NA 613 1,100 m,p-Xylene 108383 / 2,400 1,100 490 NA 1,330 2,400
106423
Naphthalene 91203 < 250 < 50 JB 52 NA 51 52 1Semivolatile Organics - Method 8270B µg/kg ( µg/L )
CAS No. R1-DS-01 R9-DS-01 R11B-DS-01 R24-DS-01 Conc Maximum Conc CommentsAverage
Benzo(a)pyrene 50328 J 4,300 J 5,600 < 10,000 < 5 4,950 5,600 1Carbazole 86748 < 13,200 < 20,625 < 20,000 43 NA NA
Chrysene 218019 < 6,600 < 10,313 J 13,000 < 5 9,971 13,000 Dibenzofuran 132649 < 6,600 12,000 J 16,000 < 5 11,533 16,000
2,4-Dimethylphenol 105679 < 6,600 < 10,313 < 10,000 190 NA NAFluorene 86737 J 6,000 24,000 26,000 < 5 18,667 26,000

Petroleum
Refining Industry S
tudy32
August 1996
Table 3.2.4. Desalting Sludge Characterization (continued)
Semivolatile Organics - Method 8270B µg/kg (continued) ( µg/L )
CAS No. R1-DS-01 R9-DS-01 R11B-DS-01 R24-DS-01 Conc Maximum Conc CommentsAverage
Phenanthrene 85018 J 12,000 61,000 68,000 26 47,000 68,000 Phenol 108952 < 6,600 < 10,313 < 10,000 900 NA NA
Pyrene 129000 < 6,600 J 10,000 < 10,000 < 5 8,867 10,000 1-Methylnaphthalene 90120 48,000 220,000 180,000 81 149,333 220,000
2-Methylnaphthalene 91576 66,000 330,000 240,000 130 212,000 330,000 2-Methylchrysene 3351324 < 13,200 J 13,000 < 20,000 < 10 13,000 13,000 1
2-Methylphenol 95487 < 6,600 < 10,313 < 10,000 340 NA NA3/4-Methylphenol NA < 6,600 < 10,313 < 10,000 530 NA NA
Naphthalene 91203 33,000 110,000 130,000 110 91,000 130,000 TCLP Semivolatile Organics - Methods 1311 and 8270B µg/L
CAS No. R1-DS-01 R9-DS-01 R11B-DS-01 R24-DS-01 Average Maximum Conc CommentsConc
Benzo(a)pyrene 50328 JB 16 < 50 < 50 NA 16 16 1Bis(2-ethylhexyl)phthalate 117817 < 50 B 500 < 50 NA 200 500
Di-n-butyl phthalate 84742 < 50 < 50 J 20 NA 20 20 12,4-Dimethylphenol 105679 J 26 < 50 J 73 NA 50 73
1-Methylnaphthalene 90120 J 32 J 50 J 71 NA 51 71 2-Methylnaphthalene 91576 J 34 J 60 J 92 NA 62 92
2-Methylphenol 95487 J 48 J 25 J 43 NA 39 48 3/4-Methylphenol NA J 68 J 40 J 49 NA 52 68
Naphthalene 91203 J 86 J 61 120 NA 89 120 Phenol 108952 200 < 50 J 54 NA 101 200
Total Metals - Methods 6010, 7060, 7421, 7470, 7471, and 7841 mg/kg (mg/L) CAS No. R1-DS-01 R9-DS-01 R11B-DS-01 R24-DS-01 Average Maximum Conc Comments
ConcAluminum 7429905 2,600 3,700 7,500 11.0 4,600 7,500 Antimony 7440360 16.0 14.0 < 6.00 0.28 12.0 16.0
Arsenic 7440382 16.0 34.0 16.0 0.05 22.0 34.0 Barium 7440393 2,200 1,700 1,400 1.80 1,767 2,200
Beryllium 7440417 < 0.50 < 0.50 1.40 < 0.0025 0.80 1.40 Cadmium 7440439 2.90 1.80 3.40 < 0.0025 2.70 3.40
Calcium 7440702 16,000 5,300 3,300 230 8,200 16,000 Chromium 7440473 110 76.0 150 0.17 112 150
Cobalt 7440484 27.0 16.0 13.0 < 0.025 18.7 27.0 Copper 7440508 680 340 430 1.20 483 680
Iron 7439896 71,000 55,000 77,000 200 67,667 77,000
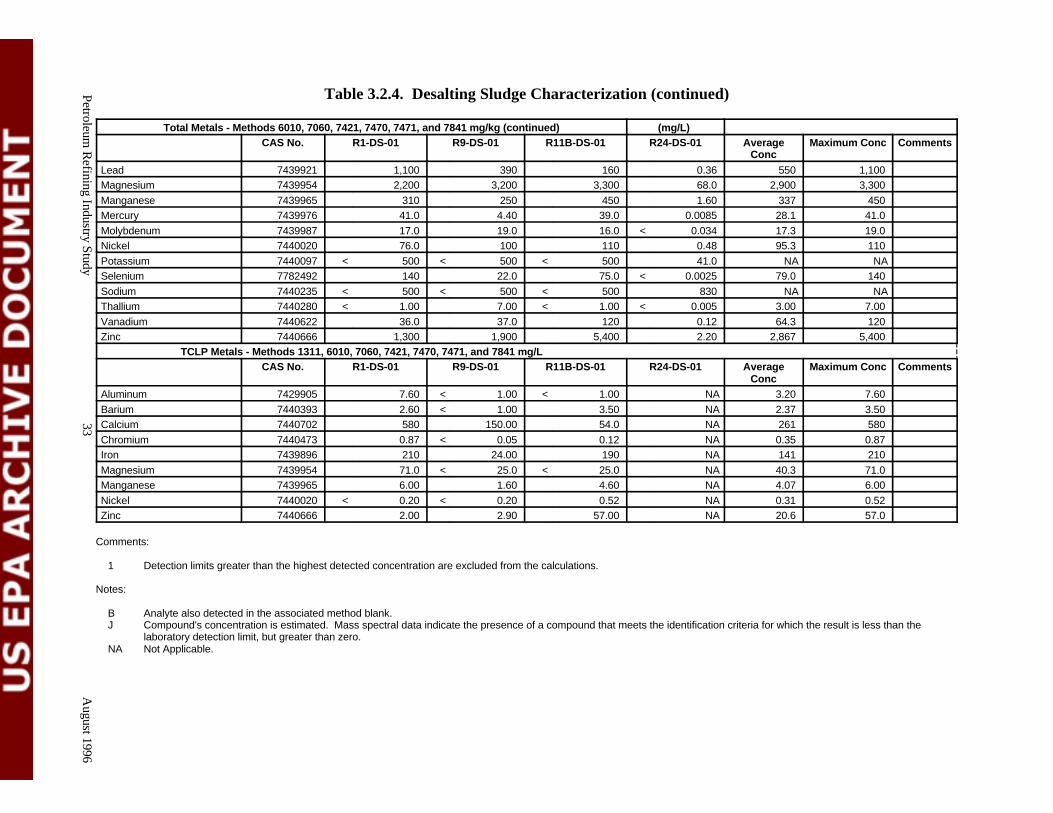
Petroleum
Refining Industry S
tudy33
August 1996
Table 3.2.4. Desalting Sludge Characterization (continued)
Total Metals - Methods 6010, 7060, 7421, 7470, 7471, and 7841 mg/kg (continued) (mg/L) CAS No. R1-DS-01 R9-DS-01 R11B-DS-01 R24-DS-01 Average Maximum Conc Comments
ConcLead 7439921 1,100 390 160 0.36 550 1,100 Magnesium 7439954 2,200 3,200 3,300 68.0 2,900 3,300
Manganese 7439965 310 250 450 1.60 337 450 Mercury 7439976 41.0 4.40 39.0 0.0085 28.1 41.0
Molybdenum 7439987 17.0 19.0 16.0 < 0.034 17.3 19.0 Nickel 7440020 76.0 100 110 0.48 95.3 110
Potassium 7440097 < 500 < 500 < 500 41.0 NA NASelenium 7782492 140 22.0 75.0 < 0.0025 79.0 140
Sodium 7440235 < 500 < 500 < 500 830 NA NAThallium 7440280 < 1.00 7.00 < 1.00 < 0.005 3.00 7.00
Vanadium 7440622 36.0 37.0 120 0.12 64.3 120 Zinc 7440666 1,300 1,900 5,400 2.20 2,867 5,400
TCLP Metals - Methods 1311, 6010, 7060, 7421, 7470, 7471, and 7841 mg/LCAS No. R1-DS-01 R9-DS-01 R11B-DS-01 R24-DS-01 Average Maximum Conc Comments
ConcAluminum 7429905 7.60 < 1.00 < 1.00 NA 3.20 7.60
Barium 7440393 2.60 < 1.00 3.50 NA 2.37 3.50 Calcium 7440702 580 150.00 54.0 NA 261 580
Chromium 7440473 0.87 < 0.05 0.12 NA 0.35 0.87 Iron 7439896 210 24.00 190 NA 141 210
Magnesium 7439954 71.0 < 25.0 < 25.0 NA 40.3 71.0 Manganese 7439965 6.00 1.60 4.60 NA 4.07 6.00
Nickel 7440020 < 0.20 < 0.20 0.52 NA 0.31 0.52 Zinc 7440666 2.00 2.90 57.00 NA 20.6 57.0
Comments:
1 Detection limits greater than the highest detected concentration are excluded from the calculations.
Notes:
B Analyte also detected in the associated method blank.J Compound's concentration is estimated. Mass spectral data indicate the presence of a compound that meets the identification criteria for which the result is less than the
laboratory detection limit, but greater than zero.NA Not Applicable.

Petroleum Refining Industry Study 34 August 1996
3.3 HYDROCRACKING
Petroleum refining hydroprocessing techniques include hydrocracking, hydrorefining,and hydrotreating. Hydrorefining and hydrotreating processes and their respective catalystresiduals are described in the Listing Background Document for the November 20, 1995proposed rule. Hydrocracking processes are similar to hydrotreating and hydrorefiningprocesses in that they remove organic sulfur and nitrogen from the process feeds, but differ inthat they also serve to break heavier fraction feeds into lighter fractions. As refinery crudes havebecome heavier, hydrocracking, a more recent process development compared to long-established conversion processes such as thermal cracking, has become more widely used. Thecurrent trend to heavier feeds and lighter high-quality feeds causes hydrocracking to offeradvantages to future refining operations.
In addition, hydrocracking is a versatile process, and under mild conditions can beutilized for hydrotreating (typically fractions that need to be saturated to give good burningquality) and under more severe conditions can be utilized as a cracker (typically feeds that aretoo heavy or too contaminant-laden for catalytic cracking). As a result of this flexibility,hydrocracking processes can appear in refinery operations in a number of different places.
3.3.1 Process Description
The process flow for hydrocracking is similar to that for hydrotreating: the feed is mixedwith a hydrogen-rich gas, pumped to operating pressure and heated, and fed to one or morecatalytic reactors in series. Hydrocracking units are typically designed with two stages: the firstuses a hydrotreating catalyst to remove nitrogen and heavy aromatics, while the second stageconducts cracking. The catalysts for each stage are held in separate vessels. Organic sulfur andnitrogen are converted to H S and NH , and some unsaturated olefins or aromatics are saturated2 3
or cracked to form lighter compounds. In addition, heavy metal contaminants are adsorbed ontothe catalyst. Following the reactor, the effluent is separated via stabilization and fractionationsteps into its various fractions. There are two major differences between hydrocracking andhydrotreating: 1) operating pressures are much higher, in the range from 2,000 - 3,000 lb/in2
gauge, and 2) hydrogen consumption is much higher, in the range from (1,200 - 1,600SCF/barrel of feed), dependent on the feed. The feed is generally a heavy gas oil or heavierstream.
Catalysts employed in hydrocracking reactors have multiple functions. First, the catalysthas a metallic component (cobalt, nickel, tungsten, vanadium, molybdenum, platinum,palladium, or a combination of these metals) responsible for the catalysis of the hydrogenationand desulfurization/denitrification reactions. In addition, these metals are supported on a highlyacidic support (silica-alumina, acid-treated clays, acid-metal phosphates, or alumina) responsiblefor the cracking reactions. A simplified process flow diagram is shown in Figure 3.3.1.

Petroleum Refining Industry Study 35 August 1996
Figure 3.3.1. Hydrocracking Process Flow Diagram
3.3.2 Spent Hydrocracking Catalyst
3.3.2.1 Description
Metal deposition acts to deactivate, or poison, the hydrocracking catalyst. In addition,carbon from the cracking reactions deactivates the catalyst. The catalyst’s life is dependent onthe severity of cracking and metal deposition and is changed out every 6 months to 8 years. Thecatalyst closest to the entrance (top) of the reactor becomes deactivated first, and for this reasonis sometimes replaced more frequently than the entire reactor contents (a “topping” operation). When catalyst activity is unacceptable, the reactor is taken out of service and typically undergoesa hydrogen sweep to burn residual hydrocarbon, then a nitrogen sweep to cool the reactor andremove occupational hazards such as hydrogen sulfide and benzene. Such procedures werereported by most facilities. The following additional procedures were reported to be employedby fewer facilities, typically only one or two:
Oxidation (to burn residual hydrocarbon)
Cat nap technology or diesel wash (to lower vapor pressure of hazardous volatiles)
Wet dump, water wash, or soda ash wash (to neutralize sulfides and remove volatiles)
Steam stripping (to remove volatiles)
Evacuation (a technique possibly similar to nitrogen sweep)
Some facilities report using no pretreatment methods prior to catalyst removal.

These percentages do not match up directly with any one of the management scenarios because the number of5
streams and the volume are a combination of several management scenarios (i.e., Subtitle C landfill, transfer formetals reclamation, etc.).
Petroleum Refining Industry Study 36 August 1996
In some processes, a moving bed of catalyst is used instead of a fixed bed. In this process,catalyst is continuously and slowly moved countercurrent to the hydrocarbon flow. Spentcatalyst is generated almost continuously and fresh catalyst added as needed for makeup. Thisconfiguration differs significantly from the fixed bed design with respect to spent catalystgeneration frequency.
Unlike hydrotreating and hydrorefining catalysts (discussed in Listing BackgroundDocument), both precious metal and nonprecious metal catalysts are used in hydrocrackingprocesses. Based on a total of 46 facilities reporting spent hydrocracking catalyst generation, 34(74%) reported using nickel/molybdenum, 11 (24%) reported using nickel/tungsten, and 11(24%) reported using palladium. An additional 16 facilities (35%) reported using other metalsin their catalyst such as cobalt, copper, magnesium, monometallic nickel, phosphorus, tin, andzinc. As stated in Section 3.3.1, many hydrocracking units are constructed as a hydrorefiningstage followed by a cracking stage. In reporting catalysis use, refineries may not havedifferentiated between hydrorefining and cracking functions in their response. In this section,data for both pretreatment (hydrorefining function) and hydrocracking catalysts are presented.
Approximately 2,500 MT of the hydrocracking catalyst generated in 1992 was identifiedas displaying hazardous characteristics. This is approximately 15 percent of the total volume5
managed. The most commonly displayed hazardous waste codes were D001 (ignitable), D003(reactive), D004 (TC arsenic) and D018 (TC benzene).
3.3.2.2 Generation and Management
During reactor change-outs, spent hydrocracking catalysts are removed from the reactorsusing a variety of techniques including gravity dumping and water drilling. Upon removal fromthe catalyst bed, the catalyst may be screened to remove fines or catalyst support media. Thecatalyst is typically stored in covered bins pending shipment off site for disposal or recovery.
Twenty-eight facilities reported generating a total quantity of 18,000 MT of this residualin 1992, according to the 1992 RCRA §3007 Questionnaire. Residuals were assigned to be“spent hydrocracking catalyst” if they were assigned a residual identification code of “spentsolid catalyst” or “spent catalyst fines” and were generated from a process identified as ahydrocracking unit. These correspond to residual code 03-A in Section VII.2 of thequestionnaire and process code 05 in Section IV-1.C of the questionnaire. Quality assurancewas conducted by ensuring that all hydrocracking catalysts previously identified in thequestionnaire (i.e., in Section V.B) were assigned in Section VII.2.

Petroleum Refining Industry Study 37 August 1996
Final Management# of
Streams# of Streams w/
Unreported VolumeTotal Volume
(MT)Average
Volume (MT)
Disposal in offsite Subtitle D landfill 7 0 1,592.70 227.53
Disposal in offsite Subtitle C landfill 8 0 991.50 123.94
Reuse onsite as replacement catalyst foranother unit
1 0 159.40 159.40
Transfer metal catalyst for reclamation orregeneration
45 2 13,185.56 293.01
Transfer to another petroleum refinery 14 0 2,100.00 150.00
TOTAL 75 2 18,029.16 295.56
Table 3.3.1. Generation Statistics for Hydrocracking Catalyst, 1992
Based on the results of the questionnaire, 47 facilities use hydrocracking units and arethus likely to generate spent hydrocracking catalyst. Due to the infrequent generation of thisresidual, not all of these 47 facilities generated spent catalyst in 1992. However, there was noreason to expect that 1992 would not be a typical year with regard to hydrocracking catalystgeneration and management. Table 3.3.1 provides a description of the quantity generated,number of streams reported, number of streams not reporting volumes (data requested wasunavailable and facilities were not required to generate it), total and average volumes.
3.3.2.3 Plausible Management
EPA believes that most of the plausible management practices for this residual werereported in the 1992 RCRA §3007 Survey, as summarized above in Table 3.3.1. The Agencygathered information suggesting other management practices had been used in other yearsincluding: “disposal in onsite Subtitle D landfill” (8 MT) and “other recycling, reclamation, orreuse: cement plant” (320 MT). These non-1992 practices are comparable to 1992 practices(i.e., off-site Subtitle D landfilling) or to typical practices for alumina-based catalysts (e.g.,cement plants).
The Agency has no other data to suggest other management practices are used forhydrocracking catalysts due to the physical characteristics and chemical composition of thewaste. EPA compared the management practice reported for hydrocracking catalysts to thosereported for hydrotreating and hydrorefining catalysts based on expected similarities. Similarland disposal practices were reported for all three residuals.
3.3.2.4 Characterization
Two sources of residual characterization were developed during the industry study:
• Table 3.3.2 summarizes the physical properties of the spent catalyst as reported inSection VII.A of the §3007 survey.
• Three record samples of spent hydrocracking catalyst were collected and analyzed byEPA and are summarized in Table 3.3.3. The record samples represent the mostfrequently used catalysts (i.e., nickel/tungsten and nickel/molybdenum, together used

Petroleum Refining Industry Study 38 August 1996
Properties# of
Values# of Unreported
Values1 10th % 50th % 90th %
pH 39 102 5.00 6.80 9.14
Reactive CN, ppm 21 120 0.30 3.20 10.00
Reactive S, ppm 38 103 1.00 12.50 9,500.00
Flash Point, C 36 105 60.00 157.50 200.00
Oil and Grease, vol% 17 124 0.00 0.36 9.00
Total Organic Carbon, vol% 14 127 0.00 0.63 8.00
Specific Gravity 54 87 0.80 1.74 3.15
Specific Gravity Temperature, C 10 131 17.80 20.00 25.00
BTU Content, BTU/lb 4 137 0.00 0.00 7,485.00
Aqueous Liquid, % 64 77 0.00 0.00 0.00
Organic Liquid, % 63 78 0.00 0.00 0.00
Solid, % 101 40 100.00 100.00 100.00
Other, % 62 79 0.00 0.00 0.00
Particle >60 mm, % 28 113 0.00 0.00 0.00
Particle 1-60 mm, % 42 99 95.00 99.00 100.00
Particle 100 µm-1 mm, % 31 110 0.00 1.00 5.00
Particle 10-100 µm, % 27 114 0.00 0.00 0.00
Particle <10 µm, % 27 114 0.00 0.00 0.00
Median Particle Diameter, microns 13 128 0.00 1,600.00 2,000.00
Facilities were not required to do additional testing, therefore information provided was based on previously collected1
data or engineering judgement.
Table 3.3.2. Hydrocracking Catalyst Physical Properties
by well over half of the refineries with hydrocracking processes. In addition, heavygas oil or similar distillate/residual feed is the most common application ofhydrocracking reactors, according to the questionnaire. Therefore, the record samplesare expected to represent most of the spent catalyst generated in the industry. However, another frequently used catalyst (palladium) is not represented, and catalystsemploying feeds other than heavy gas oil (e.g., lube oil) may not have the samecharacteristics when spent.
Table 3.3.4 provides a summary of the characterization data collected under thissampling effort. All three record samples were analyzed for total and TCLP levels of volatiles,semivolatiles, metals and ignitability. One of three samples exhibited the ignitabilitycharacteristic. Only constituents detected in at least one sample are shown in Table 3.3.4.

Petroleum Refining Industry Study 39 August 1996
Sample No. Facility Description
R2-CC-01 Shell, Wood River, IL Nickel/tungsten catalyst, fixed bed, heavy gas oil feed
R8A-CC-01 Amoco, Texas City, TX Nickel/molybdenum catalyst, moving bed, heavy gas oil feed
R20-CC-01 Star, Convent, LA Mixed nickel/tungsten and nickel/molybdenum catalyst, movingbed, heavy gas oil feed
Table 3.3.3. Spent Hydrocracking Catalyst Record Sampling Locations
3.3.2.5 Source Reduction
There is little that can be done to reduce the quantity of these generated catalyst since, bydesign, they must be periodically replaced with fresh catalyst. As a result, the greatestopportunity for waste minimization arises from sending these materials offsite for metalsregeneration, reclamation, or other reuse.
Refinery hydrocracking catalysts generally consist of cobalt and molybdenum or nickeland molybdenum on an alumina support. Typically, the catalysts are regenerated after use. However, industry is interested in finding more specific, long-lasting catalysts. Extensiveresearch is performed in producing new catalysts. Information on hydrotreating andhydrorefining catalysts are also presented below because some of this information may berelevant to hydrocracking catalysts.
Reference Waste Minimization/Management Methods
Monticello, D.J. “Biocatalytic Desulfurization.” An alternative to metal catalysts is theHydrocarbon Processing. February, 1994. development of microorganisms that can
catalyze the reaction.
”NPRA Q&A 1: Refiners Focus on FCC, Methods in improving catalyst life andHydroprocessing, and Alkylation Catalyst.” Oil & Gas performance.Journal. March 28, 1994.
Gorra, F., Scribano, G., Christensen, P., Anderson, K.V., Material substitution to extend catalyst life.and Corsaro, O.G. “New Catalyst, Improve PresulfidingResult in 4+ Year Hydrotreater Run.” Oil & Gas Journal.August 23, 1993.
”Petroleum-derived Additive Reduces Coke on Process modification extends life of catalyst.Hydrotreating Catalyst.” Oil & Gas Journal. December27, 1993.
”Waste Minimization in the Petroleum Industry: A Practices listed: 1. Metals reclamation, 2.Compendium of Practices.” API. November, 1991. Recycling to cement, 3. Recycling to
fertilizer plants.

Petroleum
Refining Industry S
tudy40
August 1996
Table 3.3.4. Spent Hydrocracking Catalyst Characterization
Volatile Organics - Method 8260A µg/kg
CAS No. R2-CC-02 R8A-CC-01 R20-CC-01 Average Conc Maximum Conc Comments
Acetone 67641 5,300 < 6,250 < 1,250 3,275 5,300 1
Acrolein 107028 2,500 < 6,250 < 1,250 1,875 2,500 1
Benzene 71432 370,000 15,000 < 1,250 128,750 370,000
n-Butylbenzene 104518 10,000 40,000 12,000 20,667 40,000
sec-Butylbenzene 135988 < 1,250 18,000 13,000 10,750 18,000
Ethylbenzene 100414 35,000 95,000 < 1,250 43,750 95,000
Isopropylbenzene 98828 < 1,250 34,000 3,700 17,625 34,000
p-Isopropyltoluene 99876 < 1,250 28,000 8,500 12,583 28,000
Naphthalene 91203 < 1,250 64,000 7,600 24,283 64,000
n-Propylbenzene 103651 5,000 49,000 < 1,250 27,000 49,000
Toluene 108883 300,000 120,000 < 1,250 140,417 300,000
1,2,4-Trimethylbenzene 95636 25,000 170,000 21,000 72,000 170,000
1,3,5-Trimethylbenzene 108678 8,000 48,000 4,200 20,067 48,000
o-Xylene 95476 23,000 120,000 3,400 48,800 120,000
m,p-Xylenes 108383 / 106423 60,000 250,000 7,100 105,700 250,000
TCLP Volatile Organics - Methods 1311 and 8260A µg/L
CAS No. R2-CC-02 R8A-CC-01 R20-CC-01 Average Conc Maximum Conc Comments
Benzene 71432 10,000 230 < 50 3,427 10,000
Ethylbenzene 100414 470 180 < 50 233 470
Methylene chloride 75092 < 50 250 < 50 117 250
Toluene 108883 6,600 640 < 50 2,430 6,600
1,2,4-Trimethylbenzene 95636 J 94 120 J 44 86 120
1,3,5-Trimethylbenzene 108678 < 50 < 50 J 61 54 61
o-Xylene 95476 290 270 < 50 203 290
m,p-Xylene 108383 / 106423 750 410 < 50 403 750
Semivolatile Organics - Method 8270B µg/kg
CAS No. R2-CC-02 R8A-CC-01 R20-CC-01 Average Conc Maximum Conc Comments
Acenaphthene 83329 < 165 20,000 32,000 17,388 32,000
Benz(a)anthracene 56553 < 165 J 6,900 < 10,313 3,533 6,900 1
Benzofluoranthene (total) NA < 165 J 5,000 31,000 12,055 31,000
Benzo(g,h,i)perylene 191242 < 165 28,000 42,000 23,388 42,000
Benzo(a)pyrene 50328 < 165 J 3,100 29,000 10,755 29,000
Carbazole 86748 < 330 74,000 J 24,000 32,777 74,000
4-Chlorophenyl phenyl ether 7005723 < 165 < 4,125 83,000 29,097 83,000
Chrysene 218019 < 165 17,000 68,000 28,388 68,000
Dibenzofuran 132649 1,200 9,700 J 13,000 7,967 13,000
7,12-Dimethylbenz(a)anthracene 57976 < 165 < 4,125 45,000 16,430 45,000

Petroleum
Refining Industry S
tudy41
August 1996
Table 3.3.4. Spent Hydrocracking Catalyst Characterization (continued)
Semivolatile Organics - Method 8270B µg/kg (continued)
CAS No. R2-CC-02 R8A-CC-01 R20-CC-01 Average Conc Maximum Conc Comments
Fluoranthene 206440 < 165 20,000 25,000 15,055 25,000
Fluorene 86737 2,800 40,000 82,000 41,600 82,000
Indeno(1,2,3-cd)pyrene 193395 < 165 J 4,600 < 10,313 2,383 4,600 1
3-Methylcholanthrene 56495 < 165 < 4,125 23,000 9,097 23,000
2-Methylchrysene 3351324 < 330 J 13,000 64,000 25,777 64,000
1-Methylnaphthalene 90120 < 330 56,000 230,000 95,443 230,000
2-Methylnaphthalene 91576 < 165 110,000 390,000 166,722 390,000
2-Methylphenol 95487 < 165 < 4,125 J 7,000 3,763 7,000
Naphthalene 91203 < 165 43,000 45,000 29,388 45,000
Phenanthrene 85018 1,200 180,000 160,000 113,733 180,000
Pyrene 129000 1,600 430,000 680,000 370,533 680,000
TCLP Semivolatile Organics - Methods 1311 and 8270B µg/L
CAS No. R2-CC-02 R8A-CC-01 R20-CC-01 Average Conc Maximum Conc Comments
Carbazole 86748 < 100 J 78 < 100 78 78 1
2,4-Dimethylphenol 105679 < 50 J 23 J 44 34 44 1
1-Methylnaphthalene 90120 < 100 J 24 J 41 33 41 1
2-Methylnaphthalene 91576 < 50 J 46 J 59 52 59
2-Methylphenol 95487 J 66 J 70 J 25 54 70
3/4-Methylphenol (total) NA J 76 J 49 J 17 47 76
Naphthalene 91203 < 50 J 44 J 26 35 44 1
Phenol 108952 J 53 < 50 J 63 55 63
Phenanthrene 85018 < 50 J 23 < 50 23 23 1
Pyrene 129000 < 50 J 42 < 50 42 42 1
Total Metals - Methods 6010, 7060, 7421, 7470, 7471, and 7841 mg/kg
CAS No. R2-CC-02 R8A-CC-01 R20-CC-01 Average Conc Maximum Conc Comments
Aluminum 7429905 120,000 53,000 110,000 94,333 120,000
Antimony 7440360 < 6.0 220 < 6.0 77.3 220
Arsenic 7440382 12.0 29.0 < 5.0 15.3 29.0
Beryllium 7440417 < 0.5 160 18.0 59.5 160
Chromium 7440473 130 68.0 < 1.0 66.3 130
Cobalt 7440484 24.0 440 < 5.0 156 440
Copper 7440508 55.0 35.0 < 2.5 30.8 55.0
Iron 7439896 52,000 2,200 570 18,257 52,000
Lead 7439921 < 0.3 15.0 1.6 5.6 15.0
Manganese 7439965 390 16.0 < 1.5 136 390
Molybdenum 7439987 < 6.5 5,400 17,000 7,469 17,000
Nickel 7440020 19,000 28,000 27,000 24,667 28,000

Petroleum
Refining Industry S
tudy42
August 1996
Table 3.3.4. Spent Hydrocracking Catalyst Characterization (continued)
Total Metals - Methods 6010, 7060, 7421, 7470, 7471, and 7841 mg/kg (continued)
CAS No. R2-CC-02 R8A-CC-01 R20-CC-01 Average Conc Maximum Conc Comments
Selenium 7782492 < 0.5 4.0 < 0.5 1.7 4.0
Sodium 7440235 1,200 2,000 < 500 1,233 2,000
Vanadium 7440622 37.0 140,000 49,000 63,012 140,000
Zinc 7440666 82.0 110 < 2.0 64.7 110
TCLP Metals - Methods 1311, 6010, 7060, 7421, 7470, 7471, and 7841 mg/L
CAS No. R2-CC-02 R8A-CC-01 R20-CC-01 Average Conc Maximum Conc Comments
Aluminum 7429905 26.0 < 1.00 < 1.00 9.33 26.00
Chromium 7440473 0.35 < 0.05 < 0.05 0.15 0.35
Iron 7439896 130 < 0.50 < 0.50 43.7 130
Manganese 7439965 10.0 < 0.08 < 0.08 3.38 10.0
Nickel 7440020 110 3.60 0.43 38.0 110
Vanadium 7440622 < 0.25 4.70 < 0.25 1.73 4.70
Zinc 7440666 0.58 < 0.10 < 0.10 0.26 0.58
Miscellaneous Characterization
R2-CC-02 R8A-CC-01 R20-CC-01
Ignitability (oF) 138 145 NA
Comments:
1 Detection limits greater than the highest detected concentration are excluded from the calculations.
Notes:
B Analyte also detected in the associated method blank.J Compound's concentration is estimated. Mass spectral data indicate the presence of a compound that meets the identification criteria for which the result is less than the laboratory detection limit, but greater than
zero.ND Not Detected.ND Not Applicable.

Petroleum Refining Industry Study 43 August 1996