Embed Size (px)
Citation preview
Department of Mechanical Engineering
Study of Renewable Energy Project Risk
Factors Influencing the Insurance Industry
Author: Gary Bratt
Supervisor: Dr Andrew Grant
A thesis submitted in partial fulfilment for the requirement of degree in
Master of Science in Renewable Energy Systems and the Environment
2010
Study of Renewable Energy Project Risk Factors Influencing the Insurance Industry ______________________________________________________________________________________________
2
Copyright Declaration
This thesis is the result of the author’s original research. It has been
composed by the author and has not been previously submitted for
examination which has led to the award of a degree.
The copyright of this thesis belongs to the author under the terms of the
United Kingdom Copyright Acts as qualified by University of Strathclyde
Regulation 3.50. Due acknowledgement must always be made of the use of
any material contained in, or derived from, this thesis.
Signed: Gary Bratt Date: 10/09/2010
Study of Renewable Energy Project Risk Factors Influencing the Insurance Industry ______________________________________________________________________________________________
3
Abstract
Until recently, the uptake of renewable energy technology for electricity
generation has been slow, with most projects being larger scale
developments. The introduction of new governmental policies over the past
20 years has helped encouraged development in this sector. However, only
the recent introduction of Feed-in Tariffs has made the market truly
accessible to large numbers of small-scale producers. Although small-scale,
these new entrants require financial backing to realise their developments
from both capital investment and insurance perspectives, just as the large-
scale developments do. Unfortunately, the financial services industry has
limited experience and understanding of renewable energy projects and their
associated risk factors. This project summarises the technical risk factors
pertaining to the renewable technologies of most interest to new sector
entrants.
By considering the nature of the renewable resource being used by each
technology and examining both the commercially available and prototype
device technology, it is possible to realise the technology specific risk factors,
as well as the more generic technical issues common across technologies
during construction and operational phases of a development.
Once collated, the findings are arranged to form a conceptual model,
summarising the relevant technological risk factors as a basis for insurance
underwriting purposes, with the potential for further actuarial development
leading to a full model and thus improved insurance products.

Study of Renewable Energy Project Risk Factors Influencing the Insurance Industry ______________________________________________________________________________________________
4
Acknowledgments
I would like to thank Dr. Andrew Grant, my academic supervisor for this
project, for his regular supply of encouragement, guidance and humour which
has been instrumental in the timely completion of this project.
My thanks also go to Derek Skinner for organising my placement with Bruce
Stevenson Risk Management Ltd and all of the staff who made me feel
welcome, and part of their team.
Finally, I will be forever indebted to Gill and the support she has provided,
without which this course of study would not have been possible, and family
and friends who have provided me with light relief when required.
Study of Renewable Energy Project Risk Factors Influencing the Insurance Industry ______________________________________________________________________________________________
5
Table of Contents
Chapter 1- Introduction..................................................................................................8 1.1 General..............................................................................................................8 1.2 Implications of the NFFO.................................................................................9 1.3 NFFO Development .......................................................................................10 1.4 Contract Completion Rates.............................................................................11 1.5 Renewables Obligation...................................................................................13 1.6 Feed-In Tariff Scheme (FITs).........................................................................16 1.7 Current Commitments ....................................................................................18 1.8 Structure of the Industry .................................................................................19 1.9 Insuring Renewable Energy Developments ...................................................21
Chapter 2 - Bruce Stevenson Risk Management Ltd...................................................23 Chapter 3 - Wind Power ..............................................................................................25
3.1 Resource.........................................................................................................25 3.1.1 Betz’ Law..................................................................................................28
3.2 Configurations ................................................................................................31 3.3 Risks ...............................................................................................................34
Chapter 4 - Hydro Power .............................................................................................38 4.1 Resource .........................................................................................................38 4.2 Configurations ................................................................................................40 4.3 Risks ...............................................................................................................50
Chapter 5 - Solar Power...............................................................................................53 5.1 Resource .........................................................................................................53 5.2 Configurations ................................................................................................56 5.3 Risks ...............................................................................................................62
Chapter 6 - Biomass Power..........................................................................................64 6.1 Resource .........................................................................................................64 6.2 Configurations ................................................................................................64 6.3 Risks ...............................................................................................................69
Chapter 7 - Wave Power ..............................................................................................71 7.1 Resource .........................................................................................................71 7.2 Configurations ................................................................................................74 7.4 Risks ...............................................................................................................78
Chapter 8 - Tidal Power...............................................................................................81 8.1 Resource .........................................................................................................81 8.2 Configurations ................................................................................................86 8.3 Risks ...............................................................................................................91
Chapter 9 - Generic Issues ...........................................................................................93 Chapter 10 - Risk factors and conceptual modelling ...................................................95
10.1 The need for a model ....................................................................................95 10.2 Profiling ........................................................................................................96 10.3 Proposed conceptual model ..........................................................................96
References....................................................................................................................99 Appendix 1 ................................................................................................................107 Appendix 2.................................................................................................................108 Appendix 3.................................................................................................................109
Study of Renewable Energy Project Risk Factors Influencing the Insurance Industry ______________________________________________________________________________________________
6
List of Figures
Fig. 1.1: Overall completion rates for NFFO contracts in 2003. .........................12 Fig. 1.2: Renewables Obligation Size (% of supplier volumes). ........................13 Fig. 1.3: Renewables Obligation System .............................................................15 Fig. 3.1: Map of annual mean wind speeds in the UK .........................................26 Fig. 3.2: Weibull Distribution ..............................................................................27 Fig. 3.4: Velocity Exceedence Curve to Equivalent Power Curve .......................30 Fig. 3.7: Wind Turbine with both a damaged blade and a missing blade.............35 Fig. 4.1: Pumped Storage Scheme, Ludington, Michigan. ..................................41 Fig. 4.2: Run-of-the-river scheme: The Lower Granite Dam, Washington..........42 Fig. 4.3: Diversion Scheme ..................................................................................42 Fig. 4.4: 3-D render of Francis runner ..................................................................44 Fig. 4.5: Francis runner being inspected...............................................................44 Fig. 4.6: Cutaway of Francis turbine ...................................................................45 Fig. 4.7: Cross-sectional view of Propeller Turbine configuration. .....................45 Fig. 4.8: Cutaway of Kaplan turbine ....................................................................46 Fig. 4.9: Pelton wheels .........................................................................................47 Fig. 4.10: Nozzle arrangement .............................................................................48 Fig. 4.11: Turgo nozzle arrangement ....................................................................48 Fig. 4.12: Turgo runner.........................................................................................48 Fig. 4.13: Crossflow turbine ................................................................................ 49 Fig. 4.14: Path of water flow in Crossflow turbine ..............................................49 Fig. 4.15 Turbine Application Chart ....................................................................50 Fig. 4.16: Francis Turbine showing cavitation damage........................................51 Fig. 5.1: Map of UK Solar Irradiance ..................................................................54 Fig. 5.2: Pyranometer............................................................................................55 Fig. 5.3: Pyrheliometer .........................................................................................55 Fig. 5.4: Flatplate solar panel................................................................................56 Fig. 5.5: Concentrator solar panels .......................................................................57 Fig. 5.6: Solar concentrator device detail .............................................................57 Fig. 5.7: How a photovoltaic cell functions..........................................................59 Fig. 6.1: Wood Chips……………………… ........................................................65 Fig. 6.2: Pellets………………………………….. ...............................................65 Fig. 6.3: Pucks………………………………… ..................................................65 Fig. 6.4: Diesel Sources .......................................................................................67 Fig. 6.5: Anaerobic digestion system for electricity generation ..........................68 Fig. 7.1: Global wave power availablility.............................................................72 Fig. 7.2: Water particle motion in waves .............................................................73 Fig. 7.3: Wavedragon cross-section......................................................................76 Fig. 7.4: Artists impression of Wavedragon .........................................................76 Fig. 7.5: Pelamis P1 ………………………..........................................................76 Fig. 7.6: Illustration of Pelamis movement...........................................................76 Fig. 7.7: Oyster……………………. ....................................................................77 Fig. 7.8: Artists impression of Oyster...................................................................77 Fig. 7.9: Limpet cross-section...............................................................................78 Fig. 7.10: Limpet, Islay…………….....................................................................78 Fig. 8.1: Gravitational influence on tides .............................................................81 Fig. 8.2: UK map of mean spring tidal peak flow. ...............................................83
Study of Renewable Energy Project Risk Factors Influencing the Insurance Industry ______________________________________________________________________________________________
7
Fig. 8.3: Ideal tidal half-cycle ...............................................................................85 Fig. 8.4: Seaflow ...................................................................................................87 Fig. 8.5: Artists impression of Seagen ..................................................................87 Fig. 8.6: Seagen, Strangford Lough ......................................................................87 Fig. 8.7: Lunar Energy Rotech Tidal Turbine.......................................................88 Fig. 8.8: Open Centre Turbine, pile mounted .......................................................89 Fig. 8.9: Artists impression of gravity base mounted Open Centre Turbine ........89 Fig. 8.10: TidEL contra rotating tidal turbine .......................................................90 Fig. 8.11: ESRU contra rotating turbine ...............................................................90 Fig. 8.12: Artists impression of Stingray, an oscillating hydrofoil device ...........91 Fig. 10.1: Proposed Conceptual Model.................................................................97
List of Tables
Table 1.1: ROC Buyout Price by Year.…………………………………………14
Table 5.1: Summary of PV materials …………………………………………...61
Study of Renewable Energy Project Risk Factors Influencing the Insurance Industry ______________________________________________________________________________________________
8
Chapter 1- Introduction
1.1 General
The renewable energy industry in the UK is entering a phase of rapid
expansion over the next decade in order to reduce the volume of fossil fuels
used for generating electricity, and their associated carbon dioxide gas
emissions, to achieve pollution reduction targets defined by governmental
policy. Although appreciable growth has taken place over the past twenty
years, it pales into insignificance compared to the level of activity required
over the next ten year period. Of course the financial motivation for industry
to develop projects has often been inadequate in past years, and there has not
been the necessary policy structure in place to encourage participation.
Since 1990, there has been a delivery program for electricity generation from
renewable sources in the UK. This began with the renewable Non-Fossil Fuel
Obligation (NFFO) which was followed by the Renewables Obligation (RO)
in 2002, and more recently, in 2010, the Feed-in Tariff scheme.
The original intention of the NFFO, however, was not directly to support
energy generation from renewable sources, but rather to provide a subsidy to
the nuclear generation industry, after it became obvious that privatisation
presented too many difficulties. Before providing support to nuclear power,
the Government was required to seek permission from the European
Commission where they formally requested ‘non-fossil fuel’ support. To pay
for the NFFO, the Electricity Act of 1990 allowed a levy on fossil fuels to be
raised and the definition of non-fossil fuels technologies included renewable
energy technologies.
It is therefore apparent that the initial support mechanism for renewable
energy in the UK was in effect a by-product of another policy demand; one
that had deep-rooted implications which served to polarise opinion on
whether a specific mechanism to support renewables is as effective as a
general mechanism for achieving carbon reductions. It could also be argued
that the inclusion of renewables into the NFFO actually prevented the
Study of Renewable Energy Project Risk Factors Influencing the Insurance Industry ______________________________________________________________________________________________
9
implementation of a feed-in tariff mechanism, such as those becoming
commonplace across continental Europe at that time and only now being
introduced in the UK.
The European Commission sanctioned the adoption of the NFFO to support
nuclear power for only an eight year period running between 1990 and 1998.
No initial capacity target for generation from renewables was set, but at the
announcement of the NFFO first round (NFFO-1) contracts, a target of 600
MW declared net capacity (DNC) was finally revealed. Of the NFFO-1
contracted capacity, around two-thirds was with existing renewable energy
power plants, which were either already generating or had previously sought
government support. This meant that payments per kWh for NFFO-1
contracts were arranged in advance of the generator’s contract bid, so there
was little in the way of competition. This was followed by NFFO round 2
(NFFO-2) which targeted 1000 MW DNC, and was different in that the
contracts were now for ‘new’ capacity and therefore gave rise to a degree of
competition.[1]
1.2 Implications of the NFFO
The opportunities presented by having renewables integrated into the NFFO
have had quite serious and ongoing implications. As the revenue period for a
project started with the point of plant commissioning and ran until the end of
1998, there was a huge incentive to maximise the use of the best sites and to
do so as quickly as possible. As all contracts for a particular round were
awarded on the same day, projects were therefore running in parallel to one
another and to similar timescales. It became particularly evident with wind
projects that planning permission was being applied for at approximately the
same time by a number of developers, and the construction of wind farms was
also taking place on similar sites simultaneously.
This apparent ‘wind rush’ generated much concern amongst the public and
saw a number of campaigns against wind farms being organised during this

Study of Renewable Energy Project Risk Factors Influencing the Insurance Industry ______________________________________________________________________________________________
10
period. There was little understanding in the public arena that imminently
approaching funding deadlines were driving the pace of wind farm
development at an accelerated rate, which would be unlikely to be sustained
at the same pace. The development activity led to an enduring anti-wind
feeling, which has served to delay the progress of further onshore wind
developments. The creation of this anxiety can be directly attributed to the
renewable NFFO contract end in 1998, which in turn is due to its close
association with the nuclear NFFO, the original intention of which was to
support the nuclear industry rather than the renewables industry. This
opportunistic use of another policy unintended for renewables use has
therefore compounded many of the issues experienced by the industry in its
early development.
1.3 NFFO Development
Further to this, with some technologies it was just not economically viable to
complete development and bring projects to fruition, given the time
restriction imposed by NFFO-1 and -2. In considering waste-to-energy power
plant contracts under NFFO-2, it was found that the time taken to be granted
planning permission was so great, that there was too little time left to generate
revenue and achieve an economic return before the contract would end. In
effect the complexity and content of the planning permissions for a project
was so time and labour intensive that it acted to prohibit entry at that time. As
the situation was clearly becoming unworkable for future rounds, the
Government requested the European Commission to extend the NFFO
contracts for renewable energy only.
The rules pertaining to the subsequent rounds, NFFO-3 through NFFO-5,
were also amended to include a five year grace period after a contract was
awarded. This provided adequate time to obtain planning permission and
enable a reasonable economic return via an index linked premium payment
for the following 15 years. Other changes included introducing a band split
for wind energy to distinguish between smaller and larger developments, with
Study of Renewable Energy Project Risk Factors Influencing the Insurance Industry ______________________________________________________________________________________________
11
the aim of enabling community projects and having a new technology band
dedicated to energy crops.
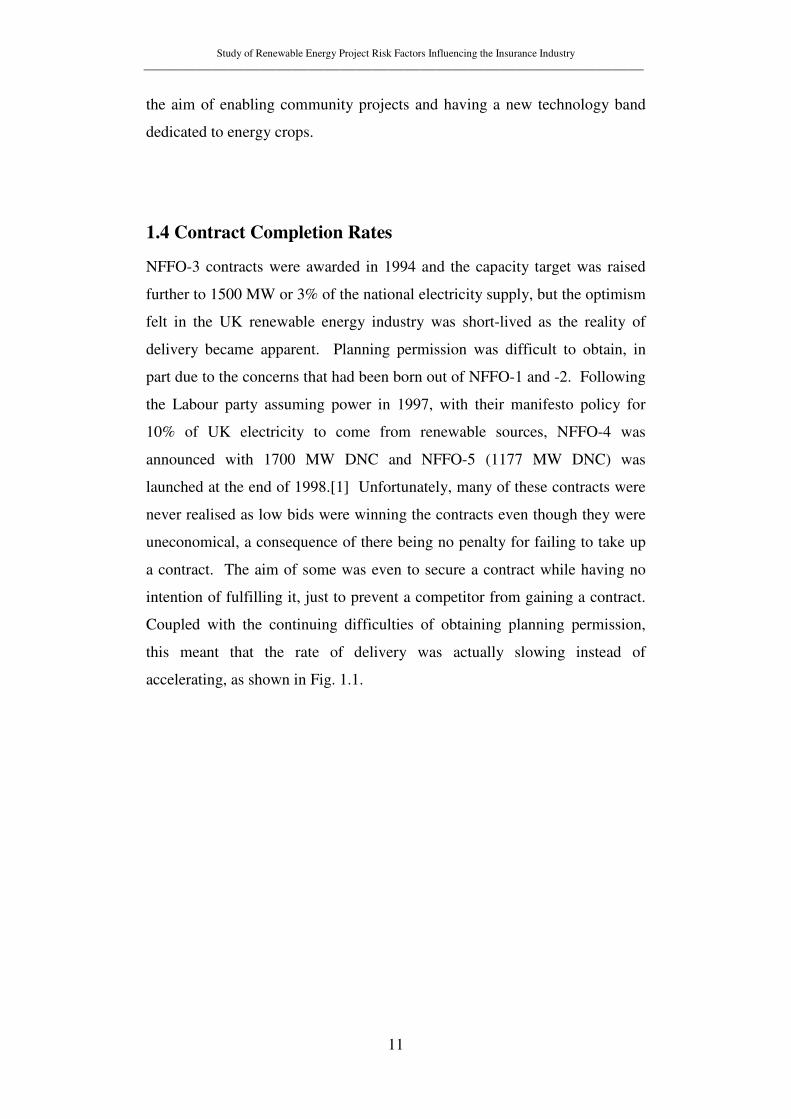
1.4 Contract Completion Rates
NFFO-3 contracts were awarded in 1994 and the capacity target was raised
further to 1500 MW or 3% of the national electricity supply, but the optimism
felt in the UK renewable energy industry was short-lived as the reality of
delivery became apparent. Planning permission was difficult to obtain, in
part due to the concerns that had been born out of NFFO-1 and -2. Following
the Labour party assuming power in 1997, with their manifesto policy for
10% of UK electricity to come from renewable sources, NFFO-4 was
announced with 1700 MW DNC and NFFO-5 (1177 MW DNC) was
launched at the end of 1998.[1] Unfortunately, many of these contracts were
never realised as low bids were winning the contracts even though they were
uneconomical, a consequence of there being no penalty for failing to take up
a contract. The aim of some was even to secure a contract while having no
intention of fulfilling it, just to prevent a competitor from gaining a contract.
Coupled with the continuing difficulties of obtaining planning permission,
this meant that the rate of delivery was actually slowing instead of
accelerating, as shown in Fig. 1.1.
Study of Renewable Energy Project Risk Factors Influencing the Insurance Industry ______________________________________________________________________________________________
12
Fig. 1.1: Overall completion rates for NFFO contracts in 2003. (Source: [2])
The failure of the renewable NFFO to deliver acceptable completion rates
highlighted that with the advent of a new, replacement mechanism for NFFO,
a different approach to contract tender, bidding and fulfilment would need to
be adopted.
Also contributing to the design of the new mechanism was the Kyoto
Protocol, drawn up in December 1997 and scheduled to become active in
2005. This protocol was an output of the United Nations Framework
Convention on Climate Change with the aim of tackling global warming
through a reduction in green house gas emissions. Although eventually, 187
member states signed up to this agreement, the exact terms and conditions of
many nations’ participation varied considerably as did their self-imposed
emission reduction targets. The UK was one of a group of 34 nations who
agreed to target an average reduction of 5.2% on 1990 levels of green house
gas emissions, more specifically carbon dioxide, methane, nitrous oxide,
sulphur hexafluoride, hydrofluorocarbons, and perfluorocarbons, by 2012.
This translated to a national commitment by the UK to reduce green house
gas emissions by 8% from their 1990 levels by 2012.[3] The prime means of
achieving this commitment was intended to come from increasing the
proportion of electricity generation from renewables and therefore the Kyoto
Study of Renewable Energy Project Risk Factors Influencing the Insurance Industry ______________________________________________________________________________________________
13
target had to be incorporated into the mechanism succeeding the renewable
NFFO.
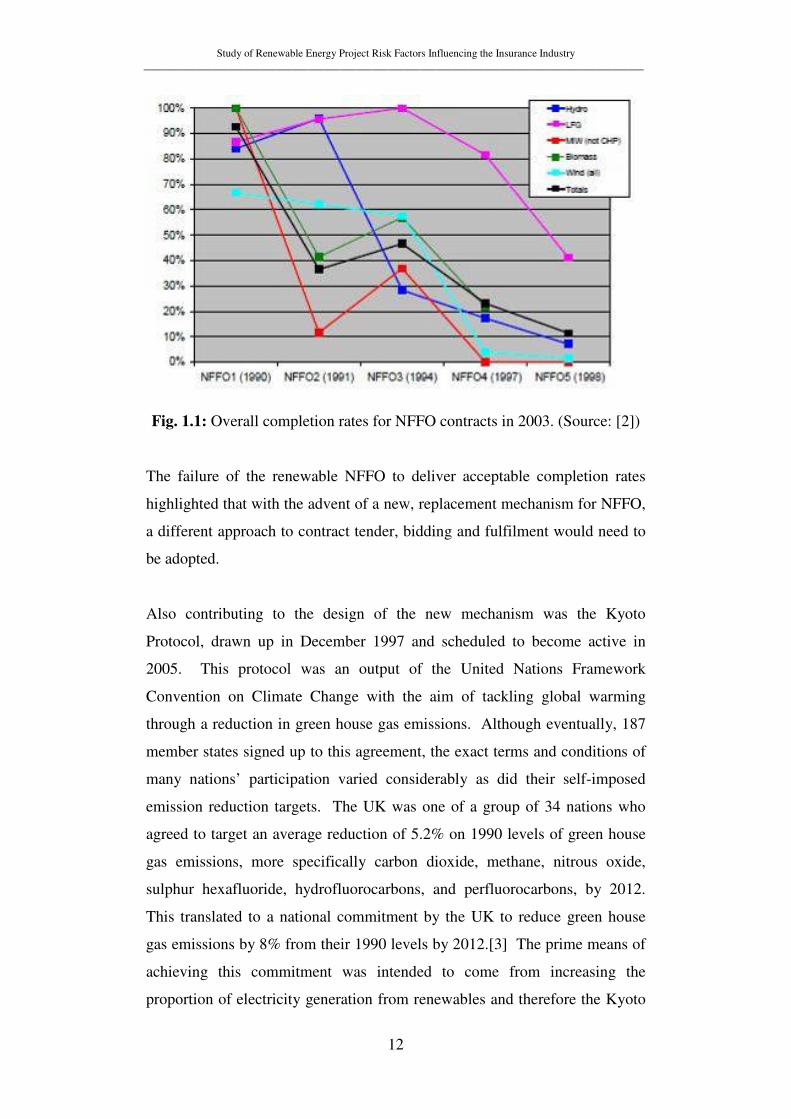
1.5 Renewables Obligation
The mechanism chosen to replace the renewable NFFO started in April 2002
and was called the Renewables Obligation (RO), which is still active today.
It originally set out to achieve 10% of the UK electricity supply from
renewable sources by 2010 but was updated in 2003 extending this to target
15% by the year 2015-2016.[1] Year on year targets are illustrated in Fig.
1.2. Originally scheduled to last until 2027, it was extended in 2010 until
2037. Additional policy introductions (e.g. Feed-in Tariffs) have seen further
government targets set at 20% by 2020 and a longer term goal of between
30% and 40% by 2050 in order to achieve a targeted total carbon dioxide
reduction of 60% in the same year.[4]
Fig. 1.2: Renewables Obligation Size (% of supplier volumes). (Source: [5])
The basis of support under the RO is achieved by requiring electricity
suppliers to purchase a predefined and annually increasing proportion of their
electricity from renewables. The suppliers must prove to the energy regulator
Ofgem that they have delivered on their obligation by providing the required
number of Renewable Obligation Certificates (ROCs) each year, where each
ROC is equal to 1 MWh of electricity generated from renewable sources.
Study of Renewable Energy Project Risk Factors Influencing the Insurance Industry ______________________________________________________________________________________________
14
ROCs are issued to the generator by Ofgem and can be either purchased from
the generator or bought in a trading market.
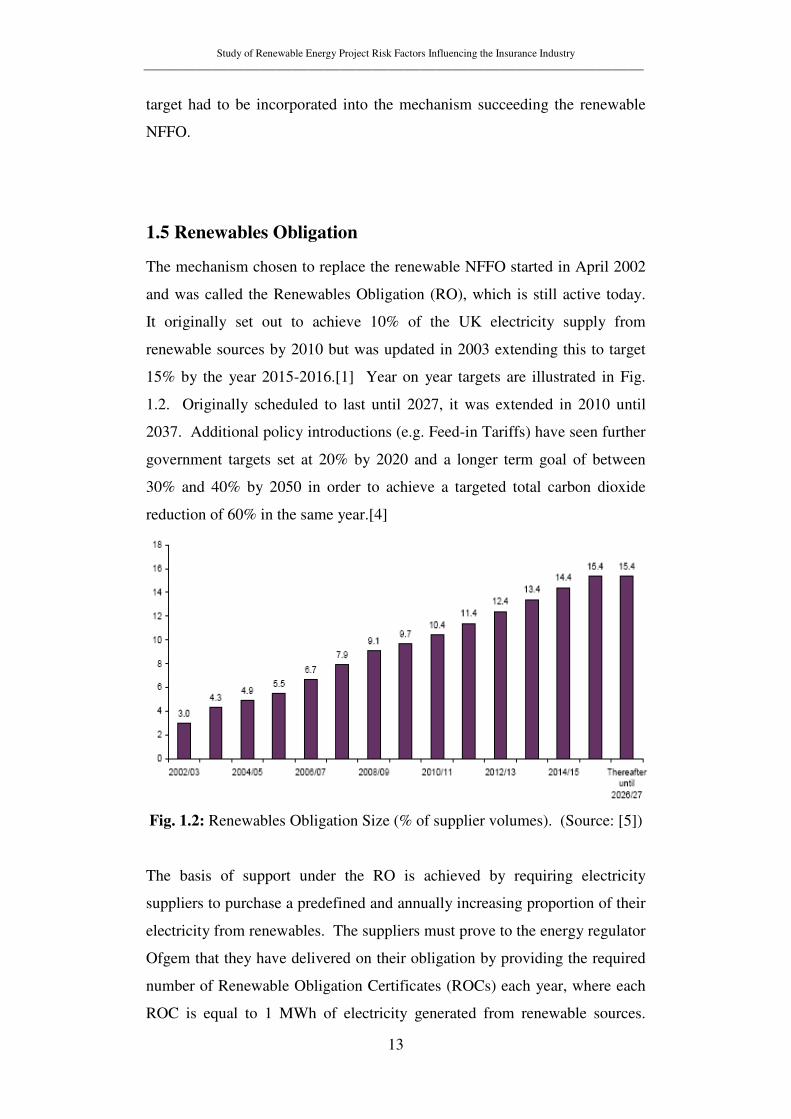
However, the supplier can also ‘buy-out’ of its obligation by paying a fixed
rate per kWh of renewable electricity they should have delivered to meet their
obligation. The buy-out price was originally set at £30/MWh and annually
increases in line with inflation with the buy-out prices to date, shown in
Table 1.1. [11]
Obligation Period Buy-out Price
(£/MWh)
1st April 2002 to 31st March 2003 30.00
1st April 2003 to 31st March 2004 30.51
1st April 2004 to 31st March 2005 31.39
1st April 2005 to 31st March 2006 32.33
1st April 2006 to 31st March 2007 33.24
1st April 2007 to 31st March 2008 34.30
1st April 2008 to 31st March 2009 35.76
1st April 2009 to 31st March 2010 37.19
1st April 2010 to 31st March 2011 36.99
Table 1.1: ROC Buyout Price by Year. (Source: [6], [7], [8], [9], [10])
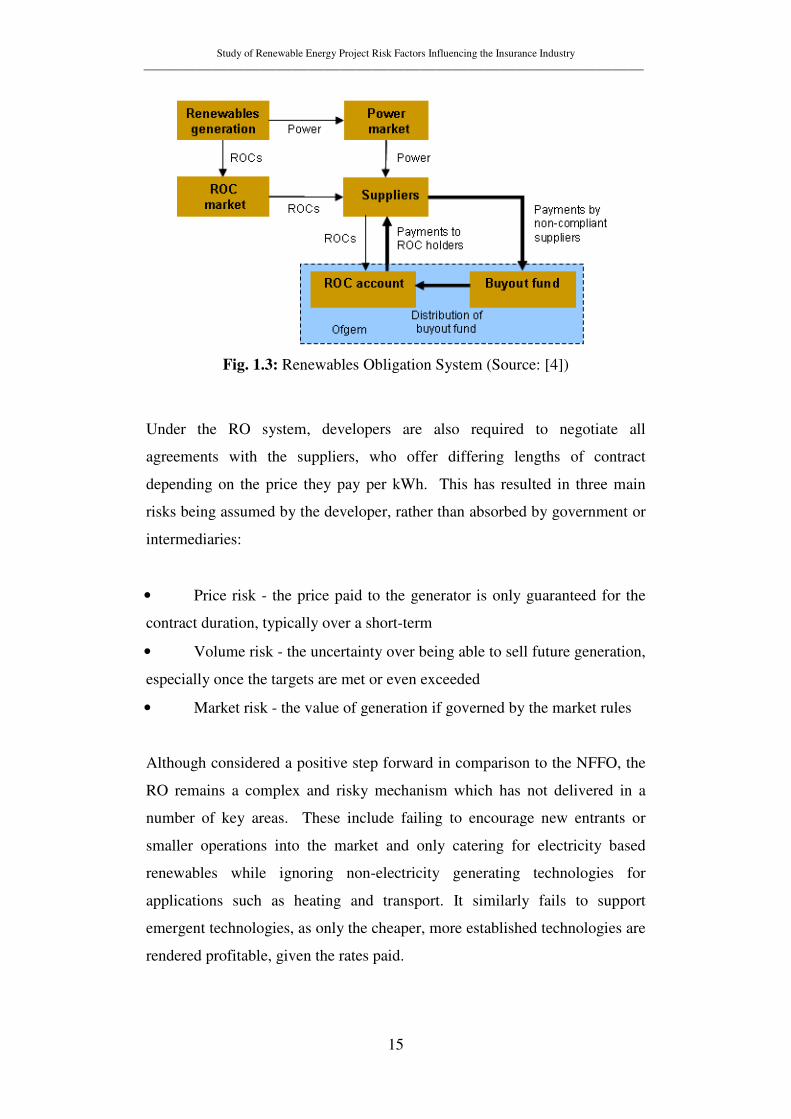
This buy-out revenue is returned back to the participating suppliers when they
submit their ROCs – if a supplier was to submit 10% of the total submitted
ROCs, they would then receive 10% of the ‘buy-out’ fund. A summary of the
RO mechanism is shown in Fig.1.3 below:
Study of Renewable Energy Project Risk Factors Influencing the Insurance Industry ______________________________________________________________________________________________
15
Fig. 1.3: Renewables Obligation System (Source: [4])
Under the RO system, developers are also required to negotiate all
agreements with the suppliers, who offer differing lengths of contract
depending on the price they pay per kWh. This has resulted in three main
risks being assumed by the developer, rather than absorbed by government or
intermediaries:
• Price risk - the price paid to the generator is only guaranteed for the
contract duration, typically over a short-term
• Volume risk - the uncertainty over being able to sell future generation,
especially once the targets are met or even exceeded
• Market risk - the value of generation if governed by the market rules
Although considered a positive step forward in comparison to the NFFO, the
RO remains a complex and risky mechanism which has not delivered in a
number of key areas. These include failing to encourage new entrants or
smaller operations into the market and only catering for electricity based
renewables while ignoring non-electricity generating technologies for
applications such as heating and transport. It similarly fails to support
emergent technologies, as only the cheaper, more established technologies are
rendered profitable, given the rates paid.
Study of Renewable Energy Project Risk Factors Influencing the Insurance Industry ______________________________________________________________________________________________
16
1.6 Feed-In Tariff Scheme (FITs)
In an attempt to rectify these perceived failings, the Feed-in Tariff scheme
(FITs) was introduced in April 2010, not as a full replacement for the RO but
as a complementary mechanism specifically targeting the small scale market,
defined as being less than 5 MW of installed capacity. Below 5 MW, a new
development qualifies for FITs support instead of the RO, while at capacities
greater than 5 MW the RO continues to operate as before. Two elements of
payment are made to generators under FITs and these are paid for by licensed
electricity suppliers. Only the largest suppliers (those which supply over
50,000 domestic customers) are obliged to offer FITs while smaller suppliers
may opt to participate or not, as they deem appropriate.
The first element is paid per kWh of electricity generated, metered by the
generator, and is known as the generation tariff. It is determined by
technology type with each technology sub-divided into bands defined by the
scale of installed capacity, with higher tariff rates for smaller capacities and
reducing rates as capacity approaches 5 MW. This is an attempt to enable an
almost seamless tariff transition when moving from the FITs to the RO
regime, preventing instances of development downsizing to gain a
preferential tariff rate. The generation tariff is paid regardless of whether the
generated electricity is exported to the local electricity network or consumed
on site. The duration of the payment is determined by the technology type
although typically this is either 20 years or 25 years (a full table of generation
tariffs planned up to 2020 can be found in appendix 1).
The export tariff is the second payment element, applicable only to the
generated electricity that is exported onto the local electricity network.
Again, the generator can meter this with a fixed amount paid per kWh
exported, but in the case of very small-scale generation, a proportion of the
total generation can be assumed to be exported in a given period without the
need for additional metering.
Study of Renewable Energy Project Risk Factors Influencing the Insurance Industry ______________________________________________________________________________________________
17
This two-tariff approach rewards both on and off grid generation while
allowing for a combination of the two. The export tariff rate at the
introduction of the scheme was 3p per kWh with future values linked to
inflation, although generators have the possibility to opt out of the export
tariff altogether to sell their electricity on the open market.[11]
On the surface it appears that the inception of the complimentary FITs does
address the main issues experienced with the RO system alone, for those who
were most affected by them – the smaller generators. Much of the price risk
associated with short-term contracts is eliminated, since tariffs are guaranteed
for 20 or 25 years, depending on the technology used. Similarly, the volume
risk is only evident at the end of the guaranteed tariff period as only then will
a contract need to be re-negotiated with the supplier. Finally, since the tariff
values are defined for the whole of the tariff duration, all uncertainties
regarding market fluctuations in the value of generation are negated until the
end of the guaranteed tariff period is reached. One criticism which can be
raised is that because the generation tariff rates step between scale bandings,
it could encourage developers to downsize generating capacity from the lower
end of one band to the higher end of the band below in order to achieve a
larger tariff rate. Summed over a number of projects, this lost capacity could
prove to be significant and only makes achievement of the government set
targets for energy proportion achieved by renewable means more difficult.
Although it remains to be seen whether FITs are ultimately successful at
bringing in new entrants while also adding a valuable contribution to the
overall renewable electricity generating capacity, it is apparent that it
represents a significant simplification when compared to the RO alone. It
provides greater financial support and income security, making small-scale
renewable generation much more attractive to those who previously would
not have considered it a worthwhile enterprise. There is also hope that by
encouraging the smallest scales of generation at a domestic level, it will
engender the societal behavioural changes necessary for tackling climate
change, as awareness of the value of electricity is realised and it is used with
more responsibility and efficiency.
Study of Renewable Energy Project Risk Factors Influencing the Insurance Industry ______________________________________________________________________________________________
18
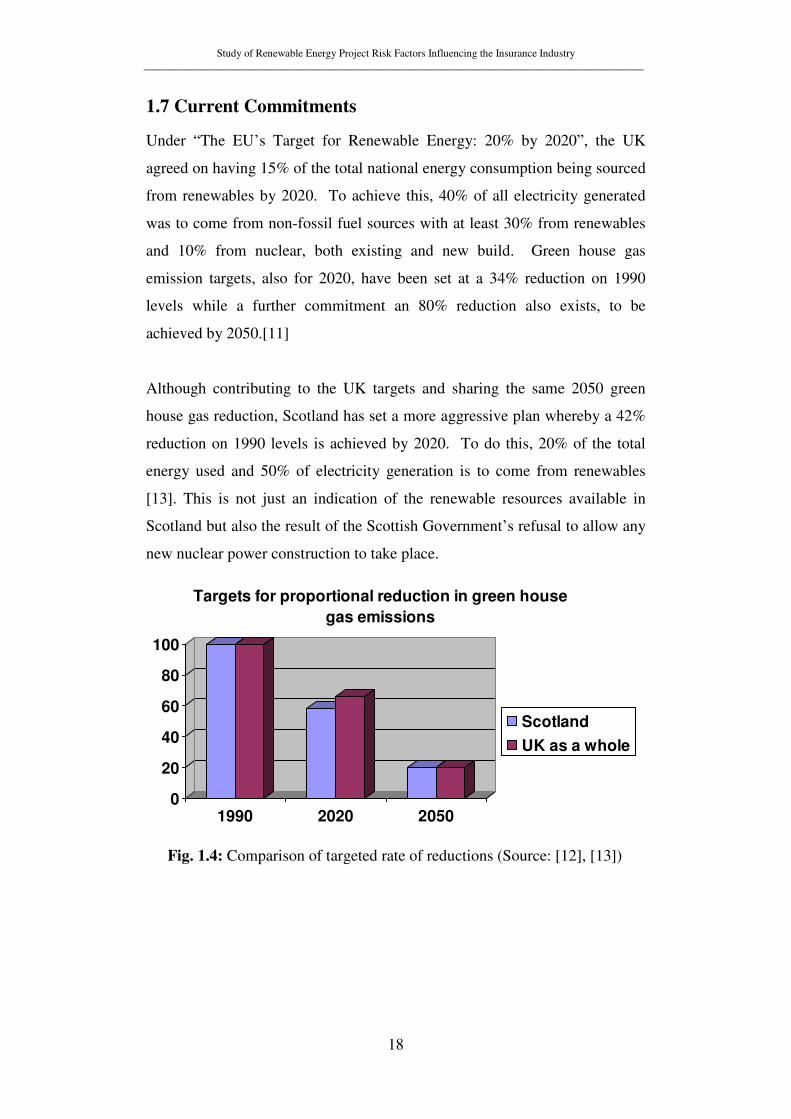
1.7 Current Commitments
Under “The EU’s Target for Renewable Energy: 20% by 2020”, the UK
agreed on having 15% of the total national energy consumption being sourced
from renewables by 2020. To achieve this, 40% of all electricity generated
was to come from non-fossil fuel sources with at least 30% from renewables
and 10% from nuclear, both existing and new build. Green house gas
emission targets, also for 2020, have been set at a 34% reduction on 1990
levels while a further commitment an 80% reduction also exists, to be
achieved by 2050.[11]
Although contributing to the UK targets and sharing the same 2050 green
house gas reduction, Scotland has set a more aggressive plan whereby a 42%
reduction on 1990 levels is achieved by 2020. To do this, 20% of the total
energy used and 50% of electricity generation is to come from renewables
[13]. This is not just an indication of the renewable resources available in
Scotland but also the result of the Scottish Government’s refusal to allow any
new nuclear power construction to take place.
0
20
40
60
80
100
1990 2020 2050
Targets for proportional reduction in green house
gas emissions
Scotland
UK as a whole
Fig. 1.4: Comparison of targeted rate of reductions (Source: [12], [13])
Study of Renewable Energy Project Risk Factors Influencing the Insurance Industry ______________________________________________________________________________________________
19
1.8 Structure of the Industry
The structure of the renewable energy industry in the UK has evolved as the
industry has grown and will likely continue to do so as this period of
anticipated accelerated growth continues. There are a vast number of
businesses involved with all aspects and scales of renewable energy but it is
the “key players” who determine the evolution of the industry within the
constraints of governmental policy.
Probably the most influential and diverse of these key players are the
electricity suppliers, whose primary involvement is to provide connection for
all scales of generator to the national grid. The reality of accomplishing this
is complex as the aging distribution network in this country struggles to cope
with accepting local generation, often of an intermittent nature, onto a system
originally designed purely for supply purposes. With many renewable
resources being extracted from areas remote to the population centres, there is
also a requirement for extensive expansion to the national grid infrastructure
to allow renewable energy developments to become viable. In addition to
providing electricity connections, many suppliers also operate their own
generation sites which to date have tended to be larger scale onshore wind
farms.
Developers constitute the next important group in the industry, and range
from large entities working on projects around the globe, to small, one-man
enterprises, for example a landowner whose aim is to develop a site on their
property before becoming the operator and generator. The developer will
identify the site for a project, design and develop the project, take it through
planning and financing, engineering and construction before finally into
operation.
The most visible of the key players are the manufacturers whose products are
designed, developed and manufactured for the purpose of operating
efficiently and reliably at a given site thereby offering a good return on
investment. Much emphasis is being placed on the development of

Study of Renewable Energy Project Risk Factors Influencing the Insurance Industry ______________________________________________________________________________________________
20
manufacturing technologies and capability within the UK to supply “home-
grown” solutions for renewable systems but this is proving challenging as
there are much more established European manufacturers, with market
leading technology, already competing for their share of the UK market.
Economic development agencies are targeting every level of the supply chain
in renewables for support in attempt both to boost the economy and ensure
attainment of the targets from the Kyoto Protocol.
Banks are an essential element in the market, financing projects (at least large
projects) when they consider the risk of their investment and rate of return to
be acceptable. Smaller projects have found more difficulty in gaining finance
from banks, mainly due to the insecurity of income streams in the past.
Cooperative Bank have thus far been leaders in this market, but with the
advent of FITs, more banks are beginning to take notice of the reduced risk to
smaller projects, and an increase in financial offerings could ensue.
Gaining finance requires insurance to secure any investment a bank may
make. Insurance providers, similar in nature to the banks, have been hesitant
about becoming involved in this relatively new industry with unknown risks,
again this trend being particularly noticeable with smaller projects. However,
demand for insurance is increasing as the number of projects increases.
Insurance can cover construction phases (construction, transportation, project
interruption, public liability) as well as operation (liability, loss of earnings).
Of those insurance providers active in the market, most decline to advertise
openly the types and levels of insurance available for renewable specific
projects, requiring the increasing use of Insurance Brokers in this industry, to
create the vital links between those requiring the insurance and those
providing it.
Study of Renewable Energy Project Risk Factors Influencing the Insurance Industry ______________________________________________________________________________________________
21
1.9 Insuring Renewable Energy Developments
Due to the relatively young nature of renewable energy as a viable enterprise
for electricity generation, sale and ultimately profit realisation, developers still
face challenges in securing insurance and financial backing for projects.
Financial markets continue to face difficulties in providing risk management
instruments for new renewable technologies.[14] Little historical actuarial
data on risk factors, and severity and frequency of occurrence of key risks is
available to enable accurate assessment.
In their thematic background paper for the International Conference for
Renewable Energies held in Bonn in 2004, Sonntag-O’Brien and Usher [15]
consider the issues surrounding mobilising finance for renewable energy
projects. Among their conclusions, they note that more should be done to
“change underwriting risk perceptions to increase the availability of risk
transfer products” and “develop appropriate new underwriting rating
methodologies”.
The paper also cites that “underwriters have limited understanding of RE
projects and associated risks and have difficulty aligning strategies for dealing
with them” as one of the key barriers to the development of risk management
instruments.
The development of a conceptual model considering each of the relevant
technological risk factors associated with the types of development would
form a basis for actuarial extrapolation and data collection. Increasing the
knowledge and understanding of those operating as insurance underwriters
and in insurance brokering would begin to address the challenges faced by
developers in securing insurance and thereby finance, enabling the industry to
grow. This model can subsequently be developed by actuaries to include
statistical likelihood and generate assessment of suitable premiums. As this is
used more frequently and becomes a more robust model, the availability of
insurance products and packages should increase. More information on the

Study of Renewable Energy Project Risk Factors Influencing the Insurance Industry ______________________________________________________________________________________________
22
performance of new renewable energy technologies will also ultimately
reduce the costs of insurance.
As part of the research undertaken for this thesis, I undertook a placement
with Bruce Stevenson Risk Management Ltd, an insurance broker and risk
management company, involved with the arrangement of insurance cover for
small and medium scale projects (those covered by FITs and smaller scale
RO).

Study of Renewable Energy Project Risk Factors Influencing the Insurance Industry ______________________________________________________________________________________________
23
Chapter 2 - Bruce Stevenson Risk Management Ltd.
Since the company was established in 1981, Bruce Stevenson has grown to
become one of the leading insurance brokers within the UK insurance and
financial services market, providing bespoke insurance solutions to private
and business customers. Based in Scotland, with offices in both Edinburgh
and Glasgow, Bruce Stevenson is an owner-managed entity and remains a
wholly independent insurance broker in order to provide the best possible
service to the client.
The services offered by Bruce Stevenson cover areas such as property,
commercial & business, private client, financial services and recently a team
dedicated to renewable energy. The creation of this team came from an early
recognition of the levels of growth required in the renewable energy industry,
to achieve governmental targets for electricity generation from renewables
and green house gas emission reductions. To achieve this growth, new
commercial developments of all scales are required. In fact, the introduction
of Feed-in Tariffs in April 2010 is encouraging higher numbers of small-scale
generators to enter the market, many of whom need customised insurance
solutions.
The current business strategy targets small-to-medium scale commercial
projects, which represent the majority of new entrants to the sector, but
avoids large scale developments as they often involve lengthy and expensive
tendering processes. As such, this influences some of the renewable
technologies Bruce Stevenson finds itself involved with. For example,
onshore wind is developed at all scales and accounts for a large proportion of
Bruce Stevenson’s client portfolio, but the development of offshore wind
currently lies exclusively in the realms of large scale, both in terms of turbine
and array size, in order to benefit from economies of scale, and so for now is
out with the current strategic scope of Brice Stevenson.

Study of Renewable Energy Project Risk Factors Influencing the Insurance Industry ______________________________________________________________________________________________
24
Other established technologies which fit the strategic footprint of this small-
to-medium scale model, are hydro and anaerobic digestion. As much of the
UK’s larger hydro resources have already been developed, most new
proposals fall into the small scale, below 5MW, category. Likewise, a typical
anaerobic digestion plant designed to fit into a farm location is liable to be
classified as small scale.
It is also important to Bruce Stevenson to have an involvement with the
“younger”, less well developed technologies, so they have an understanding
and experience of them when commercially viable products finally see
deployment. Typical examples would include wave and tidal devices and
solar photovoltaics (although already seen in continental Europe, there are
currently no commercial solar PV installations in the UK).
The aim of my placement with Bruce Stevenson was to deliver a series of
training sessions specifically for the members of their Renewable Energy
team to expand their knowledge of the range of renewable devices available,
their function/ failures/ limitations, the conditions necessary for them to work
well and the likelihood of the performance expectations cited in project
proposals being achieved. To facilitate this I investigated a number of
different technologies currently available commercially together with
prototype technologies undergoing development and was involved in client
discussions for active projects.
Study of Renewable Energy Project Risk Factors Influencing the Insurance Industry ______________________________________________________________________________________________
25
Chapter 3 - Wind Power
3.1 Resource
Wind is the result of the heating and cooling of the Earth’s surface and
atmosphere, leading to convection currents in the air. These currents are
present in the volume between the surface of the Earth and the stratosphere,
but only a relatively small proportion of the total wind resource is accessible
from just above the Earth’s surface, due to both technical and economic
reasons.
The UK possesses the largest wind energy resource in Europe with it
estimated that more than 1000TWh of electrical energy could theoretically be
extracted from the wind each year, equivalent to approximately 3 times the
national annual consumption. In practical terms though, the real available
resource from utilising only the more economic sites and observing protected
areas is closer to 50TWh/year of electrical energy, or about one sixth of the
national annual demand.[16]
The reason for the availability of this vast resource in the UK comes from its
location on the edge of the North Atlantic Ocean and its proximity to the Gulf
Stream. Combine that with the long, exposed coastal areas and low mountain
ranges of the UK landmass and an ideal environment for extracting power
from the wind is created. Generally speaking, wind speed increases with
height above the ground and wind speeds at 50m above ground level are
around 75% faster than those at average head height. Good commercial sites
will have annual mean wind speeds of about 7m/s at 45m above the ground,
therefore it is sites with this level of resource which developers are keen to
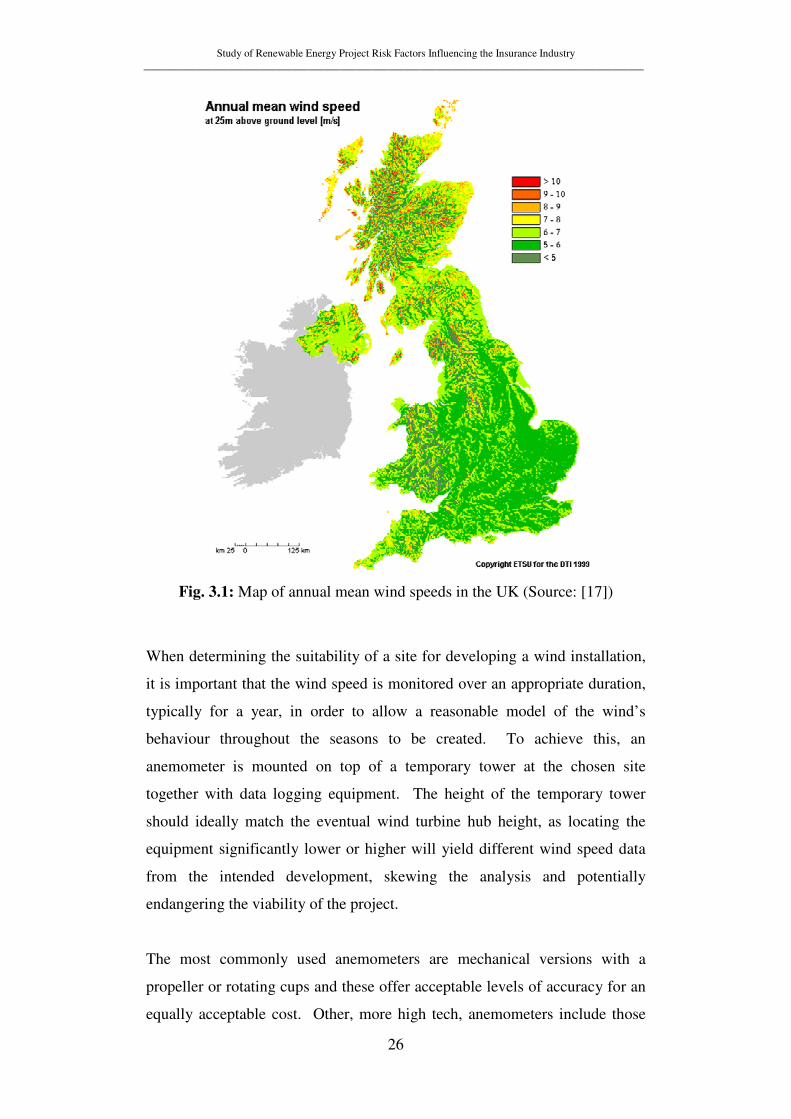
exploit.[16] A wind map of the UK is shown below in fig. 3.1:
Study of Renewable Energy Project Risk Factors Influencing the Insurance Industry ______________________________________________________________________________________________
26
Fig. 3.1: Map of annual mean wind speeds in the UK (Source: [17])
When determining the suitability of a site for developing a wind installation,
it is important that the wind speed is monitored over an appropriate duration,
typically for a year, in order to allow a reasonable model of the wind’s
behaviour throughout the seasons to be created. To achieve this, an
anemometer is mounted on top of a temporary tower at the chosen site
together with data logging equipment. The height of the temporary tower
should ideally match the eventual wind turbine hub height, as locating the
equipment significantly lower or higher will yield different wind speed data
from the intended development, skewing the analysis and potentially
endangering the viability of the project.
The most commonly used anemometers are mechanical versions with a
propeller or rotating cups and these offer acceptable levels of accuracy for an
equally acceptable cost. Other, more high tech, anemometers include those
Study of Renewable Energy Project Risk Factors Influencing the Insurance Industry ______________________________________________________________________________________________
27
employing ultrasonic, laser interferometry and Doppler laser techniques.
Although these can deliver high levels of accuracy and precision, this
significantly exceeds the genuine requirement needed for characterising a
proposed wind development, so the complexity and cost render them an
unlikely and in fact less suitable choice.
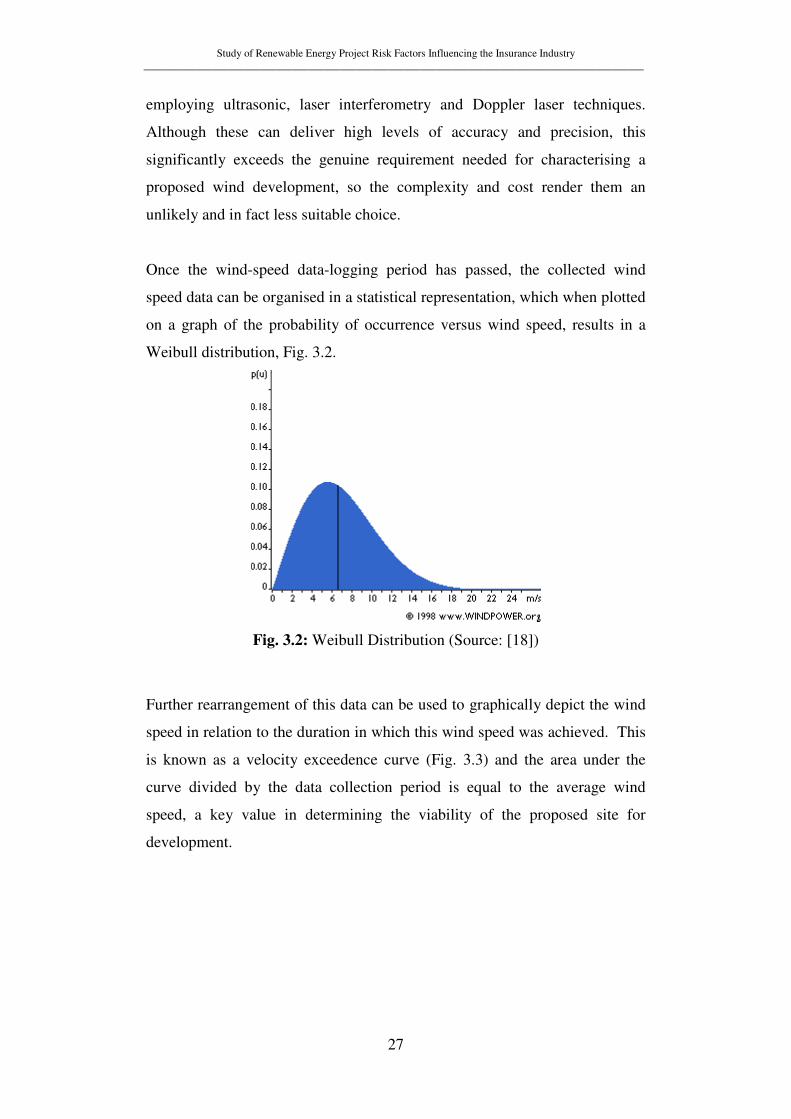
Once the wind-speed data-logging period has passed, the collected wind
speed data can be organised in a statistical representation, which when plotted
on a graph of the probability of occurrence versus wind speed, results in a
Weibull distribution, Fig. 3.2.
Fig. 3.2: Weibull Distribution (Source: [18])
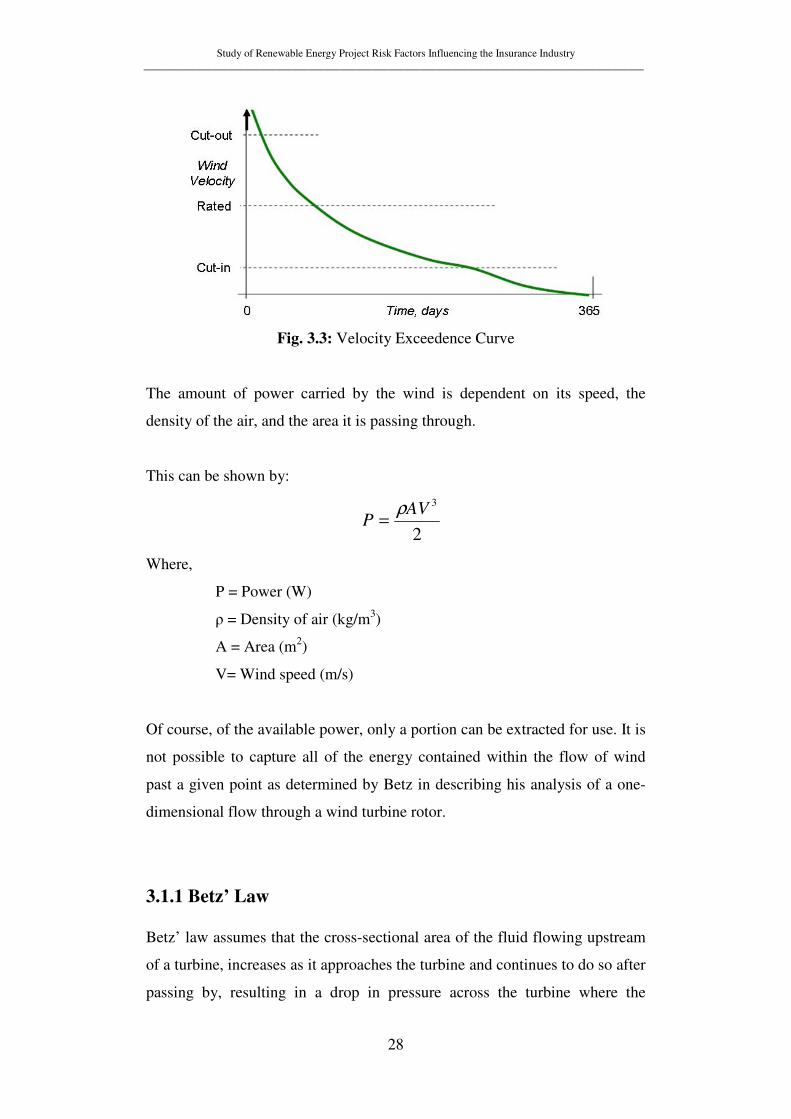
Further rearrangement of this data can be used to graphically depict the wind
speed in relation to the duration in which this wind speed was achieved. This
is known as a velocity exceedence curve (Fig. 3.3) and the area under the
curve divided by the data collection period is equal to the average wind
speed, a key value in determining the viability of the proposed site for
development.
Study of Renewable Energy Project Risk Factors Influencing the Insurance Industry ______________________________________________________________________________________________
28
Fig. 3.3: Velocity Exceedence Curve
The amount of power carried by the wind is dependent on its speed, the
density of the air, and the area it is passing through.
This can be shown by:
2
3AV
Pρ
=
Where,
P = Power (W)
ρ = Density of air (kg/m3)
A = Area (m2)
V= Wind speed (m/s)
Of course, of the available power, only a portion can be extracted for use. It is
not possible to capture all of the energy contained within the flow of wind
past a given point as determined by Betz in describing his analysis of a one-
dimensional flow through a wind turbine rotor.
3.1.1 Betz’ Law
Betz’ law assumes that the cross-sectional area of the fluid flowing upstream
of a turbine, increases as it approaches the turbine and continues to do so after
passing by, resulting in a drop in pressure across the turbine where the
Study of Renewable Energy Project Risk Factors Influencing the Insurance Industry ______________________________________________________________________________________________
29
extraction of energy from the flow has taken place. Corresponding to this
pressure change, both the flow speed and the linear momentum decrease as is
dictated by the conservation of energy and momentum. Consequently, Betz’
law states that a maximum of 59.3% of the total available energy in a fluid
flow can be extracted.
The power coefficient (Cp), or efficiency, of a wind turbine is the ratio of the
maximum power obtained from the wind, to the total power available in the
wind. A Cp factor of 0.593 is therefore the maximum theoretical efficiency of
a wind turbine and it is known as the Betz coefficient. As yet, no wind
turbine has achieved this level of efficiency and is not likely to, due in part to
the simplistic nature of the Betz analysis, which fails to account for all the
rotor losses or drive train and generator inefficiencies.
The amount of power extracted from the wind by a given turbine can
therefore be written as:
2
3AVCP P ρ
=
As wind speed is variable over time, it follows that the power extracted from
the wind is also variable. Add to this the fact that wind turbines only operate
within a certain range of wind speeds as defined by the cut-in and cut-out
wind speeds. Below the cut-in wind speed a wind turbine will not turn, as
there is not enough power in the wind to create the driving torque required to
turn the rotor. At the cut-out wind speed the turbine is deliberately stopped
from turning as the high wind speeds greatly increase the stresses on
structures and components, simultaneously increasing the risk of their failure.
A further key characteristic for a wind turbine generating electricity is the
rated speed. This lies between the cut-in and cut-out wind speeds and
identifies the wind speed at which the maximum electrical power is
generated. Beyond the rated speed the electrical output will remain at the
rated level until the cut-out is reached.
Study of Renewable Energy Project Risk Factors Influencing the Insurance Industry ______________________________________________________________________________________________
30
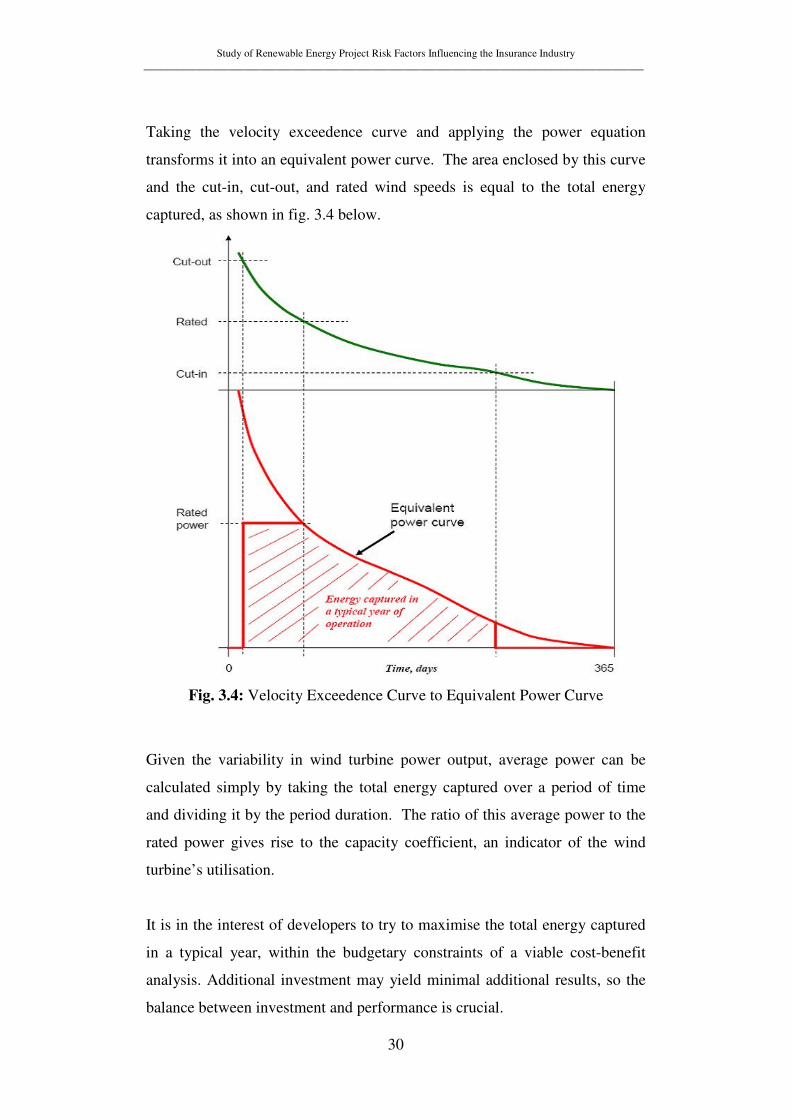
Taking the velocity exceedence curve and applying the power equation
transforms it into an equivalent power curve. The area enclosed by this curve
and the cut-in, cut-out, and rated wind speeds is equal to the total energy
captured, as shown in fig. 3.4 below.
Fig. 3.4: Velocity Exceedence Curve to Equivalent Power Curve
Given the variability in wind turbine power output, average power can be
calculated simply by taking the total energy captured over a period of time
and dividing it by the period duration. The ratio of this average power to the
rated power gives rise to the capacity coefficient, an indicator of the wind
turbine’s utilisation.
It is in the interest of developers to try to maximise the total energy captured
in a typical year, within the budgetary constraints of a viable cost-benefit
analysis. Additional investment may yield minimal additional results, so the
balance between investment and performance is crucial.
Study of Renewable Energy Project Risk Factors Influencing the Insurance Industry ______________________________________________________________________________________________
31
3.2 Configurations
There are two categories of wind turbine configuration – horizontal and
vertical axis. The horizontal axis wind turbine (HAWT) is the most
commonly seen configuration where a vertical tower supports a two or three
bladed rotor turning round a horizontal axis. These can be either upwind,
with the rotor facing upstream into the wind, or downwind, with the rotor
facing the same direction as the wind flow. Nearly all devices, with the
exception of a few smaller ones, are upwind, since downwind variants tend to
suffer from blade fatigue and structural failure due to the turbulence
experienced as the blades pass through the tower’s wind shadow.
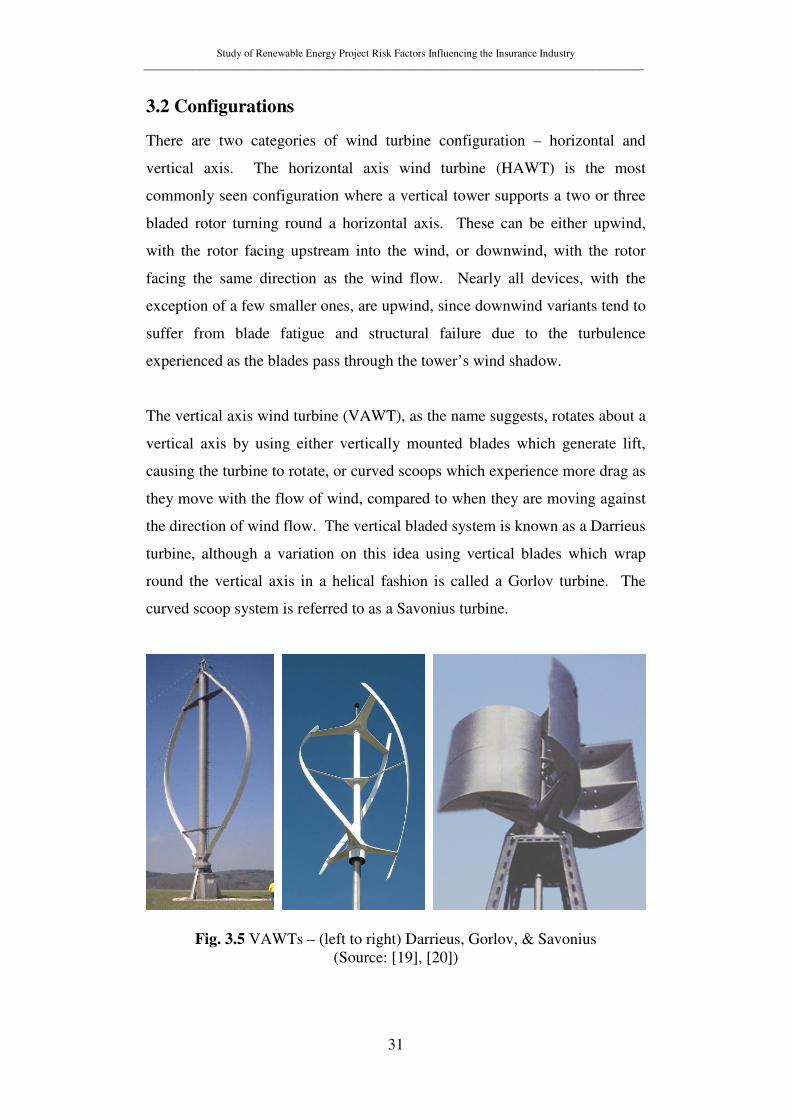
The vertical axis wind turbine (VAWT), as the name suggests, rotates about a
vertical axis by using either vertically mounted blades which generate lift,
causing the turbine to rotate, or curved scoops which experience more drag as
they move with the flow of wind, compared to when they are moving against
the direction of wind flow. The vertical bladed system is known as a Darrieus
turbine, although a variation on this idea using vertical blades which wrap
round the vertical axis in a helical fashion is called a Gorlov turbine. The
curved scoop system is referred to as a Savonius turbine.
Fig. 3.5 VAWTs – (left to right) Darrieus, Gorlov, & Savonius (Source: [19], [20])
Study of Renewable Energy Project Risk Factors Influencing the Insurance Industry ______________________________________________________________________________________________
32
To date, HAWTs have proved to be the default format for commercially
available systems, while VAWTs, although capable at smaller scales, have
not yet been shown to be durable enough when scaled up, in the case of the
Darrieus systems (blade breakages), or efficient enough in the case of the
Savonius device. On this basis, the next section of work will focus only on
HAWTs and their design.
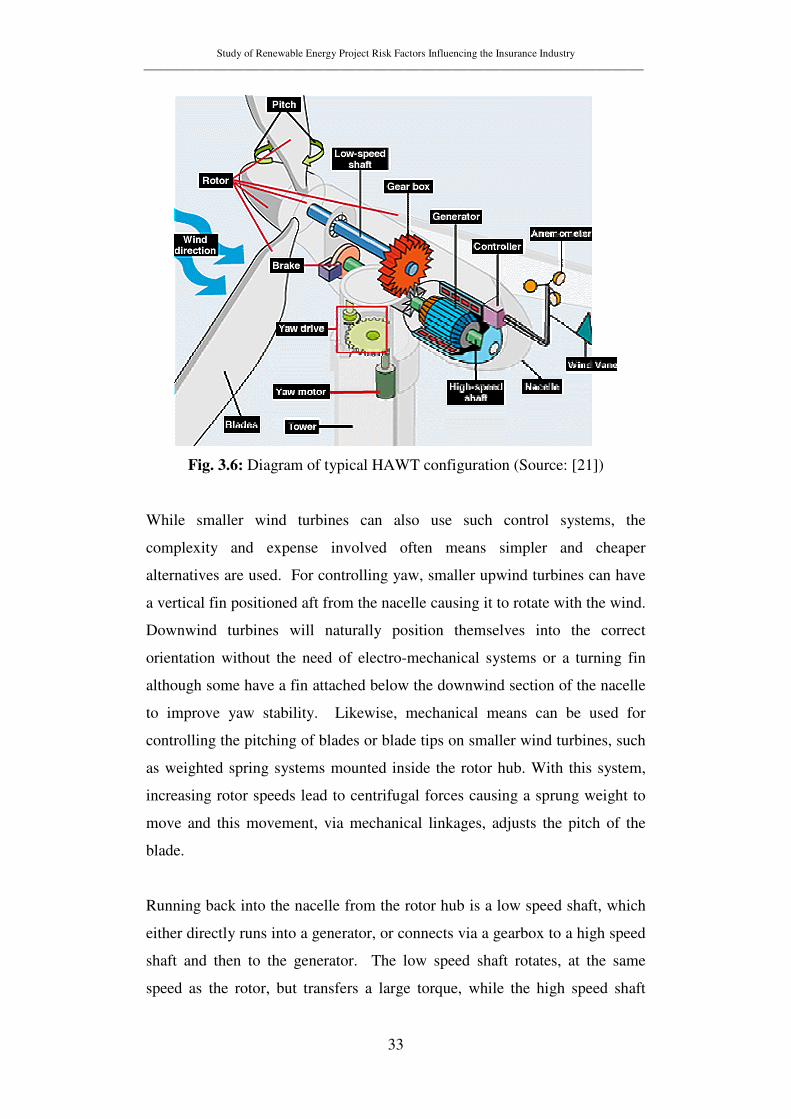
Although wind turbines can outwardly appear to be very similar, there are
many variations across both manufacturers and turbine size scales. At the top
of a wind turbine tower sits a nacelle which houses many of the sub-systems
required to convert wind power into electricity. At the front of the nacelle is
the rotor assembly, comprising a hub and usually three blades constructed
from composite material. On larger machines, the blades are pitch adjustable
to allow the amount of force transferred from the wind to be varied, in order
to control the speed at which the rotor turns. Pitching the blades out of the
wind completely will slow the rotor and it will eventually stop turning.
Although 3 blades are still common on smaller wind turbines, some
manufacturers use only 2 blades. Full length pitch adjustability of the blades
is also seen when down scaling, but there are systems where only the blade
tips are pitch varied, while the rest of the blade remains fixed. Totally fixed
blade systems are found on the smallest scales so they have no means of
aerodynamically moderating the speed of the rotor and have to rely on other
methods.
Controlling the direction the rotor faces on a large wind turbine is a wind
vane, normally positioned on top of the nacelle. As it turns, the wind vanes
movement is detected by a control system which activates a yaw mechanism
rotating the entire nacelle around the vertical axis of the tower on a large
main bearing, thus ensuring that the rotor is always facing into the wind.
Also found on top of the nacelle is an anemometer linked to a second control
system which adjusts the pitch of the rotor blades according to the wind speed
measured by the anemometer.
Study of Renewable Energy Project Risk Factors Influencing the Insurance Industry ______________________________________________________________________________________________
33
Fig. 3.6: Diagram of typical HAWT configuration (Source: [21])
While smaller wind turbines can also use such control systems, the
complexity and expense involved often means simpler and cheaper
alternatives are used. For controlling yaw, smaller upwind turbines can have
a vertical fin positioned aft from the nacelle causing it to rotate with the wind.
Downwind turbines will naturally position themselves into the correct
orientation without the need of electro-mechanical systems or a turning fin
although some have a fin attached below the downwind section of the nacelle
to improve yaw stability. Likewise, mechanical means can be used for
controlling the pitching of blades or blade tips on smaller wind turbines, such
as weighted spring systems mounted inside the rotor hub. With this system,
increasing rotor speeds lead to centrifugal forces causing a sprung weight to
move and this movement, via mechanical linkages, adjusts the pitch of the
blade.
Running back into the nacelle from the rotor hub is a low speed shaft, which
either directly runs into a generator, or connects via a gearbox to a high speed
shaft and then to the generator. The low speed shaft rotates, at the same
speed as the rotor, but transfers a large torque, while the high speed shaft
Study of Renewable Energy Project Risk Factors Influencing the Insurance Industry ______________________________________________________________________________________________
34
turns much faster but with lower torque. Both direct drive and geared
systems have large bearings supporting the shafts and somewhere on both
systems a disc braking system will be attached to a shaft to lock the system
completely. This prevents any turning motion during stoppages or can be
used to help slow the rotation of the rotor in an emergency.
The generator is commonly an asynchronous machine and is directly
connected to the electricity grid. This is made possible because a gearbox
increases the rotor speed of 5-20 rpm up to about 750-3600 rpm at the
generator. Direct drive systems use gearless permanent magnet synchronous
generators which operate at much lower rotational speeds. The main benefits
in comparison to an asynchronous machine include lower levels of
mechanical wear from the lower rotational speed, and less machine stress, as
there is a higher degree of speed variability. This variability in speed also
means that the electrical output must be converted to DC and then back to AC
before reaching the electricity grid, as the voltage and frequency are a
function of the speed of rotation of the generator.
During operation, generators produce high levels of heat and therefore require
continuous cooling. This can be achieved by incorporating air ducts which
channel air around the generator, or by using a water cooling system which
requires a radiator to be placed outside of the nacelle for transferring the heat
from the cooling water to the outside air.
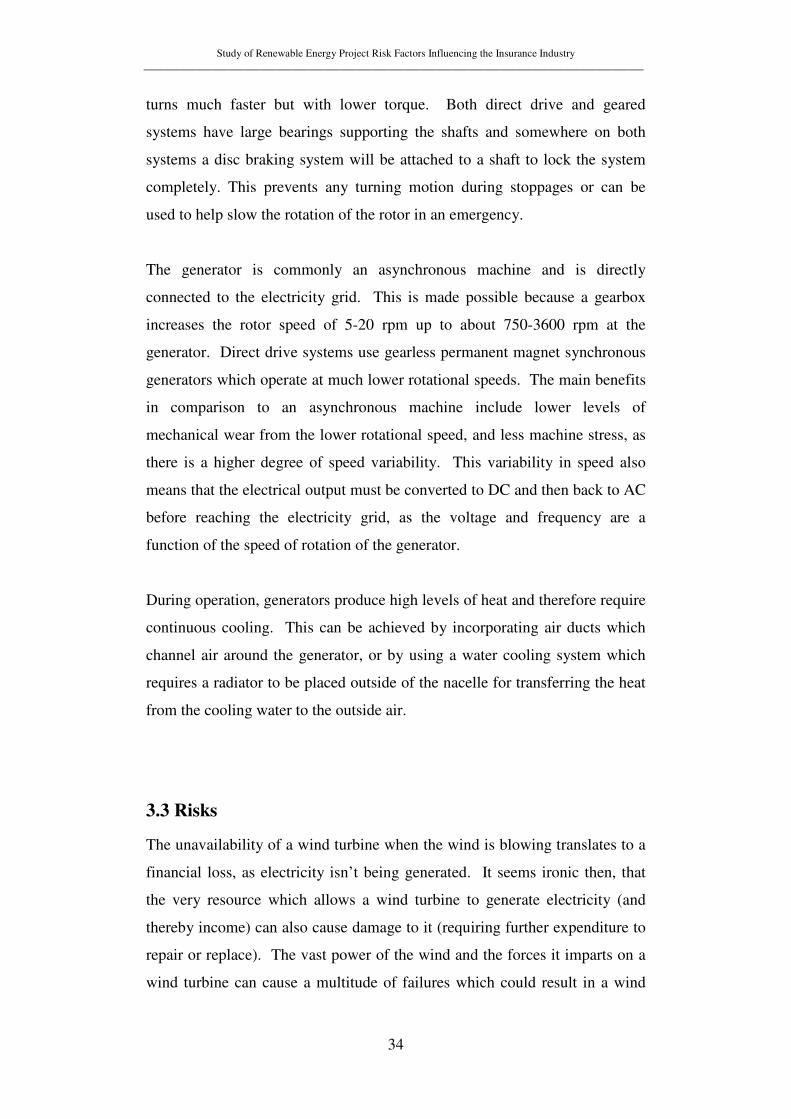
3.3 Risks
The unavailability of a wind turbine when the wind is blowing translates to a
financial loss, as electricity isn’t being generated. It seems ironic then, that
the very resource which allows a wind turbine to generate electricity (and
thereby income) can also cause damage to it (requiring further expenditure to
repair or replace). The vast power of the wind and the forces it imparts on a
wind turbine can cause a multitude of failures which could result in a wind
Study of Renewable Energy Project Risk Factors Influencing the Insurance Industry ______________________________________________________________________________________________
35
turbine being shut down for weeks, if not months, or even completely destroy
it.
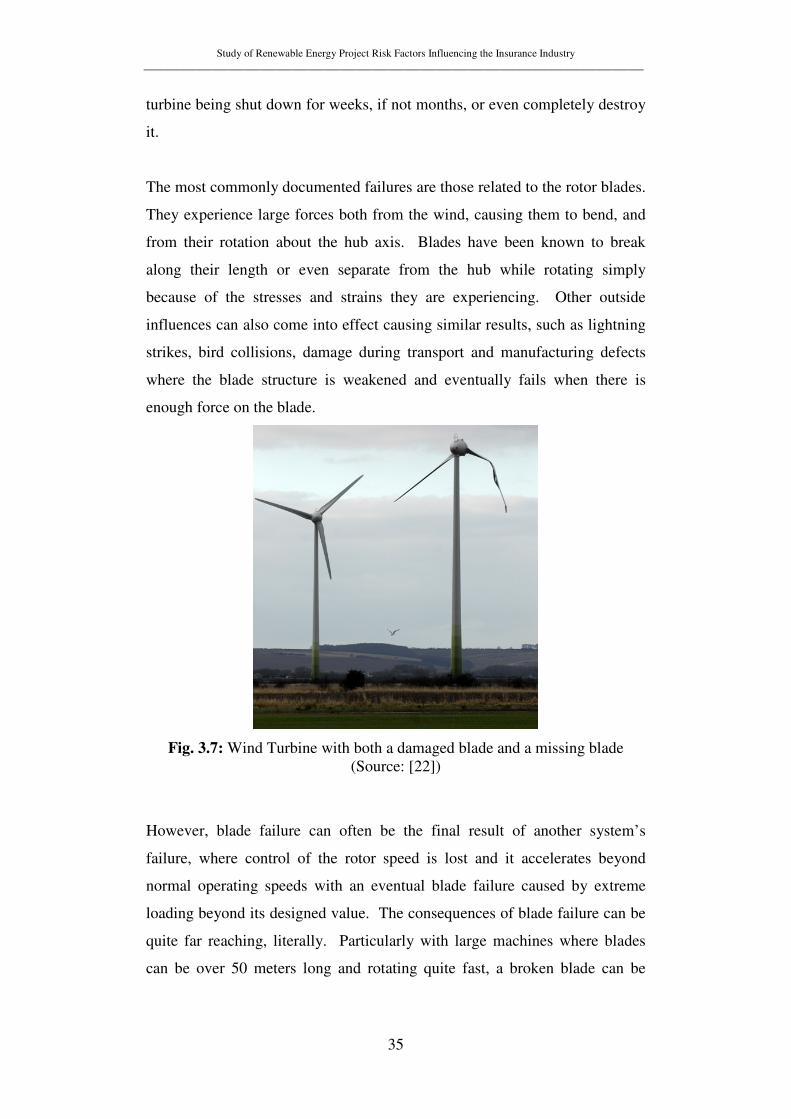
The most commonly documented failures are those related to the rotor blades.
They experience large forces both from the wind, causing them to bend, and
from their rotation about the hub axis. Blades have been known to break
along their length or even separate from the hub while rotating simply
because of the stresses and strains they are experiencing. Other outside
influences can also come into effect causing similar results, such as lightning
strikes, bird collisions, damage during transport and manufacturing defects
where the blade structure is weakened and eventually fails when there is
enough force on the blade.
Fig. 3.7: Wind Turbine with both a damaged blade and a missing blade (Source: [22])
However, blade failure can often be the final result of another system’s
failure, where control of the rotor speed is lost and it accelerates beyond
normal operating speeds with an eventual blade failure caused by extreme
loading beyond its designed value. The consequences of blade failure can be
quite far reaching, literally. Particularly with large machines where blades
can be over 50 meters long and rotating quite fast, a broken blade can be

Study of Renewable Energy Project Risk Factors Influencing the Insurance Industry ______________________________________________________________________________________________
36
thrown hundreds of meters, potentially causing damage to anything in its way
such as another wind turbine, a building or an unlucky observer.
Not only blades suffer from the force of the wind. All mechanical parts
linked to the rotor are subject to huge forces, including the shafts, their
bearings and the gearbox. Such are the demands placed on gearboxes and so
common the resulting failures, that some manufacturers are removing them
completely from their designs and resorting to direct drive transmissions.
Replacing such large mechanical components can be very time consuming
since their positioning at the top of a tower requires a large crane and
favourable weather conditions.
Likewise, the main bearing at the top of the tower which supports the nacelle
and allows it to rotate, experiences large loads and should it develop a
problem necessitating its replacement, the entire nacelle would need to be
removed before the main bearing could be reached.
Even the towers of wind turbines are not immune from risk. Should a tower
be struck by a blade, broken or otherwise, it can impart enough force to cause
it to collapse. There have even been reported cases of towers buckling in
storms and folding over in half without the assistance of a blade strike.
Fig. 3.8: Collapsed wind turbine tower (left) and turbine fire (right) (Source: [23], [24])

Study of Renewable Energy Project Risk Factors Influencing the Insurance Industry ______________________________________________________________________________________________
37
Generators tend to be more reliable than gearboxes as the mechanical stresses
and wear experienced are significantly lower, but they are a potential fire
hazard, particularly if they are not cooled correctly. Similarly the electrical
systems can present risk, as they too have the potential to start a fire, and
consist of a great many components which could fail.
Other risks associated with the realisation of wind turbine developments exist
long before they become operational, during the transportation and construction
phases. Particularly with large scale machines, the physical size and weight of
individual transportable sections (rotor blades, tower sections, nacelle, etc)
leads to greater risk of handling damage when transporting by road and when
lifting with cranes either between transport and site or at final erection.
Study of Renewable Energy Project Risk Factors Influencing the Insurance Industry ______________________________________________________________________________________________
38
Chapter 4 - Hydro Power
4.1 Resource
The movement of water down rivers and from lakes gives rise to hydro
power, or when electricity is produced, hydroelectric power, where the word
“hydro” is derived from the Greek “hydra” meaning water. At a higher
vertical position, water possesses stored potential energy but as it flows to a
lower vertical position under the influence of gravity, the fluid gains kinetic
energy. A turbine can be used to extract energy from this downwards flow,
converting it to mechanical energy and if a generator is connected, into
electrical energy.
Estimating the total potential hydro resource available in the UK is difficult
due to the vast number of waterways covering the country and the variability
in their seasonal flows. Development of the areas with the largest hydro
resource was mostly undertaken in the 1950’s and 1960’s in Scotland and
Wales so there is little scope remaining for further projects of the same scale
today. However, there remain significant opportunities at smaller scales.
A flow of water down through a vertical distance, whether a stream down a
hillside, a waterfall, or water flowing over the top of a weir, can be used to
obtain hydraulic power. Characterising the amount of power obtained are the
head and the flow rate. The head is the vertical height difference between the
water inlet to the turbine and the turbine itself. This is often referred to as the
gross head while the net head is the effective vertical height once the losses
associated with transporting the water to the turbine are accounted for. The
flow rate is the volume of water which passes a point each second.
A suitable site for a hydro project must have a supply of water with sufficient
flow rate and head characteristics, with suitability improving as these
characteristics become larger. It must also be taken into account that flow
rates are likely to fluctuate significantly throughout the year in response to
rainfall variations. Therefore, in determining the suitability of a proposed
Study of Renewable Energy Project Risk Factors Influencing the Insurance Industry ______________________________________________________________________________________________
39
hydro installation, it is important that a thorough hydrological analysis is
performed through either making river flow measurements over an extended
period, or by using computer modelling software. Unfortunately both of
these methods have serious shortcomings with measurements difficult to
make reliably as each measurement only represents a snapshot in time of the
overall situation, and computer models using historical weather data sets are
not necessarily representative of the current or future situation.
Once data is collected, an analysis similar to that for wind turbines can be
performed, with flow rate replacing wind speed to create a flow rate
exceedence curve and an equivalent power curve. The power equation
required for this is derived in the section below.
The energy released by a flow of water through a vertical height can be
described as:
mghE =
Where,
E = Energy released in J
m = mass of water in kg
g = acceleration due to gravity in m/s2 (typically 9.81 m/s2 on the
Earth)
h = vertical distance or gross head in m
As mass is equal to the product of density and volume, the energy released
now becomes:
VghE ρ=
Where,
ρ = density in kg/m3 (typically 1000kg/m3 for water)
V = volume in m3
Study of Renewable Energy Project Risk Factors Influencing the Insurance Industry ______________________________________________________________________________________________
40
If we consider substituting volume with volume per second, or flow rate, then
the equation changes to energy released per second, or power, thereby giving:
QghPg ρ=
Where,
Pg = gross power in W
Q = volumetric flow rate in m3/s
Gross power, however, is an ideal situation that ignores various losses
experienced in a working system such as pipe work friction and mechanical
losses associated with turbines and generators. To take account of these
losses, an efficiency factor can be included to give the net power.
QghPn ηρ=
Where,
Pn = net power in W
η = hydraulic efficiency in %
Using this equation to convert a flow rate exceedence curve to an equivalent
power curve then allows the total energy generated to be calculated in the
same way as for a wind turbine.
4.2 Configurations
There exist three classifications of hydro scheme: storage, run-of-river, and
diversion, sometimes known as canal. All of them share the main
components of; an intake, penstock (pipe from the intake to the turbine),
powerhouse containing a turbine, tailrace (the channel which returns water
having passed through the turbine back to the river or lake) and an electrical
substation for connecting the generated electricity to the local network.
Study of Renewable Energy Project Risk Factors Influencing the Insurance Industry ______________________________________________________________________________________________
41
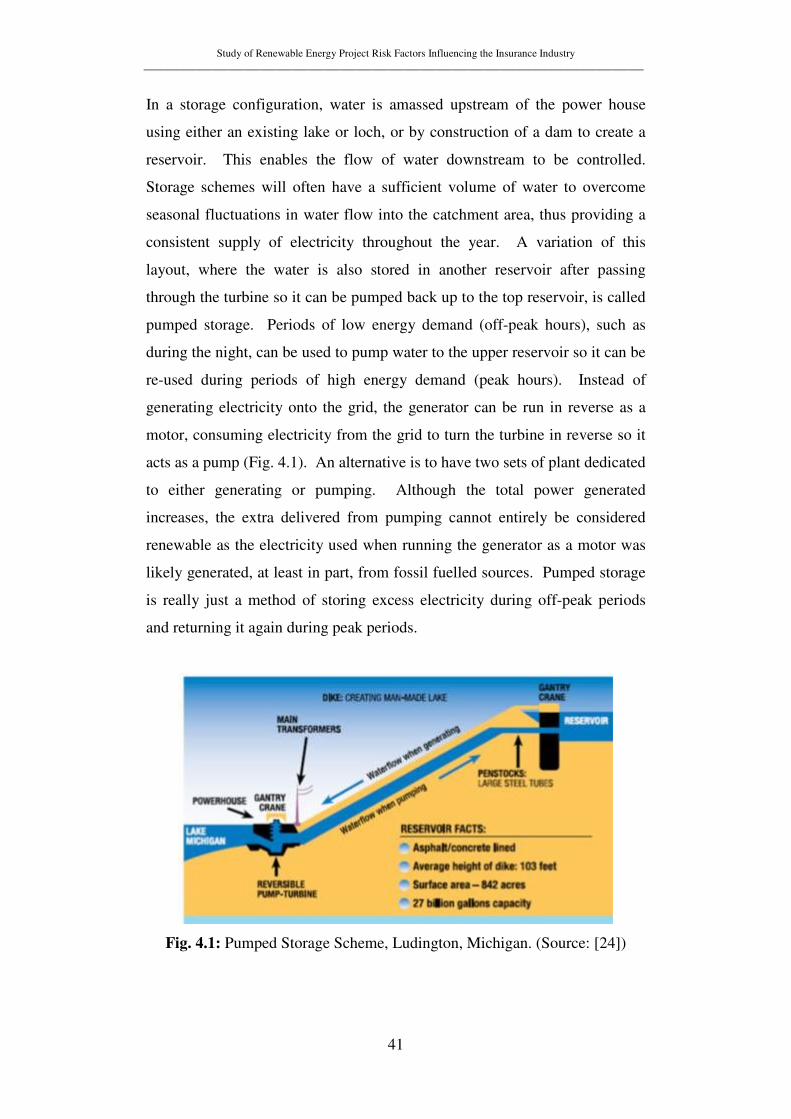
In a storage configuration, water is amassed upstream of the power house
using either an existing lake or loch, or by construction of a dam to create a
reservoir. This enables the flow of water downstream to be controlled.
Storage schemes will often have a sufficient volume of water to overcome
seasonal fluctuations in water flow into the catchment area, thus providing a
consistent supply of electricity throughout the year. A variation of this
layout, where the water is also stored in another reservoir after passing
through the turbine so it can be pumped back up to the top reservoir, is called
pumped storage. Periods of low energy demand (off-peak hours), such as
during the night, can be used to pump water to the upper reservoir so it can be
re-used during periods of high energy demand (peak hours). Instead of
generating electricity onto the grid, the generator can be run in reverse as a
motor, consuming electricity from the grid to turn the turbine in reverse so it
acts as a pump (Fig. 4.1). An alternative is to have two sets of plant dedicated
to either generating or pumping. Although the total power generated
increases, the extra delivered from pumping cannot entirely be considered
renewable as the electricity used when running the generator as a motor was
likely generated, at least in part, from fossil fuelled sources. Pumped storage
is really just a method of storing excess electricity during off-peak periods
and returning it again during peak periods.
Fig. 4.1: Pumped Storage Scheme, Ludington, Michigan. (Source: [24])
Study of Renewable Energy Project Risk Factors Influencing the Insurance Industry ______________________________________________________________________________________________
42
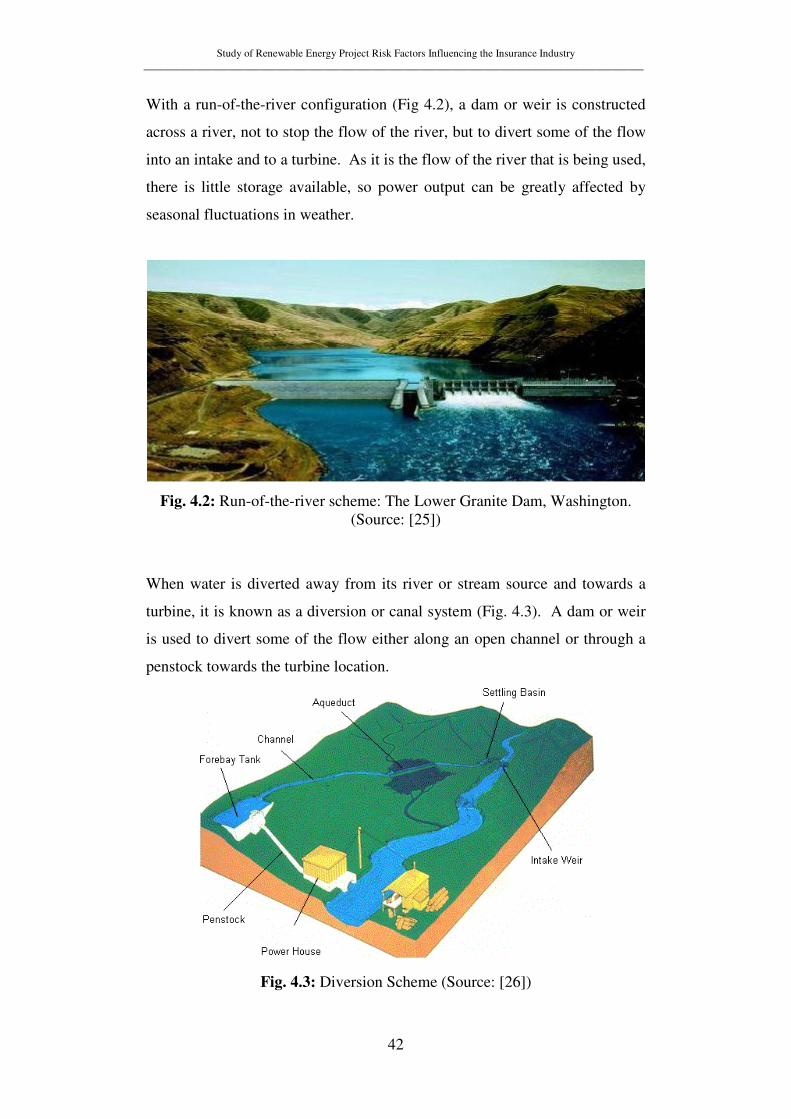
With a run-of-the-river configuration (Fig 4.2), a dam or weir is constructed
across a river, not to stop the flow of the river, but to divert some of the flow
into an intake and to a turbine. As it is the flow of the river that is being used,
there is little storage available, so power output can be greatly affected by
seasonal fluctuations in weather.
Fig. 4.2: Run-of-the-river scheme: The Lower Granite Dam, Washington. (Source: [25])
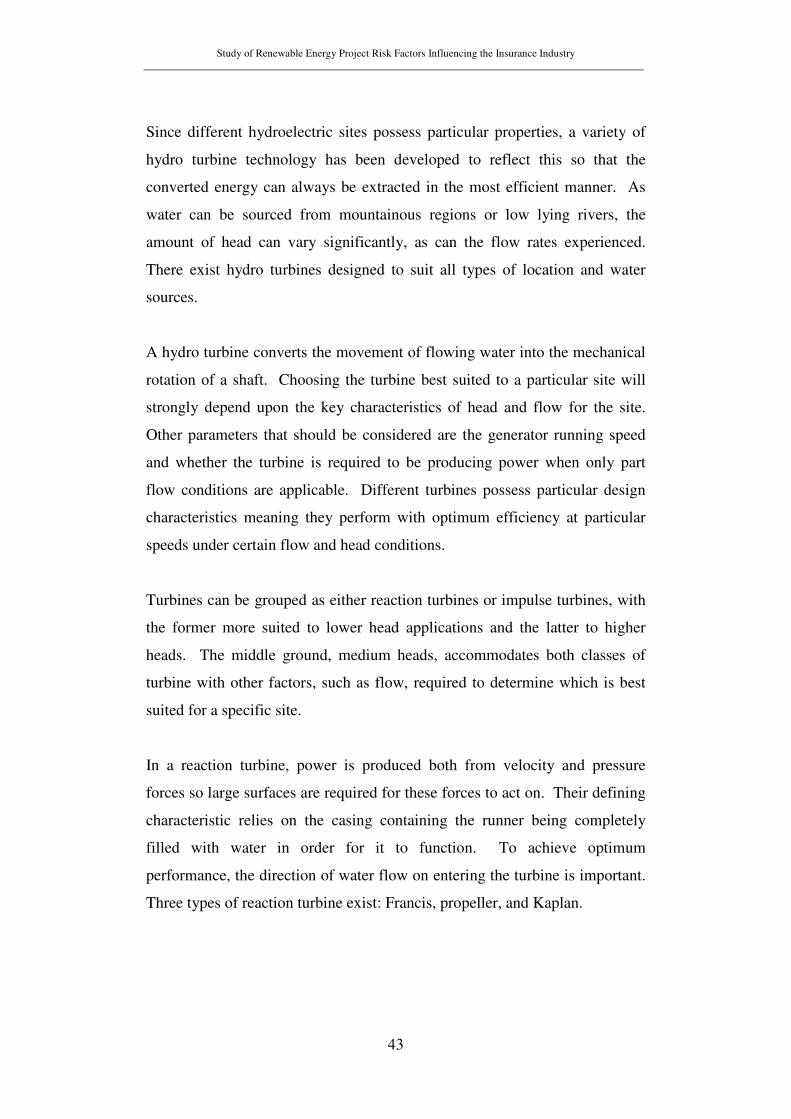
When water is diverted away from its river or stream source and towards a
turbine, it is known as a diversion or canal system (Fig. 4.3). A dam or weir
is used to divert some of the flow either along an open channel or through a
penstock towards the turbine location.
Fig. 4.3: Diversion Scheme (Source: [26])
Study of Renewable Energy Project Risk Factors Influencing the Insurance Industry ______________________________________________________________________________________________
43
Since different hydroelectric sites possess particular properties, a variety of
hydro turbine technology has been developed to reflect this so that the
converted energy can always be extracted in the most efficient manner. As
water can be sourced from mountainous regions or low lying rivers, the
amount of head can vary significantly, as can the flow rates experienced.
There exist hydro turbines designed to suit all types of location and water
sources.
A hydro turbine converts the movement of flowing water into the mechanical
rotation of a shaft. Choosing the turbine best suited to a particular site will
strongly depend upon the key characteristics of head and flow for the site.
Other parameters that should be considered are the generator running speed
and whether the turbine is required to be producing power when only part
flow conditions are applicable. Different turbines possess particular design
characteristics meaning they perform with optimum efficiency at particular
speeds under certain flow and head conditions.
Turbines can be grouped as either reaction turbines or impulse turbines, with
the former more suited to lower head applications and the latter to higher
heads. The middle ground, medium heads, accommodates both classes of
turbine with other factors, such as flow, required to determine which is best
suited for a specific site.
In a reaction turbine, power is produced both from velocity and pressure
forces so large surfaces are required for these forces to act on. Their defining
characteristic relies on the casing containing the runner being completely
filled with water in order for it to function. To achieve optimum
performance, the direction of water flow on entering the turbine is important.
Three types of reaction turbine exist: Francis, propeller, and Kaplan.

Study of Renewable Energy Project Risk Factors Influencing the Insurance Industry ______________________________________________________________________________________________
44
Fig. 4.4: 3-D render of Francis runner Fig. 4.5 (Source: [28]) (Source: [27])
A Francis turbine (Figs 4.4-4.6) is comprised of a wheel, or runner,
constructed with fixed blades sandwiched between two rims, surrounded by a
circle of adjustable guide vanes used to control the amount of water reaching
the runner and causing it to spin.
The vanes are enclosed by a spiral casing, which carries the supply water to
them. After passing through the runner from the side, the water exits the
centre of the runner and down a draft tube to the tail-race. Also classed as
radial flow reaction turbines, Francis turbines are generally designed
specifically to meet the needs of the intended installation. The complexity of
the vane system, together with the design specialisation, makes Francis
turbines less suited to smaller scale hydro projects due to the design and
development costs involved, despite the high efficiency of the end product.
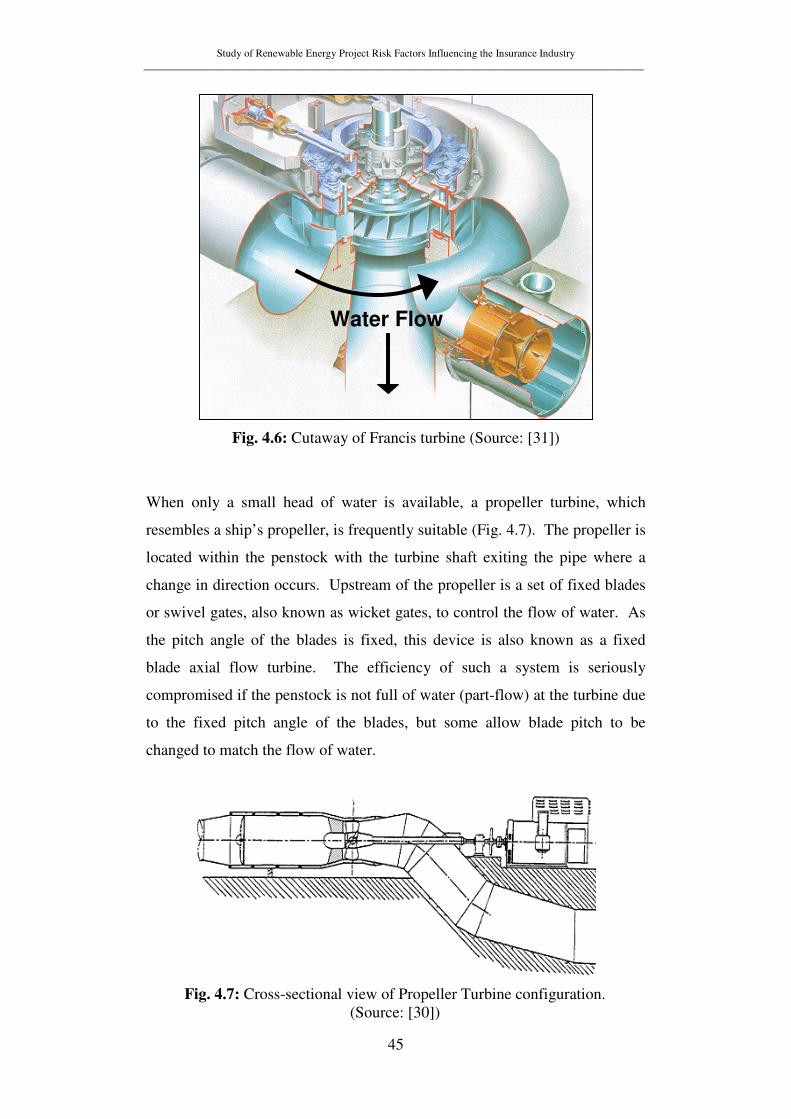
Study of Renewable Energy Project Risk Factors Influencing the Insurance Industry ______________________________________________________________________________________________
45
Fig. 4.6: Cutaway of Francis turbine (Source: [31])
When only a small head of water is available, a propeller turbine, which
resembles a ship’s propeller, is frequently suitable (Fig. 4.7). The propeller is
located within the penstock with the turbine shaft exiting the pipe where a
change in direction occurs. Upstream of the propeller is a set of fixed blades
or swivel gates, also known as wicket gates, to control the flow of water. As
the pitch angle of the blades is fixed, this device is also known as a fixed
blade axial flow turbine. The efficiency of such a system is seriously
compromised if the penstock is not full of water (part-flow) at the turbine due
to the fixed pitch angle of the blades, but some allow blade pitch to be
changed to match the flow of water.
Fig. 4.7: Cross-sectional view of Propeller Turbine configuration. (Source: [30])
Water Flow
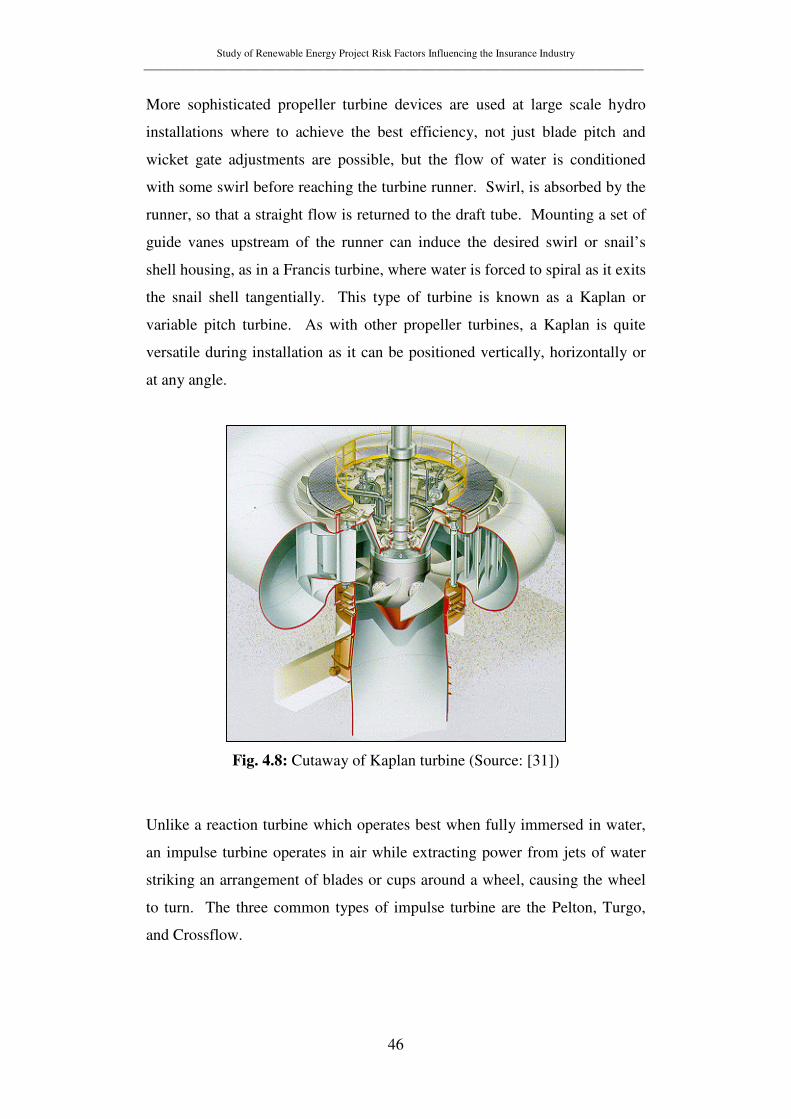
Study of Renewable Energy Project Risk Factors Influencing the Insurance Industry ______________________________________________________________________________________________
46
More sophisticated propeller turbine devices are used at large scale hydro
installations where to achieve the best efficiency, not just blade pitch and
wicket gate adjustments are possible, but the flow of water is conditioned
with some swirl before reaching the turbine runner. Swirl, is absorbed by the
runner, so that a straight flow is returned to the draft tube. Mounting a set of
guide vanes upstream of the runner can induce the desired swirl or snail’s
shell housing, as in a Francis turbine, where water is forced to spiral as it exits
the snail shell tangentially. This type of turbine is known as a Kaplan or
variable pitch turbine. As with other propeller turbines, a Kaplan is quite
versatile during installation as it can be positioned vertically, horizontally or
at any angle.
Fig. 4.8: Cutaway of Kaplan turbine (Source: [31])
Unlike a reaction turbine which operates best when fully immersed in water,
an impulse turbine operates in air while extracting power from jets of water
striking an arrangement of blades or cups around a wheel, causing the wheel
to turn. The three common types of impulse turbine are the Pelton, Turgo,
and Crossflow.
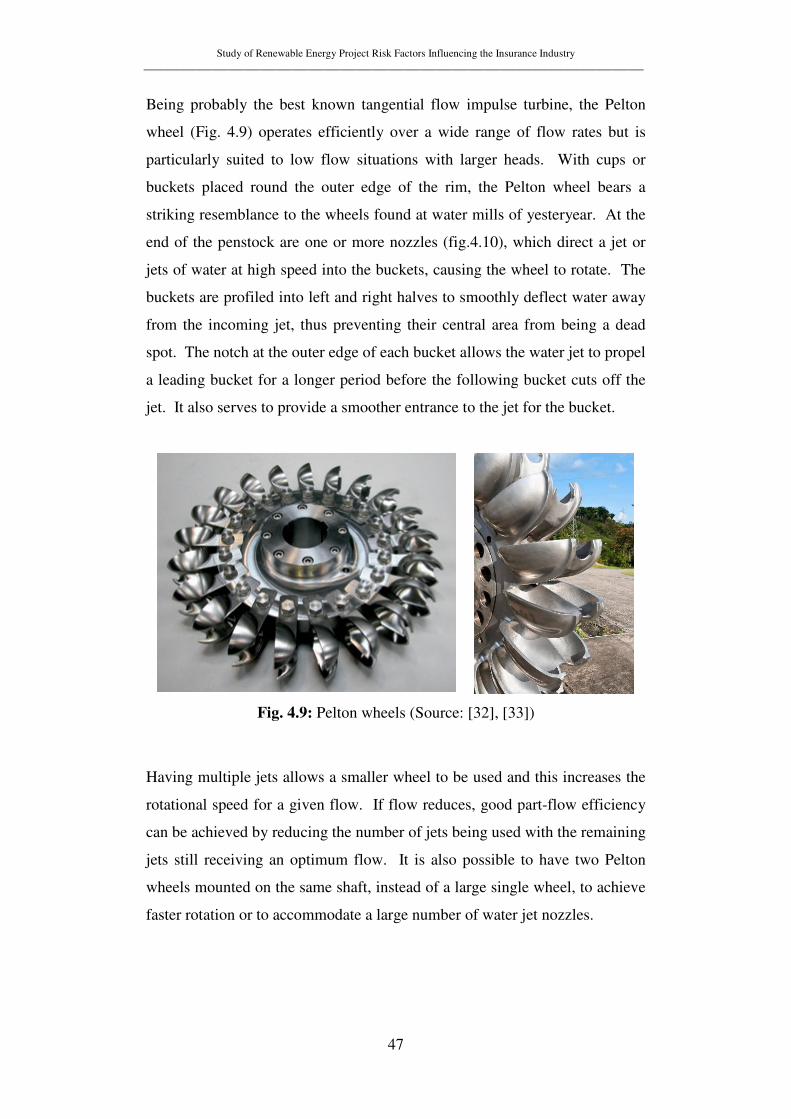
Study of Renewable Energy Project Risk Factors Influencing the Insurance Industry ______________________________________________________________________________________________
47
Being probably the best known tangential flow impulse turbine, the Pelton
wheel (Fig. 4.9) operates efficiently over a wide range of flow rates but is
particularly suited to low flow situations with larger heads. With cups or
buckets placed round the outer edge of the rim, the Pelton wheel bears a
striking resemblance to the wheels found at water mills of yesteryear. At the
end of the penstock are one or more nozzles (fig.4.10), which direct a jet or
jets of water at high speed into the buckets, causing the wheel to rotate. The
buckets are profiled into left and right halves to smoothly deflect water away
from the incoming jet, thus preventing their central area from being a dead
spot. The notch at the outer edge of each bucket allows the water jet to propel
a leading bucket for a longer period before the following bucket cuts off the
jet. It also serves to provide a smoother entrance to the jet for the bucket.
Fig. 4.9: Pelton wheels (Source: [32], [33])
Having multiple jets allows a smaller wheel to be used and this increases the
rotational speed for a given flow. If flow reduces, good part-flow efficiency
can be achieved by reducing the number of jets being used with the remaining
jets still receiving an optimum flow. It is also possible to have two Pelton
wheels mounted on the same shaft, instead of a large single wheel, to achieve
faster rotation or to accommodate a large number of water jet nozzles.
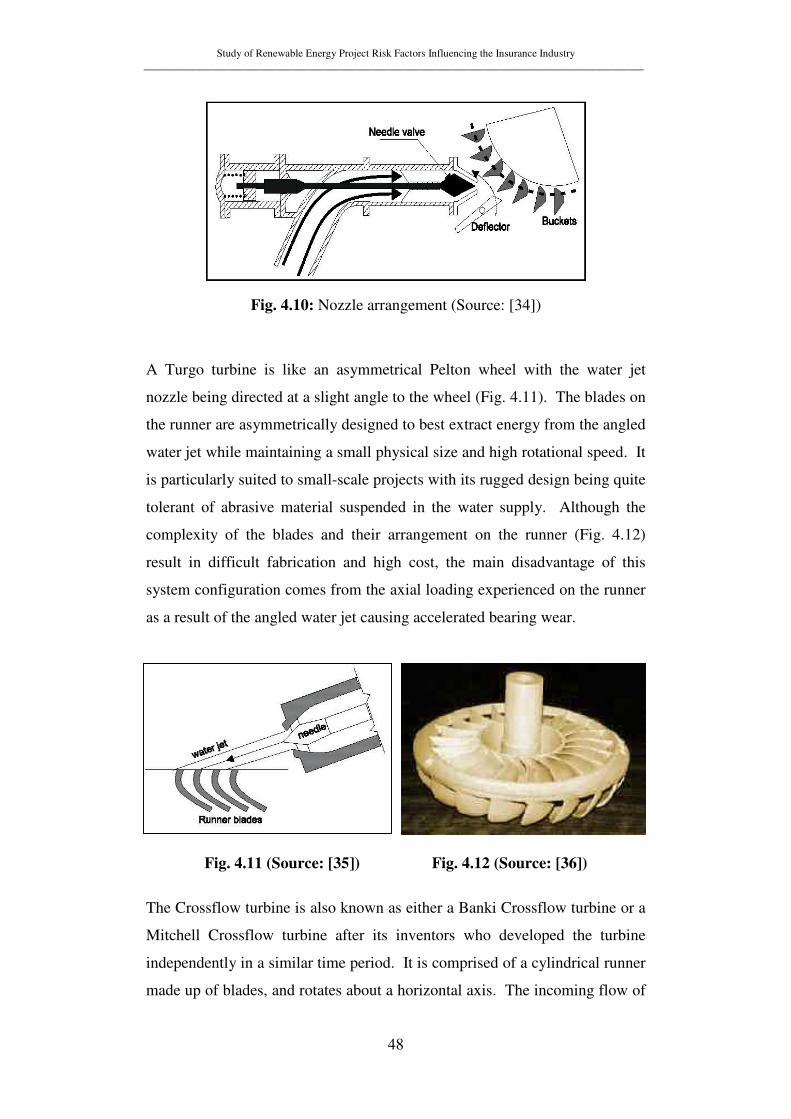
Study of Renewable Energy Project Risk Factors Influencing the Insurance Industry ______________________________________________________________________________________________
48
Fig. 4.10: Nozzle arrangement (Source: [34])
A Turgo turbine is like an asymmetrical Pelton wheel with the water jet
nozzle being directed at a slight angle to the wheel (Fig. 4.11). The blades on
the runner are asymmetrically designed to best extract energy from the angled
water jet while maintaining a small physical size and high rotational speed. It
is particularly suited to small-scale projects with its rugged design being quite
tolerant of abrasive material suspended in the water supply. Although the
complexity of the blades and their arrangement on the runner (Fig. 4.12)
result in difficult fabrication and high cost, the main disadvantage of this
system configuration comes from the axial loading experienced on the runner
as a result of the angled water jet causing accelerated bearing wear.
Fig. 4.11 (Source: [35]) Fig. 4.12 (Source: [36])
The Crossflow turbine is also known as either a Banki Crossflow turbine or a
Mitchell Crossflow turbine after its inventors who developed the turbine
independently in a similar time period. It is comprised of a cylindrical runner
made up of blades, and rotates about a horizontal axis. The incoming flow of
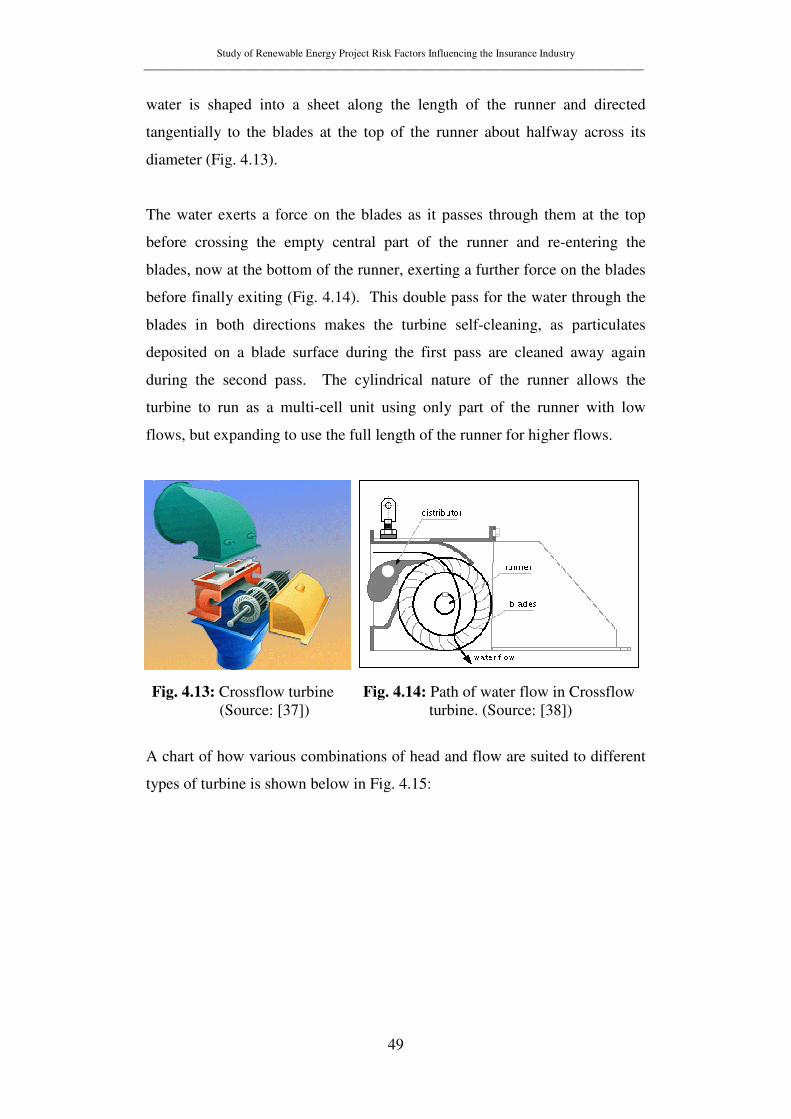
Study of Renewable Energy Project Risk Factors Influencing the Insurance Industry ______________________________________________________________________________________________
49
water is shaped into a sheet along the length of the runner and directed
tangentially to the blades at the top of the runner about halfway across its
diameter (Fig. 4.13).
The water exerts a force on the blades as it passes through them at the top
before crossing the empty central part of the runner and re-entering the
blades, now at the bottom of the runner, exerting a further force on the blades
before finally exiting (Fig. 4.14). This double pass for the water through the
blades in both directions makes the turbine self-cleaning, as particulates
deposited on a blade surface during the first pass are cleaned away again
during the second pass. The cylindrical nature of the runner allows the
turbine to run as a multi-cell unit using only part of the runner with low
flows, but expanding to use the full length of the runner for higher flows.
Fig. 4.13: Crossflow turbine Fig. 4.14: Path of water flow in Crossflow (Source: [37]) turbine. (Source: [38])
A chart of how various combinations of head and flow are suited to different
types of turbine is shown below in Fig. 4.15:
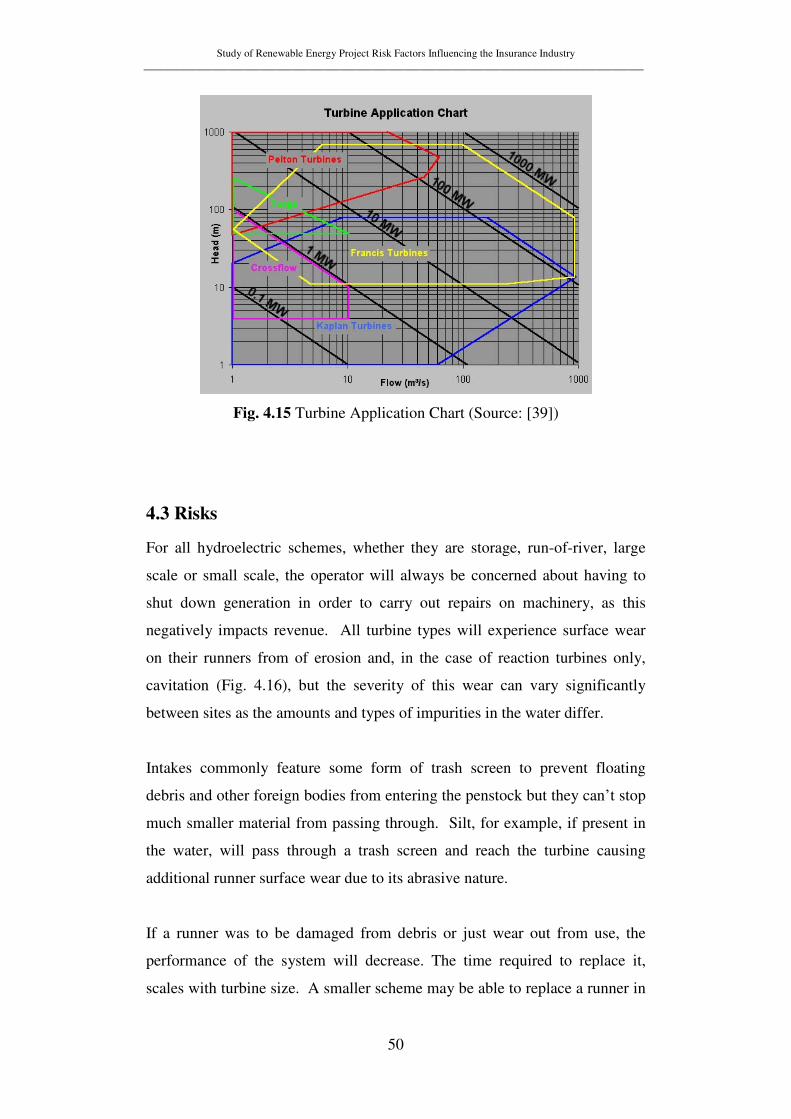
Study of Renewable Energy Project Risk Factors Influencing the Insurance Industry ______________________________________________________________________________________________
50
Fig. 4.15 Turbine Application Chart (Source: [39])
4.3 Risks
For all hydroelectric schemes, whether they are storage, run-of-river, large
scale or small scale, the operator will always be concerned about having to
shut down generation in order to carry out repairs on machinery, as this
negatively impacts revenue. All turbine types will experience surface wear
on their runners from of erosion and, in the case of reaction turbines only,
cavitation (Fig. 4.16), but the severity of this wear can vary significantly
between sites as the amounts and types of impurities in the water differ.
Intakes commonly feature some form of trash screen to prevent floating
debris and other foreign bodies from entering the penstock but they can’t stop
much smaller material from passing through. Silt, for example, if present in
the water, will pass through a trash screen and reach the turbine causing
additional runner surface wear due to its abrasive nature.
If a runner was to be damaged from debris or just wear out from use, the
performance of the system will decrease. The time required to replace it,
scales with turbine size. A smaller scheme may be able to replace a runner in
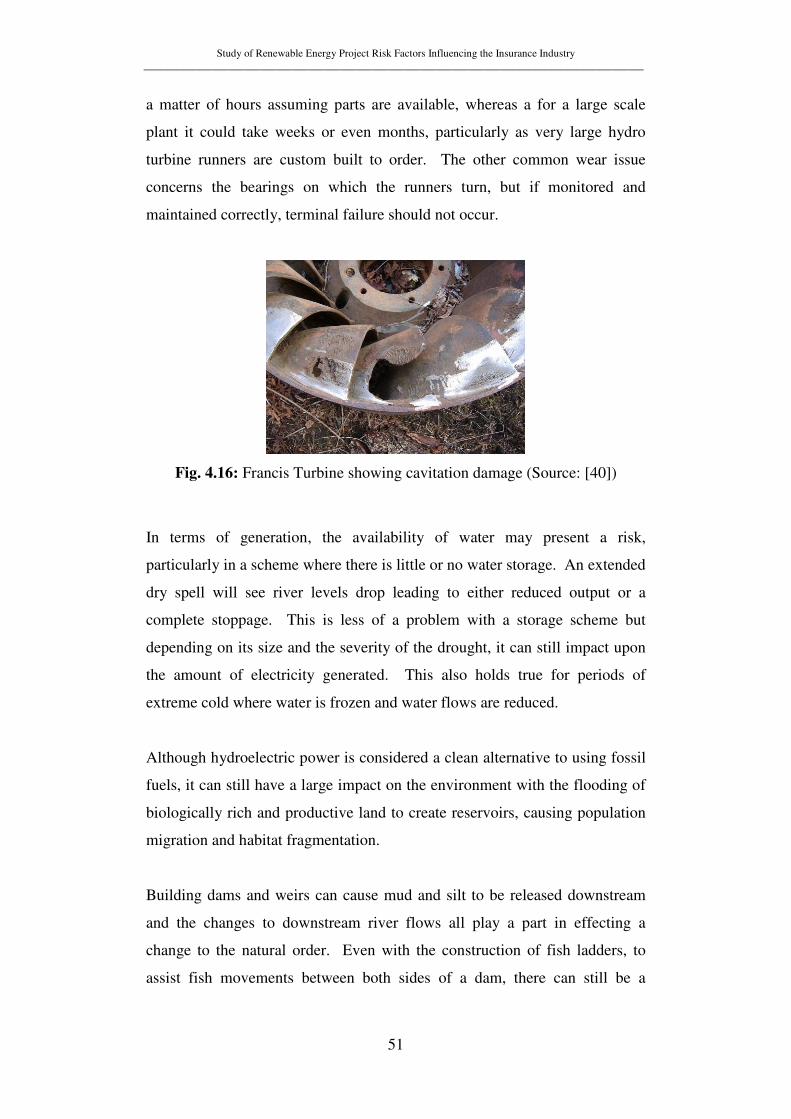
Study of Renewable Energy Project Risk Factors Influencing the Insurance Industry ______________________________________________________________________________________________
51
a matter of hours assuming parts are available, whereas a for a large scale
plant it could take weeks or even months, particularly as very large hydro
turbine runners are custom built to order. The other common wear issue
concerns the bearings on which the runners turn, but if monitored and
maintained correctly, terminal failure should not occur.
Fig. 4.16: Francis Turbine showing cavitation damage (Source: [40])
In terms of generation, the availability of water may present a risk,
particularly in a scheme where there is little or no water storage. An extended
dry spell will see river levels drop leading to either reduced output or a
complete stoppage. This is less of a problem with a storage scheme but
depending on its size and the severity of the drought, it can still impact upon
the amount of electricity generated. This also holds true for periods of
extreme cold where water is frozen and water flows are reduced.
Although hydroelectric power is considered a clean alternative to using fossil
fuels, it can still have a large impact on the environment with the flooding of
biologically rich and productive land to create reservoirs, causing population
migration and habitat fragmentation.
Building dams and weirs can cause mud and silt to be released downstream
and the changes to downstream river flows all play a part in effecting a
change to the natural order. Even with the construction of fish ladders, to
assist fish movements between both sides of a dam, there can still be a

Study of Renewable Energy Project Risk Factors Influencing the Insurance Industry ______________________________________________________________________________________________
52
significant impact on fish populations as spawning areas upstream are
affected.
The biggest risk associated with a dam holding back a reservoir, irrespective
of the scale, is the potential for causing damage and loss of life if the dam
fails. Good design and construction cannot guarantee survivability from
seismic activity, sabotage or even terrorism.
Study of Renewable Energy Project Risk Factors Influencing the Insurance Industry ______________________________________________________________________________________________
53
Chapter 5 - Solar Power
5.1 Resource
Energy from the sun is responsible for many of the things we take for granted
on a daily basis, be that daylight, heat, wind, or plant growth. Harnessing this
energy for something other than heating is a relatively recent phenomenon as
technological development has not only made electricity generation possible,
but more affordable. However, as demonstrated by other European countries,
the key to electricity generation from solar energy being more widely
adopted, is clear policy implementation supported by generous feed-in tariff
rates. The UK, having learned from this, is also now also taking this
approach.
The amount of solar energy reaching the Earth’s surface at any one time is
about 89 petawatts (PW), or 89x1015W, but this is not uniformly distributed
or consistent over time at a given location on the surface.[41] This is
primarily due to the Earth’s rotation bringing day and night, as well as its
tilted axis causing seasonal changes, and cloud cover. Unlike other
renewable sources such as wind, the availability of solar energy is very
predictable (sunrise through to sunset), although less predictable is its actual
intensity at ground level because of changeable weather influences.
The UK is not renowned for its availability of sunlight when compared to
other locations around the world, but it is still possible to generate electricity
effectively and with the introduction of Feed-in Tariffs, also economically. A
solar irradiance map of the UK and Ireland is shown in Figure 5.1 and it
highlights the variation of global horizontal irradiance experienced between
the north and south of the country.
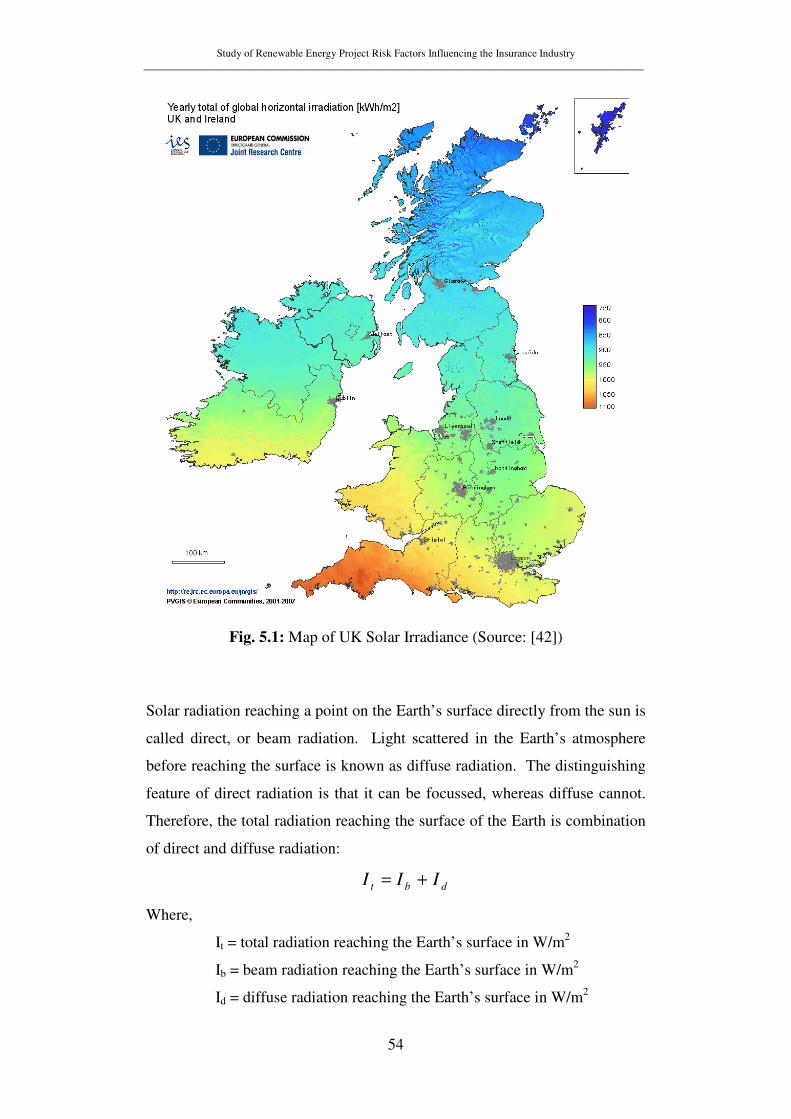
Study of Renewable Energy Project Risk Factors Influencing the Insurance Industry ______________________________________________________________________________________________
54
Fig. 5.1: Map of UK Solar Irradiance (Source: [42])
Solar radiation reaching a point on the Earth’s surface directly from the sun is
called direct, or beam radiation. Light scattered in the Earth’s atmosphere
before reaching the surface is known as diffuse radiation. The distinguishing
feature of direct radiation is that it can be focussed, whereas diffuse cannot.
Therefore, the total radiation reaching the surface of the Earth is combination
of direct and diffuse radiation:
dbt III +=
Where,
It = total radiation reaching the Earth’s surface in W/m2
Ib = beam radiation reaching the Earth’s surface in W/m2
Id = diffuse radiation reaching the Earth’s surface in W/m2
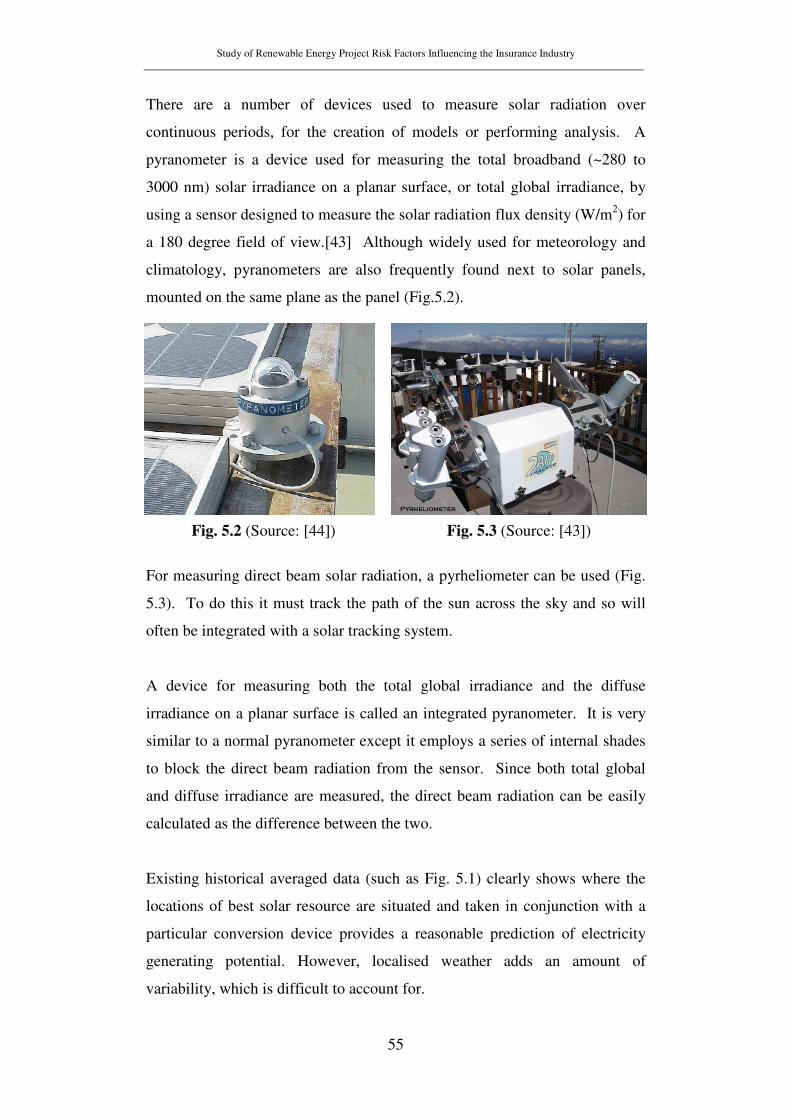
Study of Renewable Energy Project Risk Factors Influencing the Insurance Industry ______________________________________________________________________________________________
55
There are a number of devices used to measure solar radiation over
continuous periods, for the creation of models or performing analysis. A
pyranometer is a device used for measuring the total broadband (~280 to
3000 nm) solar irradiance on a planar surface, or total global irradiance, by
using a sensor designed to measure the solar radiation flux density (W/m2) for
a 180 degree field of view.[43] Although widely used for meteorology and
climatology, pyranometers are also frequently found next to solar panels,
mounted on the same plane as the panel (Fig.5.2).
Fig. 5.2 (Source: [44]) Fig. 5.3 (Source: [43])
For measuring direct beam solar radiation, a pyrheliometer can be used (Fig.
5.3). To do this it must track the path of the sun across the sky and so will
often be integrated with a solar tracking system.
A device for measuring both the total global irradiance and the diffuse
irradiance on a planar surface is called an integrated pyranometer. It is very
similar to a normal pyranometer except it employs a series of internal shades
to block the direct beam radiation from the sensor. Since both total global
and diffuse irradiance are measured, the direct beam radiation can be easily
calculated as the difference between the two.
Existing historical averaged data (such as Fig. 5.1) clearly shows where the
locations of best solar resource are situated and taken in conjunction with a
particular conversion device provides a reasonable prediction of electricity
generating potential. However, localised weather adds an amount of
variability, which is difficult to account for.
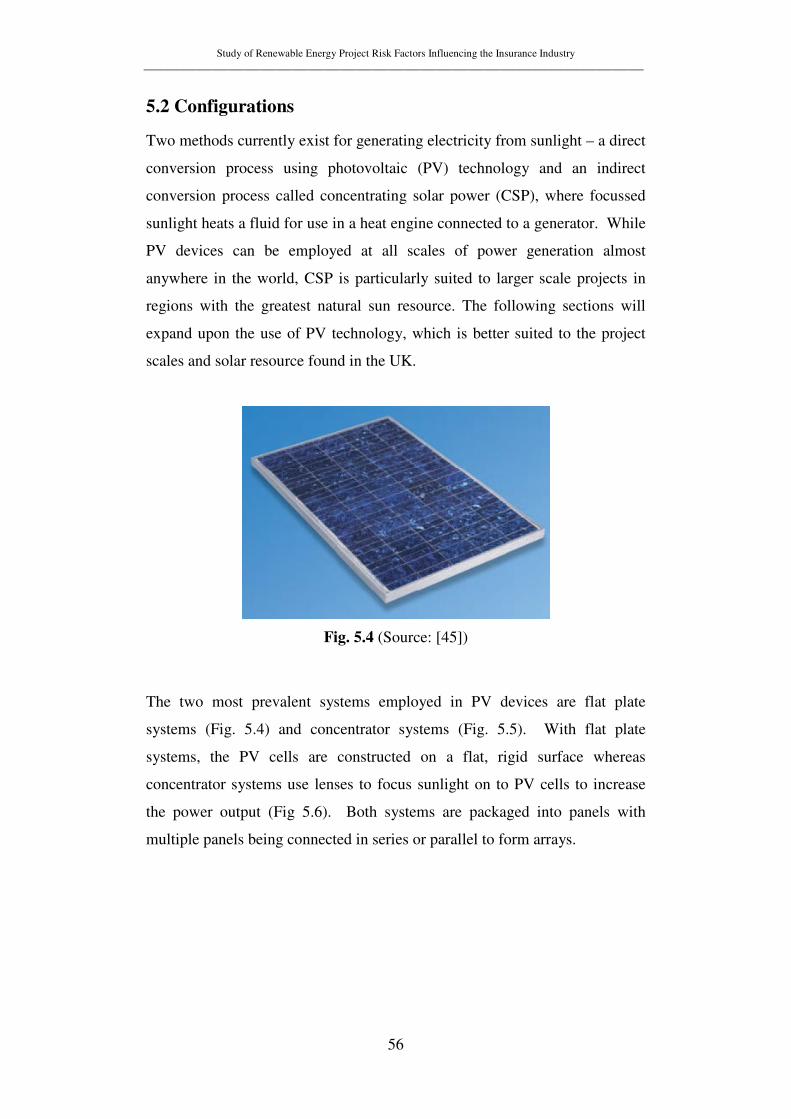
Study of Renewable Energy Project Risk Factors Influencing the Insurance Industry ______________________________________________________________________________________________
56
5.2 Configurations
Two methods currently exist for generating electricity from sunlight – a direct
conversion process using photovoltaic (PV) technology and an indirect
conversion process called concentrating solar power (CSP), where focussed
sunlight heats a fluid for use in a heat engine connected to a generator. While
PV devices can be employed at all scales of power generation almost
anywhere in the world, CSP is particularly suited to larger scale projects in
regions with the greatest natural sun resource. The following sections will
expand upon the use of PV technology, which is better suited to the project
scales and solar resource found in the UK.
Fig. 5.4 (Source: [45])
The two most prevalent systems employed in PV devices are flat plate
systems (Fig. 5.4) and concentrator systems (Fig. 5.5). With flat plate
systems, the PV cells are constructed on a flat, rigid surface whereas
concentrator systems use lenses to focus sunlight on to PV cells to increase
the power output (Fig 5.6). Both systems are packaged into panels with
multiple panels being connected in series or parallel to form arrays.
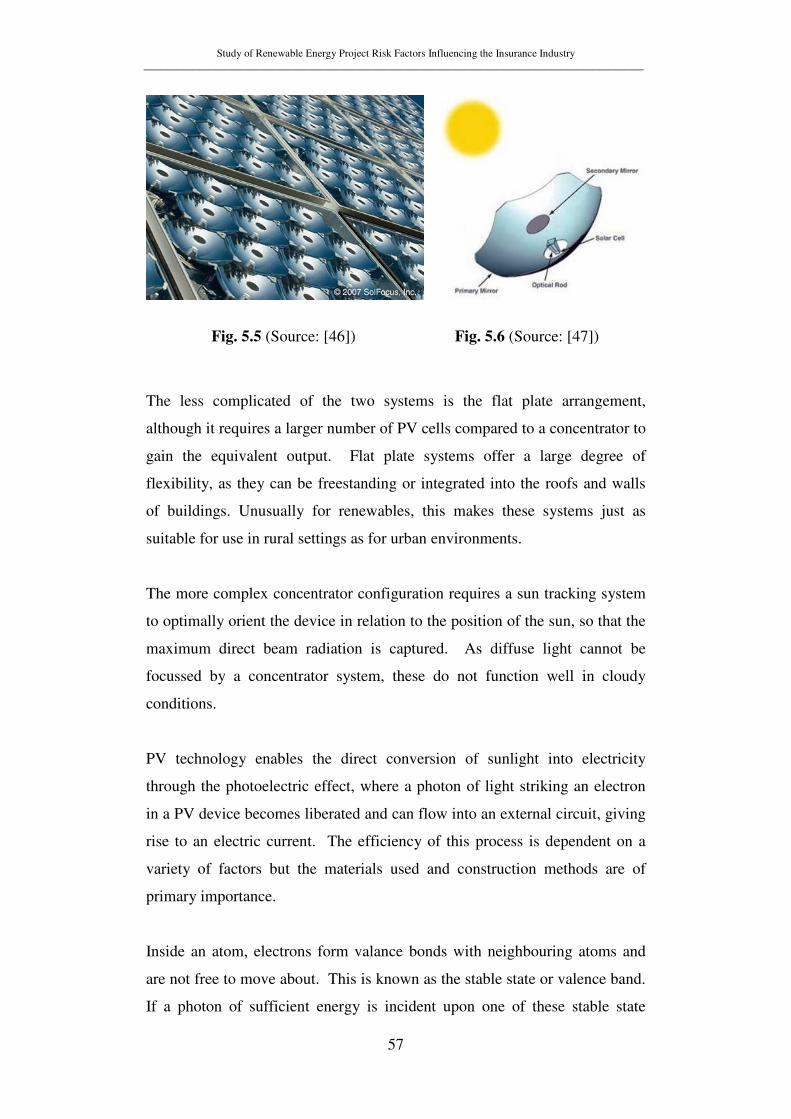
Study of Renewable Energy Project Risk Factors Influencing the Insurance Industry ______________________________________________________________________________________________
57
Fig. 5.5 (Source: [46]) Fig. 5.6 (Source: [47])
The less complicated of the two systems is the flat plate arrangement,
although it requires a larger number of PV cells compared to a concentrator to
gain the equivalent output. Flat plate systems offer a large degree of
flexibility, as they can be freestanding or integrated into the roofs and walls
of buildings. Unusually for renewables, this makes these systems just as
suitable for use in rural settings as for urban environments.
The more complex concentrator configuration requires a sun tracking system
to optimally orient the device in relation to the position of the sun, so that the
maximum direct beam radiation is captured. As diffuse light cannot be
focussed by a concentrator system, these do not function well in cloudy
conditions.
PV technology enables the direct conversion of sunlight into electricity
through the photoelectric effect, where a photon of light striking an electron
in a PV device becomes liberated and can flow into an external circuit, giving
rise to an electric current. The efficiency of this process is dependent on a
variety of factors but the materials used and construction methods are of
primary importance.
Inside an atom, electrons form valance bonds with neighbouring atoms and
are not free to move about. This is known as the stable state or valence band.
If a photon of sufficient energy is incident upon one of these stable state
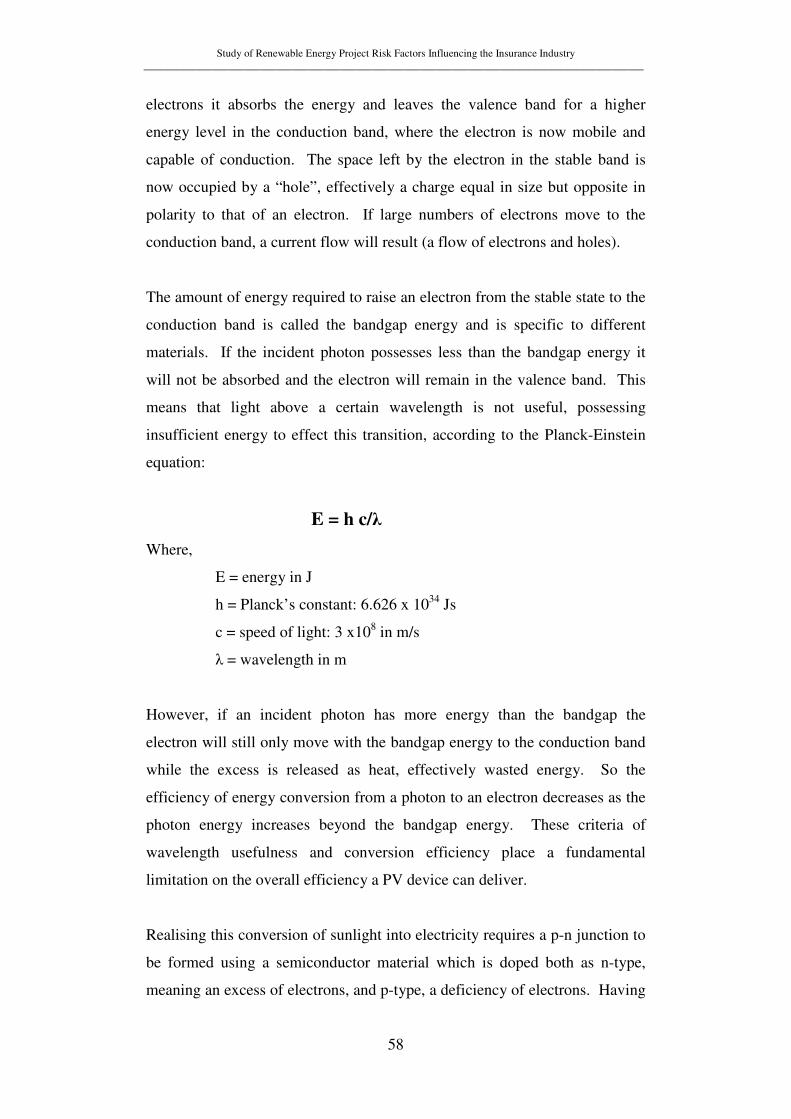
Study of Renewable Energy Project Risk Factors Influencing the Insurance Industry ______________________________________________________________________________________________
58
electrons it absorbs the energy and leaves the valence band for a higher
energy level in the conduction band, where the electron is now mobile and
capable of conduction. The space left by the electron in the stable band is
now occupied by a “hole”, effectively a charge equal in size but opposite in
polarity to that of an electron. If large numbers of electrons move to the
conduction band, a current flow will result (a flow of electrons and holes).
The amount of energy required to raise an electron from the stable state to the
conduction band is called the bandgap energy and is specific to different
materials. If the incident photon possesses less than the bandgap energy it
will not be absorbed and the electron will remain in the valence band. This
means that light above a certain wavelength is not useful, possessing
insufficient energy to effect this transition, according to the Planck-Einstein
equation:
E = h c/λ
Where,
E = energy in J
h = Planck’s constant: 6.626 x 1034 Js
c = speed of light: 3 x10⁸ in m/s
λ = wavelength in m
However, if an incident photon has more energy than the bandgap the
electron will still only move with the bandgap energy to the conduction band
while the excess is released as heat, effectively wasted energy. So the
efficiency of energy conversion from a photon to an electron decreases as the
photon energy increases beyond the bandgap energy. These criteria of
wavelength usefulness and conversion efficiency place a fundamental
limitation on the overall efficiency a PV device can deliver.
Realising this conversion of sunlight into electricity requires a p-n junction to
be formed using a semiconductor material which is doped both as n-type,
meaning an excess of electrons, and p-type, a deficiency of electrons. Having
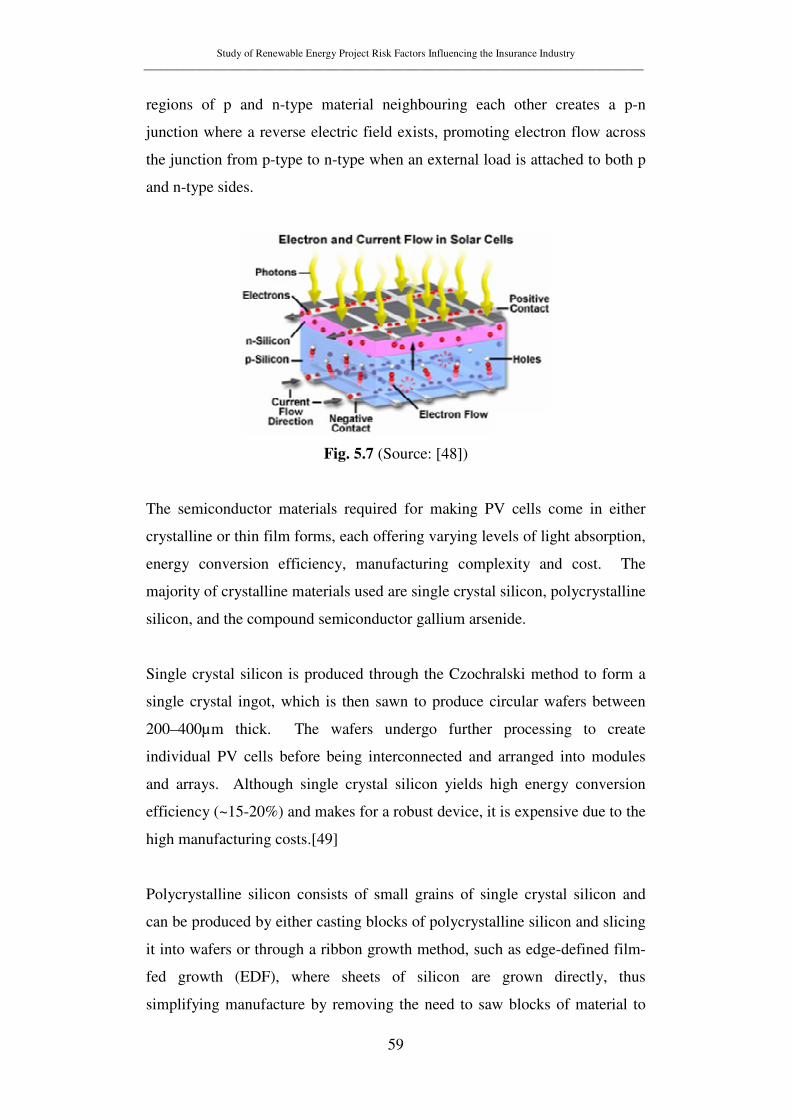
Study of Renewable Energy Project Risk Factors Influencing the Insurance Industry ______________________________________________________________________________________________
59
regions of p and n-type material neighbouring each other creates a p-n
junction where a reverse electric field exists, promoting electron flow across
the junction from p-type to n-type when an external load is attached to both p
and n-type sides.
Fig. 5.7 (Source: [48])
The semiconductor materials required for making PV cells come in either
crystalline or thin film forms, each offering varying levels of light absorption,
energy conversion efficiency, manufacturing complexity and cost. The
majority of crystalline materials used are single crystal silicon, polycrystalline
silicon, and the compound semiconductor gallium arsenide.
Single crystal silicon is produced through the Czochralski method to form a
single crystal ingot, which is then sawn to produce circular wafers between
200–400µm thick. The wafers undergo further processing to create
individual PV cells before being interconnected and arranged into modules
and arrays. Although single crystal silicon yields high energy conversion
efficiency (~15-20%) and makes for a robust device, it is expensive due to the
high manufacturing costs.[49]
Polycrystalline silicon consists of small grains of single crystal silicon and
can be produced by either casting blocks of polycrystalline silicon and slicing
it into wafers or through a ribbon growth method, such as edge-defined film-
fed growth (EDF), where sheets of silicon are grown directly, thus
simplifying manufacture by removing the need to saw blocks of material to
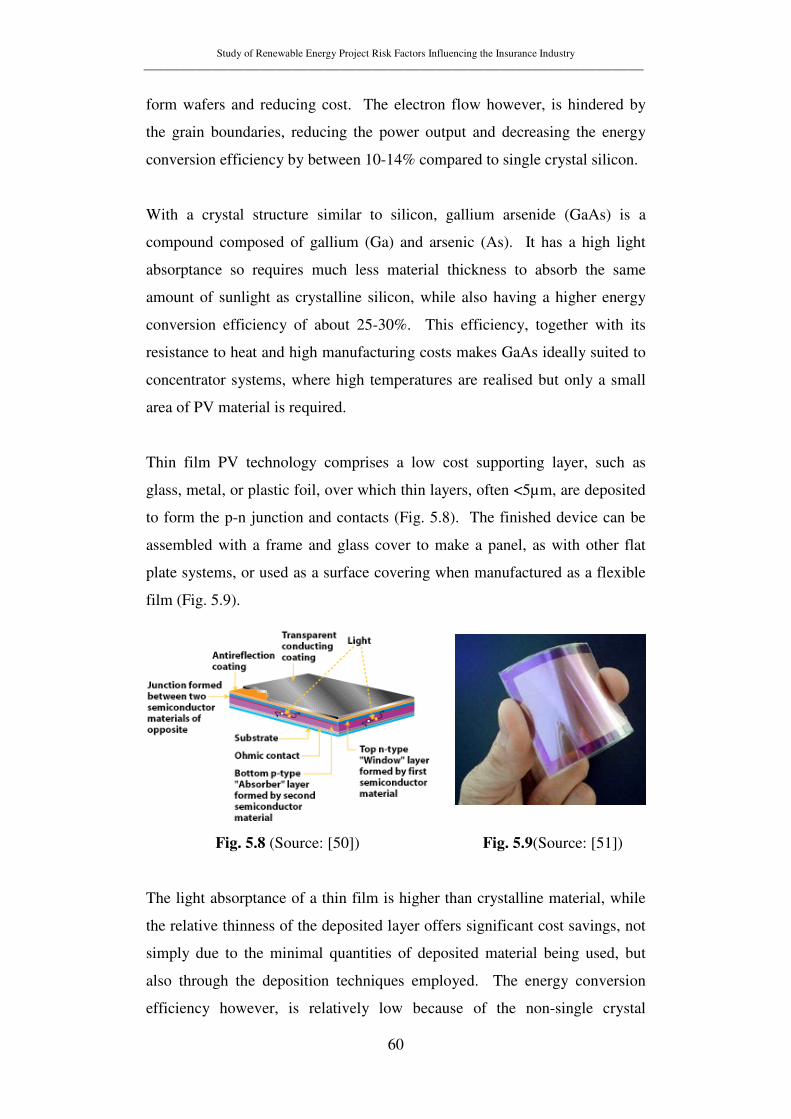
Study of Renewable Energy Project Risk Factors Influencing the Insurance Industry ______________________________________________________________________________________________
60
form wafers and reducing cost. The electron flow however, is hindered by
the grain boundaries, reducing the power output and decreasing the energy
conversion efficiency by between 10-14% compared to single crystal silicon.
With a crystal structure similar to silicon, gallium arsenide (GaAs) is a
compound composed of gallium (Ga) and arsenic (As). It has a high light
absorptance so requires much less material thickness to absorb the same
amount of sunlight as crystalline silicon, while also having a higher energy
conversion efficiency of about 25-30%. This efficiency, together with its
resistance to heat and high manufacturing costs makes GaAs ideally suited to
concentrator systems, where high temperatures are realised but only a small
area of PV material is required.
Thin film PV technology comprises a low cost supporting layer, such as
glass, metal, or plastic foil, over which thin layers, often <5µm, are deposited
to form the p-n junction and contacts (Fig. 5.8). The finished device can be
assembled with a frame and glass cover to make a panel, as with other flat
plate systems, or used as a surface covering when manufactured as a flexible
film (Fig. 5.9).
Fig. 5.8 (Source: [50]) Fig. 5.9(Source: [51])
The light absorptance of a thin film is higher than crystalline material, while
the relative thinness of the deposited layer offers significant cost savings, not
simply due to the minimal quantities of deposited material being used, but
also through the deposition techniques employed. The energy conversion
efficiency however, is relatively low because of the non-single crystal
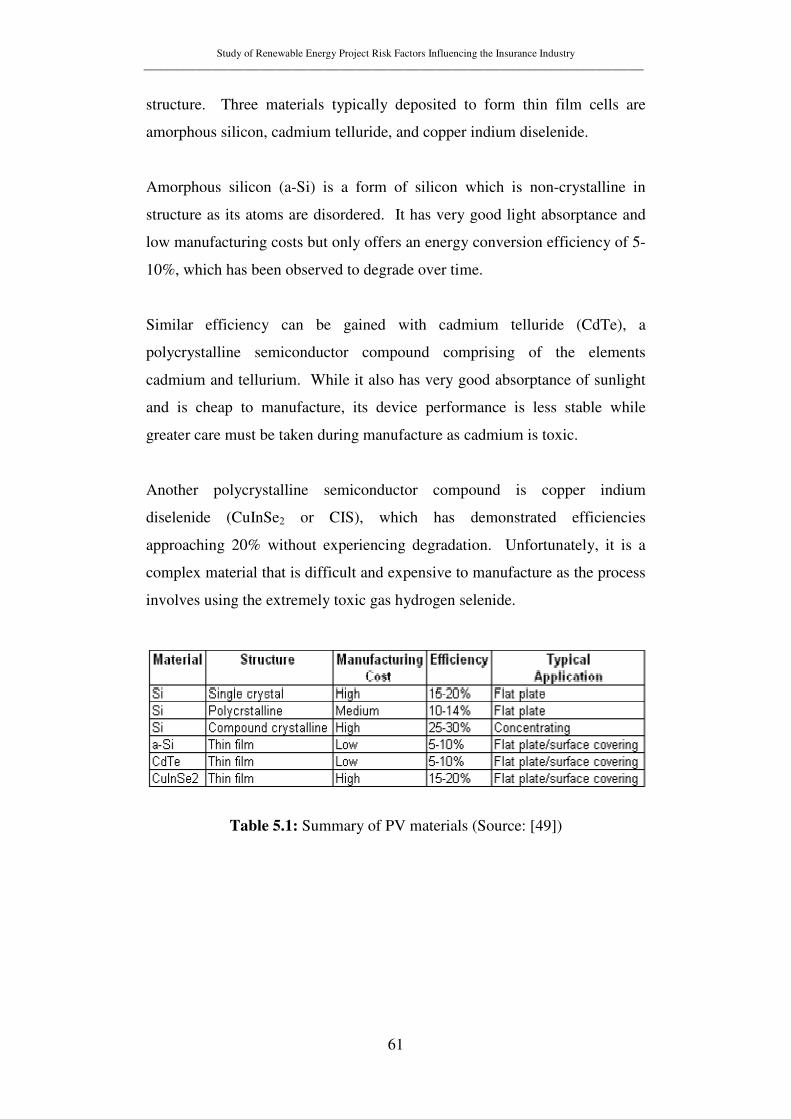
Study of Renewable Energy Project Risk Factors Influencing the Insurance Industry ______________________________________________________________________________________________
61
structure. Three materials typically deposited to form thin film cells are
amorphous silicon, cadmium telluride, and copper indium diselenide.
Amorphous silicon (a-Si) is a form of silicon which is non-crystalline in
structure as its atoms are disordered. It has very good light absorptance and
low manufacturing costs but only offers an energy conversion efficiency of 5-
10%, which has been observed to degrade over time.
Similar efficiency can be gained with cadmium telluride (CdTe), a
polycrystalline semiconductor compound comprising of the elements
cadmium and tellurium. While it also has very good absorptance of sunlight
and is cheap to manufacture, its device performance is less stable while
greater care must be taken during manufacture as cadmium is toxic.
Another polycrystalline semiconductor compound is copper indium
diselenide (CuInSe2 or CIS), which has demonstrated efficiencies
approaching 20% without experiencing degradation. Unfortunately, it is a
complex material that is difficult and expensive to manufacture as the process
involves using the extremely toxic gas hydrogen selenide.
Table 5.1: Summary of PV materials (Source: [49])
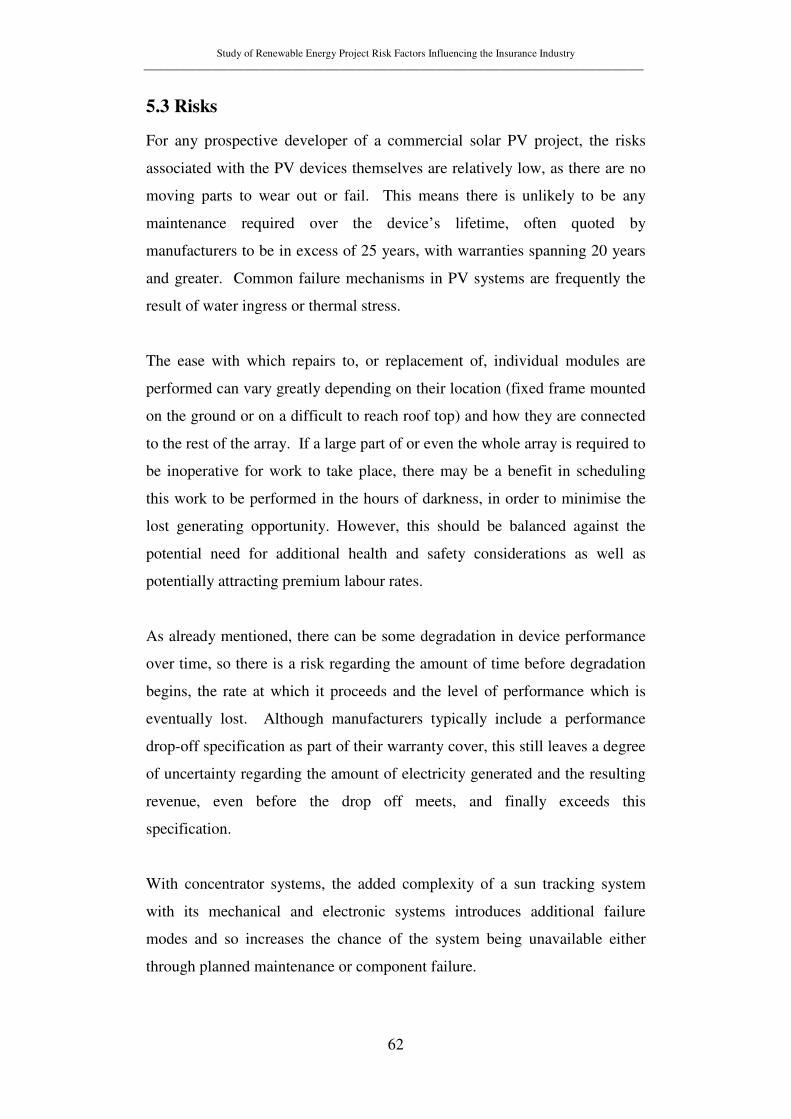
Study of Renewable Energy Project Risk Factors Influencing the Insurance Industry ______________________________________________________________________________________________
62
5.3 Risks
For any prospective developer of a commercial solar PV project, the risks
associated with the PV devices themselves are relatively low, as there are no
moving parts to wear out or fail. This means there is unlikely to be any
maintenance required over the device’s lifetime, often quoted by
manufacturers to be in excess of 25 years, with warranties spanning 20 years
and greater. Common failure mechanisms in PV systems are frequently the
result of water ingress or thermal stress.
The ease with which repairs to, or replacement of, individual modules are
performed can vary greatly depending on their location (fixed frame mounted
on the ground or on a difficult to reach roof top) and how they are connected
to the rest of the array. If a large part of or even the whole array is required to
be inoperative for work to take place, there may be a benefit in scheduling
this work to be performed in the hours of darkness, in order to minimise the
lost generating opportunity. However, this should be balanced against the
potential need for additional health and safety considerations as well as
potentially attracting premium labour rates.
As already mentioned, there can be some degradation in device performance
over time, so there is a risk regarding the amount of time before degradation
begins, the rate at which it proceeds and the level of performance which is
eventually lost. Although manufacturers typically include a performance
drop-off specification as part of their warranty cover, this still leaves a degree
of uncertainty regarding the amount of electricity generated and the resulting
revenue, even before the drop off meets, and finally exceeds this
specification.
With concentrator systems, the added complexity of a sun tracking system
with its mechanical and electronic systems introduces additional failure
modes and so increases the chance of the system being unavailable either
through planned maintenance or component failure.

Study of Renewable Energy Project Risk Factors Influencing the Insurance Industry ______________________________________________________________________________________________
63
Also important for achieving potential PV performance is the need to keep
the front surfaces clean and shadow free to maximise the light incident on the
PV cells. Wind and rain tend to leave surfaces coated with grime, and close
proximity to busy roads or airports increases the chance of oily thin films
forming as a result of exhaust pollution. Even bird fouling could play a
negative role in reducing the amount of light reaching the PV cells so it is
important to employ a rigorous cleaning regime to ensure performance is
maximised. Shadowing can also result from sub-optimal positioning of the
device and even overhanging obstacles such as tree growth over time can lead
to partial shadowing during daylight hours.
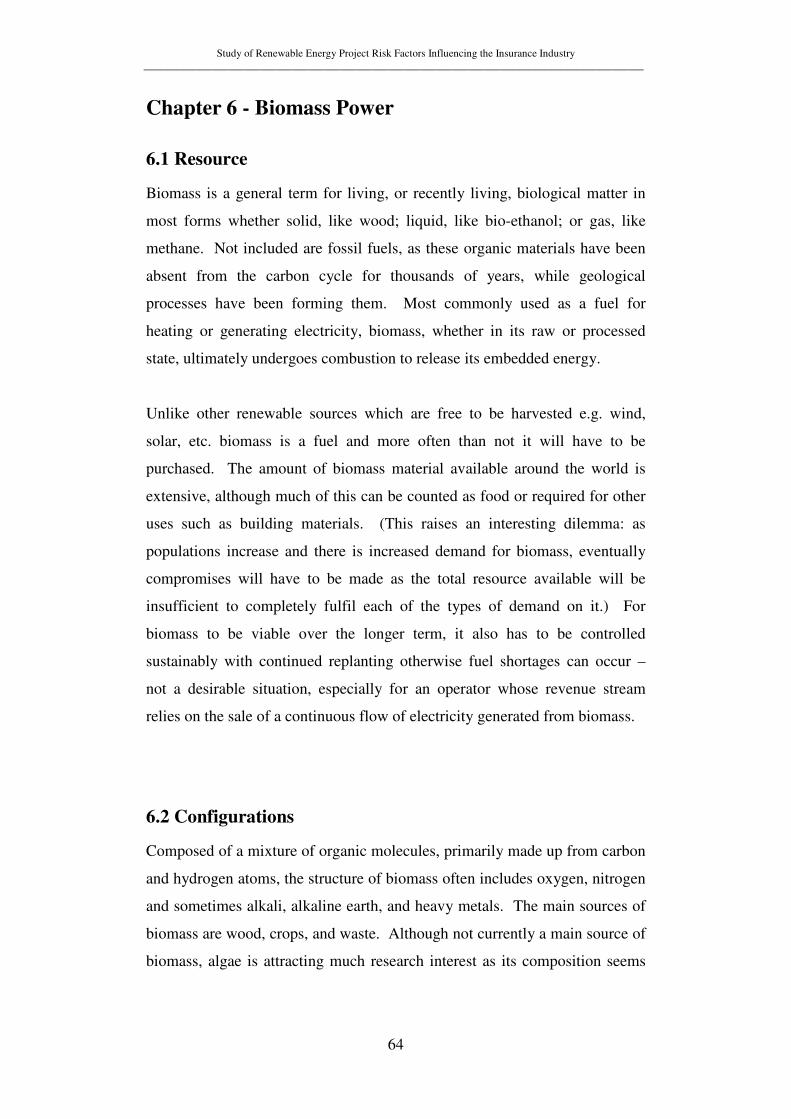
Study of Renewable Energy Project Risk Factors Influencing the Insurance Industry ______________________________________________________________________________________________
64
Chapter 6 - Biomass Power
6.1 Resource
Biomass is a general term for living, or recently living, biological matter in
most forms whether solid, like wood; liquid, like bio-ethanol; or gas, like
methane. Not included are fossil fuels, as these organic materials have been
absent from the carbon cycle for thousands of years, while geological
processes have been forming them. Most commonly used as a fuel for
heating or generating electricity, biomass, whether in its raw or processed
state, ultimately undergoes combustion to release its embedded energy.
Unlike other renewable sources which are free to be harvested e.g. wind,
solar, etc. biomass is a fuel and more often than not it will have to be
purchased. The amount of biomass material available around the world is
extensive, although much of this can be counted as food or required for other
uses such as building materials. (This raises an interesting dilemma: as
populations increase and there is increased demand for biomass, eventually
compromises will have to be made as the total resource available will be
insufficient to completely fulfil each of the types of demand on it.) For
biomass to be viable over the longer term, it also has to be controlled
sustainably with continued replanting otherwise fuel shortages can occur –
not a desirable situation, especially for an operator whose revenue stream
relies on the sale of a continuous flow of electricity generated from biomass.
6.2 Configurations
Composed of a mixture of organic molecules, primarily made up from carbon
and hydrogen atoms, the structure of biomass often includes oxygen, nitrogen
and sometimes alkali, alkaline earth, and heavy metals. The main sources of
biomass are wood, crops, and waste. Although not currently a main source of
biomass, algae is attracting much research interest as its composition seems

Study of Renewable Energy Project Risk Factors Influencing the Insurance Industry ______________________________________________________________________________________________
65
suited to the production of liquid fuels. Transforming biomass to more useful
fuels is achieved either through thermal or biochemical conversion.
Wood can be incinerated directly in large pieces or chipped (Fig. 6.1) to make
smaller ones. Sawdust and waste wood can be reformed into pellets (Fig.
6.2), pucks (Fig. 6.3), and logs to form a material of greater density more
suitable for transportation and feeding thermal generation systems. Although
primarily used for space and water heating on both residential and
commercial scales or for co-firing fossil fuelled systems, it is also possible to
raise steam for powering an engine, which when linked to a generator,
produces electricity. This can be the basis for a combined heat and power
(CHP) scheme serving communities and businesses.
Fig. 6.1: Wood Chips Fig. 6.2: Pellets Fig. 6.3: Pucks
(Source: [52]) (Source: [53]) (Source: [54])
Pulping liquor, sometimes called black liquor, is a by-product of the chemical
breakdown of wood in the pulping and paper industries and is a major source
of energy from wood. In fact many pulp mills have recovery boilers where
the black liquor is burned, generating steam and recovering chemicals, both
of which are re-used in the process. This greatly reduces reliance on other
energy sources while also reducing waste products.
Crops, whether originally grown for food, or energy crops specifically grown
for their energy content, can be incinerated but are usually more suited to the
production of a variety of liquid fuels. Although particularly appropriate in
the transportation sector, liquid bio-fuels also have a role to play in remote

Study of Renewable Energy Project Risk Factors Influencing the Insurance Industry ______________________________________________________________________________________________
66
locations off grid, where engines are used to generate electricity or function
as back-up systems.
Biologically produced alcohols, such as bio-ethanol, can be made from the
fermentation of plant materials containing sugar, typically from sugar or
starch crops such as wheat, sugar beet, sugar cane, and corn. Although it can
be used as a fuel source for internal combustion engines in its own right, bio-
ethanol is widely used as a petrol additive in some countries to increase
octane level and reduce emissions.
Two forms of diesel can be extracted from crops possessing high oil content
such as rape seed, jatropha, soy, and sunflower. Green diesel is produced
when the extracted plant oils undergo the same fractional distillation process
used for fossil fuel oil separation. This results in green diesel being a very
similar product to fossil fuel sourced, or mineral, diesel and it can be
combusted in a standard diesel engine without modification.
Biodiesel, however, comes from plant oils or animal fats which experience
transesterification, resulting in a product similar in composition to petroleum
diesel but with some stark differences. It is readily biodegradable, has low
toxicity, and a much higher flashpoint. 100% pure biodiesel (B100) can be
used in conventional diesel engines, however more modern common rail
systems can only operate correctly with biodiesel if it is blended first with
mineral diesel.
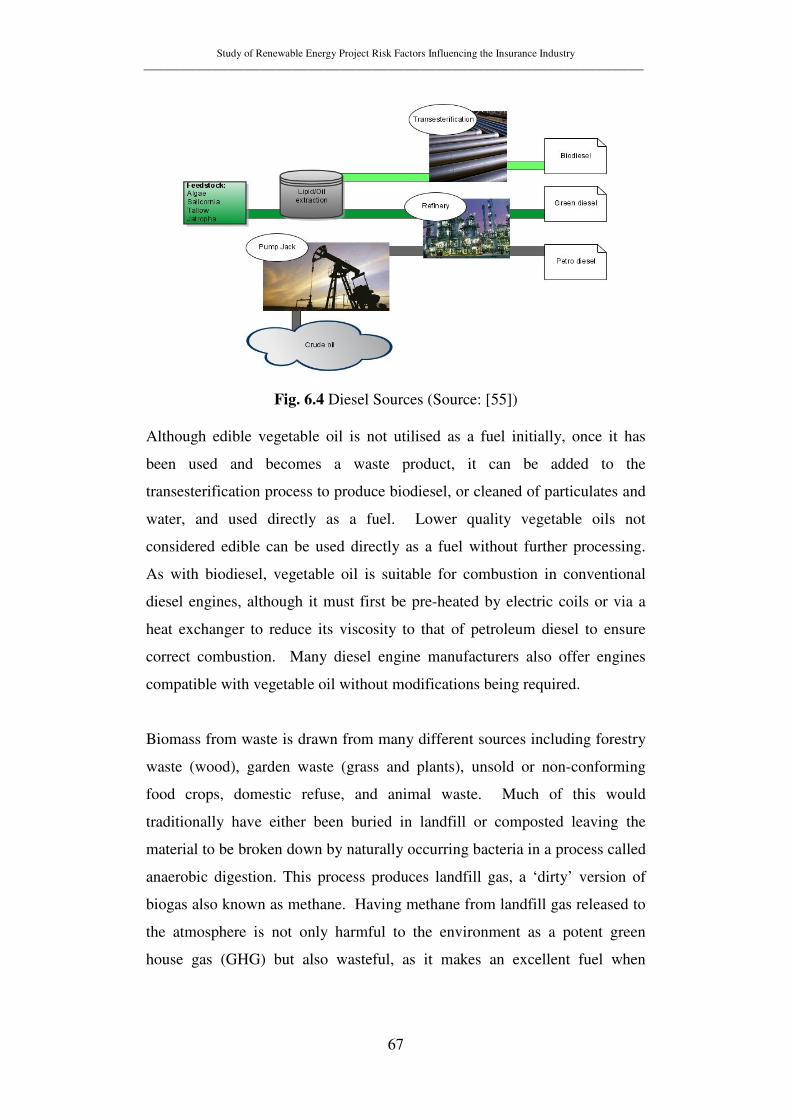
Study of Renewable Energy Project Risk Factors Influencing the Insurance Industry ______________________________________________________________________________________________
67
Fig. 6.4 Diesel Sources (Source: [55])
Although edible vegetable oil is not utilised as a fuel initially, once it has
been used and becomes a waste product, it can be added to the
transesterification process to produce biodiesel, or cleaned of particulates and
water, and used directly as a fuel. Lower quality vegetable oils not
considered edible can be used directly as a fuel without further processing.
As with biodiesel, vegetable oil is suitable for combustion in conventional
diesel engines, although it must first be pre-heated by electric coils or via a
heat exchanger to reduce its viscosity to that of petroleum diesel to ensure
correct combustion. Many diesel engine manufacturers also offer engines
compatible with vegetable oil without modifications being required.
Biomass from waste is drawn from many different sources including forestry
waste (wood), garden waste (grass and plants), unsold or non-conforming
food crops, domestic refuse, and animal waste. Much of this would
traditionally have either been buried in landfill or composted leaving the
material to be broken down by naturally occurring bacteria in a process called
anaerobic digestion. This process produces landfill gas, a ‘dirty’ version of
biogas also known as methane. Having methane from landfill gas released to
the atmosphere is not only harmful to the environment as a potent green
house gas (GHG) but also wasteful, as it makes an excellent fuel when
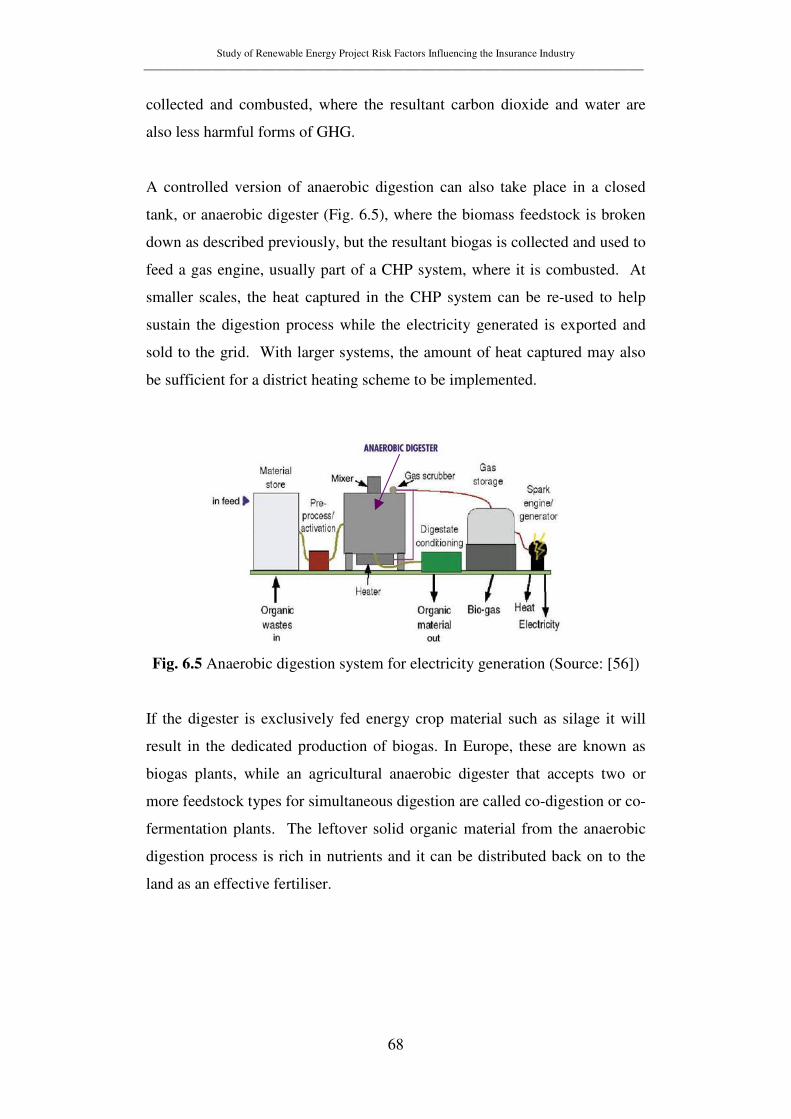
Study of Renewable Energy Project Risk Factors Influencing the Insurance Industry ______________________________________________________________________________________________
68
collected and combusted, where the resultant carbon dioxide and water are
also less harmful forms of GHG.
A controlled version of anaerobic digestion can also take place in a closed
tank, or anaerobic digester (Fig. 6.5), where the biomass feedstock is broken
down as described previously, but the resultant biogas is collected and used to
feed a gas engine, usually part of a CHP system, where it is combusted. At
smaller scales, the heat captured in the CHP system can be re-used to help
sustain the digestion process while the electricity generated is exported and
sold to the grid. With larger systems, the amount of heat captured may also
be sufficient for a district heating scheme to be implemented.
Fig. 6.5 Anaerobic digestion system for electricity generation (Source: [56])
If the digester is exclusively fed energy crop material such as silage it will
result in the dedicated production of biogas. In Europe, these are known as
biogas plants, while an agricultural anaerobic digester that accepts two or
more feedstock types for simultaneous digestion are called co-digestion or co-
fermentation plants. The leftover solid organic material from the anaerobic
digestion process is rich in nutrients and it can be distributed back on to the
land as an effective fertiliser.
Study of Renewable Energy Project Risk Factors Influencing the Insurance Industry ______________________________________________________________________________________________
69
6.3 Risks
As with fossil fuels, the supply of biomass for a project has to be secured,
leading to a biomass market being created. All scales and types of biomass
technology rely on a steady flow of biomass throughout the year which can
prove difficult to achieve as the amounts of grown biomass materials and
waste change throughout the year. Crop volumes need to be properly planned
to minimise the chance of shortages while other elements such as food crop
waste are highly variable from year to year. With this area of renewables yet
to become widespread, there doesn’t appear to be a problem securing
feedstock, but as the sector expands there will be much higher levels of
demand, driving prices up. The importance of sustainable management
becomes crucial to prevent shortages and interruption to the production of
fuels, heat and electricity.
The quality of raw biomass feedstock is also variable in a number of different
ways such as energy content, material composition, moisture content, and the
presence of foreign matter. Where biomass is directly incinerated, the
amount of energy released per tonne will change with material type and
moisture content, leading to varying rates of consumption, temperature of
incineration, and efficiency. All of these create uncertainty about the
purchase and delivery of the feedstock and the amounts of heat and electricity
produced.
For liquid bio-fuels the composition of the crop is important as this
determines how much oil can be extracted per tonne and even for a particular
plant species the oil content will vary depending on the type of soil and the
weather experienced while growing.
With anaerobic digestion, material composition varies the digestion rate
achieved and the amount of foreign matter present can, depending on type,
work to suppress the digestion process, slowing the rate of biogas production.
Study of Renewable Energy Project Risk Factors Influencing the Insurance Industry ______________________________________________________________________________________________
70
Equipment concerns centre on the mechanical systems in use for chopping
biomass into smaller pieces, feeding the incinerator, press, or digester, mixing
digestate, pumping fluids and gases, and the different engines which can be
used for combustion of the biofuels. These are naturally subject to a range of
typical wear and failure modes and are therefore open to resultant safety risks,
and down time (income) losses associated with maintenance, repair and
replacement of parts.
Incineration of solid biomass carries a fire risk where incidents of fire
spreading from the furnace back up the feeding mechanism are not unknown.
When liquid and gas bio-fuels are being produced there exists an inherent fire
and explosion risk due to their volatility, therefore high safety standards must
be met and maintained in order to prevent accidents from occurring.
Measures such as having a flare stack for burning off biogas in the event of an
emergency to prevent an explosion are required to make the operation of
these facilities safe.
Study of Renewable Energy Project Risk Factors Influencing the Insurance Industry ______________________________________________________________________________________________
71
Chapter 7 - Wave Power
7.1 Resource
The impact of wind (itself a result of solar energy heating areas of the Earth
and causing convection currents) moving across open water, gives rise to the
formation of waves. The extraction of the energy possessed by waves and its
conversion to electricity can be achieved in a number of different ways.
Although work in this area has been ongoing for some time with many
prototype devices being demonstrated, there has yet to be a larger scale
deployment of a particular technology.
Worldwide, the amount of power, or wave energy flux, carried by waves is
immense, with many locations yielding averages in excess of 60 kW/m of
wave front (Fig.7.1) with some locations approaching 100 kW/m also
observed.[57] Being located on the edge of the North Atlantic Ocean, the UK
not only lies in an area with a wealth of available wave resource, but also in
being an island, has a long coastline providing good access to the sea, unlike
other countries which are part of a larger landmass and have limited coastal
area access. For these reasons, Scotland in particular offers developers a
sufficient amount of resource to make future commercial electricity
generation from wave power possible, although currently it is not cost
competitive with other renewable technologies.
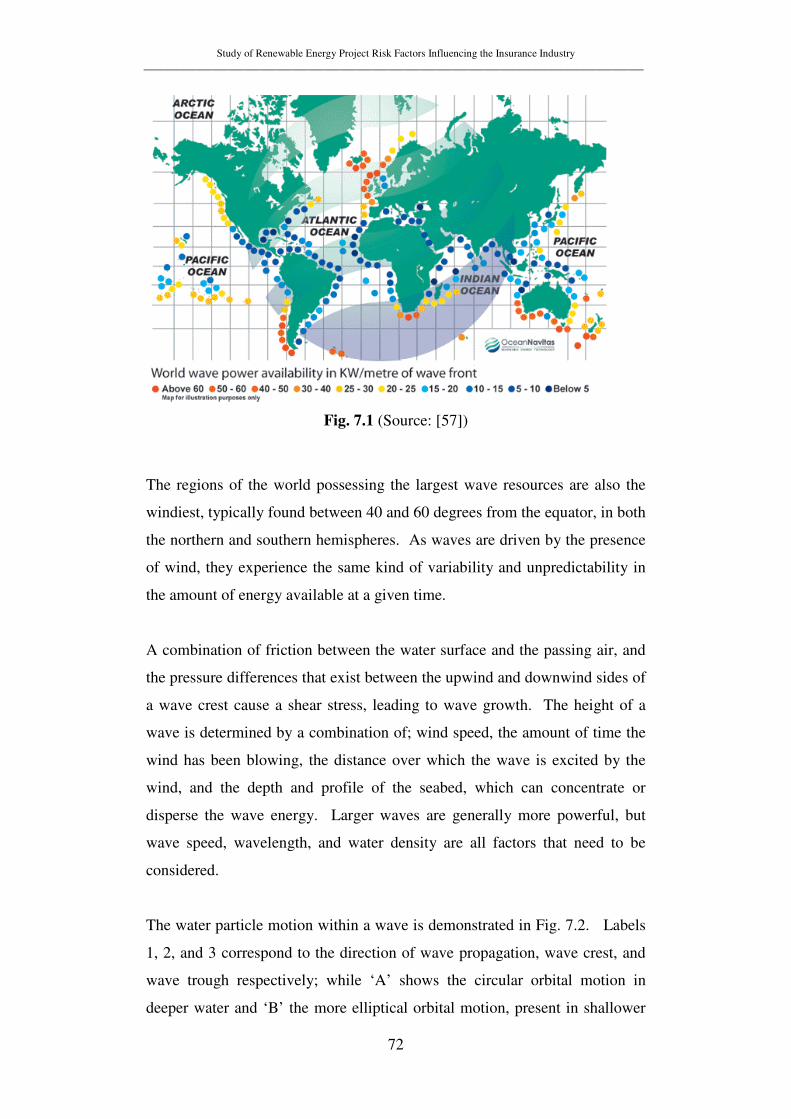
Study of Renewable Energy Project Risk Factors Influencing the Insurance Industry ______________________________________________________________________________________________
72
Fig. 7.1 (Source: [57])
The regions of the world possessing the largest wave resources are also the
windiest, typically found between 40 and 60 degrees from the equator, in both
the northern and southern hemispheres. As waves are driven by the presence
of wind, they experience the same kind of variability and unpredictability in
the amount of energy available at a given time.
A combination of friction between the water surface and the passing air, and
the pressure differences that exist between the upwind and downwind sides of
a wave crest cause a shear stress, leading to wave growth. The height of a
wave is determined by a combination of; wind speed, the amount of time the
wind has been blowing, the distance over which the wave is excited by the
wind, and the depth and profile of the seabed, which can concentrate or
disperse the wave energy. Larger waves are generally more powerful, but
wave speed, wavelength, and water density are all factors that need to be
considered.
The water particle motion within a wave is demonstrated in Fig. 7.2. Labels
1, 2, and 3 correspond to the direction of wave propagation, wave crest, and
wave trough respectively; while ‘A’ shows the circular orbital motion in
deeper water and ‘B’ the more elliptical orbital motion, present in shallower
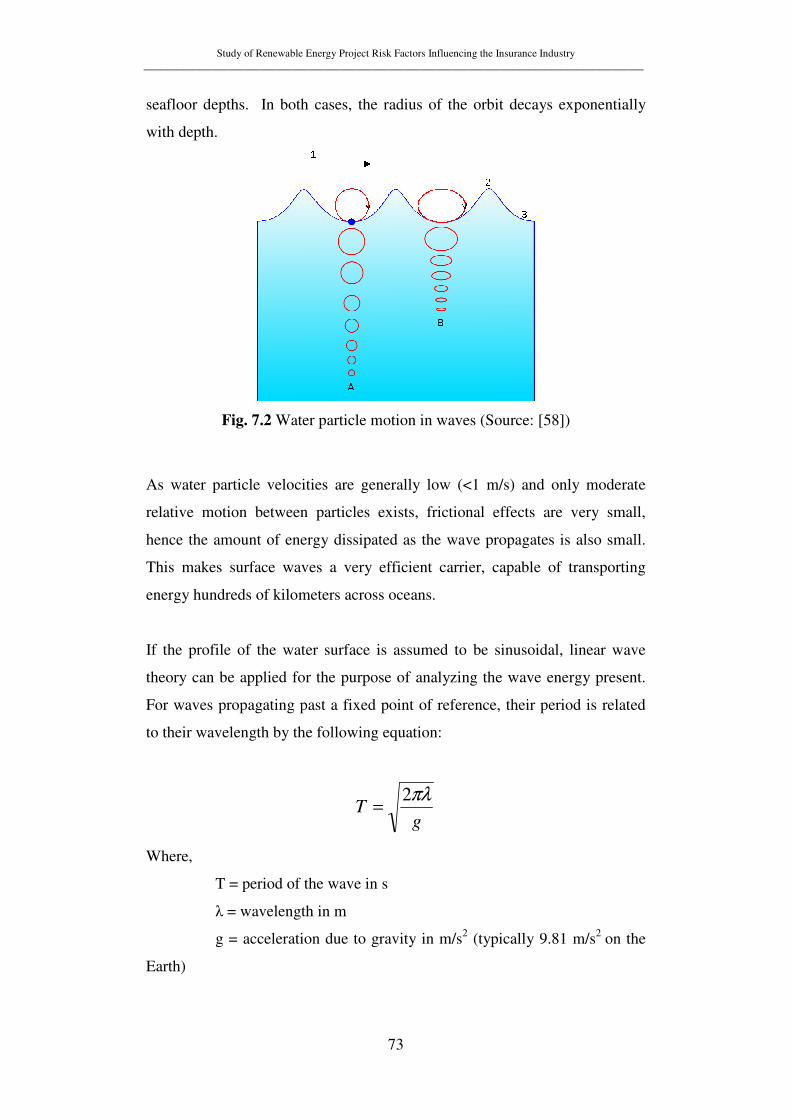
Study of Renewable Energy Project Risk Factors Influencing the Insurance Industry ______________________________________________________________________________________________
73
seafloor depths. In both cases, the radius of the orbit decays exponentially
with depth.
Fig. 7.2 Water particle motion in waves (Source: [58])
As water particle velocities are generally low (<1 m/s) and only moderate
relative motion between particles exists, frictional effects are very small,
hence the amount of energy dissipated as the wave propagates is also small.
This makes surface waves a very efficient carrier, capable of transporting
energy hundreds of kilometers across oceans.
If the profile of the water surface is assumed to be sinusoidal, linear wave
theory can be applied for the purpose of analyzing the wave energy present.
For waves propagating past a fixed point of reference, their period is related
to their wavelength by the following equation:
gT
πλ2=
Where,
T = period of the wave in s
λ = wavelength in m
g = acceleration due to gravity in m/s2 (typically 9.81 m/s2 on the
Earth)
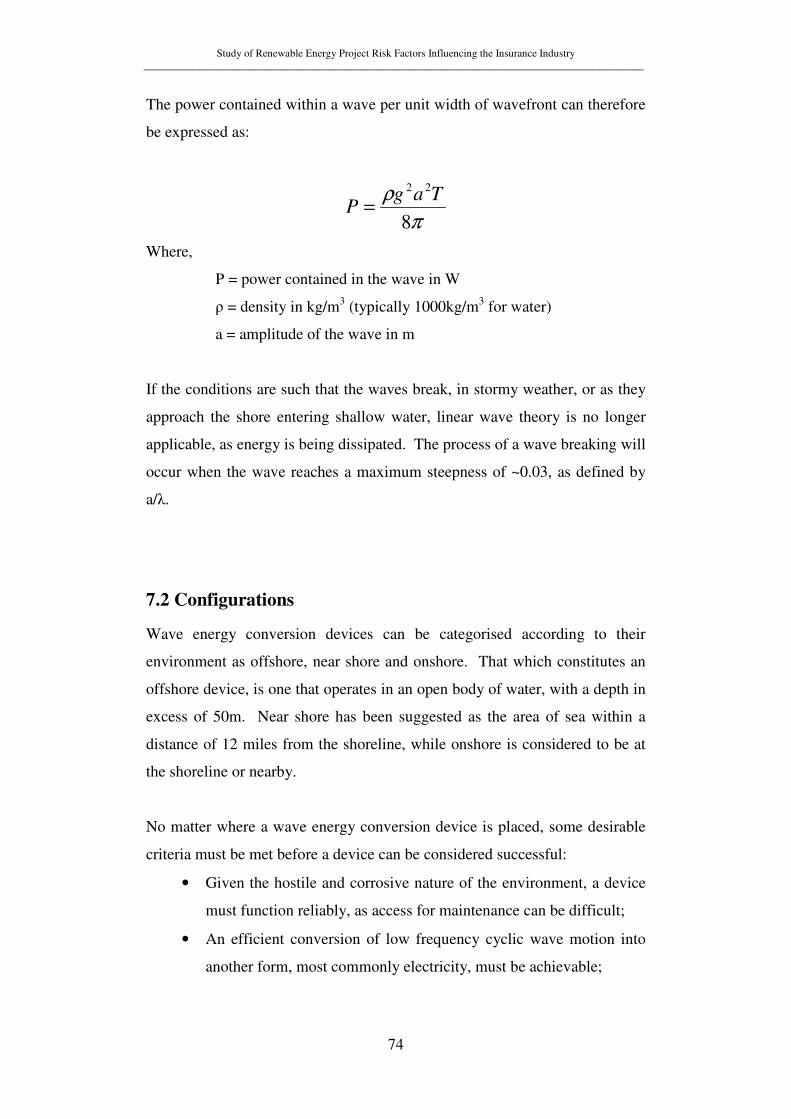
Study of Renewable Energy Project Risk Factors Influencing the Insurance Industry ______________________________________________________________________________________________
74
The power contained within a wave per unit width of wavefront can therefore
be expressed as:
π
ρ
8
22 TagP =
Where,
P = power contained in the wave in W
ρ = density in kg/m3 (typically 1000kg/m3 for water)
a = amplitude of the wave in m
If the conditions are such that the waves break, in stormy weather, or as they
approach the shore entering shallow water, linear wave theory is no longer
applicable, as energy is being dissipated. The process of a wave breaking will
occur when the wave reaches a maximum steepness of ~0.03, as defined by
a/λ.
7.2 Configurations
Wave energy conversion devices can be categorised according to their
environment as offshore, near shore and onshore. That which constitutes an
offshore device, is one that operates in an open body of water, with a depth in
excess of 50m. Near shore has been suggested as the area of sea within a
distance of 12 miles from the shoreline, while onshore is considered to be at
the shoreline or nearby.
No matter where a wave energy conversion device is placed, some desirable
criteria must be met before a device can be considered successful:
• Given the hostile and corrosive nature of the environment, a device
must function reliably, as access for maintenance can be difficult;
• An efficient conversion of low frequency cyclic wave motion into
another form, most commonly electricity, must be achievable;
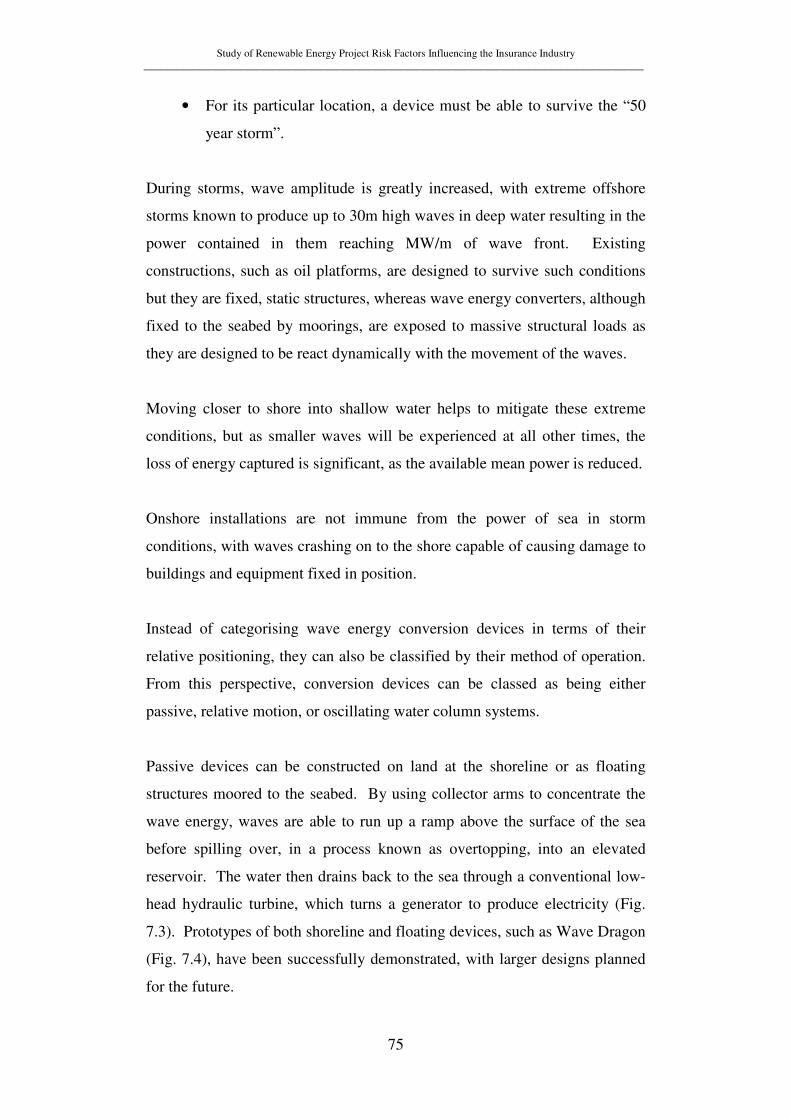
Study of Renewable Energy Project Risk Factors Influencing the Insurance Industry ______________________________________________________________________________________________
75
• For its particular location, a device must be able to survive the “50
year storm”.
During storms, wave amplitude is greatly increased, with extreme offshore
storms known to produce up to 30m high waves in deep water resulting in the
power contained in them reaching MW/m of wave front. Existing
constructions, such as oil platforms, are designed to survive such conditions
but they are fixed, static structures, whereas wave energy converters, although
fixed to the seabed by moorings, are exposed to massive structural loads as
they are designed to be react dynamically with the movement of the waves.
Moving closer to shore into shallow water helps to mitigate these extreme
conditions, but as smaller waves will be experienced at all other times, the
loss of energy captured is significant, as the available mean power is reduced.
Onshore installations are not immune from the power of sea in storm
conditions, with waves crashing on to the shore capable of causing damage to
buildings and equipment fixed in position.
Instead of categorising wave energy conversion devices in terms of their
relative positioning, they can also be classified by their method of operation.
From this perspective, conversion devices can be classed as being either
passive, relative motion, or oscillating water column systems.
Passive devices can be constructed on land at the shoreline or as floating
structures moored to the seabed. By using collector arms to concentrate the
wave energy, waves are able to run up a ramp above the surface of the sea
before spilling over, in a process known as overtopping, into an elevated
reservoir. The water then drains back to the sea through a conventional low-
head hydraulic turbine, which turns a generator to produce electricity (Fig.
7.3). Prototypes of both shoreline and floating devices, such as Wave Dragon
(Fig. 7.4), have been successfully demonstrated, with larger designs planned
for the future.
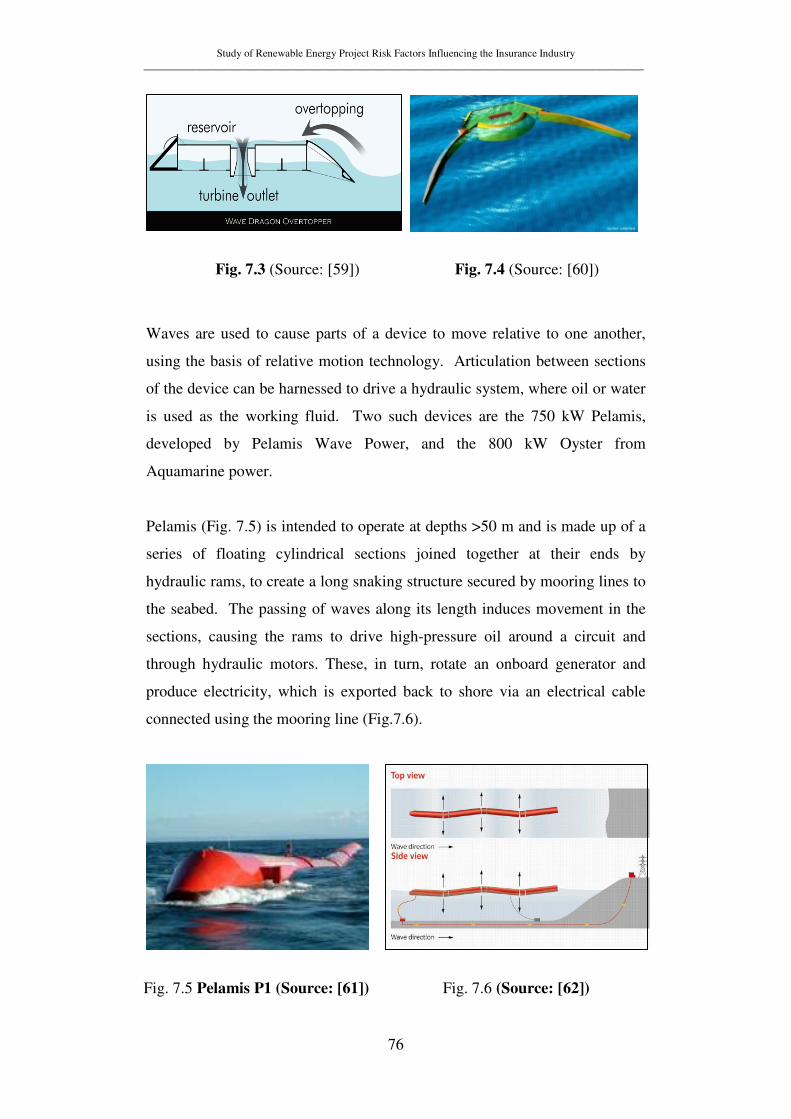
Study of Renewable Energy Project Risk Factors Influencing the Insurance Industry ______________________________________________________________________________________________
76
Fig. 7.3 (Source: [59]) Fig. 7.4 (Source: [60])
Waves are used to cause parts of a device to move relative to one another,
using the basis of relative motion technology. Articulation between sections
of the device can be harnessed to drive a hydraulic system, where oil or water
is used as the working fluid. Two such devices are the 750 kW Pelamis,
developed by Pelamis Wave Power, and the 800 kW Oyster from
Aquamarine power.
Pelamis (Fig. 7.5) is intended to operate at depths >50 m and is made up of a
series of floating cylindrical sections joined together at their ends by
hydraulic rams, to create a long snaking structure secured by mooring lines to
the seabed. The passing of waves along its length induces movement in the
sections, causing the rams to drive high-pressure oil around a circuit and
through hydraulic motors. These, in turn, rotate an onboard generator and
produce electricity, which is exported back to shore via an electrical cable
connected using the mooring line (Fig.7.6).
Fig. 7.5 Pelamis P1 (Source: [61]) Fig. 7.6 (Source: [62])
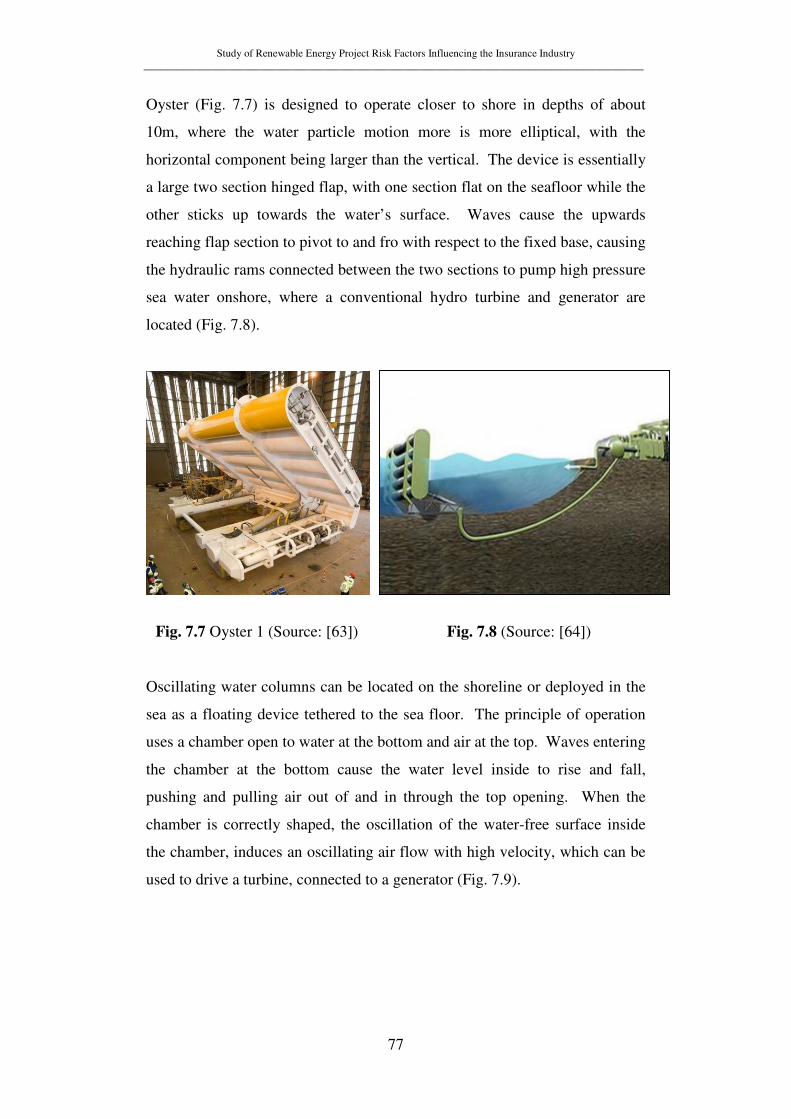
Study of Renewable Energy Project Risk Factors Influencing the Insurance Industry ______________________________________________________________________________________________
77
Oyster (Fig. 7.7) is designed to operate closer to shore in depths of about
10m, where the water particle motion more is more elliptical, with the
horizontal component being larger than the vertical. The device is essentially
a large two section hinged flap, with one section flat on the seafloor while the
other sticks up towards the water’s surface. Waves cause the upwards
reaching flap section to pivot to and fro with respect to the fixed base, causing
the hydraulic rams connected between the two sections to pump high pressure
sea water onshore, where a conventional hydro turbine and generator are
located (Fig. 7.8).
Fig. 7.7 Oyster 1 (Source: [63]) Fig. 7.8 (Source: [64])
Oscillating water columns can be located on the shoreline or deployed in the
sea as a floating device tethered to the sea floor. The principle of operation
uses a chamber open to water at the bottom and air at the top. Waves entering
the chamber at the bottom cause the water level inside to rise and fall,
pushing and pulling air out of and in through the top opening. When the
chamber is correctly shaped, the oscillation of the water-free surface inside
the chamber, induces an oscillating air flow with high velocity, which can be
used to drive a turbine, connected to a generator (Fig. 7.9).
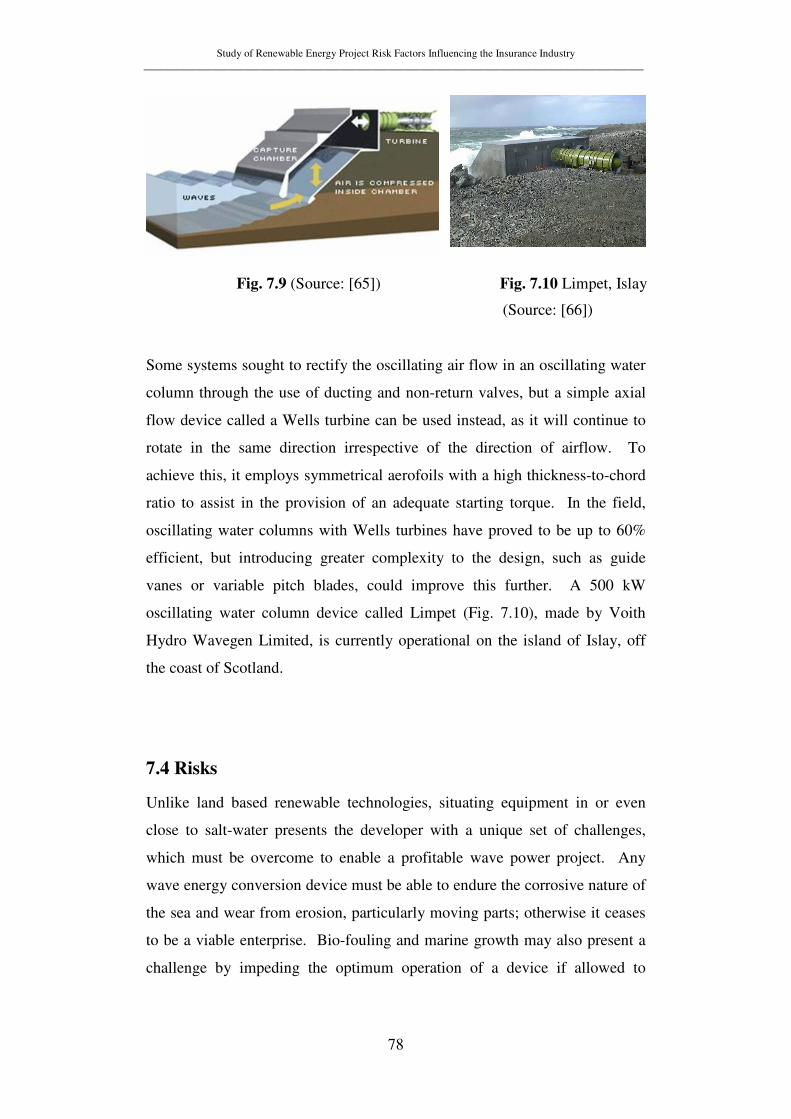
Study of Renewable Energy Project Risk Factors Influencing the Insurance Industry ______________________________________________________________________________________________
78
Fig. 7.9 (Source: [65]) Fig. 7.10 Limpet, Islay
(Source: [66])
Some systems sought to rectify the oscillating air flow in an oscillating water
column through the use of ducting and non-return valves, but a simple axial
flow device called a Wells turbine can be used instead, as it will continue to
rotate in the same direction irrespective of the direction of airflow. To
achieve this, it employs symmetrical aerofoils with a high thickness-to-chord
ratio to assist in the provision of an adequate starting torque. In the field,
oscillating water columns with Wells turbines have proved to be up to 60%
efficient, but introducing greater complexity to the design, such as guide
vanes or variable pitch blades, could improve this further. A 500 kW
oscillating water column device called Limpet (Fig. 7.10), made by Voith
Hydro Wavegen Limited, is currently operational on the island of Islay, off
the coast of Scotland.
7.4 Risks
Unlike land based renewable technologies, situating equipment in or even
close to salt-water presents the developer with a unique set of challenges,
which must be overcome to enable a profitable wave power project. Any
wave energy conversion device must be able to endure the corrosive nature of
the sea and wear from erosion, particularly moving parts; otherwise it ceases
to be a viable enterprise. Bio-fouling and marine growth may also present a
challenge by impeding the optimum operation of a device if allowed to
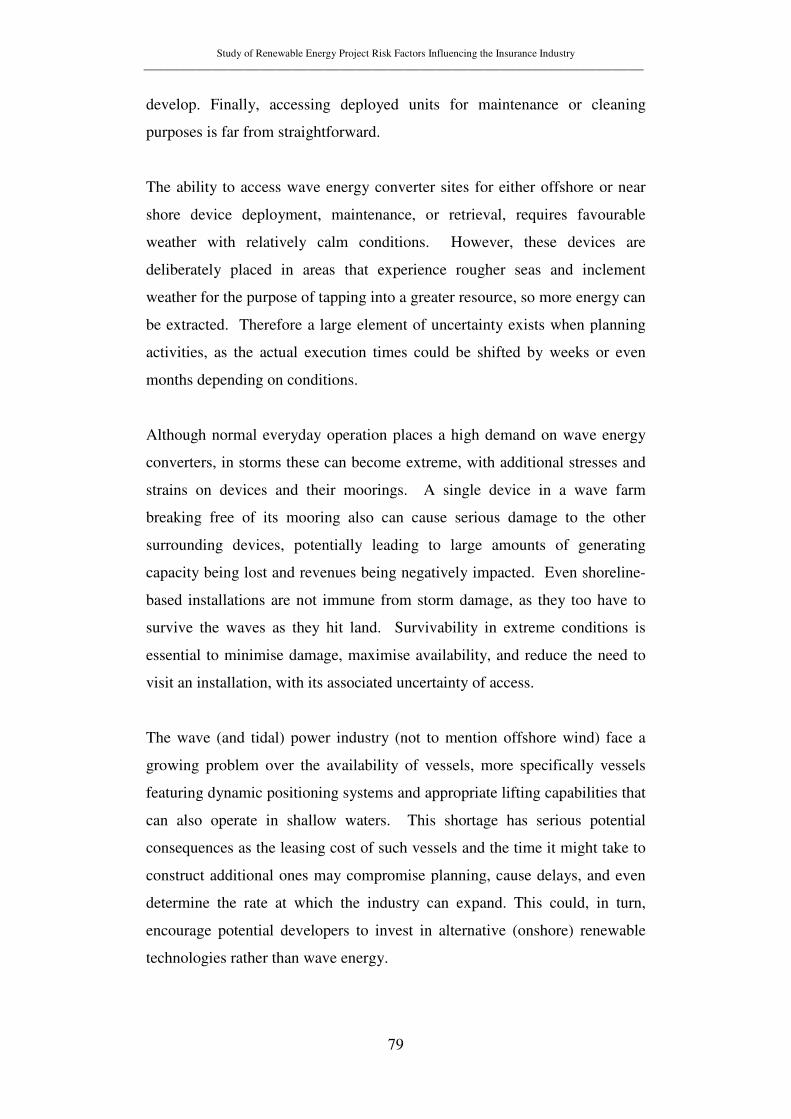
Study of Renewable Energy Project Risk Factors Influencing the Insurance Industry ______________________________________________________________________________________________
79
develop. Finally, accessing deployed units for maintenance or cleaning
purposes is far from straightforward.
The ability to access wave energy converter sites for either offshore or near
shore device deployment, maintenance, or retrieval, requires favourable
weather with relatively calm conditions. However, these devices are
deliberately placed in areas that experience rougher seas and inclement
weather for the purpose of tapping into a greater resource, so more energy can
be extracted. Therefore a large element of uncertainty exists when planning
activities, as the actual execution times could be shifted by weeks or even
months depending on conditions.
Although normal everyday operation places a high demand on wave energy
converters, in storms these can become extreme, with additional stresses and
strains on devices and their moorings. A single device in a wave farm
breaking free of its mooring also can cause serious damage to the other
surrounding devices, potentially leading to large amounts of generating
capacity being lost and revenues being negatively impacted. Even shoreline-
based installations are not immune from storm damage, as they too have to
survive the waves as they hit land. Survivability in extreme conditions is
essential to minimise damage, maximise availability, and reduce the need to
visit an installation, with its associated uncertainty of access.
The wave (and tidal) power industry (not to mention offshore wind) face a
growing problem over the availability of vessels, more specifically vessels
featuring dynamic positioning systems and appropriate lifting capabilities that
can also operate in shallow waters. This shortage has serious potential
consequences as the leasing cost of such vessels and the time it might take to
construct additional ones may compromise planning, cause delays, and even
determine the rate at which the industry can expand. This could, in turn,
encourage potential developers to invest in alternative (onshore) renewable
technologies rather than wave energy.

Study of Renewable Energy Project Risk Factors Influencing the Insurance Industry ______________________________________________________________________________________________
80
The effects of large-scale device deployment on marine ecosystems are not
well understood and although it is acknowledged that initial installation does
disturb the seabed benthos, it appears to recover and even thrives on man-
made constructions. Other disturbances that might be caused by installed
devices, such as sub-sea noise, are also poorly understood at this time.
Should future research uncover undeniable evidence of permanent damage to
marine ecosystems, future implementation of projects could be compromised.
Positioning wave energy converters in the sea has consequences for shipping,
fishing and even recreation, as a navigational hazard. These areas will often
no longer be accessible, potentially leading to shipping channels being re-
routed, fishing grounds being closed, and recreational activities disrupted,
with a possible impact on tourism. All of these could prove costly to local
economies, despite the fact that marine life may actually flourish in the
excluded areas.
Near shore and onshore projects are more likely to see public opposition, as
they are more visible than offshore projects and alter the look of the
environment as seen from dry land. This, together with the construction of
additional grid infrastructure to reach coastlines could complicate planning
applications and delay the start-up of wave power projects, in a manner
similar to that seen already with wind power.
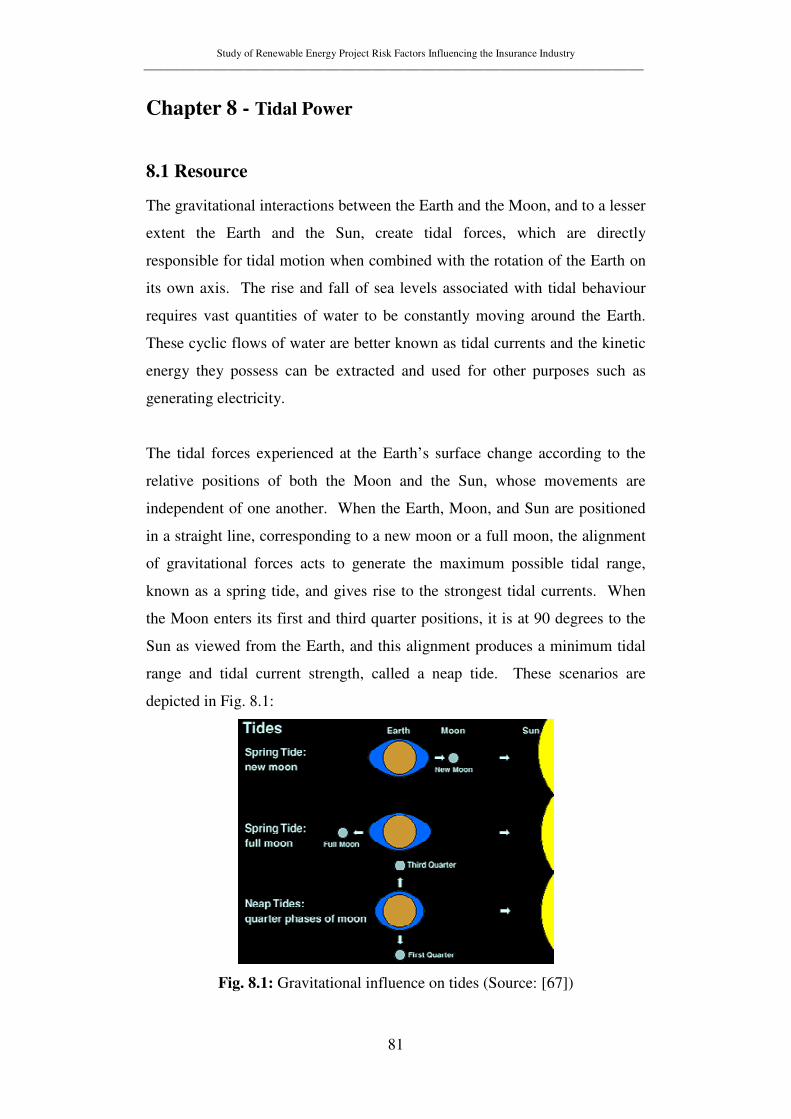
Study of Renewable Energy Project Risk Factors Influencing the Insurance Industry ______________________________________________________________________________________________
81
Chapter 8 - Tidal Power
8.1 Resource
The gravitational interactions between the Earth and the Moon, and to a lesser
extent the Earth and the Sun, create tidal forces, which are directly
responsible for tidal motion when combined with the rotation of the Earth on
its own axis. The rise and fall of sea levels associated with tidal behaviour
requires vast quantities of water to be constantly moving around the Earth.
These cyclic flows of water are better known as tidal currents and the kinetic
energy they possess can be extracted and used for other purposes such as
generating electricity.
The tidal forces experienced at the Earth’s surface change according to the
relative positions of both the Moon and the Sun, whose movements are
independent of one another. When the Earth, Moon, and Sun are positioned
in a straight line, corresponding to a new moon or a full moon, the alignment
of gravitational forces acts to generate the maximum possible tidal range,
known as a spring tide, and gives rise to the strongest tidal currents. When
the Moon enters its first and third quarter positions, it is at 90 degrees to the
Sun as viewed from the Earth, and this alignment produces a minimum tidal
range and tidal current strength, called a neap tide. These scenarios are
depicted in Fig. 8.1:
Fig. 8.1: Gravitational influence on tides (Source: [67])
Study of Renewable Energy Project Risk Factors Influencing the Insurance Industry ______________________________________________________________________________________________
82
As the movements and relative positions of the Moon and the Sun are well
understood, so is the behaviour and predictability of the tides, with most
locations experiencing semidiurnal tidal behaviour, meaning two high tides
and two low tides every twenty-four hours.
There are two methods of harnessing tidal behaviour; with the first making
use of the velocity of a tidal flow of water to cause the mechanical movement
of a machine, usually then converted to electricity. The second makes use of
large tidal ranges in geographically suitable areas, where a barrage can be
inserted between the open sea and a closed basin, for the purpose of
extracting energy as water enters or leaves the basin. The main difference
with the barrage scheme is that it allows the flows of water to be controlled
and enables a head of water to be built up on one side of the barrage
compared to the other, thus making use of gained potential energy in a
manner similar to a hydro scheme.
Although there are relatively few viable sites worldwide, extremely high civil
engineering costs, and environmental issues, mean tidal barrage schemes are
typically only undertaken when there is a high degree of government backing
due to the scale of such endeavours. Without governmental investment and
support, tidal barrage systems become less appealing to developers as the
construction period is lengthy and expensive with far reaching environmental
impacts. This lack of developer interest at present means tidal barrage will
not be considered further in this section.
The velocity of a tidal current is determined by the positioning of landmasses
and the channel created with the seabed. The highest velocities are localised
and produced when tidal effects force water through a channel. A map of the
UK showing spring tide peak flow speeds can be seen in Fig. 8.2 below:
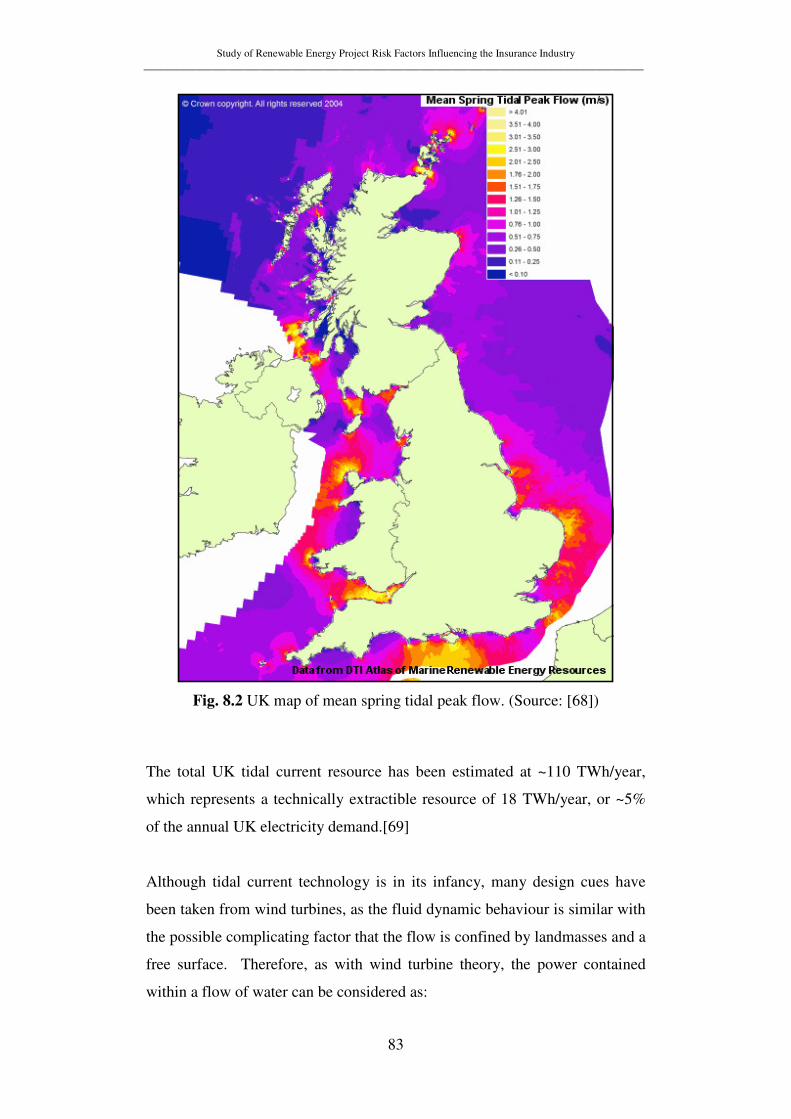
Study of Renewable Energy Project Risk Factors Influencing the Insurance Industry ______________________________________________________________________________________________
83
Fig. 8.2 UK map of mean spring tidal peak flow. (Source: [68])
The total UK tidal current resource has been estimated at ~110 TWh/year,
which represents a technically extractible resource of 18 TWh/year, or ~5%
of the annual UK electricity demand.[69]
Although tidal current technology is in its infancy, many design cues have
been taken from wind turbines, as the fluid dynamic behaviour is similar with
the possible complicating factor that the flow is confined by landmasses and a
free surface. Therefore, as with wind turbine theory, the power contained
within a flow of water can be considered as:
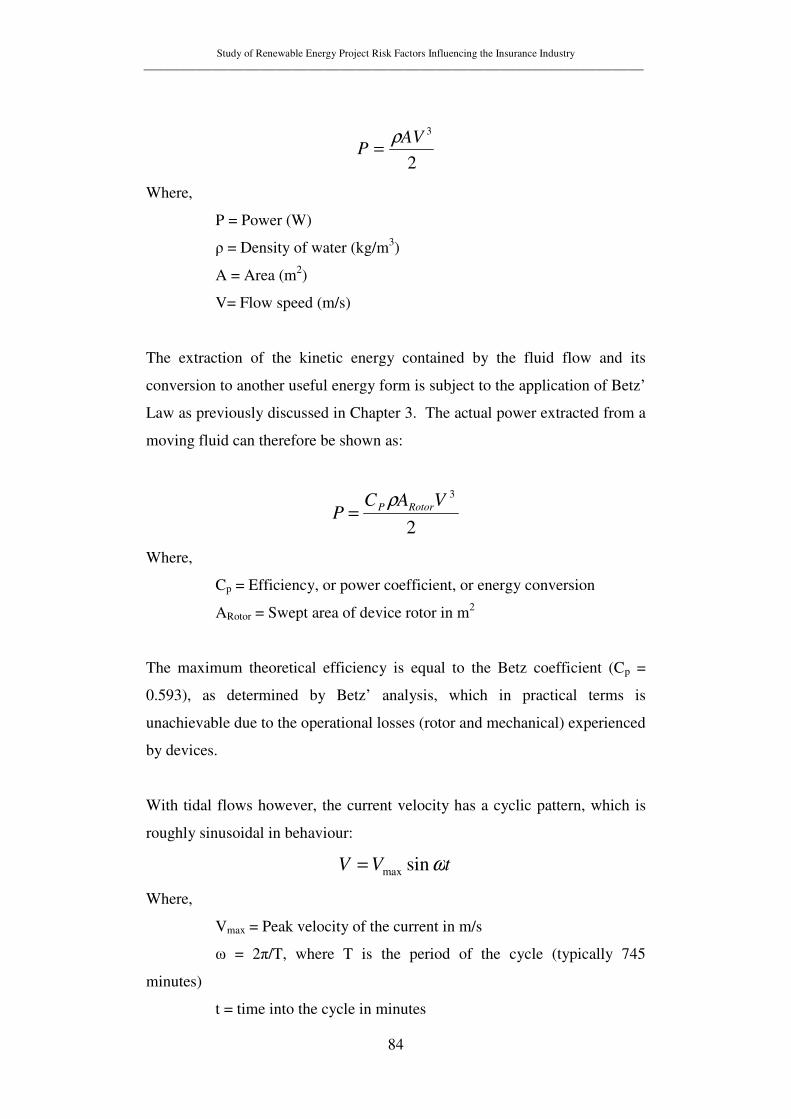
Study of Renewable Energy Project Risk Factors Influencing the Insurance Industry ______________________________________________________________________________________________
84
2
3AV
Pρ
=
Where,
P = Power (W)
ρ = Density of water (kg/m3)
A = Area (m2)
V= Flow speed (m/s)
The extraction of the kinetic energy contained by the fluid flow and its
conversion to another useful energy form is subject to the application of Betz’
Law as previously discussed in Chapter 3. The actual power extracted from a
moving fluid can therefore be shown as:
2
3VACP RotorP ρ
=
Where,
Cp = Efficiency, or power coefficient, or energy conversion
ARotor = Swept area of device rotor in m2
The maximum theoretical efficiency is equal to the Betz coefficient (Cp =
0.593), as determined by Betz’ analysis, which in practical terms is
unachievable due to the operational losses (rotor and mechanical) experienced
by devices.
With tidal flows however, the current velocity has a cyclic pattern, which is
roughly sinusoidal in behaviour:
tVV ωsinmax=
Where,
Vmax = Peak velocity of the current in m/s
ω = 2π/T, where T is the period of the cycle (typically 745
minutes)
t = time into the cycle in minutes
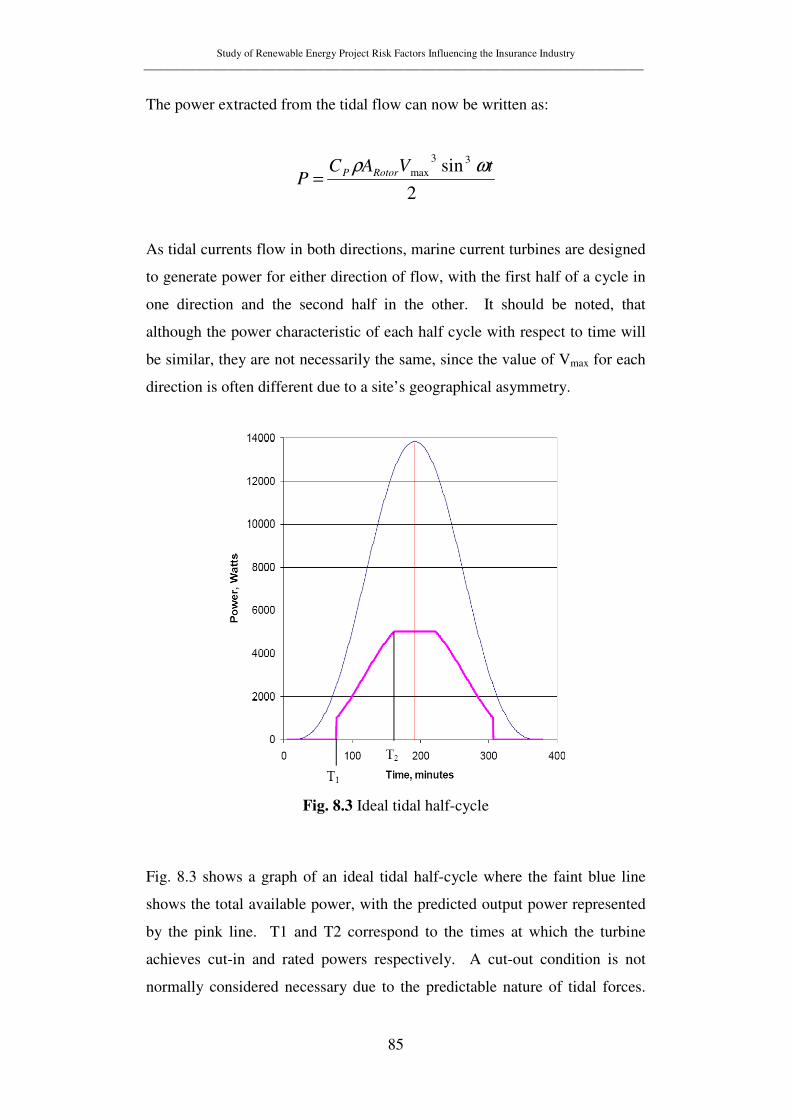
Study of Renewable Energy Project Risk Factors Influencing the Insurance Industry ______________________________________________________________________________________________
85
The power extracted from the tidal flow can now be written as:
2
sin 33
max tVACP RotorP ωρ
=
As tidal currents flow in both directions, marine current turbines are designed
to generate power for either direction of flow, with the first half of a cycle in
one direction and the second half in the other. It should be noted, that
although the power characteristic of each half cycle with respect to time will
be similar, they are not necessarily the same, since the value of Vmax for each
direction is often different due to a site’s geographical asymmetry.
Fig. 8.3 Ideal tidal half-cycle
Fig. 8.3 shows a graph of an ideal tidal half-cycle where the faint blue line
shows the total available power, with the predicted output power represented
by the pink line. T1 and T2 correspond to the times at which the turbine
achieves cut-in and rated powers respectively. A cut-out condition is not
normally considered necessary due to the predictable nature of tidal forces.

Study of Renewable Energy Project Risk Factors Influencing the Insurance Industry ______________________________________________________________________________________________
86
The red line indicates the quarter-cycle time (the midway point of the half-
cycle) of 186.25 minutes, where peak flow is achieved.
The total energy captured during one quarter of a full tidal cycle is given by:
[ ]2
33
max25.186
2
sin2
1
TPtVAC
dtP Rated
Rotorp
T
T
−+
= ∫∫
ωρ
Where,
PRated = Rated power in Watts
8.2 Configurations
In terms of device configuration, rotating tidal current turbines can be
classified in a similar manner to wind turbines, with devices described as
being either horizontal axis or vertical axis. Use of the term ‘vertical axis’ is
perhaps misleading in this case, as it is generally accepted that these devices
can also function with their axis positioned horizontally, unlike horizontal
axis machines, which will not function if their axis is changed. A category of
non-rotating tidal current device exists in the form of oscillating hydrofoils,
where the direction of oscillation is used to categorise devices as either
horizontal axis or vertical axis systems. Unlike the wind turbine market
however, no single tidal stream technology has yet proved superior, with a
variety of designs undergoing development and testing.
A number of design proposals exist for horizontal axis rotating tidal current
devices, each seemingly offering benefits over the others, but few can back
these claims with results from in-situ testing. One design concept, which has
seen extensive testing, uses a single rotor attached to a tubular steel pile,
mounted in the seabed. This bears a resemblance to a conventional wind
turbine, with pitch adjustable blades for operating in bi-directional flow and
the blade shape optimised for use in water.
Study of Renewable Energy Project Risk Factors Influencing the Insurance Industry ______________________________________________________________________________________________
87
Fig. 8.4 Fig. 8.5 Fig. 8.6
(Source: [70]) (Source: [71]) (Source: [72])
Marine Current Turbines Ltd has successfully deployed and operated two
devices of this type – SeaFlow (Fig. 8.4), a 300 kW single rotor system
installed in 2003 off the North coast of Devon, England; and SeaGen (Fig. 8.5
and Fig. 8.6) a 1.2 MW twin rotor arrangement, installed during 2008 in
Strangford Lough, Northern Ireland. The towers for both devices extend
above the water line, allowing the entire turbine and rotors to be raised out of
the water for maintenance purposes.
An alternative approach to horizontal axis rotating tidal current design, is to
employ ducting around the rotor to channel more water through the turbine,
enabling the use of a smaller diameter turbine, thereby resulting in higher
flow velocities. Ducted turbines have been shown experimentally to
demonstrate a distinct advantage over non-ducted turbines. When the
approach angle of the water flow is not perfectly in line with the turbine axis,
they experience a lesser drop in power characteristics. Such a device
currently being developed by Lunar Energy is the Rotech Tidal Turbine
(RTT) as shown below in Fig. 8.7:
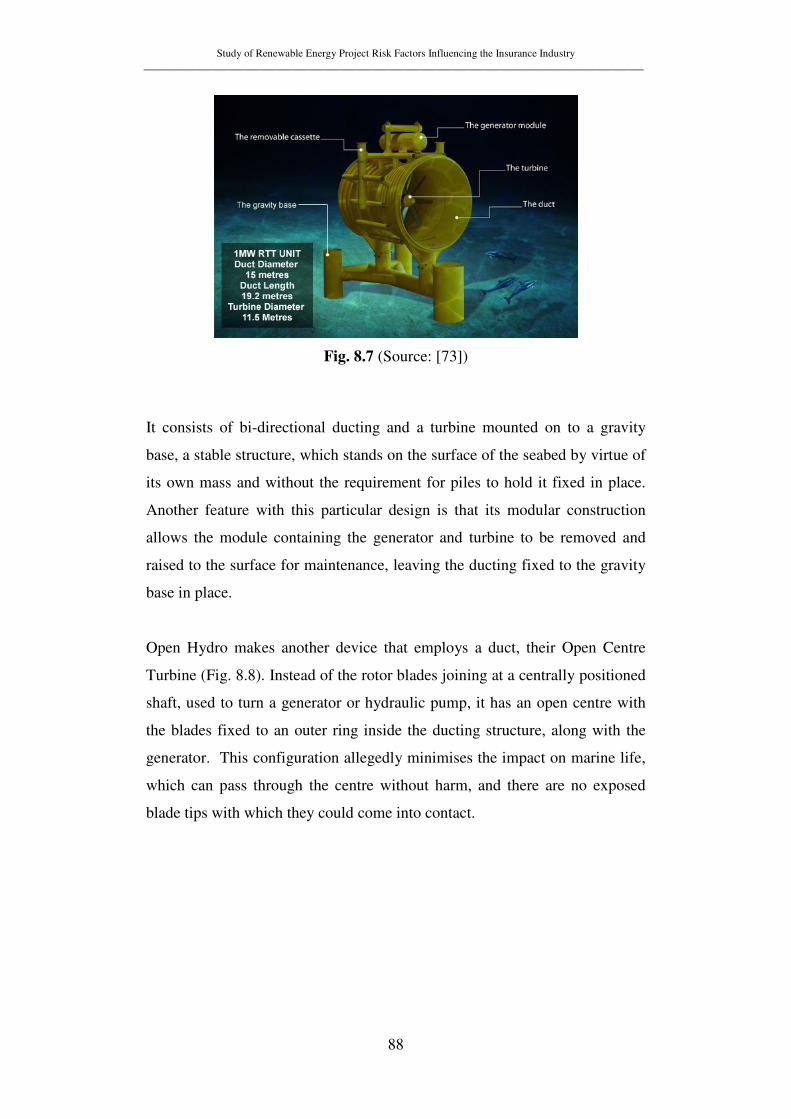
Study of Renewable Energy Project Risk Factors Influencing the Insurance Industry ______________________________________________________________________________________________
88
Fig. 8.7 (Source: [73])
It consists of bi-directional ducting and a turbine mounted on to a gravity
base, a stable structure, which stands on the surface of the seabed by virtue of
its own mass and without the requirement for piles to hold it fixed in place.
Another feature with this particular design is that its modular construction
allows the module containing the generator and turbine to be removed and
raised to the surface for maintenance, leaving the ducting fixed to the gravity
base in place.
Open Hydro makes another device that employs a duct, their Open Centre
Turbine (Fig. 8.8). Instead of the rotor blades joining at a centrally positioned
shaft, used to turn a generator or hydraulic pump, it has an open centre with
the blades fixed to an outer ring inside the ducting structure, along with the
generator. This configuration allegedly minimises the impact on marine life,
which can pass through the centre without harm, and there are no exposed
blade tips with which they could come into contact.
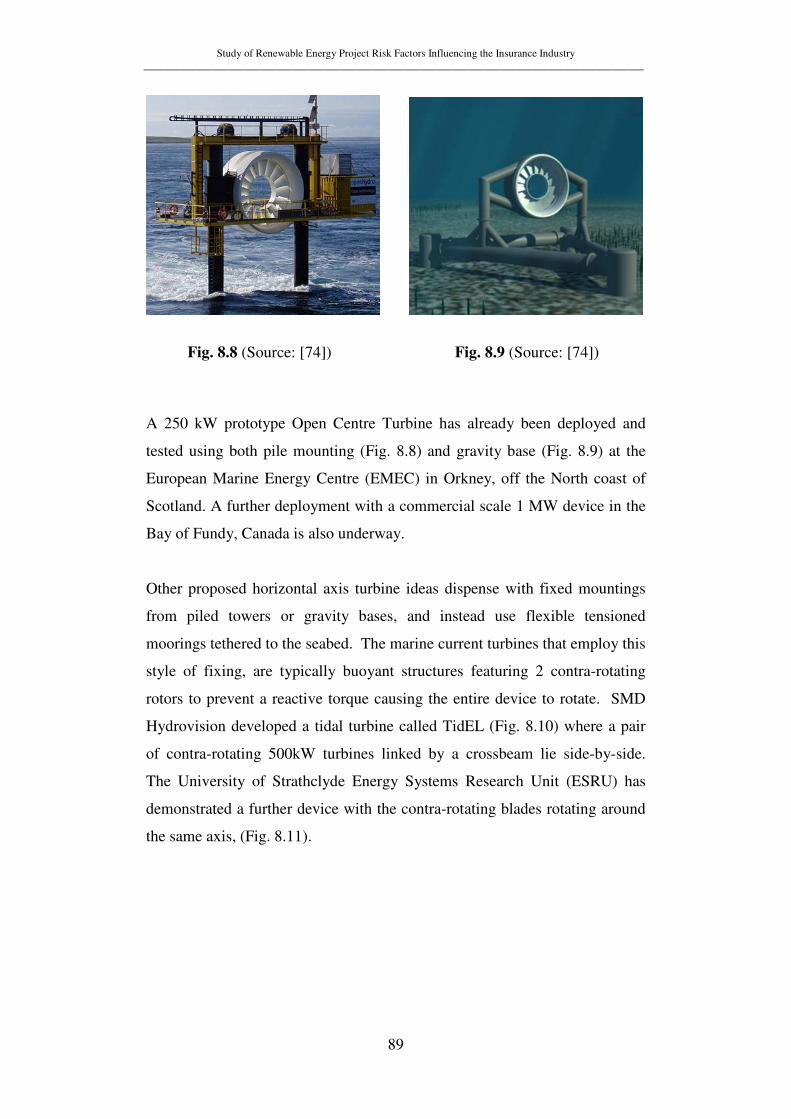
Study of Renewable Energy Project Risk Factors Influencing the Insurance Industry ______________________________________________________________________________________________
89
Fig. 8.8 (Source: [74]) Fig. 8.9 (Source: [74])
A 250 kW prototype Open Centre Turbine has already been deployed and
tested using both pile mounting (Fig. 8.8) and gravity base (Fig. 8.9) at the
European Marine Energy Centre (EMEC) in Orkney, off the North coast of
Scotland. A further deployment with a commercial scale 1 MW device in the
Bay of Fundy, Canada is also underway.
Other proposed horizontal axis turbine ideas dispense with fixed mountings
from piled towers or gravity bases, and instead use flexible tensioned
moorings tethered to the seabed. The marine current turbines that employ this
style of fixing, are typically buoyant structures featuring 2 contra-rotating
rotors to prevent a reactive torque causing the entire device to rotate. SMD
Hydrovision developed a tidal turbine called TidEL (Fig. 8.10) where a pair
of contra-rotating 500kW turbines linked by a crossbeam lie side-by-side.
The University of Strathclyde Energy Systems Research Unit (ESRU) has
demonstrated a further device with the contra-rotating blades rotating around
the same axis, (Fig. 8.11).
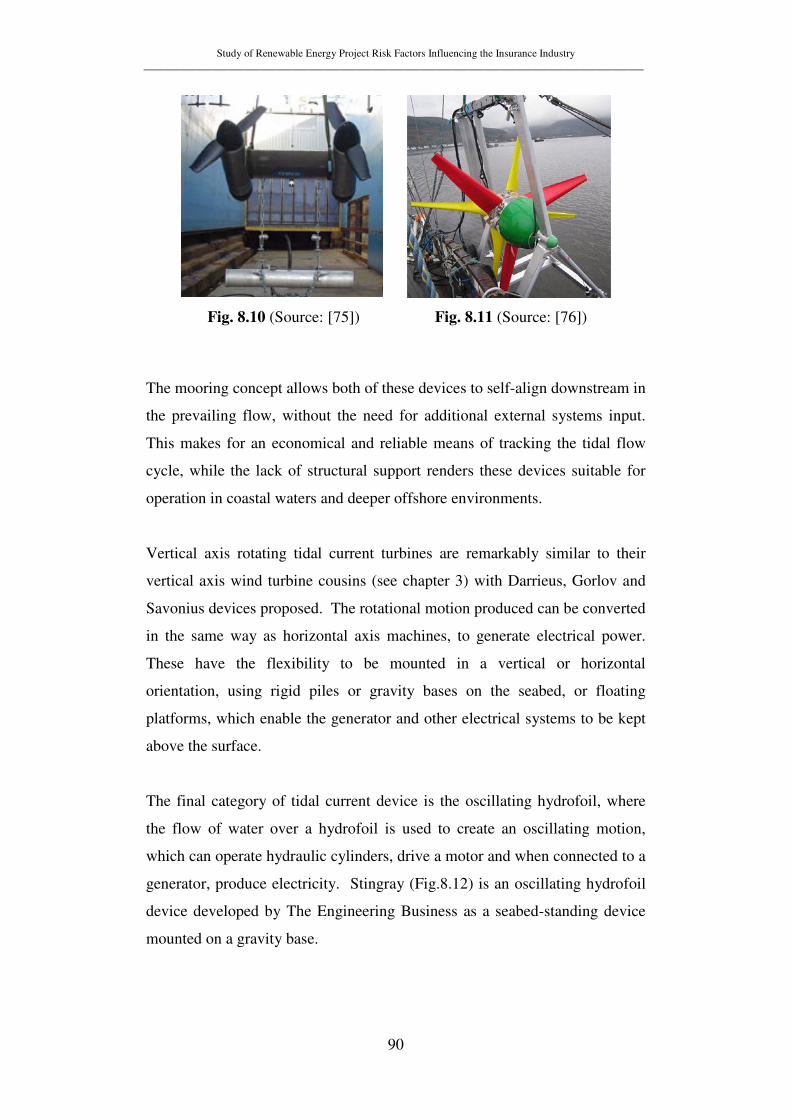
Study of Renewable Energy Project Risk Factors Influencing the Insurance Industry ______________________________________________________________________________________________
90
Fig. 8.10 (Source: [75]) Fig. 8.11 (Source: [76])
The mooring concept allows both of these devices to self-align downstream in
the prevailing flow, without the need for additional external systems input.
This makes for an economical and reliable means of tracking the tidal flow
cycle, while the lack of structural support renders these devices suitable for
operation in coastal waters and deeper offshore environments.
Vertical axis rotating tidal current turbines are remarkably similar to their
vertical axis wind turbine cousins (see chapter 3) with Darrieus, Gorlov and
Savonius devices proposed. The rotational motion produced can be converted
in the same way as horizontal axis machines, to generate electrical power.
These have the flexibility to be mounted in a vertical or horizontal
orientation, using rigid piles or gravity bases on the seabed, or floating
platforms, which enable the generator and other electrical systems to be kept
above the surface.
The final category of tidal current device is the oscillating hydrofoil, where
the flow of water over a hydrofoil is used to create an oscillating motion,
which can operate hydraulic cylinders, drive a motor and when connected to a
generator, produce electricity. Stingray (Fig.8.12) is an oscillating hydrofoil
device developed by The Engineering Business as a seabed-standing device
mounted on a gravity base.
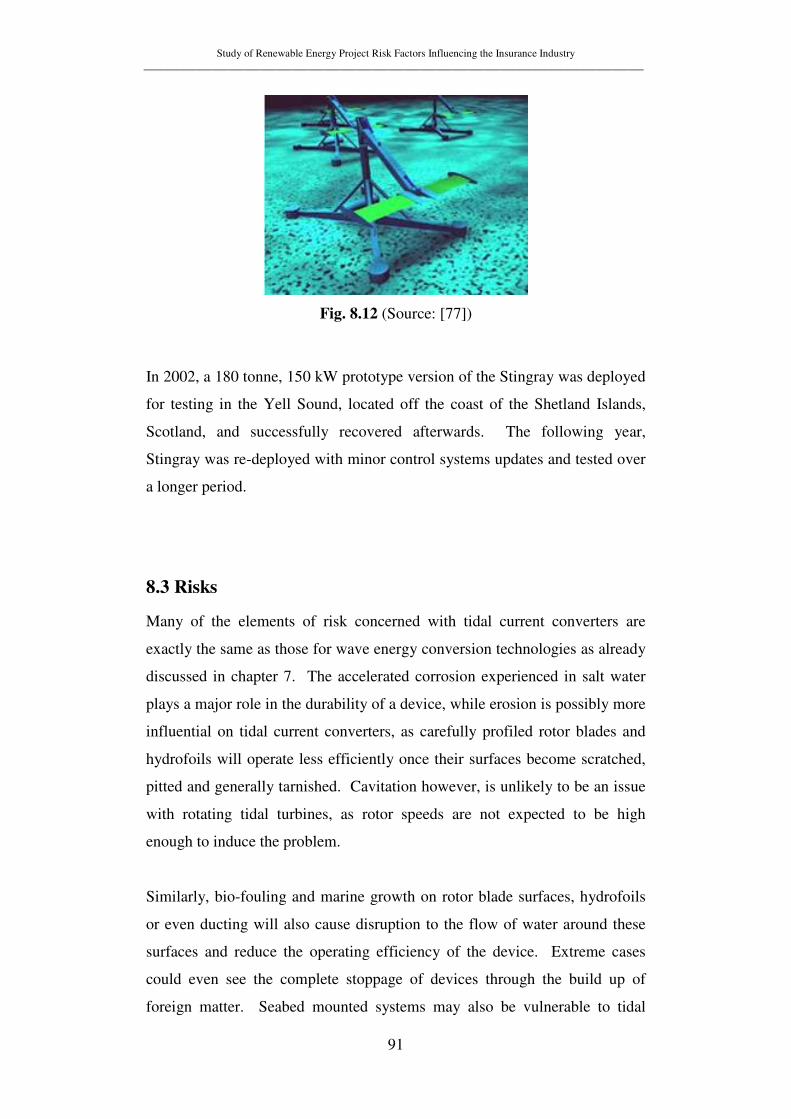
Study of Renewable Energy Project Risk Factors Influencing the Insurance Industry ______________________________________________________________________________________________
91
Fig. 8.12 (Source: [77])
In 2002, a 180 tonne, 150 kW prototype version of the Stingray was deployed
for testing in the Yell Sound, located off the coast of the Shetland Islands,
Scotland, and successfully recovered afterwards. The following year,
Stingray was re-deployed with minor control systems updates and tested over
a longer period.
8.3 Risks
Many of the elements of risk concerned with tidal current converters are
exactly the same as those for wave energy conversion technologies as already
discussed in chapter 7. The accelerated corrosion experienced in salt water
plays a major role in the durability of a device, while erosion is possibly more
influential on tidal current converters, as carefully profiled rotor blades and
hydrofoils will operate less efficiently once their surfaces become scratched,
pitted and generally tarnished. Cavitation however, is unlikely to be an issue
with rotating tidal turbines, as rotor speeds are not expected to be high
enough to induce the problem.
Similarly, bio-fouling and marine growth on rotor blade surfaces, hydrofoils
or even ducting will also cause disruption to the flow of water around these
surfaces and reduce the operating efficiency of the device. Extreme cases
could even see the complete stoppage of devices through the build up of
foreign matter. Seabed mounted systems may also be vulnerable to tidal
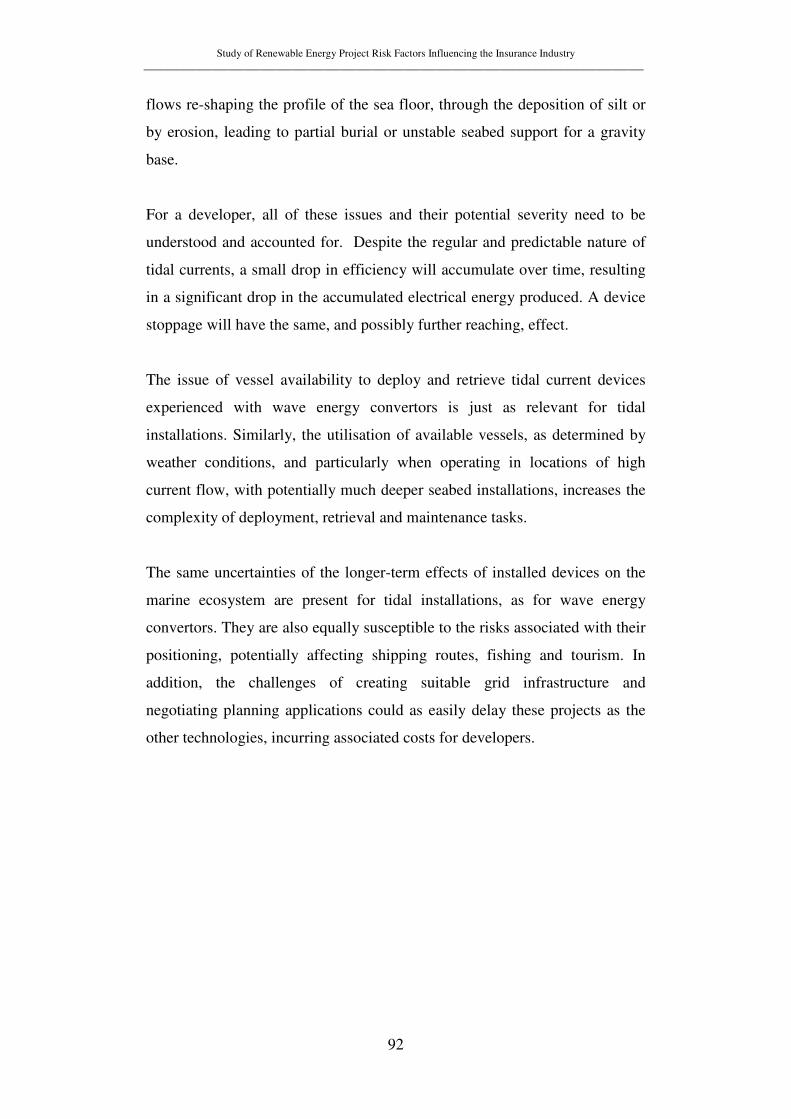
Study of Renewable Energy Project Risk Factors Influencing the Insurance Industry ______________________________________________________________________________________________
92
flows re-shaping the profile of the sea floor, through the deposition of silt or
by erosion, leading to partial burial or unstable seabed support for a gravity
base.
For a developer, all of these issues and their potential severity need to be
understood and accounted for. Despite the regular and predictable nature of
tidal currents, a small drop in efficiency will accumulate over time, resulting
in a significant drop in the accumulated electrical energy produced. A device
stoppage will have the same, and possibly further reaching, effect.
The issue of vessel availability to deploy and retrieve tidal current devices
experienced with wave energy convertors is just as relevant for tidal
installations. Similarly, the utilisation of available vessels, as determined by
weather conditions, and particularly when operating in locations of high
current flow, with potentially much deeper seabed installations, increases the
complexity of deployment, retrieval and maintenance tasks.
The same uncertainties of the longer-term effects of installed devices on the
marine ecosystem are present for tidal installations, as for wave energy
convertors. They are also equally susceptible to the risks associated with their
positioning, potentially affecting shipping routes, fishing and tourism. In
addition, the challenges of creating suitable grid infrastructure and
negotiating planning applications could as easily delay these projects as the
other technologies, incurring associated costs for developers.
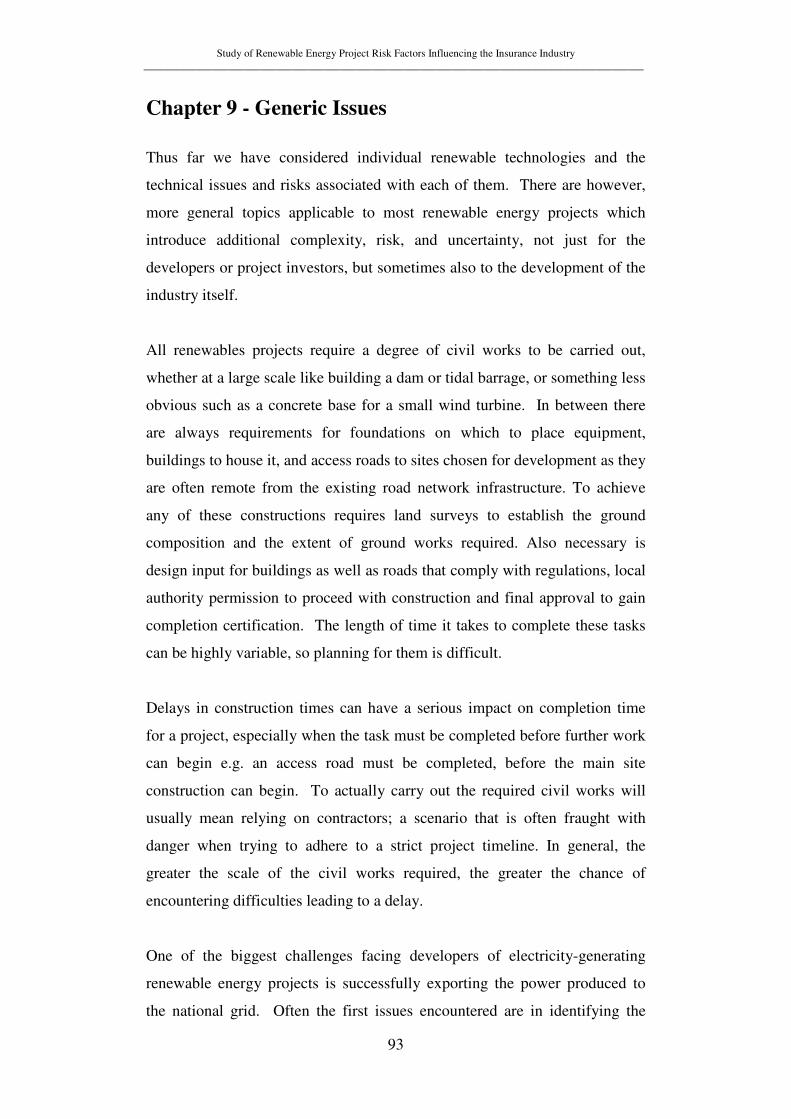
Study of Renewable Energy Project Risk Factors Influencing the Insurance Industry ______________________________________________________________________________________________
93
Chapter 9 - Generic Issues
Thus far we have considered individual renewable technologies and the
technical issues and risks associated with each of them. There are however,
more general topics applicable to most renewable energy projects which
introduce additional complexity, risk, and uncertainty, not just for the
developers or project investors, but sometimes also to the development of the
industry itself.
All renewables projects require a degree of civil works to be carried out,
whether at a large scale like building a dam or tidal barrage, or something less
obvious such as a concrete base for a small wind turbine. In between there
are always requirements for foundations on which to place equipment,
buildings to house it, and access roads to sites chosen for development as they
are often remote from the existing road network infrastructure. To achieve
any of these constructions requires land surveys to establish the ground
composition and the extent of ground works required. Also necessary is
design input for buildings as well as roads that comply with regulations, local
authority permission to proceed with construction and final approval to gain
completion certification. The length of time it takes to complete these tasks
can be highly variable, so planning for them is difficult.
Delays in construction times can have a serious impact on completion time
for a project, especially when the task must be completed before further work
can begin e.g. an access road must be completed, before the main site
construction can begin. To actually carry out the required civil works will
usually mean relying on contractors; a scenario that is often fraught with
danger when trying to adhere to a strict project timeline. In general, the
greater the scale of the civil works required, the greater the chance of
encountering difficulties leading to a delay.
One of the biggest challenges facing developers of electricity-generating
renewable energy projects is successfully exporting the power produced to
the national grid. Often the first issues encountered are in identifying the
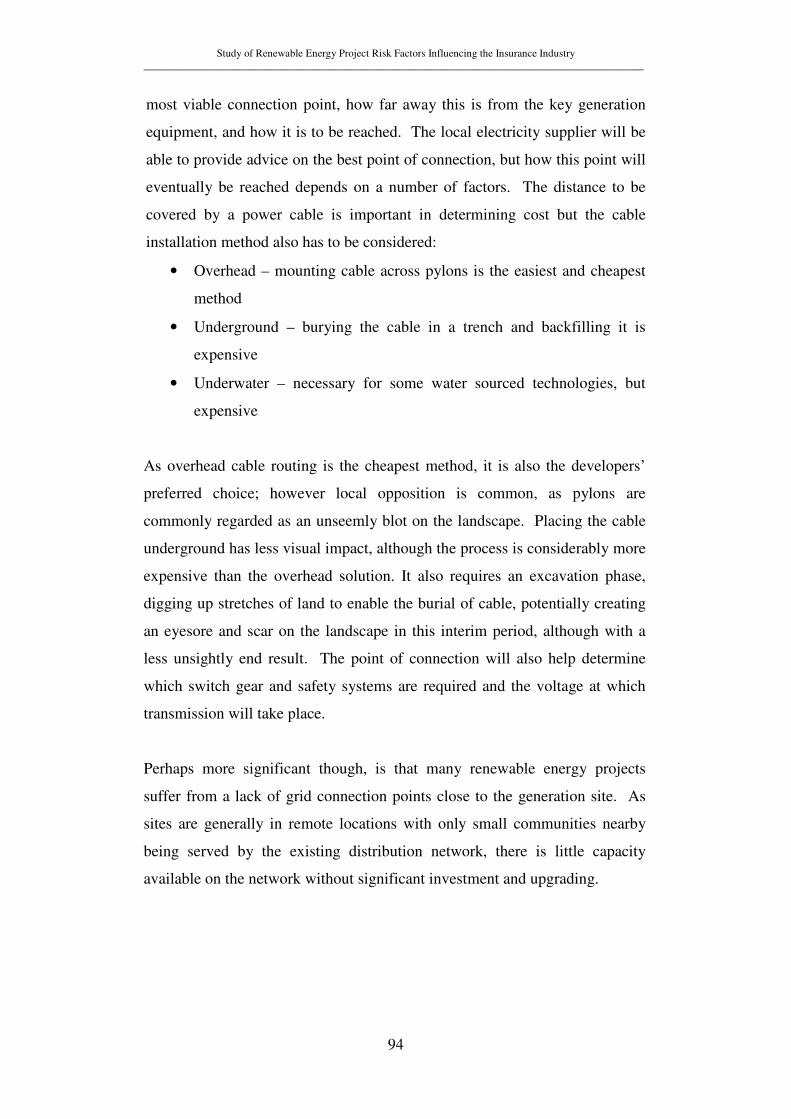
Study of Renewable Energy Project Risk Factors Influencing the Insurance Industry ______________________________________________________________________________________________
94
most viable connection point, how far away this is from the key generation
equipment, and how it is to be reached. The local electricity supplier will be
able to provide advice on the best point of connection, but how this point will
eventually be reached depends on a number of factors. The distance to be
covered by a power cable is important in determining cost but the cable
installation method also has to be considered:
• Overhead – mounting cable across pylons is the easiest and cheapest
method
• Underground – burying the cable in a trench and backfilling it is
expensive
• Underwater – necessary for some water sourced technologies, but
expensive
As overhead cable routing is the cheapest method, it is also the developers’
preferred choice; however local opposition is common, as pylons are
commonly regarded as an unseemly blot on the landscape. Placing the cable
underground has less visual impact, although the process is considerably more
expensive than the overhead solution. It also requires an excavation phase,
digging up stretches of land to enable the burial of cable, potentially creating
an eyesore and scar on the landscape in this interim period, although with a
less unsightly end result. The point of connection will also help determine
which switch gear and safety systems are required and the voltage at which
transmission will take place.
Perhaps more significant though, is that many renewable energy projects
suffer from a lack of grid connection points close to the generation site. As
sites are generally in remote locations with only small communities nearby
being served by the existing distribution network, there is little capacity
available on the network without significant investment and upgrading.
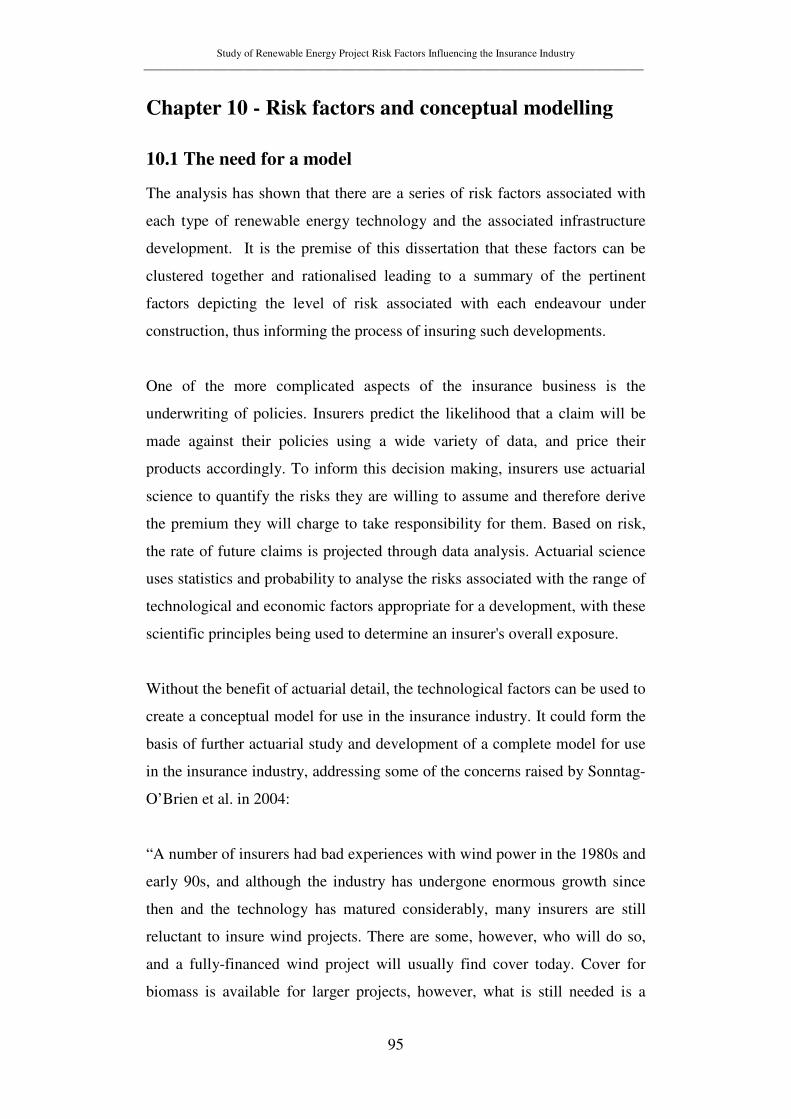
Study of Renewable Energy Project Risk Factors Influencing the Insurance Industry ______________________________________________________________________________________________
95
Chapter 10 - Risk factors and conceptual modelling
10.1 The need for a model
The analysis has shown that there are a series of risk factors associated with
each type of renewable energy technology and the associated infrastructure
development. It is the premise of this dissertation that these factors can be
clustered together and rationalised leading to a summary of the pertinent
factors depicting the level of risk associated with each endeavour under
construction, thus informing the process of insuring such developments.
One of the more complicated aspects of the insurance business is the
underwriting of policies. Insurers predict the likelihood that a claim will be
made against their policies using a wide variety of data, and price their
products accordingly. To inform this decision making, insurers use actuarial
science to quantify the risks they are willing to assume and therefore derive
the premium they will charge to take responsibility for them. Based on risk,
the rate of future claims is projected through data analysis. Actuarial science
uses statistics and probability to analyse the risks associated with the range of
technological and economic factors appropriate for a development, with these
scientific principles being used to determine an insurer's overall exposure.
Without the benefit of actuarial detail, the technological factors can be used to
create a conceptual model for use in the insurance industry. It could form the
basis of further actuarial study and development of a complete model for use
in the insurance industry, addressing some of the concerns raised by Sonntag-
O’Brien et al. in 2004:
“A number of insurers had bad experiences with wind power in the 1980s and
early 90s, and although the industry has undergone enormous growth since
then and the technology has matured considerably, many insurers are still
reluctant to insure wind projects. There are some, however, who will do so,
and a fully-financed wind project will usually find cover today. Cover for
biomass is available for larger projects, however, what is still needed is a
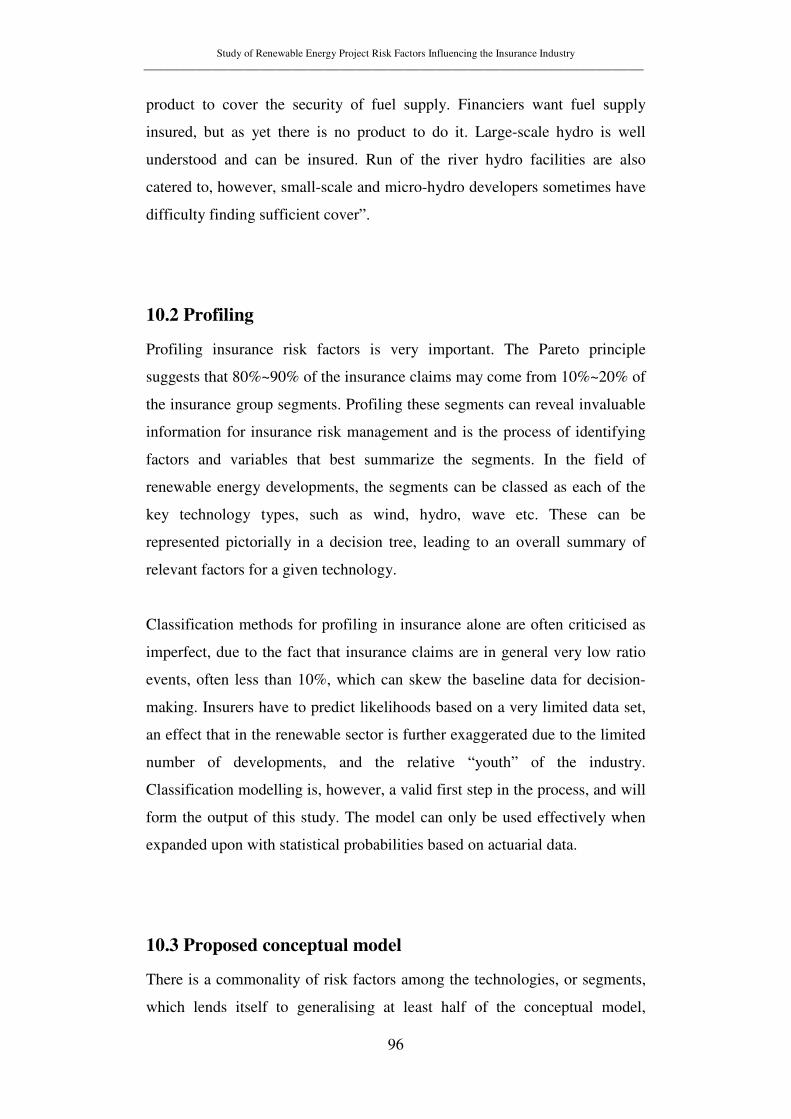
Study of Renewable Energy Project Risk Factors Influencing the Insurance Industry ______________________________________________________________________________________________
96
product to cover the security of fuel supply. Financiers want fuel supply
insured, but as yet there is no product to do it. Large-scale hydro is well
understood and can be insured. Run of the river hydro facilities are also
catered to, however, small-scale and micro-hydro developers sometimes have
difficulty finding sufficient cover”.
10.2 Profiling
Profiling insurance risk factors is very important. The Pareto principle
suggests that 80%~90% of the insurance claims may come from 10%~20% of
the insurance group segments. Profiling these segments can reveal invaluable
information for insurance risk management and is the process of identifying
factors and variables that best summarize the segments. In the field of
renewable energy developments, the segments can be classed as each of the
key technology types, such as wind, hydro, wave etc. These can be
represented pictorially in a decision tree, leading to an overall summary of
relevant factors for a given technology.
Classification methods for profiling in insurance alone are often criticised as
imperfect, due to the fact that insurance claims are in general very low ratio
events, often less than 10%, which can skew the baseline data for decision-
making. Insurers have to predict likelihoods based on a very limited data set,
an effect that in the renewable sector is further exaggerated due to the limited
number of developments, and the relative “youth” of the industry.
Classification modelling is, however, a valid first step in the process, and will
form the output of this study. The model can only be used effectively when
expanded upon with statistical probabilities based on actuarial data.
10.3 Proposed conceptual model
There is a commonality of risk factors among the technologies, or segments,
which lends itself to generalising at least half of the conceptual model,
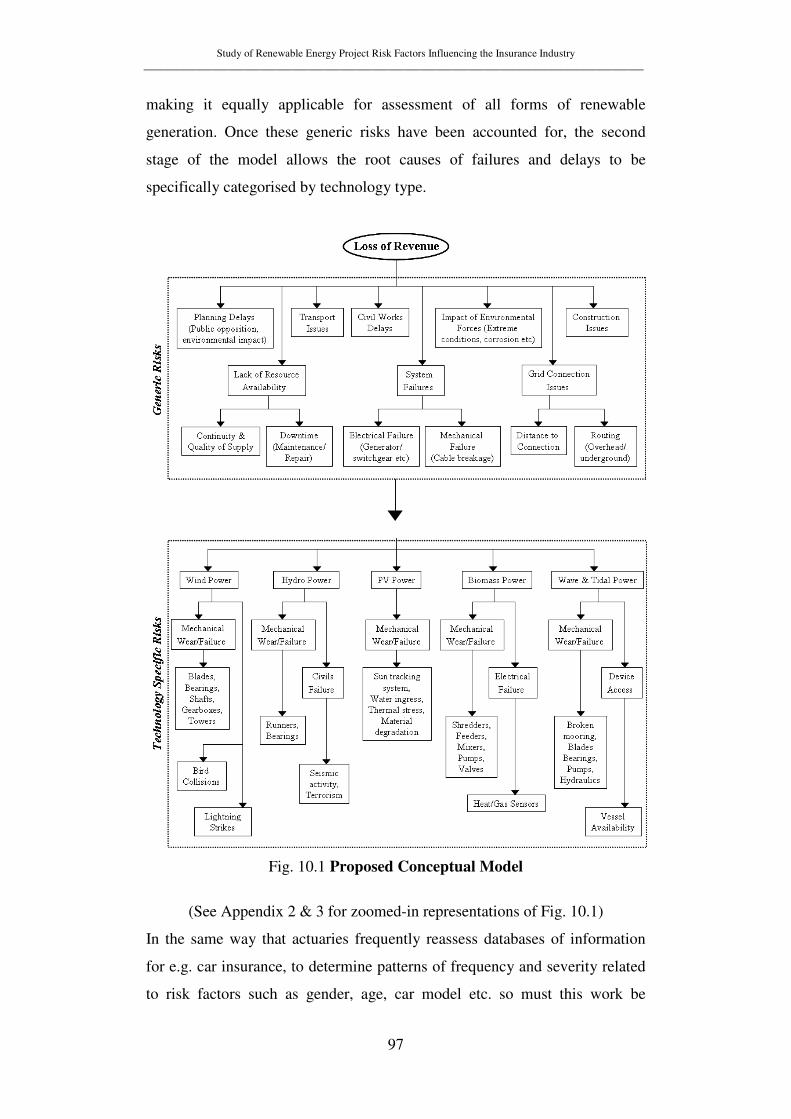
Study of Renewable Energy Project Risk Factors Influencing the Insurance Industry ______________________________________________________________________________________________
97
making it equally applicable for assessment of all forms of renewable
generation. Once these generic risks have been accounted for, the second
stage of the model allows the root causes of failures and delays to be
specifically categorised by technology type.
Fig. 10.1 Proposed Conceptual Model
(See Appendix 2 & 3 for zoomed-in representations of Fig. 10.1)
In the same way that actuaries frequently reassess databases of information
for e.g. car insurance, to determine patterns of frequency and severity related
to risk factors such as gender, age, car model etc. so must this work be

Study of Renewable Energy Project Risk Factors Influencing the Insurance Industry ______________________________________________________________________________________________
98
undertaken with the factors represented above. It will then become apparent
to both the insurance industry and to developers, the types of project risks to
look for, and where possible avoid, minimising premiums and investing in
sound development projects. This conceptual model provides a good basis on
which to begin actuarial data collection and analysis.
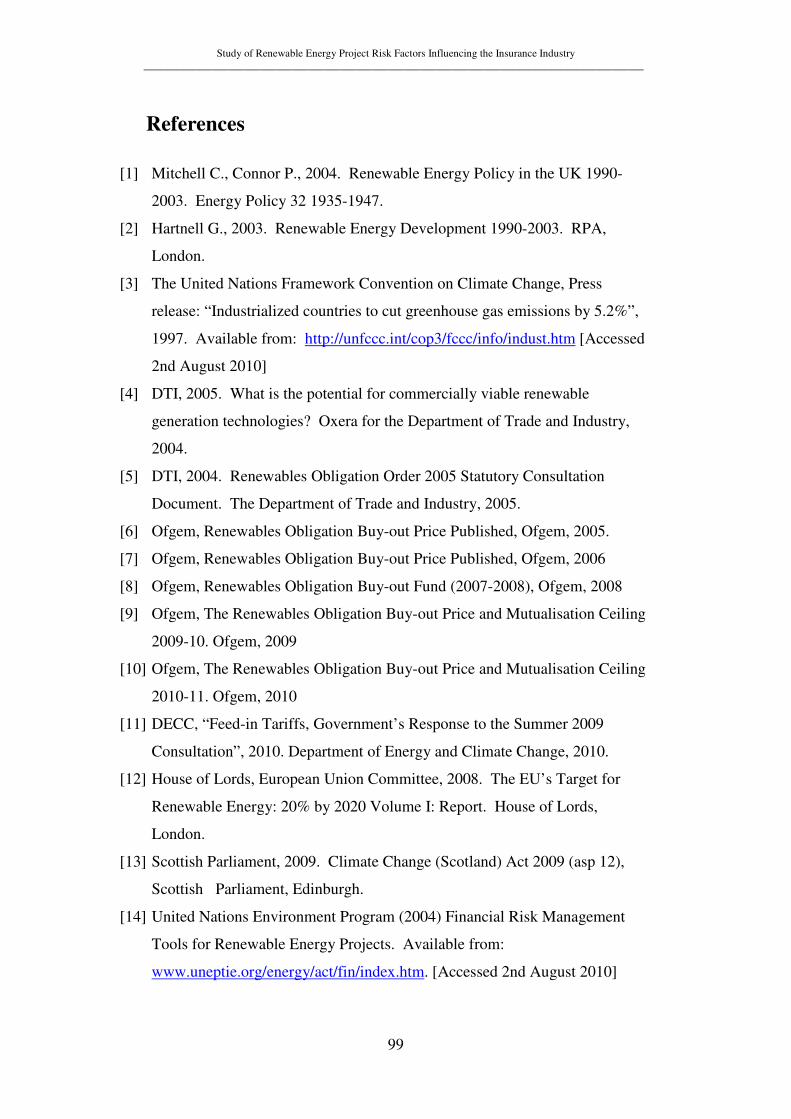
Study of Renewable Energy Project Risk Factors Influencing the Insurance Industry ______________________________________________________________________________________________
99
References
[1] Mitchell C., Connor P., 2004. Renewable Energy Policy in the UK 1990-
2003. Energy Policy 32 1935-1947.
[2] Hartnell G., 2003. Renewable Energy Development 1990-2003. RPA,
London.
[3] The United Nations Framework Convention on Climate Change, Press
release: “Industrialized countries to cut greenhouse gas emissions by 5.2%”,
1997. Available from: http://unfccc.int/cop3/fccc/info/indust.htm [Accessed
2nd August 2010]
[4] DTI, 2005. What is the potential for commercially viable renewable
generation technologies? Oxera for the Department of Trade and Industry,
2004.
[5] DTI, 2004. Renewables Obligation Order 2005 Statutory Consultation
Document. The Department of Trade and Industry, 2005.
[6] Ofgem, Renewables Obligation Buy-out Price Published, Ofgem, 2005.
[7] Ofgem, Renewables Obligation Buy-out Price Published, Ofgem, 2006
[8] Ofgem, Renewables Obligation Buy-out Fund (2007-2008), Ofgem, 2008
[9] Ofgem, The Renewables Obligation Buy-out Price and Mutualisation Ceiling
2009-10. Ofgem, 2009
[10] Ofgem, The Renewables Obligation Buy-out Price and Mutualisation Ceiling
2010-11. Ofgem, 2010
[11] DECC, “Feed-in Tariffs, Government’s Response to the Summer 2009
Consultation”, 2010. Department of Energy and Climate Change, 2010.
[12] House of Lords, European Union Committee, 2008. The EU’s Target for
Renewable Energy: 20% by 2020 Volume I: Report. House of Lords,
London.
[13] Scottish Parliament, 2009. Climate Change (Scotland) Act 2009 (asp 12),
Scottish Parliament, Edinburgh.
[14] United Nations Environment Program (2004) Financial Risk Management
Tools for Renewable Energy Projects. Available from:
www.uneptie.org/energy/act/fin/index.htm. [Accessed 2nd August 2010]
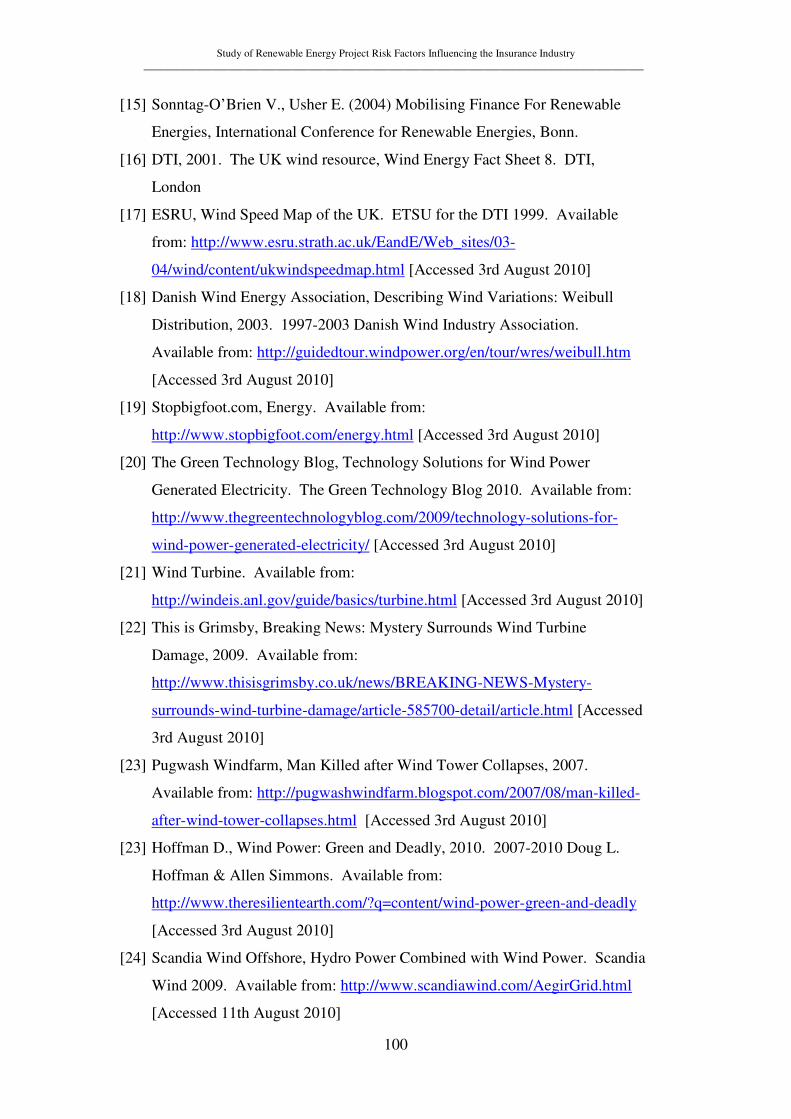
Study of Renewable Energy Project Risk Factors Influencing the Insurance Industry ______________________________________________________________________________________________
100
[15] Sonntag-O’Brien V., Usher E. (2004) Mobilising Finance For Renewable
Energies, International Conference for Renewable Energies, Bonn.
[16] DTI, 2001. The UK wind resource, Wind Energy Fact Sheet 8. DTI,
London
[17] ESRU, Wind Speed Map of the UK. ETSU for the DTI 1999. Available
from: http://www.esru.strath.ac.uk/EandE/Web_sites/03-
04/wind/content/ukwindspeedmap.html [Accessed 3rd August 2010]
[18] Danish Wind Energy Association, Describing Wind Variations: Weibull
Distribution, 2003. 1997-2003 Danish Wind Industry Association.
Available from: http://guidedtour.windpower.org/en/tour/wres/weibull.htm
[Accessed 3rd August 2010]
[19] Stopbigfoot.com, Energy. Available from:
http://www.stopbigfoot.com/energy.html [Accessed 3rd August 2010]
[20] The Green Technology Blog, Technology Solutions for Wind Power
Generated Electricity. The Green Technology Blog 2010. Available from:
http://www.thegreentechnologyblog.com/2009/technology-solutions-for-
wind-power-generated-electricity/ [Accessed 3rd August 2010]
[21] Wind Turbine. Available from:
http://windeis.anl.gov/guide/basics/turbine.html [Accessed 3rd August 2010]
[22] This is Grimsby, Breaking News: Mystery Surrounds Wind Turbine
Damage, 2009. Available from:
http://www.thisisgrimsby.co.uk/news/BREAKING-NEWS-Mystery-
surrounds-wind-turbine-damage/article-585700-detail/article.html [Accessed
3rd August 2010]
[23] Pugwash Windfarm, Man Killed after Wind Tower Collapses, 2007.
Available from: http://pugwashwindfarm.blogspot.com/2007/08/man-killed-
after-wind-tower-collapses.html [Accessed 3rd August 2010]
[23] Hoffman D., Wind Power: Green and Deadly, 2010. 2007-2010 Doug L.
Hoffman & Allen Simmons. Available from:
http://www.theresilientearth.com/?q=content/wind-power-green-and-deadly
[Accessed 3rd August 2010]
[24] Scandia Wind Offshore, Hydro Power Combined with Wind Power. Scandia
Wind 2009. Available from: http://www.scandiawind.com/AegirGrid.html
[Accessed 11th August 2010]
Study of Renewable Energy Project Risk Factors Influencing the Insurance Industry ______________________________________________________________________________________________
101
[25] Water Encyclopedia, Science & Issues, Hydroelectric Power. 2010,
Advameg, Inc. Available from: http://www.waterencyclopedia.com/Ge-
Hy/Hydroelectric-Power.html [Accessed 11th August 2010]
[26] Practical Action, Technology Challenging Poverty, Micro-hydro Power: The
Basics. Practical Action, Schumacher Centre for Technology &
Development 2010. Available from:
http://practicalaction.org/energy/micro_hydro_faq
[Accessed 11th August 2010]
[27] Capture 3D, 3D Industrial Measurement Solutions, Turbines. Available
from: http://www.capture3d.com/applications-quality-turbines-
3Dmeasure.html [Accessed 12th August 2010]
[28] The Encyclopedia of Alternative Energy and Sustainable Living, Francis
Turbine. Available from:
http://www.daviddarling.info/encyclopedia/F/AE_Francis_turbine.html
[Accessed 12th August 2010]
[30] BHA, A Guide to UK Mini Hydro Developments, 8.3 Reaction Turbines.
2004, British Hydro Association. Available from: http://www.british-
hydro.org/mini-hydro/infopagec935.html?infoid=396 [Accessed 12th August
2010]
[31] NUMERICAL INVESTIGATIONS OF TURBULENT FLOW IN WATER
TURBINES, 2002. ILJ, 2005. Available from:
http://www.tfd.chalmers.se/~hani/phdproject/proright.html [Accessed 12th
August 2010]
[32] Tooling & Production, March 2008 Edition. 2009, Nelson Publishing Inc.
Available from:
http://www.toolingandproductio.com/features/2008_March/0308_high_preci
sion.aspx [Accessed 12th August 2010]
[33] MNV Consulting Ltd, Small scale hydro – Producing more renewable
energy while providing a better environment, 2009. Available from:
http://mnvconsulting.eu/tag/unused-water-assets/ [Accessed 12th August
2010]
[34] Hydropower, Pelton Turbine. International Network for Sustainable Energy.
Available from: http://www.inforse.org/europe/dieret/Hydro/hydro.html
[Accessed 12th August 2010]
Study of Renewable Energy Project Risk Factors Influencing the Insurance Industry ______________________________________________________________________________________________
102
[35] Microhydropower.net, Hydropower Basics, Turbines. Available from:
http://www.microhydropower.net/basics/turbines.php [Accessed 12th August
2010]
[36] AltEstore, making renewable do-able, PL PLT Plastic Pelton Wheel.
Alternative Energy Store. Available from:
http://www.altestore.com/store/Hydropower/Energy-Systems-And-Design-
Parts/Pl-Plt-Plastic-Pelton-Wheel/p506/ [Accessed 12th August 2010]
[37] Hydraulic Water Turbines, Impulse Wheels, Sort of… Banki-Mitchell
Turbines. Available from:
http://members.tripod.com/hydrodocs_1/turbines.html [Accessed 12th August
2010]
[38] Wikipedia, The Free Encyclopedia, File:Banki.svg. Available from:
http://commons.wikimedia.org/wiki/File:Banki.svg [Accessed 12th August
2010]
[39] Wikipedia, The Free Encyclopedia, File:Water Turbine Chart.png. Available
from: http://en.wikipedia.org/wiki/File:Water_Turbine_Chart.png [Accessed
12th August 2010]
[40] Wikipedia, The Free Encyclopedia, File:Turbine Francis Worn.JPG.
Available from:
http://en.wikipedia.org/wiki/File:Turbine_Francis_Worn.JPG [Accessed 12th
August 2010]
[41] Eichenberg D, Design of a Glenn Research Center Solar Field Grid-tied
Photovoltaic Power System, Nasa/TM-2009-216065. Available from:
http://ntrs.nasa.gov/archive/nasa/casi.ntrs.nasa.gov/20100004828_20100039
56.pdf [Accessed 16th August 2010]
[42] JRC European Commision, Solar Radiation and PV Maps - Europe (Africa).
PVGIS © European Communities, 2001-2007. Available from:
http://re.jrc.ec.europa.eu/pvgis/countries/countries-europe.htm [Accessed
16th August 2010]
[43] Global Greenhouse Warming.com, Pyrheliometer. Available from:
http://www.global-greenhouse-warming.com/pyrheliometer.html [Accessed
16th August 2010]
Study of Renewable Energy Project Risk Factors Influencing the Insurance Industry ______________________________________________________________________________________________
103
[44] Sirichote W., DC Amplifier for Pyranometer, 2004. Available from:
http://www.kmitl.ac.th/~kswichit/logger3/insolation.html [Accessed 16th
August 2010]
[45] Sky Flair Ltd, Solar Electricity. 2007 Sky Flair Lid. Available from:
http://www.skyflair.co.uk/solarelectricity.html [Accessed 18th August 2010]
[46] Greenlaunches.com, Sol Focus inks down $100 million for world’s largest
solar CPV project, 2008. 2010 Greenlaunches.com. Available from:
http://www.greenlaunches.com/alternative-energy/solfocus-inks-down-100-
million-for-worlds-largest-solar-cpv-project.php [Accessed 18th August
2010]
[47] Hartsoch N., The solar resource: maximising energy yield with concentrator
photovoltaics. 2010, Penwell Corporation. Available from:
http://www.powergenworldwide.com/index/display/articledisplay/344420/art
icles/power-engineering-international/volume-16/issue-8/features/the-solar-
resource-maximizing-energy-yield-with-concentrator-photovoltaics.html
[Accessed 18th August 2010]
[48] Molecular Expressions, Optical Microscopy Primer, Physics of Light and
Color, Solar Cell Operation. 1998-2010, Michael W. Davidson and The
Florida State University. Available from:
http://micro.magnet.fsu.edu/primer/java/solarcell/ [Accessed 18th August
2010]
[49] Mah O., 1998. Fundamentals of Photovoltaic Materials, National Solar
Power Research Institute, Inc.
[50] Solar Panels – Green Power, Miniature PV Cells. 2010 Solar Panels – Green
Power. Available from: http://solarpanelspower.net/solar-panels/miniature-
pv-cells [Accessed 18th August 2010]
[51] The Encyclopedia of Alternative Energy and Sustainable Living, thin film
solar cell. Available from:
http://www.daviddarling.info/encyclopedia/T/AE_thin_film_cell.html
[Accessed 18th August 2010]
[52] Valley Sawmill in Anchorage, Alaska, 2004. Available from:
http://www.valleysawmill.com/Wood%20Chips.html [Accessed 23rd August
2010]
Study of Renewable Energy Project Risk Factors Influencing the Insurance Industry ______________________________________________________________________________________________
104
[53] Ontario, Ministry of Agriculture, Food & Rural Affairs, Introduction to
Bioproducts. Queen’s Printer for Ontario, 2010. Available from:
http://www.omafra.gov.on.ca/english/crops/facts/10-013w.htm [Accessed
23rd August 2010]
[54] Alibaba.com, Global trade starts here. 1999-2010 Alibaba.com. Available
from: http://www.alibaba.com/product/us105810407-108519772-
101503326/Briquettes_Biomass_Fuel.html [Accessed 23rd August 2010]
[55] Wikipedia, The Free Encyclopedia, File:Dieselsources.jpg. Available from:
http://en.wikipedia.org/wiki/File:Dieselsources.jpg [Accessed 23rd August
2010]
[56] ZeroWaste Energy Systems, Powering renewable Energy. 2010 Zero Waste
Energy Systems. Available from:
http://www.zwes.ca/Section/Solutions/Anaerobic_Digestion [Accessed 23rd
August 2010]
[57] OceanNavitas, Renewable Energy Technology. Ocean Navitas Ltd 2007.
Available from: http://www.oceannavitas.com/r_and_d/the_resource.html
[Accessed 27th August 2010]
[58] Wikipedia, The Free Encyclopedia, File:Wave motion-i18n-mod.svg.
Available from: http://en.wikipedia.org/wiki/File:Wave_motion-i18n-
mod.svg [Accessed 27th August 2010]
[59] Global Greenhouse Warming.com, Wave Dragon. Available from:
http://www.global-greenhouse-warming.com/wave-dragon.html [Accessed
27th August 2010]
[60] A List of Possible Solutions for the Energy and Climate Change Crisis.
Logical Science. Available from:
http://www.logicalscience.com/technology/ [Accessed 27th August 2010]
[61] pelamis wave power. Available from:
http://www.pelamiswave.com/gallery?category=images&page=1 [Accessed
28th August 2010]
[62] E.on UK, Vagr Atferd – Pelamis wave energy project. E.ON UK plc 2004-
2010. Available from: http://www.eon-uk.com/generation/1716.aspx
[Accessed 28th August 2010]
Study of Renewable Energy Project Risk Factors Influencing the Insurance Industry ______________________________________________________________________________________________
105
[63] Wass F, Wave Power Gets Creative, 2009. Greentech Media, Inc, 2010.
Available from: http://www.greentechmedia.com/green-light/2009/05/P14/
[Accessed 28th August 2010]
[64] sciencemuseum, Many waves make lights work…, 2007. Available from:
http://www.sciencemuseum.org.uk/antenna/wavepower [Accessed 28th
August 2010]
[65] [Wave Power Case Study], The Limpet 500; Islay. Available from:
http://www.esru.strath.ac.uk/EandE/Web_sites/01-02/RE_info/wavecase.htm
[Accessed 28th August 2010]
[66] Stormy Weather: 101 Solutions to Global Climate Change, Photo Gallery,
2008. Available from:
http://www.earthfuture.com/stormyweather/gallery/default.asp [Accessed
28th August 2010]
[67] The Moon, The Tides. Available from:
http://dolio.lh.net/~apw/astro/moon.html [Accessed 30th August 2010]
[68] RWE npower renewables, Tidal Power. Available from:
http://www.rwe.com/web/cms/en/277944/rwe-npower
renewables/technologies/marine-technologies/tidal-power/ [Accessed 30th
August 2010]
[69] Black & Veatch: Phase II UK Tidal Stream Energy Resource Assessment,
Carbon Trust, 2005.
[70] Marine Current Turbines, Turning the tide, Background. Marine Current
Turbine Limited. Available from:
http://www.marineturbines.com/2/company/6/background/ [Accessed 31st
August 2010]
[71] Alter L, Three Turbine Types To Be Tested in Bay of Fundy.
Treehugger.com, 2009. Available from:
http://www.treehugger.com/files/2009/09/turbines-to-be-tested-bay-of-
fundy.php [Accessed 31st August 2010]
[72] Jha A, First tidal power turbine gets plugged in. Guardian News and Media
Limited 2008. Available from:
http://www.guardian.co.uk/environment/2008/jul/17/waveandtidalpower.ren
ewableenergy [Accessed 31st August 2010]

Study of Renewable Energy Project Risk Factors Influencing the Insurance Industry ______________________________________________________________________________________________
106
[73] Lunar Energy, harnessing tidal power, Technology, RTT - The Product.
Available from: http://www.lunarenergy.co.uk/productOverview.htm
[Accessed 31st August 2010]
[74] Openhydro tidal technology, OpenHydro Group Limited 2010. Available
from: http://www.openhydro.com/images.html [Accessed 31st August 2010]
[75] RenewableUK, The voice of wind & marine energy (formerly named
BWEA), RenewableUK, 2010. Available from:
http://www.bwea.com/marine/devices.html [Accessed 31st August 2010]
[76] Greenmeier L, The tide is turning: Turbine Rides Underwater Currents Like
a Kite. Scientific American, 2008. Available from:
http://www.scientificamerican.com/article.cfm?id=turbine-that-rides-the-tide
[Accessed 31st August 2010]
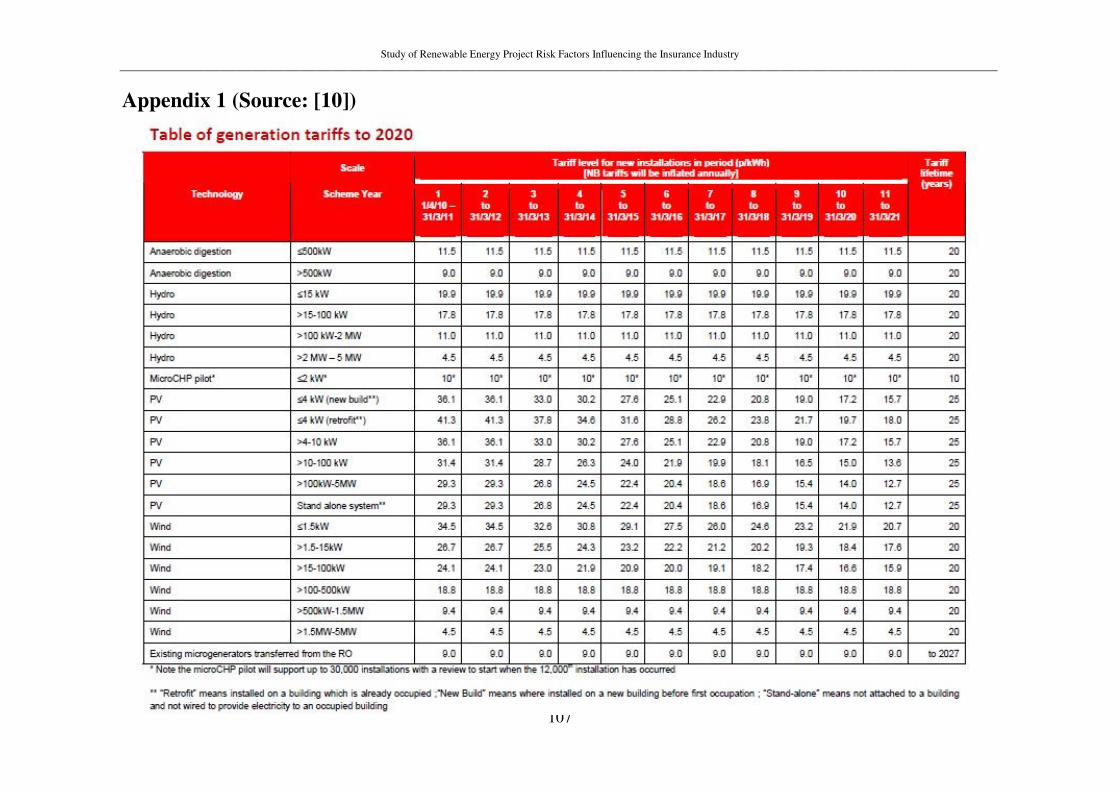
Study of Renewable Energy Project Risk Factors Influencing the Insurance Industry _____________________________________________________________________________________________________________________________________________________________________
107
Appendix 1 (Source: [10])
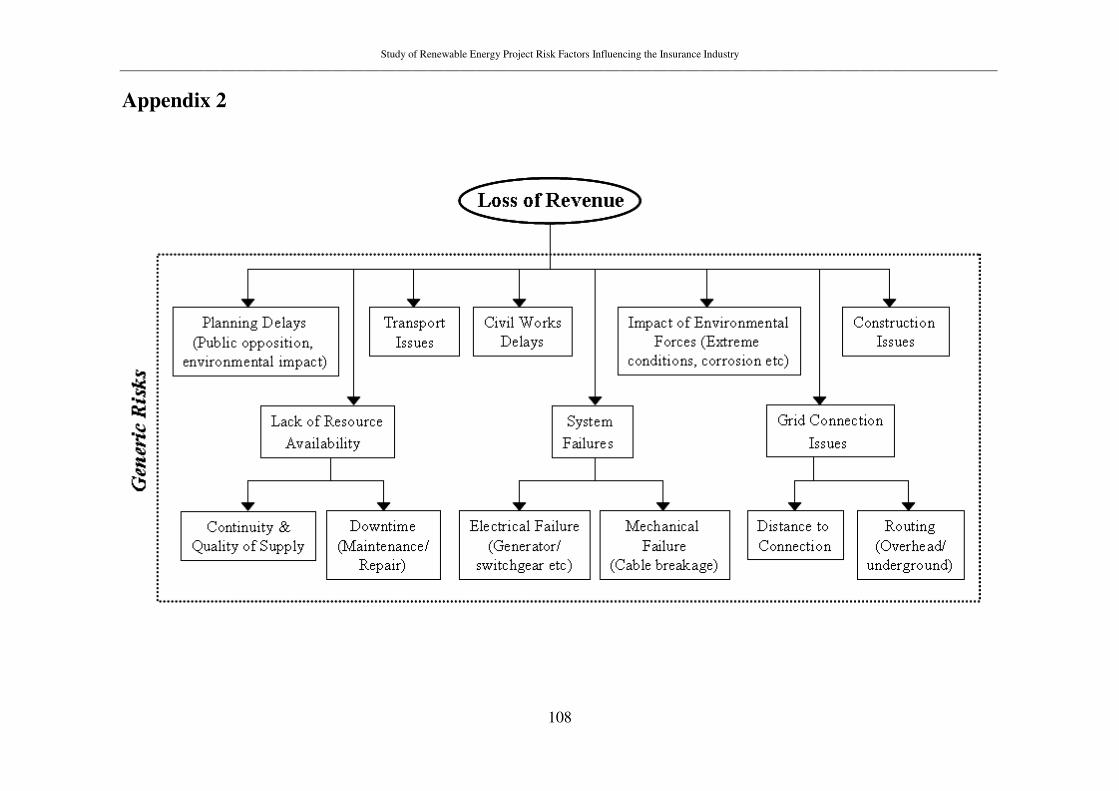
Study of Renewable Energy Project Risk Factors Influencing the Insurance Industry _____________________________________________________________________________________________________________________________________________________________________
108
Appendix 2
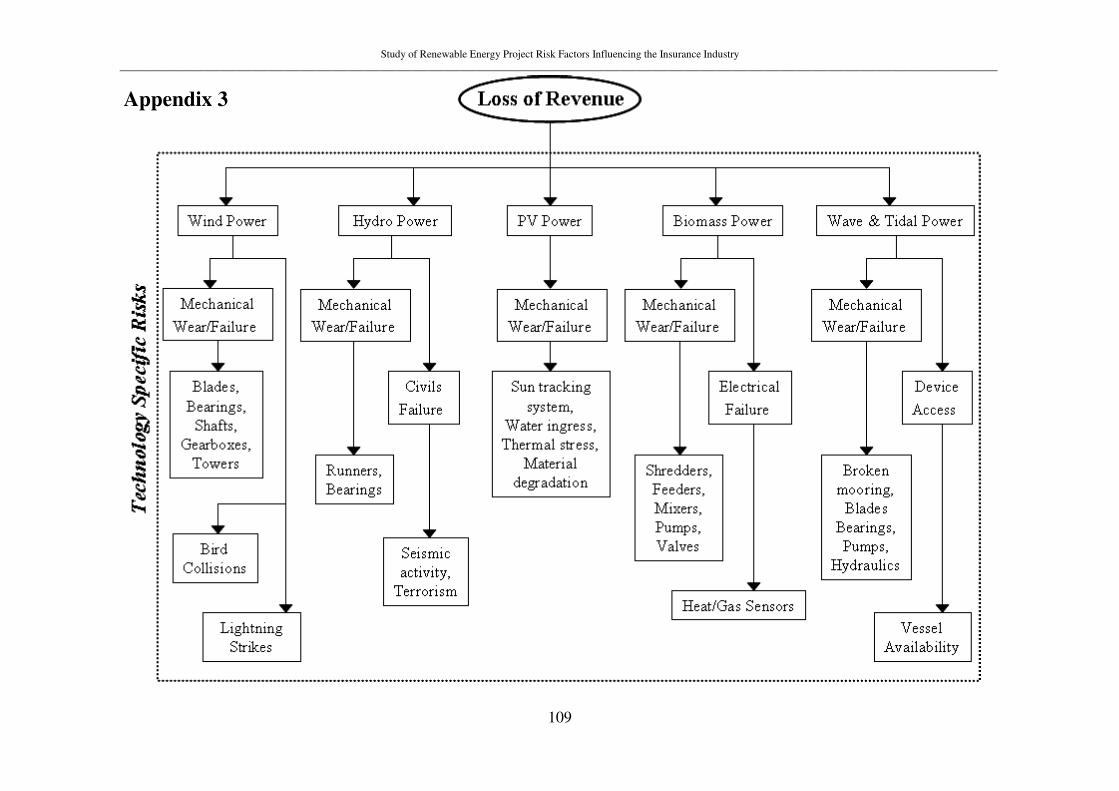
Study of Renewable Energy Project Risk Factors Influencing the Insurance Industry _____________________________________________________________________________________________________________________________________________________________________
109
Appendix 3