Embed Size (px)
Citation preview
Study of Reasons for Dropout at
Elementary Level
District Report: JanjgirChampa
May 2014
Study of Reasons for Dropout at
Elementary Level
District Report: JanjgirChampa
1
Study of Reasons for Dropout at

2
Table of Contents
LIST OF FIGURES ..................................................................................................................................... 3
LIST OF TABLES ...................................................................................................................................... 4
EXECUTIVE SUMMARY ........................................................................................................................... 6
SCHOOL RELATED FACTORS: ............................................................................................................................ 8
HOME RELATED FACTORS ................................................................................................................................ 8
1. BACKGROUNDBACKGROUNDBACKGROUNDBACKGROUND .................................................................................................................................. 11
2. DISTRICT PROFILE ....................................................................................................................... 14
2.12.12.12.1 PPPPROFILE ROFILE ROFILE ROFILE OF OF OF OF JJJJANJGIR ANJGIR ANJGIR ANJGIR CCCCHAMPAHAMPAHAMPAHAMPA ................................................................................................................ 14
2.1.1 GGGGENERAL ENERAL ENERAL ENERAL IIIINFORMATIONNFORMATIONNFORMATIONNFORMATION ....................................................................................................................... 14
2.1.2 SOCIO-DEMOGRAPHIC PROFILE ............................................................................................................... 15
2.1.3 EDUCATIONAL PROFILE ......................................................................................................................... 16
2.22.22.22.2 PPPPROFILE OF THE RESPONROFILE OF THE RESPONROFILE OF THE RESPONROFILE OF THE RESPONDENTSDENTSDENTSDENTS ............................................................................................................... 19
2.32.32.32.3 PPPPROFILE OF SCHOOLS VIROFILE OF SCHOOLS VIROFILE OF SCHOOLS VIROFILE OF SCHOOLS VISITEDSITEDSITEDSITED ................................................................................................................ 20
2.3.12.3.12.3.12.3.1 BBBBASIC INFORMATIONASIC INFORMATIONASIC INFORMATIONASIC INFORMATION ........................................................................................................................... 20
2.3.22.3.22.3.22.3.2 IIIINFRASTRUCTURENFRASTRUCTURENFRASTRUCTURENFRASTRUCTURE ............................................................................................................................... 21
3. REASONS FOR DROP OUT .......................................................................................................... 25
3.1 SCHOOL RELATED FACTORS: .................................................................................................................... 26
3.1.1 Lack of interest in studies .............................................................................................................. 26
3.1.2 Language barriers and discrimination at school............................................................................ 26
3.2 HOME RELATED FACTORS ........................................................................................................................ 28
3.2.1 Poor economic condition and migration ....................................................................................... 28
3.2.2 Low value attached to formal education ...................................................................................... 29
3.2.4 Poor community participation ...................................................................................................... 30
4. CONCLUSIONS ............................................................................................................................. 32
5. RECOMMENDATIONS ................................................................................................................. 33
ANNEXURE 1: LIST OF RESPONDENTS ............................................................................................................. 35
ANNEXURE 2: FIELD SCHEDULE VISIT ............................................................................................................. 38
ANNEXURE 3: TOOLS .................................................................................................................................... 39

3
List of Figures
Figure 1: Reasons for Drop Out ................................................................................................................................. 11
Figure 2: Teacher distribution according to qualification ................................................................................ 18
Figure 3: Teachers distribution according to professional qualification ...................................................................... 18
Figure 4: Comparison of schools visited on key performance indicators ..................................................................... 24
Figure 5: Reasons for dropouts in Janjgir .................................................................................................................. 25
Figure 6: Families that migrate ................................................................................................................................. 28
Figure 7: Distribution of families according to access to financial assets ................................................................... 29

4
List of Tables
Table 1: Area under agriculture ................................................................................................................................. 14
Table 2: Industrial Profile ......................................................................................................................................... 15
Table 3: Socio Economic profile of the district ........................................................................................................... 16
Table 4: School to Village ratio ................................................................................................................................. 16
Table 5: Teachers availability in government and private schools ............................................................................... 16
Table 6: Availability of teachers, sanctioned as compared with in position in the district and state ............................. 17
Table 7: Performance of district on key infrastructural indicator ................................................................................. 19
Table 8: Profile of families visited ............................................................................................................................. 19
Table 9: Basic information of Schools visited ............................................................................................................ 21
Table 10: Infrastructure of 16 schools visited ............................................................................................................ 22

5
Acknowledgements
The team at Ernst & Young LLP would like to thank the State Council for Education Research and Training (SCERT),
Chhattisgarh for providing us the opportunity to carry out this study. The study itself would be a mere shadow of its
current form and depth had we not received guidance and support from officials at SCERT and the education officers at
the Blocks and Circles covered under the study.
We would also like to thank the head teachers and staff at the various schools we visited for extending their full
cooperation and support. Without their keen interest we would not have been able to deliver the quality required to
make this work product meaningful and actionable.
Last but not the least, we would like to express our gratitude for the parents and children who took out time to interact
with us and showed us the path to deciphering the reasons why students are dropping out of schools. On this note, we
would like to dedicate this report to the students who have dropped out of the formal schooling system in Chhattisgarh
and hope our findings and our suggestions/recommendations would enable the state to bring them back to school.
6
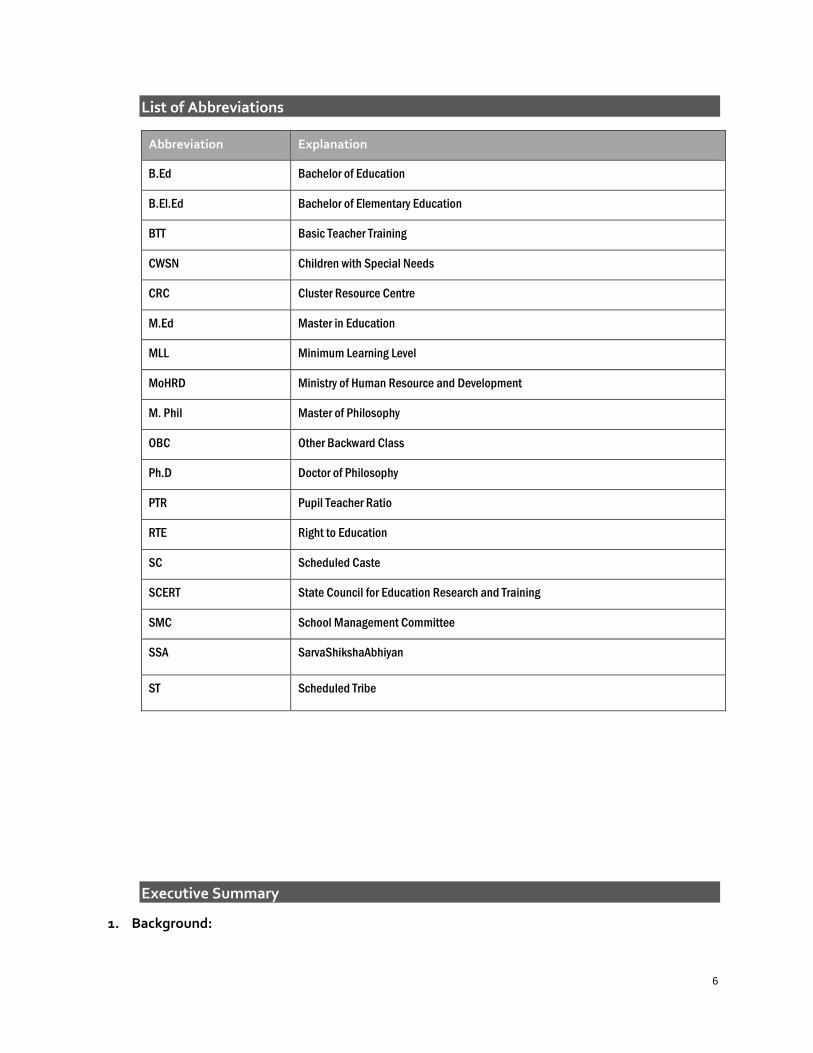
List of Abbreviations
Abbreviation Explanation
B.Ed Bachelor of Education
B.El.Ed Bachelor of Elementary Education
BTT Basic Teacher Training
CWSN Children with Special Needs
CRC Cluster Resource Centre
M.Ed Master in Education
MLL Minimum Learning Level
MoHRD Ministry of Human Resource and Development
M. Phil Master of Philosophy
OBC Other Backward Class
Ph.D Doctor of Philosophy
PTR Pupil Teacher Ratio
RTE Right to Education
SC Scheduled Caste
SCERT State Council for Education Research and Training
SMC School Management Committee
SSA SarvaShikshaAbhiyan
ST Scheduled Tribe
Executive Summary
1. Background:

7
One of the biggest challenges that the education sector faces is the problem of school dropouts. Addressing the issue of
dropout is particularly difficult because there is no standard definition of ‘dropouts’ and as a result there is no standard
procedure for identifying them and bringing them back to school. As per DISE, in 2011-2012, the estimated number of
dropouts in India was 8.9 million.
A closely related issue to dropout is the issue of out of school children, on which more elaborate studies have been conducted.
As per a sample survey report by the Ministry of Human Resource and Development (MoHRD) and Ed.CIL, in the year 2009 there
were approximately 8.1 million out of school children in India. More recently as per a parliamentary update, the number of out
of school children in the year 2012 was estimated to be 16 million.
In Chhattisgarh, as per government records, in the year 2011 approximately 1, 78,500 children were out of school. This
suggests that roughly 3.5 per cent of primary school going children and 5.5 per cent of upper primary school going children
were out of school. Further, the out of school rates were observed to be higher for girls. At the primary level, 3.4 per cent of boys
were found to be out of school and the corresponding figure for girls stood at 3.7 per cent. Similarly at the upper primary level,
5.4 per cent of boys were found to be out of school and the corresponding figure for girls stood at 5.8 per cent.
While there is a broad understanding of the reasons for out of school children, there is a dearth of comprehensive studies that
showcase specific reasons for dropout and also identify the strategic steps that are required to be taken at a systemic level to
address dropout. While dropouts may constitute a subset of out of school children, their circumstances and reasons need to be
identified and studied independently. This study is directed toward unearthing these reasons and developing an in-depth
qualitative understanding of how various variables combine to lead to a child dropping out of school. The study seeks to
understand the interplay between reasons in order to determine which reasons have the potential to combine and increase a
child’s vulnerability to dropping out of school.
2. Methodology:
The study was mainly qualitative in nature, with a quantitative aspect included to both substantiate the qualitative data and
also triangulate it. The study included data collection from 16 schools from two blocks namely Nawagarh and Pamgarh.The
clusters selected were Katoud and Janjgir in Nawagarh and Bhaiso, Loharsi, Rahod and Mulmula in Pamgarh. The clusters and
schools in these clusters were chosen in consultation with CRCs. The schools were selected to ensure a mix of primary and
upper primary schools, as well as to ensure that there were at least five dropouts from each school.For the purpose of study a
dropout has been defined as a child who has not attended the school for a month or more due to any reasons except for illness.
This operational definition was derived in consultation with SCERT.
A range of research tools such as interview checklists, FGDs, household survey were used to gain perspective from a variety of
respondents at the school, village and district level. In each school, interviews were conducted with Head Teachers and FGDs
with children. In each village, where the school was present parents of five dropout children were interviewed through a
household questionnaire. Additionally one SMC member from each village was also interviewed. A total of 16 Head Teachers
were interviewed, 16 FGDs were conducted, household survey was undertaken in 80 households and 16 SMC members were
interviewed. Interviews were also conducted with CRCs, BRCs and DEO.
3. Profile of schools visited:
For the purpose of the study the team visited 16 government schoolsconsisting of 11 primary and five middle schools providing
education to 2037 children in total. Fourout of the 16schools were located in urban setting of Janjgirwhile the rest were located
in rural settings. The pupil teacher ratio was found to higher than district average in seven of the 16 schools visited.

8
Infrastructurewas found to be comparatively better than the district average with buildings and at least two classrooms present
for all the schools visited. Six of the 16 schools lacked boundary walls and playground was found common for most primary,
middle and secondary schools.
In seven of the 16 schools visited, electricity was not present and only three schools were found not having adequate supply of
drinking water. In all schools visited separate toilet building for girls and boys was present. However, in 10 schools the toilets
were not found to be used by children due to unavailability of water and poor maintenance. For the Children with Special Needs
(CWSN), ramps were present in nineschools and separate toilets for CWSN was present in 11 of the schools.
4. Key findings:
School related factors:
Lack of interest in studiesLack of interest in studiesLack of interest in studiesLack of interest in studies: A number of families of children who had dropped out of school reported that their children were not
interested in studies. Two main reasons for this were lack of infrastructure and irregularity of teachers. Teachers’
noninvolvement and inertia in addressing the disinterest of children was also seen. Efforts to understand the child’s concern,
parent’s apathy or family condition was found to be limited. Most teachers visited households once in a year during enrolment
drives for children and undertake a household survey process.
Language barriers and discrimination at schoolLanguage barriers and discrimination at schoolLanguage barriers and discrimination at schoolLanguage barriers and discrimination at school: Drop out and long absenteeism was reported by teachers and lack of interest
among the children of these communities for studies. Discussions with the parents and children revealed that the children
could not understand the language of their teachers. The teachers however claimed to understand the children’s language and
shared that they could relate to them. Children interviewed had low level of reading and writing skills and could not recognize
simple alphabets and calculations. However, to be fair to the teachers, they would require text books and educational aids in
the local dialect to teach children. On the other hand any special effort by them to help the children overcome this barrier was
not visible.
Home related factorsHome related factorsHome related factorsHome related factors
Poor economic condition and migrationPoor economic condition and migrationPoor economic condition and migrationPoor economic condition and migration :Seasonal migration in search for work was found to be an important factor that caused
absenteeism of children from school, impacted their interest in studies and finally resulted in drop out from school. Our study
showed that 61 per cent of the families visited by the team, migrated frequently for work to Raipur or states like Jammu, Leh,
Delhi and Haryana. The usual time for migration is after the harvesting season and on an average poor household migrated for
4-5 months. During migration the education of children got affected since they rarely took admission n local schools where
their parents migrate. Besides, long absence from school led to their inability to cope with studies, thereby making them
vulnerable to dropping out.
Low priority among parents towards formal education of children was found to be an important reason for drop outLow priority among parents towards formal education of children was found to be an important reason for drop outLow priority among parents towards formal education of children was found to be an important reason for drop outLow priority among parents towards formal education of children was found to be an important reason for drop out. It was
found that parents of drop out students had poor educational status. 89 per cent of the mothers and 41 per cent of fathers were
illiterate or primary school incomplete. Lack of awareness along with everyday struggle for existence restricted parents to
attend such meetings and monitor their child’s progress in school. It was also evident that there was very weak linkage or
contact between the schools and the parents.
Non supportive environment at home Non supportive environment at home Non supportive environment at home Non supportive environment at home :During the study it was found that children were getting limited support from their homes
for continuing their education. An enabling environment at home can boost a child’s learning process. There also seems to exist

9
a strong gender dimension to the problem. Quite often education of children is considered to be the responsibility of mothers.
Since a high proportion of mothers were illiterate, they were not able to support their child. Given the fact that most of these
parents of drop out children worked as daily wage earners it seemed difficult for them to monitor the progress of their children
at home. Since most of the parents worked as daily wage earners they would leave early for work and would also not know if the
child had gone to school or not.
Poor community participationPoor community participationPoor community participationPoor community participation: During the study the team observed weak participation of community in the schooling system. In
most of the cases SMCs role were limited to fund disbursement meetings involving building construction, repair and other
monetary expenditures. Discussion on drop out, quality of teaching, teacher’s absenteeism and class irregularity did not exist in
their meeting records. Parent teacher meeting are also considered as platform for community participation in school processes.
However during our study it was found that parent teacher meetings were not conducted regularly. In household survey, 64 per
cent of the respondents reported never having heard of parent teachers meeting being conducted and not being contacted from
school side. This finding points out to the fact that little effort is being diverted into organizing parent teacher meeting.
Thus a look at the aforementioned reasons for children dropping out of school before completing their elementary education
outlines the need for greater coordination among the schools, parents and the communities; facilitation of a process whereby
parents are able to associate with the schools and take greater ownership of the education of their children.
5. Conclusions 1. Teacher’s shortage and irregular classes do have an impact on interest of children towards studiesTeacher’s shortage and irregular classes do have an impact on interest of children towards studiesTeacher’s shortage and irregular classes do have an impact on interest of children towards studiesTeacher’s shortage and irregular classes do have an impact on interest of children towards studies. Since most of the students
are first generation learners, school becomes the only place where they can learn and their interest in studies nutured. If loosing
interest in studies emerged as major reason for drop out among students the school and its teaching process do have a major
role to play in it. Somewhere inadequate number of teachers along with monotonous teaching method also contributed to
children loosing interest and finally dropping out of school.
2. Migration due to poor economic condition of families was causing children to miss classesMigration due to poor economic condition of families was causing children to miss classesMigration due to poor economic condition of families was causing children to miss classesMigration due to poor economic condition of families was causing children to miss classes for a period of 4-5 months. Children
found it extremely difficult to cope up with studies once they missed their classes and absence of any extra classes or support
on part of teachers compounded the problem. Provisions under RTE are also not being properly implemented and admissions
denied on the basis of transfer certificates to migrant children in other schools. Low level of parent’s awareness about their
rights and RTE was also found.
3. There is limited contact between teachers and parents to discuss about education of chThere is limited contact between teachers and parents to discuss about education of chThere is limited contact between teachers and parents to discuss about education of chThere is limited contact between teachers and parents to discuss about education of childrenildrenildrenildren. Parents are largely unaware of
their children progess in school and teachers about the children circumstances and family conditions. There is limited effort in
establishing a rapport between parents and teachers.
4. There seemed to be a strong belief among teachers and parents that child’s dropping out and his low learning was hugely due
to his lack of motivation and interest in studieslack of motivation and interest in studieslack of motivation and interest in studieslack of motivation and interest in studies and they had little role to play in it. Teachers and parents both blame the child
for his poor learning skills. For them the child’s learning was his and only his responsibility and dependent on his own efforts. It
seemed that teachers had little understanding of needs of first generation learners and expected enabling home environment
and responsible parents as necessary conditions for children continuing their studies.
6. Recommendations:
The key recommendations based on findings of the study for the district are given below.
► Developing a firm policy to ensure education of migrant firm policy to ensure education of migrant firm policy to ensure education of migrant firm policy to ensure education of migrant childrenchildrenchildrenchildren- During the study it was found that migrant children were being
denied admissions in other states where theirfamilies migrated for work. Under the RTE Act no child can be denied admission to
any school. Circulars informing the same needs to be issued to every school and school management committees need to be
10
informed to monitor the same. Addressing child’s learning gap due to migration need concerted efforts between two states and
two schools.
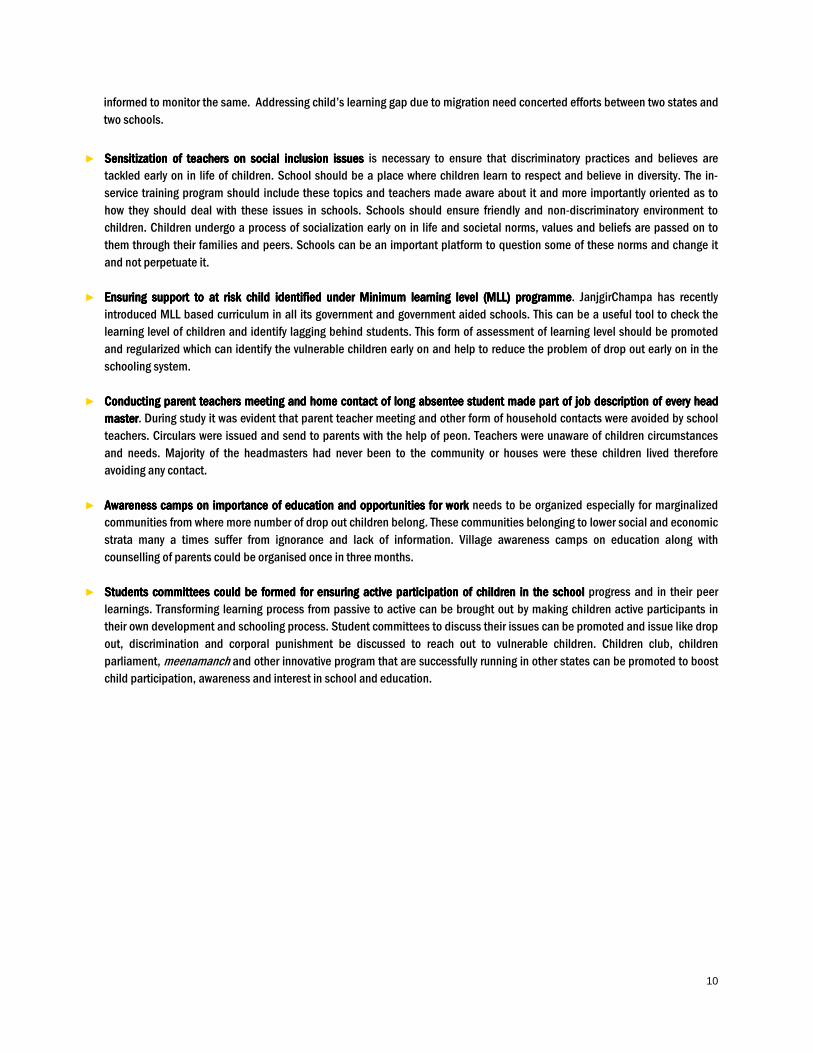
► Sensitization of teachers on social inclusion issueSensitization of teachers on social inclusion issueSensitization of teachers on social inclusion issueSensitization of teachers on social inclusion issuessss is necessary to ensure that discriminatory practices and believes are
tackled early on in life of children. School should be a place where children learn to respect and believe in diversity. The in-
service training program should include these topics and teachers made aware about it and more importantly oriented as to
how they should deal with these issues in schools. Schools should ensure friendly and non-discriminatory environment to
children. Children undergo a process of socialization early on in life and societal norms, values and beliefs are passed on to
them through their families and peers. Schools can be an important platform to question some of these norms and change it
and not perpetuate it.
► Ensuring support to at risk child identified under MiEnsuring support to at risk child identified under MiEnsuring support to at risk child identified under MiEnsuring support to at risk child identified under Minimum learning level (MLL) programnimum learning level (MLL) programnimum learning level (MLL) programnimum learning level (MLL) programmemememe. JanjgirChampa has recently
introduced MLL based curriculum in all its government and government aided schools. This can be a useful tool to check the
learning level of children and identify lagging behind students. This form of assessment of learning level should be promoted
and regularized which can identify the vulnerable children early on and help to reduce the problem of drop out early on in the
schooling system.
► Conducting parent teachers meeting and home contact of long absentee student made part of job descriptConducting parent teachers meeting and home contact of long absentee student made part of job descriptConducting parent teachers meeting and home contact of long absentee student made part of job descriptConducting parent teachers meeting and home contact of long absentee student made part of job description of every head ion of every head ion of every head ion of every head
mastermastermastermaster. During study it was evident that parent teacher meeting and other form of household contacts were avoided by school
teachers. Circulars were issued and send to parents with the help of peon. Teachers were unaware of children circumstances
and needs. Majority of the headmasters had never been to the community or houses were these children lived therefore
avoiding any contact.
► Awareness camps on importance of education and opportunities for workAwareness camps on importance of education and opportunities for workAwareness camps on importance of education and opportunities for workAwareness camps on importance of education and opportunities for work needs to be organized especially for marginalized
communities from where more number of drop out children belong. These communities belonging to lower social and economic
strata many a times suffer from ignorance and lack of information. Village awareness camps on education along with
counselling of parents could be organised once in three months.
► Students committees could be formed for ensuring active participation of children in the schoolStudents committees could be formed for ensuring active participation of children in the schoolStudents committees could be formed for ensuring active participation of children in the schoolStudents committees could be formed for ensuring active participation of children in the school progress and in their peer
learnings. Transforming learning process from passive to active can be brought out by making children active participants in
their own development and schooling process. Student committees to discuss their issues can be promoted and issue like drop
out, discrimination and corporal punishment be discussed to reach out to vulnerable children. Children club, children
parliament, meenamanch and other innovative program that are successfully running in other states can be promoted to boost
child participation, awareness and interest in school and education.
11
1. BackgroundBackgroundBackgroundBackground
1111....1111 Rationale Rationale Rationale Rationale for the studyfor the studyfor the studyfor the study
One of the biggest challenges that the education sector faces is the problem of school dropouts, which proves to be an
impediment to achieving the mandate of universalization of education. Addressing the issue of dropout is particularly difficult
because there is no standard definition of ‘dropouts’ and as a result there is no standard procedure for identifying them and
bringing them back to school.
A few studies have developed an approximation of the number of dropouts on the basis of their own definitions. In 2011-2012,
DISE estimated the number of dropouts in India at 8.9 million. However, estimates from other sources differ from these
numbers because of a difference in the way they define dropouts. Nevertheless, there is a consensus that the number of
dropouts in the country is high and that the problem of dropout warrants attention.
A closely related issue to dropout is the issue of out of school children, on which more elaborate studies have been conducted.
As per a sample survey report by the Ministry of Human Resource and Development (MoHRD) and EdCIL, in the year 2009 there
were approximately 8.1 million out of school children in India. More recently as per a parliamentary update, the number of out
of out of school children in the year 2012 was estimated to be 16 million.
In Chhattisgarh, as per government records, in the year 2011 approximately 1,78,500 children were out of school. This
suggests that roughly 3.5 per cent of primary school going children and 5.5 per cent of upper primary school going children
were out of school. Further, the out of school rates were observed to be higher for girls. At the primary level, 3.4 per cent of boys
were found to be out of school and the corresponding figure for girls stood at 3.7 per cent. Similarly at the upper primary level,
5.4 per cent of boys were found to be out of school and the corresponding figure for girls stood at 5.8 per cent.
It is also important to note that the percentage of out of school children was marginally higher in the case of children from
Scheduled Tribes. The out of school percentages for children from Scheduled Tribes at the primary and upper primary level were
4.7 and 8.1 per cent respectively.
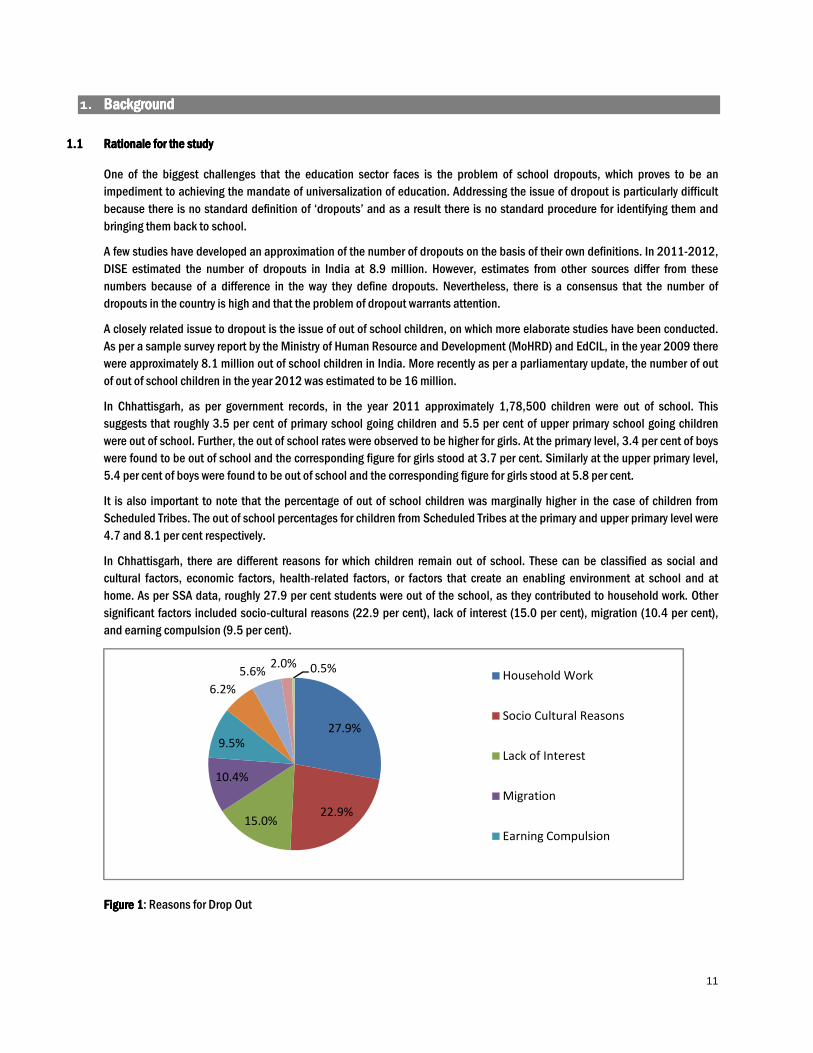
In Chhattisgarh, there are different reasons for which children remain out of school. These can be classified as social and
cultural factors, economic factors, health-related factors, or factors that create an enabling environment at school and at
home. As per SSA data, roughly 27.9 per cent students were out of the school, as they contributed to household work. Other
significant factors included socio-cultural reasons (22.9 per cent), lack of interest (15.0 per cent), migration (10.4 per cent),
and earning compulsion (9.5 per cent).
Figure Figure Figure Figure 1111: Reasons for Drop Out
27.9%
22.9%15.0%
10.4%
9.5%
6.2%
5.6%2.0% 0.5%
Household Work
Socio Cultural Reasons
Lack of Interest
Migration
Earning Compulsion

12
While there is a broad understanding of the reasons for out of school children, specific reasons for dropout need to be
understood to identify strategic steps required to be taken at a systemic level to address the issue of dropout. While dropouts
may constitute a subset of out of school children, their circumstances and reasons need to be identified and studied
independently.
In this context, the problem of dropouts is an area of major concern for any educational system as it clearly highlights the
system’s inability to retain the students it has worked hard to enrol. Successfully bringing dropped out students back into the
formal schooling system can ensure that the government does not forgo the investment it has already made towards building
their capacity.
Developing a deeper appreciation for the implicit reasons that lead to children dropping out of school and developing an
understanding of the socio-cultural and economic landscape in which these reasons prevail is necessary to develop
programmes and measures to address these issues.
This study is directed toward unearthing these reasons and developing an in-depth qualitative understanding of how various
variables combine to lead to a child dropping out of school. The study seeks to understand the interplay between reasons in
order to determine which reasons have the potential to combine and increase a child’s vulnerability to dropping out of school.
1111....2222 Terms of ReferenceTerms of ReferenceTerms of ReferenceTerms of Reference
In light of the aforementioned rationale, the study seeks to establish a better understanding of the factors that contribute to a
child’s vulnerability to dropping out of school. In order to cover for geographic disparity in reasons as well capture variations
caused by changes in the socio-economic landscape, the study was undertaken in five districts of Chhattisgarh. Therefore, the
specific objectives of this research study were:
► To compare students dropout rates of across the districts covered under the study and benchmark the same against the state
and national aggregates;
► To compare students dropout rates across type of locality (rural/urban), level of schooling (Primary/Upper Primary), gender
(male/female), and community category (SC/ST/OBC/ Minority/Others); and
► To find out district specific reasons for dropout thereby commenting upon reasons for dropout at the state level.
1111....3333 MethodologyMethodologyMethodologyMethodology
Given the mandate of the study and the larger goal that it ascribes to; the study was conducted through a mixed-methodology
approach that laid emphasis on identifying the right informants to seek the right information in order to develop relevant and
meaningful insights.
The study was conducted in five districts of Chhattisgarh – Balrampur, Janjgir-Champa, Kanker, Mungeliand Raipur. These
districts were selected by SCERT so that each region of the state was represented, to ensure a representative mix of tribal and
non-tribal districts as well as a mix of urban and rural districts. From each district, two blocks were selected in consultation with
SCERT. These blocks represented a mix of educationally backward and general blocks, Tribal Welfare Department and
Education Department, and rural and urban blocks. From Nawagarh block two clusters were chosen and fromPamgarh four
clusters were chosen. Finally, from each cluster four schools were chosen. The schools were selected to ensure a mix of primary
and upper primary schools, as well as to ensure that there were at least five dropouts from each school.
For the purpose of study a dropout has been defined as a child who had not attended the school for one month or more due to
any reasons except for illness. This operational definition was derived in consultation with SCERT.
The following section describes in detail different aspects of the methodology.
Study DesignStudy DesignStudy DesignStudy Design

13
The study results are based on a combination of analysis of qualitative and quantitative data. This data/information has been
collected and collated using a combination of three tools – household questionnaires, focused group’s discussions and semi-
structured interviews. The study results have been developed while maintaining statistical significance as household surveys
were administered to a sample of 400 households, semi-structured interviews were held with head teachers at 80 schools,
focused group discussions were conducted with children at 80 schools and semi-structured interviews were administered to
School Management Committee (SMC) members at 80 villages.
Within JanjgirChampa, household surveys were administered to 80 households. Additionally, semi-structured interviews were
held with head teachers at 16 schools. Semi-structured interviews were also held with the SMC members at these schools and
focused group discussion were held with students at these 16 schools.
Target RespondentsTarget RespondentsTarget RespondentsTarget Respondents
The target respondents in the study are the parents of children who have dropped out, head teachers at schools, children both
from primary and upper primary schools, SMC members, representatives of local governance bodies, officials at block and
district level and representatives of SCERT, SSA and Tribal Welfare Department at the state level.
Study ToolsStudy ToolsStudy ToolsStudy Tools
Household questionnaire: Household questionnaire: Household questionnaire: Household questionnaire: The objective of the household questionnaire was to understand parents’ perception of dropout. The
questionnaire, while designed to record the exact reason for dropout, also attempted to understand the profile of the household
and the socio-economic and psychological reasons that contribute to dropout.
Focus Group Discussions: Focus Group Discussions: Focus Group Discussions: Focus Group Discussions: FGDs were conducted with children at all the schools that were visited as a part of the study. The
FGDs were conducted in order to capture children’s perspective of the underlying factors for dropout. These also helped to
identify the children’s opinion about their school and their teachers.
Semi Structured Interviews: Semi Structured Interviews: Semi Structured Interviews: Semi Structured Interviews: Semi structured interviews were administered to the following stakeholders:
► Head Teachers:Head Teachers:Head Teachers:Head Teachers:Discussions were held with the head teachers at the schools covered under the study in order to record their
understanding and perspective of the problem dropout. The interview was used to collect information regarding the head
teacher’s understanding of the issue, the reasons that lead to the same and the processes followed or to be followed in order to
address the issue.
► SMC members: SMC members: SMC members: SMC members: Discussions with SMC members provided insights on their understanding of dropout, their role in curbing
dropout rates in their community and their understanding of their larger roles and responsibilities as identified under the RTE.
► District/State level officials:District/State level officials:District/State level officials:District/State level officials:The objective of interviewingdistrict/state level officials was to understand their perception on
dropout. These interviews also helped to understand some of the interventions that have been undertaken to control dropout
and the results that have been achieved.
1111....4444 Data analysis and reportingData analysis and reportingData analysis and reportingData analysis and reporting
The information from the household surveys was transformed into an electronic spreadsheet which was subsequently cleaned
under defined statistical processes. The spreadsheet was then analysed using suitable statistical packages/software. The
qualitative information from the household questionnaires was coded where possible and added to the electronic dataset.
Information recording sheets were developed to capture the qualitative information that could not have been coded. This
information was analysed and used to develop anecdotal evidence/case studies.
The information collected through the FGDs with students and semi-structured interviews with head teachers and SMC
members were also assembled into recording sheets. Where possible similarity in responses was classified and unified to
determine trends and absolute number frequencies.
14
1111....5555 LimitationsLimitationsLimitationsLimitations
► This study is based entirely on the team’s interactions with parents of children who have dropped out, children both from
primary and upper primary schools, SMC members, representatives of local governance bodies, officials at block and district
level and representatives of SCERT, SSA and Tribal Welfare Department at the state level. Thus, the scope of the study is limited
to the information that was available from these sources.
► As part of the study, the team was required to collect data on dropout for the last five years from the schools that were visited. In
the absence of a mandate to keep data on dropout at school level and also a common format to record it, the team has been
able to collect limited data.
2. District profile
2222....1111 Profile of JanjgirChampaProfile of JanjgirChampaProfile of JanjgirChampaProfile of JanjgirChampa
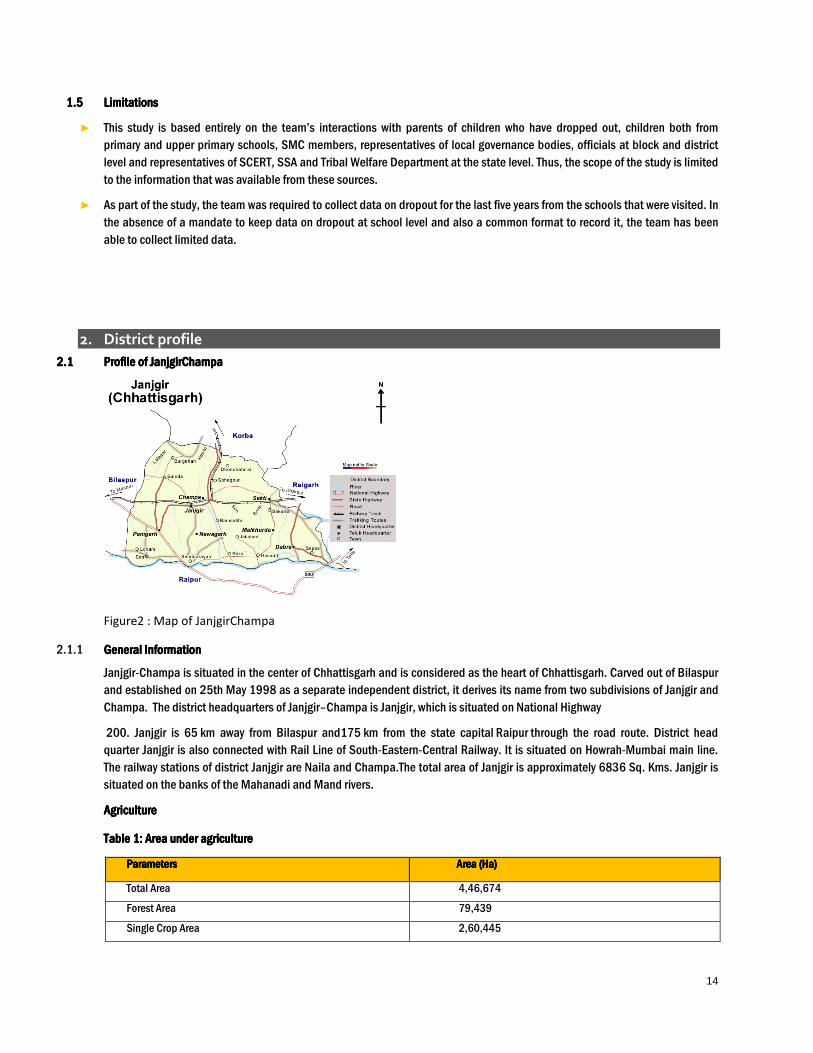
Figure2 : Map of JanjgirChampa
2.1.1 General InformationGeneral InformationGeneral InformationGeneral Information
Janjgir-Champa is situated in the center of Chhattisgarh and is considered as the heart of Chhattisgarh. Carved out of Bilaspur
and established on 25th May 1998 as a separate independent district, it derives its name from two subdivisions of Janjgir and
Champa. The district headquarters of Janjgir–Champa is Janjgir, which is situated on National Highway
200. Janjgir is 65 km away from Bilaspur and175 km from the state capital Raipur through the road route. District head
quarter Janjgir is also connected with Rail Line of South-Eastern-Central Railway. It is situated on Howrah-Mumbai main line.
The railway stations of district Janjgir are Naila and Champa.The total area of Janjgir is approximately 6836 Sq. Kms. Janjgir is
situated on the banks of the Mahanadi and Mand rivers.
Agriculture Agriculture Agriculture Agriculture
Table Table Table Table 1111: Area under agriculture: Area under agriculture: Area under agriculture: Area under agriculture
ParametersParametersParametersParameters Area (Ha)Area (Ha)Area (Ha)Area (Ha)
Total Area 4,46,674
Forest Area 79,439
Single Crop Area 2,60,445

15
Agriculture is the primary occupation of the people in the district. Janjgir Champa is a major producer of paddy in the state. It is
also the major hub for agricultural trade and a major local market for fresh farm supplies. Rice is the most important cereal
crop grown in Janjgir Champa district of Chhattisgarh state. However, only one crop is cultivated in a year in most of the areas
due to nonavailability of water for the second crop. Table 1 reveal that of the total sown area of 323, 599 Hectares the single
crop grown area is 2,60,445 Hectares. Double crop grown area consists of only 63, 154 Hectares. This specially affects the
marginal and small farmers whose single harvest cannot sustain them for rest of the year. Migration is a coping mechanism
through which the poor famers sustain their livelihood.
Industrial profileIndustrial profileIndustrial profileIndustrial profile
The district is all set to become an industrial town with large number of thermal power plants and its associated development
waiting to happen. The state of Chhattisgarh has signed MoUs with different companies to establish 34 power plants in Janjgir
Champa and nearly 40,000 acres of land is reported to be acquired for the same. Though the district does not have any coal or
mineral resource reserves, its proximity to coal rich and most industrialised district of Korba has made it the next sought after
destination for industries to be set up. Janjgir with good rail and road connectivity to Jharkhand and Odisha with least forest
cover area in the district is set to become the next destination of industrial development.
The registered industrial units in the district is 1296 and the average number of daily workers employed in small industries was
6520 in 2010-11. The major industries are that of steel, paper and cement. With large number of industries being planned in
the district, it ishoped that high migration in the region would be checked and more locals will gain employment. However, at
present migration still persists and many people continue to migrate in search of employment.
Table Table Table Table 2222: Industrial Profile: Industrial Profile: Industrial Profile: Industrial Profile
HeadHeadHeadHead UnitUnitUnitUnit ParticularParticularParticularParticular
Registered industrial Units Number 1296
Total industrial Units Number 1296
Estimated Average Number of daily
workers employed in small scale
industries
Number 6520
Number of industrial area Number 1
Source: dcmsme.gov.in/dips/Janjgir-Champa.
2.1.2 Socio-demographic profile
Janjgir Champa is the 5th most populous district of Chhattisgarh after Surguja with a total population of 1,619,707 and forms
6 per cent of the total population of the state. It is the most densely populated district in the state with density of 421 per
square meter. Table 3 gives information on some of the relevant socio demographic indicators like education, population and
employment. The district is reported to have the largest share of Scheduled Caste (SC) population that constitutes 24.57
percent of the state’s population. The sex ratio of the district is 986 according to 2011 census, marginally below the state
average of 991. What is worrisome is that the sex ratio has shown a sharp decline since the last census.
Double Crop Area 63,154
Total Sown Area 323,599
Kharif Area 259,215
Rabi Area 64,384
Total Irrigated area 215,128
http://janjgir-champa.nic.in/files/aboutdistrict.ht

16
According to Census 2011, children in the age group of 0-6 years were 224,218 in the district. In 2011, children under 0-6
years formed 13.84 percent of the population compared to 17.06 percent in 2001. Average literacy rate of the district in 2011
rose to from 66.9 to 73.7.
Table Table Table Table 3333: : : : Socio Economic profile of the districtSocio Economic profile of the districtSocio Economic profile of the districtSocio Economic profile of the district
District InformationDistrict InformationDistrict InformationDistrict Information 2001200120012001 2011201120112011
Population 1,317,431 1,619,707
Education 66.9 73.7
Employment 43.7 52.26
2.1.3 Educational profile
This section presents a short profile of the district through the lens of key education indicators such as availability of
government schools, teacher availability and qualification and basic infrastructureof schools. Overall, as per the census 2011,
the literacy rate of JanjgirChampa was 73.7 per cent and nearly equal to the national average of 74.04 per cent. Compared to
2001 the literacy rate has improved significantly over the last recorded rate of 64.66 per cent.
SchoolsSchoolsSchoolsSchools
Overall there are 3151 schools in the district operating under central government, Tribal/Social Welfare Department, State
Government Education Department, private aided, private unaided and recognized madarsa. For majority of school going
children in the district government schools are main source of education. 85.49per cent of the total schools are government
(2694) and mostly located in rural areas. 1630 primary, 785 middle and 141 secondary schoolsare present in the district.
There are2871 co ed, 123‘boys only’and 157 ‘girls only’ schoolsin the district.The district also has significant number of private
schools (aided and unaided) and the number is growing. In the year 2012-2013 there were 449 private schools compared to
393 in the previous year. Table 5 shows the comparison between district and state school to village ratio. JanjgirChampa has a
ratio of 3which is marginally better than the state average of 2 schools per village.
Table Table Table Table 4444::::School to Village ratio
DistrictDistrictDistrictDistrict Number of villagesNumber of villagesNumber of villagesNumber of villages Number of schoolsNumber of schoolsNumber of schoolsNumber of schools Number of schools/ villageNumber of schools/ villageNumber of schools/ villageNumber of schools/ village
JanjgirChampa 933 3151 3.37
State 22204 58230 2.62
Source: DISE 2012-13
TeachersTeachersTeachersTeachers
There area total of 11,606government school teachers in the district.If we compare the school teacher ratio of government and
private schools, for every private school there are 8 teachers employed per school against the 4 teachers in government school.
The total number of teachers employed in private schools was reported to be3805. However, the district school teacher ratio is
nearly equal to the state school teacher ratio (4 ). More visibility of teachers as in the case of private schools gives rise to a
perception that there is more teaching happening in private schools.
Table 5: Teachers availability in government and private schools
DistrictDistrictDistrictDistrict Govt SchoolsGovt SchoolsGovt SchoolsGovt Schools Govt TeachersGovt TeachersGovt TeachersGovt Teachers Private schoolPrivate schoolPrivate schoolPrivate school Private teachersPrivate teachersPrivate teachersPrivate teachers
JanjgirChampaJanjgirChampaJanjgirChampaJanjgirChampa 2694 11606 449 3805

17
Availability of Availability of Availability of Availability of TeacherTeacherTeacherTeacher: P: P: P: Positioned ositioned ositioned ositioned visvisvisvis----àààà----vis vis vis vis sanctionedsanctionedsanctionedsanctioned The in position teachersagainst the sanctioned number in the district is less and a shortage of 6390 teachersexists (Table 6).
The shortage of permanent teachers was found to be more acute in middle schools with 4644 teachers post lying vacant. In
primary schoolsthere are 6844 teachers and 227 para teachers in position teachersagainst the 7231 permanent teachers
and9 para teachers sanctioned for the district. If we compare the district and state average on the said parameter we find
thatJanjgir (31 per cent)has more shortage of teachers compared to that of the state(24 per cent).
Table 6: Availability of teachers, sanctioned as compared with in position in the district and state
ParticularsParticularsParticularsParticulars Regular teacherRegular teacherRegular teacherRegular teacher Para teacherPara teacherPara teacherPara teacher TotalTotalTotalTotal
PrimaryPrimaryPrimaryPrimary U. PrimaryU. PrimaryU. PrimaryU. Primary PrimaryPrimaryPrimaryPrimary U. PrimaryU. PrimaryU. PrimaryU. Primary AllAllAllAll
Chhattisgarh sanctioned 101027 163610 1286 682 319538
Chhattisgarh in position 113202 63221 13030 7388 234905
Chhattisgarh-positioned as a percent of sanctioned
112% 39% 1013% 1083% 74%
JanjgirChampa sanctioned 7231 8705 9
0 20466
JanjgirChampa in position 6844 4061 227 88 14076
JanjgirChampa-positioned as a percent of sanctioned
95% 47% 2522%
69%
Source: DISE 2012-13
: Teacher distribution according to qualification
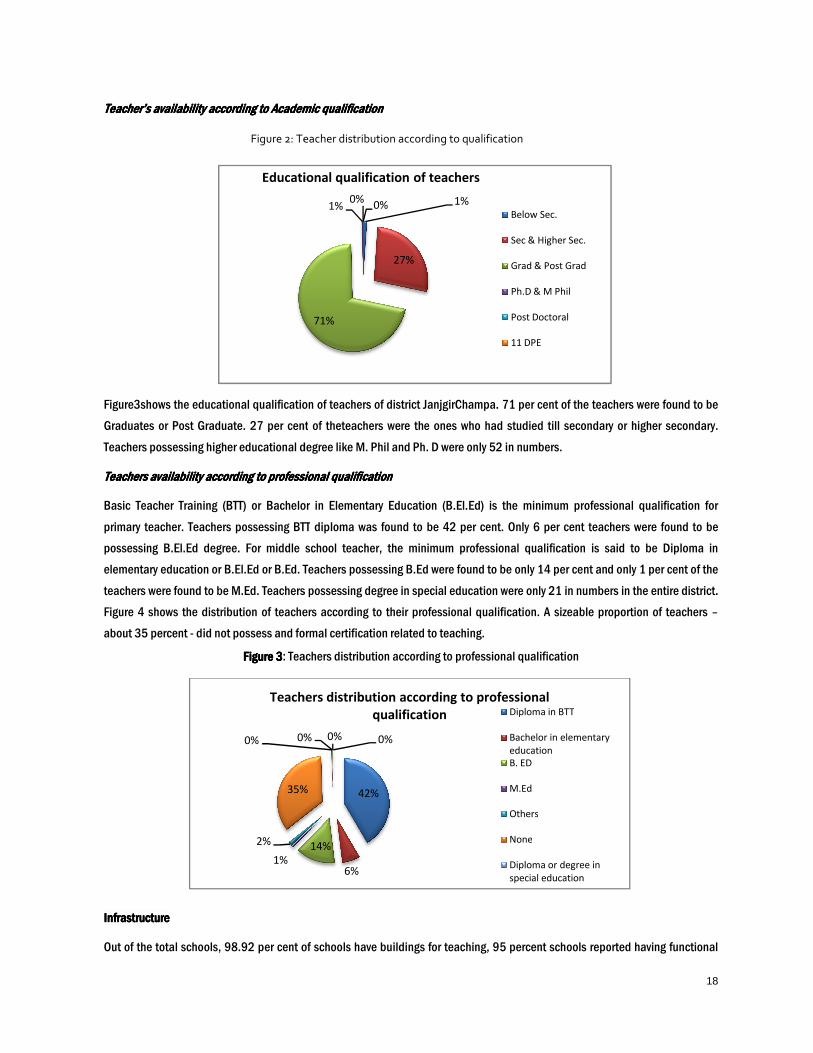
Figure 2: Teacher
TeacherTeacherTeacherTeacher’’’’s availability according to As availability according to As availability according to As availability according to Academic cademic cademic cademic
Figure3shows the educational qualification of teachers
Graduates or Post Graduate. 27 per cent
Teachers possessing higher educational degree like M. Phil and Ph. D were
Teachers availability according to professional qualificationTeachers availability according to professional qualificationTeachers availability according to professional qualificationTeachers availability according to professional qualification
Basic Teacher Training (BTT) or Bachelor in Elementary Education (B.El.Ed) is the minimum professional qualification for
primary teacher. Teachers possessing BTT
possessing B.El.Ed degree. For middle schoo
elementary education or B.El.Ed or B.Ed. Teachers possessing B.Ed were found to be only 14 per cent and only 1 per cent of th
teachers were found to be M.Ed. Teachers possessing de
Figure 4 shows the distribution of teachers according to their professional qualification.
about 35 percent - did not possess and formal certifica
Figure Figure Figure Figure 3333: Teachers distribution according to professional qualification
Infrastructure Infrastructure Infrastructure Infrastructure
Out of the total schools, 98.92 per cent of schools have
1%
2%
35%
0% 0%
Teachers distribution according to professional
Educational qualification of teachers
: Teacher distribution according to qualification
cademic cademic cademic cademic ququququalificationalificationalificationalification
shows the educational qualification of teachers of district JanjgirChampa. 71 per cent of the teachers
27 per cent of theteachers were the ones who had studied till secondary or higher secondary.
higher educational degree like M. Phil and Ph. D were only 52 in numbers.
Teachers availability according to professional qualificationTeachers availability according to professional qualificationTeachers availability according to professional qualificationTeachers availability according to professional qualification
or Bachelor in Elementary Education (B.El.Ed) is the minimum professional qualification for
BTT diploma was found to be 42 per cent. Only 6 per cent teachers
For middle school teacher, the minimum professional qualification is said to be Diploma in
elementary education or B.El.Ed or B.Ed. Teachers possessing B.Ed were found to be only 14 per cent and only 1 per cent of th
teachers were found to be M.Ed. Teachers possessing degree in special education were only 21 in numbers in the entire district.
shows the distribution of teachers according to their professional qualification. A sizeable proportion of teachers
did not possess and formal certification related to teaching.
Teachers distribution according to professional qualification
r cent of schools have buildings for teaching, 95 percent schools repo
42%
6%
14%
35%
0% 0% 0%
Teachers distribution according to professional
qualification Diploma in BTT
Bachelor in elementary
education
B. ED
M.Ed
Others
None
Diploma or degree in
special education
1%
27%
71%
1%0%
0%
Educational qualification of teachers
Below Sec.
Sec & Higher Sec.
Grad & Post Grad
Ph.D & M Phil
Post Doctoral
11 DPE
18
of the teachers were found to be
who had studied till secondary or higher secondary.
or Bachelor in Elementary Education (B.El.Ed) is the minimum professional qualification for
eachers were found to be
the minimum professional qualification is said to be Diploma in
elementary education or B.El.Ed or B.Ed. Teachers possessing B.Ed were found to be only 14 per cent and only 1 per cent of the
21 in numbers in the entire district.
A sizeable proportion of teachers –
95 percent schools reported having functional
Bachelor in elementary

19
toilets and88.19 percent have drinking water facilities. Schools with boundary water were 63.85 percent of the total, 43.79
percent had playgrounds and only half the school had electricity in their building. Percentages of schools with School
Management Committees (SMCs) were76.35. The details are given in table 7.
Table 7: Performance of district on key infrastructural indicator
IndicatorsIndicatorsIndicatorsIndicators JanjgirChampaJanjgirChampaJanjgirChampaJanjgirChampa PercentagePercentagePercentagePercentage
Total no of schools 3151 100
School with buildings 3117 98.92
Schools with boys hostel 18 0.57
Schools with girls hostel 20 0.63
School with classroom 3041 96.51
School with boundary wall 2012 63.85
School with rails for CWSN 295 9.36
Schools with functional toilets 2995 95.05
Schools with SMC 2406 76.35
Schools with drinking facility 2779 88.19
Toilet for CWSN 89 2.82
School with electricity 1610 51.09
School with playground 1380 43.79
School with computers 219 6.95
With medical check up 2679 85.02
Source: U DISE, 2012-2013
2222....2222 ProfileProfileProfileProfile of the respondentsof the respondentsof the respondentsof the respondents
This section gives us a brief profile of our major respondents for the study i.e the families of the drop out children we met. A
total of 74 families were met during our field visit. Table 8 shows the profile of the respondents according to gender, age,
caste, family size, educational level, occupation, income and access and availability of safety nets. Of the total drop out
children met during the study 60 per cent were boys and 40 per cent girls. 69 per cent of the families belonged to SC and 18
per cent belonged to ST. 89 per cent of mothers and 41 per cent of fathers were found to illiterate or had not completed primary
education. 56 per cent of the families had monthly income level as low as Rupees 3000 per month. Most of parents were daily
wage earners and frequently migrated for work. 46 per cent of the families met were found to be extremely poor with no access
to any form of financial assets.
Table Table Table Table 8888: : : : Profile Profile Profile Profile of families visitedof families visitedof families visitedof families visited
GenderGenderGenderGender (%)
Female
Male
40
60
Family Size Family Size Family Size Family Size % Type of familyType of familyType of familyType of family %

20
3-5 members
6-7 members
8-10 members
56
36
8
Single parents
Both Parents
7
93
CasteCasteCasteCaste
General
OBC
SC
ST
%
3
12
69
16
AgeAgeAgeAge
5-6 years
7-8 years
9-10 years
11-12 years
13-14 years
15-16 years
%
5
18.67
33.33
22.67
14.67
5.3
Educational status of motherEducational status of motherEducational status of motherEducational status of mother
Illiterate and primary incomplete
Primary complete and upper primary incomplete
Upper primary complete and secondary incomplete
%
89
4
7
Educational status of fatherEducational status of fatherEducational status of fatherEducational status of father
Illiterate and primary incomplete
Primary complete and upper primary incomplete
Upper primary complete and secondary
incomplete
%
41
16
26
Occupational status of motherOccupational status of motherOccupational status of motherOccupational status of mother
Stays home and unemployed
Daily wage earner
NREGA worker
%
44
44
12
Occupational status of fatherOccupational status of fatherOccupational status of fatherOccupational status of father
Stays home and unemployed
Daily wage earner
NREGA worker
Salaried and employed
Others
%
28
46
12
5
9
Monthly income of the family Monthly income of the family Monthly income of the family Monthly income of the family
Rs. 810-3000
Rs. 4000-7000
Rs.8000
Rs.10,000
%
56
33
4
7
Access to Access to Access to Access to financial assetsfinancial assetsfinancial assetsfinancial assets
Saving with banking institutions
Any saleable property
In position to receive interest fee financial support
from friends and relatives
%
13
38
3
2222....3333 Profile of schools visitedProfile of schools visitedProfile of schools visitedProfile of schools visited
For the study, 16 schools from two blocks (Nawagarh and Pamgarh) of JanjgirChampa were purposely selected based on high
percentage of drop outs students asshared by the District and Block Education Officers. Drop out children in the age group of 6-
14 years from primary and middle schools were selected for the visit. Out of 16 schools visited only 4 were located in the urban
area of district Janjgir and rest were predominantly rural. 11 primary schools and 5 middle schools were visited by the team.
Among the primary schools visited two were found to be distinctly for scheduled caste children and also named accordingly
(SaskiyaAnusuchitJatiPramthamikShala). It was observed that these schools were running in separate buildings but within the
same compound of other primary and middle schools.Also visited were two primary schools that were specifically for a
particular scheduled tribe community called Sabariyas and catered to children of that particular tribe. High drop out and long
absentee was reported from these schools and even on the day of the visit high numbers of students were found absent.
2222....3333....1111 Basic informationBasic informationBasic informationBasic information
In seven of the total schools visited the pupil teacher ratio was found to be higher than the district average of 20 as shown in
Table 9. In one middle school visited the shortage was so acute that against the provision of seven teachers only three were
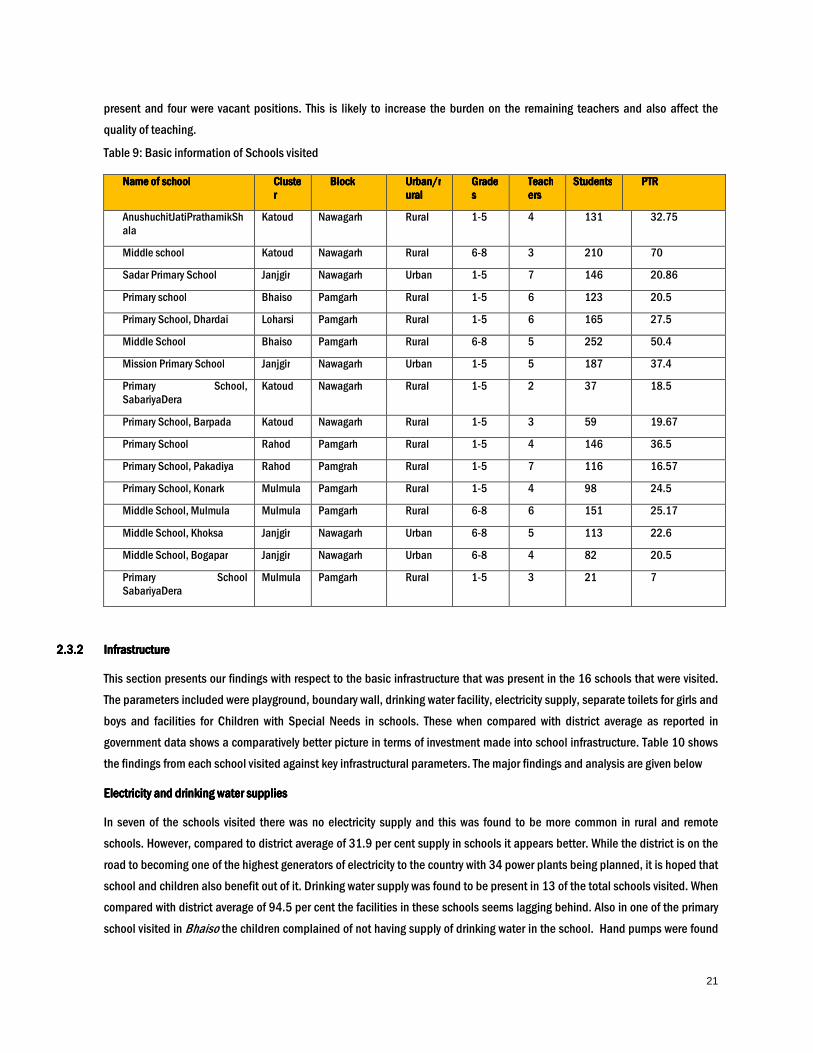
21
present and four were vacant positions. This is likely to increase the burden on the remaining teachers and also affect the
quality of teaching.
Table 9: Basic information of Schools visited
Name of schoolName of schoolName of schoolName of school ClusteClusteClusteClusterrrr
BlockBlockBlockBlock Urban/rUrban/rUrban/rUrban/ruraluraluralural
GradeGradeGradeGradessss
TeachTeachTeachTeachersersersers
StudentsStudentsStudentsStudents PTRPTRPTRPTR
AnushuchitJatiPrathamikShala
Katoud Nawagarh Rural 1-5 4 131 32.75
Middle school Katoud Nawagarh Rural 6-8 3 210 70
Sadar Primary School Janjgir Nawagarh Urban 1-5 7 146 20.86
Primary school Bhaiso Pamgarh Rural 1-5 6 123 20.5
Primary School, Dhardai Loharsi Pamgarh Rural 1-5 6 165 27.5
Middle School Bhaiso Pamgarh Rural 6-8 5 252 50.4
Mission Primary School Janjgir Nawagarh Urban 1-5 5 187 37.4
Primary School, SabariyaDera
Katoud Nawagarh Rural 1-5 2 37 18.5
Primary School, Barpada Katoud Nawagarh Rural 1-5 3 59 19.67
Primary School Rahod Pamgarh Rural 1-5 4 146 36.5
Primary School, Pakadiya Rahod Pamgrah Rural 1-5 7 116 16.57
Primary School, Konark Mulmula Pamgarh Rural 1-5 4 98 24.5
Middle School, Mulmula Mulmula Pamgarh Rural 6-8 6 151 25.17
Middle School, Khoksa Janjgir Nawagarh Urban 6-8 5 113 22.6
Middle School, Bogapar Janjgir Nawagarh Urban 6-8 4 82 20.5
Primary School SabariyaDera
Mulmula Pamgarh Rural 1-5 3 21 7
2222....3333....2222 InfrastructureInfrastructureInfrastructureInfrastructure
This section presents our findings with respect to the basic infrastructure that was present in the 16 schools that were visited.
The parameters included were playground, boundary wall, drinking water facility, electricity supply, separate toilets for girls and
boys and facilities for Children with Special Needs in schools. These when compared with district average as reported in
government data shows a comparatively better picture in terms of investment made into school infrastructure. Table 10 shows
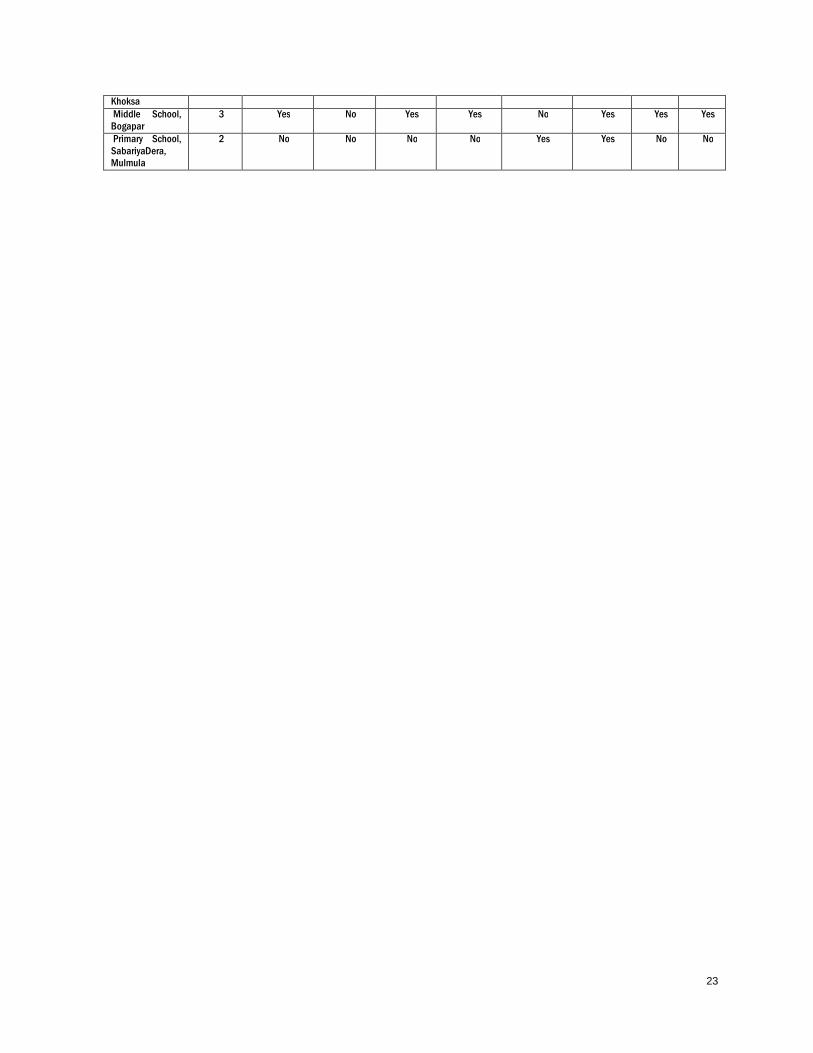
the findings from each school visited against key infrastructural parameters. The major findings and analysis are given below
Electricity and drinking water suppliesElectricity and drinking water suppliesElectricity and drinking water suppliesElectricity and drinking water supplies
In seven of the schools visited there was no electricity supply and this was found to be more common in rural and remote
schools. However, compared to district average of 31.9 per cent supply in schools it appears better. While the district is on the
road to becoming one of the highest generators of electricity to the country with 34 power plants being planned, it is hoped that
school and children also benefit out of it. Drinking water supply was found to be present in 13 of the total schools visited. When
compared with district average of 94.5 per cent the facilities in these schools seems lagging behind. Also in one of the primary
school visited in Bhaiso the children complained of not having supply of drinking water in the school. Hand pumps were found
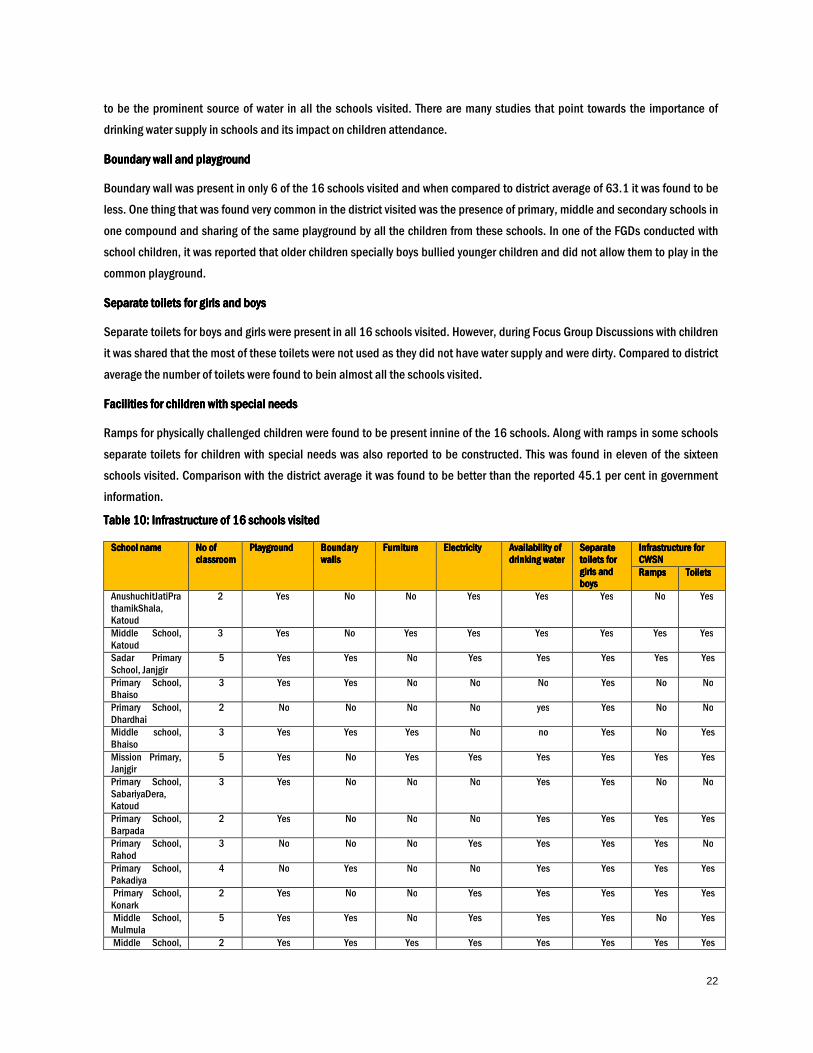
22
to be the prominent source of water in all the schools visited. There are many studies that point towards the importance of
drinking water supply in schools and its impact on children attendance.
Boundary wall and playgroundBoundary wall and playgroundBoundary wall and playgroundBoundary wall and playground
Boundary wall was present in only 6 of the 16 schools visited and when compared to district average of 63.1 it was found to be
less. One thing that was found very common in the district visited was the presence of primary, middle and secondary schools in
one compound and sharing of the same playground by all the children from these schools. In one of the FGDs conducted with
school children, it was reported that older children specially boys bullied younger children and did not allow them to play in the
common playground.
Separate toilets for girls and boysSeparate toilets for girls and boysSeparate toilets for girls and boysSeparate toilets for girls and boys
Separate toilets for boys and girls were present in all 16 schools visited. However, during Focus Group Discussions with children
it was shared that the most of these toilets were not used as they did not have water supply and were dirty. Compared to district
average the number of toilets were found to bein almost all the schools visited.
Facilities for children with special needsFacilities for children with special needsFacilities for children with special needsFacilities for children with special needs
Ramps for physically challenged children were found to be present innine of the 16 schools. Along with ramps in some schools
separate toilets for children with special needs was also reported to be constructed. This was found in eleven of the sixteen
schools visited. Comparison with the district average it was found to be better than the reported 45.1 per cent in government
information.
Table Table Table Table 10101010: : : : Infrastructure of 16 schools visitedInfrastructure of 16 schools visitedInfrastructure of 16 schools visitedInfrastructure of 16 schools visited
School nameSchool nameSchool nameSchool name No of No of No of No of classroomclassroomclassroomclassroom
PlaygroundPlaygroundPlaygroundPlayground Boundary Boundary Boundary Boundary wallswallswallswalls
FurnitureFurnitureFurnitureFurniture Electricity Electricity Electricity Electricity Availability of Availability of Availability of Availability of drinking waterdrinking waterdrinking waterdrinking water
Separate Separate Separate Separate toilets for toilets for toilets for toilets for girls and girls and girls and girls and boysboysboysboys
Infrastructure Infrastructure Infrastructure Infrastructure for for for for CWSNCWSNCWSNCWSN
RampsRampsRampsRamps ToiletsToiletsToiletsToilets
AnushuchitJatiPrathamikShala, Katoud
2 Yes No No Yes Yes Yes No Yes
Middle School, Katoud
3 Yes No Yes Yes Yes Yes Yes Yes
Sadar Primary School, Janjgir
5 Yes Yes No Yes Yes Yes Yes Yes
Primary School, Bhaiso
3 Yes Yes No No No Yes No No
Primary School, Dhardhai
2 No No No No yes Yes No No
Middle school, Bhaiso
3 Yes Yes Yes No no Yes No Yes
Mission Primary, Janjgir
5 Yes No Yes Yes Yes Yes Yes Yes
Primary School, SabariyaDera, Katoud
3 Yes No No No Yes Yes No No
Primary School, Barpada
2 Yes No No No Yes Yes Yes Yes
Primary School, Rahod
3 No No No Yes Yes Yes Yes No
Primary School, Pakadiya
4 No Yes No No Yes Yes Yes Yes
Primary School, Konark
2 Yes No No Yes Yes Yes Yes Yes
Middle School, Mulmula
5 Yes Yes No Yes Yes Yes No Yes
Middle School, 2 Yes Yes Yes Yes Yes Yes Yes Yes
23
Khoksa
Middle School, Bogapar
3 Yes No Yes Yes No Yes Yes Yes
Primary School, SabariyaDera, Mulmula
2 No No No No Yes Yes No No
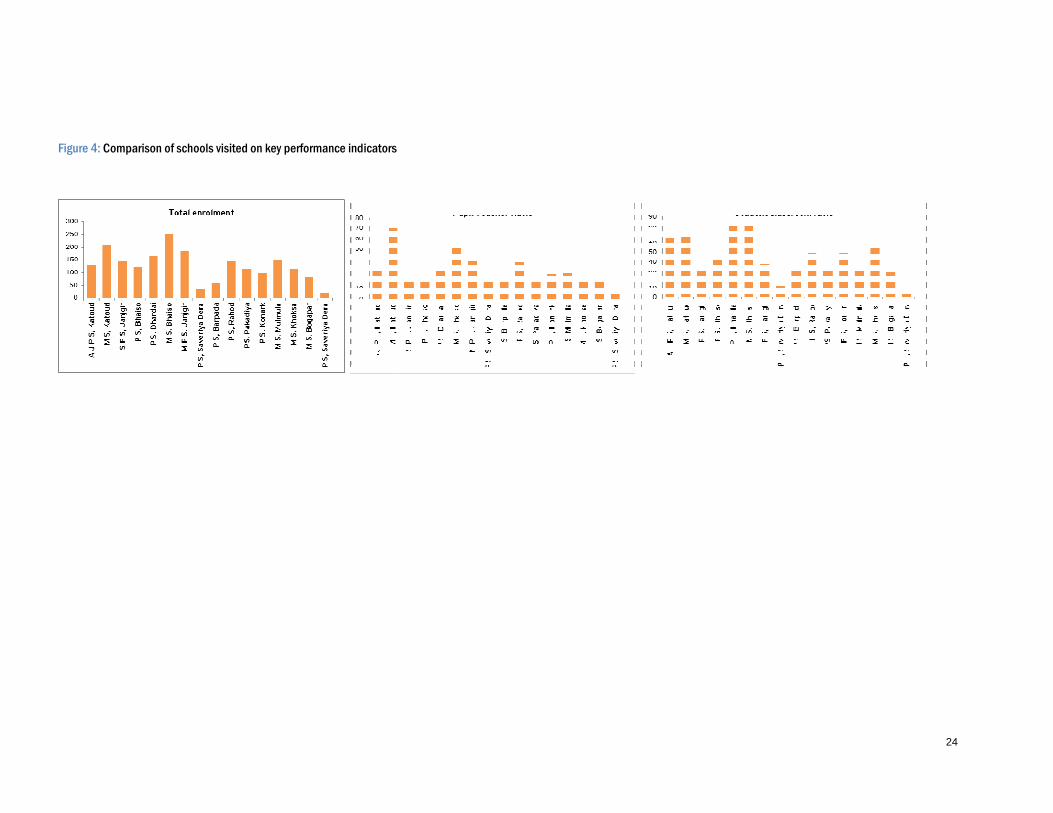
Figure 4: Comparison of schools visited on key performance indicators
Comparison of schools visited on key performance indicators
24

25
3. Reasons for drop out
This section describes the major reasons for school dropout among students based on interviews conducted with parents,
headmasters, teachers, school management committees and District Education Officer along with focus group discussions with
10-12 school children in each of the 16 schools visited.
During study it was found that children were dropping out of schools due to various reasons that can be classified into two
broad categories namely school and home related factors. The major reasons were lack of interest in studies due to irregular
classes, low value attached to formal education, non supportive home environment, poor economic condition and migration.
Individual but important cases of discrimination and language barriers were also observed.
Figure 5: Reasons for dropouts in Janjgir
The chart depicts the distribution of reasons for drop out as stated by the parents of all drop out children covered during the
study in the district. It is important to state that the above reasons are primary responses of the parents and would in some of
the cases differ from the final reasons stated in the report. This is primarily because the reasons presented in the report have
been concluded after analysing responses from different stakeholders and observations made on field.
From the chart above, we can conclude that the major reason of dropout among the children of Janjgir Champa as shared by
the parents was lack of interest in studies (43 per cent). Migration in search for work accounted for 17 per cent of the total
responses. Poor economic conditions of the family and low value attached to formal education held much weightage for
dropouts in the region. Individual cases of language barrier particularly reported among the tribal community were also stated
as reason for drop out by the concerned parents.
1% 7%
43%
5%
12%
17%
15%
Reasons for dropouts (Janjgir)
Discrimination
Domestic
Lack of interest in studies
Language barrier
Low value attached to formal
education
Migration
Poor economic condition

26
3.1 School related factors:
3.1.1 Lack of interest in studies
56 per cent of the parents met during the study cited lack of interest of children in studies as prominent reason for them not
attending school regularly and eventually dropping out of the system.On probing it was also revealed that classes were not
being regularly held and teacher’s shortage and absenteeism was common. Children had lost interest in studies and did not
want to go to school. Such children were found sitting idle, playing or roaming around. Considering the fact that most of these
children belonged to very poor socio economic background with illiterate parents and non-conducive family environment for
studies. School and teacher’s role in nurturing the interest of children and keeping them in school becomes very important. For
a first generation learner with an illiterate parent and non-supportive environment at home school would be the only place
where his/her interest in studies be nurtured and given direction. Therefore, lack of classroom teaching is found to contribute to
disinterest of students in studies and result in eventual drop out of student.
In 7 of the 16 schools visited the pupil student ratio was found to be higher than the district average of 20. Insufficient number
of teachers due to vacant positions was reported by headmasters. In one of the middle school visited in cluster Katoud, it was
found that against the seven provisioned teachers only three were in position. The PTR for the school was found to be 70.
Further, during household survey, 51 per cent respondents who reported irregular classes, nearly 71 per cent reported teacher
absenteeism or teachers’ engagement in non-academic tasks as major reasons for irregular classes. Half of the respondents
also reported not seeing regular classes being conducted in schools. This problem was recognized by the District Education
Officer also.
Monotonous ways of teaching and limited use of activity based learning can also contribute the child’s disinterest in studies. In
68 per cent of the schools visited text book teaching was reported to be the only source of teaching. In two of the primary
schools visited Multigrade and Multi level learning were said to be initiated in the past. However, it was reported by teachers
that it was dis continued two years back due to some administrative decisions.From the headmasters it was reported that
repeating lessons and sometimes organizing extra classes were the only efforts that the school put in to improve learning levels
of weak students.
Teachers’noninvolvementand inertiain addressing the disinterest of children was also seen. Efforts to understand the child’s
concern, parent’s apathy or family condition was found to be limited. Most teachers visited households once in a year during
enrolment drives for children and undertake a household survey process. Identifying and locating houses of drop out children
was very difficult for them as most of them did not know the houses and avoided going to poor localities where most of the drop
out children lived. In one of the schools circulars were issued to parents telling them about their children absenteeism and peon
send to houses to collect their signatures. However, no teacher went for meeting parents and interface meeting to understand
the problem.
3.1.2 Language barriers and discrimination at school
Among the 16 schools visited, four of them were quite distinct in the fact that they catered exclusively to children of scheduled
caste and tribes. PrathamikShallaSabariyaDera was school exclusively catering to the sabariya tribes. These tribes are reported
to be found in small numbers in the district. The community were found living in small hamlets away from the villages and
mostly engaged as agricultural labourers. It was shared that they were originally from Andhra Pradesh and had migrated from
that place long time ago. During interaction it was found that the tribe had their particular dialect which was different from
Chhattisgarhi, the local language spoken in all the places visited.
27
Drop out and long absenteeism was reported by teachers and lack of interest among the children of these communities for
studies. During the day of visit also the school wore a deserted look with 5-6 children and only one teacher present. Discussions
with the parents and children revealed that the children could not understand the language of their teachers.
The teachers however claimed to understand the children’s language and shared that they could relate to them. Children
interviewed had low level of reading and writing skills and could not recognize simple alphabets and calculations. Teachers also
did not seem very keen in teaching this community and one head teacher shared his experience of spending time in that
particular school as ‘sajjayekalapani’.It was evident that there was very little communication taking place between the
community and the teachers and teachers did not enjoy teaching these children. However, to be fair to the teachers, they would
require text books and educational aids in the local dialect to teach children. On the other hand any special effort by them to
help the children overcome this barrier was not visible.
Another individual case that we came across was about a young boy whose father was a sweeper in the same school that he was
studying. Vinod had nine brothers and sisters and studied along with his sister in this school were his father worked. He avoided
going to school while his father regularly came to the school to do his duty. During discussion the child shared that he was
teased by other students in the class calling him names due to his father’s occupation and the teachers did little to stop them.
He was asked to clean the floor and sometimes beaten up for no reason. The father however, had no complaint against the
school and seemed preoccupied in his work. When the head master was probed on the same he shared that the child was dumb
headed and weak and did not understand anything therefore the children teased him. Such children who faced discrimination
in schools are more vulnerable to dropping out of school.

28
3.2 Home related factors
3.2.1 Poor economic condition and migration
Seasonal migration in search for work was found to be an
important factor that caused absenteeism of children
from school, impacted their interest in studies and
finally resulted in drop out from school. Our study
showed that 61 per cent of the families visited by the
team, migrated frequently for work to Raipur or states
like Jammu, Leh, Delhi and Haryana. The usual time for
migration is after the harvesting season and on an
average poor household migrated for 4-5 months.
Most families preferred to take their children along with
them specially the girls and younger children. In spite
of having large joint families, the parents preferred to take their children along with them rather than leaving them behind.
Some parents also revealed that taking their children to brick kiln earned them additional income from Rupees 2000-3000 a
month. Even younger children were reported to work in Brick kilns and could be engaged in making mud mold or carrying
soil.Migration was common among families that belonged to very poor socio economic background for obvious reasons. Among
the families migrating for work majority belonged to Scheduled Caste community (78 per cent) and nearly 61 per cent were
employed as daily wage earners. As discussed earlier in most of JanjgirChampa single crop is grown in a year. This severely
impacts small and marginal farmers who have small landholdings and production from it cannot help them sustain family
income for year long. For rest of non-agricultural months these farmers work as daily wage earners. This non availability of
income for some months is compounded by absence offinancial assets and making them more vulnerable to migration.
The teamalso found out that contractors helped these families in migration and took them to work sites and therefore they were
hugely dependent on them. These contractors were also reported to be from the same village or nearby villages and therefore a
known person to the families. It was reported that lump sum money amounting to Rupees 40,000- 60,000 was usually given to
the interested families before the travel in return for their labour that they pledged to provide in the work sites. Migrant families
shared that they worked mostlyin construction sites like roads, bridges, buildings and brick kilns. Every member of the family
could get work in the kiln either to carryhead loads, make mud bricks or dig mud. The family preferred to take their daughters
along with them to work for additional income and having no reliable person to leave them with.
Do you
have to
migrate
0%0%
yes
61%
No
39%
Percentage distribution of families that
migrate for work
Figure Figure Figure Figure 6666: Families that migrate: Families that migrate: Families that migrate: Families that migrate

29
Figure Figure Figure Figure 7777: Distribution of families : Distribution of families : Distribution of families : Distribution of families according to access to financial assetsaccording to access to financial assetsaccording to access to financial assetsaccording to access to financial assets
Of the families reporting migrating to far off places for work nearly 59per cent of the parents (Figure 7) reported having no form
of social and economic protections like land and savings to help them sustain.As a result families are forced to migrate to meet
their daily needs.
Upon returning home after a gap of 4-5 months children find it difficult to cope up with classes. During interviews with head
masters it was reported that very few schools conducted extra classes for lagging students or any additional activity to put them
on track with class room teaching. Such children unable to cope up with academicsfinally drop out of schools. Some children
reported being asked to repeat their classes after their return from other states. They went to class for few days but dropped out
because of embarrassment to sit with younger children. The headmasters of the school however denied doing so and asked
them to come to school again.
Poor economic condition forced families to migrate and in case of absence of male adult in a family children were forced to
work. During the study we also came across children with single parents trying to support their families with working. Of the
total families met, nearly 31 per cent had children who were working instead of going to school.
It was found that such children were no longer interested in studies and did not want to go back to school. It was also reported
that few of them had taken up bad habits and had started playing cards and indulging in gambling. Two of the children met
during the study were also found taking addictive likegutka.
3.2.2 Low value attached to formal education
Low priority among parents towards formal education of children was found to be an important reason for drop out. It was
found that parents of drop out students had poor educational status. 89per cent of the mothersand 41 per cent of fatherswere
illiterate or primary school incomplete. When asked why they wanted their children to study in schools, responses like
‘badaaadmi ban jayega’ weresharedbut it seemed that they were not very sure whether this could happen, therefore, had not
inculcated in their children habit of going to school regularly. Large number of parents whose children dropped outdid not go to
school and talk to the teacher. When asked as to why their child had dropped out, they were quick to blame the child lack of
effort in studying. This can also be inferred from the fact that 89 per cent parents revealed that they had never attended any
parent teacher meeting in school. Lack of awareness along with everyday struggle for existence restricted parents to attend
such meetings and monitor their child’s progress in school.
13%
25%
3%
59%
Distribution of respondents according to access to safty netsDistribution of respondents according to access to safty netsDistribution of respondents according to access to safty netsDistribution of respondents according to access to safty nets
savings with banking institutions
any saleable property
in position to receive interest free financial support from frdns n
relatives
no such safety nets

30
During study we probed into understanding the benefits of education from parents and what changes it can bring in individual
life. Most parents could not articulate it properly. However, one father who belonged to Muslim community and had pulled his
son out of school gave an interesting response to the question. He claimed that his son was learning little in school and what he
learned was only abuse and foul languages. He wanted his son to at least learn some good language and manners in school.
This was his expectation from school which the school somehow was not fulfilling.
It is obvious that in most cases, either the parents had little faith in formal education or their expectations had not been met by
the school. The efforts made by the school to try and get the child back to school were also found wanting.
During our household visit we came across parent of a girl child who was absent for more than a year from school. During
discussion it was revealed by the parents that they thought that their child’s name was not in the school records since she had
not gone to school for over a year. Also no one from school had visited them to call her. It was evident that there was very weak
linkage or contact between the schools and the parents.
3.2.3 3.2.3 3.2.3 3.2.3 Non supportive environment at homeNon supportive environment at homeNon supportive environment at homeNon supportive environment at home
During the study it was found that children were getting limited support from their homes for continuing their education. An
enabling environment at home can boost a child’s learning process. Constant motivation and support can help child keep
focused and not loose direction. It was found that parents were providing limited support to children at home. One of the
reasons could be that they were parents of first generation learners so they were not able to guide them. There also seems to
exist a strong gender dimension to the problem. Quite often education of children is considered to be the responsibility of
mothers. Since a high proportion of mothers were illiterate, they were not able to support their child.
Given the fact that most of these parents of drop out children worked as daily wage earners it seemed difficult for them to
monitor the progress of their children at home. Since most of the parents worked as daily wage earners they would leave early
for work and would also not know if the child had gone to school or not. Kishore was one such boy whose parents worked as
daily wage earner. During household visit and interaction with his parents it was shared that while the parents left for work early
morning instructing the children to go to school. They were unaware that Kishore would hardly go to school and would spend the
time playing with his friends. It was only after a long time that the parents came to know abouthis absence from school and then
despite of their beating, Kishore refused to go to school.
During household interviewit was also revealed that 71 per cent parents reported providing no support to their children in their
education and schooling. Enquiring about their progress in school, helping them in homework and meeting teachers were task
most parents seldom did.
3.2.4 Poor community participation
In an ideal situation partnership between the school, parents and communities ensures that each other’s’ efforts are
complemented to get all children in the community educated. There are several examples across the country where it has been
successfully demonstrated that involvement of communities helps in supporting the teachers as well as demanding
accountability. However, during the study the team observedweak participation of community in the schooling system. Here we
would specifically discuss the role of school management committees who are supposed to be community representatives in
the schooling system. While SMCs role is mainly looked at as preventive measure for checking drop outs in school. There
nonfunctioning can also weaken the same.
In all the 16 schools visited SMCs were said to be present and functioning during interviews with the headmasters. During study

31
we met atleast half the representatives from each SMCs and what emerged on probing and during discussion with them was
very disheartening to see. Firstly, in most of the cases SMCs role were limited to fund disbursement meetings involving building
construction, repair and other monetary expenditures. Discussion on drop out, quality of teaching, teacher’s absenteeism and
class irregularity did not exist in their meeting records. The headmasters usually presided over such meetings and also kept
records. While sarpanchsare member of these committees and are expected to actively monitor the school progress, mostof
them seemed unaware of drop out situation in their schools and considered the issue very small. On probing they blamed
migration, parent’s negligence and children’s disinterest as prime reasons for drop out if any.
Participation of women members seemed weak as few of them participated in the meeting. In one school when we insisted on
meeting women participants of the SMCs who were reported to be gone for work. We were introduced to a women member who
was deaf and therefore we could hardly communicate with her.
Parent teacher meeting are also considered as platform for community participation in school processes. However during our
study it was found that parent teacher meetings were not conducted regularly. In household survey, 64 per cent of the
respondents reported never having heard of parent teachers meeting being conducted and not being contacted from school
side. This finding points out to the fact that little effort is being diverted into organizing parent teacher meeting. If functioning
properly parent teacher meetings can lead to timely intervention to stop drop out among students in school.
Thus a look at the aforementioned reasons for children dropping out of school before completing their elementary education
outlines the need for greater coordination among the schools, parents and the communities; facilitation of a process whereby
parents are able to associate with the schools and take greater ownership of the education of their children.

32
4. Conclusions
Upon undertaking the study it was felt that the reasons for children dropping out of school cannot be attributed to one single
factor alone but there exists strong interlinkages of factors that finally pushes and pulls a child out of school. This study is a
modest attempt to understand the phenomenon and reasons for drop out of children from school. The conclusions are
summarized as below:
7. Teacher’s shortage and irregular classes do have aTeacher’s shortage and irregular classes do have aTeacher’s shortage and irregular classes do have aTeacher’s shortage and irregular classes do have annnn impact on interest of children towards studiesimpact on interest of children towards studiesimpact on interest of children towards studiesimpact on interest of children towards studies. Since most of the students
are first generation learners, school becomes the only place where they can learn and their interest in studies nutured. If loosing
interest in studies emerged as major reason for drop out among students the school and its teaching process do have a major
role to play in it. Some where inadequate number of teachers along with monotonous teaching method also contributed to
children loosing interest and finally dropping out of school.
8. Migration due to poor economic condition Migration due to poor economic condition Migration due to poor economic condition Migration due to poor economic condition of families of families of families of families was causing children to miss classeswas causing children to miss classeswas causing children to miss classeswas causing children to miss classes for a period of 4-5 months. Children
found it extremely difficult to cope up with studies once they missed their classes and absence of any extra classes or support
on part of teachers compounded the problem. Provisions under RTE are also not being properly implemented and admissions
denied on the basis of transfer certificates to migrant children in other schools.Low level of parent’s awareness about their
rights and RTE was also found.
9. There is lThere is lThere is lThere is limited imited imited imited contact between teacontact between teacontact between teacontact between teachers and parenchers and parenchers and parenchers and parentstststs to discuss about education to discuss about education to discuss about education to discuss about education of childrenof childrenof childrenof children. Parents are largely unaware of
their children progess in school and teachers about the children circumstances and family conditions. There is limited effort in
establishing a rapportbetween parents and teachers. Teachers do not convinceparents to send their children to school,
generate confidence that despite their low levels of literacy, they can create a supportive environment at home. Parents on their
part do not communicate and enquire about the progress of children.
10. There seemed to be a strong belief among teachers and parents that child’s dropping out and his low learning was hugely due
to his lack of motivation and intelack of motivation and intelack of motivation and intelack of motivation and interest in studiesrest in studiesrest in studiesrest in studies and they had little role to play in it. Teachers and parents both blame the child
for his poor learning skills. For them the child’s learning was his and only his responsibility and dependent on his own efforts. It
seemed that teachers had little understanding of needs of first generation learners and expected enabling home environment
and responsible parents as necessary conditions for children continuing their studies.

33
5. Recommendations
Based on the above felt findings and analysis, some of the viable recommendations for the limiting drop out are suggested as
below:
1. Developing a firm policy to ensure education of migrant childrenDeveloping a firm policy to ensure education of migrant childrenDeveloping a firm policy to ensure education of migrant childrenDeveloping a firm policy to ensure education of migrant children- During the study it was found that migrant children were being
denied admissions in other states where they migrated for work.Under the RTE Act no child can be denied admission to any
school. Circulars informing the same needs to be issued for every schools and school management committees informed to
monitor the same. Addressing child’s learning gap due to migration need concerted efforts between two states and two
schools. If enrolling children in school can be made a simple process and learning not limited to schools and teachers. A child’s
learning can become a continuous process and migration will no longercease to be a problem in education. Alternately, cost
effective and immediate solution like issuing identity cardfor the migrant children verifying their details can be issued by village
school for children who migrate regularly. This card can be used to seek admission to any government school anywhere in the
country where the child migrates for work. However, such provisions only provide immediate relief but risks Right to Education
of a child which should not be dependent on any school certification for admission into another school.
2. Sensitization of teachers Sensitization of teachers Sensitization of teachers Sensitization of teachers on social inclusion ion social inclusion ion social inclusion ion social inclusion issuesssuesssuesssues is necessary to ensure that discriminatory practices and believes are
tackled early on in life of children. School should be a place where children learn to respect and believe in diversity. The in-
service training program should include these topics and teachers made aware about it and more importantly oriented as to
how they should deal with these issues in schools. Schools should ensure friendly and non-discriminatory environment to
children. Children undergo a process of socialization early on in life and societal norms, values and beliefs are passed on to
them through their families and peers. Schools can be an important platform to question some of these norms and change it
and not perpetuate it.
3. EnEnEnEnsuring suring suring suring support to at risk child identified under support to at risk child identified under support to at risk child identified under support to at risk child identified under Minimum learning level(MLL)Minimum learning level(MLL)Minimum learning level(MLL)Minimum learning level(MLL)programprogramprogramprogrammemememe. JanjgirChampahas recently
introduced MLL based curriculum in all its government and government aided schools. This can be a useful tool to check the
learning level of children and identify lagging behind students.This form of assessment of learning level should be promoted
and regularized which can identify the vulnerable children early on and help to reduce the problem of drop out early on in the
schooling system.
4. Conducting parent teachers meeting and home contact of long absentee Conducting parent teachers meeting and home contact of long absentee Conducting parent teachers meeting and home contact of long absentee Conducting parent teachers meeting and home contact of long absentee student student student student made part of job demade part of job demade part of job demade part of job description of every head scription of every head scription of every head scription of every head
mastermastermastermaster. During study it was evident that parent teacher meeting and other form of household contacts were avoided by school
teachers. Circulars were issued and send to parents with the help of peon. Teachers were unaware of children circumstances
and needs. Majority of the headmasters had never been to the community or houses were these children lived therefore
avoiding any contact.
5. AwaAwaAwaAwareness camps reness camps reness camps reness camps onononon importance of education importance of education importance of education importance of education and opportunities for workand opportunities for workand opportunities for workand opportunities for workneeds to be organized especially for marginalized
communities from where more number of drop out children belong like the Scheduled caste community comprising of satnami,
Chauhan, gasiya, mochi and gond. These communities belonging to lower social and economic strata many a times suffer from
ignorance and lack of information. Village awareness camps on education along with counselling of parents could be organised
once in three months.
6. StStStStudents committees udents committees udents committees udents committees could be could be could be could be formed for ensuring active participation of children in the schoolformed for ensuring active participation of children in the schoolformed for ensuring active participation of children in the schoolformed for ensuring active participation of children in the school progress and in their peer
learnings. Transforming learning process from passive to active can be brought out by making children active participants in
their own development and schooling process. Student committees to discuss their issues can be promoted and issue like drop
out, discrimination andcorporal punishment be discussed to reach out to vulnerable children. Children club, children
parliament, meenamanch and other innovative programthat are successfully running in other states can be promoted to boost
child participation, awareness and interest in school and education.

34

35
Annexure 1: List of Respondents
NameNameNameName DesignationDesignationDesignationDesignation
Satish Pandey District Education Officer
K S Tomar DIET Principal
RishikantaRathod BRC, Janjgir
Sanjay Sharma Supporting Teacher, BRC, Janjgir
Binod Pandey CAC, Janjgir
Agar Das Banjare CRC, Head Master, Sadar Primary School, Janjgir
P L Kaushik Block Officer, Pamgarh
B Akka Block Officer, Nawagarh
RoshamiNami Asst. Block Officer, Nawagarh
Dharma LalTandan Head Master, ShramikShalaAnushuchitJati , Katoud, Nawagarh
JeevanLalKumbakar CRC, Head Master, Katoud, Nawagarh
S. David Head master, Mission Primary School, Janjgir
Ramesh Kumar Sharma Headmaster, Pre middle school, Bongapar
Ram Kumar Gond Chairman, School Management Committee, Pre middle school, Bogapar
VishambarNath SMC, Pre middle school, Bongapar
Dev Narayan Ratnakar SMC, Pre middle school, Bongapar
LakmiRathod SMC, Pre middle school, Bongapar
Rookshana Begum SMC, Pre middle school, Bongapar
SivsinghShidar Headmaster, Primary School, Khoksa
Indirani Kumar Headmaster, Middle School, Koksha
Moti Ram Kewat SMC, Middle School, Khoksa, Janjgir
Padma Dubey SMC, Middle School, Khoksa, Janjgir
Chote Ram Kheswar SMC, Middle School, Khoksa, Janjgir
JankiBaiKewat SMC, Middle School, Khoksa, Janjgir

36
Rajesh Sahu Up Sarpanch, Khoksa, Janjgir
Sunita Singh Head Master, Pre Middle School, Mulmula, Pamgarh
Dinesh Singh Sarpanch, SMC Chairperson, Pre Middle School Mulmula, Pamgarh
Ravinder Singh Chandal Teacher, Pre Middle School, Mulmula, Pamgarh
Anil Singh Teacher, Pre Middle School, Mulmula, Pamgarh
Ragunath Singh Headmaster, Primary School, SaveriyaDera, Mulmula, Pamgarh
Bharat Vyas Teacher, Pre Middle School, Mulmula, Pamgarh
Ashok Kumar Tiwari Teacher, Pre Middle School, Mulmula, Pamgarh
Bhupendra Singh Teacher, Pre Middle School, Mulmula, Pamgarh
JhambulalGondh Teacher, Pre Middle School, Mulmula, Pamgarh
PramilaBharadwaj Teacher, Primary School, SaveriyaDera, Mulmula, Pamgarh
Paras Ram Local Leader, SaveriyaDera, Mulmula, Pamgarh
UdayPratap Singh Headmaster, Primary School, Konark, Pamgarh
Ramesh Kumar Wadhekar Sarpanch, Konark, Mulmula, Pamgarh
PouramTandon Headmaster, Primary School Pakadiya, Rahod, Pamgarh
Anupriti Sarpanch, Chairperson, SMC, Primary School, Rahod, Pamgarh
Ramesh Kumar Soni Headmaster, Primary School, Rahod, Pamgarh
DrSatyabhaman Singh Headmaster, Middle School, Bhaiso
Sanjay Chatri Sarpanch, SMC Chairperspon, Middle School, Bhaiso
ChunniLal Upsarpanch, Middle School,Bhaiso
Shanti Devi Sahu Headmaster, Primary School Dhardai
SitaRam Patel Vice Chairperson, SMC, Primary School, Dhardai
Bodh Ram Kewat Chairperson, SMC, Primary School, Dhardai
Harish ChndraSahu Member, SMC, Primary School, Dhardai
Phirat Ram Headmaster, Primary School, Bhaiso
Ram Kumar Yadav Chairperson, SMC, Primary School, Bhaiso

37
Santosh Srivastava Vice Chairperson, SMC, Primary School, Bhaiso

38
Annexure 2: Field Schedule Visit
DistrictDistrictDistrictDistrict BlockBlockBlockBlock ClusterClusterClusterCluster SchoolSchoolSchoolSchool Date of visitDate of visitDate of visitDate of visit
JanjgirChampa Nawagarh Katoud AnushuchitJati PS 11-Dec-13
JanjgirChampa Nawagarh Katoud MS Katoud 12-Dec-13
JanjgirChampa Nawagarh Katoud PS Barpada 12-Dec-13
JanjgirChampa Nawagarh Katoud PS SaveriyaDera 12-Dec-13
JanjgirChampa Nawagarh Janjgir PS Sadar 13-Dec-13
JanjgirChampa Nawagarh Janjgir PS Mission 13-Dec-13
JanjgirChampa Nawagarh Janjgir MS Bogapar 14-Dec-13
JanjgirChampa Nawagarh Janjgir MS Khoksha 14-Dec-13
JanjgirChampa Pamgarh Mulmula MS Mulmula 16-Dec-13
JanjgirChampa Pamgarh Mulmula PS SaveriyaDera 16-Dec-13
JanjgirChampa Pamgarh Mulmula PS Konark 16-Dec-13
JanjgirChampa Pamgarh Bhaiso PS Bhaiso 17-Dec-13
JanjgirChampa Pamgarh Bhaiso MS Bhaiso 17-Dec-13
JanjgirChampa Pamgarh Loharsi PS Dhardai 17-Dec-13
JanjgirChampa Pamgarh Rahod AnushuchitJati PS,
Rahod
19-Dec-13
JanjgirChampa Pamgarh Rahod PS PakadiyaRahod 19-Dec-13
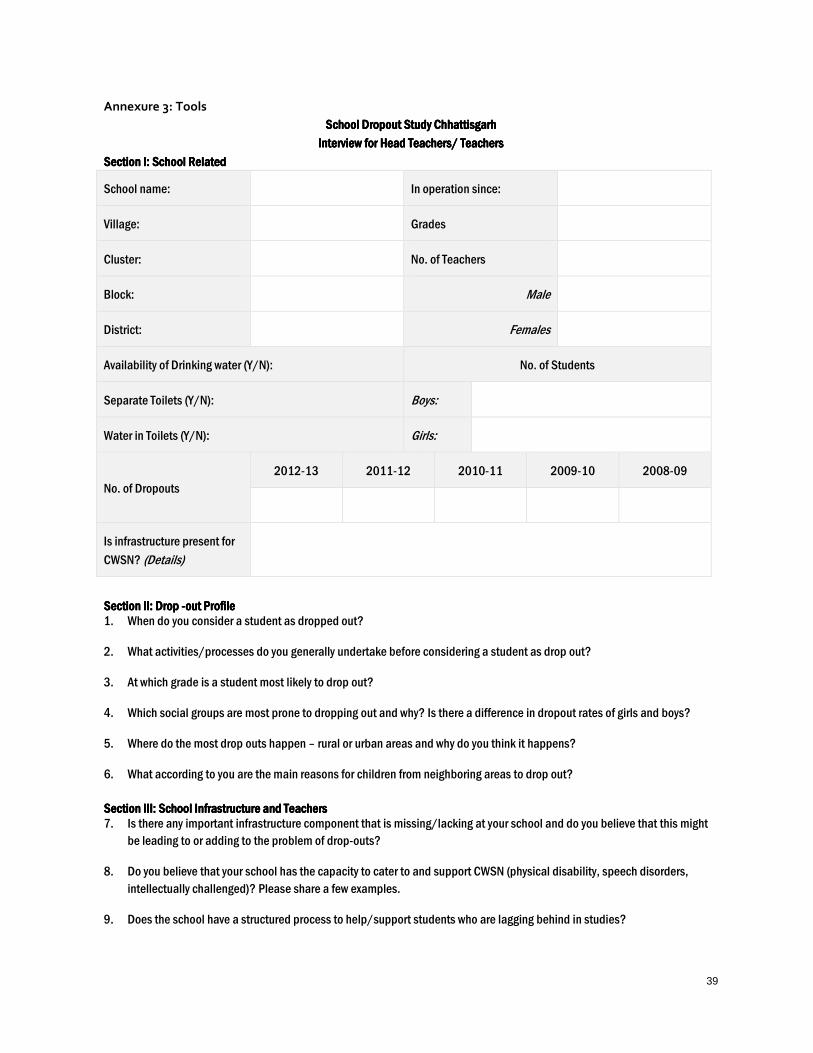
39
Annexure 3: Tools
School Dropout Study ChhattisgarhSchool Dropout Study ChhattisgarhSchool Dropout Study ChhattisgarhSchool Dropout Study Chhattisgarh
Interview for Head Teachers/ TeachersInterview for Head Teachers/ TeachersInterview for Head Teachers/ TeachersInterview for Head Teachers/ Teachers
Section I: School RelatedSection I: School RelatedSection I: School RelatedSection I: School Related
School name: In operation since:
Village: Grades
Cluster: No. of Teachers
Block: Male
District: Females
Availability of Drinking water (Y/N): No. of Students
Separate Toilets (Y/N): Boys:
Water in Toilets (Y/N): Girls:
No. of Dropouts
2012-13 2011-12 2010-11 2009-10 2008-09
Is infrastructure present for
CWSN? (Details)
Section II: Drop Section II: Drop Section II: Drop Section II: Drop ----out Profileout Profileout Profileout Profile 1. When do you consider a student as dropped out?
2. What activities/processes do you generally undertake before considering a student as drop out?
3. At which grade is a student most likely to drop out?
4. Which social groups are most prone to dropping out and why? Is there a difference in dropout rates of girls and boys?
5. Where do the most drop outs happen – rural or urban areas and why do you think it happens?
6. What according to you are the main reasons for children from neighboring areas to drop out?
Section III: School Infrastructure and TeachersSection III: School Infrastructure and TeachersSection III: School Infrastructure and TeachersSection III: School Infrastructure and Teachers 7. Is there any important infrastructure component that is missing/lacking at your school and do you believe that this might
be leading to or adding to the problem of drop-outs?
8. Do you believe that your school has the capacity to cater to and support CWSN (physical disability, speech disorders,
intellectually challenged)? Please share a few examples.
9. Does the school have a structured process to help/support students who are lagging behind in studies?

40
10. Are there any notable processes and systems that the school has developed or uses to ensure that the staff is able to cater
to the needs and educational requirements of all students? Please share a few examples.
11. How do you ensure that the staff or any students do not discriminate against a particular child/student?
12. Has the school received any complaints related to a teacher(s) meting out corporal punishment?
13. Apart from mainstream teaching, do the teachers at the school have any additional responsibilities? Do these additional
responsibilities come in the way of regular classes/mainstream teaching?
Section IV: Managing DropSection IV: Managing DropSection IV: Managing DropSection IV: Managing Drop----outsoutsoutsouts 14. What systems and processes do you have in place to prevent/curb drop outs?
15. When a student drops out, does any teacher from the school visit his/her home to find out why the child has dropped out
and what can the school do to get the child back at school?
16. Do you maintain any records/registers for students who are absent for more than 15 days?
17. Are there any policies, programs or projects to tackle problem of drop out? What kind of strategies could be initiated to
prevent drop-outs?
18. Is the school management committee operational and what is the community’s involvement in managing drop-outs?
19. How is the data on drop outs collected and managed?
20. Have any drop –outs returned to the school in the past few years? Provide details.
21. What other challenges do you face in preventing drop out in your school? What support would you require form the
Government in curbing drop out?

41
School DropSchool DropSchool DropSchool Drop----out Studyout Studyout Studyout Study
Household QuestionnaireHousehold QuestionnaireHousehold QuestionnaireHousehold Questionnaire
SECTION I: HOUSEHOLD INFORMATION SECTION I: HOUSEHOLD INFORMATION SECTION I: HOUSEHOLD INFORMATION SECTION I: HOUSEHOLD INFORMATION
Name of household (HH) head___________________
Phone number:_______________________________
Name of student:_________________________________
School ________________________________________
Distance from home (Km) __________________________
District:______________________________________ Block:_______________________________________
Cluster:______________________________________ Rural/Urban:_________________________________
Economic Status : APL/ BPL______________________
Number of family members:_____________________
Number of children:___________________________
Siblings older than the subject:__________________
Number of boys:______________________________
Is child raised by a single parent_________________
Number of Girls:______________________________
Does child stay in a nuclear family________________
Education status (Choose from list given below) : Education status (Choose from list given below) : Education status (Choose from list given below) : Education status (Choose from list given below) :
Mother: ____________________________
Father: ___________________________________
Occupational status (Choose from list given below) : Occupational status (Choose from list given below) : Occupational status (Choose from list given below) : Occupational status (Choose from list given below) :
Mother: ____________________________
Father: ___________________________________
1. Illiterate 2. Primary incomplete 3. Primary completed 4. Upper primary incomplete 5. Upper primary completed 6. Secondary school incomplete 7. Secondary school completed 8. Senior secondary school incomplete 9. Senior secondary school completed 10. Graduation incomplete 11. Graduate and above 12. Vocational Qualification
1. Unemployed (only if looking for work) 2. Stay-at-home 3. Salaried worker (Government or Private job) 4. Daily wage earner 5. NREGA worker 6. Other please specify:___________________
Approximate monthly income: INR______________________________________________________________
Which month has the least income?_____________________________________________________________
Does the household have any of the following social/financial protection system to cope with income shocks?
1. Savings with formal banking institutions 2. Savings with informal sources 3. Any saleable property or land 4. Any investments held in the form of precious stones and metals 5. In a position to receive interest free financial support from friends & relatives 6. Other please specify:__________________________________________________________________

42
7. No such safety net exists
SC/ST/OBC/General Category Categorization (To be filled in by enumerator and not to be asked from the
respondent):________________________________________________________________________________
Why did the child stop attending school? Write down the reason for drop-out (verbatim as told by the parent)
SECTION II: Child Information Sheet (kindly pen in information of only those children who fall in the age group of 6 – 13
S
No. Name
Age
(Yea
rs)
Gende
r (F/M)
Is the
child a
CWSN
(Y/N)
Age at
which the
child
enrolled
(Years or
NA)
Class in
which the
child had
enrolled
(Grade or
NA)
Was child a
scholarship
holder?
How was
the
scholarship
utilized?
Age at
which the
child
dropped
out (Years
or NA)
Class from
which the
child
dropped
out (Grade
or NA)
Reasons for
Dropout
(Choose from
list given
below)
What is
child
doing
currently?
1
2
3
4
5
6
7
8
Reasons for drop out: 1 if distance related, 2 if cost related, 3 if child related, 4 if school related, 5 if related to domestic matters, 6 if related to social
causes (e.g. child marriage and migration) and 7 if psychosocial factors (Please specify nature of activity if choosing 6 or 7) (Please note multiple
options permitted per child). In case where child dropped out to take admission to a ‘private school’ please mention the same
If the child is enrolled in a private school and still studying, this is not a drop-out case, however, we would like to study what
factors led to his/her changing the schools.
SECTION III: SocioSECTION III: SocioSECTION III: SocioSECTION III: Socio----Economic Factors [including attributing psychosocial factors] Economic Factors [including attributing psychosocial factors] Economic Factors [including attributing psychosocial factors] Economic Factors [including attributing psychosocial factors] 1. Why did you start sending your child to school?
_____________________________________________________________________________________
_________________________________________________________________________
2. How did the child used to go to school?
a. On his own – walking / cycle

43
b. With friends
c. Any other paid transport
d. Parent (s) used to drop and pick child
3. If answer is (c or d) above, did it impact family’s income negatively? (Check by how much )
a. No impact
b. Very small impact – easily bearable
c. Moderate impact
d. High impact
4. How did you support your child’s education as a parent?
a. Ensuring that child attends school
b. Dropping him/her to school and picking up
c. Aware of child’s performance in school
d. Ensuring that homework is completed
e. Others (please specify)________________________________________________________
f. No such support/supervision
5. Did you think that the child was able to perform as per your expectations?
a. Yes
b. No
If no, please elaborate
____________________________________________________________________________________________
____________________________________________________________________________________________
____________________________________________________________________________________________
____________________________________________________________________
6. Did you have to migrate seasonally for work?
a. Yes
b. No
If yes, did it impact the child’s education
_____________________________________________________________________________________
_________________________________________________________________________
7. Did the child have to stay at home to take care of younger siblings and/or to do household chores?
a. Yes
b. No
If yes, for how many days in a month/week ________________________________________
8. Did you have to spend any money on child’s education in form of text books, notebooks, uniform, transport or tuition?
a. Yes
b. No
If yes, then how much money did you have to spend? _______________________________________ 9. Would you say that this cost had any role in child’s dropping out of school?
a. Yes
b. No
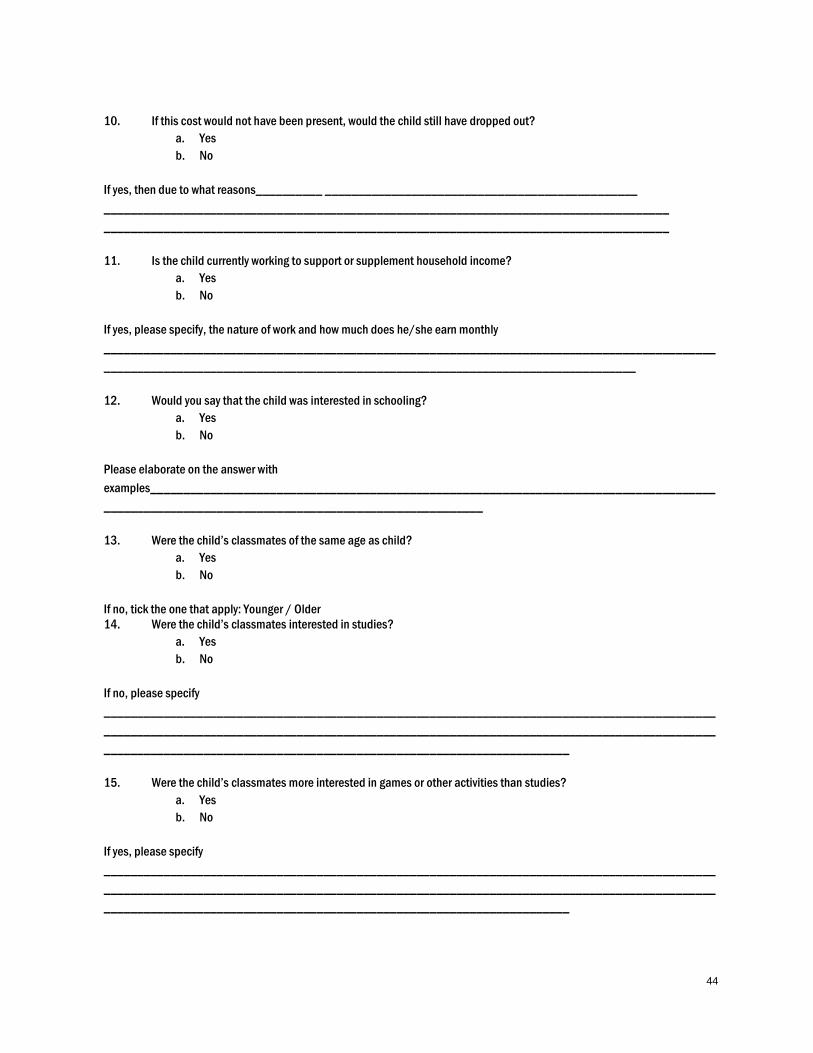
44
10. If this cost would not have been present, would the child still have dropped out?
a. Yes
b. No
If yes, then due to what reasons__________ _______________________________________________
_____________________________________________________________________________________
_____________________________________________________________________________________
11. Is the child currently working to support or supplement household income?
a. Yes
b. No
If yes, please specify, the nature of work and how much does he/she earn monthly
____________________________________________________________________________________________
________________________________________________________________________________
12. Would you say that the child was interested in schooling?
a. Yes
b. No
Please elaborate on the answer with
examples_____________________________________________________________________________________
_________________________________________________________
13. Were the child’s classmates of the same age as child?
a. Yes
b. No
If no, tick the one that apply: Younger / Older 14. Were the child’s classmates interested in studies?
a. Yes
b. No
If no, please specify
____________________________________________________________________________________________
____________________________________________________________________________________________
______________________________________________________________________
15. Were the child’s classmates more interested in games or other activities than studies?
a. Yes
b. No
If yes, please specify
____________________________________________________________________________________________
____________________________________________________________________________________________
______________________________________________________________________

45
16. Did you ever observe any discrimination in the school between students or did your child complainabout any such
discrimination? (Give example of discrimination - some children preferred overothers by teachers)
a. Yes
b. No
If yes, please specify
____________________________________________________________________________________________
____________________________________________________________________________________________
_____________________________________________________________________
Additional questions if dropAdditional questions if dropAdditional questions if dropAdditional questions if drop----out is a girl childout is a girl childout is a girl childout is a girl child 1. Do you think a girl child should study and till what standard?
a. Yes
b. No
Please elaborate
____________________________________________________________________________________________
____________________________________________________________________________________________
_____________________________________________________________________
2. Did any of your child ever go to a private school?
a. Yes
b. No
If yes, please check if it was a boy or a girl _______________________________________
Additional questions if dropAdditional questions if dropAdditional questions if dropAdditional questions if drop----out is a CWSNout is a CWSNout is a CWSNout is a CWSN 1. Did you have to spend additional time and/or money to take your child to school?
a. Yes
b. No
2. If yes, please elaborate, how it impacted your work and budget
____________________________________________________________________________________________________________________________________________________________________________________________________________________________________________________________________________________________________________________________________________________
____________________________________________________________________________________________________________________________________________________________________________________________________________________________________________________________________________________________________
3. Did the school have infrastructure to support your child needs?
a. Yes
b. No
If no, please specify what was the school lacking
____________________________________________________________________________________________
____________________________________________________________________________________________
__________________________________________________________________________
4. Were the teachers supportive of your child’s needs?
a. Yes

46
b. No
Please specify
____________________________________________________________________________________________
____________________________________________________________________________________________
__________________________________________________________________________
5. Were the other students helpful?
a. Yes
b. No
Please specify
____________________________________________________________________________________________
____________________________________________________________________________________________
__________________________________________________________________________
Section IV: School Related Factors [including attributing psychosocial factors]Section IV: School Related Factors [including attributing psychosocial factors]Section IV: School Related Factors [including attributing psychosocial factors]Section IV: School Related Factors [including attributing psychosocial factors]
1. Were there enough classrooms and seats for everyone to sit? (Was lack of school infrastructure a cause for drop out?)
a. Yes
b. No
2. What was not present in your school?
a. Toilet facility
b. Drinking water facility
c. Specific infrastructure for CWSN
d. Boundary walls
e. Classrooms & furniture
f. Other please specify:_________________________________________________________
3. Do you know if this school has any ramps or other infrastructure for physically challenged (CWSN)?
a. Yes
b. No
If yes, details
_____________________________________________________________________________________
_________________________________________________________________________
4. Were the school timings unsuitable? (Probe for very early in morning/ very late in afternoon)
a. Yes
b. No
If yes, then please specify why the timings were unsuitable:__________________________________________
5. How many games or extracurricular periods did you have in a day /week?
___________________________________________________________________________________
6. Were classes held regularly/every day in school?
a. Yes
b. No

47
If no, then was it because of any one or more of the reasons listed below
a. Teacher/s did not come on a regular basis
b. Teacher/s were busy doing other work
c. School premises was used for other purposes
d. Other please specify_______________________________________
7. Was the child able to complete homework himself/herself?
a. Yes
b. No
If no, then probe about amount of homework received daily a. Was it too much homework
b. Was it too difficult
c. Anything else about homework ____________________________________
8. Do you think the teachers encouraged and supported the student in school?
a. Yes
b. No
Please give any instances
____________________________________________________________________________________________
____________________________________________________________________________________________
____________________________________________________________________________________________
____________________________________________________________________
9. Was the child appreciated for something good that he did in school?
a. Yes
b. No
If no, please specify
____________________________________________________________________________________________
____________________________________________________________________________________________
______________________________________________________________________
10. Did you know if teachers used any activities other than text books to teach in school?
a. Yes
b. No
If yes, details__________________________________________________________________________
____________________________________________________________________________________________
____________________________________________________________________________________________
____________________________________________________________________________________________
____________________________________________________________________
11. Was the child frequently punished in school and was fearful of being beaten up or reprimanded in school?
________________________________________________________________________________________
________________________________________________________________________________________
_________________________________________________________________________

48
12. Were any derogatory or caste related remarks made by teachers?
________________________________________________________________________________________
________________________________________________________________________________________
_________________________________________________________________________
13. Did the child complain about being regularly regularly regularly regularly asked to carry out tasks other than studying in school? Probe about child
being made to do some personal work for teachers.
a. Never
b. Sometimes - How many times a week? ______________
c. Frequently - How many times a week? _________________
For answer b or c above, also check if the child was singled out for such work or was it given to every student with same
frequency.
14. Do you think your child was usually very nervous during examination?
__________________________________________________________________________________
___________________________________________________________________________________
15. Were the tests or exams too difficult?
a. Yes
b. No
16. Was the child taught in local dialect in school?
a. Yes
b. No
17. Did the school organise Parent Teacher Meeting on a regular basis and
a. Yes
b. No
18. Did you attend the same?
a. Yes
b. No
If yes, then anything about irregular attendance or drop outs ever discussed in it? Please provide details
______________________________________________________________________________________
______________________________________________________________________________________
19. When your child stopped going to school, did anyone from school contact you?
a. Yes
b. No
If yes, what sort of contact was it (enumerator to understand the process post drop out)
a. Telephonic
b. Household visit

49
c. Other please specify__________________________________________________________
Additional questions if dropAdditional questions if dropAdditional questions if dropAdditional questions if drop----out is a girl childout is a girl childout is a girl childout is a girl child 1. Was there a separate toilet for girls in the school?
a. Yes
b. No
2. If answer to Q.1 above is no – would you have continued sending your child to school if there was a separate toilet for
girls?
a. Yes
b. No
3. Did this school have female teachers?
a. Yes
b. No
4. Was your child taught by a lady teacher?
a. Yes
b. No
5. If answer to Q.3 above is no, would your child have continued to study if she was being taught by a lady teacher?
a. Yes
b. No
6. Were there any incidents of quarrel or violence against your child or any other girl children in the school?
a. Yes
b. No
If yes, details _______________________________________________________________________________
7. Were you afraid of sending your child to school because of that?
a. Yes
b. No
Section V: Community Related and Other FactorsSection V: Community Related and Other FactorsSection V: Community Related and Other FactorsSection V: Community Related and Other Factors 1. Generally till what grade do the girls study in your community/village? _____________________________
2. At what age are the girls married? __________________________________________________________
3. Do you know of any other students who have dropped out in your village? Please provide details and
reasons___________________________________________________________________________________
________________________________________________________________________________________
_______________________________________________________________________
Would you attribute instances of domestic quarrel or alcoholism to any drop outs that you know? _____________________________________________________________________________________________________________________________________________________________________________________________________________________________________________________

50

51
FGD Checklist FGD Checklist FGD Checklist FGD Checklist –––– StudentsStudentsStudentsStudents
Please use games (icePlease use games (icePlease use games (icePlease use games (ice----breakers) provided in separate sheet before starting the FGD with students.breakers) provided in separate sheet before starting the FGD with students.breakers) provided in separate sheet before starting the FGD with students.breakers) provided in separate sheet before starting the FGD with students.
SECTION I: General and School RelatedSECTION I: General and School RelatedSECTION I: General and School RelatedSECTION I: General and School Related 1. Are the school timings convenient?
2. Do you like your school’s building?
a. Probe for any infrastructure that is lacking and which creates problem
b. Check with girls about the girls’ toilet
c. Availability of playground, boundary wall and chairs/tables in school
3. What are three best things about your school? (Probe on what makes them come to school daily)
4. What are the things that you do not like about your school
SECTION II: Teacher RelatedSECTION II: Teacher RelatedSECTION II: Teacher RelatedSECTION II: Teacher Related 5. Do you understand the teacher’s dialect easily? (Ask this from a number of students separately and do not go by voice
vote). Check for any language related problem that they might face. Ask what kind of specific problems do they face, if
any
6. What kind of activities do the teachers use for teaching? (Probe if the teachers only use text books or other things like
TLM, teaching aids and conduct activities to make teaching more interesting, probe if it is interesting for child)
7. What do you like the most about your teachers?
8. What are two things that you would like to change about your teachers?
SECTION III: DropSECTION III: DropSECTION III: DropSECTION III: Drop----Out RelatedOut RelatedOut RelatedOut Related 9. Are there any students who have stopped coming to school recently? Who are they? (Make a list of drop outs and
reasons)
10. Why did these students stop coming to school?
SECTION IV: Observation for Gender Discrimination or CWSN discriminationSECTION IV: Observation for Gender Discrimination or CWSN discriminationSECTION IV: Observation for Gender Discrimination or CWSN discriminationSECTION IV: Observation for Gender Discrimination or CWSN discrimination 11. Investigators are to look out for any signs of gender discrimination in group and school; observe for following:
a. Very few girls
b. Girls not allowed to answer at all
c. Girls not mixing up
d. You can also probe about students’ sisters and where they study
12. Investigators to look for any signs of discrimination against CWSN in school. Try talking to a CWSN to understand the
challenges (to be done separately).
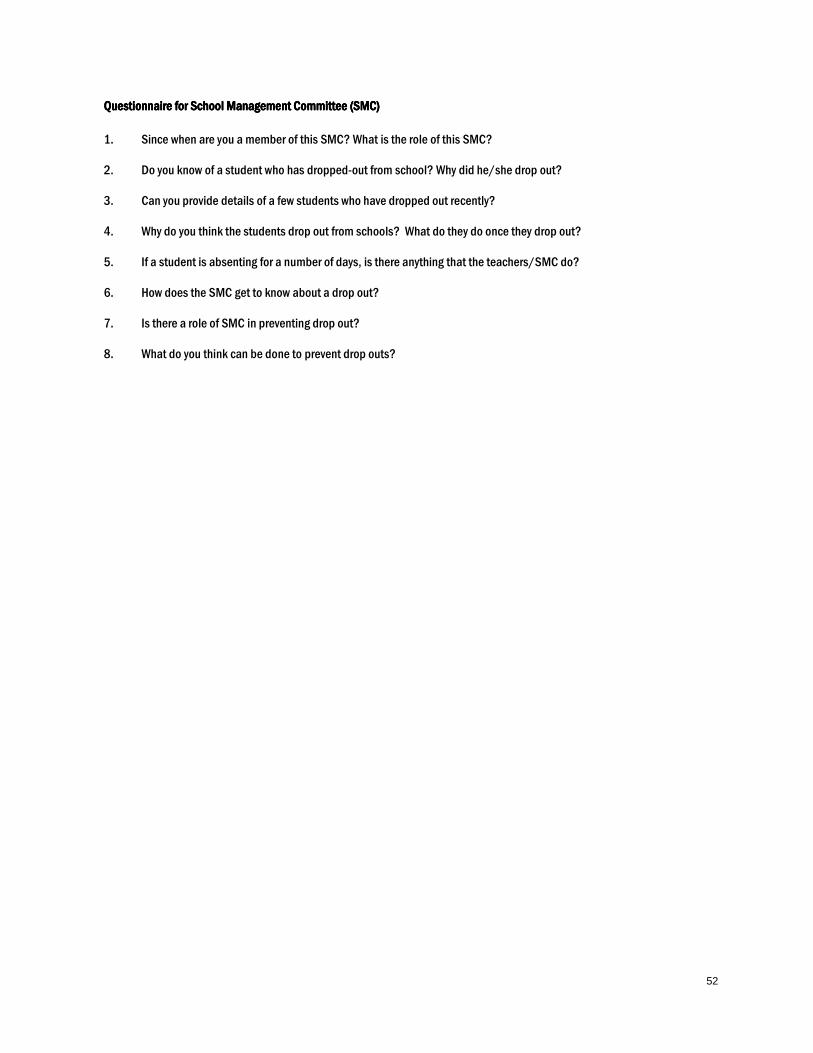
52
Questionnaire for School Management Committee (SMC)Questionnaire for School Management Committee (SMC)Questionnaire for School Management Committee (SMC)Questionnaire for School Management Committee (SMC)
1. Since when are you a member of this SMC? What is the role of this SMC?
2. Do you know of a student who has dropped-out from school? Why did he/she drop out?
3. Can you provide details of a few students who have dropped out recently?
4. Why do you think the students drop out from schools? What do they do once they drop out?
5. If a student is absenting for a number of days, is there anything that the teachers/SMC do?
6. How does the SMC get to know about a drop out?
7. Is there a role of SMC in preventing drop out?
8. What do you think can be done to prevent drop outs?
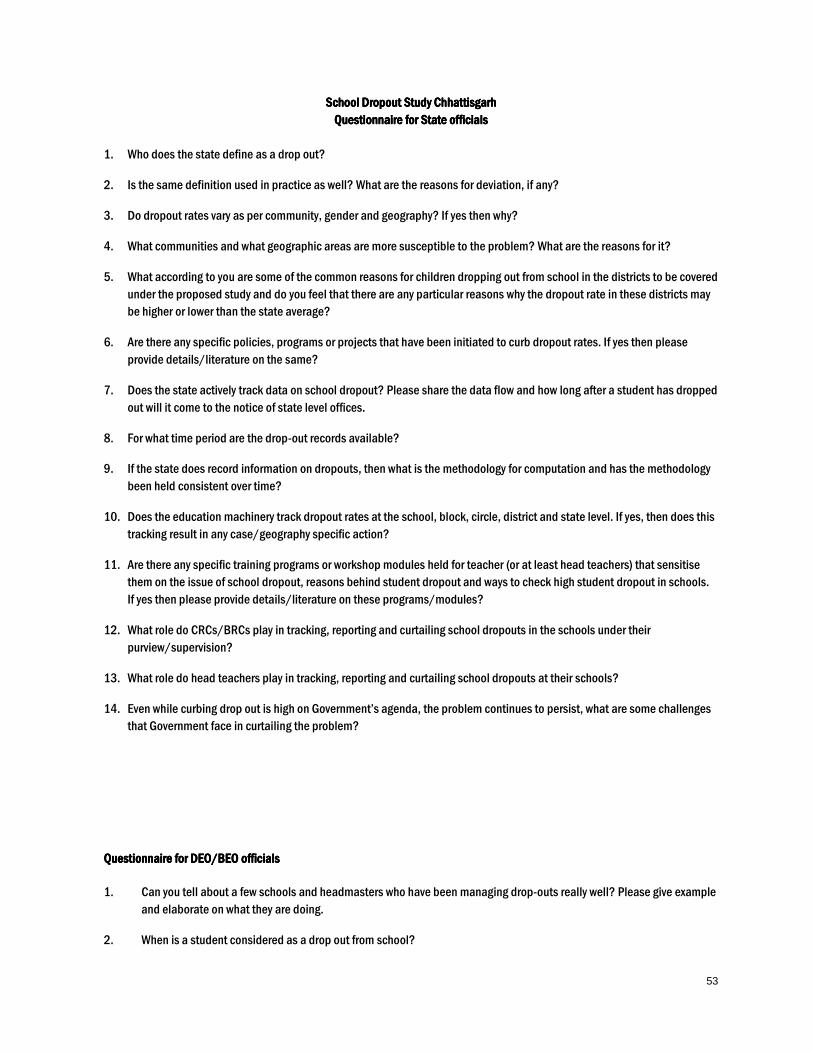
53
School Dropout Study School Dropout Study School Dropout Study School Dropout Study ChhattisgarhChhattisgarhChhattisgarhChhattisgarh
Questionnaire for State officialsQuestionnaire for State officialsQuestionnaire for State officialsQuestionnaire for State officials
1. Who does the state define as a drop out?
2. Is the same definition used in practice as well? What are the reasons for deviation, if any?
3. Do dropout rates vary as per community, gender and geography? If yes then why?
4. What communities and what geographic areas are more susceptible to the problem? What are the reasons for it?
5. What according to you are some of the common reasons for children dropping out from school in the districts to be covered
under the proposed study and do you feel that there are any particular reasons why the dropout rate in these districts may
be higher or lower than the state average?
6. Are there any specific policies, programs or projects that have been initiated to curb dropout rates. If yes then please
provide details/literature on the same?
7. Does the state actively track data on school dropout? Please share the data flow and how long after a student has dropped
out will it come to the notice of state level offices.
8. For what time period are the drop-out records available?
9. If the state does record information on dropouts, then what is the methodology for computation and has the methodology
been held consistent over time?
10. Does the education machinery track dropout rates at the school, block, circle, district and state level. If yes, then does this
tracking result in any case/geography specific action?
11. Are there any specific training programs or workshop modules held for teacher (or at least head teachers) that sensitise
them on the issue of school dropout, reasons behind student dropout and ways to check high student dropout in schools.
If yes then please provide details/literature on these programs/modules?
12. What role do CRCs/BRCs play in tracking, reporting and curtailing school dropouts in the schools under their
purview/supervision?
13. What role do head teachers play in tracking, reporting and curtailing school dropouts at their schools?
14. Even while curbing drop out is high on Government’s agenda, the problem continues to persist, what are some challenges
that Government face in curtailing the problem?
Questionnaire for DEO/BEO officialsQuestionnaire for DEO/BEO officialsQuestionnaire for DEO/BEO officialsQuestionnaire for DEO/BEO officials
1. Can you tell about a few schools and headmasters who have been managing drop-outs really well? Please give example
and elaborate on what they are doing.
2. When is a student considered as a drop out from school?
54
3. What according to you are some important reasons for which children drop out?
4. What groups are most susceptible to dropping out and why?
5. What is the role of DEO/BEO in preventing drop-outs?
6. How do you connect with BRC/CRC, headmasters to take care of drop –out issue?
7. What steps have been taken so far to prevent drop outs?
8. Are the teachers trained on preventing drop-outs? What kind of training is imparted?
9. How is the data collected and/or maintained by the DEO/BEO?
10. What is the process of validating this data?
11. How and with whom is the data on drop-outs shared?
12. Do we have school-wise data for drop-outs?
13. What is the main highlight of this data and what light does it throw on drop out reasons?