Embed Size (px)
Citation preview
Study of Pollutant Spillage andElectrokinetic Soil Remediation
C. Sawidou and M. Penn
CUED/D-SOILS/TR.302September 1996
A final report to EPSRC for grant no. GR/J05644
Cambridge University Engineering DepartmentTrumpington Street
CambridgeCB2 1PZ
EPSRC Final Report: Grant GR/J05644
Studv of Pollutant Spillage and Electrokinetic Soil Remediation
Ihe proposal for this work outlined a research programme separated in four parts as follows:
(9 design and development of equipment and instrnmentation,
(ii) laboratory electrokinetic tests at 1 g for investigation of fundamental processes,(iii) 4 centrifuge tests on spillage of dense pollutant and analysis of results,(iv) 4 centrifuge tests on electrokinetic remediation and interpretation of data.
Part I was successfully undertaken and led to the design and manticturing of a lg electrokineticcell and centrifuge test equipment and instrumentation for the two di&rent sets of tests. All thecentrifhge tests were undertaken on the CUED 10m arm centrifhge. The post-test investigationsrequired an Atomic Absorption Spectrometer was necessary and this was the most substantialequipment purchase.
Part II. investigated both chemical and thermal effects on electrokinetic remediation. As theresearch progressed several interesting findings were encountered which led to a slight modificationof the programme to enable detailed research and interpretation of those findings.
Part III accomplished 8 centrifuge tests on density driven flows in silty and sandy soils. The datawere used to validate the computer code HST3D.
Part IV involved considerable development of equipment and instrumentation and comprised 5centrifuge tests which led to a successful model con&uration and meaningful data.
Over the course of the work it was found that it would be diflicult to obtain a proven computercode for electrokinetic remediation. It was therefore decided that in addition to the proposedresearch a numerical code should be developed and used to provide predictions (Part V).
Despite various unforeseen circumstances during this work (i.e. three different Research Assistantsand an one year sick leave for the principal investigator) the research was undertaken with successand led to many interesting findings, several research papers and two PhD dissertations.
This report summa&es the findings of the work and is presented in four parts according to theproposed programme outlined above.
PART I
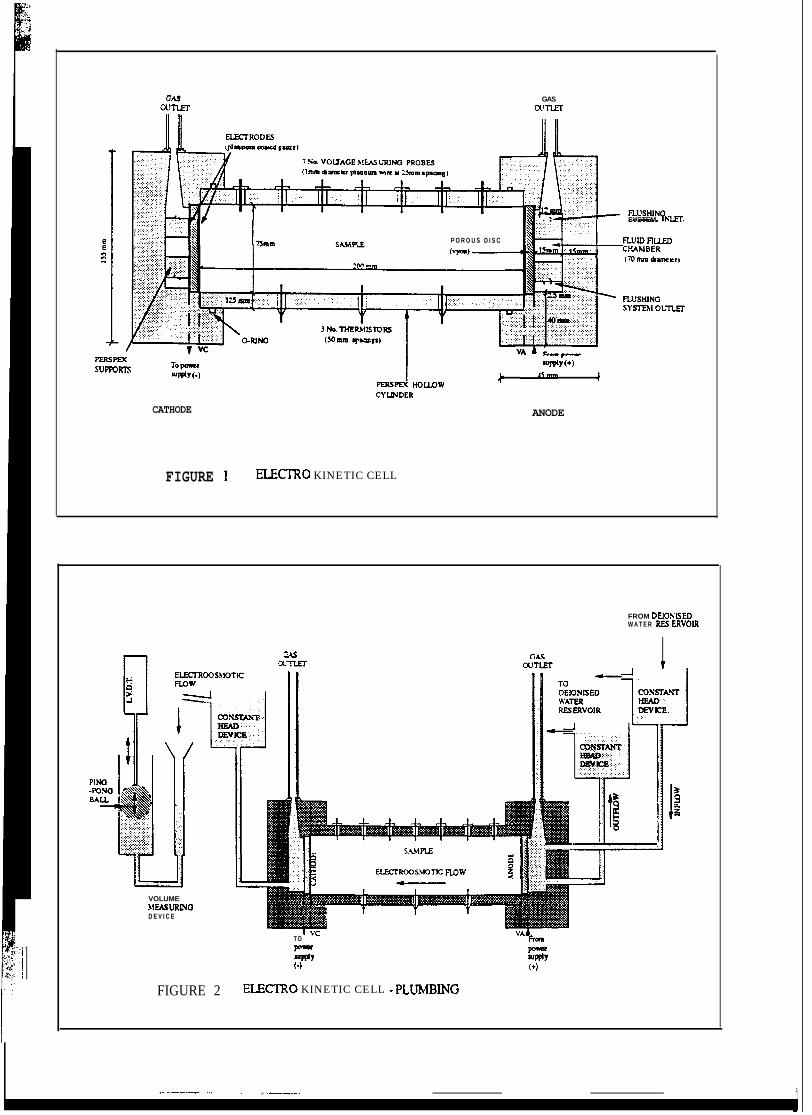
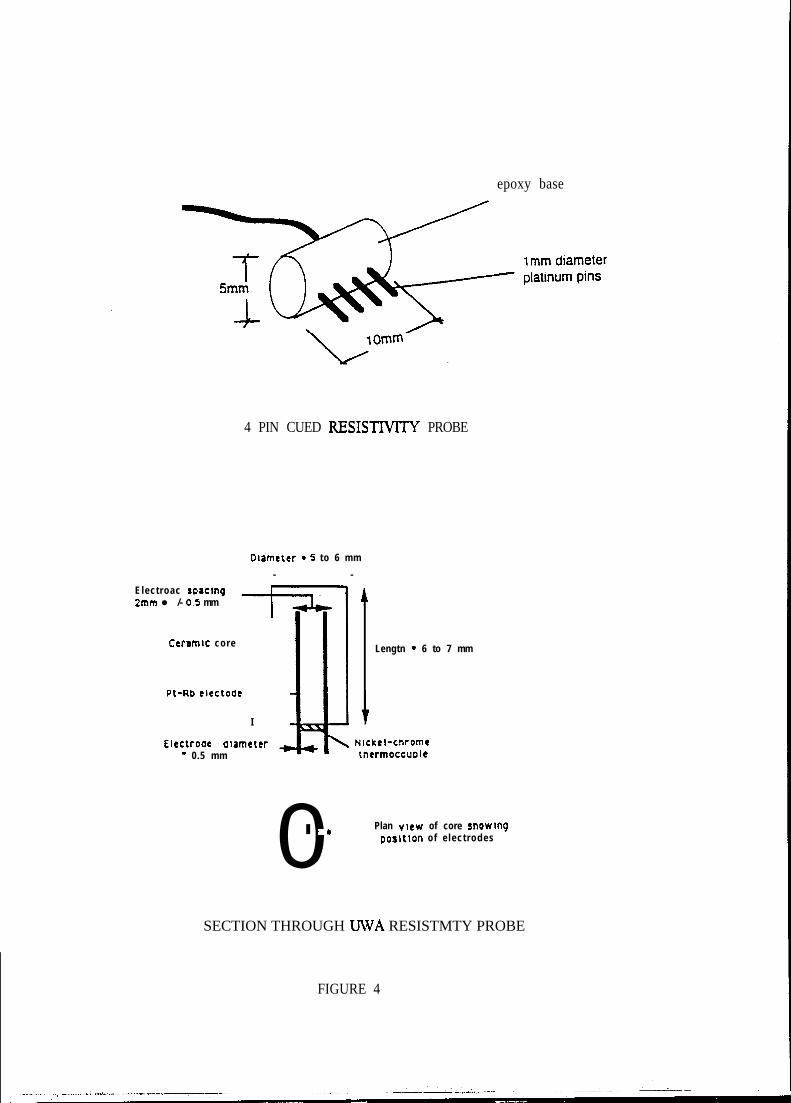
Several iterations of design and development produced the electrokinetic cell (Figs. l-3) used inPart II of the research and the centrifuge equipment (Figs. 4-6) used in Part LII and (Figs. 7- 11)UsedinPattIV.
PART It
Chemical tests
During electrokinetics electrolysis reactions occur around the wells producing alkaline conditions atthe cathode and acidic conditions at the anode. These ions then migrate towards the oppositelycharged electrode forming alkali and acid fronts. The migration of the acid is towards the cathode
J&+----~ _- .--.-&---e _._.-. .- -_--p.-. --.- - _ ..- .----- ._-_-_- -- __._.~
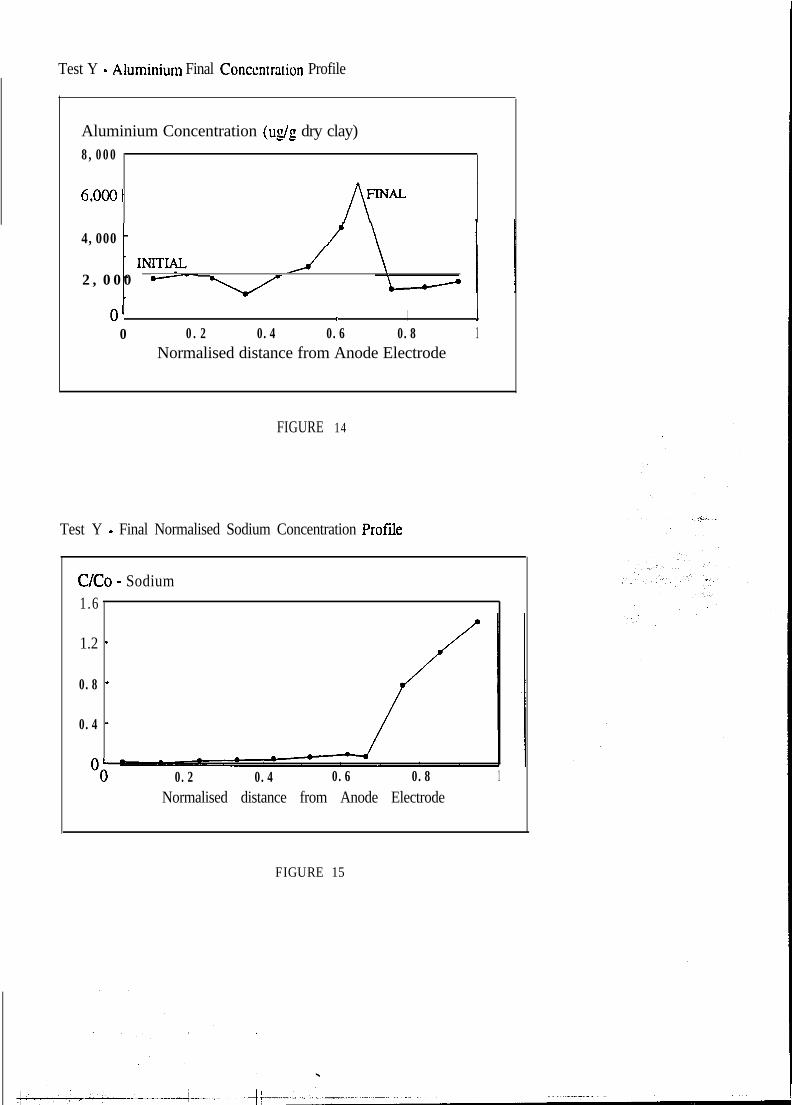
remain adsorbed or form precipitates such as ferric hydroide. When the two pH fronts meet at thepH jump, the impurities that are in solution and moving with the acid front, will form hydroxide oroxide precipitates. The high localised ion concentration produces a thin band of precipitates, whichhave a h&h resistance. A consequence of this may also be that the pore space is reduced locallyresulting in an increase in local resistance. This causes a large localised voltage drop across the pi-ljump. l%e sodium concentration profile shows no effect of the pore fluid pH level (Fig. 15).Sodium hydroxide is sohble an conductive and will therefore migrate in both high and low pHenvironments. The profile shows that approximately 2/3 of the sample has been remediated.
This series of tests indicates the need to limit pH front development and migration duringelectrokinetics. Both fronts limit the process; the alkali front produces non-conductive precipitates,which stop the process, whilst the acid front causes impurities to be desorbed and moved throughthe system, causing a large percentage of the driving gradient to be used to move them rather thanthe main pollutant ions. This means that the percentage of the applied electrical power being usedto remove the actual pollutant ions is reduce& hence influencing the efficiency of the remediationprocess. The formation of a hi~&ly resistive band also influences the remediation as it causes thevoltage gradient, and hence the pollutant migration, to decrease across the majority of the soiL
Temnerature tests
The samples were prepared as above. The tests were performed at a constant temperature - 25, 50or 75°C (note that field scale studies have shown temperature increases of 40°C are possiile afterapplying a current density of 4Amps/m2 for four weeks) by placing the electrokinetic cell in a waterbath 48 hours prior to testing. This allowed the clay samples to reach equilibrium
A volume measuring device \vas connected to the cathode reservoir to monitor the electroosmoticflow rate, whilst the anode reservoir was flushed with deionised water. Constant head devicesconnected to both reservoirs prevented the development of hydraulic gradient across the sample.Table 3 descriies the experiments undertaken; more detail can be found in Penn and Sawidou(1997). In the first two tests the supply voltage was monitored and adjusted manually to provide aconstant voltage gradient across the soil until a constant electroosmotic flow rate was established.In the other tests the supply \.oltage across the whole system was constant resulting in varyingvoltage across the soil until the process was stopped due to the pH fronts meeting. The current wasmeasured by the arrangement shown in Fig. 3.
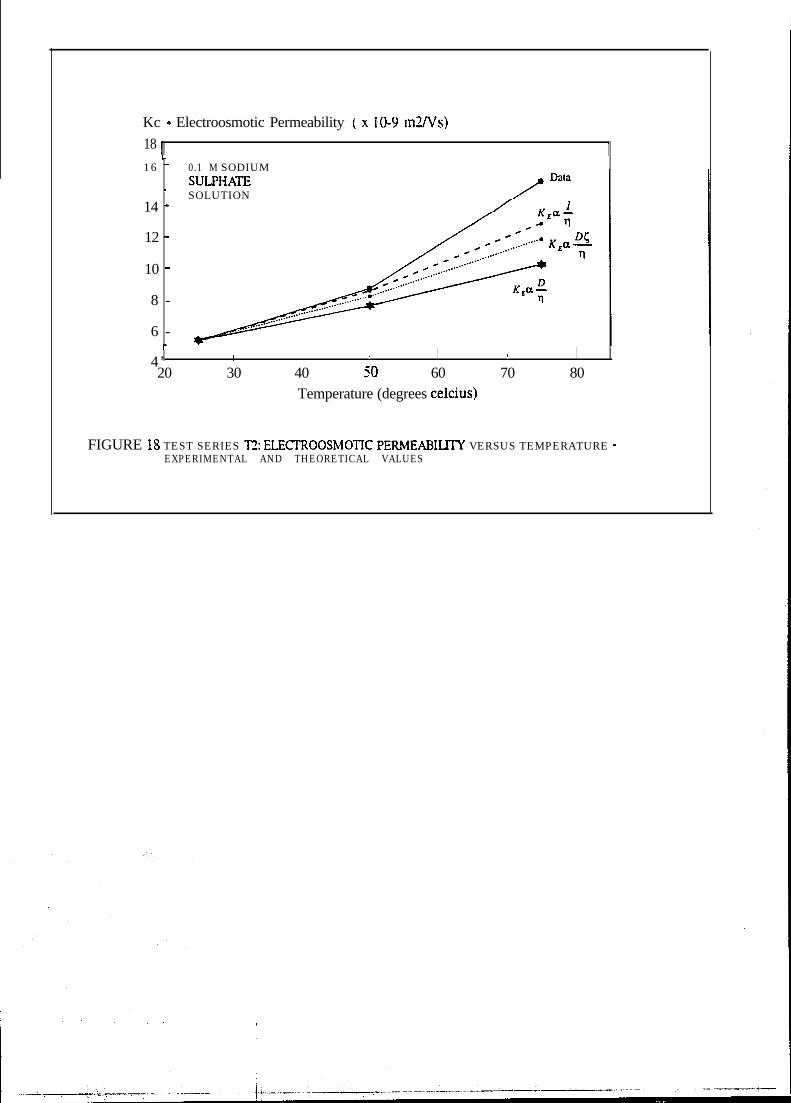
Post test investigations invoh:ed sampling and measuring the pH, moisture content, sodium andsuiphate concentrations in the pore fluid of each sample. Tests Tl and T2 showed an increase inelectroosmotic permeability with increasing temperature (fig. 16). For the calculation of theelectroosmotic permeability, \xlues for dielectric constant and viscosity were obtained fromPhysical and Chemical constants references, but zeta-potential must be obtained experimentally.Since zeta-potential measuring equipment was not available at CUED the e><perh=ntalelectroosmotic permeability at 25°C was used to calculate a v&e for zeta-potential which was thenused to calculate theoretical vahles for electroosmotic permeability at other temperatures. Threecalculations were performed, nith electroosmotic permeability assumed to be only dependent oneither (i) viscosity, (ii) dielectric constant and viscosity, or (iii) dielectric constant, hcoshY andzeta-potential. The theoretical values compare well with experimental values for both deionisedwater and sodium @hate sotition samples (Figs. 17 and 18).
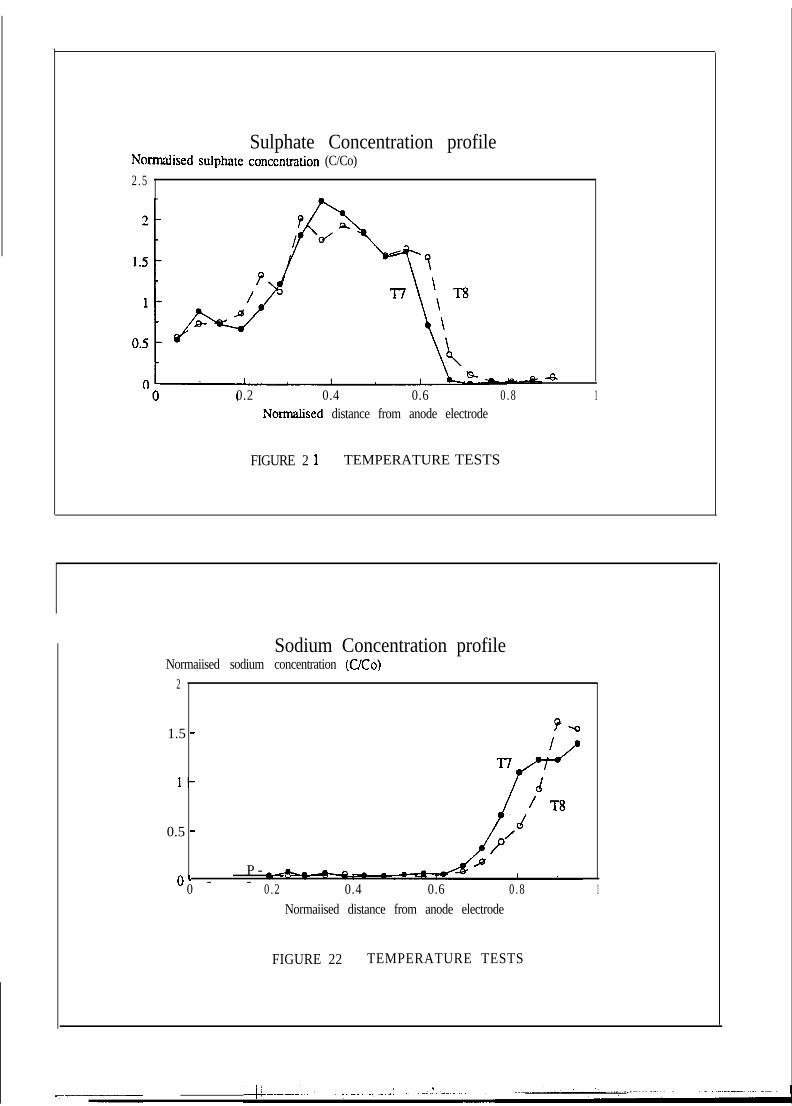
Tests T7 - T9 investigated the effect of temperature on both e1ect.roosmosi.s and ionic m&atioaThe tests were stopped after the formation of a blue line and corresponding fall in client descriibed
~~_-__--. .--~~~ -
processes. Further work would be necessary for evaluation of fingering and circulatioumechanisms present in such experiments.
PART IV
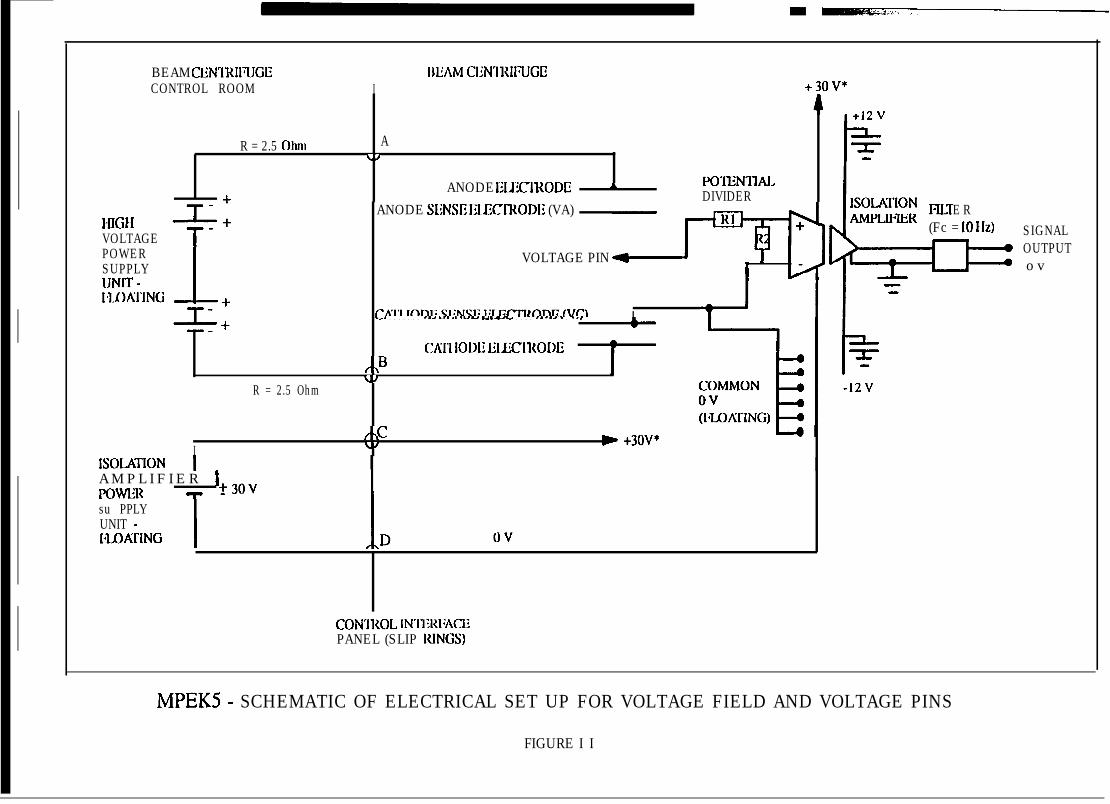
Five electrokinetic centrifuge tests were performed in cylindrical models of E-grade kaolin claymixed and saturated with copper sulphate solution. Figs. 7-10 show schematic diagrams of theequipment and Table 7 outlines the difherent tests. A constant direct current electrical potential wasapplied across the clay by inserting rectangular platinum electrodes. Contaminants that migrated tothe electrodes during the processes were removed by flushing the wells with deionised water. Thevoltage field, temperature and pore water pressures within the model were measured by voltagepins, thermocouples and pore water pressure transducers. Voltage pins with a high resistance,potential divider circuit and isolation amplifiers were developed to monitor local voltages within afloating voltage field (Fig. 11). Each test duration comprised of a period of consolidation followedby remediation. Post test sampling and analysis were carried out to determine the &ralconcentration of copper and sulphate ions in the pore fluid. The tests for copper used the atomicabsorption spectrometer and for sulphate used the turbidity method with a spectrophotometer.Since this was the first time that anyone had attempted a study of electrokinetics in a centrifuge,tests 1 to 4 involved considerable development and improvement which then led to test 5 whichprovided the most reliable data (Penn & Sav\idou, 1996). The results from this test are describedbriefly below.
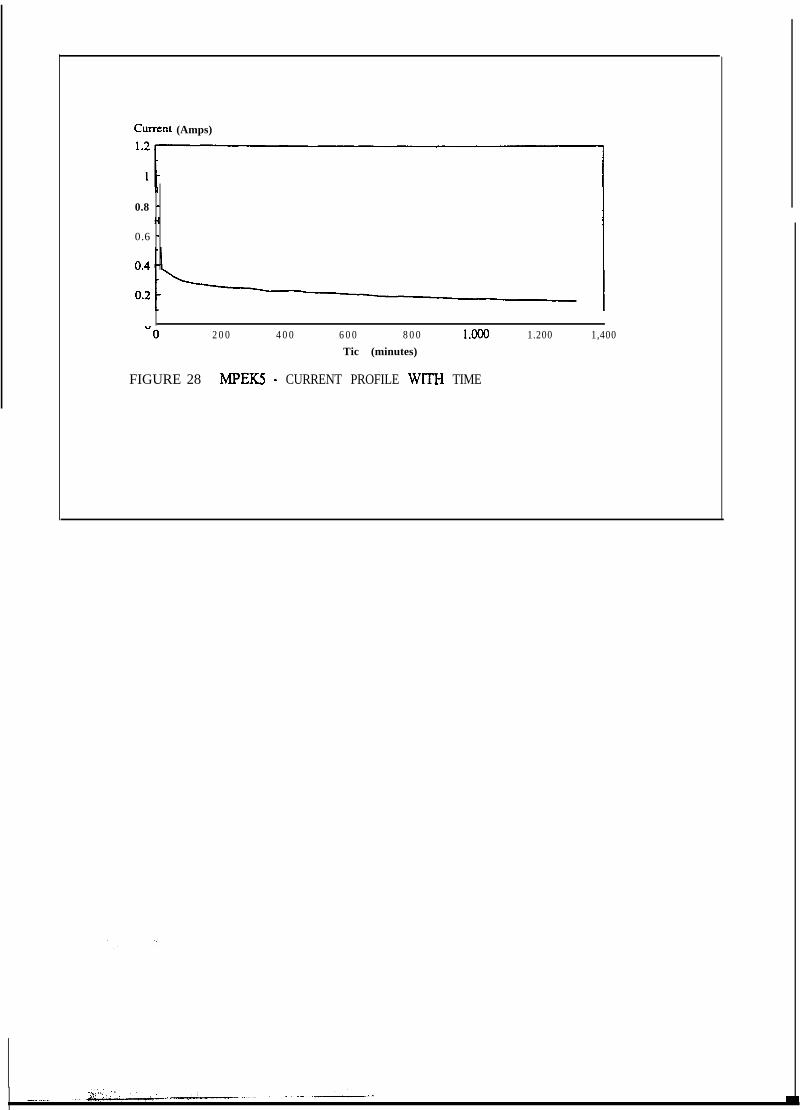
The initial and final voltage fields at a cross-section through the model, along the centreline of theelectrodes are presented in Figs. 26 and 27, This shows the initially uniform voltage field becomingdistorted and indicating a change in conductivity of the soil with time. The areas close to theelectrodes (especially the cathode) become more resistive. The explanation for this can be given interms of the resultant ions from the electrolysis reactions of the water in the wells migratingtowards the oppositely charged electrode and forming acid and alkali fronts. The acid frontmigrates from the anode to the cathode whilst the alkali front does the opposite. The copper ions,which move towards the cathode, meet the hydroxide front close to the cathode and precipitate outof solution in the high pH environment forming copper hydroxide. This precipitate is notconductive and causes a high resistive band to build up close to the cathode. The wells are flushedwith deionised water which is drawn into the soil around the anode due to electroosmosis. Thishigh resistance fhrid acts as a resistive band around the anode. The areas of high resistance developwithin a relatively short time after applying the voltage and cause the current to reduce as aconsequence (Fig. 28) and the heating effect also reduces (Fig. 29).
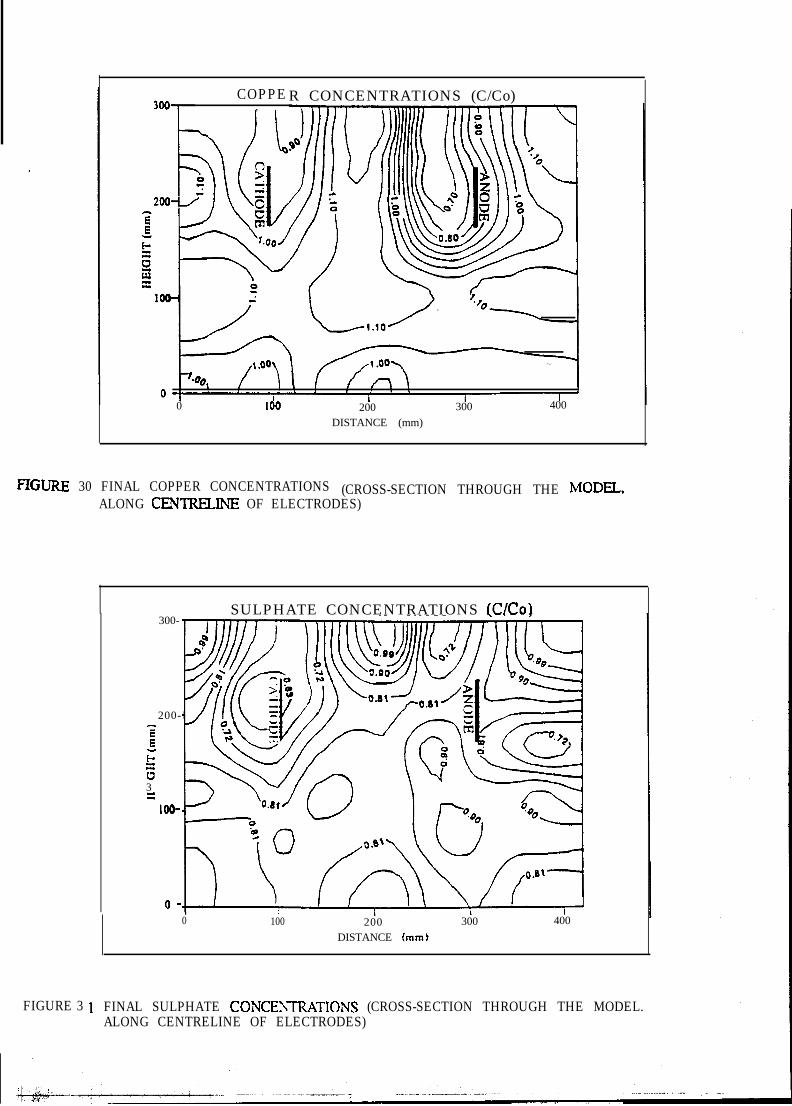
The fmal concentrations for a vertical cross-section through the model show some reduction in theconcentration for both ions but mainly around the electrodes (Figs. 30 and 3 1). As expected, thereis a greater reduction in copper ions at the anode as the positive copper ions migrate towards thecathode; the opposite occurs to the sulphate ions. The test highlights the fact that electrokineticremediation is susceptible to small areas of high resistance between the electrodes which limit theprocess by reducing the driving gradient across the majority of the contaminated soil, The tests alsoshowed that the migration of an alkali front through the soil causes areas of high resistance and istherefore detrimental to the remediation process. This is in line with the findings in Part II.
PARTV
III addition to the research work outlined in the original proposal time was invested in developingcomputer codes that predict one dimensional electrokinetic remediation. This work was undertaken
I
-----_---- -- .-.-...- - ..- ___.. _ _
EPSRC Final Report: Grant GR/J05644
Studv of Pollutant SDiUage and Electrokinetic Soil Remediation
REFERENCES
Hellawell, E.E. and Sawidou, C. (1994) “A study of contaminant transport involvingdensity driven flow and hydrodynamic clean-up”, Conference Proceedings,Centrifuge ‘94.
Hellawell, E.E. (1994) “Modelling transport processes in soil due to hydraulic, density andelectrical gradients”, PhD dissertation, Cambridge University EngineeringDepartment.
McKinley. J.D. and Sawidou, C. (1996). “Numerical modelling of the electrokeneticremediation of heavy metal contaminated soil”, CUED/D-SOJLS/TIt292.
Penn, M. and Sawidou, C. (1996). “Centrifuge modelling of the removal of heavy metalpollutants using electrokenetics”, Second International Congress on EnvironmentalGeotechnics, Osaka, Japan, November 5-Sth, (in press).
Penn, M. and Sawidou, C. (1997). “Temperature effects on electrokinetic remediation ofcontaminated soil”, International Symposium on Engineering Geolouq and theEnvironment, Athens, Greece, 2527th June 1997 (accepted for publication).
Penn, M., Neal, P., Lynch, RJ. and SavTidou, C. (1996). “Investigation of ElectrokineticRemediation in kaolinite clay using Inductively Coupled Plasma Atomic EmissionSpectrometry”, in preparation.
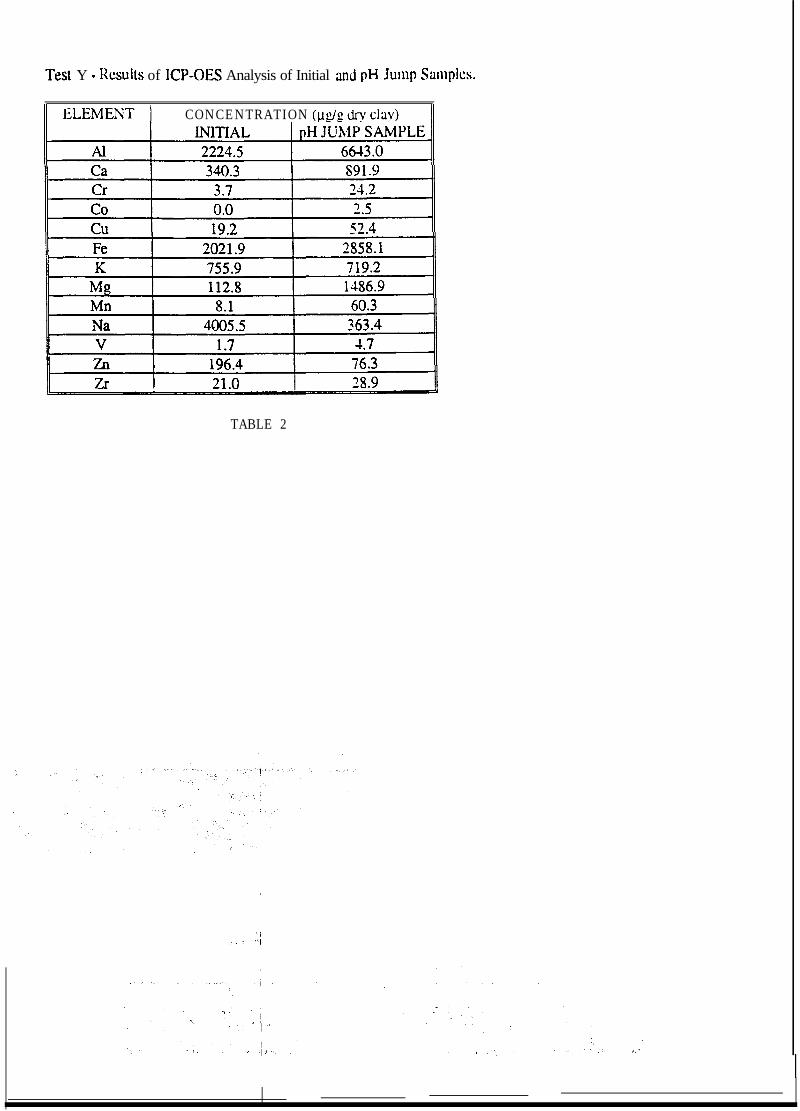
Tesl Y - Ihwl~s of ICP-OES Analysis of Initial and pH Junp Sa~l~plcs.
CONCENTRATION
TABLE 2
/
‘i,.: -,
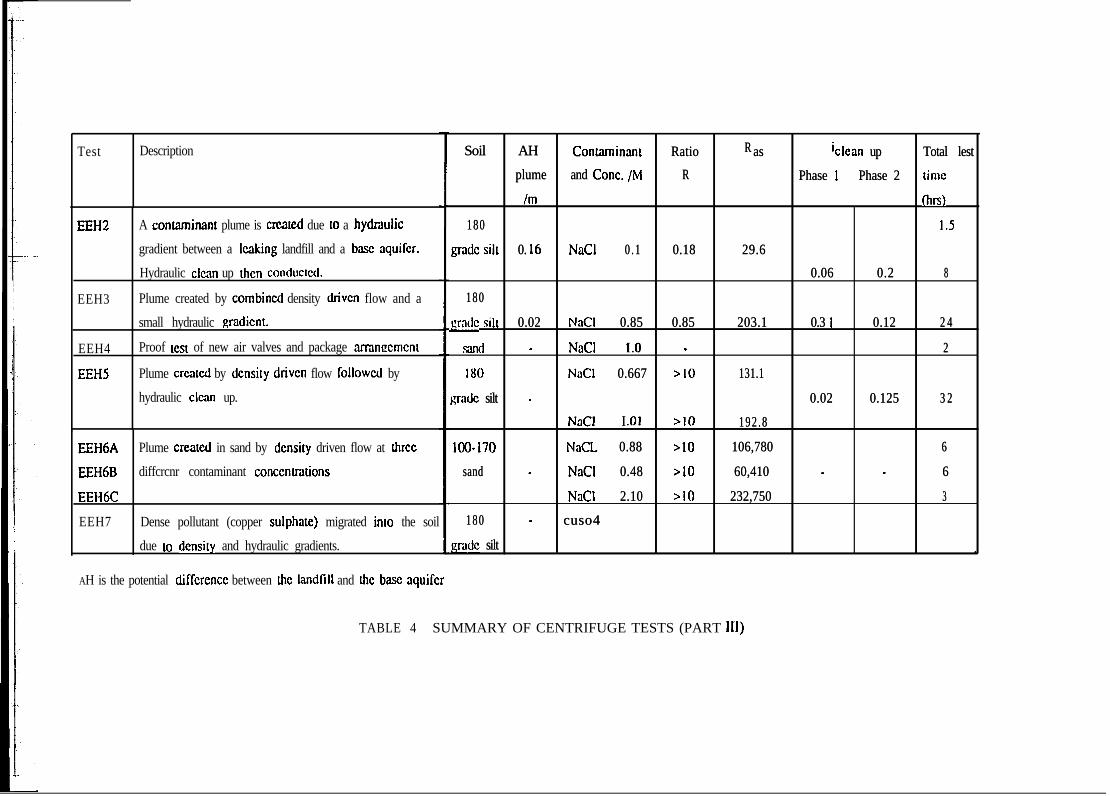
Test Description
EEH2
EEH3
EEH4
EEHS
A contaminanr plume is created due fo a hydmulic
gradient between a Icaking landfill and a base aquifer.
Hydraulic clean up then conducted.
Plume created by combined density driven flow and a
small hydraulic gradient.
Proof test of new air valves and package arranccmcm
Plume crcalcd by dcnsily driven flow followed by
hydraulic clean up.
EEH6A Plume crealcd in sand by dcnsily driven flow at three
EEH6B diffcrcnr contaminant concentrations
EEH6C
EEH7 Dense pollutant (copper sulphate) migrated into the soil
due 10 densily and hydraulic gradients.
Soil AHSoil AH ContarninaniContarninani RatioRatio RR asas iclean upiclean up Total lestTotal lest
plumeplume and Cont. /Mand Cont. /M RR Phase IPhase I Phase 2Phase 2 limelime
/m/m (hrs)(hrs)
180180 I.5I.5
grade siltgrade silt 0. I60. I6 NaClNaCl 0 . 10 . 1 0.180.18 29.629.6
0.060.06 0.20.2 88
180180
grade sibgrade sib 0.020.02 NaClNaCl 0.850.85 0.850.85 203.1203.1 0.3 I0.3 I 0.120.12 2 42 4
.md.md -- NaClNaCl I.0I.0 -- 22
I80I80 NaCINaCI 0.6670.667 >I0>I0 131.1131.1
grade siltgrade silt -- 0.020.02 0.1250.125 3 23 2
NaClNaCl I .OJI .OJ >I0>I0 1 9 2 . 81 9 2 . 8
100-170100-170 NaCLNaCL 0.880.88 >I0>I0 106,780106,780 66
sandsand -- NaClNaCl 0.480.48 >I0>I0 60,41060,410 -- -- 66
NaClNaCl 2.102.10 >I0>I0 232,750232,750 33
180180 -- cuso4cuso4
grade siltgrade siltll
AH is the potential diffcrencc between Ihc IandIill and the base aquifer
TABLE 4 SUMMARY OF CENTRIFUGE TESTS (PART III)
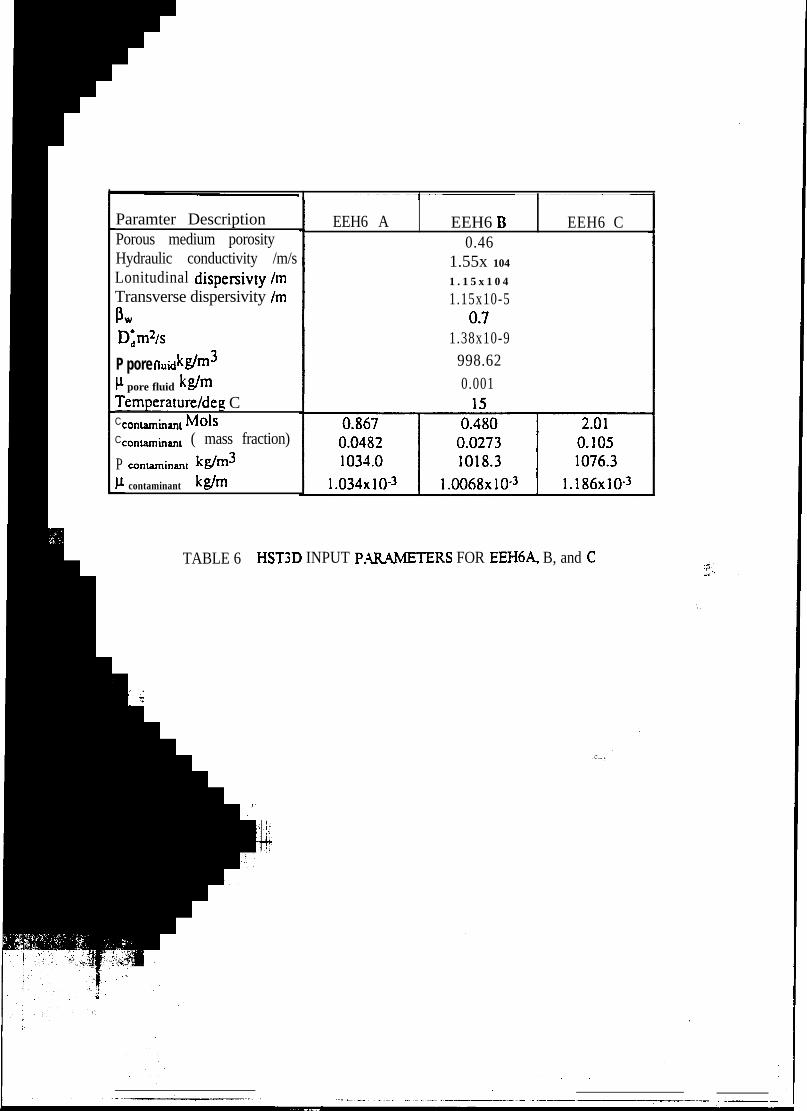
Paramter DescriptionPorous medium porosityHydraulic conductivity /m/sLonitudinal dispersivty /mTransverse dispersivity /mPwD', rnh
P pore thiciwm3p pore fluid kdm
Temperature/deg CCcontaminant MolsCconlamhan, ( mass fraction)
P contaminanr kg/m3
contaminant kg/m
EEH6 A EEH6 B EEH6 C0.46
1.55x 10⁴
1 . 1 5 x 1 0 4
1.15x10⁻⁵
1.38x10-9998.620.001
TABLE 6 HSTjD INPUT P.UUMETERS FOR EEH6A, B, and c
GASOITLEr
SYSTEM INLFT
P O R O U S D I S C
PER5PmsuPFoRTs Toporr
WHY 6) 4PERsPm HoLlow
4 -m
CYLMDER
CATHODE ANODE
FIGURE 1 EIJXTRO KINETIC CELL
FROM DEIOSISEDW A T E R RJZS ERVOIR
uEcTROOSMOTK Fl.OW
VOLUMEMtASuRMOD E V I C E
TO Ran
Zp”ctWTe
f-b w
FIGURE 2 ELECIRO KINETIC CELL - PLLTMBING
epoxy base
4 PIN CUED REZSISTMTY PROBE
Dlrmcter - 5 to 6 mm
- -
Ceramtc core
Pt-Rb clectoae
I
Electroae alameter +- 0.5 mm
Electroac sDaclng2mm l /- 0.S mm
0. .*
Lengtn - 6 to 7 mm
tdlckcl-cnrometnermocouDle
Plan view of core snowingpotltton of e lectrodes
SECTION THROUGH UWA RESISTMTY PROBE
FIGURE 4
BEAM CEN-IHIFUGEI
BliAM C13N-IRIFUGECONTROL ROOM +3ov*
R = 2.5 Oh A\J
ANODE ELJXX~ODE A+
HIGHVOLTAGEPOWERSUPPLYIJNIT -I~.Xh’XING
POlENTIALDIVIDER
ANODE SENSE I~LlXTRODE (VA)
VOLTAGE PIN qI - 1
f-r\‘I’l If-ml: c;l:N<l: I:1 m-n2nnr; fVC\ I
ISOIAIION 1A M P L I F I E R 1POWR ~ f30V
su PPLYUNIT -ItOATING I
._, . . . . . . . e....v.,..L..> .a.-- . . . . -.-.a \ . .-,
CXI‘I IODE IJIJXIXODE/B\J
R = 2.5 Ohm
/,CI \J m +3ov+
E R.I AMPLWkK
(Fc = 10 IIz)
I
CONlROL IN’I1~KI~ACEPANEL (SLIP RINGS)
SIGNALOUTPUTo v
MPEKS - SCHEMATIC OF ELECTRICAL SET UP FOR VOLTAGE FIELD AND VOLTAGE PINS
FIGURE I I
Test Y - Aluminium Final Concentration Profile
Aluminium Concentration (ug/g dry clay)8,000
.6,000. FINAL
A4,000
1 -
f \
INITIAL2,000 - v
OL I 8 I I 10 0.2 0.4 0.6 0.8 1
Normalised distance from Anode Electrode
FIGURE 14
Test Y - Final Normalised Sodium Concentration Profie
C/Co - Sodium1.6
1.2 -
0.8 -
0.4 -
OO 0.2 0.4 0.6 0.8 1Normalised distance from Anode Electrode
FIGURE 15
Kc - Electroosmotic Permeability ( x IO-9 1112Ns)
18 1 IL
16 - 0.1 M SODIUMSULPHATE
- SOLUTION14 -
12 -
10 -
8 -
6 -r
4’20
I30
! I I I I I40 50 60 70 80Temperature (degrees celcius)
FIGURE 18 TEST SERIES -l-Z: ELECTROOSM0-i-K PERMEABIW VERSUS TEMPERATURE -EXPERIMENTAL AND THEORETICAL VALUES
Sulphate Concentration profileNormalised sulphate conccnuation (C/Co)
2 . 5
43.
0.2 0.4 0.6 0 . 8 1Nonnalised distance from anode electrode
FIGURE 2 1 TEMPERATURE TESTS
Sodium Concentration profileNormaiised sodium concentration (C/Co)
2
1.5 -
l-
0.5 -
P -0, - -
0 0 . 2 0.4 0.6 0 . 8 1
Normaiised distance from anode electrode
FIGURE 22 TEMPERATURE TESTS
I
0I
40
Distance /m
I
6 0
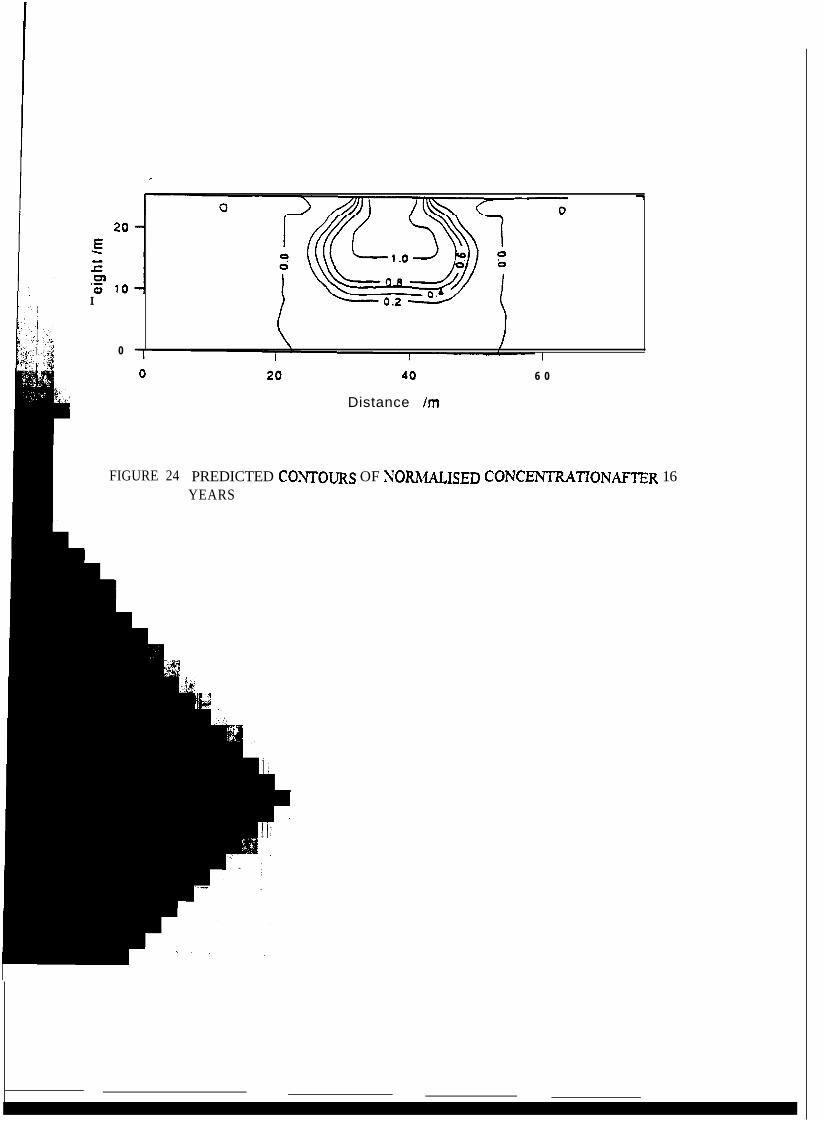
FIGURE 24 PREDICTED CO.NTOURS OF SORMALISED cONCENTMTIONAFTER 16YEARS
Currcnl (Amps)
0.8 ”
0.6 -
200 400 600 800Tic (minutes)
1300 1.200 1,400
FIGURE 28 MPEK5 - CURRENT PROFILE WITH TIME
COPPE,
R CONCENTRATIONS (C/Co)
0 100 200 300 400
DISTANCE (mm)
FIGURE 30 FINAL COPPER CONCENTRATIONS (CROSS-SECTION THROUGH THE MODELALONG CENTRELINE OF ELECTRODES)
300-
200-
zEl-=u3=
loo-
O-
SULPHATE CONCENTRATIONS (C/Co)
0 100 200 300 400
DISTANCE (mm)
FIGURE 3 1 FINAL SULPHATE CONCEh-l-RATIONS (CROSS-SECTION THROUGH THE MODEL.ALONG CENTRELINE OF ELECTRODES)
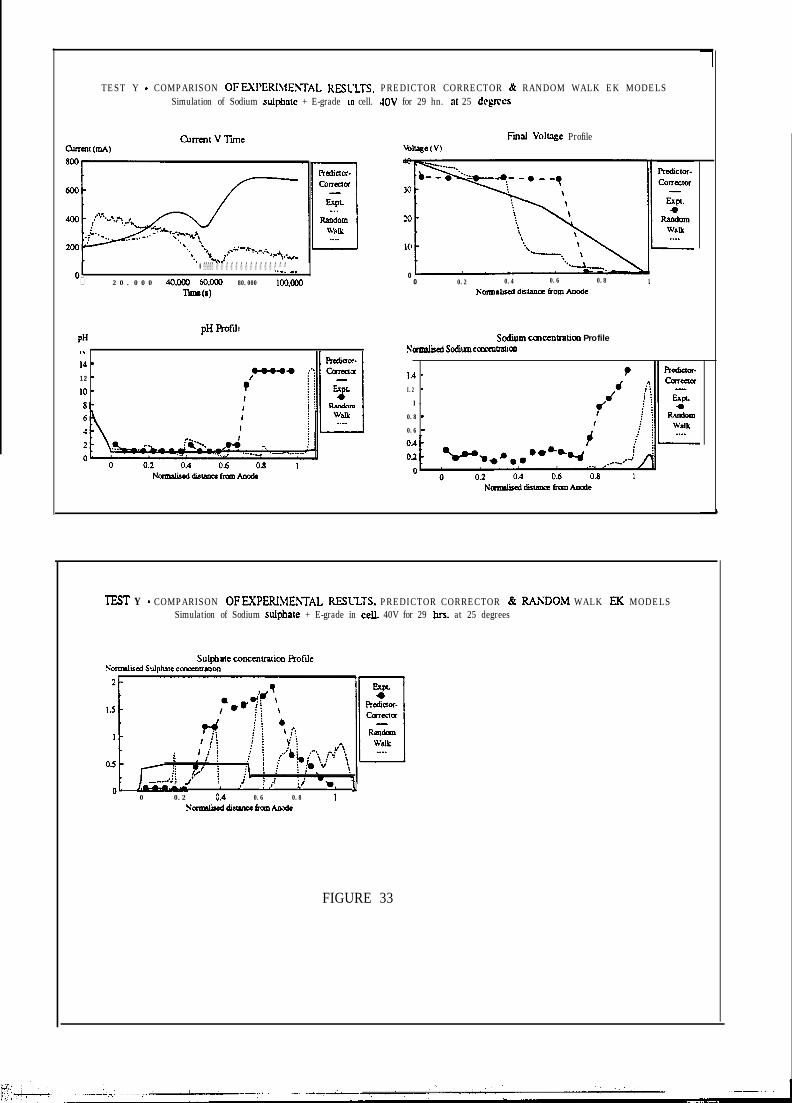
TEST Y - COMPARISON OFMPERIStE?3AL RESL-LTS. PREDICTOR CORRECTOR L RANDOM WALK EK MODELSSimulation of Sodium suiphatc + E-grade in cell. 4OV for 29 hn. al 25 dcgrccs
01l --..- . . . . . . . . . . . . . . . .._. _,
0 2 0 . 0 0 0 d0.m 6om3 80.000 lw330
l-mm
PHpH Rofde
.-
Id -
12 -
10 -
8-
Fmai Vohage Profile
00 0.2 0.4 0.6 0.8 1
Sodium concentration Profilesalmliisodimconmloaucm
1.d -
I.2 -
l -
0.8 -
0.6 -
EST Y - COMPARISON OFMPERIME3TAL RESL-LTS. PREDICTOR CORRECTOR & RAADOM WALK EK MODELSSimulation of Sodium suiphate + E-grade in cell. 40V for 29 hrs. at 25 degrees
,1 I;- ., i ,:.i ,i’ -, JJ
0 0.2 0.d 0.6 0.8 I
FIGURE 33