Embed Size (px)
Citation preview
Traf c & Transportation
Planning
Transport Planning and Environment
CSIR-CRRI, New Delhi
105
Study of Non methane Hydrocarbons in the Atmospheric Environment of Delhi Region
As reported earlier, this study has been sponsored by Department of Science & Technology with the following objectives :
• t o d o s a m p l i n g a n d c h e m i c a l characterization of ambient / atmospheric (C2-C4) non-methane hydrocarbon species in Delhi region
• to identify the sources/strength for the non-methane hydrocarbons in Delhi region and to make source inventories of non-methane hydrocarbons for Delhi region.
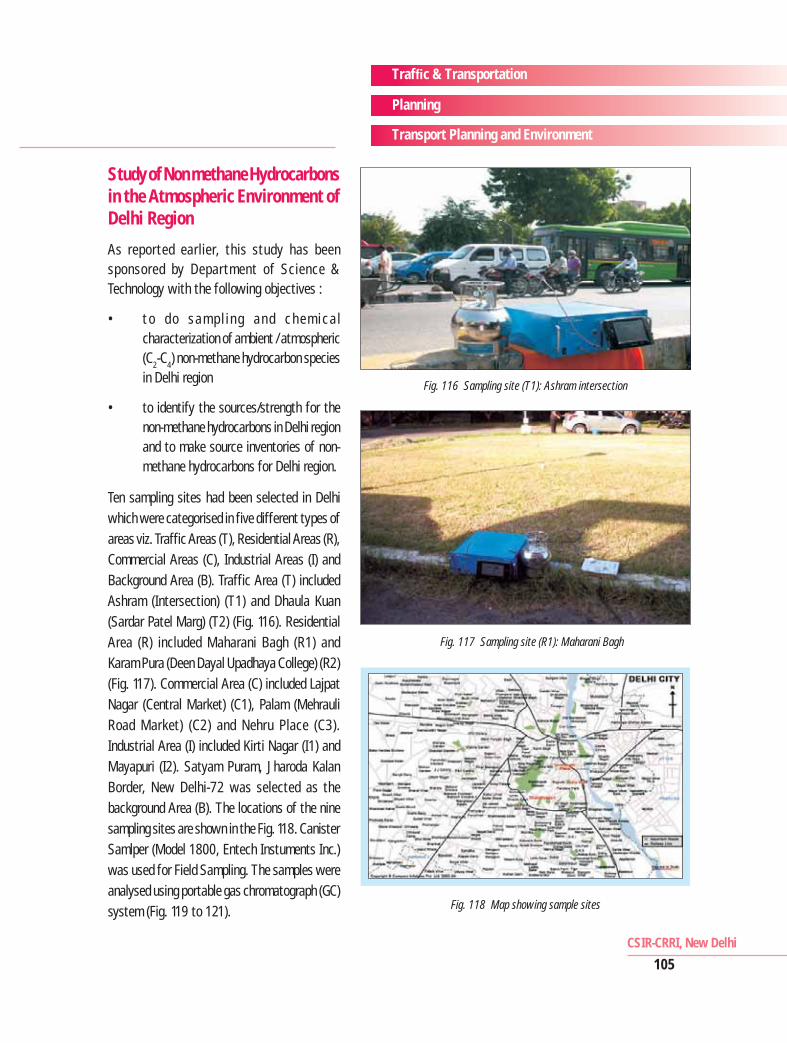
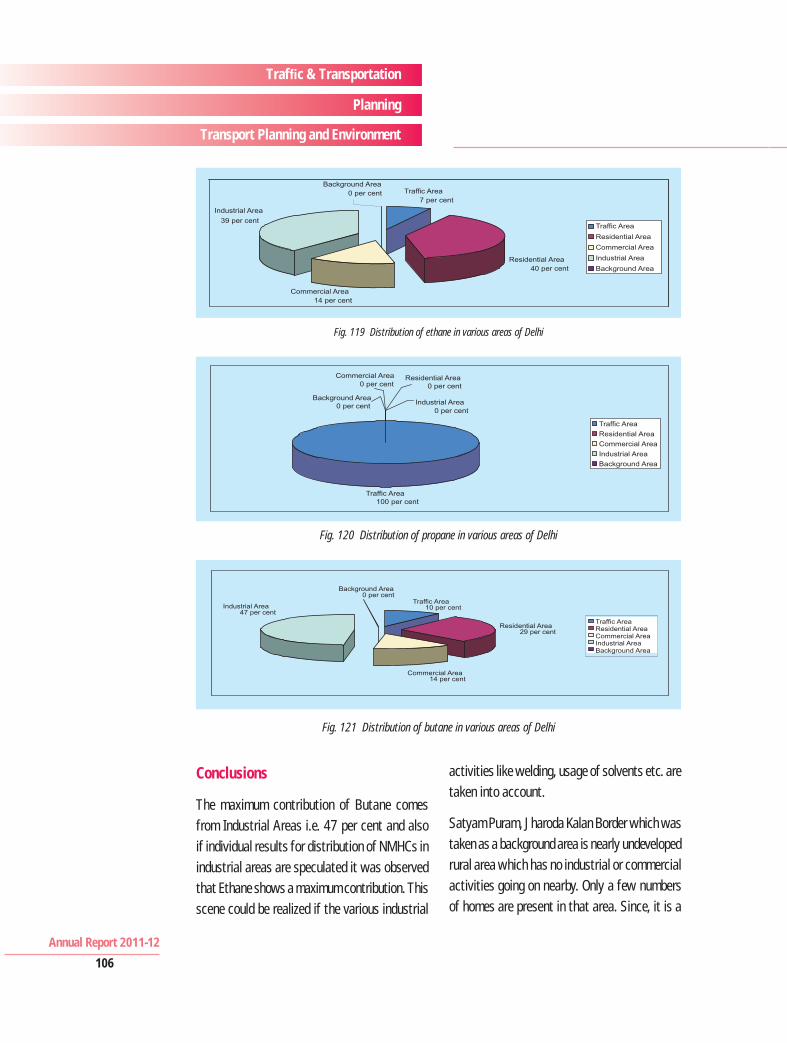
Ten sampling sites had been selected in Delhi which were categorised in five different types of areas viz. Traffic Areas (T), Residential Areas (R), Commercial Areas (C), Industrial Areas (I) and Background Area (B). Traffic Area (T) included Ashram (Intersection) (T1) and Dhaula Kuan (Sardar Patel Marg) (T2) (Fig. 116). Residential Area (R) included Maharani Bagh (R1) and Karam Pura (Deen Dayal Upadhaya College) (R2) (Fig. 117). Commercial Area (C) included Lajpat Nagar (Central Market) (C1), Palam (Mehrauli Road Market) (C2) and Nehru Place (C3). Industrial Area (I) included Kirti Nagar (I1) and Mayapuri (I2). Satyam Puram, Jharoda Kalan Border, New Delhi-72 was selected as the background Area (B). The locations of the nine sampling sites are shown in the Fig. 118. Canister Samlper (Model 1800, Entech Instuments Inc.) was used for Field Sampling. The samples were analysed using portable gas chromatograph (GC) system (Fig. 119 to 121). Fig. 118 Map showing sample sites
Fig. 116 Sampling site (T1): Ashram intersection
Fig. 117 Sampling site (R1): Maharani Bagh
Annual Report 2011-12
106
Traf c & Transportation
Planning
Transport Planning and Environment
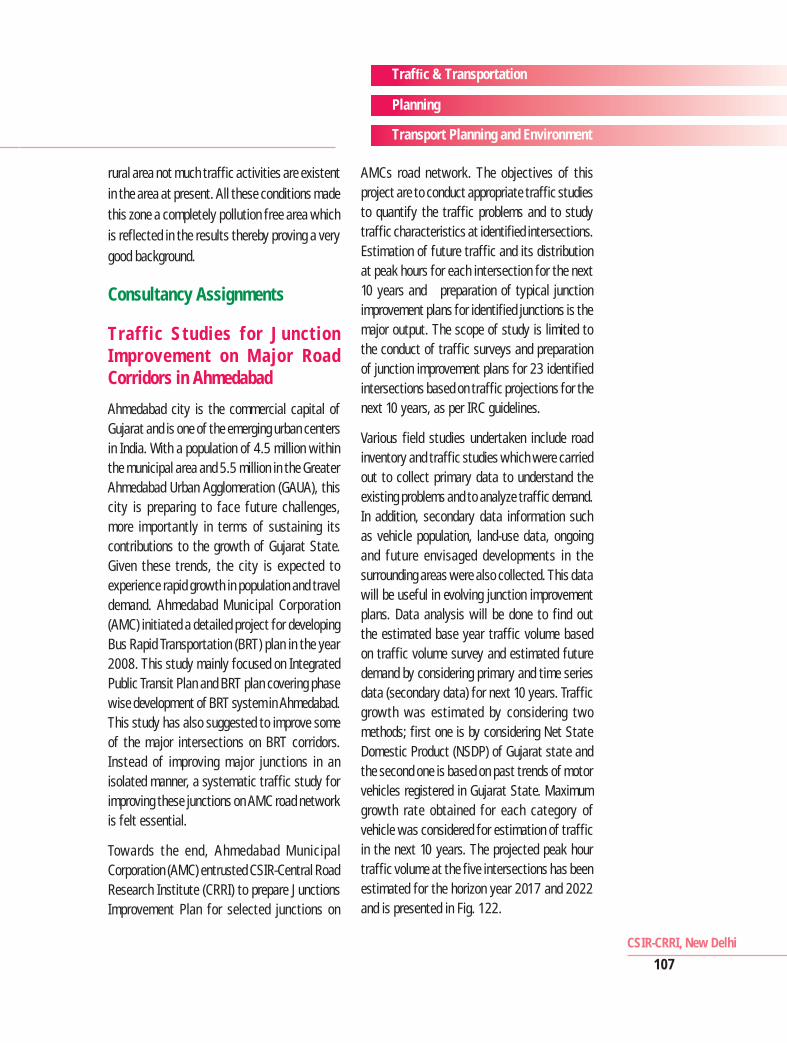
Fig. 119 Distribution of ethane in various areas of Delhi
Fig. 120 Distribution of propane in various areas of Delhi
Fig. 121 Distribution of butane in various areas of Delhi
Conclusions
The maximum contribution of Butane comes from Industrial Areas i.e. 47 per cent and also if individual results for distribution of NMHCs in industrial areas are speculated it was observed that Ethane shows a maximum contribution. This scene could be realized if the various industrial
activities like welding, usage of solvents etc. are taken into account.
Satyam Puram, Jharoda Kalan Border which was taken as a background area is nearly undeveloped rural area which has no industrial or commercial activities going on nearby. Only a few numbers of homes are present in that area. Since, it is a
Traf c & Transportation
Planning
Transport Planning and Environment
CSIR-CRRI, New Delhi
107
rural area not much traffic activities are existent in the area at present. All these conditions made this zone a completely pollution free area which is reflected in the results thereby proving a very good background.
Consultancy Assignments
Traffic Studies for Junction Improvement on Major Road Corridors in Ahmedabad
Ahmedabad city is the commercial capital of Gujarat and is one of the emerging urban centers in India. With a population of 4.5 million within the municipal area and 5.5 million in the Greater Ahmedabad Urban Agglomeration (GAUA), this city is preparing to face future challenges, more importantly in terms of sustaining its contributions to the growth of Gujarat State. Given these trends, the city is expected to experience rapid growth in population and travel demand. Ahmedabad Municipal Corporation (AMC) initiated a detailed project for developing Bus Rapid Transportation (BRT) plan in the year 2008. This study mainly focused on Integrated Public Transit Plan and BRT plan covering phase wise development of BRT system in Ahmedabad. This study has also suggested to improve some of the major intersections on BRT corridors. Instead of improving major junctions in an isolated manner, a systematic traffic study for improving these junctions on AMC road network is felt essential.
Towards the end, Ahmedabad Municipal Corporation (AMC) entrusted CSIR-Central Road Research Institute (CRRI) to prepare Junctions Improvement Plan for selected junctions on
AMCs road network. The objectives of this project are to conduct appropriate traffic studies to quantify the traffic problems and to study traffic characteristics at identified intersections. Estimation of future traffic and its distribution at peak hours for each intersection for the next 10 years and preparation of typical junction improvement plans for identified junctions is the major output. The scope of study is limited to the conduct of traffic surveys and preparation of junction improvement plans for 23 identified intersections based on traffic projections for the next 10 years, as per IRC guidelines.
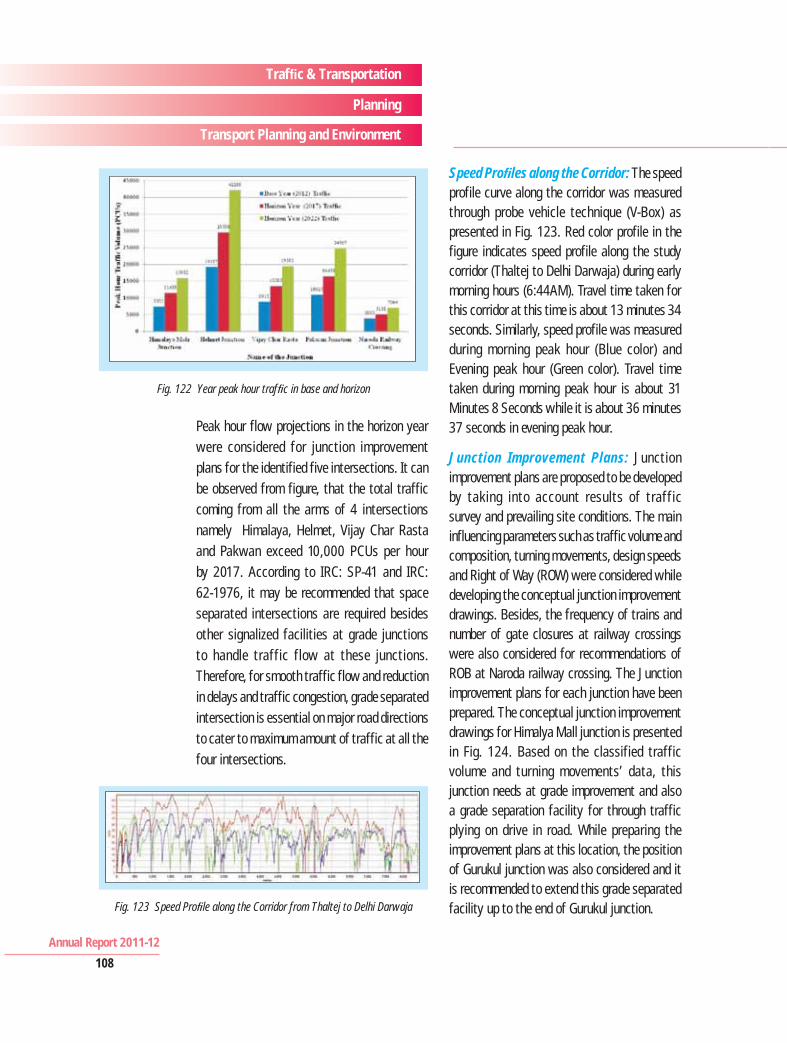
Various field studies undertaken include road inventory and traffic studies which were carried out to collect primary data to understand the existing problems and to analyze traffic demand. In addition, secondary data information such as vehicle population, land-use data, ongoing and future envisaged developments in the surrounding areas were also collected. This data will be useful in evolving junction improvement plans. Data analysis will be done to find out the estimated base year traffic volume based on traffic volume survey and estimated future demand by considering primary and time series data (secondary data) for next 10 years. Traffic growth was estimated by considering two methods; first one is by considering Net State Domestic Product (NSDP) of Gujarat state and the second one is based on past trends of motor vehicles registered in Gujarat State. Maximum growth rate obtained for each category of vehicle was considered for estimation of traffic in the next 10 years. The projected peak hour traffic volume at the five intersections has been estimated for the horizon year 2017 and 2022 and is presented in Fig. 122.
Annual Report 2011-12
108
Traf c & Transportation
Planning
Transport Planning and Environment
Peak hour flow projections in the horizon year were considered for junction improvement plans for the identified five intersections. It can be observed from figure, that the total traffic coming from all the arms of 4 intersections namely Himalaya, Helmet, Vijay Char Rasta and Pakwan exceed 10,000 PCUs per hour by 2017. According to IRC: SP-41 and IRC: 62-1976, it may be recommended that space separated intersections are required besides other signalized facilities at grade junctions to handle traffic flow at these junctions. Therefore, for smooth traffic flow and reduction in delays and traffic congestion, grade separated intersection is essential on major road directions to cater to maximum amount of traffic at all the four intersections.
Speed Pro les along the Corridor: The speed profile curve along the corridor was measured through probe vehicle technique (V-Box) as presented in Fig. 123. Red color profile in the figure indicates speed profile along the study corridor (Thaltej to Delhi Darwaja) during early morning hours (6:44AM). Travel time taken for this corridor at this time is about 13 minutes 34 seconds. Similarly, speed profile was measured during morning peak hour (Blue color) and Evening peak hour (Green color). Travel time taken during morning peak hour is about 31 Minutes 8 Seconds while it is about 36 minutes 37 seconds in evening peak hour.
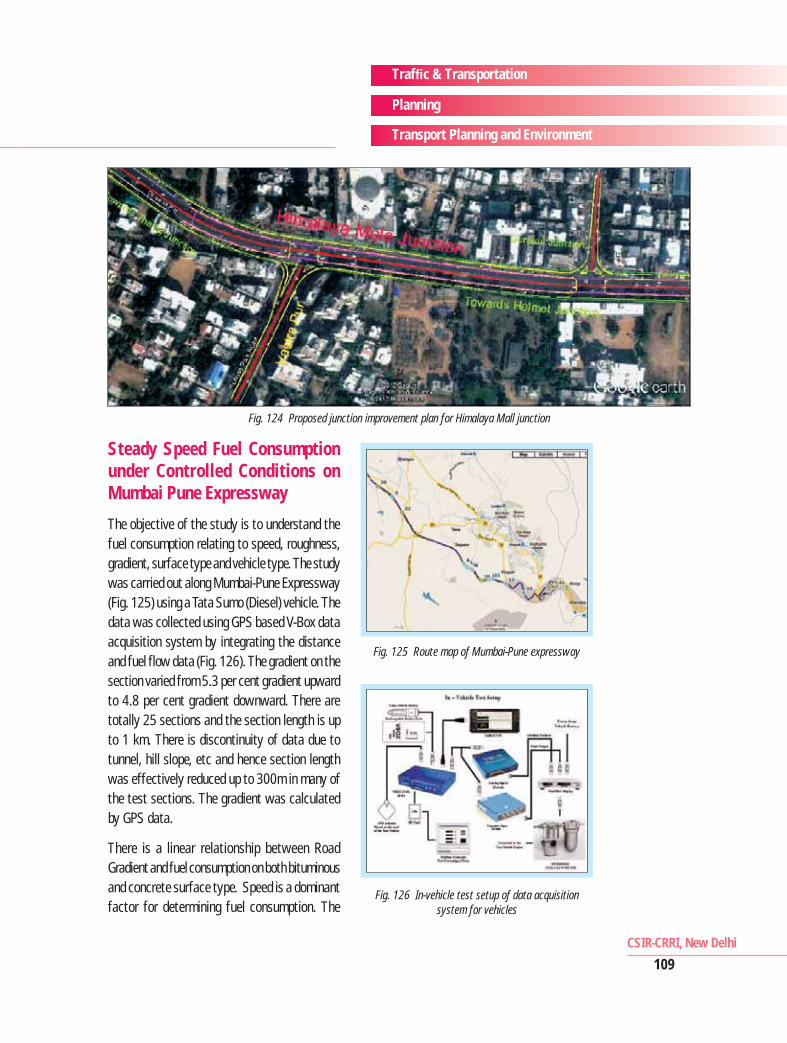
Junction Improvement Plans: Junction improvement plans are proposed to be developed by taking into account results of traffic survey and prevailing site conditions. The main influencing parameters such as traffic volume and composition, turning movements, design speeds and Right of Way (ROW) were considered while developing the conceptual junction improvement drawings. Besides, the frequency of trains and number of gate closures at railway crossings were also considered for recommendations of ROB at Naroda railway crossing. The Junction improvement plans for each junction have been prepared. The conceptual junction improvement drawings for Himalya Mall junction is presented in Fig. 124. Based on the classified traffic volume and turning movements’ data, this junction needs at grade improvement and also a grade separation facility for through traffic plying on drive in road. While preparing the improvement plans at this location, the position of Gurukul junction was also considered and it is recommended to extend this grade separated facility up to the end of Gurukul junction.
Fig. 122 Year peak hour traf c in base and horizon
Fig. 123 Speed Pro le along the Corridor from Thaltej to Delhi Darwaja
Traf c & Transportation
Planning
Transport Planning and Environment
CSIR-CRRI, New Delhi
109
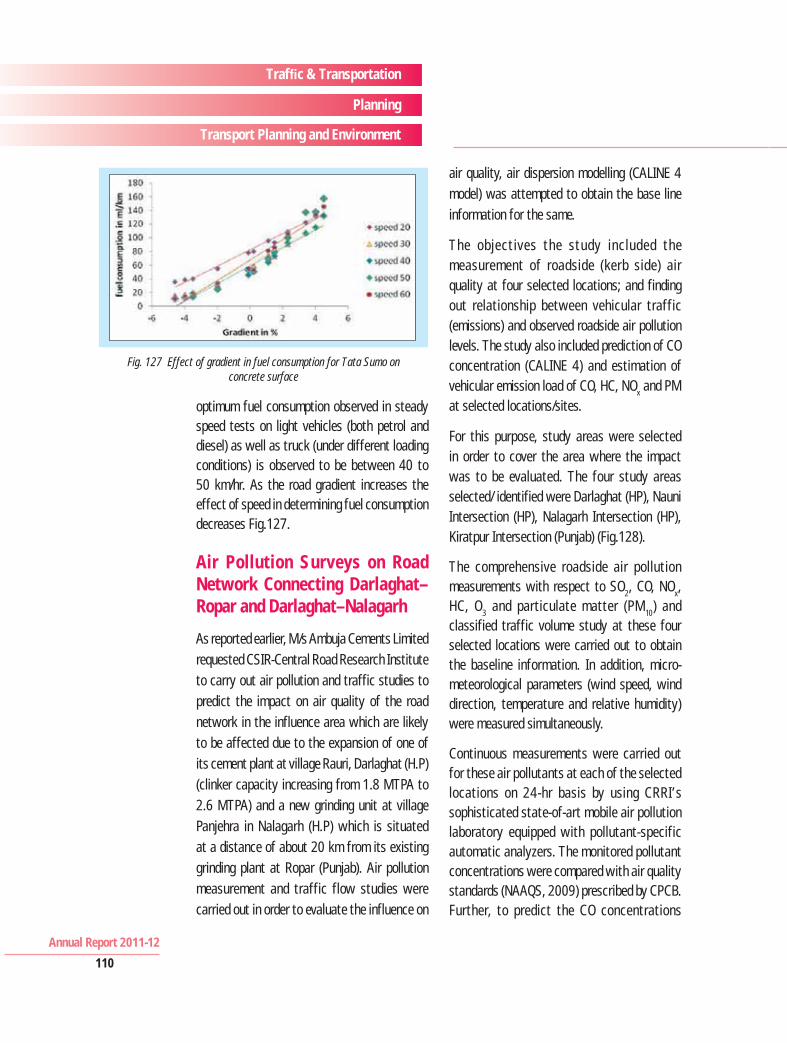
Steady Speed Fuel Consumption under Controlled Conditions on Mumbai Pune Expressway
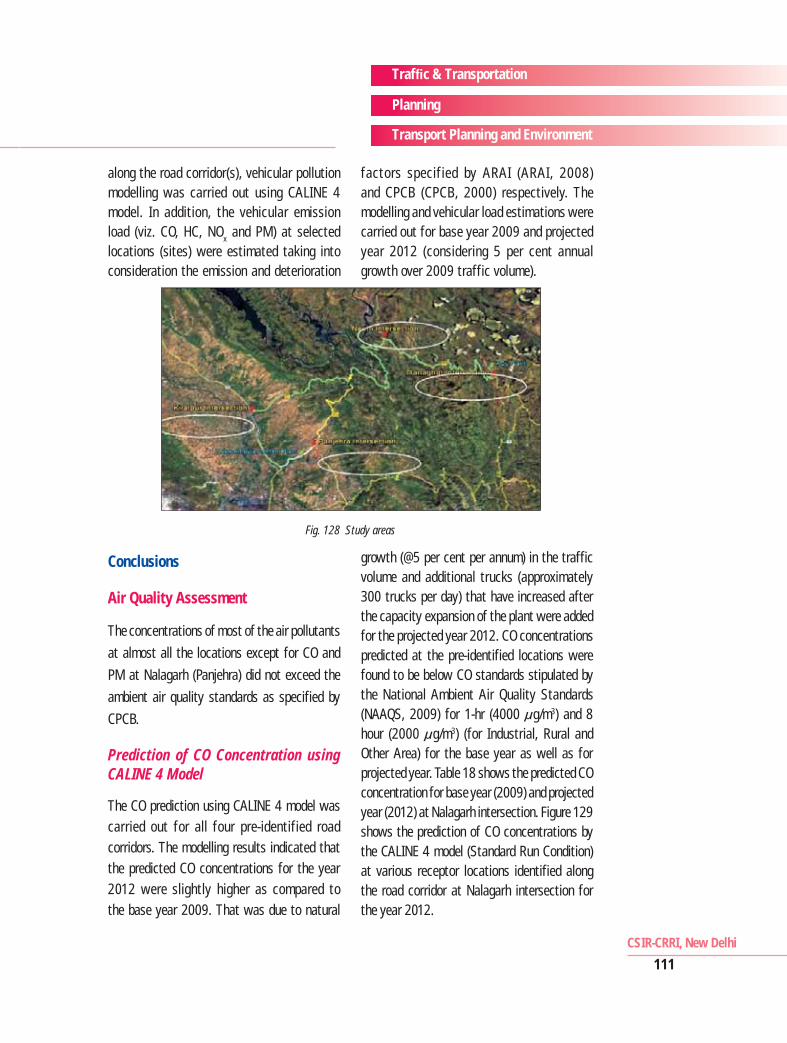
The objective of the study is to understand the fuel consumption relating to speed, roughness, gradient, surface type and vehicle type. The study was carried out along Mumbai-Pune Expressway (Fig. 125) using a Tata Sumo (Diesel) vehicle. The data was collected using GPS based V-Box data acquisition system by integrating the distance and fuel flow data (Fig. 126). The gradient on the section varied from 5.3 per cent gradient upward to 4.8 per cent gradient downward. There are totally 25 sections and the section length is up to 1 km. There is discontinuity of data due to tunnel, hill slope, etc and hence section length was effectively reduced up to 300m in many of the test sections. The gradient was calculated by GPS data.
There is a linear relationship between Road Gradient and fuel consumption on both bituminous and concrete surface type. Speed is a dominant factor for determining fuel consumption. The
Fig. 124 Proposed junction improvement plan for Himalaya Mall junction
Fig. 125 Route map of Mumbai-Pune expressway
Fig. 126 In-vehicle test setup of data acquisition system for vehicles
Annual Report 2011-12
110
Traf c & Transportation
Planning
Transport Planning and Environment
optimum fuel consumption observed in steady speed tests on light vehicles (both petrol and diesel) as well as truck (under different loading conditions) is observed to be between 40 to 50 km/hr. As the road gradient increases the effect of speed in determining fuel consumption decreases Fig.127.
Air Pollution Surveys on Road Network Connecting Darlaghat–Ropar and Darlaghat–Nalagarh
As reported earlier, M/s Ambuja Cements Limited requested CSIR-Central Road Research Institute to carry out air pollution and traffic studies to predict the impact on air quality of the road network in the influence area which are likely to be affected due to the expansion of one of its cement plant at village Rauri, Darlaghat (H.P) (clinker capacity increasing from 1.8 MTPA to 2.6 MTPA) and a new grinding unit at village Panjehra in Nalagarh (H.P) which is situated at a distance of about 20 km from its existing grinding plant at Ropar (Punjab). Air pollution measurement and traffic flow studies were carried out in order to evaluate the influence on
air quality, air dispersion modelling (CALINE 4 model) was attempted to obtain the base line information for the same.
The objectives the study included the measurement of roadside (kerb side) air quality at four selected locations; and finding out relationship between vehicular traffic (emissions) and observed roadside air pollution levels. The study also included prediction of CO concentration (CALINE 4) and estimation of vehicular emission load of CO, HC, NOx and PM at selected locations/sites.
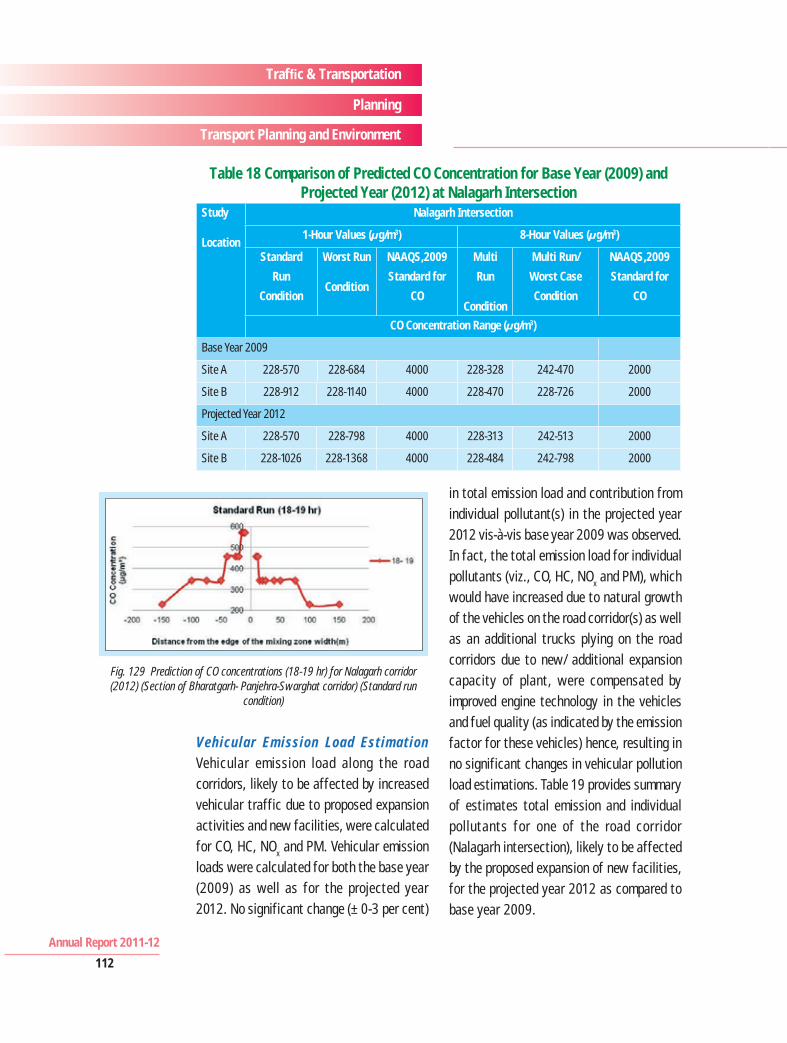
For this purpose, study areas were selected in order to cover the area where the impact was to be evaluated. The four study areas selected/ identified were Darlaghat (HP), Nauni Intersection (HP), Nalagarh Intersection (HP), Kiratpur Intersection (Punjab) (Fig.128).
The comprehensive roadside air pollution measurements with respect to SO2, CO, NOx, HC, O3 and particulate matter (PM10) and classified traffic volume study at these four selected locations were carried out to obtain the baseline information. In addition, micro-meteorological parameters (wind speed, wind direction, temperature and relative humidity) were measured simultaneously.
Continuous measurements were carried out for these air pollutants at each of the selected locations on 24-hr basis by using CRRI’s sophisticated state-of-art mobile air pollution laboratory equipped with pollutant-specific automatic analyzers. The monitored pollutant concentrations were compared with air quality standards (NAAQS, 2009) prescribed by CPCB. Further, to predict the CO concentrations
Fig. 127 Effect of gradient in fuel consumption for Tata Sumo on concrete surface
Traf c & Transportation
Planning
Transport Planning and Environment
CSIR-CRRI, New Delhi
111
along the road corridor(s), vehicular pollution modelling was carried out using CALINE 4 model. In addition, the vehicular emission load (viz. CO, HC, NOx and PM) at selected locations (sites) were estimated taking into consideration the emission and deterioration
factors specified by ARAI (ARAI, 2008) and CPCB (CPCB, 2000) respectively. The modelling and vehicular load estimations were carried out for base year 2009 and projected year 2012 (considering 5 per cent annual growth over 2009 traffic volume).
Fig. 128 Study areas
Conclusions
Air Quality Assessment
The concentrations of most of the air pollutants
at almost all the locations except for CO and
PM at Nalagarh (Panjehra) did not exceed the
ambient air quality standards as specified by
CPCB.
Prediction of CO Concentration using CALINE 4 Model
The CO prediction using CALINE 4 model was carried out for all four pre-identified road corridors. The modelling results indicated that the predicted CO concentrations for the year 2012 were slightly higher as compared to the base year 2009. That was due to natural
growth (@5 per cent per annum) in the traffic volume and additional trucks (approximately 300 trucks per day) that have increased after the capacity expansion of the plant were added for the projected year 2012. CO concentrations predicted at the pre-identified locations were found to be below CO standards stipulated by the National Ambient Air Quality Standards (NAAQS, 2009) for 1-hr (4000 g/m3) and 8 hour (2000 g/m3) (for Industrial, Rural and Other Area) for the base year as well as for projected year. Table 18 shows the predicted CO concentration for base year (2009) and projected year (2012) at Nalagarh intersection. Figure 129 shows the prediction of CO concentrations by the CALINE 4 model (Standard Run Condition) at various receptor locations identified along the road corridor at Nalagarh intersection for the year 2012.
Annual Report 2011-12
112
Traf c & Transportation
Planning
Transport Planning and Environment
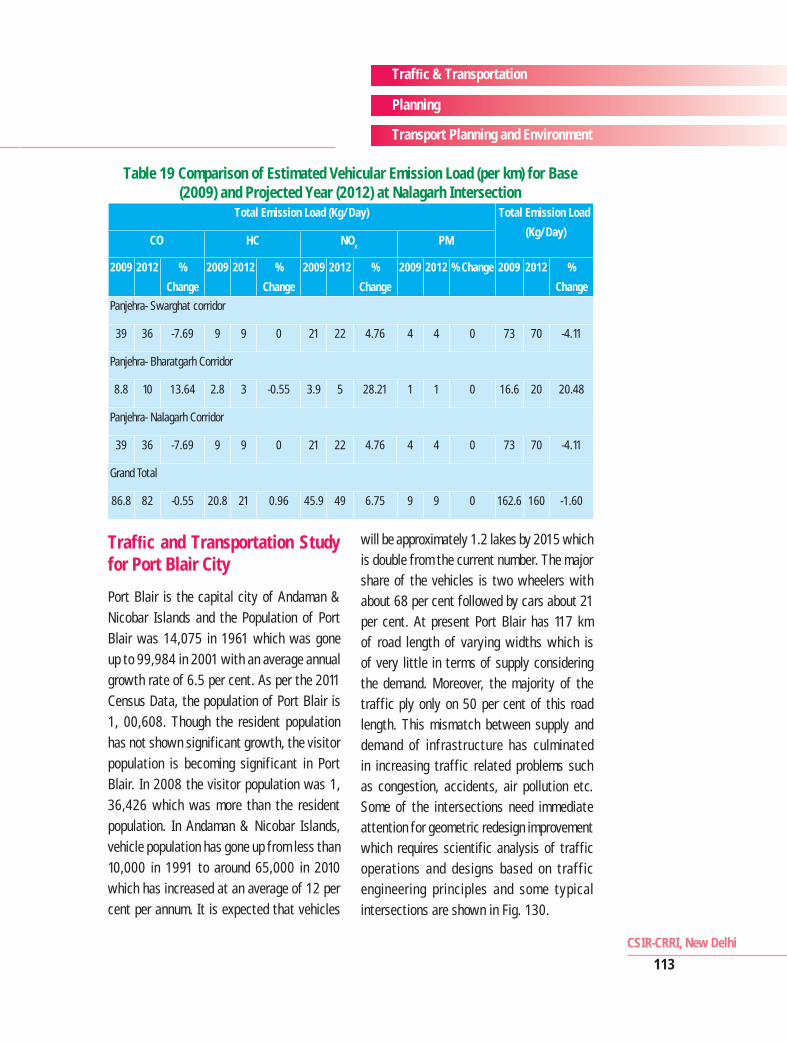
Vehicular Emission Load Estimation Vehicular emission load along the road corridors, likely to be affected by increased vehicular traffic due to proposed expansion activities and new facilities, were calculated for CO, HC, NOx and PM. Vehicular emission loads were calculated for both the base year (2009) as well as for the projected year 2012. No significant change (±0-3 per cent)
in total emission load and contribution from individual pollutant(s) in the projected year 2012 vis-à-vis base year 2009 was observed. In fact, the total emission load for individual pollutants (viz., CO, HC, NOx and PM), which would have increased due to natural growth of the vehicles on the road corridor(s) as well as an additional trucks plying on the road corridors due to new/ additional expansion capacity of plant, were compensated by improved engine technology in the vehicles and fuel quality (as indicated by the emission factor for these vehicles) hence, resulting in no significant changes in vehicular pollution load estimations. Table 19 provides summary of estimates total emission and individual pollutants for one of the road corridor (Nalagarh intersection), likely to be affected by the proposed expansion of new facilities, for the projected year 2012 as compared to base year 2009.
Table 18 Comparison of Predicted CO Concentration for Base Year (2009) and Projected Year (2012) at Nalagarh Intersection
Study
Location
Nalagarh Intersection
1-Hour Values ( g/m3) 8-Hour Values ( g/m3)
Standard
Run
Condition
Worst Run
Condition
NAAQS,2009
Standard for
CO
Multi
Run
Condition
Multi Run/
Worst Case
Condition
NAAQS,2009
Standard for
CO
CO Concentration Range ( g/m3)
Base Year 2009
Site A 228-570 228-684 4000 228-328 242-470 2000
Site B 228-912 228-1140 4000 228-470 228-726 2000
Projected Year 2012
Site A 228-570 228-798 4000 228-313 242-513 2000
Site B 228-1026 228-1368 4000 228-484 242-798 2000
Fig. 129 Prediction of CO concentrations (18-19 hr) for Nalagarh corridor (2012) (Section of Bharatgarh- Panjehra-Swarghat corridor) (Standard run
condition)
Traf c & Transportation
Planning
Transport Planning and Environment
CSIR-CRRI, New Delhi
113
Traf c and Transportation Study for Port Blair City
Port Blair is the capital city of Andaman & Nicobar Islands and the Population of Port Blair was 14,075 in 1961 which was gone up to 99,984 in 2001 with an average annual growth rate of 6.5 per cent. As per the 2011 Census Data, the population of Port Blair is 1, 00,608. Though the resident population has not shown significant growth, the visitor population is becoming significant in Port Blair. In 2008 the visitor population was 1, 36,426 which was more than the resident population. In Andaman & Nicobar Islands, vehicle population has gone up from less than 10,000 in 1991 to around 65,000 in 2010 which has increased at an average of 12 per cent per annum. It is expected that vehicles
will be approximately 1.2 lakes by 2015 which is double from the current number. The major share of the vehicles is two wheelers with about 68 per cent followed by cars about 21 per cent. At present Port Blair has 117 km of road length of varying widths which is of very little in terms of supply considering the demand. Moreover, the majority of the traffic ply only on 50 per cent of this road length. This mismatch between supply and demand of infrastructure has culminated in increasing traffic related problems such as congestion, accidents, air pollution etc. Some of the intersections need immediate attention for geometric redesign improvement which requires scientific analysis of traffic operations and designs based on traffic engineering principles and some typical intersections are shown in Fig. 130.
Table 19 Comparison of Estimated Vehicular Emission Load (per km) for Base (2009) and Projected Year (2012) at Nalagarh Intersection
Total Emission Load (Kg/ Day) Total Emission Load
(Kg/ Day) CO HC NOx PM
2009 2012 %
Change
2009 2012 %
Change
2009 2012 %
Change
2009 2012 % Change 2009 2012 %
Change
Panjehra- Swarghat corridor
39 36 -7.69 9 9 0 21 22 4.76 4 4 0 73 70 -4.11
Panjehra- Bharatgarh Corridor
8.8 10 13.64 2.8 3 -0.55 3.9 5 28.21 1 1 0 16.6 20 20.48
Panjehra- Nalagarh Corridor
39 36 -7.69 9 9 0 21 22 4.76 4 4 0 73 70 -4.11
Grand Total
86.8 82 -0.55 20.8 21 0.96 45.9 49 6.75 9 9 0 162.6 160 -1.60
Annual Report 2011-12
114
Traf c & Transportation
Planning
Transport Planning and Environment
The study has been divided into two phases namely short term (Phase I) and long term (Phase II). The objectives of Phase I include:
• To work out a traffic/ transport system management plan to ease the existing traffic problems in Port Blair and to optimize the use of existing infrastructure focusing on short term remedial measures to improve traffic flow conditions considering junctions improvement, area traffic management schemes, parking plans etc.
In Phase I study, short term solutions shall be recommended for about 25 identified junctions on the basis of a set of traffic surveys. In addition to the above road intersections, the design of traffic circulation plans at five given locations in Port Blair city are considered to be developed for smooth movement of traffic at the city centre and market areas
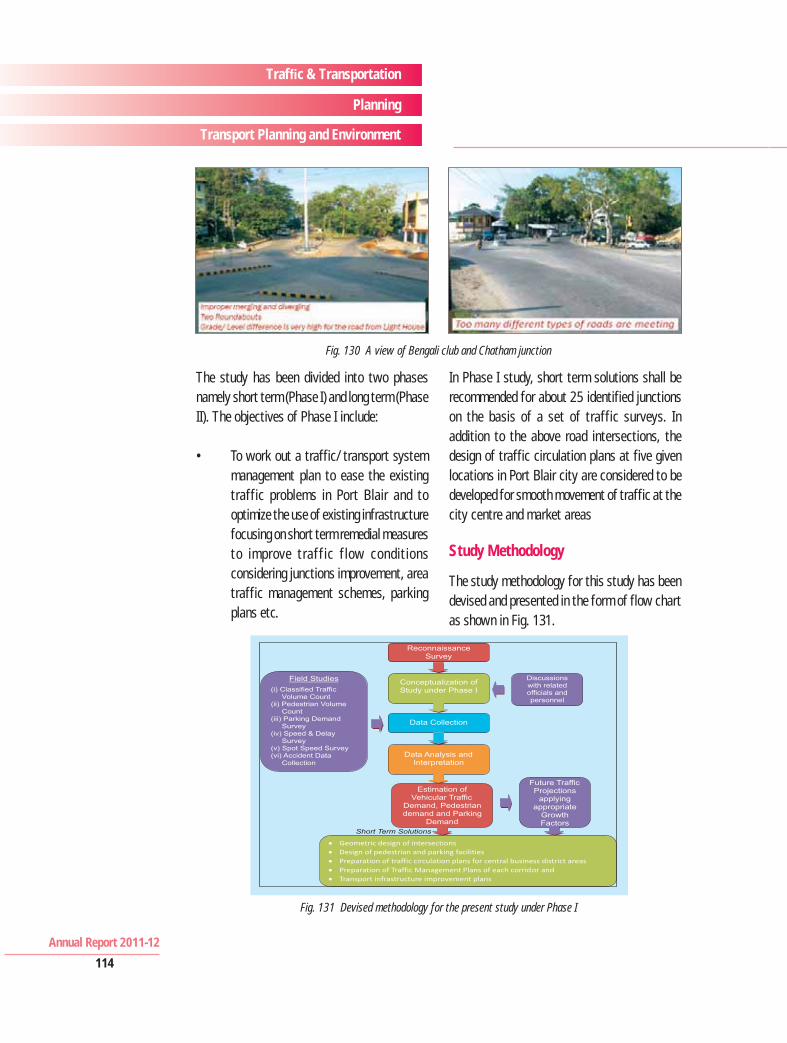
Study Methodology
The study methodology for this study has been devised and presented in the form of flow chart as shown in Fig. 131.
Fig. 130 A view of Bengali club and Chatham junction
Fig. 131 Devised methodology for the present study under Phase I
Traf c & Transportation
Planning
Transport Planning and Environment
CSIR-CRRI, New Delhi
115
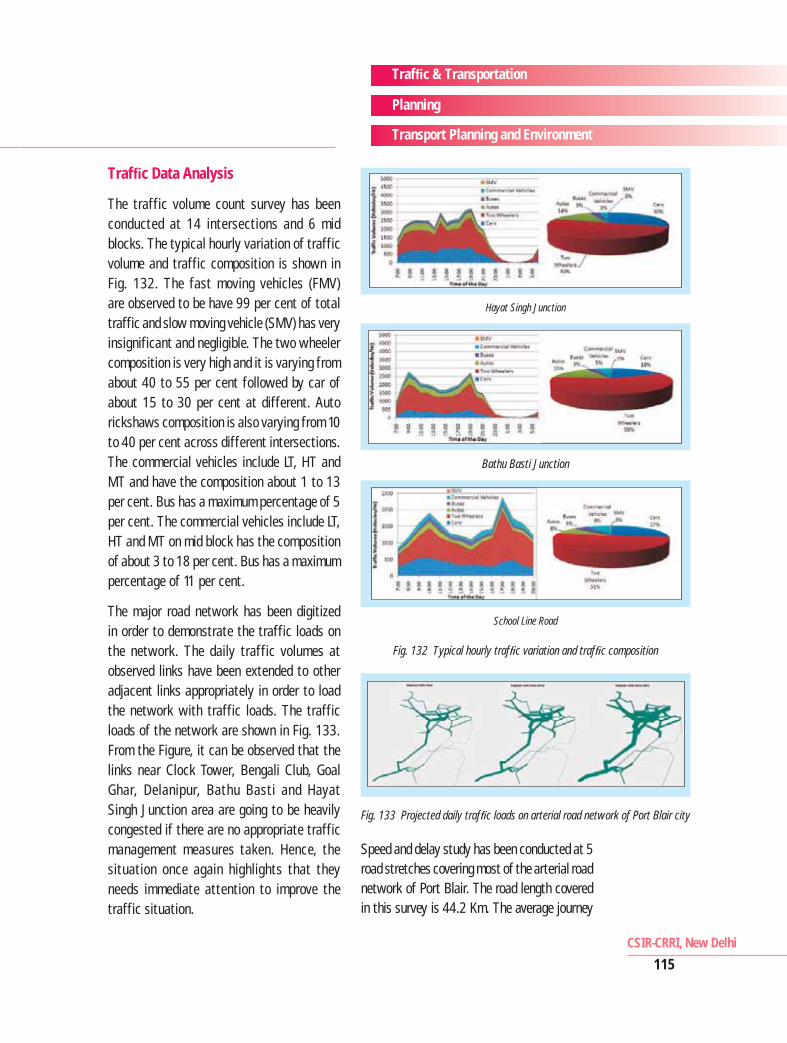
Traf c Data Analysis
The traffic volume count survey has been conducted at 14 intersections and 6 mid blocks. The typical hourly variation of traffic volume and traffic composition is shown in Fig. 132. The fast moving vehicles (FMV) are observed to be have 99 per cent of total traffic and slow moving vehicle (SMV) has very insignificant and negligible. The two wheeler composition is very high and it is varying from about 40 to 55 per cent followed by car of about 15 to 30 per cent at different. Auto rickshaws composition is also varying from 10 to 40 per cent across different intersections. The commercial vehicles include LT, HT and MT and have the composition about 1 to 13 per cent. Bus has a maximum percentage of 5 per cent. The commercial vehicles include LT, HT and MT on mid block has the composition of about 3 to 18 per cent. Bus has a maximum percentage of 11 per cent.
The major road network has been digitized in order to demonstrate the traffic loads on the network. The daily traffic volumes at observed links have been extended to other adjacent links appropriately in order to load the network with traffic loads. The traffic loads of the network are shown in Fig. 133. From the Figure, it can be observed that the links near Clock Tower, Bengali Club, Goal Ghar, Delanipur, Bathu Basti and Hayat Singh Junction area are going to be heavily congested if there are no appropriate traffic management measures taken. Hence, the situation once again highlights that they needs immediate attention to improve the traffic situation.
Hayat Singh Junction
Bathu Basti Junction
School Line Road
Fig. 132 Typical hourly traf c variation and traf c composition
Fig. 133 Projected daily traf c loads on arterial road network of Port Blair city
Speed and delay study has been conducted at 5 road stretches covering most of the arterial road network of Port Blair. The road length covered in this survey is 44.2 Km. The average journey
Annual Report 2011-12
116
Traf c & Transportation
Planning
Transport Planning and Environment
speeds are ranging from 25 to 35 kmph. The delays are about a maximum of 25 per cent of journey time which can be observed at Delanipur and Hayat Singh Jn Stretch.
Short Term Traffic Improvement Measures
From data analysis the following short-term traffic improvement measures are emerged:
a) Geometric Design of Intersections
b) Circulation Plans
• Around Clock Tower Area (include Clock Tower Jn, Light House Jn, Gandhi Statue Jn, Bengali Club Jn, Model School Jn, IP&T Jn)
• Around Dairy Farm Jn and Hayat Singh Jn.
• Around Janglighat Area
c) Widening of Existing Roads and New Links
• Widening of the road from Chatham to Dairy Farm, Chatham to Bengali Club, Marine Gate Jn to Coastal Road Link
• Chatham Saw mill junction corner improvements are needed.
• Coast road all kinks to be removed and widened to divided two lanes
• Cellular jail link connecting to the water sports kink shall be removed to have suf cient turning radius.
• Dairy farm to old CCS road needs to be improved/ widened.
d) Pedestrian Facilities
e) Parking Facilities
f) Traf c Signals
g) Traf c Signages
The study is sponsored by Police Department, Port Blair
Comprehensive Traff ic and Transportation Study of Goa
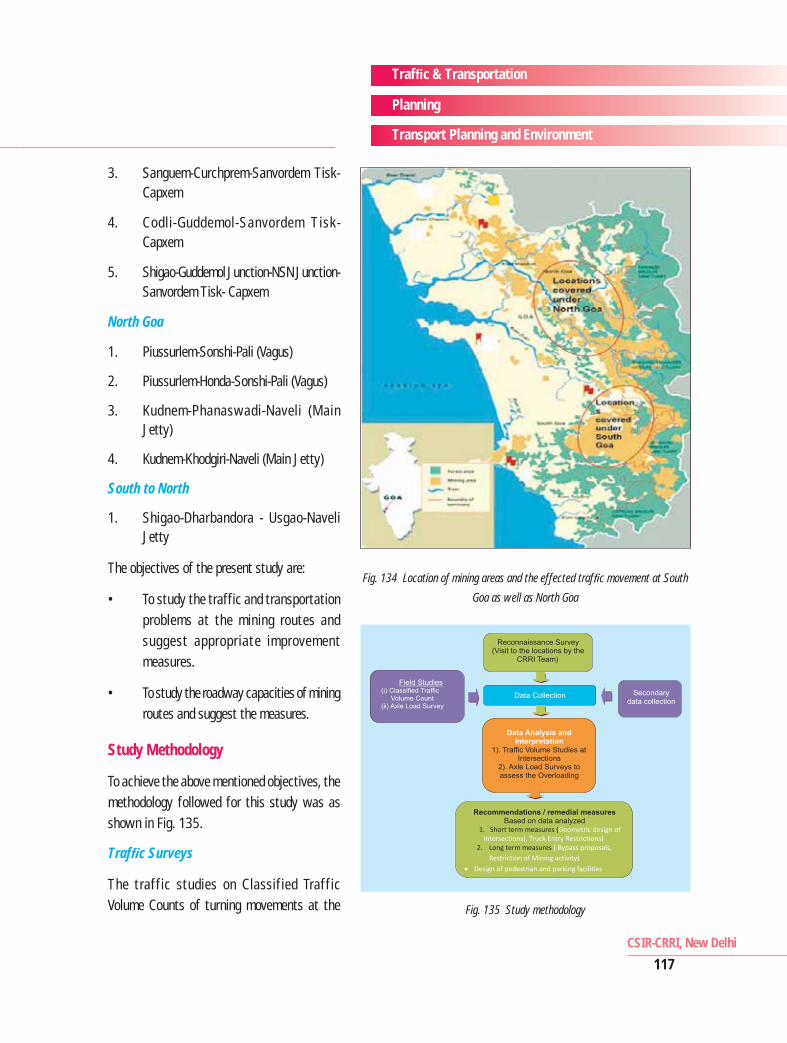
Due to intense mining activity and increase mobility in the recent past at some parts of Goa (especially in North and South Goa) as shown in Fig. 134, the heavy truck traffic movement was increased tremendously. The increase in infrastructure development in terms of improvements in road network and intersections could not cope with the increase in heavy traffic in these regions. As a result of this, mix of fast moving heavy trucks with two wheelers and other NMT (Non Motorized Traffic) can be found which is leading to increase in accidents. The hapazard movement of mining trucks without giving any proper care about the people living in these areas resulted in lot of air pollution, noise pollution and also dust pollution. Considering the above problems, the Transport Department, Goa requested CRRI to study the traffic and transportation problem at following mining areas:
South Goa
1. Collamb-Jambauli-Tilamol-Curchorem-Capxem
2. Caurem-Quepem-Tilamol-Curchorem-Capxem
Traf c & Transportation
Planning
Transport Planning and Environment
CSIR-CRRI, New Delhi
117
3. Sanguem-Curchprem-Sanvordem Tisk- Capxem
4. Codl i -Guddemol-Sanvordem Tisk- Capxem
5. Shigao-Guddemol Junction-NSN Junction- Sanvordem Tisk- Capxem
North Goa
1. Piussurlem-Sonshi-Pali (Vagus)
2. Piussurlem-Honda-Sonshi-Pali (Vagus)
3. Kudnem-Phanaswadi-Naveli (Main Jetty)
4. Kudnem-Khodgiri-Naveli (Main Jetty)
South to North
1. Shigao-Dharbandora - Usgao-Naveli Jetty
The objectives of the present study are:
• To study the traffic and transportation problems at the mining routes and suggest appropriate improvement measures.
• To study the roadway capacities of mining routes and suggest the measures.
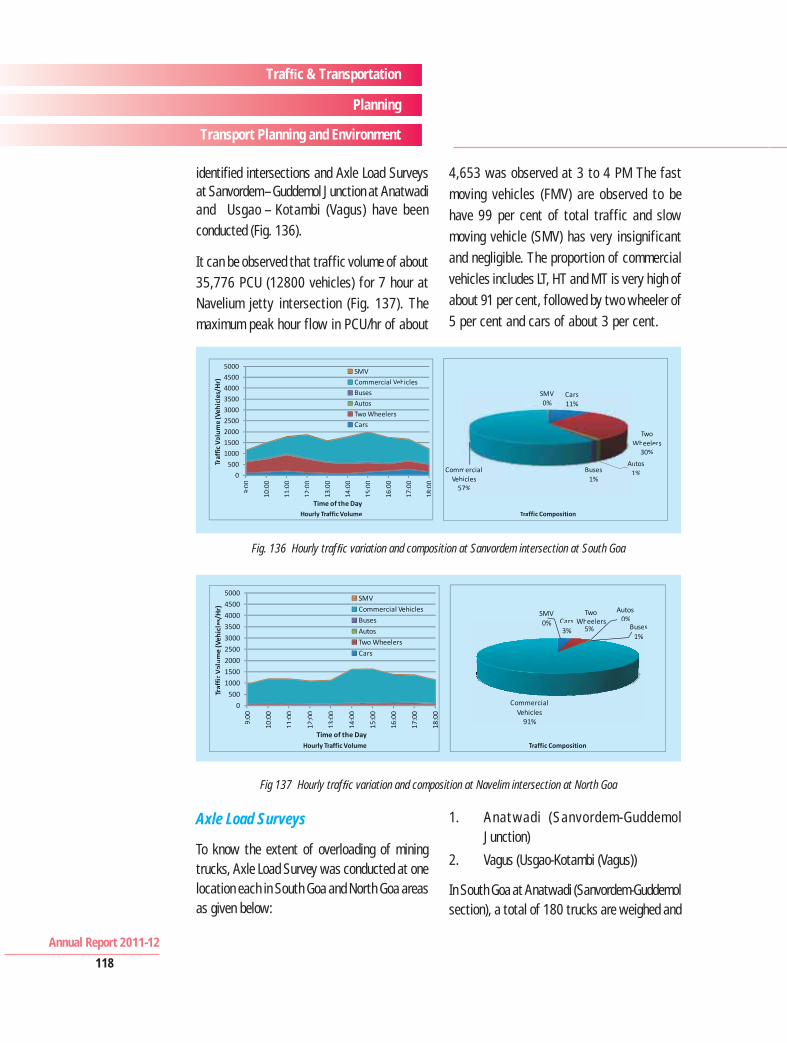
Study Methodology
To achieve the above mentioned objectives, the methodology followed for this study was as shown in Fig. 135.
Traf c Surveys
The traffic studies on Classified Traffic Volume Counts of turning movements at the
Fig. 134 Location of mining areas and the effected traf c movement at South
Goa as well as North Goa
Fig. 135 Study methodology
Annual Report 2011-12
118
Traf c & Transportation
Planning
Transport Planning and Environment
identified intersections and Axle Load Surveys at Sanvordem – Guddemol Junction at Anatwadi and Usgao – Kotambi (Vagus) have been conducted (Fig. 136).
It can be observed that traffic volume of about 35,776 PCU (12800 vehicles) for 7 hour at Navelium jetty intersection (Fig. 137). The maximum peak hour flow in PCU/hr of about
4,653 was observed at 3 to 4 PM The fast moving vehicles (FMV) are observed to be have 99 per cent of total traffic and slow moving vehicle (SMV) has very insignificant and negligible. The proportion of commercial vehicles includes LT, HT and MT is very high of about 91 per cent, followed by two wheeler of 5 per cent and cars of about 3 per cent.
Fig. 136 Hourly traf c variation and composition at Sanvordem intersection at South Goa
Fig 137 Hourly traf c variation and composition at Navelim intersection at North Goa
Axle Load Surveys
To know the extent of overloading of mining trucks, Axle Load Survey was conducted at one location each in South Goa and North Goa areas as given below:
1. Anatwadi (Sanvordem-Guddemol Junction)
2. Vagus (Usgao-Kotambi (Vagus))
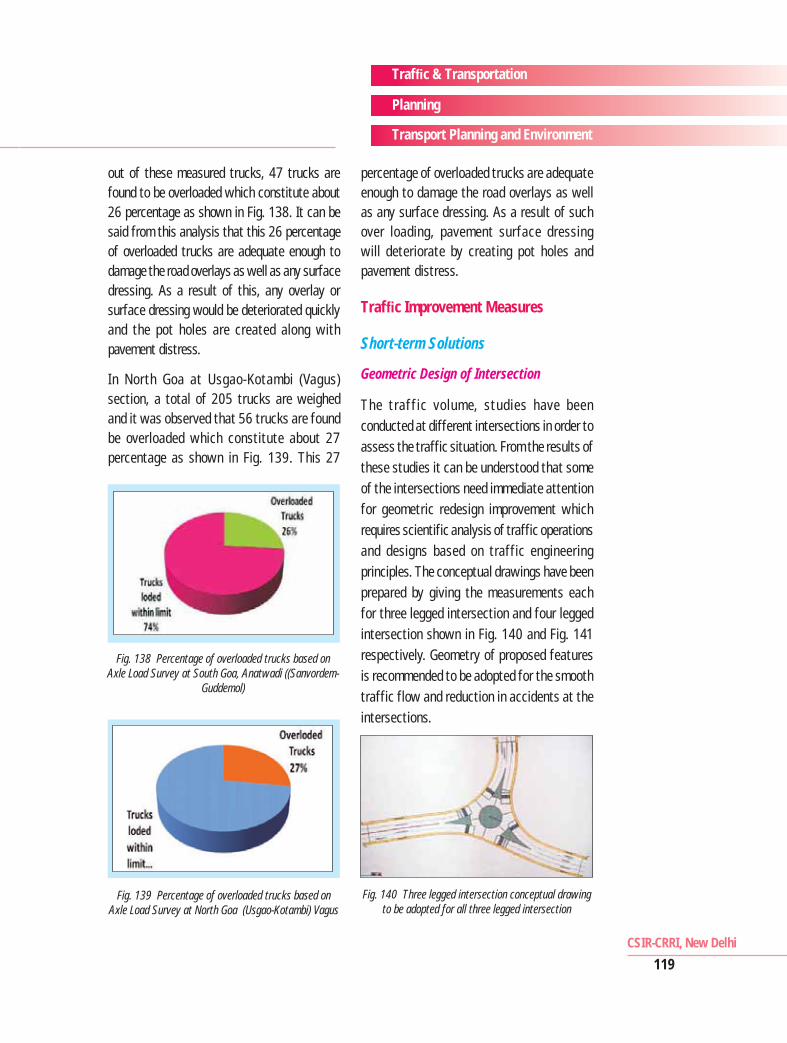
In South Goa at Anatwadi (Sanvordem-Guddemol section), a total of 180 trucks are weighed and
Traf c & Transportation
Planning
Transport Planning and Environment
CSIR-CRRI, New Delhi
119
out of these measured trucks, 47 trucks are found to be overloaded which constitute about 26 percentage as shown in Fig. 138. It can be said from this analysis that this 26 percentage of overloaded trucks are adequate enough to damage the road overlays as well as any surface dressing. As a result of this, any overlay or surface dressing would be deteriorated quickly and the pot holes are created along with pavement distress.
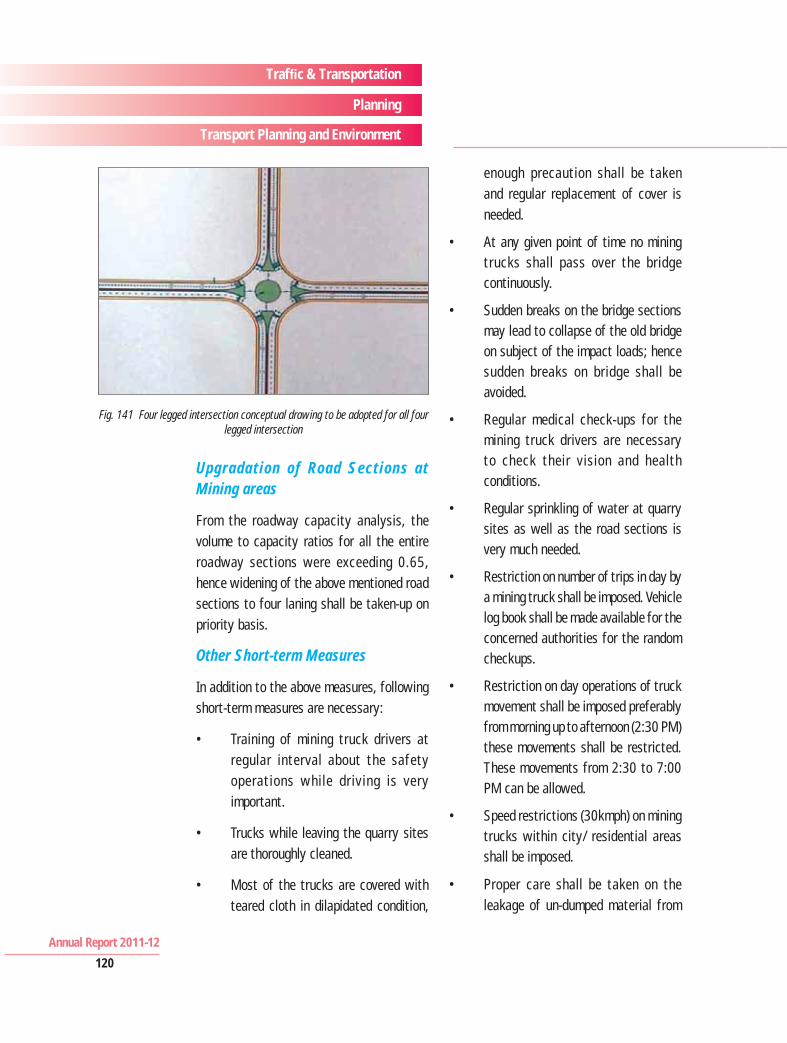
In North Goa at Usgao-Kotambi (Vagus) section, a total of 205 trucks are weighed and it was observed that 56 trucks are found be overloaded which constitute about 27 percentage as shown in Fig. 139. This 27
Fig. 138 Percentage of overloaded trucks based on Axle Load Survey at South Goa, Anatwadi ((Sanvordem-
Guddemol)
Fig. 139 Percentage of overloaded trucks based on Axle Load Survey at North Goa (Usgao-Kotambi) Vagus
percentage of overloaded trucks are adequate enough to damage the road overlays as well as any surface dressing. As a result of such over loading, pavement surface dressing will deteriorate by creating pot holes and pavement distress.
Traf c Improvement Measures
Short-term Solutions
Geometric Design of Intersection
The traffic volume, studies have been conducted at different intersections in order to assess the traffic situation. From the results of these studies it can be understood that some of the intersections need immediate attention for geometric redesign improvement which requires scientific analysis of traffic operations and designs based on traffic engineering principles. The conceptual drawings have been prepared by giving the measurements each for three legged intersection and four legged intersection shown in Fig. 140 and Fig. 141 respectively. Geometry of proposed features is recommended to be adopted for the smooth traffic flow and reduction in accidents at the intersections.
Fig. 140 Three legged intersection conceptual drawing to be adopted for all three legged intersection
Annual Report 2011-12
120
Traf c & Transportation
Planning
Transport Planning and Environment
Upgradation of Road Sections at Mining areas
From the roadway capacity analysis, the volume to capacity ratios for all the entire roadway sections were exceeding 0.65, hence widening of the above mentioned road sections to four laning shall be taken-up on priority basis.
Other Short-term Measures
In addition to the above measures, following short-term measures are necessary:
• Training of mining truck drivers at regular interval about the safety operat ions whi le dr iv ing is very important.
• Trucks while leaving the quarry sites are thoroughly cleaned.
• Most of the trucks are covered with teared cloth in dilapidated condition,
enough precaution shall be taken and regular replacement of cover is needed.
• At any given point of time no mining trucks shall pass over the bridge continuously.
• Sudden breaks on the bridge sections may lead to collapse of the old bridge on subject of the impact loads; hence sudden breaks on bridge shall be avoided.
• Regular medical check-ups for the mining truck drivers are necessary to check their vis ion and health conditions.
• Regular sprinkling of water at quarry sites as well as the road sections is very much needed.
• Restriction on number of trips in day by a mining truck shall be imposed. Vehicle log book shall be made available for the concerned authorities for the random checkups.
• Restriction on day operations of truck movement shall be imposed preferably from morning up to afternoon (2:30 PM) these movements shall be restricted. These movements from 2:30 to 7:00 PM can be allowed.
• Speed restrictions (30kmph) on mining trucks within city/ residential areas shall be imposed.
• Proper care shall be taken on the leakage of un-dumped material from
Fig. 141 Four legged intersection conceptual drawing to be adopted for all four legged intersection
Traf c & Transportation
Planning
Transport Planning and Environment
CSIR-CRRI, New Delhi
121
the empty trucks as well as loaded trucks.
• All the mining trucks shall be pasted
with retro reflective tapes in the front
as well as on the back of trucks, which
will enhance the safety while vehicles
were passing through the dust.
• Transport Department/ Traffic police
shall purchase the portable weighing
machines, which are available in the
market to check the overloading on
these routes at randomly and issue/
withdraw permits if compliance has
not met.
Long-term solutions
Considering the impact of mining trucks in
these areas there is a lot of dust and smoke
coming out of the mining trucks which create
many health hazards to the people residing
nearby. Though the economic development
is taking place, but at the cost of the people
who are residing in these areas. Hence to
avoid these losses, following measures should
be taken :
1. Government shall entrust a study for
the feasibility of bypass routes on
these mining areas.
2. The new l icenses for the mining
quarries shall be avoided.
3. The old licenses for the mining quarries
gradually scarped.
Noida Se Greater Noida Ko Jodne Wale Yamuna Expressway Par Hone Wali Durghatnaye Evam Unme Vriddhi Dar Ke Mukhya Karno Ki Janch Evam Inke Nivaran Ke Suzhav (Study of Accidents on Yamuna Expressway’s section joining Noida and Greater Noida & Suggesting Remedial Measures)
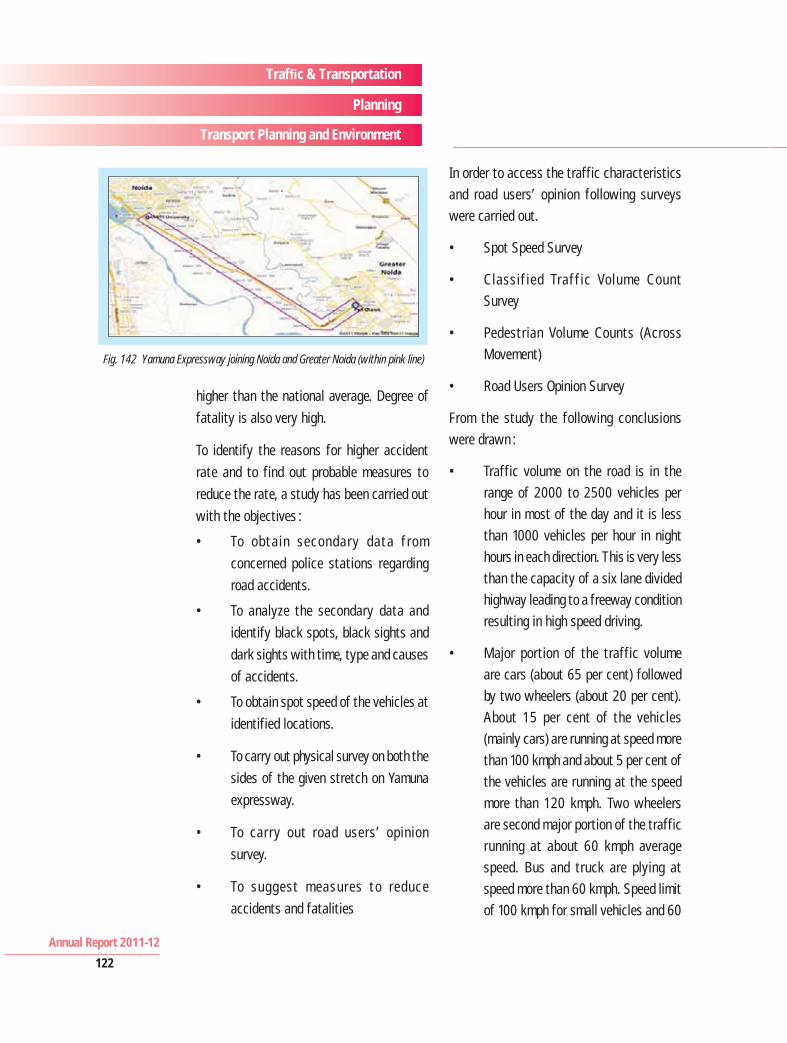
The Yamuna Expressway Project is conceived with the idea to not only reduce the travel time between New Delhi and Agra but also to open up avenue for Industrial and urban development of the region and provide the base for convergence to tourism and other allied industries. The Government of Uttar Pradesh has been working proactively to improve the connectivity of the National Capital Region to improve tourist attraction of Taj Mahal at Agra through the new 6 Lanes (extendable to 8 lanes) Access Controlled Expressway with brand name of Yamuna Expressway. The 23.4 km long section of the Yamuna Expressway joins the Noida and Greater Noida (Fig. 142). The study stretch is 23.4 km long section of Yamuna Expressway which starts from AMITY University at Noida and ends at Pari Chowk in Greater Noida. The road is 6 lanes divided by approximately 3 m wide median and has 1.5 m paved shoulders. Road accidents are one of the most important problems being faced by modern societies. On Yamuna Expressway section joining Noida and Greater Noida, the rate of accidents is much
Annual Report 2011-12
122
Traf c & Transportation
Planning
Transport Planning and Environment
higher than the national average. Degree of
fatality is also very high.
To identify the reasons for higher accident
rate and to find out probable measures to
reduce the rate, a study has been carried out
with the objectives :
• To obta in secondary data f rom
concerned police stations regarding
road accidents.
• To analyze the secondary data and
identify black spots, black sights and
dark sights with time, type and causes
of accidents.
• To obtain spot speed of the vehicles at
identified locations.
• To carry out physical survey on both the
sides of the given stretch on Yamuna
expressway.
• To carry out road users’ opinion
survey.
• To suggest measures to reduce
accidents and fatalities
In order to access the traffic characteristics and road users’ opinion following surveys were carried out.
• Spot Speed Survey
• Class if ied Traff ic Volume Count Survey
• Pedestrian Volume Counts (Across Movement)
• Road Users Opinion Survey
From the study the following conclusions were drawn :
• Traffic volume on the road is in the range of 2000 to 2500 vehicles per hour in most of the day and it is less than 1000 vehicles per hour in night hours in each direction. This is very less than the capacity of a six lane divided highway leading to a freeway condition resulting in high speed driving.
• Major portion of the traffic volume are cars (about 65 per cent) followed by two wheelers (about 20 per cent). About 15 per cent of the vehicles (mainly cars) are running at speed more than 100 kmph and about 5 per cent of the vehicles are running at the speed more than 120 kmph. Two wheelers are second major portion of the traffic running at about 60 kmph average speed. Bus and truck are plying at speed more than 60 kmph. Speed limit of 100 kmph for small vehicles and 60
Fig. 142 Yamuna Expressway joining Noida and Greater Noida (within pink line)
Traf c & Transportation
Planning
Transport Planning and Environment
CSIR-CRRI, New Delhi
123
kmph for big vehicles is not followed at all.
• Road is having developed side lands with residential townships, commercial, educational and industrial complexes. This development is in fast stage and within short time, the road side lands are going to be fully developed which will generate high traffic volume with large amount of cross road movements.
• Due to commercial and educational complexes, cross road movements of pedestrians are very high and Hazard Index near AMITY University and Galgotia University is very high warranting for grade separated road crossing facilities.
• Road is designed as access controlled expressway with concept of road s ide land development which is contradictory. Instead, the road needs to be designed like urban arterial road with sufficient facilities for cross road movements considering local requirements.
• At present, all slow and fast moving vehic les are a l lowed generat ing heterogeneous traffic with different characteristics.
• Passenger vehicles like bus and auto are allowed to ply with local passengers and bus shelters are also provided
with unplanned and unsafe gaps in the median without any warning and informatory sign and symbols.
• Rest lane, emergency parking lane, acceleration/deceleration lane are not provided.
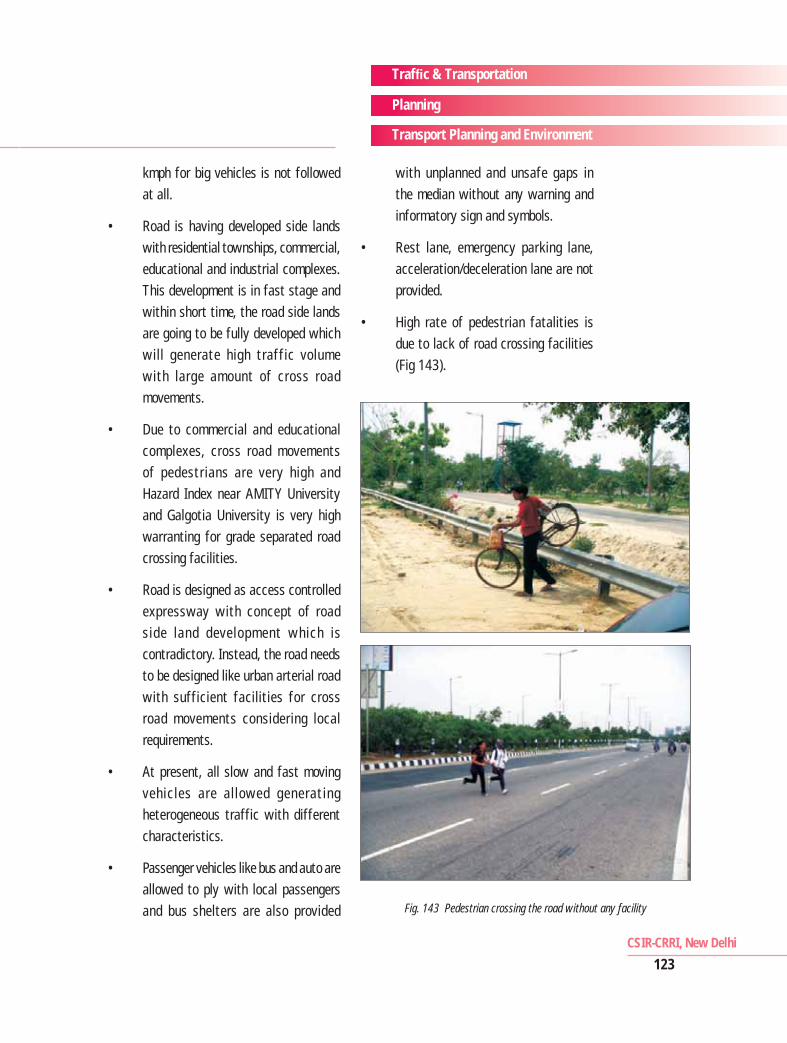
• High rate of pedestrian fatalities is due to lack of road crossing facilities (Fig 143).
Fig. 143 Pedestrian crossing the road without any facility
Annual Report 2011-12
124
Traf c & Transportation
Planning
Transport Planning and Environment
• High rate of rear end collisions and fatalities is due to heterogeneous traffic in freeway with fast and slow moving vehicles plying randomly without specified lanes.
Following recommendations were made :
• Provide FOB near AMITY University.
• Provide FOB at Galgotia University and Pari chowk joined by an elevate walkway along the road with stairs and ramps at convenient distance.
• Carry out detailed study and decide locations for road crossing facilities with local public participation at Badauli and Safipur village.
• Provide pedestrian activated stop
signals with safety measures and
warning signs for road crossing at
every bus shelter.
• Establish dedicated staff for traffic
discipline enforcement.
• Prohibit or provide separate lane for
slow moving vehicles.
• Provide emergency response system for
immediate medical treatments.
• As road is functioning like urban road,
redesign the road as urban arterial road
with lower speed limits.