Embed Size (px)
Citation preview
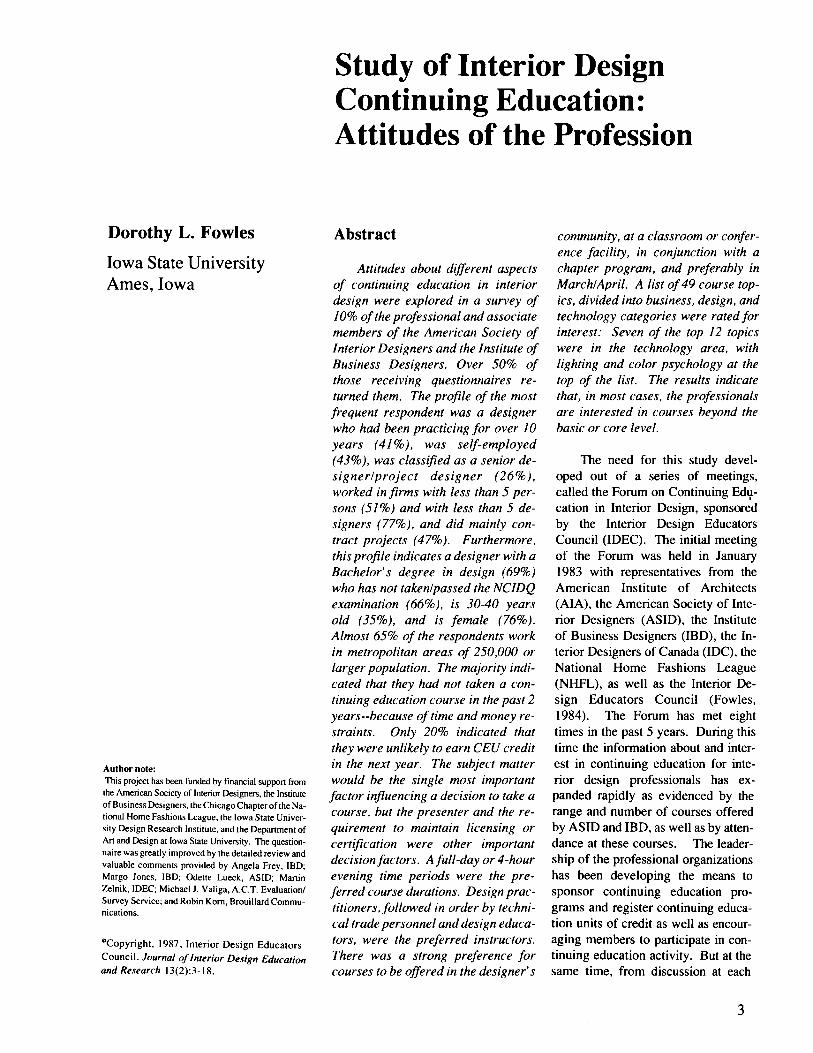
Study of Interior Design Continuing Education: Attitudes of the Profession
Dorothy L. Fowles
Iowa State University Ames, Iowa
Author note: This project has been funded by financial suppon from the American Society of Interior Designers, the lnstirute OfBusinessDesigners, theChicagoChapteroftheNa- tional Home Fashions League, the Iowa State Univer- sity Design Research Institute, and the Department of Art and Design at Iowa State University. The question- naire was greatly improved by the detailed review and valuable comments provided by Angela Frey, IBD; Margo Jones, IBD; Odette Lueck, ASID Manin Zelnik, IDEC; Michael J . Valiga, A.C.T. Evaluation/ Survey Service; and Robin Kom, Brouillard Commu- nications.
'Copyright, 1987, Interior Design Educators Council. Journal of Interior Design Education and Research 13(2):3-18.
Abstract
Attitudes about different aspects of continuing education in interior design were explored in a survey of 10% of the professional and associate members of the American Society of Interior Designers and the Institute of Business Designers. Over 50% of those receiving questionnaires re- turned them. The profile of the most frequent respondent was a designer who had been practicing for over 10 years (41 %). was self-employed (43%), was class$ed as a senior de- signerlproject designer (26%), worked in firms with less than 5 per- sons (51 %) and with less than 5 de- signers (77%), and did mainly con- tract projects (47%). Furthermore, this profile indicates a designer with a Bachelor's degree in design (69%) who has not takenlpassed the NCIDQ examination (66%), is 30-40 years old (35%), and is female (76%). Almost 65% of the respondents work in metropolitan areas of 250,000 or larger population. The majority indi- cated that they had not taken a con- tinuing education course in the past 2 years--because of time and money re- straints. Only 20% indicated that they were unlikely to earn CEU credit in the next year. The subject matter would he the single most important factor influencing a decision to take a course, but the presenter and the re- quirement to maintain licensing or certification were other important decision factors. A full-day or 4-hour evening time periods were the pre- ferred course durations. Design prac- titioners, followed in order by techni- cal trade personnel and design educa- tors, were the preferred instructors. There was a strong preference for courses to be offered in the designer's
community, at a classroom or confer- ence facility, in conjunction with a chapter program, and preferably in MarchlApril. A list of 49 course top- ics, divided into business, design, and technology categories were rated for interest: Seven of the top 12 topics were in the technology area, with lighting and color psychology at the top of the list. The results indicate that, in most cases, the professionals are interested in courses beyond the basic or core level.
The need for this study devel- oped out of a series of meetings, called the Forum on Continuing Edy- cation in Interior Design, sponsored by the Interior Design Educators Council (IDEC). The initial meeting of the Forum was held in January 1983 with representatives from the American Institute of Architects (AIA), the American Society of Inte- rior Designers (ASID), the Institute of Business Designers (IBD), the In- terior Designers of Canada (IDC), the National Home Fashions League (NHFL), as well as the Interior De- sign Educators Council (Fowles, 1984). The Forum has met eight times in the past 5 years. During this time the information about and inter- est in continuing education for inte- rior design professionals has ex- panded rapidly as evidenced by the range and number of courses offered by ASID and IBD, as well as by atten- dance at these courses. The leader- ship of the professional organizations has been developing the means to sponsor continuing education pro- grams and register continuing educa- tion units of credit as well as encour- aging members to participate in con- tinuing education activity. But at the same time, from discussion at each
3

Forum it has not been clear that the directions and assumptions held by the professional organization leaders matched the ideas and needs of the members. Thus, this study was devel- oped to more adequately identify the attitudes of professional interior de- signers toward continuing education. Questions that the survey hoped to answer included:
* What is the designer’s cur- rent interest in and aware- ness of continuing educa- tion in interior design?
* What would encourage or discourage a designer from participating in an interior design continuing educa- tion course?
* Where, when, and how long should continuing educa- tion courses be delivered?
* What topics and what level of instruction for these top- ics would fit the needs of practicing professional interior designers?
Study Procedure
Eighteen hundred professional interior designers randomly selected from the “professional” and “associ- ate” categories of the membership lists of ASID and IBD were mailed a 4-page (8 112” X 15” format) ques- tionnaire, cover letter and postage- paid return envelope in January 1985. This group represented a 10 percent sample of the membership of each organization and included members in the United States, Mexico, Canada, and Puerto Rico. Names were checked to avoid duplication between the two lists. A similar follow-up mailing was sent to 1200 non-re- sponders in mid-February.
A total of 910 designers returned questionnaires. Seventeen were eliminated from analysis because the respondents were retired, ill, or not active in interior design at the time. Four additional questionnaires were eliminated because less that 20% of the questions had been completed. Another 11 were returned after the data analysis had been completed and therefore not included in the analysis.
Final data analysis was run on 878 completed questionnaires. The data was analyzed on an NAS AS16 computer using WYLBUR, a text- editing program, and SAS, a data analysis program. A one-way fre- quency table was produced for each question. Additional two-way fre- quency or cross-tabulation tables were produced for elected questions. Unless otherwise noted, missing data was not included in the calculation of percentages. In other words, the per- centages are based on the number of responses to each individual question. (A sample of the questionnaire with a detailed summary of the data is pre- sented in Figure 1.)
Results
Background Information on Re- spondents
Years as a practicing designer. Almost 4 1 % of the respondents have been in practice over 10 years, while 2 1 % indicated 6- 10 years of practice, and 20% indicated 3-5 years of prac- tice. Only 18% indicated 2 years or less of practice. (Question 1, Figure 1)
Employment classification. Almost half of the respondents (43%) are self-employed, while 18% are employed by an interior design firm, and 17% are employed by a retail firm or dealership. The three remain- ing categories had less than 10% in each: employed by an architectural fm, employed by a corporation and other employment that included gov- ernment, university, teaching, con- tractor, manufacturer/wholesaler, art gallery, or a combination of catego- ries. (Question 2, Figure 1)
Job titles of respondents. Twenty-six percent of the respon- dents identified their job title as sen- ior designer/project designer, while 21 % indicated their job title as sales- person and designer. Principal/owner or non-design manager represented the job title for about 10% of the respondents; an additional 16% checked the “other” category and in- dicated that they have a dual job title of principal/owner as well as designer
4

and/or project manager. While 5% indicated their job title as project manager, an additional 2% checked “other” and indicated that their job title was design director or manager. Ten percent described their job title as junior designer/assistant designer, and 2% indicated their job title as facility planner/facility manager. The re- maining 9% checked “other” and listed 29 different job titles. (Ques- tion 3, Figure 1)
Type of design work handled by respondent’s firm. Thirty nine percent indicated that they do mainly residential projects (32% indicated at least 75% residential and 7% noted their work as 100% residential), while 47% indicated that they do mainly contract projects (30% noted their work as 100% contract and 17% indicated at least 75% contract). The final 14% identified their work as split with 50% being residential and 50% contract. (Question 4, Figure 1)
Educational background in de- sign. Sixty-nine percent indicated that they hold a 4- or 5-year Bachelor’s degree in design, but only 0.5% checked having an MA, MFA, or PhD. Eleven percent have a col- lege degree but not in design, 10% have a 2-year diploma or degree in design and 8% have a 3-year diploma or degree in design. Only 8% indi- cated that they have no degree in de- sign, while 7% checked “other” and indicated a wide range of education. Respondents were to check “all the degrees” held in design; thus, due to multiple responses percentages total more than 100%. (Question 5, Figure 1)
In comparing this educational background with the type of work handled by the respondent’s firm (Question 4), over two-thirds of the professionals with 4 or more years of design education are employed by firms that do 50% or more contract projects. In contrast, almost 55% of those respondents that indicated no design degree are employed by firms handling 75% or more residential projects. (Table 1)
Age and sex of respondents. Thirty-five percent are in the 30-40 age category, 30% are “under 30’, 18% are 4 1-50, and 16% are over 50 years old. Seventy-six percent of the respondents are female and 24% are male. (Question 6, Figure 1)
Membership in professional design organizations. Eighty-nine percent of the respondents are mem- bers of ASID, and 22% belong to IBD. A small percentage listed AIA- Interiors Committee, NHFL, IDC, and IDEC. (Question 7, Figure I )
Qualification examination his- tory. Almost 66% of the respondents have not taken and passed both sec- tions (written and design) of the Na- tional Council for Interior Design Qualification (NCIDQ) examination. (Question 8, Figure 1)
Number of employees in firm. Almost 30% of the respondents work in a firm that employs 2-5 persons, while almost 24% work in 6-25 per- son firms. Almost 22% work by themselves with no other employees. In contrast, 18% work in firms that employ over 50 persons, and another 8% are in 26-50 person firms. (Ques- tion 2 1, Figure 1)
Table 1 Educational Background of Designers Compared with Type of Design Work Handled by Design Firm
Educational Background No design degree 2 year design degree 3 year design degree 4 or 5 year Bachelor degree MA, MFA, or PhD College degree, not design Other
Type of Design Work Total 75% or More 50% Residential 75% or More
N Residential & 50% Contract Contract 77 9 1 7 4
608 48
102 6 1
54.5% 41.3 47.3 33.6 35.4 41.1 45.9
16.8% 17.6 16.2 13.1 12.5 16.7 13.1
28.5% 35.2 36.5 53.3 52. I 36.3 40.9
5

Number of designers in firm. Over 42% of the respondents indi- cated that their firm employs 2-5 de- signers, while over 35% employ only 1 designer. Eleven percent of the firms had 6-10 designers, another 4% had 11-15 designers, and 7% had more than 15 designers on their staff. (Question 22, Figure 1)
Population of location of designer’s firm. Thirty-nine percent of the designers work in a cityltownl metropolitan area with a population of over 1,000,OOO, while 25% work in an area with a 250,000 - 999,999 population. Twenty-three percent work in an area with a 50,000 - 249,999 population, and 12% work in areas with less than 50,000 people. (Question 23, Figure 1)
Past Continuing Education History
Recent job-related continuing education courses. Over 4 1 % indi- cated that they have taken a job-re- lated continuing education course in the past 2 years; conversely, 59% in- dicated no participation in continuing education in this time period. From occasional comments on the question- naires, it appears that some respon- dents included formal academic course work and other professional improvement activity in their positive response to these continuing educa- tion course questions. (Question 9, Figure 1)
When this participation in job- related courses is compared with the educational background of the re- spondents, it appears that individuals with a Bachelor’s or Master’s degree
in design are less likely to have taken a continuing education course (61% and 60% respectively). In contrast, the greatest percentage of participa- tion has been by professionals with no degree in design: “no degree,” 59%; “degree but not in design,” 57%. (Table 2)
Of those who noted that they had participated in continuing education within the past 2 years (41% of the respondents), 41% indicated that they have taken one course, while another 24% have taken two courses and 12% have taken three courses. Seven per- cent have taken more than three courses in the past 2 years. (15% did not answer this question.) Forty per- cent indicated that they earned no CEU credit for their participation, and 12% earned less than one CEU in the past two years. Another 19% in- dicated they earned 1 .O- 1.9 CEU dur- ing this time frame, 10% earned 2.0- 2.9 CEU, and 11% earned 3.0 or more CEUs. (6% did not indicate the CEUs earned.) Of the continuing education participants, 47% took a course offered by a university or col- lege, while a professional design or- ganization was the sponsor of courses attended by 44% of the participants. Thirteen percent attended courses of- fered by professional for-profit semi- nar groups and 12% attended courses offered by a private corporate spon- sor. Only 4% attended courses of- fered by non-design groups and an- other 3% attended courses offered by a range of sponsors. (Multiple re- sponses were possible for this ques- tion.) (Question 9 YES, Figure 1)
Of those who noted that they had not taken any job-related continuing education courses in the past 2 years, only 5% indicated that it was due to no interest in CEU. In contrast, the major reasons for not taking courses were time and money: 45% indicated that they had been too busy, 21% in- dicated that too much travel was re- quired to reach the location offering the course, 20% noted that courses were offered at the wrong time, and 17% indicated that the available courses were too expensive. Another reason for not taking courses was the topics that were offered: 17% found no design-related courses and 10% found no courses of personal interest. Of the 14% who checked “other”, the most frequent responses included: just graduated and needed time off, about to retire, and unaware of CEU andlor courses being offered. (Multiple re- sponses were possible for this last question.) (Question 9 NO, Figure 1)
Recent educational activity. Almost 32% of all respondents indi- cated that they had attended a seminar or workshop at a professioqal organization’s conference in the gast 2 years. A seminar or workshop sponsored by a university or college was attended by almost 21% of the respondents and 18% attended a semi- nar at NEOCON. Concerning CEU courses, 13% indicated they had at- tended a course offered by the local chapter of a professional organization and almost 6% attended a course of- fered at a national conference. (Mul- tiple responses were possible for this question.) (Question 10, Figure 1)
Table 2 Comparison of Educational Background with Participation in Continuing Education Courses in Past 2 Years
Educational Background
Participation in Continuing Education Total
N Yes No No design degree 2 year design degree 3 year design degree 4 or 5 year Bachelor degree MA, MFA, or PhD College degree, not design Other
78 9 3 73
610 48
102 62
59.0% 48.4 48.0 38.7 39.6 56.9 50.0
41.0% 51.6 52.0 61.3 60.4 43.1 50.0
6

Future Continuing Education Preferences
CEU credits anticipated. Re- spondents were relatively evenly split on how many CEU credits they are likely to earn in the next year (assum- ing courses were readily available at a reasonable cost): 20% indicated they are unlikely to earn any CEU, 25% anticipated one CEU, 29% antici- pated two CEUs, and another 25% anticipated earning three or more CEUs in the next year. (Question 11, Figure 1)
Factors influencing future course decisions. The single most important factor influencing a deci- sion to take a course would be the subject matter: 96% indicated that this was “very important” or “impor- tant”. The speaker or presenter of the course would be an important factor for 74% of those who responded to this question. Almost 84% felt a re- quirement to maintain state licensing would be an important decision fac- tor: A somewhat surprising percent- age considering the small number of states that currently license interior designers. Similarly, 75% felt a cer- tification requirement by a profes- sional organization would be an im- portant decision factor. Other rela- tively important factors include: proximity to the office (66%), cost (67%), and requirement by employer (58%).
An honors award program spon- sored by a professional organization would be either only “somewhat im- portant” or “not important at all” to almost 75% of the respondents. Over half of the respondents (55%) simi- larly discount the availability of CEU credit for the course in their decision process. Opinions were quite evenly split concerning the importance of the organization sponsoring the course: 35% indicated that it is an “impor- tant” decision factor, but 34% indi- cated that it is only “somewhat impor- tant”. Three of the lower rated fac- tors were left blank by more than 15% of the 878 questionnaire respon- dents: required by employer, organi- zation sponsoring course, and CEU credit. (Question 12, Figure 1)
When years of design experience are compared with factors influencing future course decisions there is one clear pattern: Cost is the most impor- tant to designers that have the least amount of professional experience. As the number of years of experience increases, cost becomes less important to respondents in their decision proc- ess. In addition, honors award pro- gram, certification, CEU credit, em- ployer requirement and speaker are all less important for designers with more than 10 years experience than these same factors are for the other re- spondents.
When employment classijkations are compared with factors influencing future course decisions, not surpris- ingly, “required by employer” is not important for almost two-thirds of the self-employed. Two factors, subject matter and cost, are more important to respondents employed in an inte- rior design firm than for other re- spondents.
When job titles of respondents are compared with factors influencing future course decisions, several dif- ferences are noted. PrincipaVowaer, non-design manager respondents in- dicated that an honors awards pro- gram is less important than it is for the other respondents. But proximity to the office is a little more important for this group, as well as for the facil- ity plannedmanager group, than for the other respondents. Employment requirement is a more important fac- tor for the facility plannedmanager respondents than for others. Cost is a more important factor for junior de- signers than for the other respondent groups.
When type of design work groups are compared with factors influencing future course decisions, some differ- ences are also noted. For respondents whose firms handle 50% or more contract projects, the speaker is con- siderably more important than for the other two groups of respondents. Employer requirement is more im- portant for the respondents whose firms handle 75% and 100% contract projects than for other respondents, but the sponsoring organization is less important for these two groups than
7

for the other groups. For respondents whose firms handle 50% residential and 50% contract projects, the availa- bility of an honors award program is slightly less important than it is for the other groups.
When age of respondent is com- pared with factors influencing future course decisions, cost is more impor- tant for respondents under 30 and less important for respondents over 50 than for the average of all respon- dents. As age increases several fac- tors become less important (or con- versely as age decreases, these factors increase in importance) in influencing future course decisions: honors award program, requirement to main- tain licensing, speaker, and required by employer. This latter factor showed considerable diversity of opinion (e.g., rated important to 68% of under 30 age group and only 40% of over 50 age group). CEU credit is most important to the 41-50 age group, but definitely not important to the “over 50” age group.
Learning situation (duration and media) preferences. Two learn- ing situations are clearly preferred for a course h the next year: (1) A full- day seminar with an expert instructor (80% combined “definitely prefer” and “probably prefer” ratings) and (2) a 4-hour evening seminar with an expert instructor (78% “definitely prefer” and “probably prefer”).
Almost 80% of the respondents probably or definitely do not prefer a 3 to 5 day seminar with an expert in- structor. Other learning situations that are not preferred by well over 50% of the respondents included: pre-packaged audio visual seminar with a trained local leader (75%), correspondence course (77%), com- puter generated course (69%), audio cassette with workbook (68%), and video cassette course with workbook (64%). Many of these last learning situations would not be eligible for CEU credit, based on current guide- lines of the Council on the Continuing Education Unit. (It should be noted that as the percentages of the negative preferences increased, so did the number of non-responders. These non-responses are not reflected in the percentages given above.)
While independent learning situ- ations are generally not preferred by most respondents, 27% of the total re- sponse pool would prefer a computer generated course. This is significant since only 34% of the respondents in- dicated that they own or have access to a personal computer. Similarly, 31% would prefer a video cassette with workbook, while 58% own or have ready access to a video cassette player. (Question 13, Figure 1)
Course instructor preference. Design practitioners, making presen- tations in their areas of expertise, would be the preferred instructors for 93% of the respondents, while 86% “definitely” or “probably” would pre- fer technical personnel from the trades as instructors. Design educa- tors, making presentations in their areas of expertise, would be the pre- ferred instructors for 78% of the re- spondents. (All three of these catego- ries had a less than 15% non-response rate.) (Question 16, Figure 1)
Respondents indicated a moder- ate preference for taking a course from a researcher (74%), an author (70%), and a non-design educator (57%). These three categories re- ceived only 31%, 21%, and 14% “definitely prefer” ratings, respec- tively.
Locatiodevent preference. Three locations or events are clear preferences for taking a CEU course: in their local town or city (90%), a conference center or classroom of a college campus (82%), and in con- junction with a chapter program (81%). (Question 15, Figure 1)
Respondents were quite evenly divided in their preference both for a location within a 100 mile radius (52% prefer; 48% not prefer) and for taking a course in conjunction with a regional conference (54% prefer; 46% not prefer). Locations “in a 100-300 mile radius” and “in another section of the country” would clearly not be preferred for attending a course (84% and 86% “not pre- ferred‘’, respectively).
Only 43% would prefer to take a course in conjunction with a national conference, while 57% would prefer not to do this. The functional signifi- cance of these figures is not clear
8

since the survey can not identify how many of either group actually would attend a national conference.
Calendar scheduling prefer- ence. The most preferred months for attending a CEU course are March/ April, having been selected by 70% as their first or second choice. Novem- berDecember are indicated by 58% as months when they would not attend a CEU course, followed by July/Au- gust (35%) and Januarypebruary (28%). September/October and May/ June were selected by 57% and -55% respectively as months “most pre- ferred” and “next most preferred” for a course to be offered. Januarypeb- ruary received the second highest per- centage of “most preferred ratings (36%) and was selected by 51% as their first or second time choice. (The number of “most preferred” votes adds up to more than 100% since numerous respondents selected more than one set of months as “most pre- ferred” rather than rank ordering the acceptable month pairs.) (Question 17, Figure 1)
Electronic equipment availa- bility. More than half of the respon- dents (58%) have ready access to a video cassette player. Over one-third of the respondents (35%) have ready access to a personal computer. Of those who indicate the type of com- puter that they have, well over half (52-55% or more, depending on one’s definition of “compatible”) have IBM or IBM compatible com- puters and 42% actually have access to an IBM computer. Another 27% have access to some version of an Apple computer. Over 30 different computer models were identified. (Questions 18 & 19, Figure 1)
Continuing Education Course Topic Preferences
Clear preferences for both course topics and course levels (but to a somewhat lesser extent) were indi- cated by the respondents. (Question 14, Figure 1)
Course topic preferences. The 49 course topics were divided into three categories on the questionnaire: business, design, and technology.
Sixty percent of those responding indicated that they would be “inter- ested” or “very interested” in 12 top- ics. These topics of highest interest across categories (in descending or- der) are:
Lighting techniques New developments in lighting Color psychology New design trends Interior finish materials Professional fees and compensa-
Computer applications in design
Presentation techniques Custom millwork design and de-
Acoustics and sound control Building construction Computer-aided design and
tion
practice
tailing
drafting
This list shows a substantial in- terest in technical information that impacts on the design solution. What is noticeably missing from the list are those topics that closely represent the humanistic orientation of interior de- sign and topics dealing with verbal communication skills. In fact, courses on such topics are generally rated to be of limited or no interest to the respondents.
The list in Table 3 presents the topics within each of the three catego- ries in order of interest as indicated by the respondents, using only the “inter- ested” and “very interested” ratings. It is assumed that a person selecting a “somewhat interested” rating would not be sufficiently interested in a topic to be a serious potential course participant. The percentages for course topics presented represent the percentage of all responses, including the blank or missing responses. Since approximately 10% of the respon- dents only indicated those topics for which they were “interested” or “very interested”, it is assumed that in most cases their non-response represented a lack of interest in the topic in ques- tion.
Course level preferences. The responses showed considerable dis- crimination in identifying the level of instruction preferred for the courses of interest. Three levels were pre-
9

sented without any definition or de- scription: Basic or Core, Intermedi- ate, and Advanced. Percentages as shown below are for those courses with interest expressed by 40% or more of the respondents and at least 33% of these responses indicated a preference for the designated level of course instruction. This minimum cut-off point represents a preference for a specific course at a specified level by only 13% of the respondents (40% x 33%) to the questionnaire.
The percentages for course levels presented in Table 4 are based on the number of actual responses (i.e. miss- ing responses are excluded in the re- sponse count) by those respondents who had indicated that they are “in- terested” or “very interested” in that topic. (Numerous respondents who checked “somewhat interested” or “not interested at all” in a topic subse- quently indicated a course level pref- erence. But since this data was quite incomplete and does not represent a preference by a potential participant, these responses are excluded from this part of the data analysis.) Thus, the number of responses represented by the percentage figure presented below varies from topic to topic (e.g., 670 respondents for “lighting techniques” and 312 respondents for “design for the elderly”).
Clearly, in most cases, interior design professionals interested in con- tinuing education are interested in courses beyond the basic or core level. In the technology area there is substantial interest in advanced courses for 11 topics. In developing courses these preferences need to be addressed.
Course level interest compared with background information cate- gories. Comparisons between course level interest and years as a practicing designer, employment classification, job titles of respondents, and type of design work handled by respondent’s firm produced almost 200 tables of frequencies and percentages but lim- ited useful information. In general, as years of experience increased, there is a greater preference for more ad- vanced courses on many topics with
one notable exception being both computer topics. In reviewing em- ployment classifications, respondents employed by a retail firm/dealership and by a corporation tend to have greater than average interest in many of the design topics. On the other hand, those employed in interior de- sign firms and by a retail finddealer- ship tend to have greater than average interest in the business topics. Of par- ticularly strong interest for the retail/ dealership group is a basic course in professional liability and legal issues, while the self-employed respondents show strong interest in an intermedi- ate level course in accounting for a small firm. The interest in most of the technology topics is proportion- ately distributed across employment classifications.
In reviewing the comparison be- tween type of design work handled by the respondent’s firm (5 categories) and interest/course level preferences, most course level preferences were proportionately distributed between the 5 categories. But when compar- ing the percentage of “very interested/ interested” preferences for each of the same 5 categories, numerous topics were selected by more respondents in contract related design work catego- ries than expected. Table 5 indicates topics that have a greater than ex- pected percentage of interest by each design work category.
Only seven topics were selected by more respondents whose firms handle 50% or more residential proj- ects than expected. All three residen- tial categories have a strong interest in kitchen planning and design as well as accounting for a small firm. Those respondents whose firms handle at least 75% residential work have a very strong interest in window cover- ing. This same group has a stronger than average interest in historic pres- ervation, personal creativity, new de- sign trends, and an intermediate level course in furniture design. The 50% residential/50% contract group has a slightly stronger than average interest in the public relations and promo- tional activities topic.
10

Table 3 Course Topics in Order of Interest within Each of Three Categories
Topic % Very Interested
or Interested Business Professional fees and compensation Marketing strategies Design practice management Professional liability and legal issues Project management Financial management and planning Cost estimating Creative communications with clients Working with special design or technical consultants Time management Public relations and promotional activities Working with construction contractors Building construction supervision Office practice handbook Accounting for a small firm Design of promotional brochure Business writing
Design New design trends Computer applications in design practice Presentation techniques Computer-aided design and drafting Photographic techniques Personal creativity Design-related research techniques Specification writing Pre-design programming Post-occupancy evaluation Video presentation techniques
Technology Lighting techniques New developments in lighting Color psychology Interior finish materials Custom millwork design and detailing Acoustics and sound control Building construction Window covering Historic preservation Furniture design Construction detailing
65 58 58 58 5 7 52 54 54 50 50 49 49 45 40 39 36 29
69 63 63 60 56 47 44 42 39 35 33
88 79
72/69* 68 62 61 60 58 57 56 55
Conclusions
The results of this survey indicate that interest in continuing education for interior design professionals is considerable. Nevertheless, con- scious efforts must be made to pack- age courses in a manner that will at- tract an even larger audience of de- signers, since almost half of the re- spondents indicated they are likely to earn one or less CEU in the next year. Clearly the topic is a critical factor in a decision to attend a course. But the instructor, proximity, registration/ certification requirements, and cost are all important factors as well.
Technology related topics are rated as having more interest than business related topics, but interest in these topics is at the intermediate or advanced level. Continuing educa- tion is seen as just that--education above the basic or core level that is covered in the formal undergraduate curriculum. There are some excep- tions, notably in newer areas of devel- opment or concern, such as computer topics, where all groups want basic or core instruction. Furthermore, there are some courses where a respondent's design experience ap- pears to make no difference in the level of instruction preferred (e.g.,

Design New design trends Computer applications in design practice Presentation techniques Computer-aided design and drafting Photographic techniques Personal creativity Design-related research techniques Specification writing
Technology Lighting techniques New developments in lighting Color psychology Interior finish materials Custom millwork design and detailing Acoustics and sound control Building construction Window covering Historic preservation Furniture design Construction detailing Energy conscious design Rehabilitation and adaptive reuse Kitchen planning and design Fire safe design Barrier-free designg Ergonomics/human factors Specialized focus on a setting type Design for the elderly Furniture design Construction detailing Energy conscious design Rehabilitation and adaptive reuse Kitchen planning and design Fire safe design Barrier-free design Ergonomics/human factors Specialized focus on a setting type Design for the elderly Heating, ventilation, and air-conditioning Corporate art programs
39
31
Table 4 Course Level Preferences (with 33% or Higher Response) for High Interest Topics (at Least 40% Response)
Course Level (%) Core Intermediate Advanced Topic
Business
Marketing strategies 42 Design practice management 42
33
Professional fees and compensation 41 34
Professional liability and legal issues Project management 41 Financial management and planning 39
Working with special design or technical consultants
Working with construction contractors 35
Office practice handbook 43
Cost estimating 40 Creative communications with clients 46
31 Time management 40 Public relations and promotional activities 47
Building construction supervision 36
54
58 35
36
35
34 36 35 36
40 31
36 35 43 43 33 31 35 39 38 41 42 38 40 40
40 56 55 53 52 50 48 41 46 46 42 39 38
41
49
46
35 36
48/53 * 46 49
51
39 35
39
33 42
*topic included twice in questionnaire list
12

Table 5 Categories of "Type of Design Work Handled by Design Firm" that Indicated Higher than Average Interest in Continuing Education Topics
Course ToDics Business Marketing strategies Public relations and promotional activities Design of promotional brochure
TvDe of design work
* * *** *
* *** Business writing Creative communications with clients
Design practice management Office practice handbook Time management
Project management Building construction supervision Financial management and planning
* Professional liability and legal issues ** *
** ** *
**A ***A * *** *
* * * * * * * * * * * *
Accounting for a small firm Cost estimating Professional fees and compensation
Working with special design or technical consultants Working with construction contractors
* * *
Design New design trends Computer applications in design practice Computer-aided design and drafting
Design-related research techniques Pre-design programming Post-occupancy evaluation
Personal creativity * Presentation techniques
Video presentation techniques
* ** ** * * * *
* * *A *** * * ***A
* * Photographic techniques * *
Specification writing * **A *** * *
Technology Rehabilitation and adaptive reuse Historic preservation Design for the elderly
* * * *
* * * ~~
Barrier free design
Fire safe design
Energy conscious design Acoustics and sound control C Color psychology * Lighting techniques New developments in lighting * Building construction
Heating, ventilation and air-conditioning Interior finish materials Window covering
* Ergonomicshuman factors * * *
**A * *
* **
* ** **
*** * ** ** Corporate art programs
Kitchen planning and design Construction detailing
Furniture design * Color psychology
** *** ** * *
Custom millwork design and detailing ** **
Specialized focus on setting type * ** **
* = 5% increase in interest, at least ** = 10% increase in interest, at least *** = much greater than 10% increase in interest
C = Basic or core course I = Intermediate level course
A = Advanced level course
13

heating, ventilation, and air-condi- tioning).
Additional data analysis indicates that years of practice, employment classification, or job title have some influence on topic interest, level of instruction desired, or decision to at- tend a course. For most topics, it is not surprising to find that more expe- rienced designers desire more ad- vanced levels of courses than do jun- ior designers with 2 or less years of experience. If the main focus of con- tinuing education is for the profes- sional interior designer (i.e., those meeting minimum qualification for professional membership), then there is additional need to focus most courses at the intermediate or ad- vanced level. Additionally, those designers with more than 10 years of experience need to be motivated to participate in continuing education courses, since they represent the larg- est group of professionals but are the group least interested in continuing education.
To satisfy the need for more ad- vanced level courses, creative “pack- aging” may be necessary. If only about 1520% of the total interior design professionals are interested in a given topic, many locations andlor ASIDflBD chapters will find it diffi- cult to attract an audience at a given time and place that is large enough to be financially feasible. But to con- tinue to offer core or basic level course will alienate those profession- als who are beyond that level and express an interest in a greater depth of knowledge. This is illustrated by the comments received from one re- spondent who wrote that “classes . . . are either too general to be of any help, or too information-packed to allow the student to absorb anything. . . .A very short seminar. . .is usually so general. . .[while] a lighting semi- nar given by an industry technical expert in 10 hours. . .ends up being too technical,” but still without teach- ing enough to be able to do a lighting job.
The problem of attracting a suffi- cient number of designers to any given course is more acute for the numerous ASID or IBD chapters that encompass larger geographic areas
with only moderate swells of design- ers in a few population pockets. Al- ternate program delivery modes may become a necessity if the profession as a whole is to have easy access to continuing education in a range of topic areas and at varied levels of instruction.
The concept of life-long learning is one that educators and the leadership of the interior design professional organizations need to emphasize to students and practitioners to ensure that the important interest in continu- ing education continues to grow.
Reference
Fowles, Dorothy. (1984). Continuing educa- tion: A collaborative effort. Journal of Inierior Design Education and Research. 10( I ) , 12-16.
14
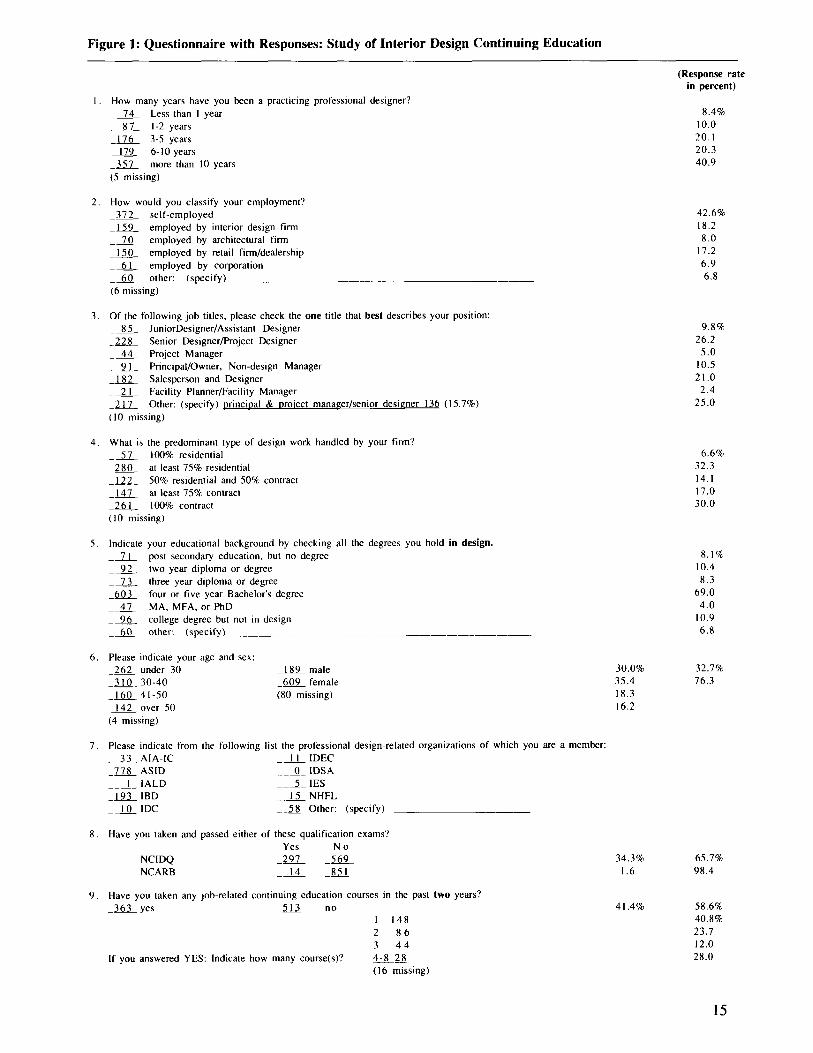
Figure 1: Questionnaire with Responses: Study of Interior Design Continuing Education
I . How many years have you been a practicing professional designer? -- 74 Less than I year -- 87 1-2 years -- 176 3-5 years 179_ 6-10 years -- 357 (5 missing)
How would you classify your employment? -- 372 self-employed -- 159 -__ 70 -- I50 -~ 6 I -__ 60 other: (specify) ___ ____ (6 missing)
Of the following job titles, please check the one title that best describes your position: -- 85 JuniorDesigner/Assistant Designer -~ 228 Senior DesigneriProject Designer -- 44 Project Manager -__ 9 I Principal/Owner, Non-design Manager -- 182 Salesperson and Designer -__ 2 I -- 2 17 (10 missing)
What is the predominant type of design work handled by your firm? -- 57 100% residential -- 280 -~ I22 -- 147 -- 26 I 100% contract ( I0 missing)
Indicate your educational background by checking all the degrees you hold in design. -~ 7 I -__ 92 -- 73 -- 603 -__ 47 -- 96 -60 other: (specify) _______ ~~~ _________---
Please indicate your age and sex: -- 262 under 30 -~ I89 male -~ 310 30-40 -~ 609 female -- 160 41-50 (80 missing)
(4 missing)
more than 10 years
2.
employed by interior design firm employed by architectural firm employed by retail firm/dealership employed by corporation
3 ,
Facility PlannerFacility Manager Other: (specify) principal & oroiect manaeer/senior desiener 136 (15.7%)
4.
at least 75% residential 50% residential and 50% contract at least 75% contract
5 . post secondary education, but no degree two year diploma or degree three year diploma or degree four or five year Bachelor's degree MA, MFA, or PhD college degree but not in design
6 .
142 over 50 --
7. Please indicate from the following list the professional design-related organizations of which you are a member: -__ 33 AIA-IC -- I I IDEC -- 778 ASlD 0 IDSA
-- 193 IBD -~ 15 NHFL -- 10 IDC -- 58 Other: (specify)
Have you taken and passed either of these qualification exams?
NCIDQ -~ 297 -~ 569
1 IALD 5 IES
8 . Yes N o
NCARB -14 -851 9 . Have you taken any job-related continuing education courses in the past two years?
363 yes -- 513 no -~
1 148 2 8 6 3 4 4 -- 4-8 28 (16 missing)
If you answered YES: Indicate how many course(s)?
(Response rate in percent)
8.4% 10.0 20. I 20.3 40.9
42.6% 18.2 8.0
17.2 6.9 6.8
9.8% 26.2 5.0
10.5 21.0 2.4
25.0
6.6% 32.3 14.1 17.0 30.0
8.1% 10.4 8.3
69.0 4.0
10.9 6.8
30.0% 32.7% 35.4 76.3 18.3 16.2
34.3% 65.7% 1.6 98.4
41.4% 58.6% 40.8% 23.1 12.0 28.0
15

*One CEU credit equals 10 course instruction hours. Credit is granted to approved courses only.
10.
1 I .
12.
13.
If you answered NO:
How many Continuing Education Units (CEU)* credits did you earn through these course(s) during the past two years? -- 146 non-credit course(s) only -__ 4 5 less than I -~ 6 9 1.0 to 1.9 -- 3 6 2.0 to 2.9 -- 4 I 3.0 or more (26 missing)
Who offered the course(s)? (check all that apply) -- 160 professional design organization -~ 172 university or college -- 15 non-design group -- 4 2 private corporate sponsor -- 4 9 professional for-profit seminar group -~ 12 other: (specify)
Please indicate your reason(s): (check all that apply) -- 28 no interest in CEU -- 230 too busy to attend -~ 8 8 no design-related courses offered -- 5 2 no courses of personal interest -- 8 7 courses offered were too expensive -- 104 courses offered at wrong time -- 109 courses offered required too much travel -- 7 3 other: (specify)
Check all of the following that you have attended in the past two years: -- 50 CEU courses at AIA or ASID national conference -- I16 CEU course sponsored by local chapter of professional organization -- 162 seminar at NEOCON -- 277 seminar or workshop at professional organization's conference -- 181 seminar or workshop sponsored by university or college
If continuing education courses of interest to you were readily available at a reasonable cost, how many CEU credits would you be likely to earn in the next year? -- 171 none -- 213 I -- 246 2 -- 208 3 or more (40 missing or ?)
How important would each of the following factors be in your future decision to take a continuing education course? Not
important Important important at all Very Somewhat important
honors award program by professional organization certification requirement by professional organization requirement to maintain state licensing speaker/presenter of course required by employer organization sponsoring course subject matter CEU credit proximity to office
other: (specify) cost
7.2% 40.3 57.0 34:4 24.7 13.9 76.9 17.3 29.0 30.6 0
17.9% 34.6 26.5 39.7 32.7 34.9 19.3 29.1 36.8 36.2 0
33.2% 13.8 7.9
17.8 16.3 34.1
I .7 29.9 25.8 26.7 0
4 I .5% 11.2 8.5 8.1
26.2 17.0 2.0
23.6 8.3 6.5 0
If you were to take a course in the next year, please indicate your preference for each of the following learning situations:
(% of 363) 40.2% 12.5 19.1 10.0 11.4 6.8
(% of 363) 44.0% 47.4 4.1
11.6 13.5 3.3
(% of 513) 5.5%
44.8 17.2 10.3 17.0 20.3 21.2 14.2
5.7 13.0 18.0 31.5 20.6
20.4 25.4 29.4 I
24.8
(Number of missing
responses)
I18 84 94
105 I67 138 71
140 96 88
829
four-hour evening seminar with expert instructor full-day seminar with expert instructor two-day seminar with expert instructor three to five day seminar with expert instructor prepackaged audio visual seminar with trained local le correspondence course home study or video cassette with workbook audio cassette with work book computer generated course
:ader
45.7 30.6 14.1 42.3 38.2 13.6 18.2 31.1 34.9 7.9 12.6 37.7 7.3 27.6 37.3 9.2 13.8 29.1
13.0 22.5 26.0 9.4 22.3 28.8 8.4 22.3 31.9
9.6% 5 . 9
15.8 41.8 27.8 47.8 39.4 39.4 37.4
86 75
I I3 137 122 I23 I09 1 I9 1 I6

14. The following is a partial list of continuing education topics. Assuming that a course would be available at a reasonable cost, first indicate your level of interest in each topic by circling the appropriate number on the left.
Second, only for those topics that interest you, indicate on the right the level of course
Interest level Course level instruction you would prefer:
BUSINESS 31% 27% 22% 32% 9% Marketing strategies 27% 42% 27% 4% 21 28 25 15 11 Public relations and promotional activities27 41 2 3 3 17 19 25 28 12 Design of promotional brochure 27 39 31 4
10 19 27 30 14 Business writing 30 43 24 3 25 29 19 15 1 1 Creative communications with clients 2 3 46 29 2 27 31 24 9 9 Professional liabilitv and leeal issues 39 33 25 3
~ ~~~ ~~
27 31 16 14 1 1 Design practice management 29 42 28 2 15 25 24 23 13 Office practice handbook 28 43 28 2 24 25 20 20 10 Time management 26 40 32 2
28 29 14 6 12 Project management 26 41 31 I 20 26 21 22 13 Building construction supervision 31 36 29 3 24 28 21 16 12 Financial management and planning 3 7 39 21 4
21 19 23 28 10 Accounting for a small firm 42 38 18 3 28 28 15 15 I I Cost estimating 32 40 26 2 38 27 16 1 1 8 Professional fees and comwnsation 22 41 34 3
~ ~________ ~______
21 30 23 16 10 Working with special design or technical consultants 29 37 30 4
21 28 24 17 10 Working with construction contractors 30 35 32 3
41 29 14 7 9 New design trends 19 32 47 2
practice 54 28 16 2 34 26 18 13 10 Computer-aided design and drafting 58 24 16 3
DESIGN
34 29 17 10 10 Computer applications in design
17 28 23 20 12 Design-related research techniques 36 35 26 3 14 25 25 23 13 Pre-design programming 28 39 30 3 12 23 28 24 13 Post-occupancy evaluation 33 35 29 3
32 26 14 16 13 Personal creativity 16 36 46 3 35 28 16 12 9 Presentation techniques 14 35 49 2 32 24 18 16 10 Photographic techniques 35 34 30 2 16 17 26 17 14 Video presentation techniques 45 26 26 2 17 25 22 22 13 Specification writing 32 36 29 2
28 24 30 26 17 27
TECHNOLOGY 19 18 1 1 Rehabilitation and adaptive reuse 28 41 29 2 20 14 9 Historic preservation 32 37 28 3 26 21 I I Design for the elderly 28 40 29 3
20 27 18 28 21 28
25 28 27 32 47 25
58 26 5 5 24 29 29
24 17 12 Barrier free design 24 40 32 3 22 19 12 Ergonomics/human factors 25 40 33 2 22 17 12 Fire safe design 30 38 30 2
22 13 12 Energy conscious design 32 38 26 4 18 10 12 Acoustics and sound control 27 43 27 2 14 8 9 Color psychology 15 33 48 3
6 3 7 Lighting techniques 21 39 35 5 10 3 8 New developments in lighting 24 37 36 3 17 13 12 Building construction 23 43 31 3
14 24 30 32 30 27
17 21 22 28 30 25
36 26 30 26 47 21
27 19
28 21 12 Heating, ventilation and air-conditioning 3 8 40 19 3 17 1 1 1 1 Interior finish materials 15 36 46 3 18 14 1 1 Window covering 12 33 51 3
25 25 13 Corporate art programs 29 35 34 2 21 19 10 Kitchen planning and design 15 42 39 4 18 16 12 Construction detailing 23 39 35 3
16 12 1 1 Custom millwork design and detailing 24 35 38 3 19 13 12 Furniture design 24 35 39 3 12 10 11 Color psychology 14 31 53 3
12 15 27 Specialized focus on a setting type 16 32 42 10 such as office, hospital, etc:
17

15
16
17.
I 8 .
19.
20.
21.
22.
23.
18
. ,
If you were to take a CEU course in the next year, please indicate your preference for attending a course at the following locations or events.
Local town or city Another location within 100 mile radius Location between 100-300 mile radius Another section of the country, if known College campus (conference center or classroom) In conjunction with national conference In conjunction with regional conference In conjunction with chapter program In conjunction with a major market, like NEOCON
92.9 5.4 . 7 .9%
3.3 12.5 35.0 49.1 12.1 39.8 25.6 22.4
3. I 10.8 26.4 59.7 39.6 42.1 10.4 7.8
43.4 38.4 10.1 8 . I 23.4 28.4 26.0 22.2
14.5 28.4 33.3 23.7 17.4 36.4 27.4 18.6
50 137 153 174 146 I 48 I 48 126 131
Researcher 30.5 43.4 23.4 5.7% 1'3 I Author 20.5 48.9 24.3 6 .3 142 Design educator 38.9 39.6 16.6 5 . 0 112 Other educator 13.9 42.7 32.5 10.8 159 DeTign practitioner 64.3 28.6 5.5 I .s 85 Trade technical personnel 48.0 37.6 10.8 3.6 112 Other: (specify) 822
Listed below are various months during which CEU courses could be offered. Please rank those months that you would prefer by entering " I " for most preferred. "2" for next most preferred, etc. (Enter "0" for those months that you could not attend.)
RANK: 0 1 _ _ _ _ _ JanuaryFebruary 27.9% 36.1% _ _ _ _ _ March/April _ _ _ _ _ May/June _ _ _ _ _ July/August _ _ _ _ _ September/October _ _ _ _ _ November/Decemher
I 1.8 40.0 19.5 27.5 34.6 21.0 15.5 28.6 57.7 8 . I
Do you own or have ready access to a video cassette player?
-- 502 yes _~ 366 n o (10 missing)
Do you own or have ready access to a pesonal computer? -- 302 yes _~ 563 n o (13 missing)
If YES, what type or make of computer do you have.
Does your firm pay for job-related continuing education courses'? -~ 290 Yes, full cost of course ~~ 27 Yes. up to a limit of $ -~ 9 6 Yes, partial cost of course on a shared basis -- 339 No
(35 missing)
How many people are employed by your firm? -- 1 8 5 I person ~~ 255 2-5 persons -- 202 6-25 persons -- 6 5 26-50 persons ~~ I52 more than 50 persons (19 missing)
How many designers are employed by your firm? -- 302 I designer -- 363 2-5 designers -~ 9 I 6-10 designers _~ 36 11-15 designers _~ 6 3 more than 15 designers (23 missing)
What is the population of the city/town/metropolitan area in which your firm is located? -~ 102 less than 50.000
-- 2 I9 250.000-999.999 -- 3 3 7 over I ,OOO,OO0 ( 1 8 missing)
263 resDonses
Y I Don't Know ~
-- 202 50,000-249.000
2 14.9% 29.7 27. I 20.3 27.5 11.3
58.8%
34.9%
(Number of missing
responses) 114 109 119 121 112 123
(Response rate in percent)
42.2%
65. I %
34.2% 3.2
11.3 40.1 I 0.8
2 I .5% 29.7 23.5 1.6
17.7
35.3% 42.5 10.6 4.2 7.4
1 I .9% 23.5 25.5 39.1