Embed Size (px)
Citation preview
30 TRANSPORTATION RESEARCH RECORD 1365
Study of Headway and Lost Time at Single-Point Urban Interchanges
JAMES A. BONNESON
The results of a recent study of the headway and lost time at three single-point urban interchanges (SPUis) arc summarized. The data base, containing more than 38,000 headway observations, was collected primarily in the Tampa, Florida, area. The data were used to calculate the minimum discharge headway and start-up lost time for the SPUI's three basic movements: cross road left-tum, off-ramp left-tum, and cross road through. It was found that traditional procedures for estimating the minimum discharge headway may be biased toward values higher than ultimately achieved by the traffic queue. Moreover, the degree of bias varied widely among the movements and sites studied because of unequal numbers of observations. As a result, initial attempts at a cause-and-effect analysis were clouded by a high degree of variability in the data. In recognition of the aforementioned bias, alternative statistical analysis techniques and regression models were used to identify significant effects and to calibrate predictive models of minimum discharge headway and startup lost time. The results i.ndicate that the minimum discharge headway ot the ::il'UJ' two lett-turn movements arc igni 1canrly lower than it through movement and lower 1han values traditionally used for protected left-turn movements under "ideal" conditions. In fact, the calibrated models predict minimum discharge headways that are generally lower, and start-up lost times that are higher, than those calculated by traditional procedures. Left-turn headway was also found to vary with turn radius.
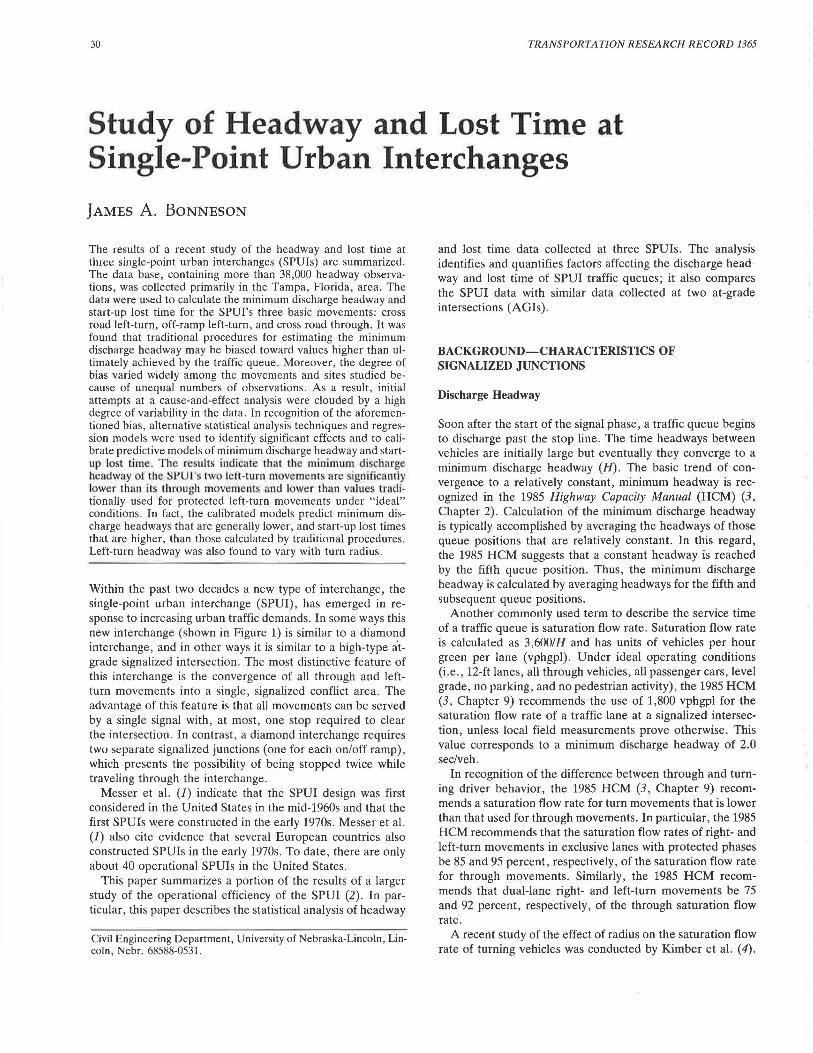
Within the past two decades a new type of interchange, the single-point urban interchange (SPUI), has emerged in response to increasing urban traffic demands. In some ways this new interchange (shown in Figure 1) is similar to a diamond interchange, and in other ways it is similar to a high-type a'tgrade signalized intersection. The most distinctive feature of this interchange is the convergence of all through and leftturn movements into a single , signalized conflict area. The advantage of this feature is that all movements can be served by a single signal with, at most, one stop required to clear the intersection. In contrast, a diamond interchange requires lwo separate signalized junctions (one for each on/off ramp), which presents the possibility of being stopped twice while traveling through the interchange.
Messer et al. (J) indicate that the SPUI design was first considered in the United States in the mid-1960s and that the first SPUis were constructed in the early 1970s. Messer et al. (1) also cite evidence that several European countries also constructed SPUis in the early 1970s. To date, there are only about 40 operational SPUls in the United States.
This paper summarizes a portion of the results of a larger study of the operational efficiency of the SPUI (2). In particular, this paper describes the statistical analysis of headway
Civil Engineering Department, University of Nebraska-Lincoln, Lincoln , Nebr. 68588-0531.
and lost time data collected at three SPUis. The analysis identifies and quantifies factors affecting the discharge headway and lost time of SPUI traffic queues; it also compares the SPUI data with similar data collected at two at-grade intersections (AGis).
BACKGROUND-CHARACTERISTICS OF SIGNALIZED JUNCTIONS
Discharge Headway
Soon after the start of the signal phase, a traffic queue begins to discharge past the stop line. The time headways between vehicles are initially large but eventually they converge to a minimum discharge headway (H). The basic trend of convergence to a relatively constant, minimum headway is recognized in the 1985 Highway Capacity Manual (HCM) (3, Chapter 2) . Calculation of the minimum discharge headway is typically accomplished by averaging the headways of those queue positions that are relatively constant. In this regard, the 1985 HCM suggests that a constant headway is reached by the fifth queue position. Thus, the minimum discharge headway is calculated by averaging headways for the fifth and subsequent queue positions.
Another commonly used term to describe the service time of a traffic queue is saturation flow rate. Saturation flow rate is calculated as 3 ,6001 H and has units of vehicles per hour green per lane (vphgpl). Under ideal operating conditions (i.e., 12-ft lanes, all through vehicles, all passenger cars, level grade, no parking, and no pedestrian activity), the 1985 HCM (3, Chapter 9) recommends the use of 1,800 vphgpl for the saturation flow rate of a traffic lane at a signalized intersection, unless local field measurements prove otherwise. This value corresponds to a minimum discharge headway of 2.0 sec/veh.
In recognition of the difference between through and turning driver behavior, the 1985 HCM (3, Chapter 9) recommends a saturation flow rate for turn movements that is lower than that used for through movements. In particular, the 1985 HCM recommends that the saturation flow rates of right- and left-turn movements in exclusive lanes with protected phases be 85 and 95 percent, respectively, of the saturation flow rate for through movements. Similarly, the 1985 HCM recommends that dual-lane right- and left-tum movements be 75 and 92 percent, respectively, of the through saturation flow rate.
A recent study of the effect of radius on the saturation flow rate of turning vehicles was conducted by Kimber et al. (4).
Bonneson 31
N~ SR 60
=:::::;:,p====,==i.: ,~:;:~~~l:'•, :: c::F=._======8= "
FIGURE 1 Typical geometric configuration of the SPUI.
On the basis of their research, Kimber et al. recommended the following relationship between radius and saturation flow rate for a left-turn movement:
s = t
2 080
1 + 4.92 R
(1)
where S, is saturation flow rate of a turn movement (vphgpl) and R is radius of curvature (feet).
Start-Up Lost Time
The first few vehicles in a traffic queue have headways in excess of the minimum discharge headway as their drivers accelerate to a de ired speed. This excess time is commonly referred to as lost time because it represent time that is inefficiently used by the discharging traffic queue . Start-up lost time can be calculated by adding the individual lost time for these first few starting vehicles. The equation for start-up lost time is
Ks (2)
where
Ks = start-up lost time ( edpha. e) , h,. = headway of the nth queued vehicle ( ec), H = minimum discharge headway ( ec/veh) , and N = number f queue positions having headways larger
than H.
Equation 2 indicates that the magnitude of start-up lost time is directly dependent on the value used for minimum discharge headway (H).
As discussed previously, the 1985 H M (3, Chapter 9) recommends that the minimum discharge headway be calculated as the average of the headways for the fifth through last queued vehicles. This approach implies that the first fo ur vehicles incur all of the start-up lost time (i .e ., N = 4). The 1985 HCM (3, Chapter 2) indicates that . tart-up lost time is generally about 2.0 sec/phase.
EXPERIMENTAL DESIGN
Headway and lost time for the three basic movement types found at tbe SPUI were examined. The basic movement types included the cross road left-turn movement, cross road through movement, and off-ramp left-turn movement.
34
(3, Chapter 9). However, the results are not totally satisfying because there are no obvious trends where trends are expected and in one case, the trend found i contrary to recommended practice.
Potential Bias in Headway and Lost Time Estimation
A closer examination of the data was undertRken to explore the causes of the wide variability in the tabulated results. This examination focused on the possjbility that the method u. ed to calculate minimum discharge headway had some inherent bia es. In particular , headways averaged for each queue position indicated a trend toward decreasing values through the first 8 to 10 queue position at most locations. This trend suggest that a minimum headway may not be achjeved by the fifth queue po ition as implied by the 1985 HCM procedure. Obviously, if the queue has not reached a minimum value by the fifth queue position , the minimum headway ca lculated using the HCM procedure would be biased toward a larger value than that ultimately achieved by the traffic queue .
This bias i · further magnified when frequency ofoccurrence is con idered. In this regard, the number of observed headway generally decrea e with increasing queue po ition. As a result the minimum headway calculated u ing the HCM procedure would be weighted toward the value observed in the lower queue position . ln effect, if headways for the lower queue positions are consi tently larger than those of higher positions and if they are also observed with the greatest frequency , then the bia in the estimated average minimum headway will be even greater due to the unequal frequency of observations.
Thi bias will also affect the estimation of start-up lost time for two rea ons . First the minimum headway i needed to calculate start-up lost time ( ee Equation 2) . A minimum headway bia ed toward a larger value will result in an estimated tart-up lost time that i smaller than actually incurred . Second , the number of queue positions included in the um (Nin Equation 2) would need to include all of the positions that are incurring some added lost time because of start-up effects. lf too few queue position are included, thee timated start-up lost time would be biased toward a smaller value than actually incurred.
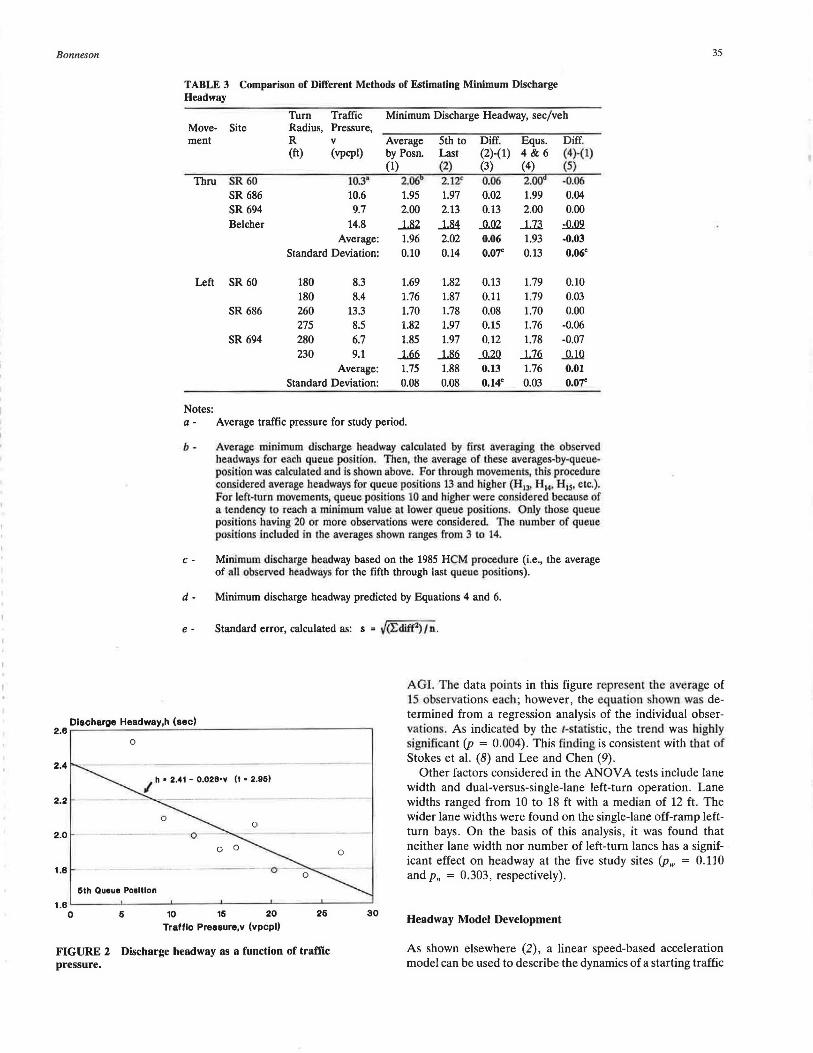
The magnitude of the potential bias resulting from the use of the 1985 HCM procedure is given in Table 3. The data in
olurnn 1 represent an estimate of tbe minimum discharge headway with most of the bias by queue position (as magnified by unequal frequency) removed. Thi was accomplished by first averaging the headways for queue positions 13 and higher for the through movemeut . Position 10 and higher were used for the left-turn movements because they tended to reach a minimum headway sooner than the through movement . These averages-by-queue-position were then averaged to yield the values given in Column 1. To add stability to the estimates, only queue positions having 20 or mo.re observations were considered. Becau e of 1he e restrictions only 4 of the 5 through lanes and 6 of the 17 left-tum lanes had enough ob ·ervations to calculate a minimum discharge headway by this procedure.
A comparison of Columns 1 and 2 in Table 3 (shown in Column 3) indicates that the 1985 HCM procedure always
TRANSPORTATION RESEARCH RECORD 1365
overestimates the minimum discharge headway. Moreover, the overestimation appears to be greater for the left-tum (0.13) than the through (0.06) movements . The error over all movements and sites ranges from 0.02 to 0.20 sec/veh.
In some cases, this bias may not be large enough to compromise the results of a capacity analysis; however, it does tend to cloud any statistical analysis of cause and effect by introducing added variability in the data set . As a result, the true effect of a treatment or factor (e.g., lane width, percent trucks, etc.) may be obscured by data from sites having different amounts of bias by queue position and a different frequency of observations at each position.
Factors Affecting Discharge Headway
Several precautions were taken to eliminate effects that might confound the analysis of discharge headway. To minimize differences in driver acceleration for the first few queue positions, the ANOV A tests only considered headways for the fifth and higher queued vehicles. In addition, the ANOVA tests included queue position as a blocking factor to preclude any bias that might be introduced by the different queue lengths found at each site. By "blocking" on queue position, all of the ANOV A comparisons are made on a queue-positionby-queue-position basis, thereby eliminating any bias by queue position. The data set used in the ANOVA analysis consisted of the individual passenger car headways recorded at each site for each movement studied, not the averages in Table 1.
One of the most interesting findings of the ANOV A tests is the ignificantly smaller headway of the SPUI left-tum movements compared with the SPUJ through movements (p = 0.001). This trend is contrary to the relationship suggested by the 1985 HCM (3, Chapter 9). Possible reasons for the lower left-tum headways at SPUls are (a) a heightened awareness of left-tum (relative to through) drivers, (b) the ability of left-turning drivers to see preceding driver in the queue complete the turn and thus anticipate the correct turn path , and ( c) the provision of lane markings through the interchange for the left-tum (but not the through) movements at SPUis. The trend toward smaller left-tum headways was also observed by Poppe et al. (7) at two of the three SPUls they studied.
The ANOV A tests also indicated that the through movement headways at the SPUis are significantly larger than those at the AGls (p = 0.001). An explanation for the larger through movement headways found at the SPUis may be the extra caution exercised by drivers when entering the rather lengthy conflict area associated with the SPUI. Time of day was not found to have a significant effect on discharge headway.
The effect of traffic pressure was examined by considering both traffic volume per cycle per lane and queue length per cycle. Both measures were found to be significant; however, lane volume per cycle accounted for considerably more of the total sum of squared deviations from the mean (SSv = 26.9, Pv = 0.001; SSq = 15.0, pq = 0.001). As a result, lane volume per cycle was determined to be the strongest measure of traffic pressure.
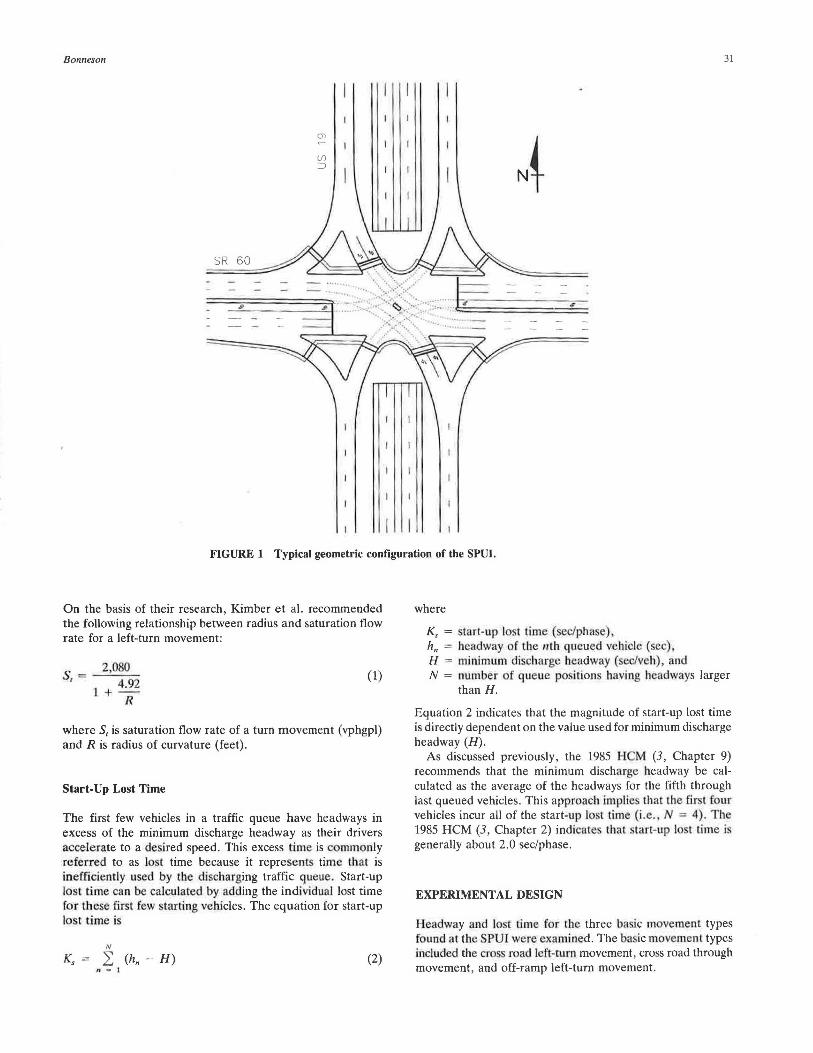
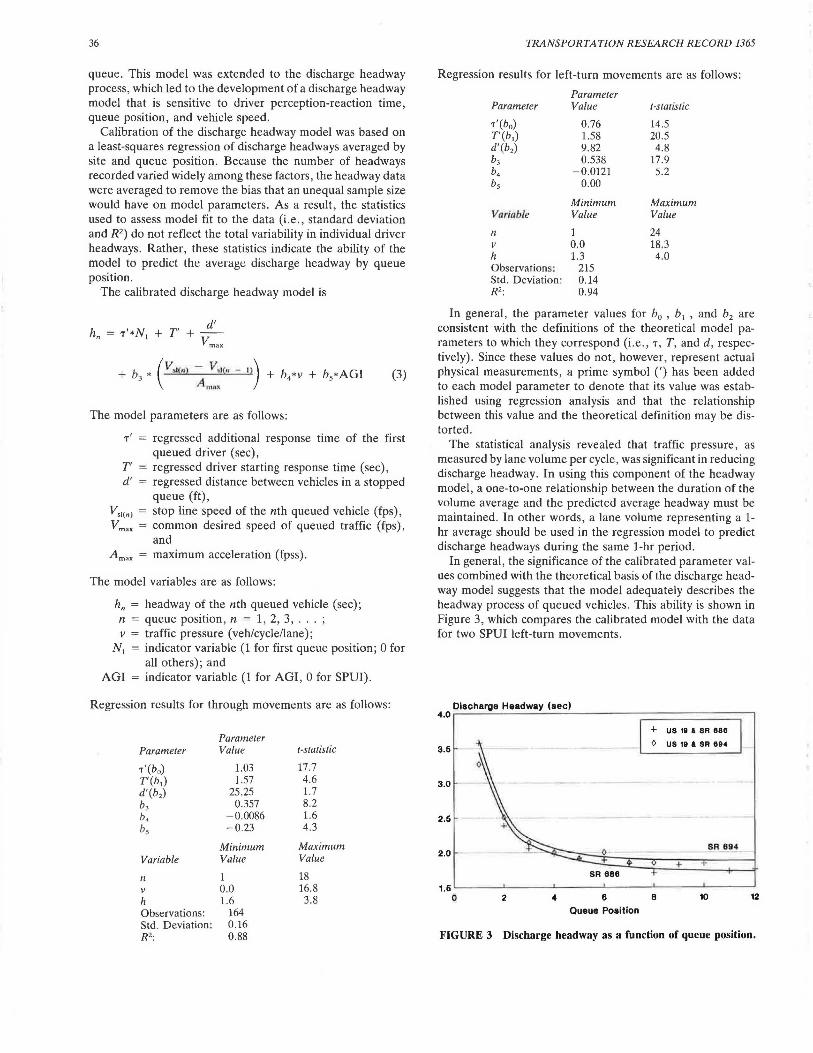
Increased traffic pressure was found to decrease headways at all queue positions. This trend is shown in Figure 2 for queue position five of the through movement at the Belcher
Bonneson
TABLE 3 Comparison of Different Methods of Estimating Minimum Discharge Headway
Tum Traffic Minimum Discharge Headway, sec/veh Move- Site Radius, Pressure, ment R v Average 5th to Diff. Equs. Diff.
(ft) (vpcpl) by Posn. Last (2)-(1) 4&6 (4)-(1) (1) (2) (3) (4) (5)
Thru SR60 10.3" 2.06b 2.12• 0.06 2.ooa -0.06 SR 686 10.6 1.95 1.97 0.02 1.99 0.04 SR 694 9.7 2.00 2.13 0.13 2.00 0.00 Belcher 14.8 ...l..8Z .lM J1.02 -1.n :M2
Average: 1.96 2.02 0.06 1.93 -0.03 Standard Deviation: 0.10 0.14 0.07° 0.13 0.06°
Left SR 60 180 8.3 1.69 1.82 0.13 1.79 0.10 180 8.4 1.76 1.87 0.11 1.79 0.03
SR 686 260 13.3 1.70 1.78 0.08 1.70 0.00 275 8.5 1.82 1.97 0.15 1.76 -0.06
SR 694 280 6.7 1.85 1.97 0.12 1.78 -0.07 230 9.1 _un ...1...8Q J!.2Q ..1.12 JU.Q
Average: 1.75 1.88 0.13 1.76 0.01 Standard Deviation: 0.08 0.08 0.14° 0.03 0.01·
Notes: a- Average traffic pressure for study period.
b • Average minimum discharge headway calculated by firs t averaging the observed headways for each queue position. Then, the average of these averages-by-queueposition was calculated and is shown above. For through movements, this procedure considered average headways for queue positions 13 and higher (H13t Hw H15, etc.). For left-turn movements, queue positions 10 and higher were considered because of a tendency to reach a minimum value at lower queue positions. Only those queue positions having 20 or more observations we.re considered. The number of queue positions included in the averages shown ranges from 3 to 14.
c - Minimum discharge 11eadway based on the 1985 HCM procedure (i.e., the average of all observed headways for the fifth through last queue positions).
d - Minimum discharge headway predicted by Equations 4 and 6.
e - Standard error, calculated as: s " J(L.diif2) / n .
35
Discharge Headway,h (sec) 2.e ~~--=~~~....:..:-.:.~~~~~~~~~~~~~~-,
AGL The data points in this figure represent the average of 15 ob ervations each; however, the equation shown was determined from a regression analysis of the individual observations. As indicated by the I-statistic , the trend was bigWy significant (p = 0.004). This fi nding is consi tent with that of Stokes et al. (8) and Lee and Chen (9).
0
2.4 (I • 2.95)
2.2
0 2.0
0
1.6
5th Queue Po•ltlon 1.e L-~~--'~~~-'-~~~-'--~~~'--~~---'~~~~
0 5 10 15 20 25
Traffic Preaaure,v (vpcpl)
FIGURE 2 Discharge headway as a function of traffic pressure.
30
Other factors considered in the ANOV A tests include lane width and dual-versus-single-lane left-turn operation. Lane widths ranged from 10 to 18 ft with a median of 12 ft. The wider lane widths were found on the single-lane off-ramp leftturn bays. On the basis of this analysis, it was found that neither lane width nor number of left-turn lanes has a significant effect on headway at the five study sites (pw = 0.110 and p. = 0.303, respectively) .
Headway Model Development
As shown elsewhere (2) , a linear speed-based acceleration model can be used to describe the dynamics of a starting traffic
36
queue. This model was extended to the discharge headway process, which led to the development of a discharge headway model that is sensitive to driver perception-reaction time, queue position, and vehicle speed.
Calibration of the discharge headway model was based on a least-squares regression of discharge headways averaged by site and queue position. Because the number of headways recorded varied widely among these factors, the headway data were averaged to remove the bias that an unequal sample size would have on model parameters. As a result, the statistics used to assess model fit to the data (i .e., standard deviation and R2) do not reflect the total variability in individual driver headways. Rather, these statistics indicate the ability of the model to predict the average discharge headway by queue position.
The calibrated discharge headway model is
The model parameters are as follows:
T1 = regressed additional response time of the first
queued driver (sec), T' = regressed driver starting response time (sec), d' regressed distance between vehicles in a stopped
queue (ft), stop line speed of the nth queued vehicle (fps), common desired speed of queued traffic (fps), and
Amax maximum acceleration (fpss).
The model variables are as follows:
h" = headway of the nth queued vehicle (sec); n = queue position, n = 1, 2, 3, ... ; v = traffic pressure (veh/cycle/lane);
N1 = indicator variable (1 for first queue position; 0 for all others); and
AGI = indicator variable (1 for AGI, 0 for SPUI).
Regression results for through movements are as follows:
Parameter Parameter Value I-statistic
T'(bo) 1.03 17.7 T'(b,) 1.57 4.6 d'(b,) 25.25 1.7 b, 0.357 8.2 b. -0.0086 1.6 bs -0.23 4.3
Minimum Maximum Variable Value Value
n 1 18 v 0.0 16.8 h 1.6 3.8 Observations: 164 Std. Deviation: 0.16 R': 0.88
TRANSPORTATION RESEARCH RECORD 1365
Regression results for left-tum movements are as follows:
Parameter Parameter Value /-statistic
T'(bo) 0.76 14.5 T'(b,) 1.58 20.5 d'(b,) 9.82 4.8 b, 0.538 17.9 b. -0.0121 5.2 bs 0.00
Minimum Maximum Variable Value Value
n 1 24 v 0.0 18.3 h 1.3 4.0 Observations: 215 Std. Deviation: 0.14 R': 0.94
In general, the parameter values for b0 , b 1 , and b2 are consistent with the definitions of the theoretical model parameters to which they correspond (i .e., T, T, and d, respectively). Since these values do not, however, represent actual physical measurements, a prime symbol (') has been added to each model parameter to denote that its value was established using regression analysis and that the relationship between this value and the theoretical definition may be distorted.
The statistical analysis revealed that traffic pressure, as measured by lane volume per cycle, was significant in reducing discharge headway. In using this component of the headway model, a one-to-one relationship between the duration of the volume average and the predicted average headway must be maintained. In other words, a lane volume representing a 1-hr average should be used in the regression model to predict discharge headways during the same 1-hr period.
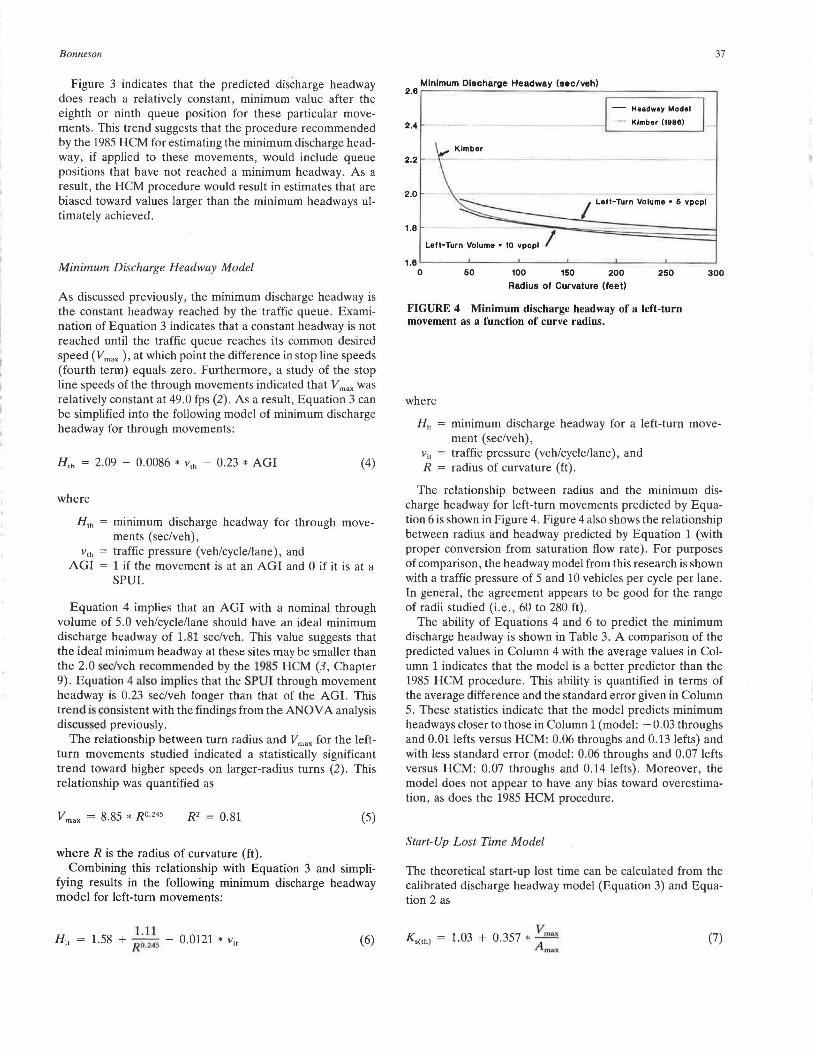
In general, the significance of the calibrated parameter values combined with the theoretical basis of the discharge headway model suggests that the model adequately describes the headway process of queued vehicles. This ability is shown in Figure 3, which compares the calibrated model with the data for two SPUI left-tum movements.
3.6
3.0
2.6
2.0 -
1.6 0 2 4
SR 888
6
Queue Position
+ US 18 & SR 886
I> US 18 & SR 884
SR 894
+
8 10 12
FIGURE 3 Discharge headway as a function of queue position.
Bonneson
Figure 3 indicates that the predicted discharge headway does reach a relatively constant, minimum value after the eighth or ninth queue position for these particular movements. This trend suggests that the procedure recommended by the 1985 HCM for estimating the minimum discharge headway, if applied to these movements, would include queue positions that have not reached a minimum headway. As a result, the HCM procedure would result in estimates that are biased toward values larger than the minimum headways ultimately achieved.
Minimum Discharge Headway Model
As discussed previously , the minimum discharge headway is the constant headway reached by the traffic queue . Examination of Equation 3 indicates that a constant headway is not reached until the traffic queue reaches its common desired speed (V max ), at which point the difference in stop line speeds (fourth term) equals zero. Furthermore, a study of the stop line speeds of the through movements indicated that V max was relatively constant at 49.0 fps (2). As a result, Equation 3 can be simplified into the following model of minimum discharge headway for through movements:
H,h = 2.09 - 0.0086 • v,h - 0.23 • AGI (4)
where
H,h = mm1mum discharge headway for through movements (sec/veh),
v,h = traffic pressure (veh/cycle/lane), and AGI = 1 if the movement is at an AGI and 0 if it is at a
SPUI.
Equation 4 implies that an AGI with a nominal through volume of 5.0 veh/cycle/lane should have an ideal minimum discharge headway of 1.81 sec/veh. This value suggests that the ideal minimum headway at these sites may be smaller than the 2.0 sec/veh recommended by the 1985 HCM (3, Chapter 9). Equation 4 al ·o implies that the SPUI through movement headway is 0.23 sec/veh longer than that of the AGL This trend is consistent with the findings from the ANOV A analysis discu sed previously.
The relationship between turn radius and V max for the leftturn movements studied indicated a statistically significant trend toward higher speeds on larger-radius turns (2). This relationship was quantified as
V max = 8.85 * R0·245 R2 = 0.81 (5)
where R is the radius of curvature (ft). Combining this relationship with Equation 3 and simpli
fying results in the following minimum discharge headway model for left-turn movements:
1.11 1.58 + R 0.2·•5 - 0.0121 * V11 (6)
37
Minimum Discharge Headway (sec/veh) 2.6 r----------------~----~
- Headway Model
2.4 - Kimber (1988)
2.2
2.0 / Lett-Turn Volume • 6 vpcpl
1.6 ---:;r-=-~~~~ Left-Turn Volume • 10 vpcpl
1.e ~---'-----'--~--'------'---~-'-----'
0 50 100 150 200 250
Radius of Curvature (feet)
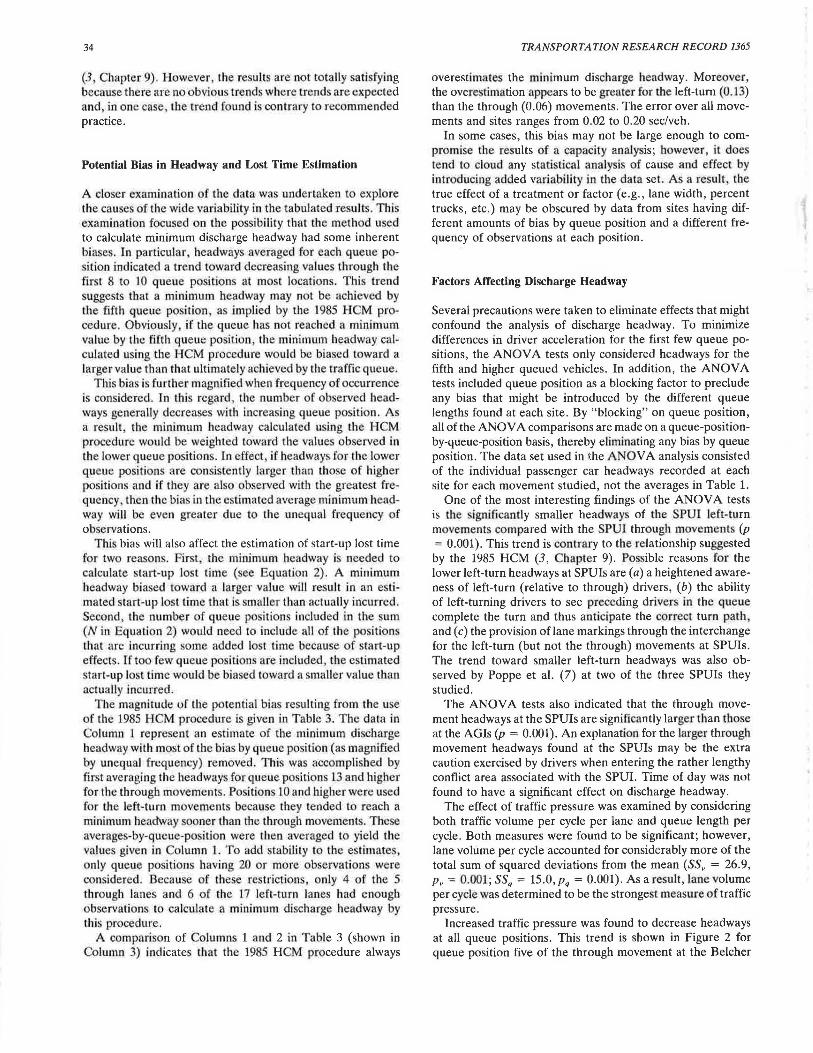
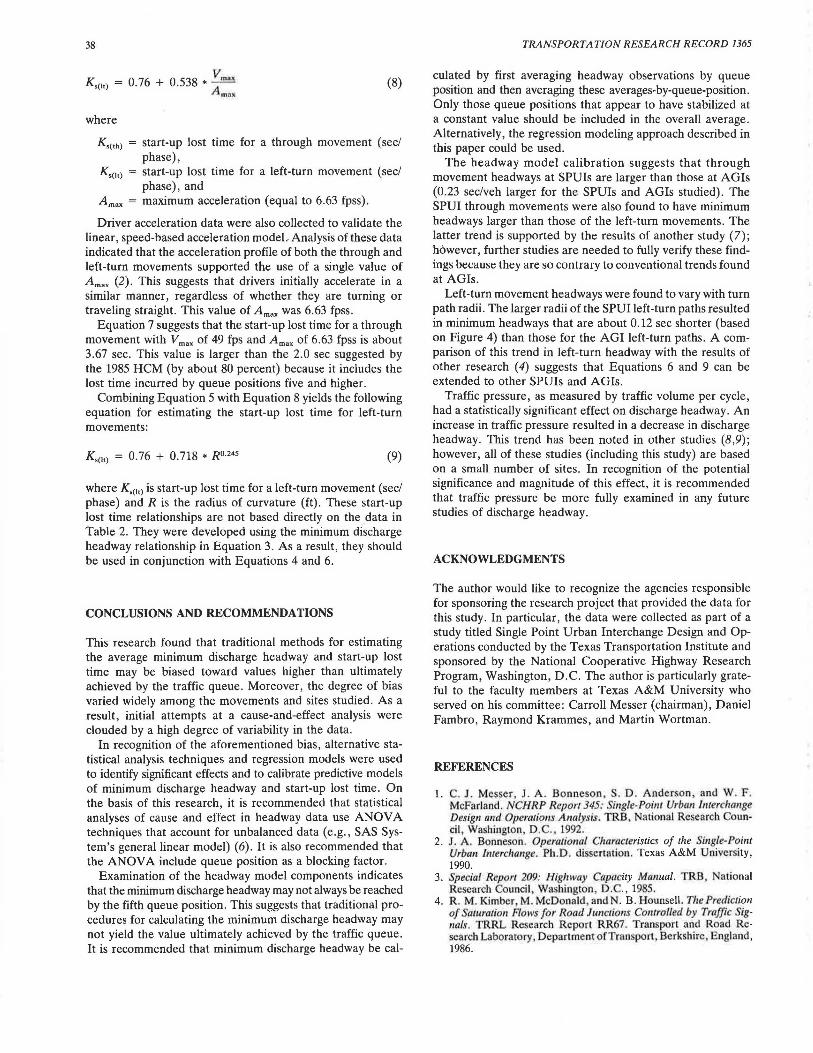
FIGURE 4 Minimum discharge headway of a left-turn movement as a function of curve radius.
where
300
H 11 minimum discharge headway for a left-turn movement (sec/veh),
v1, traffic pressure (veh/cycle/lane), and R radius of curvature (ft).
The relationship between radius and the mm1mum discharge headway for left-turn movements predicted by Equation 6 is shown in Figure 4. Figure 4 also shows the relationship between radius and headway predicted by Equation 1 (with proper conversion from saturation flow rate). For purposes of comparison, the headway model from this research is shown with a traffic pressure of 5 and 10 vehicles per cycle per lane. In general, the agreement appears to be good for the range of radii studied (i.e., 60 to 280 ft).
The ability of Equations 4 and 6 to predict the minimum discharge headway is shown in Table 3. A comparison of the predicted values in Column 4 with the average values in Column 1 indicates that the model is a better predictor than the 1985 HCM procedure. This ability is quantified in terms of the average difference and the standard error given in Column 5. These statistics indicate that the model predicts minimum headways closer to those in Column 1 (model: - 0.03 throughs and 0.01 lefts versus HCM: 0.06 throughs and 0.13 lefts) and with less standard error (model: 0.06 throughs and 0.07 lefts versus HCM: 0.07 throughs and 0.14 lefts). Moreover, the model does not appear to have any bias toward overestimation, as does the 1985 HCM procedure.
Start-Up Lost Time Model
The theoretical start-up lost time can be calculated from the calibrated discharge headway model (Equation 3) and Equation 2 as
1.03 + 0.357 * v,,. .. A," ..
(7)
38
K,<i•J = 0.76 + 0.538 * Vm•• Amax
where
(8)
K,(•h) = start-up lost time for a through movement (sec/ phase),
K,<11> = start-up lost time for a left-turn movement (sec/ phase) , and
Amax = maximum acceleration (equal to 6.63 fpss).
Driver acceleration data were also collected to validate the linear, speed-based acceleration modeL Analysis of these data indicated that the acceleration profile of both the through and left-turn movements supported the use of a single value of Amax (2) . This suggests that drivers initially accelerate in a similar manner, regardless of whether they are turning or traveling straight. This value of Amax was 6.63 fpss.
Equation 7 suggests that the start-up lost time for a through movement with V max of 49 fps and Amax of 6.63 fpss is about 3.67 sec. This value is larger than the 2.0 sec suggested by the 1985 HCM (by about 80 percent) because it includes the lost time incurred by queue positions five and higher.
Combining Equation 5 with Equation 8 yields the following equation for estimating the start-up lost time for left-turn movements:
Ks(lt) = 0.76 + 0.718 * R0·245 (9)
where K,<11i is start-up lost time for a left-turn movement (sec/ phase) and R is the radius of curvature (ft). These start-up lost time relationships are not based directly on the data in Table 2. They were developed using the minimum discharge headway relationship in Equation 3. As a result, they should be used in conjunction with Equations 4 and 6.
CONCLUSIONS AND RECOMMEND A TIO NS
This research found that traditional methods for estimating the average minimum discharge headway and start-up lost time may be biased toward values higher than ultimately achieved by the traffic queue. Moreover , the degree of bias varied widely among the movements and sites studied. As a result, initial attempts at a cause-and-effect analysis were clouded by a high degree of variability in the data.
In recognition of the aforementioned bias, alternative statistical analysis techniques and regression models were used to identify significant effects and to calibrate predictive models of minimum discharge headway and start-up lost time. On the basis of this research, it is recommended that statistical analyses of cause and effect in headway data use ANOV A techniques that account for unbalanced data (e.g., SAS System's general linear model) (6) . It is also recommended that the ANOV A include queue position as a blocking factor.
Examination of the headway model components indicates that the minimum discharge headway may not always be reached by the fifth queue position. This suggests that traditional procedures for calculating the minimum discharge headway may not yield the value ultimately achieved by the traffic queue. It is recommended that minimum discharge headway be cal-
TRANSPORTATION RESEARCH RECORD 1365
culated by first averaging headway observations by queue position and then averaging these averages-by-queue-position. Only those queue positions that appear to have stabilized at a constant value should be included in the overall average. Alternatively, the regression modeling approach described in this paper could be used.
The headway model calibration suggests that through movement headways at SPUis are larger than those at AGis (0.23 sec/veh larger for the SPUis and AGis studied). The SPUI through movements were also found to have minimum headways larger than those of the left-turn movements. The latter trend is supported by the results of another study (7); however, further studies are needed to fully verify these findings because Lhey are so contrary to conventional trends found at AGis.
Left-turn movement headways were found to vary with turn path radii. The larger radii of the SPUI left-turn paths resulted in minimum headways that are about 0.12 sec shorter (based on Figure 4) than those for the AGI left-turn paths. A comparison of this trend in left-turn headway with the results of other research (4) suggests that Equations 6 and 9 can be extended to other SPUis and AGis.
Traffic pressure, as measured by traffic volume per cycle, had a statistically significant effect on discharge headway . An increase in traffic pressure resulted in a decrease in discharge headway. This trend has been noted in other studies (8 ,9); however, all of these studies (including this study) are based on a small number of sites. In recognition of the potential significance and magnitude of this effect, it is recommended that traffic pressure be more fully examined in any future studies of discharge headway.
ACKNOWLEDGMENTS
The author would like to recognize the agencies responsible for sponsoring the research project that provided the data for this study. In particular, the data were collected as part of a study titled Single Point Urban Interchange Design and Operations conducted by the Texas Transportation Institute and sponsored by the National Cooperative Highway Research Program, Washington , D.C. The author is particularly grateful to the faculty members at Texas A&M University who served on his committee: Carroll Messer (chairman), Daniel Fambro, Raymond Krammes, and Martin Wortman.
REFERENCES
1. C. J. Messer , J . A . Bonneson , . D . Anderson , and W. F . McFarland. NCH RP Report 345: Single-Point Urban l111ercha11ge Design and Operations Analysis. TRB , National Research Council , Washington D.C., 1992.
2. J . A. Bonneson. Operational Characteristics of the Single-Point Urban Interchange. Ph.D. dissertation. Texas A&M University, 1990.
3. Special Report 209: Highway Capacity Manual. TRB, National Research Council , Washington, D.C., 1985.
4. R. M. Kimber, M. McDonald and N. B. Hounsell. Tire Prediction of Saturation Flows for Road J1111ctio11s Co11trolled by Traffic Sig-11a/s. TRRL Re earch Report RR67. Transport and Road Resea rch Laboratory, DepartmentofTransport , Berkshire, England, 1986.
Bonnes on
5. SAS/STAT User's Guide. Release 6.03 Edition. SAS Institute Inc., Cary, N.C., 1988.
6. R. J. Freund, R. C. Littell, and P. C. Spector. SAS Systems for Linear Models . SAS Institute Inc., Cary, N.C., 1986, pp . 101-108.
7. M. J. Poppe, A. E. Radwan, and J. S. Matthias. Some Traffic Parameters for the Evaluation of the Single-Point Diamond Interchange. In Transportation Research Record 1303, TRB, National Research Council, Washington, D.C., 1991, pp. 113-124.
8. R. W. Stokes, C. J. Messer, and V. G. Stover. Saturation Flows
39
of Exclusive Double Left-Turn Lanes. In Transportation Research Record 1091, TRB, National Research Council, Washington, D.C., 1986, pp. 86-95.
9. J. Lee and R. L. Chen. Entering Headway at Signalized Intersections in a Small Metropolitan Area. In Transportation Research Record 1091, TRB, National Research Council, Washington, D.C., 1986, pp. 117-126.
Publication of this paper sponsored by Committee on Highway Capacity and Quality of Service.
•