Embed Size (px)
Citation preview

Study of Early Education and
Development (SEED): Impact Study
on Early Education Use and Child
Outcomes up to Age Three
Research report
July 2017
Edward Melhuish, Julian Gardiner & Stephen Morris
University of Oxford

2
Acknowledgments
The authors wish to thank the families and children in the longitudinal study who gave
their valuable time to contribute to the collection of the data for this report.
We would like to thank the SEED research teams at NatCen Social Research, 4Children
(now Action for Children) and Frontier Economics for their contribution to the project. We
are also grateful to Maura Lantrua, Max Stanford and colleagues at the Department for
Education and to the SEED Advisory Board for comments and advice throughout the
work.

3
Table of Contents
Executive Summary 8
Introduction 8
Method 9
Results 11
Conclusions 15
Chapter 1: Introduction 17
Background 17
Objectives of this report 21
Chapter 2: The SEED longitudinal study: Design and methodology 23
Research objectives 23
Measures 26
Chapter 3: Introducing funded early education from two years old for disadvantaged
families – effects of policy change 30
Key findings 30
Introduction 30
Analytical approaches 32
Results 33
Chapter conclusions 35
Chapter 4: The relationship between early childhood education and care (ECEC) aged
two to three and children’s cognitive and socio-emotional outcomes at age three 37
Key findings 37
Introduction 38
Methods 38
Analysis 39
Results 40

4
Chapter conclusions 51
Chapter 5: The effects of home environment on child outcomes 54
Key findings 54
Introduction 54
Measures 54
Results 55
Chapter conclusions 67
Chapter 6: Discussion and conclusions 69
Aims 69
Results and Discussion 69
Final conclusions 72
References 73

5
List of Tables
Table 1: Summary of the associations between children’s time in early education and
care aged two to three and children’s outcomes at age three. ......................................... 13
Table 2: Summary of the associations between home environment variables and
children’s outcomes at age three. .................................................................................... 14
Table 3: Breakdown of sample by cohort. ........................................................................ 25
Table 4: Breakdown of sample by cohort and disadvantage group. ................................ 25
Table 5: Number of school terms of eligibility for funded early education at two years by
disadvantage group. ........................................................................................................ 26
Table 6: Mean hours/week use of formal early education between age two and age three
(Wave 2). ......................................................................................................................... 31
Table 7: Percentage breakdown of ECEC use by age group and type (10 categories). .. 39
Table 8: Summary of the associations between children’s time (hours per week) in early
education and care aged two to three and children’s outcomes at age three. ................. 40
Table 9: Breakdown of sample by formal group ECEC usage aged two to three and age
at which formal group ECEC usage started. .................................................................... 50
Table 10: Summary of the associations between home environment variables and
children’s outcomes at age three. .................................................................................... 55

6
List of Figures
Figure 1: Association of ECEC and Naming Vocabulary ................................................. 43
Figure 2: Association of ECEC and Emotional Symptoms ............................................... 44
Figure 3: Association of ECEC and Conduct Problems ................................................... 45
Figure 4: Association of ECEC and Peer Problems ......................................................... 46
Figure 5: Association of ECEC and Prosocial Behaviour ................................................. 47
Figure 6: Association of ECEC and Behavioural Self-regulation ...................................... 48
Figure 7: Association of ECEC and Emotional Self-regulation ......................................... 49
Figure 8: Comparing effect sizes for Naming Vocabulary in terms of formal group, formal
individual and informal individual ECEC use aged two to three and home environment
and demographic covariates. ........................................................................................... 57
Figure 9: Comparing effect sizes for Picture Similarities in terms of home environment
and demographic covariates. ........................................................................................... 58
Figure 10: Comparing effect sizes for Hyperactivity in terms of formal group, formal
individual and informal individual ECEC use aged two to three and home environment
and demographic covariates. ........................................................................................... 59
Figure 11: Comparing effect sizes for Emotional Symptoms in terms of formal group,
formal individual and informal individual ECEC use aged two to three and home
environment and demographic covariates. ...................................................................... 60
Figure 12: Comparing effect sizes for Conduct Problems in terms of formal group, formal
individual and informal individual ECEC use aged two to three and home environment
and demographic covariates. ........................................................................................... 61
Figure 13: Comparing effect sizes for Peer Problems in terms of formal group, formal
individual and informal individual ECEC use aged two to three and home environment
and demographic covariates. ........................................................................................... 62
Figure 14: Comparing effect sizes for Prosocial Behaviour in terms of formal group,
formal individual and informal individual ECEC use aged two to three and home
environment and demographic variables. ........................................................................ 63
Figure 15: Comparing effect sizes for Behavioural Self-regulation in terms of formal
group, formal individual and informal individual ECEC use aged two to three and home
environment and demographic variables. ........................................................................ 64

7
Figure 16: Comparing effect sizes for Emotional Self-regulation in terms of formal group,
formal individual and informal individual ECEC use aged two to three and home
environment and demographic variables. ........................................................................ 65
Figure 17: Comparing effect sizes for Co-operation in terms of formal group, formal
individual and informal individual ECEC use aged two to three and home environment
and demographic variables. ............................................................................................. 66

8
Executive Summary
Introduction
Several studies have shown that good quality early years education can have a positive
effect on the educational, cognitive, behavioural and social outcomes of children, in both
the short and long term (Sylva et al., 2010; Melhuish et al., 2015). From September 2010
all three- and four-year-olds in England have been entitled to funded early education for
570 hours per year (commonly taken as 15 hours per week for 38 weeks of the year).
More recently the Government expanded this entitlement to benefit two-year-old children
living in the most disadvantaged households in England. From September 2013, two-
year-old children living in households that were within the 20% most disadvantaged by
household income became eligible for 15 hours of funded early education per week. This
was extended in September 2014 to two-year-old children living in households within the
40% most disadvantaged by household income.
The Study of Early Education and Development (SEED)1 is a major study designed to
help the Department for Education (DfE) provide evidence on the effectiveness of early
years education and to identify any short- and longer-term benefits from this investment.
The study is being undertaken by a consortium including NatCen Social Research, the
University of Oxford, Action for Children and Frontier Economics. This report is part of
SEED, and focuses on the take-up of the early education offer for two-year-olds, and on
exploring how early childhood education and care (ECEC) may be related to children’s
development at age three. SEED aims to study children longitudinally at age two, three,
four, five and seven to seek information on how variation in ECEC experience may be
associated with cognitive and socio-emotional development.
This report addresses two main objectives:
1.To explore the impact of introducing a policy of free early education for disadvantaged
two-year-olds on take-up of early education for two- to three-year-old children, in the year
following the introduction of the policy.
2.To study the associations between the amount of differing types of early childhood
education and care (ECEC) and child development, as well as associations between
child development and aspects of the home environment.
1 Further information about the SEED study and reports published to date are available at http://www.seed.natcen.ac.uk/.

9
Method
Sample
The sample of families with a two-year-old child consisted of three groups varying in their
level of family disadvantage2:
(1) Most disadvantaged group (from the 20% most disadvantaged families);
(2) Moderately disadvantaged group (from the 20-40% most disadvantaged families);
(3) Least disadvantaged (from the 60% least disadvantaged families).
These groups were sampled across six cohorts divided over six consecutive terms
according to date of birth by the school term in which children became eligible for the
two-year-old policy of 15 hours of funded early education per week. Eligibility varied for
the three groups across the cohorts from one to three school terms. This variation was
exploited to investigate how eligibility affected the take-up of early education.
In this report child development at three years of age is analysed for 4,583 children in the
study for whom data were available for both Wave 1 and Wave 2 assessments.
Measures
Further details on the measures used in the study are available in Chapter 2.
ECEC
Children in the Study of Early Education and Development (SEED) may attend any form
of ECEC, although only those settings referred to here as ‘formal’ are eligible for
government funding. Settings classified in this report as ‘group’ based are those which
are non-domestic, whilst those classified as ‘individual’ are in a domestic (e.g. home)
setting. A three-way classification of ECEC was used for this report:
1. Formal group - ECEC in a non-domestic setting and eligible for government
funding (e.g. day nurseries, nursery classes or schools and playgroups)
2. Formal individual - ECEC in a domestic setting and eligible for government
funding (e.g. childminders)
3. Informal individual - ECEC in a domestic setting and not eligible for government
funding (e.g. friends, relatives, neighbours and nannies)
2 More information is available in Chapter 2 and the accompanying Technical Report

10
Child Development
Cognitive development
Cognitive development was measured at a Wave two assessment with the child at age
three.
1. Naming Vocabulary (verbal ability).
2. Picture Similarities (non-verbal ability).
Socio-emotional development
Socio-emotional development was measured through the child’s childcare provider at
Wave two (age three).
1. Prosocial Behaviour (e.g. shares toys, shows empathy)
2. Hyperactivity (e.g. restless, fidgets, easily distracted)
3. Emotional Symptoms (e.g. worries, unhappy, nervous)
4. Conduct Problems (e.g. loses temper, aggressive, takes other children’s things)
5. Peer Problems (e.g. often alone, poor sociability)
6. Behavioural Self-regulation (e.g. thinks before acting, persistent)
7. Emotional Self-regulation (e.g. even mood, not impulsive, calm)
8. Co-operation (e.g. calm, plays easily with others, waits turn).
Home environment measures
Home environment was measured at the Wave 1 assessment when the children were
aged two to three.3
1. Home Learning Environment
2. Household CHAOS
3. Parent’s Psychological Distress score
4. Limit Setting score
5. Parent/child Closeness score
6. Parent/child Conflict score
Demographic measures
Demographics were measured at the Wave 1 assessment when the children were aged
two to three.
1. Child’s sex
2. Child’s ethnic group
3. Child’s birth weight
4. Child’s birth order
5. Maternal age at birth of child
3 The age range was 2.06 to 3.27, with a mean of 2.52.

11
6. Number of siblings living in the same household as child
7. Whether child is living in a couple or lone parent household
8. Whether child is living in a workless or working household
9. Household income
10. Area deprivation (Index of multiple deprivation, IMD)
11. SEED disadvantage group
12. Type of accommodation tenure
13. Mother’s highest academic qualification
14. Highest parental socio-economic status
The analyses do not consider the quality of ECEC, which will be dealt with in a
subsequent SEED report.
Results
The Impact of funded early education on early childhood education and care (ECEC) use
Against a background of a general increase over time in ECEC use by all types of
families with all levels of disadvantage, there was limited evidence of increased use of
funded ECEC for disadvantaged two-year-olds between the ages of two and three years
in response to the introduction of the policy of 15 hours of free early education in the year
following its introduction.
Three possible explanations for these findings are:
1. This evaluation of the use of early education by two-year-olds occurred too soon after
the introduction of the policy. Parents (and services) needed more time to adapt for
any change in use to be evident. This interpretation is supported by census data
which demonstrates that take-up for funded ECEC among eligible families was 58% in
January 2015, increasing to 68% in January 2016, and 71% in January 2017 (DfE,
2017a).
2. Practice differed markedly amongst local authorities. While the analysis did not find
Government Office Regional differences, there may well have been differences at the
sub-regional and local authority level. In some local authorities parents were funded to
receive early education for two-year-olds in advance of the policy introduction;
conversely in some areas parents were unable to take-up funded ECEC due to a lack
of supply. Additionally, it appeared that local authorities varied in the efficiency of their
strategies for informing parents of their eligibility for funded ECEC and hence parents
may not immediately have known of their eligibility. This reflects that it took some time
for local authorities to adjust to the new policy.
3. The results accurately reflect a lack of demand for funded ECEC by parents of two-
year-olds eligible for the policy, and those parents in these most and moderately

12
disadvantaged groups who are inclined to use early education for two-year-olds would
do so regardless of whether it was funded or not.
Are variations in ECEC use associated with variations in child development?
When controlling for home environment and demographic factors, the amount of ECEC
received between ages two and three years was associated with differences in cognitive
and socio-emotional outcomes at age three years (see Table 1). Beneficial outcomes
across all three levels of disadvantage studied suggest that ECEC use has a positive
benefit regardless of a child’s household income disadvantage level. Although, given the
lower starting point among disadvantaged children (Speight et al., 2015), and reduced
likelihood to take up childcare (Speight et al., 2010a) ECEC may be of particular
importance for this group. Positive impacts were observed for both formal and informal
ECEC settings:
Cognitive development in the form of higher verbal ability was associated with use
of both formal (e.g. childminders) and informal (e.g. relatives) individual ECEC.
Socio-emotional development was associated with use of formal ECEC.
Specifically, formal group ECEC (e.g. nurseries, playgroups) was associated with
more Prosocial Behaviour and fewer Emotional Symptoms and Peer Problems,
while formal individual ECEC (e.g. childminders) was associated with fewer
emotional symptoms and more behavioural Self-regulation.
Formal group ECEC use was also associated with poorer socio-emotional
outcomes on Conduct Problems and Emotional Self-regulation. However further
sub-group analysis indicated that poorer outcomes were not identified among
children attending 35 hours or less per week and only present among children with
greater than 35 hours per week of group ECEC use. This was a small group of just
149 children, who made up 3.25% of the sample. Over half of these children
(57%) had started formal group ECEC in their first year, compared with 11% of
children who participated in 35 hours or less per week of group ECEC use. This
combination of particularly high formal group ECEC use aged two to three and an
early start in formal group ECEC may explain these poorer child outcomes at age
three. It should also be noted however that these high formal group ECEC use
children experience lower levels of Peer Problems and Emotional Symptoms than
other children.

13
Table 1: Summary of the associations between children’s time in early education and care aged two
to three and children’s outcomes at age three.
Child outcome
Type of early education and care (ECEC)
Formal ECEC Informal
ECEC
Group Childminders Friends,
relatives and
nannies
Cognitive development Naming Vocabulary (verbal) + + Picture Similarities (non-verbal) Socio-emotional problems Hyperactivity Emotional Symptoms + + Conduct Problems –‡ –‡ Peer Problems + Socio-emotional strengths Prosocial Behaviour + Behavioural Self-regulation + Emotional Self-regulation –‡ Co-operation
Sample size = 4,583 + indicates a beneficial association between time in ECEC and an outcome (i.e. higher cognitive score; more favourable socio-emotional outcomes). – indicates a detrimental association between time in ECEC and an outcome (i.e. lower cognitive score; less favourable socio-emotional outcomes). Where a cell is empty (blank) there was no statistically significant association. ‡ In later subgroup analysis, these negative associations were found to be significant only for children with
high formal group ECEC use classed as greater than 35 hours per week in term time (3.25% of the
sample).
Are variations in the home environment associated with variations in child development?
Several cognitive and socio-emotional outcomes at age three were associated with
variations in the home environment when controlling for demographic factors and type of
ECEC use, (see Table 2):
A higher Home Learning Environment (HLE) score was associated with higher
verbal and non-verbal ability and better outcomes for Prosocial Behaviour and
Behavioural Self-regulation measures.
More household disorder (CHAOS scale) was associated with less Prosocial
Behaviour and Co-operation.
Higher parent Psychological Distress was associated with poorer verbal ability and
higher levels of Emotional Symptoms.
A higher Limit Setting score was associated with higher verbal and non-verbal
ability and with fewer Emotional Symptoms and Peer Problems and better

14
Prosocial Behaviour and Behavioural Self-regulation, although was also
associated with higher Conduct Problems.
Higher Parent/child Closeness was associated with higher verbal ability, and more
Prosocial Behaviour as well as lower Hyperactivity and Peer Problems scores.
Higher Parent/child Conflict was associated with lower verbal ability, in addition to
higher levels of Hyperactivity, Peer Problems and Conduct problems as well as
less Emotional Self-regulation.
Table 2: Summary of the associations between home environment variables and children’s
outcomes at age three.
Child outcome
Home environment variables
Home
Learning
Environm
ent
Househ
old
CHAOS
Parent's
psycho-
logical
distress
Limit
Setting
scale
Parent/
child
Closene
ss
Parent/
child
Conflict
Cognitive development Naming Vocabulary
(verbal) + – + + –
Picture Similarities
(nonverbal) + +
Socio-emotional problems Hyperactivity + – Emotional Symptoms – + Conduct Problems – – Peer Problems + + – Socio-emotional strengths Prosocial Behaviour + – + + Behavioural Self-
regulation + +
Emotional Self-
regulation –
Co-operation –
Sample size = 4,583
+ indicates a beneficial association between a home environment variable and an outcome (i.e. higher
cognitive score; more favourable socio-emotional outcomes)
– indicates a detrimental association between a home environment variable and an outcome (i.e. lower
cognitive score; less favourable socio-emotional outcomes)
Where a cell is empty (blank) there was no statistically significant association.
Interactions between ECEC and HLE
Similar sized effects were observed across ECEC and home environment factors
suggesting a similar level of association between these factors and child outcomes.
Analysis also found that the beneficial effects of ECEC use and of a rich Home Learning
Environment (HLE) are largely independent of each other. A positive association
between formal individual ECEC (childminders) use and non-verbal ability (Picture

15
Similarities) was only found for children with low HLE scores. In all other cases there was
no interaction between the effects of ECEC use and those of HLE scores. This indicates
that, in most instances, even children having very rich home environments still stand to
benefit from spending time in ECEC.
Conclusions
Overall, the results within the SEED sample did not offer clear evidence of the
introduction of the policy of free early education for disadvantaged two-year-olds affecting
the take-up of early education by the intended families in the year following its
introduction. However, subsequent census data from later years (DfE, 2017a) has
demonstrated that take-up did increase after a lag. This would indicate that a longer-term
perspective of the effects of policy is warranted.
This study found that individual ECEC use, whether formal ECEC with childminders or
informal ECEC with friends, relatives, neighbours and nannies, was associated with
cognitive language development at age three. In addition, individual formal ECEC use
was associated with improvements in the socio-emotional measures of Emotional
Symptoms and Behavioural Self-regulation.
Formal group ECEC use with day nurseries, nursery classes or schools and playgroups
was also associated with benefits for several aspects of socio-emotional development,
with fewer Emotional Symptoms, more Prosocial Behaviour and fewer Peer Problems.
These results correspond in part with previous research4 that has frequently found
beneficial effects associated with more time in formal group ECEC for aspects of socio-
emotional development, such as Peer Problems, Prosocial Behaviour and Self-
regulation.
Associations between ECEC and child development were identified across all of the
SEED sample, suggesting that use of ECEC has a positive benefit on cognitive and
socio-emotional outcomes at age three regardless of a child’s family disadvantage level.
The study also found that several cognitive and socio-emotional outcomes at age three
were significantly associated with variations in the home environment, including the
quality of the parent/child relationship. It found that that the advantages of a rich Home
Learning Environment and the beneficial effects of time in ECEC are largely independent,
suggesting that even children with the most positive home learning environments still
stand to benefit from spending time in ECEC.
4 This research is reviewed comprehensively in Melhuish et al. (2015).

16
It remains to be seen whether and how associations with child development of ECEC use
and the home environment change over time. These issues will be considered in later
reports using data collected as part of the longitudinal studying of the children from the
Study of Early Education and Development (SEED).

17
Chapter 1: Introduction
Background
Internationally, the number of children attending non-parental childcare and education
services before school entry has been increasing since the 1960s, and in developed
countries some preschool education or care is the norm for most children.
‘Today’s rising generation in the countries of the OECD is the first in which a majority are
spending a large part of their early childhoods not in their own families but in some form
of childcare’ (UNICEF Innocenti Research Centre, 2008:3).
The terms ‘day care’, ‘child care’ and ‘early childhood education and care’ (ECEC) have
all been used to refer to non-parental childcare and early education occurring before
school. This includes relatives, childminders, and group or centre-based childcare and
early education. The Organisation for Economic Co-operation and Development (OECD)
and the European Commission have adopted the term ‘early childhood education and
care’ (ECEC) in their publications to encompass all these forms of childcare and early
education. Sometimes ECEC has an explicit educational component (e.g., nursery
schools) and sometimes not. However, in that all experience can potentially be
educational, this distinction is not clear-cut.
ECEC has the potential to benefit families as well as children. It can enable parents to
work, re-enter the labour market, undergo training to improve employability and work
more hours. Thus, it can play a role in improving family income, reducing welfare
dependency and poverty, and improving social mobility for families – and later for the
children themselves. Also, ECEC provision may have implications for fertility rates and is
embedded in a broader context of educational and family policies (e.g., European
Commission, Directorate-general for Education, Youth, Sport and Culture, 2014). Rates
and type of ECEC use, and the content and quality of ECEC differ by child age and
socio-political context. For instance, on average across OECD countries, 67 per cent of
three-year-olds, and 94 per cent of five-year-olds were enrolled in paid ECEC of some
form in 2011 (see www.oecd.org). In England in 2016, over 95 per cent of three- and
four-year-olds received some government-funded ECEC (DfE, 2016). For children under
three years of age, amongst OECD countries, ECEC use varies greatly, from ten per cent
and lower in some countries (e.g., Czech Republic and Poland) to around 60 per cent in
Scandinavian countries, with the OECD average being 33 per cent (OECD 2016).
ECEC and child development
A great deal is already known about the benefits of early years education in terms of
benefits for educational, cognitive, behavioural and social outcomes of children, both in
the short and long term (e.g., Melhuish, 2004; Smith et al., 2009; Sylva et al., 2004,
2010). There is good evidence that early education has a considerable influence on

18
school readiness, long-term school attainment and lifelong outcomes. Early education
can have the greatest impact on children from disadvantaged families and is crucial in
narrowing the gap in development and attainment between groups of children. Attending
high quality early years education helps prepare young children to be ‘school ready’ and
more able to learn when they start school (Becker, 2011), which is important as a
foundation for a successful educational career and long-term life outcomes. However,
children from disadvantaged families are less likely to attend early years settings
(Speight et al., 2010a), even for provision that is funded by the Government (Speight et
al., 2010b).
Child development is affected by the whole range of children’s experiences, particularly
in the early years, and ECEC constitutes a substantial part of young children’s
experiences. Also, as children enter school, experiences in the ECEC environment will
influence longer-term outcomes (e.g., Sylva et al., 2010). Not only do ECEC experiences
play an important role in promoting child well-being, but some background factors are
also important. The relevant factors do not function alone, but interact with each other.
Hence the potential effects of ECEC experience may be partly moderated by family
factors, such as disadvantage and parenting.
Early childhood education and care (ECEC) has been used as an intervention strategy to
improve the lives and development of specific groups, particularly children living in
disadvantaged households. Children from disadvantaged/impoverished family
backgrounds often experience particular difficulties at school. They enter school with
fewer academic skills than their more advantaged peers, and they often lag behind in
their cognitive development during the later school years (Stipek & Ryan, 1997; Sylva et
al., 2012). More than 40 years of research have shown that good quality preschool
experiences benefit children from impoverished environments and help prepare them for
school entry (see, for example, reviews by Barnett, 1995; Brooks-Gunn, 2003; Heckman,
2006; Melhuish, 2004; Yoshikawa at al, 2013).
For children from disadvantaged home backgrounds, the evidence on ECEC in the first
three years indicates that high-quality ECEC can produce benefits for cognitive, language
and social development (e.g., Ramey et al., 2000). With regard to provision for three
years onwards, disadvantaged children benefit particularly from high-quality early
education provision (e.g., Muennig, Schweinhart, Montie, Neidell, 2009; Reynolds et al.,
2011). Also children benefit more in socially mixed groups rather than in homogeneously
disadvantaged groups (Melhuish et al., 2008a). Some interventions have shown
improvements in cognitive development, but such benefits may not persist throughout
children’s school careers. This may be because subsequent poor school experiences for
disadvantaged children overcome earlier benefits from high-quality ECEC experience
(Barnett, 1995; Karoly et al., 1998).
ECEC interventions also boost children’s confidence and social skills, which provides a
better foundation for success at school (and subsequently in the workplace). Reviews of

19
the research often infer that it is the social skills and higher motivation that lead to lower
levels of special education and school failure, and higher educational achievement in
children exposed to early childhood development programmes (e.g., Oden et al., 1996).
However there is clear evidence that cognitive, language and academic skills can also be
enhanced by ECEC experience (e.g., Lee, Brooks-Gunn, and Schnur 1988) and these
are likely to play a role in the later educational, social and economic success that is often
found for well-implemented ECEC interventions. Studies into adulthood have indicated
that this educational success is likely to be followed by increased success in
employment, social integration and sometimes reduced criminality (e.g., Barnett, 2011;
Muennig, Schweinhart, Montie, and Neidell, 2009). The greatest improvements appear to
occur for problems that are endemic for particular disadvantaged groups, where there is
greatest opportunity for improvement, e.g., behaviour problems, criminality and lack of
educational achievement.
For children from the general population, the evidence on ECEC in the first three years
indicates that high-quality ECEC benefits children’s cognitive, language and social
development in both the short- and long-term (Melhuish et al., 1990, NICHD, 2000).
There has been some evidence that high levels of childcare, particularly group care in the
first two years, may elevate the risk for developing antisocial behaviour (Belsky, et al.,
2007; Eryigit-Madzwamuse & Barnes, 2013). However subsequent research indicates
that this may be related to high levels of poor quality care, particularly in group care and
in the first two years (Melhuish et al., 2015).
For provision for three years onwards, the evidence is consistent that preschool provision
is beneficial to educational and social development for the whole population (e.g., Sylva
et al., 2010). An example of the multi-national nature of positive ECEC effects is provided
by an OECD (2011) report on PISA results, reporting that 15-year-olds who had attended
some pre-primary education outperformed students who had not by about a year of
achievement. Studies have indicated that the benefits are greater for high-quality
provision. Some evidence showed that part-time provision produced equivalent effects to
full-time provision for the general population (Sylva et al., 2004). Also there is evidence
that a starting age from two years of age onwards was most effective for preschool
education (Sammons et al., 2002).
Recent UK policy and ECEC
Since the late 1990s, policy for early childhood education and care (ECEC) in the UK has
developed rapidly. Following the evidence from the Effective Pre-school, Primary and
Secondary Education (EPPSE) study of the positive effects of ECEC upon children’s
development (Sylva et al., 2004), the government implemented policies to provide a free
part-time early education place (12.5 hours per week for 38 weeks of the year) for every
child from their third birthday until the start of school; this policy came into effect in 2004.
From September 2010 all three- and four-year-olds in the England have been entitled to
funded early education for 570 hours per year (commonly taken as 15 hours per week for

20
38 weeks of the year). This was followed up in 2013 with an extension of this offer to
children from two years of age for the 20% most income disadvantaged, and to the 40%
most income disadvantaged from 2014. This measure was taken to increase the life
chances of children from disadvantaged families following EPPSE evidence (Sammons
et al., 2002; Sylva et al., 2010) that ECEC could be beneficial from two years of age
upwards. These policy changes have been motivated by the desire to improve early child
development and school readiness and to enable and encourage parents to undertake
paid employment. These developments have been underpinned by measures to raise the
quality and availability of provision to provide support for the development of the quality
of the workforce. Financial support for early education has included reimbursement of
early education expenses in tax credits and childcare vouchers (to be replaced by Tax
Free Childcare in 2017).
There is a forthcoming extension of free provision, ‘30 hours free childcare’, for three-
and four-year-old children from 15 to 30 hours each week (for 38 weeks of the year) for
working parents in September 2017.5
It should be noted that SEED commenced before the Childcare Act 2016 and was not
designed to study the forthcoming 30 hours free childcare policy. When this policy is
introduced in September 2017 the children within the SEED sample will be of school age
and therefore ineligible for 30 hours free childcare. As such, the impact of 30 hours of
free childcare policy will not be directly addressed by this report.
Study of Early Education and Development (SEED)
The Study of Early Education and Development (SEED), is a major eight year study
commissioned by the Department for Education to explore how early education can give
children the best start in life and the factors that are important for the delivery of high
quality provision.6 The study is being undertaken by a consortium including NatCen
Social Research, the University of Oxford, Action for Children and Frontier Economics.
The aim of SEED overall is to provide a robust evidence base to inform policy
development to improve children’s readiness for school by:
Giving evidence of the potential impact of current early years provision on
children’s outcomes and providing a basis for the longitudinal assessment of any
impact on later attainment.
Assessing the role and influence of the quality of early childhood education and
care (ECEC) provision on children’s outcomes.
5 For further information please see the Childcare Act, 2016, available at: http://www.legislation.gov.uk/ukpga/2016/5/enacted 6 Further information about the SEED study and reports published to date are available at http://www.seed.natcen.ac.uk/.

21
Assessing the overall value for money of early childhood education and care
(ECEC) and the relative value for money associated with different types of early
childhood education and care (e.g., private, voluntary, local authority) and the
quality of ECEC provision.
Exploring how the Home Learning Environment may interact with early education
use (age two-to three years) in affecting children’s outcomes.
To address these aims, SEED has several inter-related research strands:
A longitudinal survey that initially included 5,642 families with preschool children
from the age of two years to the end of Key Stage 1 (age 7 years).
Around 1,000 visits to early years group settings and to around 100 childminders
to study the quality, characteristics and process of provision.
Case studies of good practice in early years settings.
A value for money study involving the collection of cost data from 166 early years
settings.
Qualitative studies of childminders and of early education provision for children
with special educational needs and/or disabilities (SEND).
A study of experiences of the Early Years Pupil Premium (EYPP).
Objectives of this report
This report is the first output from the longitudinal study, and has two main objectives:
1. To explore the impact of introducing a policy of free early education for
disadvantaged two-year-olds on take-up of early education, between two and
three years of age, in the year following introduction of the policy.
2. To study the associations between the amount of differing types of early childhood
education and care (ECEC) and child development, as well as associations with
aspects of parenting.
The remainder of this report is structured in the following way:
Chapter 2 deals with the research design and methodology of the longitudinal
study.
Chapter 3 deals with analyses that attempted to answer the question “Was there
any change in the take-up of early education by families with a two-year-old, as an
immediate consequence of the policy change?”
Chapter 4 deals with analyses of possible associations between the use of early
childhood education and care (ECEC) from two to three years of age and child
cognitive and socio-emotional outcomes at age three years, having controlled for a
range of demographic, parenting and home environment variables.
Chapter 5 uses analyses described in chapter 4 to examine the associations of
parenting and home environment with child cognitive and socio-emotional
outcomes at age three years.

22
Chapter 6 draws the findings of the report together and discusses the results in
relation to other UK and international research.

23
Chapter 2: The SEED longitudinal study: Design and
methodology
This section describes the main elements of the SEED longitudinal study design
including details on the sample used within this report. A more detailed account of the
methods is given in the Technical Report accompanying this report. This study within
SEED uses a longitudinal, multi-cohort, sample survey research design. The design is
pragmatic, in that several different objectives need to be achieved and some practical
constraints affect the timing of sample selection and the sample size.
Research objectives
The design of the SEED longitudinal study was complex as it was required to meet two
separate objectives:
1. To provide a sample capable of exploring the impact on take-up of early education of
the introduction of the policy of free early education for disadvantaged two-year-olds, in
the year following the introduction of the policy.
2. To provide a sample of sufficient size to enable the study of factors affecting
development and behaviour during the early years among a representative sample of
children. The focus was on effects of early childhood education and care (ECEC), in
particular ECEC between two and three years of age, on cognitive and socio-emotional
development. Other factors involved were parenting including the Home Learning
Environment, household disorder, parental distress, parent/child relationship and parental
limit setting, as well as family demographics.
The quality of childcare settings is also being measured as part of SEED however
findings are due to be reported in a subsequent SEED report.
Sample selection
A three-stage clustered sample design was implemented for this study, with sample
members selected from Child Benefit records (Speight et al. 2015). In the first stage
postcode districts were designated primary sampling units (PSUs). As the second stage
groups of postal sectors were identified within each PSU and designated Secondary
Sampling Units (SSUs). Finally, eligible families with children of the relevant age were
selected for interview within each SSU. This approach was adopted in order to generate
a highly clustered sample of children and also a sample of childcare settings within the
SSUs that the sampled children were likely to use.
24
The sample was selected so that children were chosen from three groups varying in level
of disadvantage to match as close as possible the policy eligibility criteria:
1. Most disadvantaged 20% who had a parent in receipt of one of:7
Income-based Jobseeker’s Allowance (JSA-IB);
Income-related Employment Support Allowance (ESA-IR);
Income Support (IS);
Guaranteed element of the State Pension Credit (PC with Guarantee Credit);
Child Tax Credit only (not in receipt of an accompanying Working Tax Credit award) with household gross earnings of less than £16,190.
2. Moderately disadvantaged 20-40% who had a parent in receipt of Working Tax Credits with household gross earnings of less than £16,190.8
3. Least disadvantaged 60% who had parents not in receipt of any of the qualifying
benefits or tax credits.
Longitudinal study
Information was/will be collected from families at four time periods:
Wave 1 (baseline) when the target child is about two years old
Wave 2 when the child is about three years old
Wave 3 when the child is about four years old
Wave 4 when the child is about five years old
In total, 5,642 families were seen in the baseline survey. The sample for the analyses in
this report consists of 4,583 of these families, for whom data were available from both
Wave 1 and Wave 2. Some degree of family dropout from follow-up assessments in this
type of longitudinal research is to be expected, and the follow-up rate of 81% would be
considered acceptable.
7 From September 2013, the eligibility criteria included two-year-olds who met any one of the following criteria: (i) All two-year-olds who are looked after by their local authority; (ii) Two-year-olds whose family receives one of the following are also eligible: income support; income-based Jobseeker’s Allowance (JSA); income-related Employment and Support Allowance (ESA); support through part 6 of the Immigration and Asylum Act; the guaranteed element of State Pension Credit; Child Tax Credit (but not Working Tax Credit) and have an annual income not over £16,190; the Working Tax Credit 4-week run on (the payment received when claimants stop qualifying for Working Tax Credit) or Universal Credit. 8 From September 2014, the eligibility criteria included two-year-olds who met any one of the following criteria:; if their families receive Working Tax credits and have annual gross earnings of no more than £16,190 per year; if they have a current statement of special educational needs (SEN) or an education, health and care plan; if they attract Disability Living Allowance; if they are looked after by their local authority; or if they have left care through special guardianship or through an adoption or child arrangements order. To note these eligibility criteria were also used for free school meals.

25
Cohort and disadvantage groups
The sample consists of six cohorts divided according to date of birth by the school term in
which children became eligible for funded early education from two to three years of age
(see Table 3).
Table 3: Breakdown of sample by cohort.
Cohort Dates of birth N %
1 Sep-Dec 2010 803 17.5%
2 Jan-Mar 2011 814 17.8%
3 Apr-Aug 2011 784 17.1%
4 Sep-Dec 2011 815 17.8%
5 Jan-Mar 2012 727 15.9%
6 Apr-Aug 2012 640 14.0%
Total 4583 100.0%
These six cohorts can be considered in terms of level of disadvantage as in Table 4.
Table 4: Breakdown of sample by cohort and disadvantage group.
Cohort Dates of
birth
Disadvantage group
Total 20% Most
disadvantaged
>20-40% Moderately
disadvantaged
60% Least
disadvantaged
1 Sep-Dec
2010 170 (21.2%) 304 (37.9%) 329 (41.0%) 803
2 Jan-Mar
2011 186 (22.9%) 297 (36.5%) 331 (40.7%) 814
3 Apr-Aug
2011 179 (22.8%) 307 (39.2%) 298 (38.0%) 784
4 Sep-Dec
2011 247 (30.3%) 277 (34.0%) 291 (35.7%) 815
5 Jan-Mar
2012 220 (30.3%) 241 (33.1%) 266 (36.6%) 727
6 Apr-Aug
2012 208 (32.5%) 199 (31.1%) 233 (36.4%) 640
Total 1210 (26.4%) 1625 (35.5%) 1748 (38.1%) 4583
Eligibility for funded early education
Eligibility for funded early education changed as the new policy was rolled out. The
government funding of 15 hours per week of early education over the 38 annual weeks of
the school terms for children aged two to three years of age was initially available in
September 2013 for the most disadvantaged, and in September 2014 for the moderately
disadvantaged. This gives variation in the number of terms that the provision was
available for the different disadvantage groups, shown in Table 5.

26
Table 5: Number of school terms of eligibility for funded early education at two years by
disadvantage group.
Cohort Dates of birth Eligibility for funded early education by group
1. 20% Most
disadvantaged
2. >20-40%
Moderately
disadvantaged
3. 60% Least
disadvantaged
1 Sep-Dec 2010 1 term None None
2 Jan-Mar 2011 2 terms None None
3 Apr-Aug 2011 3 terms None None
4 Sep-Dec 2011 3 terms 1 term None
5 Jan-Mar 2012 3 terms 2 terms None
6 Apr-Aug 2012 3 terms 3 terms None
ECEC use
Early childhood education and care (ECEC) in England is of various types including:
1. Childminder
2. Nursery school
3. Nursery class attached to a primary/infant school
4. Private day nursery
5. Local Authority day nursery
6. Pre-school or playgroup
7. SEN day school, nursery or unit.
8. Relative, friend or neighbour
9. Nanny or au pair
10. Other early education
Children in the Study of Early Education and Development (SEED) may attend any form
of ECEC, although only the first seven are eligible for government funding.
A three-way classification of ECEC was used for this report:
1. “Formal group” ECEC with day nurseries, nursery classes or schools and
playgroups that is eligible for government funding.
2. “Formal individual” ECEC with childminders that is eligible for government funding.
3. “Informal individual” ECEC with friends, relatives, neighbours and nannies that is
not eligible for government funding.
Measures
The Wave 1 and 2 surveys when the children were two and three years of age collected
information on a range of family and child measures.

27
Home Environment Measures
These measures were assessed at the Wave 1 interview carried out with parents when
the children were aged two and three.9
1. Home Learning Environment (HLE) index (i.e. home activities that allow learning
opportunities for the child; e.g., child read to, taken to library, painting/drawing,
play with letters/numbers, songs/rhymes; Melhuish et al. 2001; 2008a)
2. Household Disorder (CHAOS scale including confusion, hubbub and disorder
scale), adapted from Matheny et al. 1995 by NESS (2005) and Melhuish et al.
(2008b)
3. Parent’s Psychological Distress (using the Kessler scale)
4. Limit Setting (i.e. how often parents set limits when a child is naughty)
5. Parent/child Closeness (i.e. affectionate bond, child seeks comfort, child shares
feelings), adapted from Pianta 2001 by NESS (2005) and Melhuish et al. (2008b)
6. Parent/child Conflict (i.e. parent-child struggles, child easily angry with parent),
adapted from Pianta 2001 by NESS (2005) and Melhuish et al. (2008b)
Demographic Measures
These measures were also assessed at the Wave 1 interview carried out with parents
when the children were aged two and three.
1. Child’s gender
2. Child’s ethnic group
3. Child’s birth weight
4. Child’s birth order
5. Maternal age at birth of child
6. Number of siblings living in the same household as child
7. Whether child is living in a couple or lone parent household
8. Whether child is living in a workless or working household
9. Household income
10. Area Deprivation (Index of multiple deprivation, IMD)
11. SEED disadvantage group
12. Type of accommodation tenure
13. Mother’s highest academic qualification
14. Highest parental socio-economic status
9 The age range was 2.06 to 3.27, with a mean of 2.52.

28
Child development
Child development was measured at age three (Wave 2). Aspects of cognitive
development and socio-emotional development were chosen based on validity of
measurement, their use in similar studies of this kind)10 and potential importance for
longer-term outcomes.
Cognitive development
British Ability Scales (BAS) (standardised child assessment, age adjusted) (Elliot,
Smith, & McCulloch, 2011)
1. Naming Vocabulary (verbal ability).
2. Picture Similarities (non-verbal ability).
Socio-emotional development
When children were aged over three years old, and hence when all the sample were
eligible for free early education, a socio-emotional assessment was carried out by an
ECEC provider. This consisted of eight socio-emotional measures which could be used
as child outcome variables; five from the Strength and Difficulties Questionnaire (SDQ)
and three additional, related scales.
The SDQ provides measures of four negative aspects of socio-emotional development
and one measure of a positive aspect of socio-emotional development. To balance the
measures, three extra scales of positive aspects of socio-emotional development were
added. This strategy was followed by the Millennium Cohort study (2010) and the
National Evaluation of Sure Start (Melhuish et al., 2008). The eight socio-emotional
measures were:
Strengths and Difficulties Questionnaire (SDQ, Goodman 1997) (reported by
ECEC provider)11
1. Prosocial Behaviour (e.g., includes child sharing, showing empathy)
2. Hyperactivity Scale (e.g., restless, fidgets, easily distracted)
3. Emotional Symptoms (e.g., worries, unhappy, nervous)
4. Conduct Problems (e.g., loses temper, aggressive, takes other children’s
things)
5. Peer Problems (e.g., often alone, poor sociability)
Additional items (NESS, 2005) (reported by ECEC provider)
10 For example, the Effective Pre-school, Primary and Secondary Education (EPPSE) study (Sylva et al., 2004), Millennium Cohort Study, 2010; the National Evaluation of Sure Start (Melhuish et al., 2008). 11 Analysis for parent reported socio-emotional outcomes is presented in the appendix of the Technical Report

29
6. Behavioural Self-regulation (e.g., thinks before acting, persistent, chooses
own activities)
7. Emotional Self-regulation (e.g., even mood, not impulsive, calm)
8. Co-operation (e.g., calm, plays easily with others, waits turn)

30
Chapter 3: Introducing funded early education from
two years old for disadvantaged families – effects of
policy change
Key findings
In the year immediately following the introduction of funded early education for the
20% most disadvantaged two-year-olds and for the 20% to 40% moderately
disadvantaged there was no clear evidence of an increase in the take-up of early
education in these disadvantaged groups. There is therefore no strong evidence of
the effect of the policy on take-up in the first year following its introduction.
There was an indication of some increase in the take-up of early education for the
cohort of the moderately disadvantaged group who were eligible for three terms of
funded early education as compared with the cohort eligible for two terms of
funded early education. This increase was 4.7 hours per week.
The absence of clear evidence of an increase in the use of early education in the
first year after the introduction of funded childcare for disadvantaged two-year-olds
may indicate that local authorities and families needed time to adjust to the new
policy. Subsequent census data from later years (DfE, 2017a) indicate that there is
now an increased use of early education for eligible two-year-olds. It is worth
noting that other studies have also found that it can take several years for the
effect of a policy change to be evident.
Introduction
This chapter provides an overview of findings from an analysis of the effects of two policy
changes on take-up of ECEC. Prior to these changes, funded support was available
universally from the term after a child’s third birthday.
1. From September 2013 funding became available for 15 hours per week of ECEC
for two year old children from the 20% ‘most disadvantaged’ families.12
12 From September 2013, the eligibility criteria included two-year-olds who met any one of the following
criteria: (i) All two-year-olds who are looked after by their local authority; (ii) Two-year-olds whose family receives one of the following are also eligible: income support; income-based Jobseeker’s Allowance (JSA); income-related Employment and Support Allowance (ESA); support through part 6 of the Immigration and Asylum Act; the guaranteed element of State Pension Credit; Child Tax Credit (but not Working Tax Credit) and have an annual income not over £16,190; the Working Tax Credit 4-week run on (the payment received when claimants stop qualifying for Working Tax Credit) or Universal Credit.

31
2. From September 2014 the funded support for 15 hours of early education from the
term after a child turned two was extended to families from the 20% to 40%
‘moderately disadvantaged’ families.13
Details on these groups can be found in Chapter 2.
The analyses in this chapter consider the effect of these policy changes, focussing on the
impact of eligibility for funded childcare from age two on ECEC use between age two and
the term after their third birthday, captured in the Wave 2 survey.
Changes in early childhood education and care (ECEC) use over time
Mean weekly ECEC use broken down by cohort and disadvantage group is shown in
Table 6.
Table 6: Mean hours/week use of formal early education between age two and age three (Wave 2).
Cohort Date of birth
Disadvantage group
All children 1. Most
disadvantaged
2. Moderately
disadvantaged
3. Least
disadvantaged
1 Sep-Dec 2010 8.7 11.9 12.3 11.4
2 Jan-Mar 2011 8.7 10.4 11.5 10.5
3 Apr-Aug 2011 11.5 12.8 13.3 12.7
4 Sep-Dec 2011 11.0 12.7 14.5 12.8
5 Jan-Mar 2012 10.7 11.5 13.6 12.0
6 Apr-Aug 2012 12.5 14.5 15.7 14.3
All cohorts 10.6 12.2 13.4 12.2
Sample size = 4,583
The mean weekly usage of ECEC between age two and the Wave 2 survey at age three
tended to increase from the earlier to the later birth cohorts. This applies even in the
‘least disadvantaged’ group for whom there was no change in funding eligibility between
cohorts. It was therefore necessary to ensure that the analyses could separate those
changes in ECEC use that could be attributed to the policy change from those that would
have occurred in any case as the use of ECEC increased over time.
13 From September 2014, the eligibility criteria included two-year-olds who met any one of the following criteria:; if their families receive Working Tax credits and have annual gross earnings of no more than £16,190 per year; if they have a current statement of special educational needs (SEN) or an education, health and care plan; if they attract Disability Living Allowance; if they are looked after by their local authority; or if they have left care through special guardianship or through an adoption or child arrangements order. To note this eligibility criteria was also used for free school meals.

32
Analytical approaches
Assessing the effects of changing the eligibility for funded early education is complex.
This is partly due to the policy changes being introduced across England at two points in
time, affecting eligibility for support for the most disadvantaged at the first time point
(September 2013) and the moderately disadvantaged at the second (September 2014).
The implementation of the policy changes was not piloted or staggered, leaving little
scope for identifying a contemporaneous control or comparison group. The analyses in
this chapter addressed the effect of the policy change in three different ways. Further
details of these analysis methods are given in the Technical Report.
In all cases, the outcome analysed was ‘formal’ ECEC use, i.e. ECEC which was eligible
for government funding (i.e. group ECEC and ECEC with childminders). Analyses for all
ECEC, additionally including childcare with friends, relatives, neighbours and nannies,
were also performed as this might also be affected by change in use of funded ECEC.
These results are given in the Technical Report.
Discontinuity analysis
Children were divided into six cohorts, defined by their date of birth. When the two policy
changes were introduced, children’s eligibility for funding depended on the cohort to
which they belonged. In those cases where a cohort boundary corresponded to a change
in eligibility for funded ECEC, the analysis was able to assess the impact of the policy
change by comparing the use of ECEC between children born immediately before and
immediately after the cohort boundary. Therefore, the discontinuity analysis compared
children with different eligibility but who were born within a short period of time. Because
they were born close in time it is reasonable to assume other factors that might affect
ECEC use are equivalent.
Given the timing of the policy changes and the sample data available, this discontinuity
analysis compared:
For the most disadvantaged group: Take-up of early education between those
eligible for two terms versus one term of use and for those eligible for three
versus two terms of use.
For the moderately disadvantaged group: Take-up of early education between
those eligible for one term of use versus no use; those eligible for two terms
versus one term of use; and for those eligible for three versus two terms of use.
Multiple regression modelling
In this method, ECEC use was analysed in terms of the number of terms of funded
childcare for which children are eligible. This approach used three models to demonstrate
the possible contribution of pre-existing differences to ECEC use in addition to the

33
contribution of eligibility for funded early education:
1. A model of ECEC use for the number of terms of eligibility for funding (univariate linear
regression).
2. A regression model controlling for disadvantage group and other demographic
measures (multivariate regression).
3. A regression model additionally controlling for the linear trend in ECEC use over time
(multivariate regression).14
Difference-in-differences analysis
The difference-in-differences analysis makes use of comparison between a group in
which a change in eligibility has occurred and a second group in which there has been no
change in eligibility. Specifically, the change in ECEC use between the third and sixth
cohorts was compared for the moderately disadvantaged and the most disadvantaged
groups. In the moderately disadvantaged group eligibility changed between the third and
sixth cohorts from ‘no eligibility’ to ‘three terms’ whilst in the most disadvantaged group
eligibility was the same for the two cohorts (‘three terms’ in both cases). This method
controlled for those changes in ECEC use occurring over time regardless of changes of
eligibility, although it does depend on the assumption that these changes were the same
in the most and moderately disadvantaged groups.
Results
Below is a summary of the results for the three different analytical approaches. Detailed
findings can be found in the Technical Report.
Discontinuity analysis
The results of the discontinuity analysis are presented for two measures of take-up and
use of ECEC:
Hours per week of formal ECEC use between child’s second birthday and the
Wave 2 survey, occurring in the term after their third birthday.
Percentage take-up of any formal ECEC between the second birthday and the
Wave 2 survey.
For the first of these, four of the five comparisons did not have a statistically significant
association. However, moderately disadvantaged children who were eligible for three as
opposed to two terms of support showed an association, with an increase of 4.7 hours of
14 Linear trend over time was modelled separately for each disadvantage group, avoiding the assumption required by the difference in differences method that the same time-trends apply in different disadvantage groups.

34
ECEC use per week. For the second, there were no statistically significant differences in
percentage take-up.
Tentatively, the positive effects found for being eligible for three terms of support relative
to two terms, may reveal a genuine increase in usage resulting from the policy change,
but only for the moderately disadvantaged group. However, if this effect is real, it may be
too modest to be substantively important.
Multiple regression analysis
Below gives a summary of results obtained from three regression models:
1. A model of the relationship between eligibility and take-up (univariate regression)
2. A model controlling for demographic measures (multiple regression)
3. A model controlling for demographic measures and linear trend in ECEC use over
time (multiple regression)
Two outcomes were considered:
Does eligibility affect amount of ECEC use?
Analysing the mean weekly usage of formal ECEC aged two to three and controlling for
other factors which might influence the amount of ECEC use including household
income, disadvantage group, other demographic factors and the trend in early education
usage over time, there was no association between the level of eligibility and formal
ECEC use.15
Does eligibility affect using any ECEC versus none?
The results are parallel to those shown above. Analysing the use of any formal ECEC
aged two to three, versus none and controlling for other factors which might influence the
amount of ECEC use including household income, disadvantage group, other
demographic factors and the trend in early education usage over time, there was no
association between the level of eligibility and the use of any formal ECEC.
Regional and Deprivation Variation
In order to have adequate sample sizes for analysis of regional variation, data was
grouped by English Government Office Region, as smaller geographical units would have
meant group sizes were too small for reliable analysis. There was no association
15 Note, however, that both the number of terms of eligibility and the trend in early education use were changing the early education outcome in the same direction. Because of this association it is not possible to separate these two effects completely. It is possible that some of the upward trend in early education use in the most disadvantaged and moderately disadvantaged groups is due to the effect of the policy. However, this cannot be confirmed.

35
between the effect of number of terms of eligibility and region. This leads to the
conclusion that there was no clear evidence of differential take-up at the regional level.
Analysis also showed there was no evidence for differential take-up by area deprivation
in analyses using the Index of Multiple Deprivation (IMD).
Difference-in-differences approach
The difference-in-difference analysis found a positive effect associated with the policy
change, but the result was not statistically significant.
Chapter conclusions
This chapter explored three approaches to examining the impact of introducing a policy
of free early education for disadvantaged two-year-olds on take-up of early education for
two- to three-year-old children, in the year following the introduction of the policy.
The key findings are:
The discontinuity analysis found an effect of being eligible for three as opposed to
two terms of funded early education in the moderately disadvantaged group; this
change in eligibility was associated with an increase in formal ECEC use of 4.7
hours/week.
The multiple regression analysis found no evidence of a relationship between
different levels of eligibility and the use of early education once the linear trend in
early education use over time was controlled for.
The difference-in-difference analysis looked specifically at the effects for the
moderately disadvantaged group of being eligible for three terms of funded early
education compared to being ineligible. While a positive impact of the policy
change was observed, it was not statistically significant.
Three possible explanations may contribute to the failure to find a consistent effect on
take-up of early education, two of which concern the context in which this study took
place:
The evaluation attempted to estimate the impact of the policy changes upon
disadvantaged groups too soon, i.e. in the year immediately following their
introduction. Interestingly, the tentative evidence of positive effects of eligibility for
the moderately disadvantaged group for the full three terms of support were found
when the policy changes had been in force for the longest period. Parents (and
services) needed more time to adapt for any change in use to be evident. This
interpretation is supported by census data which indicates that take-up for funded

36
ECEC among eligible families was 58% in January 2015, increasing to 68% in
January 2016, and 71% in January 2017 (DfE, 2017a).16
While significant differences by government region were not found, it is still likely
that there were sub-regional differences at the level of the local authority, as local
authorities are in charge of implementing the policy. It appeared that there was
significant divergence from the official policy eligibility criteria occurring within
many local authorities. Local authorities in many cases had been offering free
early education to disadvantaged parents before the official policy changes came
into force. This is seen in the generally high levels of usage across the three
groups, not only in the least disadvantaged group. Also local authorities took time
to inform relevant families of their eligibility for free early education, and this is
likely to have led to considerable local variation in knowledge of eligibility amongst
the relevant disadvantaged families. Such local variations make it difficult to find
an impact resulting from official policy changes.
The results accurately reflect a lack of demand for funded ECEC by parents of
two-year-olds eligible for a number of reasons. Possibly because they felt their
children were too young to enter early education, or that financial support was only
for 15 hours per week, requiring in many cases funded support to be blended with
other non-funded sources of early education, or they were already receiving
support locally through other sources. It is also possible that those parents in this
income group who are inclined to use early education for two-year-olds would do
so regardless of whether it was funded or not.
It is worth noting that other studies of the effects of policy change have also found that it
can take several years for the effect of a policy change to be evident. For example, in the
National Evaluation of Sure Start (NESS) it was found that Sure Start Local Programmes
typically took three years to adjust the provision of services to meet with changes in
government funding (Meadows & NESS team, 2006).
16 2015 was the first year for which census data was able to robustly estimate take-up of funded ECEC for two-year-olds among eligible families

37
Chapter 4: The relationship between early childhood
education and care (ECEC) aged two to three and
children’s cognitive and socio-emotional outcomes at
age three
Key findings
There was good evidence that children’s three-year-old cognitive and socio-
emotional outcomes were influenced by their use of early childhood education and
care (ECEC) between ages two and three. These effects were apparent after
controlling for demographic and home environment factors.
Use of formal group ECEC (e.g., day nursery, nursery class, nursery school,
playgroup) was associated with better socio-emotional outcomes through more
Prosocial Behaviour and fewer Emotional Symptoms and Peer Problems.
Use of formal individual ECEC (e.g., childminders) and informal individual ECEC
(e.g., friends, relatives, neighbours and nannies) were associated with higher
cognitive verbal ability (Naming Vocabulary). Formal individual ECEC use was
also associated with better socio-emotional outcomes with fewer Emotional
Symptoms and more Behavioural Self-regulation.
Formal group ECEC use was also associated with two poorer socio-emotional
outcomes: Conduct Problems and Emotional Self-regulation. However further
subgroup analyses indicated that these outcomes were seen for only a small
percentage of the sample who participated in a high amount of formal group
ECEC use (greater than 35 hours per week) between two and three years old.
Many of whom began formal group ECEC at a particularly early age. The
combination of these factors may explain these poorer child outcomes at age
three for this very small percentage of the sample. It was also observed however
that these high formal group ECEC use children experienced lower levels of Peer
Problems and Emotional Symptoms than other children.
There was no clear evidence that the effects of ECEC use differed according to
family disadvantage, neighbourhood deprivation, or region. This suggests that
ECEC use has a positive benefit on cognitive and socio-emotional outcomes at
age three regardless of a child’s family disadvantage level. However, given the
lower starting point among disadvantaged children (Speight et al., 2015), ECEC
may be of particular importance for this group.

38
Introduction
The evidence on ECEC in the first three years indicates that high-quality ECEC can
benefit children’s cognitive, language and social development in both the short and long-
term for both the general population (Melhuish et al., 1990; NICHD, 2000) and for
children from disadvantaged home backgrounds more specifically (e.g. Ramey et al.,
2000).
This chapter aims to consider the relationship between the amount and type of early
ECEC use aged two to three and children’s cognitive and socio-emotional outcomes at
age three. Furthermore, the chapter aims to consider whether any relationship between
ECEC use and developmental outcomes is moderated by family disadvantage. The
analyses do not consider the quality of ECEC, which will be dealt with in a subsequent
SEED report.
Methods
Measuring child development at three years of age
Child developmental outcomes were assessed at the Wave 2 interview when the children
were aged three. Cognitive development was measured for verbal and non-verbal ability
using the British Ability Scales (BAS; Elliot, Smith, & McCulloch, 2011). Socio-emotional
development was measured using the Strengths and Difficulties Questionnaire (SDQ)
and three additional items from the National Evaluation of Sure Start. Further detail for
these measures is available in Chapter 2. Summary statistics for the outcome variables
are given in the Technical Report.17
Classifying early childhood education and care (ECEC) use
The use of early childhood education and care (ECEC) was recorded separately for ten
types of ECEC as shown in Table 7. The study was principally concerned with the effects
associated with formal ECEC, which is eligible for government funding between the ages
of two and three years for disadvantaged groups. However, preliminary analyses
suggested that the associations between children’s ECEC use and the outcomes differed
between group ECEC — childcare in non-domestic group settings — and individual
ECEC — childcare in a domestic setting. For the purposes of these analyses a three-way
classification of ECEC was therefore adopted:
1. Formal group ECEC, in day nurseries, nursery class, nursery school, playgroup.
2. Formal individual ECEC, with childminders.
17 See Technical Report Appendix B

39
3. Informal individual ECEC, with friends, relatives, neighbours and nannies.
Table 7: Percentage breakdown of ECEC use by age group and type (10 categories).
Type of ECEC Children’s age Formal /
Informal
Group /
Individual 0-1 1-2 2-3
% % %
Childminder 13.0 14.6 9.4 Formal Individual
Nursery school 6.2 9.5 17.4 Formal Group
Nursery class attached to primary
school 0.1 0.2 5.8 Formal Group
Private day nursery 21.8 28.6 26.9 Formal Group
Local Authority day nursery 0.1 0.4 0.3 Formal Group
Pre-school or playgroup 0.5 0.5 12.6 Formal Group
SEN day school, nursery or unit 0.0 0.0 0.1 Formal Group
Relative, friend or neighbour 53.9 43.4 25.5 Informal Individual
Nanny or au pair 2.7 2.6 1.9 Informal Individual
Other ECEC 1.7 0.3 0.0 Informal Individual
TOTAL 100.0 100.0 100.0
Sample size = 4,342 children who had some ECEC use aged 0 to 3. 241 children (5.3%) had no ECEC use
aged 0 to 3.
Analysis
Of the 4,583 children seen at Wave 2, 4,402 (96%) had results for Naming Vocabulary,
4,312 (94%) had results for Picture Similarities and 2,310 (50.40%) had an assessment
by an ECEC provider from which the 8 socio-emotional scales were derived. Because
there were some missing data, e.g., socio-emotional outcomes were not available for a
substantial proportion of the children, there was a risk that standard statistical analysis
would produce biased results. The analysis therefore used multiple imputation to control
for the presence of missing data. The imputation model included all outcome variables,
home environment variables, demographic covariates and ECEC usage data. Ten
imputed data sets were generated and used for all statistical models, and the results
were combined. Further details of the multiple imputation process are given in the
Technical Report.
The analyses were principally interested in the association between amount of ECEC use
by differing types by children aged two to three and children’s outcomes at age three.18
Because there is a high correlation between amount of ECEC use aged one to two and
amount of ECEC use aged two to three, these analysis models did not control for earlier
18 Because the data were clustered, linear mixed-effects regression models were used in all cases. Random effects were fitted for government region, for stratum within government region and for primary sampling unit within stratum. Models were unweighted as analyses were not concerned with population prevalence rates.

40
ECEC use. This high correlation indicates considerable continuity of ECEC use over
time.
Full details of the measures included in analyses are available in Chapter 2. Child
developmental outcomes were measured for cognitive development using the British
Ability Scales (BAS), and socio-emotional development was measured using the
Strengths and Difficulties Questionnaire (SDQ) and additional items from the National
Evaluation of Sure Start.
All models controlled for six home environment measures, and fourteen demographic measures, further details of which are available in Chapter 2.
Results
Results by ECEC use
Child outcomes were analysed in terms of the amount (mean hours per week) of ECEC
use in three categories: formal group ECEC, formal individual ECEC and informal
individual ECEC. Analyses controlled for home environment and demographic measures.
Seven of the ten outcomes showed statistically significant associations with ECEC use
aged two to three years. A summary of the results is shown in Table 8.
Table 8: Summary of the associations between children’s time (hours per week) in early education
and care aged two to three and children’s outcomes at age three.
Child outcome
Type of early education and care (ECEC)
Formal ECEC Informal ECEC
Group Childminders Friends,
relatives and
nannies
Cognitive development Naming Vocabulary (verbal) +0.106*** +0.099***
Picture Similarities (non-verbal)
Socio-emotional problems
Hyperactivity
Emotional Symptoms -0.124** -0.090*
Conduct Problems +0.116**‡ +0.084*‡
Peer Problems -0.199***
Socio-emotional strengths
Prosocial Behaviour +0.109**
Behavioural Self-regulation +0.102*
Emotional Self-regulation -0.100*‡
Co-operation
Sample size = 4,583

41
Table displays coefficients for the statistically significant associations between hours of each type of ECEC and each outcome (* = p < .05, ** = p < .01, *** = p < .001). Where a cell is empty (blank) there was no statistically significant association. ‡ Indicates a detrimental association between time in ECEC and an outcome. Later subgroup analysis
identified that these negative associations were found only for children with high formal group ECEC use,
i.e. over 35 hours per week of term time (3.25% of the sample)
Formal group ECEC (e.g., day nursery, nursery class, nursery school, playgroup)
Higher use of formal group ECEC was associated with several better socio-emotional
child outcomes, namely more Prosocial Behaviour and fewer Peer Problems and
Emotional Symptoms.
There was also an unfavourable association between formal group ECEC use and two
poorer socio-emotional outcomes, specifically higher levels of Conduct Problems and
lower levels of Emotional Self-regulation. The context for this finding is considered more
closely in the following section considering outcomes associated with specific levels of
ECEC use.
Formal individual ECEC with childminders
Higher use of formal individual ECEC was associated with higher cognitive verbal ability
(Naming Vocabulary) and better socio-emotional outcomes with fewer Emotional
Symptoms and more Behavioural Self-regulation. There was one unfavourable
association in that higher formal individual ECEC use was associated with higher
Conduct Problems.
Informal individual ECEC with friends, relatives, neighbours and nannies
Higher use of informal individual ECEC was associated with higher cognitive verbal
ability (Naming Vocabulary).
Results by level of ECEC use
Following analysis considering whether the overall amount of ECEC was associated with
child outcomes, further analyses considered outcomes associated with specific levels of
ECEC use. For this analysis, ECEC use was classified according to six levels of use, and
compared with a ‘two hours or below’ reference level. The levels of ECEC use were:
Two hours or below (reference level) per week
Above two hours to five hours per week
Above five hours to 15 hours per week
Above 15 hours to 25 hours per week
Above 25 hours to 35 hours per week
Above 35 hours per week
All levels of ECEC usage are compared with the “two hours or below” reference level.

42
To reduce the risk of spurious significant results through testing a large number of
hypotheses, only measures that had significant effects in the initial models were included.
Non-verbal ability, Hyperactivity Scale and Co-operation were therefore not included.
Sub-group analysis indicates generally linear relationships between time in ECEC and
child developmental outcomes, such that increased time in ECEC leads to improved
outcomes. For some outcomes the relationship appears non-linear, such that a moderate
amount of ECEC leads to better outcomes than high or low amounts, however this may
relate to the small sample size within certain groups, and therefore a wider margin for
error.19 These findings are presented in detail below along with illustrative figures.
Each figure shows the difference in the named outcome (e.g., Naming Vocabulary), in
standard deviations, between five levels of ECEC use (hours per week over 38 weeks of
the school term), as shown above, for formal group, formal individual and informal
individual ECEC use, respectively, compared to a baseline of children with two hours or
less of that type of ECEC.20 This baseline is represented by the dotted horizontal line.
Circles indicate the scores for each category based on hours per week and the vertical
lines show 95% confidence intervals for the difference in scores. Statistically significant
effects are shown in bold. Non-bolded effects indicate the difference from baseline is not
sufficiently large to be considered statistically significant and may be due to chance,
although may also relate to the small sample sizes within some sub-groups.
19 Sample sizes for each level of ECEC use are available in the accompanying Technical Report (Table 18). 20 Standard Deviation is a standardised measure of the spread of data values. In this example the standardised units are used so the effects are comparable for variables measured on different scales. See Technical Report Appendix B for outcome variable summary statistics including standard deviations.

43
Cognitive outcomes
The subgroup analysis (see Figure 1) indicates that the significant relationship for formal
individual ECEC and verbal ability is close to linear, with increased time in ECEC being
associated with improved verbal ability, with the greatest benefits associated with
children with more than 35 hours per week of formal individual ECEC with childminders.21
For informal individual ECEC however, although visually a similar level of improved
verbal abilities is seen for all groups over 5 hours per week, the effects over 25 hours are
not statistically significant. However this finding may relate to small sample size.22
Figure 1: Association of ECEC and Naming Vocabulary
Sample size = 4,583 Graph shows difference in standard deviations at each level of ECEC use compared to a baseline of children with two hours or less of that type of ECEC. Statistically significant effects are in bold.
21 The non-significant finding at for 26 to 35 hours of formal individual ECEC may be related to the small sample size for this group (n=41) and therefore wide confidence interval 22 Sample Size: 26 to 35 hours of informal individual ECEC (n = 88); Over 35 hours of informal individual ECEC (n = 68).

44
Socio-emotional outcomes
Emotional Symptoms
A linear relationship is seen between time in formal group ECEC and reduced Emotional
Symptoms (see Figure 2), such that longer time spent in formal group ECEC each week
leads to lower levels of Emotional problems.
Figure 2: Association of ECEC and Emotional Symptoms
Sample size = 4,583
Graph shows difference in standard deviations at each level of ECEC use compared to a baseline of children with two hours or less of that type of ECEC. Statistically significant effects are in bold.

45
Conduct Problems
Higher levels of Conduct Problems (see Figure 3) were specifically associated with
children having had a particularly high level of formal group ECEC use aged two to three
(more than 35 hours per week averaged over the 38 weeks of the school terms). This
association is analysed in more detail in the subsequent section.
Figure 3: Association of ECEC and Conduct Problems
Sample size = 4,583
Graph shows difference in standard deviations at each level of ECEC use compared to a baseline of children with two hours or less of that type of ECEC. Statistically significant effects are in bold.

46
Peer Problems
A linear relationship is seen between time in formal group ECEC and reduced Peer
Problems (see Figure 4), such that longer time spent in formal group ECEC each week
leads to lower levels of Peer Problems. Although there appears to be a significant
relationship between 26 to 35 hours of informal individual ECEC and peer problems,
there was no overall effect observed in the initial analyses. 23
Figure 4: Association of ECEC and Peer Problems
Sample size = 4,583
Graph shows difference in standard deviations at each level of ECEC use compared to a baseline of children with two hours or less of that type of ECEC. Statistically significant effects are in bold.
23 Further, the size of this effect is uncertain given the wide confidence interval relating to smaller sample size for this subgroup (n=88)

47
Prosocial Behaviour
Formal group ECEC appears to improve Prosocial Behaviour among children, particularly
among those attending 26-35 hours per week (see Figure 5). The non-linear relationship,
such that the highest levels of ECEC does not lead to further improved outcomes, may
relate to the smaller sample size of the higher duration group, and therefore more
uncertain effects.24 Alternatively, this finding that 35 hours or less of formal ECEC is
optimum for development may be in line with the finding regarding the impact of
attending over 35 hours of formal group ECEC on Conduct Problems and Emotional Self-
regulation.
Figure 5: Association of ECEC and Prosocial Behaviour
Sample size = 4,583
Graph shows difference in standard deviations at each level of ECEC use compared to a baseline of
children with two hours or less of that type of ECEC. Statistically significant effects are in bold.
24 Sample Size: Formal group ECEC over 35 hours per week (n = 149);

48
Behavioural Self-regulation
Formal individual ECEC appears to improve Behavioural Self-regulation particularly
among children attending 16 to 25 hours per week (see Figure 6). The non-linear
relationship, such that the highest levels of ECEC does not lead to further improved
outcomes, may relate to the smaller sample size of the higher duration group, and
therefore more uncertain effects.25 Alternatively, this finding that 16 to 25 hours of formal
ECEC is optimum for development may be in line with the finding regarding the impact of
attending over 35 hours of formal group ECEC on Conduct Problems and Emotional Self-
regulation.
Figure 6: Association of ECEC and Behavioural Self-regulation
Sample size = 4,583
Graph shows difference in standard deviations at each level of ECEC use compared to a baseline of
children with two hours or less of that type of ECEC. Statistically significant effects are in bold.
25 Formal individual ECEC 26 to 35 hours per week (n = 41); Formal individual ECEC over 35 hours per week (n = 35).

49
Emotional Self-regulation
Similar to the finding for Conduct Problems, lower Emotional Self-regulation (see Figure
7) was specifically associated with children with a particularly high level of formal group
ECEC use aged two to three (more than 35 hours per week averaged over the 38 weeks
of the school terms). These two aspects of socio-emotional development are closely
related, which may explain the parallel finding.
Figure 7: Association of ECEC and Emotional Self-regulation
Sample size = 4,583
Graph shows difference in standard deviations at each level of ECEC use compared to a baseline of
children with two hours or less of that type of ECEC. Statistically significant effects are in bold.
Investigating the high formal group ECEC use children: Possible effect of the age that formal group ECEC started
For Conduct Problems and Emotional Self-regulation, high formal group ECEC use
between the ages of two and three (more than 35 hours per week) was associated with
poorer child outcomes at age three. There were 149 children with this high level of formal
group ECEC use, making up just 3.25% of the sample. This section considers whether
factors other than the high formal group ECEC use may account for these outcomes for
this small group within the sample.
One notable characteristic of this group of children is that they are much more likely than
other children to have started formal group ECEC use early in life; see Table 9.

50
Table 9: Breakdown of sample by formal group ECEC usage aged two to three and age at which
formal group ECEC usage started.
Age started formal group ECEC
Formal group ECEC usage aged 2 to 3
≤ 35 hours per week >35 hours per week
N % N %
Age 0-1 526 11.9 86 57.7
Age 1-2 570 12.9 43 28.9
Age 2-3 2868 64.7 20 13.4
All 4434 100.0 149 100.0
Sample size = 4,583
The outcomes for Conduct Problems and Emotional Self-regulation are less favourable
only for children with both high formal group ECEC use aged two to three and an early
start in formal group ECEC (i.e. before age one) compared to children who received two
or fewer hours of formal group ECEC per week. However, there are small numbers of
children in the high use group who started formal group ECEC aged one to two or aged
two to three. This means that a firm conclusion cannot be drawn as to the extent to which
those high formal group ECEC use children who start formal group ECEC after age one
may also display higher levels of conduct problems and lower levels of emotional self-
regulation.
Comparing the families using high levels (more than 35 hours per week) of formal group
ECEC with the rest of the sample. Families with high formal group ECEC use tend to
have:
Older mothers and higher levels of Parent/child Closeness.
Lower levels of household chaos.
Fewer children.
Less likely to be workless households and have lower income.
Parents are more likely to be professionals and to be highly qualified.
More likely to be in the Black ethnic group.
There are also differences in the type of formal group ECEC used aged two to three, with
higher use of private day nurseries and lower use of nursery classes and playgroups.
These differences are more pronounced for high formal group ECEC use with an early
start (first year of life) in formal group ECEC.
Finally, the outcomes for children with high formal group ECEC use aged two to three
(more than 35 hours per week) were compared with those of all other children. These
comparisons do not control for demographic or home environment measures. Results
show that whilst these children have poorer outcomes for Conduct Problems and
Emotional Self-regulation they also have significantly lower levels of Peer Problems and
Emotional Symptoms than other children.

51
Conclusion
Higher levels of Conduct Problems and lower levels of Emotional Self-regulation were
shown by those children who had an average of over 35 hours per week of formal group
ECEC between ages two and three (149 children, 3.25% of the sample). There is some
evidence that these effects may be linked to an early start in formal group ECEC, i.e.
formal group ECEC used during the first year of life, rather than high use of formal group
ECEC aged two to three per se. It should also be noted however that these high formal
group ECEC use children experience lower levels of Peer Problems and Emotional
Symptoms than other children.
Investigating interactions
Disadvantage
Analysis investigated whether the associations between ECEC use for each type of
ECEC and child outcomes were similar across the disadvantage groups (most
disadvantaged 20%, moderately disadvantaged 20-40% and least disadvantaged 60%).
There were no statistically significant associations between disadvantage group and
ECEC use suggesting that the associations between ECEC use and the outcomes were
the same across the disadvantage groups. This suggests that ECEC use has a positive
benefit on cognitive and socio-emotional outcomes at age three regardless of a child’s
family disadvantage level. These findings are in accord with results from earlier
longitudinal studies in England (e.g., the EPPE study, Sylva et al., 2004).
Index of Multiple Deprivation (IMD)
Analysis tested for associations between ECEC use and level of area deprivation as
measured by the Index of Multiple Deprivation (IMD) based on family postcode. No
significant interactions were found. It was concluded that there was no evidence that the
associations between ECEC use and child outcomes differed by area deprivation.
Region
Analysis tested for associations between the effects of ECEC use and region. In order to
keep the numbers in different groups from being too small, the 9 government office
regions were aggregated into 5 geographical regions. There were no significant
interactions involving region and ECEC use. It was concluded that there was no evidence
for regional differences in the relationships between ECEC use and child outcomes.
Chapter conclusions
These analyses offer good evidence that the amount of ECEC that children receive
between the ages of two and three is associated with effects on cognitive and socio-
emotional outcomes measured at age three. These associations were present after
controlling for a number of home environment and demographic measures. Given that
child developmental characteristics are unlikely to be the dominant influence on parent

52
choice of childcare setting, it may be cautiously assumed that any associations found are
likely to result from causation of the outcomes by the use of ECEC.26
Cognitive development in the form of verbal abilities was seen particularly in individual
settings, both formal and informal. These findings are in accord with findings from
Millennium Cohort Study data looking in particular at grandparent care, which was linked
with a higher vocabulary at age three years (Hansen & Hawkes, 2009). This finding may
relate to previous indications that high quality adult-child interactions are particularly
important in speech and language development (DfE, 2017b). In contrast to the present
findings, a smaller UK longitudinal study found that, controlling for other factors, higher
cognitive development and particularly non-verbal ability was associated with an earlier
start in group care and with more hours per week in group care from 0 to 51 months, and
that individual ECEC was not associated with cognitive outcomes (Barnes & Melhuish,
2016). Whether cognitive outcomes are observed for group based ECEC in the longer
term will be addressed in future SEED reports.
Socio-emotional development was seen in formal settings, both group (e.g. nurseries)
and individual/domestic (e.g., childminders). These results correspond in part with
previous research27 that has frequently found beneficial effects associated with more time
in formal group ECEC for aspects of socio-emotional development, such as sociability,
prosocial behaviour and Self-regulation.
Regarding variations in results by family disadvantage, area deprivation or region, there
was no evidence that the effects of formal ECEC use differed by disadvantage group,
area deprivation, or region. This suggests that ECEC use has a positive benefit on
cognitive and socio-emotional outcomes at age three regardless of a child’s family
disadvantage level, the level of disadvantage in their area or the region within which they
live. Some previous research has found that the benefits of ECEC are greater for children
from more disadvantaged families (e.g. Reynolds et al., 2011) but other research has
found similar effects of ECEC use for different levels of family disadvantage (e.g., the
EPPE study, Sylva et al., 2004). Findings in previous research may vary depending on
the way in which disadvantage is classified, and across countries with differing welfare
provision. Although the present findings indicate that ECEC is beneficial for children
whether or not they are disadvantaged, the baseline SEED report indicates that
disadvantaged children had a lower starting point in terms of both language skills and
social behaviour (Speight et al., 2015). Furthermore, disadvantaged children have been
seen to be less likely to use ECEC than those from more advantaged families (Speight et
al., 2010a). This indicates that disadvantaged children may have more to gain from
ECEC, which can help bring them into the normal range of functioning seen among more
advantaged children.
26 Further detail on causal relationships is available in the associated Technical Report (see Chapter 2). 27 This research is reviewed comprehensively in Melhuish et al. (2015).

53
Analysis also found unfavourable effects associated with formal group ECEC use and
socio-emotional measures of Conduct Problems and Emotional Self-regulation for
children with greater than 35 hours per week of group ECEC use (3.25% of sample). This
was a small group of 149 children, who made up 3.25% of sample. Over half of these
children (57%) had started formal group ECEC in their first year, compared with 11% of
children who participated in 35 hours or less per week of group ECEC use. Conduct and
Emotional Self-regulation difficulties were not identified in subgroups of children attending
35 hours or less per week. It may therefore be that this combination of particularly high
formal group ECEC use aged two to three and an early start in formal group ECEC which
is a risk factor for these poorer child outcomes among a small proportion of children at
age three. It should also be noted however that these high formal group ECEC use
children experience lower levels of Peer Problems and Emotional Symptoms than other
children. In another British study of childcare use over the first three years, Barnes et al.
(2010) failed to find an association between amount or type of childcare and mother-
reported levels of disruptive behaviour at 36 months of age, although by age 51 months
more hours of group care predicted more mother-reported hyperactivity (Stein et al,
2013). Previous research has also indicated higher levels of conduct problems
associated with greater group ECEC use, but that this association gradually reduced with
child age and disappeared during the elementary school years (Melhuish et al., 2010).
Similar results occurred in a parallel study in Northern Ireland (Melhuish, et al., 2006).
54
Chapter 5: The effects of home environment on child
outcomes
Key findings
A better Home Learning Environment (HLE) score was associated with higher
cognitive scores and fewer socio-emotional problems for children at age three.
Better child cognitive and socio-emotional outcomes at age three were also
associated with higher parental Limit Setting scores and a better parent/child
relationship.
The outcome effects for children at age three associated with ECEC use were of
roughly comparable size to the effects associated with the home environment and
the parent/child relationship, but these varied depending on the outcome.
Investigating the interaction between the effects of ECEC use and HLE found
these to be largely independent of each other. An association between formal
individual ECEC (childminder) use and non-verbal ability was found only for
children with low HLE scores. For the remaining outcome variables there were no
interactions between the effects of HLE and ECEC use for all children. This
indicates that even children having a rich home learning environment still stand to
benefit from spending time in ECEC.
Introduction
The previous chapter focussed on effects associated with different patterns of ECEC use.
In the analyses a range of demographic and home environment measures acted as
control measures. This is because not controlling for them might otherwise confound the
relationship between ECEC use and children’s outcomes.
There is considerable evidence for the influence of both the home environment and the
quality of the parent/child relationship on the child’s cognitive and socio-emotional
outcomes. This chapter looks at the effects upon child outcomes associated with various
home environment variables.
Measures
Home environment factors, child cognitive and socio-emotional developmental outcomes,
and demographic characteristics which were included in these analyses are outlined in
detail in Chapter 2.

55
Results
Effects of home environment on three-year-old child outcomes
The effects of the home environment on child outcomes controlling for demographic
measures and all types of ECEC use aged two to three are summarised in Table 10.
Table 10: Summary of the associations between home environment variables and children’s
outcomes at age three.
Child outcome
Home environment variables
Home
Learning
Environm
ent
Househ
old
CHAOS
Parent's
psycho-
logical
distress
Limit
setting
scale
Parent/c
hild
Closene
ss
Parent/c
hild
Conflict
Cognitive
development
Naming Vocabulary
(verbal)
+0.295*** –0.066* +0.198*** +0.107*** –0.123***
Picture Similarities
(nonverbal)
+0.226*** +0.114***
Socio-emotional problems
Hyperactivity -0.092* +0.109*
Emotional Symptoms +0.087* -0.155*
Conduct Problems +0.088* +0.130**
Peer Problems -0.188*** -0.157** +0.102*
Socio-emotional strengths
Prosocial Behaviour +0.119** –0.113* +0.185*** +0.106*
Behavioural Self-
regulation
+0.132** +0.226***
Emotional Self-
regulation
–0.145*
Co-operation –0.011*
Sample size = 4,583 Table displays coefficients for the statistically significant associations between hours of each type of ECEC and each outcome (* = p < .05, ** = p < .01, *** = p < .001). Where a cell is empty (blank) there was no statistically significant association.
Home Learning Environment
Higher Home Learning Environment Scores were associated with better performance on
both verbal and non-verbal cognitive scales. For the socio-emotional outcomes, higher
HLE scores were associated with higher levels of Prosocial Behaviour and Behavioural
Self-regulation.
Household Disorder
Higher levels of household disorder (CHAOS scale) were associated with lower socio-
emotional outcomes of Prosocial Behaviour and Co-operation.
Parent’s Psychological Distress
Higher levels of Parent’s Psychological Distress were associated with lower cognitive
verbal ability (Naming Vocabulary) and higher socio-emotional outcome levels of
Emotional Symptoms.

56
Limit Setting Scale
Higher Limit Setting scores were associated with higher scores on both verbal and non-
verbal cognitive abilities and with higher socio-emotional outcomes of Prosocial
Behaviour and Behavioural Self-regulation and lower Emotional Symptoms and Peer
Problems scores. However, higher Limit Setting scores were also associated with higher
levels of Conduct Problems.
Parent/child Closeness
Higher Parent/child Closeness scores were associated with higher cognitive verbal ability
(Naming Vocabulary) and socio-emotional outcomes of higher Prosocial Behaviour, as
well as lower Hyperactivity and Peer Problems.
Parent/child Conflict
Higher Parent/child Conflict scores were associated with lower cognitive verbal ability
(Naming Vocabulary) and socio-emotional outcomes of lower Emotional Self-regulation
and higher Hyperactivity, Conduct Problems and Peer Problems.
Comparing the effect sizes associated with ECEC use aged two to three, home environment variables and demographic variables
The analysis in this report has found that both ECEC use between the ages of two and
three and home environment variables had significant associations with children’s
cognitive and socio-emotional outcomes at age three. Therefore the relative sizes of such
effects on child outcomes associated with formal group, formal individual and informal
individual ECEC use aged two to three and home environment variables were
investigated.28 A large body of research already investigates the role of demographic
factors in child development (e.g. Sylva et al., 2008). These are therefore not dealt with
separately in this report, but are included here for comparison with the role of ECEC and
the home environment.
For cognitive development, home environment and demographic factors appear
particularly strongly associated with outcomes, as well as a small but significant
association between formal and informal individual ECEC and verbal abilities. For socio-
emotional development, while certain demographic factors are particularly influential,
similar levels of association with most socio-emotional outcomes are seen when
comparing the effects for home environment and formal ECEC. These findings are
summarized in Figures 8 to 17 and considered in detail below. Plots show the effect size
28 Analysis also controlled for child’s ethnic group, but because of the small sizes of most of the ethnic groups ethnicity effects were omitted from the results.

57
of all statistically significant variables in descending order of size.29 Early education use is
shown in red, home environment factors in blue and demographic factors in green.
Cognitive outcomes
Verbal Abilities (Naming Vocabulary)
Naming Vocabulary outcomes had significant associations with a number of demographic
factors, home environment variables and ECEC use; see Figure 8. The largest effect was
a positive association with mother’s highest qualification. There were effects of all the
home environment variables with the exception of household disorder (CHAOS scale).
The largest of these was the positive effect of Home Learning Environment on Naming
Vocabulary. There were small positive effects of formal individual and informal individual
ECEC use aged two to three years.
Figure 8: Comparing effect sizes for Naming Vocabulary in terms of formal group, formal individual
and informal individual ECEC use aged two to three and home environment and demographic
covariates.
Sample size = 4,583.
Note: All statistically significant effects are shown in decreasing order of absolute size.
HLE = Home Learning Environment.
29 Effect size is displayed as the standardised regression coefficient

58
Non-Verbal Abilities (Picture Similarities)
Picture Similarities outcomes showed significant associations with demographic and
home environment factors but not with ECEC use (see Figure 9). Children’s Picture
Similarities scores tended to be higher where Home Learning Environment score was
higher and where Limit Setting was higher. Scores also tended to be higher where the
level of maternal education was higher, for girls and for higher birthweight children.
Figure 9: Comparing effect sizes for Picture Similarities in terms of home environment and
demographic covariates.30
Sample size = 4,583.
Note: All statistically significant effects are shown in decreasing order of absolute size.
30 No significant effects were found for ECEC use
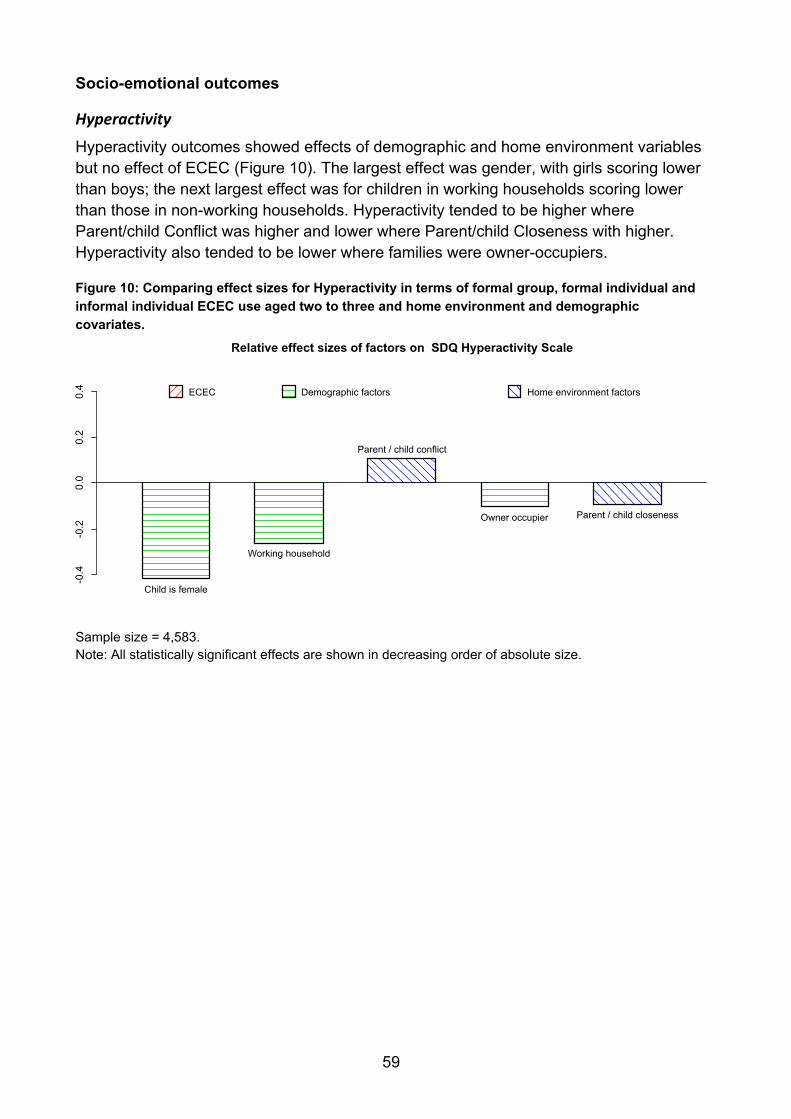
59
Socio-emotional outcomes
Hyperactivity
Hyperactivity outcomes showed effects of demographic and home environment variables
but no effect of ECEC (Figure 10). The largest effect was gender, with girls scoring lower
than boys; the next largest effect was for children in working households scoring lower
than those in non-working households. Hyperactivity tended to be higher where
Parent/child Conflict was higher and lower where Parent/child Closeness with higher.
Hyperactivity also tended to be lower where families were owner-occupiers.
Figure 10: Comparing effect sizes for Hyperactivity in terms of formal group, formal individual and
informal individual ECEC use aged two to three and home environment and demographic
covariates.
Sample size = 4,583.
Note: All statistically significant effects are shown in decreasing order of absolute size.

60
Emotional Symptoms
Figure 11 shows that Emotional Symptoms tended to be lower where Limit Setting was
higher. Children with higher formal ECEC use aged two to three also tended to exhibit
fewer emotional symptoms. Finally, children’s Emotional Symptoms scores tended to be
higher where parent’s psychological distress was higher.
Figure 11: Comparing effect sizes for Emotional Symptoms in terms of formal group, formal
individual and informal individual ECEC use aged two to three and home environment and
demographic covariates.
Sample size = 4,583.
Note: All statistically significant effects are shown in decreasing order of absolute size.

61
Conduct Problems
Figure 12 shows that children from working households and girls tended to exhibit fewer
conduct problems. Conduct problems tended to be higher where Parent/child Conflict
and Limit Setting scores were higher. There were also associations for conduct problems
with formal group and formal individual ECEC use aged two to three, as discussed in the
previous chapter.
Figure 12: Comparing effect sizes for Conduct Problems in terms of formal group, formal individual
and informal individual ECEC use aged two to three and home environment and demographic
covariates.
Sample size = 4,583.
Note: All statistically significant effects are shown in decreasing order of absolute size.

62
Peer Problems
The largest effect on Peer Problems was the association with formal group ECEC use
aged two to three, children with higher formal group ECEC use tending to have lower
levels of peer problems; see Figure 13. Peer Problems also tended to be lower where
Limit Setting was higher, where there was a higher level of Parent/child Closeness and
for girls. Peer Problems scores tended to be higher where Parent/child Conflict scores
were higher.
Figure 13: Comparing effect sizes for Peer Problems in terms of formal group, formal individual and
informal individual ECEC use aged two to three and home environment and demographic
covariates.
Sample size = 4,583.
Note: All statistically significant effects are shown in decreasing order of absolute size.

63
Prosocial Behaviour
There were significant effects of demographic, home environment and ECEC factors on
Prosocial Behaviour (see Figure 14). The largest effect was of gender; Prosocial
Behaviour tended to be higher for girls than for boys. There were significant effects of
four of the home environment variables, the largest of these being of Limit Setting:
children with higher Limit Setting scores tended to have higher Prosocial Behaviour.
There was a positive effect of formal group ECEC use aged two to three on this outcome.
Figure 14: Comparing effect sizes for Prosocial Behaviour in terms of formal group, formal
individual and informal individual ECEC use aged two to three and home environment and
demographic variables.
Sample size = 4,583.
Note: All statistically significant effects are shown in decreasing order of absolute size.

64
Behavioural Self-regulation
This scale shows effects of demographic, home environment and ECEC factors (see
Figure 15). Behavioural Self-regulation tended to be better for girls, where Limit Setting
was higher and where the Home Learning environment was higher and for children from
working households. Use of formal individual ECEC was associated with better
Behavioural Self-regulation.
Behavioural Self-regulation also tended to be higher for children from lone parent
households. It should be remembered that this effect of coming from a lone parent rather
than a couple household is from a multivariate regression model, so that this is the effect
of having a lone parent when all other factors (e.g., mother’s education, income, social
class) are equal. Often when children’s outcomes are found to be poorer in lone parent
households this is likely to be due to other socio-economic and demographic factors that
are associated with lone parenting, rather than lone parenting itself. The effect found
here was after allowing for a wide range of demographic factors.
Figure 15: Comparing effect sizes for Behavioural Self-regulation in terms of formal group, formal
individual and informal individual ECEC use aged two to three and home environment and
demographic variables.
Sample size = 4,583.
Note: All statistically significant effects are shown in decreasing order of absolute size.

65
Emotional Self-regulation
Emotional Self-regulation tended to be higher for girls; it tended to be poorer where
Parent/child Conflict was higher (see Figure 16). There was also a small negative effect
of formal group ECEC use on Emotional Self-regulation. This parallels the association of
formal group ECEC use with more Conduct Problems (see Figure 12).
Figure 16: Comparing effect sizes for Emotional Self-regulation in terms of formal group, formal
individual and informal individual ECEC use aged two to three and home environment and
demographic variables.
Sample size = 4,583.
Note: All statistically significant effects are shown in decreasing order of absolute size.

66
Co-operation
Co-operation tended to be higher for girls and for children from working families (see
Figure 17). It tended to be lower where household disorder (CHAOS scale) was higher.
Figure 17: Comparing effect sizes for Co-operation in terms of formal group, formal individual and
informal individual ECEC use aged two to three and home environment and demographic variables.
Sample size = 4,583.
Note: All statistically significant effects are shown in decreasing order of absolute size.
Interactions between ECEC use and the Home Learning Environment
Analysis has shown that both ECEC use and Home Learning Environment Index were
associated with child outcomes. It was hypothesised that there may be an interaction
between ECEC use and the Home Learning Environment: specifically, that the effect of
ECEC use on the outcomes would be smaller when the Home Learning Environment
Index score was high and the effect would be larger when the Home Learning
Environment Index score was low. This may be characterised as a saturation effect; i.e.
children already experiencing a rich home learning environment may have received
enough “learning opportunities” and thus may derive less benefit from time in an ECEC
setting than those whose home learning environment was less rich.
There was a significant interaction only between formal individual ECEC use (with
childminders) and Home Learning Environment Index in Picture Similarities outcomes,
but not for any other outcome.31 To investigate this interaction further, separate models
for children with high and low Home Learning Environment Index scores were analysed.
31 Interactions between Home Learning Environment Index and each type of ECEC are presented in Table 35 of the accompanying Technical Report.

67
The results showed that there was only a positive association between Picture
Similarities and time in formal individual ECEC for children with lower Home Learning
Environment Index scores, in accordance with the “saturation hypothesis”.
For all other relationships between the three types of ECEC use and the ten child
outcomes (two cognitive outcomes and eight socio-emotional outcomes), no significant
interaction with Home Learning Environment was identified. This indicates that for most
outcomes ECEC was similarly beneficial for children with low and high Home Learning
Environment scores.
Chapter conclusions
Cognitive and socio-emotional outcomes reported in this chapter were significantly
associated with aspects of the home environment, including the quality of the parent/child
relationship, and with demographic factors. These findings are in line with previous
research which has found a relationship between factors of the home learning
environment and children’s cognitive and social development such as the EPPE project
(Sammons et al., 2003).
As with the findings in Chapter 4, it may be assumed that home environment predicts
child developmental outcomes, although it is likely in the case of these factors that
causation may be bi-directional such that child socio-emotional characteristics may also
influence parenting for example.32
Analyses also compared the effect sizes associated with ECEC use aged between two
and three, home environment variables and demographic variables. For cognitive
outcomes, the effects for demographics (particularly child gender and maternal
education) and home environment factors (particularly HLE and Limit Setting) are
stronger than those for individual ECEC (both formal and informal). For most socio-
emotional outcomes, the effects for formal group or individual ECEC are similar to those
seen for home environment factors (particularly Limit Setting and Parent/child Conflict),
although weaker than those seen for certain demographic factors (particularly a child’s
gender and whether they come from a working household). Formal individual ECEC also
has a significant but smaller association with Behavioural Self-regulation than
demographic factors (particularly gender and working or lone parent household) and
home environment factors (particularly Limit Setting). ECEC however has no association
with hyperactivity or cooperation, both of which are particularly influenced by
demographic factors (gender and working household) as well as showing a smaller
association with home environment factors (Parent/child Conflict or Closeness, and
Household Chaos respectively).
32 For further information on causal relationships see Chapter 2 in the accompanying Technical Report.

68
Analyses also considered a potential interaction between the effects of Home Learning
Environment and ECEC use. However, an interaction was found in only one case:
specifically, ECEC with childminders was associated with higher Picture Similarities, but
only for children with lower HLE scores. This suggests that the advantages of a rich
home learning environment and the beneficial effects of time in ECEC are largely
independent, with even children having the most positive home environments still
showing beneficial associations from spending time in ECEC in most cases.

69
Chapter 6: Discussion and conclusions
Aims
This report was concerned with two main objectives:
1. To explore the impact of introducing a policy of free early education for
disadvantaged two-year-olds on take-up of early education between two and three
years of age in the year following introduction of the policy.
2. To study the associations between the amount of differing types of early childhood
education and care (ECEC) and child development, as well as associations with
aspects of parenting.
Results and Discussion
The Impact of funded early education on ECEC use
Entitlement to funded early education for two-year-olds was introduced in September
2013 for children in the 20% most disadvantaged families and extended to children in the
40% most disadvantaged families in September 2014. The analysis explored the effects
of the official policy change on take-up and use of ECEC. ECEC was measured
according to a three-way classification, formal group ECEC (e.g. nurseries and
playgroups, and eligible for government funding), formal individual ECEC (e.g.
childminders, and eligible for government funding), and informal individual ECEC (e.g.
with friends, relatives or nannies, that is not eligible for government funding).
In summary, there was limited evidence of any increased use of early education in
response to the policy change.
Three possible explanations for these findings are:
1. This evaluation of the use of early education by two-year-olds occurred too soon
after the introduction of the policy change. In line with this, more recent census
data has shown subsequent increased take-up of ECEC among disadvantaged
two-year-olds.
2. Practice differed markedly amongst local authorities. In some cases parents were
funded to receive early education for two-year-olds in advance of the policy
change; conversely in some cases parents were unable to take up funded places
due to a lack of supply.
3. The results accurately reflect a lack of demand for early education by parents of
two-year-olds eligible for the policy.

70
Other studies of the effects of policy change have also found that it can take several
years for the effect of a policy change to be evident, as discussed previously.
Are variations in use of ECEC associated with child development outcomes?
The analyses provided evidence that the amount of early childhood education and care
(ECEC) that children received between the ages of two and three was associated with
differences for cognitive and socio-emotional outcomes measured at age three.
The associations were identified across all three groups of children studied, suggesting
that ECEC use has a positive benefit on cognitive and socio-emotional outcomes at age
three regardless of a child’s family disadvantage level. However, given the baseline
SEED report has indicated a lower starting point among disadvantaged children (Speight
et al., 2015), and that disadvantaged children are less likely to attend childcare settings
(Speight et al., 2010a), ECEC may be of particular importance for this group.
These associations were seen after allowing for the effects of a number of home
environment and demographic measures. The results varied for formal group, formal
individual and informal individual ECEC use.
Cognitive outcomes
There was a beneficial effect associated with use of both formal individual ECEC (i.e.
childminders) and informal individual ECEC (i.e. friends, relatives, neighbours and
nannies) for language development. For formal individual ECEC, greater time spent in
ECEC appears to relate to greater improvements in verbal abilities.
Socio-emotional outcomes
The socio-emotional outcomes of hyperactivity and co-operation under three years of age
appear to be unrelated to ECEC use. However, for other dimensions there are several
associations linked to formal group ECEC. The beneficial outcomes associated with use
of formal group ECEC (primarily day nurseries, nursery schools and playgroups) include
fewer emotional symptoms and peer problems and more prosocial behaviour. More
formal individual ECEC (with childminders) was associated with more prosocial
behaviour, and also better behavioural self-regulation.
Further detailed analysis of number of hours per week in ECEC revealed that greater
time spent in formal ECEC often related to increasing benefits for socio-emotional
development, particularly for emotional symptoms and peer problems. Benefits for
prosocial behaviour were particularly associated with between 26 and 35 hours per week
of formal group ECEC. Benefits for behavioural self-regulation were particularly
associated with between 16 and 25 hours per week of ECEC with childminders. Other

71
research has frequently found beneficial effects associated with more time in formal
group ECEC, as in the review by Melhuish et al. (2015).
However children who received more than 35 hours per week of group ECEC were found
to have unfavourable associations with higher conduct problems and lower emotional
self-regulation than children receiving less than two hours a week (the baseline
comparison group), although this group of children comprised only 3.25% of sample
(n=149). It is noteworthy that the children who received more than 35 hours of group
ECEC when aged between two and three years were also more likely to have started
formal group ECEC use early in life. Analysis suggested that the early start in formal
group ECEC combined with high use aged two to three is a significant factor behind
these effects. Subgroup analysis indicated that spending 35 hours or less in group ECEC
was not associated with higher levels of Conduct Problems or lower Emotional Self-
regulation. It should also be noted that these high formal group ECEC use children
experience lower levels of Peer Problems and Emotional Symptoms than other children,
indicating there are also benefits of spending more than 35 hours per week in formal
group settings.
Are variations in the home environment associated with child development?
In line with previous research, analysis in this report showed that cognitive and socio-
emotional outcomes were also significantly associated with variations in the home
environment, including the quality of the parent/child relationship, aspects of parenting
behaviour, Home Learning Environment (HLE) and with demographic factors.
The relative importance of ECEC use compared to the effects associated with the home
environment varied depending on the outcome considered. For those outcomes where
there was a significant association with ECEC, the relative size of association in
comparison with home and demographic factors varied. For cognitive outcomes, the
effects for demographic and home environment factors were often stronger than those for
ECEC. For most socio-emotional outcomes, the effects for formal ECEC were similar to
those seen for home environment factors, although weaker than those seen for certain
demographic factors. ECEC had no association with hyperactivity or cooperation, both of
which are particularly influenced by demographic factors as well as showing a smaller
association with home environment factors.
Interactions between ECEC and Home Learning Environment (HLE)
Analysis found that the beneficial effects of ECEC use and of a rich Home Learning
Environment (HLE) are largely independent of each other. A positive association
between formal individual ECEC (childminders) use and non-verbal ability (Picture
Similarities) was only found for children with low HLE scores. In all other cases an

72
interaction of this sort was absent, indicating that children with a rich HLE still benefit
from ECEC use.
Final conclusions
While this study did not offer clear evidence of the two-year-old offer affecting the take-up
of early education, subsequent census data (DfE, 2017a) indicate that such an effect is
now appearing. This suggests that a longer-term perspective of the effects of this policy
is warranted.
Individual ECEC, whether eligible for government funding (formal) or not (informal), was
associated with benefits for language development at age three years. Formal group
ECEC was associated with benefits for several aspects of socio-emotional development,
with fewer emotional symptoms, more prosocial behaviour and fewer peer problems.
It was found that the effects of ECEC use on child outcomes were the same for families
with all levels of disadvantage, in accordance with results from earlier English studies
(e.g., the EPPE study, Sylva et al., 2004). However, given that lower levels of baseline
functioning have been indicated for disadvantaged children (Speight et al., 2015), and
these children may be less likely to attend childcare settings (Speight et al., 2010a),
disadvantaged groups may be considered to have more to gain.
In addition, there were substantial effects upon child development outcomes at age three
years associated with aspects of the home environment, and these effects were often
similar in size to the effects of ECEC.
The beneficial effects of ECEC use and of a rich Home Learning Environment (HLE)
were found to be largely independent of each other, although there was some indication
that non-verbal benefits of formal individual ECEC were seen only for children with a low
HLE.
It remains to be seen whether and how these associations with child development
change over time, particularly as ECEC use changes as children get older, and the role
of quality in the impact of childcare, and these issues will be considered in later reports
from the Study of Early Education and Development (SEED).

73
References Barnes, J., Leach, P., Malmberg, L. E., Stein, A., Sylva, K., & FCCC Team. (2010).
Experiences of childcare in England and socio‐emotional development at 36 months.
Early Child Development and Care, 180, 1215-1229. doi: 10.1080/03004430902943959
Barnes, J & Melhuish, E. (2016). Amount and timing of group-based childcare from birth
and cognitive development at 51 months: A UK study. International Journal of Behavioral
Development, doi: 10.1177/0165025416635756
Barnett, W. S. (1995). Long-term effects of early childhood programs on cognitive and
school outcomes. The Future of Children, 5(3), 25-50. doi: 10.2307/1602366
Barnett, W. S. (2011). Effectiveness of early educational intervention. Science,
333(6045), 975-978. doi: 10.1126/science.1204534
Becker, B. (2011). Social disparities in children's vocabulary in early childhood. Does pre‐
school education help to close the gap? The British Journal of Sociology, 62(1), 69-88.
doi: 10.1111/j.1468-4446.2010.01345.x
Belsky, J. (2001). Emanuel Miller Lecture: Developmental risks (still) associated with
early child care. Journal of Child Psychology and Psychiatry and Allied Disciplines, 42(7),
845-859. doi: 10.1111/1469-7610.00782
Belsky, J., Vandell, D. L., Burchinal, M., Clarke‐Stewart, K. A., McCartney, K., & Owen,
M. T. (2007). Are there long‐term effects of early child care? Child Development, 78(2),
681-701. doi: 10.1111/j.1467-8624.2007.01021.x
Bornstein, M. H., Hahn, C. S., Gist, N. F., & Haynes, O. M. (2006). Long‐term cumulative
effects of childcare on children's mental development and socioemotional adjustment in a
non‐risk sample: the moderating effects of gender. Early Child Development and Care,
176(2), 129-156. doi: 10.1080/0300443042000266286
Brooks-Gunn, J. (2003). Do you believe in magic: What can we expect from early
childhood intervention programs? Society for Research in Child Development, 17, 1-14.
Department for Education (2016). Childcare and Early years Survey of Parents in
England, 2014 to 2015. SFR 09/2016, 3 March 2016. London: DfE. https://www.gov.uk/government/uploads/system/uploads/attachment_data/file/504693/SFR09-
2016_Childcare_and_Early_Years_Survey_of_Parents_2014-15_SFR.pdf
Department for Education (DfE) (2016). Provision for children under five years of age in
England, January, 2016. SFR 23/2016, 30 June, 2016. London: DfE. https://www.gov.uk/government/uploads/system/uploads/attachment_data/file/532575/SFR23_2016_Text.p
df

74
Department for Education (DfE) (2017a). Provision for children under five years of age in
England, January 2017. SFR 29/2017, 29 June, 2017. London: DfE. https://www.gov.uk/government/uploads/system/uploads/attachment_data/file/622632/SFR29_2017_Text.p
df
Department for Education (2017b). Study of Early Education and Development: Good
Practice in Early Education. January 2017. London: DfE. https://www.gov.uk/government/uploads/system/uploads/attachment_data/file/586242/SEED__Good_Pract
ice_in_Early_Education_-_RR553.pdf
Dunning, T. (2012). Natural experiments in the social sciences: A design-based
approach. Cambridge, UK: Cambridge University Press.
Elliot, C., Smith, P. & McCulloch, K. (2011). British Ability Scales Third Edition (BAS III).
Windsor: GL-Assessment.
Eryigit-Madzwamuse, S., & Barnes, J. (2014). Patterns of childcare arrangements and
cognitive development. Journal of Child and Adolescent Behavior, 2(5).
European Commission, Directorate-general for Education, Youth, Sport and Culture.
(2014). Study of the effective use of early childhood education and care (ECEC) in
preventing early school leaving (ESL). Brussels: European Commission.
http://bookshop.europa.eu/en/study-on-the-effective-use-of-early-childhood-education-and-care-ecec-in-
preventing-early-school-leaving-esl--pbNC0414322/
Goodman R. (1997). The Strengths and Difficulties Questionnaire: A research note.
Journal of Child Psychology and Psychiatry, 38 (5), 581-586.
Hansen, K and Hawkes, D. (2009). Early Childcare and Child Development. Journal of
Social Policy, 38, pp 211-239 doi:10.1017/S004727940800281X
Harris, F., Law, J., & Roy, P. (2005). The third implementation of the Sure Start
Language Measure. SSU/2005/Fr/014. London, DCSF. http://webarchive.nationalarchives.gov.uk/20130401151715/http://www.education.gov.uk/publications/eOrd
eringDownload/SSU-2005-SF-014.pdf
Heckman, J. J. (2006). Skill formation and the economics of investing in disadvantaged
children. Science, 312(5782), 1900-1902
Hesterberg, T., Combining multiple imputation t, chi-square, and F inferences . Research
report No 75. Seattle, WA; MathSoft, 1998. http://www.uvm.edu/~dhowell/StatPages/Missing_Data/tech75-mi-inference.pdf
Hogan, A.E., Scott, K.G., & Bauer, C.R. (1992). The Adaptive Social Behavior Inventory
(ASBI): A new assessment of social competence in high-risk three-year-olds. Journal of
Psychoeducational Assessment, 10, 230-239.

75
Honaker J, King G, Blackwell M. Amelia II (R package) 2010. http://cran.r-
project.org/web/packages/Amelia/index.html.
Huskinson, T., Kostadintcheva, K., Greevy, H., Salmon, C., Dobie, S., Medien K., with
Gilby, N., Littlewood M., & D’Souza, J. (2014). Childcare and Early years Survey of
Parents 2012 to 2013. SFR 06/2014, January 2014. London: DfE. https://www.gov.uk/government/uploads/system/uploads/attachment_data/file/275992/SFR06-
2014_Childcare_and_Early_Years_Survey_of_Parents_2012-13_final.pdf
Huskinson, T., Hobden, S., Oliver, D., Keyes, J., Littlewood, M., Pye, J., & Tipping, S.
(2016). Childcare and early years survey of parents 2014-2015. London; DfE.
Huston, A. C., Bobbitt, K. C., & Bentley, A. (2015). Time spent in child care: How and
why does it affect social development? Developmental Psychology, 51(5), 621-634. doi:
10.1037/a0038951
Jaffee, S. R., Van Hulle, C., & Rodgers, J. L. (2011). Effects of nonmaternal care in the
first 3 years on children’s academic skills and behavioral functioning in childhood and
early adolescence: A sibling comparison study. Child Development, 82(4), 1076-1091.
Karoly, L. A., Greenwood, P. W., Everingham, S. S., Houbé, J., Kilburn, M. R., Rydell, C.
P., . . . Chiesa, J. (1998). Investing in our children: What we know and don’t know about
the costs and benefits of early childhood interventions. Santa Monica, CA: RAND.
Kessler, R.C., Andrews, G., Colpe, .et al (2002). Short screening scales to monitor
population prevalences and trends in non-specific psychological distress.
Psychological Medicine, 32, 959-956.
Lee, V. E., Brooks-Gunn, J., & Schnur, E. (1988). Does Head Start work? A 1-year
follow-up comparison of disadvantaged children attending Head Start, no preschool, and
other preschool programs. Developmental Psychology, 24(2), 210-222.
Lefebvre, P., & Merrigan, P. (2002). The effect of childcare and early education
arrangements on developmental outcomes of young children. Canadian Public
Policy/Analyse de Politiques, 28(2), 159-186. doi: 10.2307/3552323
Loeb, S., Bridges, M., Bassok, D., Fuller, B., & Rumberger, R. W. (2007). How much is
too much? The influence of preschool centers on children's social and cognitive
development. Economics of Education Review, 26(1), 52-66.
Love, J. M., Harrison, L., Sagi‐Schwartz, A., Van IJzendoorn, M. H., Ross, C., Ungerer, J.
A., . . . Brooks‐Gunn, J. (2003). Child care quality matters: How conclusions may vary
with context. Child Development, 74(4), 1021-1033.
Matheny A P, Wachs T, Ludwig J L, Phillips K. (1995), Bringing order out of

76
chaos: Psychometric characteristics of the Confusion, Hubbub and Order Scale. Journal
of Applied Developmental Psychology, 16, 429-444.
McCartney, K., Burchinal, M., Clarke-Stewart, A., Bub, K. L., Owen, M. T., & Belsky, J.
(2010). Testing a series of causal propositions relating time in child care to children’s
externalizing behavior. Developmental Psychology, 46(1), 1
Meadows, P. & NESS team (2006). Cost-effectiveness of Implementing SSLPS: An
Interim Report. Research Report NESS/2006/FR/015. London: Department for Education
and Skills. http://www.ness.bbk.ac.uk/cost-effectiveness/documents/1240.pdf
Melhuish, E. (2010). Why children, parents and home learning are important. In K. Sylva,
E. Melhuish, P. Sammons, I. Siraj-Blatchford & B. Taggart (Eds.), Early Childhood
Matters: Evidence from the Effective Pre-school and Primary Education Project. London:
Routledge.
Melhuish E. C. (2011). Preschool matters. Science, 333, 299-300.
Melhuish, E. C., Lloyd, E., Martin, S., & Mooney, A. (1990). Type of childcare at 18
months: II relations with cognitive and language development. Journal of Child
Psychology and Psychiatry, 31(6), 861-870.
Melhuish, E. C., Sylva, K., Sammons, P., Siraj-Blatchford, I., & Taggart, B. (2001). The
Effective Provision of Pre-school Education Project, Technical Paper 7:
Social/behavioural and cognitive development at 3-4 years in relation to family
background. London: Institute of Education/DfES.
Melhuish, E. C. (2004). A literature review of the impact of early years provision on young
children, with emphasis given to children from disadvantaged backgrounds. London:
National Audit Office. http://media.nao.org.uk/uploads/2004/02/268_literaturereview.pdf
Melhuish, E., Quinn, L., Hanna, K., Sylva, K., Siraj-Blatchford, I., Sammons, P. &
Taggart, B. (2006) The Effective Pre-school Provision in Northern Ireland Project,
Summary Report. Belfast, N.I.: Stranmillis University Press. http://www.deni.gov.uk/researchreport41.pdf
Melhuish, E.C., Sylva, K., Sammons, P., Siraj-Blatchford, I., Taggart, B., & Phan, M.
(2008a) Effects of the Home Learning Environment and preschool center experience
upon literacy and numeracy development in early primary school. Journal of Social
Issues, 64, 95-114.
Melhuish, E. Belsky, J., Leyland, A.H., Barnes, J. & NESS Team (2008b). Effects of fully-
established Sure Start Local Programmes on 3-year-old children and their families living
in England: a quasi-experimental observational study. Lancet, 372, 1641-1647.
77
Melhuish, E., Ereky-Stevens, K., Petrogiannis, K., Ariescu, A., Penderi, E., Rentzou, K.,
Tawell, A., Slot, P., Broekhuizen, M., & Leseman, P. (2015). A review of research on the
effects of early childhood Education and Care (ECEC) upon child development. CARE
project; Curriculum Quality Analysis and Impact Review of European Early Childhood
Education and Care (ECEC). http://ecec-care.org/resources/publications/
Melhuish, E., Quinn, L., Sylva, K., Sammons, P., Siraj-Blatchford, I., and Taggart, B.
(2010). Pre-school Experience and Key Stage 2 performance in English and
Mathematics. Belfast: DfE, Northern Ireland. www.deni.gov.uk/no_52_2010.pdf
Melhuish, E., Quinn, L., Sylva, K., Sammons, P., Siraj-Blatchford, I., & Taggart, B.
(2012). Preschool affects longer term literacy and numeracy: results from a general
population longitudinal study in Northern Ireland. School Effectiveness and School
Improvement: An International Journal of Research, Policy and Practice, 24, 234-250.
Millennium Cohort Study, ed. K. Hansen (2010). A guide to the datasets, fifth edition.
Centre for Longitudinal Studies, Institute of Education, University of London.
http://www.cls.ioe.ac.uk/library-
media%5Cdocuments%5CMCS%20Guide%20to%20the%20Datasets%20v5.pdf
Muennig, P., Schweinhart, L., Montie, J., & Neidell, M. (2009). Effects of a
prekindergarten educational intervention on adult health: 37-year follow-up results of a
randomized controlled trial. American Journal of Public Health, 99(8), 1431-1437. doi:
10.2105/AJPH.2008.148353
NESS (2005). Early impacts of Sure Start Local Programmes on children and families.
Sure Start Report 13. London: Department for Education and Skills. http://www.ness.bbk.ac.uk/impact/documents/1183.pdf
NICHD Early Child Care Research Network. (2000). The relation of child care to cognitive
and language development. Child Development, 71, 960-980.
OECD. (2004). Learning for tomorrow's world: First results from Pisa 2003. Paris:
Organisation For Economic Co-operation And Development (OECD)/UNESCO.
OECD. (2006). Early childhood education and care. Paris: OECD Publishing.
OECD. (2011). Pisa in focus 2011/1: Does participation in pre-primary education
translate into better learning outcomes at school? Paris: OECD Publishing.
OECD (2016). Who uses childcare? Background brief on inequalities in the use of formal early childhood education and care (ECEC) among very young children. Paris: OECD Publishing. https://www.oecd.org/els/family/Who_uses_childcare-
Backgrounder_inequalities_formal_ECEC.pdf

78
Oden, S., Schweinhart, L., Weikart, D., Markus, S., & Xie, Y. (1996). Summary of the
long term benefits of Head Start study. Head Start Third National Research Conference,
Washington, DC.
Pianta, R. C. (2001). The Student-Teacher Relationship Scale. Odessa FL: PAR.
Ramey, C. T., Campbell, F. A., Burchinal, M., Skinner, M. L., Gardner, D. M., & Ramey,
S. L. (2000). Persistent effects of early childhood education on high-risk children and
their mothers. Applied Developmental Science, 4(1), 2-14.
Reynolds, A. J., Temple, J. A., Ou, S.-R., Arteaga, I. A., & White, B. A. B. (2011). School-
based early childhood education and age-28 well-being: Effects by timing, dosage, and
subgroups. Science, 333(6040), 360-364. doi: 10.1126/science.1203618
Rubin, D. B. (1987). Multiple imputation for nonresponse in surveys. Chichester: Wiley.
Sammons, P., Sylva, K., Melhuish, E., Taggart, B., Elliot, K., & Siraj-Blatchford, I. (2002).
The Effective Provision of Pre-School Education (EPPE) Project: Measuring the impact of
pre-school on children's cognitive progress over the pre-school period. London: Institute
of Education, University of London/ Department for Education and Skills.
Sammons, P., Sylva, K., Melhuish, E., Siraj-Blatchford, I., Taggart, B., & Elliot, K. (2003).
Measuring the impact of pre-school on children’s social/behavioural development over
the pre-school period. The Effective Provision of Pre-School Education (EPPE) Project.
Technical Paper 8b. University of London, Institute of Education. London.
Smith, R., Purdon, S., Schneider, V., La Valle, I., Wollny, I., Owen, R., . . . Lloyd, E.
(2009). Early education pilot for two year old children: Evaluation. London: DCSF.
Solheim, E., Wichstrøm, L., Belsky, J., & Berg‐Nielsen, T. S. (2013). Do time in child care
and peer group exposure predict poor socioemotional adjustment in Norway? Child
Development, 84(5), 1701-1715.
Speight, S., Smith, R., Lloyd, E., and Coshall, C. (2010a) Families Experiencing Multiple
Disadvantage: Their Use of and Views on Childcare Provision, Research Report DCSF-
RR191, London: Department for Children, Schools and Families.
Speight, S., Smith, R., Lloyd, E., and Coshall, C. (2010b) Towards Universal Early Years
Provision: Analysis of Take-up by Disadvantaged Families From Recent Annual
Childcare Surveys, DfE Research Report DFE-RR066. London: DfE.
Speight, S., Maisey, R., Chanfreau, J., Haywood, S., Lord C., and Hussey, D. (2015).
Study of Early Education and Development: Baseline survey of families. Research
Report, July 2015. DFE-RR480. ISBN: 978-1-78105-509-0. London: DfE. http://www.seed.natcen.ac.uk/media/5645/Study_of_early_education_and_development_survey_of_familie
s.pdf

79
Stein, A., Malmberg, L-E., Leach, P., Barnes, J., Sylva, K. and the FCCC Team. (2013)
The Influence of Different Forms of Early Childcare on Children’s Emotional and
Behavioural Development. Child: Care, Health and Development, 39(5):676-87. doi:
10.1111/j.1365-2214.2012.01421.x
Stipek, D. J., & Ryan, R. H. (1997). Economically disadvantaged preschoolers: Ready to
learn but further to go. Developmental Psychology, 33(4), 711.
Sylva, K., Melhuish, E., Sammons, P., Siraj-Blatchford, I., and Taggart, B. (2004).
Effective Pre-school Provision. London: Institute of Education.
Sylva, K., Melhuish, E., Sammons, P., Siraj-Blatchford, I., & Taggart, B. (2008). Final report from the primary phase: Pre-school, school and family influences on children's development during Key Stage 2 (7-11). Nottingham, United Kingdom: Department for Children, Schools and Families.
Sylva, K., Melhuish, E., Sammons, P., Siraj-Blatchford, I., & Taggart, B. (2010). Early
childhood matters: Evidence from the effective pre-school and primary education project.
Oxon: Routledge.
Sylva, K., Melhuish, E. C., Sammons, P., Siraj-Blatchford, I., Taggart, B., Toth, K., ... &
Welcomme, W. (2012). Effective pre-school, primary and secondary education 3-14
project (EPPSE 3-14)-Final report from the Key Stage 3 phase: influences on students'
development from age 11-14.
UNICEF Innocenti Research Centre. (2008). The child care transition. A league table of
early childhood education and care in economically advanced countries. Florence, Italy:
UNICEF.
Wylie, C., Hodgen, E., Ferral, H., & Thompson, J. (2006). Contributions of early
childhood education to age-14 performance. Wellington, New Zealand: Ministry of
Education. www.educationcounts.govt.nz/__data/assets/pdf_file/0003/7716/Contributions-of-ECE-to-age-
14-Performance.pdf
Yamauchi, C., & Leigh, A. (2011). Which children benefit from non-parental care?
Economics of Education Review, 30(6), 1468-1490.
Yoshikawa, H., Weiland, C., Brooks-Gunn, J., Burchinal, M. R., Espinosa, L. M.,
Gormley, W. T., . . . Zaslow, M. J. (2013). Investing in our future: The evidence base on
preschool education. Ann Arbor, MI/ New York, NY: Society for Research in Child
Development/ Foundation for Child Development.
Zachrisson, H. D., Dearing, E., Lekhal, R., & Toppelberg, C. O. (2013). Little evidence
that time in child care causes externalizing problems during early childhood in Norway.
Child Development, 84(4), 1152-1170.

80
© NatCen Social Research & University of Oxford 2017
Reference: DFE-RR706
ISBN: 978-1-78105-783-4
The views expressed in this report are the authors’ and do not necessarily reflect those of
the Department for Education.
Any enquiries regarding this publication should be sent to us at:
[email protected] or www.education.gov.uk/contactus
This document is available for download at www.gov.uk/government/publications