Embed Size (px)
Citation preview

STUDY OF DS-CDMA SYSTEM AND STUDY OF DS-CDMA SYSTEM AND IMPLEMENTATION OF ADAPTIVE FILTERING IMPLEMENTATION OF ADAPTIVE FILTERING
ALGORITHMSALGORITHMS
ByByNikita GoelNikita Goel
Prerna MayorPrerna MayorSonal AmbwaniSonal Ambwani
OBJECTIVESOBJECTIVES Extensive Analysis of the Adaptive Algorithms in MATLAB Extensive Analysis of the Adaptive Algorithms in MATLAB
and LabVIEW and comparison of the Algorithms on various and LabVIEW and comparison of the Algorithms on various points such as convergence, BER performance. The basic points such as convergence, BER performance. The basic signal model chosen is that of a multi-user DS-CDMA system.signal model chosen is that of a multi-user DS-CDMA system.
Implementation of the Algorithms in C language.Implementation of the Algorithms in C language.
Design of a suitable GUI for the system.Design of a suitable GUI for the system.
Interfacing the TI-DSP kit with the computer using the C Interfacing the TI-DSP kit with the computer using the C codes. codes.

Understanding the Signal ModelUnderstanding the Signal Model We are dealing with a We are dealing with a DS-CDMADS-CDMA system with system with
multi-user communication.multi-user communication.((In a CDMA system, all the users transmit in the frequency spectrum In a CDMA system, all the users transmit in the frequency spectrum
simultaneously and are coded using spread-spectrum techniques.)simultaneously and are coded using spread-spectrum techniques.) However, we are interested in the However, we are interested in the
communication of a single user of interest. The communication of a single user of interest. The other users become ‘other users become ‘InterferersInterferers’.’.
Key idea of the projectKey idea of the project: : To develop online, To develop online, adaptive algorithms which are recursive in adaptive algorithms which are recursive in nature to process nature to process real time datareal time data and work and work towards the minimization of the towards the minimization of the MEAN-SQUARE MEAN-SQUARE ERRORERROR (MMSE) between the received signal (MMSE) between the received signal and the desired response. and the desired response.
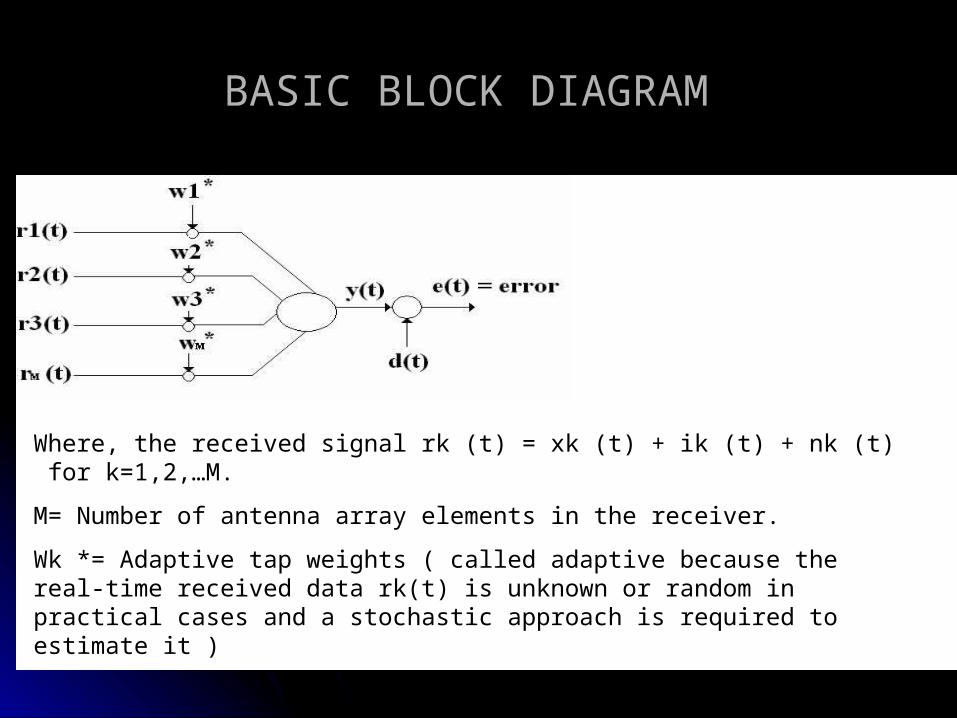
BASIC BLOCK DIAGRAM BASIC BLOCK DIAGRAM
Where, the received vector rk (t) = xk (t) + ik (t) + nk (t) for i=1,2,…M.
M= Number of antenna array elements in the receiver.
Wk *= Adaptive tap weights ( called adaptive because the real-time received data rk(t) is unknown or random in practical cases and a stochastic approach is required to estimate it )
ANTENNA
ARRAY
Where, the received signal rk (t) = xk (t) + ik (t) + nk (t) for k=1,2,…M.
M= Number of antenna array elements in the receiver.
Wk *= Adaptive tap weights ( called adaptive because the real-time received data rk(t) is unknown or random in practical cases and a stochastic approach is required to estimate it )
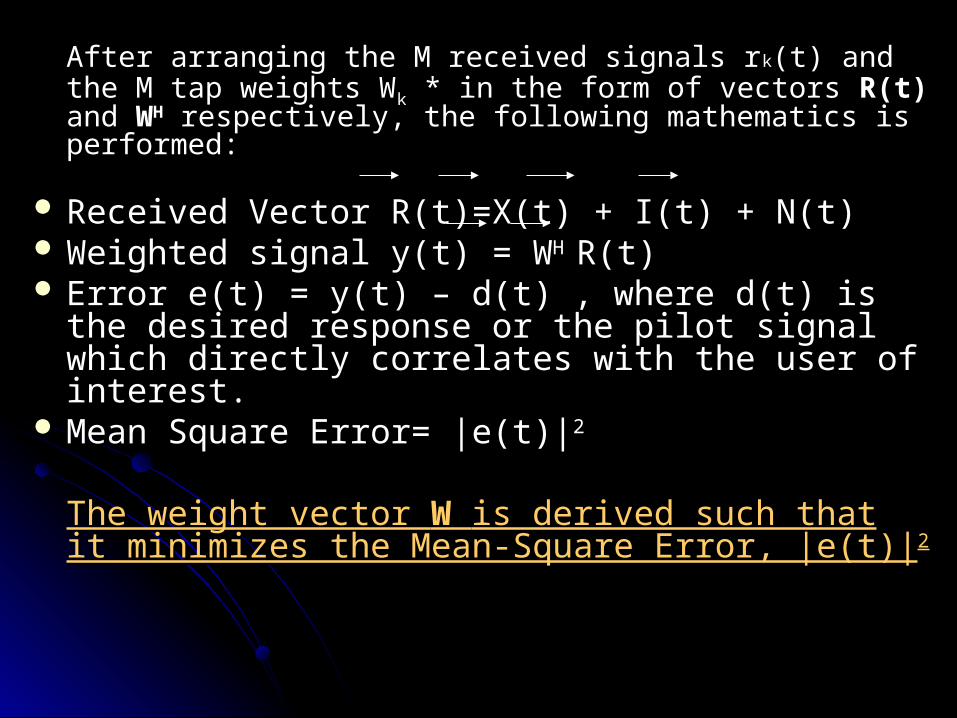
After arranging the M received signals rAfter arranging the M received signals rkk(t) and the M tap (t) and the M tap weights Wweights Wkk * in the form of vectors * in the form of vectors R(t)R(t) and and WWHH respectively, respectively, the following mathematics is performed:the following mathematics is performed:
Received Vector R(t)=X(t) + I(t) + N(t)Received Vector R(t)=X(t) + I(t) + N(t) Weighted signal y(t) = WWeighted signal y(t) = WH H R(t)R(t) Error e(t) = y(t) – d(t) , where d(t) is the desired Error e(t) = y(t) – d(t) , where d(t) is the desired
response or the pilot signal which directly correlates response or the pilot signal which directly correlates with the user of interest. with the user of interest.
Mean Square Error= |e(t)|Mean Square Error= |e(t)|22
The weight vector The weight vector W W is derived such that it is derived such that it minimizes the Mean-Square Error, |e(t)|minimizes the Mean-Square Error, |e(t)|22

Why Adaptive Algorithms?Why Adaptive Algorithms?
Fast and considerably reduce system overheads Fast and considerably reduce system overheads as data can be processed online.as data can be processed online.
Process real-time and random data (Online). Process real-time and random data (Online). Tend to the WTend to the WMMSEMMSE in the mean-square sense in the mean-square sense
with probability 1.with probability 1. Adapt easily to the communication system data.Adapt easily to the communication system data. Follow a general recursive pattern.Follow a general recursive pattern.

LMS ( Least Mean Squares)LMS ( Least Mean Squares)WWn+1n+1 = W = Wnn – –μμ rrnn ( (rrn n HH WWn n – dn*)Wlms Wmmse (in the mean square sense)
Advantages:simplicity in implementationstable and robust performance against
different signal conditions
Disadvantage:Relatively slow Convergence ( but that can
be overcome by using normalised LMS)

CMA ( Constant Modulus Algorithm)CMA ( Constant Modulus Algorithm)
WWn+1n+1 = W = Wnn – –μμ( ( rrnn rrnn HH WWnn( | ( | WWnn H H rrnn||22 – A2 2 )))) p(t)p(t)
Advantage:Advantage: Blind, Online scheme ( no pilot signal)Blind, Online scheme ( no pilot signal)
TbTb
Disadvantages:Disadvantages: Needs a constant modulus signal of interestNeeds a constant modulus signal of interest Algorithm will not work for power-controlled CDMA Algorithm will not work for power-controlled CDMA
(wireless) system(wireless) system
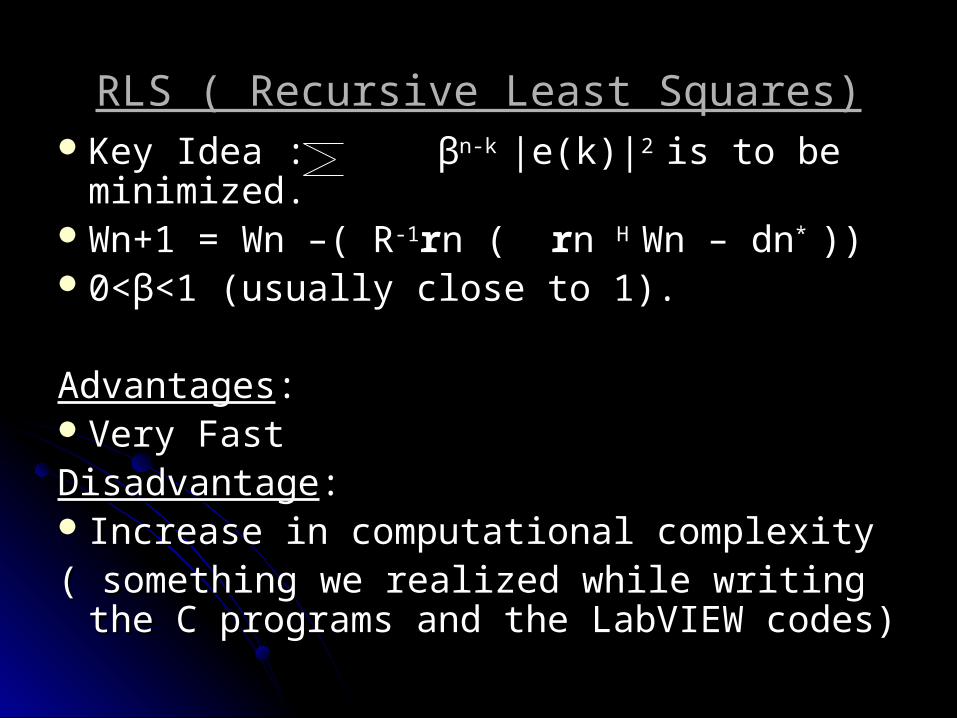
RLS ( Recursive Least Squares)RLS ( Recursive Least Squares)Key Idea : Key Idea : ββn-k n-k |e(k)||e(k)|2 2 is to be minimized.is to be minimized.Wn+1 = Wn –Wn+1 = Wn –( R( R-1-1rrn ( n ( rrn n H H Wn Wn – dn* * ))))0<0<ββ<1 (usually close to 1). <1 (usually close to 1).
AdvantagesAdvantages::Very FastVery FastDisadvantageDisadvantage:: Increase in computational complexity Increase in computational complexity ( something we realized while writing the C ( something we realized while writing the C
programs and the LabVIEW codes) programs and the LabVIEW codes)
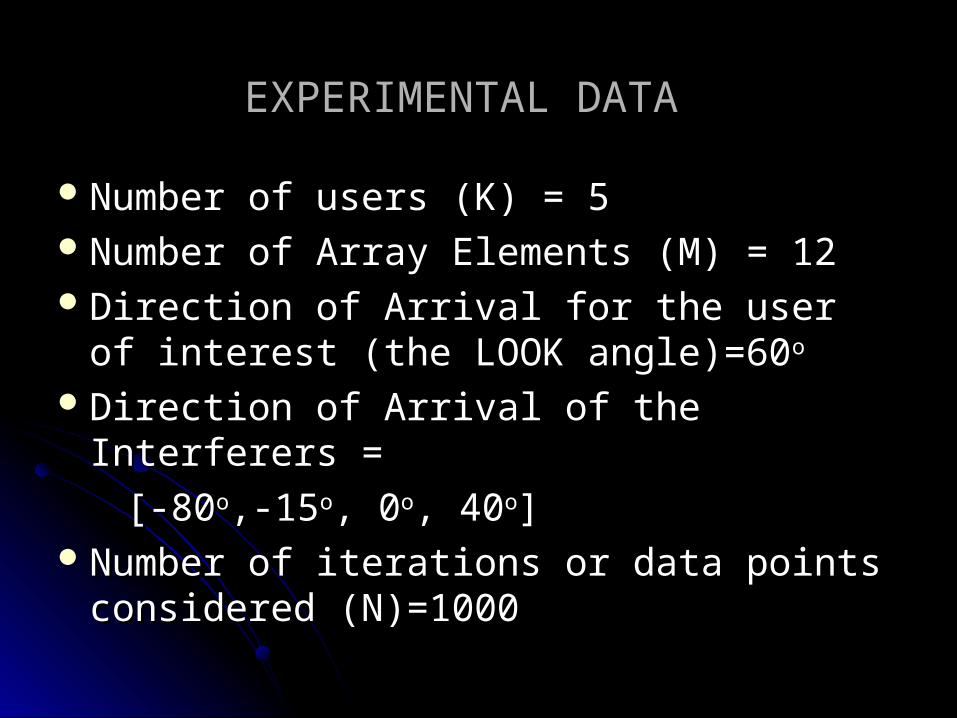
EXPERIMENTAL DATAEXPERIMENTAL DATA
Number of users (K) = 5Number of users (K) = 5Number of Array Elements (M) = 12Number of Array Elements (M) = 12Direction of Arrival for the user of interest Direction of Arrival for the user of interest
(the LOOK angle)=60(the LOOK angle)=60oo
Direction of Arrival of the Interferers =Direction of Arrival of the Interferers =
[-80[-80oo,-15,-15oo, 0, 0oo, 40, 40oo]]Number of iterations or data points Number of iterations or data points
considered (N)=1000 considered (N)=1000

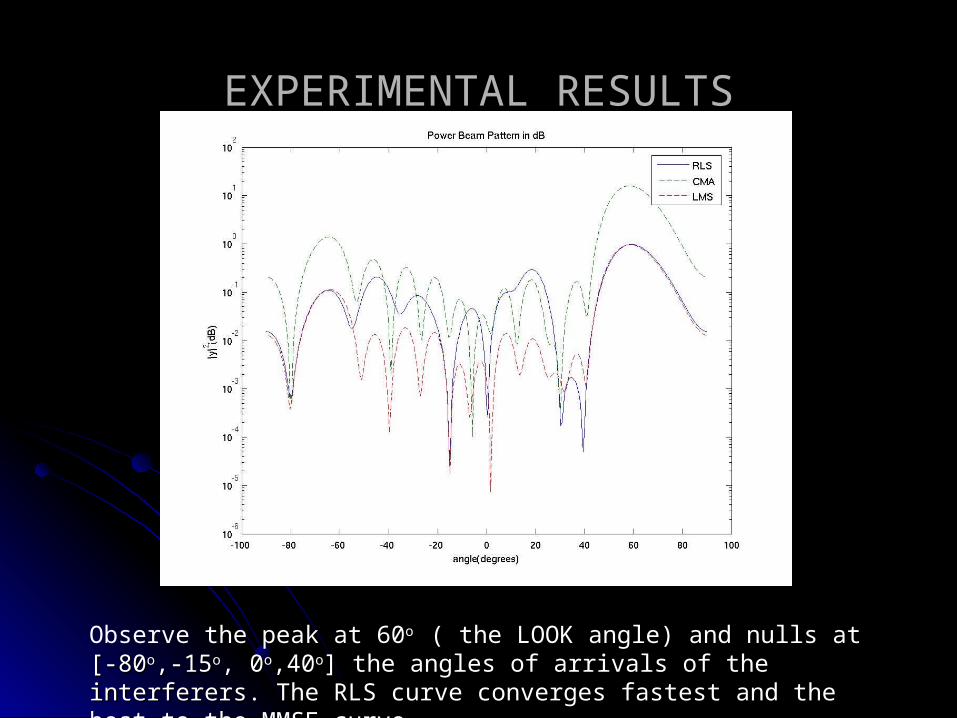
EXPERIMENTAL RESULTSEXPERIMENTAL RESULTS
Observe the peak at 60o ( the LOOK angle) and nulls at [-80[-80oo,-15,-15oo, 0, 0oo,40,40oo] ] the angles of arrivals of the interferers. The RLS curve converges fastest the angles of arrivals of the interferers. The RLS curve converges fastest and the best to the MMSE curve. and the best to the MMSE curve.

The above diagram depicts the adaptive algorithm at the receiver which essentially deciphers which bit was transmitted by the user-of-interest.
The received vector r is passed through a linear filter characterized according to theadaptive filtering technology used (LMS, RLS, CMA etc) .
The bit transmitted is decided by performing a hypothesis testing onSign(W T *r), i.e if Sign(W T *r), >0 then a +1 was transmitted, and if it is <0 then
-1 was transmitted.
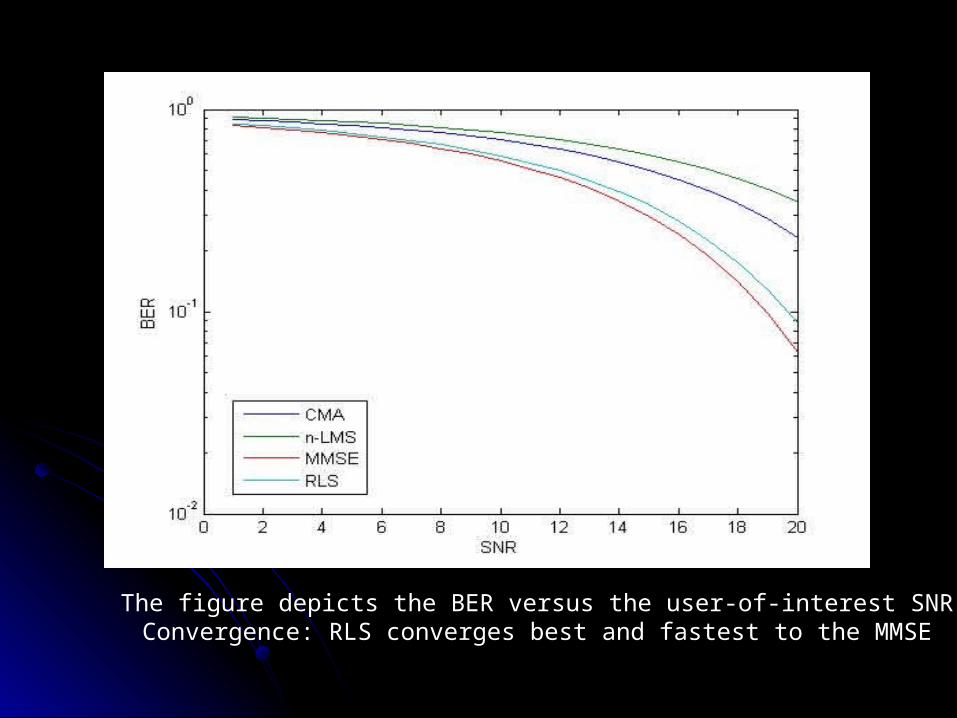
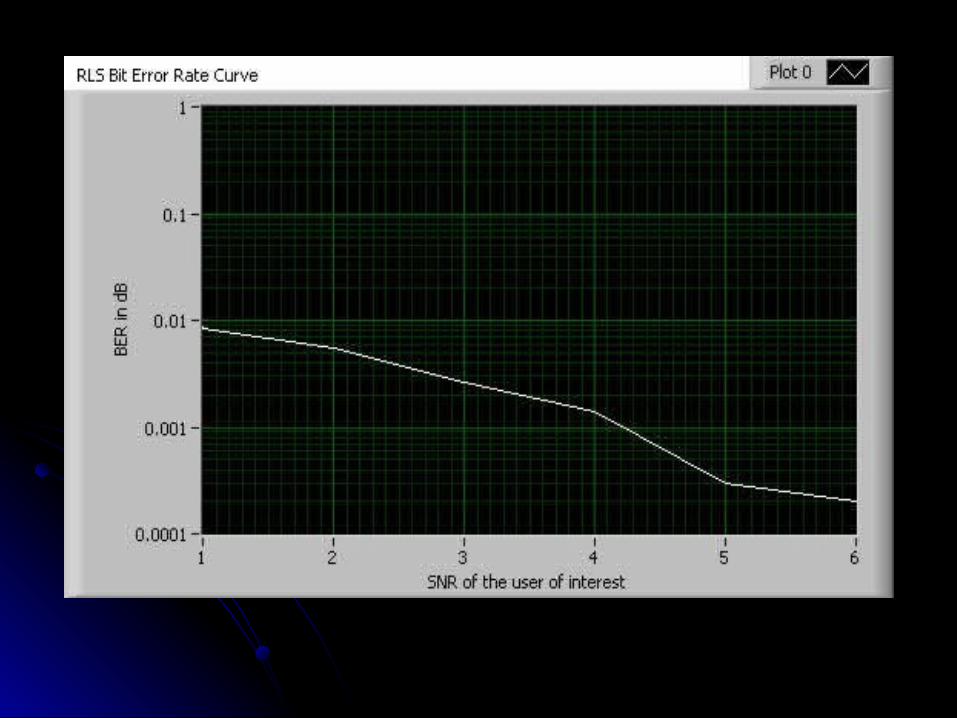
The figure depicts the BER versus the user-of-interest SNRConvergence: RLS converges best and fastest to the MMSE
GUIGUI
The GUI has been implemented in The GUI has been implemented in
LabVIEW, because of the user-friendly LabVIEW, because of the user-friendly nature of the interface.nature of the interface.
We have also coded the algorithms in We have also coded the algorithms in LabVIEW, because of the novelty of the LabVIEW, because of the novelty of the idea.idea.
contd..contd..
About LabVIEWAbout LabVIEW It is an out and out graphical programming It is an out and out graphical programming
tool with an excellent and user-friendly tool with an excellent and user-friendly interface.interface.
Terminology:Terminology:A program in LabVIEW is called a A program in LabVIEW is called a VIVI
(Virtual Instrument).(Virtual Instrument).The graphical programming is done on the The graphical programming is done on the
Block-Diagram Block-Diagram and the user interface is and the user interface is called the called the Front Panel. Front Panel.

A Look at the GUIA Look at the GUI
…where the user can select the signals’ angles of arrivals and the operating SNR (in dB)
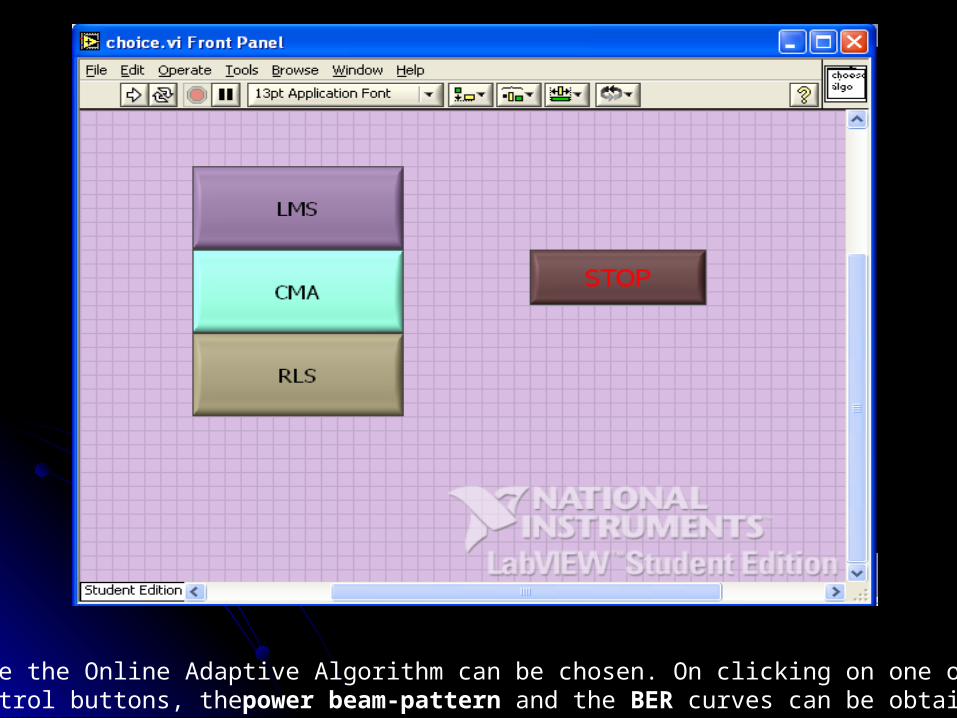
…where the Online Adaptive Algorithm can be chosen. On clicking on one of the control buttons, thepower beam-pattern and the BER curves can be obtained.
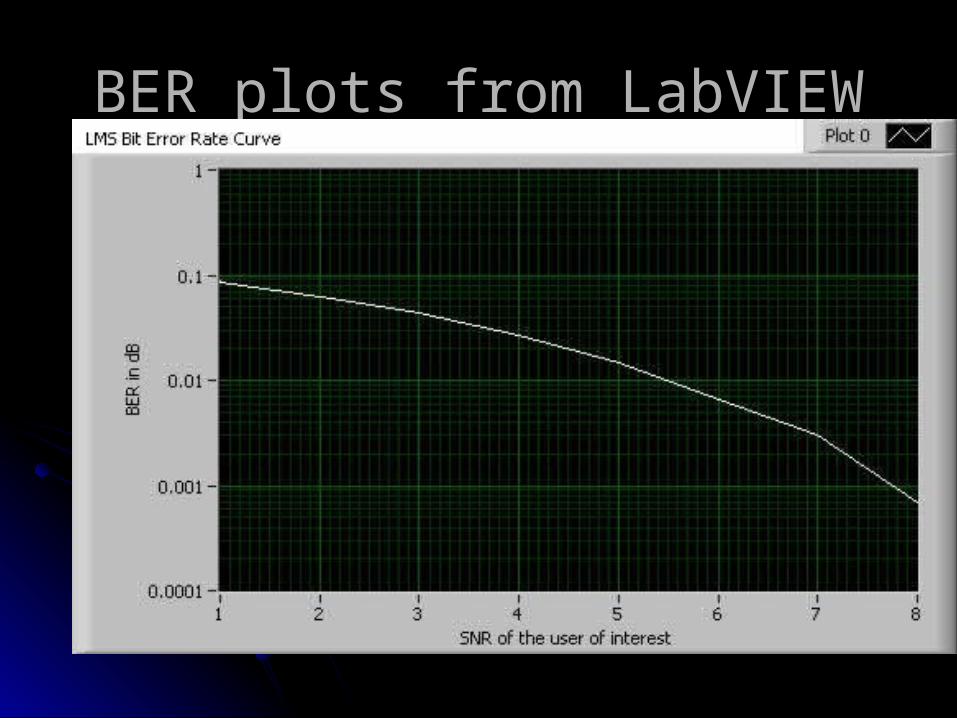
BER plots from LabVIEWBER plots from LabVIEW

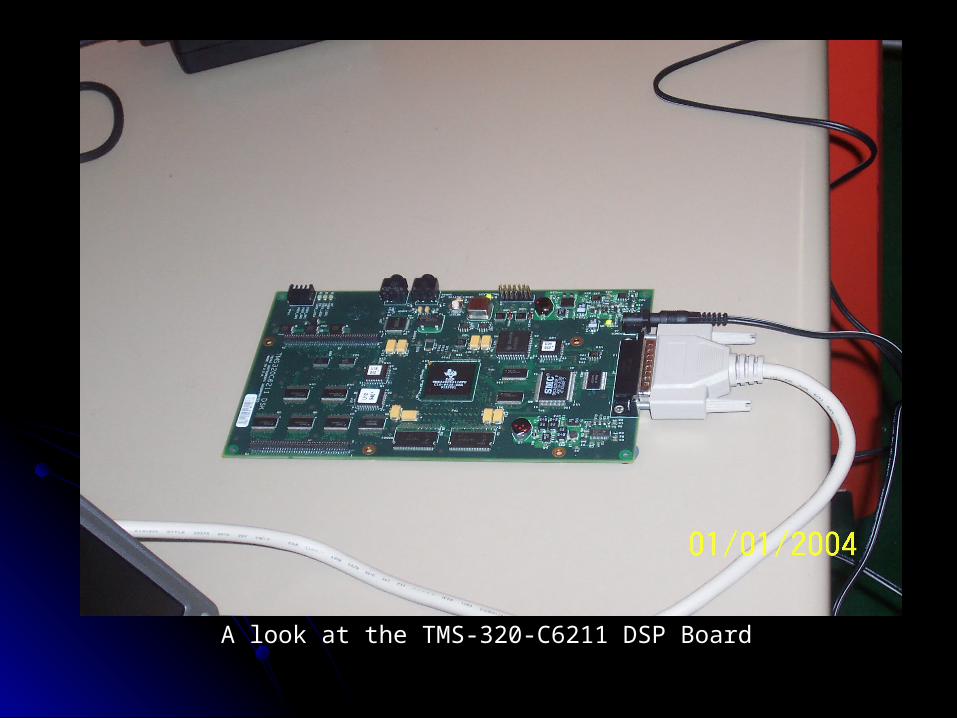
A look at the TMS-320-C6211 DSP Board

The DSP Board Interfaced with the Code Composer Studio that executes theC codes.
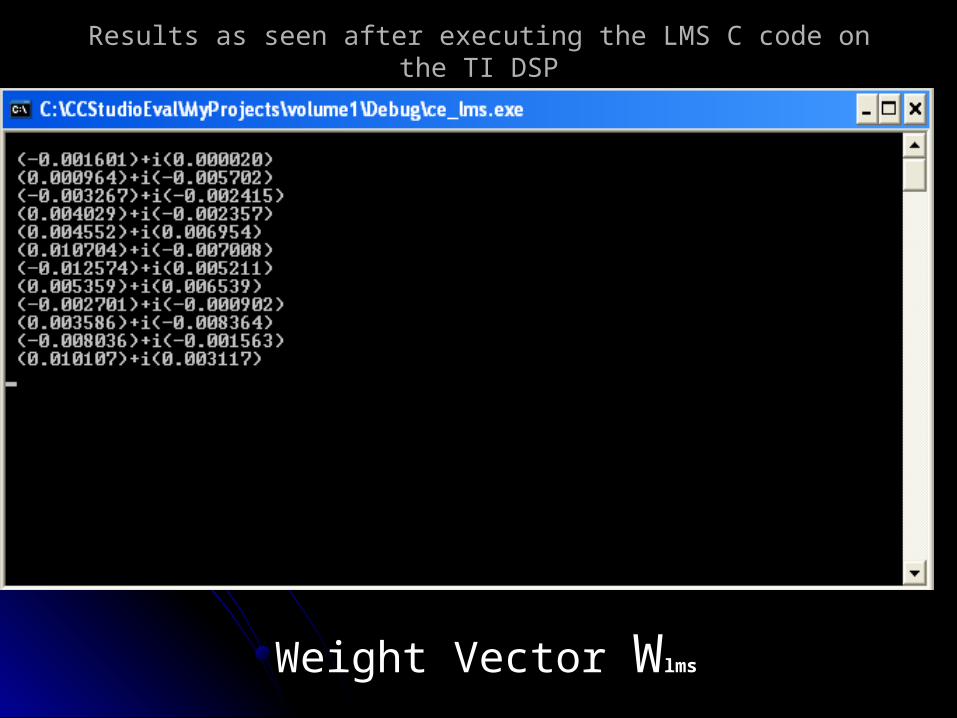
Results as seen after executing the LMS C code on the TI DSPResults as seen after executing the LMS C code on the TI DSP
Weight Vector Weight Vector WWlmslms
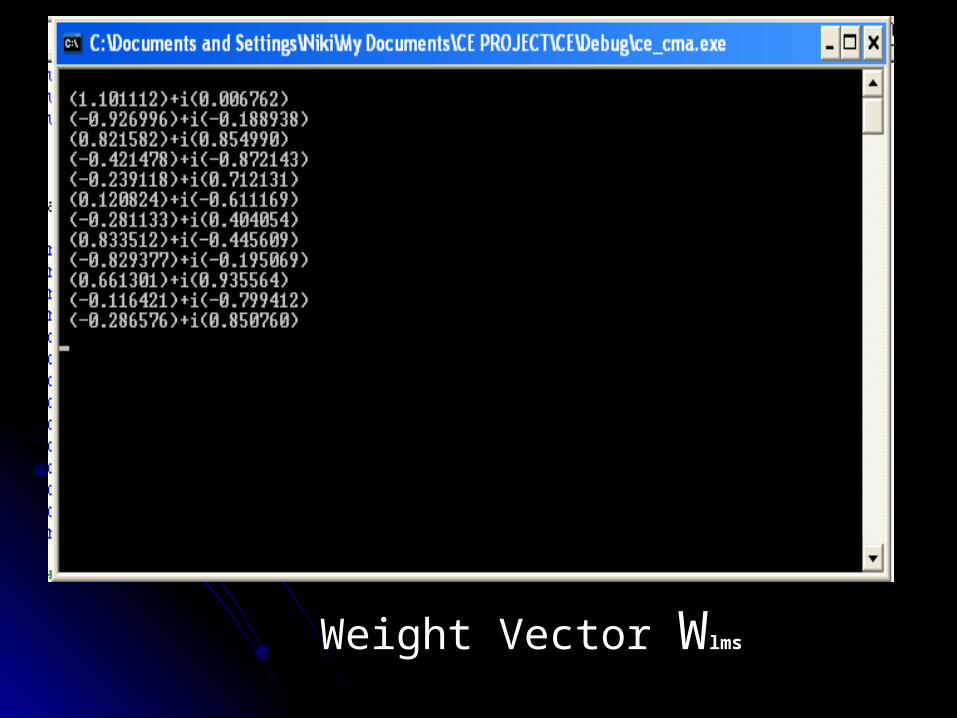
Weight Vector Weight Vector WWlmslms

OBJECTIVES ACHIEVEDOBJECTIVES ACHIEVED
The above described algorithms have been The above described algorithms have been implemented in MATLAB.implemented in MATLAB.
The codes have also been implemented in LabVIEW, The codes have also been implemented in LabVIEW, and the GUI has been developed in LabVIEW.and the GUI has been developed in LabVIEW.
Stand-alone codes have been written in C. Stand-alone codes have been written in C. Comparative analysis has been carried out by varying Comparative analysis has been carried out by varying
the number of iterations N, changing the direction of the number of iterations N, changing the direction of arrivals of the user of interest and the interferers.arrivals of the user of interest and the interferers.
Bit-Error-Rate performance for the three algorithms, Bit-Error-Rate performance for the three algorithms, and the convergence issues have been compared.and the convergence issues have been compared.
Successfully Interfaced the TMS-320-C6211 DSP kit Successfully Interfaced the TMS-320-C6211 DSP kit with the C codes. with the C codes.

Additional Work DoneAdditional Work Done
MATLAB analysis of some variants of LMS MATLAB analysis of some variants of LMS like, sign-LMS, Constraint LMS, etc has like, sign-LMS, Constraint LMS, etc has been done.been done.
Analysis of a Space Division Multiple Analysis of a Space Division Multiple Access (SDMA) system in MATLAB, Access (SDMA) system in MATLAB, LabVIEW and C.LabVIEW and C.
A simple Joint Space-Time Multiple A simple Joint Space-Time Multiple Access system has been considered.Access system has been considered.
A preview of the Joint Space -Time A preview of the Joint Space -Time SystemSystem
It is SDMA combined with the DS-CDMA It is SDMA combined with the DS-CDMA system, i.e. there is an Antenna Array at system, i.e. there is an Antenna Array at the receiver which exploits the spatial the receiver which exploits the spatial characteristics of the user of interest and characteristics of the user of interest and the interferers.the interferers.
We have not considered Multipath fading We have not considered Multipath fading and Rayleigh fading. We have an AWGN and Rayleigh fading. We have an AWGN channel, and AWGN channel fading is channel, and AWGN channel fading is taken into consideration.taken into consideration.

Joint ST : The 3-D space and time Joint ST : The 3-D space and time plotsplots
The DS-CDMA signals have a 12 bit signature The DS-CDMA signals have a 12 bit signature sequence generated by a PN generator. sequence generated by a PN generator. T=transmitted bit period for the user-of-interest and the T=transmitted bit period for the user-of-interest and the
interferersinterferers
TTs s =bit period of each signature bit (chip period)=bit period of each signature bit (chip period) Thus, T=12* TThus, T=12* Ts s
There are 12 antenna array elements at the There are 12 antenna array elements at the receiver. receiver.
We have plotted the power beam pattern with We have plotted the power beam pattern with respect to each signature bit, thus obtaining arespect to each signature bit, thus obtaining a3-D plot. 3-D plot.
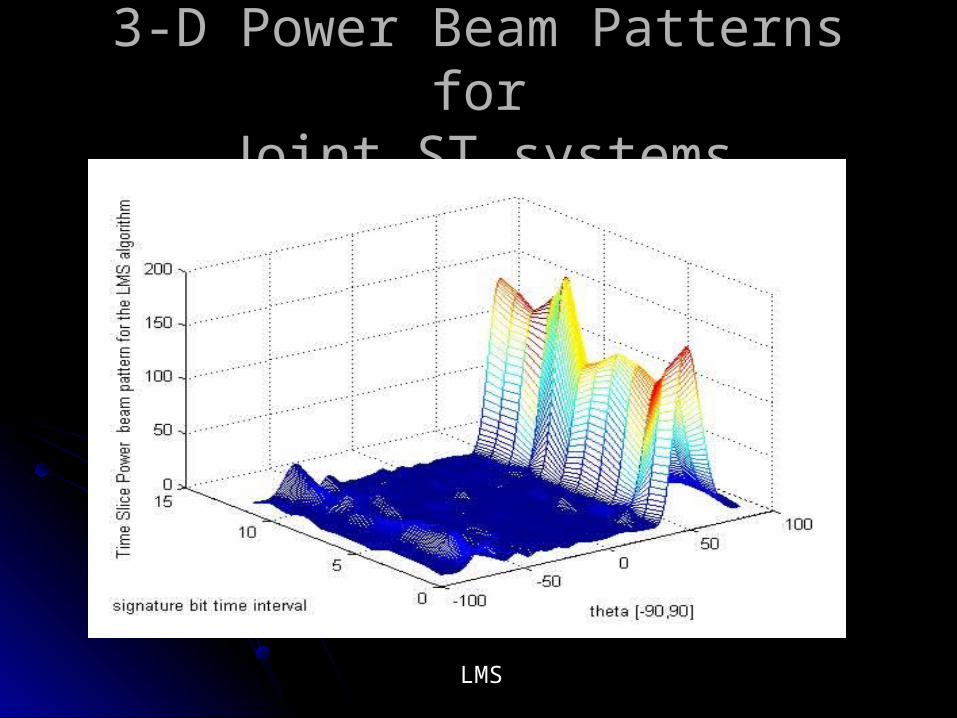
3-D Power Beam Patterns for3-D Power Beam Patterns forJoint ST systemsJoint ST systems
LMS
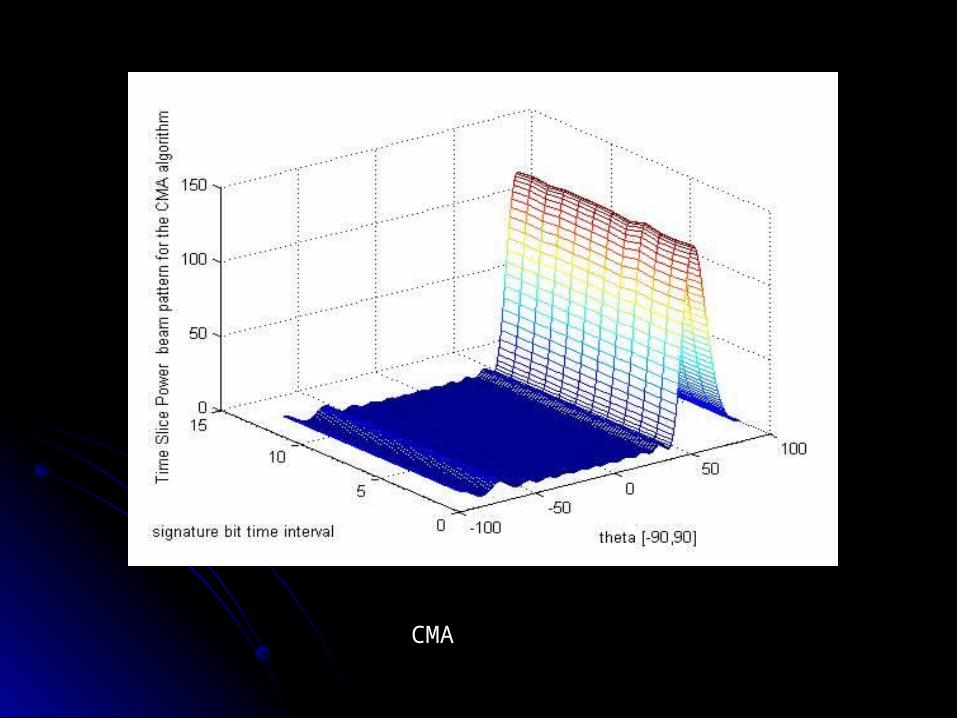
CMA
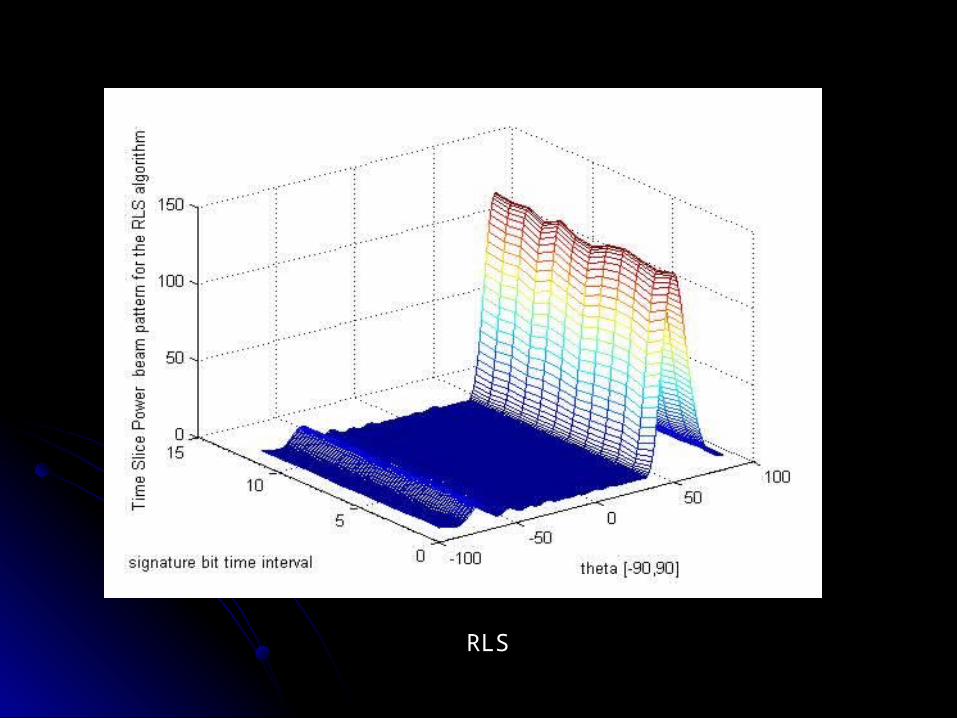
RLS