Embed Size (px)
Citation preview
ISSN: 0973-4945; CODEN ECJHAO
E-Journal of Chemistry
http://www.e-journals.net Vol. 5, No.4, pp. 904-913, October 2008
Study of Curing Kinetics and Thermal Degradation
of UV Curable Epoxy Acrylate Resin
AMRITA SHARMA*§, DEVENDRA AGARWAL
§
and JAGABIR SINGH#
§Department of Oil & Paint Technology,
H.B. Technological Institute, Kanpur - 208002, UP, India. #Jubilant Organosys Ltd. Plot 1A, Sector 16, Noida – 201301.
[email protected], Fax: +915122501541
Received 22 January 2008; Accepted 20 March 2008
Abstract: Blends of epoxy acrylate resins (acid values 3, 6.5 & 10 mg KOH/gm
Solid) with monofunctional monomers (ethoxylated phenol monoacrylate) were
prepared by physical mixing, having weight ratio 50:50. These blends were cured
by using UV radiations in presence of photo initiator (Darocure 1173). The thermal
degradation kinetics of these resin blends were studied, using thermo gravimetric
analysis in nitrogen atmosphere at a heating rate of 100C/min. by applying Coats-
Red fern equation. According to the analysis, all the coating films degrade in two
steps. In the first step of degradation kinetics, R2M follows 1.75 order (n=1.75) and
all other coating films follow second order (n=2) kinetics. In second step, R2M &
R3M follow half order (n=0.5) kinetics and R1M follow first order (n=1)
degradation kinetics. Order of the reaction is obtained on the basis of best fit
analysis, and all the parameters were confirmed by regression analysis. From the
reaction order, value of activation energy (E) and pre exponential factor (Z) were
calculated by the slop and intercept of the plot between X and Y, respectively.
Keywords: Epoxy acrylate, Thermal properties, Acid value, UV curing, Degradation kinetics
Introduction
Epoxy acrylate resins are commercially used in coatings and various structural applications. By
proper selection of epoxy acrylate resin and monomers, the cured thermosetting product can be
tailored to specific performance characteristics. The choice depends upon the cost, processing
and performance requirement. Cured epoxy acrylate resins exhibit excellent adhesion to a
905 D. AGARWAL et al.
variety of substrates, good chemical and corrosion resistance, excellent electrical insulation,
high tensile, flexural strength, good compressive strength and thermal stability. The largest
single use is in coatings, where high chemical, corrosion resistance and adhesion are
important. The exceptional adhesion performance is due to the presence of polar hydroxyl
and ether groups in the backbone structure of epoxy resins1–3
. The presence of unsaturation
at the end of the polymer backbone (due to reaction with acid functional acrylic monomers)
has shaped epoxy resins for the radiation curing industry. Terminal unsaturated double
bonds are the reactive sites for coatings and paints4–6
. Unsaturated monofunctional,
multifunctional acrylated monomer and acrylated oligomer having epoxy backbone are
capable of a rational designed formulation that provides good coating properties after curing.
In general, the UV curing process results in three dimensional network formations. The
curing process is fast and depends on the radiation dose and the time of radiation7. UV curing,
i.e., the process of photo initiated conversion of polymeric materials from a liquid to a solid is
a popular alternative to conventional thermal curing8. UV curing systems had recently
succeeded in a large number of new applications and expanded toward new markets9-11
. Many
of these become possible because of the development of new UV-curable system that is
commercially available12
. UV curing process has attractive advantages over thermal curing. Its
major advantages are high-speed process, low energy consumption (as the operation at room
temperature), and environmental friendly as there is no solvent exposure13
. Generally, UV-
curable formulations contain oligomer or prepolymer consisting of reactive sites based on a
functional acrylate group to meet the VOC compliance14
. Several researchers15-18
studied the
thermal degradation mechanism of different products.
In this study, epoxy resins were reacted with acrylic acid. The acrylated oligomer were
mixed with ethoxylated phenol monoacrylate and cured by UV radiation. The aim of this
study was to analyze the effect on the thermal properties of polymeric film due to the
presence of Epoxy acrylate resins of different acid values and monofunctional monomer.
Experimental
Materials
Epoxy resin (M/S Parik Resin), acrylic acid (M/S), triethyl amine (M/S), ethoxylated phenol
monoacrylate (M/S Cognis), Darocure 1173 (Ciba Specialty Chemical), ethyl alcohol
(Ranbaxy Laboratories Ltd.), NaOH (E. Merck), H2SO4 (S.D. Fine Chemicals) were used
during the Investigation.
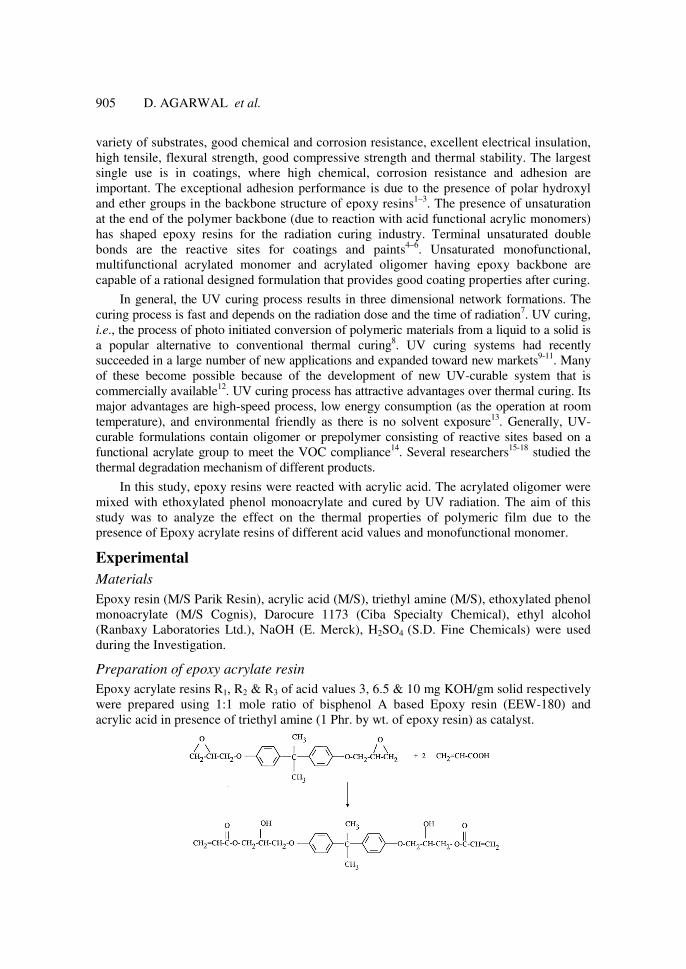
Preparation of epoxy acrylate resin
Epoxy acrylate resins R1, R2 & R3 of acid values 3, 6.5 & 10 mg KOH/gm solid respectively
were prepared using 1:1 mole ratio of bisphenol A based Epoxy resin (EEW-180) and
acrylic acid in presence of triethyl amine (1 Phr. by wt. of epoxy resin) as catalyst.
Study of Curing Kinetics and Thermal Degradation 906
Characterization of epoxy acrylate resin
Determination of acid value
The acid value of epoxy acrylate resin was determined according to Karshak and
Vinogradova19
Acid value = 56.1× (A-B) × N/ W
Where, A = mL. of KOH of sample
B = mL. of KOH of blank
W = wt. of resin (g)
Extent of reaction
The extent of reaction ‘p’ defined as the fraction of carboxyl group that has reacted in time t,
was calculated from the acid value of the resins which a measure of the concentration of
carboxyl groups is using following equation:
Extent of reaction (P) = 1- M/M0
where, M0 = initial acid value
M = acid value at time T
Preparation of blends of epoxy acrylate resin & mono functional monomer
(ethoxylated Phenol monoacrylate)
Epoxy acrylate resins (R1, R2 & R3) were mixed with ethoxylated phenol monoacrylate
(EOPA) with wt ratio 50/50, based on physical mixing. All the samples were designated
according to Table 1. These blends were cured by adding a requisite amount of photo
initiator (Darocure 1173) and cured by UV radiations. The degradation kinetics of these
blends was studied by thermogravimetric analysis.
The reactive thermal stability of experimental resins was quantitatively estimated by
comparing temperatures for a particular degree of weight loss (Thermogravimetric analyzer
TGA Q 50 V 6.1 Build 181).
The Coats-Red Fern equation was used to determine the values of the activation energy
(E) and pre-exponential factor (Z).
log10 [g (α)/T2] =
log10 [ZR/β E (1-2RT/E)]-E/2.303RT (1)
where, g (α) = {1-(1- α)1-n
/ 1-n for n≠1- log10 {- log10 (1- α) for n=1
Equation (1) can be reduce to
Y = A + B/1000 X (2)
where, Y = log [g (α)/ T2]
for different values of n lying between 0 and 2
X = 1000/T
A = log10 [ZR/β E (1-2RT/E]
B = -E/2.303 R
α = WT - Wf / Wo - Wf
where, α = fractional w. loss
WT = Wt. at temp. T
Wf = Final wt.
W0 = Initial wt.
R = Gas constant
A graph of X vs. Y was plotted on the basis of best fit technique, and the value on n, was
calculated. The value of n was confirmed by regression analysis. The samples have been
designated according to the blend of epoxy acrylate resins and mono functional reactive diluent.
(Table 1)
907 D. AGARWAL et al.
Table 1. Sample designation of various blends sample
Results and Discussion
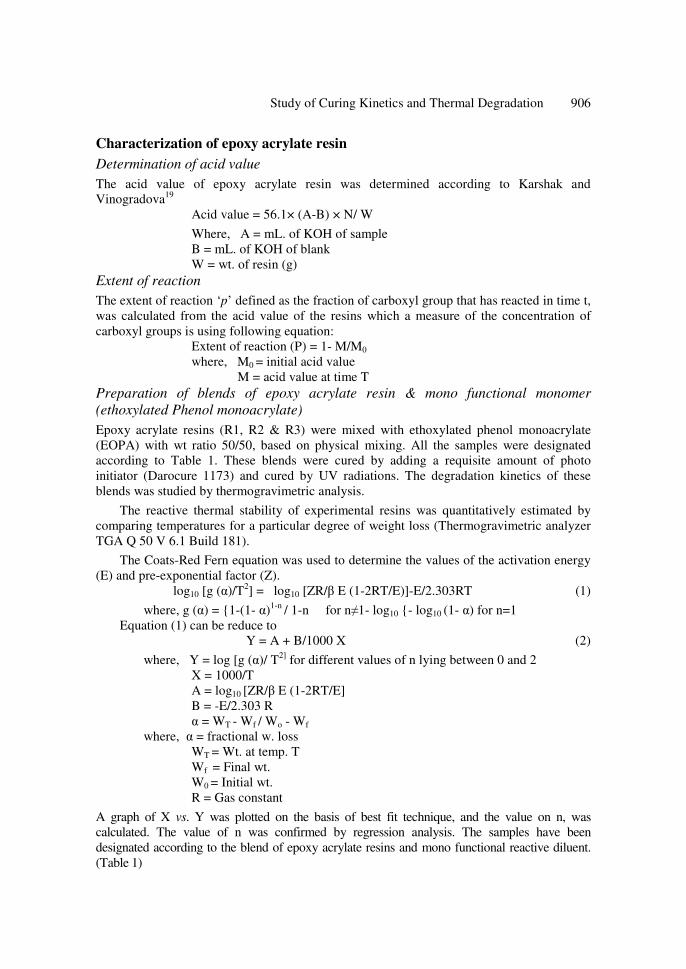
Figure 1 shows the change in the acid value of different epoxy acrylate samples (R1, R2 &
R3) with reaction time. It is apparent from the figure that the acid value decreases with the
reaction time. It is apparent from the plot that the decrease in acid value in the initial stages
of the reaction is not linear. This is because of high concentration of the reactive sites and
greater possibility of association of the acid and epoxide groups.
0
20
40
60
80
100
120
140
0 50 100 150 200 250 300 350
R1
R2
R3
Figure 1. Acid value vs. reaction time
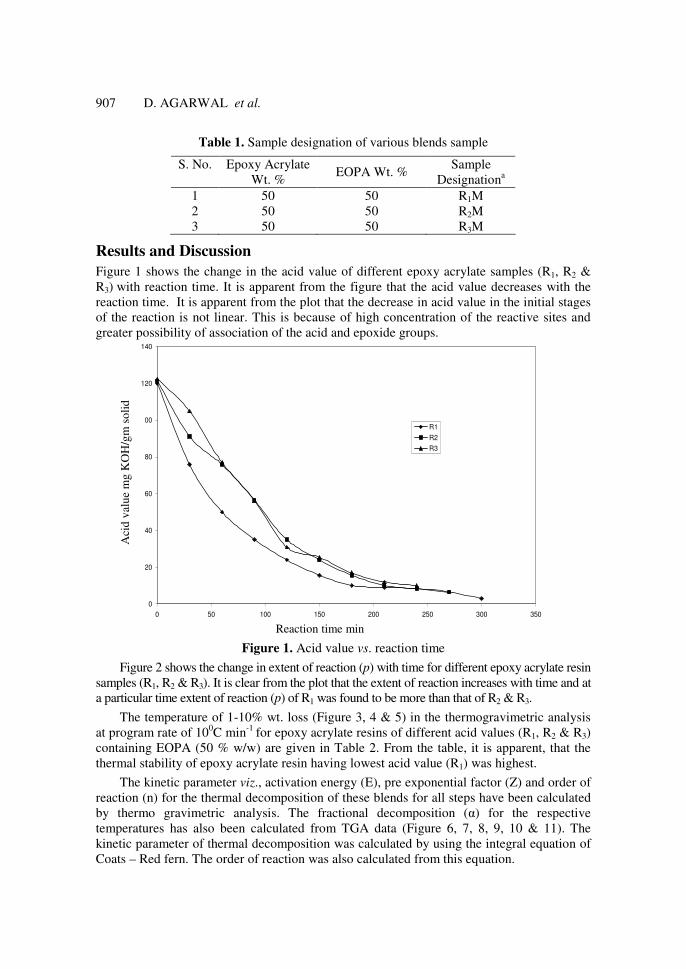
Figure 2 shows the change in extent of reaction (p) with time for different epoxy acrylate resin
samples (R1, R2 & R3). It is clear from the plot that the extent of reaction increases with time and at
a particular time extent of reaction (p) of R1 was found to be more than that of R2 & R3.
The temperature of 1-10% wt. loss (Figure 3, 4 & 5) in the thermogravimetric analysis
at program rate of 100C min
-1 for epoxy acrylate resins of different acid values (R1, R2 & R3)
containing EOPA (50 % w/w) are given in Table 2. From the table, it is apparent, that the
thermal stability of epoxy acrylate resin having lowest acid value (R1) was highest.
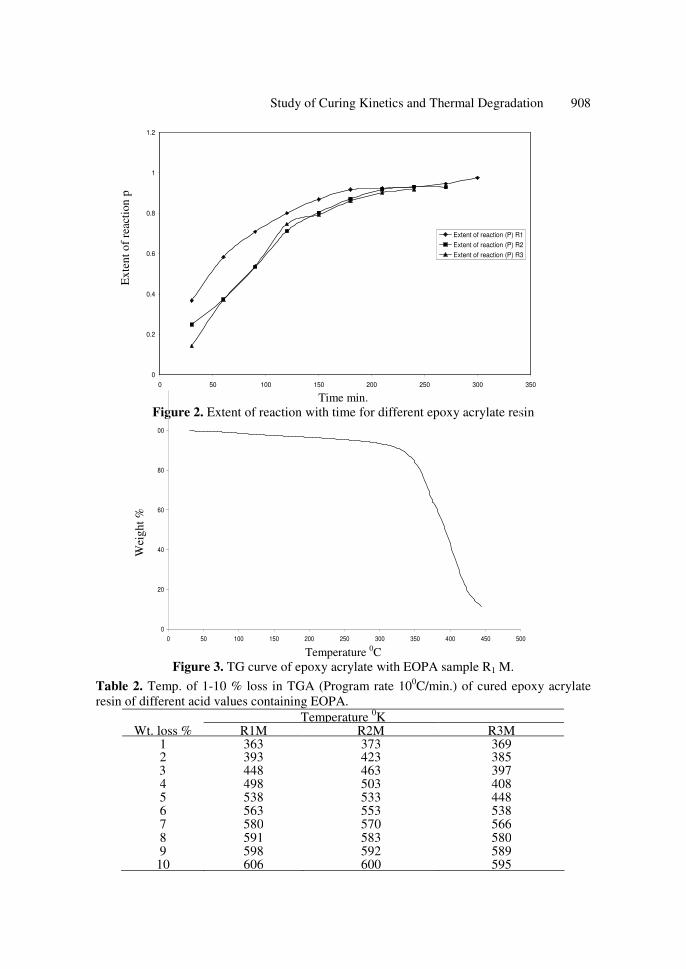
The kinetic parameter viz., activation energy (E), pre exponential factor (Z) and order of
reaction (n) for the thermal decomposition of these blends for all steps have been calculated
by thermo gravimetric analysis. The fractional decomposition (α) for the respective
temperatures has also been calculated from TGA data (Figure 6, 7, 8, 9, 10 & 11). The
kinetic parameter of thermal decomposition was calculated by using the integral equation of
Coats – Red fern. The order of reaction was also calculated from this equation.
S. No.
Epoxy Acrylate
Wt. % EOPA Wt. %
Sample
Designationa
1 50 50 R1M
2 50 50 R2M
3 50 50 R3M
Aci
d v
alu
e m
g K
OH
/gm
so
lid
Reaction time min
Study of Curing Kinetics and Thermal Degradation 908
0
0.2
0.4
0.6
0.8
1
1.2
0 50 100 150 200 250 300 350
Extent of reaction (P) R1
Extent of reaction (P) R2
Extent of reaction (P) R3
Time min.
Figure 2. Extent of reaction with time for different epoxy acrylate resin
0
20
40
60
80
100
0 50 100 150 200 250 300 350 400 450 500 Temperature 0C
Figure 3. TG curve of epoxy acrylate with EOPA sample R1 M.
Table 2. Temp. of 1-10 % loss in TGA (Program rate 100C/min.) of cured epoxy acrylate
resin of different acid values containing EOPA.
Temperature 0K
Wt. loss % R1M R2M R3M 1 363 373 369 2 393 423 385
3 448 463 397 4 498 503 408 5 538 533 448 6 563 553 538 7 580 570 566 8 591 583 580 9 598 592 589
10 606 600 595
Ex
ten
t o
f re
acti
on
p
Wei
gh
t %
909 D. AGARWAL et al.
0
20
40
60
80
100
0 50 100 150 200 250 300 350 400 450 500 Temperature 0C
Figure 4. TG curve of epoxy acrylate with EOPA sample R2 M
0
20
40
60
80
100
0 50 100 150 200 250 300 350 400 450 500 Temperature 0C
Figure 5. TG curve of epoxy acrylate with EOPA sample R3 M
0
1
2
3
4
5
6
7
1.5 1.55 1.6 1.65 1.7 1.75 1.8 1.85 1.9 1/Tx101
Figure 6. Plot between 1-1-a 1.n /1.-n and reciprocal of temperature from TGA data for
R1M Step 1.
Wei
gh
t %
W
eig
ht
%
1-1
-a 1
-n /
1-n
Study of Curing Kinetics and Thermal Degradation 910
0
0.1
0.2
0.3
0.4
0.5
0.6
0.7
0.8
0.9
1
1.435 1.445 1.455 1.465 1.475 1.485 1.495 1.505 1.515 1.525 1/Tx103
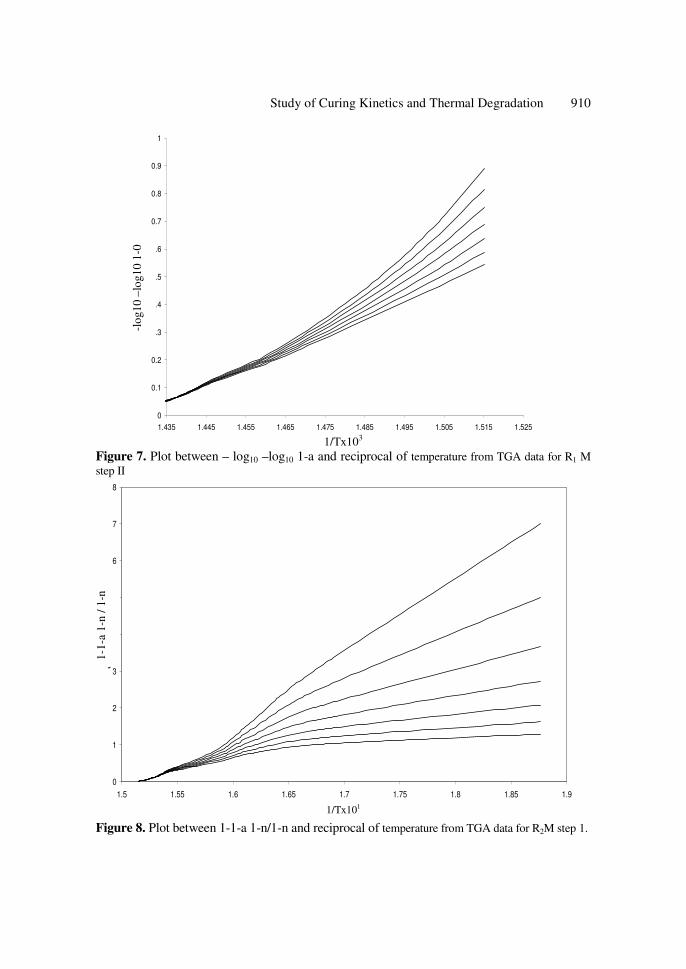
Figure 7. Plot between – log10 –log10 1-a and reciprocal of temperature from TGA data for R1 M
step II
0
1
2
3
4
5
6
7
8
1.5 1.55 1.6 1.65 1.7 1.75 1.8 1.85 1.9
{1-(
1- α
)1-n
/ 1
-n}
1/Tx101
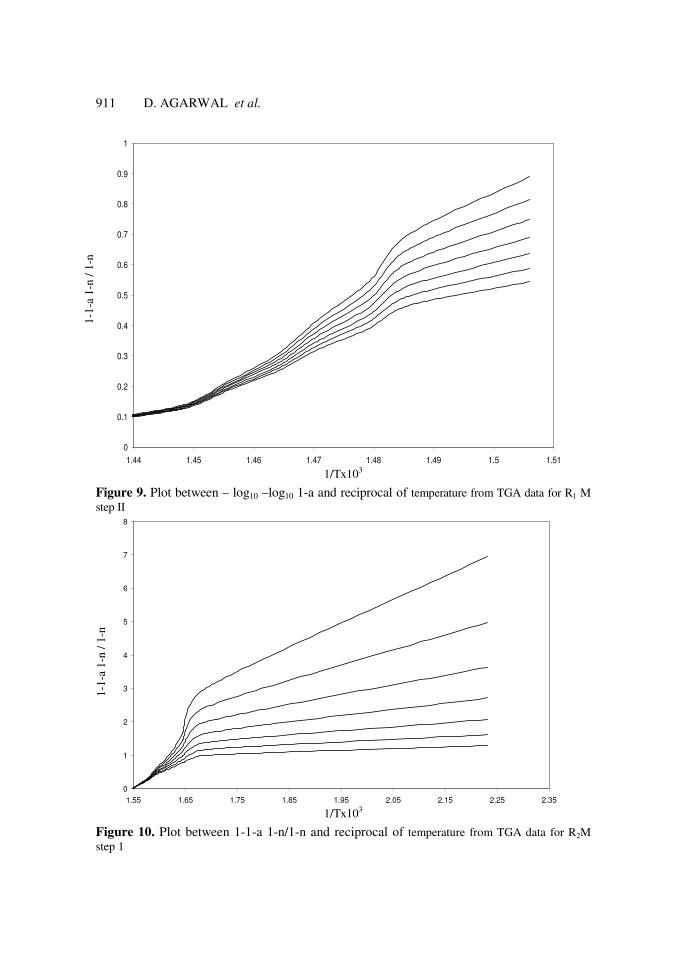
Figure 8. Plot between 1-1-a 1-n/1-n and reciprocal of temperature from TGA data for R2M step 1.
-lo
g1
0 –
log1
0 1
-0
1-1
-a 1
-n /
1-n
911 D. AGARWAL et al.
0
0.1
0.2
0.3
0.4
0.5
0.6
0.7
0.8
0.9
1
1.44 1.45 1.46 1.47 1.48 1.49 1.5 1.51 1/Tx103
Figure 9. Plot between – log10 –log10 1-a and reciprocal of temperature from TGA data for R1 M
step II
0
1
2
3
4
5
6
7
8
1.55 1.65 1.75 1.85 1.95 2.05 2.15 2.25 2.35 1/Tx103
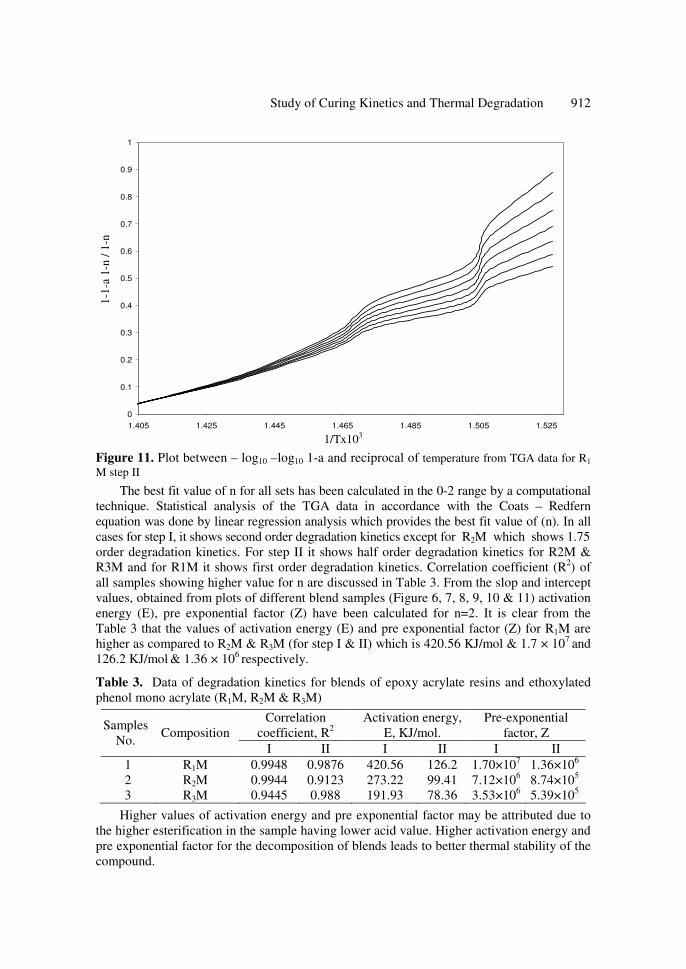
Figure 10. Plot between 1-1-a 1-n/1-n and reciprocal of temperature from TGA data for R2M
step 1
1-1
-a 1
-n /
1-n
1
-1-a
1-n
/ 1
-n
Study of Curing Kinetics and Thermal Degradation 912
0
0.1
0.2
0.3
0.4
0.5
0.6
0.7
0.8
0.9
1
1.405 1.425 1.445 1.465 1.485 1.505 1.525
{1-(
1- α
)1-n
/ 1
-n}
1/Tx103
Figure 11. Plot between – log10 –log10 1-a and reciprocal of temperature from TGA data for R1
M step II
The best fit value of n for all sets has been calculated in the 0-2 range by a computational
technique. Statistical analysis of the TGA data in accordance with the Coats – Redfern
equation was done by linear regression analysis which provides the best fit value of (n). In all
cases for step I, it shows second order degradation kinetics except for R2M which shows 1.75
order degradation kinetics. For step II it shows half order degradation kinetics for R2M &
R3M and for R1M it shows first order degradation kinetics. Correlation coefficient (R2) of
all samples showing higher value for n are discussed in Table 3. From the slop and intercept
values, obtained from plots of different blend samples (Figure 6, 7, 8, 9, 10 & 11) activation
energy (E), pre exponential factor (Z) have been calculated for n=2. It is clear from the
Table 3 that the values of activation energy (E) and pre exponential factor (Z) for R1M are
higher as compared to R2M & R3M (for step I & II) which is 420.56 KJ/mol & 1.7 × 10⁷
and
126.2 KJ/mol & 1.36 × 10
6 respectively.
Table 3. Data of degradation kinetics for blends of epoxy acrylate resins and ethoxylated
phenol mono acrylate (R1M, R2M & R3M)
Correlation
coefficient, R2
Activation energy,
E, KJ/mol.
Pre-exponential
factor, Z Samples
No. Composition
I II I II I II
1 R1M 0.9948 0.9876 420.56 126.2 1.70×10⁷ 1.36×10
6
2 R2M 0.9944 0.9123 273.22 99.41 7.12×10⁶ 8.74×10
5
3 R3M 0.9445 0.988 191.93 78.36 3.53×10⁶ 5.39×10
5
Higher values of activation energy and pre exponential factor may be attributed due to
the higher esterification in the sample having lower acid value. Higher activation energy and
pre exponential factor for the decomposition of blends leads to better thermal stability of the
compound.
1-1
-a 1
-n /
1-n
913 D. AGARWAL et al.
Conclusion
An attempt has been made to establish the correlation among the data obtained from
different tests and to suggest how best the findings can be used in assessing the performance
of coatings. The practical data obtained from some of the essential tests conducted on the
unsupported and supported coatings were discussed to project their performance criteria.
The data obtained from different test, shows that the UV curable formulations with lower
acid value have good thermal behavior which may be due to the higher esterification during
the reaction.
References
1 Lee H and Nevelle K, Handbook of epoxy resin, McGraw-Hill, 1972, pp. 1.
2 Oprea S, Vlad S, Stanciu A and Macoveanu M, Eur Polym J., 2000, 36, 373.
3 Cascaval C N, Rosu D and Stoleriu A, Polym Deg Stab, 1997, 55, 281.
4 Annelese E and Gerbase, Surf Coat Int., 2002, 8, 79.
5 Bajpai M, Shukla V and Kumar A, Prog Org Coat., 2002, 44, 271.
6 Agarwal D, Vasishtha A K, Surf Coat Int., 1983, 66, 1.
7 Weiss K D, Prog Polym Sci., 1997, 22, 203.
8 Haering E, Application of radiation curable coatings on metal substrates, Maecel
Dekker, Inc, New York, 1984.
9 Goss B, Int J Adhes Adhes, 2002, 22, 405.
10 Green G E, Stark B P and Zahir S A, J. J Macromol Sci Rev Macromol Chem C.,
1982, 21, 187.
11 Kloosterboer J G, Adv Polym Sci., 1988, 84,1.
12 Decker C, Viet T N, Decker D and Weber-Koehl E, Polymer, 2001, 42, 5531.
13 Zhang JY, Windall G and Boyd I W, Appl Surf Sci., 2002, 186, 568.
14 Narayan R, Doctoral Thesis, Submitted to ISM, Dhanbad, India.
15 Mehrotra K N and Rawat M K, Colloid & Polymer Science, 1992, 270, 1232-1236.
16 Straszko J, Olszak-Humienik M and Mozejko J, J Therm Anal Calor., 1996, 48,
1415-1422.
17 Ian Hamerton, Alen M. Emsley, Brendan J Howlin, Paul Klewpatinond and Shinji
Takeda, Polymer, 2004, 45, 2193-2199.
18 Salmoria G V, Gonzalez VJ, Ahrens C H, Soldi V and Pires A T N, J Mater Process
Technol., 2005, 168, 164-171.
19 Karshak V V, Vinogradova, in: Burdon Ed., Polyesters, Pergamon Press, Oxford,
1965, p. 191.

Submit your manuscripts athttp://www.hindawi.com
Hindawi Publishing Corporationhttp://www.hindawi.com Volume 2014
Inorganic ChemistryInternational Journal of
Hindawi Publishing Corporation http://www.hindawi.com Volume 2014
International Journal ofPhotoenergy
Hindawi Publishing Corporationhttp://www.hindawi.com Volume 2014
Carbohydrate Chemistry
International Journal of
Hindawi Publishing Corporationhttp://www.hindawi.com Volume 2014
Journal of
Chemistry
Hindawi Publishing Corporationhttp://www.hindawi.com Volume 2014
Advances in
Physical Chemistry
Hindawi Publishing Corporationhttp://www.hindawi.com
Analytical Methods in Chemistry
Journal of
Volume 2014
Bioinorganic Chemistry and ApplicationsHindawi Publishing Corporationhttp://www.hindawi.com Volume 2014
SpectroscopyInternational Journal of
Hindawi Publishing Corporationhttp://www.hindawi.com Volume 2014
The Scientific World JournalHindawi Publishing Corporation http://www.hindawi.com Volume 2014
Medicinal ChemistryInternational Journal of
Hindawi Publishing Corporationhttp://www.hindawi.com Volume 2014
Chromatography Research International
Hindawi Publishing Corporationhttp://www.hindawi.com Volume 2014
Applied ChemistryJournal of
Hindawi Publishing Corporationhttp://www.hindawi.com Volume 2014
Hindawi Publishing Corporationhttp://www.hindawi.com Volume 2014
Theoretical ChemistryJournal of
Hindawi Publishing Corporationhttp://www.hindawi.com Volume 2014
Journal of
Spectroscopy
Analytical ChemistryInternational Journal of
Hindawi Publishing Corporationhttp://www.hindawi.com Volume 2014
Journal of
Hindawi Publishing Corporationhttp://www.hindawi.com Volume 2014
Quantum Chemistry
Hindawi Publishing Corporationhttp://www.hindawi.com Volume 2014
Organic Chemistry International
Hindawi Publishing Corporationhttp://www.hindawi.com Volume 2014
CatalystsJournal of
ElectrochemistryInternational Journal of
Hindawi Publishing Corporation http://www.hindawi.com Volume 2014


![Degradation Kinetics of Metronidazole in Solution[1]](https://img.pdfslide.us/doc/110x75/54f94e5c4a7959d7638b4b82/degradation-kinetics-of-metronidazole-in-solution1.jpg)