Embed Size (px)
Citation preview
© Glencoe/McGraw-Hill 67 Mathematics: Applications and Concepts, Course 2
Less
on
2–1
ATHLETIC SHOES The table showsprices of 20 types of athletic shoes at a recent sidewalk sale. Make afrequency table and then determinehow many types are available forless than $80.
Step 1 Choose an appropriate interval and scale for thedata. The scale should include the least price, $43,and the greatest price, $135.
Step 2 Draw a table with three columns and label the columns Price, Tally, and Frequency.
Step 3 Complete the table.
Step 4 Two categories include prices less than $80.$40–$59 5 5 types$60–$79 5 7 typesSo, 5 1 7 or 12 types of shoes cost less than $80.
For Exercises 1 and 2, use the table below.
1. Make a frequency table of the data.
2. Use your frequency table to determine how many students studied
10 hours or more.
A frequency table uses tally marks to show how many times each piece of data appears. If the data
is numerical, the table should have a scale which includes the least and the greatest numbers. Also,
each table should have an interval which separates the scale into equal parts.
NAME ________________________________________ DATE ______________ PERIOD _____
Study Guide and Intervention
Frequency Tables
Price($) Tally Frequency40–59 5 560–79 52 780–99 3 3
100–119 2 2120–139 3 3
Hours Tally Frequency5
52
51
2
Prices of Athletic Shoes ($)
607043
100
4595
11075
1201358470
75657085
504753
130
Hours Spent Studyingfor Math Exam
3 7 10 0 2
12 18 3 1 15
10 11 8 5 9
8 12 6 8 12

Make a frequency table of each set of data.
1.
R 5 regular, W 5 whitening,
T 5 tartar control, S 5 sensitive
2.
3. Use your frequency table from Exercise 1. Which type of toothpaste is
preferred by more students than any other type?
4. Use your frequency table from Exercise 2. Which age is least common
among the students in the class?
ALBUMS For Exercises 5–7, use the data at the right. It shows the number of albums,sold to the nearest million, of the top-sellingalbums of all time.
5. Make a frequency table of the data. Use the intervals
14–16, 17–19, 20–22, 23–25, and 26–28.
6. How many albums sold more than 25 million copies?
7. How many albums sold less than 20 million copies?
NAME ________________________________________ DATE ______________ PERIOD _____
Practice: Skills
Frequency Tables
© Glencoe/McGraw-Hill 68 Mathematics: Applications and Concepts, Course 2
Students’ Choices of Toothpaste
R S R W T
T T R T W
R W T S T
R W W T T
Ages of Students in a Class
11 10 11 12 12
13 11 10 12 10
11 11 12 11 13
Toothpaste Tally Frequency5
5
53
2
Age Tally Frequency3
51
4
2
Number of AlbumsSold (millions)
26 19 18 16 21
16 16 27 15 14
22 17 15 19 16
16 15 14 23 15
18 15 16 15 15
Albums Sold (millions) Tally Frequency
14–16
17–19
20–22
23–25
26–28
© Glencoe/McGraw-Hill 69 Mathematics: Applications and Concepts, Course 2
Less
on
2–1
5. Make a frequency table of the data.
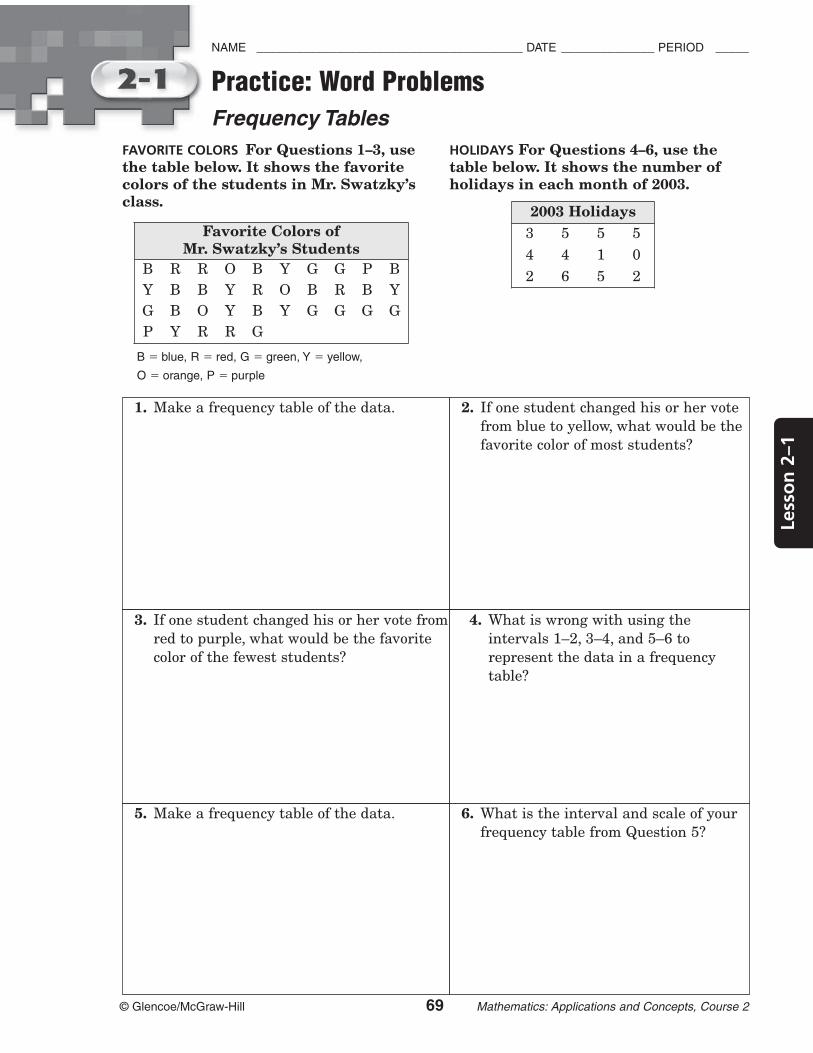
FAVORITE COLORS For Questions 1–3, use the table below. It shows the favoritecolors of the students in Mr. Swatzky’sclass.
B 5 blue, R 5 red, G 5 green, Y 5 yellow,
O 5 orange, P 5 purple
1. Make a frequency table of the data.
Favorite Color
NAME ________________________________________ DATE ______________ PERIOD _____
Practice: Word Problems
Frequency Tables
Tally Frequency
Holidays Tally Frequency
HOLIDAYS For Questions 4–6, use thetable below. It shows the number ofholidays in each month of 2003.
2. If one student changed his or her vote
from blue to yellow, what would be the
favorite color of most students?
3. If one student changed his or her vote from
red to purple, what would be the favorite
color of the fewest students?
4. What is wrong with using the
intervals 1–2, 3–4, and 5–6 to
represent the data in a frequency
table?
6. What is the interval and scale of your
frequency table from Question 5?
Favorite Colors ofMr. Swatzky’s Students
B R R O B Y G G P B
Y B B Y R O B R B Y
G B O Y B Y G G G G
P Y R R G
2003 Holidays
3 5 5 5
4 4 1 0
2 6 5 2
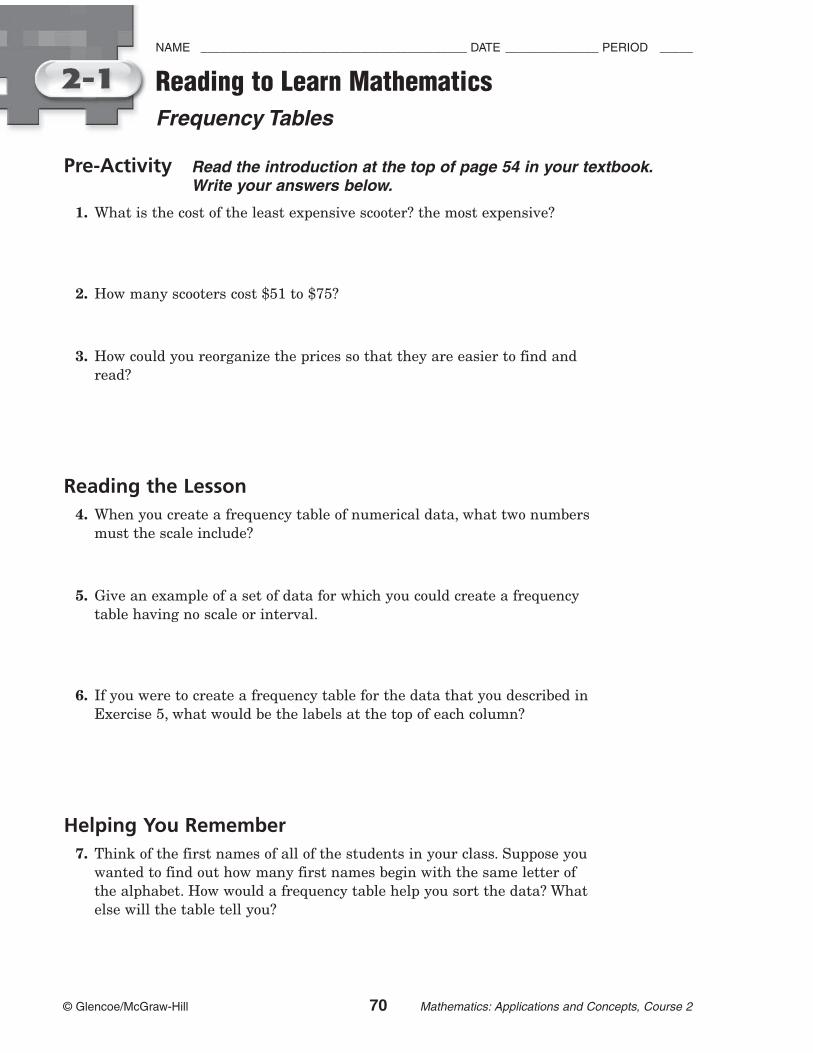
Pre-Activity Read the introduction at the top of page 54 in your textbook.Write your answers below.
1. What is the cost of the least expensive scooter? the most expensive?
2. How many scooters cost $51 to $75?
3. How could you reorganize the prices so that they are easier to find and
read?
Reading the Lesson
4. When you create a frequency table of numerical data, what two numbers
must the scale include?
5. Give an example of a set of data for which you could create a frequency
table having no scale or interval.
6. If you were to create a frequency table for the data that you described in
Exercise 5, what would be the labels at the top of each column?
Helping You Remember
7. Think of the first names of all of the students in your class. Suppose you
wanted to find out how many first names begin with the same letter of
the alphabet. How would a frequency table help you sort the data? What
else will the table tell you?
NAME ________________________________________ DATE ______________ PERIOD _____
Reading to Learn Mathematics
Frequency Tables
© Glencoe/McGraw-Hill 70 Mathematics: Applications and Concepts, Course 2

© Glencoe/McGraw-Hill 71 Mathematics: Applications and Concepts, Course 2
Breaking the Code
Many secret messages are written in code. One way to construct a code is touse a substitution alphabet. For example, the letter A might be coded into Y,the letter B into R, and so on until every letter is coded.
To break a code of this type, it is helpful to know that the letters of thealphabet occur with different frequencies. For example, the letter E occurs anaverage of 13 times out of every 100 letters. In any message, however, thefrequencies will vary.
Use the clues below to break this coded message.
“FOZ BUJRSJBKD CJMMJSGDFE,” UZQKUAZC VOZUDNSA ONDQZV, “DKE JR FOZ
MKSF NM FOZUZ HZJRT FNN QGSO ZYJCZRSZ. POKF PKV YJFKD PKV NYZUDKJC
KRC OJCCZR HE POKF PKV JUUZDZYKRF.”
1. On another sheet of paper, make a frequency distribution chart for the
letters in the message. Which seven letters in the message appear most
frequently?
2. The most frequently used letter in the alphabet is E, so write an E
underneath each place this letter occurs in the message.
3. The word the is very common and appears twice in the message. Use this
fact to determine which letters stand for T and H.
4. The word was occurs three times in the last sentence. What letters
represent W, A, and S in the message?
5. The message is a quote from a famous detective whose last name begins
with H. Complete the detective’s name and you will have three more
letters.
6. What is the message?
Enrichment
NAME ________________________________________ DATE ______________ PERIOD _____
Less
on
2–1
Letters
E
T
A, O
N
I, R
S, H
Frequency(per hundred)
13
9
8
7
6.5
6

© Glencoe/McGraw-Hill 72 Mathematics: Applications and Concepts, Course 2
BASKETBALL The table shows how many successful free throws Brettmade. Make a line graph and predict how many successful freethrows he will make in 8 minutes.
Brett will make about 31 free throws in 8 minutes.
GROWTH RATE For Exercises 1 and 2, use the table that shows a puppy’s weight by month.
1. Make a line graph of the data.
2. Predict her weight at six months.
21 3 4 5 6
Wei
ght
(lb
)
Month
9
6
3
12
15
18
0
1 2 3 4 5 6 7 8
15
10
5
20
25
30
35
40
Num
ber
of
Succ
essf
ul
Free
Thro
ws
Time (min)
0
NAME ________________________________________ DATE ______________ PERIOD _____
Study Guide and Intervention
Making Predictions
A scatter plot displays two sets of data on the same graph and shows trends in data. A line graph
is a graph made by connecting the data points from a set of data. A line graph can be useful in
predicting future events.
Time(min)
0 0
Number of SuccessfulFree Throws
1 5
2 9
3 12
4 15
Month Weight (lb)
0 7
2 10
3 13
1 9
© Glencoe/McGraw-Hill 73 Mathematics: Applications and Concepts, Course 2
Less
on
2–2
Practice: Skills
Making Predictions
NAME ________________________________________ DATE ______________ PERIOD _____
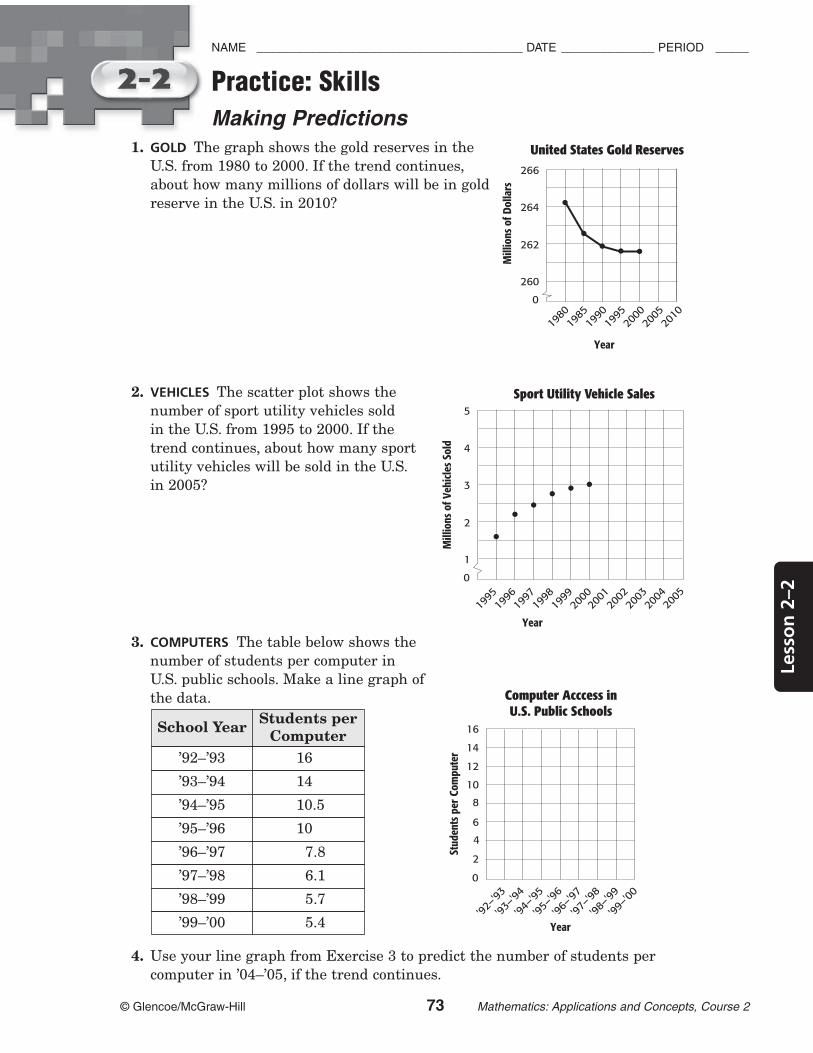
1. GOLD The graph shows the gold reserves in the
U.S. from 1980 to 2000. If the trend continues,
about how many millions of dollars will be in gold
reserve in the U.S. in 2010?
2. VEHICLES The scatter plot shows the
number of sport utility vehicles sold
in the U.S. from 1995 to 2000. If the
trend continues, about how many sport
utility vehicles will be sold in the U.S.
in 2005?
3. COMPUTERS The table below shows the
number of students per computer in
U.S. public schools. Make a line graph of
the data.
4. Use your line graph from Exercise 3 to predict the number of students per
computer in ’04–’05, if the trend continues.
1995
1996
1997
1998
1999
2000
2
1
3
4
5
Millions
of
Veh
icle
s So
ld
Year
0
Sport Utility Vehicle Sales
2001
2002
2003
2004
2005
1980
1985
1990
1995
2000
2005
2010
262
260
264
266
Millions
of
Dollar
s
Year
0
United States Gold Reserves
School YearStudents per
Computer
’92–’93 16
’93–’94 14
’94–’95 10.5
’95–’96 10
’96–’97 7.8
’97–’98 6.1
’98–’99 5.7
’99–’00 5.4'92–'93
'93–'94
'94–'95
'95–'96
'96–'97
'97–'98
'98–'99
'99–'00
Studen
ts p
er C
om
pute
r
Year
Computer Acccess inU.S. Public Schools
6
4
2
8
10
12
14
16
0
© Glencoe/McGraw-Hill 74 Mathematics: Applications and Concepts, Course 2
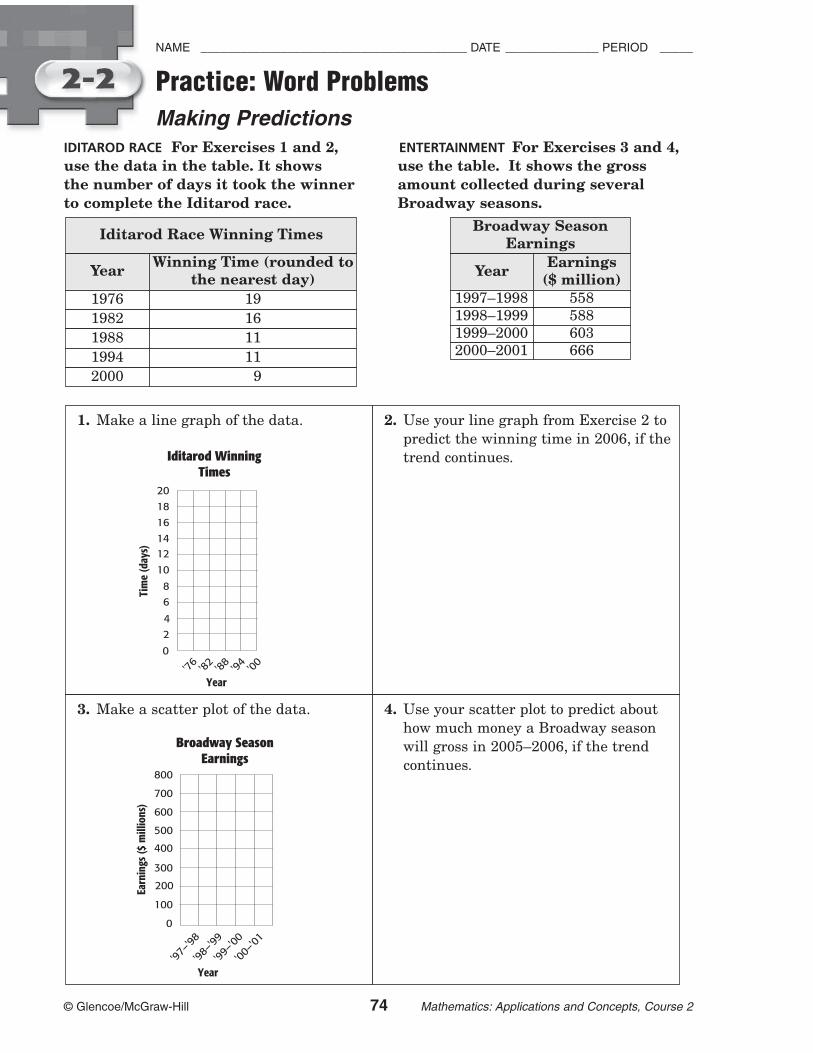
IDITAROD RACE For Exercises 1 and 2, ENTERTAINMENT For Exercises 3 and 4,
use the data in the table. It shows use the table. It shows the gross
the number of days it took the winner amount collected during several
to complete the Iditarod race. Broadway seasons.
NAME ________________________________________ DATE ______________ PERIOD _____
Practice: Word Problems
Making Predictions
YearWinning Time (rounded to
the nearest day)
1976 19
1982 16
1988 11
1994 11
2000 9
Iditarod Race Winning Times
1. Make a line graph of the data. 2. Use your line graph from Exercise 2 to
predict the winning time in 2006, if the
trend continues.
3. Make a scatter plot of the data. 4. Use your scatter plot to predict about
how much money a Broadway season
will gross in 2005–2006, if the trend
continues.
'76
'82
'88
'94
'00
6
4
2
8
10
12
14
16
18
20
Tim
e (d
ays)
Year
0
Iditarod WinningTimes
'97–
'98
'98–
'99
'99–
'00
'00–
'01
Earn
ings
($
millions)
Year
Broadway SeasonEarnings
300
200
100
400
500
600
700
800
0
Broadway SeasonEarnings
YearEarnings
($ million)1997–1998 5581998–1999 5881999–2000 6032000–2001 666

NAME ________________________________________ DATE ______________ PERIOD _____
Less
on
X–2
© Glencoe/McGraw-Hill 75 Mathematics: Applications and Concepts, Course 2
Less
on
X–2
Less
on
X–2
Less
on
2–2
Reading to Learn Mathematics
Making Predictions
Pre-Activity Complete the Mini Lab at the top of page 60 in your textbook.Write your answers below.
1. By how much did the height of the water change after each addition of
five marbles?
2. Predict the height of the water when thirty marbles are in the drinking
glass. Explain how you made your prediction.
3. Test your prediction by placing ten more marbles in the glass.
4. Draw a graph of the data that you recorded in the table.
Reading the Lesson
5. Give an example of a set of data for which you could create a line graph.
6. What does it mean if the points on a scatter plot do not appear to lie on a
straight line?
Helping You Remember
7. In your own words, describe what you would use a line graph to show.
Describe what you would use a scatter plot to show.

Number Patterns
The dot diagram below illustrates a number pattern.
You can discover what number in the pattern comes next by drawing the nextfigure in the dot pattern. You can also use thinking with numbers. Try to seehow two consecutive numbers in the pattern are related.
It looks like the next number in the pattern is obtained by adding 6 to 15. Thenext number in the pattern is 21. You can check this by drawing the nextfigure in the dot pattern.
Write the next two numbers in the number pattern for each dotdiagram.
1.
2.
3. A staircase is being built from cubes. How many cubes will it take to
make a staircase 25 cubes high?
1 3 6 10 15
1 2 1 3 1 4 1 5
NAME ________________________________________ DATE ______________ PERIOD _____
Enrichment
© Glencoe/McGraw-Hill 76 Mathematics: Applications and Concepts, Course 2

© Glencoe/McGraw-Hill 77 Mathematics: Applications and Concepts, Course 2
NAME ________________________________________ DATE ______________ PERIOD _____
Less
on
2–3
SHOE SIZE The table shows the shoe size of studentsin Mr. Kowa’s classroom. Make a line plot of thedata.
Step 1 Draw a number line. Because the smallest size is 4 and the largestsize is 14, you can use a scale of 4 to 14 and an interval of 2.
Step 2 Put an “3” above the number that represents the shoe size of eachstudent.
Use the line plot in Example 1. Identify any clusters, gaps, oroutliers and analyze the data by using these values. What is therange of data?
Many of the data cluster around 6 and 10. You could say that most of the shoe sizes are 6 or10. There is a gap between 11 and 14, so there are no shoe sizes in this range. The number14 appears removed from the rest of the data, so it would be considered an outlier. Thismeans that the shoe size of 14 is very large and is not representative of the whole data set.
The greatest shoe size is 14, and the smallest is 4. The range is 14 – 4 or 10.
PETS For Exercises 1–3 use the table at the right that shows the number of pets owned by different families.
1. Make a line plot of the data.
2. Identify any clusters, gaps, or outliers.
3. What is the range of the data?
Study Guide and Intervention
Line Plots
A line plot is a diagram that shows the frequency of data on a number line.
Shoe Sizes
10 6 4 6
5 11 10 10
6 9 6 8
7 11 7 14
5 10 6 10
Number of Pets
2 1 2 03 1 1 28 3 1 4
3 3
3 3
3
3
3
3 3 3 33
4 6 8 10 12
3
14
3 3
3
3
3
3
3

© Glencoe/McGraw-Hill 78 Mathematics: Applications and Concepts, Course 2
For Exercises 1–3, use the data at the right that shows thenumber of fish each person caught on a fishing trip.
1. Make a line plot of the data.
2. What is the range of the data?
3. Identify any clusters, gaps, or outliers and analyze the data by describing what these
values represent.
Make a line plot for each set of data. Identify any clusters, gaps, oroutliers.
4. 5.
For Exercises 6–8, use the line plot at the right.
6. What is the range of the data?
7. What number occurred most often?
8. Identify any clusters, gaps, or outliers.
NAME ________________________________________ DATE ______________ PERIOD _____
Practice: Skills
Line Plots
Number of Fish
3 1 0 1 0
1 2 3 1 4
2 1 2 3 0
1 2 3 2 7
83 84 92 91
82 81 80 94
85 95 96 84
94 98 93 90
Rainfall (in.)3 2 4 31 8 7 32 9 4 0
0 1 2 3 4 5 6 7 8 9
80 85 90 95 100
3 33 3
3
3
3
3
3
3
3
33 3 3 33
2 4 6 8 10 12 14 16 18
3
3 3
3
Test Scores
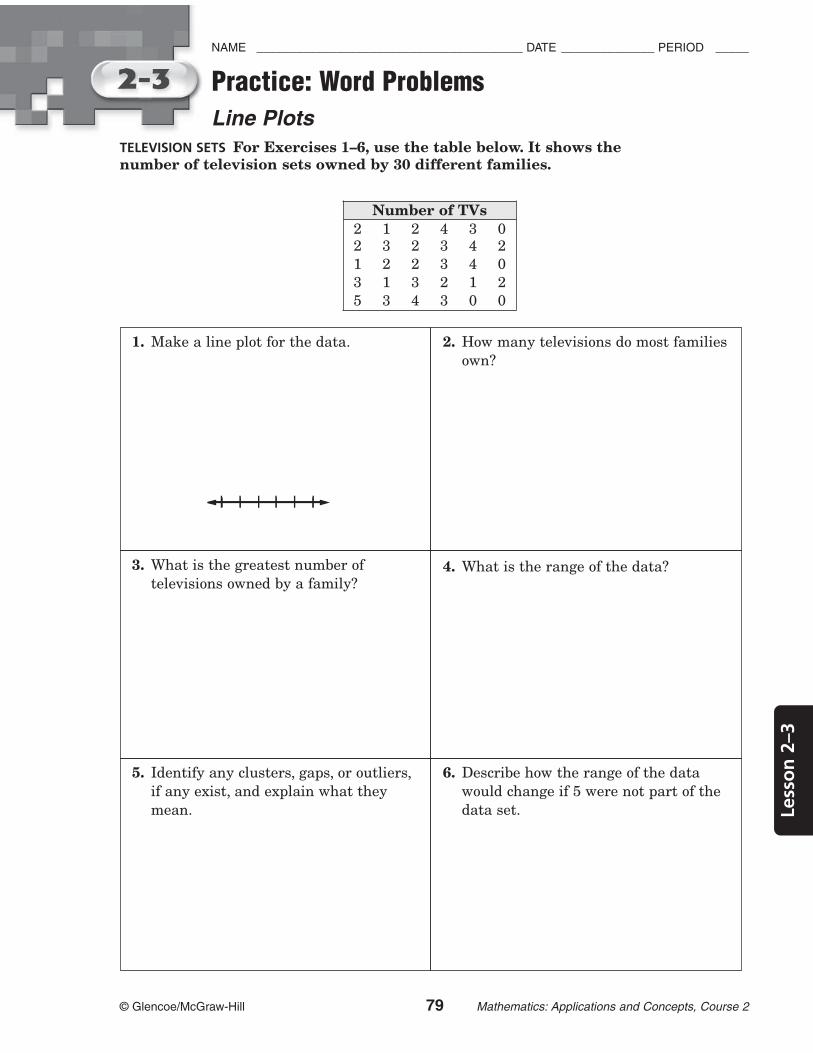
TELEVISION SETS For Exercises 1–6, use the table below. It shows thenumber of television sets owned by 30 different families.
NAME ________________________________________ DATE ______________ PERIOD _____
Less
on
2–3
© Glencoe/McGraw-Hill 79 Mathematics: Applications and Concepts, Course 2
Practice: Word Problems
Line Plots
1. Make a line plot for the data. 2. How many televisions do most families
own?
3. What is the greatest number of
televisions owned by a family?4. What is the range of the data? 5
5. Identify any clusters, gaps, or outliers,
if any exist, and explain what they
mean.
6. Describe how the range of the data
would change if 5 were not part of the
data set.
Number of TVs
2 1 2 4 3 02 3 2 3 4 21 2 2 3 4 03 1 3 2 1 25 3 4 3 0 0
NAME ________________________________________ DATE ______________ PERIOD _____
© Glencoe/McGraw-Hill 80 Mathematics: Applications and Concepts, Course 2
Reading to Learn Mathematics
Line Plots
Pre-Activity Read the introduction at the top of page 64 in your textbook.Write your answers below.
1. Do any of the values seem much greater or much less than the other data
values?
2. Do some of the buildings have the same number of stories? Is this easy to
see? Explain.
3. What better ways can you suggest for organizing these data?
Reading the Lesson
4. If the least number of a data set is 75 and the greatest number in the set
is 200, what is the range?
5. Give an example of a set of data for which you could create a line plot.
6. If you see a gap in a line plot, what do you know about that interval?
Helping You Remember
7. How is a line plot similar to a frequency table? How is it different?

Enhanced Line Plots
You have learned to create line plots to analyze given data. Sometimes altering a line plotcan show even more information about a data set.
SPORTS For Exercises 1–4, use the following data about the Super Bowl.
The National Football League began choosing its champion in the Super Bowl in 1967. Thelist below shows the margin of victory and the winning league for the first 36 Super Bowlgames. In the list, A indicates that the winning team is from the American FootballConference (AFC), N indicates that the winning team is from the National FootballConference.
1. Make a line plot of the data.
2. What do you observe about the winning margins?
3. Make a new line plot for the winning margins by replacing each 3 with Afor an AFC win or N for an NFC win. What do you observe about thewinning margins when looking at this enhanced line plot?
4. The list of Super Bowl margins is given in order of years: first 25-N, then19-N, and so on. Describe any patterns you see in the margins or in thewinning league over the years of the Super Bowl.
0 5 10 15 20 25 3530 40 45
0 5 10 15 20 25 3530 40 45
NAME ________________________________________ DATE ______________ PERIOD _____
Less
on
X–3
© Glencoe/McGraw-Hill 81 Mathematics: Applications and Concepts, Course 2
Less
on
X–3
Less
on
2–3
Enrichment
Year Margin Year Margin Year Margin Year Margin
123456789
25-N10-A10-N
1-N15-A19-N
4-A29-A13-N
101112131415161718
7-N9-A
18-A22-N35-N27-A16-A17-N36-N
192021222324252627
17-N3-A3-A4-A
19-N10-N21-N12-A32-N
282930313233343536
23-N7-A
17-A4-N
14-N17-A5-N
45-N7-A
12
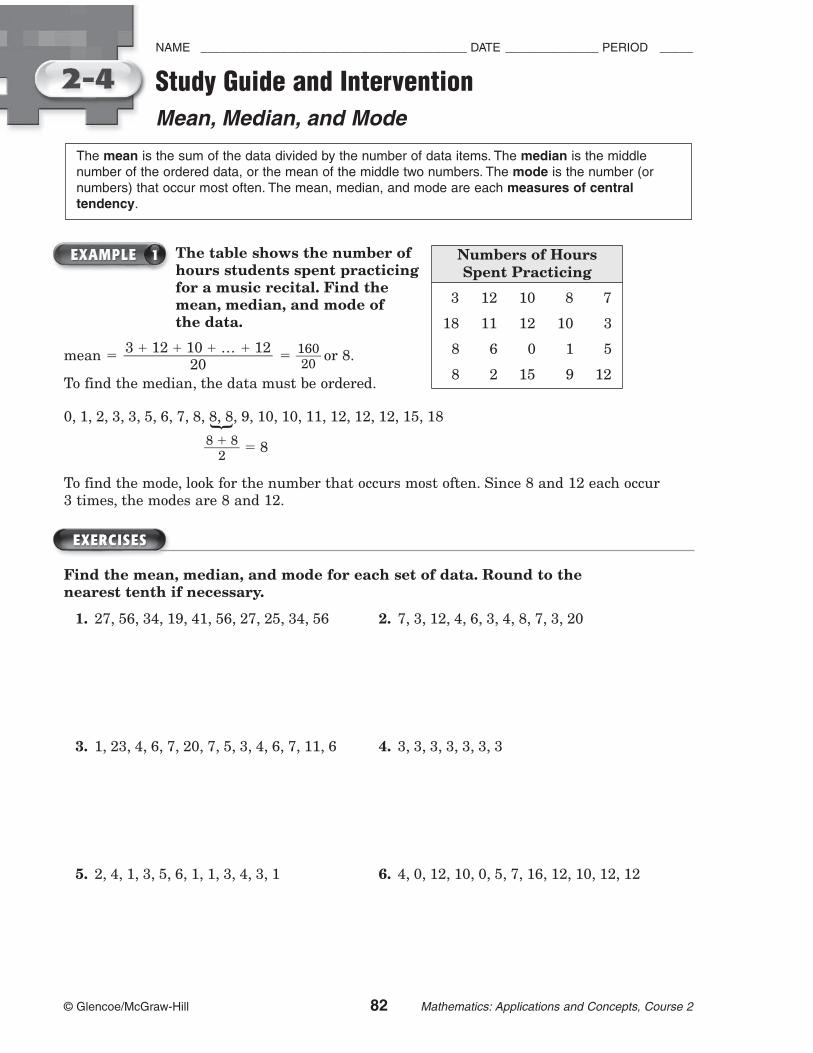
The table shows the number of hours students spent practicing for a music recital. Find the mean, median, and mode of the data.
mean 5 5 }12600
} or 8.
To find the median, the data must be ordered.
0, 1, 2, 3, 3, 5, 6, 7, 8, 8, 8, 9, 10, 10, 11, 12, 12, 12, 15, 18
}8 1
28
} 5 8
To find the mode, look for the number that occurs most often. Since 8 and 12 each occur 3 times, the modes are 8 and 12.
Find the mean, median, and mode for each set of data. Round to thenearest tenth if necessary.
1. 27, 56, 34, 19, 41, 56, 27, 25, 34, 56 2. 7, 3, 12, 4, 6, 3, 4, 8, 7, 3, 20
3. 1, 23, 4, 6, 7, 20, 7, 5, 3, 4, 6, 7, 11, 6 4. 3, 3, 3, 3, 3, 3, 3
5. 2, 4, 1, 3, 5, 6, 1, 1, 3, 4, 3, 1 6. 4, 0, 12, 10, 0, 5, 7, 16, 12, 10, 12, 12
3 1 12 1 10 1 … 1 12}}}
20
© Glencoe/McGraw-Hill 82 Mathematics: Applications and Concepts, Course 2
NAME ________________________________________ DATE ______________ PERIOD _____
Study Guide and Intervention
Mean, Median, and Mode
The mean is the sum of the data divided by the number of data items. The median is the middle
number of the ordered data, or the mean of the middle two numbers. The mode is the number (or
numbers) that occur most often. The mean, median, and mode are each measures of central
tendency.
Numbers of HoursSpent Practicing
3
18
8
8
12
11
6
2
10
12
0
15
8
10
1
9
7
3
5
12
{
NAME ________________________________________ DATE ______________ PERIOD _____
Less
on
X–4
© Glencoe/McGraw-Hill 83 Mathematics: Applications and Concepts, Course 2
Less
on
X–4
Less
on
2–4
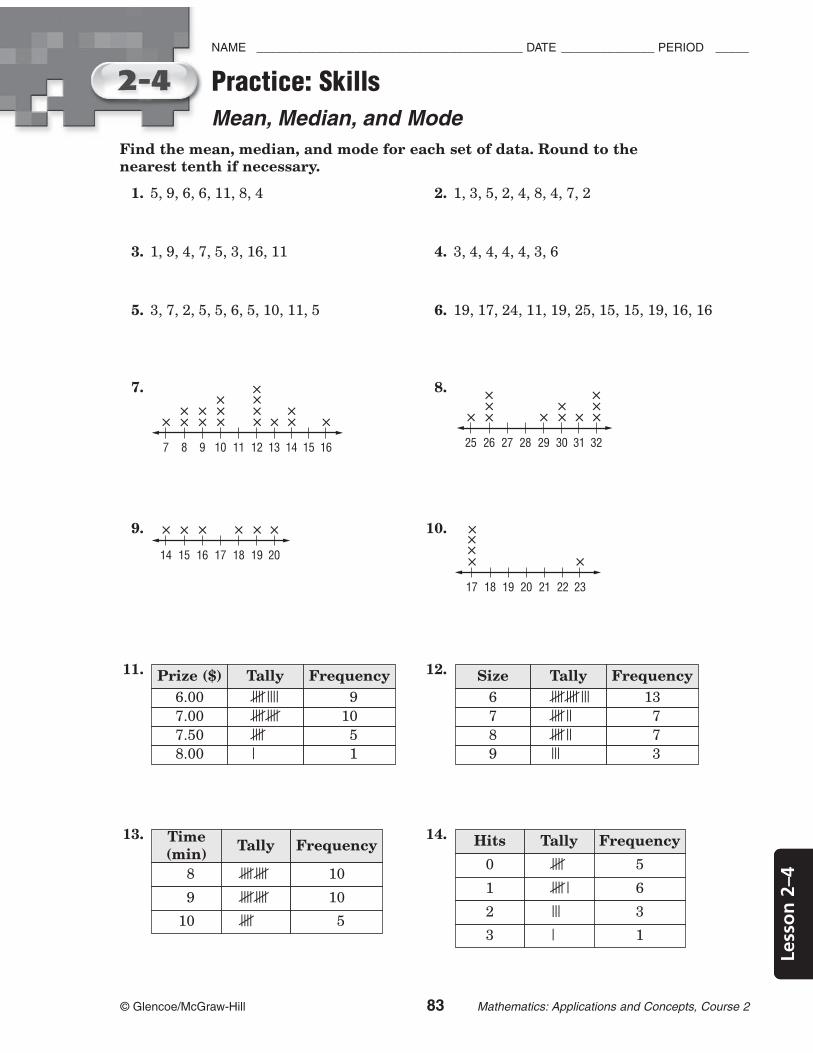
Practice: Skills
Mean, Median, and Mode
Find the mean, median, and mode for each set of data. Round to thenearest tenth if necessary.
1. 5, 9, 6, 6, 11, 8, 4 2. 1, 3, 5, 2, 4, 8, 4, 7, 2
3. 1, 9, 4, 7, 5, 3, 16, 11 4. 3, 4, 4, 4, 4, 3, 6
5. 3, 7, 2, 5, 5, 6, 5, 10, 11, 5 6. 19, 17, 24, 11, 19, 25, 15, 15, 19, 16, 16
7. 8.
9. 10.
11. 12.
13. 14.
3 3
17 18 19 20 21 22 23
3
3
3
3 3 3 3 33
14 15 16 17 18 19 20
3 3 3
3
3 3
3
3
3
33
25 26 27 28 29 30 31 32
3 3 3
3
3
3 3
3
3
3
3
3
33
7 8 9 10 11 12 13 14
3
15 16
3
Size Tally
6 553
7 52
8 52
9 3 3
7
7
13
FrequencyPrize ($) Tally
6.00 54
7.00 55
7.50 5
8.00 1 1
5
10
9
Frequency
Time(min)
Tally Frequency
8 55 10
9 55 10
10 5 5
Hits Tally Frequency
0 5 5
1 51 6
2 3 3
3 1 1

NAME ________________________________________ DATE ______________ PERIOD _____
© Glencoe/McGraw-Hill 84 Mathematics: Applications and Concepts, Course 2
SCHOOL For Exercises 1–6, use the table below. It shows the number oftimes per day that students go to their lockers.
Practice: Word Problems
Mean, Median, and Mode
1. Make a frequency table of the data. 2. What is the range of the data? 10
3. Find the mean, median, and mode of
the data. Round to the nearest tenth if
necessary.
4. Would the mean, median, or mode best
represent the data? Explain.
5. Explain why the mean does not best
represent the data.
6. If the value 10 were dropped from the
data, find the median and the mode of
the remaining data.
Number
of VisitsTally Frequency
Student Locker Visits
2 2 0 1 2 2 3 4
0 5 2 5 2 5 2 4
2 4 6 4 5 6 5 6
2 2 0 1 4 6 10 2
NAME ________________________________________ DATE ______________ PERIOD _____
Less
on
X–4
© Glencoe/McGraw-Hill 85 Mathematics: Applications and Concepts, Course 2
Less
on
2–4
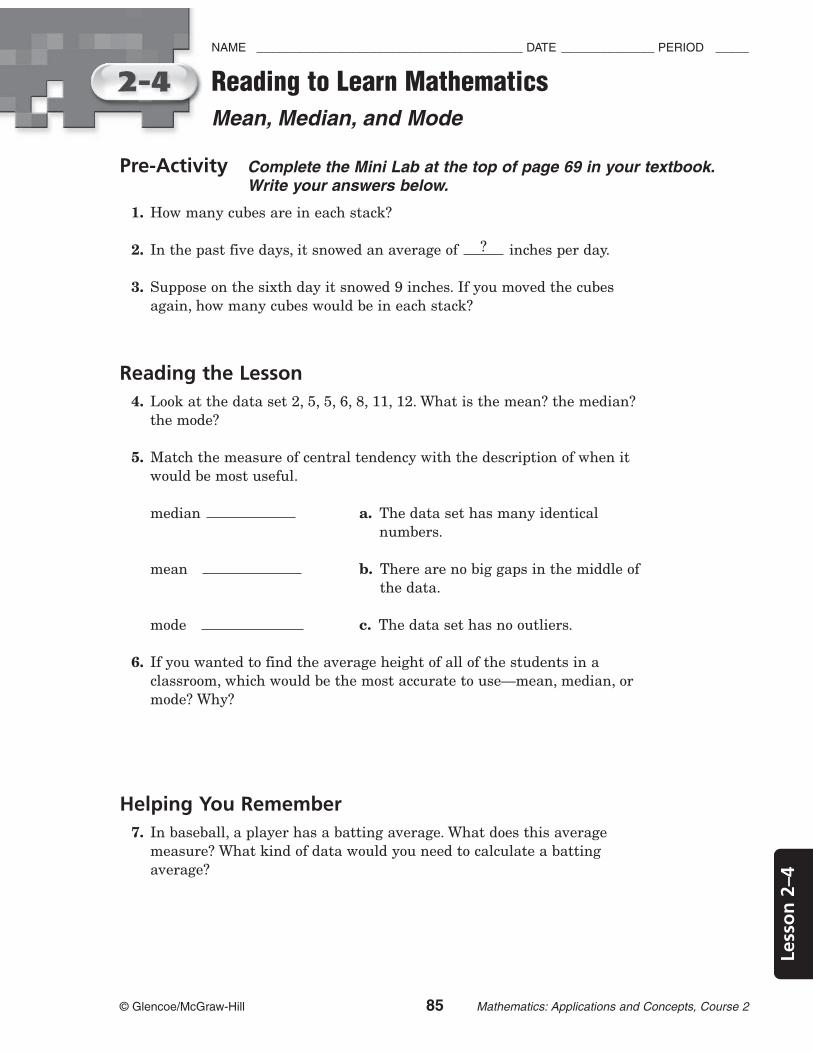
Pre-Activity Complete the Mini Lab at the top of page 69 in your textbook.Write your answers below.
1. How many cubes are in each stack?
2. In the past five days, it snowed an average of inches per day.
3. Suppose on the sixth day it snowed 9 inches. If you moved the cubes
again, how many cubes would be in each stack?
Reading the Lesson
4. Look at the data set 2, 5, 5, 6, 8, 11, 12. What is the mean? the median?
the mode?
5. Match the measure of central tendency with the description of when it
would be most useful.
median a. The data set has many identical
numbers.
mean b. There are no big gaps in the middle of
the data.
mode c. The data set has no outliers.
6. If you wanted to find the average height of all of the students in a
classroom, which would be the most accurate to use—mean, median, or
mode? Why?
Helping You Remember
7. In baseball, a player has a batting average. What does this average
measure? What kind of data would you need to calculate a batting
average?
?
Reading to Learn Mathematics
Mean, Median, and Mode

NAME ________________________________________ DATE ______________ PERIOD _____
Enrichment
© Glencoe/McGraw-Hill 86 Mathematics: Applications and Concepts, Course 2
QuartilesThe median is a number that describes the “center” of a set of data. Here are two sets withthe same median, 50, indicated by .
But, sometimes a single number may not be enough. The numbers shown in the trianglescan also be used to describe the data. They are called quartiles. The lower quartile is the
median of the lower half of the data. It is indicated by . The upper quartile is the median
of the upper half. It is indicated by .
Circle the median in each set of data. Draw triangles around the quartiles.
1.
2.
3.
4.
Use the following set of test scores to solve the problems.
71 57 29 37 53 41 25 37 53 27 62 55 75 48 66 53 66 48 75 66
5. Which scores are “in the lower quartile”?
6. How high would you have to score to be “in the upper quartile”?
5 2 9 7 9 3 7 8 7 2 5 6 9 5 1
1,150 1,600 1,450 1,750 1,500 1,300 1,200
1.7 0.4 1.4 2.3 0.3 2.7 2.0 0.9 2.7 2.6 1.2
29 52 44 37 27 46 43 60 31 54 36
25 30 35 40 45 50 55 60 65 70 75
0 10 20 40 50 50 60 70 80 90 100
© Glencoe/McGraw-Hill 87 Mathematics: Applications and Concepts, Course 2
NAME ________________________________________ DATE ______________ PERIOD _____
Less
on
X–5
Less
on
2–5
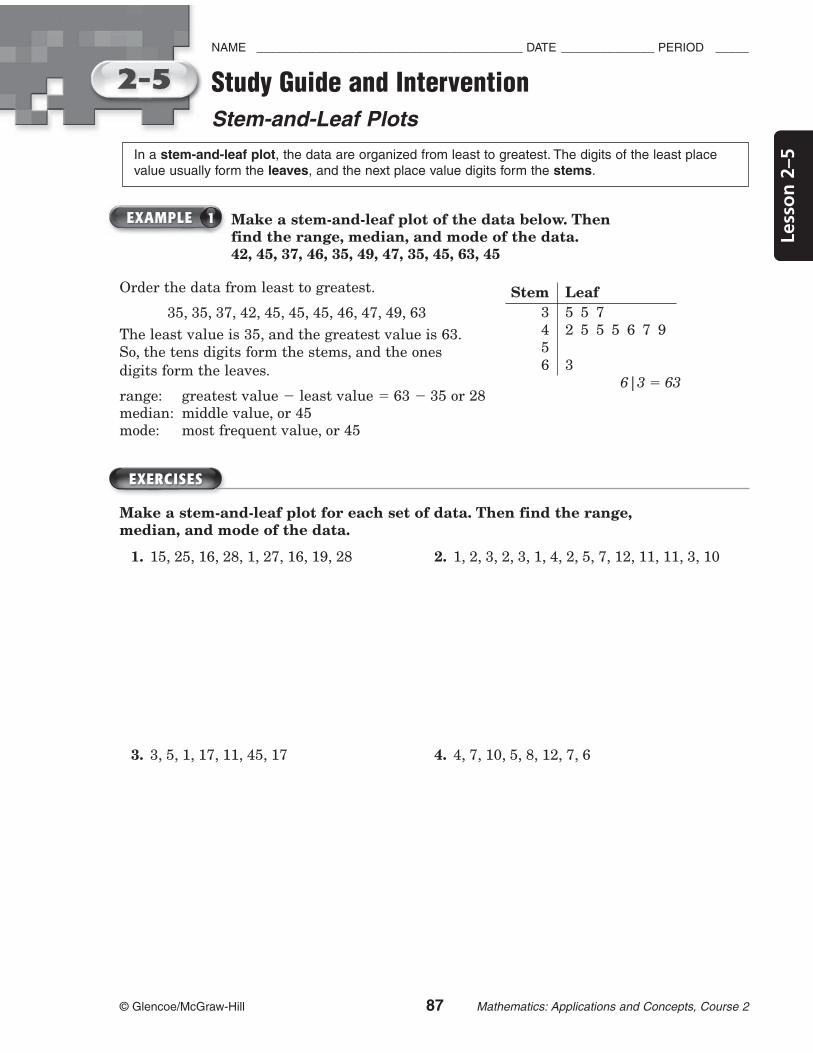
Study Guide and Intervention
Stem-and-Leaf Plots
In a stem-and-leaf plot, the data are organized from least to greatest. The digits of the least place
value usually form the leaves, and the next place value digits form the stems.
Make a stem-and-leaf plot of the data below. Then find the range, median, and mode of the data.42, 45, 37, 46, 35, 49, 47, 35, 45, 63, 45
Order the data from least to greatest.
35, 35, 37, 42, 45, 45, 45, 46, 47, 49, 63
The least value is 35, and the greatest value is 63.
So, the tens digits form the stems, and the ones
digits form the leaves.
range: greatest value 2 least value 5 63 2 35 or 286|3 5 63
median: middle value, or 45mode: most frequent value, or 45
Make a stem-and-leaf plot for each set of data. Then find the range,median, and mode of the data.
1. 15, 25, 16, 28, 1, 27, 16, 19, 28 2. 1, 2, 3, 2, 3, 1, 4, 2, 5, 7, 12, 11, 11, 3, 10
3. 3, 5, 1, 17, 11, 45, 17 4. 4, 7, 10, 5, 8, 12, 7, 6
Stem Leaf
3
4
5
6
5 5 7
2 5 5 5 6 7 9
3

© Glencoe/McGraw-Hill 88 Mathematics: Applications and Concepts, Course 2
NAME ________________________________________ DATE ______________ PERIOD _____
Make a stem-and-leaf plot for each set of data.
1. 23, 36, 25, 13, 24, 25, 32, 33, 17, 26, 24 2. 3, 4, 6, 17, 12, 5, 17, 4, 26, 17, 18, 21, 16,
15, 20
3. 26, 27, 23, 23, 24, 26, 31, 45, 33, 32, 41 4. 347, 334, 346, 330, 348, 347, 359, 344, 357
40, 21, 20
HOT DOGS For Exercises 5–7, use the stem- and-leaf plot at the right that shows thenumber of hot dogs eaten during a contest.
5. How many hot dogs are represented on the
stem-and-leaf plot?
6. What is the range of the number of hot dogs eaten?
7. Find the median and mode of the data.
Determine the mean, median, and mode of the data shown in eachstem-and-leaf plot.
8. 9.
10. 11.
Practice: Skills
Stem-and-Leaf Plots
Stem Leaf
22
23
24
1 1 2 7
3 3 9
0 6 8
24|0 5 240
Stem Leaf
2
3
4
0 0 0 2 3 5 7
1 2
0
4|0 5 40
Stem Leaf
0
1
2
1 3 3 4 7
2 2 2 4 5 6
0 0 0 1
2|0 5 20
Stem Leaf
0
1
2
1 2 2 3
3 4 5 5
0 0 0 1 3
2|0 5 20
Stem Leaf
0
1
2
8 8 9
1 2 2 4 7 7 7
1 1 2
2|1 5 21

© Glencoe/McGraw-Hill 89 Mathematics: Applications and Concepts, Course 2
Less
on
2–5ENDANGERED SPECIES For Exercises 1–6, use the table below. It shows
the number of endangered species in the U.S.
NAME ________________________________________ DATE ______________ PERIOD _____
Practice: Word Problems
Stem-and-Leaf Plots
1. Make a stem-and-leaf plot of the data. 2. What group has the greatest number of
endangered species in the U.S.?
3. What group has the least number of
endangered species in the U.S.?4. What is the range of the data? 68
5. Use your stem-and-leaf plot to
determine the median and mode.
6. How many groups have less than 30
endangered species in the U.S.?
GroupNumber of
SpeciesGroup
Number ofSpecies
mammals 63 clams 61
birds 78 snails 20
reptiles 14 insects 33
amphibians 10 arachnids 12
fishes 70 crustaceans 18
Endangered Species in U.S.
© Glencoe/McGraw-Hill 90 Mathematics: Applications and Concepts, Course 2
NAME ________________________________________ DATE ______________ PERIOD _____
Pre-Activity Read the introduction at the top of page 76 in your textbook.Write your answers below.
1. What was the age of the youngest signer?
2. What methods do you already have for showing the distribution of ages?
Reading the Lesson
3. What can you determine easily from a stem-and-leaf plot?
4. How do you determine the stems of a stem-and-leaf plot? How do you
determine the leaves?
5. If you look at a stem-and-leaf plot, how can you tell what the stems and
leaves represent?
Helping You Remember
6. Describe how the arrangement of stems and leaves in a stem-and-leaf
plot relates to a plant or tree.
Reading to Learn Mathematics
Stem-and-Leaf Plots
© Glencoe/McGraw-Hill 91 Mathematics: Applications and Concepts, Course 2
Less
on
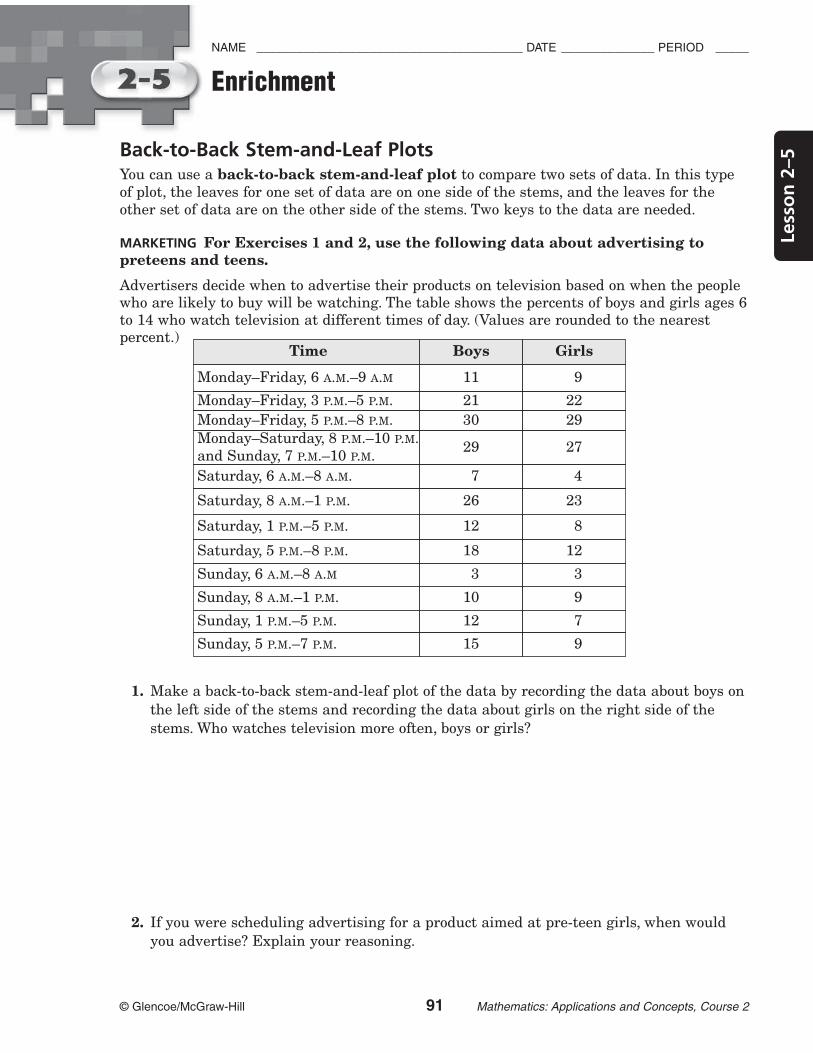
2–5Back-to-Back Stem-and-Leaf Plots
You can use a back-to-back stem-and-leaf plot to compare two sets of data. In this type
of plot, the leaves for one set of data are on one side of the stems, and the leaves for the
other set of data are on the other side of the stems. Two keys to the data are needed.
MARKETING For Exercises 1 and 2, use the following data about advertising topreteens and teens.
Advertisers decide when to advertise their products on television based on when the peoplewho are likely to buy will be watching. The table shows the percents of boys and girls ages 6to 14 who watch television at different times of day. (Values are rounded to the nearestpercent.)
1. Make a back-to-back stem-and-leaf plot of the data by recording the data about boys on
the left side of the stems and recording the data about girls on the right side of the
stems. Who watches television more often, boys or girls?
2. If you were scheduling advertising for a product aimed at pre-teen girls, when would
you advertise? Explain your reasoning.
NAME ________________________________________ DATE ______________ PERIOD _____
Enrichment
Time Boys Girls
Monday–Friday, 6 A.M.–9 A.M 11 9
Monday–Friday, 3 P.M.–5 P.M. 21 22
Monday–Friday, 5 P.M.–8 P.M. 30 29
Monday–Saturday, 8 P.M.–10 P.M.
and Sunday, 7 P.M.–10 P.M.29 27
Saturday, 6 A.M.–8 A.M. 7 4
Saturday, 8 A.M.–1 P.M. 26 23
Saturday, 1 P.M.–5 P.M. 12 8
Saturday, 5 P.M.–8 P.M. 18 12
Sunday, 6 A.M.–8 A.M 3 3
Sunday, 8 A.M.–1 P.M. 10 9
Sunday, 1 P.M.–5 P.M. 12 7
Sunday, 5 P.M.–7 P.M. 15 9
© Glencoe/McGraw-Hill 92 Mathematics: Applications and Concepts, Course 2
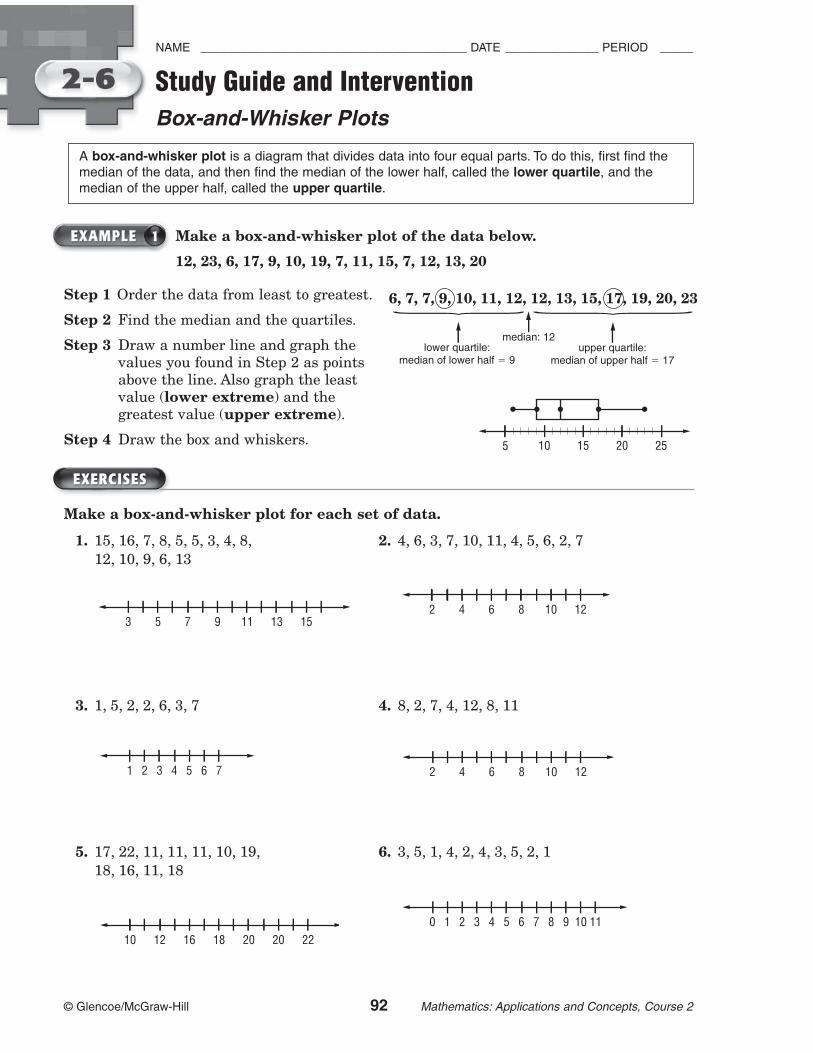
Make a box-and-whisker plot of the data below.
12, 23, 6, 17, 9, 10, 19, 7, 11, 15, 7, 12, 13, 20
Step 1 Order the data from least to greatest.
Step 2 Find the median and the quartiles.
Step 3 Draw a number line and graph the values you found in Step 2 as points above the line. Also graph the least value (lower extreme) and the greatest value (upper extreme).
Step 4 Draw the box and whiskers.
Make a box-and-whisker plot for each set of data.
1. 15, 16, 7, 8, 5, 5, 3, 4, 8, 2. 4, 6, 3, 7, 10, 11, 4, 5, 6, 2, 7
12, 10, 9, 6, 13
3. 1, 5, 2, 2, 6, 3, 7 4. 8, 2, 7, 4, 12, 8, 11
5. 17, 22, 11, 11, 11, 10, 19, 6. 3, 5, 1, 4, 2, 4, 3, 5, 2, 1
18, 16, 11, 18
NAME ________________________________________ DATE ______________ PERIOD _____
Study Guide and Intervention
Box-and-Whisker Plots
A box-and-whisker plot is a diagram that divides data into four equal parts. To do this, first find the
median of the data, and then find the median of the lower half, called the lower quartile, and the
median of the upper half, called the upper quartile.
5 10 15 20 25
3 5 7 9 11 13 15
2 4 6 8 10 12
1 2 3 4 5 6 7 2 4 6 8 10 12
10 12 16 18 20 20 22
0 1 2 3 4 5 6 7 8 9 10 11
6, 7, 7, 9, 10, 11, 12, 12, 13, 15, 17, 19, 20, 23{ {
lower quartile:median of lower half 5 9
upper quartile:median of upper half 5 17
median: 12

SPORTS For Exercises 1–6, refer to the table at the right. It shows the regular season games lost by each professionalbaseball team in the National League in 2001.
1. Find the lower extreme, LQ, median, UQ, and upper extreme.
2. Draw a box-and-whisker plot of the data.
3. What fraction of the data is between 73 and 78?
4. Between what two numbers is the largest range of the four quartiles?
5. Find the interquartile range.
6. Are there any outliers? If so, identify them.
LIFE SCIENCE For Exercises 7–12, refer to the table at the right.It shows average life spans of 21 mammals.
7. Find the lower extreme, LQ, median, UQ, and upper extreme.
8. Draw a box-and-whisker plot of the data.
9. What fraction of the data is between 5 and 12?
10. Find the interquartile range.
11. What are the limits on outliers?
12. Are there any outliers? If so, identify them.
NAME ________________________________________ DATE ______________ PERIOD _____
Less
on
X–6
© Glencoe/McGraw-Hill 93 Mathematics: Applications and Concepts, Course 2
Less
on
2–6
Practice: Skills
Box-and-Whisker Plots
Number of
Losses
74 76 80 86
69 69 74 94
100 70 72 76
89 94 96 83
5 12 4 3 12
12 6 5 8 35
7 8 12 10 12
10 3 7 1 12
10
Life Span (yr)
65 70 75 80 85 90 95 100
1 6 11 16 21 26 31 35

NAME ________________________________________ DATE ______________ PERIOD _____
© Glencoe/McGraw-Hill 94 Mathematics: Applications and Concepts, Course 2
SOCCER For Exercises 1–6, use the table below. It shows the number ofwins in a recent major league soccer season.
Practice: Word Problems
Box-and-Whisker Plots
1. Find the lower extreme, LQ, median,
UQ, and upper extreme.
2. Construct a box-and-whisker plot of the
data in the table.
3. What fraction of the data is greater
than 7.5?
4. What fraction of the data is between
7.5 and 13.5?
5. Determine the interquartile range. 6 6. Use the interquartile range to
determine the limits for the outliers.
Are there any outliers?
Major League Soccer Wins
16 13 7 8 10 4
14 13 11 5 16 13

NAME ________________________________________ DATE ______________ PERIOD _____
Less
on
X–6
© Glencoe/McGraw-Hill 95 Mathematics: Applications and Concepts, Course 2
Less
on
2–6
Pre-Activity Read the introduction at the top of page 80 in your textbook.Write your answers below.
1. What is the median of the data?
2. Into how many parts does the median divide the data?
Reading the Lesson
3. What do the terms lower quartile, upper quartile, and interquartile range
have to do with the word quarter?
4. Complete the sentence. Outliers are data that are more than
times the interquartile range from the quartiles.
5. What is the first step in creating a box-and-whisker plot?
Helping You Remember
6. A box-and-whisker plot divides a data set into four parts. Write a series of
steps that tells how to divide a data set of fifteen numbers into four parts.
Reading to Learn Mathematics
Box-and-Whisker Plots
NAME ________________________________________ DATE ______________ PERIOD _____
Enrichment
© Glencoe/McGraw-Hill 96 Mathematics: Applications and Concepts, Course 2
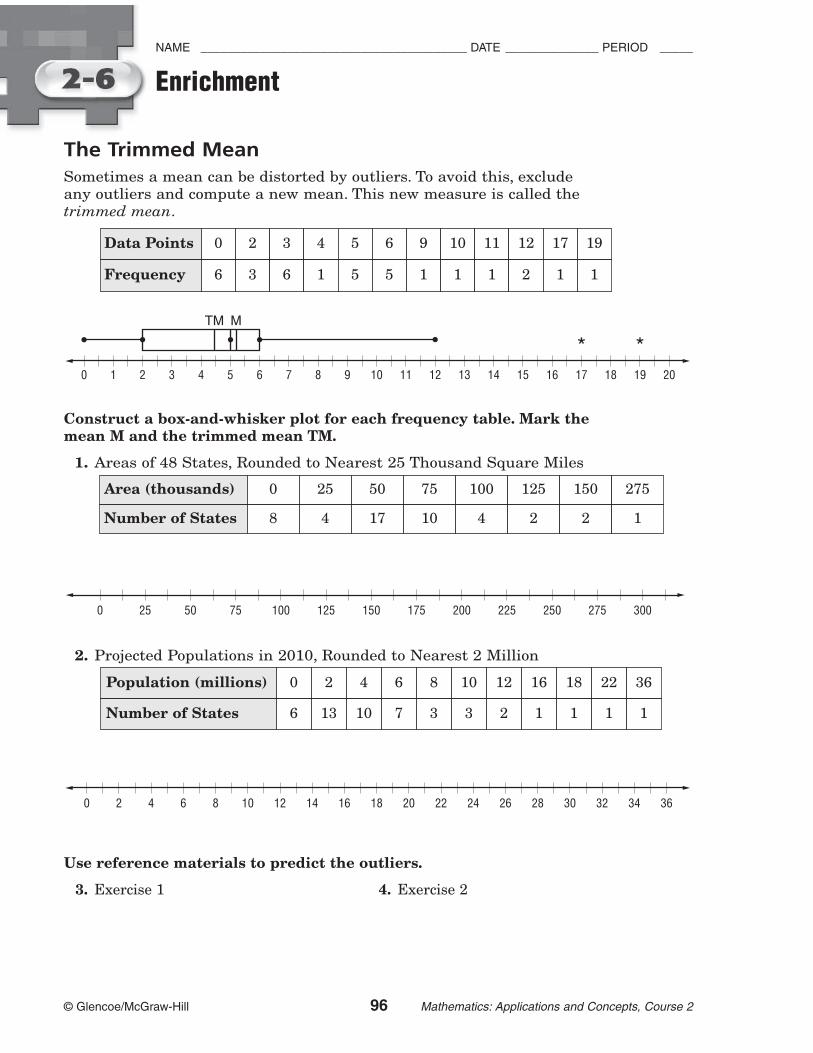
The Trimmed Mean
Sometimes a mean can be distorted by outliers. To avoid this, excludeany outliers and compute a new mean. This new measure is called thetrimmed mean.
Construct a box-and-whisker plot for each frequency table. Mark themean M and the trimmed mean TM.
1. Areas of 48 States, Rounded to Nearest 25 Thousand Square Miles
2. Projected Populations in 2010, Rounded to Nearest 2 Million
Use reference materials to predict the outliers.
3. Exercise 1 4. Exercise 2
0 2 6 10 14 18 22 26 30 344 8 12 16 20 24 28 32 36
150 175 200 225 250 275 3000 25 50 75 100 125
0 1 2 3 4 5 6 7 8
*
MTM
*9 10 11 12 13 14 15 16 17 18 19 20
Data Points 0 2 3 4 5 6 9 10 11 12 17 19
Frequency 6 3 6 1 5 5 1 1 1 2 1 1
Area (thousands) 0 25 50 75 100 125 150 275
Number of States 8 4 17 10 4 2 2 1
Population (millions) 0 2 4 6 8 10 12 16 18 22 36
Number of States 6 13 10 7 3 3 2 1 1 1 1

© Glencoe/McGraw-Hill 97 Mathematics: Applications and Concepts, Course 2
Less
on
2–7
SIBLINGS Make a bar graph to display the data in the table below.
Step 1 Draw a horizontal and a vertical axis. Label the axes as shown. Add a title.
Step 2 Draw a bar to represent each student. In this case, a bar is used to represent thenumber of siblings for each student.
SIBLINGS The number of siblings of 17 students have beenorganized into a table. Make a histogram of the data.
Step 1 Draw and label horizontal and vertical axes. Add a title.
Step 2 Draw a bar to represent the frequency of each interval.
1. Make a bar graph for the data in 2. Make a histogram for the data in
the table. the table.
6–74–52–30–1
8
10
4
6
02Fr
equen
cy
Number of Siblings
Siblings
MargaritaIstuSue
34
2
01
567
Num
ber
of
Siblings
Student
Akira
Siblings
NAME ________________________________________ DATE ______________ PERIOD _____
Study Guide and Intervention
Bar Graphs and Histograms
A bar graph is one method of comparing data by using solid bars to represent quantities. A
histogram is a special kind of bar graph. It uses bars to represent the frequency of numerical
data that have been organized into intervals.
StudentNumber of
Siblings
Sue
Isfu
Margarita
Akira
1
6
3
2
StudentNumber of
Free Throws
Luis
Laura
Opal
Gad
6
10
4
14
Number of
Free ThrowsFrequency
0–1 1
4–5 10
2–3 5
6–7 4
Number of
SiblingsFrequency
0–1 4
4–5 2
2–3 10
6–7 1
© Glencoe/McGraw-Hill 98 Mathematics: Applications and Concepts, Course 2
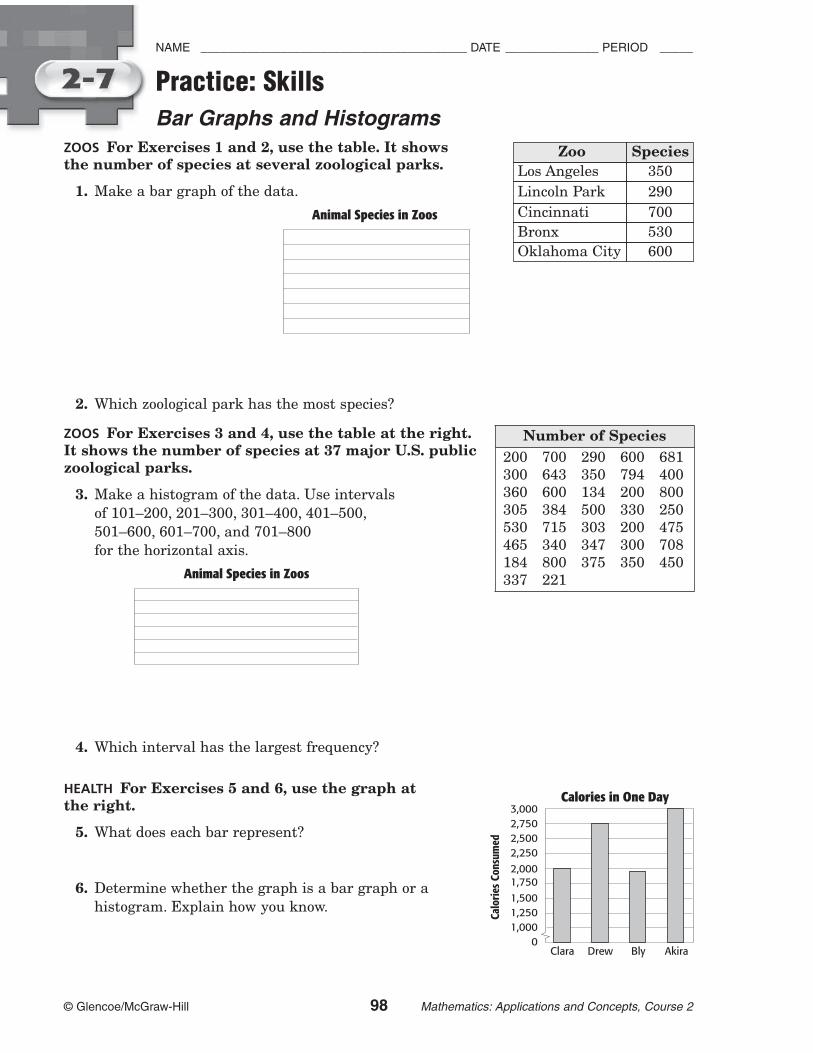
ZOOS For Exercises 1 and 2, use the table. It shows the number of species at several zoological parks.
1. Make a bar graph of the data.
2. Which zoological park has the most species?
ZOOS For Exercises 3 and 4, use the table at the right.It shows the number of species at 37 major U.S. publiczoological parks.
3. Make a histogram of the data. Use intervals
of 101–200, 201–300, 301–400, 401–500,
501–600, 601–700, and 701–800
for the horizontal axis.
4. Which interval has the largest frequency?
HEALTH For Exercises 5 and 6, use the graph at the right.
5. What does each bar represent?
6. Determine whether the graph is a bar graph or a
histogram. Explain how you know.
Animal Species in Zoos
Animal Species in Zoos
NAME ________________________________________ DATE ______________ PERIOD _____
Practice: Skills
Bar Graphs and Histograms
Zoo Species
Los Angeles 350
Lincoln Park 290
Cincinnati 700
Bronx 530
Number of Species
200 700 290 600 681
300 643 350 794 400
360 600 134 200 800
305 384 500 330 250
530 715 303 200 475
465 340 347 300 708
184 800 375 350 450
337 221
Oklahoma City 600
BlyDrewClara
1,500
1,750
1,250
0
1,000
2,000
2,250
2,500
2,750
3,000
Cal
ori
es C
onsu
med
Akira
Calories in One Day
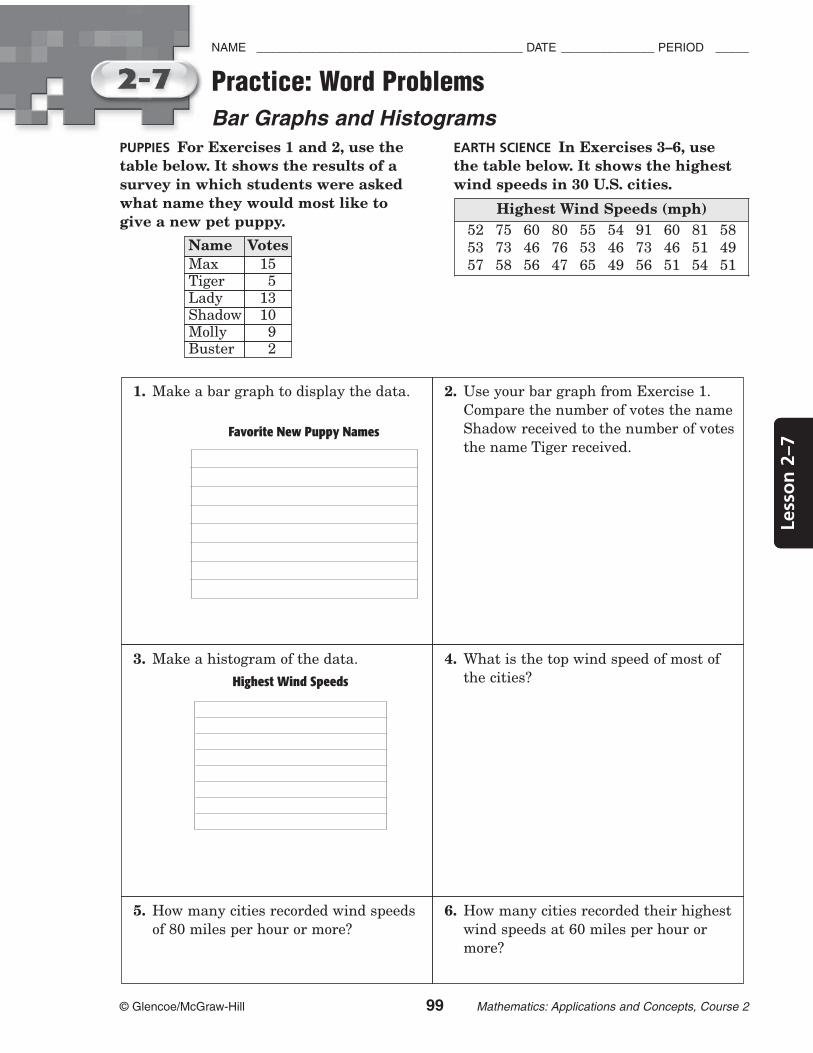
PUPPIES For Exercises 1 and 2, use the EARTH SCIENCE In Exercises 3–6, use
table below. It shows the results of a the table below. It shows the highest
survey in which students were asked wind speeds in 30 U.S. cities.
what name they would most like to
give a new pet puppy.
NAME ________________________________________ DATE ______________ PERIOD _____
Less
on
X–1
© Glencoe/McGraw-Hill 99 Mathematics: Applications and Concepts, Course 2
Less
on
2–7
Practice: Word Problems
Bar Graphs and Histograms
Highest Wind Speeds (mph)
52 75 60 80 55 54 91 60 81 58
53 73 46 76 53 46 73 46 51 49
57 58 56 47 65 49 56 51 54 51
Name Votes
Max 15Tiger 5Lady 13Shadow 10Molly 9Buster 2
1. Make a bar graph to display the data.
Favorite New Puppy Names
2. Use your bar graph from Exercise 1.
Compare the number of votes the name
Shadow received to the number of votes
the name Tiger received.
3. Make a histogram of the data.
Highest Wind Speeds
4. What is the top wind speed of most of
the cities?
5. How many cities recorded wind speeds
of 80 miles per hour or more?
6. How many cities recorded their highest
wind speeds at 60 miles per hour or
more?
NAME ________________________________________ DATE ______________ PERIOD _____
© Glencoe/McGraw-Hill 100 Mathematics: Applications and Concepts, Course 2
Pre-Activity Read the introduction at the top of page 85 in your textbook.Write your answers below.
1. What are the fastest and slowest speeds recorded in the table?
2. How can you create a visual representation to summarize the data?
3. Do any of these representations show both the animal name and its
speed?
Reading the Lesson
4. Look at Example 1. What are the things that a bar graph should have?
5. Why are all of the bars in a histogram the same width without space
between them?
Helping You Remember
6. How is a histogram similar to a bar graph? How is it different?
Reading to Learn Mathematics
Bar Graphs and Histograms

African Americans in History
A magazine published this list of fifty African Americans who made significant contributionsto American history and culture.
1. On a separate sheet of paper, construct a histogram that displays the years of birth
for these fifty people. Organize the data in twenty-year intervals, such as 1841–1860
and 1861–1880. If there is a question mark next to a person’s year of birth, use that
year in the histogram.
2. Refer to the histogram you constructed in Exercise 1. In which interval were the mostpeople born? In which interval were the fewest born? What historical events can youassociate with the times these people were living?
Enrichment
NAME ________________________________________ DATE ______________ PERIOD _____
Less
on
X–1
© Glencoe/McGraw-Hill 101 Mathematics: Applications and Concepts, Course 2
Less
on
2–7
50 Influential Figures in African-American History
Robert S. Abbott (1870–1940)
Richard Allen (1760–1831)
Louis Armstrong (1900–1971)
Ella Baker (1903–1986)
James Baldwin (1924–1987)
Benjamin Banneker (1736–1806)
Ida B. Wells-Barnett (1862–1931)
Mary McLeod Bethune (1875–1955)
Ralph J. Bunche (1904–1971)
George Washington Carver (1861?–1943)
Martin R. Delany (1812–1885)
Frederick Douglass (1817–1895)
Charles R. Drew (1904–1950)
W. E. B. Du Bois (1868–1963)
Paul Laurence Dunbar (1872–1906)
Edward Kennedy Ellington (1899–1974)
Marcus Garvey (1887–1940)
Prince Hall (1735?–1807)
Fannie Lou Hamer (1917–1977)
W. C. Handy (1873–1958)
Frances E. W. Harper (1825–1911)
Charles H. Houston (1895–1950)
Langston Hughes (1902–1967)
Zora Neale Hurston (1901?–1960)
Jack Johnson (1878–1946)
James Weldon Johnson (1871–1938)
Ernest E. Just (1883–1941)
Joe Louis (1914–1981)
Martin Luther King, Jr. (1929–1968)
Malcolm X (1925–1965)
Benjamin E. Mays (1894–1984)
Jesse Owens (1913–1980)
Adam Clayton Powell, Jr. (1908–1972)
A. Philip Randolph (1889–1979)
Paul Robeson (1898–1976)
Jackie Robinson (1919–1972)
Mary Church Terrell (1863–1954)
Howard Thurman (1900–1981)
William Monroe Trotter (1872–1934)
Sojourner Truth (1797?–1883)
Harriet Tubman (1821?–1913)
Henry McNeal Turner (1834–1915)
Nat Turner (1800–1831)
David Walker (1785–1830)
Madame C. J. Walker (1867–1919)
Booker T. Washington (1856–1915)
Phillis Wheatley (1753?–1784)
Daniel Hale Williams (1856–1931)
Carter G. Woodson (1875–1950)
Richard Wright (1908–1960)

© Glencoe/McGraw-Hill 102 Mathematics: Applications and Concepts, Course 2
WEEKLY CHORES The line graphs below show the total hours Salomonspent doing his chores one month. Which graph would be best touse to convince his parents he deserves a raise in his allowance?Explain.
He should use graph A because it makes the total hours seem much larger.
PROFITS For Exercises 1 and 2, use the graphs below. It shows acompany’s profits over a four-month period.
1. Which graph would be best to use to convince potential investors to
invest in this company?
2. Why might the graph be misleading?
Jan. Feb. Mar. Apr.
Pro
fits
Months
Graph BCompany Profits
$30,000
$20,000
$10,000
$40,000
$50,000
$60,000
$70,000
$0
Jan. Feb. Mar. Apr.
Pro
fits
Months
Graph ACompany Profits
1 2 3 4
6
4
2
8
10
12
14
16
Tota
l (h
ours
)
Week
0
Graph BSalomon's Weekly Chores
1 2 3 4
3
2
1
4
5
6
7
8
Tota
l (h
ours
)
Week
0
Graph ASalomon's Weekly Chores
NAME ________________________________________ DATE ______________ PERIOD _____
Study Guide and Intervention
Misleading Statistics
Graphs can be misleading for many reasons: there is no title, the scale does not include 0; there are
no labels on either axis; the intervals on a scale are not equal; or the size of the graphics
misrepresents the data.
© Glencoe/McGraw-Hill 103 Mathematics: Applications and Concepts, Course 2
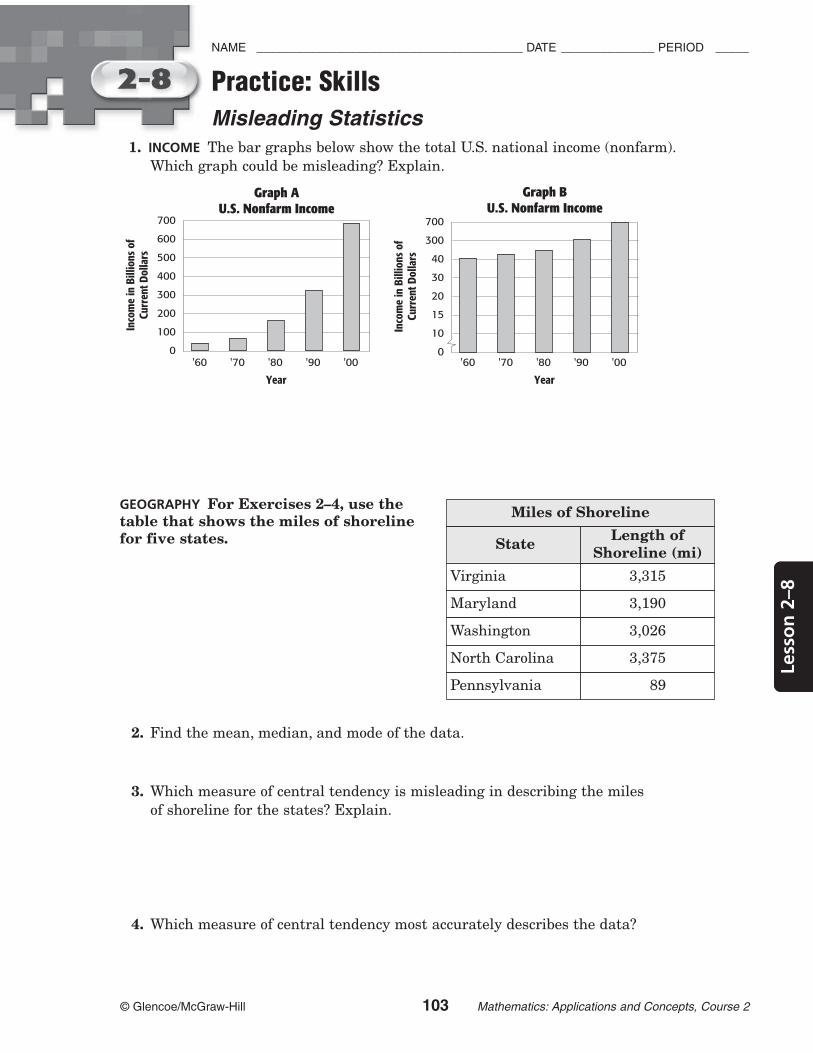
1. INCOME The bar graphs below show the total U.S. national income (nonfarm).
Which graph could be misleading? Explain.
GEOGRAPHY For Exercises 2–4, use the table that shows the miles of shorelinefor five states.
2. Find the mean, median, and mode of the data.
3. Which measure of central tendency is misleading in describing the miles
of shoreline for the states? Explain.
4. Which measure of central tendency most accurately describes the data?
'00'80'70'60
20
30
15
0
10
40
300
700
Inco
me
in B
illions
of
Curr
ent
Dollar
s
Year
'90
Graph BU.S. Nonfarm Income
'00'80'70'60
200
300
100
0
400
500
600
700
Inco
me
in B
illions
of
Curr
ent
Dollar
s
Year
'90
Graph AU.S. Nonfarm Income
NAME ________________________________________ DATE ______________ PERIOD _____
Less
on
X–2
Practice: Skills
Misleading Statistics
Less
on
2–8
Miles of Shoreline
State
Virginia 3,315
Maryland 3,190
Washington 3,026
North Carolina 3,375
Pennsylvania 89
Length of
Shoreline (mi)

QUIZ SCORES For Exercises 1 and 2, use BOOK SALES For Exercises 3 and 4, use
the data shown in the table below. The the table below. It shows the number
table shows the quiz grades for of books sold each day for 20 days.
Ms. Andrey’s and Mr. Luna’s classes.
NAME ________________________________________ DATE ______________ PERIOD _____
Practice: Word Problems
Misleading Statistics
© Glencoe/McGraw-Hill 104 Mathematics: Applications and Concepts, Course 2
1. Ms. Andrey claims the average score on
a quiz in her class was 25. Mr. Luna
claims the average score on a quiz in
his class is 25. Explain how they
arrived at these figures.
2. What additional information could be
useful in analyzing the data?
3. Find the mean, median, and mode of
the data. Which measure of central
tendency would be misleading in
describing the book sales? Explain.
4. Which value would most accurately
describe the data? Explain.
Quiz Scores
Ms. Andrey’sClass
10 20
15 20
25 25
25 29
12 26
Mr. Luna’sClass
Book Sales Per Day
23 18 23 15
24 16 0 11
19 10 13 17
12 23 11 16
36 24 12 27

© Glencoe/McGraw-Hill 105 Mathematics: Applications and Concepts, Course 2
NAME ________________________________________ DATE ______________ PERIOD _____
Less
on
X–2
Pre-Activity Read the introduction at the top of page 92 in your textbook.Write your answers below.
1. Approximately how many more passengers per lane can a 40-foot bus
transport in an hour than a car can transport?
2. Is the bus on the graph about twice as large as the car? Explain.
3. Do you think the graph appeared in a brochure for a train/bus transit
company or for a car company? What makes you think so?
Reading the Lesson
4. Give an example of a data set you could represent with a graph and how
you could represent it in a misleading way.
5. Study Example 1 on page 92. How does the definition you learned for the
word interval help identify what is wrong with Graph B?
Helping You Remember
6. Missing labels on graphs and uneven intervals on a scale are two ways a
set of statistics can be misleading. Listen for a statistic used on the radio
or in a newspaper. Is it a reasonable statement? What other information
might you like to have before you consider a statistic to be reasonable?
Reading to Learn Mathematics
Misleading Statistics
Less
on
2–8

Choosing a Representative Sample
Statisticians often use samples to represent larger groups. For example,television ratings are based on the opinions of a few people who are surveyedabout a program. The people surveyed are just part of the whole group ofpeople who watched the program. When using samples, people taking surveysmust make sure that their samples are representative of the larger group inorder to ensure that their conclusions are not misleading.
ADVERTISING A company that makes athletic shoes is consideringhiring a professional basketball player to appear in theircommercials. Before hiring him, they are doing research to see if heis popular with teens. Would they get good survey results from takinga survey about the basketball player from each of these surveys?
1. 200 teens at a basketball game of the basketball player’s team
2. 25 teens at a shopping mall
3. 500 students at a number of different middle and high schools
Decide whether each location is a good place to find a representativesample for the selected survey. Justify your answer.
4. number of hours of television watched in a month at a shopping mall
5. favorite kind of entertainment at a movie theater
6. whether families own pets in an apartment complex
7. taste test of a soft drink at a grocery store
8. favorite teacher in a school cafeteria
9. teenagers’ favorite magazine at five different high schools
NAME ________________________________________ DATE ______________ PERIOD _____
Enrichment
© Glencoe/McGraw-Hill 106 Mathematics: Applications and Concepts, Course 2
Enrichment
![[PPT]PowerPoint Presentation - PC\|MACimages.pcmac.org/SiSFiles/Schools/NC/OnslowCounty... · Web viewTitle PowerPoint Presentation Author Zittle, Robert Last modified by seth.landesman](https://img.pdfslide.us/doc/110x75/5ab479377f8b9adc638c1c92/pptpowerpoint-presentation-pc-viewtitle-powerpoint-presentation-author-zittle.jpg)