Embed Size (px)
Citation preview
Page 1 of 26
FSIS Nationwide Beef and Veal Carcass Microbiological Baseline Survey
Study Design and Sampling Plan
September 2013
Microbiological Analysis and Data Team
Science Staff Office of Public Health Science
Food Safety and Inspection Service
United States Department of Agriculture
FSIS Contact:
Dr. Hans D. Allender, Statistician [email protected]
202-690-0771
Dr. James Rogers, Team Lead
202-690-6537
Dr. Uday Dessai, Director Science Staff
202-690-6431
Page 2 of 26
Table of Contents
1. Executive Summary ---------------------------------------------------------------------------------------- 3
2. Program Summary: ---------------------------------------------------------------------------------------- 5
3. Study Objectives -------------------------------------------------------------------------------------------- 5
4. Target Populations ----------------------------------------------------------------------------------------- 5
5. Study Specifications ---------------------------------------------------------------------------------------- 6
A. Background ------------------------------------------------------------------------------------ 6
B. Sampling Techniques ------------------------------------------------------------------------- 6
C. Indicator Organisms ------------------------------------------------------------------------- 7
D. Pathogenic Organisms ----------------------------------------------------------------------- 7
6. Study Design: ----------------------------------------------------------------------------------------------- 8
A. Development of Sampling Frame ---------------------------------------------------------- 9
B. Stratification --------------------------------------------------------------------------------- 10
C. Allocation of Samples per Stratum -------------------------------------------------------- 12
D. Sampling Design, Table 1 ------------------------------------------------------------------ 14
E. Expected Statistical Precision and Power ------------------------------------------------ 15
F. Sample Collection Method and Sampling Location within Establishments ---------- 16
G. Additional Comments on Sample Design ------------------------------------------------- 17
7. Potential Sources of Error and Biases ---------------------------------------------------------------- 17
A. Sampling Technique Error ----------------------------------------------------------------- 18
B. Laboratory Error ---------------------------------------------------------------------------- 18
8. Data Analysis Plan --------------------------------------------------------------------------------------- 19
A. Analytical Approach ------------------------------------------------------------------------ 19
B. Regular Reporting of Microbiological Test Results ------------------------------------- 19
C. Estimation of Prevalence and Quantitative Levels -------------------------------------- 19
Appendix 1 Figures Showing Power and Sampling Error for Beef -------------------------------- 21
Appendix 1-A Script for Power Graphs ------------------------------------------------------------------ 23
Appendix 2 Figures Showing Power and Sampling Error for Veal -------------------------------- 24
References ---------------------------------------------------------------------------------------------------- 26
Page 3 of 26
1. Executive Summary FSIS will launch a nationwide Beef and Veal Carcass Baseline Survey (B-VCBS) to sample establishments that slaughter and process beef and veal carcasses in FY 2014. During this survey FSIS will sample steers, heifers, cows, bulls, stag, dairy cows, and veal at two locations in the slaughterhouse. These two processing points are - immediately after hide removal (pre-evisceration) and at pre-chill (after all antimicrobial interventions). The B-VCBS will provide FSIS the data on percent positives and quantitative levels of select foodborne bacterial pathogens (e.g. Salmonella sp., Escherichia coli O157:H7 and non-O157 Shiga-toxin producing E. coli [STEC] and levels of total bacteria [aerobic plate count], generic E. coli, coliforms, and Enterobacteriaceae). FSIS will use the data from B-VCBS to estimate the national prevalence of select microorganisms, to develop industry performance guidelines, to assess process control across the industry, and to inform additional policy considerations. For the baseline surveys that were completed in the recent years, FSIS has published two documents for each baseline; a study design and a final survey report. The study design is published before the start of the survey for review by stakeholders and a final report with the national prevalence calculations is published at the completion of the survey. For B-VCBS, this first document outlines the study design and proposed sampling plan. The sampling frame for B-VCBS consists of 200 establishments with 184 establishments that process beef carcasses (steers/heifers/cows/bulls/stag/dairy cows and represent approximately 99% beef production, and 16 establishments that process veal carcasses (bob veal, heavy calf, non-formula-fed veal, and formula-fed veal) and represent approximately 92% of veal production. The sample design is stratified according to establishment production volume. The 200 establishments in the sampling frame are divided into 3-strata. Establishments within each stratum are sampled with a frequency and sample size determined by their relative production volumes. The boundaries for each stratum were calculated using the visual clustering method approach; this approach minimizes the variability within each stratum. The sampling design includes oversampling to accommodate for non-response and discarded samples. FSIS will adjust the sampling frame to account for ongoing changes in establishments’ status. For the establishments that process beef carcasses 117 out of the 184 will be sampled, and to capture data from small establishments a relatively larger number of samples has been allocated to the third stratum (small establishments). All 16 Veal processing plants are included in a separate stratum. The sampling details for the beef-veal sampling plan are listed in Table 1. The beef carcass sampling methodology adopted for this baseline was developed by the Agriculture Research Service (ARS) Meat Animal Research Center (MARC). FSIS inspectors will apply the ARS carcass swab procedure to randomly selected carcasses in each of the selected plants. Each side of the same carcass will be swabbed at two sampling points - after hide removal, but before pre-evisceration and at pre-chill after application of all antimicrobial
Page 4 of 26
interventions. FSIS will use a modified method for veal carcass sampling to accommodate for the carcass size difference. Samples will be analyzed for qualitative and quantitative level of pathogens and indicator bacteria and National prevalence estimates for Salmonella, Escherichia coli O157:H7, and non-O157 Shiga-toxin producing E. coli (STEC) will be developed for both beef and veal carcasses.
Page 5 of 26
Study Design and Sampling Plan
2. Program Summary: During the Beef and Veal Carcass Baseline Survey (B-VCBS), USDA Food Safety and Inspection Services (FSIS) will collect approximately 2,612 beef carcass samples and 576 veal carcass samples from establishments under federal inspection. Each establishment will be sampled several times over the 12-month survey’s period. Laboratory personnel will analyze swab samples from beef and veal carcasses to detect and quantify selected foodborne pathogens and indicator organisms. Results of this study will be used to estimate volume-weighted prevalence and bacterial loads immediately after hide removal and at pre-chill.
3. Study Objectives: Objective 1- Estimate the prevalence and bacterial load (quantitative level) of pathogenic organisms Escherichia coli O157:H7, non-O157 Shiga-toxin producing E. coli1, and Salmonella on carcasses. Detect the presence and estimate the quantitative levels of indicator organisms, including generic E. coli, Total Viable Count (TVC)2, Enterobacteriaceae and total coliforms;
Objective 2- Obtain data for use in microbiological risk assessments to guide the development of Agency programs and guidance for industry related to process control; and
Objective 3- Perform post-hoc statistical analyses of the microbiological data when appropriate to explore the following additional issues:
1. Compare prevalence and counts between pathogenic organisms and indicator organisms to determine relationships and associations;
2. Compare the count and prevalence of the selected bacteria to previous studies (where appropriate); and
3. Assess the effects of various factors on the microbiological profile (e.g., geographic region, seasonality, inspection system, plant size, and specific antimicrobial interventions).
4. Target Populations:
1 Non-O157 Shiga-toxin producing E. Coli (STEC) included in this survey are: O23, O45, O103, O111, O121, and O145. 2 In previous Baselines FSIS has used the term Aerobic Plate Count (APC) which is a type of TVC that uses plate counts (e.g., Petrifilm). The TEMPO method is not a plate count; it is an automated MPN so its creator the company “bioMerieux” calls it a Total Viable Count. Even if TEMPO is not used, TVC will be a more appropriate term to describe the Petrifilm.
Page 6 of 26
FSIS will estimate the microorganism concentration on beef and veal carcasses for the composite of all federally inspected establishments producing these carcasses. FSIS will publish a Notice (1) with more information.
Establishments processing beef carcasses are included in the survey if they slaughter any kind of beef animal, including steers, heifers, cows, bulls, stags, or dairy cows. The survey will not include other amenable species such as bison and buffalo. Veal establishments are included in the survey if they slaughter bob veal, heavy calves, non-formula-fed veal, or formula-fed veal. Bob veal at 50.7% and formula-fed veal at 43.3% are the primary types of veal slaughtered.
5. Study Specifications: A. Background:
The FSIS mission is to ensure that the Nation’s commercial supply of meat, poultry, and egg products are safe to consume, correctly labeled, and properly packaged. Based on previous baselines results, the FSIS published the Pathogen Reduction Hazard Analysis and Critical Control Point Systems (PR/HACCP) Final Rule (2, 3) with the goal of reducing the prevalence and counts of pathogenic organisms in meat and poultry products. The rule mandates that all establishments slaughtering cattle, swine, chickens, or turkeys screen products for levels of E. coli Biotype 1 (generic E. coli) at a frequency based on production volume. Levels of generic E. coli are used to statistically track process control of fecal contamination. The rule also includes foodborne pathogen prevalence-based performance criteria for meat and poultry products. In support of this mission and the PR/HACCP rule, FSIS conducts periodic baseline studies that analyze various food commodities for foodborne microorganisms.
B. Sampling Techniques:
FSIS will obtain samples following the procedures described in the United States Department of Agriculture Agricultural Research Service Meat Animal Research Center Carcass Sampling Protocol (4). Also, instructions for sample collectors are provided on computer-generated sample forms and through the FSIS Notice to be published shortly.
Eligible establishments: Except for establishments outside the continental U.S., all federally inspected beef establishments slaughtering over 1,000 animals per year are eligible for inclusion in the survey. For veal, establishments slaughtering over 10,000 animals per year within the continental U.S. are included in the survey. Prior to the start of the survey, FSIS will conduct a 90-day trial sampling practice period called “shakedown.” The shakedown phase helps the Agency to gather preliminary information and data to make further refinements to the survey while allowing FSIS personnel to practice the steps necessary to conduct an efficient study.
Page 7 of 26
Collection Method: During the survey, sample collectors will collect swab samples from beef carcasses by swabbing 8,000 cm2 of the surface area representing one side of one carcass. Sample collectors will follow procedures based on the USDA ARS MARC methodology. The swabs will be shipped to FSIS laboratories and analyzed for foodborne pathogenic and indicator bacteria using FSIS laboratory methods (5). Similarly, FSIS will sample veal carcasses by swabbing 4,000 cm2 of the surface area; the same USDA ARS MARC carcass sampling protocol procedures will apply.
Location of collection: FSIS inspectors will obtain samples at two points in the slaughter process: immediately after hide removal, but before evisceration and at pre-chill before the carcasses enter the chillers and after all antimicrobial applications. In cases of establishments working two shifts, sample collectors are requested to collect samples from both shifts through the survey, and will specify the production shift on which the sample is collected. To measure differences in pathogen and indicator data at these two processing points across the industry, the after hide removal and pre-chill samples will be sampled either from the same carcass or, as necessary, from carcasses from the same production timeframe.
Sample collection procedure:
1. Randomly select a production line (if there is more than one slaughter production line in the establishment).
2. Select a beef or veal carcass after hide removal, but before evisceration; swab 8,000 cm surface area of the beef carcass using two swabs (4,000 cm2 each from the upper and lower half of the carcass side). In case of a veal carcass, then swab 4,000, cm2 of the veal carcass surface area using two swabs (2000 cm2 from the upper and lower half of the
2
carcass side). 3. After swabbing, place each one of the four swabs in individual bags. 4. Move to the pre-chill area and select the unsampled side of the same carcass, if this is not
possible select a different carcass for swabbing. 5. After swabbing in the same fashion as in step 2, place each of the four swabs in
individual bags. 6. Cool samples (on ice or in refrigerator) within 5 minutes of collection and keep sample
under refrigeration until shipping. Do not freeze. 7. Place all swabs in the shipping container, seal shipping container, and ship all samples to
the lab on the day of collection.
C. Indicator Organisms The samples will be analyzed for levels of bacteria including coliforms, Enterobacteriaceae, generic E. coli, and Total Viable Count (TVC).
D. Pathogenic Organisms
Page 8 of 26
FSIS will provide estimates of the prevalence and levels of the foodborne pathogens E. coli O157:H7, non-O157 STEC, and Salmonella.
6. Study Design: FSIS identified beef and veal slaughter establishments listed in the Public Health Information System (PHIS) database. Each establishment’s yearly production volume was recorded and ranked. The intent of this survey is to reflect the entire federally regulated supply of each commodity in the United States. This baseline is subject to a series of constraints. The scope of the survey includes two products: beef and veal; and several bacteriological targets. Calculations of production volume are based on annual production measured in a 12-month span from February 2012 through January 2013.
Summary of Survey parameters:
1. This survey presents a stratified design based on production volume in head slaughtered/year • Beef: three strata design • Veal: a single stratum
2. This survey has a 3-month training period or “shakedown” before the survey starts. Product from each plant selected will be sampled once per month to collect two samples (one after hide removal and one at pre-chill); ideally, the post-hide removal and pre-chill samples will be paired, that is, collected from the same carcass; this is 6 samples per plant during the 3-month shakedown.
3. Plants eliminated from the survey because of location or practical reasons: • Plants eliminated because of location; plants in Alaska (4), Hawaii (7), the Virgin
Islands (2), and Puerto Rico (5). Factors considered included high cost for shipping samples to the laboratories and high probability of samples arriving outside of established parameters. This would result in an unacceptable number of discarded samples.
• For beef: Plants producing less than 1,000 carcasses per year. These plants were eliminated from the survey because of their small contribution to the total production volume. In addition, irregular patterns of production in these plants will produce a high likelihood of nonresponse, because of difficulty scheduling sampling to coincide with operations.
• For veal: Plants producing less than 10,000 carcasses per year. These plants were eliminated from the survey because their small contribution to total production. In
Page 9 of 26
addition, when comparing veal with beef, veal represents only 0.5% of the total beef consumed in the U.S., so for survey efficiency, FSIS will concentrate on larger producers of veal.
• After the reductions, plants in the sampling frame3 are: o Beef: 184 plants slaughtering 31,348,197 carcasses per year; approximately
99% of total U.S. beef production. o Veal: 16 plants slaughtering 674,884 carcasses per year; approximately 92%
of total U.S. veal production. 4. This survey will sample a disproportionally large number of small plants in the third
stratum of beef to obtain data needed for providing guidance on indicator bacteria and assess process control. This will help small establishments to satisfy the Hazard Analysis and Critical Control Point (HACCP) System Part II (2).
5. Because of resource constraints, the total number of samples will be limited to fewer than 4,000 samples.
6. A sampling event is a visit to an establishment regardless of strata (plant size) or product (beef or veal) to collect two samples (one after hide removal and one at pre-chill).
7. Selection of establishments in the stratum for which there will not be 100% sampling (i.e., third stratum of beef) will be based on a random selection of available plants.
A. Development of Sampling Frame
One aim of this survey is to make pathogen prevalence estimations for federally inspected establishments that slaughter beef and veal carcasses identified in the Public Health Information System (PHIS). The study anticipates that the day-to-day production at establishments in the sampling frame will vary through time, and FSIS will review the sampling frame periodically to accommodate for inclusion of new establishments or closure of existing ones. The Agency will update each establishment’s production volume at the end of the study to reflect actual production volume.
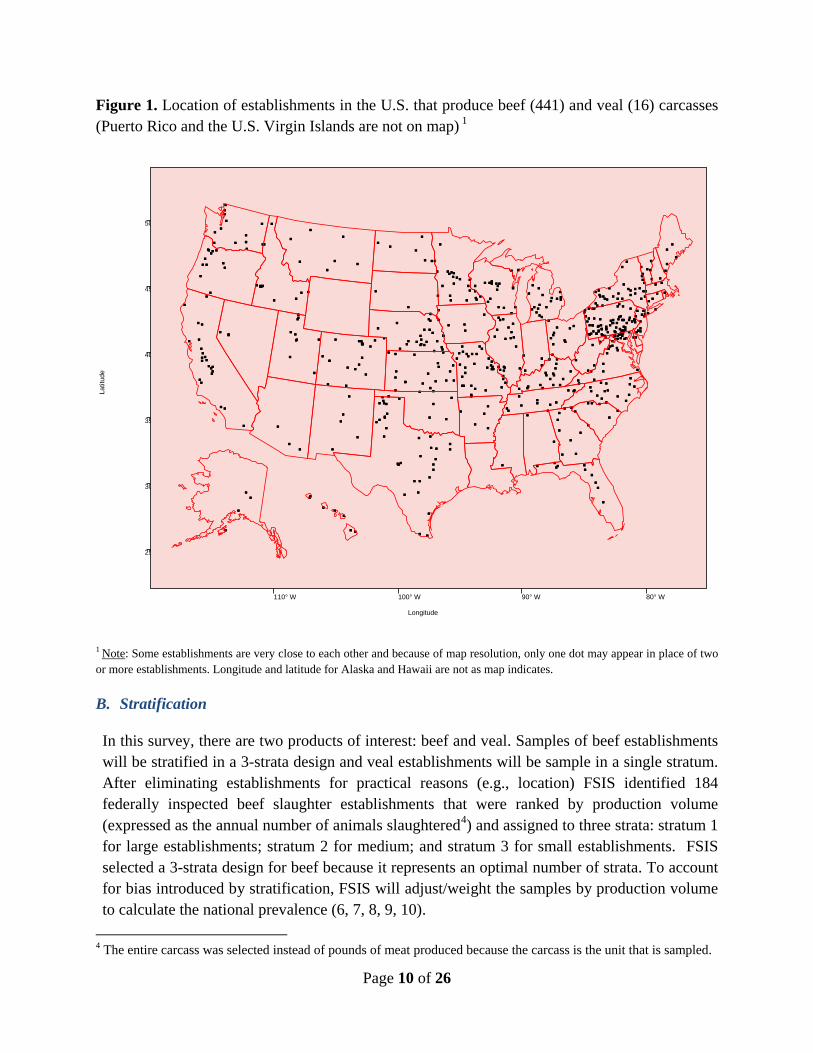
Beef and veal establishments are located across the U.S.; however, FSIS has a presence in all establishments, which allows for a nationwide geographical sample. Figure 1 presents a U.S. map with the location of beef and veal establishments in the U.S. Because of their remote location, FSIS will not sample establishments in AK (4), HI (7), VI (2), and PR (5). Cost and shipping time is a factor in the elimination of these establishments. Also excluded from the sampling frame are beef establishments slaughtering fewer than 1,000 animals per year or veal establishments slaughtering fewer than 10,000 animals per year. The irregular production pattern of these establishments makes sample collection difficult and the contribution of these small establishments to the national production is small.
3 In statistics, a sampling frame is the source from which samples may be drawn. In this survey, the sampling frame is the establishments that may be sampled (184 for beef and 16 for veal).
Page 10 of 26
Figure 1. Location of establishments in the U.S. that produce beef (441) and veal (16) carcasses (Puerto Rico and the U.S. Virgin Islands are not on map) 1
1 Note: Some establishments are very close to each other and because of map resolution, only one dot may appear in place of two or more establishments. Longitude and latitude for Alaska and Hawaii are not as map indicates.
B. Stratification In this survey, there are two products of interest: beef and veal. Samples of beef establishments will be stratified in a 3-strata design and veal establishments will be sample in a single stratum. After eliminating establishments for practical reasons (e.g., location) FSIS identified 184 federally inspected beef slaughter establishments that were ranked by production volume (expressed as the annual number of animals slaughtered4) and assigned to three strata: stratum 1 for large establishments; stratum 2 for medium; and stratum 3 for small establishments. FSIS selected a 3-strata design for beef because it represents an optimal number of strata. To account for bias introduced by stratification, FSIS will adjust/weight the samples by production volume to calculate the national prevalence (6, 7, 8, 9, 10).
4 The entire carcass was selected instead of pounds of meat produced because the carcass is the unit that is sampled.
Latit
ude
25
30
35
40
45
50
110° W 100° W 90° W 80° W
Longitude
Page 11 of 26
There are several methods to define each stratum boundary, i.e., Dalenius-Hodge, Geometric Method, and Visual Method. The Visual Method was chosen because it is easy to use and provides partitions using the natural breaks in the data, which minimizes error within stratum for the design.
Method Description of the Visual Method:
In the visual clustering method, the analyst visually assesses the data by plotting the data and using the natural breaks occurring in the sequence of values as potential boundaries. For improved visual aid, the production volume data is converted to log10 and observed on a graph (Figure 2). Once the natural boundaries are established, the log10 boundaries are converted to production volume to find the stratification boundaries.
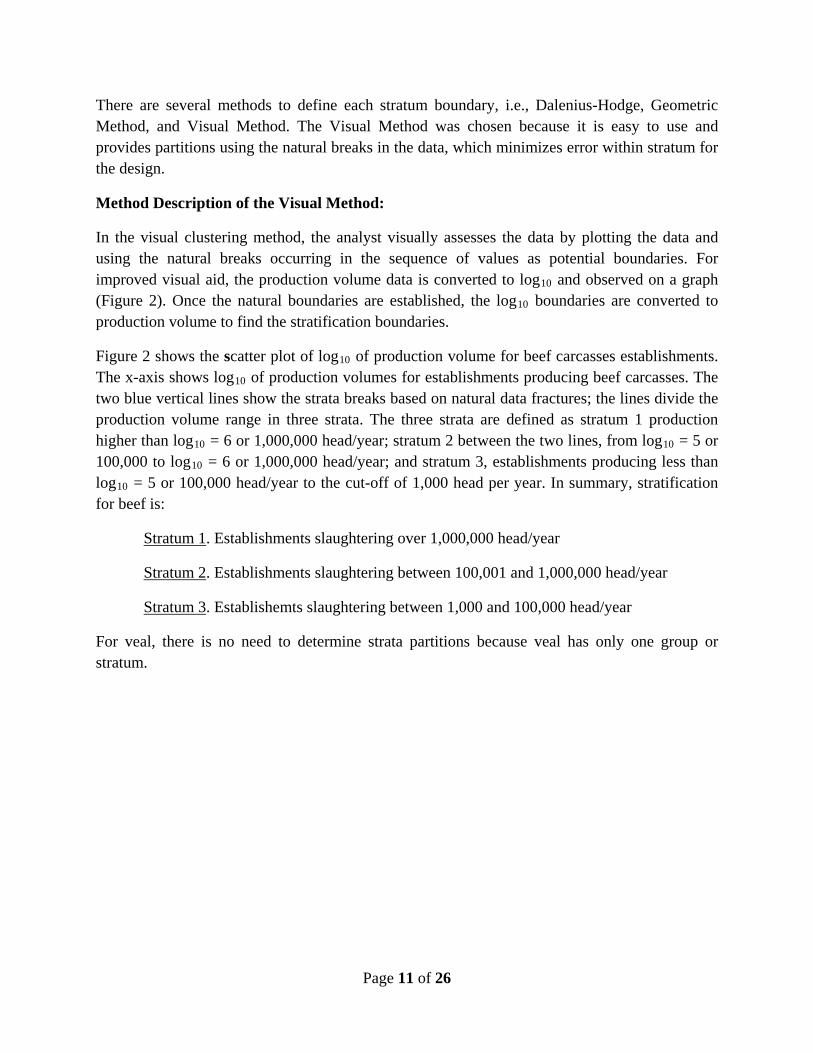
Figure 2 shows the scatter plot of log10 of production volume for beef carcasses establishments. The x-axis shows log10 of production volumes for establishments producing beef carcasses. The two blue vertical lines show the strata breaks based on natural data fractures; the lines divide the production volume range in three strata. The three strata are defined as stratum 1 production higher than log10 = 6 or 1,000,000 head/year; stratum 2 between the two lines, from log10 = 5 or 100,000 to log10 = 6 or 1,000,000 head/year; and stratum 3, establishments producing less than log10 = 5 or 100,000 head/year to the cut-off of 1,000 head per year. In summary, stratification for beef is:
Stratum 1. Establishments slaughtering over 1,000,000 head/year
Stratum 2. Establishments slaughtering between 100,001 and 1,000,000 head/year
Stratum 3. Establishemts slaughtering between 1,000 and 100,000 head/year
For veal, there is no need to determine strata partitions because veal has only one group or stratum.
Page 12 of 26
Figure 2. Beef: Visual stratification
C. Allocation of Samples per Stratum The following allocation of sampling events is based on field and design restrictions. A sampling event consists of a visit to the establishment that results in collection of two beef or veal samples, one after hide removal, and one at pre-chill for veal and beef strata 1, 2 and 3.
1. Stratum 1: Two events per establishment per month (24 events per establishment per year) resulting in collection of 48 (24 x 2) samples per establishment per year. All plants in this stratum will be sampled.
2. Stratum 2: Four events per establishment every 3 months (16 events per establishment per year) resulting in collection of 32 (16 x 2) samples per establishment per year. All plants in this stratum will be sampled.
3. Stratum 3: One event per establishment every 2 months (six events per establishment per year) resulting in collection of 12 (6 x 2) samples per establishment per year. A proportion of establishments (50%) in this stratum or 67 establishments were selected for sampling at random.
2.0 2.5 3.0 3.5 4.0 4.5 5.0 5.5 6.0 6.5 7
Stratum 3 Stratum 2 Stratum 1
Page 13 of 26
4. For veal: Three events per establishment every 2 months (18 events per establishment per year) resulting in collection of 36 (18 x 2) samples per establishment per year. All plants in this stratum will be sampled.
5. Shakedown: This survey has a “shakedown” or 3-month training period before the survey starts. Each plant selected for sampling (beef or veal) will be visited once per month to collect two samples (one at hide removal and one at pre-chill); this is six samples per plant during the 3-month shakedown. Given that this is the first baseline for FSIS with carcasses, “shakedown” becomes a very important part of the survey that will clarify access to carcasses in plants, expected percent of positives for the many bacterial targets, variances of preliminary estimations, etc.
Based on the above sample allocation, Table 1 presents the sample scheme for survey design. The beef stratum 1 represents 54% of production and stratum 3 only 5% of production. In stratum 3, FSIS will select at random 50% of the establishments for sampling. To satisfy requirements of sampling small establishments, this design allocates 30.8% of beef samples to the third stratum that only produces 5% of total production. This design samples 133 establishments and calls for 3,986 samples in both shakedown and the survey. Overall, the distribution of sample allocation is as follows:
1. Percentage of samples allocated to beef, 65.5% (2,612 samples) 2. Percentage of samples allocated to veal, 14.5% (576 samples) 3. Percentage of samples allocated to shakedown, 20% (798 samples)
Shakedown allocates 702 samples (88%) to beef and 96 samples (12%) to veal. Combining the samples from shakedown and the 12-month survey, beef will receive 3,314 (2,612 + 702) samples. The distribution by strata is, stratum 1- 702 (624 + 78), stratum 2- 1,406 (1,184 + 222), and stratum 3– 1,206 (804 + 402). For beef, the combination of these two phases of the survey produces a final allocation by strata of, stratum 1- 21.2%, stratum 2– 42.4% and stratum 3- 36.4%. Veal will receive 672 (576 + 96) samples.
Page 14 of 26
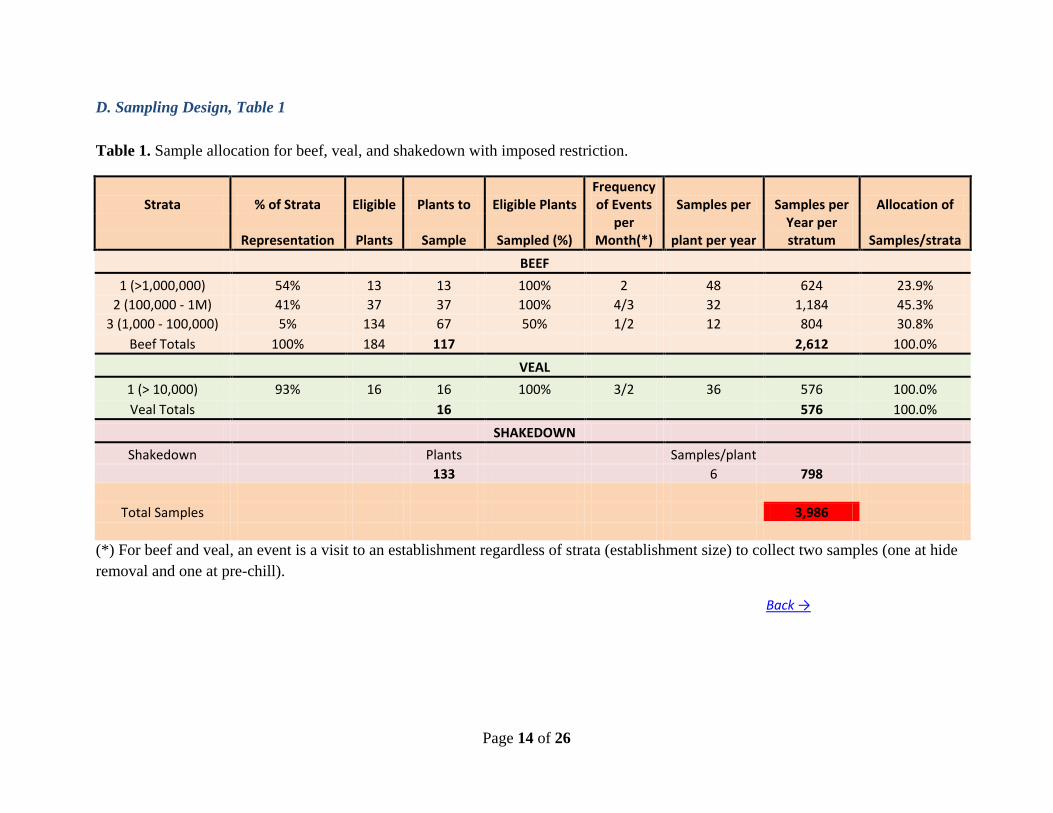
D. Sampling Design, Table 1 Table 1. Sample allocation for beef, veal, and shakedown with imposed restriction.
Strata % of Strata Eligible Plants to Eligible Plants Frequency of Events Samples per Samples per Allocation of
Representation Plants Sample Sampled (%) per
Month(*) plant per year Year per stratum Samples/strata
BEEF
1 (>1,000,000) 54% 13 13 100% 2 48 624 23.9% 2 (100,000 - 1M) 41% 37 37 100% 4/3 32 1,184 45.3%
3 (1,000 - 100,000) 5% 134 67 50% 1/2 12 804 30.8% Beef Totals 100% 184 117 2,612 100.0%
VEAL
1 (> 10,000) 93% 16 16 100% 3/2 36 576 100.0% Veal Totals 16 576 100.0%
SHAKEDOWN
Shakedown Plants Samples/plant 133 6 798
Total Samples 3,986
(*) For beef and veal, an event is a visit to an establishment regardless of strata (establishment size) to collect two samples (one at hide removal and one at pre-chill).
Back →
Page 15 of 26
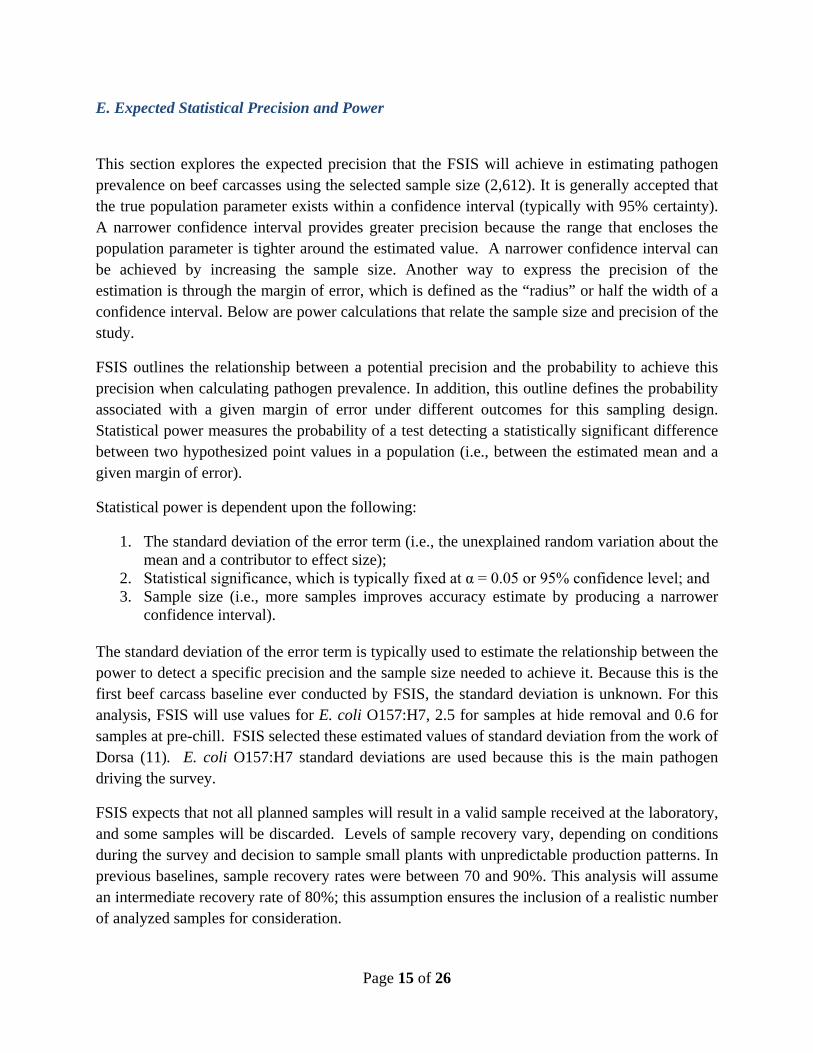
E. Expected Statistical Precision and Power
This section explores the expected precision that the FSIS will achieve in estimating pathogen prevalence on beef carcasses using the selected sample size (2,612). It is generally accepted that the true population parameter exists within a confidence interval (typically with 95% certainty). A narrower confidence interval provides greater precision because the range that encloses the population parameter is tighter around the estimated value. A narrower confidence interval can be achieved by increasing the sample size. Another way to express the precision of the estimation is through the margin of error, which is defined as the “radius” or half the width of a confidence interval. Below are power calculations that relate the sample size and precision of the study.
FSIS outlines the relationship between a potential precision and the probability to achieve this precision when calculating pathogen prevalence. In addition, this outline defines the probability associated with a given margin of error under different outcomes for this sampling design. Statistical power measures the probability of a test detecting a statistically significant difference between two hypothesized point values in a population (i.e., between the estimated mean and a given margin of error).
Statistical power is dependent upon the following:
1. The standard deviation of the error term (i.e., the unexplained random variation about the mean and a contributor to effect size);
2. Statistical significance, which is typically fixed at α = 0.05 or 95% confidence level; and 3. Sample size (i.e., more samples improves accuracy estimate by producing a narrower
confidence interval).
The standard deviation of the error term is typically used to estimate the relationship between the power to detect a specific precision and the sample size needed to achieve it. Because this is the first beef carcass baseline ever conducted by FSIS, the standard deviation is unknown. For this analysis, FSIS will use values for E. coli O157:H7, 2.5 for samples at hide removal and 0.6 for samples at pre-chill. FSIS selected these estimated values of standard deviation from the work of Dorsa (11). E. coli O157:H7 standard deviations are used because this is the main pathogen driving the survey.
FSIS expects that not all planned samples will result in a valid sample received at the laboratory, and some samples will be discarded. Levels of sample recovery vary, depending on conditions during the survey and decision to sample small plants with unpredictable production patterns. In previous baselines, sample recovery rates were between 70 and 90%. This analysis will assume an intermediate recovery rate of 80%; this assumption ensures the inclusion of a realistic number of analyzed samples for consideration.
Page 16 of 26
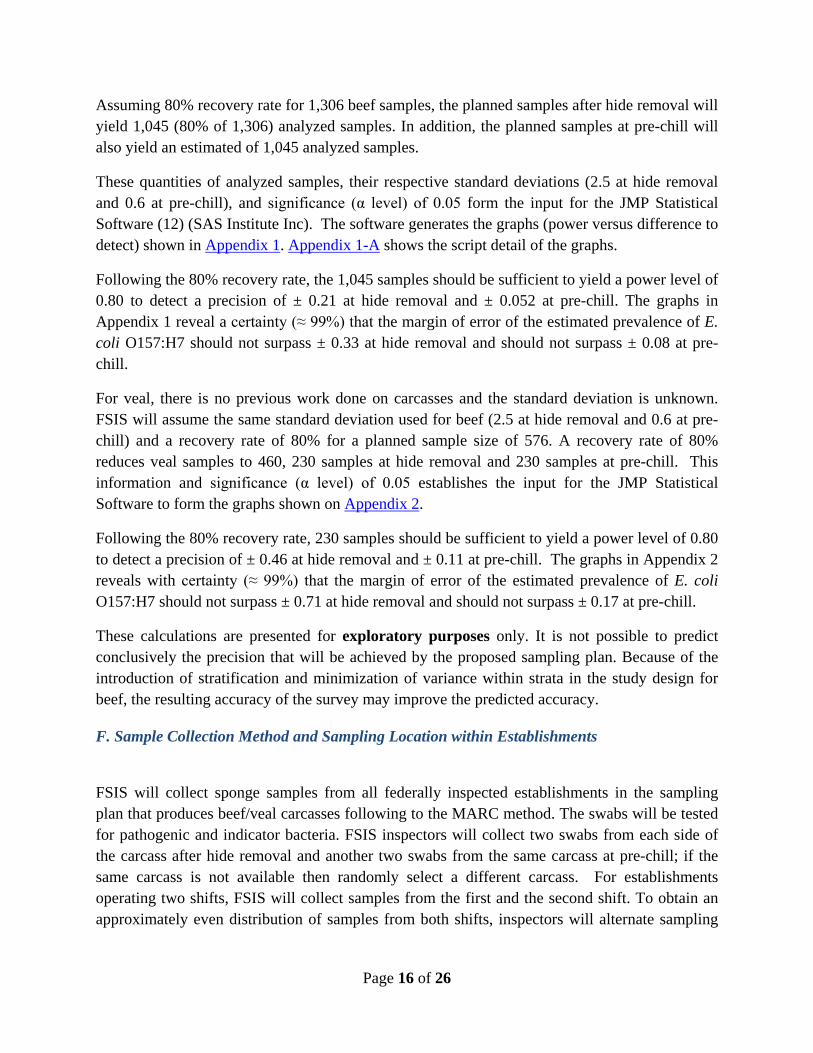
Assuming 80% recovery rate for 1,306 beef samples, the planned samples after hide removal will yield 1,045 (80% of 1,306) analyzed samples. In addition, the planned samples at pre-chill will also yield an estimated of 1,045 analyzed samples.
These quantities of analyzed samples, their respective standard deviations (2.5 at hide removal and 0.6 at pre-chill), and significance (α level) of 0.05 form the input for the JMP Statistical Software (12) (SAS Institute Inc). The software generates the graphs (power versus difference to detect) shown in Appendix 1. Appendix 1-A shows the script detail of the graphs.
Following the 80% recovery rate, the 1,045 samples should be sufficient to yield a power level of 0.80 to detect a precision of ± 0.21 at hide removal and ± 0.052 at pre-chill. The graphs in Appendix 1 reveal a certainty (≈ 99%) that the margin of error of the estimated prevalence of E. coli O157:H7 should not surpass ± 0.33 at hide removal and should not surpass ± 0.08 at pre-chill.
For veal, there is no previous work done on carcasses and the standard deviation is unknown. FSIS will assume the same standard deviation used for beef (2.5 at hide removal and 0.6 at pre-chill) and a recovery rate of 80% for a planned sample size of 576. A recovery rate of 80% reduces veal samples to 460, 230 samples at hide removal and 230 samples at pre-chill. This information and significance (α level) of 0.05 establishes the input for the JMP Statistical Software to form the graphs shown on Appendix 2.
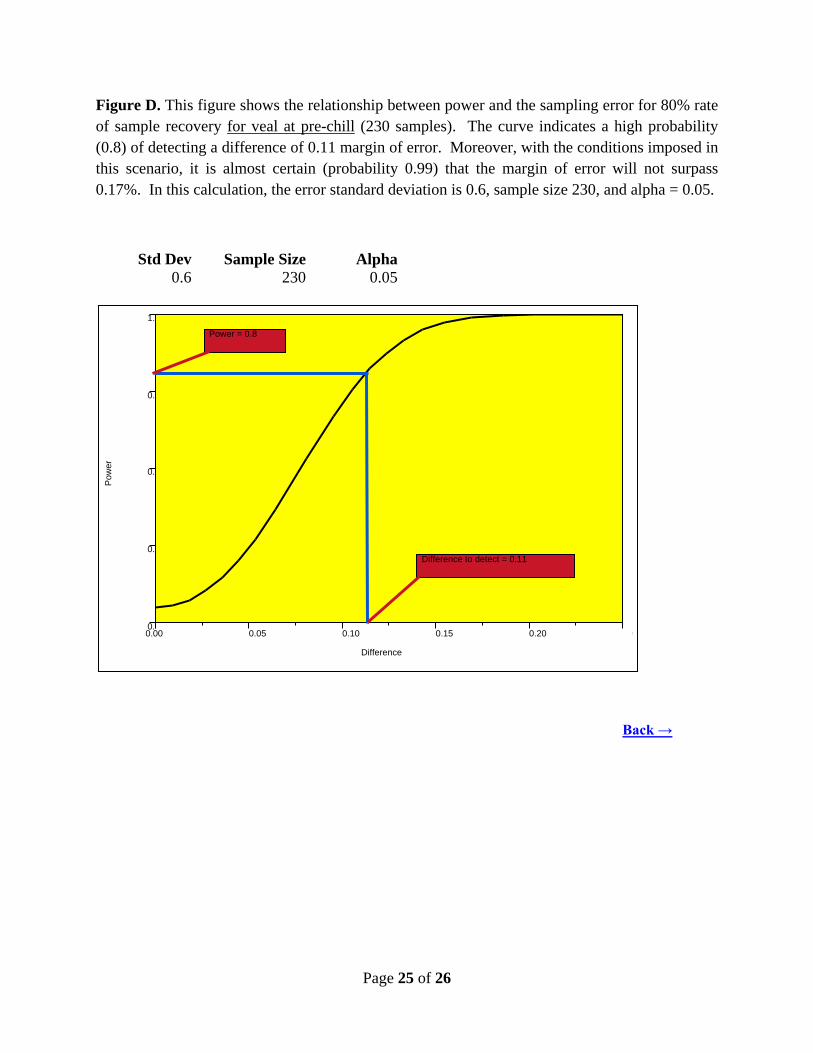
Following the 80% recovery rate, 230 samples should be sufficient to yield a power level of 0.80 to detect a precision of ± 0.46 at hide removal and ± 0.11 at pre-chill. The graphs in Appendix 2 reveals with certainty (≈ 99%) that the margin of error of the estimated prevalence of E. coli O157:H7 should not surpass ± 0.71 at hide removal and should not surpass ± 0.17 at pre-chill.
These calculations are presented for exploratory purposes only. It is not possible to predict conclusively the precision that will be achieved by the proposed sampling plan. Because of the introduction of stratification and minimization of variance within strata in the study design for beef, the resulting accuracy of the survey may improve the predicted accuracy.
F. Sample Collection Method and Sampling Location within Establishments
FSIS will collect sponge samples from all federally inspected establishments in the sampling plan that produces beef/veal carcasses following to the MARC method. The swabs will be tested for pathogenic and indicator bacteria. FSIS inspectors will collect two swabs from each side of the carcass after hide removal and another two swabs from the same carcass at pre-chill; if the same carcass is not available then randomly select a different carcass. For establishments operating two shifts, FSIS will collect samples from the first and the second shift. To obtain an approximately even distribution of samples from both shifts, inspectors will alternate sampling
Page 17 of 26
collection between the first and the second shift. The sample request form will be fitted with a question for shift identification.
G. Additional Comments on Sample Design
This study addresses three distinct objectives: to estimate the prevalence and quantitative levels of selected foodborne microorganisms, obtain data for use in the development of Agency programs, and obtain data for informing industry guidance related to process control. The sample design and the resulting sample size are limited for this survey by practical constraints such as finite personnel, financial resources, and implementing scientific studies in real-world production settings. Considering these constraints, FSIS expects that the B-VCBS will achieve the stated objectives by collecting and analyzing as many samples as possible to ensure an appropriate level of statistical confidence.
Some of the sample requests will not yield a result; meaning some samples will not be collected and some will be discarded. Recognizing this limitation, the described sample design incorporates “oversampling” by approximately 10% to 20%. This “oversampling” ensures that enough samples are collected and analyzed, so that the study has an acceptable level of statistical reliability. For this survey, reliability is defined as developing estimations with a sufficient large sample, thus creating a minimal interval confidence and giving more precision to the estimate. The final data files will record deviations from the actual sample plan with entries showing nonresponse or “sample not analyzed” for various reasons. If necessary, FSIS will correct for nonresponses in the calculation of prevalence.
7. Potential Sources of Error and Biases
It is important to identify potential sources of error that may affect the results obtained from the proposed study and attempt to minimize such errors prior to the beginning of the study. Below are possible sources of error that may occur during this study and procedures that will be implemented to minimize the error.
In this study design and sample plan, errors will be classified as sampling and nonsampling. Sampling errors develop from sampling a subset of a population and not the entire population. Testing the entire population is not possible because of budget constraints. Sampling error during the B-VCBS may happen when samples are taken from some beef/veal carcasses-producing establishments but not all; the target organisms are unevenly distributed throughout the sample; and some establishments will not respond to the survey. FSIS assumes that the beef/veal carcass processing plants that will be sampled during the study are representative of the entire beef carcass processing industry. To adjust for the uneven distribution of microorganisms in each
Page 18 of 26
sample, FSIS aims to sample each establishment at frequent and evenly spaced intervals to ensure that the probability of isolating the target microorganisms is equal for each sample. Nonresponse may introduce bias and may occur with more intensity in establishments with low production volumes. To reduce nonresponse, FSIS will create a special e-mail account to answer questions from inspectors that may arise during sampling and to ensure that the forms and instructions are understood. The question/answer computerized system AskFSIS will also be used. The sample plan incorporates “overscheduling” to guarantee that a minimum number of samples are obtained. During the study, FSIS will closely monitor nonresponse and will follow up with inspectors to maximize the response rate. Moreover, FSIS will review monthly reports from the FSIS laboratories to identify potential non-response errors that may jeopardize the overall integrity of data obtained from the sampling results.
Non-sampling errors may bias the survey and they occur when either the sampling frame does not represent the population or the sample size does not represent the frame properly. The B-VCBS will utilize data and information from the 90-day shakedown to improve the sampling plan with the aim to minimize nonsampling error and other issues.
A. Sampling Technique Error Sampling techniques present inherent error because the sponge samples may not represent the microbiological status of the entire beef carcass, especially when the expected bacterial counts are low.
Variability in sample storage and shipment due to geographic and climate diversity may introduce error. Several procedures to standardize the collection technique should minimize the potential for this error. Instructions to sample collectors provide details concerning the collection process. All establishments receive the same brand of materials and a consistent type of swab prior to sample collection. Error may be introduced when samples are not refrigerated prior to sending them to the lab and therefore may be temperature abused. Samples should be refrigerated prior to shipment and should be shipped in a temperature controlled container. Sample processing occurs on the day of receipt at the laboratory.
B. Laboratory Error Inconsistency and variability in laboratory procedures can create measurement error in the data. Such errors include media preparation and storage, sample preparation and processing, sample dilution, plating, incubating, counting, and data entry. The process of obtaining total bacterial counts is a critical source of error for studies that seek to estimate bacterial prevalence or concentrations. To minimize the potential for variable data for indicator levels, the volume of diluent associated with the sponge will be adjusted in the laboratory to ensure consistency in relating the count to the surface area that was sampled. FSIS will evaluate and apply automated “most probable number” (MPN) testing technology for indicator testing to minimize variability associated with manual plate count procedures. Using the automated MPN system, Total Viable Count (TVC) will replace Aerobic Plate Count (APC). These tests produce equivalent results
Page 19 of 26
but have different names to reflect how the test creates the result; i.e., automated MPN as opposed to plate count. The laboratory technicians received training and conducted analyses during similar baseline surveys. Analysis will be conducted by one or more FSIS laboratories. FSIS laboratories are accredited as meeting the ISO 17025 specification by the American Association of Laboratory Accreditation. The laboratory has standard operating procedures for media preparation and storage, detailed sample preparation instructions, and microbiological methods. Preliminary reports of the microbiological data generated by the laboratory will identify data entry errors to ensure data quality.
8. Data Analysis Plan
A. Analytical Approach FSIS will maintain certain consistencies when analyzing B-VCBS data using several types of statistical analyses. First, the final weight assigned to each observation will remain consistent for all analyses used to compute population-based estimates. Second, the same hierarchical structure resulting from the complex survey design will apply to all mathematical models.
B. Regular Reporting of Microbiological Test Results Project managers will receive monthly reports of microbiological data (e.g., timeliness of submission, accuracy, and completeness) during the course of this baseline survey. The reports summarize the number of individual samples requested and discarded, including a reason for discard. A report will include a summary table illustrating the number of establishments contributing samples during the month. The preliminary reports will yield the response rate to sample requests and the crude (unweighted) rates of positive samples for pathogens. Project managers will also receive quarterly reports, including monthly tables and the findings from preliminary descriptive analyses of the microbiological test results. These reports are for internal use only. FSIS will not distribute the reports to a wider audience.
C. Estimation of Prevalence and Quantitative Levels The qualitative results, expressed as the detection (positive result) or nondetection (negative result) of each bacterial target, will provide an estimate of the percent positive of the unweighted sample. The quantitative results will provide an estimate of the geometric mean of the observed contamination levels. Additional variables in the dataset include the establishment and the date of sample collection.
The national prevalence estimate is equivalent to an average of positive sample results that have been weighted according to individual plant production volume. It is expected that the results of the percent positive for pathogens will differ slightly from the national prevalence due to the influence of the production volume of individual plants and other potential adjustments.
Page 20 of 26
Recordings of daily processing totals will provide auxiliary information to assign sampling weights to the individual observations in the dataset. The sampling weights will account for the variability in processing totals associated with establishment production at the time of collection, which can affect the establishment’s stratum and amount of product collected during the survey.
Prior to final analysis, the described sampling weights will be adjusted to account for nonresponse if necessary. FSIS plans to calculate estimates of prevalence using commercially available statistical software WesVar package developed for the design and analysis of complex surveys (13). Based on sampling replication methods, the statistical package will calculate the variance estimates of the point estimates and if necessary adjust for nonresponse.
Page 21 of 26
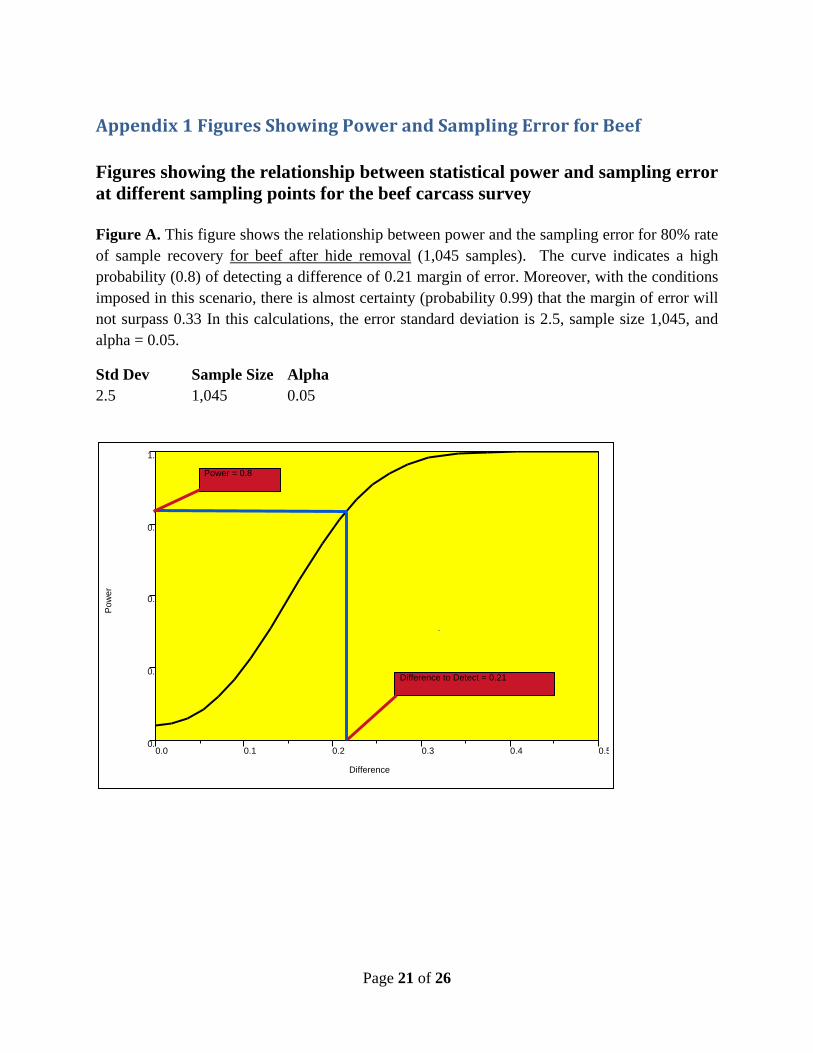
Appendix 1 Figures Showing Power and Sampling Error for Beef Figures showing the relationship between statistical power and sampling error at different sampling points for the beef carcass survey Figure A. This figure shows the relationship between power and the sampling error for 80% rate of sample recovery for beef after hide removal (1,045 samples). The curve indicates a high probability (0.8) of detecting a difference of 0.21 margin of error. Moreover, with the conditions imposed in this scenario, there is almost certainty (probability 0.99) that the margin of error will not surpass 0.33 In this calculations, the error standard deviation is 2.5, sample size 1,045, and alpha = 0.05.
Std Dev Sample Size Alpha 2.5 1,045 0.05
0.0
0.2
0.5
0.7
1.0
Pow
er
0.0 0.1 0.2 0.3 0.4 0.5
Difference
Power = 0.8
Difference to Detect = 0.21
Page 22 of 26
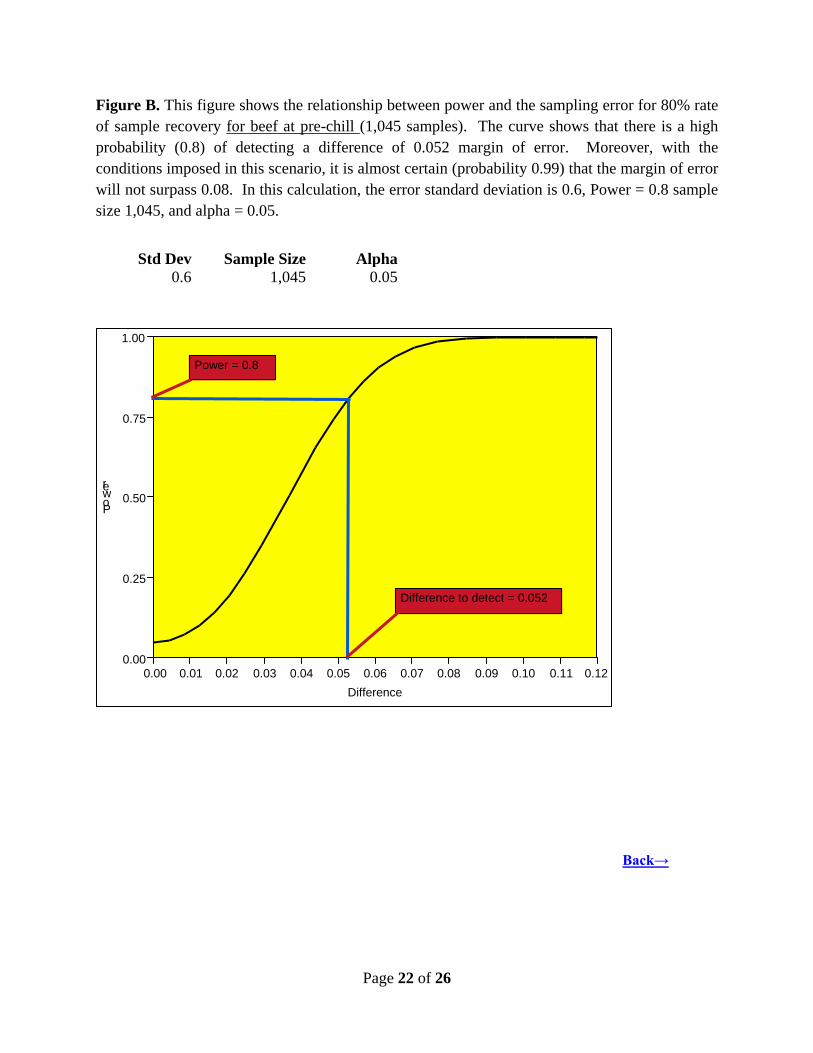
Figure B. This figure shows the relationship between power and the sampling error for 80% rate of sample recovery for beef at pre-chill (1,045 samples). The curve shows that there is a high probability (0.8) of detecting a difference of 0.052 margin of error. Moreover, with the conditions imposed in this scenario, it is almost certain (probability 0.99) that the margin of error will not surpass 0.08. In this calculation, the error standard deviation is 0.6, Power = 0.8 sample size 1,045, and alpha = 0.05.
Std Dev Sample Size Alpha
0.6 1,045 0.05
Back→
0.00
0.25
0.50
0.75
1.00
P o w e r
0.00 0.01 0.02 0.03 0.04 0.05 0.06 0.07 0.08 0.09 0.10 0.11 0.12 Difference
Difference to detect = 0.052
Power = 0.8
Page 23 of 26
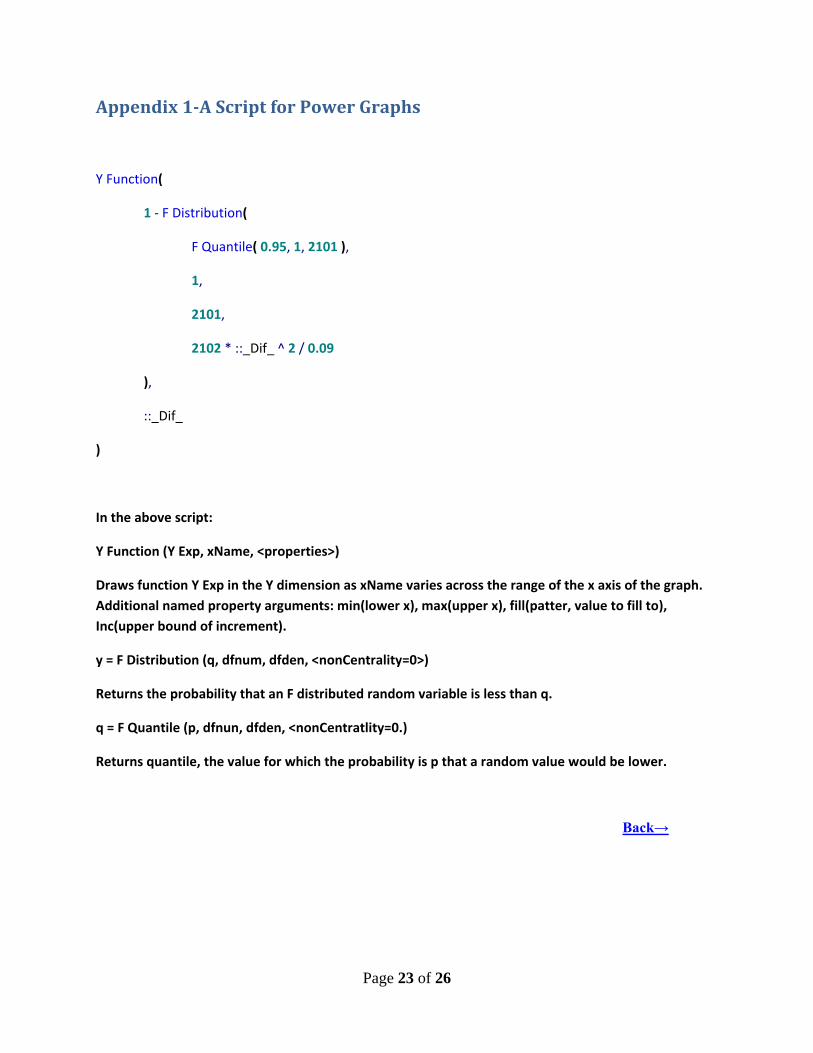
Appendix 1-A Script for Power Graphs
Y Function(
1 - F Distribution(
F Quantile( 0.95, 1, 2101 ),
1,
2101,
2102 * ::_Dif_ ^ 2 / 0.09
),
::_Dif_
)
In the above script:
Y Function (Y Exp, xName, <properties>)
Draws function Y Exp in the Y dimension as xName varies across the range of the x axis of the graph. Additional named property arguments: min(lower x), max(upper x), fill(patter, value to fill to), Inc(upper bound of increment).
y = F Distribution (q, dfnum, dfden, <nonCentrality=0>)
Returns the probability that an F distributed random variable is less than q.
q = F Quantile (p, dfnun, dfden, <nonCentratlity=0.)
Returns quantile, the value for which the probability is p that a random value would be lower.
Back→
Page 24 of 26
Appendix 2 Figures Showing Power and Sampling Error for Veal
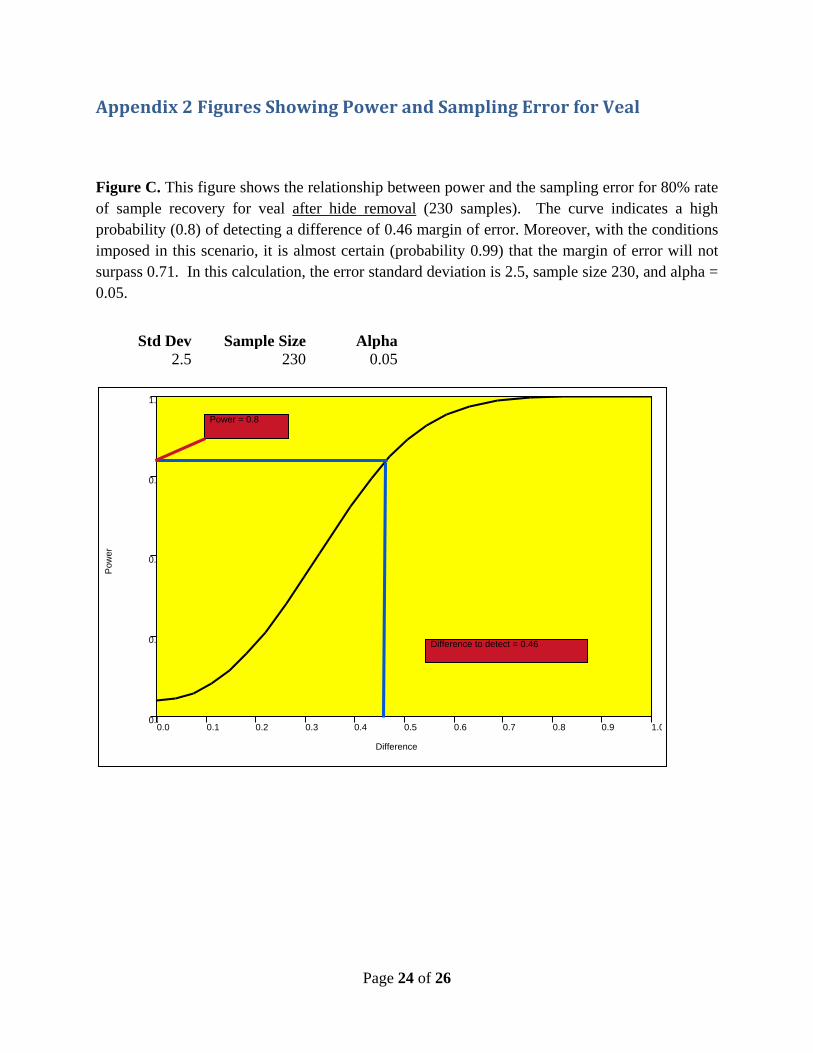
Figure C. This figure shows the relationship between power and the sampling error for 80% rate of sample recovery for veal after hide removal (230 samples). The curve indicates a high probability (0.8) of detecting a difference of 0.46 margin of error. Moreover, with the conditions imposed in this scenario, it is almost certain (probability 0.99) that the margin of error will not surpass 0.71. In this calculation, the error standard deviation is 2.5, sample size 230, and alpha = 0.05.
Std Dev Sample Size Alpha
2.5 230 0.05
0.0
0.2
0.5
0.7
1.0
Pow
er
0.0 0.1 0.2 0.3 0.4 0.5 0.6 0.7 0.8 0.9 1.0
Difference
Difference to detect = 0.46
Power = 0.8
Page 25 of 26
Figure D. This figure shows the relationship between power and the sampling error for 80% rate of sample recovery for veal at pre-chill (230 samples). The curve indicates a high probability (0.8) of detecting a difference of 0.11 margin of error. Moreover, with the conditions imposed in this scenario, it is almost certain (probability 0.99) that the margin of error will not surpass 0.17%. In this calculation, the error standard deviation is 0.6, sample size 230, and alpha = 0.05.
Std Dev Sample Size Alpha 0.6 230 0.05
Back →
0.0
0.2
0.5
0.7
1.0
Pow
er
0.00 0.05 0.10 0.15 0.20 0
Difference
Power = 0.8
Difference to detect = 0.11
Page 26 of 26
References
1. FSIS Notice on the Beef –Veal Carcass Baseline Survey to be publish shortly. 2. U.S. Department of Agriculture. 1996. Pathogen Reduction Hazard Analysis and Critical
Control Point Systems (PR/HACCP) Final Rule. Available at: http://www.fsis.usda.gov/OPPDE/rdad/FRPubs/93-016F.pdf.
3. U.S. Department of Agriculture Food Safety and Inspection Service. 15 July 1996. Pathogen reduction; hazard analysis and critical control point (HACCP) systems; final rule. Available at: http://www.fsis.usda.gov/OA/fr/haccp_rule.htm
4. U.S. Meat Animal Research Center (MARC) Carcass Sampling Protocol Available at: http://www.ars.usda.gov/SP2UserFiles/Place/54380530/protocols/USMARC%20Carcass%20Sampling%20Protocol.pdf
5. U.S. Department of Agriculture Food Safety and Inspection Service. 4 February 1998. FSIS Directive 10,230.5 Amend 1: Self-instruction guide for collecting raw meat and poultry product samples for Salmonella analysis. Available at: http://www.fsis.usda.gov/OPPDE/rdad/FSISDirectives/10230-5.pdf.
6. Cochran, W. G. 1977. Sampling Techniques. Third Edition. John Wiley and Sons, New York, NY.
7. Hansen, Hurwitz and Madow. 1993. Sample Survey Methods and Theory Volume I Methods and Applications. Chapter 5 Stratified Simple Random Sampling. John Wiley and Sons. New York, NY.
8. Lehtonen R., E. Pahkinen.2004. Practical Methods for Design and Analysis of Complex Surveys. Second Edition. Further Use of Auxiliary Information: Stratified Sampling. John Wiley and Sons. New York, NY.
9. Rust, K. 1985. Variance Estimation for Complex Estimation in Sample Surveys. Journal of Official Statistics. 1: 381–397.
10. Montgomery D.C. Design and Analysis of Experiments. Sixth Edition. 2005. John Wiley and Sons. New York, NY.
11. Dorsa, W. J., G. R. Siragusa, C. N. Cutter, E. D. Berry and M. Koohmaraie. Efficacy of using a sponge sampling method to recover low levels of E. coli O157:H7 from beef carcass surface tissue. Available at: http://www.sciencedirect.com/science/article/pii/S074000209690060X.
12. JMP, Version 9. SAS Institute Inc., Cary, NC, 1989–2007. Available at: http://www.jmp.com/.
13. WesVar Software version 5.1 by Westat. Available at: http://www.westat.com/Westat/expertise/information_systems/WesVar/index.cfm.