Embed Size (px)
Citation preview

António César Rodrigues Águia
Study and Development of Paints for the Photocatalytic oxidation of NOx
Dissertation presented for obtaining the degree of Doctor of Philosophy in Chemical and Biological Engineering by University of Porto
Supervisors:
Adélio Miguel Magalhães Mendes
Luís Miguel Palma Madeira
LEPAE – Laboratory for Process, Environmental and Energy Engineering
Chemical Engineering Department, Faculty of Engineering - University of Porto
March 2011

ii

iii
Acknowledgements
I am grateful to the Portuguese Foundation for Science and Technology (FCT) for the PhD
grant (SFRH/BD/23263/2005) and financial support under the framework of the project
POCI/EQU/60366/2004, QREN project NOxOUT (ref. 5365) and CRUP (Integrated Action,
ref. E-28/08). I am also grateful to the companies for supplying the commercial photocatalytic
TiO2 samples.
Thankful words are also directed to LEPAE, DEQ and FEUP for providing the necessary
conditions to carry out my work.
I must express my gratitude to Professor Adélio Mendes; your help was far beyond the one
that a supervisor could give…thank you Professor! I would also like to express my gratitude
to Professor Miguel Madeira for the helpful discussions and all the good sense given to me
during this journey.
I am very grateful to Professor Hermenegildo Garcia, Francesc Llabres and Esther
Dominguez (Instituto de Tecnología Química CSIC-UPV, Universidad Politécnica de
Valencia) who received me like a true member of their Institute, and helped me even in the
most difficult moments. Thank you also to Abdessamad, Clara and Maria who made Valência
become my second home. A special thanks to João: you should have given me a ticket to see
Valência football team, but anyway.
To my parents…whenever there is a wish, there is a will! This was also your wish.
……to the women who most inspired my life until this moment…with her smile, kindness,
and love…I wonder you could live this moment with me….this thesis is for you, avó!
And the last but not the least…to Catarina, who make the sunshine, even when the rain seems
to do not stop.

iv

v
To my grandmother…

vi
vii
Preface
The present work was carried out at the Laboratory for Process, Environmental and Energy
Engineering (LEPAE), in the Chemical Engineering Department of the Faculty of
Engineering – University of Porto (FEUP), between 2006 and 2010, under the framework of
the project POCI/EQU/60366/2004 (funded by the Fundação para a Ciência e Tecnologia)
and under the grant SFRH/BD/23263/2005. The thesis starts with an introductory chapter
(chapter 1) and ends with the overall conclusions and perspectives for future work (chapter 7).
It contains 4 scientific articles (chapters 2, 3, 4 and 6) published, accepted or submitted for
publication. Chapter 5 was published in the proceedings of an international conference.

viii

ix
Contents
FIGURE CAPTIONS XIII
TABLE CAPTIONS XVII
NOMENCLATURE XIX
ABSTRACT XXVII
SUMÁRIO XXIX
SOMMAIRE XXXI
RESUMEN XXXIII
PART I - NOX AND PHOTOCATALYSIS ............................................................................. 1
CHAPTER 1 – INTRODUCTION ................................................................................................... 3
1.1 NOX: A PRIORITY POLLUTANT ............................................................................................ 3
1.2 FROM PHOTOELECTROCHEMISTRY TO PHOTOCATALYSIS OF NOX ...................................... 9
1.3 PHOTOCATALYTIC OXIDATION OF NOX ........................................................................... 16
1.3.1 LAB TESTS ON PURE PHOTOCATALYTIC TIO2 ........................................................... 16
1.3.2 PHOTOCATALYTIC CONSTRUCTION MATERIALS ....................................................... 17
1.4 MOTIVATION AND OUTLINE ............................................................................................. 22
REFERENCES .......................................................................................................................... 23
PART II – COMMERCIALLY AVAILABLE TIO2 .............................................................. 29
CHAPTER 2 – PHOTOCATALYTIC OXIDATION OF NO – SCREENING OF COMMERCIAL TIO2 .... 31
ABSTRACT ............................................................................................................................. 31
2.1 INTRODUCTION ................................................................................................................ 32
2.2 EXPERIMENTAL ................................................................................................................ 33
2.2.1 PHOTOCATALYTIC FILMS ......................................................................................... 33
2.2.2 EXPERIMENTAL SETUP ............................................................................................. 35
2.2.3 UV LAMP SYSTEM ................................................................................................... 38
2.3 RESULTS AND DISCUSSION ............................................................................................... 39
2.3.1 PHOTOCATALYTIC TESTS ......................................................................................... 39
x
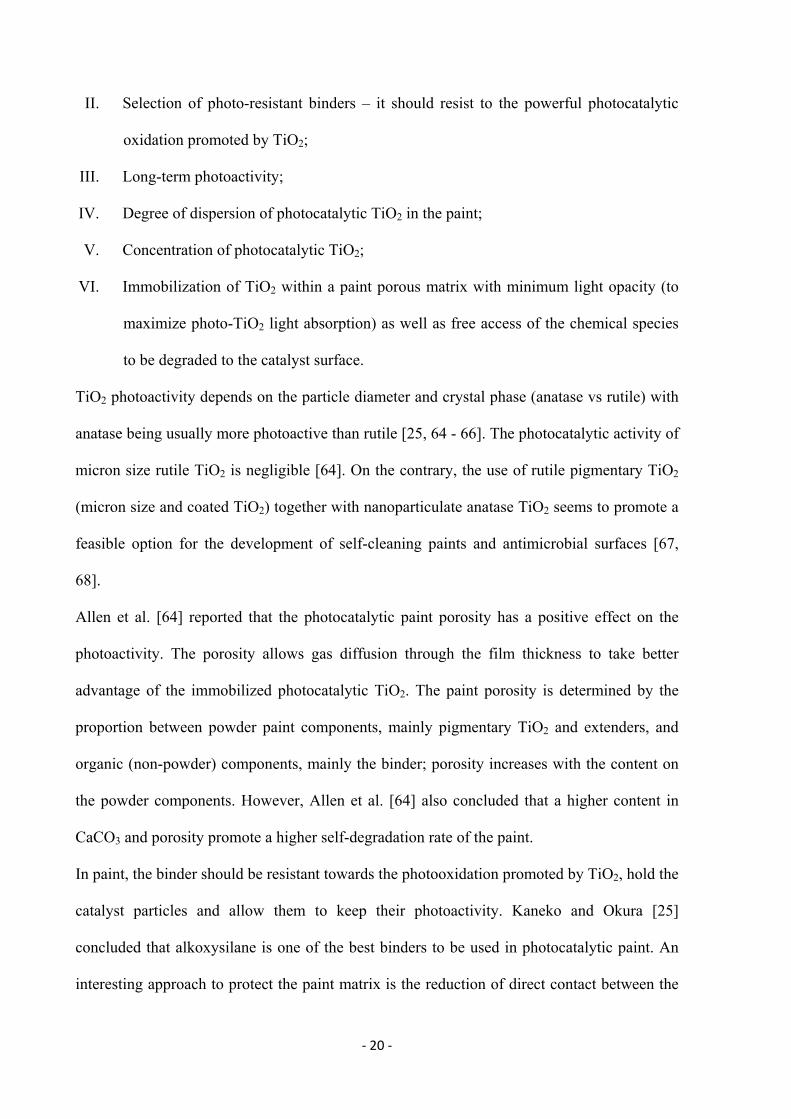
2.3.1.1 EFFECT OF THE ACTIVATION STEP ON THE PHOTOACTIVITY ..................................... 41
2.3.1.2 REPEATABILITY AND EFFECT OF PHOTO-TIO2 LOAD ............................................... 43
2.3.1.3 STEADY STATE PHOTOACTIVITY OF THE POWDER PRESSED AND PAINT FILMS ............ 46
2.3.2 DIFFUSE REFLECTANCE AND SEM ANALYSES ......................................................... 49
2.4 CONCLUSIONS ................................................................................................................. 51
REFERENCES ......................................................................................................................... 55
PART III – THE PAINT MATRIX ....................................................................................... 59
CHAPTER 3 – INFLUENCE OF PAINT COMPONENTS ON P25 PHOTOACTIVITY – POWDER AND
ORGANIC PAINT COMPONENTS ............................................................................................... 61
ABSTRACT ............................................................................................................................. 61
3.1 INTRODUCTION ................................................................................................................ 61
3.2 EXPERIMENTAL ............................................................................................................... 63
3.2.1 PHOTOCATALYTIC FILMS ........................................................................................ 63
3.2.2 EXPERIMENTAL SETUP ............................................................................................ 65
3.3 RESULTS AND DISCUSSION ............................................................................................... 68
3.3.1 UV/VIS DIFFUSE REFLECTANCE .............................................................................. 68
3.3.2 PHOTOACTIVITY OF POWDER PRESSED (PP) FILMS .................................................. 70
3.3.3 PHOTOACTIVITY OF PSEUDO-PAINT (PSP) FILMS ..................................................... 74
3.4 CONCLUSIONS ................................................................................................................. 78
REFERENCES ......................................................................................................................... 79
CHAPTER 4 - INFLUENCE OF PAINT COMPONENTS ON P25 PHOTOACTIVITY – WET
EFFECT AND PAINT MATRIX DEGRADATION ........................................................................ 81
ABSTRACT ............................................................................................................................. 81
4.1 INTRODUCTION ................................................................................................................ 83
4.2 EXPERIMENTAL ............................................................................................................... 85
4.2.1 PHOTOCATALYTIC FILMS ........................................................................................ 85
4.2.2 PHOTOCATALYTIC TESTS ........................................................................................ 89
4.2.3 PHYSICOCHEMICAL CHARACTERIZATION ................................................................ 91
4.3 RESULTS AND DISCUSSION ............................................................................................... 91
4.3.1 PHOTOACTIVITY OF POWDER PRESSED (PP) FILMS .................................................. 91
4.3.2 PHOTOACTIVITY OF PSEUDO-PAINT (PSP) FILMS ..................................................... 97

xi
4.4 CONCLUSIONS ................................................................................................................ 103
REFERENCES ........................................................................................................................ 105
PART IV – THE PHOTOCATALYST ................................................................................. 107
CHAPTER 5 – SUPPORTED PHOTOCATALYTIC TIO2 PRODUCED BY ION EXCHANGE ............. 109
ABSTRACT ........................................................................................................................... 109
5.1 INTRODUCTION .............................................................................................................. 110
5.2 EXPERIMENTAL .............................................................................................................. 110
5.2.1 SUPPORTED PHOTOCATALYSTS, SYNTHESIS AND CHARACTERIZATION .................. 110
5.2.2 PHOTOCATALYTIC FILMS ....................................................................................... 111
5.2.3 EXPERIMENTAL SETUP AND PHOTOCATALYTIC TESTS ............................................ 111
5.3 RESULTS AND DISCUSSION ............................................................................................. 112
5.3.1 PHYSICOCHEMICAL CHARACTERIZATION ............................................................... 112
5.3.2 PHOTOCATALYTIC TESTS ....................................................................................... 114
5.4 CONCLUSIONS ................................................................................................................ 116
REFERENCES ........................................................................................................................ 117
CHAPTER 6 - SUPPORTED PHOTOCATALYTIC TIO2 PRODUCED BY IMPREGNATION .............. 119
ABSTRACT ........................................................................................................................... 119
6.1 INTRODUCTION .............................................................................................................. 120
6.2 EXPERIMENTAL .............................................................................................................. 122
6.2.1 SUPPORTED PHOTOCATALYST SYNTHESIS .............................................................. 122
6.2.2 PHYSICOCHEMICAL CHARACTERIZATION ............................................................... 122
6.2.3 PHOTOCATALYTIC TESTS ....................................................................................... 123
6.3 RESULTS AND DISCUSSION ............................................................................................. 125
6.3.1 PHYSICOCHEMICAL CHARACTERIZATION ............................................................... 125
6.3.2 PHOTOCATALYTIC TESTS ....................................................................................... 123
6.4 CONCLUSIONS ................................................................................................................ 138
REFERENCES ........................................................................................................................ 138
PART V – CONCLUSIONS AND FUTURE WORK .......................................................... 143
CHAPTER 7 - CONCLUSIONS AND FUTURE WORK .................................................................. 145
7.1 MAIN CONCLUSIONS ...................................................................................................... 145

xii
7.2 FUTURE WORK ............................................................................................................... 147
7.3 A POSSIBLE ROADMAP ................................................................................................... 149
REFERENCES ....................................................................................................................... 150
APPENDIX ........................................................................................................................... 151
APPENDIX A – EXPERIMENTAL SETUP – ADDITIONAL AND BRIEF OVERVIEW ....................... 153

xiii
Figure captions
Figure 1.1 – Thermodynamic equilibrium concentration of NO ( ) and NO2 ( ) starting
from NO + NO2 = 300 ppm in air ( ) and in oxygen depleted air ( ) (adapted
from [3]).
Figure 1.2 – Sketch of major reactions involving airborne NOx (rectangles represent anthropogenic
primary gas emissions; bold lines represent reaction with direct involvement of NOx;
NMHC – non-methane hydrocarbon; VOC – volatile organic compound) – adapted
from [5, 6].
Figure 1.3 – Typical smog episodes: a) London, late of XIX century, photo and portrait by Monet; b)
Beijing nowadays.
Figure 1.4 – NOx emission by source in the USA by 2005 (top) [9] and EU-27 by 2008 (bottom) [10].
Figure 1.5 – NO and NO2 concentrations in June and December from 1995 to 2007 at Lisbon (adapted
from [15]).
Figure 1.6 – Redox position bands of various semiconductors and their bandgaps (adapted from [18]).
Figure 1.7 – Simplified sketch of photocatalytic phenomena over TiO2 and relation with redox
potentials and flat band energy positions.
Figure 1.8 – Detail image of TiO2 (adapted from [46]).
Figure 1.9 – Schematic models for O2 and H2O coadsorption on TiO2 surface (adapted from [46]).
Figure 1.10 – TiO2 anatase valence and conduction band reduction potential dependence on pH and
reduction potential of some possible photocataytic reactions of NO, water and oxygen -
reagents and products (adapted from [50 - 53]).
Figure 1.11 – Poison effect on photocatalytic paint films.
Figure 1.12 – Estimated number of patents on TiO2 photocatalysis per year for air (filled diamond) and
water treatment (empty triangles) and self-cleaning surfaces (empty circles) (adapted
from [77]).
Figure 2.1 – Sketch of the experimental setup used for the photocatalytic tests (arrows represent the
gas flow direction).
Figure 2.2 – Schematic representation of the photoreactor (top view).
Figure 2.3 – Irradiance as a function of the position inside the photoreactor and respective uncertainty
(maximum 5% considered); irradiance obtained with eq.(1) (full circles) and the
corresponding interpolation curve (continuous line).
Figure 2.4 – NO conversion (full symbols) and selectivity (empty symbols) histories as a function of
the activation protocol for paint films incorporating ANX type PA.

xiv
Figure 2.5 – NO conversion (full symbols) and selectivity (empty symbols) histories in two
consecutive runs, with 24 hours resting period, with a photocatalytic paint film
incorporating UVLP7500.
Figure 2.6 – NO conversion (full symbols) and selectivity (empty symbols) for (a) powder-pressed
films of P25 (Runs #1-3) and (b) photocatalytic paint films of P25 (Runs # 6-8), as
described in Table 2.
Figure 2.7 – Steady state NO conversion (full circles) and selectivity (empty circles) for all tested
powder pressed (X axis) and paint (Y axis) films.
Figure 2.8 – Yield (product of NO conversion and selectivity) obtained at steady state for all tested
powder pressed (X axis) and paint (Y axis) films.
Figure 2.9 – Diffuse reflectance (DR) powder pressed films and incident UV lamp spectrum (a) and
absorbed spectral radiant power for the same powder pressed films (b).
Figure 2.10 – NO conversion and selectivity as a function of the total absorbed radiant power by the
powder pressed films between 315 nm and 390 nm.
Figure 2.11 – SEM images of the photo-TiO2 in powder (left images) and paint (right images) films –
100 000x mag.
Figure 3.1 – Sketch of the experimental setup used for the photocatalytic tests (arrows represent the
gas flow direction).
Figure 3.2 – Diffuse reflectance (DR) of pure powder films of P25, CaCO3, BaSO4, pigmentary TiO2
and films tested in the photoreactor (Table 1); it was used an aluminum support for
powder deposition except for CaCO3 – B (black support - Leneta test charts) and CaCO3
– W (white support - Leneta test charts).
Figure 3.3 – Conversion (full symbols) and selectivity (empty symbols) histories on 3 different
powder pressed films of pure P25 (experiment PP0).
Figure 3.4 – Steady state conversion and selectivity on PP0 films with different loads and areas of
P25: 14.8(6x5) – 14.8 mg·cm-2 and 6 x 5 cm2 (length x width); 13.5(10x5) – 13.5
mg·cm-2 and 10 x 5 cm2 and 23.7(10x5) – 23.7 mg·cm-2 and 10 x 5 cm2.
Figure 3.5 – Conversion (full symbols) and selectivity (empty symbols) history for experiments PP1,
PP2 and PP3.
Figure 3.6 – Conversion (full symbols) and selectivity (empty symbols) history for experiments PP3,
PP4 and PP5.
Figure 3.7 – Conversion (full symbols) and selectivity (empty symbols) history of experiments PsP6,
PsP7 and PsP8.
Figure 3.8 – Conversion (full symbols) and selectivity (empty symbols) history of experiment PsP9,
employing fresh and 6 months in-can pseudo-paint.
Figure 3.9 – Conversion (full symbols) and selectivity (empty symbols) history of experiment PsP10,
using pseudo-paints produced from two different batches.

xv
Figure 3.10 – Conversion (full symbols) and selectivity (empty symbols) history of experiment RP11,
after harsher activation.
Figure 4.1 – Schematic representation of the production procedure of the photocatalytic films.
Figure 4.2 – Schematic representation of the photocatalytic reactor.
Figure 4.3 – NO conversion (full symbols) and selectivity (empty symbols) histories obtained with
powder films PP0 and wPP0.
Figure 4.4 - High-resolution XPS spectra at O 1s region for powders of fresh P25 and P25 after
mechanical mixture and sonication.
Figure 4.5 – Diffuse reflectance (DR) spectra of powder pressed films PP0 and wPP0.
Figure 4.6 - NO conversion (full symbols) and selectivity (empty symbols) histories obtained with PP#
(circles) and wPP# (triangles) films of P25 mixed with: a) silicates; b) CaCO3; c)
pigmentary TiO2 and d) all powder components (silicates, CaCO3 and pigmentary
TiO2).
Figure 4.7 - Conversion (top graph) and selectivity (bottom graph) histories on films PsP1, PsP2 and
RP (the later with hasher activation).
Figure 4.8 – TG analysis of PsP1, PsP2, BP and RP films without (0 h) and with (24 h or 150 h)
standard activation (mass variations were calculated based on 100 % mass at 120 ºC).
Figure 4.9 – Diffuse refectance (DR) spectra of P25, pigmentary TiO2, wPP4 and RP films (star points
- lamp spectrum).
Figure 4.10 – DTG curves of (a) fresh samples of PsP1, PsP2, BP and RP films and (b) RP fresh and
aged films for 24 h and 150 h.
Figure 5.1 – X-ray diffraction patterns (top) and nitrogen adsorption isotherms performed at 77 K
(bottom) for the supported photocatalysts into zeolite Y.
Figure 5.2 – Transformed Kubelka–Munk function vs. energy of the excitation source.
Figure 5.3 – NO conversion and ionic selectivity at steady state for all tested films of Table 2.
Figure 6.1 – Schematic representation of the photocatalytic reactor.
Figure 6.2 – XRD patterns of supports and respective composite materials (P25 used for reference).
Figure 6.3 – SEM images of CP811 (left side images) and TiO2@CP811 (right side images).
Figure 6.4 – SEM images of CBV100 (left side images) and TiO2@CBV100 (right side images).
Figure 6.5 – SEM images of CBV500 (left side images) and TiO2@CBV500 (right side images).
Figure 6.6 – Diffuse reflectance (DR) spectra of zeolite in pure form and with TiO2.
Figure 6.7– Infrared results to CBV500 zeolite and respective photocatalytic material TiO2@CBV500.
Figure 6.8 – Transformed Kubelka–Munk function vs. energy of the excitation source.
Figure 6.9 – History of NO conversion (a) and selectivity (b) for P25, CBV500 and CBV100.
Figure 6.10 – NO adsorption isotherm on composite photocatalysts TiO2@CBV100 and
TiO2@CBV500 at 25 °C.

xvi
Figure 6.11 – NO conversion for photocatalytic paint containing 9 wt.% of P25 (open symbols) and 9
wt.% of TiO2@CBV100 (ca. 0.3 wt.% of TiO2).
Figure 7.1 – A view of the photocatalytic technological solutions and its major areas of knowledge.
Figure 7.2 – An approach for chronological technological applications of photocatalytic paints.
Figure A.1 – General overview of one of the setups used.
Figure A.2 – Detail of the thermostatic cabinet.
Figure A.3 – Detail of the photocatalytic reactor.

xvii
Table Captions
Table 1.1 – Lifetime, acidity, PM10 mass factors and ozone formation potential for NOx and other
priority pollutants [11].
Table 2.1 – Properties of the photo-TiO2 used (data provided by the manufacturers).
Table 2.2 – Steady state NO conversion and selectivity of powder pressed and photocatalytic paint
films of P25 and VLP7101 photo-TiO2 – study of repeatability and load effect.
Table 2.3 – Photo-TiO2 loads of the powder pressed and paint films shown in Figure 7.
Table 2.4 – Particle diameter and shape of the photo-TiO2, obtained by SEM.
Table 3.1 – Mass fraction (with two decimal places) of paint components in the film used in each
experiment, load of P25 and content of powders and organic components (dry basis).
Table 4.1 –Base and reference paint formulations (wt.% are given for the specific case of reference
paint).
Table 4.2 – Mass fraction (with two decimal places) of powder paint components and load of P25 for
films prepared via the powder pressed route.
Table 4.3 – Mass fraction (with two decimal places) of all components in the paint films used in each
experiment, load of P25 and content of powders and organic components (dry basis).
Table 4.4 – Crystalline phase fraction, density, particle diameter and crystallographic net parameters
of fresh P25 and P25 after mechanical mixture and sonication, obtained by XRD.
Table 4.5 - Results of curve fitting of high-resolution XPS spectra at O1s region of fresh P25 and P25
after mechanical mixture and sonication (percentage of Ti-O vs. O-H bonds obtained by
peak deconvolution).
Table 4.6 – TG mass losses at 900 °C of fresh and aged samples for 24 h and 150 h and relative mass
loss due to photodegradation during UV aging.
Table 5.1 – Results of elemental analysis performed by ICP, and BET surface areas obtained by
nitrogen adsorption isotherms performed at 77 K.
Table 5.2 – Photocatalytic materials and estimated TiO2’s mass in each experiment.
Table 6.1 – Pristine and composite zeolite surface area (SBET), pore volume (Vp) and average pore size
(�P) of the prepared samples.
Table 6.2 – EDS analyses, corresponding to the zones indicated in Figures 3, 4 and 5.
Table 6.3 – Photocatalyst bandgap, bandgap shift related to P25 and corresponding wavelength for
absorption threshold.
Table 6.4 – Mass of composite photocatalyst and P25 used, corresponding TiO2 mass and load (mass
normalized by the film area; 6 x 5 cm2).
Table 6.5 – Fraction of UV light absorption by each photocatalytic material.

xviii
Table 6.6 – Mass of composite photocatalyst and P25 in dry paint film, corresponding TiO2 mass and
load.

xix
Nomenclature
Abbreviations, symbols and
chemicals Definition Units
AgCl Silver Chloride
AirK Synthetic air
AMT100 A commercial grade of photocatalytic
titanium dioxide
ANX type PA A commercial grade of photocatalytic
titanium dioxide
BaSO4 Barium sulfate
BP Base paint
CaCO3 Calcium carbonate
Ca(NO3)2 Calcium nitrate
CB Conduction band
CFCs Chlorofluorocarbons
CNOin Inlet gas phase concentration of NO ppm
CNOout Outlet gas phase concentration of NO ppm
CNO2in Inlet gas phase concentration of NO2 ppm
CNO2out Outlet gas phase concentration of NO2 ppm
CO Carbon monoxide
CPVC Critical Pigment Volume Concentration
DAQ Data acquisition
DR Diffuse reflectance
DTG Differential
thermogravimetric/thermogravimetry
e- Electron

xx
Abbreviations, symbols and
chemicals Definition Units
E
(or EA+/A or EB/B-) Reduction potential V
EDS Energy-dispersive x-ray spectroscopy
e-/h+ Electron-hole pair
Eb Binding energy eV
EEA European Environment Agency
EPA USA Environmental Protection Agency
EU-27 European Union at 27 member states
F(R) Kubelka-Munk function
FS Full scale
fwhm Full width at half of peak maximum
H+ Proton (derived from hydrogen atom)
h+ Positive charge (hole)
HNO3 Nitric acid
HNO2 Nitrous acid
HOMO Highest occupied molecular orbital
HO2• Hydroperoxy radicals
H2O Water
H2Oads Adsorbed water (on TiO2 surface)
H2O2 Hydrogen peroxide
h Photonic energy eV or J
H2 Hydrogen molecule
ICP Induced Coupled Plasma

xxi
Abbreviations, symbols and
chemicals Definition Units
IPCC International Panel for Climate Change
IR Infrared
ISO International Standard Organization
I film Average irradiance reaching the
photocatalytic film W·m-2
I zi read
Irradiance per axial position in reactor chamber
W·m-2
I zi film
Irradiance profile at the reactor axial
direction W·m-2
KBr Potassium bromide
LoadP25 Load of photocatalytic P25 mg·cm-2
Lphoto-TiO2 Load of photocatalytic TiO2 mg·cm-2
LUMO Lowest unoccupied molecular orbital
MFC Mass flow controller
MFM Mass flow meter
mk-10 Montmorillonite k-10
NECD National Emission Ceilings Directive
NH3 Ammonia
NH4+ Ammonium
NHE Normal hydrogen electrode V
NMHCs Non-methane hydrocarbons
NO Nitric oxide
NOx Nitrogen dioxides (NO and NO2)
NO2 Nitrogen dioxide

xxii
Abbreviations, symbols and
chemicals Definition Units
NO3• Pernitrite radical
NO3- Nitrate ion
NO2- Nitrite ion
N2 Nitrogen
N2O Nitrous oxide
N2O5 Dinitrogen pentoxide
OHads Adsorbed OH group (on TiO2 surface)
OHads-
Adsorbed negative OH group (on TiO2 surface)
OHads•
Adsorbed OH radical group (on TiO2 surface)
OH- Negative OH group
O-H General oxygen-hydrogen atoms bond
O3 Ozone
O2,ads Adsorbed oxygen molecule (on TiO2
surface)
O2•- Superoxide ion
PC50 A commercial grade of photocatalytic
titanium dioxide
PC500 A commercial grade of photocatalytic
titanium dioxide
PC105 A commercial grade of photocatalytic
titanium dioxide
pH Potential of Hydrogen
Photo-TiO2 Abbreviation for photocatalytic TiO2
PM10 Particulate matter with particle diameter
equal or lower than 10 m

xxiii
Abbreviations, symbols and
chemicals Definition Units
PP Powder pressed
PsP Pseudo-paint
PVC Pigment Volume Concentration
P Relative spectral response of the sensor
P25 A commercial grade of photocatalytic
titanium dioxide
RH Relative humidity %
RO2• Alkyl peroxy
RP Reference paint
S Selectivity (towards NO3- and NO2
-) %
SEM Scanning electron microscopy
SBET BET surface area m2·g-1
SHE Standard hydrogen electrode V
T Temperature ºC
TiO2 Titanium dioxide
hTiO2 Positive charge on irradiated titanium
dioxide
eTiO2 Excited electron on irradiated titanium
dioxide
TG Thermogravimetry/thermogravimetric
UNEP United Nations Environment Programme
USY Ultra-stable Y type zeolite
UV Ultraviolet light

xxiv
Abbreviations, symbols and
chemicals Definition Units
UVLP7500 A commercial grade of photocatalytic
titanium dioxide
UV100 A commercial grade of photocatalytic
titanium dioxide
VB Valence band
Vis Visible light
VLP7000 A commercial grade of photocatalytic
titanium dioxide
VLP7101 A commercial grade of photocatalytic
titanium dioxide
VOC Volatile organic compounds
Vp Pore volume cm3·g-1
WHO World Health Organization
WMO World Meteorological Organization
wPP Wet mixed powder pressed
W Radiant power of the lamp W·m-2
XNO NO conversion %
XPS X-ray photoelectron spectroscopy
XRD X-ray diffraction
Y Y type zeolite
Z Position in the reactor chamber m
Zi A certain position (axial) inside the reactor
chamber m
Zinitial Initial position of the photocatalytic film,
axial to the reaction chamber m

xxv
Abbreviations, symbols and
chemicals Definition Units
Zfinal Final position of the photocatalytic film,
axial to the reaction chamber m
initial Lower limit of spectral range of UV lamp nm
final Upper limit of spectral range of UV lamp nm
BABA Enthalpy of reaction eV or J
ΔE Bandgap eV
th Relative mass loss due to photodegradation after t hours;
%
�P Average pore size Å
� Braag angle (XRD analyses) º
Beta type zeolite

xxvi

xxvii
Abstract
Ambient NOx are originated from the combustion of fossil fuels in presence of N2 and O2,
which promotes the so-called urban smog and ozone formation that have severe health
impacts. Nevertheless, many cities in Europe, and namely in Portugal, are still recording NOx
concentrations above the legislated limit (2008/50/EC). Therefore, technologies are required
to solve this environmental problem, among which photocatalysis should play an important
role.
Photocatalysis uses energy of light and a catalyst, generally nanoparticulate TiO2
(photocatalytic TiO2; herein called photo-TiO2), to promote chemical reactions. However,
appropriate supports for TiO2 are required. Construction materials can be used to support
photocatalytic TiO2 for the photoabatement of atmospheric pollutants. From all possible
construction materials, paint coatings present interesting advantages since almost all surfaces
can be painted and their low thickness allow the use of low amounts of photocatalyst, for the
same abatement capacity.
An exterior, water-based, high quality paint was selected as starting paint for the work
presented in this thesis. From this paint, half of the pigmentary TiO2 (that promotes paint
opacity) was replaced by different commercially available photocatalytic TiO2 (9 wt.%, wet
based); when incorporating P25 photocatalyst this paint was named reference paint.
Part II of this dissertation focuses on the photoactivity study of paints incorporating different
commercially available photocatalysts, and powder pressed films made by each photocatalyst.
It was concluded that the ranking of the best photoactive paint films did not match with the
ranking of the best photoactive powder pressed films.
Therefore, the influence of paint film components on the photoactivity of P25 photocatalyst
was consequently studied - Part III of this dissertation. Powder films, containing only powder
(mostly inorganic) paint components, and pseudo-paint films, containing also part of the

xxviii
organic components, were prepared mixing stepwise components of the reference paint. It
was concluded that pigmentary TiO2 absorbing competitively the UV light, was the most
critical component affecting the photocatalytic activity. Films also containing different
organic components, which are added in proportions accordingly to the reference paint recipe,
show different transient periods. However, similar steady state photoactivities were achieved.
This was ascribed to the photoerosion of a significant fraction of the organic phase during the
transient period. Powder components play a major role on light behavior of films and such
fact rules the long-term photoactivity; in fact, films containing the same powder matrix but
different organic composition, show the same photoerosion (ca. 25 wt.%) and therefore the
very similar photoactivity.
Deposition of photocatalytic TiO2 particles either on the internal or external surface of porous
solid inorganic adsorbent materials, such as zeolites, are possible approaches for the
protection of the paint matrix. If particles are deposited inside the pore structure, one can
achieve paint protection avoiding direct contact of the paint matrix, namely the binder, with
the photocatalytic TiO2 particles; harmful gases can yet penetrate the support pore system and
get oxidized. On the other hand, if photocatalytic TiO2 particles are deposited on the outer
surface of the support, protection can still occur once direct contact of paint and TiO2 is
reduced (dilution effect). Chapters 5 and 6 report the study of photocatalytic TiO2 produced
by ion exchange and impregnation on different supports, respectively. The highest
photoactivity was observed for the TiO2 supported on the outer surface of zeolite Y.

xxix
Sumário
Os NOx ambientais são maioritariamente provenientes da queima de combustíveis fósseis na
presença de N2 e O2. Estes promovem a formação de smog urbano e ozono com
consequências mais ou menos graves na saúde pública. No entanto, muitas cidades europeias,
e nomeadamente em Portugal, apresentam ainda concentrações de NOx no ar acima do limite
legal (2008/50/EC). São por isso necessárias tecnologias para resolver este problema
ambiental; de entre as várias opções, a fotocatálise poderá desempenhar um papel importante.
A fotocatálise usa a energia da luz para promover a excitação de um catalisador, geralmente
nanopartículas de TiO2 (TiO2 fotocatalítico, aqui também denominado de foto-TiO2),
desencadeando reacções químicas na sua superfície. São, no entanto, necessários suportes
apropriados para o TiO2 fotocatalítico. Os materiais de construção habitualmente usados
podem ser utilizados para suportar o TiO2 fotocatalítico. De todos os materiais de construção
possíveis, as tintas apresentam vantagens interessantes, já que quase todas as superfícies
podem ser pintadas e a sua baixa espessura permite o uso de pequenas quantidades de
fotocatalisador.
Foi seleccionada uma tinta exterior, de base aquosa e alta qualidade, como ponto de partida
para o trabalho apresentado nesta tese. A partir desta tinta, metade em peso do TiO2 pigmentar
(que promove a opacidade da tinta) foi substituído pela mesma quantidade de diferentes tipos
de TiO2 fotocatalítico disponíveis comercialmente (9% em peso, em base húmida); a tinta
incorporando P25, um dos fotocatalisadores seleccionados, foi designada de tinta de
referência.
Assim, a Parte II desta dissertação estuda a fotoactividade de filmes de tinta incorporando os
diferentes fotocatalisadores disponíveis comercialmente. Estes fotocatalisadores foram
também testados na sua forma pura, em filmes feitos de pó prensado. Concluiu-se que o os

xxx
fotocatalisadores mais activos quando incorporados na tinta não são necessariamente os
melhores sob a forma de pó prensado.
Assim sendo, a influência dos componentes do filme de tinta na fotoactividade do
fotocatalisador P25 foi estudada na Parte III desta dissertação. Filmes de pó, contendo apenas
componentes inorgânicos da tinta, e filmes de pseudo-tinta, contendo também componentes
orgânicos, foram preparados misturando os componentes passo a passo de acordo com a
formulação da tinta. Concluiu-se que o TiO2 pigmentar, absorvendo a luz UV
competitivamente, é o componente mais crítico no que respeita ao prejuízo da actividade
catalítica do P25. Os filmes contendo diferentes componentes orgânicos, que são adicionados
em proporções de acordo com a formulação de tinta de base, apresentam diferentes
comportamentos no estado transiente. No entanto, estes apresentam fotoactividades
semelhantes no estado estacionário. Tal facto foi atribuído à fotoerosão de uma parcela
semelhante da fase orgânica (25 % em massa) durante o período transiente.
A deposição de partículas fotocataliticas de TiO2 na superfície interna ou externa de
adsorventes porosos inorgânicos, tais como zeólitos, são abordagens possíveis para a
protecção da tinta. Se as partículas forem depositadas dentro da estrutura de poros, pode
obter-se uma protecção da tinta através do impedimento do contacto directo da tinta com as
partículas de TiO2 fotocatalítico; o NOx pode contudo difundir-se no sistema de poros do
suporte adsorvente. Por outro lado, se o TiO2 é depositado sobre a superfície externa dos
adsorventes, a protecção deverá ocorrer apenas como consequência da redução desse contacto
directo entre fotocatalisador e tinta. Os capítulos 5 e 6 desta tese abordam de forma breve a
fotoactividade de fotocatalisadores compósitos em que o TiO2 existem depositado na
superfície interna e externa dos adsorventes. A maior fotoactividade foi observada para o
TiO2 suportado na superfície externa de zeólito Y.

xxxi
Sommaire
Ambient NOx est originaire de la combustion de combustibles fossiles sous N2 et O2, ce qui
favorise la formation du smog que l'on appelle la formation d'ozone en milieu urbain et qui
ont des répercussions graves sur la santé. Néanmoins, de nombreuses villes en Europe, et
notamment au Portugal, sont encore d'enregistrement des concentrations de NOx au-dessus de
la limite prescrite (2008/50/EC). Par conséquent, les technologies sont nécessaires pour
résoudre ce problème environnemental, dont la photocatalyse devrait jouer un rôle important.
Photocatalyse utilise l'énergie lumineuse et d'un catalyseur, généralement nanoparticulaire
TiO2 (TiO2 photocatalytique; ci-après appelée photo-TiO2), pour favoriser les réactions
chimiques. Toutefois, soutien approprié pour le TiO2 sont nécessaires. Matériaux de
construction peuvent être utilisés pour soutenir TiO2 photocatalytique pour la photo-oxydation
des polluants atmosphériques. De tous les matériaux de construction possible, revêtements de
peinture présente des avantages intéressants puisque presque toutes les surfaces peuvent être
peintes et leur faible épaisseur permet l'utilisation de faibles quantités de photocatalyseur,
pour la même capacité de réduction.
Un extérieur, à base d'eau, peinture de haute qualité a été choisie comme point de départ de la
peinture pour le travail présenté dans cette thèse. De cette peinture, la moitié des TiO2
pigmentaire (qui favorise l'opacité de la peinture) a été remplacé par différents disponibles
dans le commerce TiO2 photocatalytique (9% en poids, humide fondée.); Lors de
l'incorporation photocatalyseur P25 cette peinture a été nommé peinture de référence.
Par conséquent, la partie II de cette thèse se concentre sur l'étude de la photoactivité de la
peinture photocatalytique, en intégrant différents photocatalyseurs disponibles dans le
commerce, et la poudre pressée films réalisés par chacun photocatalyseur. Il a été conclu que
le classement des meilleurs films de peinture photoactifs ne correspond pas à la hiérarchie des
meilleurs films de poudre pressée photoactifs.
xxxii
L'influence des composantes du film de peinture sur la photo-activité des photocatalyseur P25
a donc été étudiées - Partie III de cette thèse. Films de poudre, contenant des composants de la
peinture que inorganiques, et les films pseudo-peinture, contenant également une partie des
composants organiques, ont été préparés par étapes de mélange des composants de la peinture
de référence. Il a été conclu que TiO2 pigmentaires absorbe la lumière UV concurrence, étant
l'élément le plus important affectant l'activité photocatalytique. Films contenant également
des différents composants organiques, qui sont ajoutés dans des proportions en conséquence à
la recette de base de peinture, montrent différentes périodes transitoires. Toutefois, comme
photoactivities l'état d'équilibre ont été atteints. Cela a été attribué à la photoerosion d'une
fraction importante de la phase organique au cours de la période transitoire. Composants
inorganiques jouent un rôle majeur sur photoactivité à long terme d'un film de peinture, en
fait, films contenant les mêmes minéraux, mais différentes compositions organiques
présentent les mêmes photoactivities l'état d'équilibre.
Le dépôt de particules de TiO2 photocatalytique soit sur la surface intérieure ou extérieure de
solide poreux inorganiques matériaux adsorbants, tels que les zéolithes, sont les approches
possibles pour la protection de la matrice de peinture. Si les particules se déposent à l'intérieur
de la structure des pores, on peut obtenir une protection de peinture en évitant le contact direct
de la matrice de peinture, à savoir le liant avec les particules de TiO2 photocatalytique; gaz
nocifs peuvent encore pénétrer dans le système de pores de soutien et une oxydation. D'autre
part, si les particules de TiO2 photocatalytique sont déposés sur la surface extérieure du
support, la protection peut encore se produire une fois contact direct de peinture et de TiO2 est
réduite (effet de dilution). Les chapitres 5 et 6 du rapport de l'étude de TiO2 photocatalytique
produite à l'intérieur qu'à l'extérieur du système de pores de supports différents,
respectivement. Une plus grande photoactivité a été observée pour le TiO2 pris en charge sur
la surface externe de la zéolithe Y.

xxxiii
Resumen
Ambiente de NOx se origina de la combustión de combustibles fósiles en atmósfera de N2 e
O2, que promueve el smog urbano y la formación de ozono que tienen efectos graves para la
salud. Sin embargo, muchas ciudades de Europa, y especialmente en Portugal, se sigue
grabando las concentraciones de NOx por encima del límite legislado (2008/50/EC). Por lo
tanto, tecnologías son necesarias para resolver este problema ambiental, entre las que la
fotocatálisis debe desempeñar un papel importante.
Fotocatálisis utiliza energía de la luz y un catalizador, por lo general nanopartículas de TiO2
(TiO2 fotocatalítica; aquí denominado foto-TiO2), para promover las reacciones químicas. Sin
embargo, los apoyos apropiados para TiO2 son obligatorios. Los materiales de construcción se
puede utilizar para apoyar fotocatalítica de TiO2 para la foto-reducción de los contaminantes
del aire. De todos los materiales de construcción posibles, revestimientos de pinturas
presentan ventajas interesantes, ya que casi todas las superficies se pueden pintar y su bajo
espesor permite el uso de pequeñas cantidades de fotocatalizador, por la capacidad de
reducción mismo.
Una pintura exterior, a base de agua, de alta calidad ha sido seleccionada para los trabajos
presentados en esta tesis. A partir de esta pintura, la mitad de los TiO2 pigmentario (que
promueve la opacidad de la pintura) fue reemplazado por diferentes TiO2 fotocatalítica
disponibles comercialmente (9% en peso, basado en mojado), Cuando la incorporación de
fotocatalizador P25 esta pintura fue nombrado pintura de referencia.
Por lo tanto, la parte II de esta tesis doctoral se centra en el estudio de la fotoactividad de la
pintura fotocatalítica, con la incorporación de distintos fotocatalizadores disponibles en el
mercado, así como peliculas de polvo pressionado del fotocatalisador. Se concluye que el
ranking de las mejores películas de pintura no se han encontrado con el ranking de las mejores
películas en polvo presionado.

xxxiv
Por lo tanto, la influencia de los componentes de la pelicula de pintura en la fotoactividad del
fotocatalizador P25 se estudió - parte III de esta tesis. Películas en polvo, que contienen
componentes inórganicos de la pintura, y películas de pseudo-pintura, que contienen también
parte de los componentes orgánicos, se prepararon mezclando los componentes de la pintura
de referencia, paso a paso. Se concluyó que el TiO2 pigmentario absorbe competitivamente la
luz UV, siendo el componente más crítico que afecta la actividad fotocatalítica. Las películas
también contienen diferentes componentes orgánicos, que se añaden en proporciones de
acuerdo a la formulación de pintura de base, se muestran diferentes períodos transitorios. Sin
embargo, tienen actividades similares en el estado estacionario. Esto se atribuyó a la
photoerosion de una fracción similar de la fase orgánica (25 % en peso) durante el período
transitorio. Componentes inorgánicos juegan un papel importante en fotoactividad a largo
plazo de una película de pintura, de hecho, las películas que contienen los mismos
inorgánicos, pero diferentes composiciones orgánicas, presentan similares actividades en
estado estacionario.
La deposición de partículas de TiO2 fotocatalítica en la superficie interna o externa del sólido
poroso adsorbente de materiales inorgánicos, tales como las zeolitas, son los posibles
enfoques para la protección de la pintura de la matriz. Si las partículas se depositan dentro de
la estructura porosa, se puede lograr una protección de pintura evitando el contacto directo de
la matriz de la pintura con las partículas de TiO2 fotocatalítico; gases nocivos aún puede
penetrar en el sistema de poros y seguir su oxidación. Por otro lado, si las partículas
fotocatalítica de TiO2 se depositan en la superficie externa del soporte, protección aún así
puede ocurrir porque el contacto directo de la pintura y TiO2 es reducido. Los capítulos 5 y 6
estudian la actividade del TiO2 producido dentro y fuera del sistema de poros de diferentes
soportes, respectivamente. Una fotoactividad mayor se observó para el TiO2 soportado en la
superficie externa de la zeolita Y.

‐ 1 ‐
Part I - NOx and Photocatalysis

‐ 2 ‐

‐ 3 ‐
Chapter 1 – Introduction
1.1 NOx: a priority pollutant
Anthropogenic NOx are mainly derived from combustion processes and can be divided into 3
groups according to the process of formation: - Prompt NOx; - Fuel NOx; - and Thermal
NOx. Prompt NOx are produced in the fuel rich pre-combustion zone from the reaction
between chemical radicals from the heated fuel with molecular nitrogen from combustion air
(Fenimore mechanism) [1]. Fuel NOx result from the reaction between fuel nitrogen and
molecular oxygen from combustion air. Thermal NOx, first proposed by Zeldovich [2], refers
to NO and NO2 formation via radical process from oxygen and nitrogen atoms. Such radical
process is only possible at high temperatures in the flame zone and is therefore highly
dependent on the combustion temperature.
Combustion flue gas is normally rich in NO; depending on the combustion technology,
NO/NO2 mixing ratio range from 500/1 up to 1000/1 (volume ratio). However, at typical
atmosphere conditions NO-NO2 thermodynamic equilibrium favors the formation of NO2
(Figure 1.1), though kinetics are rather slow. NO concentration in the vicinity of the emission
zone is then higher than it should be, if one consider just the thermodynamic equilibrium.
NOx have several impacts. Actually, they are related to the formation of [4]: - troposphere
ozone; - secondary particulate matter; - gaseous nitric acid; - and toxic gases due to airborne
reaction with volatile organic compounds (VOCs). Such processes lead to urban smog and
acid rain occurrence as well as to eutrophication of water with high health and environmental
impacts.
A complex net of chemical reactions involve NO and NO2 in troposphere. Although
controversy, major reaction paths can be sketched as follows, Figure 1.2.

‐ 4 ‐
Figure 1.1 – Thermodynamic equilibrium concentration of NO ( ) and NO2 ( ) starting
from NO + NO2 = 300 ppm in air ( ) and in oxygen depleted air ( ) (adapted from [3]).
VOC‐containing atmosphere
O3
OH*
HO2*
RO2*
VOCsNMHCs
NOx‐freeatmosphere
NOx‐containingatmopshere
VOC‐free atmosphere
O2
O3O3
VOCsNMHCs
RONO2
VOCsNMHCs
HNO2
HNO3NO3*
N2O5 N2O5
HNO3
HNO2
h?
h?
h?
CO
NO2
h?
O3
NO2
OH*
h?
(<420 nm)
h?
RONO2
NOx‐containing atmosphere
NO3*
NO
NO2
NO
O3
H2O2
NO3*
O3
H2O
O2
NO
Day NightAcid rain and wet
deposition
Figure 1.2 – Sketch of major reactions involving airborne NOx (rectangles represent anthropogenic
primary gas emissions; bold lines represent reaction with direct involvement of NOx; NMHC – non-
methane hydrocarbon; VOC – volatile organic compound) – adapted from [5, 6].

‐ 5 ‐
Stratosphere ozone diffusion to troposphere is responsible for O3 ground level occurrence
even in “clean” environment [5]. However, in a NOx-free atmosphere (usually below 100 ppt
of NOx), ozone is constantly consumed, forming OH•, HO2• and RO2
• radicals. In VOC-free,
NOx-containing atmosphere, ozone reacts with NO originating NO2. However, photolysis of
NO2 promotes the formation of ozone. These net reactions lead to null net ozone formation;
though NO2 can react with ozone to produce NO3• radicals, these are promptly photolysed to
NO2 again with ozone uptake [5]. In VOC and NOx-containing atmosphere, the concentration
of HO2• radicals strongly increases, reacting with NO and interfering in the null ozone net
reactions mentioned before; NO is oxidized towards NO2 without ozone consumption. NO
reactions with RO2• and OH• radicals produce RONO2 (gaseous or particulate) and gaseous
HNO2 and HNO3. Ozone, RONO2 and nitrogen acids are the main responsible for urban smog
formation (Figure 1.2) directly related to health problems, namely lung diseases. The Great
London Smog of 1952 was reported to be responsible for approximately 4000 deaths during 4
days and a further 8000 deaths in following weeks [7]. However, urban smog occurrence is
still usual in the present in many cities, as in Beinjing (Figure 1.3).
Rain washout of airborne NOx and related nitrogen components (see Figure 1.2), are
responsible for the acid rain. This wet deposition of nitrogen, along with dry deposition
(particulate matter), promotes eutrophication of water.
NOx air concentrations and emissions started to be recorded after the Gothenburg protocol in
1972 and signatories’ self-imposed NOx reductions targets. Within European Union, the
National Emissions Ceiling Directive (NECD) is enforced until the end of 2010. However,
taking into account last reports [8], at EU-27 only 16 countries expected to meet their NOx
ceiling; France, Spain and Ireland expected to exceed their emission ceilings by 32 %, 28 %
and 47 %, respectively. Road transportation is usually the main responsible for NOx
emissions both in the EU and USA (Figure 1.4).

‐ 6 ‐
a)
b)
Figure 1.3 – Typical smog episodes: a) London, late of XIX century, photo and portrait by Monet; b)
Beijing nowadays.
Table 1.1 shows that for usual priority gases, regarding urban air directives of international
agencies, NOx are the ones with greatest troposphere ozone formation potential and
secondary PM10 mass factor.
Therefore NOx occurrence in urban air, where 50 % of the world population lives [11],
deserves special attention. Both USA Environmental Protection Agency (EPA) and European
Environment Agency (EEA) established an hourly NOx air concentration limit of 0.1 ppm
[12, 13]. NOx concentration still overcomes the limit allowed, even in small cities. This
reflects the difficulties for problem solving; Figure 1.5 plots NOx concentration in the main
avenue of Lisbon (Liberdade Avenue) in June (sunny dry month) and in December (foggy and
rainy month) from 1995 until 2007. No clear reduction in NOx concentrations is observed and

‐ 7 ‐
NO + NO2 concentration very often overcomes the maximum hourly limit of 0.1 ppm.
Generally, NOx concentration is higher in the foggy rainy month of December than in June.
Such fact must arise from the lower irradiance and consequent lower OH• and HO2• radical
production that can help the direct NOx removal (see Figure 1.2). NO concentration values
higher than NO2, highlights the kinetic constraints of NO oxidation towards NO2 though the
thermodynamic tendency towards the more oxidized species (Figure 1.1). Competitive
reaction of RO2• with NO in comparison to reaction with ozone towards NO2 can also play a
role in NO prevalence over NO2 (see Figure 1.2).
Figure 1.4 – NOx emission by source in the USA by 2005 (top) [9] and EU-27 by 2008 (bottom) [8].

‐ 8 ‐
Table 1.1 – Lifetime, acidity, PM10 mass factors and ozone formation potential for NOx and other
priority pollutants [10].
Chemical
Lifetime
(weeks or other)
Acidity mass factor
(eq. H+·kg-1)
Secondary PM10 mass factor
Troposphere ozone formation potential
NOx 1 day 21.74 0.88 1.22a
SO2 ----- 31.25 0.54 -----
NH3 ----- 58.82 0.64 -----
NMVOC < 4 ----- ----- 1a
CO 8 ----- ----- 0.11b
CH4 450 ----- ----- 0.014b a, responsible for short distance ozone formation; b, responsible for transboundary ozone formation.
June 1995 - 2007 December 1995 - 2007
NO
NO
/ pp
m
0.0
0.2
0.4
0.6
0.8
NO
/ p
pm
0.0
0.2
0.4
0.6
0.8
NO
2
NO
2 /
ppm
0.00
0.02
0.04
0.06
0.08
0.10
0.12
0.14
NO
2 /
ppm
0.00
0.02
0.04
0.06
0.08
0.10
0.12
0.14
Figure 1.5 – NO and NO2 concentrations in June and December from 1995 to 2007 at Lisbon (adapted
from [14]).

‐ 9 ‐
1.2 From photoelectrochemistry to photocatalysis of NOx
In 1839, Becquerel [15] reported electric current production over an irradiated AgCl electrode
immersed on an electrolyte and connected to a counter electrode; the phenomenum was
known as Becquerel effect. Many years later, in 1972, Fujishima et. al. [16] succeed to make
the water splitting using an irradiated photoanode of TiO2. Both researchers created what it is
presently known as a photoelectrochemical cell.
When two atoms get close enough to form a molecule, their atomic orbitals (valence orbitals)
originate ligant and anti-ligant molecular orbitals, each containing up to two electrons (Pauli
Exclusion Principle). Increasing the number of atoms in a molecule or cluster will increase the
number of energy levels that a molecular orbital can have (Figure 1.6); this set of orbitals
exhibits the so-called energy band. In the case of semiconductors, the valence band (lower
energy) is separated from the conduction band (higher energy) by a certain energy, known as
bandgap (ΔE, Figure 1.6). When an electron absorbs a photon with sufficient energy (higher
than the bandgap) it moves from the valence to the conduction band; this is the so-called
photoelectric effect. When an electron leaves the valence towards the conduction band, it
creates an electron-hole pair (e-/h+, where h+ stands for hole, the positive charge left in the
valence band). These e-/h+ pairs can intermediate redox chemical reactions - photocatalysis.
Figure 1.6 shows the potential edges and bandgaps of various semiconductors.

‐ 10 ‐
Figure 1.6 – Redox position bands of various semiconductors and their bandgaps (adapted from [17]).
Suitable photocatalysts for efficient photoabatement under solar radiation have to fulfill the
following requirements:
I. Suitable bandgap and band edge positions, to have a high solar light harvest and
enable reduction/oxidation of target species, respectively;
II. Efficient charge transport;
III. Low overpotentials for the reduction/oxidation reactions;
IV. High absorption of the reactants but not of the reaction products;
V. High chemical stability in the dark and under illumination;
VI. Harmless for the environment and humans;
VII. Low cost.
Photocatalytic TiO2 has being by far the most used photocatalyst [18]. The high reduction
potential of TiO2 anatase valence band (ca. 2.7 V (NHE) at pH 7) [19] makes this
semiconductor suitable for the photocatalytic oxidation of harmful species present either in
gas [20, 21] or liquid [22, 23] phases. On the other hand, the reduction potential of TiO2

‐ 11 ‐
conduction band is quite low (ca. -0.5 V (NHE) at pH 7) [19]. The energy band positions
(band edges), which change with the pH, determines the semiconductor bandgap (3.2 eV for
TiO2 anatase). So, this semiconductor absorbs photons with energy not smaller than 3.2 eV,
this means for wavelengths not longer than 387 nm (UV light). Since only ca. 5 % of the solar
radiation has less than 387 nm, research is being done for producing photocatalytic TiO2 with
smaller bandgaps (i.e., with absorption at higher wavelengths, if possible in the Vis region).
As illustrated in Figure 1.7, the photocatalyst promotes oxidation reactions with a reduction
potential smaller than the corresponding valence band edge potential and reduction reactions
with a reduction potential higher than the corresponding conduction band edge potential.
Figure 1.7 – Simplified sketch of photocatalytic phenomena over TiO2 and relation with redox
potentials and flat band energy positions.
Besides the band edges potentials, the mobility of charges also characterizes the photoactivity
of a semiconductor. The e-/h+ pair generated in the semiconductor particle should move
towards its surface. For instance, TiO2 rutile absorbs light up to ca. 415 nm but is generally

‐ 12 ‐
less photoefficient than TiO2 anatase. Indeed, the charge transport kinetics in rutile is about
one order magnitude smaller than in anatase, making the recombination phenomena more
probable to occur [24]. According to Kaneko and Okura [25], electron transfer at the surface
of a semiconductor is normally a limiting step in photocatalytic processes. The transfer occurs
due to charge accumulation on the surface of TiO2 (depletion layer) and counter balancing
charges in the surrounding of the particle (Helmholtz layer). Therefore, to promote fast
reaction rates an overpotential is required [26, 27] (electron transfer overpotential), which is
created by charge accumulation on the particle surface that makes, however, the
recombination to increase [19]. Therefore a lower overpotential is desired. For the case of
TiO2 and under atmospheric conditions, water adsorption originates surface OH groups that
can promote electron transfer to the adsorbed species [28] reducing the overpotential. When
charge carrier densitiy increases, electron transfer at semiconductor surface also increases and
difusion of species (reagents and products of reaction) becomes the limiting step; an even
higher overpotential is required (diffusion overpotential) to counter balance the low
concentration at surface [29]. In this way, adsorption and desorption kinetics of reactants and
products, respectively, contributes for the efficiency of photocatalysis. Weak adsorption on
TiO2 surface is reported for the case of NO [30, 31] and NO2 [30]. Adsorption of NOx is
greatly influenced by oxygen vacancies on TiO2 surface.
Matsuoka and Anpo [32] observed NO photocatalytic reduction towards N2 and N2O. For
N2O production, lateral interactions of adsorbed NO molecules must exist and are reported for
a minimum surface coverage of 5.5 x 10¹⁴ molecules·cm-2 [32]. Higher coverage is reported to
form N2O2, which adsorbs more strongly than NO, N2O and NO2 [30]. However, NOx
photocatalytic reduction is commonly achieved when high partial pressures of NOx are
observed along with absence of water and/or oxygen [e.g. 23]. At atmosphere conditions, the
presence of water and oxygen together with low NOx partial pressures promote the NOx

‐ 13 ‐
photocatalytic oxidation. A dissociative adsorption of water occurs on surface defects for
coverages up to 7 x 10¹³ molecules·cm-2 [33, 34] while molecular adsorption prevails for
higher coverages, both in defects [35] and terraces [33, 34] of TiO2 particles (Figure 1.8). A
second layer is reported in a flat layer [35] with lattice oxygen interaction [33, 34, 36].
Concerning oxygen adsorption, photocatalytic [37 – 39] and co-adsorption studies with H2O
and NH3 [40 - 42], revealed molecular oxygen adsorption centered on lattice oxygen
vacancies producing extended oxygen adatoms, which help in the hydrolisys of coadsorbed
water (Figure 1.9).
Figure 1.8 – Detail image of TiO2 (adapted from [43]).
Adsorption also occurs on the vicinity of the oxygen vacancies towards Ti atoms. The
presence of an adatom helps in the dissociation of adsorbed water on Ti4+ sites with formation
of OH groups [43]. These OH groups are believed to have a greater contribution than
adsorbed water in hydroxyl radical formation by electron donation to the hole produced on the
valence band of excited TiO2 (eqs. 1.1 – 1.2). Redox cycle closes with electron scavenging by
the adsorbed oxygen reduction towards superoxide (eq. 1.3).
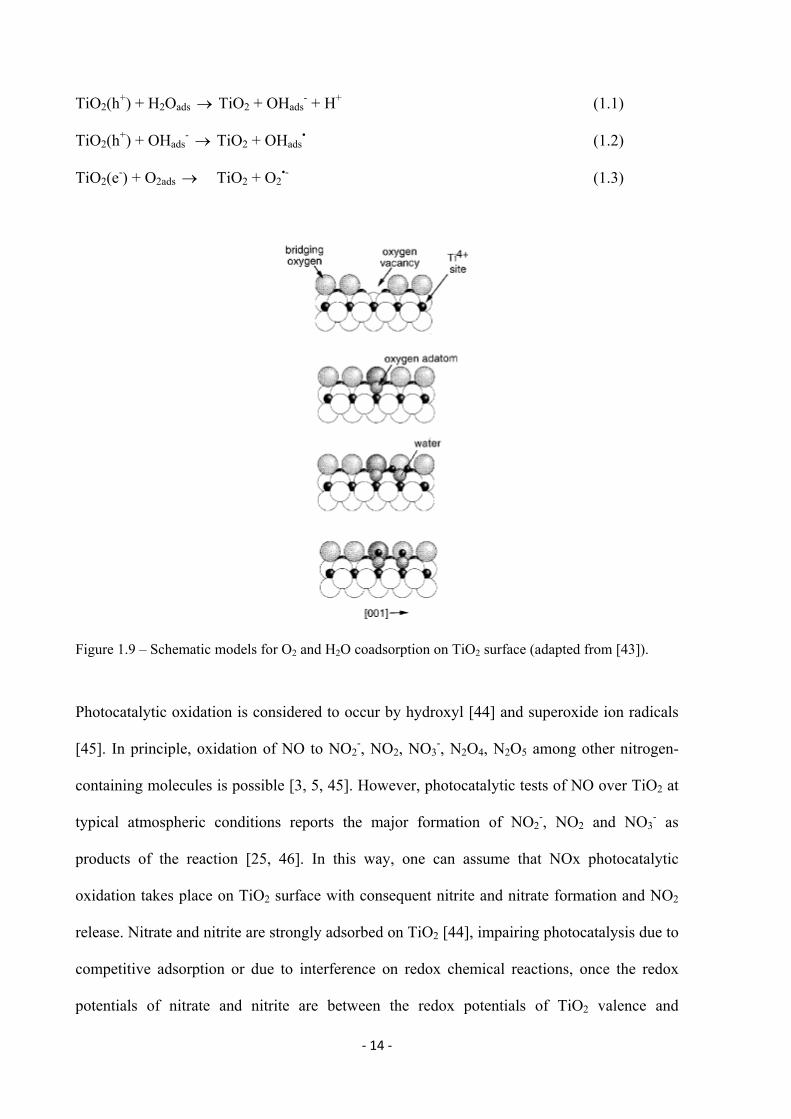
‐ 14 ‐
TiO2(h+) + H2Oads TiO2 + OHads
- + H+ (1.1)
TiO2(h+) + OHads
- TiO2 + OHads• (1.2)
TiO2(e-) + O2ads TiO2 + O2
•- (1.3)
Figure 1.9 – Schematic models for O2 and H2O coadsorption on TiO2 surface (adapted from [43]).
Photocatalytic oxidation is considered to occur by hydroxyl [44] and superoxide ion radicals
[45]. In principle, oxidation of NO to NO2-, NO2, NO3
-, N2O4, N2O5 among other nitrogen-
containing molecules is possible [3, 5, 45]. However, photocatalytic tests of NO over TiO2 at
typical atmospheric conditions reports the major formation of NO2-, NO2 and NO3
- as
products of the reaction [25, 46]. In this way, one can assume that NOx photocatalytic
oxidation takes place on TiO2 surface with consequent nitrite and nitrate formation and NO2
release. Nitrate and nitrite are strongly adsorbed on TiO2 [44], impairing photocatalysis due to
competitive adsorption or due to interference on redox chemical reactions, once the redox
potentials of nitrate and nitrite are between the redox potentials of TiO2 valence and

‐ 15 ‐
conduction bands (Figure 1.10). Therefore, the products of reaction nitrates and nitrites must
be removed from the TiO2 surface.
Figure 1.10 – TiO2 anatase valence and conduction band reduction potential dependence on pH and
reduction potential of some possible photocataytic reactions of NO, water and oxygen - reagents and
products (adapted from [47 - 49]).
TiO2 presents a good chemical and physical stability under dark and irradiated conditions that
is important for real applications.
TiO2 has been produced for many years and is part of the formulation of many products such
has pills, paper, paint, chewing-gum, tooth-paste, among others [18]. However, recent studies
with nanoparticulated TiO2 refer possible neurons damage when in contact with brain cells
[50]. This is a non-conclusive study and research is going on to assess the real harmfulness of
nanoparticulated TiO2.
The increasing interest on TiO2 reinforced the worldwide production and prices are now lower
than before. However, nanoparticulated TiO2 (photocatalytic grade) is still a specialty, sold at
ca. 150 €·kg-1, compared to ca. 27 €·kg-1 for micron size TiO2 [18].

‐ 16 ‐
1.3 Photocatalytic oxidation of NOx
1.3.1 Lab tests on pure photocatalytic TiO2
Devahasdin et al. [44] studied the effect of irradiance, NO concentration, relative humidity
(RH), and flow rate on the ability of P25 (Evonik) to photocatalyticaly oxidize NO. P25 was
applied on the internal walls of a borosilicate tubular reactor by brush-coating. These authors
concluded that a photocatalyst load higher than 0.7 mg·cm-2 did not improve the
photoefficiency of the reactor. They referred an equilibrium limited photoefficiency for space
time values greater than 12 seconds and found a strong dependence of NO conversion with
the inlet concentration; the lower the NO inlet concentration, the higher the conversion for a
concentration ranging from 5 ppm to 40 ppm. Devahasdin and co-authors also concluded that
irradiance plays an important role on NO conversion, especially for high NO concentrations
(above 40 ppm); however, for irradiances above 7 W·m-2 it was observed a constant NO
conversion. Moreover, for 5 ppm NO concentration photoefficiency was found to be almost
irradiance independent (irradiance from 2 W·m-2 to 7 W·m-2).
Kaneko and Okura [25] proposed a UV light controlled region for irradiances between 10-4
and 10-3 W·m-2 for solute concentrations between 1 and 10 ppm. On the other hand, Kaneko
and Okura [25] reported a light controlled region for irradiances below 1 W·m-2, specifically
for NO concentration of 1 ppm. These very different irradiance ranges of light controlled
region point out the influence of photoreactor design on photoefficiency [51]. To allow a
comparative assessment of photocatalysts and photocatalytic films performance, a standard
based on the NO photocatalytic oxidation was proposed (ISO 22197-1:2007(E)) [52].
Devahasdin et al. [44] reported a positive effect of relative humidity on NO photocatalytic
oxidation up to 50 % RH. However, this should depend on the adsorption properties of the
used TiO2 grade along with the NOx feed concentration. They observed the production of

‐ 17 ‐
NO2 and nitrate at steady state conditions and reported 100 % selectivity towards NO2 for NO
inlet concentrations higher than 10 ppm. However, selectivity towards nitrate is 10 % and 50
% when NO inlet concentration is 6 ppm and 2 ppm, respectively, which are typical
atmospheric concentrations in polluted areas. NO2 selectivity also increases with irradiance.
Lab tests have been showing that photocatalysis using TiO2 and under typical atmospheric
conditions is able to perform NO and NO2 abatement. Nitrate is the main product of reaction.
Therefore, photocatalysis using TiO2 can play an important role on urban air NOx depletion.
Construction industry realized this and has been incorporating photocatalytic TiO2 into their
products, opening a new market segment - the photocatalytic construction materials.
1.3.2 Photocatalytic construction materials
Photocatalysis using TiO2 presents some interesting features for atmospheric abatement of
harmful gases [25, 53]:
I. The reaction is rather fast at the atmospheric pressure and room temperature;
II. It deals well with the relatively low atmospheric pollutants concentration;
III. A wide spectrum of organic contaminants can be oxidized towards harmless products;
IV. No additional chemical reactants are required;
V. Solar energy can be used as activation source;
VI. Photocatalytic TiO2 is highly stable, both chemically and physically.
Such advantages do not disappear when incorporating photocatalytic TiO2 in construction
materials. Thus, construction materials can be used to support photocatalytic TiO2, working as
depolluting agents, especially in highly polluted urban areas.
However, radicals formed during the photocatalytic process, namely highly oxidative OH•,
can increase the degradation rate of such construction materials. Kaneko and Okura [25]
enumerate the requirements a support for photocatalytic TiO2 should have:

‐ 18 ‐
I. Support the photocatalytic TiO2 particles while allowing them to be photoactive;
II. Be chemically and physically stable;
III. Provide large specific surface area;
IV. Be harmless for environmental use.
Ibusuki mentioned that fluorocarbon based sheets, hardened cement paste and alkoxysilane-
based paint are the most promising photocatalytic TiO2 supports [25].
Marley Eternit [54], a UK based roofing solutions company, developed a photocatalytic roof
tile, the EcoLogic. This company estimates that an average-sized roof made of EcoLogic tiles
can remove an amount of NOx equivalent to that emitted by a modern car travelling 160 000
km, during its lifetime of 25 years [54].
Concerning lab scale tests, Cassar et al. [55] studied the photoefficiency of concrete in a
standard-like setup. These authors observed a ca. 40 % NO conversion with a NO2 selectivity
of 70 %. On the other hand, Beeldens [56] concluded that the contact time and air turbulence
are the controlling parameters of NOx photoabatement with photocatalytic concrete. Beeldens
also reported a significant dependence of NOx photocatalytic conversion on the reaction
chamber height.
Real scale tests are however necessary since conditions such as dust, sand and stain
deposition, wind direction, typical air composition, among others, are difficult to reproduce in
the lab.
In 2007, approximately 50 000 m2 of urban surfaces were estimated to be covered with
photocatalytic construction materials in Japan [57]. Kaneko and Okura [25] reports a test
performed with windowed photocatalytic highway wall panels (0.6 m x 1.0 m) in Tokyo
(Japan). Photocatalytic surfaces were attached to traditional panels and a borosilicate glass
was used to cover them, producing a gap between the glass and the surface. Polluted air was
pumped at a flow rate of 15 to 60 L·min-1 through the gap. Daylight irradiance was ca. 1

‐ 19 ‐
W·cm-2 at noon and an estimated amount of 113 000 vehicles crossed the 6-lane roadside per
day. An average removal of 31 % to 69 % of NOx was obtained. The rate of NOx removal
was calculated to be 3 mmol·m-2·d-1, based on the amount of nitrate washed from the panels.
Guerrini and Peccati [58] studied the NOx concentration profile as a function of the distance
to a photocatalytic cementitious road; at 1.80 m high NOx concentration was 40 % higher
than at 0.30 m high. The authors also showed that results are strongly dependent on weather
conditions, namely wind velocity and direction [59].
Self-cleaning and antibacterial ceramic tiles, under the name Hydrotech and produced since
2000 by the Czech company Rako Rakovnik, were probably the first commercially available
photoactive construction materials produced in Europe [60]. However, quality issues and a
non-mature European market are responsible for the slow introduction in the market of these
construction photocatalytic products.
From all possible construction materials, paint coatings present interesting advantages when
used for immobilizing photocatalytic TiO2: - almost all surfaces in urban areas can be painted;
and - paints have the exact thickness for being optically opaque and then to produce
photocatalysis. In this way, some European companies started to study and commercialize
photocatalytic paints [61 - 63].
Bygott et al. [62] conducted a field test in a children playground in London, UK. An area of
300 m2 of surrounding walls was painted with a silicate-based paint incorporating 7.5 wt.% of
photocatalytic TiO2. A daily abatement of ca. 4.5 g of NOx was reported from about 10 000
m3 of air around the school playground.
When designing a paint formulation for immobilizing photocatalytic TiO2, the following
aspects should be considered:
I. Select the most suitable photocatalytic TiO2 – particle size, bandgap and band edges,
etc.;
‐ 20 ‐
II. Selection of photo-resistant binders – it should resist to the powerful photocatalytic
oxidation promoted by TiO2;
III. Long-term photoactivity;
IV. Degree of dispersion of photocatalytic TiO2 in the paint;
V. Concentration of photocatalytic TiO2;
VI. Immobilization of TiO2 within a paint porous matrix with minimum light opacity (to
maximize photo-TiO2 light absorption) as well as free access of the chemical species
to be degraded to the catalyst surface.
TiO2 photoactivity depends on the particle diameter and crystal phase (anatase vs rutile) with
anatase being usually more photoactive than rutile [25, 64 - 66]. The photocatalytic activity of
micron size rutile TiO2 is negligible [64]. On the contrary, the use of rutile pigmentary TiO2
(micron size and coated TiO2) together with nanoparticulate anatase TiO2 seems to promote a
feasible option for the development of self-cleaning paints and antimicrobial surfaces [67,
68].
Allen et al. [64] reported that the photocatalytic paint porosity has a positive effect on the
photoactivity. The porosity allows gas diffusion through the film thickness to take better
advantage of the immobilized photocatalytic TiO2. The paint porosity is determined by the
proportion between powder paint components, mainly pigmentary TiO2 and extenders, and
organic (non-powder) components, mainly the binder; porosity increases with the content on
the powder components. However, Allen et al. [64] also concluded that a higher content in
CaCO3 and porosity promote a higher self-degradation rate of the paint.
In paint, the binder should be resistant towards the photooxidation promoted by TiO2, hold the
catalyst particles and allow them to keep their photoactivity. Kaneko and Okura [25]
concluded that alkoxysilane is one of the best binders to be used in photocatalytic paint. An
interesting approach to protect the paint matrix is the reduction of direct contact between the

‐ 21 ‐
matrix, and the photocatalytic TiO2, which can be obtained allowing the presence of
agglomerated particles of TiO2 instead of primary particles [25, 67]. Motohashi and Inukai
[65] showed that, with few exceptions, higher photoactivity is linked with higher paint
degradation.
Long-term activity of a paint formulation is an important factor, enumerated above. Results
obtained with an exterior, vinyl type, water-based photocatalytic paint (9 wt.% in P25) have
shown a slight reversible loss of activity (Figure 1.11).
Time / h
20 25 30 35 40 325 330 335
%
20
30
40
50
60
70
80
90
100
NO conversionSelectivity towards NO2- and NO3-
Figure 1.11 – Poison effect on photocatalytic paint films.
Decreasing the amount of photocatalytic TiO2 in the paint would decrease self-photocatalytic
degradation [68], but a loss in photoactvity towards hazardous gases would also occur.
However, Ichiura et al. [69] showed that adding zeolites to photocatalytic paper allows the
improvement on photoactivity towards NOx, eventhough a lower concentration of TiO2 was
used. Such approach must allow a higher paper matrix resistance, although rheological tests
were not performed by the authors.

‐ 22 ‐
1.4 Motivation and Outline
Photocatalysis is gaining an increasing interest not only among the scientific community but
also in the industry, which is coming up with technological solutions for air and water
treatment, self-cleaning and microorganism photoinactivation surfaces (Figure 1.12).
Figure 1.12 – Estimated number of patents on TiO2 photocatalysis per year for air (filled diamond),
water treatment (empty triangles) and self-cleaning surfaces (empty circles) (adapted from [70]).
Air treatment is drawing the highest attention, and the fact may be due to the increase in
restricted legislation and weakness on problem solving of some harmful gases such as NOx.
Construction materials, and namely paints, seem to be a good support for photocatalytic TiO2
immobilization, acting therefore as depolluting supports.
A wide variety of TiO2 photocatalysts are presently available in the market. From a
photocatalytic paint development and commercialization point of view, it is important to
know which are the most promising photocatalysts for NOx abatement. Therefore, this thesis
starts by screening 10 commercially available TiO2 photocatalysts as supplied and
immobilized in a commercial paint. The photocatalytic activity was assessed based on
standard ISO 22197-1:2007(E). These results are reported in chapter 2. Further on, the role of
the paint matrix on photoactivity was addressed. The role of paint components that are present
in the paint matrix was studied and important conclusions withdrawn. The study was focused
on photocatalyst P25 (Evonik) and is presented in chapters 3 and 4.

‐ 23 ‐
The photocatalytic process is not selective since it normally generates free radicals, namely
hydroxyl radical, that are responsible for the photodegradation of the paint matrix. The
concentration of these radicals is related to the amount of TiO2 irradiated. Therefore,
photocatalytic TiO2 was deposited and mixed with porous adsorbent particles aiming at
minimize the paint matrix photooxidation and improving NO conversion and selectivity.
Results are reported in chapters 5 and 6.
Finally, chapter 7 presents the conclusions of this work and suggests future developments.
References
[1] Kenneth, W., Warner, C., Davis, W., Air Pollution - Its Origin and Control, 3rd Edition,
Prentice Hall, 1997.
[2] Nevers, N., Air Pollution Control Engineering, 2th
Edition, McGrawHill 2000.
[3] Larrubia, M.A., Arrighi, L., Ramis, G., Catalysis Today 2005, 107, 139.
[4] European Environment Agency, EEA-32 Nitrogen oxides (NOx) emissions, Technical
report No APE002/2010 (available at:
http://themes.eea.europa.eu/IMS/IMS/ISpecs/ISpecification20080218104839/IAssessment126
2689215798/view_content - accessed February 2011).
[5] Atkinson, R., Atmospheric Environment 2000, 34, 2063.
[6] Sadanaga, Y., Matsumoto, J., Kajii, Y., Journal of Photochem. and Photobiol. C:
Photochem. Reviews 2003, 4, 85.
[7] Bell, M., Davis, D., Fletcher, T., Environ. Health Perspect. 2004, 112, 6.
[8] European Environment Agency, European Union emission inventory report 1990–2008 under the
UNECE Convention on Long-range Transboundary Air Pollution (LRTAP), Technical report No
7/2010 (available at http://www.eea.europa.eu/publications/european-union-emission-inventory-report
– accessed February 20011).
[9] http://www.epa.gov/air/emissions/nox.htm (accessed February 2011).

‐ 24 ‐
[10] Nikolas, N., Adams, M., in: European Evironment Agency (Eds.), Transport Emissions
of Air Pollutants (CO, NH3, NO
X, NMVOCs, PM
10, SOx) by mode, (available
at:http://eea.eionet.europa.eu/Members/irc/eionet-circle/etcacc/library?l=/etcacc_
factsheets&vm=detailed&sb=Title – accessed February 2011).
[11] http://environment.nationalgeographic.com/environment/habitats/urban-profile/
(accessed February 2011).
[12] http://www.epa.gov/air/criteria.html (accessed February 2011).
[13] http://eur-lex.europa.eu/LexUriServ/LexUriServ.do?uri=OJ:L:2008:152:0001:01:
EN:HTML (accessed February 2011).
[14] www.qualar.org (accessed February 2011).
[15] Becquerel, E., C.R. Acad. Sci. 1839, 9, 561.
[16] Fujishima, A., Kohayakawa, K., Honda, K., J. Electrochem. Soc. 1975, 122, 1487.
[17] Andrew, A., Le Hunt, S., Journal of Photochemistry and Photobiology A: Chemistry
1997, 108, 1.
[18] Robichaud, C., Uyar, A., Darby, M., Zucker, L., Wiesner, M., Environ. Sci. Techno.
2009, 43, 4227.
[19] Van, R., Liang, Y., Schoonman, J., J. Mater. Chem. 2008, 18, 2311.
[20] Anpo, M., in: Tundo, P., Anastas, P. (Eds.), Green Chemistry, Oxford University Press,
2000.
[21] Anpo, M., in: Corma, A., Melo, F.V., Mendioroz, S., Fierro, J.L.G., (Eds.), Proceedings
of the 12th International Congress on Catalysts, Granada, Studies in Surface Science and
Catalysis 2000, 130, 157.
[22] Ollis, D.F., AlEkabi, H., (Eds.), Photocatalytic Purification and Treatment of Water and
Air, Elsevier, Amsterdam, 1993.

‐ 25 ‐
[23] Pelizzetti, E., (Eds.), Photochemical Conversion and Storage of Solar Energy, Kluwer
Academic Publishers, Dordrecht, 1991.
[24] Kavan, L., Gratzel, M., Gilbert, S.E., Klemenz, C., Scheel, H.J., J. Am. Chem. Soc. 1996,
118, 6716.
[25] Kaneko, M., Okura, I. (Eds.), Photocatalysis science and technology, Springer, New
York, 2002.
[26] Bolton, J.R., Strickler, S.J., Connolly, J.S., Nature 1985, 316, 495.
[27] Murphy, A.B., Barnes, P.R.F., Randeniya, L.K., Plumb, I.C., Grey, I.E., Horne, M.D.,
Glasscock, J.A., Int. J. Hydrogen Energy 2006, 31, 1999.
[28] Salvador, P., Gutierrez, C., Chem. Phys. Lett. 1982, 86, 131.
[29] Hamann, C.H., Hamnett, A., Vielstich, W., in: Electrochemistry, 2nd edition, Wiley-
VCH, 2007.
[30] Sorescu, D.C., Rusu, C.N., Yates Jr, J.T., J. Phys. Chem. B 2000, 104, 4408.
[31] Rusu, C.N., Yates Jr, J.T., J. Phys. Chem. B 2001, 105, 2596.
[32] Matsuoka, M., Anpo, M., Journal of Photochem and Photobiol C: Photochem Reviews
2003, 3, 225.
[33] Henderson, M.A., Surf. Sci. 1996, 355, 151.
[34] Henderson, M.A., Langmuir 1996, 12, 5093.
[35] Kurts, R.L., Stockbauer, R., Madey, T.E., Roman, E., Segovia, J.L., Surf. Sci. 1989, 218,
178.
[36] Hugenschmidt, M.B., Gamble, L., Campbell, C.T., Surf. Sci. 1994, 302, 329.
[37] Lu, G., Linsebigler, A., Yates Jr, J.T., J. Chem. Phys. 1995, 102, 4657.
[38] Lu, G., Linsebigler, A., Yates Jr, J.T., J. Chem. Phys. 1995, 102, 3005.
[39] Rusu, C.N., Yates Jr, J.T., Langmuir 1997, 13, 4311.
‐ 26 ‐
[40] Henderson, M.A., Epling, W.S., Perkins, C.L., Peden, C.H.F., Diebold, U., J. Phys.
Chem. B 1999, 103, 5328.
[41] Epling, W.S., Peden, C.H.F., Henderson, M.A., Diebold, U., Surf. Sci. 1998, 412, 333.
[42] Perkins, C.L., Henderson, M.A., J. Phys. Chem. B 2001, 105, 3856.
[43] Diebold, U., Surf. Sci. 2003, 48, 53.
[44] Devahasdin, S., Fan Jr., C., Li, K., Chen, D.H., J. Photochem. Photobiol. A 2003, 156,
161.
[45] Jourd’heuil, D., Kang D., Grisham, M.B., Frontiers in Bioscience 1997, 2, 189.
[46] Fujishima, A., Zhang, X., Tryk, D.A., Surf. Sci. Rep. 2008, 63, 515.
[47] Milazzo, G., Caroli, S., Sharma, V.K., Tables of Standard Electrode Potentials, Wiley,
Chichester, 1978.
[48] Bard, A.J., Parsons, R., Jordan, J., Standard Potentials in Aqueous Solutions, Marcel
Dekker, New York, 1985.
[49] Bratsch, S.G., J. Phys. Chem. Ref. Data 1989, 18, 1.
[50] Long, T.C., Tajuba, J., Sama, P., Saleh, N., Swartz, C., Parker, J., Hester, S., Lowry,
G.V., Veronesi, B., Environmental Health Perspectives 2077, 115, 11.
[51] Kapteijn, F., Rodriguez-Miraso, J., Moulijn, J.A., Applied Catalysis B: Environmental
1996, 9, 25.
[52] International Standard Organization, Fine ceramics (advanced ceramics, advanced
technical ceramics) -- Test method for air-purification performance of semiconducting
photocatalytic materials -- Part 1: Removal of nitric oxide, ISO 22197-1:2007.
[53] Herrmann, J.-M, Topics Catal. 2005, 34, 49.
[54] Marley Eternit, Ecologic Roof Tiles – Breathing Life Into the Environment (available on:
http://www.marleyeternit.co.uk/Roofing/Concrete-Tiles/EcoLogic-Ludlow-Major-
Interlocking-Tile.aspx, accessed February 2011).

‐ 27 ‐
[55] Cassar, L., Beeldens, A., Pimpinelli, N., Guerrini, G.L., Photocatalysis of Cementitious
Materials, International RILEM Symposium on Photocatalysis, Environment and
Construction Materials, 8-9 October 2007, Florence, Italy, 131 - 146.
[56] Beeldens, A., Air purification by road materials: results of the test project in Antwerp,
International RILEM Symposium on Photocatalysis, Environment and Construction
Materials, 8-9 October 2007, Florence, Italy, 187 - 194.
[57] Osburn L., Proceedings of 5th Post Graduate Conference on Construction Industry
Development, 16-18 March 2008, Bloemfontein, South Africa.
[58] Guerrini, G.L., Peccati, E., White Cement and Photocatalysis – Part 1: Fundamentals,
International RILEM Symposium on Photocatalysis, Environment and Construction
Materials, 8-9 October 2007, Florence, Italy, 179-186.
[59] http://www.picada-project.com/domino/SitePicada/Picada.nsf?OpenDataBase (accessed
on February 2011).
[60] Peterka, F., Jirkovsky, J., St’ahel, P., Navrátil, Z., Limits of application of photocatalytic
technologies to construction materials, International RILEM Symposium on Photocatalysis,
Environment and Construction Materials 8-9 October 2007, Florence, Italy, 49 - 56.
[61] Paint company Sto – website for photocatalytic product Climasan
(www.stoclimasan.com - accessed February 2011).
[62] Bygott, C.E., Maltby, J.E., Stratton, J.L., McIntyre, R., Photocatalytic Coatings for the
Construction Industry, International RILEM Symposium on Photocatalysis, Environment and
Construction Materials 8-9 October 2007, Florence, Italy, 251–258.
[63] Global Engineering - Photocatalytic building products (www.ecopurer.com - accessed
February 2011).
[64] Allen, N.S., Edge, M., Verran, J., Stratton, J., Maltby, J., Bygott, C., Polymer
Degradation and Stability 2008, 93, 1632.

‐ 28 ‐
[65] Motohashi, K., Inukai, T., Self-cleaning Performance Evaluation of Commercial
Photocatalyst Coating Materials Through 5 Years Outdoor Exposure, International RILEM
Symposium on Photocatalysis, Environment and Construction Materials 8-9 October 2007,
Florence, Italy, 307 - 314.
[66] Solomon, D.H., Hawthorne, D.G., Chemistry of Pigments and Fillers 1983, Wiley-
Blackwell.
[67] Fujishima, A., Hashimoto, K., Watanabe, T., TiO2 Photocatalysis: fundamentals and
applications, 1st edition, Bkc Inc., Kudanminami (Japan), 1999.
[68] Caballero, L., Whitehead, .A., Allen, N.S., Verran, J., Dyes and Pigments 2010, 86, 56.
[69] Ichiura, H., Kitaoka, T., Tanaka, H., Journal of Materials Science 2003, 38, 1611.
[70] Paz, P., Applied Catalysis B: Environmental 2010, 99, 448.

‐ 29 ‐
Part II – Commercially Available TiO2

‐ 30 ‐

‐ 31 ‐
Chapter 2 – Photocatalytic Oxidation of NO – Screening of commercial TiO21
Abstract
The present chapter aims to evaluate the photocatalytic activity of photocatalytic TiO2 from
various producers (Evonik, Kemira, Kronos, Millennium Inorganic Chemicals, Sachtleben
and Tayca), in the form of powder pressed films and upon incorporation in a water-based
paint, for outdoor NO abatement. The photocatalytic activity of the different samples was
evaluated in terms of NO conversion and selectivity towards nitrite and nitrate ions following
approximately the ISO 22197-1:2007(E) standard.
The highest yields obtained for powder pressed films were achieved with VLP7000 (0.70),
followed by VLP7101 (0.55) and UVLP7500 (0.55), all from Kronos. On the other hand,
when incorporated in paint films, the highest yields were obtained with PC500 and PC105
from Millennium and UV100 from Sachtleben (ca. 0.15).
The paint matrix plays an important role on the photocatalytic activity. In particular, the time
for steady state is one or two orders of magnitude higher when the photocatalysts are
incorporated in paint films in relation to the powder pressed films.
The paint films were activated following the procedure recommended by the above-
mentioned standard. However, the photocatalytic activity of films incorporating P25 (Evonik)
was displayed only when higher power radiation and higher humidity conditions were used.
This allowed for similar levels of photocatalytic activity as the other paint films.
1 Águia, C., Ângelo, J., Madeira, L.M., Mendes, A., Journal of Environmental Management (10.1016/j.jenvman.2011.02.010).

‐ 32 ‐
2.1 Introduction
NOx emissions have been receiving particular attention [1] as they are related to serious
environmental and human health problems, namely acid rain, water eutrophication and
photochemical smog formation [2, 3]. In the European Environment Agency (EEA-32) area,
NOx emissions have decreased 31 % in the period 1990-2007 [4]. However, Spain is still
reporting a significant increase in NOx emissions, far from the National Emissions Ceilings
Directive (NECD) for the year 2010, while the emissions in Portugal have just stabilised [5].
Beyond this, it is also important to remark that although emissions have been decreasing,
NOx concentration in air is still above EU legislated limit (2008/50/EC directive), especially
in urban areas [6]. Therefore, the development of new technologies for NOx abatement and
emissions reduction is required.
Photocatalysis using a semi-conducting material, mainly titanium dioxide, and free solar
energy is a promising approach to handle with NOX abatement. When a photon with sufficient
energy is absorbed, occurs the injection of an electron to the conduction band and the
consequent formation of a hole of positive charge in the valence band. The energy difference
between these bands is called bandgap; for TiO2-anatase the bandgap is 3.2 eV [e.g. 7] and
only photons with less than 387 nm wavelengths have enough energy for promoting the
electron injection. The hole in anatase has a high oxidation power, (2.7 V vs. NHE, at pH 7
[8]), which makes this semiconductor suitable for the production of highly oxidant hydroxyl
radicals when in contact with water molecules or OH- [9]. Hydroxyl radicals promote
consequently the oxidation of harmful NOx, with nitrate production [10]. On the other hand,
the excited electron has a high reduction power/low reduction potential (- 0.5 V vs. NHE, at
pH 7 [8]), which forms O2- and contribute for the production of HO2
• oxidant radicals [10,
11].

‐ 33 ‐
Presently, a range of photocatalytic TiO2 is commercially available. Each performs differently
according to their intrinsic properties, the support material and the interaction between the
two [12]. Since photocatalysis deals better with low concentrations and environment
temperatures [e.g. 10, 13], it is being considered to address the photoabatment of atmospheric
pollutants. In this way, a number of construction materials incorporating photocatalysts are
being studied for the abatement of NOx in urban areas, such as paints, glass windows and
concrete for outside surfaces [14, 15]. Tests performed on a 500 meter long photocatalytic
concrete pavement in an avenue of Bergamo, Italy, have led to a mean NOx concentration
decrease of ca. 50 % [16]. On the other hand, Maggos et al. [17] reported a decrease between
ca. 37 % and 82 % in a canyon-like pilot street, 2 m x 5.2 m x 18.2 m (width x height x
length), in Guerville, France, coated with mortars containing 3 wt.% of photocatalytic TiO2.
Concerning the use of photocatalytic paints, Bygott et al. [18] conducted a field trial in
London, close to a school children playground, where an area of 300 m2 of walls was painted
with a silicate-based paint incorporating 7.5 wt.% of photocatalytic TiO2. These authors
reported a daily NOx abatement of ca. 4.5 g in about 10000 m3 of air around the school
children playground [19].
In this work, the photocatalytic activity towards NO abatement is studied, using a paint
incorporating different commercially available photocatalytic TiO2. An exterior water-based
paint was chosen, with a pigment volume concentration (PVC) slightly above the critical
value (CPVC) [20]; PVC and CPVC are 62.2 and 59.3, respectively. The photocatalysts
added to the paint were also evaluated directly in powder form. The photocatalytic tests
followed roughly ISO 22197-1:2007(E) standard.
2.2 Experimental
2.2.1 Photocatalytic films

‐ 34 ‐
Different commercial photocatalytic TiO2 grades were tested for the photooxidation of NO.
Table 2.1 summarizes the main properties of the materials used, as reported by the
manufacturers. The photocatalytic TiO2 were tested in two forms: pure powder pressed film
and incorporated in an exterior water-based paint (9 wt.% in wet base).
The vinyl type water-based paint used for incorporating the photocatalysts was a commercial
exterior paint, from which half of the pigmentary TiO2 was removed (this paint is hereafter
named base paint). A brief description of its composition is given chapter 3 (and [20]). The
same batch of the base paint was used for all experiments (unless otherwise stated). Each
photocatalytic paint was then prepared by adding photocatalytic TiO2 to ca. 50 cm3 of the
base paint and mixing for 30 min at 300 rpm in a 100 cm3 stainless steel vessel. The final
photocatalytic TiO2 and pigmentary TiO2 content was 9 wt.% in wet basis (ca. 17 wt.% in dry
basis).
The photocatalytic films, either powder pressed or paint films, 0.10 m length x 0.05 m width,
were applied over an aluminum slab. A draw-down bar was used to apply the photocatalytic
paint films, producing wet films ca. 200 m thick (varying slightly accordingly to the
rheology of each film). Photocatalytic paint films were dried at lab conditions for one day;
drying for longer periods showed no differences in terms of photoactivity.
Powder pressed films were obtained pouring the photocatalytic TiO2 powder evenly over the
aluminum slab and then pressing at ca. 5 bar for 7 min. This procedure yielded homogeneous
powder films ca. 0.5 mm thick. The exact amount of photocatalytic TiO2 poured over the
support was obtained gravimetrically (using an analytical balance). The final load of
photocatalytic TiO2 (mass of photo-TiO2 per area of film) was around 2 mg·cm-2 and 60
mg·cm-2 for paint and powder pressed films, respectively (except for powder pressed films of
P25, for the reasons mentioned below – section 2.3.1.2).

‐ 35 ‐
Table 2.1 – Properties of the photo-TiO2 used (data provided by the manufacturers).
Sample #
Photo-TiO2 (manufacturer)
Crystal structure
Crystal Size
(nm)
Surface area
(m2·g-1)
Particle diameter
(m)
1 ANX type PA
(Kemira) Anatase 7 - 25 100 - 250 2 - 6
2 PC500
(Millennium)
> 99 % Anatase
5 - 10 345 1.2 - 1.7
3 PC50
(Millennium)
> 99 % Anatase
20 - 30 50 1.5
4 PC105
(Millennium)
> 99 % Anatase
15 - 25 86 1.2
5 P25
(Evonik)
80 % Anatase
20 % Rutile 25 50 n.p.
6 UV100
(Sachtleben) Anatase 10 250 n.p.
7 UVLP7500
(Kronos) Anatase 15 > 250 n.p.
8 VLP7000
(Kronos) Anatase 15 > 250 n.p.
9 VLP7101
(Kronos) Anatase 15 > 150 n.p.
10 AMT100
(Tayca) Anatase 6 267 n.p.
n.p. – not-provided.
2.2.2 Experimental setup
The experimental setup used is depicted in Figure 2.1 and implements roughly ISO 22197-
1:2007(E) standard.

‐ 36 ‐
It comprehends basically a photocatalytic reactor inserted in a thermostatic cabinet, a feed
system and a NOx analyzer (Thermo Scientific 42C). The photoreactor is made of aluminum,
with internal dimensions 0.05 m x 0.23 m x 0.005 m (width x length x height) and is equipped
with a borosilicate glass window (Präzisions Glas & Optik GmbH) 0.005 m thick, at the top
face (because the film is only 0.10 m long, a loading of 200 m2/m3 was used – photocatalytic
film area per photocatalytic chamber volume). The borosilicate window has an overall light
transmittance of more than 90 % between 330 nm and 400 nm; during 2 years of usage no
solarisation effect was observed. The gas entrance and exit of the reactor is made via two
mixture chambers that connect with the internal reaction chamber through 5 holes with 1 mm
diameter, allowing an homogeneous gas flow across the reactor width (see Figure 2.2 for
details). Two thermocouples were inserted at the entrance and exit of the internal reaction
chamber to better assess the temperature (by means of a NI USB-9211A DAQ board with 24
bits).
Figure 2.1 – Sketch of the experimental setup used for the photocatalytic tests (arrows represent the
gas flow direction).

‐ 37 ‐
Figure 2.2 – Schematic representation of the photoreactor (top view).
The feed system is composed of two mass flow meters (MFM) and one mass flow controller
(MFC) (Hi-Tech Bronkhorts, MFM 0-1 LN·min-1 and MFC 0-0.1 LN·min-1, with a precision of
±0.5 % FS) and a humidifier – Figure 2.1. The relative humidity (RH) of the air stream is
adjusted by mixing dry and water-saturated synthetic air streams.
In the present study, a 50 % RH feed stream was supplied (Hydrogat 20; accuracy ±2 % RH),
containing 1 ppm of NO in synthetic air at 25 ºC, in agreement with the above-mentioned
standard; however, a flow rate of 0.7 LN·min-1 (residence time of 2.1 s; equivalent to an air
change rate of 1680 h-1) was used instead of the 3 LN·min-1 recommended by the standard.
The NO was added to the previously humidified synthetic air stream, from a gas cylinder
containing ca. 45 ppm of NO in nitrogen (Linde – 2 % accuracy). In order to obtain a NO
concentration of 1 ppm, it was necessary to add 2.3 % of this NO gas mixture to the synthetic
air stream. The by-pass line to the reactor (see Figure 2.1) was used to calibrate the NOx
analyzer at the beginning and to check the calibration at the end of each experiment; the
maximum relative difference was always smaller than 1 %. The experimental setup was
controlled using a data acquisition board system (Advantech PCI 1710HG and PCLD 8710)
and an in-house developed program written in Labview (National Instruments).

‐ 38 ‐
2.2.3 UV lamp system
The UV lamp system (Vilbert Lourmat - BLB 365 nm, 2 x 6 W lamps) was placed over the
borosilicate glass window of the reactor in a support that allows tuning the irradiance by
changing the distance of the lamp to the reactor.
For the present tests, an irradiance of 7 W·m-2 was used (instead of the 10 W·m-2
recommended by the standard), which corresponds to a distance between the lamp and the
reactor of ca. 0.20 m. The spectrum of the UV lamp system ranges from initial =315 nm to
final =390 nm. The irradiance was measured across the reactor, at 7 equally spaced positions
along the axial direction of the gas flow ( zi). These measurements were made at the
transversal centre of the reactor, under the borosilicate glass window. A radiometer set (Delta
Ohm HD 2102.2 equipped with a LP471UVA sensor – maximum uncertainty of 5 %) was
used for reading the irradiance per position during 60 min ( I zi read ). The UV lamp was
allowed to stabilise for 30 min before the measurements. Transversal irradiance showed no
significant variation. The irradiance reaching the surface of the photocatalytic films at a
certain axial position zi of the reactor, accounting for the borosilicate glass transmittance, the
relative spectral response of the sensor ( P ) and the radiant power of the lamp (W ) for each
wavelength, averaged for the entire wavelength range, is given by [21]:
final
initial
final
initial
Pw
wzIzI readifilmi
d
d (2.1)
The irradiance profile at the reactor axial direction I zi film is shown in Figure 2.3.

‐ 39 ‐
Figure 2.3 – Irradiance as a function of the position inside the photoreactor and respective uncertainty
(maximum 5% considered); irradiance obtained with eq.(2.1) (full circles) and the corresponding
interpolation curve (continuous line).
The average irradiance reaching the photocatalytic film ( I film ) was calculated based on the
irradiance profile over it:
I film I zi film
dzzinitial
z final
z final zinitial
7 W m2 (2.2)
where active area of the photoreactor begins at initialz = 0.065 m and ends at finalz = 0.165 m.
2.3 Results and discussion
2.3.1 Photocatalytic tests
Photocatalysis can originate the reduction [22] or the oxidation [10] of NO. However,
photoreduction is commonly achieved when high partial pressure of NOx and/or reducing
agents are present (CO, NH3, etc.), and in the absence of water and/or oxygen [23]. For the
operating conditions used, NO photocatalytic oxidation has been reported to originate only

‐ 40 ‐
nitrite (NO2-), nitrate (NO3
-) and nitrogen dioxide (NO2) [10], which were therefore
considered to be the only reaction products in the present work. Since NO2 is more harmful
than NO for human health, the desired reaction products are the ionic species. In this way, two
parameters were used to characterize the photoactivity towards the abatement of NO: NO
conversion (eq. 2.3) and selectivity towards the formation of the ionic species NO2- and NO3
-
(eq. 2.4):
XNO CNO
in CNOout
CNOin
100 (2.3)
S 1CNO2
out
CNOin CNO
out
100 (2.4)
where CNO and CNO2 stand for the concentration of NO and NO2, respectively, and the
superscripts (in and out) refer to the reactor’s inlet and outlet streams.
The steady state was considered to be achieved whenever NO conversion and selectivity do
not vary more than 2.5 percentage points for 5 h.
Before initiating the characterization of the photoactivity of the materials, the ability of the
powder pressed films to adsorb NO and the ability of the base paint (containing no
photocatalytic TiO2) to photo-oxidize or adsorb NO was evaluated. With the UV light turned
off, a negligible decrease in the exiting NO concentration was observed for all tests,
indicating no significant NO adsorption (as compared to photocatalytic activity, due to the
high flow rates used), either in powder pressed or paint films. No photoactivity of the base
paint was also observed, even after 24 hours of activation under 90 % of RH and 30 W·m-2
(harsher activation protocol as detailed in section 2.3.1.1).
For the specific case of photocatalytic paint incorporating P25 the PVC was 62.4 and the
critical one (CPVC) 55.0.
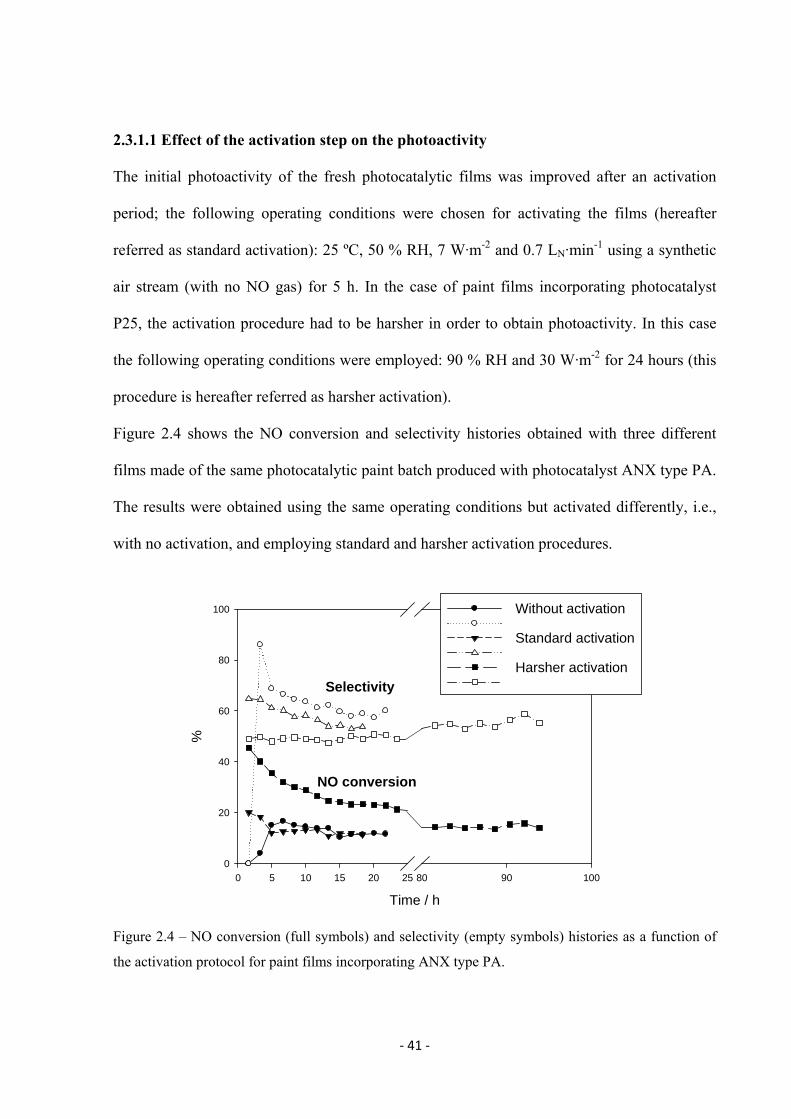
‐ 41 ‐
2.3.1.1 Effect of the activation step on the photoactivity
The initial photoactivity of the fresh photocatalytic films was improved after an activation
period; the following operating conditions were chosen for activating the films (hereafter
referred as standard activation): 25 ºC, 50 % RH, 7 W·m-2 and 0.7 LN·min-1 using a synthetic
air stream (with no NO gas) for 5 h. In the case of paint films incorporating photocatalyst
P25, the activation procedure had to be harsher in order to obtain photoactivity. In this case
the following operating conditions were employed: 90 % RH and 30 W·m-2 for 24 hours (this
procedure is hereafter referred as harsher activation).
Figure 2.4 shows the NO conversion and selectivity histories obtained with three different
films made of the same photocatalytic paint batch produced with photocatalyst ANX type PA.
The results were obtained using the same operating conditions but activated differently, i.e.,
with no activation, and employing standard and harsher activation procedures.
Time / h
0 5 10 15 20 25 80 90 100
%
0
20
40
60
80
100 Without activation
Standard activation
Harsher activationSelectivity
NO conversion
Figure 2.4 – NO conversion (full symbols) and selectivity (empty symbols) histories as a function of
the activation protocol for paint films incorporating ANX type PA.

‐ 42 ‐
All the films showed different transient behaviors concerning the conversion and selectivity
histories. The non-activated film showed no photoactivity for about 4 hours. After this period,
it became photoactive, showing approximately the same steady state performance as the
remaining samples (Figure 2.4). On the other hand, the harsher activated film showed a
transient photoactivity that exceeded the steady state during a long period of time, ca. 90
hours; the standard activated film exhibited an intermediate photoactivity history. After the
transient behavior, the steady state performance of all three photocatalytic films was
approximately the same. Similar behavior was observed for other photocatalytic paint films;
the steady state is approximately the same, no matter the activation protocol used and
consequent transient behavior. Despite, in real tests other variables may play a role affecting
the steady state performance, such as chalking with possible photocatalyst washout and dirty
that can impair light absorption.
Time / h
0 20 40 60 80 100 120 140 160 180
%
0
20
40
60
80
100
XNOS
1st run 2nd runRestingperiod
Figure 2.5 – NO conversion (full symbols) and selectivity (empty symbols) histories in two
consecutive runs, with 24 hours resting period, with a photocatalytic paint film incorporating
UVLP7500.

‐ 43 ‐
Figure 2.5 shows the history of NO conversion and selectivity of the paint film produced with
photocatalyst UVLP7500, after the standard activation. This figure illustrates two consecutive
runs; the paint sample was withdrawn from the photoreactor and reinserted back after one
day. It can be seen that the steady state conversion and selectivity are approximately the same,
showing a stable performance for the photocatalytic film after the steady state has been
reached. This same behavior was observed for paint films made with other photocatalysts
(data not shown). The steady state performance of a photocatalytic paint film seems therefore
to be independent of the history.
Regarding the powder pressed films, no noticeable differences were observed for each sample
as a function of the activation protocol, in both transient and steady state photoactivity (data
not shown). In the following sections, standard activation was used, unless otherwise stated.
2.3.1.2 Repeatability and effect of photo-TiO2 load
Repeatability of the photoactivity performance on the powder pressed and paint films and the
effect of photocatalytic TiO2 load in the photoactivity of powder pressed films were assessed
using P25 and VLP7101. Table 2.2 shows the steady state NO conversion and selectivity for
these tests. Powder pressed films made of P25 and VLP7101 show very different loads (Table
2.2) for similar thicknesses because P25 bulk density is very low when compared to the
density of VLP7101.
The NO conversion and selectivity at steady state in powder pressed films with different
photocatalyst loads are very similar (Table 2.2). This should indicate that the film is optically
thick (constant optical thickness despite the film thickness and TiO2 load); this was also
concluded from spectrophotometer contrast ratio tests.

‐ 44 ‐
Table 2.2 – Steady state NO conversion and selectivity of powder pressed and photocatalytic paint
films of P25 and VLP7101 photo-TiO2 – study of repeatability and load effect.
Film type Run # Photo-TiO2 Lphoto-TiO2
(mg·cm-2) XNO (%)
S
(%)
Powder
pressed
1
P25
13.5 81 47
2 18.4 81 44
3 23.7 80 48
4 VLP7101
61.6 94 61
5 67.2 90 60
Paint
6
P25
2.30 25 30
7 2.30 24 21
8(1) 2.27 29 30
9 VLP7101
2.23 27 40
10 2.35 25 40
(1) Paint produced with a different base paint batch.
Figure 2.6a shows that for P25 pressed films the steady state condition was attained after a
short transient period of ca. 5 h. On the other hand, the steady state photoactivity of the
corresponding paint film, Figure 2.6b, was achieved after a much longer operation period of
ca. 100 to 200 h, variable according to the batch of base paint used; paint films exhibited a
less reproducible transient behavior even when the same batch of base paint was used, which
highlights the interference of the paint matrix with the photocatalytic process. Generally, for
the case of paint films, more than 100 hours were required to attain the steady state, with
exception for the paint film incorporating ANX type PA which required only ca. 10 h (Figure
2.4). About 5 to 10 percentage points of variation in steady state NO conversion and
selectivity within paint films can be generally considered as result of experimental errors
(Table 2.2).

‐ 45 ‐
Figure 2.6 – NO conversion (full symbols) and selectivity (empty symbols) for (a) powder-pressed
films of P25 (Runs #1-3) and (b) photocatalytic paint films of P25 (Runs # 6-8), as described in Table
2.2.
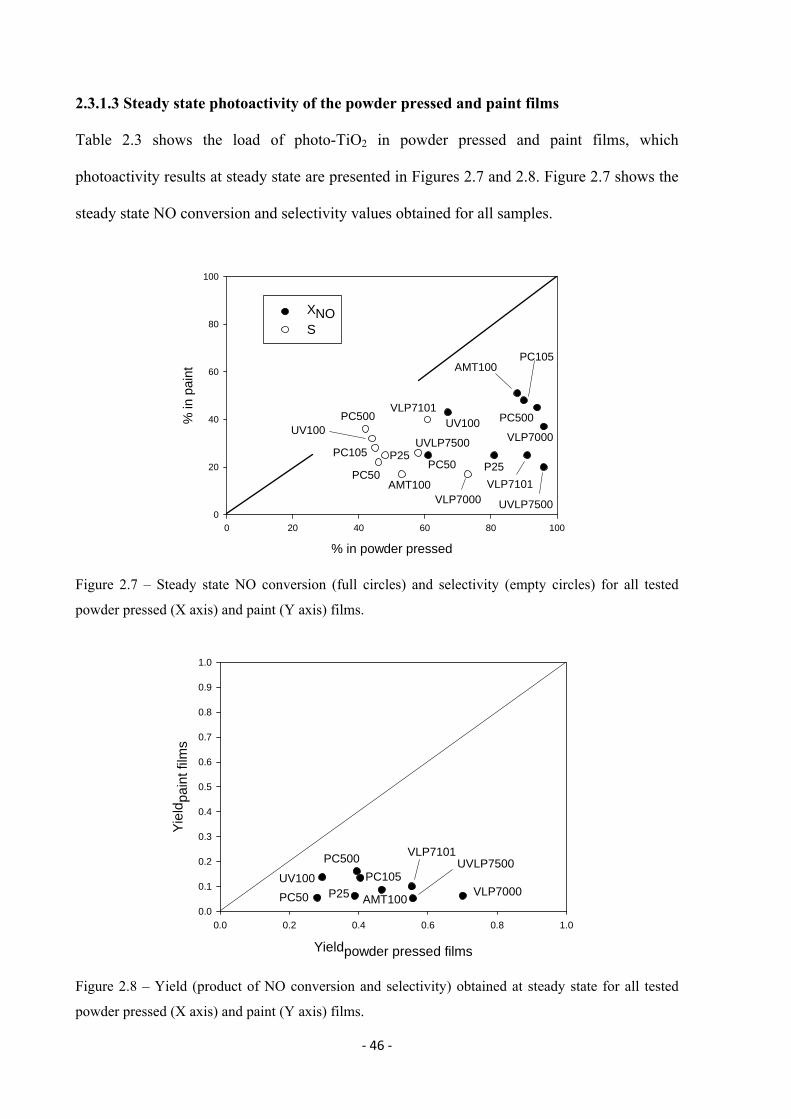
‐ 46 ‐
2.3.1.3 Steady state photoactivity of the powder pressed and paint films
Table 2.3 shows the load of photo-TiO2 in powder pressed and paint films, which
photoactivity results at steady state are presented in Figures 2.7 and 2.8. Figure 2.7 shows the
steady state NO conversion and selectivity values obtained for all samples.
% in powder pressed
0 20 40 60 80 100
% in
pai
nt
0
20
40
60
80
100
XNOS
P25P25
PC50PC50
PC105
PC105
PC500PC500UV100
UV100
AMT100
VLP7000
VLP7000
VLP7101
VLP7101
UVLP7500
UVLP7500
AMT100
Figure 2.7 – Steady state NO conversion (full circles) and selectivity (empty circles) for all tested
powder pressed (X axis) and paint (Y axis) films.
Yieldpowder pressed films
0.0 0.2 0.4 0.6 0.8 1.0
Yie
ldpa
int f
ilms
0.0
0.1
0.2
0.3
0.4
0.5
0.6
0.7
0.8
0.9
1.0
UV100VLP7000
VLP7101UVLP7500
PC50
PC105
PC500
AMT100P25
Figure 2.8 – Yield (product of NO conversion and selectivity) obtained at steady state for all tested
powder pressed (X axis) and paint (Y axis) films.

‐ 47 ‐
The photocatalytic yield is the product of the NO conversion and selectivity, weighting this
way the two characterizing parameters. Figure 2.8 shows the steady state yield obtained with
the powder pressed and paint films, therefore condensing the information given in Figure 2.7.
It was not possible to make a powder pressed film with ANX type PA because this material
has a very low cohesion. Even though the paint films were formulated with the same mass
fraction of each commercial TiO2, they exhibit different photocatalytic TiO2 loads because of
the differences in the film thicknesses.
Table 2.3 – Photo-TiO2 loads of the powder pressed and paint films shown in Figure 2.7.
Lphoto-TiO2 (mg·cm-2)
Photo-TiO2 Powder pressed films Paint films
ANX type PA n.p. 1.91
PC500 60.3 1.97
PC50 79.0 1.66
PC105 71.3 2.33
P25 18.4 2.30
UV100 65.9 2.00
UVLP7500 50.4 2.27
VLP7000 57.7 2.23
VLP7101 61.6 2.35
AMT100 67.1 2.23
Average 64.21 2.13
Standard deviation 8.71 0.23
n.p. – not-performed; (1) - P25 was not included in this calculation because of its relative lower load (see section 2.3.1.2 for details).

‐ 48 ‐
Figure 2.7 shows that NO conversion values obtained with powder pressed films are generally
above 80 %; only PC50 and UV100 exhibit lower NO conversions, in the range of 60 - 70 %.
When incorporated in paint, PC500, PC105, UV100 and AMT100 revealed the highest NO
conversion values (ca. 40 - 50 %), while ANX type PA had the lowest one (15 % - Figure 2.4,
not shown in Figure 2.7 due to lack of results in powder pressed form).
For each commercial photocatalytic TiO2, the NO conversion was always higher for the
powder pressed than for the paint films. These differences should result from the much higher
photocatalyst loads and the hiding and impairing effects of the paint matrix.
Figures 2.7 and 2.8 also show that there is no apparent relationship between photoactivity of
the commercial samples in powder vs. paint films (i.e., the less or more active materials in
powder pressed films are not necessarily the same in paints); so, the interaction between the
paint matrix with each photocatalytic TiO2 must play a role on the photoactivity of the paint
films.
It is worth mentioning that the paint film added with P25 showed no photoactivity when
activated following the standard protocol, becoming photoactive only after the harsher
activation protocol. This behavior should be related to the higher dispersion of the
photocatalyst in the paint films, as discussed below (see Figure 2.11). As shown by Fujishima
and co-workers, a better dispersion of photocatalytic TiO2 in the matrix of the support lead to
a greater interference of the matrix in the photocatalytic process [12].
It is also important to remark that photocatalyst UV100 exhibited the smallest NO conversion
difference when comparing paint and powder films – respectively 40 % and 65 %. Such fact
highlights the importance of better understanding the interactions between paint components
and photocatalytic TiO2; it was shown, for example, that there is a significant competitive
absorption of UV by the pigmentary TiO2 of the paint (chapter 3 and 4 and [20]).

‐ 49 ‐
Concerning the selectivity obtained with the powder pressed films, VLP7000 showed the
highest value (ca. 75 %) followed by VLP7101 and UVLP7500 (ca. 60 %); the selectivity
obtained with the remaining materials lied in the range of 40 % to 55 % (Figure 2.7).
Regarding the selectivity obtained with paint films, ANX Type PA showed the highest value
(ca. 55 % - Figure 2.4), exhibiting however the lowest NO conversion (15 %). VLP7101,
PC500 and UV100 showed the second highest selectivity (30 % to 40 %).
No clear relationship was found between the photocatalytic TiO2 properties - Table 2.1 - and
their photoactivity, either in powder pressed or paint films (Figures 2.7 and 2.8).
The highest yields for powder pressed films were obtained with photocatalysts VLP7000
(0.70), VLP7101 and UVLP7500 (ca. 0.55), while for paint films the highest yields were
achieved with PC500, UV100 and PC105 (ca. 0.15). The yield obtained with the
photocatalytic paint containing ANX type PA was 0.06 (data not shown).
2.3.2 Diffuse reflectance and SEM analyses
Light interaction with an optically thick powder pressed film of photocatalytic TiO2 particles
results in absorption and scattering. The intensity of each phenomenon varies accordingly to
the wavelength used, particle diameter and nature, film morphology, crystal-lattice,
temperature and pressure [24]. The photoactivity depends on the nature and morphology of
the photocatalyst but also on the powder pressed film ability to absorb effectively the incident
light. Figure 2.9a shows the incident light spectrum used on the photocatalytic tests and the
diffuse reflectance of the powder pressed films tested (data not shown for ANX type PA
because it was not possible to obtain stable powder pressed films). The diffuse reflectance
data were obtained using a Perkin Elmer lambda 750 spectrophotometer, equipped with a 60
mm integrating sphere and using SpectralonTM as 100% reflectance standard. The powder
samples were supported on the above-mentioned aluminum slabs.
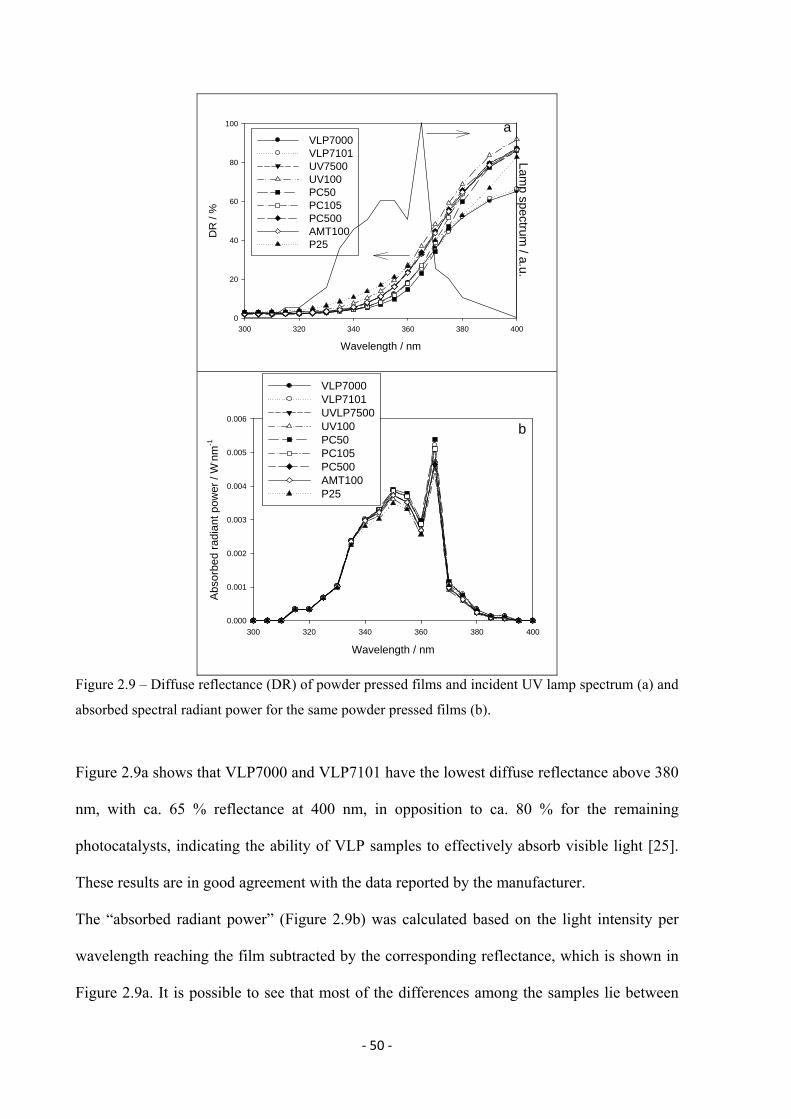
‐ 50 ‐
Wavelength / nm
300 320 340 360 380 400
DR
/ %
0
20
40
60
80
100
VLP7000VLP7101UV7500UV100PC50PC105PC500AMT100P25
Lamp spectrum
/ a.u.
a
Wavelength / nm
300 320 340 360 380 400
Abs
orbe
d ra
dian
t pow
er /
W. nm
-1
0.000
0.001
0.002
0.003
0.004
0.005
0.006
VLP7000VLP7101UVLP7500UV100PC50PC105PC500AMT100P25
b
Figure 2.9 – Diffuse reflectance (DR) of powder pressed films and incident UV lamp spectrum (a) and
absorbed spectral radiant power for the same powder pressed films (b).
Figure 2.9a shows that VLP7000 and VLP7101 have the lowest diffuse reflectance above 380
nm, with ca. 65 % reflectance at 400 nm, in opposition to ca. 80 % for the remaining
photocatalysts, indicating the ability of VLP samples to effectively absorb visible light [25].
These results are in good agreement with the data reported by the manufacturer.
The “absorbed radiant power” (Figure 2.9b) was calculated based on the light intensity per
wavelength reaching the film subtracted by the corresponding reflectance, which is shown in
Figure 2.9a. It is possible to see that most of the differences among the samples lie between

‐ 51 ‐
the wavelengths from 335 nm to 365 nm, which corresponds to the range of the maximum
radiant power of the lamp used (cf. Figure 2.9a). Figure 2.10 shows the NO conversion and
selectivity as a function of the total absorbed radiant power (integral of the “absorbed radiant
power”); no clear trend was observed indicating that either the energy differences are not
significant or other variables are playing a significant role.
Total absorbed radiant power/ w
0.130 0.135 0.140 0.145 0.150
%
30
40
50
60
70
80
90
100
XNO
S
P25
P25
VLP7000
VLP7000
VLP7101
VLP7101
UVLP7500
UVLP7500PC50
PC50PC105PC500
PC500
AMT100
AMT100
PC105
Figure 2.10 – NO conversion and selectivity as a function of the total absorbed radiant power by the
powder pressed films between 315 nm and 390 nm.
SEM images of some photocatalytic films are shown in Figure 2.11; left side images show
powder pressed films while right side ones show paint films. In this Figure, there are visible
agglomerates of primary particles with dimensions in good agreement with the values
provided by the manufacturers, cf. Table 2.1 and Table 2.4. P25 (Figure 2.11c and d), PC500
(Figure 2.11e and f) and the remaining photocatalytic TiO2 tested show uniform-size
agglomerates, while VLP7101 (Figure 2.11a) and PC50 exhibit two distinct particle
morphologies: the smaller primary particles form agglomerates while the bigger ones do not
agglomerate. Despite these behaviors, the EDS analyses indicates that in both cases

‐ 52 ‐
agglomerates and individual particles are only made of TiO2 (data not shown). In Figure
2.11b there are visible smooth round hollow spheres. These spheres are a polymeric extender
used for increasing the paint contrast ratio (opacity). Besides these spheres, Figure 2.11 shows
that the morphology of the photocatalytic TiO2 is similar when analysed in powder pressed
films (Figure 2.11c and e) or when incorporated in paint films (Figure 2.11d and f).
Table 2.4 – Particle diameter and shape of the photo-TiO2, obtained by SEM.
Photo-TiO2 Particle diameter (m
or specified) Shape
ANX type PA 2 to 6 Agglomerates
PC500 1.5 Agglomerates
PC50 ~ 0.1 and ~ <1.5 Single large particles and
agglomerates
PC105 1.5 Agglomerates
P25 25 nm Primary particles
UV100 1 to 3 Agglomerates
UVLP7500 1 to 3 Agglomerates
VLP7000 1 to 3 Agglomerates
VLP7101 ~ 0.1 and ~ 1 Single large particles and
agglomerates
AMT100 < 2 Agglomerates
P25 was the photocatalyst that showed the highest dispersion in paints among all the
photocatalysts tested (see Figure 2.11). This higher dispersion exposes the photocatalyst to the
direct contact with the paint matrix, and then to possibly more severe photocatalytic hindering
effects. As mentioned before, this might be the reason why a harsher activation was needed
for this material.

‐ 53 ‐
Powder Paint
a) VLP7101 b) Base paint
c) P25 d) P25
e) PC500 f) PC500 Figure 2.11 – SEM images of the photo-TiO2 in powder (left images) and paint (right images) films –
100 000x mag.

‐ 54 ‐
2.4 Conclusions
In the present study 10 commercial photocatalytic TiO2 samples were tested for NO
abatement. The photoactivity was assessed following approximately ISO 22197-1:2007(E)
standard. The photocatalysts were tested as powder pressed films and incorporated in a water-
based paint, with a content of ca. 9 wt.% (wet base). For this, an exterior water-base paint
with PVC slightly above the critical value was used.
In the photocatalytic tests, the steady state conversion and selectivity were attained faster with
the powder pressed films than with the paint films: respectively within ca. 5 hours and
generally after more than 100 hours. No clear relation was found between the photoactivity of
the commercial photocatalytic TiO2 in powder and when incorporated in the paint film; i.e.,
the best performing photo-TiO2 in powder form was not the best when incorporated in the
paint. Such fact indicates that the paint support plays an important role in the photoactivity of
the tested materials, as shown elsewhere (chapters 3 and 4 and [20]).
The photocatalytic TiO2 in powder form exhibited always a higher photoactivity than when
incorporated in the paint. This can be partially explained by the photocatalytic content: 100
wt.% when in the powder form compared with ca. 17 wt.% (dry base) when incorporated in
paint. The highest yields were obtained with powder pressed films of photocatalysts VLP7000
(0.70), VLP7101 (0.55) and UVLP7500 (0.55), while the highest yields obtained with paint
films were achieved with PC500, UV100 and PC105 (ca. 0.15).
The powder pressed films showed a very reproducible photoactivity that was not influenced
by the activation step. On the other hand, the photoactivity of the paint films showed a great
dependence on the activation protocol, affecting the time needed to reach the steady state.
However, the steady state photoactivity of a given photocatalytic paint was the same,
independently of the activation protocol, within the accepted variation of 5 to 10 percentage
points. Moreover, after attaining the steady state a paint film held the photoactivity even after

‐ 55 ‐
a resting period. Such fact confirms the steady state results as more adequate for
photocatalytic TiO2 screening than initial or transient values.
References
[1] European Commission, Attitudes of European Citizens Towards the Environment, Special
Eurobarometer 295/Wave 68.2 – TNS Opinion & Social, March 2008 (available at:
http://ec.europa.eu/public_opinion/archives/ebs/ebs_295_en.pdf – accessed February 2011).
[2] United States Environmental Protection Agency, How nitrogen oxides affect the way we
live and breathe, EPA-456/F-98-005, September 1998 (available at:
http://www.cleanairaction.org/pubs/pdfs/old_pubs/noxfldr.pdf - accessed February 2011).
[3] Leeuw, F.A.A.M., Environ Sci Policy 2002, 5, 135.
[4] – European Environment Agency, - EEA-32 Nitrogen oxides (NOx) emissions, Technical
report, APE002/2010 (available at:
http://themes.eea.europa.eu/IMS/IMS/ISpecs/ISpecification20080218104839/IAssessment126
2689215798/view_content - accessed February 2011).
[5] European Environment Agency, NECD: Member State Country-Profiles, 2007 (available
at: http://www.eea.europa.eu/themes/air/nec-directive-member-state-country-profiles/nec-
directive-member-state-country-profiles - accessed February 2011).
[6] Riga-Karandinos, A.-N., Saitanis, C., Chemosphere 2005, 59, 1125.
[7] Fujishima, A., Zhang, X., Tryk., D. A., Surf. Sci. Rep. 2008, 63, 515.
[8] Krol, R., Liang, Y., Schoonman, J., J. Mater. Chem.2008, 18, 2311.
[9] Diebold, U., Surf. Sci. Rep. 2003), 48, 53.
[10] Devahasdin, S., Fan Jr., C., Li, K., Chen, D.H., J. Photochem. Photobiol. A 2003, 156,
161.
[11] Gerischer, H., Heller, A., J. Phys. Chem. 1991, 95 5261.

‐ 56 ‐
[12] Fujishima, A., Hashimoto, K., Watanabe, T., TiO2 PhotocatalysisFundamentals and
Applications, 1st ed., BKC Inc., Tokyo (Japan), 1999.
[13] Herrmann, J.-M., Appl. Catal. B: Environ. 2010, 99, 461.
[14] Paint company Sto – website for photocatalytic product Climasan
(www.stoclimasan.com - accessed February 2011).
[15] Global Engineering - Photocatalytic building products (www.ecopurer.com - accessed
February 2011).
[16]. Guerrini, G.L, Peccati, E., White Cement and Photocatalysis – Part 1: Fundamentals,
International RILEM Symposium on Photocatalysis, Environment and Construction
Materials, 8-9 October 2007, Florence, Italy, 179-186.
[17] Maggos, Th., Plassais, A., Bartzis, J.G., Vasilakos, Ch., Moussiopoulos, N., Bonafous,
L., Environ. Monit. Assess. 2008, 136, 35.
[18] Bygott, C.E., Maltby, J.E., Stratton J.L., McIntyre, R., Photocatalytic Coatings for the
Construction Industry, International RILEM Symposium on Photocatalysis, Environment and
Construction Materials, 8-9 October 2007, Florence, Italy, 251-258.
[19] Koleske, J.V., Paint and coating testing manual, 14th ed., Gardner-Sward Handbook,
Philadelphia, 1995.
[20] Águia, C., Ângelo, J., Madeira, L.M., Mendes, A., Catal. Today 2010, 151, 77.
[21] Salvad-Estivill, I., Hargreaves, D.M., Puma, G.L., Environ. Sci. Technol. 2007, 41, 2028.
[22] Matsuoka, M., Anpo, M., J. Photochem. Photobiol. C, 2003, 3, 225.
[23] Bowering, N., Walker, G.S., Harrison, P.G., Appl. Catal. B – Environ 2006, 62, 208.
[24] Siegel, R., Howell, J.R., Thermal radiation heat transfer, 4th ed., Taylor & Francis, New
York, 2002.
‐ 57 ‐
[25] Blöß S.P., Elfenthal, L., Doped Titanium Dioxide as a Photocatalyst for UV and Visible
Light, International RILEM Symposium on Photocatalysis, Environment and Construction
Materials, 8-9 October 2007, Florence, Italy, 31-38.

‐ 58 ‐

‐ 59 ‐
Part III – The Paint Matrix

‐ 60 ‐

‐ 61 ‐
Chapter 3 – Influence of Paint Components on P25 Photoactivity – Powder and organic paint components2
Abstract
The present chapter studies the effect of the components of a photocatalytic paint towards the
photooxidation of NO. A high quality vinyl exterior paint, modified with photocatalyst P25,
was used. NO conversion and selectivity towards nitrate and nitrite were obtained in an
experimental photocatalytic reactor that implements essentially the standard ISO 22197-
1:2007(E).
It is concluded that the paint matrix plays an important role on the photocatalytic activity:
pigmentary TiO2 absorbs competitively the UV light, being the most critical component
affecting the photocatalytic activity; extenders, such as CaCO3, impair the photoactivity,
especially when water is involved in mixing the paint components; organic components
mostly affect the performance of the paint during a transient period time of ca. 100 - 250
hours.
2 Águia, C., Ângelo, J., Madeira, L.M., Mendes, A., Cataysis Today 2010, 151, 77.

‐ 62 ‐
3.1 Introduction
Air pollution has been calling the attention of the public in general [1]. Amongst numerous air
pollutants, hazardous gases for human health are of particular concern, mainly in urban and
industrial areas.
Presently, more than a half of the population in developed countries lives in highly dense
traffic cities. Such way of living exposes people to toxic gases like carbon monoxide and
nitrogen oxides (NO + NO2). End of pipe technologies developed over the last decades have
been particularly important to decrease the emission of hazardous gases to the atmosphere.
However, some gases are still present in the atmosphere above their legal limits; NOx, mainly
produced by vehicles, is one of such examples. NOx concentrations are above the legal limits
established by the European Commission (2008/50/EC) not only in big cities but even in
small cities with relative low traffic such as Guimarães (Portugal), Patras and Volos (Greece),
among others [2, 3]. It is therefore necessary to improve and develop new de-pollution
technologies.
Photocatalysis is an attractive technology for de-pollution proposes because it uses solar
radiation and works at ambient temperatures and at typical low airborne concentrations [4, 5].
In a simple way, photocatalysis can be described as a redox process that uses a catalyst
activated by photonic energy (photocatalyst).
Photocatalysts have been incorporated into construction materials so they can act as de-
polluting agents. They have been incorporated into cement/mortars pavements [e.g. 6, 7],
coatings [8 - 12], among others. Maggos et al. [9], for instance, reported a NO
photoabatement of ca. 40 % to 80 % in a canyon pilot street under real weather conditions
using mortar panels. Bygott et al. [11] conducted a field trial in London, close to a children
playground, where an area of 300 m2 of walls was painted with a silicate-based paint loaded
‐ 63 ‐
with 7.5 wt.% of photocatalytic TiO2. It was reported a daily abatement of ca. 4.5 g of NOX
from about 10 000 m3 of air around the school playground [11].
In order to be commercially attractive, a photocatalytic paint should exhibit a high
photoactivity while preventing its own degradation. However, typical photocatalysts
processes involving hydroxyl radicals are generally non-selective and strategies for
minimizing paint photodegradation must be developed. At the same time, paint components
can impair photoactivity concerning the abatement of target pollutants. This can be due to
several factors such as blockage of radiation and/or blockage of the gas pollutants itself
towards the photocatalyst, electron-hole external recombination or preferential photooxidation
of organics present in the paint.
In a previous work by the authors, various commercially available photocatalytic TiO2
materials were incorporated in an exterior water-based paint [12]. In this study it was noticed
a strong influence of the paint components on the NO photooxidation [12]. Paint film
incorporating the photocatalyst P25 (Evonik) was, among those tested, the only one requiring
a harsher activation procedure to become promptly active. In this way, this work aims to study
the influence of paint components on the photoactivity of P25.
3.2 Experimental
3.2.1 Photocatalytic films
The paint formulation used in the present work is based on exterior water-based vinyl paint.
This paint formulation was modified and half of the pigmentary TiO2 was replaced by P25
(producing a photocatalytic paint hereafter referred as reference paint – denoted as RP#).
Paint components were here divided in powder components – pigmentary and photocatalytic
TiO2, extenders and powder thickener – and non-powder or water-dispersed components

‐ 64 ‐
(hereafter referred as organic components, for simplicity) –binder (resin) and additives such
as thickener, dispersing agents and coalescent.
For evaluating the role of each paint component in the photoactivity of the paint, a series of
experiments with increasing number of component were performed – see Table 3.1. For
simplicity, whenever the films are formed by just powder components, they are called powder
pressed films (denoted as PP#); the others are called pseudo-paint films (denoted as PsP#).
The mass proportion of each component in the final paint was mostly kept in the powder and
pseudo-paint films.
The powder mixtures were obtained by hand-shaking for 5 min. The powder mixtures were
then evenly poured over an aluminum slab and pressed at ca. 5 bar for 7 min; the film was
then tested for NO photoactivity as described below.
In the case of PP5 (Table 3.1) the powder mixture was obtained stirring 10 g of the powder
mixture used in PP4 into 50 cm3 of distilled water applying 300 rpm for 30 min followed by
sonication for 5 min (Hielscher UIP1000hd, at 90 % of amplitude). The slurry was then
deposited over a glass plate and dried for 1 day at lab conditions and 1 more day at 50 ºC
(temperature already higher than the typical maximum a paint usually face). It was then
powdered and the powder applied in an aluminum slab, as described before.
In the case of the pseudo-paint films, the powder and organic components were mixed in a
100 cm3 vessel with 50 cm3 distilled water, applying 300 rpm for 30 min. Wet films were
produced with the help of a drawn down bar over the aluminum slab and let to dry for 1 day at
lab conditions, producing therefore the pseudo-paint films.
All films have an area of ca. 10 x 5 cm2. PP# and PsP# / RP# films have approximately 0.5
mm thickness (estimated using a micrometer) and 60 µm dry thickness (estimated by SEM
images), respectively. The initial composition of the pseudo-paint films and their rheology
yield different P25 loads in the film. For the case of pseudo and reference paint experiments,

‐ 65 ‐
the fraction of volatile substances present in each organic component and the amount of water
added for stirring were considered, along with the film mass, to estimate the final P25 load
(mass of P25 per area of film) reported in Table 3.1.
UV/Vis Diffuse reflectance analysis of the films were made using a Perkin Elmer lambda 750
spectrophotometer equipped with a 60 mm integrating sphere and SpectralonTM as reflectance
standard.
3.2.2 Experimental setup
The aluminum slabs above referred used to support the testing films were introduced in the
down part of the interior of the photoreactor, sketched in Figure 3.1.
Figure 3.1 – Sketch of the experimental setup used for the photocatalytic tests (arrows represent the
gas flow direction).
The photoreactor has a borosilicate window (overall light transmittance of 90 % over 330 nm)
at the top face, above which is placed a UV lamp system (Vilbert Lourmat - BLB 365 nm, 2 x
6 W lamps). These units were assembled inside a thermostatic cabinet for temperature control.

66
Table 3.1 – Mass fraction (with two decimal places) of paint components in the film used in each experiment, load of P25 and content of powders and organic
components (dry basis).
Mass fraction in dry film basis (wt.%)
Powder pressed films Pseudo-paint films Reference paint film
Component paint
functionality Description
Run PP0
Run PP1
Run PP2
Run PP3
Run PP4
Run PP51
Run PsP6
Run PsP7
Run PsP8
Run PsP9
Run PsP10
Run RP11
Pow
ders
Photocatalyst Photo-TiO2 P25 100.00 25.44 25.44 25.44 25.43 25.43 25.40 25.34 25.34 24.93 18.28 17.45
Extender CaCO3 ----- 74.56 ----- ----- 1.63 1.63 1.60 1.59 1.60 1.56 1.12 1.02
Extender BaSO4 ----- ----- 74.56 ----- ----- ----- ----- ----- ----- ----- ----- -----
Extender Silicates ----- ----- ----- ----- 46.93 46.93 46.89 46.78 46.66 45.86 33.57 32.56
Pigment Pigmentary TiO2 ----- ----- ----- 74.56 25.18 25.18 25.16 25.10 25.04 24.60 18.01 17.45
Additive Powder thickener ----- ----- ----- ----- 0.83 0.83 0.83 0.84 0.83 0.82 0.60 0.58
Org
anic
s
Extender pigment
Opaque polymeric particles
----- ----- ----- ----- ----- ----- ----- ----- ----- ----- 5.11 4.69
Additive Biocides ----- ----- ----- ----- ----- ----- ----- ----- 0.41 0.02 ----- 0.24
Additive Antifoam ----- ----- ----- ----- ----- ----- 0.12 0.12 0.12 0.13 ----- 0.08
Additive Amine ----- ----- ----- ----- ----- ----- ----- 0.23 ----- 0.29 ----- 0.16
Additive Dispersing agent ----- ----- ----- ----- ----- ----- ----- ----- ----- 1.79 ----- 1.26
Additive Coalescent ----- ----- ----- ----- ----- ----- ----- ----- ----- ----- 3.34 4.10
Additive Thickener ----- ----- ----- ----- ----- ----- ----- ----- ----- ----- ----- 0.53
Binder Resin ----- ----- ----- ----- ----- ----- ----- ----- ----- ----- 19.97 19.88
LoadP25 (mg·cm-2) 13.5 13.9 13.6 13.4 9.7 14.5 2.6 2.6 3.1 6.1 1.8 2.3
Powders (wt.%) 100.0 100.0 100.0 100.0 100.0 100.0 99.9 99.6 99.5 97.8 71.6 69.1
Organics (wt.%) 0.0 0.0 0.0 0.0 0.0 0.0 0.1 0.4 0.5 2.2 28.4 30.9 1 equivalent to run PP4 but sonicated in a slurry, dried and powdered in mortar (see section 3.2.1)

67
The setup comprehends also a feed system and a NOx analyzer (Thermo Scientific 42C). The
feed is ensured by a set of mass flow meters and one controller (Hi-Tech Bronkhorts) and the
corresponding relative humidity is adjusted by mixing dry and water-saturated synthetic air
streams (the latter obtained allowing the gas to bubble through a water column – referred as
humidifier, Figure 3.1).
The photoactivity was assessed by means of NO conversion (eq. 3.1) and selectivity towards
ionic species (eq. 3.2), i.e. nitrate and nitrite ions.
XNO CNO
in CNOout
CNOin
100 (3.1)
S 1CNO2
out
CNOin CNO
out
100 (3.2)
In these equations CNO and CNO2 stand for the concentration of NO and NO2, respectively,
while the superscripts in and out refer to the inlet and outlet streams of the reactor.
The operating conditions used were the following: 50 % relative humidity (RH), 25 ºC, 7
W·m-2 of irradiance and total feed flow rate of 0.7 LN·min-1 containing 1 ppm of NO. Prior to
the photocatalytic tests, the films were let to activate for 5 hours in the same operating
conditions but in absence of NO. This procedure follows roughly the standard ISO 22197-
1:2007(E). For the case of RP, a harsher activation was required (similar to the one above
referred but with 90 %RH, 30 W·m-2 and for 24 hours). The steady state was considered to be
achieved whenever NO conversion and selectivity do not vary more than ±2.5 percentage
points for 50 hours.

68
3.3 Results and discussion
3.3.1 UV/Vis diffuse reflectance
The light that reaches a film can be reflected, absorbed or transmitted. According to the
chemical and physical properties of the films, the contribution of each of these three
phenomena may vary. Figure 3.2 presents the diffuse reflectance of powder pressed (PP) films
tested in the photoreactor, in which transmittance of radiation is negligible, as discussed
below.
Wavelength / nm
300 320 340 360 380 400 420 440 460
DR
/ %
0
20
40
60
80
100
120
Lamp spectrumP25 (PP0)CaCO3
CaCO3 - B
CaCO3 - W
P25+CaCO3 (PP1)
BaSO4
P25+BaSO4 (PP2)
Pig. TiO2
P25+Pig. TiO2 (PP3)
Wavelength / nm
300 320 340 360 380 400 420 440 460
DR
/ %
0
20
40
60
80
100
120
Lamp spectrumP25 (PP0)Pig. TiO2
PP4, without P25PP4PP5 (PP4 sonicated)
Figure 3.2 – Diffuse reflectance (DR) of pure powder films of P25, CaCO3, BaSO4, pigmentary TiO2
and films tested in the photoreactor (Table 3.1); it was used an aluminum support for powder
deposition except for CaCO3 – B (black support - Leneta test charts) and CaCO3 – W (white support -
Leneta test charts).

69
P25 absorbs light up to the wavelength of 415 nm. However, it is known that the efficiency of
the photocatalyst to absorb light decays near to the longest wavelength that it can absorb [5];
accordingly, the diffuse reflectance analysis of P25 PP film exhibits a sigmoid-like curve with
no significant reflection up to 320 nm (Figure 3.2). The reflectance intensity starts then to
increase up to the 415 nm wavelength, the minimum energy able to excite electrons in rutile
crystal form of P25 (values above 100 % are related to the higher reflectance of the powder
film compared to the reference material, SpectralonTM).
The spectrum obtained with pigmentary TiO2 reveals an increase in diffuse reflectance with
the wavelength, again with a sigmoid-shape, particularly in the range 360 nm – 450 nm. The
low reflection of this material at wavelengths lower than 360 nm arises from the ability of
light absorption by TiO2 (rutile crystalline form).
P25 behaves similarly to pigmentary TiO2, but the reflectance in the UV region is generally
higher. For this difference account several properties of the two materials, namely: the particle
diameter (25 nm vs. 360 nm, respectively, probably with an higher dispersion of the primary
particle diameter in the first case) and the crystal structure (80 % anatase and 20 % rutile for
P25 and pure rutile for pigmentary TiO2). Apart of such differences, pigmentary TiO2 has also
a surface treatment of alumina and amorphous silica (5.5 wt.%) for minimizing the
photocatalytic activity, which otherwise would degrade the paint.
The UV/Vis diffuse reflectance analysis shows that extenders CaCO3 and BaSO4 have a high
reflectance in the wavelength range analysed (Figure 3.2). The spectra of CaCO3 PP films are
mostly independent of the support used (B – black, or W – white), indicating a negligible
transmittance of these films. This effect was also observed for the remaining films, indicating
that they are optically thick (i.e. their corresponding optical thickness is lower than the film
thickness).

70
When mixing CaCO3 or BaSO4 with P25 (experiments PP1 and PP2, Table 3.1), films reveal
similar spectra as pure P25 (Figure 3.2). Diffuse reflectance spectrum of the PP3 film (P25 +
pigmentary TiO2) lies in general between those of the pure components, but in the wavelength
region of concern for photocatalysis (majority of irradiance promoted by the UV lamp system
is in between 330 nm and 380 nm), reflectance lies closer to the one of pigmentary TiO2. Such
fact highlights the competitive absorption of photons by both components of this mixture.
Diffuse reflectance of film PP4 (see Table 3.1 and Figure 3.2) reveals a higher UV reflectance
than pigmentary TiO2, which is consistent with the presence of P25; the spectrum of PP4 lies
between the one of pigmentary TiO2 and that of P25.
Analysis of siliacates was impossible to perform due to lack of powder cohesion, however
their pure analyses shows that they must act as reflectors as CaCO3 and BaSO4.
Film PP5 shows a lower diffuse reflectance compared to PP4, particularly up from 340 nm,
being more similar to the spectra of pigmentary TiO2 in the UV region, while revealing the
lowest reflectance in visible region. Such result highlight the procedure interference on film
behavior towards light, which can account for its photoactivity.
3.3.2 Photoactivity of powder pressed (PP) films
Figure 3.3 shows the NO conversion and selectivity histories on three different powder
pressed films of P25. It can be seen that the steady state conversion and selectivity towards
nitrate and nitrite were reached after ca. 5 hours, ca. 80 % and 45 %, respectively. Figure 3.3
also shows that tests performed with different P25 films show good repeatability.

71
Time / h
0 5 10 15 20
%
0
20
40
60
80
100
XNO
S
Figure 3.3 – Conversion (full symbols) and selectivity (empty symbols) histories on 3 different
powder pressed films of pure P25 (experiment PP0).
Tests performed with powder films of pure P25 (experiment PP0) with different thicknesses
(and therefore different loads of P25) have shown no differences in either diffuse reflectance
or photoactivity at steady state (Figure 3.4). This allows concluding that only a fraction of the
P25 in PP0 films becomes photoactive. Consequently, it is not totally possible to establish a
direct correlation between photocatalyst load and photoactivity of the film.
Contrarily to the load, photoactivity of the powder film P25 is particularly affected by the film
length, which is related to the NO contact time in the photoreactor. It can be seen that not only
the conversion is smaller, but also it seems that the selectivity becomes smaller (Figure 3.4).
Such fact highlights once again that photocatalyst load is not the unique parameter playing a
role, as the 6 x 5 cm2 film has the same load as one of the 10 x 5 cm2 films and a lower
conversion.

72
%
0 20 40 60 80 100
LP
25 /
mg.
cm-2
(fil
m a
rea
/ cm
len
gth
x cm
wid
th)
23.7 (10x5)
13.5 (10x5)
14.8 (6x5)XNO
S
Figure 3.4 – Steady state conversion and selectivity on PP0 films with different loads and areas of
P25: 14.8 (6x5) – 14.8 mg·cm-2 and 6 x 5 cm2 (length x width); 13.5 (10x5) – 13.5 mg·cm-2 and 10 x 5
cm2 and 23.7 (10x5) – 23.7 mg·cm-2 and 10 x 5 cm2.
Time / h
0 100 200 300 400
%
0
20
40
60
80
100 XNO - PP1
S - PP1XNO - PP2
S - PP2XNO - PP3
S - PP3
Figure 3.5 – Conversion (full symbols) and selectivity (empty symbols) history for experiments PP1,
PP2 and PP3.

73
Figure 3.5 presents the photocatalytic results of P25 mixed separately with CaCO3, BaSO4
and pigmentary TiO2 (experiments PP1 to PP3, respectively, cf. Table 3.1). The formers are
extenders typically used in paints while the latter is the most typical opacifier in the visible
light region of the electromagnetic spectrum used in paint industry. Among all, only BaSO4
does not enter in the reference paint formulation used herein. However, since it is a usual
paint component, it was decided to use it for comparing with CaCO3 in terms of the film
photoactivity. NO steady state conversion on films containing CaCO3 and BaSO4 are similar,
ca. 55 %. The mass fraction of P25 in these films was 25 % (cf. Table 3.1), thus it possibly
explains the smaller NO conversion when compared to the one obtained with the PP0 film
(pure P25 – XNO = 80 %). Films made with CaCO3 and BaSO4 (PP1 and PP2) also show a
similar NO conversion history (Figure 3.5). The lower NO steady state conversion obtained
with PP3 (ca. 40 %) should be due to the competitive light absorption between pigmentary
TiO2 and P25, as discussed before. From these results one can conclude that CaCO3 and
BaSO4 are not bottlenecks in terms of lower photocatalytic oxidation rates obtained with
reference paint film obtained in chapter 2. On the other hand, pigmentary TiO2 must play an
important role.
Time / h
0 100 200 300 400 500
%
0
20
40
60
80
100 XNO - PP3
S - PP3XNO - PP4
S - PP4XNO - PP5
S - PP5
Figure 3.6 – Conversion (full symbols) and selectivity (empty symbols) history for experiments PP3,
PP4 and PP5.

74
Figure 3.6 presents the NO conversion and selectivity on films PP4 and PP5 (conversion and
selectivity obtained on film PP3 are reprinted for convenience). Film PP4 contains all powder
components used in the formulation of the reference paint; basically, 66 wt.% of pigmentary
TiO2 present in PP3 have been replaced by extenders and powder thickener (cf. Table 3.1).
The lower pigmentary TiO2 concentration on PP4 should result in less competitive absorption
of UV light and then on higher NO conversion compared to PP3. PP5 has the same
composition as PP4 but the powder components were mixed in an aqueous suspension
followed by sonication, drying, powdering and application over the aluminum slab, following
the same procedure as for PP4. Despite the similarities between the two experiments, it was
observed a significant decrease in the steady state NO conversion (from ca. 55 % to ca. 35
%). Such fact highlights the interference of paint production procedure on the photoactivity of
the final product; in fact, film PP5 shows a stronger impair effect on light absorption by P25,
as discussed on chapter 3.3.1 (Figure 3.2). It is worth noting the increase on the transient
period observed for experiments on films PP1 to PP5 compared to film PP0, revealing an
interference of the powder components; ionic chromatography did not reveal the presence of
dissolved anions or cations on the water used for PP5 film production.
3.3.3 Photoactivity of pseudo-paint (PsP) films
Figures 3.7 - 3.10 show the NO conversion and selectivity histories on pseudo-paint films
PsP6-PsP10 and on RP11. The organic paint components were added step by step (cf. Table
3.1) and the photoactivity of the corresponding pseudo-paint films evaluated. First of all, a
slurry was made with all powder components.

75
Time / h
0 50 100 150 200 250 300
%
0
20
40
60
80
100
XNO - PsP6
S - PsP6XNO - PsP7
S - PsP7XNO - PsP8
S - PsP8
Figure 3.7 – Conversion (full symbols) and selectivity (empty symbols) history of experiments PsP6,
PsP7 and PsP8.
Time / h
0 50 100 150 200 250
%
0
20
40
60
80
100
XNO - PsP9
S - PsP9XNO - PsP9 (repeat, same batch)
S - PsP9 (repeat, same batch)
Figure 3.8 – Conversion (full symbols) and selectivity (empty symbols) history of experiment PsP9,
employing fresh and 6 months in-can pseudo-paint.
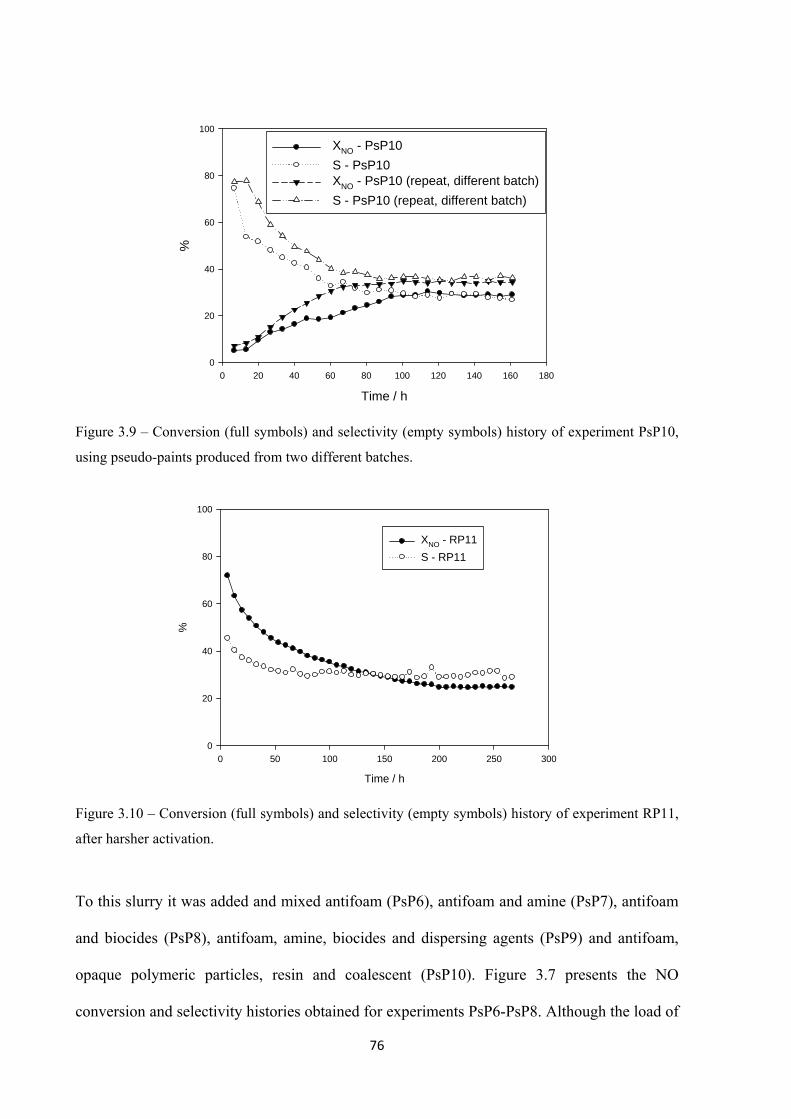
76
Time / h
0 20 40 60 80 100 120 140 160 180
%
0
20
40
60
80
100
XNO - PsP10
S - PsP10XNO - PsP10 (repeat, different batch)
S - PsP10 (repeat, different batch)
Figure 3.9 – Conversion (full symbols) and selectivity (empty symbols) history of experiment PsP10,
using pseudo-paints produced from two different batches.
Time / h
0 50 100 150 200 250 300
%
0
20
40
60
80
100
XNO - RP11
S - RP11
Figure 3.10 – Conversion (full symbols) and selectivity (empty symbols) history of experiment RP11,
after harsher activation.
To this slurry it was added and mixed antifoam (PsP6), antifoam and amine (PsP7), antifoam
and biocides (PsP8), antifoam, amine, biocides and dispersing agents (PsP9) and antifoam,
opaque polymeric particles, resin and coalescent (PsP10). Figure 3.7 presents the NO
conversion and selectivity histories obtained for experiments PsP6-PsP8. Although the load of

77
P25 is higher for the case of PsP8, the initial NO conversion is lower than for PsP6 and PsP7.
This might arise from the stronger detrimental influence of the biocides on the photoactivity
but also from the presence of a greater amount of organic vs. powder components. In fact, the
initial NO conversion decreases with the amount of organic components in the formulation
(cf. Table 3.1).
However, steady state conversion and selectivity values are nearly the same for these
experiments and also for experiment PP5 (Figures 3.6 and 3.7), ca. 30 %, which may indicate
that the surface of P25 is free of these organics (and products of reaction) at this stage.
PsP6 was performed in order to compare the influence of the antifoam in the transient
behavior in comparison to antifoam + amine (PsP7) and antifoam + biocides (PsP8), being
therefore a reference for both tests. Figure 3.7 evidences that PsP6 shows a similar transient
behavior as PsP7, indicating a major effect of the antifoam compared to the amine one, the
former one present in smaller concentration (Table 3.1). Comparing PsP6 with PsP8, one can
refer the greater impairment by the biocides during the transient period. However, the higher
amount of biocides can be here playing an important role.
Similar tests performed with fresh PsP9 exhibited a low initial NO conversion, Figure 3.8.
Comparing with experiments PsP6 to PsP8 (Figure 3.7), it becomes apparent that again such
fact should arise from the higher organic content and namely from dispersing agents (see
Table 3.1). However, the steady state conversion is again ca. 30 %. Experiment PsP9 was
repeated with the pseudo-paint after its rest in-can for about 6 months (Figure 3.8), producing
close steady state results. This indicates also the good stability of the formulation.
Steady state conversion and selectivity obtained with PsP10 films were also ca. 30 % (Figure
3.9), which is in line with the results obtained for PP5 to PsP9. For PsP10, the initial
conversion was the lowest of all experiments and, as referred above, such fact should arise
from the highest content in organic components (cf. Table 3.1 and Figures 3.7 – 3.9).

78
Repeatability assessment made to different films from different batches of PsP10 produce
similar results, especially at the steady state (Figure 3.9).
In line with this, the reference paint (which has the maximum content of organic components,
Table 3.1) does not show any photoactivity after the normal activation protocol. The ratio of
the pigment volume concentration (PVC) to the critical PVC [13] is 2.1 for PsP9 and 1.2 for
PsP10 and RP11. Consequently, there is a larger porosity and lower coverage of P25 by
organic components in PsP9 film (therefore higher initial activity) compared to PsP10 and
RP11. Compared to PsP10, RP11 contains more only the organic additives that account only
for ca. 2.5 wt.%. However, PsP10 showed initial photoactivity while RP11 did not; it was
necessary a harsher activation procedure (see section 3.2.2) to make it photoactive, Figure
3.10. Consequently, the lowest initial photoactivity of RP11 points out to a synergetic hiding
effect of the paint components towards the photocatalyst obtained after all components being
present. After the harsher activation protocol the steady state NO conversion obtained is
similar to the one obtained for all PsP films, ca. 30 % (Figure 3.10).
3.4 Conclusions
Photocatalytic powder pressed and pseudo-paint films were produced and tested towards NO
abatement. Paint components (powder and organic compounds) were progressively added,
giving rise to more complex films that ended with the reference photocatalytic paint. The
photoactivity of each film was assessed and the interference of each paint component in P25
photoactivity evaluated.
The load of P25 photocatalyst explains only partially the different photoactivity of the films
produced, as the composition of the film itself influences the larger or shorter penetration
depth of light through the film and therefore the real active load (photoactivated photocatalyst
mass vs. total mass of photocatalyst). When CaCO3 was mixed with P25 alone (25 wt.% of

79
P25), it was observed an improvement of selectivity towards more oxidized species (nitrate
and nitrite). On the other hand, the film containing pigmentary TiO2 has shown the worst
photoactivity of all, which is due to the competitive absorption of photons in the UV region.
The production of a slurry of distilled water with the powder components deeply interfered
with the photoactivity of P25.
Although the amount of organic paint components (films PsP6 to RP11) plays a major role on
initial NO conversion, steady state photoactivity is mostly independent of this amount,
tending to the same NO conversion of ca. 30 %, whatever the species initially present
(dispersing agents, resin, antifoam, antifoam plus amine, etc). Such fact should be related to
the oxidation of organic species initially wrapping the photocatalytic TiO2 particles, which
after being oxidised allow the NO reaction to proceed freely.
The NO conversion and selectivity histories on films produced from different batches were
reproducible. The reference paint showed no photoactivity after being submitted to the normal
activation procedure and needed to be activated under hasher conditions to produce
conversion and selectivity values in line with experiments PsP6 to PsP10. It is suggested that
there should be a synergetic effect when all paint components are present in the formulation,
that wrap more closely the photocatalytic TiO2 particles leading to no initial photoactivity.
References
[1] European Commission, Attitudes of European Citizens Towards the Environment, Special
Eurobarometer 295/Wave 68.2 – TNS Opinion & Social, March 2008 (available at:
http://ec.europa.eu/public_opinion/archives/ebs/ebs_295_en.pdf accessed February 2011).
[2] Agência Portuguesa do Ambiente – online database on air quality (www.qualar.org ,
accessed on February 2011).
[3] Riga-Karandinos, A., Saitanis, C., Chemosphere 2005, 59, 1125.

80
[4] Devahasdin, S. Fan Jr., C., Li, K., Chen, D. H., J. Photoch. Photobio. A 2003, 156, 161.
[5] Herrmann, J.-M., Top. Catal. 2005, 34, 49.
[6] Italcementi Group Press Release, Urban photocatalysis comes to city roads and facades
with Italcementi, (available at: http://www.italcementigroup.com/NR/rdonlyres/2062CB8F-
6FAB-4C3B-86EB-28AE17D68913/0/Comunicato_TXActive_UK.pdf - accessed on
February 2011).
[7] Guerrini, G.L., Peccati, E., White Cement and Photocatalysis – Part 1: Fundamentals,
International RILEM Symposium on Photocatalysis, Environment and Construction
Materials, 8-9 October 2007, Florence, Italy, 179-186.
[8] Paint company Sto – website for photocatalytic product Climasan (www.stoclimasan.com
- accessed February 2011).
[9] Maggos, Th., Plassais, A., Bartzis, J. G., Vasilakos, Ch., Moussiopoulos, N. Bonafous, L.,
Environ. Monit. Assess. 2008, 136, 35.
[10] Fujishima, A., Hashimoto, K., Watanabe, T., TiO2 Photocatalysis – Fundamentals and
Applications, BKC, Inc., Tokyo, 1999.
[11] Bygott, C.E., Maltby, J.E., Stratton, J.L., McIntyre, R., Photocatalytic Coatings for the
Construction Industry, International RILEM Symposium on Photocatalysis, Environment and
Construction Materials 8-9 October 2007, Florence, Italy, 251–258.
[12] Águia, C., Xamena, F.X.L., Dominguez, E., García, H., Madeira L. M., Mendes, A.,
Photocatalytic Paint Production for the Abatement of Nitrogen Oxides, 10th International
Chemical and Biological Engineering Conference, 4-6 September 2008, Braga, Portugal, 117-
118 (CD: pp. 277-282).
[13] Koleske, J. V., Paint and Coating Testing Manual, 14th edition of the Gardner-Sward
Handbook, Philadelphia, 1995.

‐ 81 ‐
Chapter 4 Influence of Paint Components on P25 Photoactivity – Wet effect and paint matrix degradation3
Abstract
The present chapter studies the interference of paint components on the photoactivity of P25
photocatalyst towards NO abatement. Paint components are divided in two major groups:
powder inorganic components and organic components. Two types of films were then
prepared, powder pressed films and films made of pseudo-paints, and their photoactivity
assessed following approximately standard ISO 22197-1:2007(E). Powder pressed films were
obtained by mixing stepwise powder components of the base paint; pseudo-paint films
involved mixing stepwise the powder components with families of organic components
present in the original photocatalytic paint formulation.
Concerning powder pressed films, it was concluded that the morphology of the film
influences the photoactivity while CaCO3 and silicates, which are extenders, have a smaller
impact on P25 photoactivity compared to pigmentary TiO2, even when water is involved in
the production procedure.
Pseudo-paint films containing the same proportion of powder components as powder pressed
films displayed different transient behaviors but similar steady state photoactivities, regardless
the presence of organic components such as the binder. This was assigned to the photoerosion
of a significant fraction of the organic paint components during the transient period.
Therefore, after reaching steady state, NO photooxidation could proceed freely as if only
3Águia, C., Ângelo, J., Madeira, L., Mendes, A., Polymer Degradation and Stability
(10.1016/j.polymdegradstab.2011.01.032).

‐ 82 ‐
inorganic paint components were present. An average of ca. 25 wt.% of organic phase erosion
was observed and more severe erosion should occur closer to the top of the paint film.

‐ 83 ‐
4.1 Introduction
NOx emissions and corresponding atmospheric concentration have been legislated all over the
world due to environmental and health effects of these contaminants. Tropospheric NOx
contribute for water eutrophication, promotion of ozone and particulate matter formation, with
consequent development of urban smog and increase number of lung diseases. In fact, NOx
are one of the anthropogenic contaminants present in atmosphere with greatest impact on
aerosol and particulate matter formation [1, 2]. Legislation regarding NOx emissions and
atmospheric concentration are leading to technological improvements; however, recent
surveys in urban areas showed that NOx concentrations are still above the legislated limits [3-
5]. Therefore, efforts for continuous reduction on NOx emissions and greater atmospheric
abatement are expected in the next years.
Photocatalytic TiO2 has been increasingly studied and used for NOx photoabatement [6-9]. At
atmospheric conditions (low partial pressure of NOx, low temperature and presence of water
and oxygen) the reaction mechanism of NOx photoabatement follows the oxidation path.
Photooxidation of hazardous compounds occurs over the photocatalytic TiO2 surface or in the
neighboring of the particle [10]. At atmosphere conditions, the photocatalysis of NOx
produces mostly nitrate ions that can be easily washed out from the photocatalyst surface [11].
Photocatalytic oxidation using photocatalytic TiO2 presents some advantages compared to
other processes for the abatement of atmospheric contaminants, such as [12-15]: - the reaction
is rather fast at atmospheric pressure and room temperature; - it deals with the low
atmospheric pollutants concentration; - a wide spectrum of organic contaminants can be
completely oxidized towards non-toxic products; - no additional chemical reactants are
required; - it makes use of a relative low cost material; - it can use solar energy as activation
source; - it shows high chemical and physical stability; and – it allows the formation of

‐ 84 ‐
thermodynamically disfavored products, overcoming large activation barriers in a short period
of time.
Photocatalytic TiO2 can be immobilized in different construction materials for the
photoabatement of atmospheric NOx. For example, approximately 50 000 m2 of urban
surfaces are estimated to be already covered with photocatalytic construction materials in
Japan [16]. Kaneko and Okura [13] reported a windowed photocatalytic highway wall panels
(0.6 m x 1.0 m) tested in Tokyo, where photocatalytic surfaces were attached by adhesive tape
to the panels. A borosilicate glass window was used to cover the painted panels forming a gap
through which polluted air was pumped at 15 to 60 L·min-1. Daylight irradiance was ca. 1
W·m-2 at noon and an average of 113 000 vehicles crossed the 6-lane roadside per day. An
average NOx removal of 31 % to 69 % was observed, which corresponded to a rate of ca. 3
mmol·m-2·d-1 based on the amount of nitrate washed from the panels [13]. On the other hand,
Marley Eternit [17], a roofing solutions company based in the UK, developed a photocatalytic
roof tile - the EcoLogic. This company estimates that an average-sized roof made of EcoLogic
tiles can remove during its lifetime an equivalent amount of NOx to that emitted by a modern
car travelling 160 000 km and it claims that the photocatalytic activity should last for 25 years
[17].
From all possible construction materials, paint coatings have several advantages when used
for immobilizing photocatalytic TiO2, since almost all surfaces in urban areas can be painted.
Moreover, paints have the exact thickness for being opaque and then to produce
photocatalysis taking full advantage of the solar radiation. Bygott et al. [18] conducted a field
test in a children playground in London. 300 m2 of surrounding walls were painted with a
silicate-based paint loaded with 7.5 wt.% of photocatalytic TiO2. A daily abatement of ca. 4.5
g of NOx is reported from about 10 000 m3 of air around the school playground.

‐ 85 ‐
Photocatalytic paints must keep their properties along time in terms of photoactivity and
mechanical stability. However, few studies concerning the aging of photocatalytic paints or
the formulation influence on photocatalytic activity are available. Allen et al. [9] studied the
effect of adding CaCO3 to a polysiloxane paint incorporating photocatalytic TiO2. This
extender is reported to have the capacity to react with the nitric acid formed in the NOx
photooxidation process, cleaning the surface of the photocatalyst. These authors concluded
that a higher content in CaCO3 resulted in a higher NOx removal. They attributed this effect
to the higher porosity of the paint films, which allows an efficient mass transport towards the
photocatalyst surface. On the other hand, these authors concluded that increasing the
concentration of CaCO3 and photocatalytic TiO2 results in an increase of paint self-
degradation rate.
In the previous chapter (and [19]) the authors reported the strong impairment of pigmentary
TiO2 on the photoactivity of P25 in powder pressed films. Such impairment was attributed to
the competitive photonic absorption between the two types of TiO2 (photocatalytic TiO2 and
pigmentary TiO2). It was also concluded that the photoactivity of powder pressed films
depends whether the mixture was obtained via dry or wet mode. The present study aims to
further address these issues and to study the effect of the paint components on the
photoactivity of P25-based films on NO abatement. Special attention is given to the aging of
the photocatalytic films tested.
4.2 Experimental
4.2.1 Photocatalytic films
An exterior water-based matt paint with a pigment volume concentration (PVC) higher than
the critical value (CPVC) [20] was used as starting paint. From the original formulation, half
of the pigmentary TiO2 (9 wt.% in wet base) was removed; this paint is hereafter referred as

‐ 86 ‐
base paint (BP). The photocatalytic paint was subsequently formulated adding 9 wt.% (wet
base) of photo- TiO2 P25 (Evonik) to the BP; this paint is hereafter referred as reference paint
(RP).
The BP is formulated with inorganic (in powder form) and organic components (mostly
dispersions). The powder components are pigmentary TiO2 and extenders, which include
CaCO3 and silicates. Organic components are the binder, dispersing agents, the coalescent,
thickeners, additives (anti-foam, pH-stabilizer and biocides), and the polymer extender slurry.
Table 4.1 gives briefly BP and RP formulations.
Procedures used to prepare the photocatalytic coatings are sketched in Figure 4.1.
Powder mixtures used in the powder pressed films were obtained by dry mixture and wet
mixture, whether water was or not involved in mixing the powder components, respectively.
Wet mixed powder pressed films and dry mixed powder pressed films are denoted wPP# and
PP#, respectively. Pseudo-paint films, incorporating all powder as well as some organic
dispersion components, were applied using a draw down bar and are denoted PsP# (pseudo-
paint films, meaning that are formulated with fewer components than the reference paint); RP
and BP films were also applied using this technique.
The powder mixtures of PP films (Runs PP0 - PP4, Table 4.2) were prepared by hand-shaking
the relevant powder components together with P25 for ca. 5 minutes, followed by powder
pouring over an aluminum slab and further compression at 5 bar for 7 min (see also Figure
4.1), originating an effective area of 10 x 5 cm2 and a film thickness of ca. 0.05 cm.
On the other hand, powder mixtures of wPP films (runs wPP0 – wPP4, Table 4.2) were
obtained by dispersing the relevant powders in distillate water, mixing mechanically for 30
min and applying ultra-sounds 5 times for 1 min with 1 min of dwell (Hielscher UIP1000hd,
at 90 % of amplitude - 1.8 x 10⁷ W•m-3) – cf. Figure 4.1.

‐ 87 ‐
Powder pressed route Draw down bar route
Film application(powder pressed @ 5 bar on aluminium slabs for 7 min)
Powder mixing(by hand-shaking for 5 min)
Wet milling(sonication 5 x 1min)
Dry(1 day @ lab conditions plus 1
day @ 50 ºC)
Dry manual milling
Wet mixture(slurry - 300 rpm for 30 min)
Film application(Draw down bar and dry for 1 day at lab conditions)
Stabilisation(5 days @ lab conditions)
Wet mixture(slurry - 300 rpm for 30 min)
Dry procedure Wet procedure Wet procedure
Powder pressed (PP) films
Wetted powder pressed (wPP) films
Pseudo-paint (PsP), base paint (BP) and reference paint (RP) films
Figure 4.1 – Schematic representation of the production procedure of photocatalytic films prepared.
Table 4.1 –Base and reference paint formulations (wt.% are given for the specific case of reference
paint).
Component wt.%
Water 30
Extenders (CaCO3 and silicates) 18
Pigmentary TiO2 9
Polymer extender slurry 8
Binder slurry 20
Dispersing agents, coalescent, thickeners and other additives (in slurry)
6
Photo-TiO2 P25 9a a – not used in base paint.

‐ 88 ‐
Table 4.2 – Mass fraction (with two decimal places) of powder paint components and load of P25 for
films prepared via the powder pressed route.
Powder and wetted powder pressed films
Description
(functionality in paint)
Run PP0
Run wPP0
Run PP1a
Run wPP1
Run PP2
Run wPP2
Run PP3
Run wPP3
Run PP4
Run wPP4
Mas
s fr
acti
on in
film
(w
t.%
) P25 (photocatalyst)
100.0 25.44 25.44 25.44 25.26
Silicates (extenders)
----- 74.56 ----- ----- 47.78
CaCO3 (extender)
----- ----- 74.56 ----- 1.64
Pigmentary TiO2 (pigment)
----- ----- ----- 74.56 25.32
LoadP25
(mg·cm-2) 13.5 14.2 ----- 15.3 13.9 14.3 13.4 15.1 9.5 14.4
a – not performed due to lack of powder aggregation.
The powders were subsequently dried at lab conditions for one day and at 50 °C for one more
day, followed by hand milling the resulting powder mixture. The powder mixture was then let
to rest for 5 days at lab conditions. Subsequently, the application over aluminum slabs was
performed (effective area of 10 x 5 cm2 and ca. 0.05 cm thick) in the same way as mentioned
for PP films. Pseudo-paint (PsP1 and PsP2, Table 4.3), RP and BP films were applied coating
an effective area of 10 x 5 cm2 with a wet thickness of 200 µm. The influence of drying
period on the photoactivity was assessed and it was concluded that 1 day at lab conditions was
sufficient to obtain reproducible results.
The original mass proportions of each component in the PsP formulations are the same as in
the RP. However, since these films include fewer components, mass fraction and final load
(mass per film area) of photocatalytic TiO2 in the reactor varies from film-to-film (Table 4.3).
Moreover, the final concentration of each component in the dry paint film was computed

‐ 89 ‐
taking into account the evaporation of the water added to the mixture and the volatiles present
in the dispersions of each individual organic component used.
Table 4.3 – Mass fraction (with two decimal places) of all components in the paint films used in each
experiment, load of P25 and content of powders and organic components (dry basis).
Base paint
Pseudo-paint films Reference
paint
Description
(functionality in paint) Run BP
Run PsP1
Run PsP2
Run RP
Mas
s fr
acti
on in
dry
fil
m b
ase
(wt.
%)
Pow
der
s
P25 (photocatalyst) ----- 24.93 18.28 17.45
Silicates (extenders) 39.26 45.86 33.57 32.56
Pigmentary TiO2 (pigment) 21.03 24.60 18.01 17.45
CaCO3 (extender) 1.23 1.56 1.12 1.02
Thickener (additive) 0.70 0.82 0.60 0.58
Org
anic
s
Antifoam, biocide, and pH controllers (additives)
0.77 0.44 ----- 0.48
Dispersing agents (additives) 1.52 1.79 ----- 1.26
Opaque polymeric particles (extender pigment)
5.66 ----- 5.11 4.69
Coalescent (additive) 4.95 ----- 3.34 4.10
Resin (binder) 23.97 ----- 19.97 19.88
Thickener (additives) 0.91 ----- ----- 0.53
LoadP25 (mg·cm-2) 0.0 6.1 1.8 2.3 Powders (wt.%) 62.2 97.8 71.6 69.0 Organics (wt.%) 37.8 2.2 28.4 31.0
4.2.2 Photocatalytic tests
The performance was assessed based on the NO conversion (eq. 4.1):
XNO CNO
in CNOout
CNOin
100 (4.1)
and selectivity towards ionic species (eq. 4.2), i.e. nitrate and nitrite ions:

‐ 90 ‐
S 1CNO2
out
CNOin CNO
out
100 (4.2)
where CNO and CNO2 are the gas phase concentration of NO and NO2, respectively, and the
superscripts refer to the inlet and outlet streams of the photocatalytic reactor.
Figure 4.2 sketches the photocatalytic reactor used, which is described in detail in chapter 2
(and [19]). A 0.7 LN·min-1 flow rate of synthetic air containing 1 ppm of NO and 50 %
relative humidity (RH) at 25 ºC was fed to the reactor, irradiated with an average irradiance of
7 W·m-2 [21] (Vilbert Lourmat lamp system – UV BLB 365 nm). NO and NO2 were analyzed
on-line by chemiluminescence (Thermo Scientific 42C).
Figure 4.2 – Schematic representation of the photocatalytic reactor.
Prior to the photocatalytic tests all films produced were activated for 5 hours in the same
operating conditions used for photoactivity assessment but in the absence of NO (standard
activation). When required, a harsher activation protocol was used with a higher relative
humidity (90 % RH) and irradiance (30 W·m-2) and for a longer period (24 hours); this
activation protocol is hereafter referred as harsher activation. Steady state was considered to
be achieved when NO conversion and selectivity did not vary more than ±2.5 percentage
points for 5 hours.
‐ 91 ‐
4.2.3 Physicochemical characterization
Thermogravimetric (TG) analyses were carried out to assess the content of organic
components on dried fresh films of PsP#, BP and RP as well as after their exposition to UV
light for 24 hours and for 150 hours (UV aging); the above referred standard activation
conditions were used. The paint and pseudo-paint films were applied in contrast ratio charts
(Form 2A by Leneta). After activation, the films were easily removed from the support by
means of a bistoury and dried at 110 ºC for 2 h. TG analyses were then carried out in a
Netzsch TG 209 F1 Iris thermo gravimetric balance with ±10-5 g precision, using a platinum
crucible. A heating rate of 3 ºC·min-1 was used (from 20 ºC up to 900 ºC) under 30 mLN·min-1
of synthetic air.
UV/Vis diffuse reflectance (DR) spectra were obtained using a Perkin Elmer lambda 750
spectrophotometer, equipped with a 60 mm integrating sphere, using SpectralonTM as
standard.
High-resolution X-ray photoelectron spectroscopy (XPS) analyses were performed under high
vacuum in an ESCALAB 200A (Thermo VG Scientific) equipment with an aluminum anode
source (Eo = 15 kV – 300 W), energy step of 0.1 eV and 1000 ms dwell time.
The crystalline phases of pure P25 were obtained using a Bruker AXS D8 Discover x-ray
diffractometer equipped with a Göbel mirror with Cu K radiation in locked couple mode.
4.3 Results and discussion
4.3.1 Photoactivity of powder pressed (PP) films
Figure 4.3 plots the NO conversion and selectivity histories obtained for P25 powder pressed
films PP0 and wPP0. Steady state NO conversion and selectivity are higher for wPP0, the
powder pressed film prepared via wet mixture.

‐ 92 ‐
Figure 4.3 – NO conversion (full symbols) and selectivity (empty symbols) histories obtained with
powder films PP0 and wPP0.
Such improvement should be related to chemical or physical changes of either P25 or the
morphology of the photocatalytic film. Table 4.4 presents X-ray diffraction (XRD) patterns of
fresh P25 and P25 after wet mechanical mixture followed by sonication. It can be concluded
that the size and nature of P25 mostly did not change after the complete wet mixing
procedure. Results of XPS analyses made to these samples are shown in Figure 4.4 and Table
4.5 and indicate a change of 3 percentage points concerning the number of OH groups
bounded to the photocatalyst surface (which is within the technique uncertainty). Yu et al.
[22] reported significant photoactivity improvement of P25 after hydrothermal treatment but
these authors observed an increase of OH surface groups of 14 percentage points. The
morphology of the film should therefore play a significant role; simple density measurements
showed that wPP0 powder is ca. 5 times denser than fresh P25. Figure 4.5 plots the diffuse
reflectance spectra of PP0 and wPP0 films. A different behavior of the films towards
irradiation is observed, with a higher reflectance for the non-humidified one. Therefore,
differences obtained in the photoactivity of PP0 and wPP0 should be assigned to different

‐ 93 ‐
scattering behavior of the films instead of bandgap changes. Different scatter behavior can
modify the optical thickness of the film [23], and therefore the amount of UV-activated
photocatalyst (effective load). These results evidence the influence of the photocatalytic film
preparation protocol on the photoactivity, yielding a better steady state performance when wet
protocol is used, although with a longer transient period (Figure 4.3).
Table 4.4 – Crystalline phase fraction, density, particle diameter and crystallographic net parameters
of fresh P25 and P25 after mechanical mixture and sonication, obtained by XRD.
P25 Sample Crystalline
form
% phase (v/v)
Density (g·cm-3)
Particle diameter
(nm)
Lattice constant a
(Å)
Lattice constant b
(Å)
PP0
(fresh)
Anatase 88.5 3.896 25 3.7805 9.4942
Rutile 11.5 4.266 35 4.5893 2.9530
wPP0
(mixed & sonication)
Anatase 88.7 3.906 26 3.7821 9.4982
Rutile 11.3 4.266 39 4.5902 2.9556
Binding Energy / eV
522 524 526 528 530 532 534 536 538 540 542
Inte
nsity
/ a.
u.
P25 fresh (PP0)
P25 sonicated (wPP0)
Figure 4.4 - High-resolution XPS spectra at O1s region for powders of fresh P25 and P25 after
mechanical mixture and sonication.
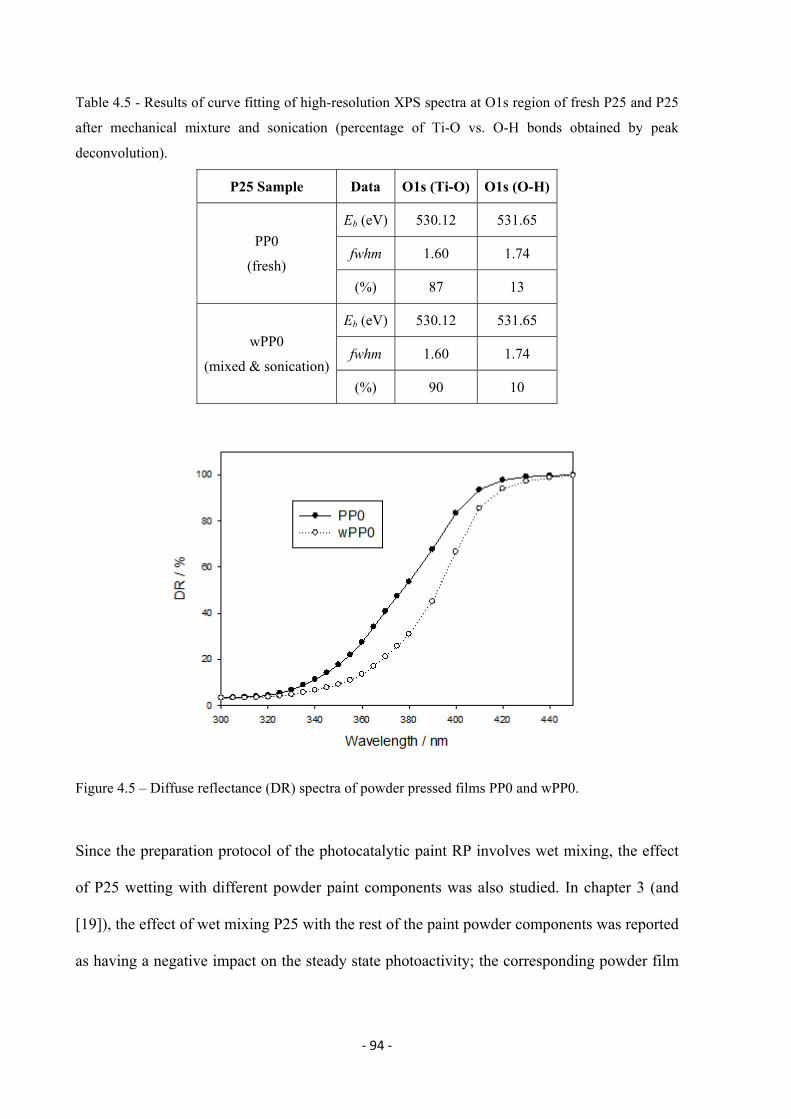
‐ 94 ‐
Table 4.5 - Results of curve fitting of high-resolution XPS spectra at O1s region of fresh P25 and P25
after mechanical mixture and sonication (percentage of Ti-O vs. O-H bonds obtained by peak
deconvolution).
P25 Sample Data O1s (Ti-O) O1s (O-H)
PP0
(fresh)
Eb (eV) 530.12 531.65
fwhm 1.60 1.74
(%) 87 13
wPP0
(mixed & sonication)
Eb (eV) 530.12 531.65
fwhm 1.60 1.74
(%) 90 10
Figure 4.5 – Diffuse reflectance (DR) spectra of powder pressed films PP0 and wPP0.
Since the preparation protocol of the photocatalytic paint RP involves wet mixing, the effect
of P25 wetting with different powder paint components was also studied. In chapter 3 (and
[19]), the effect of wet mixing P25 with the rest of the paint powder components was reported
as having a negative impact on the steady state photoactivity; the corresponding powder film

‐ 95 ‐
originated a NO conversion of about 40 % (in line with results of reference paint) whereas a
powder film obtained via dry mixture originated a NO conversion of ca. 60 %.
Time / h
0 20 40 60 80 100 120 140 160
%
0
20
40
60
80
100
XNO - wPP1S - wPP1
Time / h
0 100 200 300 400 500
%
0
20
40
60
80
100 XNO - PP2
S - PP2XNO - wPP2
S - wPP2
a) P25 mixed with silicates b) P25 mixed with CaCO3
Time / h
0 20 40 60 80 100 120
%
0
20
40
60
80
100
XNO - PP3
S - PP3XNO - wPP3
S - wPP3
Time / h
0 100 200 300 400 500
%
0
20
40
60
80
100
XNO - PP4
S - PP4XNO - wPP4
S - wPP4
c) P25 mixed with pigmentary TiO2 d) P25 mixed with silicates, CaCO3 and
pigmentary TiO2
Figure 4.6 - NO conversion (full symbols) and selectivity (empty symbols) histories obtained with PP#
(circles) and wPP# (triangles) films of P25 mixed with: a) silicates; b) CaCO3; c) pigmentary TiO2 and
d) all powder components (silicates, CaCO3 and pigmentary TiO2).
Figure 4.6 plots the NO conversion and selectivity histories for powder films PP2 to PP4
(sample PP1 did not form a stable powder film) and wPP1 to wPP4. It can be seen that
extenders do not impair the NO conversion as much as pigmentary TiO2 does. Figure 4.6a
plots the history of NO conversion and selectivity for film wPP1. This film exhibits a steady
state conversion of NO of ca. 70 % and selectivity of ca. 20 %, showing that the silicate
extenders do not impair significantly the NO photoconversion - cf. Figure 4.3 (one should

‐ 96 ‐
take into account that wPP1 film contains ca. 25 wt.% of photocatalytic TiO2 while wPP0
contains 100 % – Table 4.2). Similar conclusion can be drawn for extender CaCO3 (Figure
4.6b) where it was obtained a steady state NO conversion of ca. 55 % and 65 % for the dry
and wet mixed films, respectively. CaCO3 is often referred in literature as being involved in
the removal of nitrous and nitric acids (nitrate and nitrite ions) from the surface of
photocatalytic TiO2 during NOx photocatalytic oxidation, forming the corresponding calcium
salts [11, 18]. However, concerning wPP2, it was not observed a significant difference,
neither in terms of conversion nor in terms of selectivity, compared to the performance of
wPP1, which contains silicates instead of calcium carbonate. Finally, Figure 4.6c illustrates
the effect on the powder film photoactivity of the pigmentary TiO2, which seems to be the
main responsible among all powder components for impairing the photoactivity of P25; such
impairing effect is even higher when water is involved in the production procedure compared
to pure dry mixture as shown in chapter 3.
Figure 4.6b shows that the presence of CaCO3 makes the transient period up to steady state to
be very long, ca. 400 h, compared to that when using silicate extenders (Figure 4a) or just in
the presence of pigmentary TiO2 (Figure 4.6c). On the other hand, the steady state activity
when all powder components are present, including 1.64 wt.% of CaCO3, is achieved after ca.
100 h in the case of dry mixture and ca. 400 h in the case of wet mixture (Figure 4.6d).
Although no clear evidence was found for this observation, it is proposed that the
photocatalyst surface after contacting with calcium carbonate becomes modified in such a
way that it allows the slower accumulation of reaction products, making the conversion and
selectivity to decrease accordingly until the steady state. Finally, it is worth mentioning that
the wet mixture protocol led to powder films that in some cases exhibited better NO
conversions than the non-wet films (e.g. Figure 4.3) but in other cases the opposite behavior
was observed (e.g. Figure 4.6c). Such fact must be addressed in future studies.

‐ 97 ‐
4.3.2 Photoactivity of pseudo-paint (PsP) films
In the previous chapter (and [19]), the initial NO conversion of pseudo-paint films was
inversely related to the amount of organic components; however, the preparation protocol
may also affect the initial photoactivity [21]. Figure 4.7 shows the NO conversion and
selectivity histories for pseudo-paint films PsP1 and PsP2 and for the reference paint RP
(compositions shown in Table 4.3). It can be seen that after a transient period of ca. 150 hours
the NO conversion concerning films PsP2 and RP are similar and the NO conversion of PsP1
only slightly higher; selectivities of all films are similar. The base paint showed no
photoactivity because it has no P25 (only pigmentary TiO2).
The possible existence of parallel photocatalytic reactions involving oxidation of NOx and
organic components of the photocatalytic paint during the transient period was postulated in
the previous chapter (and [19]).
As mentioned before, standard activation was not sufficient to activate the RP film and a
harsher activation protocol had to be applied. The amount of the organic components
photooxidized after UV aging was computed from thermogravimetry (TG) data. The UV
aging was performed under the same operating conditions as for the standard activation,
during 24 hours or 150 hours (see section 4.2.3).

‐ 98 ‐
Figure 4.7 – NO conversion (top graph) and selectivity (bottom graph) histories on films PsP1, PsP2
and RP (the later with hasher activation).
Figure 4.8 presents the TG plots obtained for PsP#, RP and BP films. Although the samples
were previously dried, a slight mass loss was observed for temperatures below 100 ºC. It was
then used the mass at 120 ºC for normalizing the mass loss as a function of temperature (Δth).
The samples were heated up at a constant rate under an atmosphere of air with consequent
organic phase degradation and mass loss. Figure 4.8 compares the TG plots for the PsP1,
PsP2, BP and RP films. It may be concluded that samples containing photocatalytic TiO2
exhibit less mass loss, especially after 150 h of aging.

‐ 99 ‐
T / ºC
200 400 600 800 1000
Ma
ss /
a.u
96
97
98
99
100 PsP1 - 0hPsP1 - 24hPsP1 - 150h
h ~ 2.7 %
24h ~ 3.1 %
0h ~ 3.5 %
T / ºC
200 400 600 800 1000
Ma
ss /
a.u
.
60
70
80
90
100PsP2 - 0hPsP2 - 24hPsP2 - 150h
h ~ 20.7 %
24h ~ 27.6 %
h ~ 28.5 %
a) PsP1 films b) PsP2 films
T / ºC
200 400 600 800 1000
Ma
ss /
a.u
.
60
70
80
90
100 BP - 0hBP - 24hBP - 150h
h ~ 34.7 %
24h ~ 36.3 %
h ~35.7 %
T / ºC
200 400 600 800 1000
Mas
s / a
.u.
60
70
80
90
100 RP - 0hRP - 24hRP - 150h
h ~28.3 %
24h ~ 29.2 %
h ~20.8 %
c) BP films d) RP films Figure 4.8 – TG analysis of PsP1, PsP2, BP and RP films without (0 h) and with (24 h and 150 h) UV
aging (mass were calculated with base 100 at 120 ºC).
This means that during the UV aging stage a fraction of the organic phase was degraded and
the oxidation products vented out; Table 4.6 summarizes these results. The relative mass loss
due to the photodegradation occurred during the aging stage was computed as follows:
100dationPhotodegra
0
0
h
hthth (4.3)
where t refers to 24 h or 150 h of aging. The organic content of each paint film is given by
the TG mass loss at 900 °C ( h0 ), which are in close agreement with data in Table 4.3.

‐ 100 ‐
Table 4.6 – TG mass losses at 900 °C of fresh and aged samples for 24 h and 150 h and relative mass
loss due to photodegradation during UV aging.
Film Δ0h (%)
Δ24h (%)
Photodegradation24h (organic phase loss / wt.%)
Δ150h (%)
Photodegradation150h (organic phase loss / wt.%)
PsP1 3.5 3.1 -11.4 2.7 -23.2
PsP2 28.5 27.6 -3.1 20.7 -27.4
BP 35.7 36.3 1.9 34.7 -2.7
RP 28.3 29.2 3.4 20.8 -26.3
PsP2 film exhibits a lower photodegradation than PsP1 after 24 hours UV aging (3.1 %
compared to 11.4 %, respectively). This is consistent with the smaller initial photoactivity
shown by PsP2, 6.5 % of NO conversion, compared to 18 % for PsP1 film, respectively –
Figure 4.7. Indeed, PsP2 film contained originally a higher amount of organic phase (Table
4.3), responsible for hiding the photoactivity. The full photoactivity of samples such as PsP2
or RP is only revealed after degrading a significant amount of the organic phase. This
degraded organic phase should be initially wrapping photocatalytic TiO2 particles and
preventing them to photooxidize NO.
TG mass loss of BP and RP films after 24 hours of UV aging present a slight increase
compared to fresh films (Table 4.6 and Figures 4.8c and d), which might be related to the
precision error in TG analyses. Allen et al [9] observed a similar behavior for photocatalytic
siliconised polyester coatings aged in QUV weatherometer. These results are in good
agreement with the photo inactivity exhibited by the RP, even after 24 h of standard
activation. This result contrasts with the photoactivity exhibited by PsP2 film that has the
same composition as RP except for the dispersants (cf. Table 4.3). Indeed, the dispersants
should provide a better contact of the binder with the photocatalytic TiO2 particles, preventing
the photoactivity until a stronger activation protocol is applied – Figure 4.7. Alone, however,

‐ 101 ‐
i.e. without other organics, the dispersants do not provide this strong photoactivity barrier
since film PsP1 exhibited photoactivity right after being submitted to a standard activation
procedure – Figure 4.7.
After 150 h of UV aging, BP film shows a marginal photodegradation (Figure 4.8c and Table
4.6) since it has no P25. All photocatalytic films (PsP1, PsP2 and RP) after 150 h of aging
show ca. 25 wt.% of photodegradation of the organic phase (Figure 4.8c and Table 4.6). Such
photoerosion should occur to a larger extend close to the film surface; thus, their
photocatalytic performances towards NO abatement became quite similar after around 150 h –
Figure 4.7.
The steady state photoactivity achieved for wPP4 film, containing all powder components as
RP (XNO ~40 %; S ~30 % – Figure 4.6d), is comparable to the ones achieved for PsP1, PsP2
and RP films (XNO ~30 %; S ~30 % – Figure 4.7). Organic components show a small UV
light absorption, which is supported by a similar diffuse reflectance of wPP4 film compared
to RP film – Figure 4.9.
/ nm
300 320 340 360 380 400
DR
/ %
0
20
40
60
80
100
P25Pigmentary TiO2
wPP1RP
Figure 4.9 – Diffuse refectance (DR) spectra of P25, pigmentary TiO2, wPP1 and RP (star points -
lamp spectrum).

‐ 102 ‐
As stated above, pigmentary TiO2 is the greatest UV light absorber in a paint film. Since the
photoactivity is related to the amount of illuminated photocatalytic TiO2, the optically
activated photocatalyst among PsP1, PsP2 and RP films should be similar and they perform
accordingly after the transient period.
Figure 4.10a shows the differential thermogravimetric (DTG) curves of fresh samples of
PsP1, PsP2, BP and RP films. It is apparent a relationship between each DTG peak and a
family of organic compounds, which in principle should allow following their specific
photodegradation; from Figure 4.10b it is clearly visible the heterogeneous decrease on the
size of the peaks of UV aged samples. If the peaks are related to different organic species in
the paint matrix, UV aging does not uniformly degrade them. A preliminary study indicates
that the resin and the dispersing agents are the components that suffer more photodegradation.

‐ 103 ‐
T / ºC
0 200 400 600 800 1000
DT
G /
a.u
.
PsP1
PsP2
BP
RP
295 ºC310 ºC 435 ºC
565 ºC
630 ºC670 ºC
a) Fresh films
T / ºC
200 300 400 500 600 700
DT
G /
a.u
.
-0.5
-0.4
-0.3
-0.2
-0.1
0.0
RP - 0hRP - 24hRP - 150hRP - 0h and 24h
RP - 150h
RP - 0h, 24h and 150h
b) RP UV aged films for 0 h, 24 h and 150 h.
Figure 4.10 – DTG curves of (a) fresh samples of PsP1, PsP2, BP and RP films and (b) RP fresh and
aged films for 24 h and 150 h.
4.4 Conclusions
The influence of the components of exterior water-based vinyl paint on the photoactivity of
P25 was assessed. A special attention was given to the photodegradation of the organic phase
during UV aging. Several films containing powder components and powder and organic
components were prepared. The powder components are photocatalytic TiO2, pigmentary

‐ 104 ‐
TiO2 and extenders CaCO3 and silicates. The powder films were obtained via dry and wet
mixture protocols.
Concerning powder films obtained via dry mixture, it was observed that pigmentary TiO2
impairs significantly the NO conversion and selectivity while silicates and CaCO3 have a
smaller impact in the photoactivity. Such conclusion on impair effect are similar for dry or
wet production procedure, being however the impair effect of pigmentary TiO2 much higher
on the later one type of film.
The steady state of the CaCO3-containing films, obtained via wet mixture, is attained after a
correspondingly longer transient period of time, evidencing interference of the mixture
process and/or of the carbonate.
P25 alone showed a greater photoactivity after wet mixing while, when mixed with
pigmentary TiO2 revealed much lower steady state NO conversion.
TG analysis to fresh and UV aged films revealed the strong photodegradation of the organic
phase of the paint films prepared. After 150 h of UV aging, ca. 25 wt.% of the organic phase
disappeared via photocatalytic oxidation, being the top layer of the film the most photoeroded.
The degradation of the organic coating covering the photocatalytic TiO2 particles was related
to the transient photoactivity behavior of the PsP# and RP films. Moreover, it was concluded
that RP film needs a stronger activation protocol for starting photocatalysing NO because of a
synergetic effect between dispersants and binder coating photocatalytic TiO2 particles.
Wet mixed powder film wPP4, containing all powder paint components as RP film, originated
similar steady state photoactivity compared to RP. It was then concluded that the top layer of
the 150 h UV aged RP film contains a similar amount of illuminated photocatalytic TiO2 as
the wPP4 film.

‐ 105 ‐
References
[1] United States Environmental Protection Agency, How nitrogen oxides affect the way we
live and breathe, EPA-456/F-98-005, September 1998
(http://www.cleanairaction.org/pubs/pdfs/old_pubs/noxfldr.pdf - accessed February 2011).
[2] Leeuw, F.A.A.M., , Environ Sci Policy 2002; 5: 135–145.
[3] Agência Portuguesa do Ambiente, Online database on air quality (www.qualar.org,
accessed on February 2011).
[4] Riga-Karandinos, A., Saitanis, C., Chemosphere 2005, 59, 1125.
[5] European Environment Agency, NECD: Member State Country-Profiles, 2007 (available
at: http://www.eea.europa.eu/themes/air/nec-directive-member-state-country-profiles/nec-
directive-member-state-country-profiles - accessed February 2011).
[6] Lim, T.H., Jeong, S.M., Kim, S.D., Gyenis, J., J. Photochem. Photobiol. A: Chem. 2000,
134, 209.
[7] Hashimoto, K., Wasada, K., Osaki, M., Shono, E., Adachi K., Toukai N., Kominami H.,
Kera, Y., Appl. Catal. B: Environ. 2001, 30, 429.
[8] Matsuda, S., Hatano, H., Tsutsumi, A., Chem. Eng. J. 2001, 82, 183.
[9] Allen, N.S., Edge, M., Verran, J., Stratton, J., Maltby J., Bygott C., Polym Degrad Stab
2008 93 1632.
[10] Diebold, U., Surf. Sci. Rep. 2003, 4, 53.
[11] Devahasdin, S., Fan Jr., C., Li, K., Chen, D.H., J Photoch Photobio A 2003, 156, 161.
[12] Benedix, R., Dehn, F., Quaas, J., Orgass, M., Lacer 2000, 5, 157.
[13] Kaneko M. and Okura I., (eds.), Photocatalysis Science and Technology, Tokyo,
Kodansha Ltd., 2002.
[14] Herrmann, J.-M., Top. Catal. 2005, 34, 49.
[15] Braslavsky, S.E., Pure Appl. Chem. 2007, 79, 293.
‐ 106 ‐
[16] Osburn, L., Proceedings 5th Post Graduate Conference on Construction Industry
Development 2008, 16-18 March, Bloemfontein, South Africa.
[17] Marley Eternit, Ecologic Roof Tiles – Breathing Life Into the Environment (available at:
http://www.marleyeternit.co.uk/Roofing/Concrete-Tiles/EcoLogic-Ludlow-Major-
Interlocking-Tile.aspx, accessed February 2011).
[18] Bygott, C.E., Maltby, J.E., Stratton, J.L., McIntyre, R., Photocatalytic Coatings for the
Construction Industry, International RILEM Symposium on Photocatalysis, Environment and
Construction Materials 8-9 October 2007, Florence, Italy, 251–258 [19] Águia C., Ângelo J.,
Madeira L.M., Mendes A., Catal. Today 2010, 151, 77.
[20] Koleske, J. V., Paint and Coating Testing Manual, 14th edition of the Gardner-Sward
Handbook, Philadelphia, 1995.
[21] Águia C., Ângelo J., Madeira L.M., Mendes A., Photo-oxidation of NO using an Exterior
Paint – Screening of Various Commercial Titania, Journal of Environmental Management
(10.1016/j.jenvman.2011.02.010).
[22] – Yu, J, Yu, H, Cheng, B, Zhou, M, Zhao, X., J. of Mol. Catal. A. 2006, 253, 112.
[23] Murphy, A.B., J. Phys. D: Appl. Phys. 2006, 39, 3571.
‐ 107 ‐
Part IV – The Photocatalyst

‐ 108 ‐

‐ 109 ‐
Chapter 5 – Supported Photocatalytic TiO2 Produced by Ion Exchange4
Abstract
In the present chapter, the performance of commercially available photocatalyst P25 (based
on titanium dioxide), as well as synthesized new ones (TiO2 supported in porous solid
inorganic materials), is compared regarding photocatalytic oxidation of NO. Lower NO
conversion achieved with the supported photocatalytic TiO2 materials (TiO2 content about 1
wt.%, except for zeolite Y with two exchange steps) than with the commercial ones, suggest
the possible influence of intrinsic characteristics of the supported materials on the
photoactivity. A strong synergetic effect between zeolite Y and P25, in mechanical mixtures,
is observed; a film produced from mixture of P25 and zeolite Y, with only 15 wt.% in P25,
originated approximately the same values of NO conversion (55 %) and selectivity (35 %)
than a film with 100 wt.% of P25.
4 Águia, C., Xamena, F.X.L., Dominguez, E., García, H., Madeira, L. M., Mendes, A., 10th International
Chemical and Biological Engineering Conference, 4-6 September 2008, Braga, Portugal, 117 (CD: pp. 277-
282).
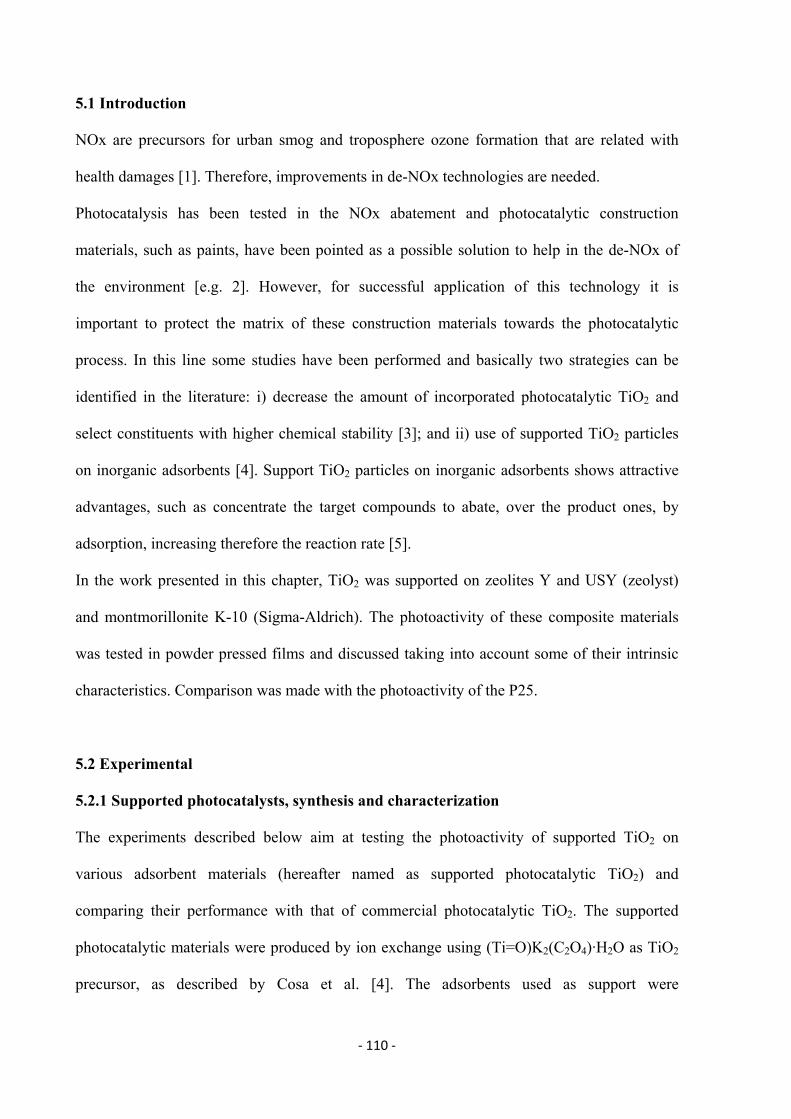
‐ 110 ‐
5.1 Introduction
NOx are precursors for urban smog and troposphere ozone formation that are related with
health damages [1]. Therefore, improvements in de-NOx technologies are needed.
Photocatalysis has been tested in the NOx abatement and photocatalytic construction
materials, such as paints, have been pointed as a possible solution to help in the de-NOx of
the environment [e.g. 2]. However, for successful application of this technology it is
important to protect the matrix of these construction materials towards the photocatalytic
process. In this line some studies have been performed and basically two strategies can be
identified in the literature: i) decrease the amount of incorporated photocatalytic TiO2 and
select constituents with higher chemical stability [3]; and ii) use of supported TiO2 particles
on inorganic adsorbents [4]. Support TiO2 particles on inorganic adsorbents shows attractive
advantages, such as concentrate the target compounds to abate, over the product ones, by
adsorption, increasing therefore the reaction rate [5].
In the work presented in this chapter, TiO2 was supported on zeolites Y and USY (zeolyst)
and montmorillonite K-10 (Sigma-Aldrich). The photoactivity of these composite materials
was tested in powder pressed films and discussed taking into account some of their intrinsic
characteristics. Comparison was made with the photoactivity of the P25.
5.2 Experimental
5.2.1 Supported photocatalysts, synthesis and characterization
The experiments described below aim at testing the photoactivity of supported TiO2 on
various adsorbent materials (hereafter named as supported photocatalytic TiO2) and
comparing their performance with that of commercial photocatalytic TiO2. The supported
photocatalytic materials were produced by ion exchange using (Ti=O)K2(C2O4)·H2O as TiO2
precursor, as described by Cosa et al. [4]. The adsorbents used as support were

‐ 111 ‐
montmorillonite k-10 (mK-10) from Sigma-Aldrich, Zeolites Y (CBV100) and USY
(CBV500) from Zeolyst. These materials were exchanged once or twice. The first exchange
was performed with a 0.2 M solution in Ti and the second with a 0.6 M solution. The
supported photocatalyic TiO2 obtained by one or two ion exchanges were denoted as
TiO2@support and (TiO2)2@support, respectively, with “support” being USY, Y or mk-10.
(P25+Y)_15 wt.% TiO2 refers to the material produced from the mechanical mixture of
zeolite Y and P25 TiO2 (15 wt.% in P25).
Elemental analysis was performed by induced coupled plasma (ICP) using a Varian 715-ES
instrument. The surface area and porosity of tha samples produced was studied by nitrogen
adsorption at 77 K using a Micromeritics ASAP 2010.
5.2.2 Photocatalytic films
Powder pressed films were tested in the setup described below and in greater detail in chapter
2. Powder pressed films were produced by pressing the powder to the base of the reactor,
made of amovible aluminum slabs, applying 5 bar for 7 min. Film size was 6 x 5 cm2.
5.2.3 Experimental setup and photocatalytic tests
The operating conditions and construction of the setup were inspired on standard ISO 22197-
1:2007(E). Basically it comprehends a thermostatic cabinet where the reactor and the feed
system are assembled. In the rectangular base of the reactor, made of amovible aluminum
slabs, is applied the photocatalytic film to be tested. A photoluminescent NO and NO2
analyzer (Thermo Scientific 42C) is used to monitor the concentration of these species. The
irradiance, relative humidity (RH), NO concentration at the inlet of the reactor (NOin) and
temperature were set to 7 W·m-2 (UV BLB lamp 365 nm – Vilbert Lourmat), 50 %, 1 ppm (in
AirK), and 25 ºC, respectively. Total gas flow rate used was 0.7 LN·min-1.
‐ 112 ‐
5.3 Results and discussion
Photocatalysis of NOx can proceed as reduction and/or as oxidation. However,
photoreduction is not probable to occur in the presence of water and oxygen. Also, it is not
referred the formation of N2O in similar systems [6]. NO photocatalytic oxidation should then
proceed to NO2 and then to NO2- or NO3
-. NO conversion (XNO) and selectivity towards NO2-
and NO3- were calculated using the following equations:
XNO CNO
in CNOout
CNOin
100 (5.1)
S 1CNO2
out
CNOin CNO
out
100 (5.2)
where CNO and CNO2 are the gas phase concentration of NO and NO2, respectively, and the
superscripts refer to the inlet and outlet streams of the photocatalytic reactor.
5.3.1 Physicochemical characterization
X-ray diffraction did not allow the identification of typical peaks of crystal structures of TiO2.
Such fact does not mean that a crystalline structure does not exist; actually, a photocatalytic
activity was detected, as shown later on. The analysis of the diffractogram of zeolite Y with
one and two exchanges (Figure 5.1) reveals complete loss of crystallinity, which must be a
consequence of a structure loss due to TiO2 incorporation.
Table 5.1 presents the weight fraction of Ti in each sample, and the BET surface area,
obtained by ICP and nitrogen adsorption isotherms performed at 77 K, respectively. Results
of (TiO2)2@Y show a very large amount of incorporated Ti, which can be one of the causes
for crystalinity loss of zeolite Y, shown in Figure 5.1. Such loss produces a strong decrease in
the BET surface area of zeolite Y from the first to the second ion exchange steps (Table 5.1

‐ 113 ‐
and Figure 5.1). A decrease was also noticed in the remain supported samples tested, however
much less pronounced than with zeolite Y.
2 / º
0 20 40 60
Inte
nsi
ty /
a.u
.
0
200
400
600
800
TiO2@Y
(TiO2)2@Y
P/P0
0.0 0.2 0.4 0.6 0.8 1.0
Qu
an
tity
ad
so
rbe
d /
cm
3N g
-1
0
50
100
150
200
TiO2@Y
(TiO2)2@Y
Figure 5.1 – X-ray diffraction patterns (top) and nitrogen adsorption isotherms performed at 77 K
(bottom) for the supported photocatalysts into zeolite Y.
Table 5.1 – Results of elemental analysis performed by ICP, and BET surface areas obtained by
nitrogen adsorption isotherms performed at 77 K.
Y
TiO
2@Y
(TiO
2)2@
Y
USY
(TiO
2)2@
US
Y
mK
-10
TiO
2@m
K-1
0
(TiO
2)2@
mK
-10
Ti (wt.%) 0.06 0.96 10.68 0.07 1.12 0.28 0.60 0.89
SBET (m2 g-1) 688 311 25 558 519 269 264 259

‐ 114 ‐
Diffuse reflectance was performed and has shown the light absorption characteristic of TiO2.
For zeolite Y, only after a second exchange step some activity is noticed (Figure 5.3), which
can be ascribed to the particle diameter increase, leading to a red-shift and absorption of
radiation in the wavelength range of the UV lamp used (Figure 5.2); TiO2@Y has a bandgap
of ca. 4.5 eV, which corresponds to ca. 275 nm. This wavelength is out of the range of the UV
lamp used (315 nm < <390 nm). On the other hand, (TiO2)2@Y has a bandgap close to the
one of anatase TiO2 - 3.2 eV, which might indicate that TiO2 particles are large enough. These
values match with the destroyed structure presented in Figure 5.1; increase of the particles
inside the pores of zeolite Y must led to the destruction zeolite structure.
h / eV
2 3 4 5 6
(F(R
)xh
)0.5 /
a.u
.
0
2
4
6
8
10
12
14 TiO2@Y
(TiO2)2@Y
(TiO2)2@USY
TiO2@mk-10
(TiO2)2@mk-10
Figure 5.2 – Transformed Kubelka–Munk function vs. energy of the excitation source.
5.3.2 Photocatalytic tests
Table 5.2 presents the mass of each photocatalytic material used. The masses of TiO2
employed in powder pressed films were obtained by direct weighting, in the case of

‐ 115 ‐
commercial photocatalysts, and were estimated, taking into account the amount of Ti
exchanged and perfect TiO2 molecular structure, in the case of the supported materials.
Figure 5.3 summarizes the NO conversions and selectivities (taken at steady state). From
Table 5.2 one can see that there is a relatively large variation in the photocatalytic masses
from experiment to experiment, due to the associated difficulties on its control. Figure 5.3
puts into evidence that commercial P25 provides, when used alone, NO conversions of ca. 50
%. It is thus worth noting that although the film area is the same as in the experiment where it
is mechanically mixed with zeolite Y - “(P25 + Y)_15 wt.% TiO2” (Table 5.2), the latter
exhibits a similar NO conversion (Figure 5.3), despite of the much lower photocatalyst
surface that is possibly exposed to radiation (as a consequence of a TiO2 concentration of only
15 wt.%). This indicates that the adsorbent is playing a significant role on the photoactivity,
an issue that needs however to be further investigated.
Regarding supported materials, it is possible to see that the increase in the number of ion
exchange cycles leads to better performances (Figure 5.3). This is related to TiO2 particles
size (thus decreasing the so-called quantum size effect – blue shift) [5], for the case of zeolite
Y, and Ti content for the case of mk-10 (Table 5.1); bandgap did not change from the first to
the second ion exchange in this support (see Figure 5.2).
In general, conversions reached with the supported materials are low. Even so, it must be
noticed the lower masses of TiO2 per surface area of film when compared with the powder
pressed films of commercial P25 (Table 5.2).

‐ 116 ‐
Table 5.2 – Photocatalytic materials and estimated TiO2’s mass in each experiment.
Powder pressed films
Run# Mass of powder pressed
(g)
Lphoto-TiO2
(mg cm-2)
Commercial TiO2 P25 0.44 14.8
(P25+Y)_15 wt.% TiO2 1.00 5.0
Supported photocatalytic TiO2
(TiO2)2@Y 1.60 9.7
TiO2@Y 1.61 1.0
(TiO2)2@USY 1.32 1.1
(TiO2)2@mK-10 1.23 0.8
TiO2@mK-10 1.78 0.7
Figure 5.3 – NO conversion and selectivity at steady state for all tested films of Table 5.2.
5.4 Conclusions
Mixtures of commercial P25 with zeolite Y showed the same performance of a film with only
P25, revealing the importance of the surroundings of the TiO2 photocatalyst in its activity.
The mass content of TiO2 in adsorbents and absence of blue-shift, seem to play an important
role on the photoactivity.

‐ 117 ‐
References
[1] US Environmental Protection Agency (1998). NOx: How nitrogen oxides affect the way
we live and breathe, Office of Air Quality Planning and Standards Research Triangle Park,
NC 27711.
[2] Strini, A., Cassese, S., Schiavi, L., Applied Catalysis B: Environmental 2005, 61, 90.
[3] Motohashi, K., Inukai, T., Self-cleaning performance evaluation of commercial
photocatalyst coting materials trough 5 years outdoor exposure, International RILEM
Symposium on Photocatalysis, Environment and Construction Materials 8-9 October 2007,
Florence, Italy, pp. 80 - 86.
[4] Cosa, G., Galletero, M., Fernández, L., Márquez, F., García, H., Scaiano, J., New J. Chem.
2002, 26, 1448.
[5] Corma, A., García, H., Chem. Commun. 2004, 1443.
[6] Devahasdin, S., Fan Jr., C., Li, K., Chen, D.H., J. Photochem. Photobiol. A 2003, 156,
161.

‐ 118 ‐

‐ 119 ‐
Chapter 6 Supported Photocatalytic TiO2 Produced by Impregnation5
Abstract
The present chapter studies photocatalytic TiO2 supported on zeolites, using an impregnation
technique, and their performance for NOx abatement. Zeolites Y (Zeolyst CBV100 and
CBV500), and (Zeolyst CP811 HB20), were impregnated with TiO2 to a concentration of
ca. 3.3 wt.%. The composite and pristine zeolites were characterized for internal volume and
surface area, NO adsorption isotherms, diffuse reflectance, SEM and X-ray diffraction. It was
concluded that TiO2 was mostly present on the external surface of the zeolite samples. The
photocatalytic activity of powder pressed films made of these samples and of photocatalyst
P25 (from Evonik) was assessed following approximately the standard ISO 22197-1:2007(E).
TiO2 supported on CBV100 originated the highest NO conversion (40 %), close to the one
obtained with P25 (50 %). TiO2 supported on CBV500 originated a NO conversion of 20 %,
while TiO2 on CP811 did not show any photoactivity. TiO2@CBV100 was incorporated in a
paint film, ca. 9 wt.% of composite catalyst (this means ca. 0.3 wt.% of TiO2), and its
photocatalytic activity assessed. It was obtained a steady state conversion of NO of ca. 2.5 %,
compared to 25 % conversion with a paint film incorporating 9 wt.% of P25; the specific
photocatalytic activity of TiO2 in both paint films was 0.16 µgNO·gTiO2-1·s-1 and 0.03
µgNO·gTiO2-1·s-1, for TiO2@CBV100 and P25 paint films, respectively.
5 C. Águia, Francesc X. Llabrés i Xamena, E. Dominguez, H. García, L. M. Madeira, A. Mendes – under
submission.

‐ 120 ‐
6.1 Introduction
Photocatalysis makes use of photonic energy and a catalyst (photocatalyst) to promote
chemical reactions [1]. The photonic energy is responsible for the excitation of valence
electrons into the conduction band, creating the so-called electron-hole pair. These carriers
move to the photocatalyst surface where they promote electrochemical reactions; the holes
promote oxidations while the excited electrons promote reductions. The electrochemical
potential of the band edges determine the possibility for a given reaction to occur while the
charge carrier diffusivity and recombination time constant determine the efficiency of the
photoelectrochemical process. An ideal photocatalyst should therefore exhibit the appropriate
bandgap (which is directly related to the fraction of light spectrum absorbed) and band edges
positions, have a larger recombination time constant compared to the diffusion time constant,
be stable and cheap.
Nanoparticulated TiO2 (photocatalytic TiO2; herein also called photo-TiO2) is the most used
semiconductor in photocatalysis [2]. Anatase, the commonly used crystalline form of titanium
dioxide, has a bandgap of 3.2 eV absorbing wavelengths shorter than ca. 387 nm. This
semiconductor is very stable and the reduction potential of the valence band (2.7 V NHE at
pH 7 [3]), when in contact with water molecules allows the production of highly oxidant
hydroxyl radicals that can be used to oxidize hazardous chemical species. In this way,
photocatalytic TiO2 is able to oxidize hazardous chemical species both in gas [4, 5] and liquid
phase [6, 7]. On the other hand, the reduction potential of the conduction band (-0.5 V NHE at
pH 7 [3]) originates, in presence of O2, the production of superoxide O2.-, which can react
with protons to produce hydrogen peroxide, also known as a powerful oxidation chemical
specie [8].
Concerning air quality, NOx abatement is of great importance since they originate
troposphere ozone and urban smog with consequent human health impacts [9]. Moreover,
‐ 121 ‐
despite recent and more restrictive regulation concerning maximum allowable NOx
concentrations in atmosphere, there are still many places in the world where these limits are
not respected, and namely in Lisbon [10].
Photocatalytic construction materials are being studied and developed to address the
atmospheric pollution. Photocatalytic TiO2 can be incorporated in concrete [11], roof tiles
[12], pavement blocks [13] and coatings [14, 15]. Among all, paint coatings are of interest
since a great fraction of surfaces is traditionally painted or can be painted. Moreover, paints
have the exact thickness for being opaque avoiding excessive use of photocatalysts.
Nevertheless, as shown by the authors ([16] and chapter 4), the matrix of the paint films is
eroded by the photocatalytic activity. Therefore, strategies must be implemented for paint
protection. A possible approach is supporting the photocatalytic TiO2 either occluded or
wrapped by a solid resistant to the photocatalytic activity. When photocatalytic TiO2 is grown
inside the pore structure, the support works like a sieve, avoiding the direct contact of the
paint matrix with photocatalytic TiO2, but permitting NOx, water and oxygen to diffuse
inside. It is also possible to make porous aggregates occluding the photocatalyst for obtaining
the same effect. On the other hand, reducing the amount of photocatalyst added can produce
an optimized balance between photoerosion of the paint and photoactivity. For reaching the
same photoacatalytic activity, a reduction of the photocatalyst amount is viable if it would be
possible to obtain a positive synergy between the photocatalytic TiO2 and the support;
Zeolites are being considered to support photocatalytic TiO2 since it was observed a
synergetic effect on the photoabatement of atmospheric NOx [17 - 22]. For instance, Ichiura
et al. [18] evidenced the synergetic effect between zeolites A and Y with photocatalytic TiO2,
simply mechanically mixed, towards NO photoabatement. This synergy was reported to be
related to the great adsorption ability of NO and NO2 on zeolites, increasing the reaction rate
and allowing a more complete oxidation of produced NO2 towards nitrate.

‐ 122 ‐
In this chapter, the impregnation method was used to immobilize photocatalytic TiO2 in two
commercial grades of zeolite Y and one zeolite. The performance of these composite
photocatalytic materials towards NO oxidation was assessed following approximately ISO
22197-1:2007(E) standard. Performance was tested using the pure composite materials and
inserted in paint. The results obtained indicate a significant synergy between the photocatalyst
and the zeolite supports.
6.2 Experimental
6.2.1 Supported photocatalyst synthesis
Mesopore zeolites Y CBV100 (sodium form), CBV500 (ammonium form) and CP811 -
HB20 from Zeolyst, were used for supporting photocatalytic TiO2. Zeolites (10 g) were
previously treated under vacuum at 550 ºC overnight, in order to remove water and other
adsorbed species. Zeolites were let to cool until room temperature under vacuum previously
to their prompt impregnation with a TiO2 precursor solution; 1.25 mL of titanium
isopropoxide (Sigma-Aldich) in ca. 6 g of propan-2-ol (Sigma-Aldrich) was used, where
propan-2-ol was employed to prevent prompt oxidation of titanium isopropoxide towards
titanium hydroxide. Materials were then heated overnight at 500 ºC for TiO2 formation. A
concentration of 2 wt.% of titanium element was therefore introduced in each zeolite sample.
Samples were denoted by “TiO2@support”, where “support” refers to CBV500, CBV100 and
CP811, accordingly.
6.2.2 Physicochemical characterization
Surface area and porosity of the samples were studied by nitrogen adsorption at 77 K using a
Micromeritics ASAP 2010 equipment. Scanning electron microscopy (SEM) analysis was
performed in ultra-high resolution field emission gun equipment (NOVA 200 Nano SEM).

‐ 123 ‐
Energy dispersive spectroscopy (EDS) was used for semi-quantitative chemical analysis using
an EDAX Si(Li) detector. X-ray analyses were performed on a Bruker AXS D8 Discover x-
ray diffractometer (XRD) equipped with a Göbel mirror with Cu K radiation in locked
couple mode. UV/Vis diffuse reflectance (DR) was performed in optically thick films of the
materials, in a Perkin Elmer 720 spectrometer equipped with a 60 mm integrating sphere,
using SpectralonTM as reference. Infrared (IR) spectra were recorded with a resolution of 4
cm-1 at 295 K using a Bomem MB-154S spectrometer (ca. 1.5 wt.% of sample mixed in KBr)
and samples compressed into thin disk-shaped pellets. The NO adsorption isotherms on the
photocatalytic composite materials were obtained at 25 °C using an in-house assembled
volumetric method [23]. Samples were previously evacuated at room temperature down to 2
mbar.
6.2.3 Photocatalytic tests
A schematic representation of the photocatalytic reactor used is given in Figure 6.1.
Photocatalytic films (6 cm length and 5 cm width) were applied over aluminum slabs; the
composite materials were tested in powder pressed films and the most photoactive of all was
also tested when inserted in paint film loaded with 9 wt.% (wet base). An exterior vinyl type,
water-based paint, with a pigment volume concentration (PVC) [24] above the critical value
(CPVC) was used for receiving the composite materials. The powder films were obtained
pouring the catalysts over the aluminum slab and pressing it up to 5 bar; the resulting films
were ca. 0.5 mm thick. The paint film was obtained pulling a draw-down bar with a gap of
200 µm over the aluminum slab. After drying, the paint film obtained was ca. 60 µm thick.
Both type of films were optically thick.
The aluminum slab was then inserted in the photoreactor which is described in greater detail
in chapter 2 and elsewhere [25]. Briefly, the reaction chamber has 5 cm width, 25 cm length
‐ 124 ‐
and 0.5 cm height. The top part of the reaction chamber is made of a borosilicate glass
window (Präzisions Glass & Optik GmbH) allowing UV light (Vilbert Lourmat - BLB 365
nm, 2 x 6 W), exterior to the chamber, to irradiate the photocatalytic film delivering an
average UV irradiance of 7 W·m-2. The relative humidity (RH), feed flow rate, NO
concentration and temperature used were 50 %, 0.7 LN·min-1, 1 ppm and 25 ºC, respectively.
Atmospheric pressure was used. NO and NO2 analyses were performed using a
chemiluminescence analyzer (Thermo Scientific 42C). The steady state was considered to be
achieved whenever NO conversion and selectivity did not vary more than 2.5 percentage
points for 5 h. NO conversion (eq. 6.1) and selectivity towards the formation of the ionic
species NO2- and NO3
- (eq. 6.2) were used for assessing the photoactivity performance of the
films:
XNO CNO
in CNOout
CNOin
100 (6.1)
S 1CNO2
out
CNOin CNO
out
100 (6.2)
where CNO and CNO2 stand for the concentration of NO and NO2, respectively, and the
superscripts (in and out) refer to the reactor’s inlet and outlet streams.
The ability of the photocatalytic films to adsorb NO was evaluated, prior to the begining of
the photocatalytic tests; with the UV light turned off, a negligible decrease in the exiting NO
concentration was observed for all composite photocatalysts, P25 and photocatalytic paints
produced, indicating no significant NO adsorption as compared to the photocatalytic activity.
No photoactivity was observed for either pure zeolites or paint films without photocatalytic
TiO2.

‐ 125 ‐
Figure 6.1 – Schematic representation of the photocatalytic reactor.
6.3 Results and discussion
6.3.1 Physicochemical characterization
The zeolite supports as well as the composite materials were characterized for BET surface
area, pore volume and average pore size. The results are shown in Table 6.1. The differences
in internal surface area, pore volume and average pore size of the materials with and without
TiO2 are not conclusive. This prevents any conclusion concerning the influence of TiO2
presence on zeolite properties.
Table 6.1 – Pristine and composite zeolite surface area (SBET), pore volume (Vp) and average pore
size (�P) of the prepared samples.
Only Support TiO2@support
Zeolite SBET
(m2·g-1)
Vp
(cm3·g-1)
�P
(Å)
SBET
(m2·g-1)
Vp
(cm3·g-1)
�P
(Å)
CP811 581.8 0.367 62.4 540.1 0.331 62.4
CBV100 688.4 0.027 33.8 665.7 0.033 37.2
CBV500 558.2 0.106 52.5 563.5 0.097 50.3

‐ 126 ‐
During the impregnation process TiO2-zeolite composite materials were treated at a maximum
of 550 °C. This high temperature may damage the crystalline structure of zeolites. XRD
analyses were therefore performed showing no crystalline defects in any of the zeolites
prepared (Figure 6.2). XRD analyses indicate no incorporation of TiO2 into the zeolite
matrixes; a small shift to higher diffraction angles observed in CBV100 and CBV500 samples
is noticed after TiO2 incorporation, which is reported to be related to a slight shrunken of the
zeolites structure [26]. Typical anatase and rutile peaks are not observed in Figure 6.2.
Independent works by Chatti et al. and Anandan and Yoon [27, 28] reported the same
behavior; indeed, XRD can hardly detect TiO2 if present in small concentrations like in the
present case.
SEM images and EDS results, Figures 6.3 – 6.5 and Table 6.2, respectively, show the
presence of titanium on the surface of the zeolite particles, indicating that probably most of
TiO2 did not crystallized inside the zeolite matrix. Figure 6.4b (concerning TiO2@CBV100)
and Figure 6.5b (concerning TiO2@CBV500), along with the corresponding EDS analyses,
show a non-homogeneous deposition of TiO2. Zeolite CP811 is organized in big
agglomerates, Figure 6.3.
Figure 6.6 shows diffuse reflectance (DR) spectra of the pure zeolites and composite samples.
For wavelengths smaller than ca. 390 nm it is noted a significant absorption of radiation for
composite samples in opposition to pure zeolites. This is a behavior typically displayed by
crystaline TiO2, evidencing its presence.

‐ 127 ‐
a) CP811
b) CBV100
c) CBV500
Figure 6.2 – XRD patterns of supports and respective composite materials (P25 used for reference).

‐ 128 ‐
a) CP811 zeolite b) TiO2@CP811
c) CP811 zeolite d) TiO2@CP811
e) Zoom in of image a) at Z1 f) Zoom in of image b) at Z1
Figure 6.3 – SEM images of CP811 (left side images) and TiO2@CP811 (right side images).

‐ 129 ‐
a) CBV100 zeolite b) TiO2@CBV100
c) CBV100 zeolite d) TiO2@CBV100
e) TLD detection mode of image c) f) TLD detection mode of image d)
Figure 6.4 – SEM images of CBV100 (left side images) and TiO2@CBV100 (right side images).
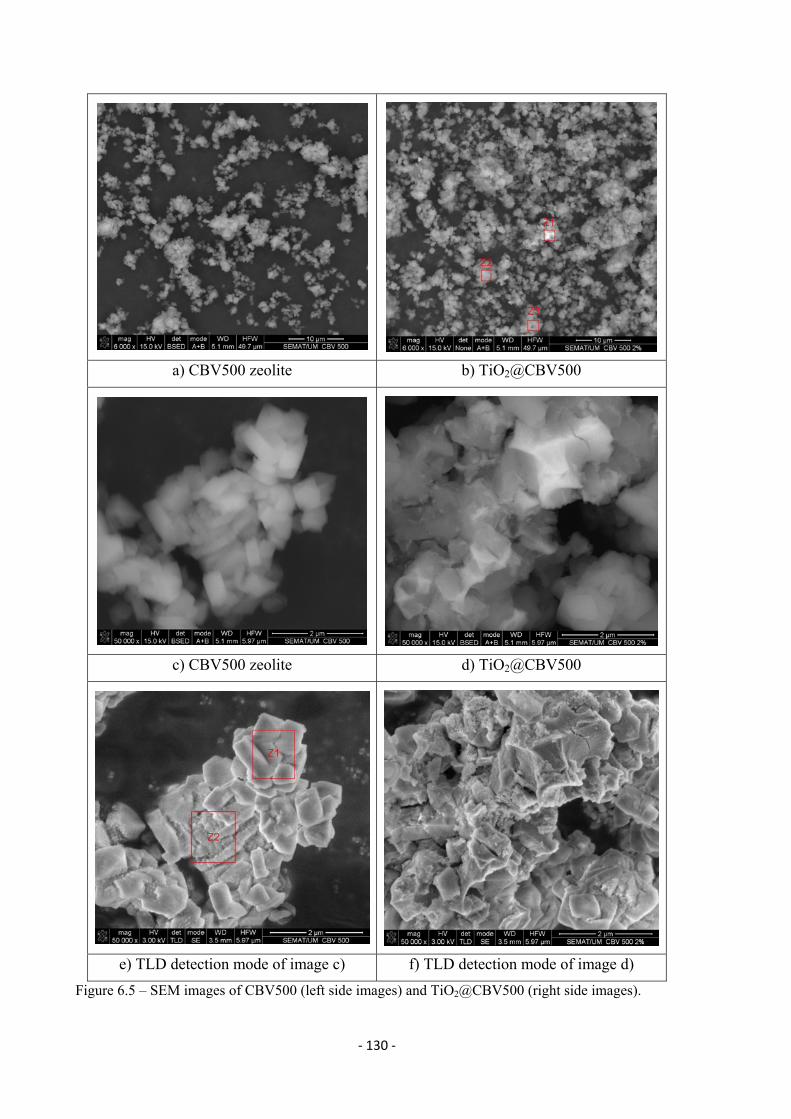
‐ 130 ‐
a) CBV500 zeolite b) TiO2@CBV500
c) CBV500 zeolite d) TiO2@CBV500
e) TLD detection mode of image c) f) TLD detection mode of image d)
Figure 6.5 – SEM images of CBV500 (left side images) and TiO2@CBV500 (right side images).

‐ 131 ‐
Table 6.2 – EDS analyses, corresponding to the zones indicated in Figures 6.3, 6.4 and 6.5.
Wt. %
CP811 TiO2@CP811 TiO2@CBV100 CBV500 TiO2@CBV500
Element Z1 Z1 Z1 Z2 Z1 Z2 Z1 Z2 Z3
O K 54.49 33.09 44.45 61.44 44.45 43.46 65.39 67.69 67.05
Si K 14.54 55.08 3.48 15.21 6.30 11.06 10.78 20.63 22.52
Al K 1.06 4.55 1.36 5.97 2.21 4.14 4.28 7.28 8.48
Ti K 0.00 7.28 8.21 0.00 0.00 0.00 15.37 0.00 0.00
/ nm
300 320 340 360 380 400 420 440
Diff
use
Re
flect
ance
/ %
0
20
40
60
80
100
120
140
160
CBV500CBV100CP811TiO2@CBV500
TiO2@CBV100
TiO2@CP811
P25
Figure 6.6 – Diffuse reflectance (DR) spectra of the zeolite in pure form and with TiO2.
Absorption on the UV region of the composite photocatalytic materials is generally lower
than for P25 (Figure 6.6), which should be related to the lower TiO2 content. TiO2@CBV500
has a high absorption towards the visible light spectrum. Infrared spectroscopy (Figure 6.7)
made to this material and to corresponding zeolite before TiO2 impregnation, show the

‐ 132 ‐
elimination of the peak centered at ca. 1400 cm-1. Peaks in the wavenumber range between
1400 cm-1 to 1600 cm-1 are usually related to nitrogen components adsorbed on the Bronsted
and Lewis sites of zeolite Y. Accordingly to the producer, CBV500 is a NH4+ exchanged
zeolite, and then these peaks should be related to the presence of this ion. After TiO2
impregnation in the CBV500 support, the composite material is calcinated and ammonium
should be released, justifying the nitrogen peak disappearance. However, during the high
temperature treatment ammonium evolution occurs, which can originate nitrogen doped TiO2
crystals, supporting the ability for the visible light absorption displayed.
Wavenumber / cm-1
1000150020002500300035004000
Tra
nsm
ittan
ce /
a.u
.
CBV500TiO2@CBV500
ca. 1400 cm-1
Figure 6.7 – Infrared results to CBV500 zeolite and respective photocatalytic material
TiO2@CBV500.
Near the absorption threshold of an indirect semiconductor, as it is the case of TiO2, a direct
relation exists between the energy of the exciting photon and the square-root of the product
between the Kubelka-Munk function and the energy [29]. Bandgap can be determined by
extrapolation of the linear part to the x-axis (Figure 6.8). These analyses show a quantization
effect for all photocatalytic materials prepared, being particularly important for

‐ 133 ‐
TiO2@CP811 (0.35 eV compared to photocatalytic TiO2 P25) – see Table 6.3.
h / eV
2.8 3.0 3.2 3.4 3.6 3.8 4.0
(F(R
) x
h)0
.5 /
a.u
.
TiO2@CBV500
TiO2@CBV100
TiO2@CP811
P25
Figure 6.8 – Transformed Kubelka–Munk function vs. energy of the excitation source.
Table 6.3 – Photocatalyst bandgap (ΔE), bandgap shift related to P25 and corresponding wavelength
for absorption threshold.
Material ΔE (eV) Bandgap shift (eV) (nm)
P25 3.20 - 387
TiO2@CBV100 3.25 0.05 380
TiO2@CBV500 3.35 0.15 370
TiO2@CP811 3.55 0.35 350
Korman et al. [30] prepared TiO2 particles with an average diameter of 2.4 nm and observed a
bandgap shift of 0.15 eV. This indicates that TiO2 crystals on TiO2@CBV500 should have a
similar size and on TiO2@CP811 TiO2 crystals should be even smaller.
Photoluminescence analyses indicated that TiO2 is agglomerated in all the composite material

‐ 134 ‐
with an octahedral coordination, as it can be usually found in bulk TiO2 samples [31];
differences on photoactivity can not be therefore related to tretrahedral vs. octahedral
arrangements of TiO2 particles, as shown by Anpo and co-workers [31].
6.3.2 Photocatalytic tests
Table 6.4 presents the mass of each photocatalytic sample used in each photocatalytic test.
TiO2 mass was estimated assuming that samples contain 2 wt.% of titanium (3.3 wt.% of
TiO2).
Table 6.4 – Mass of composite photocatalyst used and P25, corresponding photo-TiO2 mass and load
(photo-TiO2 mass normalized by the film area; 6 x 5 cm2).
Material Mass (g) Photo-TiO2 mass (g) LPhoto-TiO2 (mg·cm-2)
P25 0.444 0.444 14.8
TiO2@CP811 1.980 0.065 2.2
TiO2@CBV100 3.125 0.103 3.5
TiO2@CBV500 2.531 0.083 2.7
Powder films were made by pressing the photocatalytic materials for 5 min at 7 bar. This
application method justifies the mass differences between samples (Table 6.4).
TiO2@CP811 did not show photoactivity, which should be related to the large bandgap of
this photocatalyst, 3.55 eV (Table 6.3). The UV lamp used has a light spectrum between 315
nm to 390 nm. Table 6.5 shows the maximum fraction of this spectrum energy that can be
absorbed by the prepared photocatalysts. TiO2@CP811 can only absorb ca. 25 % of the UV
light, which is a very small amount of energy.

‐ 135 ‐
Table 6.5 – Fraction of UV light absorption of the lamp spectrum by each photocatalytic material.
Material UV light absorbed (%)
TiO2@CBV100 95
TiO2@CBV500 90
TiO2@CP811 25
Figure 6.9 shows the history of NO conversion and selectivity for P25 and composite
photocatalysts TiO2@CBV100 and TiO2@CBV500.
Time / h
0 20 40 60 80 100 120 140 160
XN
O /
%
0
20
40
60
80
100
TiO2@CBV500
TiO2@CBV100
P25
a) NO conversion
Time / h
0 20 40 60 80 100 120 140 160
S /
%
0
20
40
60
80
100
TiO2@CBV500
TiO2@CBV100
P25
b) Selectivity
Figure 6.9 – History of NO conversion (a) and selectivity (b) for P25, CBV500 and CBV100.

‐ 136 ‐
Despite the small TiO2 load, photocatalyst TiO2@CBV100 performed close to P25; at steady
state, the NO conversion was 40 % and 50 % and the selectivity 20 % and 40 %, respectively.
The initial NO conversion was even higher for this composite material than for P25.
The longer transient period shown for TiO2@CBV100 indicates that zeolite influences the
photocatalytic process. In fact, this transient period is longer than the one observed for all
pure powder pressed films of commercial photocatalytic TiO2 reported in chapter 2 and
elsewhere [25]. The greater NO adsorption capacity of TiO2@CBV100 compared to
TiO2@CBV500 must play a role in the photoactivity of these materials. The NO Henry
constant on TiO2@CBV100 is ca. two times larger than on TiO2@CBV500 - Figure 6.10.
P / bar
0.0 0.5 1.0 1.5 2.0
NO
ads
orbe
d / m
ol. kg
-1
0.00
0.05
0.10
0.15
0.20
0.25
TiO2@CBV100
TiO2@CBV500
Figure 6.10 – NO adsorption isotherm on composite photocatalysts TiO2@CBV100 and
TiO2@CBV500 at 25 °C.
Table 6.6 – Mass of composite photocatalyst and P25 in dry paint film, corresponding TiO2 mass and
load.
Material Mass (g) Photo-TiO2 mass (g) LPhoto-TiO2 (mg·cm-2)
P25 0.115 0.115 2.30
TiO2@CBV100 0.070 0.0023 0.077

‐ 137 ‐
The NO conversion and selectivity for TiO2@CBV100 (the best performing composite
sample) and P25 incorporated in a water-based paint is shown in Figure 6.11. The steady state
conversion is ca. 2.5 % and 25 %, respectively for TiO2@CBV100 and P25, while selectivity
is ca. 100 % and 25 %. High TiO2@CBV100 selectivity should be related to the ability of the
photocatalyst support to adsorb NO2. Paint film incorporating TiO2@CBV100 contained ca.
0.077 mg·cm-2 of TiO2 while the paint film incorporating P25 contained ca. 2.3 mg·cm-2 of
TiO2 (Table 6.6). The steady state specific NO photooxidation rate of paint films is 0.16
µgNO·gTiO2-1·s-1 and 0.03 µgNO·gTiO2
-1·s-1, respectively for TiO2@CBV100 and P25 containing
samples, putting into evidence the importance of the zeolite in the composite material when in
paint films. Moreover, no paint chalking was noticed on the TiO2@CBV100 based paint even
after harsher activation.
Figure 6.11 – NO conversion for photocatalytic paint containing 9 wt.% of P25 (open symbols) and 9
wt.% of TiO2@CBV100 (ca. 0.3 wt.% of TiO2).

‐ 138 ‐
6.4 Conclusions
In the present study ca. 3.3 wt.% of TiO2 was incorporated into three different zeolites,
CBV100, CBV500 and CP811. It was concluded that Ti containing particles was mostly
present on the external surface of the zeolites. The semiconducting nature of these particles
was confirmed by diffuse reflectance, which allowed estimating the bandgap of the composite
photocatalysts; it was observed a blue shift for all the composite samples here produced, but
much larger for the TiO2@CP811 that showed no photocatalytic activity.
NO photooxidation experiments with powder films of TiO2@CBV100, TiO2@CBV500 and
P25 demonstrated that supported photocatalysts have a high photoactivity; the steady state
NO conversion for these samples was respectively 40 %, 20 % and 50 %. The composite
photocatalysts exhibited a linear adsorption isotherm of NO at 25 °C and the Henry’s
coefficients are 0.10 and 0.044 for photocatalysts TiO2@CBV100 and TiO2@CBV500,
respectively, which might contribute for the better photoacatalytic abatement of NO of the
previous.
TiO2@CBV100 incorporated in an exterior water-based paint (9 wt.% of photocatalytic
material in wet base) exhibited a steady state NO conversion of ca. 2.5 %, reached after 1
hour of irradiation, compared to ca. 25 % for P25 after around 200 h. However, specific
activity was much higher in the TiO2@CBV100 sample.
References
[1] IUPAC Recommendations 2006, Pure Appl. Chem. 2007, 79 (3), 293.
[2] Robichaud, C., Uyar, A., Darby, M., Zucker, L., Wiesner, M., Environ. Sci. Techno. 2009,
43, 4227.
[3] Krol, R., Liang, Y., Schoonman, J., J. Mater. Chem. 2008, 18, 2311.
[4] Anpo, M., in: Tundo, P., Anastas, P., (Eds.), Green Chemistry, Oxford University Press,
‐ 139 ‐
2000, 1.
[5] Anpo, M., in: Corma, A., Melo, F.V., Mendioroz, S., Fierro, J.L.G., (Eds.), Proceedings of
the 12th International Congress on Catalysts, Granada, Studies in Surface Science and
Catalysis 2000, 130, 157.
[6] Ollis, D.F., AlEkabi, H., (Eds.), Photocatalytic Purification and Treatment of Water and
Air, Elsevier, Amsterdam, 1993.
[7] Pelizzetti, E., Schiavello, M., (Eds.), Photochemical Conversion and Storage of Solar
Energy, Kluwer Academic Publishers, Dordrecht, 1991.
[8] Devahasdin, S., Fan Jr., C., Li, K., Chen, D.H., J. Photochem. Photobiol. A 2003, 156,
161.
[9] United States Environmental Protection Agency, How nitrogen oxides affect the way we
live and breathe, EPA-456/F-98-005, September 1998 (available at:
http://www.cleanairaction.org/pubs/pdfs/old_pubs/noxfldr.pdf - accessed February 2011).
[10] Agência Portuguesa do Ambiente – online database on air quality (www.qualar.org,
accessed February 2011).
[11] Guerrini, G.L., Peccati, E., White Cement and Photocatalysis – Part 1: Fundamentals,
International RILEM Symposium on Photocatalysis, Environment and Construction
Materials, 8-9 October 2007, Florence, Italy, 179-186.
[12] Marley Eternit, Ecologic Roof Tiles – Breathing Life Into the Environment (available at:
http://www.marleyeternit.co.uk/Roofing/Concrete-Tiles/EcoLogic-Ludlow-Major-
Interlocking-Tile.aspx, accessed February 2011).
[13] Beeldens, A., Air purification by road materials: results of the test project in Antwerp,
International RILEM Symposium on Photocatalysis, Environment and Construction
Materials, 8-9 October 2007, Florence, Italy, 187 - 194.
[14] Bygott, C.E., Maltby, J.E., Stratton, J.L., McIntyre, R., Photocatalytic Coatings for the

‐ 140 ‐
Construction Industry, International RILEM Symposium on Photocatalysis, Environment and
Construction Materials 8-9 October 2007, Florence, Italy, 251–258.
[15] Paint company Sto – website for photocatalytic product Climasan
(www.stoclimasan.com - accessed February 2011).
[16] Águia, C., Ângelo, J., Madeira, L., Mendes, A., Polymer Degradation and Stability
(10.1016/j.polymdegradstab.2011.01.032).
[17] Zhang, S., Fujii, N., Nosaka, Y., Journal of Molecular Catalysis A: Chemical 1998, 129,
219,
[18] Ichiura, H., Kitaoka, T., Tanaka, H., Journal of Materials Science 2003, 38, 1611.
[19] Kaneko, M., Okura, I., (eds.), Photocatalysis Science and Technology, Tokyo, Kodansha
Ltd., 2002, 123.
[20] Anandan, S., Yoon, M., Journal of Photochem and Photobiol C: Photochem Reviews
2003, 4, 5.
[21] Yoon, M., Negi, D. P. S., Photoinduced electron transfer in some photosensitive
molecules-incorporated semiconductor/zeolites: New photocatalytic systems, Proc. Indian
Acad. Sci. (Chem. Sci.), Vol. 114, No. 6, December 2002, 593–602.
[22] Melanie, A., O’Neill, F., Cozens, L., Schepp, N. P., J. Phys. Chem. B 2001, 105, 12746.
[23] Santos, J. C., Magalhães, F. D., Mendes, A., Ind. Eng. Chem. Res., 2008, 47 (16), 6197.
[24] Koleske, J. V., Paint and Coating Testing Manual, 14th edition of the Gardner-Sward
Handbook, Philadelphia, 1995.
[25] Águia, C., Ângelo, J., Madeira, L., Mendes, A., Polymer Degradation and Stability
(10.1016/j.jenvman.2011.02.010).
[26] Iwamoto, M. Abe, T. Tachibana, Y., Journal of Molecular Catalysis A: Chemical 2000,
155, 143.
[27] Chatti, R., Rayalu, S., Dubey, N., Labhsetwar, N., Devotta, S., Solar Energy Materials &

‐ 141 ‐
Solar Cells 2007, 91, 180.
[28] Anandan, S., Yoon, M., J. Photochem and Photobiol. C: Photo Rev. 2003, 4, 5.
[29] Lin, H., Huang, C.P., Li, W., Ni, C., Shah, S., Tseng, Y., Applied Catalysis B:
Environmental 2006, 68, 1.
[30] Kormann, C., Bahnemann, D. W., Hoffmann, M. R., J. Phys. Chem. 1988, 92, 5196.
[31] Matsuoka, M., Anpo, M., Journal of Photochemistry and Photobiology C:
Photochemistry Reviews 2003, 3, 225.

‐ 142 ‐

‐ 143 ‐
Part V – Conclusions and future work

‐ 144 ‐

‐ 145 ‐
Chapter 7 Conclusions and future work
7.1 Main Conclusions
Ten commercial photocatalytic TiO2 samples were tested for NO abatement, under pure
powder pressed form and incorporated in a water-based high pigment volume concentration
paint (which originates high porosity dry films). Powder films were produced pressing the
photocatalytic TiO2 powder into a stable layer and paint films were obtained using a draw-
down bar; both films were optically thick and were applied over aluminum slabs. This
aluminum slabs were then inserted into a photoreactor for photoactivity assessment. No clear
relation was found between the photoactivity of the powder films and when incorporated in
the paint matrix; the highest yields over powder films were obtained with pristine VLP7000
(ca. 0.70), VLP7101 and UVLP7500 (ca. 0.55), while paint films based on PC500, UV100
and PC105 originated the best performances (yields of ca. 0.15). Such fact reveals that the
paint matrix influences the photocatalytic TiO2 photoactivity differently. Steady state was
attained in shorter period with powder pressed films that also showed reproducible
photoactivity, both during transient and steady state periods. On the other hand, paint films
transient photoactivity showed to depend on the activation protocol and production batch,
exhibiting however mostly the same steady state performance.
Further tests were therefore performed to better understand the role of the paint matrix and its
components on photocatalytic TiO2 activity; P25 was used in these runs. A paint was prepared
using inorganic, typically in the powder form, and organic paint components. Inorganic
components are pigments (pigmentary TiO2), extenders (such as CaCO3, silicates and BaSO4),
and the photocatalyst. Organic components comprehend the binder and additives: dispersing
agents, opaque polymeric particles and other minority additives. In this way, powder pressed
and pseudo-paint films (containing all powder and selected organic paint components) were
produced. Powder pressed films were prepared folowing two different mixing protocols, dry

‐ 146 ‐
and wet basis; P25 and powder paint components in dry form were mixed, shacking them in a
can for few minutes (dry protocol). The same components were mixed with deionised water
using a mechanical stirrer, dried overnight and milled (wet protocol). Pure P25 films were
also produced using the dry and wet protocol. It was noticed the greater NO conversion when
wet protocol was used in pure P25, which was seen to be related to a diferent film behavior
towards UV light. On the contrary, a lower NO conversion is obtained when wet protocol is
involved in film preparation of P25 mixed with powder paint components. Also, a significant
longer transient behavior was observed. Such fact is the prove that chemical and physical
interferences exist between P25 and powder paint components, which are more intense when
slury mixture is used, as in typical industrial paint production. CaCO3, BaSO4 and silicates are
reflective materials in the UV region and revealed no significant impairment onto P25
photoactivity. On the contrary, pigmentary TiO2 works as UV light absorber, contributing for
the greatest impairment to P25 photoactivity.
When all powder paint components are wet mixed with P25, the film revealed close steady
state behavior to the one found with the photocatalytic paint containing a similar
concentration of photocatalyst. Moreover, transient period is as longer as the one shown for
paint films. Such facts points to a low interference of organic components on P25
photoactivity, in paint film, at steady state. Paint and pseudo-paint (incorporating only part of
organic components) photocatalytic films revealed similar steady state NO photooxidation.
TG analysis made ot these films after 150 h UV aging showed similar photocatalytic
degradation of the organic components (25 wt.%). These results indicate that after the
photoerosion of organic paint components within the opticaly active layer of paint film, the
paint surface becomes performing as if it was a wet powder pressed film; long-term
photoactivity is ruled by powder components.

‐ 147 ‐
Reduction of photoerosion was intended supporting TiO2 on usual adsorbents. In this way,
protection could occur either by avoiding or at least reducing direct contact of TiO2 with the
paint matrix, namely the binder. Interaction of the support with the TiO2 particles is important
in order to create a synergetic effect. From all the materials tested, the one showing higher
photoactivity was TiO2 supported on zeolite Y CBV100, which contained ca. 3.3 wt.% TiO2.
It was concluded that TiO2 was mostly present on the external surface of the zeolites. The
presence of TiO2 on the zeolite samples was confirmed by diffuse radiance, which allowed
estimating the bandgap of the composite photocatalysts, revealing a value typical for anatase
(ca. 3.2 eV). The steady state NO conversion for the TiO2@CBV100 sample was 40 %, which
compares with 50 % obtained for pure P25, with a much higher TiO2 load. However,
incorporation of the composite material in an exterior water-based paint (9 wt.% of
photocatalytic material in wet base) exhibited a steady state NO conversion of only 2.5 %
(reached after 1 hour of irradiation), compared to ca. 25 % NO for P25. However, specific NO
photocatalytic conversion obtained were 0.16 µgNO·gTiO2-1·s-1 and 0.03 µgNO·gTiO2
-1·s-1, for
TiO2@CBV100 and P25 paint films, respectively, and no paint chalking was noticed on the
TiO2@CBV100 based paint even after harsher activation.
7.2 Future work
The UV lamp used showed heterogeneous irradiation over the illuminated surface due to
typical lamp hetergeneous irradiance with length. A more homogeneous illumination system
would originate more precise photoactivity analyses favouring future reaction kinetics
determination. An improved illumination system should then be designed and implemented in
future works. This may be accomplished reorienting the present lamps perpendicular to the
flow direction of the photoreactor.

‐ 148 ‐
The present work was based on NO photocatalytic oxidation towards NO2, nitrite and nitrate
acids. The reaction mechanism of NOx photocatalytic oxidation over pure photocatalytic TiO2
is quite well described in literature. On the other hand, the mechanism within a paint matrix
was not yet studied. Therefore, more studies must be performed in order to develop
knowledge regarding the influence (chemical and physical) of paint components and matrix
on the photocatalyst photoactivity photoactivity and reaction mechanism. Some authors claim
that photocatalytic paint may release VOCs and free-radicals while photooxidizing pollutants
such as NOx. This should be clarified since it is an important issue concerning the safety of
using photocatalytic paints. The paint matrix photodegradation is a tricky issue. On one hand,
it should occur for an efficient photoactivity of the paint but, on the other hand, it originates
the paint chalking that is not desirable if it originates the paint quick degradation. Deposition
of photocatalytic TiO2 on usual adsorbents is one promising methodology but the proposed
approaches still originate unsatisfying results for commercial application. Therefore, higher
amounts of TiO2 must be supported on the adsorbents in order to obtain a better balance
between photoactivity and paint degradation. Other approache would be to develop a suitable
binder, UV transparent, stable against photodegradation, highly permeable to reactants and
products and that allows the photoactivity over the catalyst surface. Silicone based polymers
exhibit promising results and should be addressed. Despite the very preliminary study
conducted concerning the poisoning of the photocatalytic paint films, this study must be
continued.
Regarding the photocatalysts, one must not neglect the possible (eco)toxicity of nanoscale
particles. Recent studies have been reporting nanomaterials (< 100 nm), and namely
nanoscale TiO2, as neurodegenerative, reactive oxidative species producers and protein
aggregation promoters, with consequent health impacts. Therefore, connection of
photocatalyst nanoparticles onto larger micron-sized support particles (or forcing irreversible

‐ 149 ‐
agglomeration of TiO2 nanoparticles), seems to be a safe and reasonable approach. For
example, it was patented recently the use of graphene platelets coated with small
nanoparticles of photocatalytic TiO2 [1]. The continuous study on the composite materials
here tested might allow to ignore such a problem in the future.
7.3 A possible roadmap
The work proposed would allow the development of knowledge in three main areas: reactor
design (engineering), photocataytic material and film (material science), and light-film
interaction (physics) (Figure 7.1). Such knowledge areas, working together, will allow the
development of new technological solutions for different markets in the future, namely for
highly demanding car coatings and flue gas treatment (Figure 7.2).
Possible applications for the abatement of other atmospheric pollutant gases should be
considered. For an appropriate selection, one must focus on: - last evolution on emission and
air concentration of particular gases; - state of the art of competitive technology and
respective bottleneck for abatement; - future gas concentration/emissions evolution due to
side-technological development; - physical local of presence (are people and nature
threatened? are paints possible to be applied?); - ability of photocatalysis to deal with the gas
concentration levels; - life-time of compound (related to impact factors). Targeted pollutants
are usually issued by organizations such as WHO, IPCC, EPA, EEA, UNEP, WMO, among
others, which are often related to further legislation development. Examples are persistent
organic pollutants, VOCs, freons, CFCs, greenhouse gases, among others.
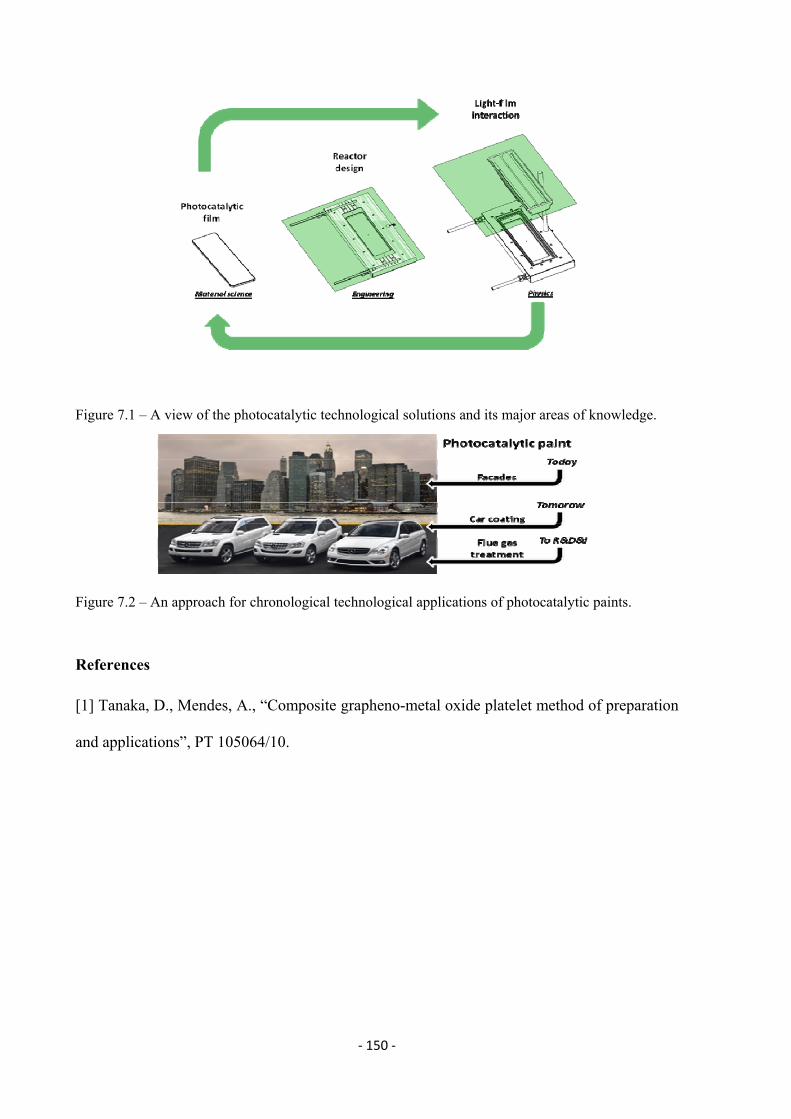
‐ 150 ‐
Figure 7.1 – A view of the photocatalytic technological solutions and its major areas of knowledge.
Figure 7.2 – An approach for chronological technological applications of photocatalytic paints.
References
[1] Tanaka, D., Mendes, A., “Composite grapheno-metal oxide platelet method of preparation
and applications”, PT 105064/10.

‐ 151 ‐
Appendix

‐ 152 ‐

‐ 153 ‐
Appendix A – Experimental setup – additional and brief overview
Two lab photoreactors were designed and builted by the author. A general overview of one of
them is shown in Figure A.1.
Figure A.1 – General overview of one of the lab photoreactors.
The feed system comprehends a cylinder containing 50 ppm of NO balanced with N2 (Linde)
and a drying air unit (Figure A.2). This last is made of a compressor (N145.1.2 AN.18, from
KNF), two particulate filters (AFM30-F03 and AFD30-F03, from SMC), a membrane air
dryier (IDG30L-F03-P, from SMC). The system is also made of a reservoir in order to obtain
a constant and pressurized air flow supply.
Dry treated air and NO streams are continuously mixed to produce the desired NO
concentrations for photocatalytic tests (1 ppm). To produce an air stream with the required
humidity, a fraction of dry air flows through an humidifier (saturated air) mixing afterwards
with the other fraction of dry air.

‐ 154 ‐
Figure A.2 – Detail of the thermostatic cabinet.
A detail of the thermostatic cabinet used for controlling the temperature, in the photoreactor,
gas flow meters and controllers and humidifier can be seen in Figure A.2. The photoreactor is
made of aluminum, with internal dimensions 0.05 m x 0.23 m x 0.005 m (width x length x
height) and is equipped with a borosilicate glass window (Präzisions Glas & Optik GmbH)
0.005 m thick. The borosilicate window has an overall light transmittance of more than 90 %
between 330 nm and 400 nm and no solarisation effect was observed. The gas entrance and
exit of the reactor is made via two mixing chambers that connect with the internal reaction
chamber through 5 holes with 1 mm diameter, allowing an homogeneous gas flow across the
reactor width. Two thermocouples were inserted at the entrance and exit of the internal
reaction chamber to better assess the temperature. Figure A.3 presents a photograph of the
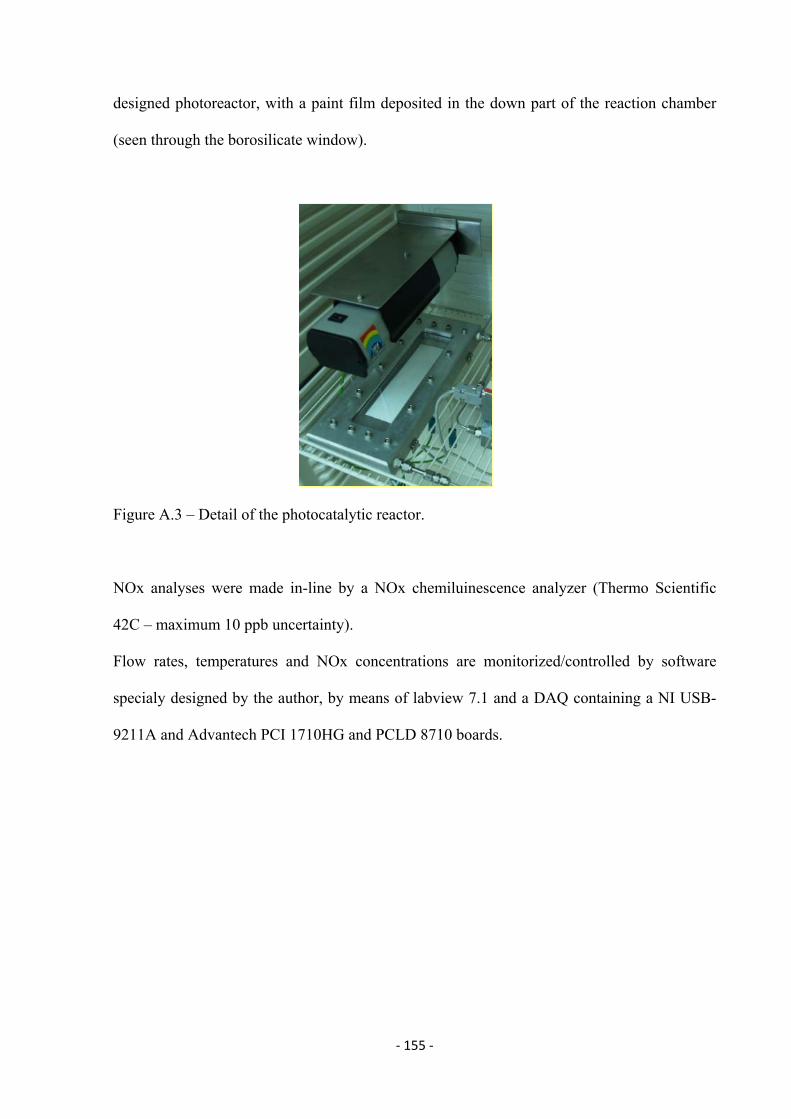
‐ 155 ‐
designed photoreactor, with a paint film deposited in the down part of the reaction chamber
(seen through the borosilicate window).
Figure A.3 – Detail of the photocatalytic reactor.
NOx analyses were made in-line by a NOx chemiluinescence analyzer (Thermo Scientific
42C – maximum 10 ppb uncertainty).
Flow rates, temperatures and NOx concentrations are monitorized/controlled by software
specialy designed by the author, by means of labview 7.1 and a DAQ containing a NI USB-
9211A and Advantech PCI 1710HG and PCLD 8710 boards.