Embed Size (px)
Citation preview
“Studies on Synthesis & Characterization of
Thermoplastic Polyurethane-urea
Copolymers”
A thesis submitted to the
UNIVERSITY OF PUNE
For the degree of
DOCTOR OF PHILOSOPHY
in
CHEMISTRY
by
Vipin P. Joshi
Complex Fluids & Polymer Engineering Group
Polymer Science & Engineering Division
National Chemical Laboratory
Pune - 411008
India
May 2009
Form ‘A’
Certified that the work incorporated in the thesis entitled ‘Studies on Synthesis &
Characterization of Thermoplastic Polyurethane-urea Copolymers’ submitted by
Vipin Joshi was carried out under my supervision. Such material as has been obtained
from other sources has been duly acknowledged in the thesis.
May, 2009 A.K. Lele NCL, Pune (Research Guide)
ACKNOWLEDGEMENT
First, I thank my advisor Dr. Ashish Lele, for his continuous support in the
Ph.D. program. He has been a very good mentor and a friend. He always showed
confidence in me when I doubted myself, and brought out the good ideas in me.
Without his encouragement and constant guidance, I could not have finished this
thesis. I have learned a lot on the professional as well as personal fronts while
working with him. A special thanks goes to Dr. Prakash Wadgaonkar for his help and advice in
carrying out synthesis part of this work. I would like to thank him for his
encouragement, cooperation and insightful comments. I thank my external thesis
committee member Dr. Anilkumar for reviewing this work and giving valuable
suggestions. The advice and help rendered by Dr. K. Guruswamy for the successful
completion of this work especially for small angle X-ray analysis is gratefully
acknowledged. I also wish to express my gratitude to Dr. Premnath who has helped in
developing a different view of the laboratory science.
I would like to thank the council of Scientific & Industrial Research, New
Delhi, for the award of Senior Research Fellowship. Thanks also go to the director,
deputy director, and head of the department for providing facilities which enabled me
to carry out my research in this prestigious institute.
I would like to acknowledge the debt I owe to following colleagues and
friends, particularly Balaji Iyer, Ashokdas Mahapatra, Arvind More, Sandeep
Kothawade, Mahesh Kulkarni, Jiten, Hemant, Santosh, Suresh, Ujwal, Aarti, Satish,
Smitha, Sony, Shailesh Nagarkar, Suhas Patil, Neelima Bulakh, Sangeeta Hambir,
Anuya, Naveen, Harish, Kamendra Sharma for their cooperation and support during
the work. I also like to thank all the CFPE group members for making this lab a
wonderful workplace. They have made my life at NCL comfortable and enjoyable. Special thanks also go to my parents Pradeep and Suman Joshi, in-laws
Yeshwant and Sanjeevani Dharmadhikari for their help and encouragement to pursue
this task. I thank my brother Abhijeet, sister Snehal, brother-in-law Mandar and
grandparents Madhav and Kamal Joshi for their support and faith in me. Finally, I
thank my wife, Shraddha, for her patience and forbearance during the course of this
work. Life would have been very difficult without her love and support.
I
Abstract
A typical thermoplastic polyurethane (PU) and its analogue polyurethane-urea
(PUU) are (AB)n type random block copolymers consisting of sequences of hard and
soft segments. The soft segment is generally composed of polyether or polyester diols,
while the hard segment is usually composed of the reaction products of diisocyanates
with a chain extender. Thermodynamic incompatibility between hard and soft
segments, and/or crystallinity in the hard segment drives them to phase separate. The
extent of microphase separation and the phase morphology have a profound effect on
the ultimate properties of the copolymer. Hence it is desirable to have a control on the
microphase separation in polyurethanes.
In the present work we have tested a new hypothesis for achieving control on
microphase separation namely, the use of defect structural moieties in hard segments.
The inspiration for this idea is derived from semicrystalline polymers in which the
role of defect moieties in controlling the size of crystalline structures is well known.
Thus the overall objective of the present work was to achieve control on the phase
morphology of PUUs via controlled introduction of defects in the hard segments. The
defect moieties that we have studied are diamines having long aliphatic chains, which
form short branches on the hard segments of Polyurethane.
Present study systematically investigates the role of the content and the length
of aliphatic chain defect in hard segment on the morphology and microphase mixing
in PUU copolymers. Morphology was characterized at molecular length scales
(FTIR), mesoscopic length scales (SAXS) and macroscopic length scales (DMA,
Rheology). Present study shows that aromatic chain extenders, when introduced in the
hard segments, acted as defect sites and frustrated hard segment association as
evidenced by FTIR, DSC, DMA, SAXS and rheological analysis. Phase mixing of
soft segments in hard segment domains and the average domain spacing was found to
be sensitive to both the content and the length of the chain defect in hard segment.
Thus, we have successfully shown that morphology of polyurethanes can be
controlled by introducing chain defects in the hard segments.
Table of Contents
Description Page No.
Abstract I
Glossary II
List of Schemes III
List of Tables III
List of Figures IV
Chapter 1 : Introduction and Literature Review
1.1 History and Development of Polyurethanes 1 1.2 Raw Materials 4
1.2.1 Isocyanates 4 1.2.2 Reactions of Isocyanates 8 1.2.3 Polyols 12 1.2.4 Chain Extenders 14
1.3 Synthesis of Segmented Polyurethane Elastomer 15 1.4 Morphology 17
1.4.1 Heterophase Morphology 17 1.4.2 Structure-Property Relationship 19
Soft Segments 19 Hard Segments 20 Hydrogen Bonding 23
1.5 Morphological Characterization 25 Molecular Size Scale 25 Mesoscopic Size Scale 27 Macroscopic Size Scale 28
1.6 Morphologies Reported in the Literature 30 1.7 Summary 31
Chapter 2 : Scope and Objectives Scope and Objectives of the work 39 Chapter 3 : Synthesis of Chain Extenders and Polyurethane-ureas 3.1 Chemicals and Methods Used 43
3.1.1 Solvents 43 3.1.2 Monomers and Oligomers 44
3.1.2.1 Isophorone diisocyanate 44 3.1.2.2 Polytetramethylene oxide 44 3.1.2.3 1,4-Butanediol 44 3.1.2.4 N-Dodecyl 3,5-diaminobenzoate 45 3.1.2.5 N-Docosyl 3,5-diaminobenzoate 45 3.1.2.6 Dibutyltin dilaurate 46
3.1.3 Analytical Methods 46 3.1.3.1 Proton Nuclear Magnetic Resonance 46 3.1.3.2 Fourier Transform Infrared Spectroscopy 46 3.1.3.3 Elemental Analysis 46
3.2 Synthesis and Characterization of Diamine Chain Extenders Containing Alkyl Branches 46
3.2.1 Esterification of 3,5-dinitrobenzoyl chloride 47 3.2.2 Characterization of n-alkyl 3,5-dinitro benzoates 49 3.2.3 Catalytic Reduction of n-alkyl 3,5-dinitro benzoates 53 3.2.4 Characterization of n-alkyl 3,5-diamino benzoates 54
3.3 Synthesis of Linear Polyurethane and Polyurethane-ureas 58 3.3.1 Synthesis of Linear Polyurethane Control 59 3.3.2 Synthesis of Linear Polyurethane-ureas 59
3.4 Synthesis of Branched Polyurethane-ureas Containing Diamine Chain Extenders 60
3.4.1 Synthesis of Polyurethane-ureas Containing C12 Branches 61
3.4.2 Synthesis of Polyurethane-ureas Containing C22 Branches 62
3.5 Synthesis of Model Hard Segment Polymers 63 3.6 Summary 65
Chapter 4 : Molecular Characterization of Polyurethane-ureas 4.1 Proton Nuclear Magnetic Resonance 66
4.1.1 L-PU and L-PUU Series 66 4.1.2 B12-PUU Series 69 4.1.3 B22-PUU Series 73
4.2 Fourier Transform Infrared Spectroscopy 77 4.2.1 L-PU and L-PUU Series 79 4.2.2 B12-PUU Series 82 4.2.3 B22-PUU Series 85
4.3 Gel Permeation Chromatography 88 4.4 Estimation of Diamine Content from 1H-NMR 90 4.5 Summary 95 Chapter 5 : Morphological Characterization of Polyurethane-ureas 5.1 Fourier Transform Infrared Spectroscopy 96
5.1.1 L-PUU Series 98 5.1.2 B12-PUU and B22-PUU Series 100
5.2 Differential Scanning Calorimetry 104 5.2.1 Model Hard Segments 106 5.2.2 L-PUU Series 108 5.2.3 B12-PUU Series 109 5.2.4 B22-PUU Series 112
5.3 Dynamic Mechanical Analysis 117 5.3.1 L-PUU Series 117 5.3.2 B12-PUU Series 121 5.3.3 B22-PUU Series 124
5.4 Couchman Analysis 129 5.5 Small Angle X-ray Scattering 130
5.5.1 Background Information – SAXS Experiment 131 5.5.2 Background Information – SAXS Theory 132 5.5.3 L-PUU Series 136 5.5.4 B12-PUU and B22-PUU Series 138 5.5.5 Electron Density Contrast 140 5.5.6 High Temperature Experiments 147
5.6 Rheology 150
5.6.1 Background: Rheology Basics 151 5.6.2 L-PU and B12-PUU Series 154
5.7 Tensile Testing 161 Chapter 6 : Conclusions and Future Work 6.1 Conclusions 167 6.2 Future Work 170
II
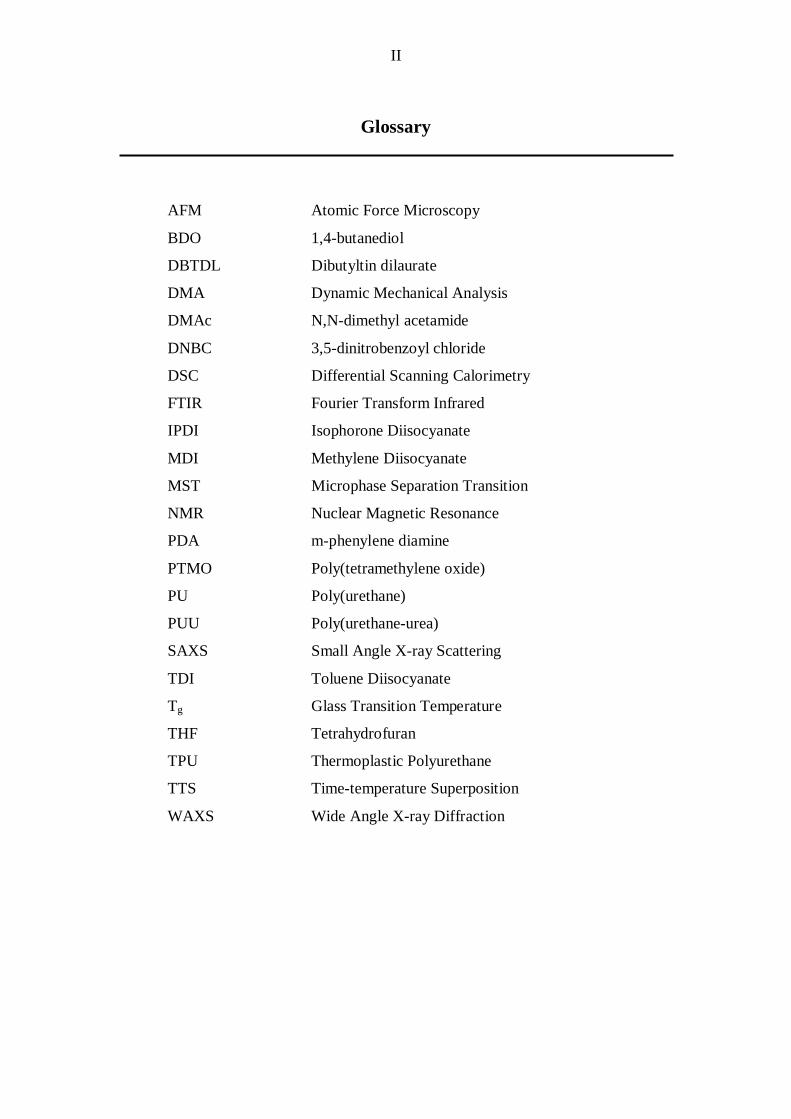
Glossary
AFM Atomic Force Microscopy
BDO 1,4-butanediol
DBTDL Dibutyltin dilaurate
DMA Dynamic Mechanical Analysis
DMAc N,N-dimethyl acetamide
DNBC 3,5-dinitrobenzoyl chloride
DSC Differential Scanning Calorimetry
FTIR Fourier Transform Infrared
IPDI Isophorone Diisocyanate
MDI Methylene Diisocyanate
MST Microphase Separation Transition
NMR Nuclear Magnetic Resonance
PDA m-phenylene diamine
PTMO Poly(tetramethylene oxide)
PU Poly(urethane)
PUU Poly(urethane-urea)
SAXS Small Angle X-ray Scattering
TDI Toluene Diisocyanate
Tg Glass Transition Temperature
THF Tetrahydrofuran
TPU Thermoplastic Polyurethane
TTS Time-temperature Superposition
WAXS Wide Angle X-ray Diffraction
III
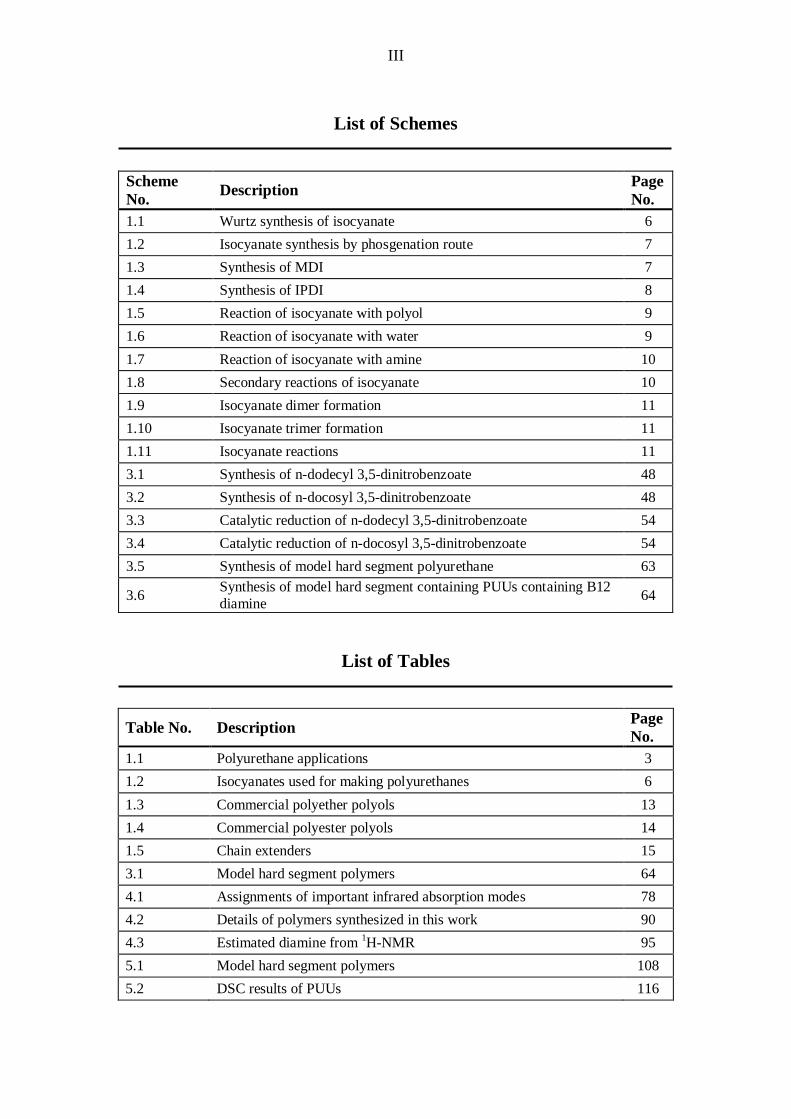
List of Schemes
Scheme No. Description Page
No. 1.1 Wurtz synthesis of isocyanate 6 1.2 Isocyanate synthesis by phosgenation route 7 1.3 Synthesis of MDI 7 1.4 Synthesis of IPDI 8 1.5 Reaction of isocyanate with polyol 9 1.6 Reaction of isocyanate with water 9 1.7 Reaction of isocyanate with amine 10 1.8 Secondary reactions of isocyanate 10 1.9 Isocyanate dimer formation 11 1.10 Isocyanate trimer formation 11 1.11 Isocyanate reactions 11 3.1 Synthesis of n-dodecyl 3,5-dinitrobenzoate 48 3.2 Synthesis of n-docosyl 3,5-dinitrobenzoate 48 3.3 Catalytic reduction of n-dodecyl 3,5-dinitrobenzoate 54 3.4 Catalytic reduction of n-docosyl 3,5-dinitrobenzoate 54 3.5 Synthesis of model hard segment polyurethane 63
3.6 Synthesis of model hard segment containing PUUs containing B12 diamine 64
List of Tables
Table No. Description Page No.
1.1 Polyurethane applications 3 1.2 Isocyanates used for making polyurethanes 6 1.3 Commercial polyether polyols 13 1.4 Commercial polyester polyols 14 1.5 Chain extenders 15 3.1 Model hard segment polymers 64 4.1 Assignments of important infrared absorption modes 78 4.2 Details of polymers synthesized in this work 90 4.3 Estimated diamine from 1H-NMR 95 5.1 Model hard segment polymers 108 5.2 DSC results of PUUs 116
IV
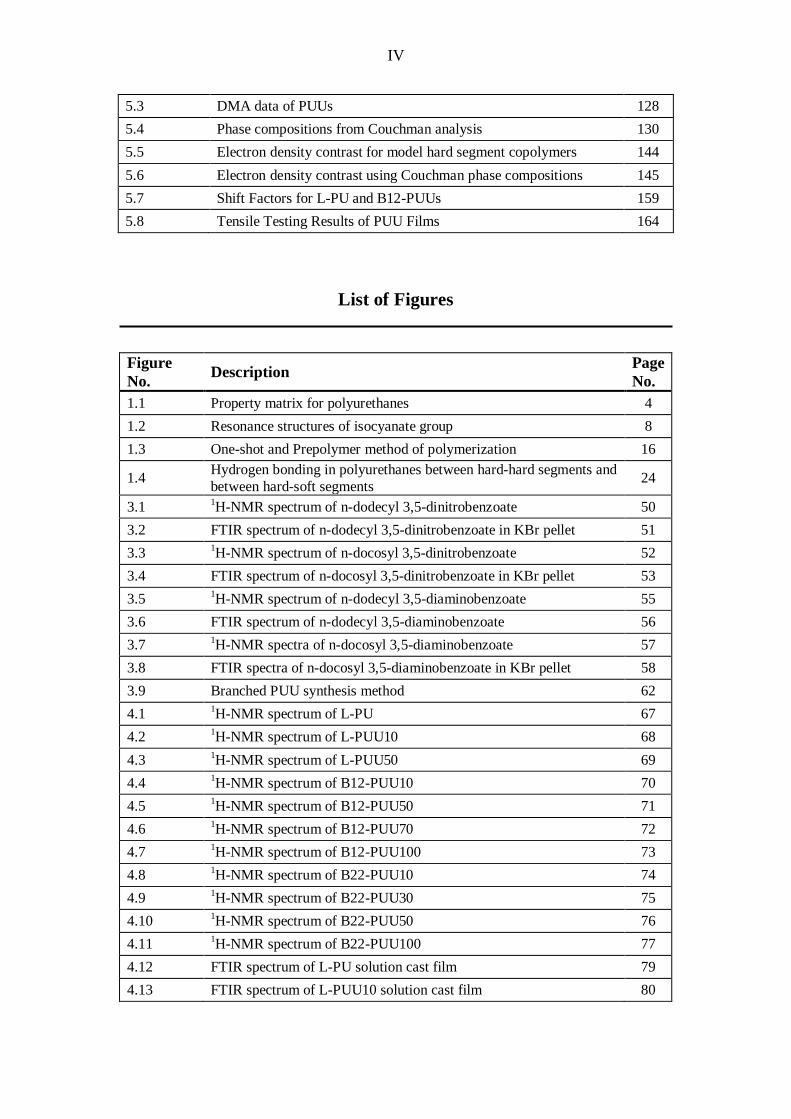
5.3 DMA data of PUUs 128 5.4 Phase compositions from Couchman analysis 130 5.5 Electron density contrast for model hard segment copolymers 144 5.6 Electron density contrast using Couchman phase compositions 145 5.7 Shift Factors for L-PU and B12-PUUs 159 5.8 Tensile Testing Results of PUU Films 164
List of Figures
Figure No. Description Page
No. 1.1 Property matrix for polyurethanes 4 1.2 Resonance structures of isocyanate group 8 1.3 One-shot and Prepolymer method of polymerization 16
1.4 Hydrogen bonding in polyurethanes between hard-hard segments and between hard-soft segments 24
3.1 1H-NMR spectrum of n-dodecyl 3,5-dinitrobenzoate 50 3.2 FTIR spectrum of n-dodecyl 3,5-dinitrobenzoate in KBr pellet 51 3.3 1H-NMR spectrum of n-docosyl 3,5-dinitrobenzoate 52 3.4 FTIR spectrum of n-docosyl 3,5-dinitrobenzoate in KBr pellet 53 3.5 1H-NMR spectrum of n-dodecyl 3,5-diaminobenzoate 55 3.6 FTIR spectrum of n-dodecyl 3,5-diaminobenzoate 56 3.7 1H-NMR spectra of n-docosyl 3,5-diaminobenzoate 57 3.8 FTIR spectra of n-docosyl 3,5-diaminobenzoate in KBr pellet 58 3.9 Branched PUU synthesis method 62 4.1 1H-NMR spectrum of L-PU 67 4.2 1H-NMR spectrum of L-PUU10 68 4.3 1H-NMR spectrum of L-PUU50 69 4.4 1H-NMR spectrum of B12-PUU10 70 4.5 1H-NMR spectrum of B12-PUU50 71 4.6 1H-NMR spectrum of B12-PUU70 72 4.7 1H-NMR spectrum of B12-PUU100 73 4.8 1H-NMR spectrum of B22-PUU10 74 4.9 1H-NMR spectrum of B22-PUU30 75 4.10 1H-NMR spectrum of B22-PUU50 76 4.11 1H-NMR spectrum of B22-PUU100 77 4.12 FTIR spectrum of L-PU solution cast film 79 4.13 FTIR spectrum of L-PUU10 solution cast film 80
V
4.14(A) FTIR spectrum of L-PUU50 solution cast film 81 4.14(B) FTIR spectrum of L-PUU50 showing carbonyl region 81 4.15 FTIR spectrum of B12-PUU10 solution cast film 82 4.16(A) FTIR spectrum of B12-PUU50 solution cast film 83 4.16(B) FTIR spectrum of B12-PUU50 showing carbonyl region 83 4.17 FTIR spectrum of B12-PUU70 solution cast film 84 4.18 FTIR spectrum of B12-PUU100 solution cast film 85 4.19 FTIR spectrum of B22-PUU10 solution cast film 85 4.20 FTIR spectrum of B22-PUU30 solution cast film 86 4.21 FTIR spectrum of B22-PUU50 solution cast film 87 4.22 FTIR spectrum of B22-PUU100 solution cast film 87
4.23 Representative GPC elugrams (a) L-PU, (b)L-PUU10, (c)B12-PUU10, (d)B22-PUU10 89
4.24 1H-NMR spectrum of n-dodecyl 3,5-diaminobenzoate 92 4.25 1H-NMR spectrum of B22-PUU30 93
5.1 Experimental protocol followed for high temperature FTIR experiments 96
5.2 FTIR spectra of L-PU (A) N-H absorption region and (B) C=O absorption region with temperature interval of 10oC 99
5.3 Example of peak fitting for N-H absorption band of L-PU data at 30oC 99
5.4 Comparison of FTIR N-H absorption peak wavenumber as a function of temperature for L-PUUs in comparison with L-PU 101
5.5 Comparison of FTIR N-H absorption peak wavenumber as a function of temperature for B12-PUUs in comparison with L-PU 102
5.6(A) N-H absorption of B12-PUU100 at 30oC 102 5.6(B) Carbonyl absorption of B12-PUU100 at 30oC 102
5.7 Comparison of FTIR N-H absorption peak wavenumber as a function of temperature for B22-PUUs in comparison with L-PU 103
5.8(A) N-H absorption of B22-PUU100 at 30oC 103 5.8(B) Carbonyl absorption of B22-PUU100 at 30oC 103
5.9 Comparison of FTIR N-H absorption peak wavenumber as a function of temperature for B12-PUU50, B22-PUU50 and L-PU 104
5.10 DSC thermogram of PTMO soft segment 105
5.11 Second heating DSC thermogram of model hard segment polyurethane 107
5.12 Second heating DSC thermograms of Model hard segment PUUs 107 5.13 DSC traces for L-PUU series 109 5.14(A) DSC traces for B12-PUU series. First heat 110 5.14(B) DSC traces for B12-PUU series. Second heat 111 5.15(A) DSC traces for B22-PUU series. First heat 112 5.15(B) DSC traces for B22-PUU series. Second heat 113 5.15(C) First and second heating DSC traces of B22-PUU100 114 5.16 WAXD patterns of L-PU, B2-PUU50 and B22-PUU100 116
VI
5.17 DMA curves of L-PU 118 5.18 DMA curves of L-PUU10 119 5.19 DMA curves of L-PUU50 120 5.20 DMA loss modulus curves of L-PUUs in comparison with L-PU 121 5.21 DMA curves of B12-PUU10 121 5.22 DMA curves of B12-PUU50 122 5.23 DMA curves of B12-PUU70 122 5.24 DMA curves of B12-PUU100 123 5.25 DMA loss modulus curves of B12-PUUs in comparison with L-PU 123 5.26 DMA curves of B22-PUU10 125 5.27 DMA curves of B22-PUU30 125 5.28 DMA curves of B22-PUU50 126 5.29 DMA curves of B22-PUU100 126 5.30 DMA loss modulus curves of B22-PUUs in comparison with L-PU 127 5.31 X-ray Scattering Experiment 131 5.32(A) Electron density profile for ideal system 136
5.32(B) Electron density profile for system having thermal density fluctuations 136
5.32(C) Electron density profile for system having diffuse phase boundary 136
5.33 SAXS intensities as a function of the scattering vector for L-PUUs in comparison with L-PU 137
5.34(A) Porod behavior of L-PU 138 5.34(B) Porod behavior of L-PUUs 138 5.35(A) SAXS intensities for B12-PUUs 139 5.35(B) Porod behavior of B12-PUUs 139 5.36(A) SAXS intensities for B22-PUUs 140 5.36(B) Porod behavior of B22-PUUs 140
5.37 Squared electron density contrast vs B12 diamine content for model and real copolymers 145
5.38 SAXS intensity vs q – L-PU 147 5.39 SAXS intensity vs q – L-PUU10 147 5.40 SAXS intensity vs q – L-PUU50 147 5.41 SAXS intensity vs q – B12-PUU10 147 5.42 SAXS intensity vs q – B12-PUU50 148 5.43 SAXS intensity vs q – B12-PUU70 148 5.44 SAXS intensity vs q – B22-PUU10 148
5.45 Average periodicity as a function of temperature for B12-PUUs in comparison with L-PU 150
5.46(A) Schematic of a rheometer 152 5.46(B) Oscillating strain and stress response 152 5.47 TTS master curve 153 5.48 Time sweep curves of L-PU at different temperatures 154
VII
5.49 Frequency sweep response of L-PU at different temperatures 156 5.50 TTS for L-PU 159 5.51 TTS for B12-PUU10 160 5.52 TTS for B12-PUU50 160 5.53 TTS for B12-PUU70 160 5.54 TTS master curve for L-PU 161 5.55 Engineering stress-strain data for L-PUU10 and B12-PUU10 163 5.56 Stress-strain behaviour of L-PUUs 163 5.57 Stress-strain behaviour of B12-PUUs 164 5.58 Stress-strain behaviour of B22-PUUs 164 6.1 Average periodicity after Lorentz correction vs temperature 171 6.2 Dynamic Temperature Ramp for L-PU while heating and cooling 171
6.3 Dynamic Temperature Ramp for B12-PUU10 while heating and cooling 172
6.4 Dynamic Temperature Ramp for B22-PUU10 while heating and cooling 172

Introduction and Literature Survey
Chapter - 1
National Chemical Laboratory
1 Introduction and Literature Review
1.1 History and Development of Polyurethanes
Polyurethanes, formed by a simple polyaddition reaction, prove to be very versatile,
high-performance polymers having applications as diverse as coatings, adhesives,
elastomers, fibers and foams. The first basic diisocyanate polyaddition reaction dates
back to 1937 by Professor Otto Bayer in the I.G.Farben laboratories1. The
polyurethane fiber formed using this reaction was trademarked by Bayer as Perlon U.
Later, elastomeric properties were discovered by chemists at DuPont and ICI. Initial
work on polyurethane was primarily focused on the production of fibers and
elastomers with improved properties. During World War II Bayer developed
elastomeric foams based on naphthalene 1,5-diisocyanate (NDI) and polyester resins.
These foams were then used to reinforce the wings of military aircrafts to enhance
their strength and performance.
In 1950’s, polyurethane chemistry started to develop rapidly with toluene
diisocyanate (TDI) and the first polyether polyols from Dow Chemical. In 1954,
DuPont chemists successfully copolymerized polyethylene glycol and toluene 2,4-
diisocyanate in the presence of water to form a polyurethane fiber spandex. The aim
was to replace natural rubber threads. In 1959, DuPont commercialized a polyether
urea fiber prepared using methylene bis (4-phenylene isocyanate) (MDI) and ethylene
diamine under the trade name Lycra.
Earlier efforts on the synthesis of polyurethane elastomer resulted in the
production of gummy materials, probably due to irregular elastomeric network from
low hard segment concentration. These elastomers lacked adequate melt stability to
function as practical thermoplastic elastomers. They were synthesized using bulky
diisocyanates such as NDI, and had melting temperature higher than the
decomposition temperature of urethane linkages. Properties of these elastomers were
improved significantly when NDI was replaced by MDI and by the introduction of
short chain extender diols and diamines. In 1957, Schollenberger prepared a linear
polyurethane elastomer from MDI, adipic acid and 1,4-butanediol.2 The polymer had
interesting properties such as high elasticity, extensibility, abrasion resistance and
solubility. Schollenberger called this a “virtually crosslinked elastomer.” A new
family of thermoplastic polyurethane (TPU) elastomers, in a practical sense, thus
became available. But structure-property relationship was still not very well
National Chemical Laboratory
2 Introduction and Literature Review
understood. A lot of research work had been carried out to understand the exact
structure and its relationship with the properties. Cooper and Tobolsky3 were the first
to gain an understanding in this area in one of their study on “virtually crosslinked
elastomer.” They found out that phase separated hard and soft blocks were
responsible for the excellent elastomeric properties of TPU.
During 1960’s the polyurethane industry expanded dramatically with MDI
becoming a key chemical to make elastomeric fibers. MDI became the raw material of
choice for rapidly evolving applications of polyurethane (refrigeration, construction,
spray foam etc.). Pure MDI applications went beyond Spandex to make thermoplastic
polyurethanes, cast elastomers, adhesives and coatings. 1990’s saw the start of major
supplier consolidation and rapid globalization of the business. Today, the global
business of polyurethanes is dominated by four major players BASF, Bayer, Dow and
Huntsman. A dynamic development in the Chinese economy has influenced the
polyurethane business considerably, with the major players concentrating on future
strategies (primarily large scale manufacturing facilities) for the country.4
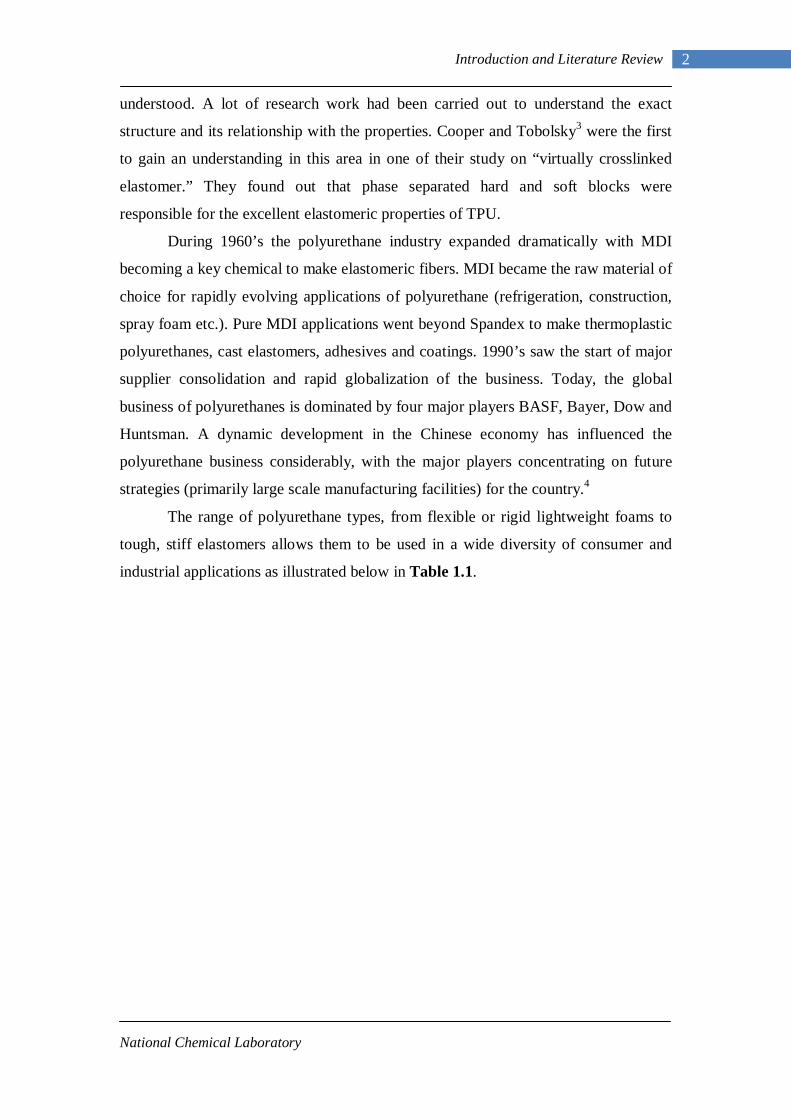
The range of polyurethane types, from flexible or rigid lightweight foams to
tough, stiff elastomers allows them to be used in a wide diversity of consumer and
industrial applications as illustrated below in Table 1.1.
National Chemical Laboratory
3 Introduction and Literature Review
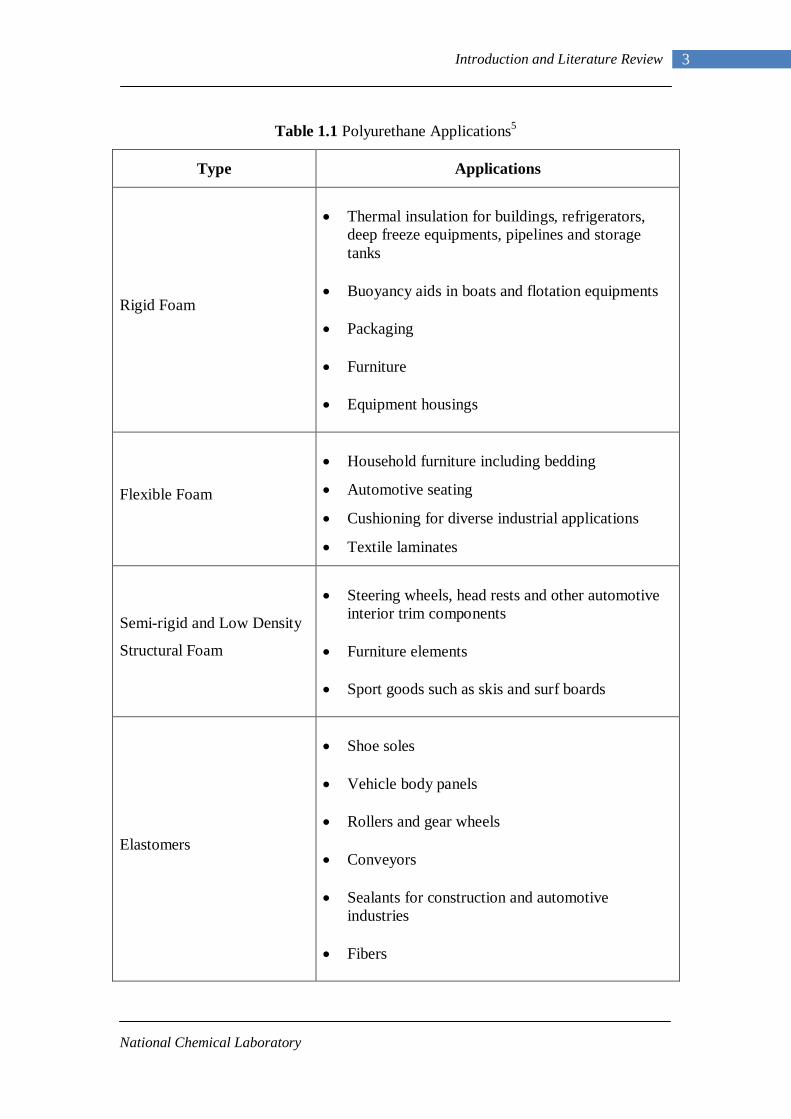
Table 1.1 Polyurethane Applications5
Type
Applications
Rigid Foam
• Thermal insulation for buildings, refrigerators,
deep freeze equipments, pipelines and storage tanks
• Buoyancy aids in boats and flotation equipments • Packaging • Furniture • Equipment housings
Flexible Foam
• Household furniture including bedding
• Automotive seating
• Cushioning for diverse industrial applications
• Textile laminates
Semi-rigid and Low Density
Structural Foam
• Steering wheels, head rests and other automotive
interior trim components • Furniture elements • Sport goods such as skis and surf boards
Elastomers
• Shoe soles • Vehicle body panels • Rollers and gear wheels • Conveyors • Sealants for construction and automotive
industries • Fibers
National Chemical Laboratory
4 Introduction and Literature Review
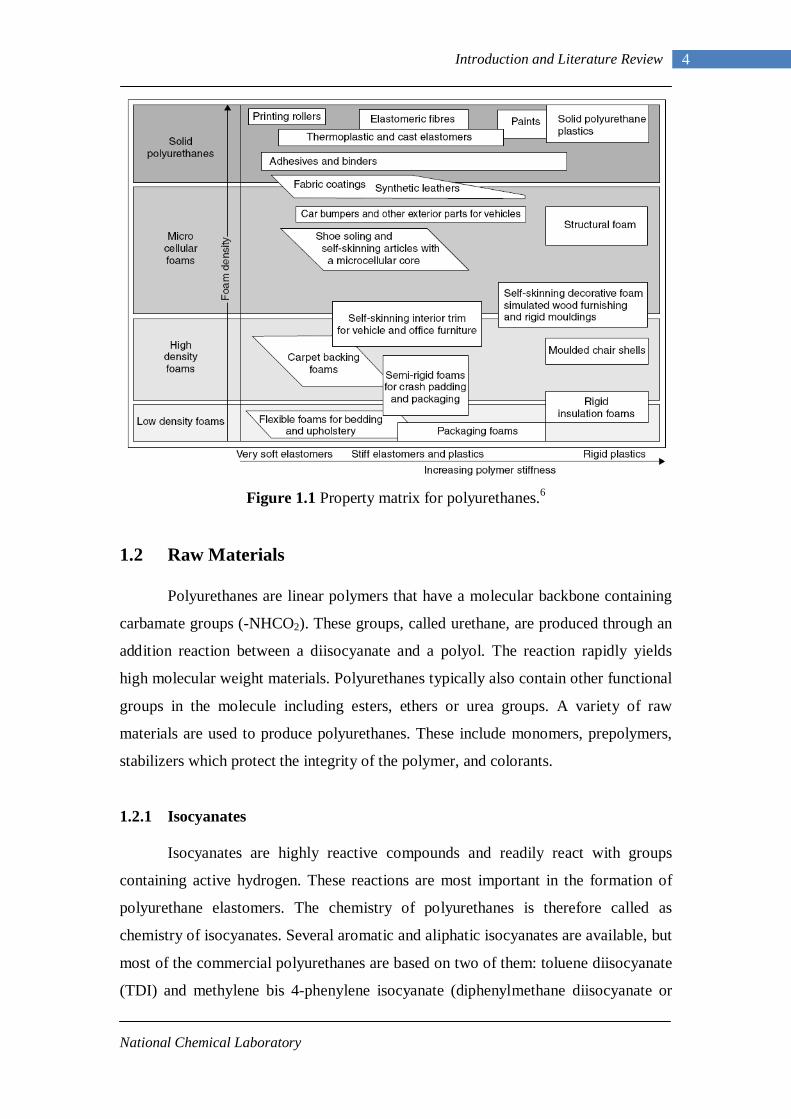
Figure 1.1 Property matrix for polyurethanes.6
1.2 Raw Materials
Polyurethanes are linear polymers that have a molecular backbone containing
carbamate groups (-NHCO2). These groups, called urethane, are produced through an
addition reaction between a diisocyanate and a polyol. The reaction rapidly yields
high molecular weight materials. Polyurethanes typically also contain other functional
groups in the molecule including esters, ethers or urea groups. A variety of raw
materials are used to produce polyurethanes. These include monomers, prepolymers,
stabilizers which protect the integrity of the polymer, and colorants.
1.2.1 Isocyanates
Isocyanates are highly reactive compounds and readily react with groups
containing active hydrogen. These reactions are most important in the formation of
polyurethane elastomers. The chemistry of polyurethanes is therefore called as
chemistry of isocyanates. Several aromatic and aliphatic isocyanates are available, but
most of the commercial polyurethanes are based on two of them: toluene diisocyanate
(TDI) and methylene bis 4-phenylene isocyanate (diphenylmethane diisocyanate or
National Chemical Laboratory
5 Introduction and Literature Review
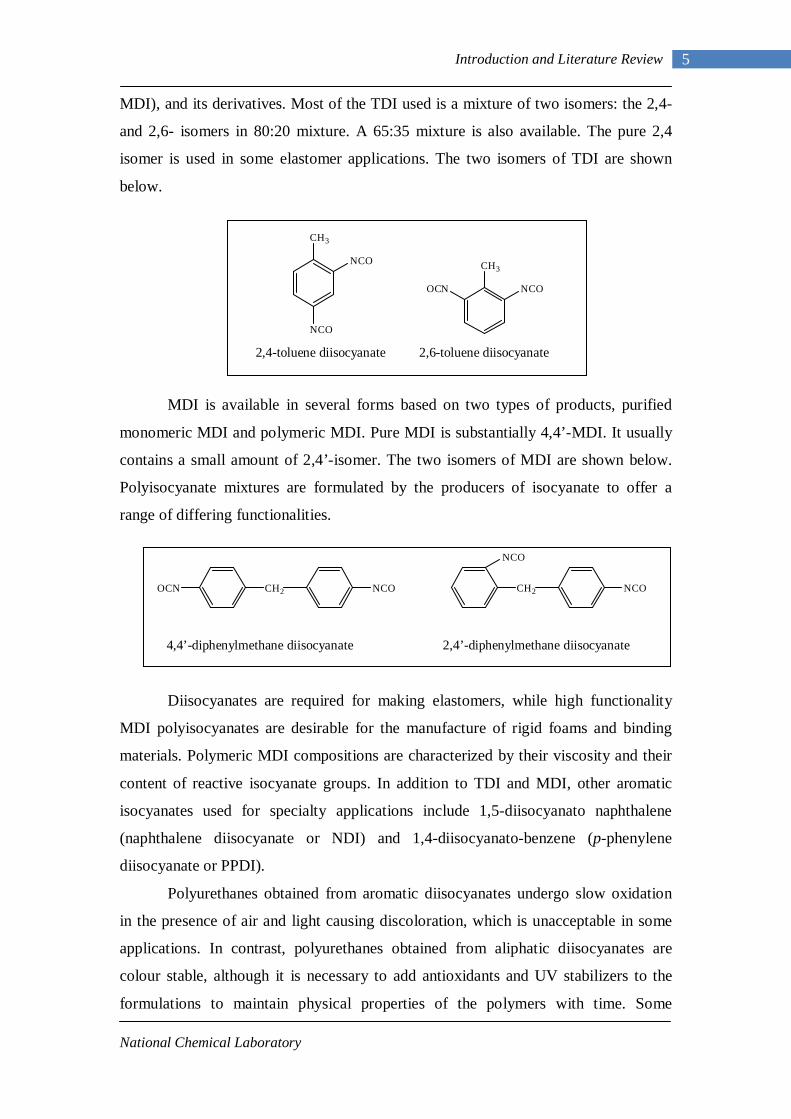
MDI), and its derivatives. Most of the TDI used is a mixture of two isomers: the 2,4-
and 2,6- isomers in 80:20 mixture. A 65:35 mixture is also available. The pure 2,4
isomer is used in some elastomer applications. The two isomers of TDI are shown
below.
2,4-toluene diisocyanate 2,6-toluene diisocyanate
MDI is available in several forms based on two types of products, purified
monomeric MDI and polymeric MDI. Pure MDI is substantially 4,4’-MDI. It usually
contains a small amount of 2,4’-isomer. The two isomers of MDI are shown below.
Polyisocyanate mixtures are formulated by the producers of isocyanate to offer a
range of differing functionalities.
4,4’-diphenylmethane diisocyanate 2,4’-diphenylmethane diisocyanate
Diisocyanates are required for making elastomers, while high functionality
MDI polyisocyanates are desirable for the manufacture of rigid foams and binding
materials. Polymeric MDI compositions are characterized by their viscosity and their
content of reactive isocyanate groups. In addition to TDI and MDI, other aromatic
isocyanates used for specialty applications include 1,5-diisocyanato naphthalene
(naphthalene diisocyanate or NDI) and 1,4-diisocyanato-benzene (p-phenylene
diisocyanate or PPDI).
Polyurethanes obtained from aromatic diisocyanates undergo slow oxidation
in the presence of air and light causing discoloration, which is unacceptable in some
applications. In contrast, polyurethanes obtained from aliphatic diisocyanates are
colour stable, although it is necessary to add antioxidants and UV stabilizers to the
formulations to maintain physical properties of the polymers with time. Some
NCO
CH3
NCO
OCN NCO
CH3
CH2 NCOOCN
CH2 NCO
NCO
National Chemical Laboratory
6 Introduction and Literature Review
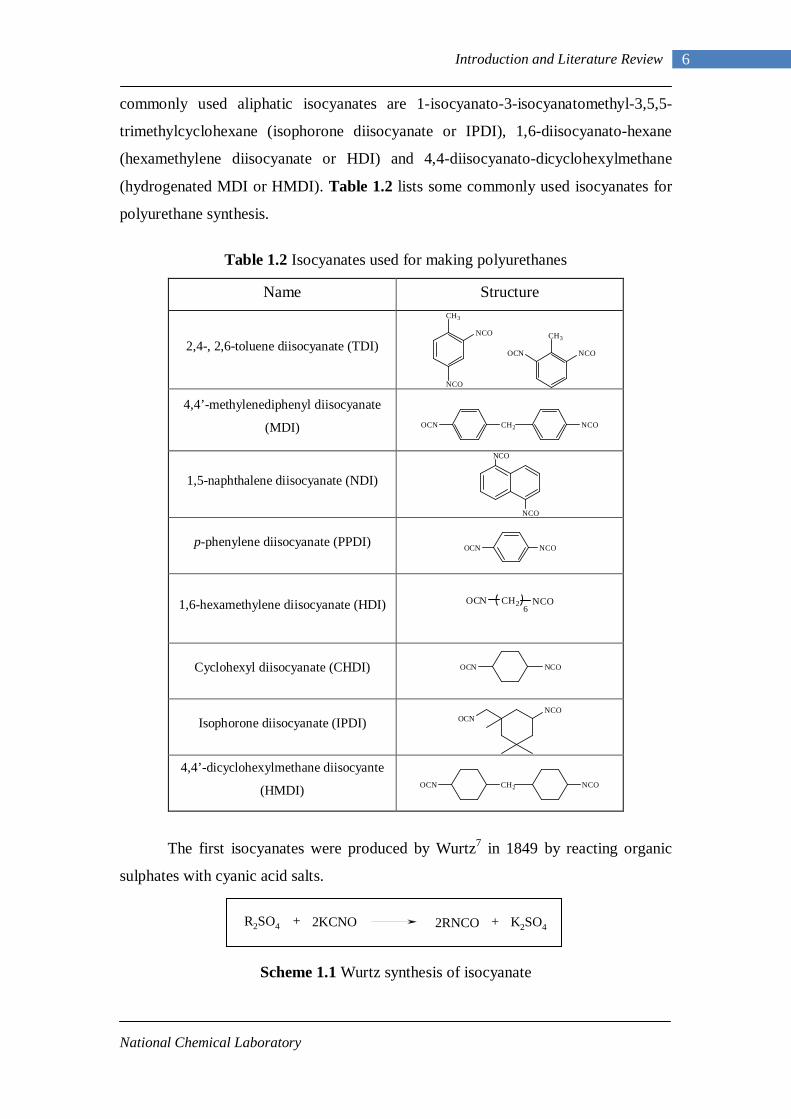
commonly used aliphatic isocyanates are 1-isocyanato-3-isocyanatomethyl-3,5,5-
trimethylcyclohexane (isophorone diisocyanate or IPDI), 1,6-diisocyanato-hexane
(hexamethylene diisocyanate or HDI) and 4,4-diisocyanato-dicyclohexylmethane
(hydrogenated MDI or HMDI). Table 1.2 lists some commonly used isocyanates for
polyurethane synthesis.
Table 1.2 Isocyanates used for making polyurethanes
Name Structure
2,4-, 2,6-toluene diisocyanate (TDI)
4,4’-methylenediphenyl diisocyanate
(MDI)
1,5-naphthalene diisocyanate (NDI)
p-phenylene diisocyanate (PPDI)
1,6-hexamethylene diisocyanate (HDI)
Cyclohexyl diisocyanate (CHDI)
Isophorone diisocyanate (IPDI)
4,4’-dicyclohexylmethane diisocyante
(HMDI)
The first isocyanates were produced by Wurtz7 in 1849 by reacting organic
sulphates with cyanic acid salts.
R2SO4 + 2KCNO 2RNCO K2SO4+
Scheme 1.1 Wurtz synthesis of isocyanate
NCO
CH3
NCO
OCN NCO
CH3
CH2 NCOOCN
NCO
NCO
NCOOCN
OCN CH2 NCO6
OCN NCO
OCNNCO
CH2 NCOOCN
National Chemical Laboratory
7 Introduction and Literature Review
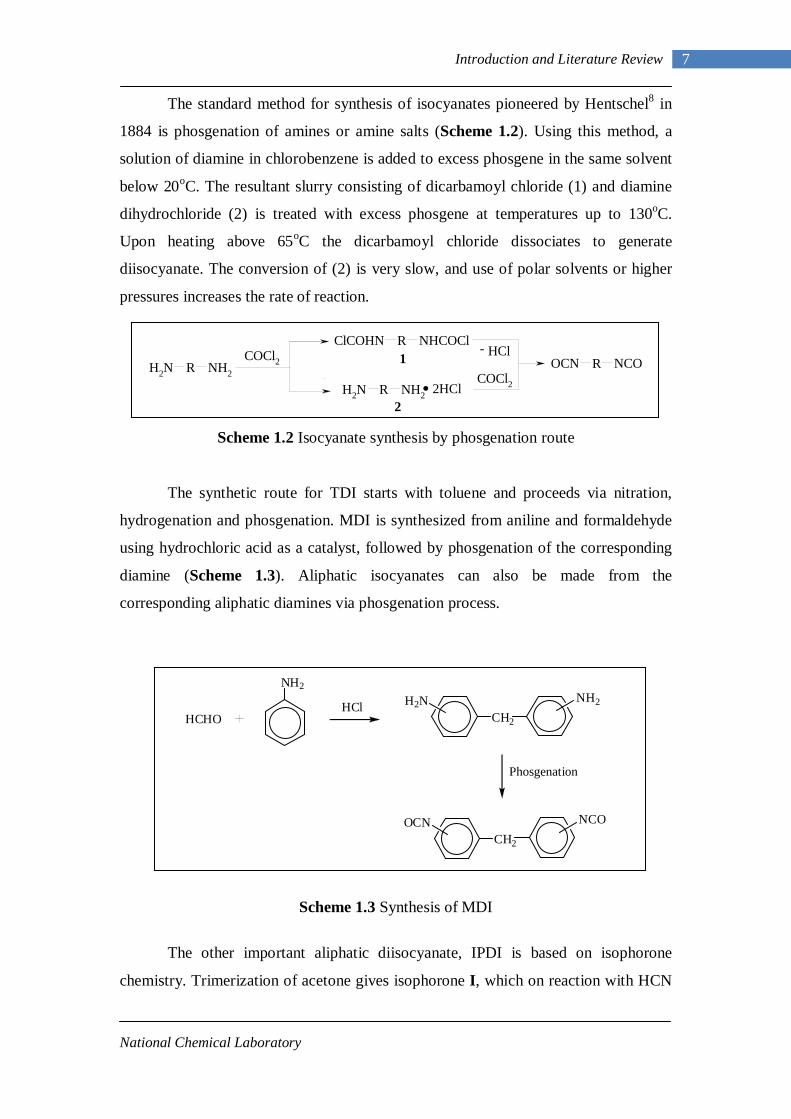
The standard method for synthesis of isocyanates pioneered by Hentschel8 in
1884 is phosgenation of amines or amine salts (Scheme 1.2). Using this method, a
solution of diamine in chlorobenzene is added to excess phosgene in the same solvent
below 20oC. The resultant slurry consisting of dicarbamoyl chloride (1) and diamine
dihydrochloride (2) is treated with excess phosgene at temperatures up to 130oC.
Upon heating above 65oC the dicarbamoyl chloride dissociates to generate
diisocyanate. The conversion of (2) is very slow, and use of polar solvents or higher
pressures increases the rate of reaction.
ClCOHN R NHCOCl
.1
NH2 R NH2 2HCl2
NH2 R NH2
COCl2COCl2
HCl-OCN R NCO
Scheme 1.2 Isocyanate synthesis by phosgenation route
The synthetic route for TDI starts with toluene and proceeds via nitration,
hydrogenation and phosgenation. MDI is synthesized from aniline and formaldehyde
using hydrochloric acid as a catalyst, followed by phosgenation of the corresponding
diamine (Scheme 1.3). Aliphatic isocyanates can also be made from the
corresponding aliphatic diamines via phosgenation process.
Scheme 1.3 Synthesis of MDI
The other important aliphatic diisocyanate, IPDI is based on isophorone
chemistry. Trimerization of acetone gives isophorone I, which on reaction with HCN
HCHO
NH2
HClCH2
H2N NH2
Phosgenation
CH2
OCN NCO

National Chemical Laboratory
8 Introduction and Literature Review
yields β-cyanoketone II. Reductive amination of II to the diamine III, followed by
phosgenation, gives IPDI IV as shown below.
Scheme 1.4 Synthesis of IPDI
1.2.2 Reactions of Isocyanates
The high reactivity of isocyanate toward nucleophilic reagents is mainly due
to pronounced electropositive character of the carbon atom caused by the
delocalization of electrons onto oxygen, nitrogen and aromatic group. Aromatic
isocyanates are therefore more reactive than aliphatic isocyanates, due to negative
charge delocalization. Substitution on the aromatic ring can affect delocalization of
negative charge in case of aromatic isocyanates. Electron withdrawing groups on the
ortho or para position can increase the reactivity of the NCO group, while an electron
donating group will have the opposite effect on the reactivity of isocyanate. The
electronic structure of isocyanate group can be represented by resonance structures as
shown in the following Figure 1.2.
Figure 1.2 Resonance structures of isocyanate group
(I) Primary reactions of isocyanates: Polyols: The addition reaction of isocyanate with a polyol is an exothermic reaction,
influenced by the structure of both reactants. Aliphatic polyols with primary hydroxyl
end groups are the most reactive. They react with isocyanates about ten times faster
than similar polyols with secondary hydroxyl groups. Phenols react more slowly with
the isocyanates, and the resulting urethane groups are easily broken on heating to
yield the original isocyanate and phenol. The reaction is strongly influenced by
catalysts; e.g. acid compounds (mineral acid, acid halide etc.) slow the reaction,
HCN
O O
CNNH2
NH2
NCO
NCO
I II III IV
N CR ON C OR NR C O NR C ON C OR
National Chemical Laboratory
9 Introduction and Literature Review
whereas basic compounds (tertiary amines) and metal compounds (Sn, Zn, Fe salts)
accelerate the reaction.
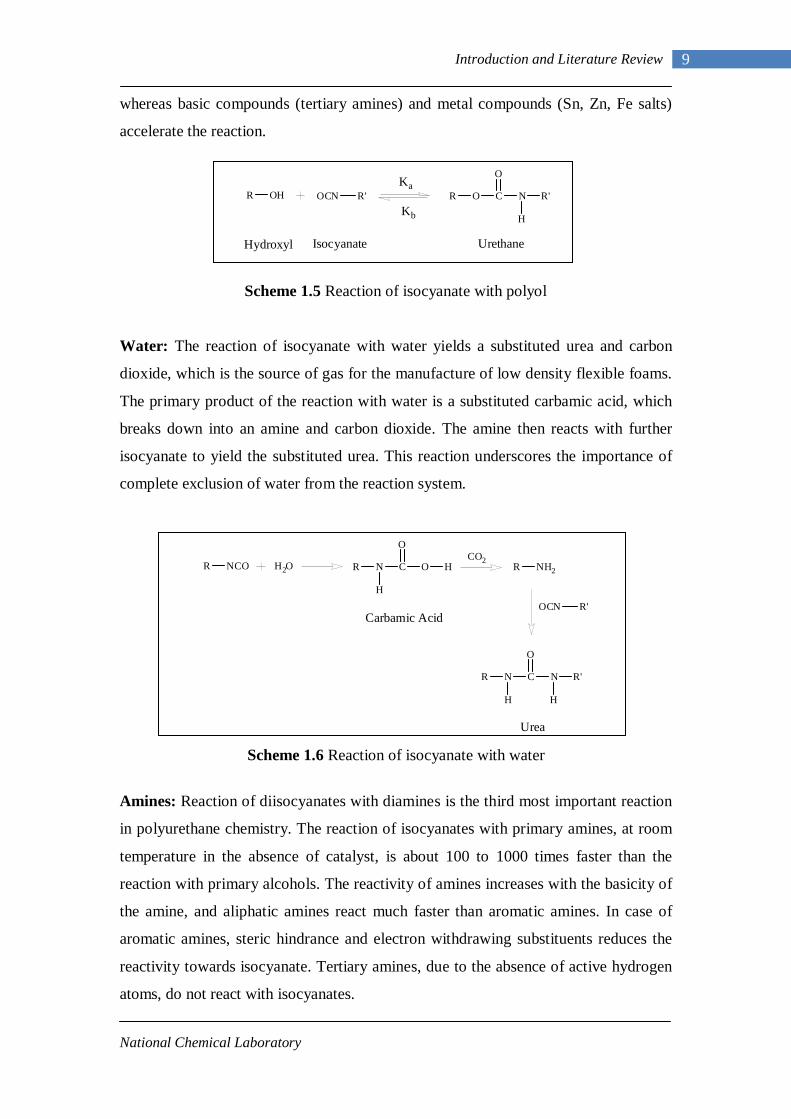
Scheme 1.5 Reaction of isocyanate with polyol
Water: The reaction of isocyanate with water yields a substituted urea and carbon
dioxide, which is the source of gas for the manufacture of low density flexible foams.
The primary product of the reaction with water is a substituted carbamic acid, which
breaks down into an amine and carbon dioxide. The amine then reacts with further
isocyanate to yield the substituted urea. This reaction underscores the importance of
complete exclusion of water from the reaction system.
Scheme 1.6 Reaction of isocyanate with water
Amines: Reaction of diisocyanates with diamines is the third most important reaction
in polyurethane chemistry. The reaction of isocyanates with primary amines, at room
temperature in the absence of catalyst, is about 100 to 1000 times faster than the
reaction with primary alcohols. The reactivity of amines increases with the basicity of
the amine, and aliphatic amines react much faster than aromatic amines. In case of
aromatic amines, steric hindrance and electron withdrawing substituents reduces the
reactivity towards isocyanate. Tertiary amines, due to the absence of active hydrogen
atoms, do not react with isocyanates.
R OH OCN R'
Ka
Kb
R O C N R'
O
H
UrethaneIsocyanateHydroxyl
R NCO H2O R N C O
O
H
H
Carbamic Acid
CO2R NH2
OCN R'
R N C N R'
H
O
H
Urea
National Chemical Laboratory
10 Introduction and Literature Review
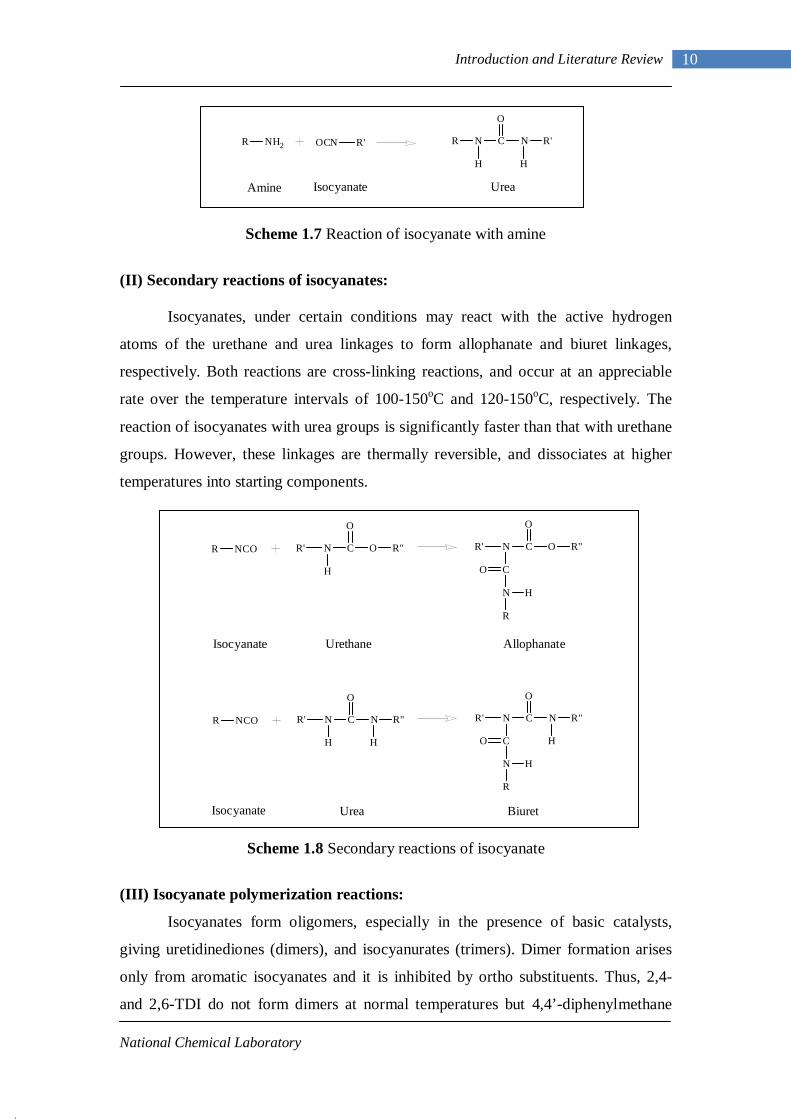
Scheme 1.7 Reaction of isocyanate with amine
(II) Secondary reactions of isocyanates: Isocyanates, under certain conditions may react with the active hydrogen
atoms of the urethane and urea linkages to form allophanate and biuret linkages,
respectively. Both reactions are cross-linking reactions, and occur at an appreciable
rate over the temperature intervals of 100-150oC and 120-150oC, respectively. The
reaction of isocyanates with urea groups is significantly faster than that with urethane
groups. However, these linkages are thermally reversible, and dissociates at higher
temperatures into starting components.
Scheme 1.8 Secondary reactions of isocyanate
(III) Isocyanate polymerization reactions:
Isocyanates form oligomers, especially in the presence of basic catalysts,
giving uretidinediones (dimers), and isocyanurates (trimers). Dimer formation arises
only from aromatic isocyanates and it is inhibited by ortho substituents. Thus, 2,4-
and 2,6-TDI do not form dimers at normal temperatures but 4,4’-diphenylmethane
R NH2 OCN R' R N C N R'
H H
O
UreaIsocyanateAmine
R NCO R' N C O
O
H
R" R' N C O
O
C
R"
N H
O
R
AllophanateUrethaneIsocyanate
R NCO R' N C N
O
H
R"
H
R' N C N
O
C
R"
H
N H
O
R
BiuretUreaIsocyanate
National Chemical Laboratory
11 Introduction and Literature Review
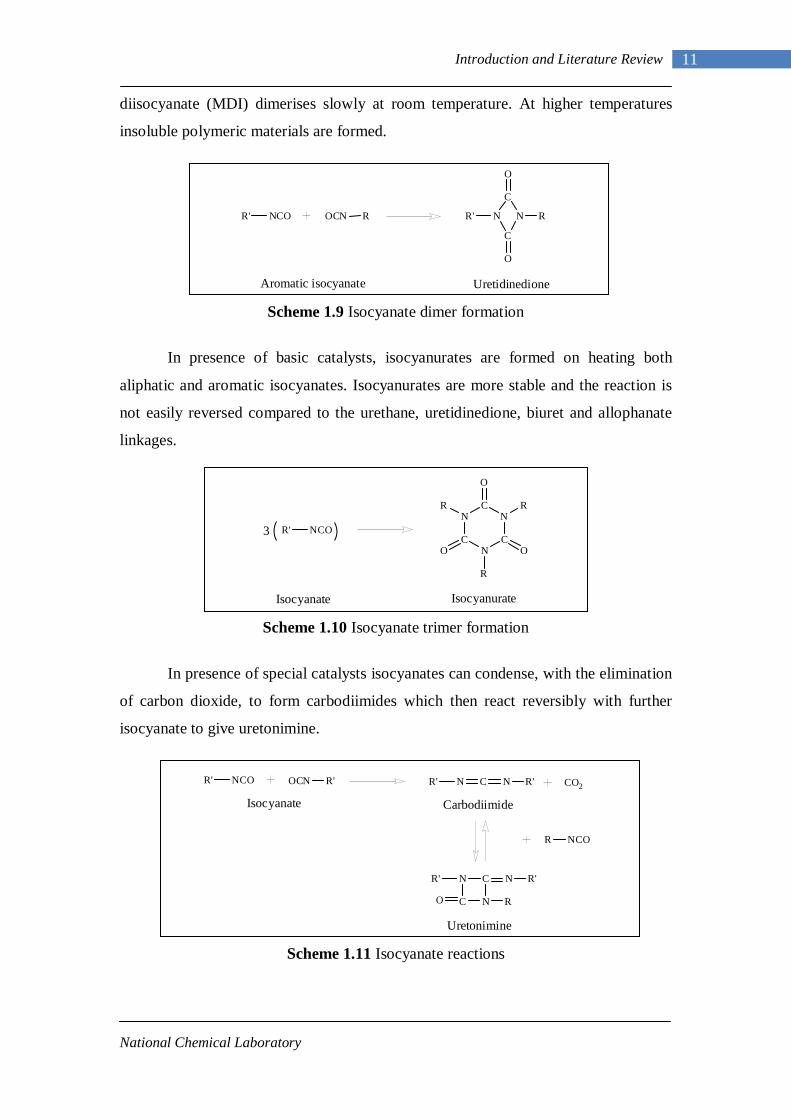
diisocyanate (MDI) dimerises slowly at room temperature. At higher temperatures
insoluble polymeric materials are formed.
Scheme 1.9 Isocyanate dimer formation
In presence of basic catalysts, isocyanurates are formed on heating both
aliphatic and aromatic isocyanates. Isocyanurates are more stable and the reaction is
not easily reversed compared to the urethane, uretidinedione, biuret and allophanate
linkages.
Scheme 1.10 Isocyanate trimer formation
In presence of special catalysts isocyanates can condense, with the elimination
of carbon dioxide, to form carbodiimides which then react reversibly with further
isocyanate to give uretonimine.
Scheme 1.11 Isocyanate reactions
R' NCO OCN R R' N
C
C
N R
O
O
Aromatic isocyanate Uretidinedione
N
CN
C
NC RR
R
O
O O
R' NCO3
IsocyanurateIsocyanate
R' NCO R' N C N R' CO2
R' N C N R'
C NO R
R NCO
OCN R'
Isocyanate Carbodiimide
Uretonimine
National Chemical Laboratory
12 Introduction and Literature Review
1.2.3 Polyols
Polyols are hydroxyl terminated macromolecules, with molecular weights
ranging from 250 to 8000. The structure of polyol is an important factor in
determining the properties of polyurethane. A wide range of polyols are used for the
manufacture of polyurethanes. However, most of them fall under two classes:
hydroxyl terminated polyethers and hydroxyl terminated polyesters. Polyols are
characterized by their hydroxyl value, which is related to its molecular weight and
functionality as follows.
1000weightmolecular
ityfunctional56.1KOH/g) (mg valueHydroxyl ××
= (1.1)
Polyether Polyols: The backbone of polyether polyols are either propylene oxide
homopolymers or random or block copolymers with ethylene oxide. These are made
by the addition of alkylene oxides on to alcohols or amines, which are usually called
starters or initiators. The addition polymerization of propylene oxide occurs with
either anionic (basic) or cationic (acidic) catalysis. A special class of polyether
polyols, poly (tetramethylene glycol) is synthesized by cationic ring opening
polymerization of tetrahydrofuran. The economically attractive polyether polyols
based on alkylene oxides are listed in Table 1.3.
Important characteristics of polyols are their hydroxyl functionality, hydroxyl
equivalent weight, and their reactivity and compatibility with the other components
used in the polyurethane formulation. Blending of polyols of different functionality,
molecular weight, and reactivity can be used to tailor a polyol for a specific
application. Since primary hydroxyl groups are more reactive than secondary groups,
it is advantageous to produce block copolymers with terminal primary hydroxyl
groups. Some of the characteristic features imparted by the use of polyether polyols
are following:
• High hydrolysis resistance
• Excellent low temperature flexibility
• Resistance to microbial degradation
• Excellent clarity
National Chemical Laboratory
13 Introduction and Literature Review
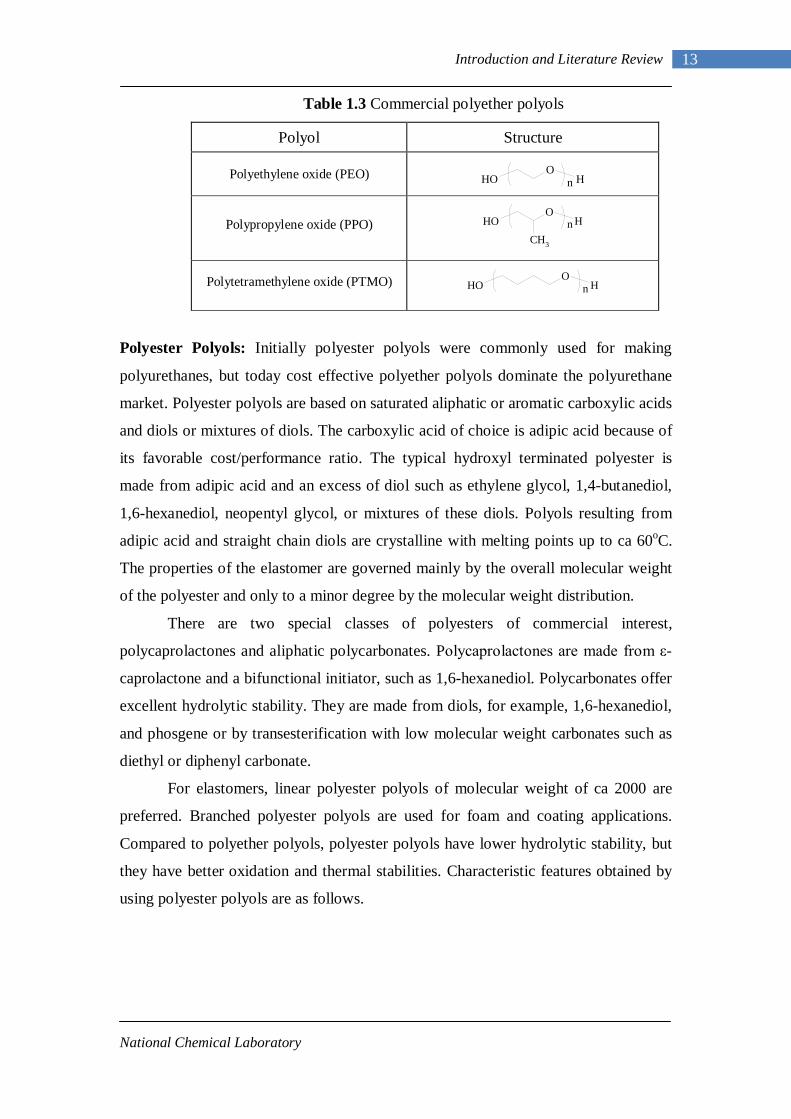
Table 1.3 Commercial polyether polyols
Polyol Structure
Polyethylene oxide (PEO) OHO
Hn
Polypropylene oxide (PPO) OHO
H
CH3
n
Polytetramethylene oxide (PTMO) OHO
Hn
Polyester Polyols: Initially polyester polyols were commonly used for making
polyurethanes, but today cost effective polyether polyols dominate the polyurethane
market. Polyester polyols are based on saturated aliphatic or aromatic carboxylic acids
and diols or mixtures of diols. The carboxylic acid of choice is adipic acid because of
its favorable cost/performance ratio. The typical hydroxyl terminated polyester is
made from adipic acid and an excess of diol such as ethylene glycol, 1,4-butanediol,
1,6-hexanediol, neopentyl glycol, or mixtures of these diols. Polyols resulting from
adipic acid and straight chain diols are crystalline with melting points up to ca 60oC.
The properties of the elastomer are governed mainly by the overall molecular weight
of the polyester and only to a minor degree by the molecular weight distribution.
There are two special classes of polyesters of commercial interest,
polycaprolactones and aliphatic polycarbonates. Polycaprolactones are made from ε-
caprolactone and a bifunctional initiator, such as 1,6-hexanediol. Polycarbonates offer
excellent hydrolytic stability. They are made from diols, for example, 1,6-hexanediol,
and phosgene or by transesterification with low molecular weight carbonates such as
diethyl or diphenyl carbonate.
For elastomers, linear polyester polyols of molecular weight of ca 2000 are
preferred. Branched polyester polyols are used for foam and coating applications.
Compared to polyether polyols, polyester polyols have lower hydrolytic stability, but
they have better oxidation and thermal stabilities. Characteristic features obtained by
using polyester polyols are as follows.
National Chemical Laboratory
14 Introduction and Literature Review
• Excellent mechanical properties
• Heat resistance
• High resistance to oils and chemicals
• Outstanding tear strength
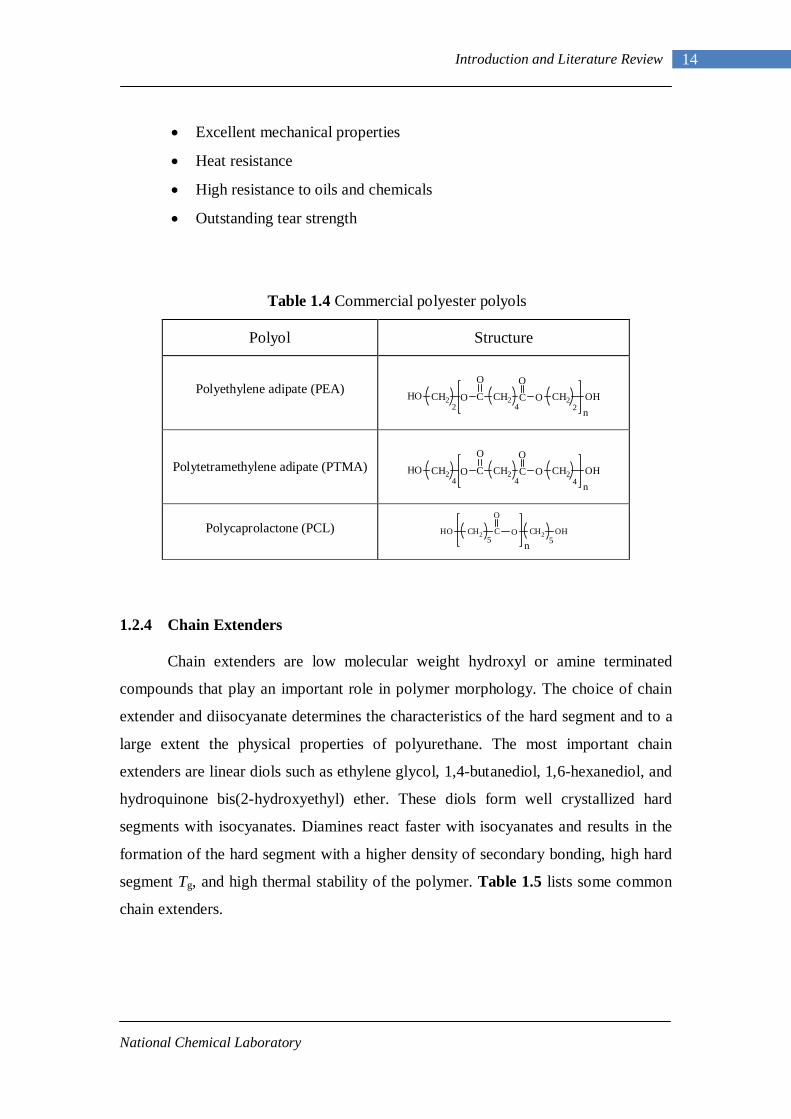
Table 1.4 Commercial polyester polyols
Polyol Structure
Polyethylene adipate (PEA)
Polytetramethylene adipate (PTMA)
Polycaprolactone (PCL)
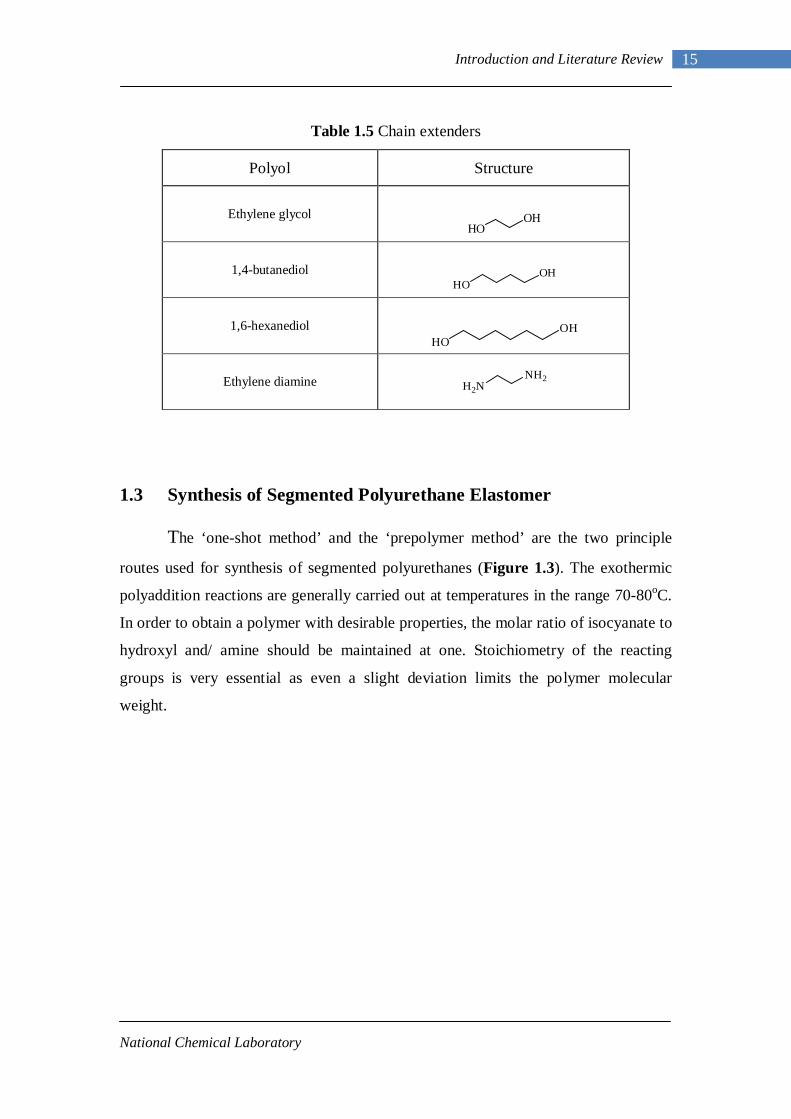
1.2.4 Chain Extenders
Chain extenders are low molecular weight hydroxyl or amine terminated
compounds that play an important role in polymer morphology. The choice of chain
extender and diisocyanate determines the characteristics of the hard segment and to a
large extent the physical properties of polyurethane. The most important chain
extenders are linear diols such as ethylene glycol, 1,4-butanediol, 1,6-hexanediol, and
hydroquinone bis(2-hydroxyethyl) ether. These diols form well crystallized hard
segments with isocyanates. Diamines react faster with isocyanates and results in the
formation of the hard segment with a higher density of secondary bonding, high hard
segment Tg, and high thermal stability of the polymer. Table 1.5 lists some common
chain extenders.
HO CH2 O C
O
CH2 C O CH2 OHO
2 4 2 n
HO CH2 O C
O
CH2 C O CH2 OHO
4 4 4 n
HO CH2 C O CH2 OH
O
5 5n
National Chemical Laboratory
15 Introduction and Literature Review
Table 1.5 Chain extenders
Polyol Structure
Ethylene glycol
1,4-butanediol
1,6-hexanediol
Ethylene diamine
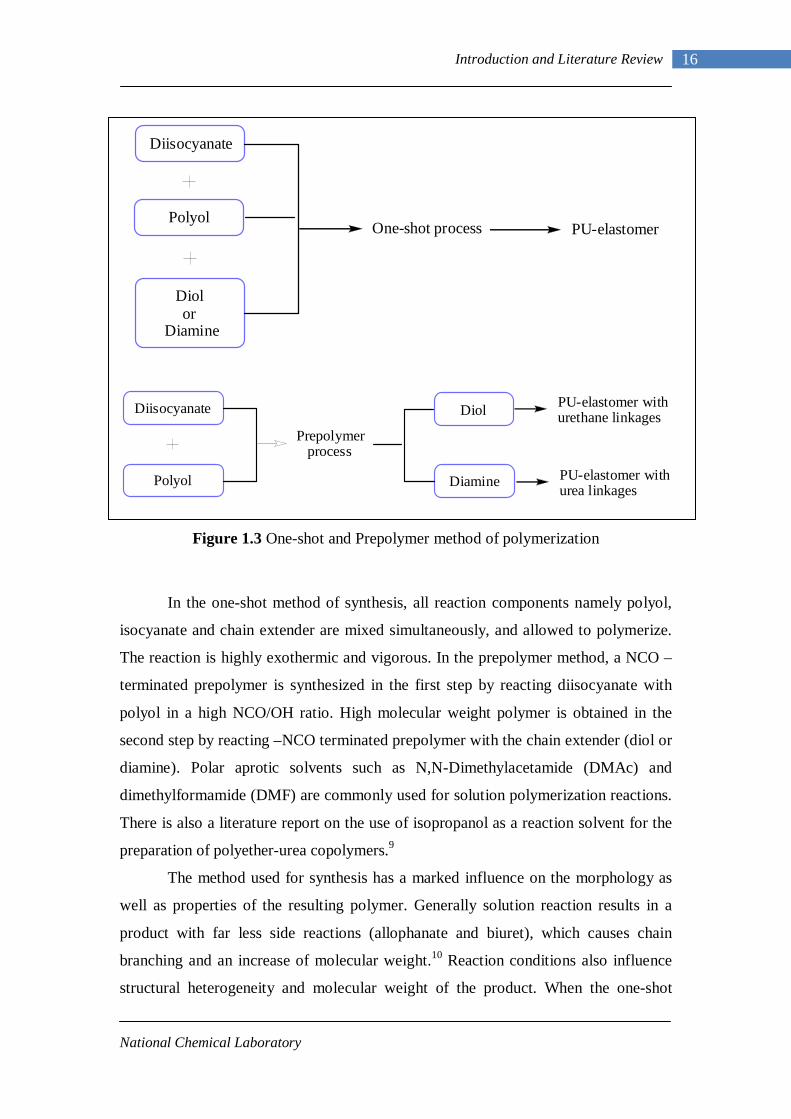
1.3 Synthesis of Segmented Polyurethane Elastomer
The ‘one-shot method’ and the ‘prepolymer method’ are the two principle
routes used for synthesis of segmented polyurethanes (Figure 1.3). The exothermic
polyaddition reactions are generally carried out at temperatures in the range 70-80oC.
In order to obtain a polymer with desirable properties, the molar ratio of isocyanate to
hydroxyl and/ amine should be maintained at one. Stoichiometry of the reacting
groups is very essential as even a slight deviation limits the polymer molecular
weight.
HOOH
HOOH
HO
OH
H2NNH2
National Chemical Laboratory
16 Introduction and Literature Review
Figure 1.3 One-shot and Prepolymer method of polymerization
In the one-shot method of synthesis, all reaction components namely polyol,
isocyanate and chain extender are mixed simultaneously, and allowed to polymerize.
The reaction is highly exothermic and vigorous. In the prepolymer method, a NCO –
terminated prepolymer is synthesized in the first step by reacting diisocyanate with
polyol in a high NCO/OH ratio. High molecular weight polymer is obtained in the
second step by reacting –NCO terminated prepolymer with the chain extender (diol or
diamine). Polar aprotic solvents such as N,N-Dimethylacetamide (DMAc) and
dimethylformamide (DMF) are commonly used for solution polymerization reactions.
There is also a literature report on the use of isopropanol as a reaction solvent for the
preparation of polyether-urea copolymers.9
The method used for synthesis has a marked influence on the morphology as
well as properties of the resulting polymer. Generally solution reaction results in a
product with far less side reactions (allophanate and biuret), which causes chain
branching and an increase of molecular weight.10 Reaction conditions also influence
structural heterogeneity and molecular weight of the product. When the one-shot
Diisocyanate
Polyol
Diolor
Diamine
One-shot process PU-elastomer
Prepolymerprocess
PU-elastomer withurea linkages
Diisocyanate
Polyol
Diol
Diamine
PU-elastomer withurethane linkages
National Chemical Laboratory
17 Introduction and Literature Review
method is used in bulk polymerization, the reactivity difference between the –OH
groups of the polyol and the chain extender with different isocyanate groups affect the
sequence of hard segments in the polymer chain. In case of prepolymer method,
sequences are found to be more regular compared to the one shot method. Prepolymer
method produces polyurethanes with superior properties since structural regularity
leads to the better packing of hard segments, which crystallize to form physical
crosslink points.
1.4 Morphology
1.4.1 Heterophase Morphology
Segmented thermoplastic polyurethane and its closest analogue polyurethane-
urea (PUU), containing randomly alternating hard and soft blocks, constitute an
industrially important class of block copolymers. Thermodynamic incompatibility
between the polar hard and the less polar soft segments makes the free energy of
mixing positive, and thus forces them to phase separate. However, the length scale of
phase separation is limited by the connectivity of the blocks. Further, the shorter hard
and soft segment chain lengths (compared to the diblock and triblock copolymers),
the high level of polydispersity and the presence of weak secondary interactions
(dipole-dipole or hydrogen bonding) between the hard and soft segments, results in an
ill-defined microphase separated morphology in polyurethanes. The degree to which
hard and soft segments microphase separate and the resulting morphology have a
profound effect on the ultimate properties of the copolymer.
The tendency to microphase separate into periodic morphologies depends on
composition (volume fraction of hard/soft blocks, φ), the overall degree of
polymerization (N), and the segment-segment (Flory-Huggins) interaction parameter
(χ). The interaction parameter χ has inverse temperature dependence, and
consequently a first order phase transition, called as order-disorder transition (ODT)
takes place as the temperature is raised. At high temperatures, the entropy dominates
and segments mix randomly to form a homogeneous (disordered) phase. At low
temperatures, the drive to lower the energy of the system dominates, and the blocks
locally segregate to minimize contacts between unlike monomers. This process,
National Chemical Laboratory
18 Introduction and Literature Review
referred to as microphase separation, results in the formation of periodic
morphology.11 Such a transition is associated with a significant change in the
viscoelastic properties of the material. ODTs of this kind have been commonly
observed in block copolymers,12-19 and have been the subject of extensive
investigations using techniques such as scattering,20-23 rheology12,24 and calorimetry.25
Polyurethanes, on the other hand typically show a weak ODT or a continuous
microphase mixing because of their ill defined microphase morphology.26
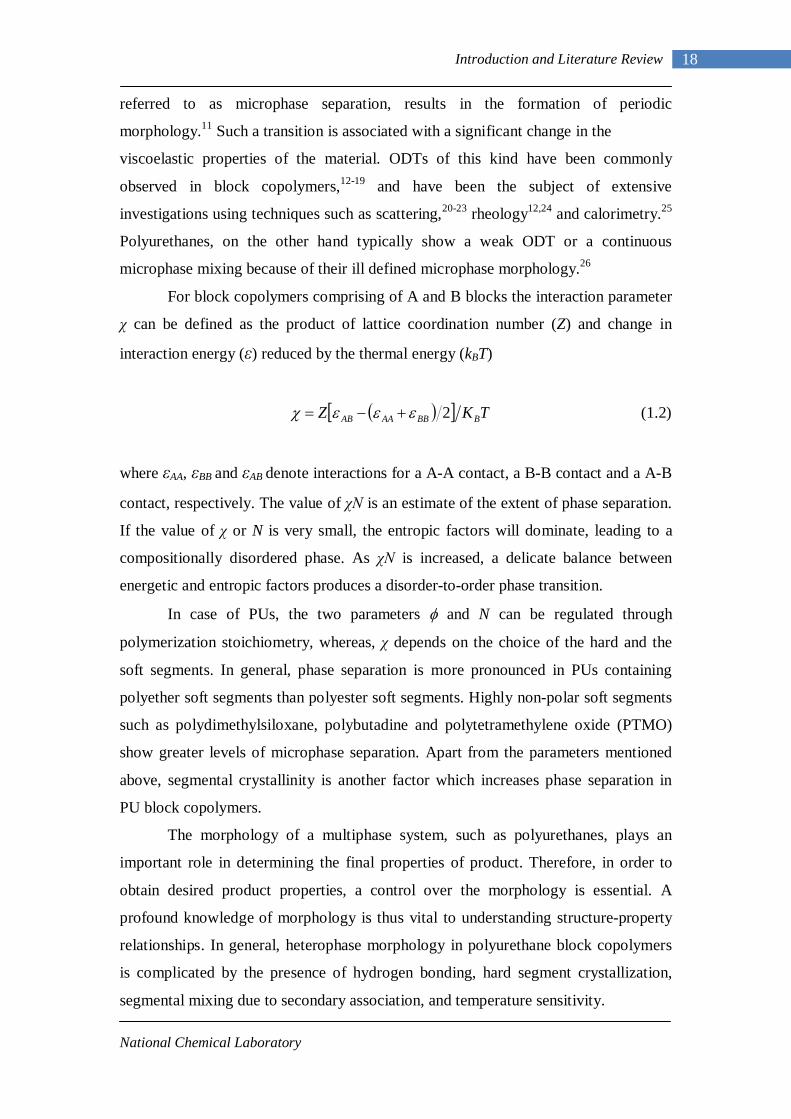
For block copolymers comprising of A and B blocks the interaction parameter
χ can be defined as the product of lattice coordination number (Z) and change in
interaction energy (ε) reduced by the thermal energy (kBT)
( )[ ] TKZ BBBAAAB 2εεεχ +−= (1.2)
where εAA, εBB and εAB denote interactions for a A-A contact, a B-B contact and a A-B
contact, respectively. The value of χN is an estimate of the extent of phase separation.
If the value of χ or N is very small, the entropic factors will dominate, leading to a
compositionally disordered phase. As χN is increased, a delicate balance between
energetic and entropic factors produces a disorder-to-order phase transition.
In case of PUs, the two parameters φ and N can be regulated through
polymerization stoichiometry, whereas, χ depends on the choice of the hard and the
soft segments. In general, phase separation is more pronounced in PUs containing
polyether soft segments than polyester soft segments. Highly non-polar soft segments
such as polydimethylsiloxane, polybutadine and polytetramethylene oxide (PTMO)
show greater levels of microphase separation. Apart from the parameters mentioned
above, segmental crystallinity is another factor which increases phase separation in
PU block copolymers.
The morphology of a multiphase system, such as polyurethanes, plays an
important role in determining the final properties of product. Therefore, in order to
obtain desired product properties, a control over the morphology is essential. A
profound knowledge of morphology is thus vital to understanding structure-property
relationships. In general, heterophase morphology in polyurethane block copolymers
is complicated by the presence of hydrogen bonding, hard segment crystallization,
segmental mixing due to secondary association, and temperature sensitivity.
National Chemical Laboratory
19 Introduction and Literature Review
1.4.2 Structure-Property Relationship
The physical properties of polyurethanes can vary considerably depending
upon the nature and amount of the three main components namely, polyol,
diisocyanate and chain extender. The mechanical properties of polyurethane are
strongly dependent on the extent of microphase separation and the details of domain
structure of phase separated morphology. At a primary level the morphology is
controlled by the chemical nature of monomers, molecular weight and distribution of
hard and soft segments, crosslinking, and degree of branching. At a secondary level,
the morphology is controlled by the three dimensional chain orientations and
crystallinity.
Soft Segment (SS):
The long flexible soft segment largely controls the low temperature properties,
weather resistance, solvent resistance and mechanical properties. The structure and
the molecular weight of soft segments also influence the morphology of
polyurethanes. Typically, soft segments with average molecular weights of 1000 –
5000 are used for synthesis of thermoplastic polyurethanes. Polyether urethanes show
a higher degree of phase separation than polyester urethanes due to greater
incompatibility of polyether soft segments with the polar hard segments.
Increasing the molecular weight of soft segments affects the properties of both
polyether and polyester urethanes. Velankar and Cooper27 studied the effect of
increasing soft segment molecular weight on microphase separation and viscoelastic
properties of polyester polyurethanes. A series of polyesterurethanes with differing
block length (soft segment MW = 830, 1250, 2000 & 3000) and constant composition
(soft segment ≈ 5 0 wt %) were synthesized and characterized by DSC, SAXS and
rheology. DSC and SAXS data showed that PUs synthesized with SS MW 830 and
1250 were single phase materials. The rheological behaviour of these two PUs was
akin to that of homopolymer melts and followed predictions of Rouse theory
reasonably well. DSC, SAXS and rheological analysis (Time Temperature
Superposition) for PUs having SS MW 2000 and 3000 showed progressive increase in
the extent of microphase separation with SS MW. In addition, the relaxation time and
Newtonian viscosity also showed strong dependence on soft segment length.
National Chemical Laboratory
20 Introduction and Literature Review
Although soft segments in polyurethanes are normally in the amorphous state,
tendency towards crystallization and cold-hardening increases with increase in soft
segment molecular weight. Soft segments were also observed to crystallize during
tensile deformation at low and medium elongations.28 Strain induced crystallization
leads to a self reinforcing effect, which enhances the modulus of the polymer. Yeh et
al.28 studied structure development during deformation of a segmented polyurethane-
urea elastomer. Stress induced crystallization of isotropically oriented PTMO soft
segments was observed with increasing strain. Also, both orientation and stress
induced crystallization relaxed after releasing the applied stress. WAXD results
showed that the initially isotropically oriented soft segments increase in orientation
with the increasing strain. At strains approaching 300-500%, strain induced
crystallization of soft segments was detected. Based on x-ray and vibrational
spectroscopic data, the authors proposed a morphological model of hard and soft
segment microphase separation, orientation and strain induced crystallization in the
soft segment.
In a recent work Korley et al.29 studied the effects of crystallinity in soft
segment phase comprising of polyether soft blocks with varying tendencies to
crystallize. In this study, the authors examined the morphology and mechanical
behavior of a series of polyurethanes containing PEO (1000 and 4600 g/mol) and
PEO-PPO-PEO (1900 g/mol) soft segments with varying hard segment content. It was
found that soft segment crystallinity in PEO (1000 g/mol) improved the storage
modulus of polyurethane below the Tm of the soft block and enhanced toughness
compared to the polyurethanes containing PEO-PPO-PEO soft segments. The study
showed that soft segments not only impart extensibility, but ordered soft segment
regions also reinforce the polyurethane matrix during deformation process in a similar
manner to the hard domains, dissipating energy and contributing to the overall
toughness.
Hard Segment (HS):
The elastomeric properties of polyurethane segmented block copolymers result
from the microphase separation between soft segment and hard segment sequences
which are respectively above and below their Tg at ambient conditions. HS sequences,
which are formed by the isocyanate and the chain extender molecules, can be
National Chemical Laboratory
21 Introduction and Literature Review
crystalline, semicrystalline or glassy. They form a nonresilient phase dispersed in the
continuous phase of the soft elastomeric segments. The HS microdomains act as
thermally labile physical cross-link sites as well as fillers for the rubbery SS matrix.
Considerable efforts have been made to elucidate the nature of hard segments in
polyurethanes.30-34
Typically, the morphology of polyurethanes consists of many HS rich domains
with sizes ranging from tens to hundreds of angstroms, dispersed in the matrix of soft
segments. The primary driving force for domain formation is the strong
intermolecular interaction between the urethane units, which are capable of forming
interurethane hydrogen bonds. The HS structure plays an important role in phase
separation. The incorporation of urea linkages in the HS has a profound effect on the
phase separation and domain structure of polyether polyurethane-ureas. This is due to
the increased polarity difference between hard and soft segments, and a likely
development of three dimensional hydrogen bonding network.35-37
Chain extender components and their properties also determine the
intermolecular interactions as well as the morphology of polyurethanes. Blackwell et
al.38 extensively studied the structure of hard segments in MDI-diol-
polytertamethylene adipate polyurethanes. They used butanediol (BDO), propanediol
(PDO), and ethylene glycol (EDO) as chain extenders. Poly MDI-BDO was found to
be the most crystalline hard segment. This was due to the extended chain
conformation of the HS resulting in strong hydrogen bonded network.
Urea groups, formed by the reaction of diisocyanate with diamine chain
extender, are excellent functionalities for use in hard segments of thermoplastic
elastomers because they are known to associate via bifurcated hydrogen bonds. Their
hydrogen bond strength exceeds that of amides and urethanes. But these elastomers
suffer from disadvantages such as poor melt processibility and incomplete solubility
in organic solvents. Due to very strong bifurcate hydrogen bonding between urea
groups, the melting or softening temperatures of urea segments are much higher than
their thermal decomposition temperatures.
In general, there are two different types of dispersed HS morphologies present
in segmented polyurethanes, when the concentration of HS is low: I) fibrillar domains
in which the domain axes coincide with the polymer chain axes, and II) the lamellar
domains in which the domain axes are perpendicular to the polymer chain axes. These
National Chemical Laboratory
22 Introduction and Literature Review
hard segment domains connect the linear polymer chains in both the lateral direction
and the chain direction, producing an effective crosslink network that is responsible
for the elastic properties of the polymer. Each microphase domain behaves as a cross-
link junction that is thermally reversible.
Generally, the HS content is a major factor influencing the mechanical
properties. It was observed using thermal, X-ray and AFM techniques that increasing
the HS content resulted in enhancement of hard domain crystallinity. Initial moduli
and tensile strength were also found to increase with concomitant decrease in the
ultimate elongation.29 This was attributed to the formation of more interconnected HS
domain morphology from randomly dispersed hard domains. Cooper et al.39 studied
the orientation of elastomeric polyurethane block copolymers using differential
infrared dichroism. Hard segment length and crystallinity were found to be primarily
responsible for the orientation. A drastic change in the orientation behaviour was
observed with the onset of interlocking hard segment morphology when the hard
segment content was increased from 24 to 28 wt%. Once the interlocked,
semicrystalline hard segments are formed, only minor changes in the orientation
behaviour due to change in volume fraction of hard segments were observed. Van
Bogart et al.,40 on the basis of X-ray scattering and DSC studies, concluded that
MDI/BD hard segments exist in semicrystalline domains whose crystallinity increased
as the hard segment length increased. The length of the hard segment blocks forms the
upper limit to the size of the hard segment crystals in the chain direction, which, in
turn determines the melting point. Increasing hard segment content was also found to
be accompanied with the broadening of the melting transition resulting from a
distribution of the hard segment crystal thickness.
Versteegen et al.41 studied the effect of uniform hard segments on the
morphology and properties of polyether ureas. Their study demonstrated that block
copoly(ether urea) with exactly two urea groups in the hard blocks showed
mechanical properties superior to less defined analogue possessing polydisperse hard
blocks. The strain at break (1000 – 2100%) and toughness of these materials were
claimed to be higher than commercially available thermoplastic elastomers. The
morphology of these materials consisted of long stacks of associated hard blocks
embedded in soft phase.
National Chemical Laboratory
23 Introduction and Literature Review
Yilgor et al.42 studied the influence of hydrogen bonding and diisocyanate
symmetry on microphase morphology. Their study on non-chain extended, segmented
polyether urethanes and polyether ureas showed some interesting results regarding the
microphase separation in these polymers. In their work, polyurethanes that were
prepared by using symmetrical diisocyanates, such as 1,4-phenylene diisocyanate
(PPDI), 1,6-hexamethylene diisocyanate (HDI) and 1,4-cyclohexyl diisocyanate
(CHDI) all showed microphase morphology, where ribbon-like hard segments
percolated through the soft segment matrix. On the other hand polyurethanes based on
unsymmetrical diisocyanates such as bis(4-isocyanatocyclohexyl)methane (HMDI),
2,6- and 2,4-toluene diisocyanate (TDI), MDI and 1,3-phenylene diisocyanate
(MPDI) did not display microphase morphology at room temperature. In contrast to
their urethane counterparts all polyether ureas, regardless of the structure or symmetry
of the diisocyanate displayed microphase morphology at room temperature. Their
study shows the important role of hard segment symmetry on the microphase
morphology of polyurethanes.
Over the past few years, there have been reports on the preparation of
segmented polyurethanes and polyureas without chain extenders and investigation of
their structure-property relationships.41-45 These polymers, not only display
microphase morphologies, but also show very attractive thermal and mechanical
properties comparable to the chain extended copolymers. These results disproved the
widely held belief that it is necessary to employ chain extension to produce
segmented polyurethanes and polyurea copolymers with useful structural properties.
Hydrogen Bonding:
Hydrogen bond, the strongest secondary chemical bond, is formed between a
proton donor and a proton acceptor. The urethane and urea linkages in polyurethanes
can serve both as proton donor and acceptor. Typical polyurethane is extensively
hydrogen bonded, the donor being N-H group of urethane or urea linkage in the hard
segment. At room temperature, approximately 90% of the N-H groups are found to be
hydrogen bonded.46 The proton acceptor may be either C=O in the urethane or urea
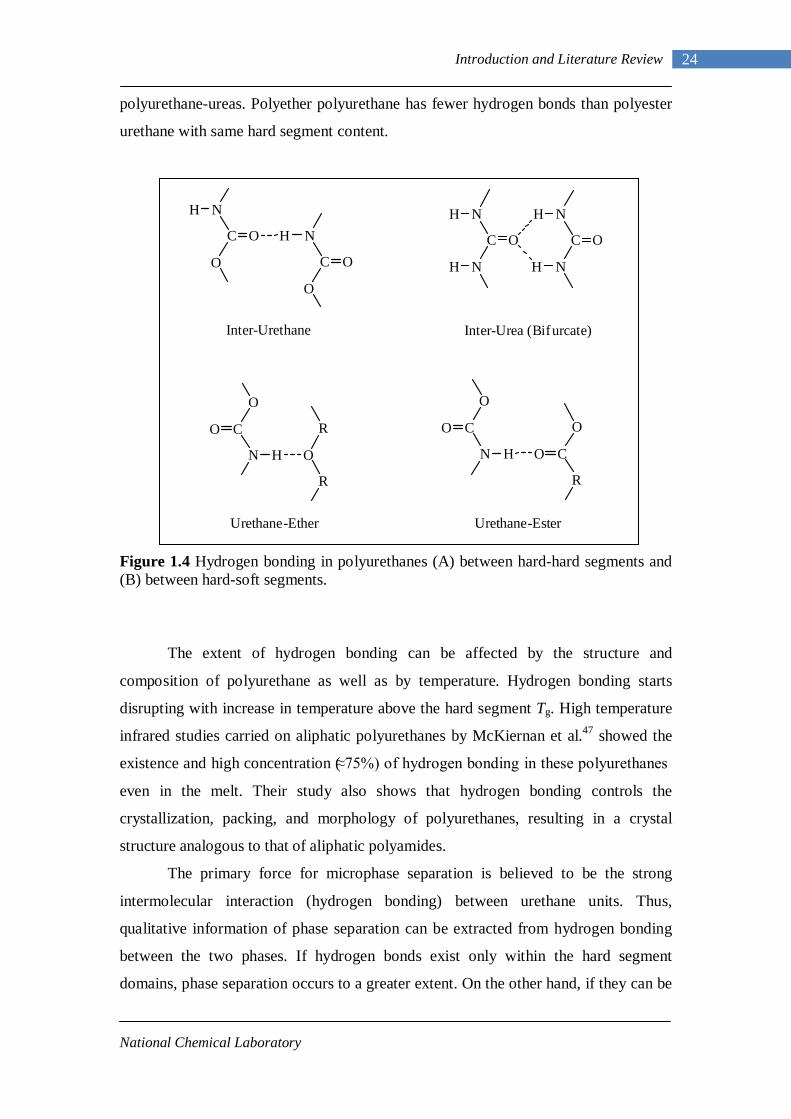
hard segment, or the ester C=O or ether –O- in the soft segment. Figure 1.4 shows
hydrogen bonds between various donors and acceptors in polyurethane and
National Chemical Laboratory
24 Introduction and Literature Review
polyurethane-ureas. Polyether polyurethane has fewer hydrogen bonds than polyester
urethane with same hard segment content.
Figure 1.4 Hydrogen bonding in polyurethanes (A) between hard-hard segments and (B) between hard-soft segments.
The extent of hydrogen bonding can be affected by the structure and
composition of polyurethane as well as by temperature. Hydrogen bonding starts
disrupting with increase in temperature above the hard segment Tg. High temperature
infrared studies carried on aliphatic polyurethanes by McKiernan et al.47 showed the
existence and high concentration (≈75%) of hydrogen bonding in these polyurethanes
even in the melt. Their study also shows that hydrogen bonding controls the
crystallization, packing, and morphology of polyurethanes, resulting in a crystal
structure analogous to that of aliphatic polyamides.
The primary force for microphase separation is believed to be the strong
intermolecular interaction (hydrogen bonding) between urethane units. Thus,
qualitative information of phase separation can be extracted from hydrogen bonding
between the two phases. If hydrogen bonds exist only within the hard segment
domains, phase separation occurs to a greater extent. On the other hand, if they can be
O
C
N
O
C
N
H
O H
O
Inter-Urethane
N
C
NH
O
N
C
NH
O
H H
Inter-Urea (Bifurcate)
O
C
N
O
H
R
O
R
Urethane-Ether
O
C
N
O
H
O
C
R
O
Urethane-Ester
National Chemical Laboratory
25 Introduction and Literature Review
formed between the soft and hard segments, the interphase hydrogen bonding
enhances the degree of phase mixing. The higher strength of hydrogen bonding in
polyureas48-50 and the three dimensional configuration of hydrogen bonded urea
groups have been studied.35,36
Wang and Cooper51 studied the effect of urea linkage, hard segment content,
and block length on the extent of phase separation, domain structure and physical
properties. It was observed that the presence of three dimensional hydrogen bonding
between the urea groups leads to unusually strong hard domain cohesion. That is,
single urea N-H group is bonded to two urea C=O in a nonplanar three dimensional
configuration.
FTIR spectroscopy has been used as a sensitive tool for the characterization of
hydrogen bonding.36,47,52-59 Although a number of vibrational modes are present in the
system, valuable information can be obtained from the N-H and C=O stretching
vibrations near 3200-3400 and 1600-1700 cm-1, respectively.
1.5 Morphological Characterization
Morphology of polyurethane block copolymers can be studied at three
different length scales. The smallest length scales correspond to molecular sizes such
as the block sequence, sequence distribution, hard segment crystallinity (up to few
nanometers), and these can be studied by NMR, FTIR spectroscopy and wide angle
X-ray diffraction (WAXD). The next length scale corresponds to mesoscopic size,
and this typically refers to the microphase separated domain structure (tens of
nanometers). The same can be investigated by direct methods such as TEM, AFM or
qualitatively by SAXS. The third level of microstructure is the spherulitic texture (in
micrometers) and can be characterized by using small angle light scattering, electron
microscopy and polarized light microscopy. However, complete characterization of
the morphology needs other supplementary thermal analytical methods such as DSC,
dynamic mechanical analysis (DMA), and rheology. Depending on the chemical
composition and the hard segment content, microphase morphologies such as
spherical, cylindrical and lamellar have been reported. Several characterization
techniques are used in combination to study microphase separation and the resulting
morphologies in polyurethanes.
National Chemical Laboratory
26 Introduction and Literature Review
Several studies have reported the application of FTIR technique for
characterization of hydrogen bonding in polyurethanes. Hydrogen bonding is
evidenced by a frequency shift to values lower than those observed when these groups
are free. Such shifts in the peak positions of N-H and C=O groups, depending on their
strength and the environment (ordered or disordered) of hydrogen bonding, yield
important information about the phase separated or phase mixed states.46,51,54,60-62
Based on their FTIR study, Wang and Cooper51 proposed the formation of three-
dimensional urea hydrogen bonds in segmented polyether polyurethane-urea
copolymers. Stress-strain studies carried out on these copolymers using IR dichroism
measurements showed, that the hard segments within the domains initially orient
transverse to the stretch direction, whereas soft segments orient parallel to the stretch
direction.
Painter and coworkers have done extensive studies on the characterization of
morphology in polyurethane and polyurethane-urea block copolymers. In a recent
study, Mattia and Painter used FTIR to examine the role of hydrogen bonding on the
morphology of polyurethane and polyurethane-urea and their blends with
polyethylene glycol.60 Their results indicate that polymer mixtures with polyethylene
glycol, form small ordered structures (imperfect crystals) with largely two-
dimensional packing of chain segments.
Yilgor et al.63 have also reported FTIR study of the time-dependent
morphology development in polyurethanes and polyureas to obtain valuable
quantitative information on the extent of microphase separation. IR dichroism has the
ability to provide a quantitative picture of average spatial orientation of several IR
absorbing species simultaneously. This technique has been used as a sensitive tool for
the analysis of orientation and relaxation responses of both amorphous as well as
crystalline regions of polyurethanes undergoing mechanical deformation.30,39,64,65
Dynamic IR spectroscopy has also been used successfully in the study of molecular
and submolecular origins of macroscopic rheological properties of polymeric
materials.66
Nuclear magnetic resonance (NMR) spectroscopy has also been used as a tool
for studying morphology of PU. Pulsed NMR technique is sensitive to the molecular
dynamics of polymers and was used for the investigation of phase interfaces as well
as the extent of microphase separation.67-70
National Chemical Laboratory
27 Introduction and Literature Review
Microscopy is the most direct way of the observation of morphology. Higher
magnification imaging is possible with electron microscopy, given sufficient electron
density contrast. However, poor natural contrast between hard and soft segments in
PU becomes a limiting factor in the extensive use of this technique. Heavy elemental
staining of domains is therefore required to generate sufficient contrast for TEM.71-78
More recently, atomic force microscopy (AFM) has proved to be an important
tool for the morphological investigation.79-84 For soft materials such as PU, the
tapping mode is more popular since it involves lower forces and only intermittent
contact between tip and the sample surface. This technique allows for simultaneous
detection of height and phase information which respectively provides insight into the
variations in topography and local stiffness.
In a comparative study of the morphology of highly branched polyurethane
urea copolymers, with their linear analogs, J.P. Sheth et al.85 have used AFM phase
imaging for the microstructure characterization. AFM imaging revealed differences in
the morphology of hard segment domains such as disorded, particulate, short rod like
and percolating. In another study, Sheth et al.86 have used AFM as a primary tool for
probing the hard segment phase connectivity and percolation in segmented
polyurethane-urea copolymers. The tapping mode phase images of the PUU sample
without hard segment branching showed the presence of long ribbon like hard
domains that percolated through the soft matrix. This long range connectivity was
found to be increasingly disrupted with higher levels of hard segment branching.
Korley et al.29 have used AFM imaging to study the effect of hard and soft
segment ordering on the development of morphology. At lower hard segment
contents, hard domains are observed to be randomly dispersed in a continuous soft
matrix. It was observed that interlocking hard domain morphology was developed on
increasing the hard block length. S. Das et al.45 recently carried out morphological
analysis of non-chain extended polyether polyureas which showed phase separated
morphologies with hard segments forming thread-like crystalline structures that were
dispersed in the continuous soft segment matrix.
Small angle X-ray scattering (SAXS), is another technique which is very
popular in the morphological study of PU.27,33,34,64,87-93 SAXS is advantageous in some
aspects such as ease of sample preparation. Advent of synchrotron X-ray sources has
opened up the possibility of real time measurements of morphological changes,
National Chemical Laboratory
28 Introduction and Literature Review
including those caused by mechanical deformation and microphase separation
kinetics. Scattering in the Porod region is related to morphological fine detail.
Generally this can be attributed to the nature of interfaces between micordomains.
SAXS has been successfully utilized to study the width and the nature of interphases94
(Porod scaling). The ratio of SAXS invariants has been used as an indicator of the
extent of phase separation in TPU. But, interpretation of morphology from SAXS data
alone is not unambiguous, and requires help from other techniques.
The majority of information about polyurethane microstructure has been
obtained through X-ray scattering experiments which have resulted in different
schematic models of hard segment structure. Laity et al.90 have provided an excellent
review on small angle scattering models for segmented polyether urethane
copolymers. The authors have reviewed various models proposed as a basis for
interpreting scattering data from polyurethanes. SAXS data from several experimental
and commercial polyether formulations was used to test scattering models based on
different morphologies. In one of the early X-ray scattering experiments on
polyurethanes, Bonart et al.30,95,96 proposed a hard segment packing model in which
hard segments are ordered laterally in order to maximize the hard-hard segment
hydrogen bonding. Hard segment sequences were assumed to exist in extended
configurations within lamellar or sheetlike microdomains. Koberstein and Stein97
carried out a detailed SAXS study and proposed that hard segment sequences must be
present in either coiled or folded configurations and have developed a lamellar model
based on their study. Support to such lamellar model allowing partially coiled hard
segment sequence came due to a detailed work by Leung and Koberstein from SAXS
and neutron scattering analysis.33 The thickness of the hard segment microdomain
obtained from the model was approximately four hard segment repeat units. Their
results also provided evidence for a transition from discrete to continuous hard
domain morphology with increase in hard segment content above ca. 50%. X-ray
scattering data was also analyzed to estimate details of microphase separated domains
such as their diffuse boundary thickness, surface-to-volume ratio, microdomain purity
and specific interfacial area.
Ryan et al. have used small angle X-ray scattering as a tool for studying the
temperature dependent morphological properties of polyurethane.87 Time resolved
National Chemical Laboratory
29 Introduction and Literature Review
SAXS data showed a strong Bragg reflection at low temperatures, and the same
disappeared at high temperatures due to order-disorder transition.
Differential scanning calorimetry (DSC) has been used as a common tool to
determine thermal changes, for example, enthalpy changes associated with glass
transitions (Tg), and enthalpy changes associated with phase separation,98
crystallization,89 and ordering in the hard segments.46 DSC data has also been used to
estimate the phase composition of a microphase separated sample from the measured
Tg values of the two phases.27,99
The presence of multiple α-transitions in PU block copolymers have been
studied by many research groups using dynamic mechanical analysis (DMA). The
detection of hard segment Tg in PUs often becomes difficult due to very small changes
in the heat capacity associated with the transition.100 DMA proves to be a more
sensitive tool in such cases. Extensive studies on the use of dynamic mechanical
analysis for the characterization of PU have been carried out by Cooper,101,102
Wilkes,103 Schneider and co-workers104 to name a few.
The effects of viscoelasticity on the kinetics and morphology of phase
separation in block copolymers have been studied since past two decades following
the first observation by DeGennes et al.105-108 Rheological techniques have been in use
as an alternative method for the characterization of microstructural changes taking
place in the sample, especially during phase transition stages.109-111 In case of block
copolymers, the order-to-disorder transition (ODT) is known to take place with
concurrent changes in the viscoelastic parameters. Viscoelastic behavior of a block
copolymer in the ordered and disordered state is quite different. Ordering causes the
copolymer to resist flow leading to higher shear modulus.111,112 In isochronal dynamic
temperature sweep experiment, elastic modulus, would therefore, be expected to drop
discontinuously with the onset of phase mixing. This is expected to be more
pronounced in case of molecules with well defined architectures, such as diblock
copolymers having long range microstructure ordering. A homogeneous, molten
polymer on the other hand, displays a gradual decrease of elastic modulus with
increasing temperature in isochronal temperature sweep test.
The principle of time temperature superposition (TTS) has also been used as a
test for heterogeneous morphology. TTS works when all measured relaxation times
have the same temperature dependence. Heterogeneity in the sample is associated
National Chemical Laboratory
30 Introduction and Literature Review
with the differences in temperature dependence of relaxation times, leading to
violation of TTS. Velankar and Cooper27 carried out an extensive rheological study on
polyester urethanes to investigate the effect of soft segment block length on
microphase separation using TTS as one of the characterization tools. Yoon and
Han113 studied the effect of thermal history on the rheological behaviour of
commercial PUs. Time evolution of the dynamic storage and loss moduli (G’ and G’’)
during isothermal annealing was found to be sensitive to the thermal history of the
samples.
Dario Nichetti and Nano Grizzuti have used rheological measurements for
studying microstructure modifications in TPU that occur during phase transitions.109 It
was observed that microstructural aging during isothermal annealing, which was not
detected by DSC, was clearly observed as an increase in elastic modulus. Their work
showed that rheology can be successfully used for the qualitative as well as
quantitative characterization of kinetics of phase transition.
1.6 Morphologies Reported in the Literature
Estes and co-workers65 were the first to propose a two phase model for
polyurethane morphology with semicontinuous and interpenetrating domains.
Lamellar morphologies have been reported in PUs based on the TEM
observations.73,74,76,78 This morphology is observed in block copolymers with a
volume fraction of one of the component (φA) around 0.5, and characterized by
extensive parallel sheets of alternating composition. Chi Li and co-workers114 studied
the morphology of polybutadine-polyurethanes containing a wide range of hard
segment content (MDI-BDO). It was observed that polyurethanes containing low hard
segment content showed dispersed, short, hard segment cylinders embedded in a
matrix of polybutadine soft segments. Polyurethanes having higher hard segment
content showed alternating rod like or lamellar microdomain structure. Whereas, at
high hard segment contents, dispersed soft segment phase morphology was observed.
Versteegen et al.41 have observed long stacks of hard blocks embedded in soft
phase for the segmented copoly(ether urea)s having uniform hard segments. Das et
al.45 studied structure-property relationship of segmented, non-chain extended
polyureas. AFM imaging on these polyureas showed the presence of a microphase
National Chemical Laboratory
31 Introduction and Literature Review
separated structure, with thread like hard segments randomly dispersed throughout the
soft segment matrix. Revenko et al.115 studied heterophase morphology of
polyurethanes containing aliphatic soft segments (HS content 30 wt %) using tapping
mode AFM. Authors have observed rod like hard domains of about 50 nm length
dispersed in the soft segment matrix. Later Christenson et al.116 have also reported a
similar morphology in polycarbonate polyurethanes. Hard segment domains were
found to be cylindrical having 5-10 nm in width and 40-100 nm in length for this
polyurethane.
Hernandez et al.117 recently studied phase organization in a series of
segmented polyurethanes having different soft segment chemistries by AFM, SAXS,
FTIR and DSC. Three series of polyurethanes synthesized in this study had soft
segments composed of either an aliphatic polycarbonate, polytetramethyleneoxide, or
a mixed macrodiol of polyhexamethyleneoxide (PHMO) and hydroxyl terminated
PDMS and the same hard segment chemistry (MDI and 1,4-butanediol). Their
morphological analysis demonstrates the presence of three phase core-shell
morphology in PHMO/PDMS based copolymers, while the other two copolymers
demonstrated two phase microstructure. Hard domain dimensions were approximately
50-75 nm2.
1.7 Summary
A typical thermoplastic polyurethane (TPU) and its analogue polyurethane-
urea (PUU) are (AB)n type block copolymers consisting of random sequences of hard
and soft segments. As a result of the pioneering efforts of Otto Bayer and co-workers
(1930), polyurethane chemistry opened the way to a new class of high performance
materials. Since then TPUs have become the materials of choice in a steadily
increasing number of very different applications in the form of fibers, elastomers,
rigid and soft foams. TPUs today play an important role within the rapidly growing
family of thermoplastic elastomers. The versatility of chemistry allows the production
of polyurethanes using a wide range of monomers which consists of three basic
components: an aromatic or aliphatic diisocyanate, a polyether or polyester polyol
(soft segment), and a short chain extender diol, or a diamine. Tailoring the molecular
weight, chemistry, topology, and composition of the different blocks can result in
materials ranging from soft elastomers to rigid, hard thermoplastics.
National Chemical Laboratory
32 Introduction and Literature Review
The exothermic polyaddition reaction between diols and diisocyanates can be
carried out in bulk or in solution. In ‘one-shot method’ method of synthesis, all
reaction components are mixed simultaneously and allowed to polymerize. The
‘prepolymer method’ of synthesis involves formation of isocyanate terminated
prepolymer in the first step by reacting excess of diisocyanate with polyol, which is
then reacted with the chain extender to produce high molecular weight polymer.
Reaction conditions as well as the method used for the synthesis has a marked
influence on the morphology and hence on the properties of resulting polymer.
Prepolymer method produces polyurethanes having superior properties due to regular
structural arrangements of blocks leading to better packing and crystallization of hard
segment sequences.
Polyurethane macromolecules are composed of flexible polyether or polyester
segments of low Tg (typically below ambient temperature) and rigid urea or urethane
blocks having high Tg (typically above ambient temp.). The incompatibility between
hard and soft segments lead to mircophase separation forming hard urea or urethane
domains segregated from soft matrix. The degree to which hard and soft segments
microphase separate and the resulting morphology have a profound effect on the
mechanical properties of these polymers. Their tendency to microphase separate into
periodic morphologies depends upon the composition, molecular weight, and
monomer-monomer interaction parameter (χ). The driving force for phase separation
is believed to be the strong hydrogen bonding between urethane and urea groups.
Phase separation is thus stronger in the case of polyurea as a result of strong bifurcate
hydrogen bonding.
Many techniques have been used to investigate microphase separation in
polyurethanes and the resulting morphology. The multiple bands observed by infrared
spectroscopy have been used for studying hard segment hydrogen bonding in phase
mixed or phase separated environments. DMA and DSC have been used extensively
to study multiple glass transitions and enthalpy peaks related to the microphase
separation. The data obtained from DSC has also been used successfully for
determining phase compositions. Low natural contrast between microdomains has
prohibited the widespread use of transmission electron microscopy in studying
polyurethane morphology. More recently, atomic force microscopy (AFM) has
become an essential tool for studying polyurethane morphology. Small angle X-ray
National Chemical Laboratory
33 Introduction and Literature Review
scattering (SAXS) is one of the most popular technique for morphological study of
polyurethanes. SAXS has been used to obtain valuable information about the extent of
phase separation, type of microphase morphology, average size of the microdomains,
nature of interfaces etc. Rheological techniques have also been used as alternative
method for the characterization of microstructural changes taking place in the sample,
especially during phase transition stages.
References :
(1) Otto Bayer German patent 1937.
(2) Schollenberger, C. S.; Scott, H.; Moore, G. R. Paper presented at the ACS Rubber Div. Mtg. 2008.
(3) Cooper, S. L.; Tobolsky, A. V. J. Appl. Polym. Sci. 1966, 10, 1837.
(4) Grieve, R. L. Internet Communication 2008.
(5) Huntsman Polyurethanes Internet Communication 2008.
(6) Woods, G. The ICI Polyurethanes Book; John Wiley and Sons, New York: 1990.
(7) Wurtz.A Ann. 1849, 71, 326.
(8) Hentschel.W. Ber. 1884, 17, 1284.
(9) Yilgor, I.; Mather, B. D.; Unal, S.; Yilgor, E.; Long, T. E. Polymer 2004, 45, 5829.
(10) G.Woods The ICI Polyurethanes Book; John Wiley and Sons, New York: 1990.
(11) Leibler, L. Macromolecules 1980, 13, 1602.
(12) Sakamoto, N.; Hashimoto, T.; Han, C. D.; Kim, D.; Vaidya, N. Y. Macromolecules 1997, 30, 1621.
(13) Khandpur, A. K.; Fo¨rster, S.; Bates, F. S.; Hamley, I. W.; Ryan, A. J.; Bras, W.; Almdal, K.; Mortensen, K. Macromolecules 1995, 28, 8796.
(14) Fo¨rster, S.; Khandpur, A. K.; Zhao, J.; Bates, F. S.; Hamley, I. W.; Ryan, A. J.; Bras, W. Macromolecules 1994, 27, 6922.
(15) Hamley, I. W.; Koppi, K. A.; Rosedale, J. H.; Bates, F. S.; Almadal, K.; Mortensen, K. Macromolecules 1993, 26, 5659.
National Chemical Laboratory
34 Introduction and Literature Review
(16) Almdal, K.; Koppi, K. A.; Bates, F. S.; Mortensen, K. Macromolecules 1992, 25, 1743.
(17) Hajduk, D. A.; Gruner, S. M.; Rangarajan, P.; Register, R. S.; Fetters, L. J.; Honeker, C.; Albalak, R. J.; Thomas, E. L. Macromolecules 1994, 27, 490.
(18) Sakurai, S.; Momii, T.; Taie, K.; Shibayama, M.; Nomura, S.; Hashimoto, T. Macromolecules 1993, 26, 458.
(19) Sakurai, S.; Kawada, H.; Hashimoto, T.; Fetters, L. Macromolecules 1993, 26, 5796.
(20) Korbestein, J. T.; Russell, T. P.; Walsh, D. J.; Pottick, L. Macromolecules 1990, 23, 877.
(21) Yang, Y.; Tanodekaew, S.; Mai, S.; Booth, C.; Ryan, A. J.; Bras, W.; Viras, K. Macromolecules 1995, 28, 6029.
(22) Adams, J. L.; Quiram, D. J.; Graessley, W. W.; Register, R. A.; Marchand, G. R. Macromolecules 1996, 29, 2929.
(23) Sakamoto, N.; Hashimoto, T. Macromolecules 1995, 28, 6825.
(24) Lee, K. M.; Han, C. D. Macromolecules 2002, 35, 760.
(25) Bates, F. S.; Bair, H. E.; Hartney, M. A. Macromolecules 1984, 17, 1987.
(26) Eitouni, H. B.; Rappl, T. J.; Gomez, E. D.; Balsara, N. P.; Qi, S.; Chakraborty, A. K.; Fre´chet, J. M. J.; Pople, J. A. Macromolecules 2004, 37, 8487.
(27) Velankar, S.; Cooper, S. L. Macromolecules 1998, 31, 9181.
(28) Yeh, F.; Hsiao, B. S.; Sauer, B. B.; Michel, S.; Siesler, H. W. Macromolecules 2003, 36, 1940.
(29) Korley, L. T. J.; Pate, B. D.; Thomas, E. L.; Hammond, P. T. Polymer 2006, 47, 3073.
(30) Bonart, R.; Morbitzer, L.; Hentze, G. J. Macromol. Sci. -Phys. 1969, 3[2], 337.
(31) Cooper, S. L.; Tobolsky, A. V. J. Appl. Polym. Sci. 1966, 10, 1837.
(32) Wilkes, C. W.; Yusek, C. J. Macromol. Sci. 1973, B7, 157.
(33) Leung, L. M.; Koberstein, J. T. J. Polym. Sci. -Phys. 1985, 23, 1883.
(34) Musselman, S. G.; Santosusso, T. M.; Barnes, J. D.; Sperling, L. H. J. Polym. Sci. -Phys. 1999, 37, 2586.
(35) Bonart, R.; Morbitzer, L.; Muller, E. H. J. Macromol. Sci. Phys. 1974, B9, 447.
(36) Sung, C. S. P.; Smith, T. W.; Sung, N. H. Macromolecules 1980, 13, 117.
National Chemical Laboratory
35 Introduction and Literature Review
(37) Knutson, K.; Lvman, D. J. Adv. Chem. Ser. 1982, 199.
(38) Blackwell, J.; Nagarajan, M. R. Polymer 1981, 22, 202.
(39) Seymour, R. W.; Allegrezza, A. E.; Cooper, S. L. Macromolecules 1973, 6[6], 896.
(40) Van Bogart, J. W. C.; Gibson, P. E.; Cooper, S. L. J. Polym. Sci. -Phys. 1983, 21, 65.
(41) Versteegen, R. M.; Kleppinger, R.; Sijbesma, R. P.; Meijer, E. W. Macromolecules 2006, 39, 772.
(42) Yilgor, I.; Yilgor, E. Polym. Rev. 2007, 47, 487.
(43) Sheth, J. P.; Klinedinst, D. B.; Wilkes, G. L.; Yilgor, I.; Yilgor, E. Polymer 2005, 46, 7317.
(44) Versteegen, R. M.; Sijbesma, R. P.; Meijer, E. W. Macromolecules 2005, 38, 3176.
(45) Das, S.; Yilgor, I.; Yilgor, E.; Inci, B.; Tezgel, O.; Beyer, F. L.; Wilkes, G. L. Polymer 2007, 48, 290.
(46) Seymour, R. W.; Cooper, S. L. Macromolecules 1973, 6, 48.
(47) McKiernan, R. L.; Heintz, A. M.; Hsu, S. L.; Atkins, E. D. T.; Penelle, J.; Gido, S. P. Macromolecules 2002, 35, 6970.
(48) Coleman, M. M.; Lee, K. L.; Skrovanek, D. J.; Painter, P. C. Macromolecules 1986, 19, 2149.
(49) Coleman, M. M.; Skrovanek, D. J.; Hu, J.; Painter, P. C. Macromolecules 1988, 21, 59.
(50) Coleman, M. M.; Sobkowiak, M.; Pehlert, G. J.; Painter, P. C. Macromol. Chem. Phys. 1997[198], 117.
(51) Wang, C. B.; Cooper, S. L. Macromolecules 1983, 16, 775.
(52) Lee, H. S.; Wang, Y. K.; Hsu, S. L. Macromolecules 1987, 20, 2089.
(53) Lee, H. S.; Hsu, S. L. Macromolecules 1989, 22, 1100.
(54) Senich, G. A.; MacKnight, W. J. Macromolecules 1980, 13, 106.
(55) Sung, C. S. P.; Hu, C. B. Macromolecules 1981, 14, 212.
(56) Tang, W.; MacKnight, W. J.; Hsu, S. L.; Wang, Q.; Stidham, H. D. Macromolecules 1995, 28, 4284.
(57) Teo, L. S.; Chen, C. Y.; Kuo, J. F. Macromolecules 1997, 30, 1793.
National Chemical Laboratory
36 Introduction and Literature Review
(58) Irusta, L.; Iruin, J. J.; Fernandez-Berridi, M. J.; Sobkowiak, M.; Painter, P. C.; Coleman, M. M. Vib. Spectrosc. 2000, 23, 187.
(59) Painter, P. C.; Shenoy, S. L.; Bhagwager, D. E.; Fishburn, J.; Coleman, M. M. Macromolecules 1991, 24, 5623.
(60) Mattia, J.; Painter, P. C. Macromolecules 2007, 40, 1546.
(61) Seymour, R. W.; Estes, G. M.; Cooper, S. L. Macromolecules 1970, 3, 579.
(62) Yilgor, E.; Burgaz, E.; Yurtsever, E.; Yilgor, I. Polymer 2000, 41, 849.
(63) Yilgor, I.; Yilgor, E.; Guler, G. I.; Ward, T. C.; Wilkes, G. L. Polymer 2006, 47, 4105.
(64) Bonart, R. J. J. Macromol. Sci-Phys. 1968, B2[1], 115.
(65) Estes, G. M.; Seymour, R. W.; Cooper, S. L. Macromolecules 1971, 4, 452.
(66) Gregoriou, V. G.; Rodman, S. E.; Nair, B. R.; Hammond, P. T. J. Phys. Chem. B 2002, 106, 11108.
(67) Assink, R. A.; Wilkes, G. L. Polym. Eng. Sci. 1977, 17[8], 606.
(68) Voda, M. A.; Demco, D. E.; Voda, A.; Schauber, T.; Adler, M.; Dabisch, T.; Adams, A.; Baias, M.; Blu1mich, B. Macromolecules 2006, 39, 4802.
(69) Clayden, N. J.; Nijs, C.; Eeckhaut, G. Macromolecules 1998, 31, 7820.
(70) Nierzwicki, W. J. Appl. Polym. Sci. 1984, 29, 1203.
(71) Koutsky, J. A.; Hien, N. V.; Cooper, S. L. Polymer Letters 1970, 8, 353.
(72) Hamley, I. W.; Stanford, J. L.; Wilkinson, A. N.; Elwell, M. J.; Ryan, M. J. Polymer 2000, 41, 2569.
(73) Eisenbach, C. D.; Stadler, E. Macromol. Chem. Phys. 1995, 196, 1981.
(74) Eisenbach, C. D.; Heinemann, T.; Ribbe, E.; Stadler, E. Macromol. Symp. 1994, 77, 125.
(75) Eisenbach, C. D.; Heinemann, T.; Ribbe, E.; Stadler, E. Angew. Makromol. Chem. 1992, 202, 221.
(76) Serrano, M.; MacKnight, W. J.; Thomas, E. L.; Ottino, J. M. Polymer 1987, 27, 1667.
(77) Wang, G.; Fang, B.; Zhang, Z. Polymer 1994, 35, 3178.
(78) Ryan, A. J.; Stanford, J. L.; Tao, X. Q. Polymer 1993, 34, 4020.
(79) O'Sickey, M. J.; Lawrey, B. D.; Wilkes, G. L. J. Appl. Polym. Sci. 2003, 89, 3520.
National Chemical Laboratory
37 Introduction and Literature Review
(80) O'Sickey, M. J.; Lawrey, B. D.; Wilkes, G. L. J. Appl. Polym. Sci. 2002, 84, 229.
(81) Garrett, J. T.; Siedlecki, C. A.; Runt, J. Macromolecules 2001, 34, 7066.
(82) Garrett, J. T.; Runt, J.; Lin, J. S. Macromolecules 2000, 33, 6353.
(83) Kaushiva, B. D.; Wilkes, G. L. Polymer 2000, 41, 6981.
(84) McLean, R. S.; Sauer, B. B. Macromolecules 1997, 30, 8314.
(85) Sheth, J. P.; Unal, S.; Yilgor, E.; Yilgor, I.; Beyer, F. L.; Long, T. E.; Wilkes, G. L. Polymer 2005, 46, 10180.
(86) Sheth, J. P.; Wilkes, G. L.; Fornof, A. R.; Long, T. E.; Yilgor, I. Macromolecules 2005, 38, 5681.
(87) Ryan, A. J.; Macosko, C. W.; Bras, W. Macromolecules 1992, 25, 6277.
(88) Chu, B.; Gao, T.; Li, Y.; Wane, J.; Deeper, C. R.; Byrne, C. A. Macromolecules 1992, 25, 5724.
(89) Koberstein, J. T.; Russell, T. P. Macromolecules 1986, 19, 714.
(90) Laity, P. R.; Taylor, J. E.; Wong, S. S.; Khunkamchoo, P.; Norris, K.; Cable, M.; Andrews, G. T.; Johnson, A. F.; Cameron, R. E. Polymer 2004, 45, 7273.
(91) Velankar, S.; Cooper, S. L. Macromolecules 2000, 33, 382.
(92) Tyagi, D.; McGrath, J. E.; Wilkes, G. L. Polym. Eng. Sci. 1986, 26, 1371.
(93) Wilkes, C. E.; Yusek, C. S. J. Macromol. Sci-Phys. 1973, B7[1], 157.
(94) Koberstein, J. T. J. Polym. Sci. -Phys. 1983, 21, 2181.
(95) Bonart, R.; Morbitzer, L.; Muller, E. H. J. Macromol. Sci. Phys. 1974, B9, 447.
(96) Bonart, R.; Muller, E. H. J. Macromol. Sci. Phys. 1974, B10, 177.
(97) Koberstein, J. T.; Stein, R. S. J. Polym. Sci. -Phys. 1983, 21, 1439.
(98) Leung, L. M.; Koberstein, J. T. Macromolecules 1986, 19, 706.
(99) Saiani, A.; Daunch, W. A.; Verbeke, H.; Leenslag, J. W.; Higgins, H. S. Macromolecules 2001, 34, 9059.
(100) Camberlin, Y.; Pascault, J. P. J. Polym. Sci. -Phys. 1984, 22, 1835.
(101) Huh, D. S.; Cooper, S. L. Polym. Eng. Sci. 1971, 11, 369.
(102) Ng, H. N.; Allegrezza, A. E.; Seymour, R. W.; Cooper, S. L. Polymer 1973, 14, 255.
National Chemical Laboratory
38 Introduction and Literature Review
(103) Samuels, S. L.; Wilkes, G. L. J. Polym. Sci. Pt. C 1973, 43, 149.
(104) Illinger, J. L.; Schneider, N. S.; Karasz, F. E. Polym. Eng. Sci. 1972, 12, 25.
(105) De Gennes, P. G. Macromolecules 1976, 9, 594.
(106) De Gennes, P. G. Macromolecules 1976, 9, 587.
(107) Brochard, F.; De Gennes, P. G. Macromolecules 1977, 10, 1157.
(108) De Gennes, P. G. J. Chem. Phys. 1980, 72, 4756.
(109) Nichetti, D.; Grizzuti, N. Polym. Eng. Sci. 2004, 44[8], 1514.
(110) Ryu, D. Y.; Jeong, U.; Kim, J. K.; Russell, T. P. Nature Materials 2002, 1[October], 114.
(111) Rosedale, J. H.; Bates, F. S. Macromolecules 1990, 23, 2329.
(112) Bates, F. S.; Rosedale, J. H.; Bair, H. E.; Russell, T. P. Macromolecules 1989, 22, 2257.
(113) Yoon, P. J.; Han, C. D. Macromolecules 2000, 33, 2171.
(114) Li, C.; Goodman, S. L.; Albercht, R. M.; Cooper, S. L. Macromolecules 1988, 21, 2367.
(115) Revenko, I.; Tang, Y.; Santerre, J. P. Surf. Sci. 2001, 491, 346.
(116) Christenson, E. M.; Dadesetan, M.; Wiggins, M.; Anderson, J. M.; Hiltner, A. J. Biomed. Mat. Res. 2004, 69, 407.
(117) Hernandez, R.; Weksler, J.; Padsalgikar, A.; Choi, T.; Angelo, E.; Lin, J. S.; Xu, L.; Siedlecki, C. A.; Runt, J. Macromolecules 2008, 41, 9767.

Objectives and Scope
Chapter - 2
National Chemical Laboratory
39 Objectives and Scope
Polyurethane elastomers are industrially important polymeric materials
because of their wide range of applications, and their properties, which can be
controlled by changes in the starting materials, preparation conditions and so on.1 As
described in Chapter 1, thermoplastic polyurethanes (PU) and their analogue
polyurethane-ureas (PUU) are (AB)n type random block copolymers consisting of
sequences of hard and soft segments. Thermodynamic incompatibility between hard
and soft segments, and/or crystallinity in the hard segment drives them to phase
separate.2 However, phase separation is limited at the segmental level due to
connectivity of the blocks.3,4 The primary driving force for domain formation is the
intermolecular interactions between urethane / urea units which are capable of
forming hydrogen bonds. The incorporation of urea linkages in PU hard segment has
a profound effect on the phase separation and microphase morphology.5-7
The extent of microphase separation and the phase morphology have a
profound effect on the ultimate properties of the copolymer. Hence it is desirable to
have a control on the microphase separation in polyurethanes. Factors that are known
to control the degree of microphase separation include copolymer composition, block
length and crystallizability of either segment.8 In the present work we have tested a
new hypothesis for achieving control on microphase separation namely, the use of
structural moieties that produce ‘defects’ in the packing of hard segments. The
inspiration for this idea is derived from semicrystalline polymers in which the role of
defect moieties in controlling the size of crystalline structures is well known. For
example, alpha olefins when copolymerized with ethylene in linear low density
polyethylene chains act as defects since they cannot be incorporated into the unit cell
of a polyethylene crystal and thereby inhibit the formation of long range crystalline
order. As a result, thinner lamellae and smaller spherulites are formed. This
microstructure is used to make polyethylene films of improved transparency and
toughness. In a similar manner, we hypothesize that defect moieties when
incorporated into hard segments of a PU or PUU might inhibit the effective
organization of hard domains. Thus the primary objective of the present work was to
test this hypothesis, and consequently to study the effect of controlled introduction of
defects in the hard segments on the phase morphology and the ultimate properties of
PUUs. The defect moieties that we have studied in this work are diamines having long
National Chemical Laboratory
40 Objectives and Scope
aliphatic side chains, which form short branches on the hard segments of a PU
molecule.
Present study systematically investigates the role of the content and the length
of aliphatic chains on the microphase mixing in PUU copolymers. Our study
demonstrates that morphology of polyurethanes can indeed be controlled by
introducing chain defects in the hard segments.
The scope of the present study is as follows:
• Synthesis of a linear aliphatic polyurethane containing poly(tetramethylene
oxide) as the soft segment and isophorone diisocyanate in combination with
butanediol chain extender as the hard segment. The ratio of hard segment to
soft segment was 50:50. This is the control sample.
• Design and synthesis of two different aromatic diamine monomers having
pendent aliphatic chains of different lengths which can be used as chain
extender molecules. Specifically, these molecules were n-dodecyl 3,5-
diaminobenzoate and n-docosyl 3,5-diaminobenzoate.
• Synthesis of two different series of branched polyurethane-ureas using the two
aromatic diamine chain extenders indicated above; each series contained
varying amounts of the aromatic diamines. The adjective ‘branched’ used here
refers to the presence of alkyl side chains on the polymer.
• Synthesis of a series of linear polyurethane-ureas with varying content of a
chain extender that had no pendent alkyl chain (m-phenylenediamine).
• Synthesis of model hard segments using n-dodecyl 3,5-diaminobenzoate and
m-phenylenediamine in combination with 1,4-butanediol.
• Molecular characterization of the polymers synthesized using 1H-NMR and
gel permeation chromatography (GPC).
National Chemical Laboratory
41 Objectives and Scope
• Morphological characterization of synthesized polymers by using differential
scanning calorimetry (DSC), dynamic mechanical analysis (DMA), and small
angle x-ray scattering (SAXS) and rheology.
• Measurement of tensile properties of the polymers.
Here, we briefly take a look at the forthcoming chapters in the thesis. The next
chapter, Chapter 3: Synthesis of Chain Extenders and Polyurethane-ureas, is divided
into four parts: Part I discusses about the two-step synthesis of branching agents (n-
alkyl 3,5-diaminobenzoates) and their structural characterization by 1H NMR, FTIR
and Elemental Analysis. Part II describes the synthesis of linear polyurethane L-PU,
as a control sample. This part also discusses the synthesis of a series of linear
polyurethane-ureas L-PUUs using m-phenylenediamine. Part III describes the two-
step solution polymerization of polyurethane-ureas containing n-alkyl 3,5-
diaminobenzoate (n = 10, 20) branching agents (B12-PUU and B22-PUU series).
Lastly, part IV of this chapter explains the synthesis of model hard segments using
diisocyante (IPDI), in combination with of 1,4-butanediol and n-alkyl 3,5-
diaminobenzoates. This follows their characterization using proton NMR, FTIR, and
DSC.
Chapter 4 discusses the molecular characterization of synthesized polymers
described in chapter 3, by 1H-NMR, FTIR and molecular weight analysis by GPC.
This leads to chapter 5, which details the systematic investigation of heterophase
morphology of synthesized polymers at various length scales. This involves probing
hydrogen bonding as a function of temperature by using FTIR, thermal analysis by
DSC and DMTA, SAXS, viscoelastic behaviour by rheology, and finally, mechanical
properties by tensile measurements. This is followed by chapter 6 which draws some
important conclusions on morphology of PUUs. This chapter finally, provides some
suggestions for future work based on interesting observations of this study.
National Chemical Laboratory
42 Objectives and Scope
References:
(1) Meckel, W.; Goyert, W.; Wieder, W.; Wussow, H.-G. Thermoplastic Elastomers. 2005, 3rd[2], 15.
(2) Cooper, S. L.; Tobolsky, A. V. J. Appl. Polym. Sci. 1966, 10, 1837.
(3) Fredrickson, G. H.; Helfand, E. J. Chem. Phys. 1987, 87, 697.
(4) Leibler, L. Macromolecules 1980, 13, 1602.
(5) Wilkes, G. L.; Abouzahr, S. Macromolecules 1981, 14, 458.
(6) Bonart, R.; Morbitzer, L.; Muller, E. H. J. Macromol. Sci. Phys. 1974, B9, 447.
(7) Sung, C. S. P.; Smith, T. W.; Sung, N. H. Macromolecules 1980, 13, 117.
(8) Wang, C. B.; Cooper, S. L. Macromolecules 1983, 16, 775.
Synthesis of Chain Extenders and Polyurethane-ureas
Chapter - 3
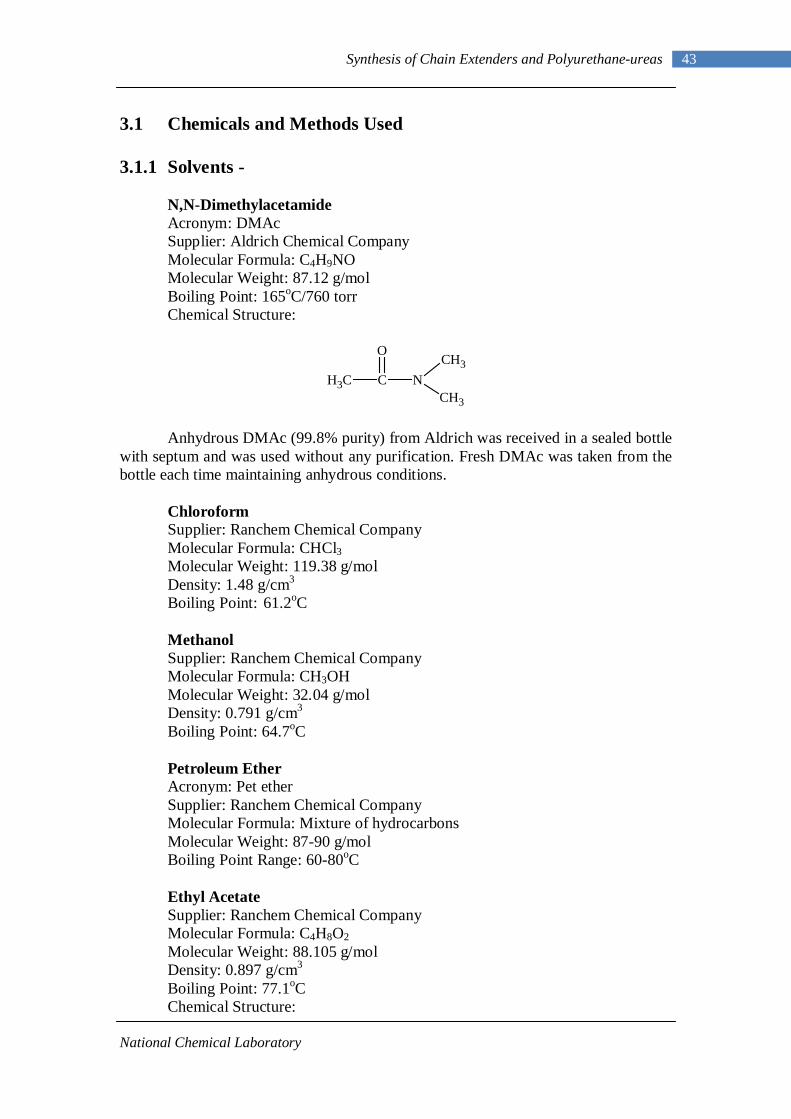
National Chemical Laboratory
43 Synthesis of Chain Extenders and Polyurethane-ureas
3.1 Chemicals and Methods Used
3.1.1 Solvents - N,N-Dimethylacetamide Acronym: DMAc Supplier: Aldrich Chemical Company Molecular Formula: C4H9NO Molecular Weight: 87.12 g/mol Boiling Point: 165oC/760 torr Chemical Structure:
Anhydrous DMAc (99.8% purity) from Aldrich was received in a sealed bottle with septum and was used without any purification. Fresh DMAc was taken from the bottle each time maintaining anhydrous conditions. Chloroform Supplier: Ranchem Chemical Company Molecular Formula: CHCl3 Molecular Weight: 119.38 g/mol Density: 1.48 g/cm3 Boiling Point: 61.2oC Methanol Supplier: Ranchem Chemical Company Molecular Formula: CH3OH Molecular Weight: 32.04 g/mol Density: 0.791 g/cm3 Boiling Point: 64.7oC Petroleum Ether Acronym: Pet ether Supplier: Ranchem Chemical Company Molecular Formula: Mixture of hydrocarbons Molecular Weight: 87-90 g/mol Boiling Point Range: 60-80oC
Ethyl Acetate Supplier: Ranchem Chemical Company Molecular Formula: C4H8O2 Molecular Weight: 88.105 g/mol Density: 0.897 g/cm3 Boiling Point: 77.1oC Chemical Structure:
CH3 C NCH3
CH3
O
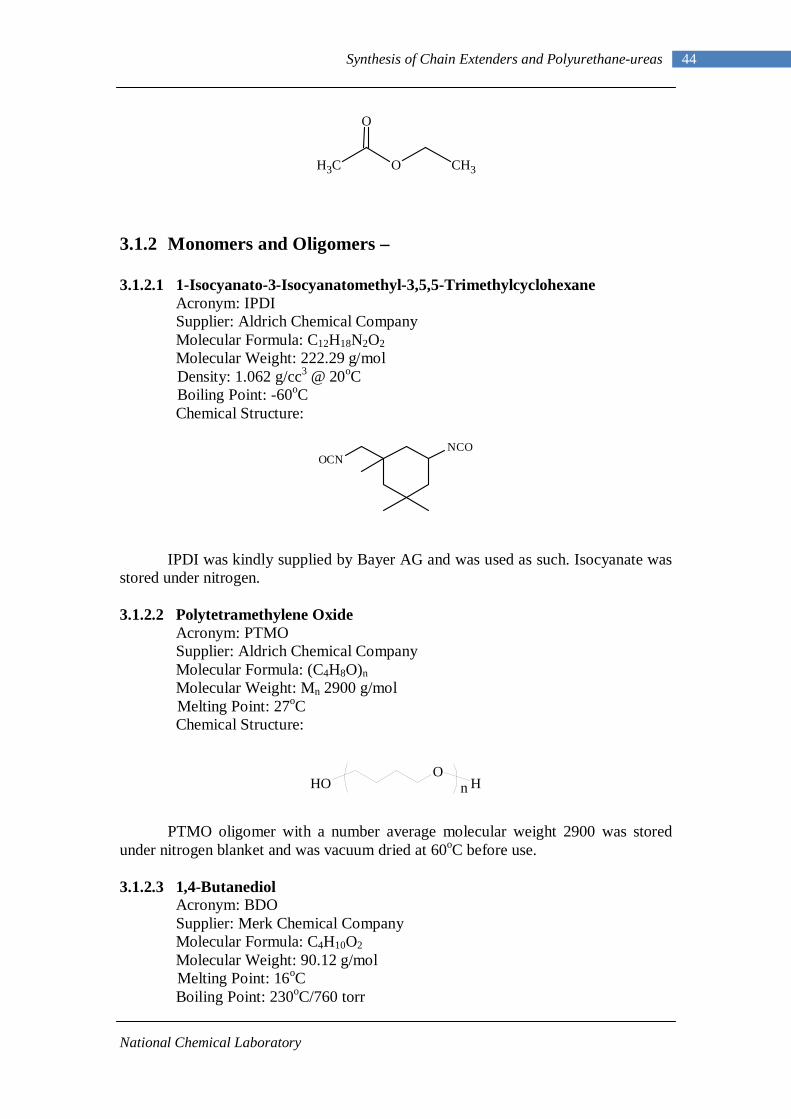
National Chemical Laboratory
44 Synthesis of Chain Extenders and Polyurethane-ureas
3.1.2 Monomers and Oligomers – 3.1.2.1 1-Isocyanato-3-Isocyanatomethyl-3,5,5-Trimethylcyclohexane Acronym: IPDI Supplier: Aldrich Chemical Company Molecular Formula: C12H18N2O2 Molecular Weight: 222.29 g/mol Density: 1.062 g/cc3 @ 20oC Boiling Point: -60oC Chemical Structure:
IPDI was kindly supplied by Bayer AG and was used as such. Isocyanate was stored under nitrogen. 3.1.2.2 Polytetramethylene Oxide Acronym: PTMO Supplier: Aldrich Chemical Company Molecular Formula: (C4H8O)n Molecular Weight: Mn 2900 g/mol Melting Point: 27oC Chemical Structure:
OHO
Hn
PTMO oligomer with a number average molecular weight 2900 was stored under nitrogen blanket and was vacuum dried at 60oC before use. 3.1.2.3 1,4-Butanediol Acronym: BDO Supplier: Merk Chemical Company Molecular Formula: C4H10O2 Molecular Weight: 90.12 g/mol Melting Point: 16oC Boiling Point: 230oC/760 torr
CH3 O CH3
O
OCN
NCO
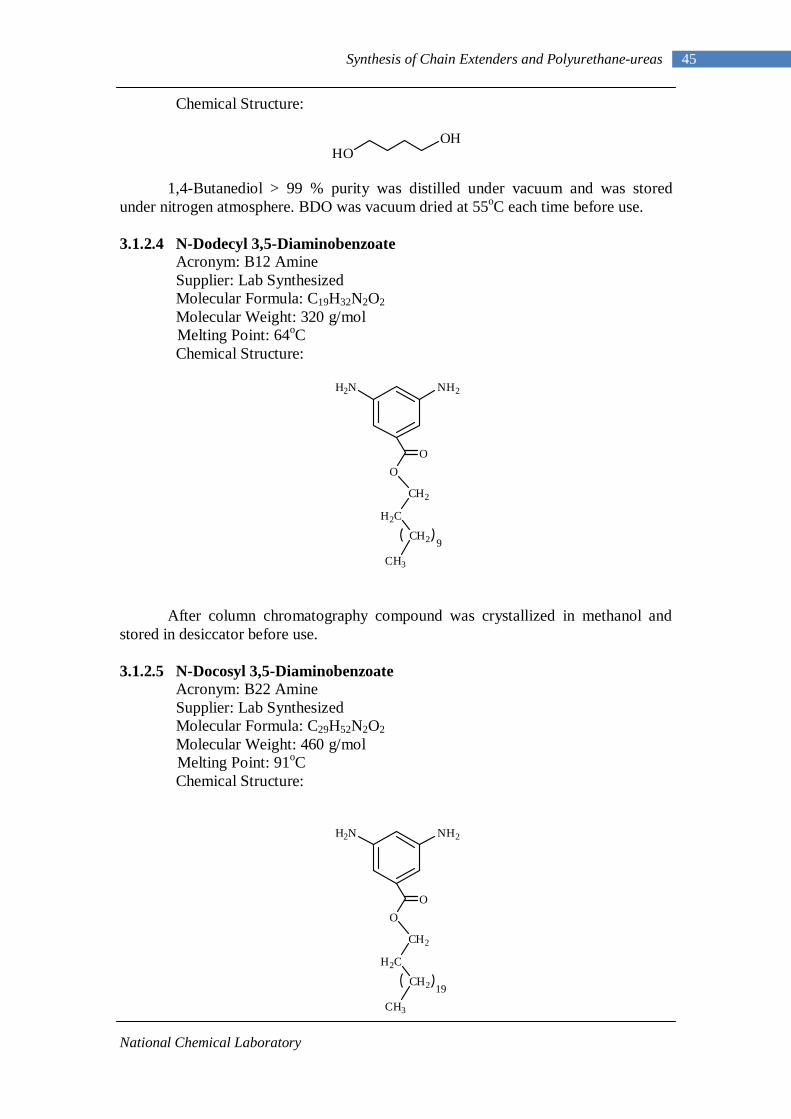
National Chemical Laboratory
45 Synthesis of Chain Extenders and Polyurethane-ureas
Chemical Structure:
1,4-Butanediol > 99 % purity was distilled under vacuum and was stored under nitrogen atmosphere. BDO was vacuum dried at 55oC each time before use. 3.1.2.4 N-Dodecyl 3,5-Diaminobenzoate Acronym: B12 Amine Supplier: Lab Synthesized Molecular Formula: C19H32N2O2 Molecular Weight: 320 g/mol Melting Point: 64oC Chemical Structure:
After column chromatography compound was crystallized in methanol and stored in desiccator before use. 3.1.2.5 N-Docosyl 3,5-Diaminobenzoate Acronym: B22 Amine Supplier: Lab Synthesized Molecular Formula: C29H52N2O2 Molecular Weight: 460 g/mol Melting Point: 91oC Chemical Structure:
HO
OH
H2N NH2
O
CH2
O
H2C
CH2
CH3
9
H2N NH2
O
CH2
O
H2C
CH2
CH3
19
National Chemical Laboratory
46 Synthesis of Chain Extenders and Polyurethane-ureas
Column purified compound was crystallized and stored in desiccator before use. 3.1.2.6 Dibutyltin Dilaurate Acronym: DBTDL Supplier: Merk Chemical Company Molecular Formula: C32H64O4Sn Molecular Weight: 631.6 g/mol Chemical Structure:
DBTDL > 97 % purity was stored under nitrogen and was used without further purification.
3.1.3 Analytical Methods
3.1.3.1 Proton Nuclear Magnetic Resonance (1H-NMR)
Samples were analyzed for 1H-NMR using a Bruker AV200 spectrometer at
operating frequency 200 MHz. CDCl3 was used as a solvent, with 1 % (v/v) TMS as
internal standard. Peaks were referenced to the TMS peak (δ = 0 ppm).
3.1.3.2 Fourier Transform Infrared Spectroscopy (FTIR)
FTIR experiments were conducted on a Perkin Elmer Spectrum GX
spectrometer.
Samples were scanned by forming KBr pellets. Fifteen scans were signal averaged at
a resolution of 4 cm-1 for each sample.
3.1.3.3 Elemental Analysis
Elemental analysis was carried out by CHNS-O, EA 1108- Elemental
Analyzer of Carlo-Erba Instruments, Italy.
3.2 Synthesis and Characterization of Diamine Chain Extenders
Containing Alkyl Branches
(C4H9)2Sn(OOC(CH2)10CH3)2
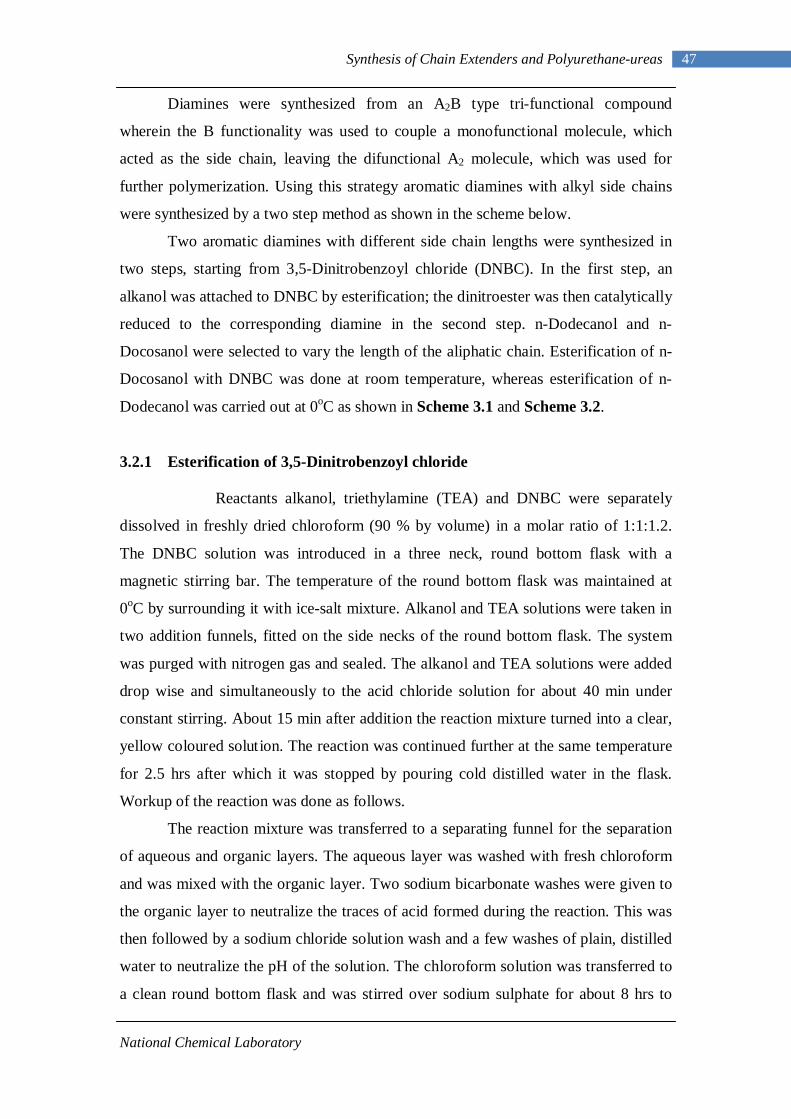
National Chemical Laboratory
47 Synthesis of Chain Extenders and Polyurethane-ureas
Diamines were synthesized from an A2B type tri-functional compound
wherein the B functionality was used to couple a monofunctional molecule, which
acted as the side chain, leaving the difunctional A2 molecule, which was used for
further polymerization. Using this strategy aromatic diamines with alkyl side chains
were synthesized by a two step method as shown in the scheme below.
Two aromatic diamines with different side chain lengths were synthesized in
two steps, starting from 3,5-Dinitrobenzoyl chloride (DNBC). In the first step, an
alkanol was attached to DNBC by esterification; the dinitroester was then catalytically
reduced to the corresponding diamine in the second step. n-Dodecanol and n-
Docosanol were selected to vary the length of the aliphatic chain. Esterification of n-
Docosanol with DNBC was done at room temperature, whereas esterification of n-
Dodecanol was carried out at 0oC as shown in Scheme 3.1 and Scheme 3.2.
3.2.1 Esterification of 3,5-Dinitrobenzoyl chloride
Reactants alkanol, triethylamine (TEA) and DNBC were separately
dissolved in freshly dried chloroform (90 % by volume) in a molar ratio of 1:1:1.2.
The DNBC solution was introduced in a three neck, round bottom flask with a
magnetic stirring bar. The temperature of the round bottom flask was maintained at
0oC by surrounding it with ice-salt mixture. Alkanol and TEA solutions were taken in
two addition funnels, fitted on the side necks of the round bottom flask. The system
was purged with nitrogen gas and sealed. The alkanol and TEA solutions were added
drop wise and simultaneously to the acid chloride solution for about 40 min under
constant stirring. About 15 min after addition the reaction mixture turned into a clear,
yellow coloured solution. The reaction was continued further at the same temperature
for 2.5 hrs after which it was stopped by pouring cold distilled water in the flask.
Workup of the reaction was done as follows.
The reaction mixture was transferred to a separating funnel for the separation
of aqueous and organic layers. The aqueous layer was washed with fresh chloroform
and was mixed with the organic layer. Two sodium bicarbonate washes were given to
the organic layer to neutralize the traces of acid formed during the reaction. This was
then followed by a sodium chloride solution wash and a few washes of plain, distilled
water to neutralize the pH of the solution. The chloroform solution was transferred to
a clean round bottom flask and was stirred over sodium sulphate for about 8 hrs to
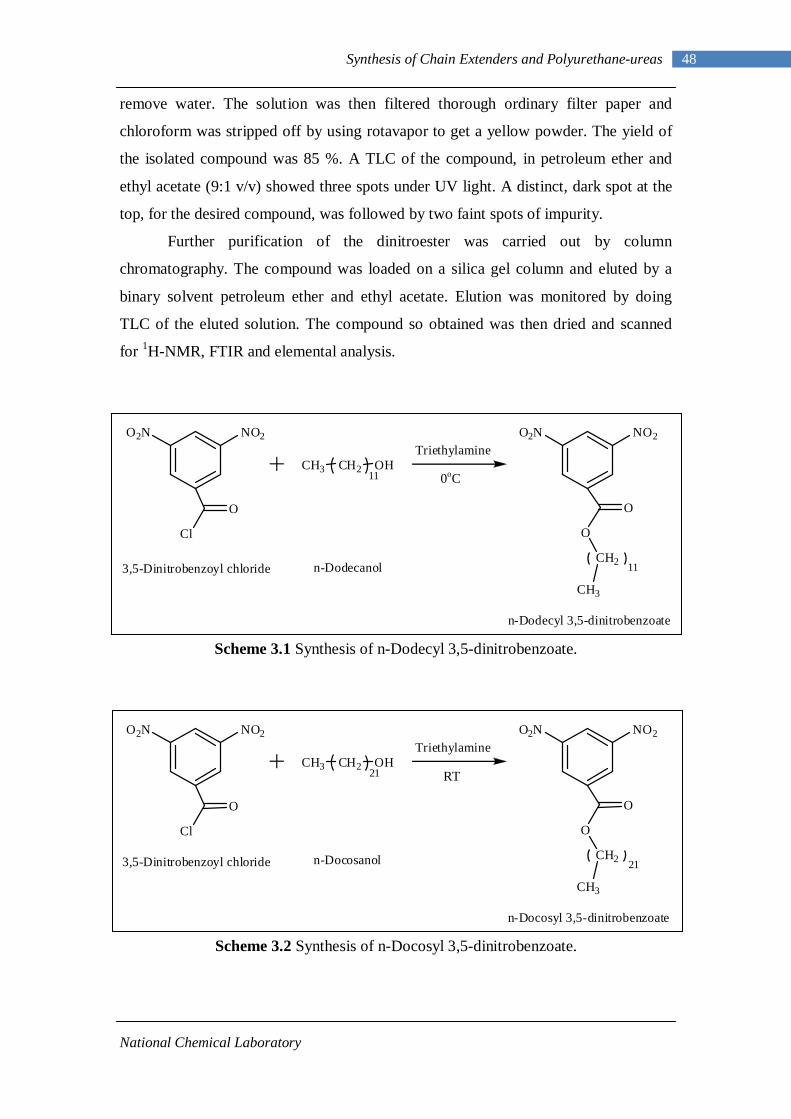
National Chemical Laboratory
48 Synthesis of Chain Extenders and Polyurethane-ureas
remove water. The solution was then filtered thorough ordinary filter paper and
chloroform was stripped off by using rotavapor to get a yellow powder. The yield of
the isolated compound was 85 %. A TLC of the compound, in petroleum ether and
ethyl acetate (9:1 v/v) showed three spots under UV light. A distinct, dark spot at the
top, for the desired compound, was followed by two faint spots of impurity.
Further purification of the dinitroester was carried out by column
chromatography. The compound was loaded on a silica gel column and eluted by a
binary solvent petroleum ether and ethyl acetate. Elution was monitored by doing
TLC of the eluted solution. The compound so obtained was then dried and scanned
for 1H-NMR, FTIR and elemental analysis.
Scheme 3.1 Synthesis of n-Dodecyl 3,5-dinitrobenzoate.
Scheme 3.2 Synthesis of n-Docosyl 3,5-dinitrobenzoate.
O2N NO2
Cl
O
CH3 CH2 OH11
TriethylamineO2N NO2
O
CH2
O
CH3
113,5-Dinitrobenzoyl chloride n-Dodecanol
n-Dodecyl 3,5-dinitrobenzoate
O2N NO2
Cl
O
CH3 CH2 OH21
TriethylamineO2N NO2
O
CH2
O
CH3
213,5-Dinitrobenzoyl chloride n-Docosanol
n-Docosyl 3,5-dinitrobenzoate
0oC
RT
National Chemical Laboratory
49 Synthesis of Chain Extenders and Polyurethane-ureas
3.2.2 Characterization of n-alkyl 3,5-dinitro benzoates
n-Dodecyl 3,5-Dinitrobenzoate – Yield: 85 %. Mp: 64oC. 1H-NMR (CDCl3, 200 MHz): δ 9.23 (1H), 9.16 (2H), 4.45 (t, 2H), 1.84 (m, 2H), 1.26
(m, 18H), 0.88 (m, 3H) ppm.
FTIR (KBr): 3098 (aromatic C-H stretch), 2920 and 2852 (aliphatic C-H stretch),
1727 (C=O), 1543 (N-O asymmetric stretch) and 1346 (N-O symmetric stretch) cm-1.
Elemental Analysis: C% H% N%
Calculated: 60 7.36 7.36
Observed: 60.04 7.43 7.30
1H-NMR spectrum of n-dodecyl 3,5-dinitrobenzoate in Figure 3.1 shows a
multiplet at 0.88 δ ppm due to terminal methyl protons, a multiplet at 1.26 δ ppm
corresponding to the methylenes of aliphatic chain. Methylenes β- and α- to ester
oxygen gives rise to a multiplet around 1.84 δ ppm, and a triplet centered at 4.45 δ
ppm. The presence of these peaks demonstrates the formation of ester. Solvent
CDCl3 displayed a peak at 7.27 δ ppm. Aromatic protons ortho and para to ester
group are observed downfield as a doublet around 9.16 δ ppm, and a triplet centered
at 9.23 δ ppm respectively, due to electron withdrawing nitro groups.
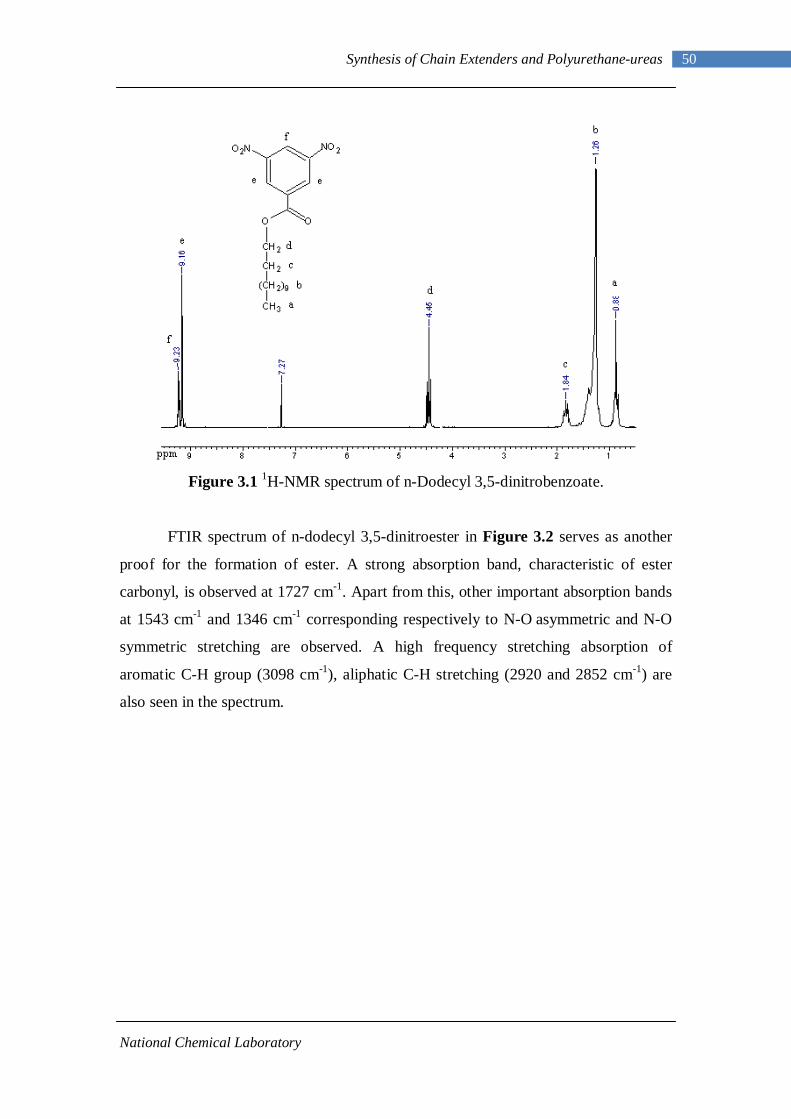
National Chemical Laboratory
50 Synthesis of Chain Extenders and Polyurethane-ureas
Figure 3.1 1H-NMR spectrum of n-Dodecyl 3,5-dinitrobenzoate.
FTIR spectrum of n-dodecyl 3,5-dinitroester in Figure 3.2 serves as another
proof for the formation of ester. A strong absorption band, characteristic of ester
carbonyl, is observed at 1727 cm-1. Apart from this, other important absorption bands
at 1543 cm-1 and 1346 cm-1 corresponding respectively to N-O asymmetric and N-O
symmetric stretching are observed. A high frequency stretching absorption of
aromatic C-H group (3098 cm-1), aliphatic C-H stretching (2920 and 2852 cm-1) are
also seen in the spectrum.
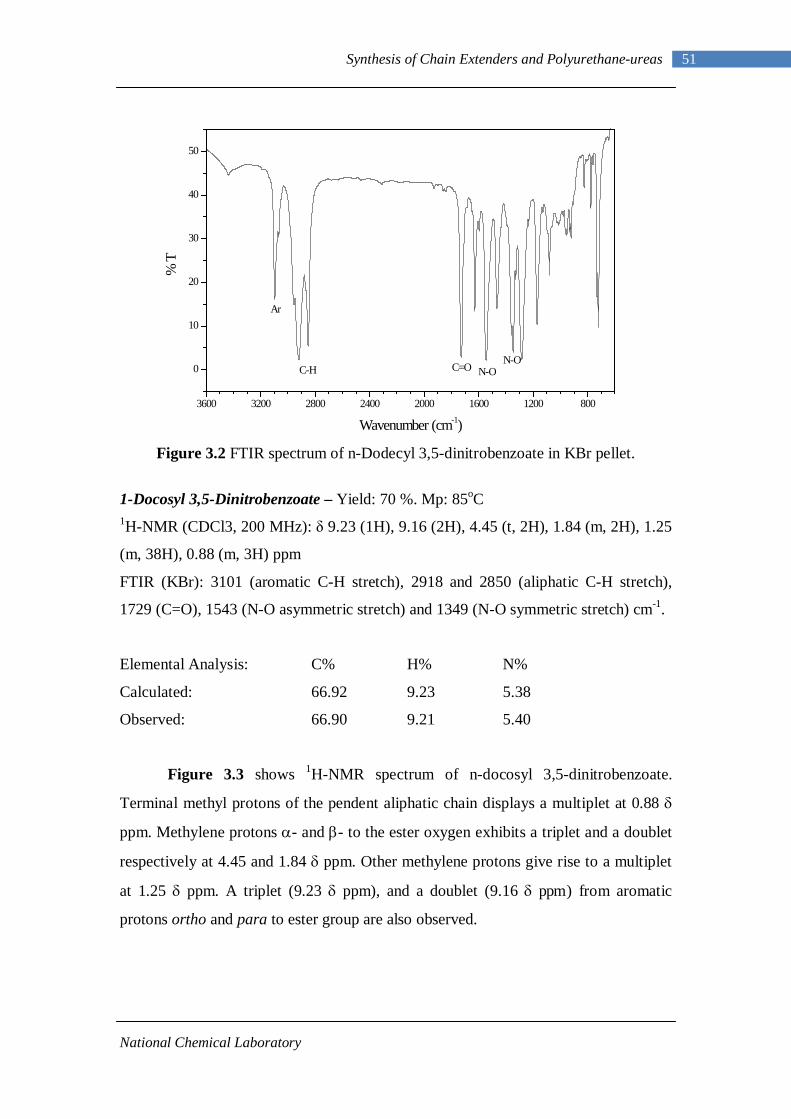
National Chemical Laboratory
51 Synthesis of Chain Extenders and Polyurethane-ureas
Figure 3.2 FTIR spectrum of n-Dodecyl 3,5-dinitrobenzoate in KBr pellet.
1-Docosyl 3,5-Dinitrobenzoate – Yield: 70 %. Mp: 85oC 1H-NMR (CDCl3, 200 MHz): δ 9.23 (1H), 9.16 (2H), 4.45 (t, 2H), 1.84 (m, 2H), 1.25
(m, 38H), 0.88 (m, 3H) ppm
FTIR (KBr): 3101 (aromatic C-H stretch), 2918 and 2850 (aliphatic C-H stretch),
1729 (C=O), 1543 (N-O asymmetric stretch) and 1349 (N-O symmetric stretch) cm-1.
Elemental Analysis: C% H% N%
Calculated: 66.92 9.23 5.38
Observed: 66.90 9.21 5.40
Figure 3.3 shows 1H-NMR spectrum of n-docosyl 3,5-dinitrobenzoate.
Terminal methyl protons of the pendent aliphatic chain displays a multiplet at 0.88 δ
ppm. Methylene protons α- and β- to the ester oxygen exhibits a triplet and a doublet
respectively at 4.45 and 1.84 δ ppm. Other methylene protons give rise to a multiplet
at 1.25 δ ppm. A triplet (9.23 δ ppm), and a doublet (9.16 δ ppm) from aromatic
protons ortho and para to ester group are also observed.
3600 3200 2800 2400 2000 1600 1200 800
0
10
20
30
40
50
N-ON-OC=OC-H
Ar
% T
Wavenumber (cm-1)
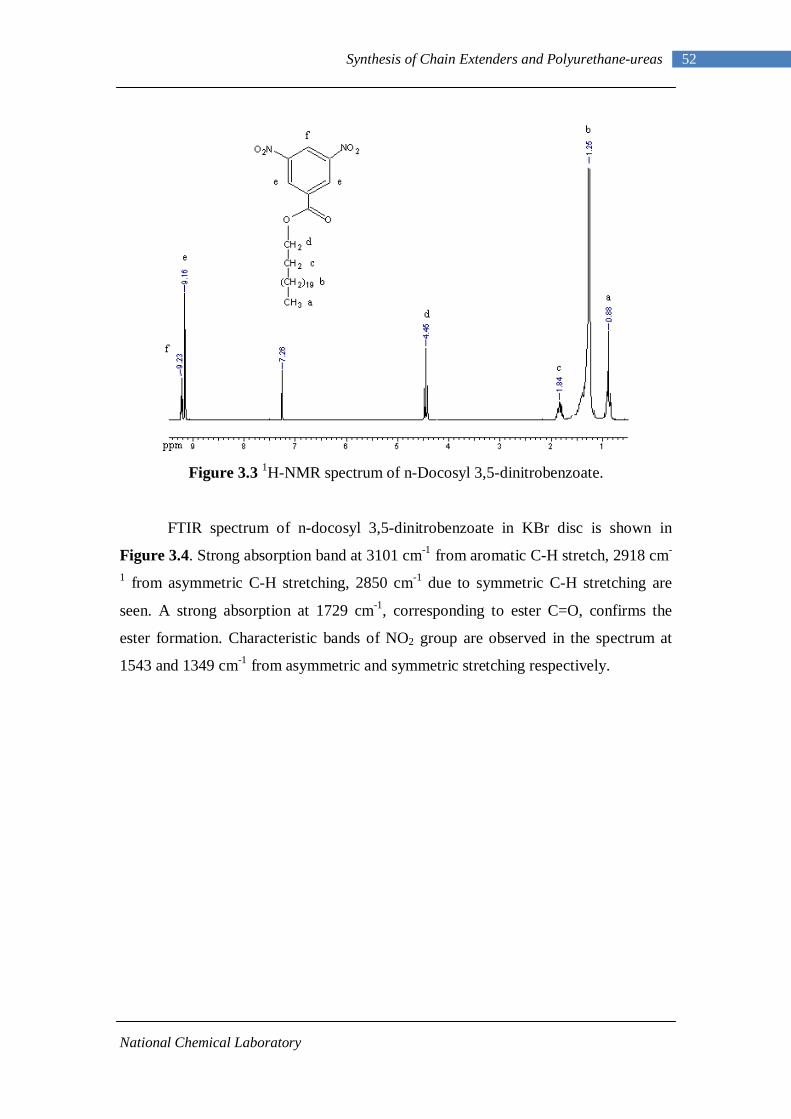
National Chemical Laboratory
52 Synthesis of Chain Extenders and Polyurethane-ureas
Figure 3.3 1H-NMR spectrum of n-Docosyl 3,5-dinitrobenzoate.
FTIR spectrum of n-docosyl 3,5-dinitrobenzoate in KBr disc is shown in
Figure 3.4. Strong absorption band at 3101 cm-1 from aromatic C-H stretch, 2918 cm-
1 from asymmetric C-H stretching, 2850 cm-1 due to symmetric C-H stretching are
seen. A strong absorption at 1729 cm-1, corresponding to ester C=O, confirms the
ester formation. Characteristic bands of NO2 group are observed in the spectrum at
1543 and 1349 cm-1 from asymmetric and symmetric stretching respectively.
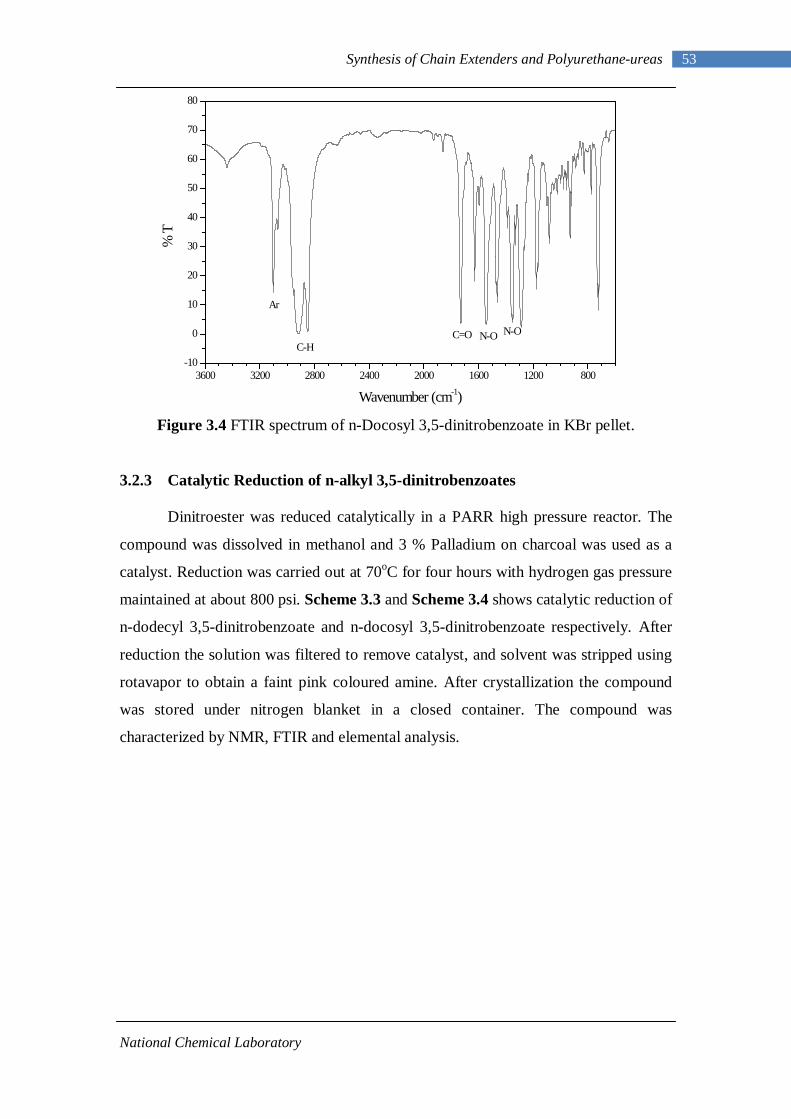
National Chemical Laboratory
53 Synthesis of Chain Extenders and Polyurethane-ureas
Figure 3.4 FTIR spectrum of n-Docosyl 3,5-dinitrobenzoate in KBr pellet.
3.2.3 Catalytic Reduction of n-alkyl 3,5-dinitrobenzoates
Dinitroester was reduced catalytically in a PARR high pressure reactor. The
compound was dissolved in methanol and 3 % Palladium on charcoal was used as a
catalyst. Reduction was carried out at 70oC for four hours with hydrogen gas pressure
maintained at about 800 psi. Scheme 3.3 and Scheme 3.4 shows catalytic reduction of
n-dodecyl 3,5-dinitrobenzoate and n-docosyl 3,5-dinitrobenzoate respectively. After
reduction the solution was filtered to remove catalyst, and solvent was stripped using
rotavapor to obtain a faint pink coloured amine. After crystallization the compound
was stored under nitrogen blanket in a closed container. The compound was
characterized by NMR, FTIR and elemental analysis.
3600 3200 2800 2400 2000 1600 1200 800-10
0
10
20
30
40
50
60
70
80
N-ON-OC=OC-H
Ar
% T
Wavenumber (cm-1)
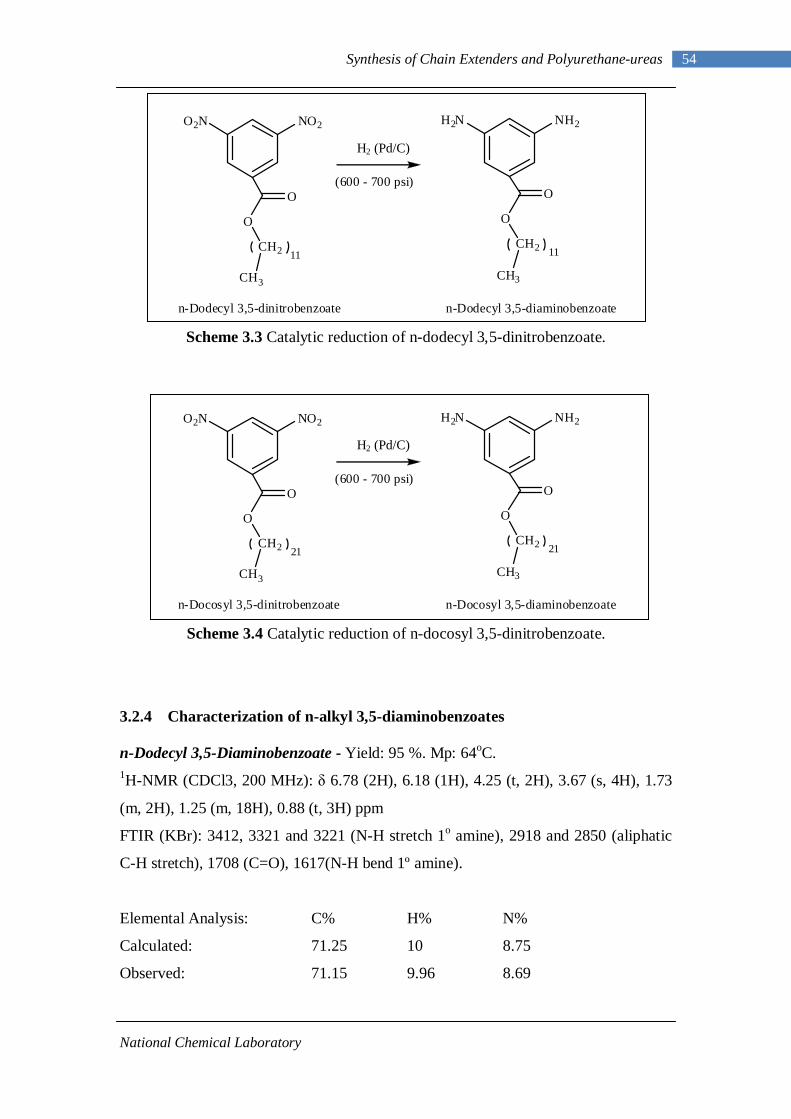
National Chemical Laboratory
54 Synthesis of Chain Extenders and Polyurethane-ureas
Scheme 3.3 Catalytic reduction of n-dodecyl 3,5-dinitrobenzoate.
Scheme 3.4 Catalytic reduction of n-docosyl 3,5-dinitrobenzoate.
3.2.4 Characterization of n-alkyl 3,5-diaminobenzoates
n-Dodecyl 3,5-Diaminobenzoate - Yield: 95 %. Mp: 64oC. 1H-NMR (CDCl3, 200 MHz): δ 6.78 (2H), 6.18 (1H), 4.25 (t, 2H), 3.67 (s, 4H), 1.73
(m, 2H), 1.25 (m, 18H), 0.88 (t, 3H) ppm
FTIR (KBr): 3412, 3321 and 3221 (N-H stretch 1o amine), 2918 and 2850 (aliphatic
C-H stretch), 1708 (C=O), 1617(N-H bend 1º amine).
Elemental Analysis: C% H% N%
Calculated: 71.25 10 8.75
Observed: 71.15 9.96 8.69
O2N NO2
O
CH2
O
CH3
11
H2N NH2
O
CH2
O
CH3
11
H2
(600 - 700 psi)
n-Dodecyl 3,5-dinitrobenzoate n-Dodecyl 3,5-diaminobenzoate
O2N NO2
O
CH2
O
CH3
21
H2N NH2
O
CH2
O
CH3
21
H2
(600 - 700 psi)
n-Docosyl 3,5-dinitrobenzoate n-Docosyl 3,5-diaminobenzoate
H2 (Pd/C)
H2 (Pd/C)
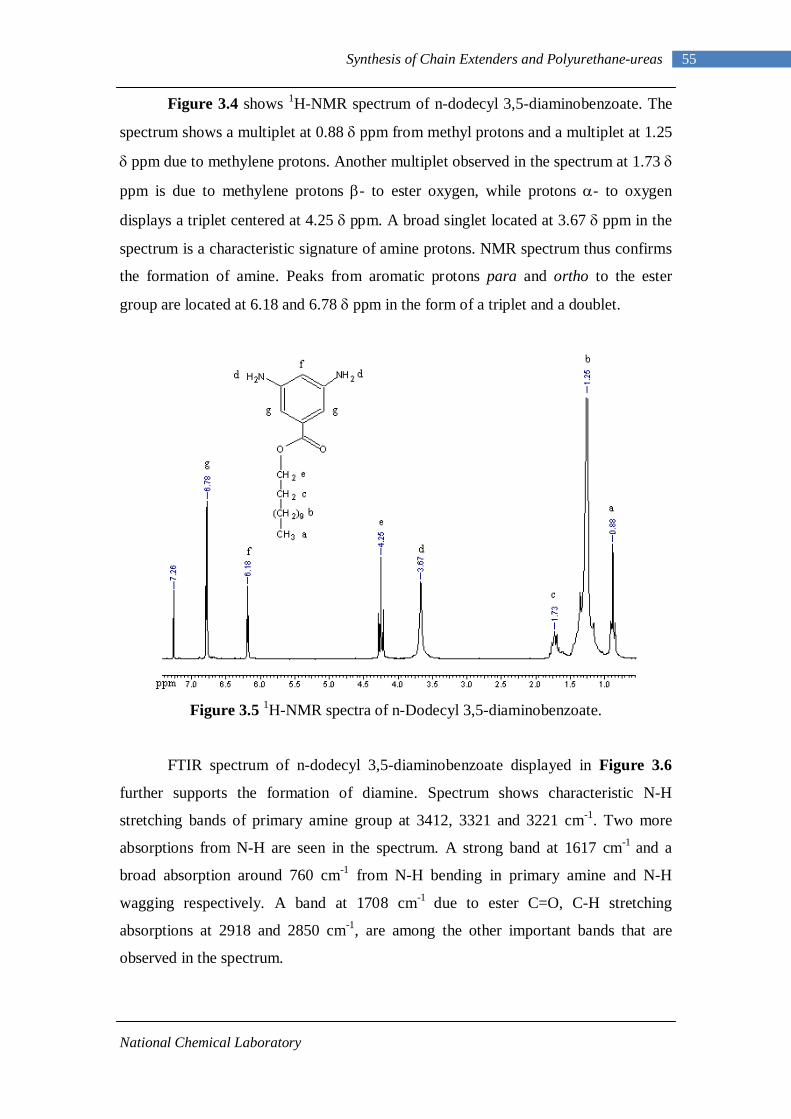
National Chemical Laboratory
55 Synthesis of Chain Extenders and Polyurethane-ureas
Figure 3.4 shows 1H-NMR spectrum of n-dodecyl 3,5-diaminobenzoate. The
spectrum shows a multiplet at 0.88 δ ppm from methyl protons and a multiplet at 1.25
δ ppm due to methylene protons. Another multiplet observed in the spectrum at 1.73 δ
ppm is due to methylene protons β- to ester oxygen, while protons α- to oxygen
displays a triplet centered at 4.25 δ ppm. A broad singlet located at 3.67 δ ppm in the
spectrum is a characteristic signature of amine protons. NMR spectrum thus confirms
the formation of amine. Peaks from aromatic protons para and ortho to the ester
group are located at 6.18 and 6.78 δ ppm in the form of a triplet and a doublet.
Figure 3.5 1H-NMR spectra of n-Dodecyl 3,5-diaminobenzoate.
FTIR spectrum of n-dodecyl 3,5-diaminobenzoate displayed in Figure 3.6
further supports the formation of diamine. Spectrum shows characteristic N-H
stretching bands of primary amine group at 3412, 3321 and 3221 cm-1. Two more
absorptions from N-H are seen in the spectrum. A strong band at 1617 cm-1 and a
broad absorption around 760 cm-1 from N-H bending in primary amine and N-H
wagging respectively. A band at 1708 cm-1 due to ester C=O, C-H stretching
absorptions at 2918 and 2850 cm-1, are among the other important bands that are
observed in the spectrum.
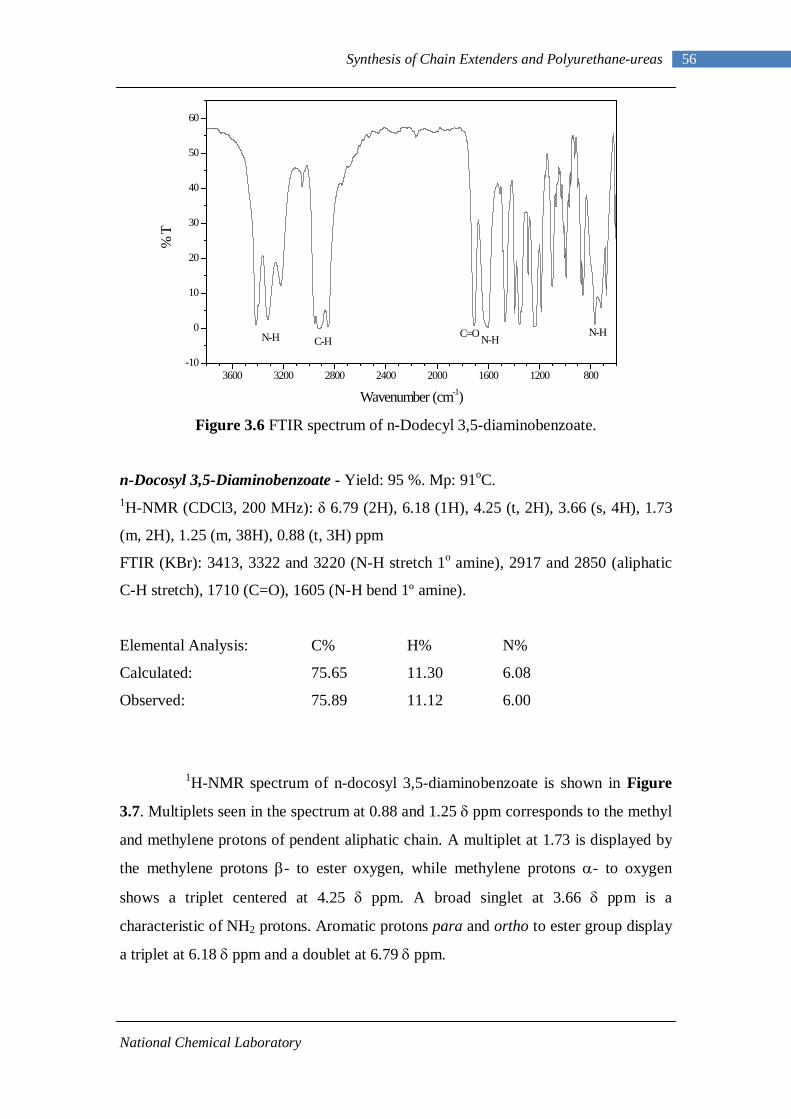
National Chemical Laboratory
56 Synthesis of Chain Extenders and Polyurethane-ureas
Figure 3.6 FTIR spectrum of n-Dodecyl 3,5-diaminobenzoate.
n-Docosyl 3,5-Diaminobenzoate - Yield: 95 %. Mp: 91oC. 1H-NMR (CDCl3, 200 MHz): δ 6.79 (2H), 6.18 (1H), 4.25 (t, 2H), 3.66 (s, 4H), 1.73
(m, 2H), 1.25 (m, 38H), 0.88 (t, 3H) ppm
FTIR (KBr): 3413, 3322 and 3220 (N-H stretch 1o amine), 2917 and 2850 (aliphatic
C-H stretch), 1710 (C=O), 1605 (N-H bend 1º amine).
Elemental Analysis: C% H% N%
Calculated: 75.65 11.30 6.08
Observed: 75.89 11.12 6.00
1H-NMR spectrum of n-docosyl 3,5-diaminobenzoate is shown in Figure
3.7. Multiplets seen in the spectrum at 0.88 and 1.25 δ ppm corresponds to the methyl
and methylene protons of pendent aliphatic chain. A multiplet at 1.73 is displayed by
the methylene protons β- to ester oxygen, while methylene protons α- to oxygen
shows a triplet centered at 4.25 δ ppm. A broad singlet at 3.66 δ ppm is a
characteristic of NH2 protons. Aromatic protons para and ortho to ester group display
a triplet at 6.18 δ ppm and a doublet at 6.79 δ ppm.
3600 3200 2800 2400 2000 1600 1200 800-10
0
10
20
30
40
50
60
N-HN-HC=O
C-HN-H
% T
Wavenumber (cm-1)
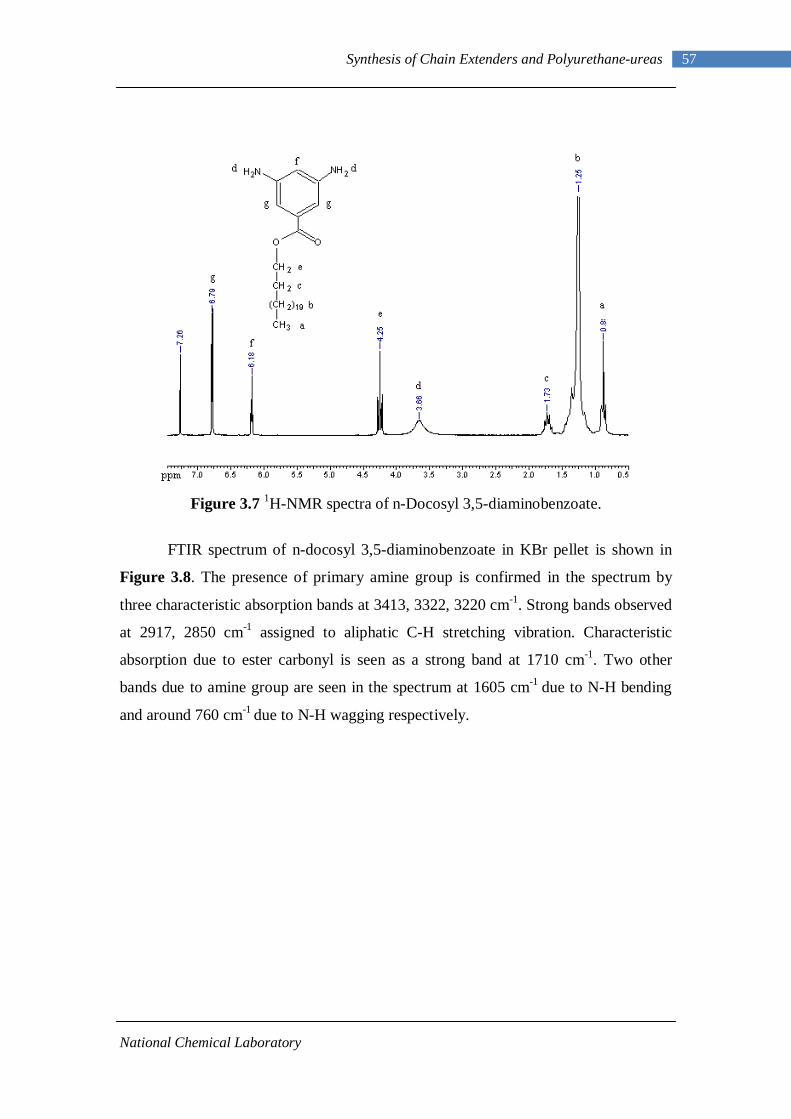
National Chemical Laboratory
57 Synthesis of Chain Extenders and Polyurethane-ureas
Figure 3.7 1H-NMR spectra of n-Docosyl 3,5-diaminobenzoate.
FTIR spectrum of n-docosyl 3,5-diaminobenzoate in KBr pellet is shown in
Figure 3.8. The presence of primary amine group is confirmed in the spectrum by
three characteristic absorption bands at 3413, 3322, 3220 cm-1. Strong bands observed
at 2917, 2850 cm-1 assigned to aliphatic C-H stretching vibration. Characteristic
absorption due to ester carbonyl is seen as a strong band at 1710 cm-1. Two other
bands due to amine group are seen in the spectrum at 1605 cm-1 due to N-H bending
and around 760 cm-1 due to N-H wagging respectively.
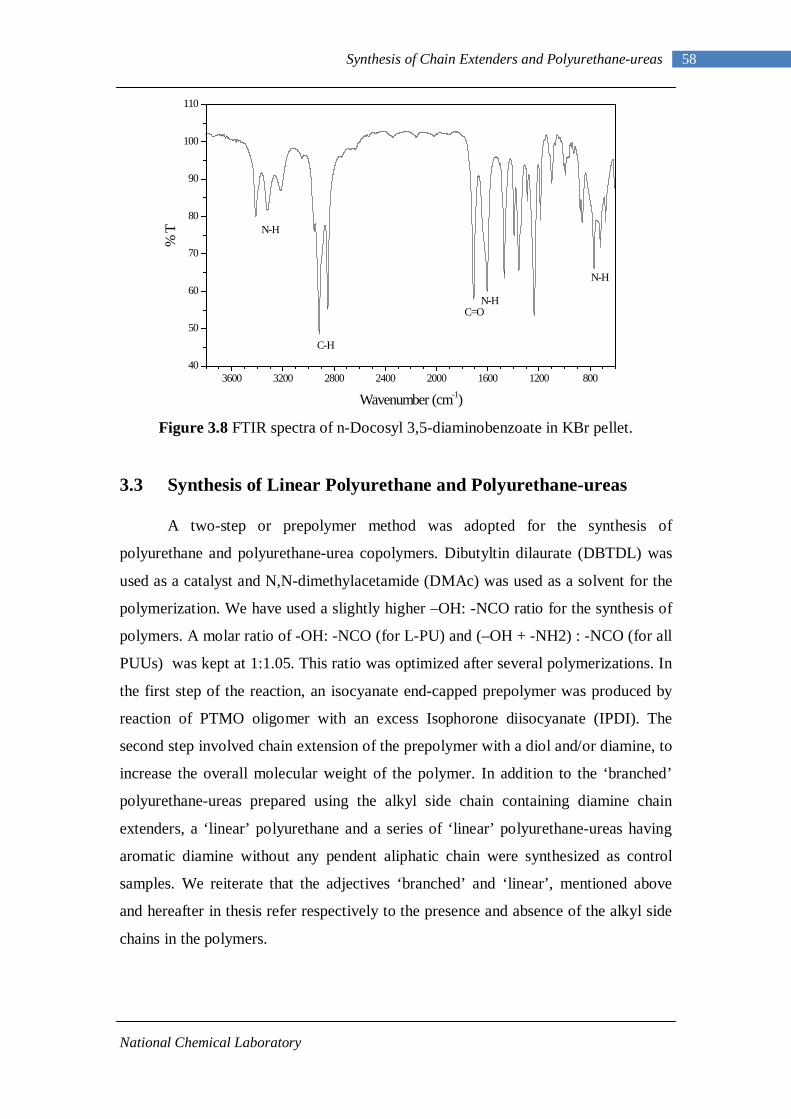
National Chemical Laboratory
58 Synthesis of Chain Extenders and Polyurethane-ureas
Figure 3.8 FTIR spectra of n-Docosyl 3,5-diaminobenzoate in KBr pellet.
3.3 Synthesis of Linear Polyurethane and Polyurethane-ureas
A two-step or prepolymer method was adopted for the synthesis of
polyurethane and polyurethane-urea copolymers. Dibutyltin dilaurate (DBTDL) was
used as a catalyst and N,N-dimethylacetamide (DMAc) was used as a solvent for the
polymerization. We have used a slightly higher –OH: -NCO ratio for the synthesis of
polymers. A molar ratio of -OH: -NCO (for L-PU) and (–OH + -NH2) : -NCO (for all
PUUs) was kept at 1:1.05. This ratio was optimized after several polymerizations. In
the first step of the reaction, an isocyanate end-capped prepolymer was produced by
reaction of PTMO oligomer with an excess Isophorone diisocyanate (IPDI). The
second step involved chain extension of the prepolymer with a diol and/or diamine, to
increase the overall molecular weight of the polymer. In addition to the ‘branched’
polyurethane-ureas prepared using the alkyl side chain containing diamine chain
extenders, a ‘linear’ polyurethane and a series of ‘linear’ polyurethane-ureas having
aromatic diamine without any pendent aliphatic chain were synthesized as control
samples. We reiterate that the adjectives ‘branched’ and ‘linear’, mentioned above
and hereafter in thesis refer respectively to the presence and absence of the alkyl side
chains in the polymers.
3600 3200 2800 2400 2000 1600 1200 80040
50
60
70
80
90
100
110
N-H
N-HC=O
C-H
N-H
% T
Wavenumber (cm-1)
National Chemical Laboratory
59 Synthesis of Chain Extenders and Polyurethane-ureas
3.3.1 Synthesis of Linear Polyurethane Control
The first control sample, a linear polyurethane, was synthesized using 1,4-
butanediol (BDO) as the chain extender, and is henceforth referred to as L-PU. The
hard segment content was maintained at 50 % by weight. Hard segment content was
calculated using following formula.
PTMO of wt. BDO of wt. IPDI of wt.
BDO of wt. IPDI of wt. Content Segment Hard %++
+= (3.1)
Polymerization was conducted in a 500 ml, three-neck, round bottom flask
equipped with a magnetic stirring bar, a nitrogen gas inlet and outlet fitted to the two
necks of the flask, and an addition funnel fitted to the third neck. Reactants, IPDI,
PTMO and BDO were dissolved separately in dry DMAc to prepare 20 % by weight
solutions. Calculated amount of the PTMO solution was taken in the round bottom
flask to which 0.5 mol % of catalyst, DBTDL was added. Under vigorous stirring, the
isocyanate solution was added by dropping funnel over 25-30 min. Temperature was
then slowly raised to 70oC and the reaction was carried out for 3 hrs. After this
prepolymerization step, the temperature was lowered to ambient, and the chain
extender 1,4-butanediol solution was added to the vigorously stirred prepolymer. The
temperature was raised again to 70oC and reaction was continued for 4 hrs under
constant stirring and nitrogen atmosphere. The polymer solution thus formed, was
precipitated in cold distilled water and dried at 60oC under vacuum for four days.
3.3.2 Synthesis of Linear Polyurethane-ureas
The second set of control samples namely, a series of linear polyurethane-
ureas (PUUs), were synthesized by replacing 1,4-butanediol with different amounts of
m-phenylenediamine (PDA). Three such control polymers were synthesized in this
series and were labeled as L-PUU10, L-PUU50, and L-PUU100 where, L refers to
linear and the number after PUU refers to the mole percent of 1,4-butanediol replaced
using PDA. The hard segment content in all polymers was maintained at 50 % by
weight.
All PUUs in this series were synthesized by following a similar prepolymer
synthesis protocol. Briefly, polymerizations were carried out in 500 ml, three-neck,
round bottom flask fitted with a nitrogen gas inlet, outlet and an addition funnel.
National Chemical Laboratory
60 Synthesis of Chain Extenders and Polyurethane-ureas
Reactants were dissolved separately in dry DMAc to prepare 20 % by weight
solutions. 0.5 mol% of DBTDL was added to the PTMO solution in the round bottom
flask. The solution of IPDI was added dropwise into the PTMO solution for about 30
min under constant stirring and at room temperature. Reaction was carried out for
three hours at 70oC. After this prepolymer step, the temperature was lowered to
ambient, and solutions of the chain extenders BDO and PDA were simultaneously
added to the reaction vessel under vigorous agitation. The temperature was raised to
70oC and reaction was continued for a further 3.5 hrs under constant stirring and
nitrogen atmosphere. The polymer solution thus formed, was precipitated in cold
distilled water and dried at 60oC under vacuum for four days.
An important point relating to the chemistry of polyurethane-urea synthesis
needs a comment here. As discussed in the chapter no. 1, section 1.2.2, reactivity of
isocyanate with primary amines is substantially higher as compared to primary
alcohol groups (even in the absence of catalyst). Accordingly, a small excess of
diisocyanate (–OH + -NH2 : -NCO = 1:1.05 mol), and combination of a diol and
diamine chain extenders, as used in this study, can influence the resulting hard and
soft segment sequence in the polymer chain. Thus, for all polyurethane-ureas
synthesized in the present work (by simultaneous addition of chain extenders to the
prepolymer solution), there is a propensity of formation of urea linkages in preference
to the urethane linkages. Therefore, we do not rule out the possibility of formation of
a few longer urea hard segment sequences. This is particularly more likely in
copolymer compositions having high diamine content.
3.4 Synthesis of Branched Polyurethane-ureas Containing Diamine
Chain Extenders
The same two step solution polymerization method was used for the
preparation of branched polyurethane-urea copolymers containing equivalent hard and
soft segments (approximately 50 wt. % each). The prepolymer method followed is
illustrated in Figure 3.9.
National Chemical Laboratory
61 Synthesis of Chain Extenders and Polyurethane-ureas
3.4.1 Synthesis of Polyurethane-ureas Containing C12 Branches
Polymers synthesized in this series will be referred to as B12-PUU10, B12-
PUU50, B12-PUU70 and B12-PUU100, where B12 denotes B –for branch and 12 –
for the number carbon atoms in the alkyl side chain, and last number refers to the
mole percentage of chain extender BDO replaced with n-Dodecyl 3,5-
diaminobenzoate. A representative procedure for the synthesis of B12 series PUUs is
described below.
All reactants were separately dissolved in anhydrous DMAc (80% by vol.).
PTMO (12.00 g / 0.004 mol) solution was added to a 250 ml three neck round bottom
flask equipped with an addition funnel, a nitrogen gas inlet and outlet, and a magnetic
stirring bar. A few drops of catalyst DBTDL were added to the PTMO solution and
solution was stirred. IPDI (9.336 g / 0.042 mol) solution was added dropwise from the
addition funnel into the PTMO solution for 35-40 min under constant stirring.
Temperature was then increased slowly to 70oC and the prepolymerization reaction
was carried out for ca. four hours under nitrogen atmosphere. The reaction mixture
was allowed to cool down to room temperature.
Chain extension or polymerization step was then carried out by simultaneous
addition of BDO (2.808 g / 0.0312 mol) and n-Dodecyl 3,5-diaminobenzoate (1.504 g
/ 0.0047 mol) solutions to the prepolymer under vigorous stirring. Temperature was
again raised to 70oC and was maintained for four hours before the polymer was
precipitated in cold, distilled water. The polymer was dried at 60oC under vacuum for
four days.
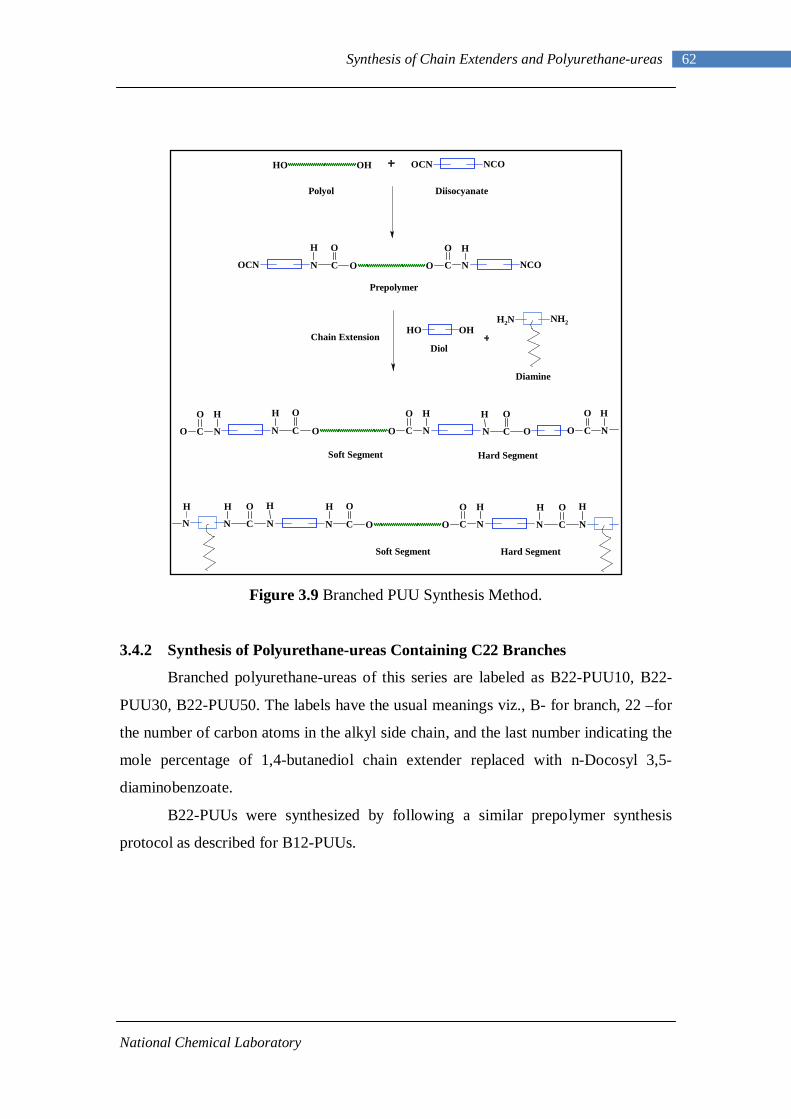
National Chemical Laboratory
62 Synthesis of Chain Extenders and Polyurethane-ureas
Figure 3.9 Branched PUU Synthesis Method.
3.4.2 Synthesis of Polyurethane-ureas Containing C22 Branches
Branched polyurethane-ureas of this series are labeled as B22-PUU10, B22-
PUU30, B22-PUU50. The labels have the usual meanings viz., B- for branch, 22 –for
the number of carbon atoms in the alkyl side chain, and the last number indicating the
mole percentage of 1,4-butanediol chain extender replaced with n-Docosyl 3,5-
diaminobenzoate.
B22-PUUs were synthesized by following a similar prepolymer synthesis
protocol as described for B12-PUUs.
NCOOCNHO OH
Polyol Diisocyanate
O O CCN
H
N
HO O
NCOOCN
Prepolymer
HO OH
DiolChain Extension
O O CCN
H
N
HO O
OCN
H O
O C N
HO
O C N
HO
Soft Segment Hard Segment
NH2H2N
Diamine
NCN
H O H
O O CCN
H
N
HO O
NCN
H O H
N
Soft Segment Hard Segment
H
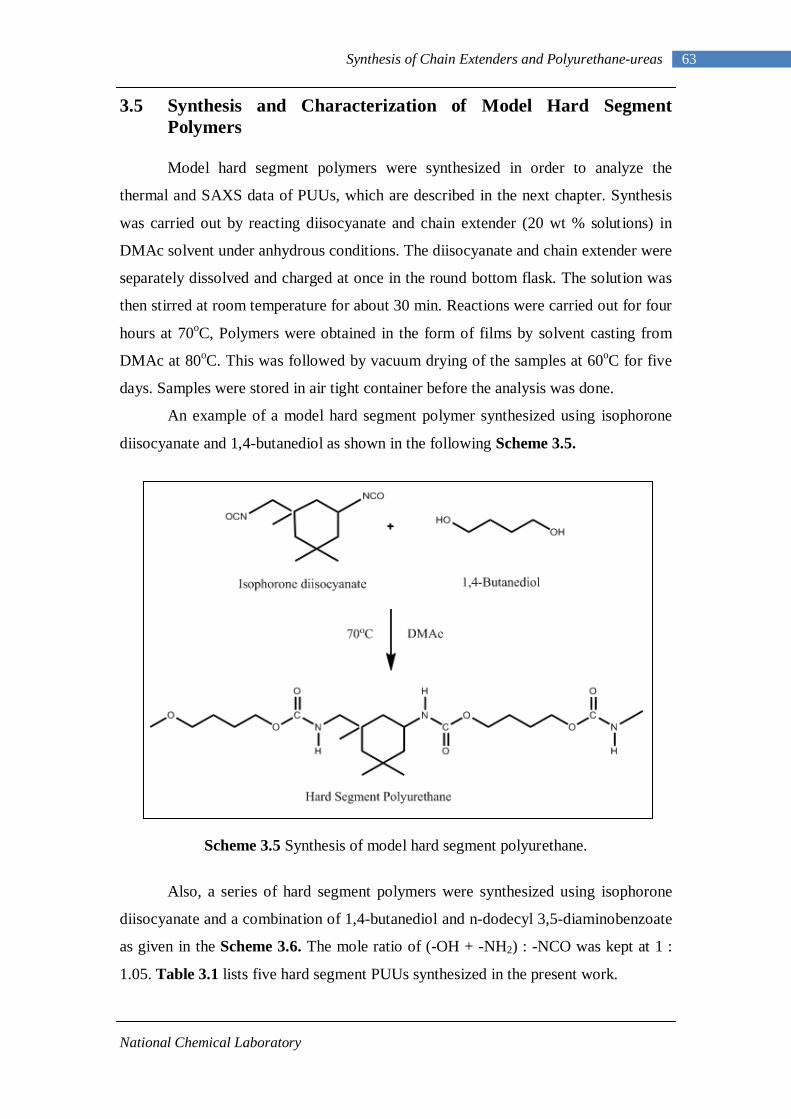
National Chemical Laboratory
63 Synthesis of Chain Extenders and Polyurethane-ureas
3.5 Synthesis and Characterization of Model Hard Segment Polymers
Model hard segment polymers were synthesized in order to analyze the
thermal and SAXS data of PUUs, which are described in the next chapter. Synthesis
was carried out by reacting diisocyanate and chain extender (20 wt % solutions) in
DMAc solvent under anhydrous conditions. The diisocyanate and chain extender were
separately dissolved and charged at once in the round bottom flask. The solution was
then stirred at room temperature for about 30 min. Reactions were carried out for four
hours at 70oC, Polymers were obtained in the form of films by solvent casting from
DMAc at 80oC. This was followed by vacuum drying of the samples at 60oC for five
days. Samples were stored in air tight container before the analysis was done.
An example of a model hard segment polymer synthesized using isophorone
diisocyanate and 1,4-butanediol as shown in the following Scheme 3.5.
Scheme 3.5 Synthesis of model hard segment polyurethane.
Also, a series of hard segment polymers were synthesized using isophorone
diisocyanate and a combination of 1,4-butanediol and n-dodecyl 3,5-diaminobenzoate
as given in the Scheme 3.6. The mole ratio of (-OH + -NH2) : -NCO was kept at 1 :
1.05. Table 3.1 lists five hard segment PUUs synthesized in the present work.
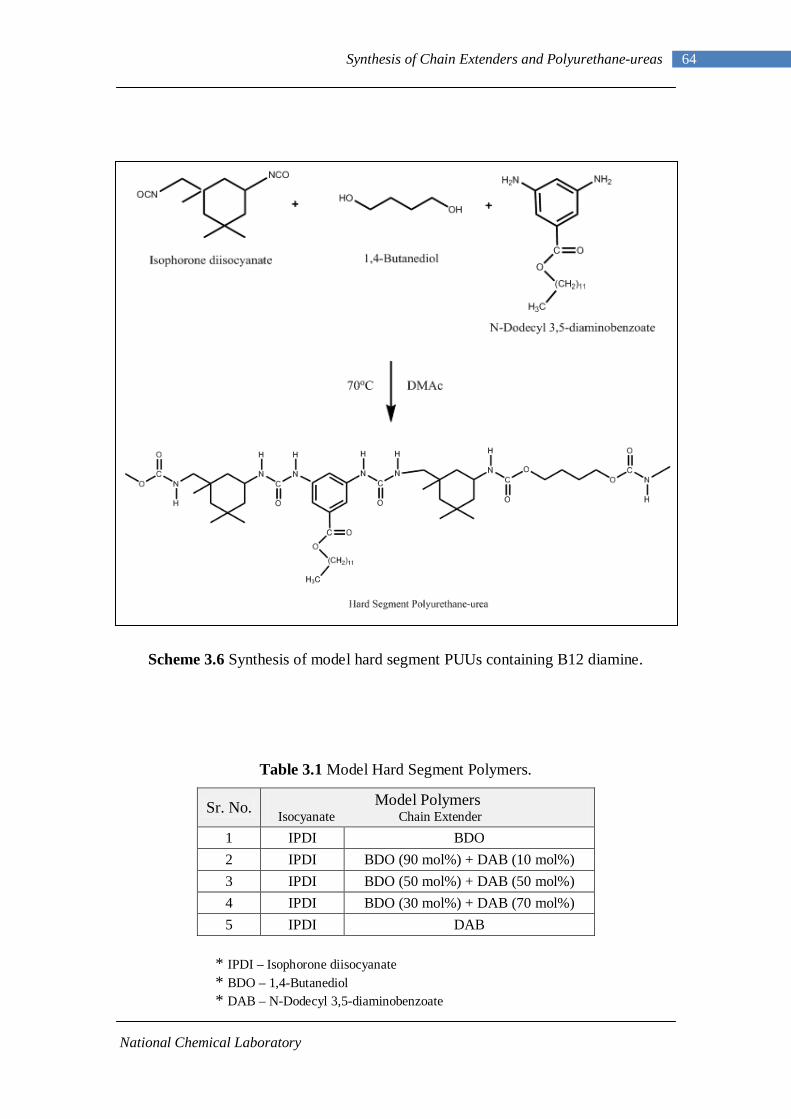
National Chemical Laboratory
64 Synthesis of Chain Extenders and Polyurethane-ureas
Scheme 3.6 Synthesis of model hard segment PUUs containing B12 diamine.
Table 3.1 Model Hard Segment Polymers.
Sr. No. Model Polymers Isocyanate Chain Extender
1 IPDI BDO 2 IPDI BDO (90 mol%) + DAB (10 mol%) 3 IPDI BDO (50 mol%) + DAB (50 mol%) 4 IPDI BDO (30 mol%) + DAB (70 mol%) 5 IPDI DAB
* IPDI – Isophorone diisocyanate
* BDO – 1,4-Butanediol * DAB – N-Dodecyl 3,5-diaminobenzoate
National Chemical Laboratory
65 Synthesis of Chain Extenders and Polyurethane-ureas
3.8 Summary
In summary, this chapter has described
• Two step synthesis of diamine chain extenders n-dodecyl 3,5-diaminobenzoate
and n-docosyl 3,5-diaminobenzoate starting from 3,5-dinitrobenzoylchloride.
• Characterization of diamine chain extenders by spectral methods and
elemental analysis.
• Synthesis of ‘linear’ polyurethane and a series of linear polyurethane-ureas
(chain extender m-phenylenediamine) via a two-step solution polymerization
scheme.
• Synthesis of two series of ‘branched’ polyurethane-ureas with varying
amounts of chain extenders n-dodecyl 3,5-diaminobenzoate and n-docosyl 3,5-
diaminobenzoate by a two-step solution polymerization scheme.
• Synthesis of a series of model hard segment polymers (chain extender 1,4-
butanediol and n-dodecyl 3,5-diaminobenzoate).
Molecular Characterization of Polyurethane-ureas
Chapter - 4
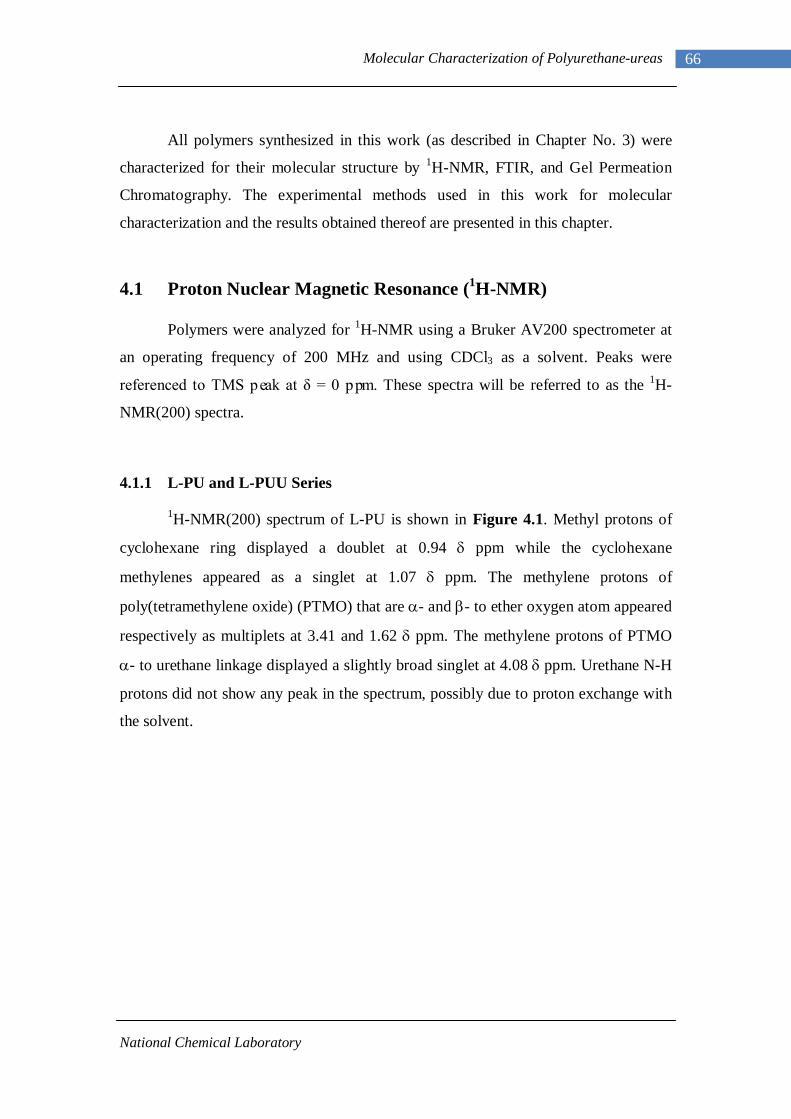
National Chemical Laboratory
66 Molecular Characterization of Polyurethane-ureas
All polymers synthesized in this work (as described in Chapter No. 3) were
characterized for their molecular structure by 1H-NMR, FTIR, and Gel Permeation
Chromatography. The experimental methods used in this work for molecular
characterization and the results obtained thereof are presented in this chapter.
4.1 Proton Nuclear Magnetic Resonance (1H-NMR)
Polymers were analyzed for 1H-NMR using a Bruker AV200 spectrometer at
an operating frequency of 200 MHz and using CDCl3 as a solvent. Peaks were
referenced to TMS peak at δ = 0 ppm. These spectra will be referred to as the 1H-
NMR(200) spectra.
4.1.1 L-PU and L-PUU Series
1H-NMR(200) spectrum of L-PU is shown in Figure 4.1. Methyl protons of
cyclohexane ring displayed a doublet at 0.94 δ ppm while the cyclohexane
methylenes appeared as a singlet at 1.07 δ ppm. The methylene protons of
poly(tetramethylene oxide) (PTMO) that are α- and β- to ether oxygen atom appeared
respectively as multiplets at 3.41 and 1.62 δ ppm. The methylene protons of PTMO
α- to urethane linkage displayed a slightly broad singlet at 4.08 δ ppm. Urethane N-H
protons did not show any peak in the spectrum, possibly due to proton exchange with
the solvent.
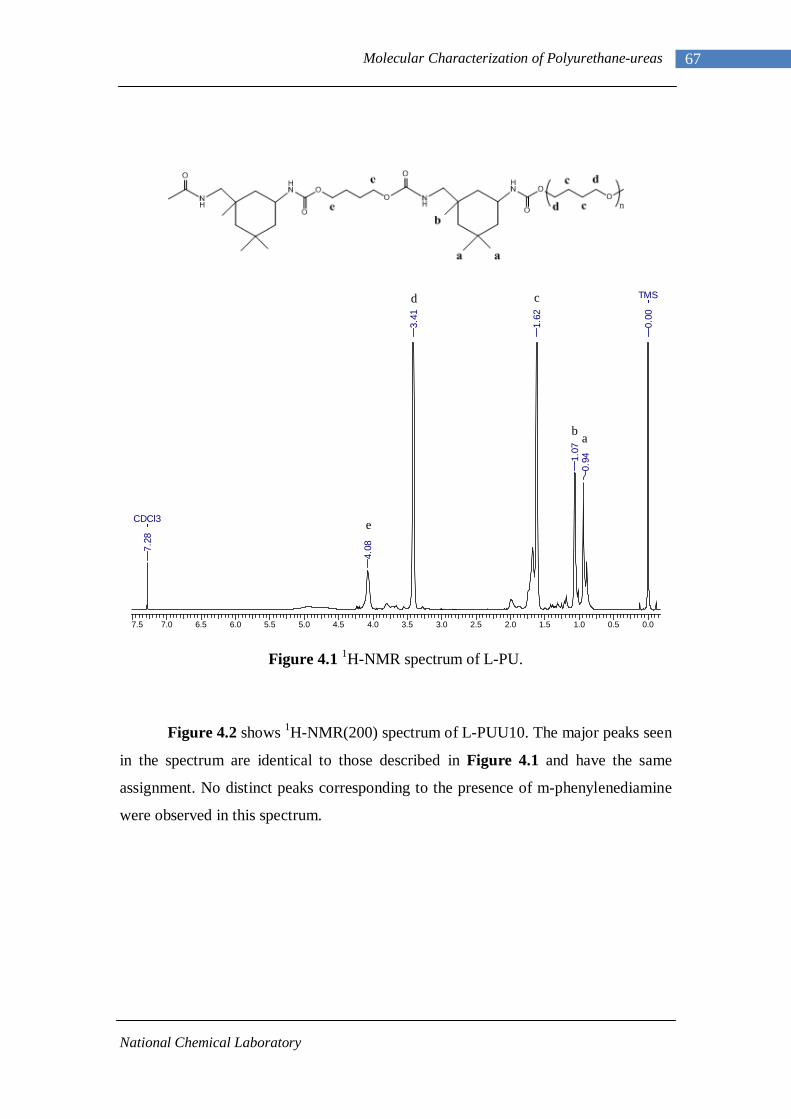
National Chemical Laboratory
67 Molecular Characterization of Polyurethane-ureas
Figure 4.1 1H-NMR spectrum of L-PU.
Figure 4.2 shows 1H-NMR(200) spectrum of L-PUU10. The major peaks seen
in the spectrum are identical to those described in Figure 4.1 and have the same
assignment. No distinct peaks corresponding to the presence of m-phenylenediamine
were observed in this spectrum.
7.5 7.0 6.5 6.0 5.5 5.0 4.5 4.0 3.5 3.0 2.5 2.0 1.5 1.0 0.5 0.0
TMS
CDCl3
0.00
0.941.
07
1.62
3.41
4.087.
28
b
cd
e
a
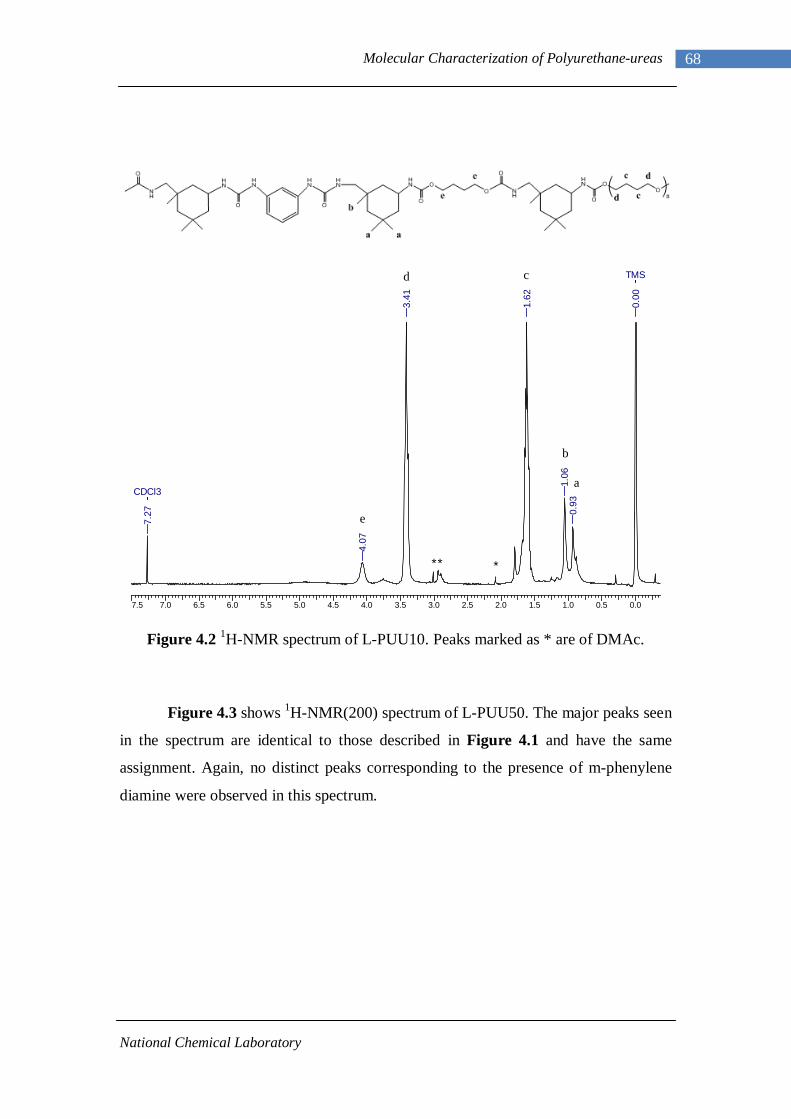
National Chemical Laboratory
68 Molecular Characterization of Polyurethane-ureas
Figure 4.2 1H-NMR spectrum of L-PUU10. Peaks marked as * are of DMAc.
Figure 4.3 shows 1H-NMR(200) spectrum of L-PUU50. The major peaks seen
in the spectrum are identical to those described in Figure 4.1 and have the same
assignment. Again, no distinct peaks corresponding to the presence of m-phenylene
diamine were observed in this spectrum.
7.5 7.0 6.5 6.0 5.5 5.0 4.5 4.0 3.5 3.0 2.5 2.0 1.5 1.0 0.5 0.0
CDCl3
TMS
7.27
4.07
3.41
1.62
1.06
0.93
0.00
a
b
cd
e
* **
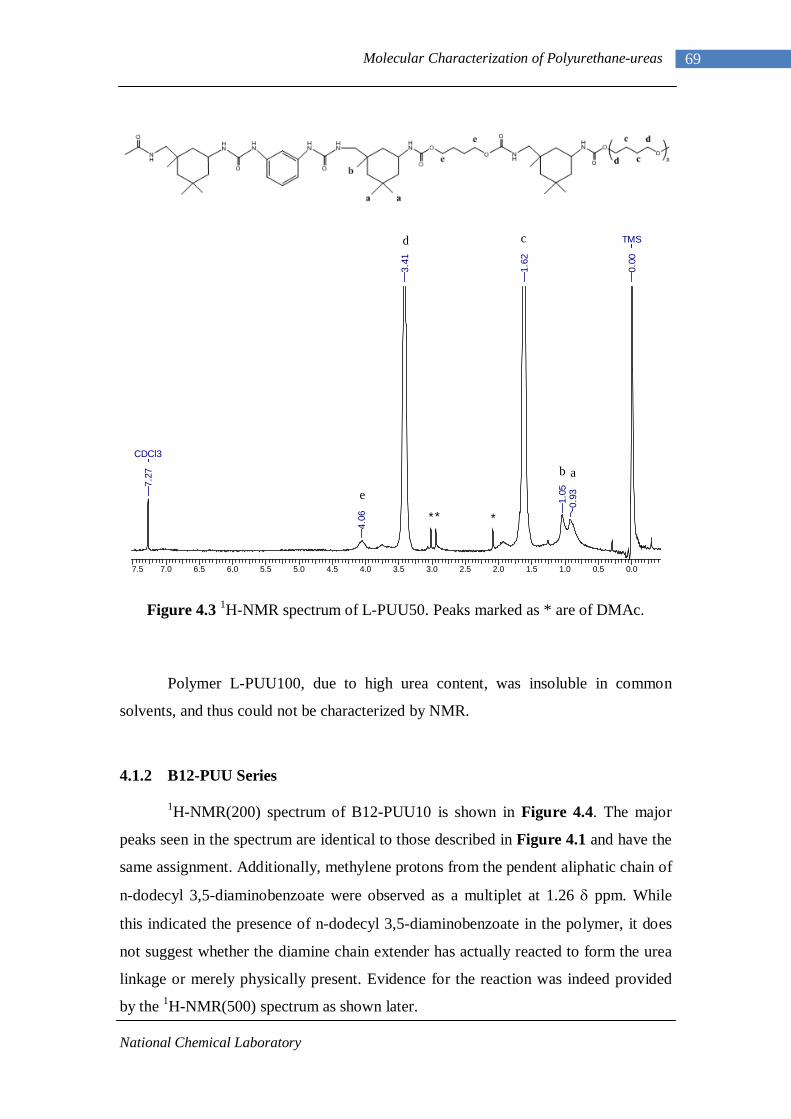
National Chemical Laboratory
69 Molecular Characterization of Polyurethane-ureas
Figure 4.3 1H-NMR spectrum of L-PUU50. Peaks marked as * are of DMAc.
Polymer L-PUU100, due to high urea content, was insoluble in common
solvents, and thus could not be characterized by NMR.
4.1.2 B12-PUU Series 1H-NMR(200) spectrum of B12-PUU10 is shown in Figure 4.4. The major
peaks seen in the spectrum are identical to those described in Figure 4.1 and have the
same assignment. Additionally, methylene protons from the pendent aliphatic chain of
n-dodecyl 3,5-diaminobenzoate were observed as a multiplet at 1.26 δ ppm. While
this indicated the presence of n-dodecyl 3,5-diaminobenzoate in the polymer, it does
not suggest whether the diamine chain extender has actually reacted to form the urea
linkage or merely physically present. Evidence for the reaction was indeed provided
by the 1H-NMR(500) spectrum as shown later.
7.5 7.0 6.5 6.0 5.5 5.0 4.5 4.0 3.5 3.0 2.5 2.0 1.5 1.0 0.5 0.0
CDCl3
TMS
7.27
4.06
3.41
1.62
1.05
0.93
0.00
* * *
ab
cd
e
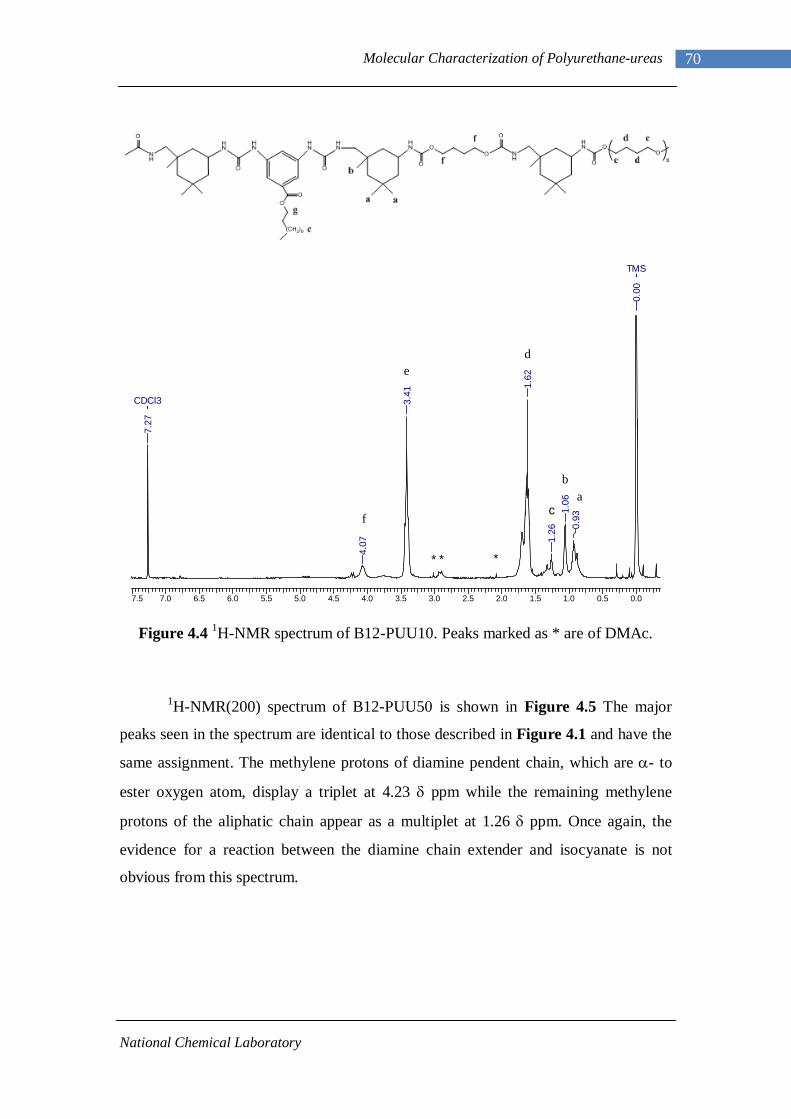
National Chemical Laboratory
70 Molecular Characterization of Polyurethane-ureas
Figure 4.4 1H-NMR spectrum of B12-PUU10. Peaks marked as * are of DMAc.
1H-NMR(200) spectrum of B12-PUU50 is shown in Figure 4.5 The major
peaks seen in the spectrum are identical to those described in Figure 4.1 and have the
same assignment. The methylene protons of diamine pendent chain, which are α- to
ester oxygen atom, display a triplet at 4.23 δ ppm while the remaining methylene
protons of the aliphatic chain appear as a multiplet at 1.26 δ ppm. Once again, the
evidence for a reaction between the diamine chain extender and isocyanate is not
obvious from this spectrum.
7.5 7.0 6.5 6.0 5.5 5.0 4.5 4.0 3.5 3.0 2.5 2.0 1.5 1.0 0.5 0.0
TMS
CDCl3
0.00
0.93
1.06
1.26
1.62
3.41
4.07
7.27
ab
c
de
f
* * *
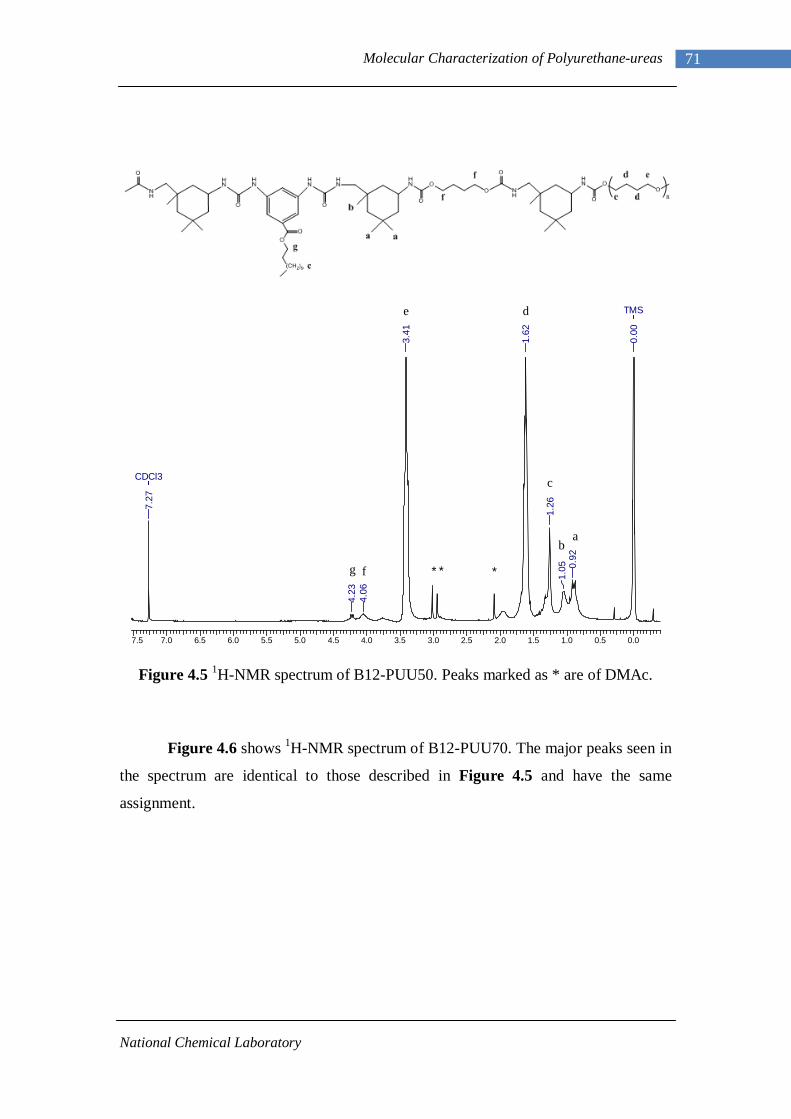
National Chemical Laboratory
71 Molecular Characterization of Polyurethane-ureas
Figure 4.5 1H-NMR spectrum of B12-PUU50. Peaks marked as * are of DMAc.
Figure 4.6 shows 1H-NMR spectrum of B12-PUU70. The major peaks seen in
the spectrum are identical to those described in Figure 4.5 and have the same
assignment.
7.5 7.0 6.5 6.0 5.5 5.0 4.5 4.0 3.5 3.0 2.5 2.0 1.5 1.0 0.5 0.0
CDCl3
TMS
7.27
4.23
4.06
3.41
1.62
1.26
1.05 0.
92
0.00
ab
c
de
fg * * *
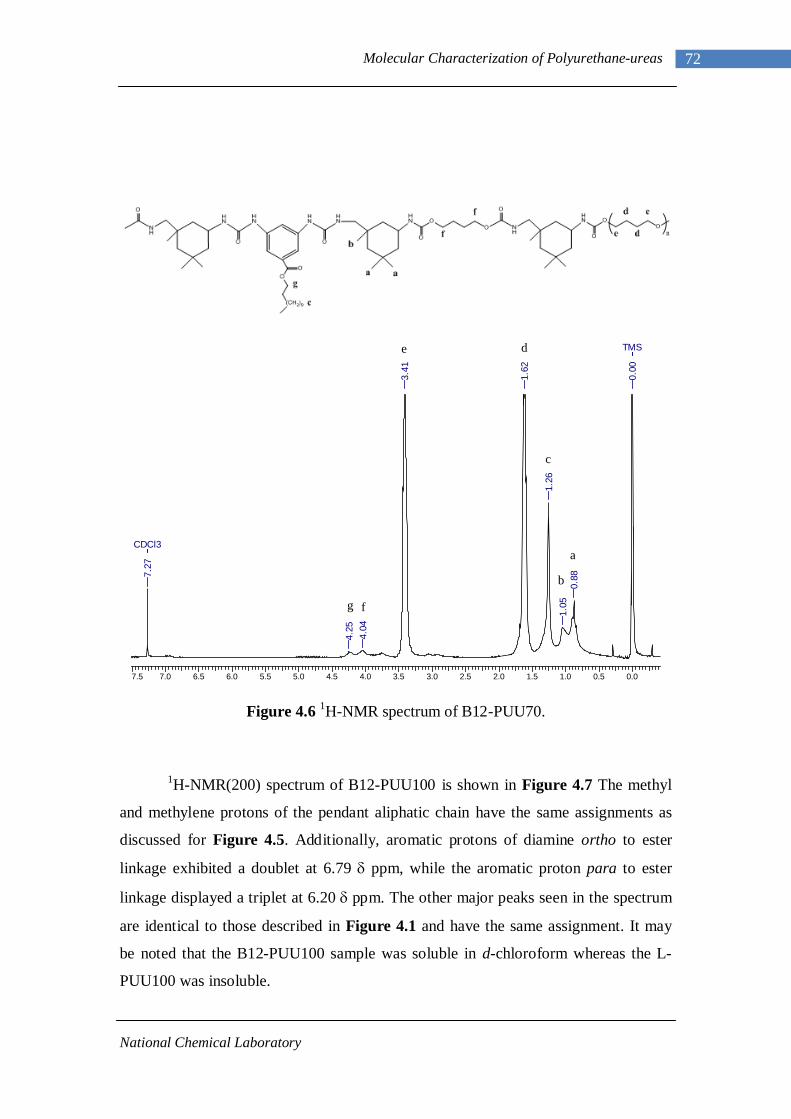
National Chemical Laboratory
72 Molecular Characterization of Polyurethane-ureas
Figure 4.6 1H-NMR spectrum of B12-PUU70.
1H-NMR(200) spectrum of B12-PUU100 is shown in Figure 4.7 The methyl
and methylene protons of the pendant aliphatic chain have the same assignments as
discussed for Figure 4.5. Additionally, aromatic protons of diamine ortho to ester
linkage exhibited a doublet at 6.79 δ ppm, while the aromatic proton para to ester
linkage displayed a triplet at 6.20 δ ppm. The other major peaks seen in the spectrum
are identical to those described in Figure 4.1 and have the same assignment. It may
be noted that the B12-PUU100 sample was soluble in d-chloroform whereas the L-
PUU100 was insoluble.
7.5 7.0 6.5 6.0 5.5 5.0 4.5 4.0 3.5 3.0 2.5 2.0 1.5 1.0 0.5 0.0
CDCl3
TMS
7.27
4.25
4.04
3.41
1.62
1.26
1.05
0.88
0.00
a
b
c
de
fg
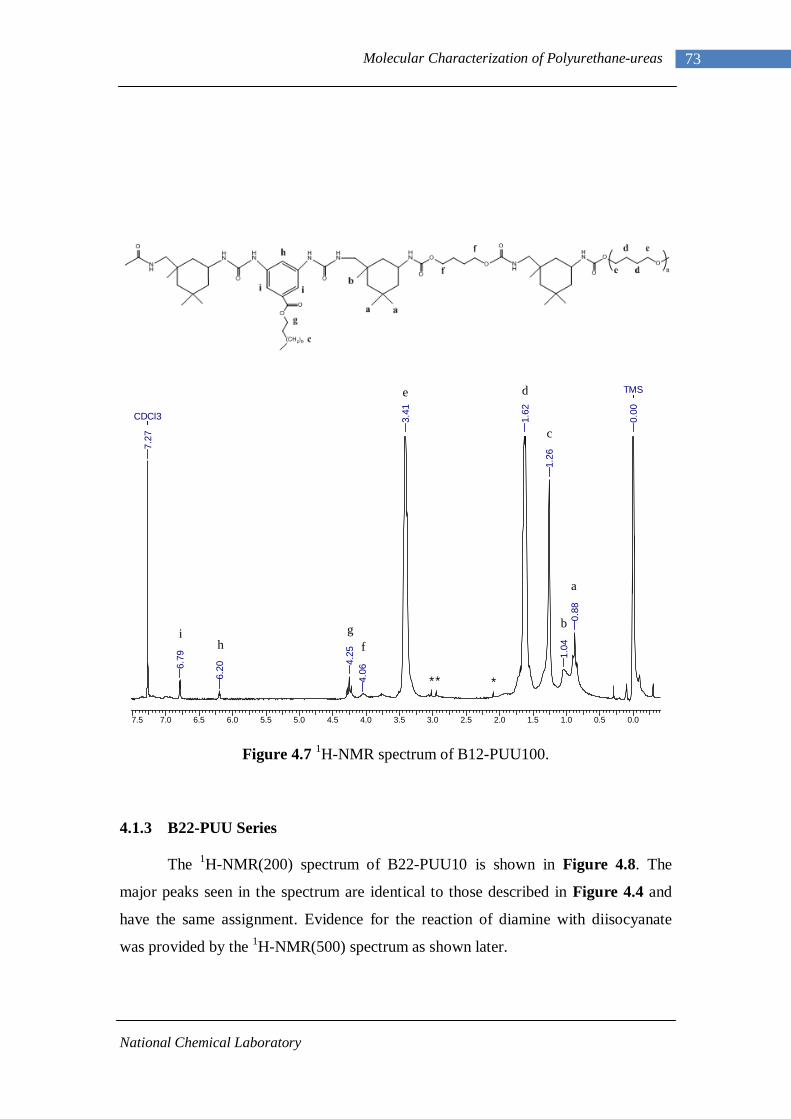
National Chemical Laboratory
73 Molecular Characterization of Polyurethane-ureas
Figure 4.7 1H-NMR spectrum of B12-PUU100.
4.1.3 B22-PUU Series
The 1H-NMR(200) spectrum of B22-PUU10 is shown in Figure 4.8. The
major peaks seen in the spectrum are identical to those described in Figure 4.4 and
have the same assignment. Evidence for the reaction of diamine with diisocyanate
was provided by the 1H-NMR(500) spectrum as shown later.
7.5 7.0 6.5 6.0 5.5 5.0 4.5 4.0 3.5 3.0 2.5 2.0 1.5 1.0 0.5 0.0
CDCl3
TMS
7.27
6.79
6.20
4.25
4.06
3.41
1.62
1.26
1.04
0.88
0.00
a
b
c
de
fg
hi
** *
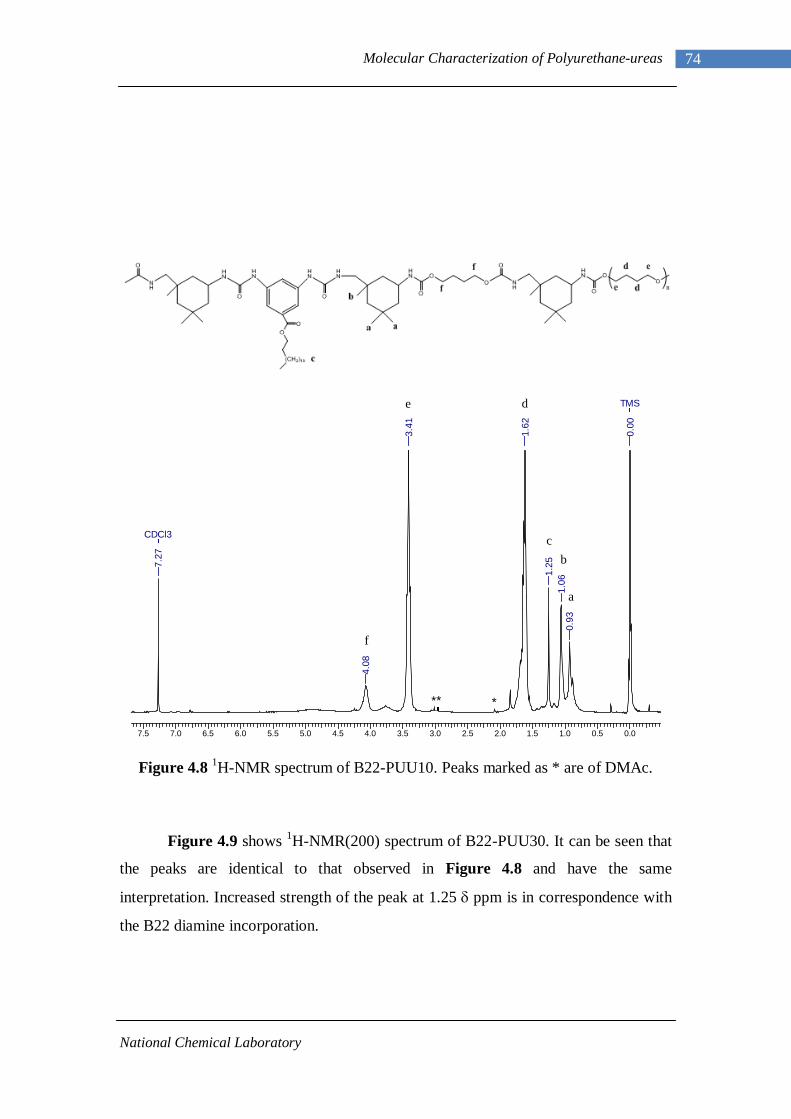
National Chemical Laboratory
74 Molecular Characterization of Polyurethane-ureas
Figure 4.8 1H-NMR spectrum of B22-PUU10. Peaks marked as * are of DMAc.
Figure 4.9 shows 1H-NMR(200) spectrum of B22-PUU30. It can be seen that
the peaks are identical to that observed in Figure 4.8 and have the same
interpretation. Increased strength of the peak at 1.25 δ ppm is in correspondence with
the B22 diamine incorporation.
7.5 7.0 6.5 6.0 5.5 5.0 4.5 4.0 3.5 3.0 2.5 2.0 1.5 1.0 0.5 0.0
TMS
CDCl3
0.00
0.93
1.06
1.25
1.62
3.41
4.08
7.27
a
bc
de
f
** *
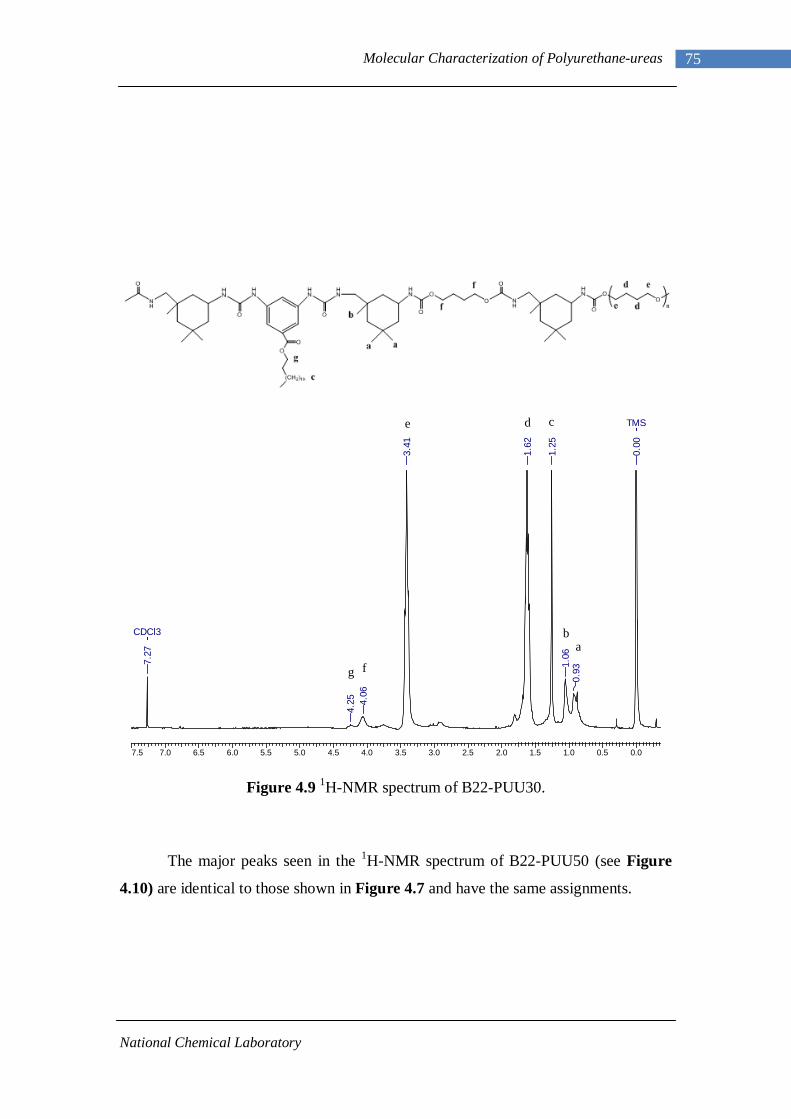
National Chemical Laboratory
75 Molecular Characterization of Polyurethane-ureas
Figure 4.9 1H-NMR spectrum of B22-PUU30.
The major peaks seen in the 1H-NMR spectrum of B22-PUU50 (see Figure
4.10) are identical to those shown in Figure 4.7 and have the same assignments.
7.5 7.0 6.5 6.0 5.5 5.0 4.5 4.0 3.5 3.0 2.5 2.0 1.5 1.0 0.5 0.0
CDCl3
TMS
7.27
4.25 4.
06
3.41
1.62
1.25
1.06
0.93
0.00
ab
cde
fg
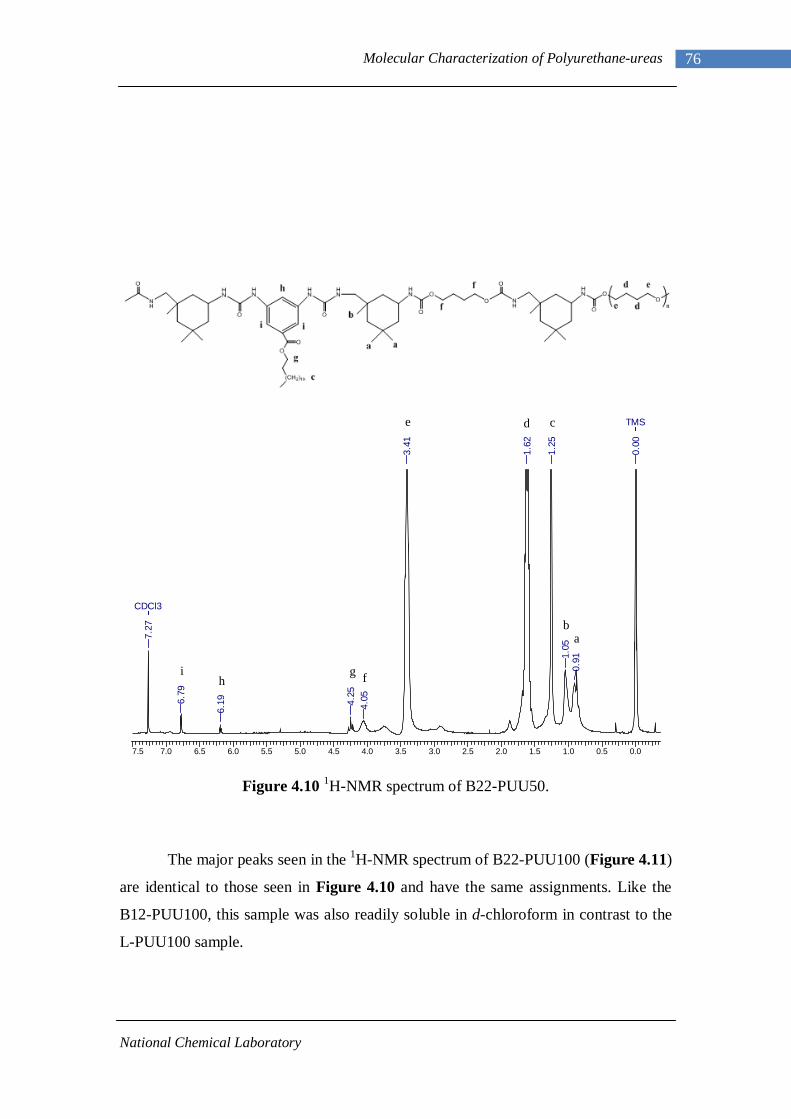
National Chemical Laboratory
76 Molecular Characterization of Polyurethane-ureas
Figure 4.10 1H-NMR spectrum of B22-PUU50.
The major peaks seen in the 1H-NMR spectrum of B22-PUU100 (Figure 4.11)
are identical to those seen in Figure 4.10 and have the same assignments. Like the
B12-PUU100, this sample was also readily soluble in d-chloroform in contrast to the
L-PUU100 sample.
7.5 7.0 6.5 6.0 5.5 5.0 4.5 4.0 3.5 3.0 2.5 2.0 1.5 1.0 0.5 0.0
CDCl3
TMS
7.27
6.79
6.19 4.
254.
05
3.41
1.62
1.25
1.05
0.91
0.00
ab
cde
fgh
i
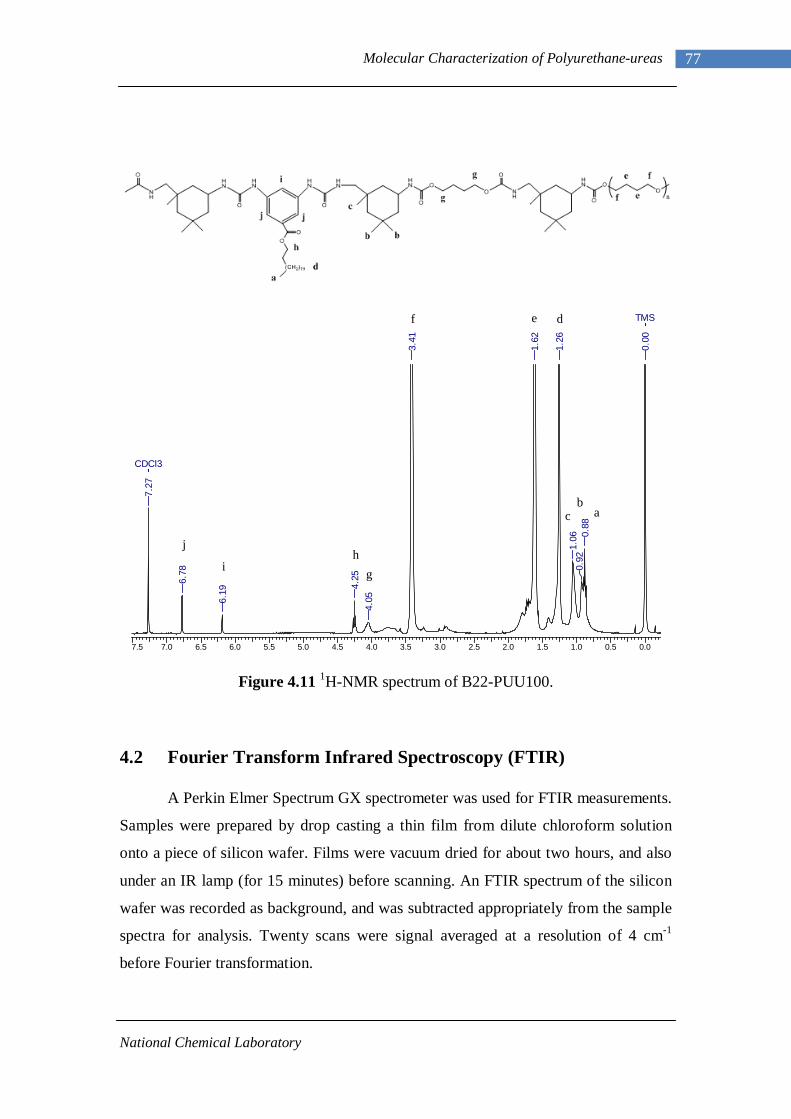
National Chemical Laboratory
77 Molecular Characterization of Polyurethane-ureas
Figure 4.11 1H-NMR spectrum of B22-PUU100.
4.2 Fourier Transform Infrared Spectroscopy (FTIR)
A Perkin Elmer Spectrum GX spectrometer was used for FTIR measurements.
Samples were prepared by drop casting a thin film from dilute chloroform solution
onto a piece of silicon wafer. Films were vacuum dried for about two hours, and also
under an IR lamp (for 15 minutes) before scanning. An FTIR spectrum of the silicon
wafer was recorded as background, and was subtracted appropriately from the sample
spectra for analysis. Twenty scans were signal averaged at a resolution of 4 cm-1
before Fourier transformation.
7.5 7.0 6.5 6.0 5.5 5.0 4.5 4.0 3.5 3.0 2.5 2.0 1.5 1.0 0.5 0.0
CDCl3
TMS
7.27
6.78
6.19 4.
254.
05
3.41
1.62
1.26
1.06
0.92
0.88
0.00
ab
c
def
gh
i
j
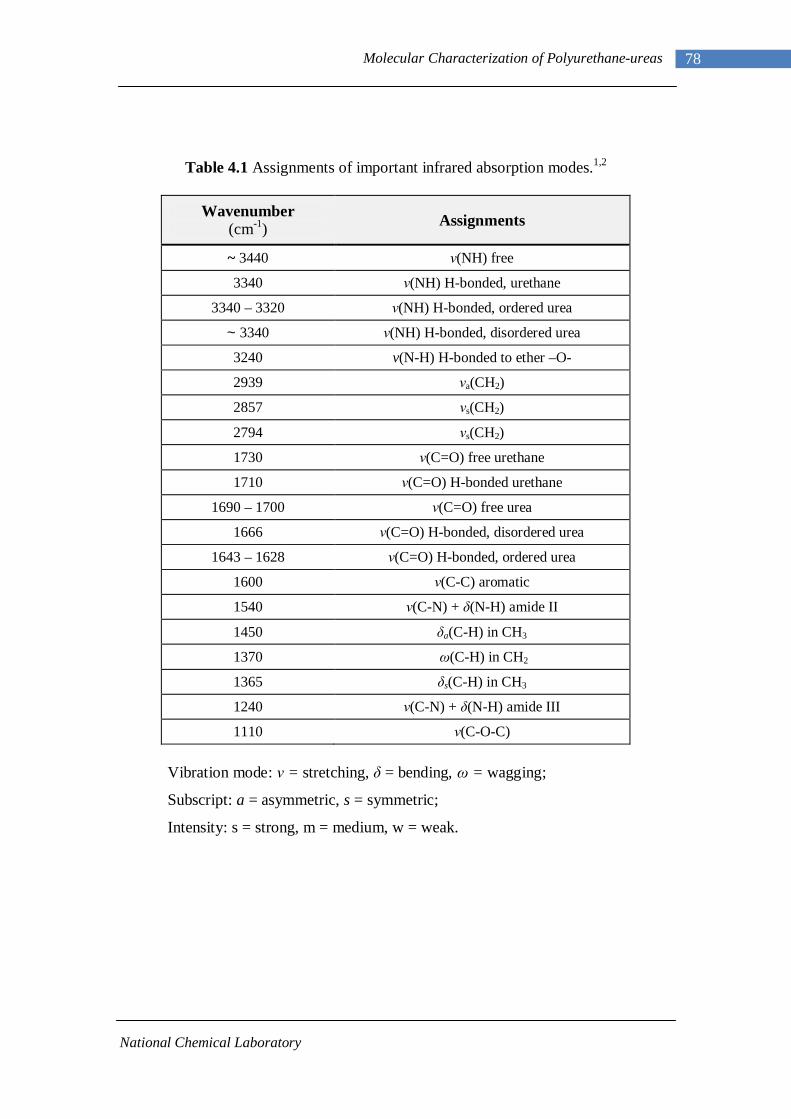
National Chemical Laboratory
78 Molecular Characterization of Polyurethane-ureas
Table 4.1 Assignments of important infrared absorption modes.1,2
Wavenumber (cm-1) Assignments
~ 3440 ν(NH) free
3340 ν(NH) H-bonded, urethane
3340 – 3320 ν(NH) H-bonded, ordered urea
~ 3340 ν(NH) H-bonded, disordered urea
3240 v(N-H) H-bonded to ether –O-
2939 νa(CH2)
2857 νs(CH2)
2794 νs(CH2)
1730 ν(C=O) free urethane
1710 ν(C=O) H-bonded urethane
1690 – 1700 ν(C=O) free urea
1666 ν(C=O) H-bonded, disordered urea
1643 – 1628 ν(C=O) H-bonded, ordered urea
1600 ν(C-C) aromatic
1540 ν(C-N) + δ(N-H) amide II
1450 δa(C-H) in CH3
1370 ω(C-H) in CH2
1365 δs(C-H) in CH3
1240 ν(C-N) + δ(N-H) amide III
1110 ν(C-O-C)
Vibration mode: ν = stretching, δ = bending, ω = wagging;
Subscript: a = asymmetric, s = symmetric;
Intensity: s = strong, m = medium, w = weak.
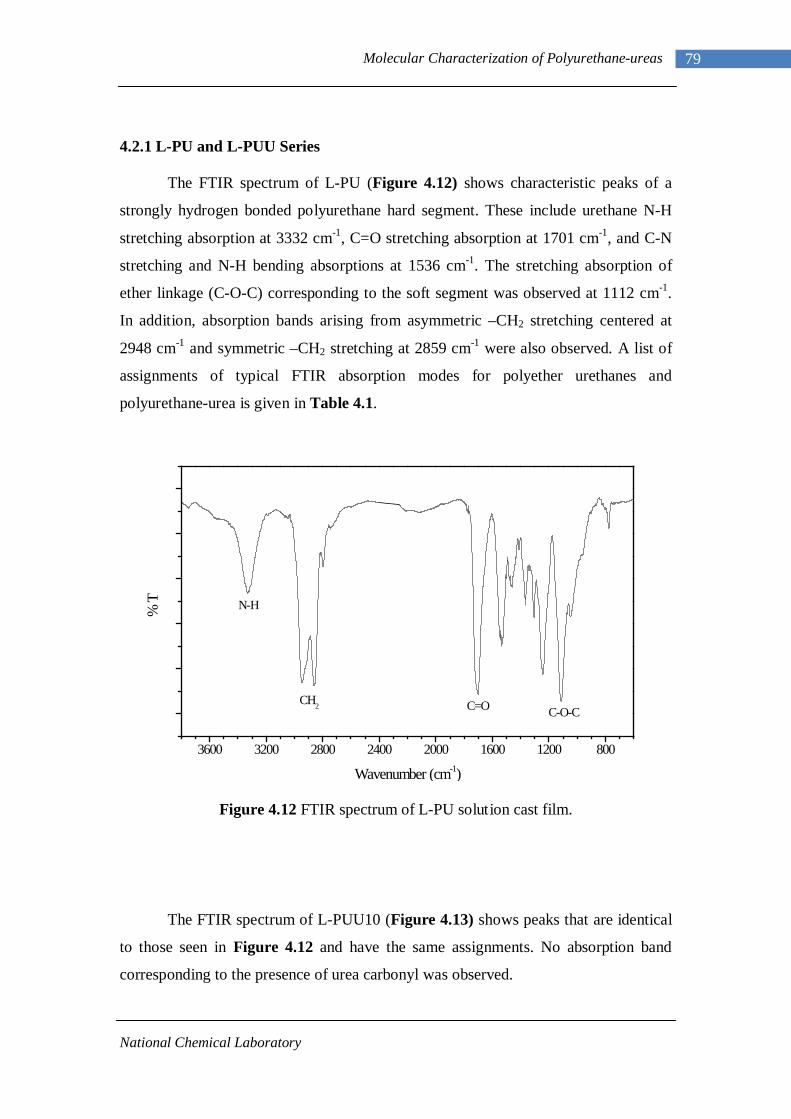
National Chemical Laboratory
79 Molecular Characterization of Polyurethane-ureas
4.2.1 L-PU and L-PUU Series
The FTIR spectrum of L-PU (Figure 4.12) shows characteristic peaks of a
strongly hydrogen bonded polyurethane hard segment. These include urethane N-H
stretching absorption at 3332 cm-1, C=O stretching absorption at 1701 cm-1, and C-N
stretching and N-H bending absorptions at 1536 cm-1. The stretching absorption of
ether linkage (C-O-C) corresponding to the soft segment was observed at 1112 cm-1.
In addition, absorption bands arising from asymmetric –CH2 stretching centered at
2948 cm-1 and symmetric –CH2 stretching at 2859 cm-1 were also observed. A list of
assignments of typical FTIR absorption modes for polyether urethanes and
polyurethane-urea is given in Table 4.1.
Figure 4.12 FTIR spectrum of L-PU solution cast film.
The FTIR spectrum of L-PUU10 (Figure 4.13) shows peaks that are identical
to those seen in Figure 4.12 and have the same assignments. No absorption band
corresponding to the presence of urea carbonyl was observed.
3600 3200 2800 2400 2000 1600 1200 800
C-O-CC=OCH2
N-H
% T
Wavenumber (cm-1)
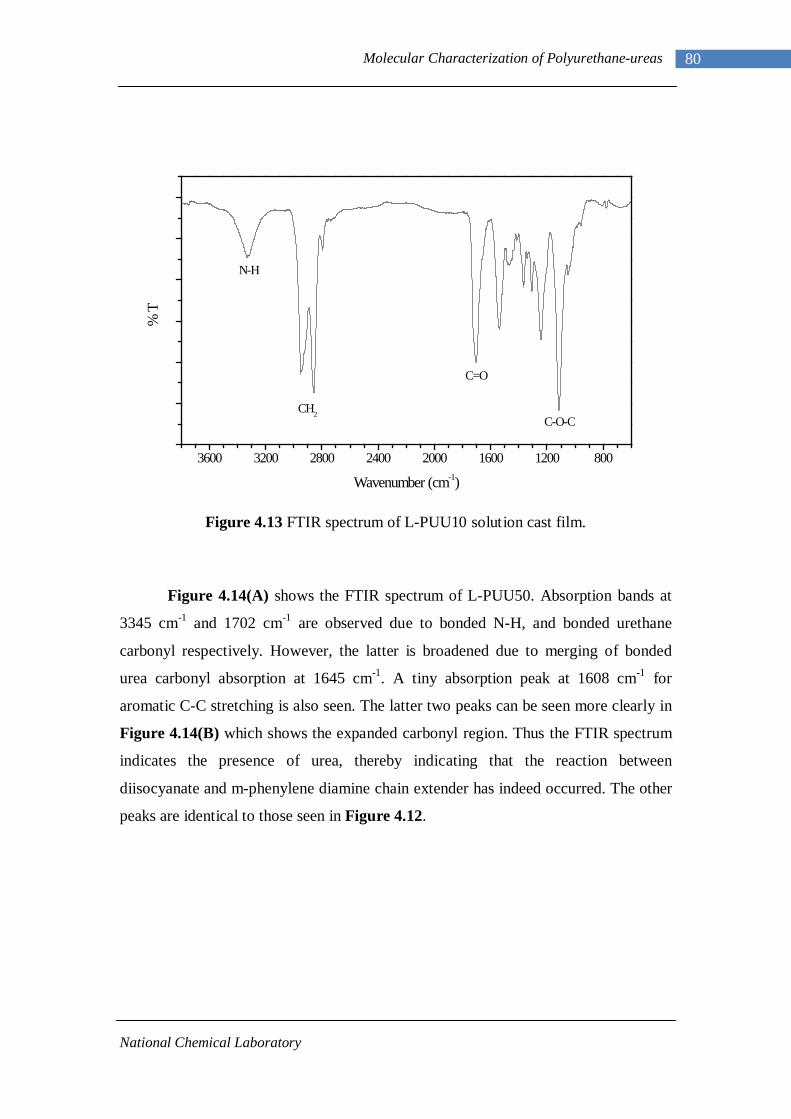
National Chemical Laboratory
80 Molecular Characterization of Polyurethane-ureas
Figure 4.13 FTIR spectrum of L-PUU10 solution cast film.
Figure 4.14(A) shows the FTIR spectrum of L-PUU50. Absorption bands at
3345 cm-1 and 1702 cm-1 are observed due to bonded N-H, and bonded urethane
carbonyl respectively. However, the latter is broadened due to merging of bonded
urea carbonyl absorption at 1645 cm-1. A tiny absorption peak at 1608 cm-1 for
aromatic C-C stretching is also seen. The latter two peaks can be seen more clearly in
Figure 4.14(B) which shows the expanded carbonyl region. Thus the FTIR spectrum
indicates the presence of urea, thereby indicating that the reaction between
diisocyanate and m-phenylene diamine chain extender has indeed occurred. The other
peaks are identical to those seen in Figure 4.12.
3600 3200 2800 2400 2000 1600 1200 800
C=O
C-O-CCH2
N-H
% T
Wavenumber (cm-1)
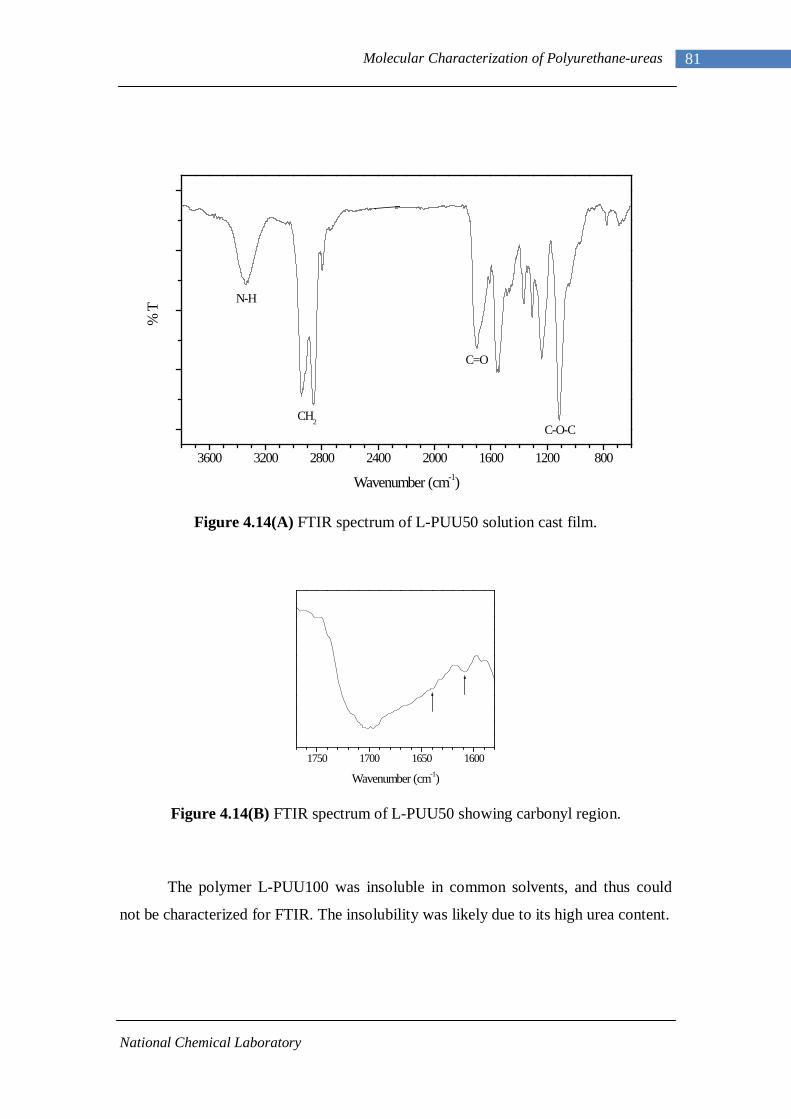
National Chemical Laboratory
81 Molecular Characterization of Polyurethane-ureas
Figure 4.14(A) FTIR spectrum of L-PUU50 solution cast film.
Figure 4.14(B) FTIR spectrum of L-PUU50 showing carbonyl region.
The polymer L-PUU100 was insoluble in common solvents, and thus could
not be characterized for FTIR. The insolubility was likely due to its high urea content.
3600 3200 2800 2400 2000 1600 1200 800
C=O
C-O-CCH2
N-H
% T
Wavenumber (cm-1)
1750 1700 1650 1600
Wavenumber (cm-1)
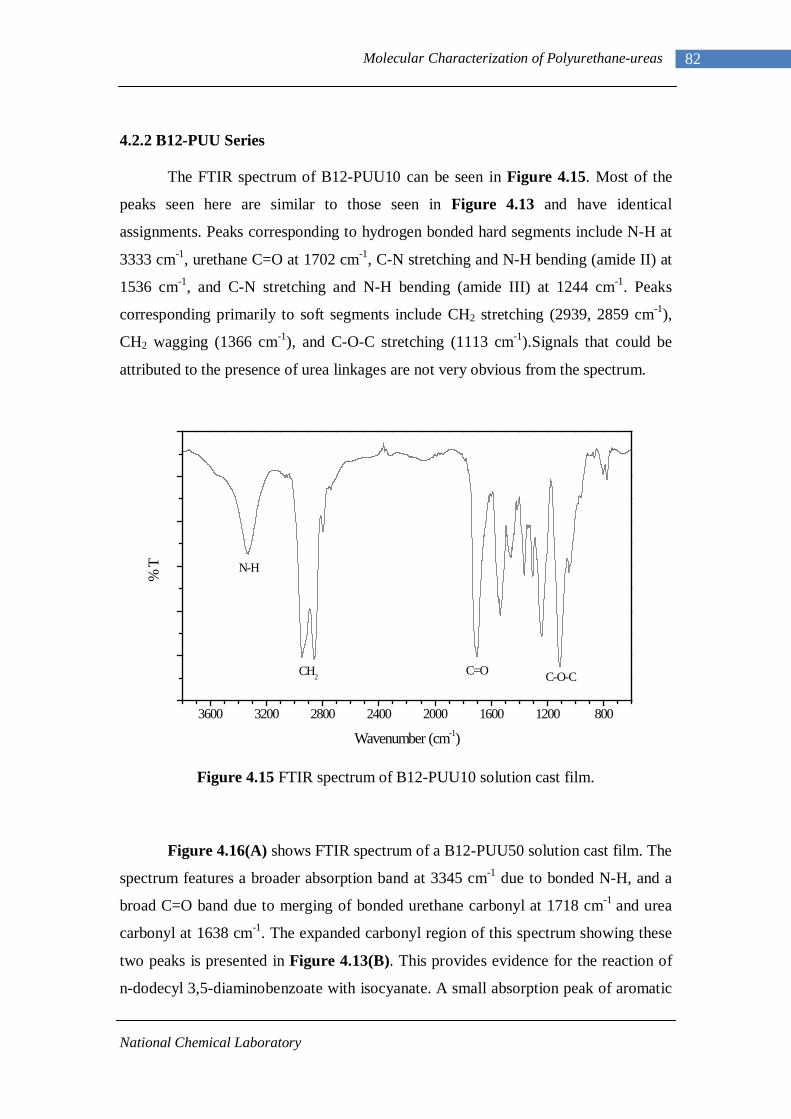
National Chemical Laboratory
82 Molecular Characterization of Polyurethane-ureas
4.2.2 B12-PUU Series
The FTIR spectrum of B12-PUU10 can be seen in Figure 4.15. Most of the
peaks seen here are similar to those seen in Figure 4.13 and have identical
assignments. Peaks corresponding to hydrogen bonded hard segments include N-H at
3333 cm-1, urethane C=O at 1702 cm-1, C-N stretching and N-H bending (amide II) at
1536 cm-1, and C-N stretching and N-H bending (amide III) at 1244 cm-1. Peaks
corresponding primarily to soft segments include CH2 stretching (2939, 2859 cm-1),
CH2 wagging (1366 cm-1), and C-O-C stretching (1113 cm-1).Signals that could be
attributed to the presence of urea linkages are not very obvious from the spectrum.
Figure 4.15 FTIR spectrum of B12-PUU10 solution cast film.
Figure 4.16(A) shows FTIR spectrum of a B12-PUU50 solution cast film. The
spectrum features a broader absorption band at 3345 cm-1 due to bonded N-H, and a
broad C=O band due to merging of bonded urethane carbonyl at 1718 cm-1 and urea
carbonyl at 1638 cm-1. The expanded carbonyl region of this spectrum showing these
two peaks is presented in Figure 4.13(B). This provides evidence for the reaction of
n-dodecyl 3,5-diaminobenzoate with isocyanate. A small absorption peak of aromatic
3600 3200 2800 2400 2000 1600 1200 800
C-O-CC=OCH2
N-H
% T
Wavenumber (cm-1)
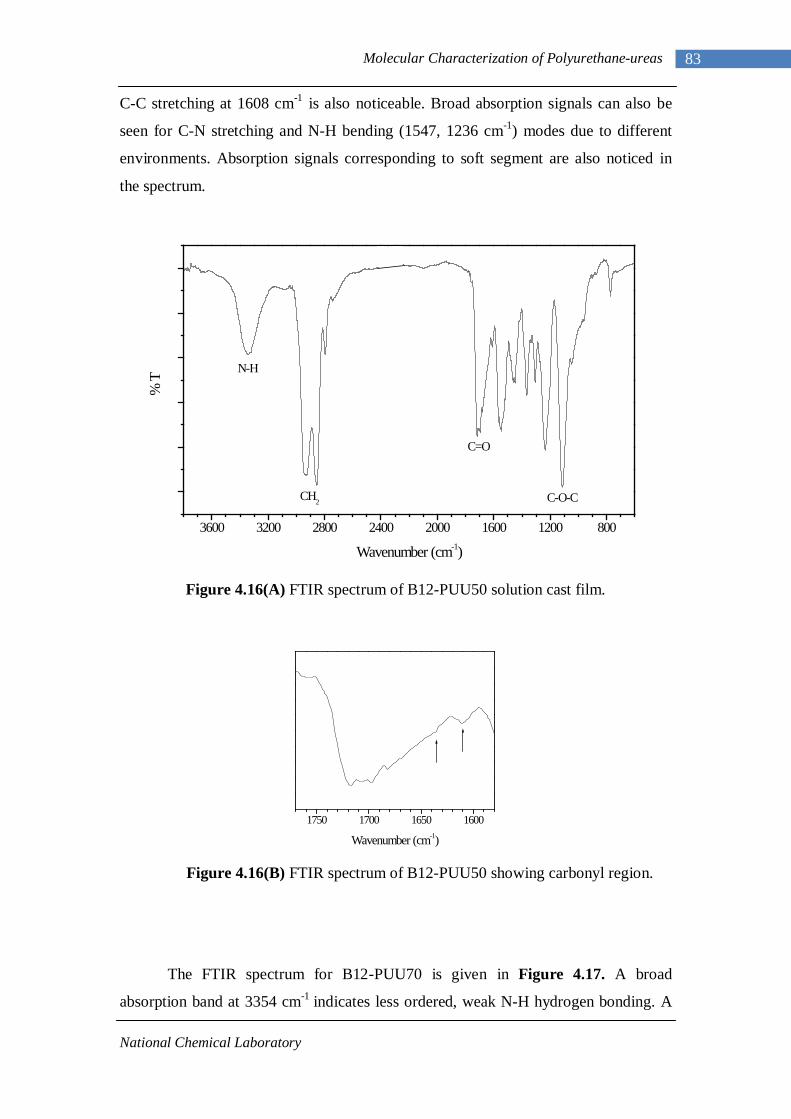
National Chemical Laboratory
83 Molecular Characterization of Polyurethane-ureas
C-C stretching at 1608 cm-1 is also noticeable. Broad absorption signals can also be
seen for C-N stretching and N-H bending (1547, 1236 cm-1) modes due to different
environments. Absorption signals corresponding to soft segment are also noticed in
the spectrum.
Figure 4.16(A) FTIR spectrum of B12-PUU50 solution cast film.
Figure 4.16(B) FTIR spectrum of B12-PUU50 showing carbonyl region.
The FTIR spectrum for B12-PUU70 is given in Figure 4.17. A broad
absorption band at 3354 cm-1 indicates less ordered, weak N-H hydrogen bonding. A
3600 3200 2800 2400 2000 1600 1200 800
C-O-C
C=O
CH2
N-H
% T
Wavenumber (cm-1)
1750 1700 1650 1600
Wavenumber (cm-1)
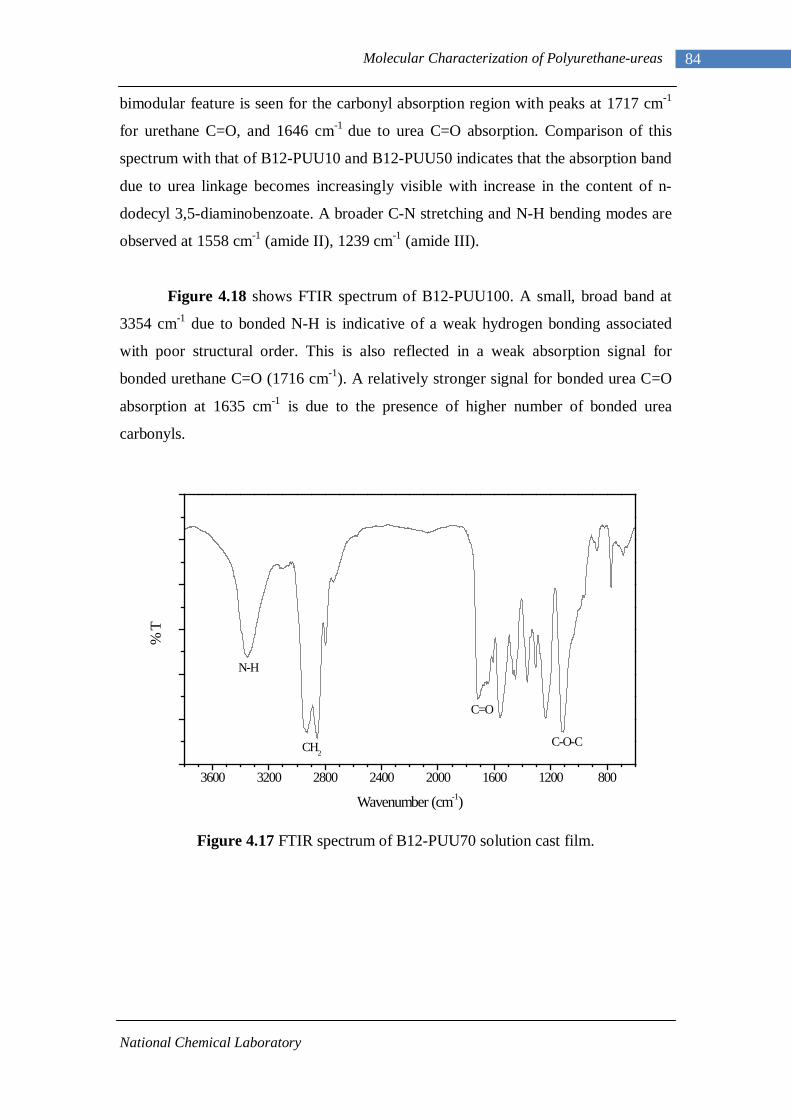
National Chemical Laboratory
84 Molecular Characterization of Polyurethane-ureas
bimodular feature is seen for the carbonyl absorption region with peaks at 1717 cm-1
for urethane C=O, and 1646 cm-1 due to urea C=O absorption. Comparison of this
spectrum with that of B12-PUU10 and B12-PUU50 indicates that the absorption band
due to urea linkage becomes increasingly visible with increase in the content of n-
dodecyl 3,5-diaminobenzoate. A broader C-N stretching and N-H bending modes are
observed at 1558 cm-1 (amide II), 1239 cm-1 (amide III).
Figure 4.18 shows FTIR spectrum of B12-PUU100. A small, broad band at
3354 cm-1 due to bonded N-H is indicative of a weak hydrogen bonding associated
with poor structural order. This is also reflected in a weak absorption signal for
bonded urethane C=O (1716 cm-1). A relatively stronger signal for bonded urea C=O
absorption at 1635 cm-1 is due to the presence of higher number of bonded urea
carbonyls.
Figure 4.17 FTIR spectrum of B12-PUU70 solution cast film.
3600 3200 2800 2400 2000 1600 1200 800
C-O-C
C=O
CH2
N-H
% T
Wavenumber (cm-1)
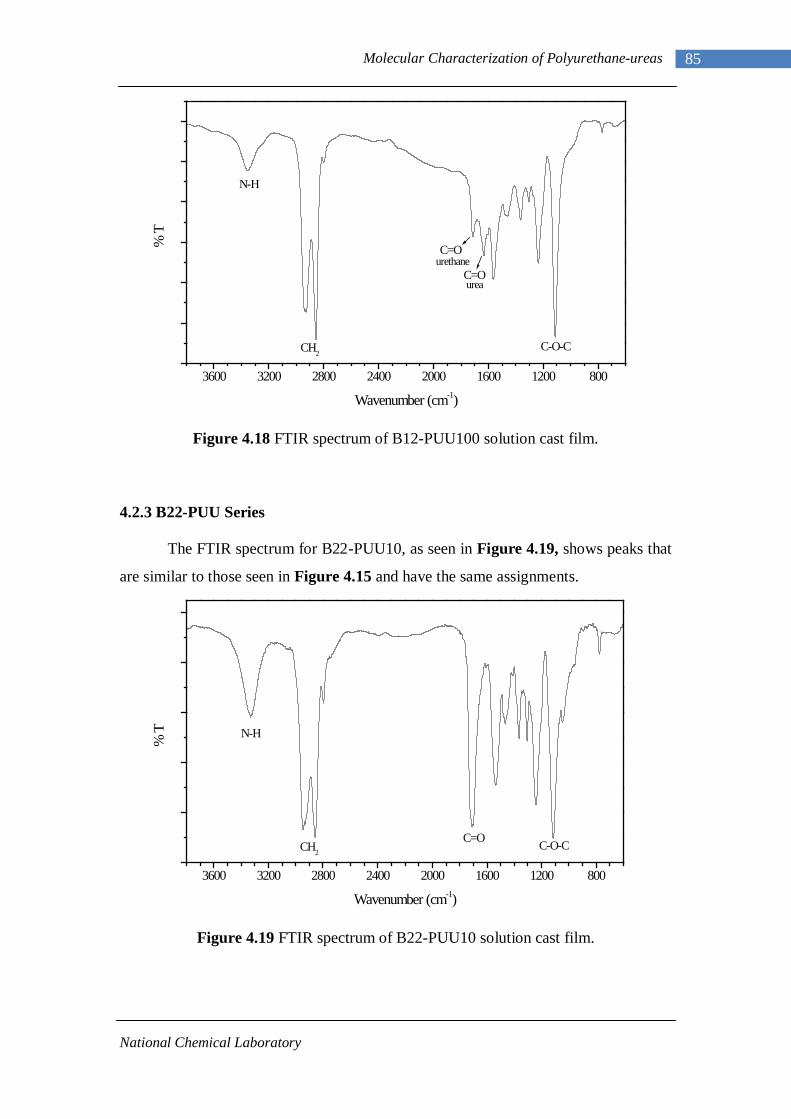
National Chemical Laboratory
85 Molecular Characterization of Polyurethane-ureas
Figure 4.18 FTIR spectrum of B12-PUU100 solution cast film.
4.2.3 B22-PUU Series
The FTIR spectrum for B22-PUU10, as seen in Figure 4.19, shows peaks that
are similar to those seen in Figure 4.15 and have the same assignments.
Figure 4.19 FTIR spectrum of B22-PUU10 solution cast film.
3600 3200 2800 2400 2000 1600 1200 800
urea
urethaneC=O
C-O-C
C=O
CH2
N-H
% T
Wavenumber (cm-1)
3600 3200 2800 2400 2000 1600 1200 800
C=O C-O-CCH2
N-H
% T
Wavenumber (cm-1)
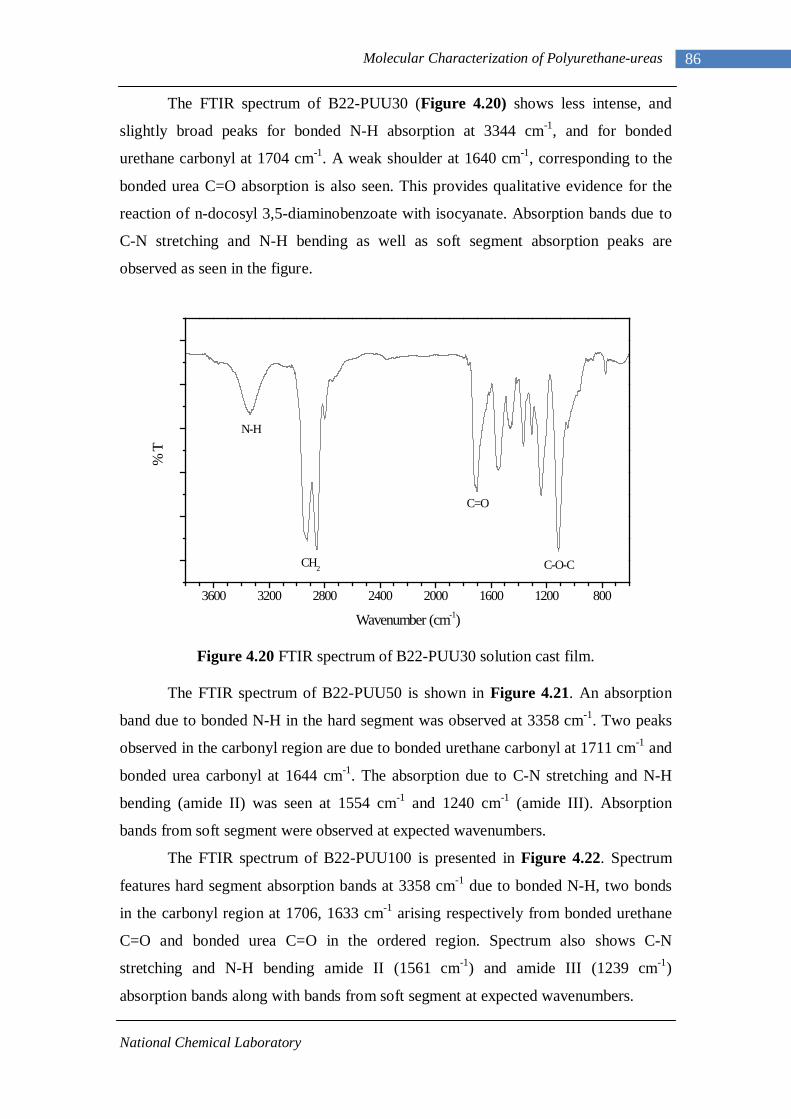
National Chemical Laboratory
86 Molecular Characterization of Polyurethane-ureas
The FTIR spectrum of B22-PUU30 (Figure 4.20) shows less intense, and
slightly broad peaks for bonded N-H absorption at 3344 cm-1, and for bonded
urethane carbonyl at 1704 cm-1. A weak shoulder at 1640 cm-1, corresponding to the
bonded urea C=O absorption is also seen. This provides qualitative evidence for the
reaction of n-docosyl 3,5-diaminobenzoate with isocyanate. Absorption bands due to
C-N stretching and N-H bending as well as soft segment absorption peaks are
observed as seen in the figure.
Figure 4.20 FTIR spectrum of B22-PUU30 solution cast film.
The FTIR spectrum of B22-PUU50 is shown in Figure 4.21. An absorption
band due to bonded N-H in the hard segment was observed at 3358 cm-1. Two peaks
observed in the carbonyl region are due to bonded urethane carbonyl at 1711 cm-1 and
bonded urea carbonyl at 1644 cm-1. The absorption due to C-N stretching and N-H
bending (amide II) was seen at 1554 cm-1 and 1240 cm-1 (amide III). Absorption
bands from soft segment were observed at expected wavenumbers.
The FTIR spectrum of B22-PUU100 is presented in Figure 4.22. Spectrum
features hard segment absorption bands at 3358 cm-1 due to bonded N-H, two bonds
in the carbonyl region at 1706, 1633 cm-1 arising respectively from bonded urethane
C=O and bonded urea C=O in the ordered region. Spectrum also shows C-N
stretching and N-H bending amide II (1561 cm-1) and amide III (1239 cm-1)
absorption bands along with bands from soft segment at expected wavenumbers.
3600 3200 2800 2400 2000 1600 1200 800
C=O
C-O-CCH2
N-H
% T
Wavenumber (cm-1)
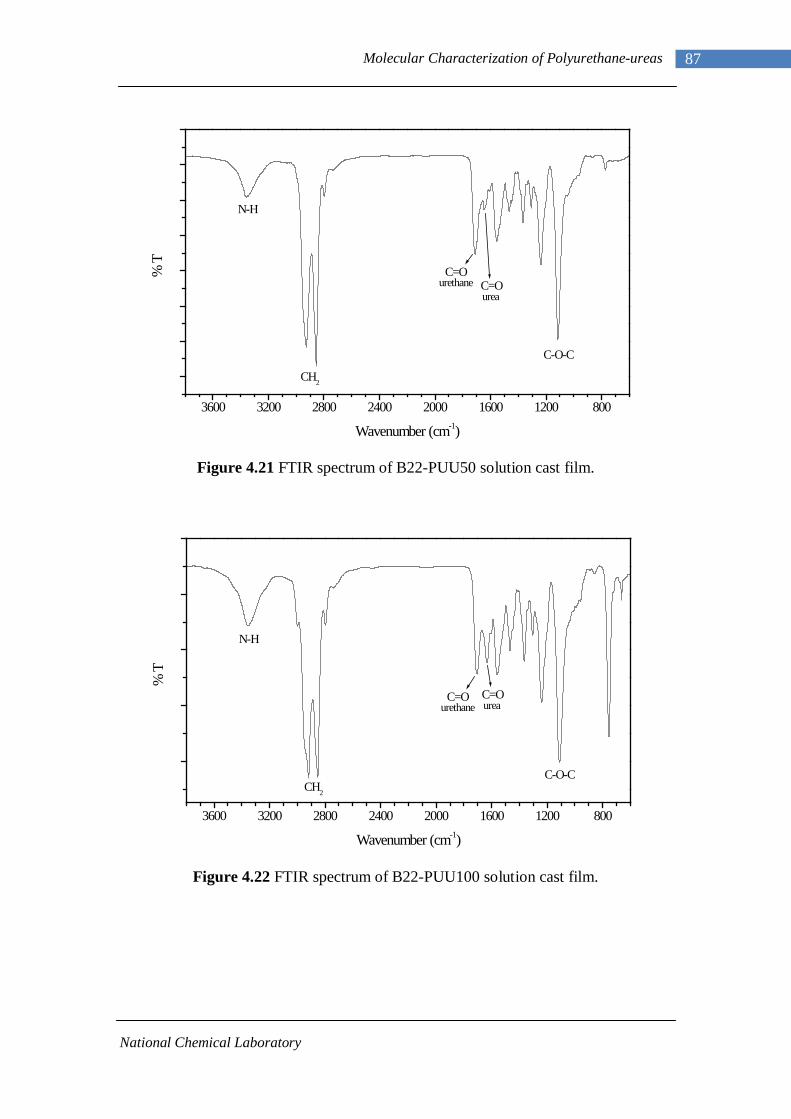
National Chemical Laboratory
87 Molecular Characterization of Polyurethane-ureas
Figure 4.21 FTIR spectrum of B22-PUU50 solution cast film.
Figure 4.22 FTIR spectrum of B22-PUU100 solution cast film.
3600 3200 2800 2400 2000 1600 1200 800
ureaurethane C=OC=O
C-O-C
CH2
N-H
% T
Wavenumber (cm-1)
3600 3200 2800 2400 2000 1600 1200 800
ureaurethaneC=OC=O
C-O-CCH2
N-H
% T
Wavenumber (cm-1)
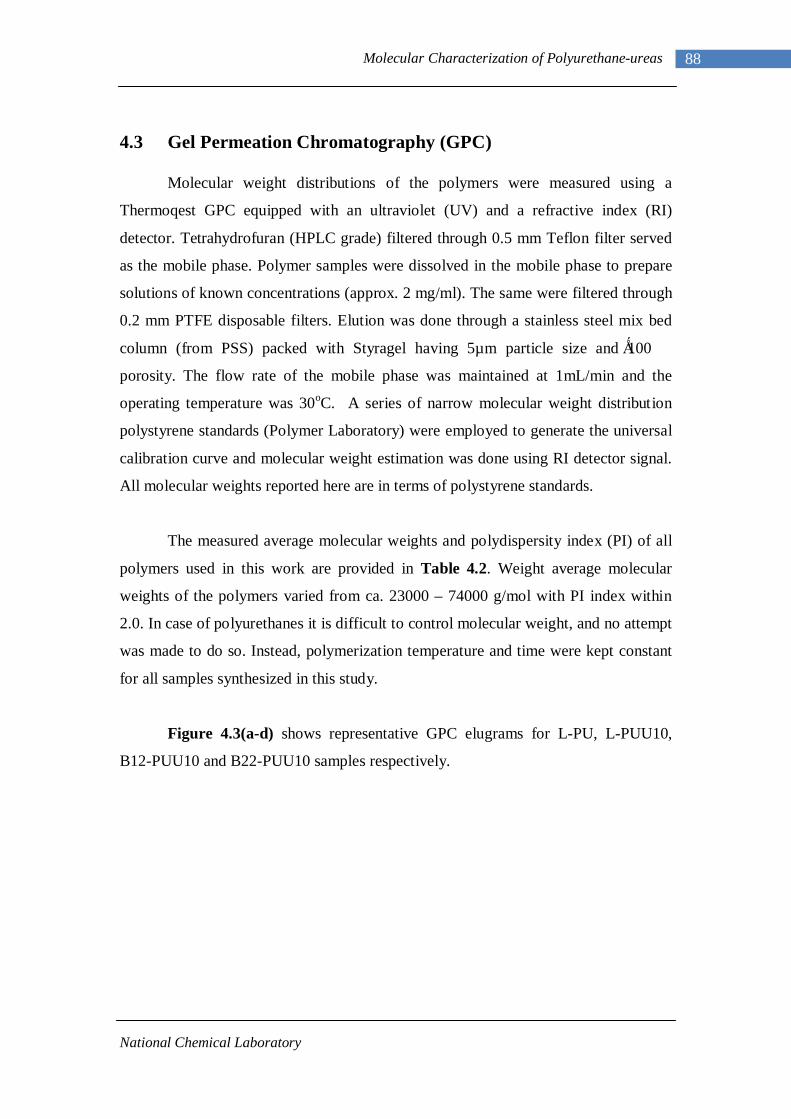
National Chemical Laboratory
88 Molecular Characterization of Polyurethane-ureas
4.3 Gel Permeation Chromatography (GPC)
Molecular weight distributions of the polymers were measured using a
Thermoqest GPC equipped with an ultraviolet (UV) and a refractive index (RI)
detector. Tetrahydrofuran (HPLC grade) filtered through 0.5 mm Teflon filter served
as the mobile phase. Polymer samples were dissolved in the mobile phase to prepare
solutions of known concentrations (approx. 2 mg/ml). The same were filtered through
0.2 mm PTFE disposable filters. Elution was done through a stainless steel mix bed
column (from PSS) packed with Styragel having 5µm particle size and 100 Ǻ
porosity. The flow rate of the mobile phase was maintained at 1mL/min and the
operating temperature was 30oC. A series of narrow molecular weight distribution
polystyrene standards (Polymer Laboratory) were employed to generate the universal
calibration curve and molecular weight estimation was done using RI detector signal.
All molecular weights reported here are in terms of polystyrene standards.
The measured average molecular weights and polydispersity index (PI) of all
polymers used in this work are provided in Table 4.2. Weight average molecular
weights of the polymers varied from ca. 23000 – 74000 g/mol with PI index within
2.0. In case of polyurethanes it is difficult to control molecular weight, and no attempt
was made to do so. Instead, polymerization temperature and time were kept constant
for all samples synthesized in this study.
Figure 4.3(a-d) shows representative GPC elugrams for L-PU, L-PUU10,
B12-PUU10 and B22-PUU10 samples respectively.
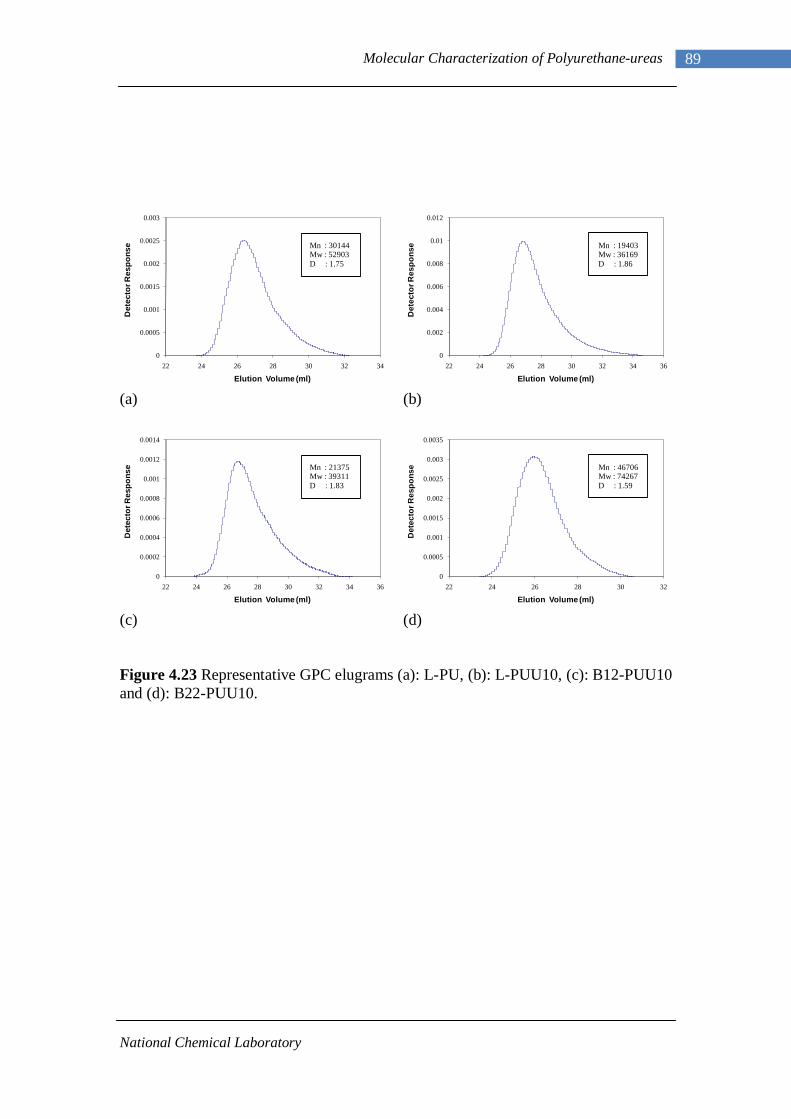
National Chemical Laboratory
89 Molecular Characterization of Polyurethane-ureas
(a)
(b)
(c)
(d)
Figure 4.23 Representative GPC elugrams (a): L-PU, (b): L-PUU10, (c): B12-PUU10 and (d): B22-PUU10.
0
0.0005
0.001
0.0015
0.002
0.0025
0.003
22 24 26 28 30 32 34
Det
ecto
r Res
pons
e
Elution Volume (ml)
Mn : 30144Mw : 52903D : 1.75
0
0.002
0.004
0.006
0.008
0.01
0.012
22 24 26 28 30 32 34 36
Det
ecto
r Res
pons
e
Elution Volume (ml)
Mn : 19403Mw : 36169D : 1.86
0
0.0002
0.0004
0.0006
0.0008
0.001
0.0012
0.0014
22 24 26 28 30 32 34 36
Det
ecto
r Res
pons
e
Elution Volume (ml)
Mn : 21375Mw : 39311D : 1.83
0
0.0005
0.001
0.0015
0.002
0.0025
0.003
0.0035
22 24 26 28 30 32
Det
ecto
r Res
pons
e
Elution Volume (ml)
Mn : 46706Mw : 74267D : 1.59
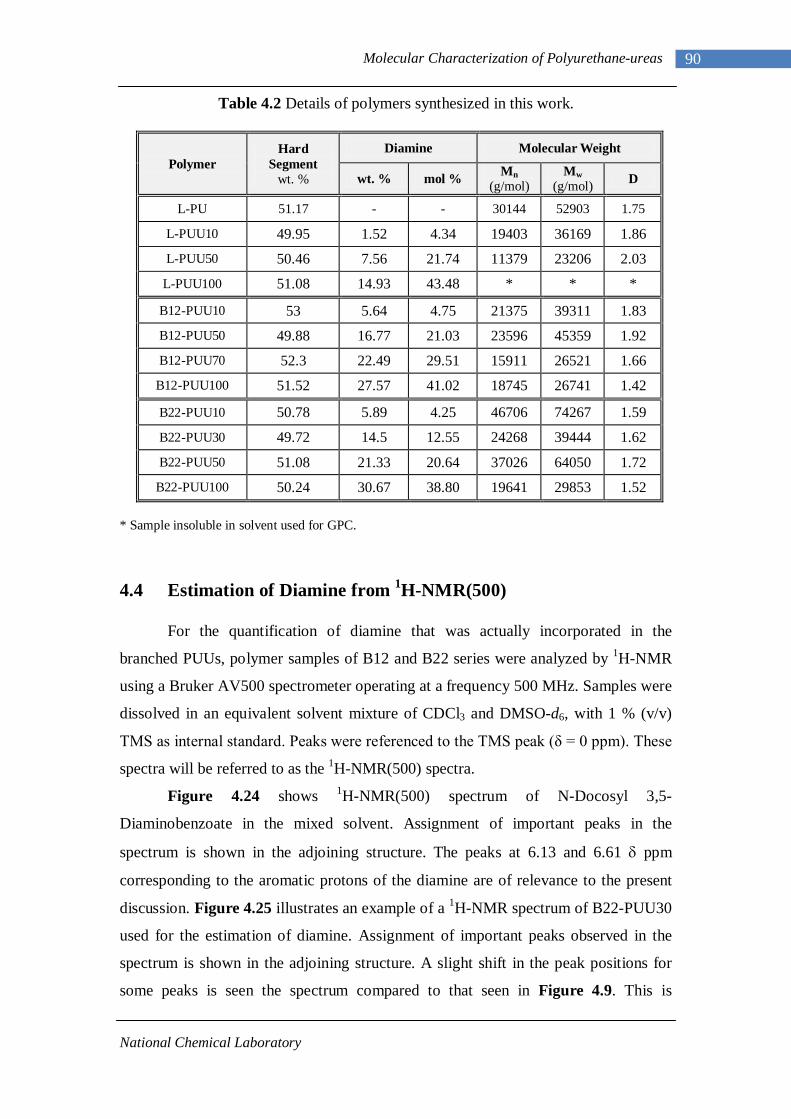
National Chemical Laboratory
90 Molecular Characterization of Polyurethane-ureas
Table 4.2 Details of polymers synthesized in this work.
Polymer Hard
Segment wt. %
Diamine Molecular Weight
wt. % mol % Mn (g/mol)
Mw (g/mol) D
L-PU 51.17 - - 30144 52903 1.75
L-PUU10 49.95 1.52 4.34 19403 36169 1.86
L-PUU50 50.46 7.56 21.74 11379 23206 2.03
L-PUU100 51.08 14.93 43.48 * * *
B12-PUU10 53 5.64 4.75 21375 39311 1.83
B12-PUU50 49.88 16.77 21.03 23596 45359 1.92
B12-PUU70 52.3 22.49 29.51 15911 26521 1.66
B12-PUU100 51.52 27.57 41.02 18745 26741 1.42
B22-PUU10 50.78 5.89 4.25 46706 74267 1.59
B22-PUU30 49.72 14.5 12.55 24268 39444 1.62
B22-PUU50 51.08 21.33 20.64 37026 64050 1.72
B22-PUU100 50.24 30.67 38.80 19641 29853 1.52 * Sample insoluble in solvent used for GPC.
4.4 Estimation of Diamine from 1H-NMR(500)
For the quantification of diamine that was actually incorporated in the
branched PUUs, polymer samples of B12 and B22 series were analyzed by 1H-NMR
using a Bruker AV500 spectrometer operating at a frequency 500 MHz. Samples were
dissolved in an equivalent solvent mixture of CDCl3 and DMSO-d6, with 1 % (v/v)
TMS as internal standard. Peaks were referenced to the TMS peak (δ = 0 ppm). These
spectra will be referred to as the 1H-NMR(500) spectra. Figure 4.24 shows 1H-NMR(500) spectrum of N-Docosyl 3,5-
Diaminobenzoate in the mixed solvent. Assignment of important peaks in the
spectrum is shown in the adjoining structure. The peaks at 6.13 and 6.61 δ ppm
corresponding to the aromatic protons of the diamine are of relevance to the present
discussion. Figure 4.25 illustrates an example of a 1H-NMR spectrum of B22-PUU30
used for the estimation of diamine. Assignment of important peaks observed in the
spectrum is shown in the adjoining structure. A slight shift in the peak positions for
some peaks is seen the spectrum compared to that seen in Figure 4.9. This is
National Chemical Laboratory
91 Molecular Characterization of Polyurethane-ureas
primarily due to the effect of mixed solvents used in this case. The spectrum features
a surprisingly large number of peaks in the aromatic region (from 6.0 to 7.7 δ ppm)
corresponding to the aromatic protons para and ortho to the ester linkage of the
diamine. These peaks are collectively labeled as ‘k’ in the spectrum. A plausible
explanation for this is the presence of many different environments for these protons.
Polydispersity in the length of the hard segment where diamine is incorporated could
also be a factor influencing this. The aromatic protons of the diamine appearing at
6.13 and 6.61 δ ppm in Figure 4.24 are expected to shift downfield upon formation of
urea linkage in the polymerization reaction. The absence these two peaks in Figure
4.25 indicates that there is no free diamine in the polymer to at least within the
NMR500 detection limit. Further, the downfield shift for the aromatic protons is a
validation of the reaction of diamine with diisocyanate. All B12 and B22 PUUs
showed the same trend except B12-PUU100 and B22-PUU100. For these two
polymers a small amount of amine protons at their unshifted positions (6.13 and 6.61
δ ppm) were also observed indicating that perhaps not all the amine was reacted.
In order to estimate the amount of diamine incorporated in the polymers we
first assume that the absence of unshifted amine protons indicates that there is no free
diamine left behind in the polymer. Secondly, we have used the methylene protons α-
to ester oxygen in the aliphatic chain (at δ 4.21 ppm) for the estimation of diamine in
the polymer. We did not use the amine protons themselves for the purpose of
estimation because despite using a 500 MHz machine and collecting a large number
of scans, the amine protons unfortunately showed poor signal quality.
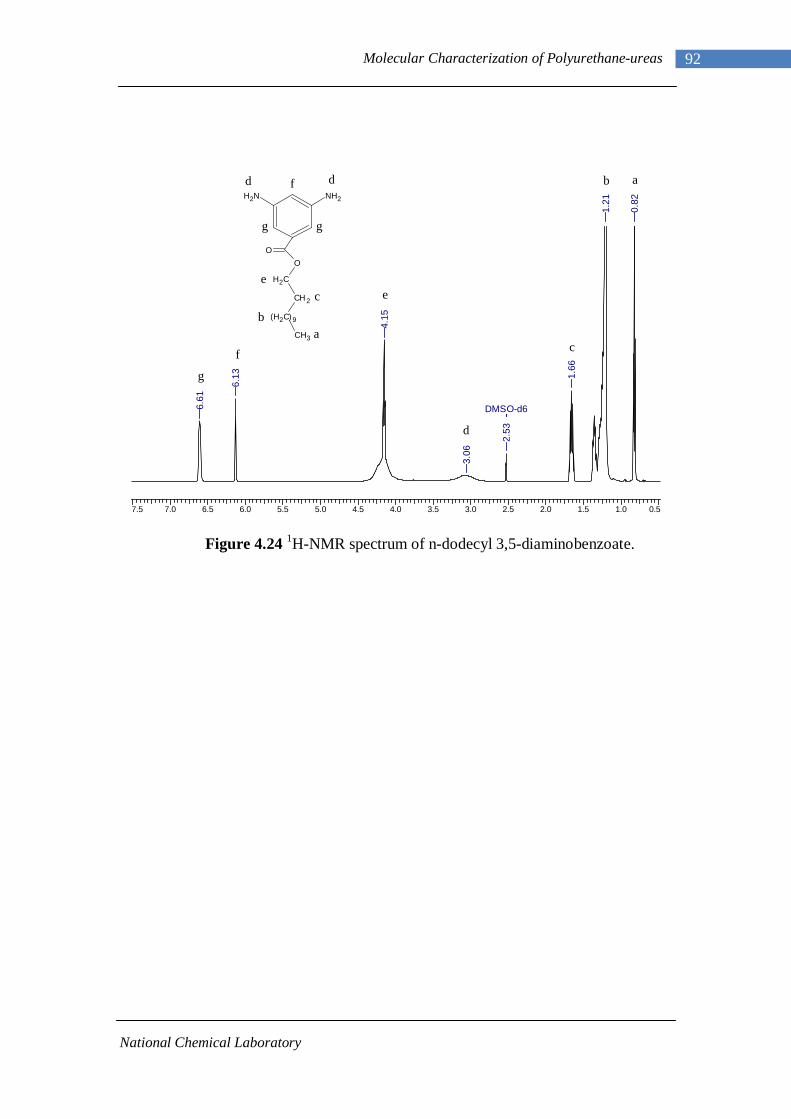
National Chemical Laboratory
92 Molecular Characterization of Polyurethane-ureas
Figure 4.24 1H-NMR spectrum of n-dodecyl 3,5-diaminobenzoate.
7.5 7.0 6.5 6.0 5.5 5.0 4.5 4.0 3.5 3.0 2.5 2.0 1.5 1.0 0.5
DMSO-d66.61
6.13
4.15
3.06
2.53
1.66
1.21
0.82
ab
c
d
e
f
g
OO
H2C
CH 2
(H2C)9
CH3
NH2NH2
ab
c
d d
e
f
g g
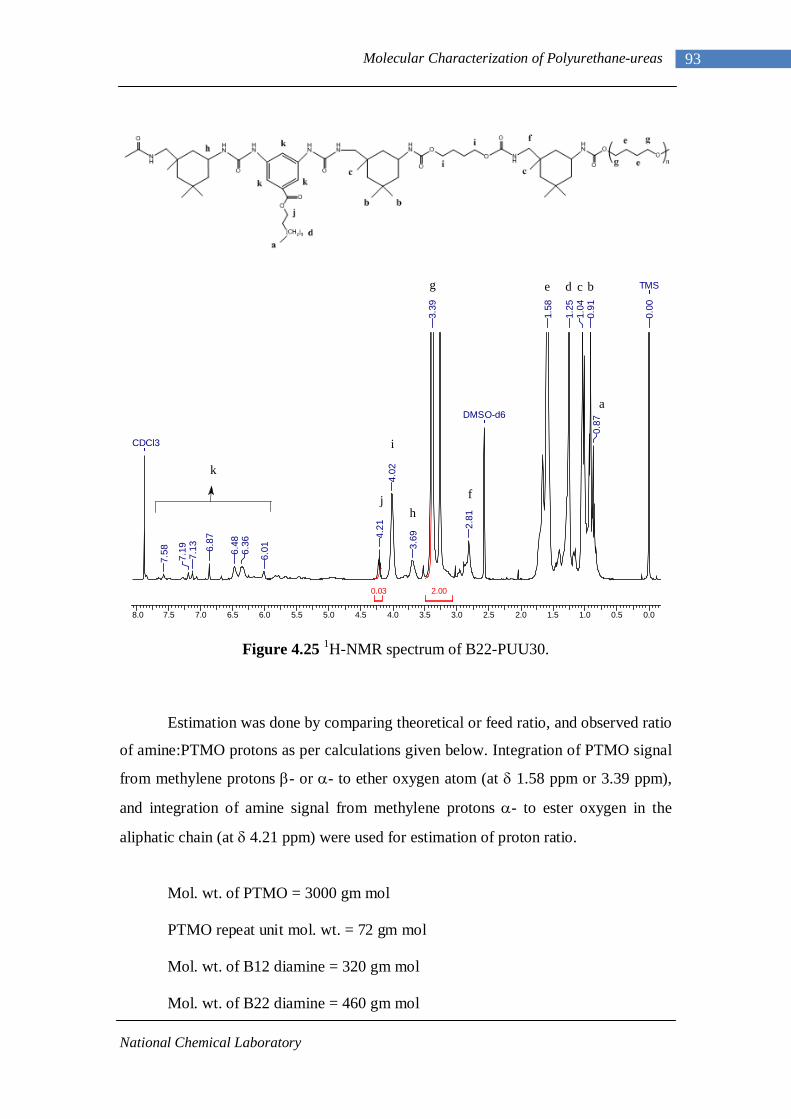
National Chemical Laboratory
93 Molecular Characterization of Polyurethane-ureas
Figure 4.25 1H-NMR spectrum of B22-PUU30.
Estimation was done by comparing theoretical or feed ratio, and observed ratio
of amine:PTMO protons as per calculations given below. Integration of PTMO signal
from methylene protons β- or α- to ether oxygen atom (at δ 1.58 ppm or 3.39 ppm),
and integration of amine signal from methylene protons α- to ester oxygen in the
aliphatic chain (at δ 4.21 ppm) were used for estimation of proton ratio.
Mol. wt. of PTMO = 3000 gm mol
PTMO repeat unit mol. wt. = 72 gm mol
Mol. wt. of B12 diamine = 320 gm mol
Mol. wt. of B22 diamine = 460 gm mol
8.0 7.5 7.0 6.5 6.0 5.5 5.0 4.5 4.0 3.5 3.0 2.5 2.0 1.5 1.0 0.5 0.0
2.000.03
TMS
DMSO-d6
CDCl3
0.00
0.87
0.91
1.04
1.25
1.58
2.81
3.39
3.69
4.02
4.21
6.016.
366.
486.87
7.13
7.19
7.58
a
bcde
f
g
h
i
j
k
National Chemical Laboratory
94 Molecular Characterization of Polyurethane-ureas
unit repeat PTMO of wt.mol.
gmin PTMO of wt. unit repeat PTMO of moles = (4.1)
unitrepeat amine of wt.mol.
gmin amine of wt. unit repeat amine of moles = (4.2)
Thus we have,
oxygenester to- amine of protons methylene ofn integratiooxygenether to- protons methylene PTMO ofn integratio
unitrepeat amine of moles2unitrepeat PTMO of moles4
αβ
=××
(4.3)
Where, the numbers ‘4’ and ‘2’ come from the number of methylene protons of
PTMO (α- or β- to ether oxygen) and diamine chain extender (α- to ester oxygen
atom), whose signals were used for the estimation.
Rearranging equation (4.3),
oxygenether to- protons methylene PTMO ofn integratiooxygenester to- amine of protons methylene ofn integratio
24
unitrepeat PTMO of molesunitrepeat amine of moles
βα
×=
(4.4)
Equation (4.4) gives the ratio of amine to PTMO as calculated from the 1H-
NMR(500) spectrum. The feed ratio of amine to PTMO was calculated from the
actual moles of the two reactants used for the synthesis of the respective polymers
(see Table 4.2).
Table 4.3 shows comparison between the feed ratio (theoretical) and the
estimated amine:PTMO ratio calculated using the above procedure. The table also
shows % incorporation determined as 100 x (estimated amine:PTMO ratio divided by
the theoretical ratio). The calculations show a progressive increase in the estimated
amine content with increasing feed ratio for both B12 and B22-PUU series. The
calculated diamine content was found to be lower than the theoretical values. This
difference may be attributed either to the incomplete reaction of diamine and
National Chemical Laboratory
95 Molecular Characterization of Polyurethane-ureas
diisocyanate followed by removal of the unreacted diamine during purification of the
polymer or to the limits of the NMR technique used for the determination of diamine
content in the polymer.
Table 4.3 Estimated diamine from 1H-NMR.
Polymer Feed Ratio Amine / PTMO
Observed Ratio Amine / PTMO
Incorporation %
B12-PUU10 0.0228 0.01 44
B12-PUU50 0.0753 0.05 66
B12-PUU70 0.1061 0.07 66
B12-PUU100 0.128 0.11 86
B22-PUU10 0.0187 0.01 53
B22-PUU30 0.0454 0.03 66
B22-PUU50 0.0683 0.05 73
B22-PUU100 0.0966 0.06 62
4.5 Summary
In summary this chapter described
• Proton NMR and FTIR evidence of the formation of L-PU and three series of
PUUs namely L-PUU, B12-PUU and B22-PUUs.
• Polymer molecular weights by gel permeation chromatography.
• Estimation of diamine chain extender from proton NMR.
References:
(1) Mattia, J.; Painter, P. C. Macromolecules 2007, 40, 1546.
(2) Yilgor, E.; Burgaz, E.; Yurtsever, E.; Yilgor, I. Polymer 2000, 41, 849.
Morphological Characterization of Polyurethane-ureas
Chapter - 5
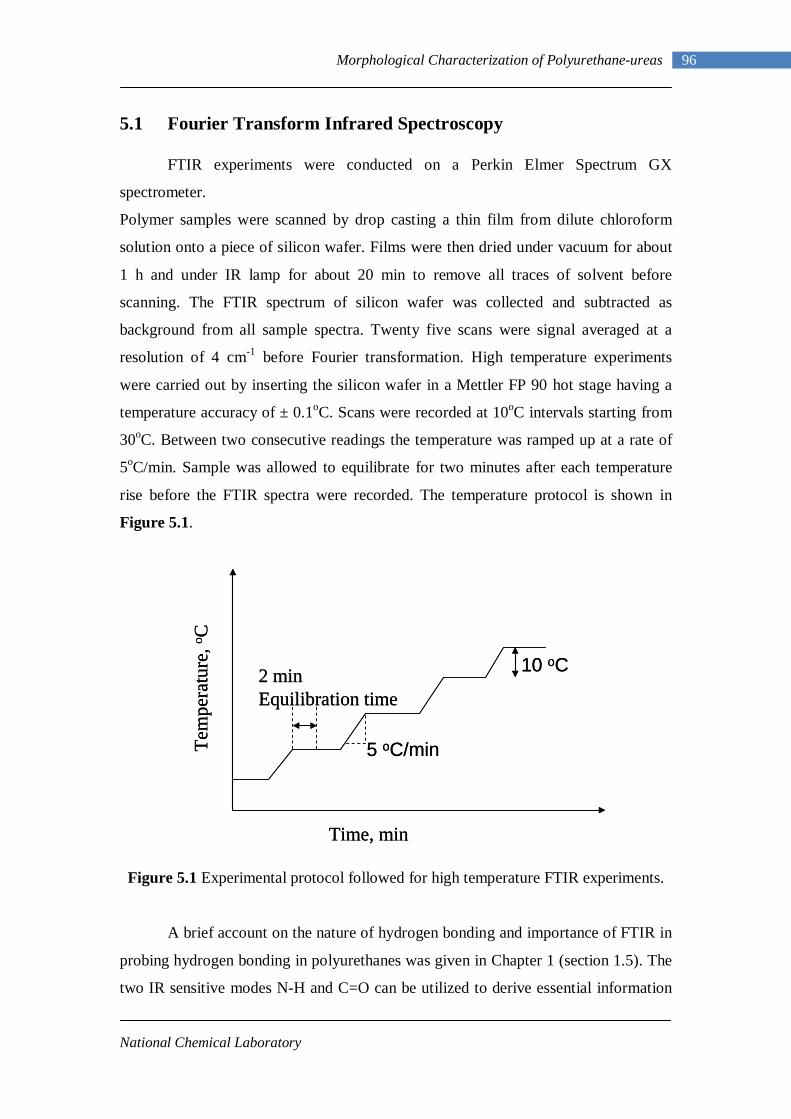
National Chemical Laboratory
96 Morphological Characterization of Polyurethane-ureas
5.1 Fourier Transform Infrared Spectroscopy
FTIR experiments were conducted on a Perkin Elmer Spectrum GX
spectrometer.
Polymer samples were scanned by drop casting a thin film from dilute chloroform
solution onto a piece of silicon wafer. Films were then dried under vacuum for about
1 h and under IR lamp for about 20 min to remove all traces of solvent before
scanning. The FTIR spectrum of silicon wafer was collected and subtracted as
background from all sample spectra. Twenty five scans were signal averaged at a
resolution of 4 cm-1 before Fourier transformation. High temperature experiments
were carried out by inserting the silicon wafer in a Mettler FP 90 hot stage having a
temperature accuracy of ± 0.1oC. Scans were recorded at 10oC intervals starting from
30oC. Between two consecutive readings the temperature was ramped up at a rate of
5oC/min. Sample was allowed to equilibrate for two minutes after each temperature
rise before the FTIR spectra were recorded. The temperature protocol is shown in
Figure 5.1.
Figure 5.1 Experimental protocol followed for high temperature FTIR experiments.
A brief account on the nature of hydrogen bonding and importance of FTIR in
probing hydrogen bonding in polyurethanes was given in Chapter 1 (section 1.5). The
two IR sensitive modes N-H and C=O can be utilized to derive essential information
Time, min
Tem
pera
ture
, o C
2 minEquilibration time
5 oC/min
10 oC
Time, min
Tem
pera
ture
, o C
2 minEquilibration time
5 oC/min
10 oC
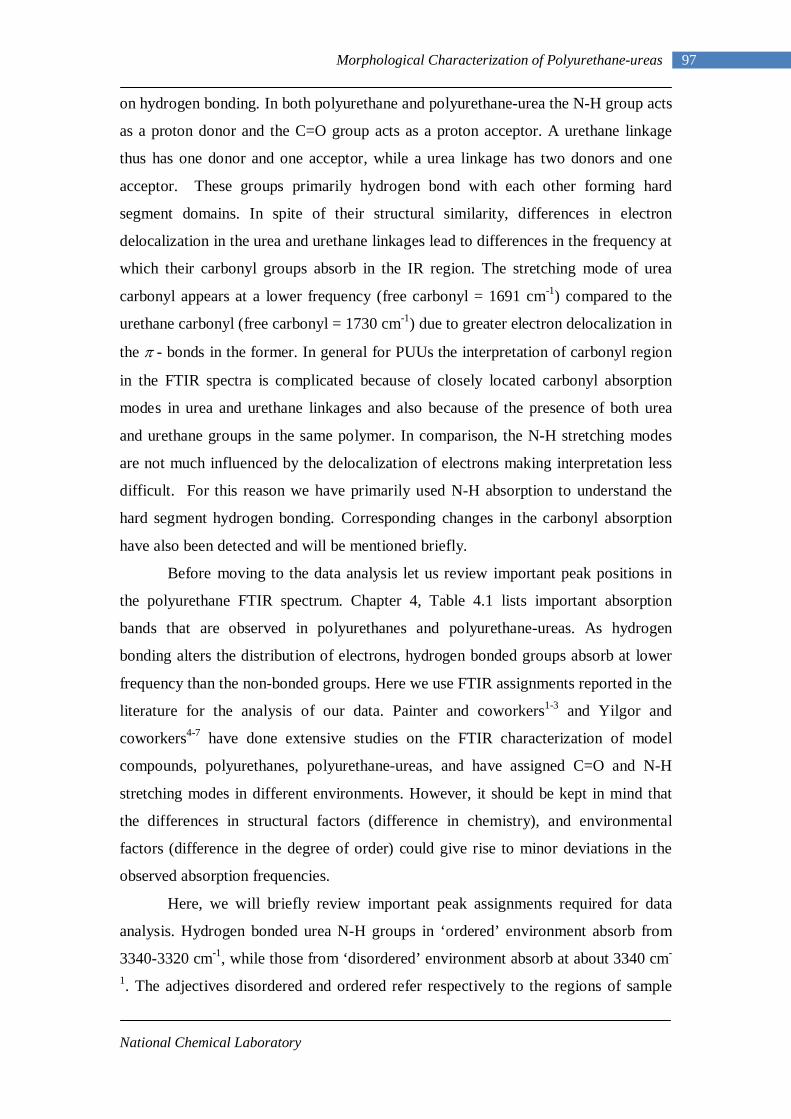
National Chemical Laboratory
97 Morphological Characterization of Polyurethane-ureas
on hydrogen bonding. In both polyurethane and polyurethane-urea the N-H group acts
as a proton donor and the C=O group acts as a proton acceptor. A urethane linkage
thus has one donor and one acceptor, while a urea linkage has two donors and one
acceptor. These groups primarily hydrogen bond with each other forming hard
segment domains. In spite of their structural similarity, differences in electron
delocalization in the urea and urethane linkages lead to differences in the frequency at
which their carbonyl groups absorb in the IR region. The stretching mode of urea
carbonyl appears at a lower frequency (free carbonyl = 1691 cm-1) compared to the
urethane carbonyl (free carbonyl = 1730 cm-1) due to greater electron delocalization in
the π - bonds in the former. In general for PUUs the interpretation of carbonyl region
in the FTIR spectra is complicated because of closely located carbonyl absorption
modes in urea and urethane linkages and also because of the presence of both urea
and urethane groups in the same polymer. In comparison, the N-H stretching modes
are not much influenced by the delocalization of electrons making interpretation less
difficult. For this reason we have primarily used N-H absorption to understand the
hard segment hydrogen bonding. Corresponding changes in the carbonyl absorption
have also been detected and will be mentioned briefly.
Before moving to the data analysis let us review important peak positions in
the polyurethane FTIR spectrum. Chapter 4, Table 4.1 lists important absorption
bands that are observed in polyurethanes and polyurethane-ureas. As hydrogen
bonding alters the distribution of electrons, hydrogen bonded groups absorb at lower
frequency than the non-bonded groups. Here we use FTIR assignments reported in the
literature for the analysis of our data. Painter and coworkers1-3 and Yilgor and
coworkers4-7 have done extensive studies on the FTIR characterization of model
compounds, polyurethanes, polyurethane-ureas, and have assigned C=O and N-H
stretching modes in different environments. However, it should be kept in mind that
the differences in structural factors (difference in chemistry), and environmental
factors (difference in the degree of order) could give rise to minor deviations in the
observed absorption frequencies.
Here, we will briefly review important peak assignments required for data
analysis. Hydrogen bonded urea N-H groups in ‘ordered’ environment absorb from
3340-3320 cm-1, while those from ‘disordered’ environment absorb at about 3340 cm-
1. The adjectives disordered and ordered refer respectively to the regions of sample
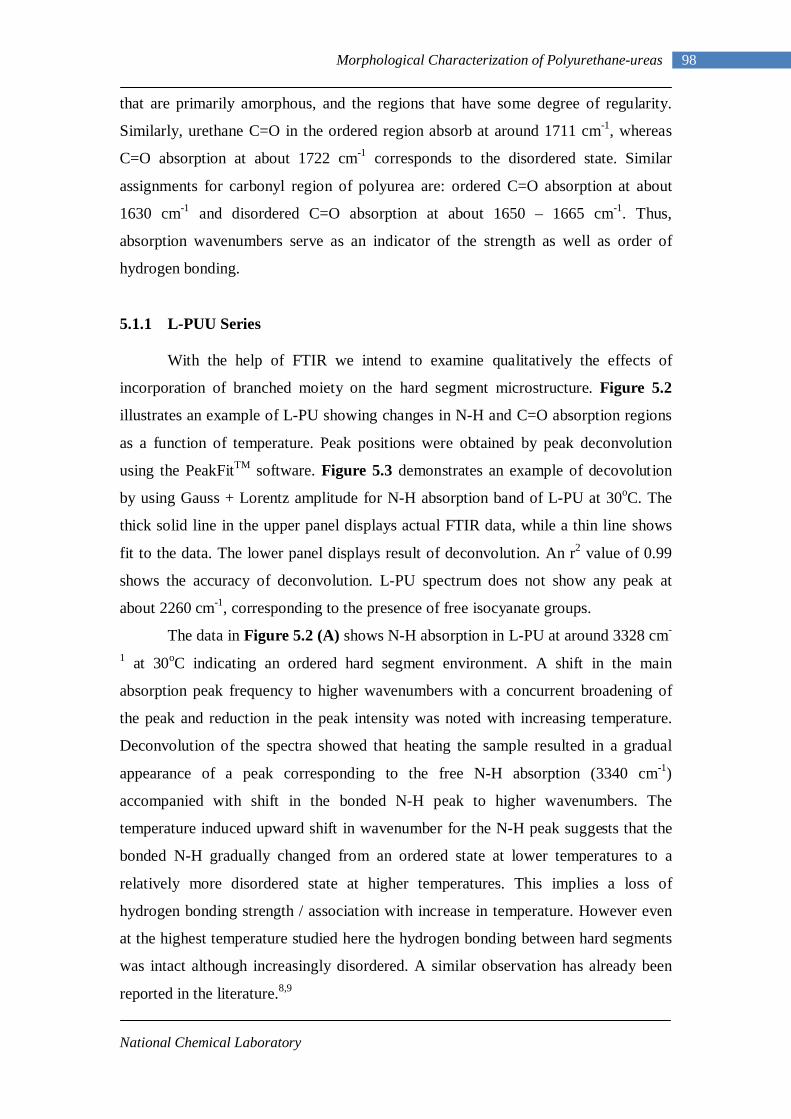
National Chemical Laboratory
98 Morphological Characterization of Polyurethane-ureas
that are primarily amorphous, and the regions that have some degree of regularity.
Similarly, urethane C=O in the ordered region absorb at around 1711 cm-1, whereas
C=O absorption at about 1722 cm-1 corresponds to the disordered state. Similar
assignments for carbonyl region of polyurea are: ordered C=O absorption at about
1630 cm-1 and disordered C=O absorption at about 1650 – 1665 cm-1. Thus,
absorption wavenumbers serve as an indicator of the strength as well as order of
hydrogen bonding.
5.1.1 L-PUU Series
With the help of FTIR we intend to examine qualitatively the effects of
incorporation of branched moiety on the hard segment microstructure. Figure 5.2
illustrates an example of L-PU showing changes in N-H and C=O absorption regions
as a function of temperature. Peak positions were obtained by peak deconvolution
using the PeakFitTM software. Figure 5.3 demonstrates an example of decovolution
by using Gauss + Lorentz amplitude for N-H absorption band of L-PU at 30oC. The
thick solid line in the upper panel displays actual FTIR data, while a thin line shows
fit to the data. The lower panel displays result of deconvolution. An r2 value of 0.99
shows the accuracy of deconvolution. L-PU spectrum does not show any peak at
about 2260 cm-1, corresponding to the presence of free isocyanate groups.
The data in Figure 5.2 (A) shows N-H absorption in L-PU at around 3328 cm-
1 at 30oC indicating an ordered hard segment environment. A shift in the main
absorption peak frequency to higher wavenumbers with a concurrent broadening of
the peak and reduction in the peak intensity was noted with increasing temperature.
Deconvolution of the spectra showed that heating the sample resulted in a gradual
appearance of a peak corresponding to the free N-H absorption (3340 cm-1)
accompanied with shift in the bonded N-H peak to higher wavenumbers. The
temperature induced upward shift in wavenumber for the N-H peak suggests that the
bonded N-H gradually changed from an ordered state at lower temperatures to a
relatively more disordered state at higher temperatures. This implies a loss of
hydrogen bonding strength / association with increase in temperature. However even
at the highest temperature studied here the hydrogen bonding between hard segments
was intact although increasingly disordered. A similar observation has already been
reported in the literature.8,9
National Chemical Laboratory
99 Morphological Characterization of Polyurethane-ureas
Figure 5.2 FTIR spectra of L-PU (A) N-H absorption region and (B) C=O absorption region with temperature interval of 10oC.
Figure 5.3 Example of Peak fitting for N-H absorption band of L-PU data at 30oC.
A strong carbonyl absorption band at 1705 cm-1 as seen in Figure 5.2 (B) also
corresponds to the ordered hard segment environment. Increasing intensity of the
shoulder at 1730 cm-1 at higher temperatures can be similarly attributed to the
dissociation of bonded carbonyls. Thus changes in the N-H and C=O absorptions with
temperature as observed in figures (A) and (B) are correlated. The shift to higher
wavenumers with a simultaneous decrease in intensity at higher temperatures is again
related to the decrease in the strength of the bond with increasing thermal motion. We
confirmed that except small shifts in amide II (~1540 cm-1) and amide III (~1240 cm-
1) absorption modes, other bands in the spectrum did not shift with increase in
temperature, although some decrease in the strength of the signal was observed.
All L-PUUs studied here showed similar qualitative behaviour to that shown
by L-PU. Figure 5.4 shows the effect of temperature on the bonded N-H absorption
3600 3500 3400 3300 3200 3100
Temp.
200oC
30oC
Wavenumber (cm-1)1800 1760 1720 1680 1640 1600
30oC
200oC
Temp.
Wavenumber (cm-1)
0 99 306 S 0 00 90 5069 08
3328
3442.4
2500 3000 3500 4000-0.05
0
0.05
0.1
0.15
-0.05
0
0.05
0.1
0.15
0
0.05
0.1
0.15
0.2
0
0.05
0.1
0.15
0.2
(A) (B)
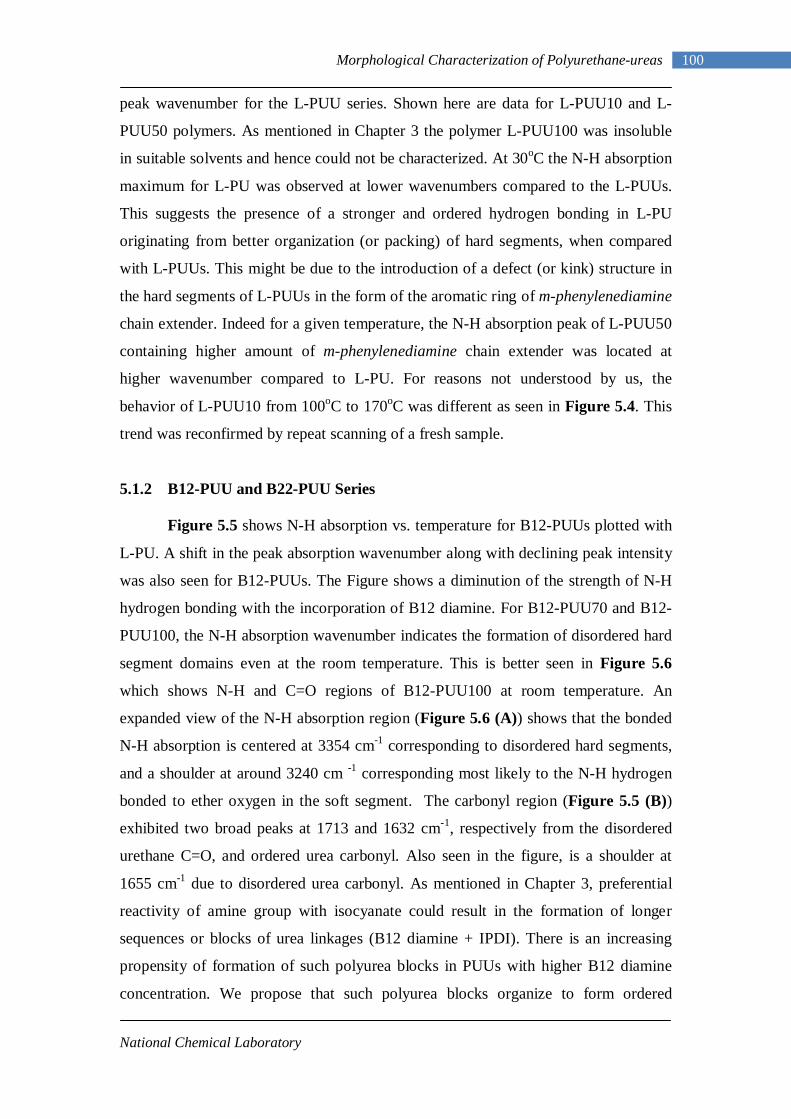
National Chemical Laboratory
100 Morphological Characterization of Polyurethane-ureas
peak wavenumber for the L-PUU series. Shown here are data for L-PUU10 and L-
PUU50 polymers. As mentioned in Chapter 3 the polymer L-PUU100 was insoluble
in suitable solvents and hence could not be characterized. At 30oC the N-H absorption
maximum for L-PU was observed at lower wavenumbers compared to the L-PUUs.
This suggests the presence of a stronger and ordered hydrogen bonding in L-PU
originating from better organization (or packing) of hard segments, when compared
with L-PUUs. This might be due to the introduction of a defect (or kink) structure in
the hard segments of L-PUUs in the form of the aromatic ring of m-phenylenediamine
chain extender. Indeed for a given temperature, the N-H absorption peak of L-PUU50
containing higher amount of m-phenylenediamine chain extender was located at
higher wavenumber compared to L-PU. For reasons not understood by us, the
behavior of L-PUU10 from 100oC to 170oC was different as seen in Figure 5.4. This
trend was reconfirmed by repeat scanning of a fresh sample.
5.1.2 B12-PUU and B22-PUU Series
Figure 5.5 shows N-H absorption vs. temperature for B12-PUUs plotted with
L-PU. A shift in the peak absorption wavenumber along with declining peak intensity
was also seen for B12-PUUs. The Figure shows a diminution of the strength of N-H
hydrogen bonding with the incorporation of B12 diamine. For B12-PUU70 and B12-
PUU100, the N-H absorption wavenumber indicates the formation of disordered hard
segment domains even at the room temperature. This is better seen in Figure 5.6
which shows N-H and C=O regions of B12-PUU100 at room temperature. An
expanded view of the N-H absorption region (Figure 5.6 (A)) shows that the bonded
N-H absorption is centered at 3354 cm-1 corresponding to disordered hard segments,
and a shoulder at around 3240 cm -1 corresponding most likely to the N-H hydrogen
bonded to ether oxygen in the soft segment. The carbonyl region (Figure 5.5 (B))
exhibited two broad peaks at 1713 and 1632 cm-1, respectively from the disordered
urethane C=O, and ordered urea carbonyl. Also seen in the figure, is a shoulder at
1655 cm-1 due to disordered urea carbonyl. As mentioned in Chapter 3, preferential
reactivity of amine group with isocyanate could result in the formation of longer
sequences or blocks of urea linkages (B12 diamine + IPDI). There is an increasing
propensity of formation of such polyurea blocks in PUUs with higher B12 diamine
concentration. We propose that such polyurea blocks organize to form ordered
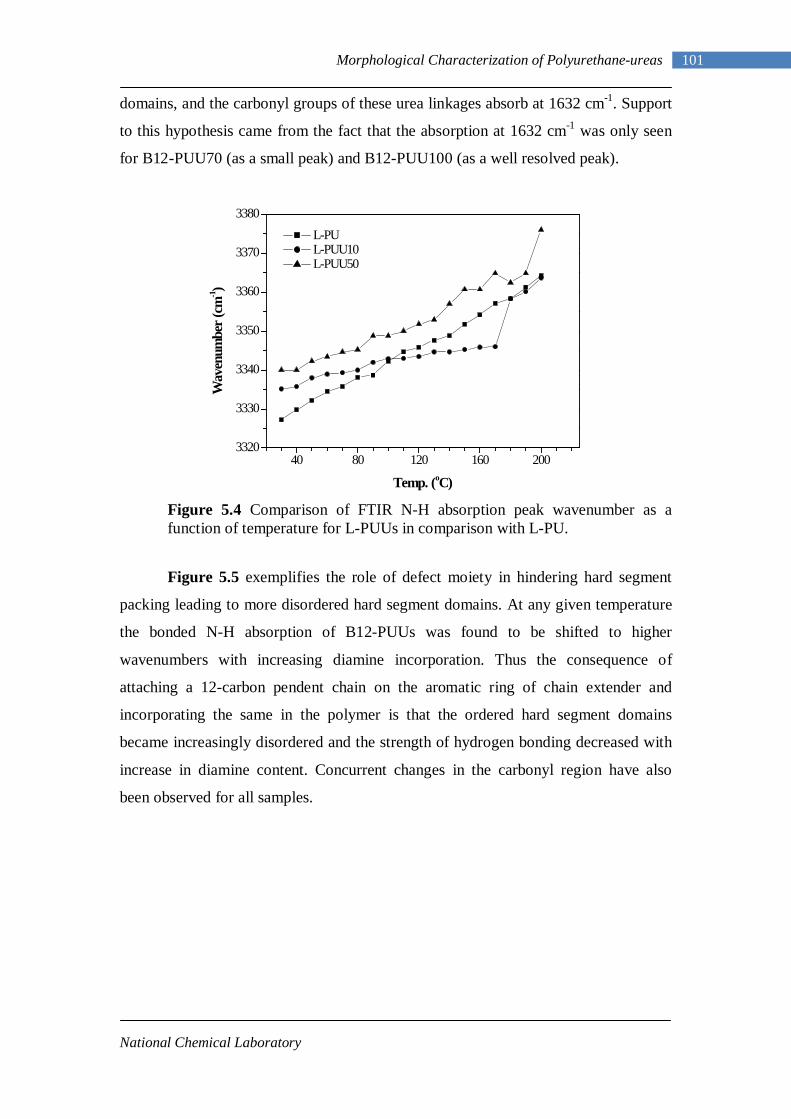
National Chemical Laboratory
101 Morphological Characterization of Polyurethane-ureas
domains, and the carbonyl groups of these urea linkages absorb at 1632 cm-1. Support
to this hypothesis came from the fact that the absorption at 1632 cm-1 was only seen
for B12-PUU70 (as a small peak) and B12-PUU100 (as a well resolved peak).
Figure 5.4 Comparison of FTIR N-H absorption peak wavenumber as a function of temperature for L-PUUs in comparison with L-PU.
Figure 5.5 exemplifies the role of defect moiety in hindering hard segment
packing leading to more disordered hard segment domains. At any given temperature
the bonded N-H absorption of B12-PUUs was found to be shifted to higher
wavenumbers with increasing diamine incorporation. Thus the consequence of
attaching a 12-carbon pendent chain on the aromatic ring of chain extender and
incorporating the same in the polymer is that the ordered hard segment domains
became increasingly disordered and the strength of hydrogen bonding decreased with
increase in diamine content. Concurrent changes in the carbonyl region have also
been observed for all samples.
40 80 120 160 2003320
3330
3340
3350
3360
3370
3380
L-PU L-PUU10 L-PUU50
Wav
enum
ber (
cm-1)
Temp. (oC)
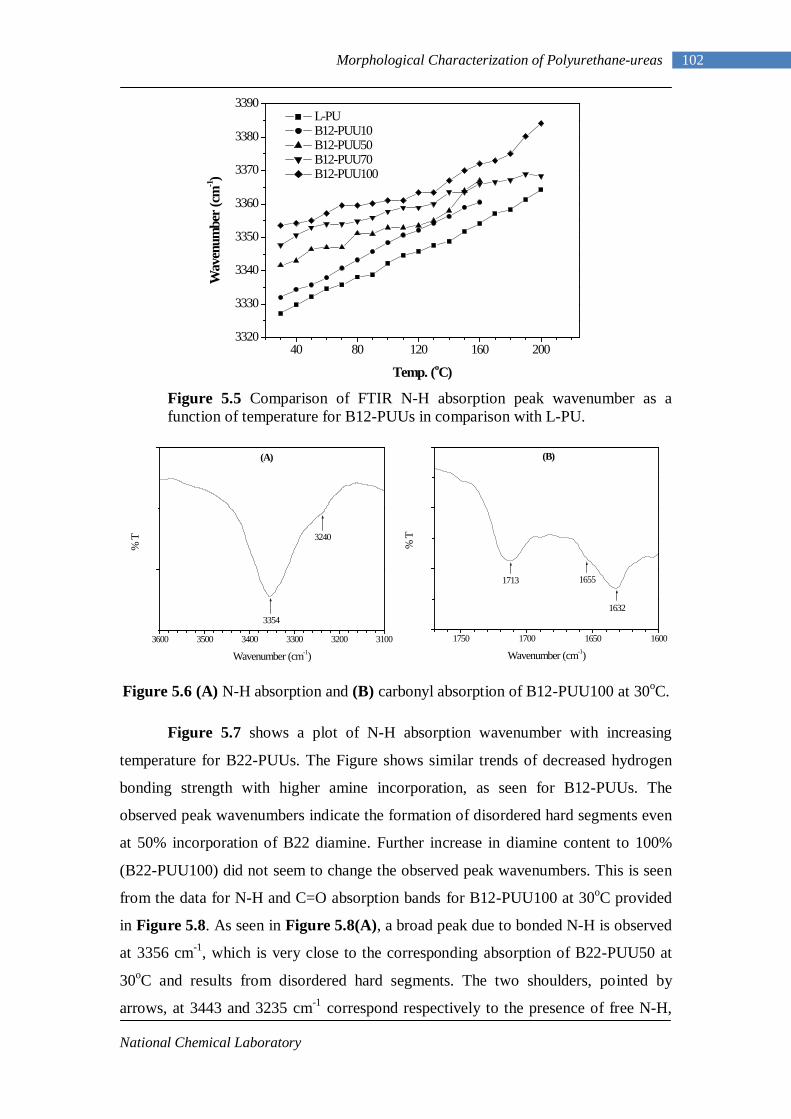
National Chemical Laboratory
102 Morphological Characterization of Polyurethane-ureas
Figure 5.5 Comparison of FTIR N-H absorption peak wavenumber as a function of temperature for B12-PUUs in comparison with L-PU.
Figure 5.6 (A) N-H absorption and (B) carbonyl absorption of B12-PUU100 at 30oC.
Figure 5.7 shows a plot of N-H absorption wavenumber with increasing
temperature for B22-PUUs. The Figure shows similar trends of decreased hydrogen
bonding strength with higher amine incorporation, as seen for B12-PUUs. The
observed peak wavenumbers indicate the formation of disordered hard segments even
at 50% incorporation of B22 diamine. Further increase in diamine content to 100%
(B22-PUU100) did not seem to change the observed peak wavenumbers. This is seen
from the data for N-H and C=O absorption bands for B12-PUU100 at 30oC provided
in Figure 5.8. As seen in Figure 5.8(A), a broad peak due to bonded N-H is observed
at 3356 cm-1, which is very close to the corresponding absorption of B22-PUU50 at
30oC and results from disordered hard segments. The two shoulders, pointed by
arrows, at 3443 and 3235 cm-1 correspond respectively to the presence of free N-H,
40 80 120 160 2003320
3330
3340
3350
3360
3370
3380
3390 L-PU B12-PUU10 B12-PUU50 B12-PUU70 B12-PUU100
Wav
enum
ber (
cm-1)
Temp. (oC)
3600 3500 3400 3300 3200 3100
3240
3354
(A)
% T
Wavenumber (cm-1)
1750 1700 1650 1600
1632
16551713
(B)
% T
Wavenumber (cm-1)
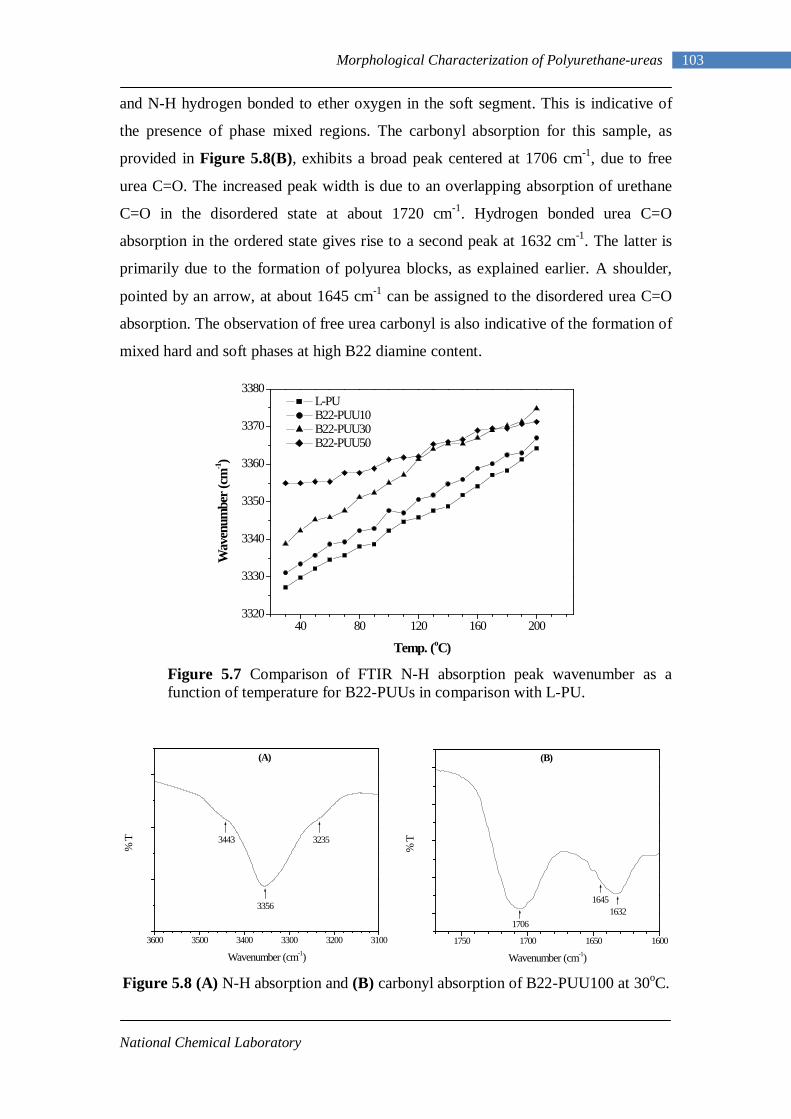
National Chemical Laboratory
103 Morphological Characterization of Polyurethane-ureas
and N-H hydrogen bonded to ether oxygen in the soft segment. This is indicative of
the presence of phase mixed regions. The carbonyl absorption for this sample, as
provided in Figure 5.8(B), exhibits a broad peak centered at 1706 cm-1, due to free
urea C=O. The increased peak width is due to an overlapping absorption of urethane
C=O in the disordered state at about 1720 cm-1. Hydrogen bonded urea C=O
absorption in the ordered state gives rise to a second peak at 1632 cm-1. The latter is
primarily due to the formation of polyurea blocks, as explained earlier. A shoulder,
pointed by an arrow, at about 1645 cm-1 can be assigned to the disordered urea C=O
absorption. The observation of free urea carbonyl is also indicative of the formation of
mixed hard and soft phases at high B22 diamine content.
Figure 5.7 Comparison of FTIR N-H absorption peak wavenumber as a function of temperature for B22-PUUs in comparison with L-PU.
Figure 5.8 (A) N-H absorption and (B) carbonyl absorption of B22-PUU100 at 30oC.
40 80 120 160 2003320
3330
3340
3350
3360
3370
3380 L-PU B22-PUU10 B22-PUU30 B22-PUU50
Wav
enum
ber (
cm-1)
Temp. (oC)
3600 3500 3400 3300 3200 3100
3443
3356
3235
(A)
% T
Wavenumber (cm-1)1750 1700 1650 1600
16321645
1706
(B)
% T
Wavenumber (cm-1)
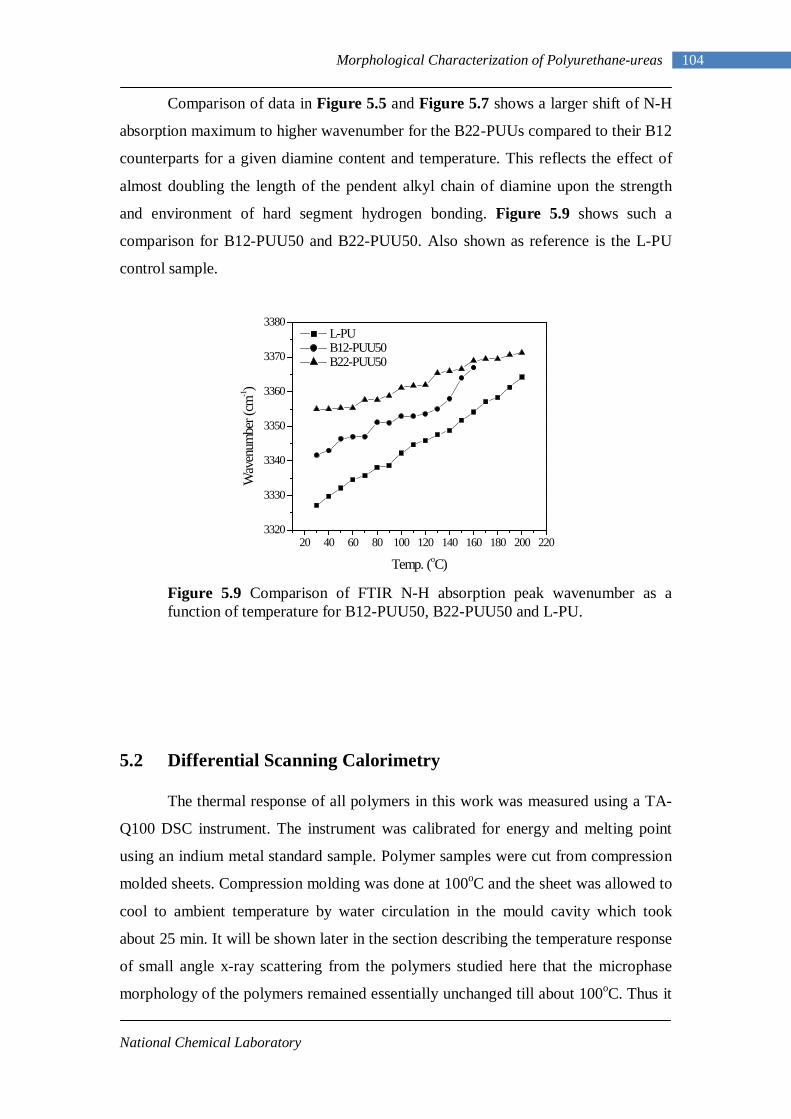
National Chemical Laboratory
104 Morphological Characterization of Polyurethane-ureas
Comparison of data in Figure 5.5 and Figure 5.7 shows a larger shift of N-H
absorption maximum to higher wavenumber for the B22-PUUs compared to their B12
counterparts for a given diamine content and temperature. This reflects the effect of
almost doubling the length of the pendent alkyl chain of diamine upon the strength
and environment of hard segment hydrogen bonding. Figure 5.9 shows such a
comparison for B12-PUU50 and B22-PUU50. Also shown as reference is the L-PU
control sample.
Figure 5.9 Comparison of FTIR N-H absorption peak wavenumber as a function of temperature for B12-PUU50, B22-PUU50 and L-PU.
5.2 Differential Scanning Calorimetry
The thermal response of all polymers in this work was measured using a TA-
Q100 DSC instrument. The instrument was calibrated for energy and melting point
using an indium metal standard sample. Polymer samples were cut from compression
molded sheets. Compression molding was done at 100oC and the sheet was allowed to
cool to ambient temperature by water circulation in the mould cavity which took
about 25 min. It will be shown later in the section describing the temperature response
of small angle x-ray scattering from the polymers studied here that the microphase
morphology of the polymers remained essentially unchanged till about 100oC. Thus it
20 40 60 80 100 120 140 160 180 200 2203320
3330
3340
3350
3360
3370
3380 L-PU B12-PUU50 B22-PUU50
Wav
enum
ber (
cm-1)
Temp. (oC)
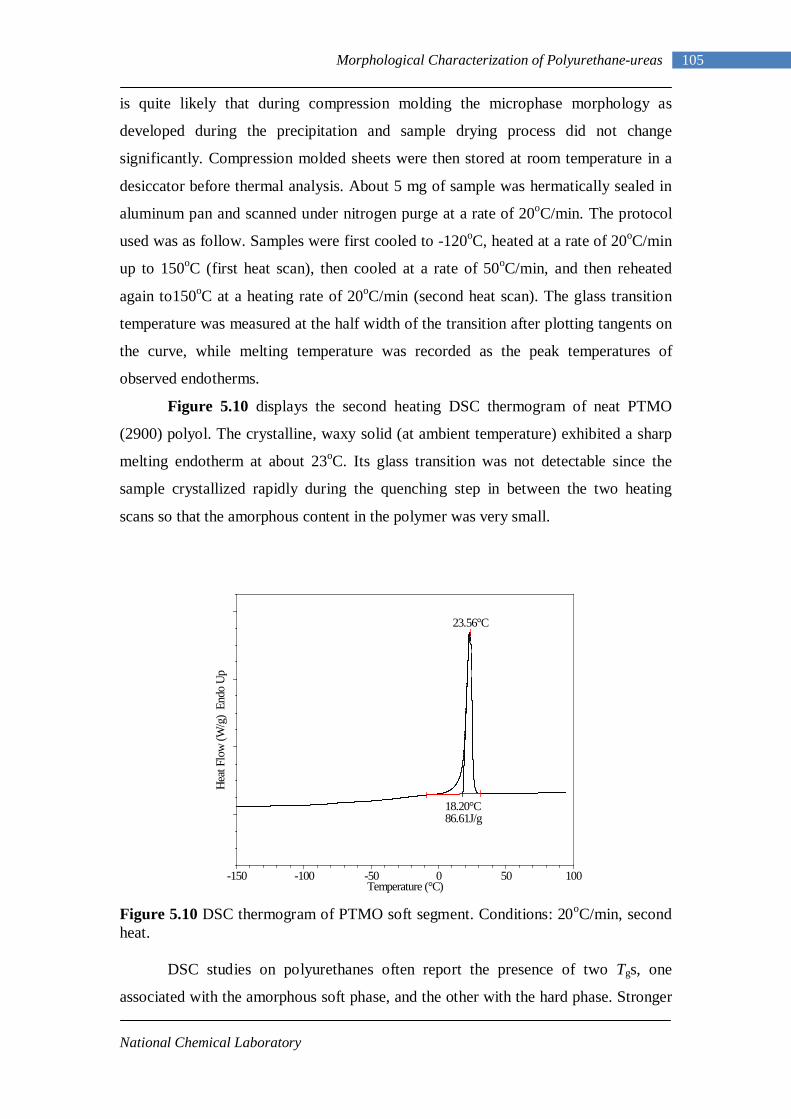
National Chemical Laboratory
105 Morphological Characterization of Polyurethane-ureas
is quite likely that during compression molding the microphase morphology as
developed during the precipitation and sample drying process did not change
significantly. Compression molded sheets were then stored at room temperature in a
desiccator before thermal analysis. About 5 mg of sample was hermatically sealed in
aluminum pan and scanned under nitrogen purge at a rate of 20oC/min. The protocol
used was as follow. Samples were first cooled to -120oC, heated at a rate of 20oC/min
up to 150oC (first heat scan), then cooled at a rate of 50oC/min, and then reheated
again to150oC at a heating rate of 20oC/min (second heat scan). The glass transition
temperature was measured at the half width of the transition after plotting tangents on
the curve, while melting temperature was recorded as the peak temperatures of
observed endotherms.
Figure 5.10 displays the second heating DSC thermogram of neat PTMO
(2900) polyol. The crystalline, waxy solid (at ambient temperature) exhibited a sharp
melting endotherm at about 23oC. Its glass transition was not detectable since the
sample crystallized rapidly during the quenching step in between the two heating
scans so that the amorphous content in the polymer was very small.
Figure 5.10 DSC thermogram of PTMO soft segment. Conditions: 20oC/min, second heat. DSC studies on polyurethanes often report the presence of two Tgs, one
associated with the amorphous soft phase, and the other with the hard phase. Stronger
23.56°C
18.20°C
86.61J/g
Heat
Flow
(W/g
) En
do U
p
-150
-100
-50
0
50
100
Temperature (°C)
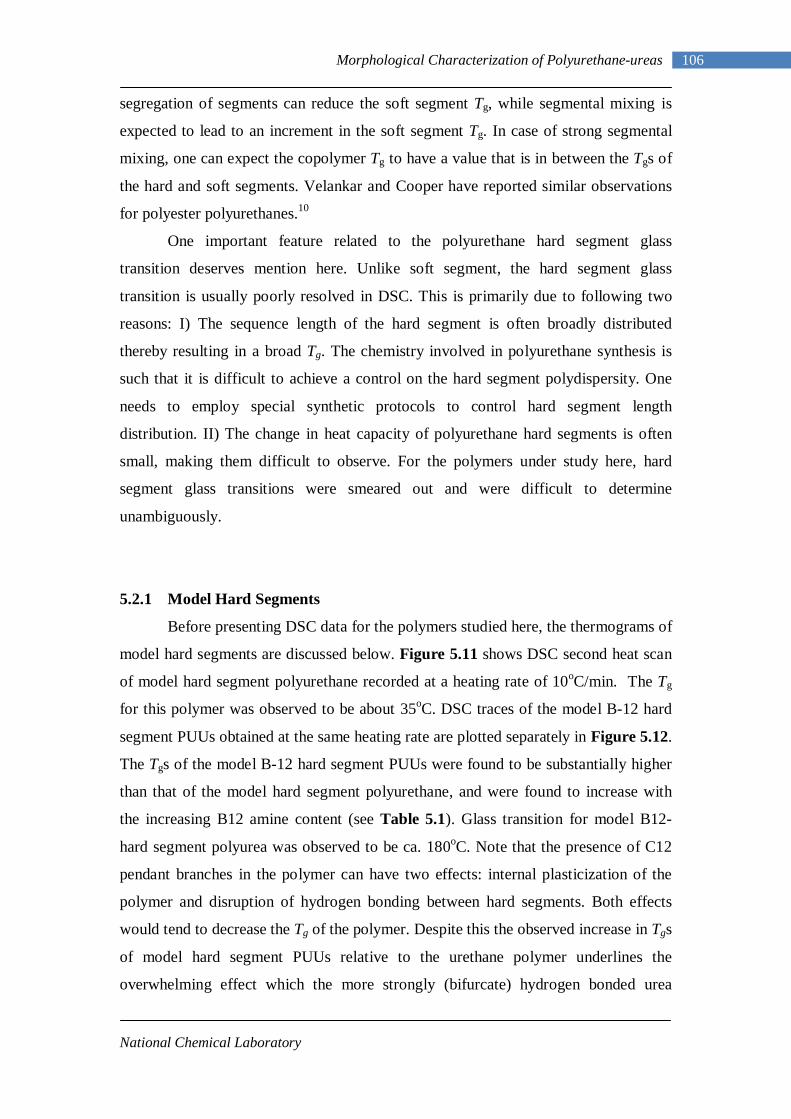
National Chemical Laboratory
106 Morphological Characterization of Polyurethane-ureas
segregation of segments can reduce the soft segment Tg, while segmental mixing is
expected to lead to an increment in the soft segment Tg. In case of strong segmental
mixing, one can expect the copolymer Tg to have a value that is in between the Tgs of
the hard and soft segments. Velankar and Cooper have reported similar observations
for polyester polyurethanes.10
One important feature related to the polyurethane hard segment glass
transition deserves mention here. Unlike soft segment, the hard segment glass
transition is usually poorly resolved in DSC. This is primarily due to following two
reasons: I) The sequence length of the hard segment is often broadly distributed
thereby resulting in a broad Tg. The chemistry involved in polyurethane synthesis is
such that it is difficult to achieve a control on the hard segment polydispersity. One
needs to employ special synthetic protocols to control hard segment length
distribution. II) The change in heat capacity of polyurethane hard segments is often
small, making them difficult to observe. For the polymers under study here, hard
segment glass transitions were smeared out and were difficult to determine
unambiguously.
5.2.1 Model Hard Segments
Before presenting DSC data for the polymers studied here, the thermograms of
model hard segments are discussed below. Figure 5.11 shows DSC second heat scan
of model hard segment polyurethane recorded at a heating rate of 10oC/min. The Tg
for this polymer was observed to be about 35oC. DSC traces of the model B-12 hard
segment PUUs obtained at the same heating rate are plotted separately in Figure 5.12.
The Tgs of the model B-12 hard segment PUUs were found to be substantially higher
than that of the model hard segment polyurethane, and were found to increase with
the increasing B12 amine content (see Table 5.1). Glass transition for model B12-
hard segment polyurea was observed to be ca. 180oC. Note that the presence of C12
pendant branches in the polymer can have two effects: internal plasticization of the
polymer and disruption of hydrogen bonding between hard segments. Both effects
would tend to decrease the Tg of the polymer. Despite this the observed increase in Tgs
of model hard segment PUUs relative to the urethane polymer underlines the
overwhelming effect which the more strongly (bifurcate) hydrogen bonded urea
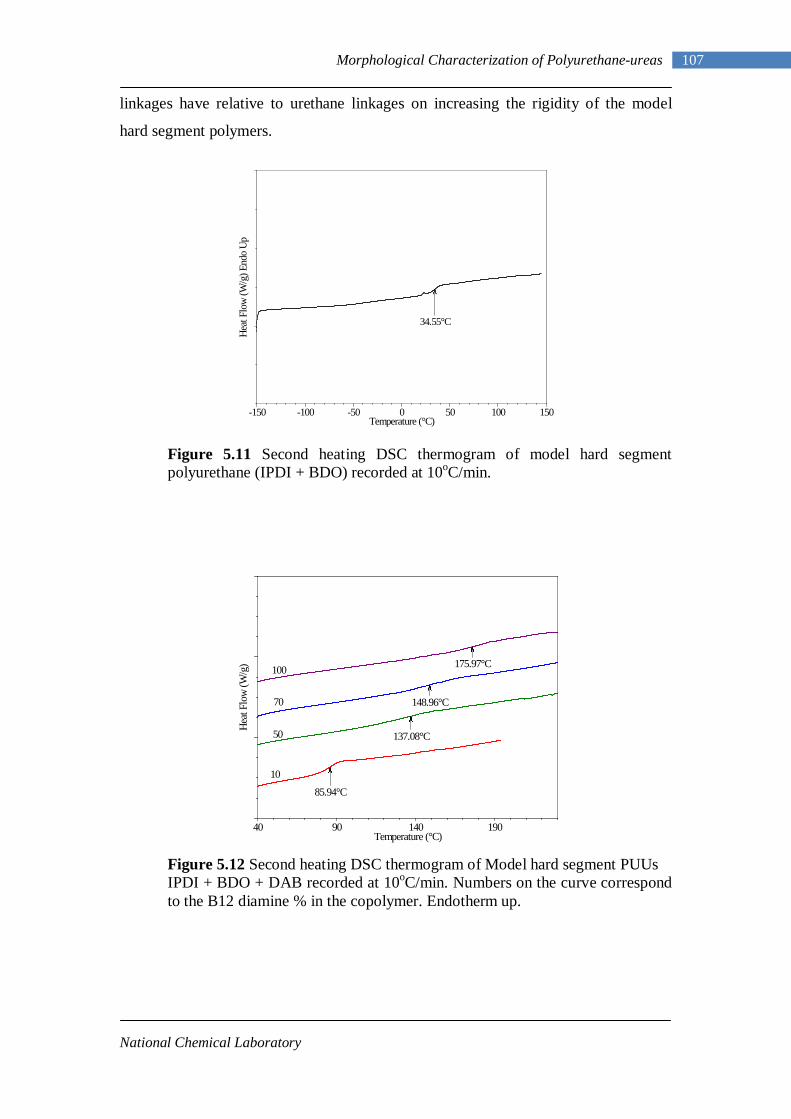
National Chemical Laboratory
107 Morphological Characterization of Polyurethane-ureas
linkages have relative to urethane linkages on increasing the rigidity of the model
hard segment polymers.
Figure 5.11 Second heating DSC thermogram of model hard segment polyurethane (IPDI + BDO) recorded at 10oC/min.
Figure 5.12 Second heating DSC thermogram of Model hard segment PUUs IPDI + BDO + DAB recorded at 10oC/min. Numbers on the curve correspond to the B12 diamine % in the copolymer. Endotherm up.
34.55°C
Heat
Flow
(W/g
) End
o Up
-150
-100
-50
0
50
100
150
Temperature (°C)
85.94°C
137.08°C
148.96°C
175.97°C
50
10
70
100
Heat
Flow
(W/g
)
40
90
140
190
Temperature (°C)
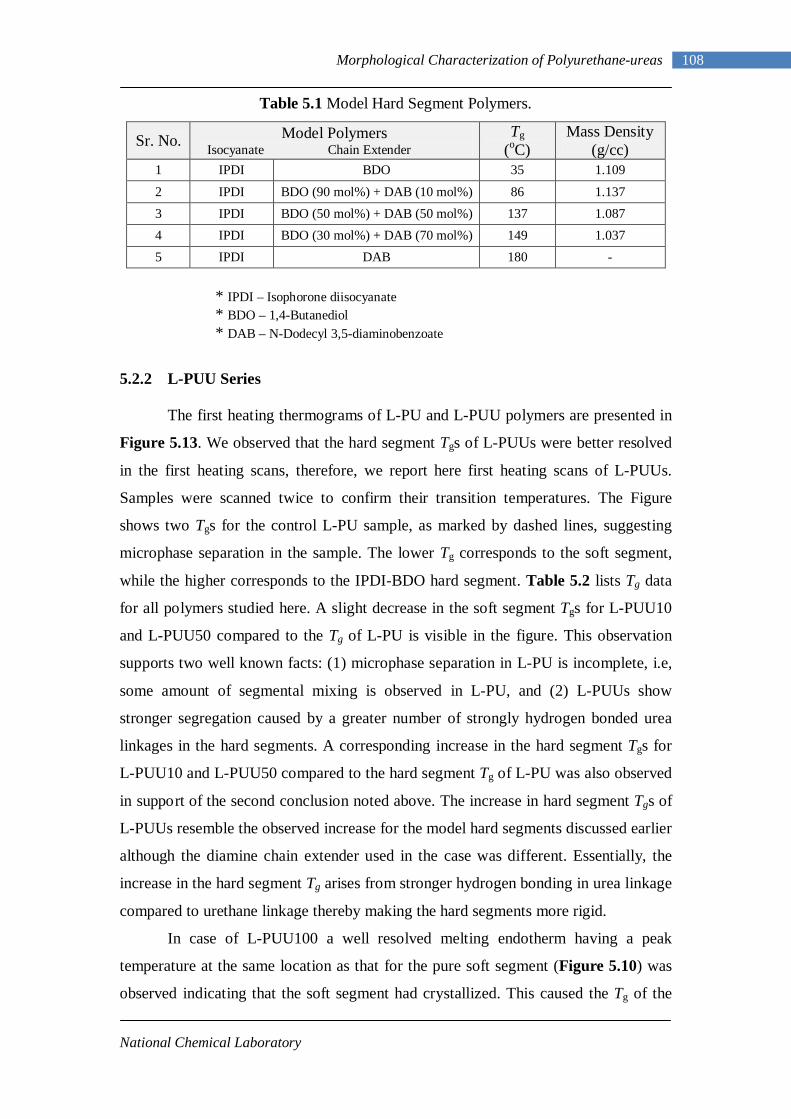
National Chemical Laboratory
108 Morphological Characterization of Polyurethane-ureas
Table 5.1 Model Hard Segment Polymers.
Sr. No. Model Polymers Isocyanate Chain Extender
Tg (oC)
Mass Density (g/cc)
1 IPDI BDO 35 1.109
2 IPDI BDO (90 mol%) + DAB (10 mol%) 86 1.137 3 IPDI BDO (50 mol%) + DAB (50 mol%) 137 1.087 4 IPDI BDO (30 mol%) + DAB (70 mol%) 149 1.037 5 IPDI DAB 180 -
* IPDI – Isophorone diisocyanate
* BDO – 1,4-Butanediol * DAB – N-Dodecyl 3,5-diaminobenzoate
5.2.2 L-PUU Series
The first heating thermograms of L-PU and L-PUU polymers are presented in
Figure 5.13. We observed that the hard segment Tgs of L-PUUs were better resolved
in the first heating scans, therefore, we report here first heating scans of L-PUUs.
Samples were scanned twice to confirm their transition temperatures. The Figure
shows two Tgs for the control L-PU sample, as marked by dashed lines, suggesting
microphase separation in the sample. The lower Tg corresponds to the soft segment,
while the higher corresponds to the IPDI-BDO hard segment. Table 5.2 lists Tg data
for all polymers studied here. A slight decrease in the soft segment Tgs for L-PUU10
and L-PUU50 compared to the Tg of L-PU is visible in the figure. This observation
supports two well known facts: (1) microphase separation in L-PU is incomplete, i.e,
some amount of segmental mixing is observed in L-PU, and (2) L-PUUs show
stronger segregation caused by a greater number of strongly hydrogen bonded urea
linkages in the hard segments. A corresponding increase in the hard segment Tgs for
L-PUU10 and L-PUU50 compared to the hard segment Tg of L-PU was also observed
in support of the second conclusion noted above. The increase in hard segment Tgs of
L-PUUs resemble the observed increase for the model hard segments discussed earlier
although the diamine chain extender used in the case was different. Essentially, the
increase in the hard segment Tg arises from stronger hydrogen bonding in urea linkage
compared to urethane linkage thereby making the hard segments more rigid.
In case of L-PUU100 a well resolved melting endotherm having a peak
temperature at the same location as that for the pure soft segment (Figure 5.10) was
observed indicating that the soft segment had crystallized. This caused the Tg of the
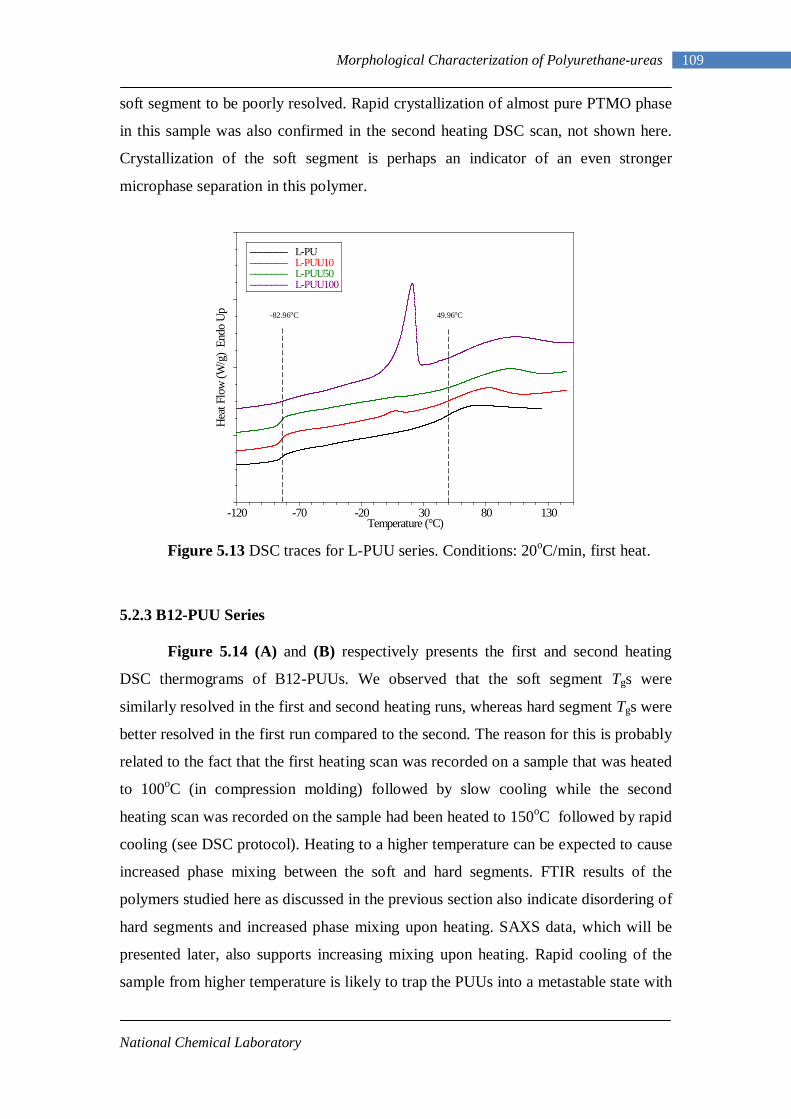
National Chemical Laboratory
109 Morphological Characterization of Polyurethane-ureas
soft segment to be poorly resolved. Rapid crystallization of almost pure PTMO phase
in this sample was also confirmed in the second heating DSC scan, not shown here.
Crystallization of the soft segment is perhaps an indicator of an even stronger
microphase separation in this polymer.
Figure 5.13 DSC traces for L-PUU series. Conditions: 20oC/min, first heat.
5.2.3 B12-PUU Series
Figure 5.14 (A) and (B) respectively presents the first and second heating
DSC thermograms of B12-PUUs. We observed that the soft segment Tgs were
similarly resolved in the first and second heating runs, whereas hard segment Tgs were
better resolved in the first run compared to the second. The reason for this is probably
related to the fact that the first heating scan was recorded on a sample that was heated
to 100oC (in compression molding) followed by slow cooling while the second
heating scan was recorded on the sample had been heated to 150oC followed by rapid
cooling (see DSC protocol). Heating to a higher temperature can be expected to cause
increased phase mixing between the soft and hard segments. FTIR results of the
polymers studied here as discussed in the previous section also indicate disordering of
hard segments and increased phase mixing upon heating. SAXS data, which will be
presented later, also supports increasing mixing upon heating. Rapid cooling of the
sample from higher temperature is likely to trap the PUUs into a metastable state with
Heat
Flow
(W/g
) En
do U
p
-120
-70
-20
30
80
130
Temperature (°C)
L-PU
–––––––
L-PUU10
–––––––
L-PUU50
–––––––
L-PUU100
–––––––
-82.96oC 49.96oC
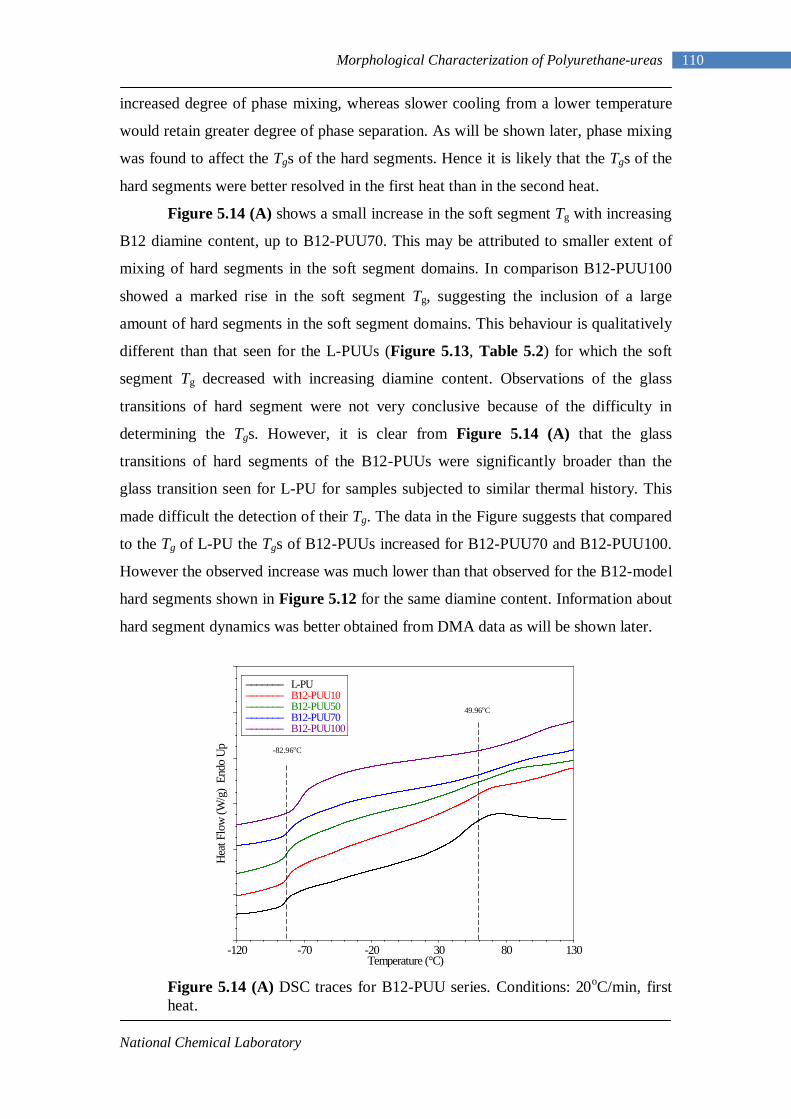
National Chemical Laboratory
110 Morphological Characterization of Polyurethane-ureas
increased degree of phase mixing, whereas slower cooling from a lower temperature
would retain greater degree of phase separation. As will be shown later, phase mixing
was found to affect the Tgs of the hard segments. Hence it is likely that the Tgs of the
hard segments were better resolved in the first heat than in the second heat.
Figure 5.14 (A) shows a small increase in the soft segment Tg with increasing
B12 diamine content, up to B12-PUU70. This may be attributed to smaller extent of
mixing of hard segments in the soft segment domains. In comparison B12-PUU100
showed a marked rise in the soft segment Tg, suggesting the inclusion of a large
amount of hard segments in the soft segment domains. This behaviour is qualitatively
different than that seen for the L-PUUs (Figure 5.13, Table 5.2) for which the soft
segment Tg decreased with increasing diamine content. Observations of the glass
transitions of hard segment were not very conclusive because of the difficulty in
determining the Tgs. However, it is clear from Figure 5.14 (A) that the glass
transitions of hard segments of the B12-PUUs were significantly broader than the
glass transition seen for L-PU for samples subjected to similar thermal history. This
made difficult the detection of their Tg. The data in the Figure suggests that compared
to the Tg of L-PU the Tgs of B12-PUUs increased for B12-PUU70 and B12-PUU100.
However the observed increase was much lower than that observed for the B12-model
hard segments shown in Figure 5.12 for the same diamine content. Information about
hard segment dynamics was better obtained from DMA data as will be shown later.
Figure 5.14 (A) DSC traces for B12-PUU series. Conditions: 20oC/min, first heat.
Heat
Flow
(W/g
) En
do U
p
-120
-70
-20
30
80
130
Temperature (°C)
L-PU
–––––––
B12-PUU10
–––––––
B12-PUU50
–––––––
B12-PUU70
–––––––
B12-PUU100
–––––––
-82.96oC
49.96oC
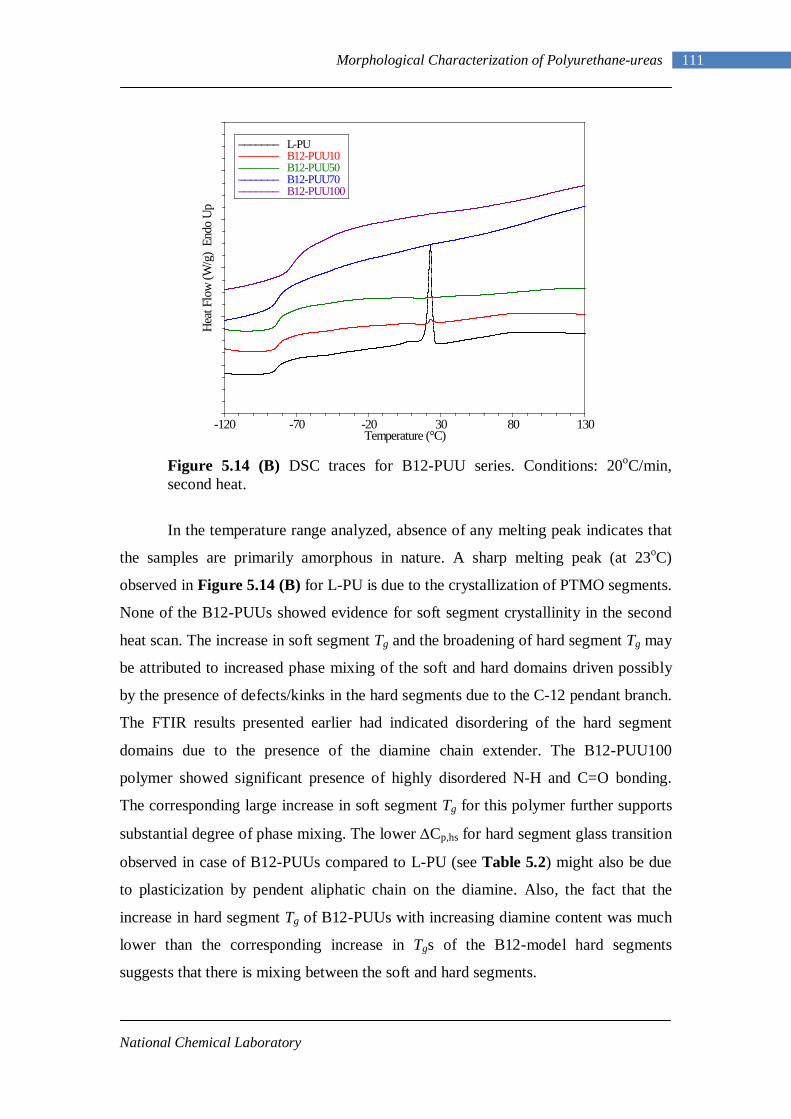
National Chemical Laboratory
111 Morphological Characterization of Polyurethane-ureas
Figure 5.14 (B) DSC traces for B12-PUU series. Conditions: 20oC/min, second heat.
In the temperature range analyzed, absence of any melting peak indicates that
the samples are primarily amorphous in nature. A sharp melting peak (at 23oC)
observed in Figure 5.14 (B) for L-PU is due to the crystallization of PTMO segments.
None of the B12-PUUs showed evidence for soft segment crystallinity in the second
heat scan. The increase in soft segment Tg and the broadening of hard segment Tg may
be attributed to increased phase mixing of the soft and hard domains driven possibly
by the presence of defects/kinks in the hard segments due to the C-12 pendant branch.
The FTIR results presented earlier had indicated disordering of the hard segment
domains due to the presence of the diamine chain extender. The B12-PUU100
polymer showed significant presence of highly disordered N-H and C=O bonding.
The corresponding large increase in soft segment Tg for this polymer further supports
substantial degree of phase mixing. The lower ∆Cp,hs for hard segment glass transition
observed in case of B12-PUUs compared to L-PU (see Table 5.2) might also be due
to plasticization by pendent aliphatic chain on the diamine. Also, the fact that the
increase in hard segment Tg of B12-PUUs with increasing diamine content was much
lower than the corresponding increase in Tgs of the B12-model hard segments
suggests that there is mixing between the soft and hard segments.
Heat
Flow
(W/g
) En
do U
p
-120
-70
-20
30
80
130
Temperature (°C)
L-PU
–––––––
B12-PUU10
–––––––
B12-PUU50
–––––––
B12-PUU70
–––––––
B12-PUU100
–––––––
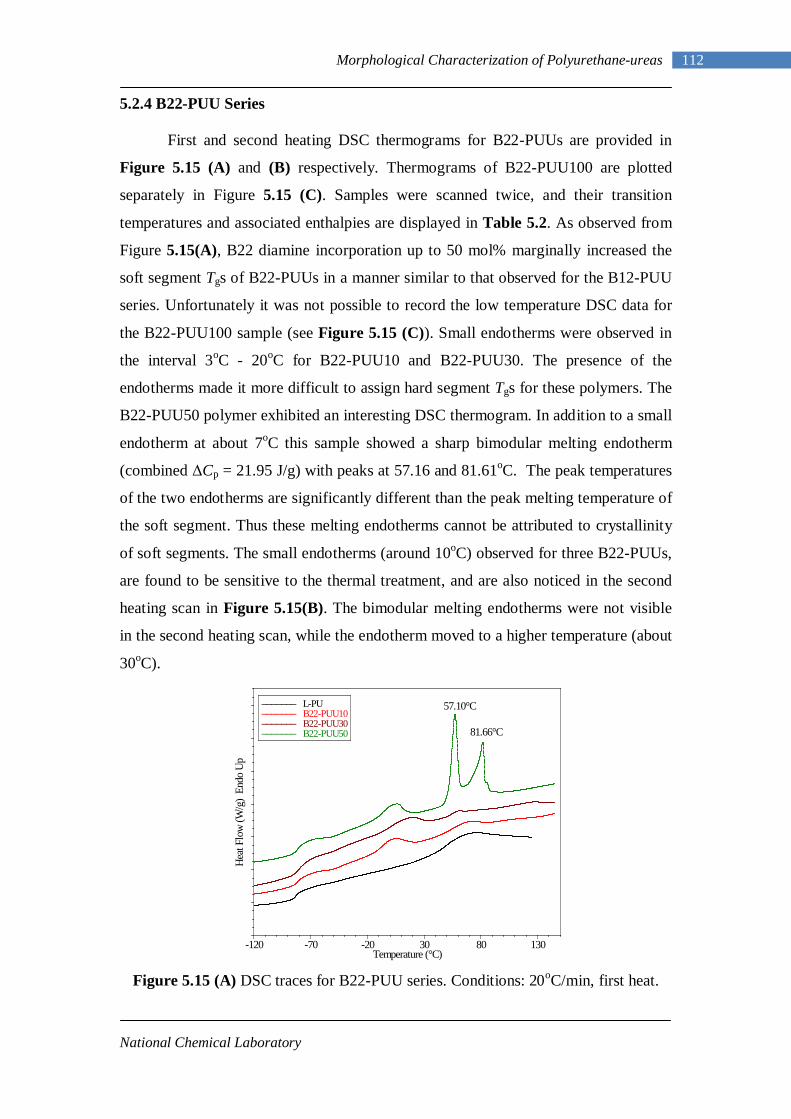
National Chemical Laboratory
112 Morphological Characterization of Polyurethane-ureas
5.2.4 B22-PUU Series
First and second heating DSC thermograms for B22-PUUs are provided in
Figure 5.15 (A) and (B) respectively. Thermograms of B22-PUU100 are plotted
separately in Figure 5.15 (C). Samples were scanned twice, and their transition
temperatures and associated enthalpies are displayed in Table 5.2. As observed from
Figure 5.15(A), B22 diamine incorporation up to 50 mol% marginally increased the
soft segment Tgs of B22-PUUs in a manner similar to that observed for the B12-PUU
series. Unfortunately it was not possible to record the low temperature DSC data for
the B22-PUU100 sample (see Figure 5.15 (C)). Small endotherms were observed in
the interval 3oC - 20oC for B22-PUU10 and B22-PUU30. The presence of the
endotherms made it more difficult to assign hard segment Tgs for these polymers. The
B22-PUU50 polymer exhibited an interesting DSC thermogram. In addition to a small
endotherm at about 7oC this sample showed a sharp bimodular melting endotherm
(combined ΔCp = 21.95 J/g) with peaks at 57.16 and 81.61oC. The peak temperatures
of the two endotherms are significantly different than the peak melting temperature of
the soft segment. Thus these melting endotherms cannot be attributed to crystallinity
of soft segments. The small endotherms (around 10oC) observed for three B22-PUUs,
are found to be sensitive to the thermal treatment, and are also noticed in the second
heating scan in Figure 5.15(B). The bimodular melting endotherms were not visible
in the second heating scan, while the endotherm moved to a higher temperature (about
30oC).
Figure 5.15 (A) DSC traces for B22-PUU series. Conditions: 20oC/min, first heat.
57.10°C
81.66°C
Heat
Flow
(W/g
) En
do U
p
-120
-70
-20
30
80
130
Temperature (°C)
L-PU
–––––––
B22-PUU10
–––––––
B22-PUU30
–––––––
B22-PUU50
–––––––
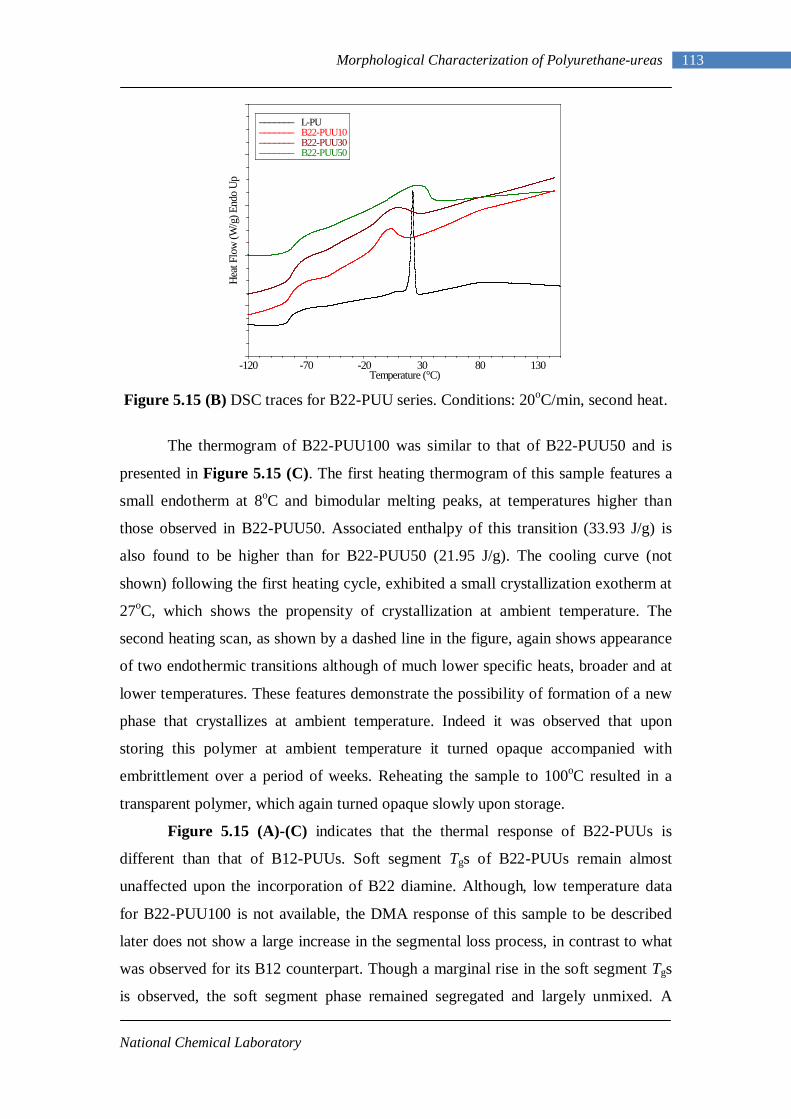
National Chemical Laboratory
113 Morphological Characterization of Polyurethane-ureas
Figure 5.15 (B) DSC traces for B22-PUU series. Conditions: 20oC/min, second heat.
The thermogram of B22-PUU100 was similar to that of B22-PUU50 and is
presented in Figure 5.15 (C). The first heating thermogram of this sample features a
small endotherm at 8oC and bimodular melting peaks, at temperatures higher than
those observed in B22-PUU50. Associated enthalpy of this transition (33.93 J/g) is
also found to be higher than for B22-PUU50 (21.95 J/g). The cooling curve (not
shown) following the first heating cycle, exhibited a small crystallization exotherm at
27oC, which shows the propensity of crystallization at ambient temperature. The
second heating scan, as shown by a dashed line in the figure, again shows appearance
of two endothermic transitions although of much lower specific heats, broader and at
lower temperatures. These features demonstrate the possibility of formation of a new
phase that crystallizes at ambient temperature. Indeed it was observed that upon
storing this polymer at ambient temperature it turned opaque accompanied with
embrittlement over a period of weeks. Reheating the sample to 100oC resulted in a
transparent polymer, which again turned opaque slowly upon storage.
Figure 5.15 (A)-(C) indicates that the thermal response of B22-PUUs is
different than that of B12-PUUs. Soft segment Tgs of B22-PUUs remain almost
unaffected upon the incorporation of B22 diamine. Although, low temperature data
for B22-PUU100 is not available, the DMA response of this sample to be described
later does not show a large increase in the segmental loss process, in contrast to what
was observed for its B12 counterpart. Though a marginal rise in the soft segment Tgs
is observed, the soft segment phase remained segregated and largely unmixed. A
Heat
Flow
(W/g
) End
o Up
-120
-70
-20
30
80
130
Temperature (°C)
L-PU
–––––––
B22-PUU10
–––––––
B22-PUU30
–––––––
B22-PUU50
–––––––
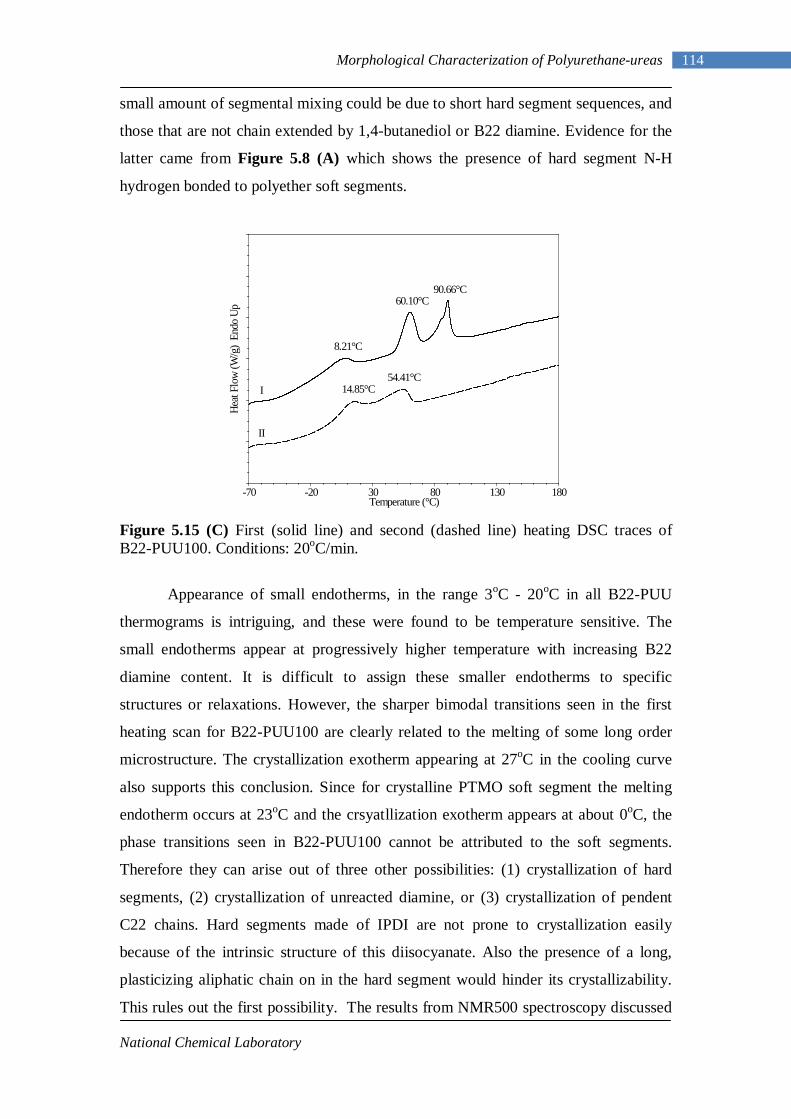
National Chemical Laboratory
114 Morphological Characterization of Polyurethane-ureas
small amount of segmental mixing could be due to short hard segment sequences, and
those that are not chain extended by 1,4-butanediol or B22 diamine. Evidence for the
latter came from Figure 5.8 (A) which shows the presence of hard segment N-H
hydrogen bonded to polyether soft segments.
Figure 5.15 (C) First (solid line) and second (dashed line) heating DSC traces of B22-PUU100. Conditions: 20oC/min.
Appearance of small endotherms, in the range 3oC - 20oC in all B22-PUU
thermograms is intriguing, and these were found to be temperature sensitive. The
small endotherms appear at progressively higher temperature with increasing B22
diamine content. It is difficult to assign these smaller endotherms to specific
structures or relaxations. However, the sharper bimodal transitions seen in the first
heating scan for B22-PUU100 are clearly related to the melting of some long order
microstructure. The crystallization exotherm appearing at 27oC in the cooling curve
also supports this conclusion. Since for crystalline PTMO soft segment the melting
endotherm occurs at 23oC and the crsyatllization exotherm appears at about 0oC, the
phase transitions seen in B22-PUU100 cannot be attributed to the soft segments.
Therefore they can arise out of three other possibilities: (1) crystallization of hard
segments, (2) crystallization of unreacted diamine, or (3) crystallization of pendent
C22 chains. Hard segments made of IPDI are not prone to crystallization easily
because of the intrinsic structure of this diisocyanate. Also the presence of a long,
plasticizing aliphatic chain on in the hard segment would hinder its crystallizability.
This rules out the first possibility. The results from NMR500 spectroscopy discussed
8.21°C
60.10°C
90.66°C
I
II
14.85°C
54.41°C
Heat
Flow
(W/g
) En
do U
p
-70
-20
30
80
130
180
Temperature (°C)
National Chemical Laboratory
115 Morphological Characterization of Polyurethane-ureas
in Chapter 4 (section 4.4) showed that a small part of unreacted diamine chain
extender was detected in the B22-PUU100. The melting point of the pure diamine was
found to be 91oC (see Chapter 3, section 3.2.4). Thus it is possible that some free
unreacted diamine could have crystallized in this polymer and appears as the 90oC
endotherm seen in Figure 5.15 (C). However the endotherm appearing at 60oC in the
same figure is not explained by this argument. Similarly, no free diamine was
detected in the B22-PUU50 polymer and yet it showed an endotherm at about 82oC
(see Figure 5.15 (A)). Thus, the possibility (2) can also be ruled out. We are then left
with the possibility that crystallization of C22 chains has resulted in the formation of a
new phase having the unique melting endotherms and crystallization exotherms
discussed above. The microstructure of the B22-PUU50 and B22-PUU100 polymers
is therefore rather unique. It appears that there are three distinct phases in the
polymer: soft segment phase, hard segment phase and a crystalline C22 segment
phase. The physical location of the third phase is not known. It is likely to be located
within the hard domains.
It is likely that the smaller endotherms located between 3oC - 20oC are also
due to dissociation of the C22 chains. In B22-PUU10 the concentration of C22 chains
is very low, but it appears that although weakly they associate and give rise to the
small endotherm at about 3oC (Figure 5.15 (A) and (B)). With the increase in diamine
concentration in B22-PUU30 the endotherm moved to 20oC (Figure 5.15 (A)),
indicating a better C22 association than the previous copolymer composition. In B22-
PUU50 a further increase in the C22 chain concentration probably resulted in
crystallization of a poorly organized 3-D ordered structure. Whereas, for the highest
B22 diamine content (B22-PUU100) the C22 chains are in sufficient concentration to
form a well ordered 3-D structure with higher melting points.
Process of paraffin crystallization is complicated and is a subject of academic
as well as industrial research. n-Alkanes are known to undergo on heating to a strong
first order transition a few degrees below the melting point into the so-called rotator
phase.11-14 Previous work demonstrate that C22 shows a rotator phase on heating and
cooling.15 The B22-PUU100 sample was analyzed by wide angle x-ray diffraction
(WAXD) and the result is shown in Figure 5.16. Also shown is wide angle diffraction
result for the L-PU. Whereas the L-PU showed only an amorphous halo the B22-
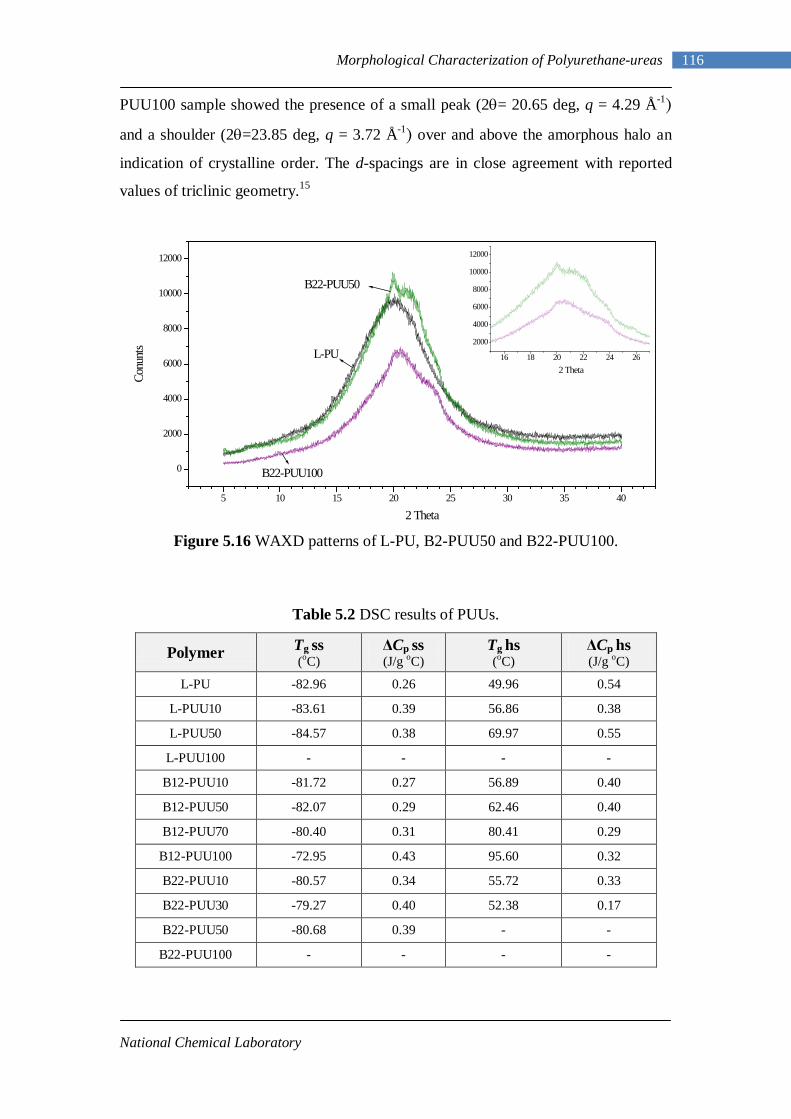
National Chemical Laboratory
116 Morphological Characterization of Polyurethane-ureas
PUU100 sample showed the presence of a small peak (2θ= 20.65 deg, q = 4.29 Å-1)
and a shoulder (2θ=23.85 deg, q = 3.72 Å-1) over and above the amorphous halo an
indication of crystalline order. The d-spacings are in close agreement with reported
values of triclinic geometry.15
Figure 5.16 WAXD patterns of L-PU, B2-PUU50 and B22-PUU100.
Table 5.2 DSC results of PUUs.
Polymer Tg ss (oC)
ΔCp ss (J/g oC)
Tg hs (oC)
ΔCp hs (J/g oC)
L-PU -82.96 0.26 49.96 0.54
L-PUU10 -83.61 0.39 56.86 0.38
L-PUU50 -84.57 0.38 69.97 0.55
L-PUU100 - - - -
B12-PUU10 -81.72 0.27 56.89 0.40
B12-PUU50 -82.07 0.29 62.46 0.40
B12-PUU70 -80.40 0.31 80.41 0.29
B12-PUU100 -72.95 0.43 95.60 0.32
B22-PUU10 -80.57 0.34 55.72 0.33
B22-PUU30 -79.27 0.40 52.38 0.17
B22-PUU50 -80.68 0.39 - -
B22-PUU100 - - - -
5 10 15 20 25 30 35 40
0
2000
4000
6000
8000
10000
12000
16 18 20 22 24 26
2000
4000
6000
8000
10000
12000
B22-PUU100
B22-PUU50
L-PU
Conu
nts
2 Theta
2 Theta
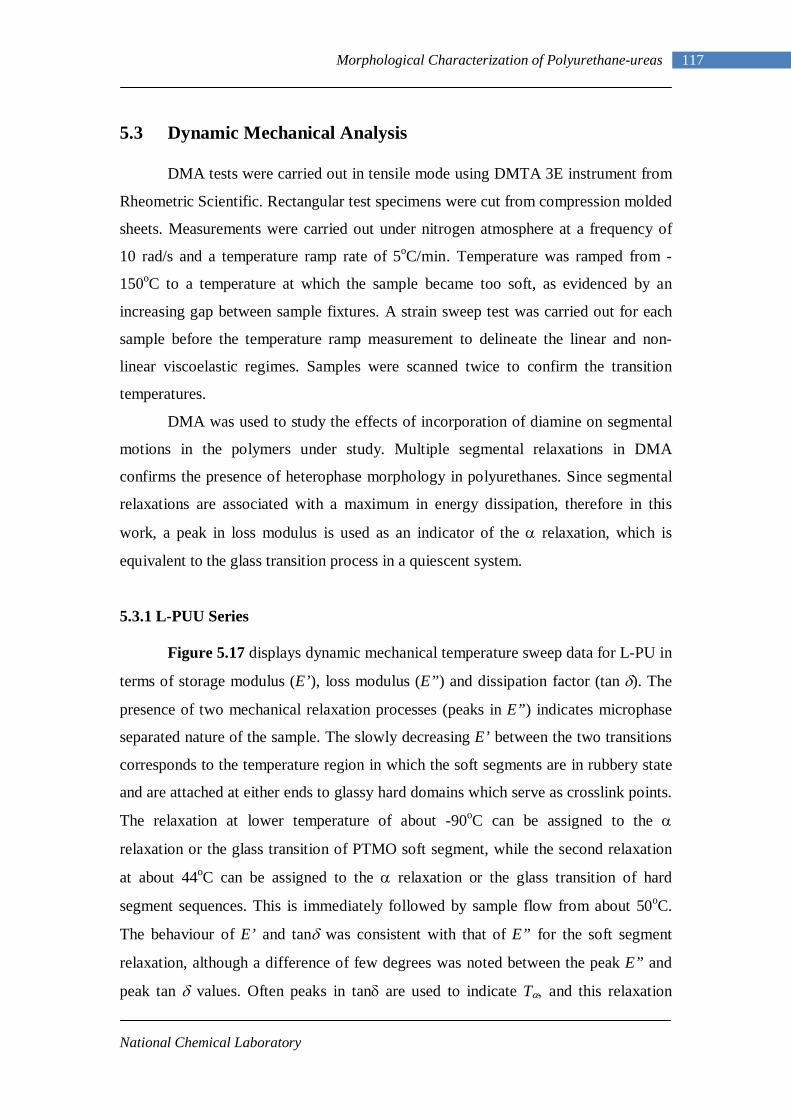
National Chemical Laboratory
117 Morphological Characterization of Polyurethane-ureas
5.3 Dynamic Mechanical Analysis
DMA tests were carried out in tensile mode using DMTA 3E instrument from
Rheometric Scientific. Rectangular test specimens were cut from compression molded
sheets. Measurements were carried out under nitrogen atmosphere at a frequency of
10 rad/s and a temperature ramp rate of 5oC/min. Temperature was ramped from -
150oC to a temperature at which the sample became too soft, as evidenced by an
increasing gap between sample fixtures. A strain sweep test was carried out for each
sample before the temperature ramp measurement to delineate the linear and non-
linear viscoelastic regimes. Samples were scanned twice to confirm the transition
temperatures.
DMA was used to study the effects of incorporation of diamine on segmental
motions in the polymers under study. Multiple segmental relaxations in DMA
confirms the presence of heterophase morphology in polyurethanes. Since segmental
relaxations are associated with a maximum in energy dissipation, therefore in this
work, a peak in loss modulus is used as an indicator of the α relaxation, which is
equivalent to the glass transition process in a quiescent system.
5.3.1 L-PUU Series
Figure 5.17 displays dynamic mechanical temperature sweep data for L-PU in
terms of storage modulus (E’), loss modulus (E”) and dissipation factor (tan δ). The
presence of two mechanical relaxation processes (peaks in E”) indicates microphase
separated nature of the sample. The slowly decreasing E’ between the two transitions
corresponds to the temperature region in which the soft segments are in rubbery state
and are attached at either ends to glassy hard domains which serve as crosslink points.
The relaxation at lower temperature of about -90oC can be assigned to the α
relaxation or the glass transition of PTMO soft segment, while the second relaxation
at about 44oC can be assigned to the α relaxation or the glass transition of hard
segment sequences. This is immediately followed by sample flow from about 50oC.
The behaviour of E’ and tanδ was consistent with that of E” for the soft segment
relaxation, although a difference of few degrees was noted between the peak E” and
peak tan δ values. Often peaks in tanδ are used to indicate Tα, and this relaxation
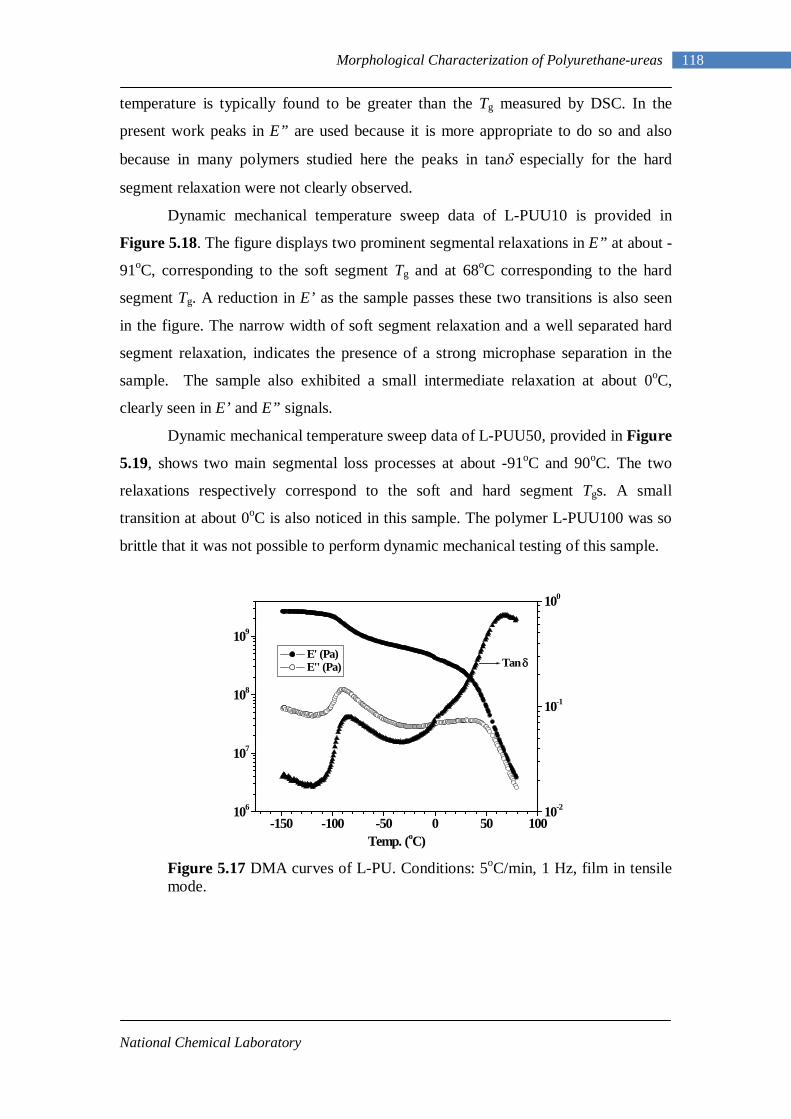
National Chemical Laboratory
118 Morphological Characterization of Polyurethane-ureas
temperature is typically found to be greater than the Tg measured by DSC. In the
present work peaks in E” are used because it is more appropriate to do so and also
because in many polymers studied here the peaks in tanδ especially for the hard
segment relaxation were not clearly observed.
Dynamic mechanical temperature sweep data of L-PUU10 is provided in
Figure 5.18. The figure displays two prominent segmental relaxations in E” at about -
91oC, corresponding to the soft segment Tg and at 68oC corresponding to the hard
segment Tg. A reduction in E’ as the sample passes these two transitions is also seen
in the figure. The narrow width of soft segment relaxation and a well separated hard
segment relaxation, indicates the presence of a strong microphase separation in the
sample. The sample also exhibited a small intermediate relaxation at about 0oC,
clearly seen in E’ and E” signals.
Dynamic mechanical temperature sweep data of L-PUU50, provided in Figure
5.19, shows two main segmental loss processes at about -91oC and 90oC. The two
relaxations respectively correspond to the soft and hard segment Tgs. A small
transition at about 0oC is also noticed in this sample. The polymer L-PUU100 was so
brittle that it was not possible to perform dynamic mechanical testing of this sample.
Figure 5.17 DMA curves of L-PU. Conditions: 5oC/min, 1 Hz, film in tensile mode.
-150 -100 -50 0 50 100106
107
108
109
E' (Pa) E'' (Pa)
Temp. (oC)
10-2
10-1
100
Tan δ
National Chemical Laboratory
119 Morphological Characterization of Polyurethane-ureas
Figure 5.18 DMA curves of L-PUU10. Conditions: 5oC/min, 1 Hz, film in tensile mode.
Figure 5.20 displays a plot of loss moduli (E”) of L-PUUs in comparison with
the control sample L-PU. Soft and hard segmental relaxations are labeled as I and II
respectively. Soft segment relaxations of L-PUU10 and L-PUU50 were found to be
marginally shifted to lower temperature compared to L-PU (-89.65oC), and were
observed at -92oC and -93oC respectively. The loss modulli peak of the two PUUs
was observed to have narrowed down. Also when compared with the L-PU sample,
the hard segment glass transition of L-PUUs was seen to increase with the amount of
aromatic chain extender m-phenylenediamine. Additionally, both L-PUUs showed a
third segmental relaxation near 0oC which is in between the soft and hard segment
relaxations. This transition was observed at a slightly higher temperature for L-
PUU10 than for L-PUU50.
-150 -100 -50 0 50 100
107
108
109
10-2
10-1
100
Tan δ
Temp. (oC)
E' (Pa) E'' (Pa)
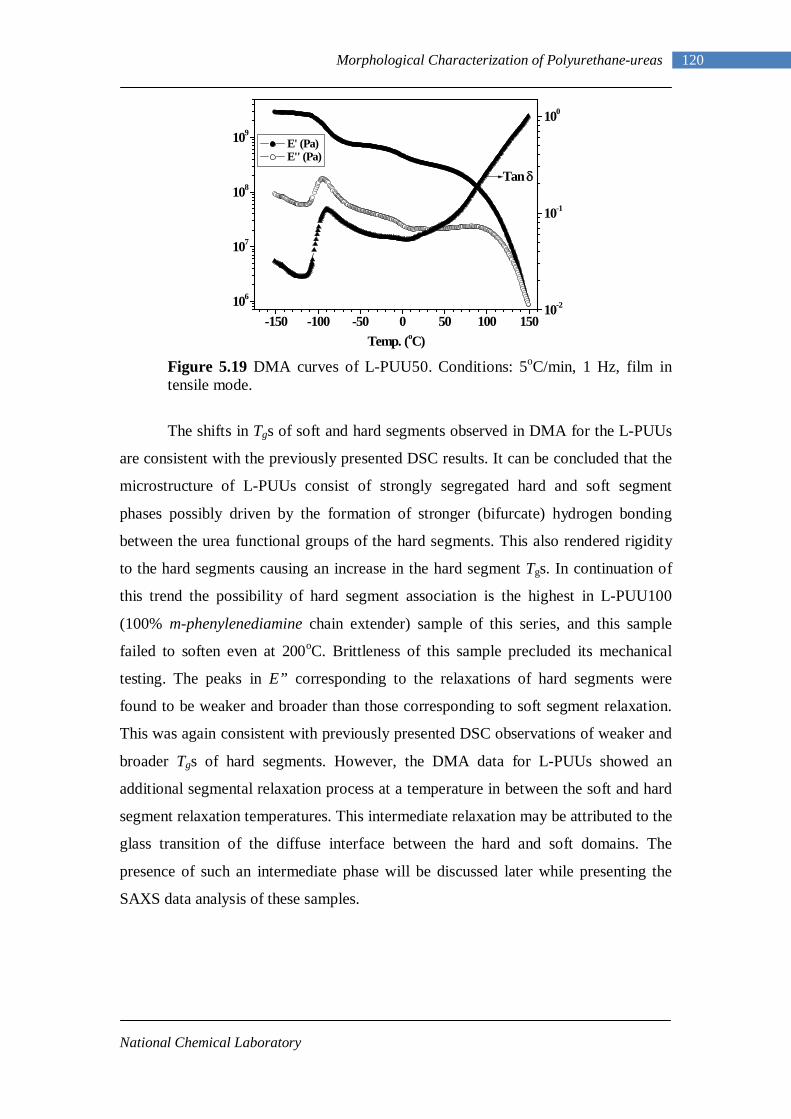
National Chemical Laboratory
120 Morphological Characterization of Polyurethane-ureas
Figure 5.19 DMA curves of L-PUU50. Conditions: 5oC/min, 1 Hz, film in tensile mode.
The shifts in Tgs of soft and hard segments observed in DMA for the L-PUUs
are consistent with the previously presented DSC results. It can be concluded that the
microstructure of L-PUUs consist of strongly segregated hard and soft segment
phases possibly driven by the formation of stronger (bifurcate) hydrogen bonding
between the urea functional groups of the hard segments. This also rendered rigidity
to the hard segments causing an increase in the hard segment Tgs. In continuation of
this trend the possibility of hard segment association is the highest in L-PUU100
(100% m-phenylenediamine chain extender) sample of this series, and this sample
failed to soften even at 200oC. Brittleness of this sample precluded its mechanical
testing. The peaks in E” corresponding to the relaxations of hard segments were
found to be weaker and broader than those corresponding to soft segment relaxation.
This was again consistent with previously presented DSC observations of weaker and
broader Tgs of hard segments. However, the DMA data for L-PUUs showed an
additional segmental relaxation process at a temperature in between the soft and hard
segment relaxation temperatures. This intermediate relaxation may be attributed to the
glass transition of the diffuse interface between the hard and soft domains. The
presence of such an intermediate phase will be discussed later while presenting the
SAXS data analysis of these samples.
-150 -100 -50 0 50 100 150106
107
108
109
10-2
10-1
100
Tan δ
Temp. (oC)
E' (Pa) E'' (Pa)
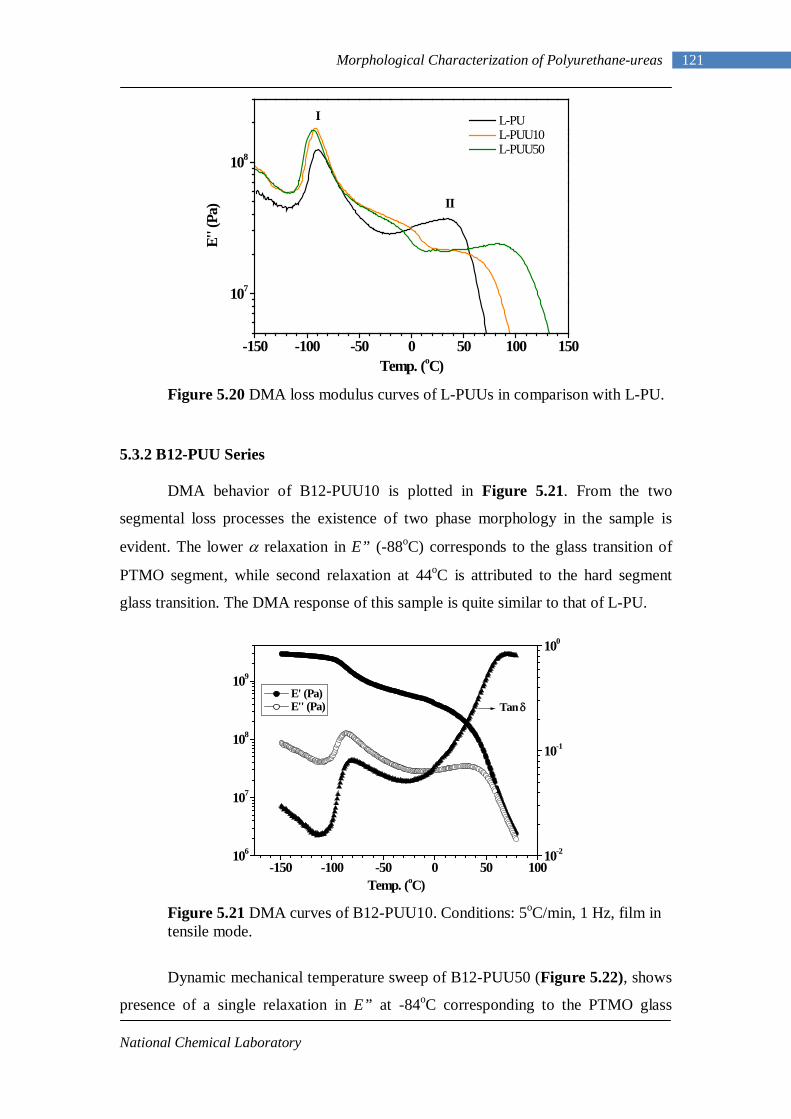
National Chemical Laboratory
121 Morphological Characterization of Polyurethane-ureas
Figure 5.20 DMA loss modulus curves of L-PUUs in comparison with L-PU.
5.3.2 B12-PUU Series
DMA behavior of B12-PUU10 is plotted in Figure 5.21. From the two
segmental loss processes the existence of two phase morphology in the sample is
evident. The lower α relaxation in E” (-88oC) corresponds to the glass transition of
PTMO segment, while second relaxation at 44oC is attributed to the hard segment
glass transition. The DMA response of this sample is quite similar to that of L-PU.
Figure 5.21 DMA curves of B12-PUU10. Conditions: 5oC/min, 1 Hz, film in tensile mode.
Dynamic mechanical temperature sweep of B12-PUU50 (Figure 5.22), shows
presence of a single relaxation in E” at -84oC corresponding to the PTMO glass
-150 -100 -50 0 50 100 150
107
108
L-PU L-PUU10 L-PUU50
E'' (
Pa)
Temp. (oC)
I
II
-150 -100 -50 0 50 100106
107
108
109
10-2
10-1
100
Tan δ
Temp. (oC)
E' (Pa) E'' (Pa)
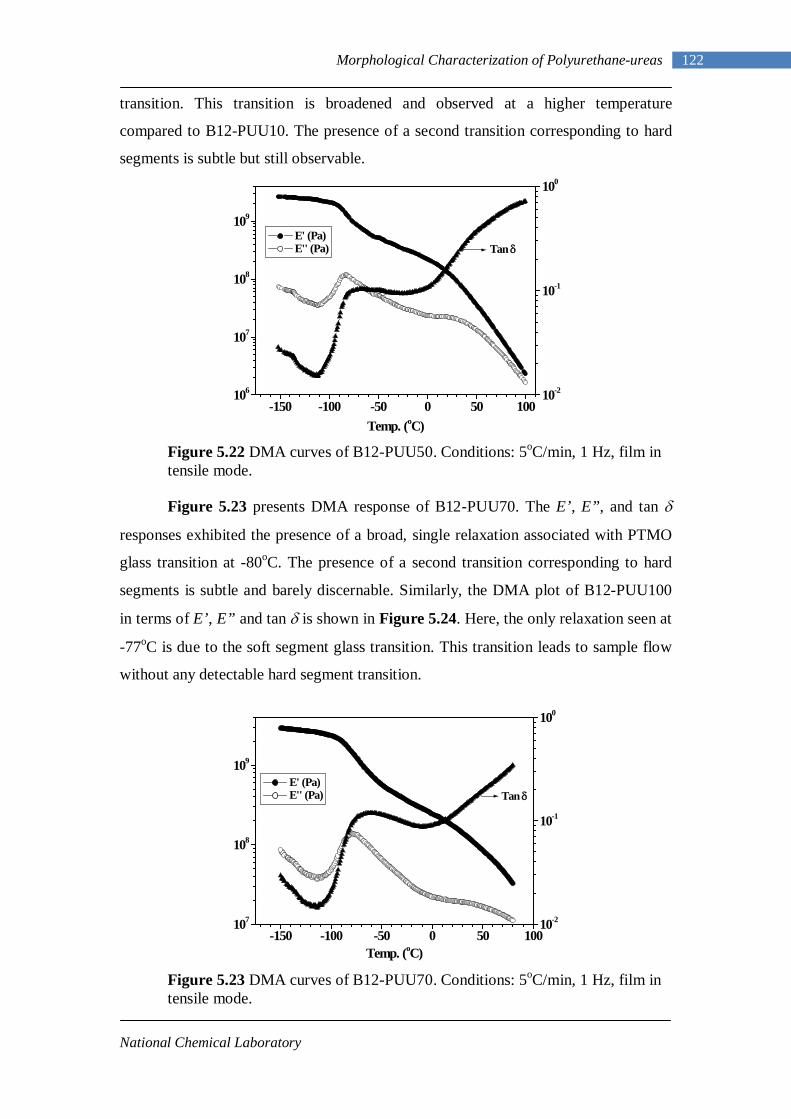
National Chemical Laboratory
122 Morphological Characterization of Polyurethane-ureas
transition. This transition is broadened and observed at a higher temperature
compared to B12-PUU10. The presence of a second transition corresponding to hard
segments is subtle but still observable.
Figure 5.22 DMA curves of B12-PUU50. Conditions: 5oC/min, 1 Hz, film in tensile mode.
Figure 5.23 presents DMA response of B12-PUU70. The E’, E”, and tan δ
responses exhibited the presence of a broad, single relaxation associated with PTMO
glass transition at -80oC. The presence of a second transition corresponding to hard
segments is subtle and barely discernable. Similarly, the DMA plot of B12-PUU100
in terms of E’, E” and tan δ is shown in Figure 5.24. Here, the only relaxation seen at
-77oC is due to the soft segment glass transition. This transition leads to sample flow
without any detectable hard segment transition.
Figure 5.23 DMA curves of B12-PUU70. Conditions: 5oC/min, 1 Hz, film in tensile mode.
-150 -100 -50 0 50 100106
107
108
109
10-2
10-1
100
Tan δ
Temp. (oC)
E' (Pa) E'' (Pa)
-150 -100 -50 0 50 100107
108
109
10-2
10-1
100
Tan δ
Temp. (oC)
E' (Pa) E'' (Pa)
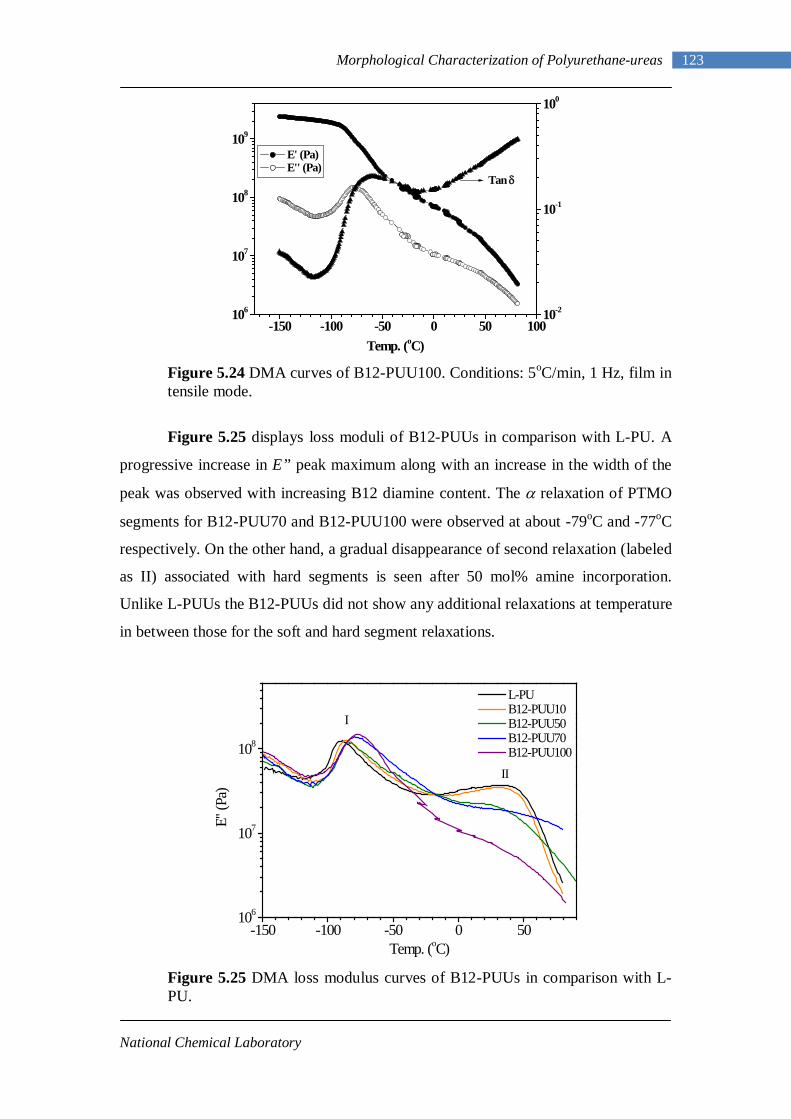
National Chemical Laboratory
123 Morphological Characterization of Polyurethane-ureas
Figure 5.24 DMA curves of B12-PUU100. Conditions: 5oC/min, 1 Hz, film in tensile mode.
Figure 5.25 displays loss moduli of B12-PUUs in comparison with L-PU. A
progressive increase in E” peak maximum along with an increase in the width of the
peak was observed with increasing B12 diamine content. The α relaxation of PTMO
segments for B12-PUU70 and B12-PUU100 were observed at about -79oC and -77oC
respectively. On the other hand, a gradual disappearance of second relaxation (labeled
as II) associated with hard segments is seen after 50 mol% amine incorporation.
Unlike L-PUUs the B12-PUUs did not show any additional relaxations at temperature
in between those for the soft and hard segment relaxations.
Figure 5.25 DMA loss modulus curves of B12-PUUs in comparison with L-PU.
-150 -100 -50 0 50 100106
107
108
109
10-2
10-1
100
Tan δ
Temp. (oC)
E' (Pa) E'' (Pa)
-150 -100 -50 0 50106
107
108
II
I
L-PU B12-PUU10 B12-PUU50 B12-PUU70 B12-PUU100
E'' (
Pa)
Temp. (oC)
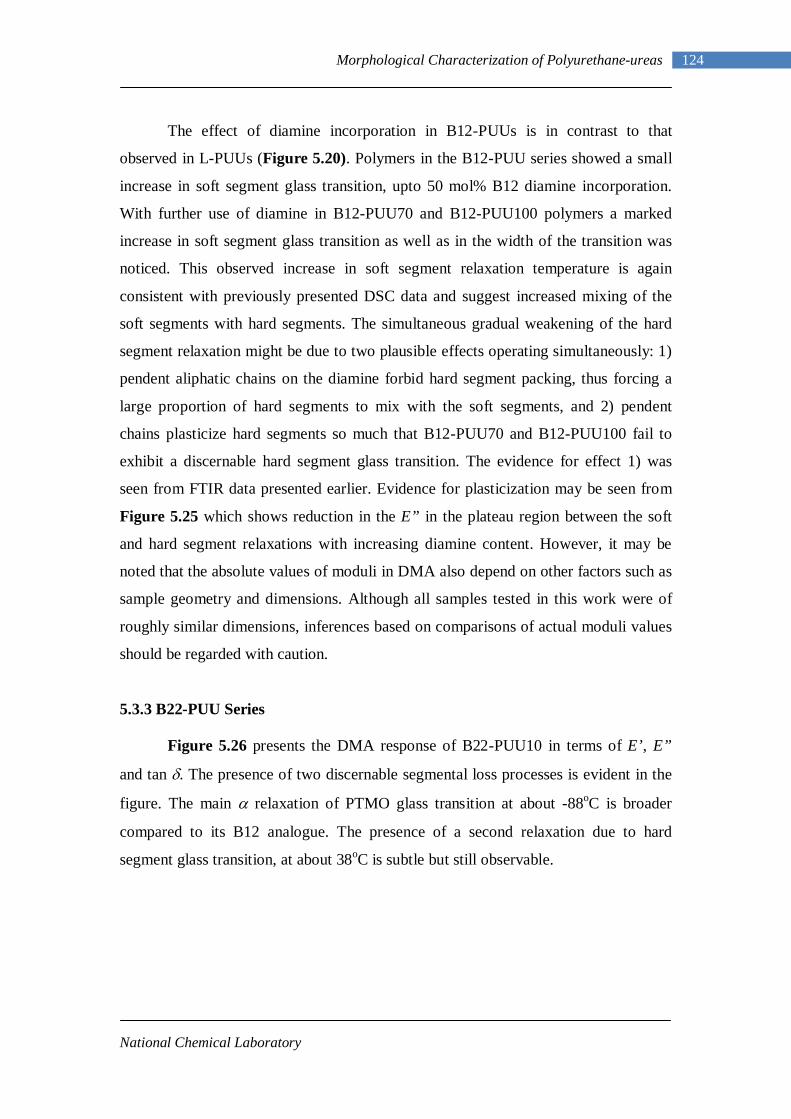
National Chemical Laboratory
124 Morphological Characterization of Polyurethane-ureas
The effect of diamine incorporation in B12-PUUs is in contrast to that
observed in L-PUUs (Figure 5.20). Polymers in the B12-PUU series showed a small
increase in soft segment glass transition, upto 50 mol% B12 diamine incorporation.
With further use of diamine in B12-PUU70 and B12-PUU100 polymers a marked
increase in soft segment glass transition as well as in the width of the transition was
noticed. This observed increase in soft segment relaxation temperature is again
consistent with previously presented DSC data and suggest increased mixing of the
soft segments with hard segments. The simultaneous gradual weakening of the hard
segment relaxation might be due to two plausible effects operating simultaneously: 1)
pendent aliphatic chains on the diamine forbid hard segment packing, thus forcing a
large proportion of hard segments to mix with the soft segments, and 2) pendent
chains plasticize hard segments so much that B12-PUU70 and B12-PUU100 fail to
exhibit a discernable hard segment glass transition. The evidence for effect 1) was
seen from FTIR data presented earlier. Evidence for plasticization may be seen from
Figure 5.25 which shows reduction in the E” in the plateau region between the soft
and hard segment relaxations with increasing diamine content. However, it may be
noted that the absolute values of moduli in DMA also depend on other factors such as
sample geometry and dimensions. Although all samples tested in this work were of
roughly similar dimensions, inferences based on comparisons of actual moduli values
should be regarded with caution.
5.3.3 B22-PUU Series
Figure 5.26 presents the DMA response of B22-PUU10 in terms of E’, E”
and tan δ. The presence of two discernable segmental loss processes is evident in the
figure. The main α relaxation of PTMO glass transition at about -88oC is broader
compared to its B12 analogue. The presence of a second relaxation due to hard
segment glass transition, at about 38oC is subtle but still observable.
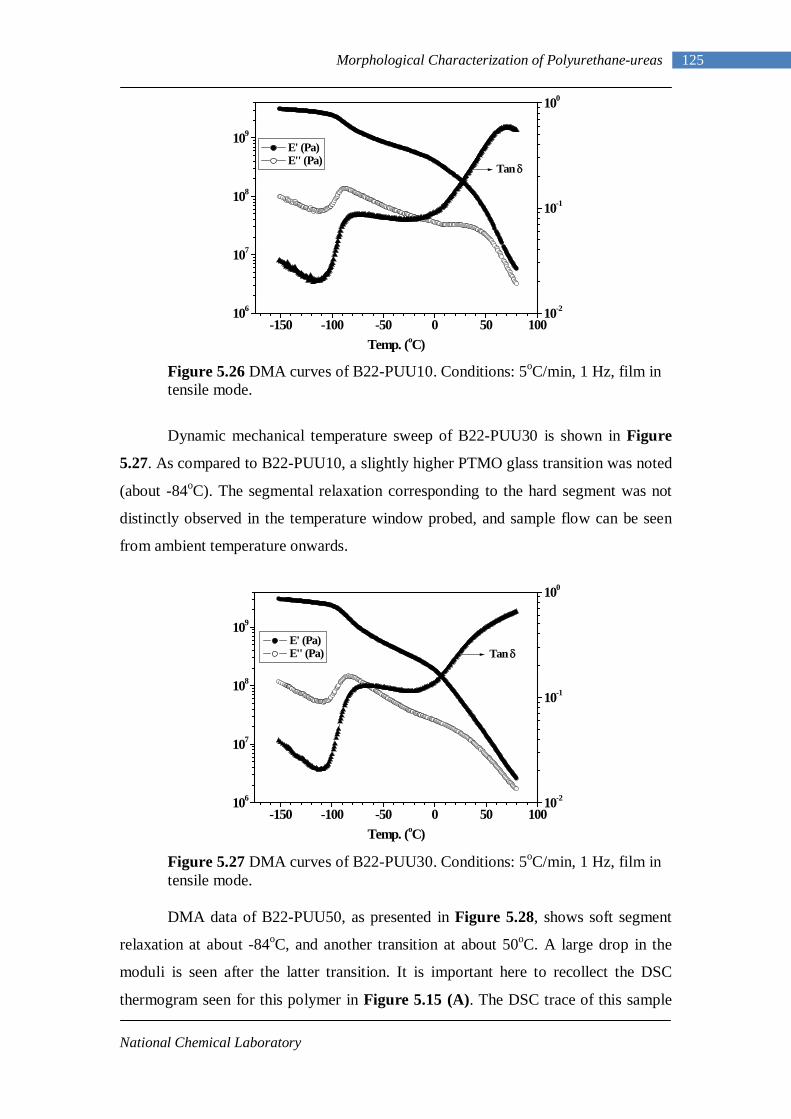
National Chemical Laboratory
125 Morphological Characterization of Polyurethane-ureas
Figure 5.26 DMA curves of B22-PUU10. Conditions: 5oC/min, 1 Hz, film in tensile mode.
Dynamic mechanical temperature sweep of B22-PUU30 is shown in Figure
5.27. As compared to B22-PUU10, a slightly higher PTMO glass transition was noted
(about -84oC). The segmental relaxation corresponding to the hard segment was not
distinctly observed in the temperature window probed, and sample flow can be seen
from ambient temperature onwards.
Figure 5.27 DMA curves of B22-PUU30. Conditions: 5oC/min, 1 Hz, film in tensile mode.
DMA data of B22-PUU50, as presented in Figure 5.28, shows soft segment
relaxation at about -84oC, and another transition at about 50oC. A large drop in the
moduli is seen after the latter transition. It is important here to recollect the DSC
thermogram seen for this polymer in Figure 5.15 (A). The DSC trace of this sample
-150 -100 -50 0 50 100106
107
108
109
10-2
10-1
100
Temp. (oC)
E' (Pa) E'' (Pa)
Tan δ
-150 -100 -50 0 50 100106
107
108
109
10-2
10-1
100
Tan δ
Temp. (oC)
E' (Pa) E'' (Pa)
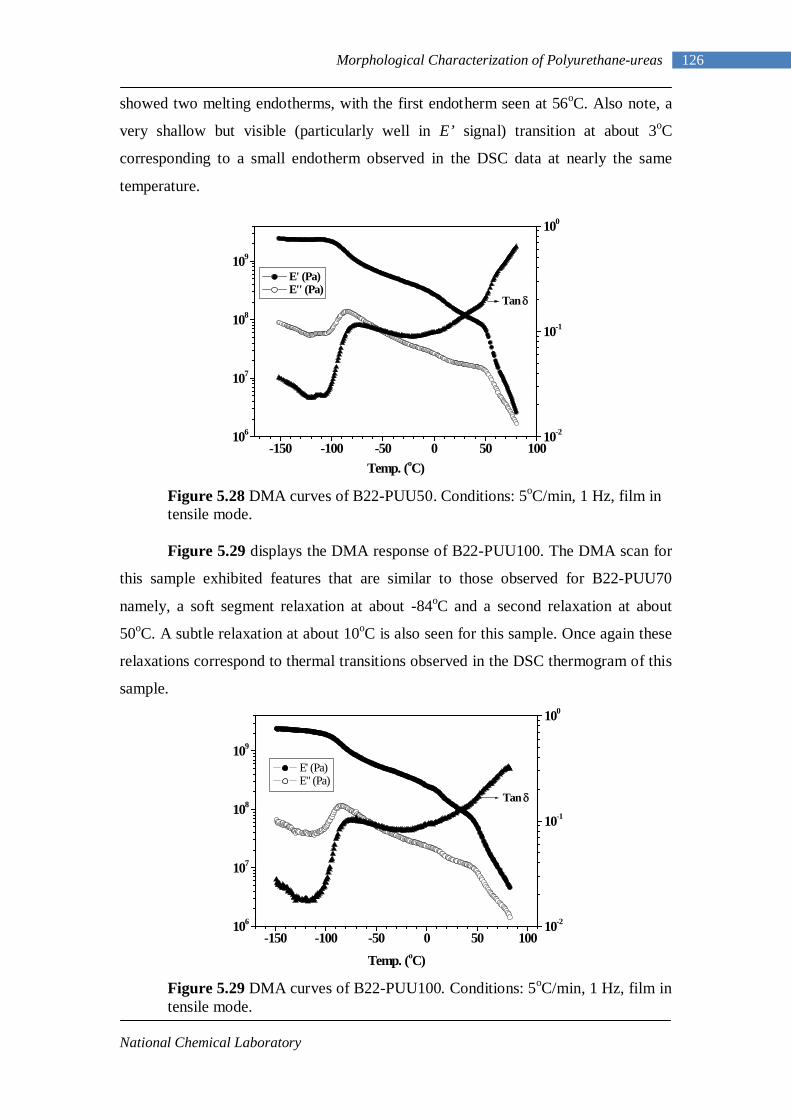
National Chemical Laboratory
126 Morphological Characterization of Polyurethane-ureas
showed two melting endotherms, with the first endotherm seen at 56oC. Also note, a
very shallow but visible (particularly well in E’ signal) transition at about 3oC
corresponding to a small endotherm observed in the DSC data at nearly the same
temperature.
Figure 5.28 DMA curves of B22-PUU50. Conditions: 5oC/min, 1 Hz, film in tensile mode.
Figure 5.29 displays the DMA response of B22-PUU100. The DMA scan for
this sample exhibited features that are similar to those observed for B22-PUU70
namely, a soft segment relaxation at about -84oC and a second relaxation at about
50oC. A subtle relaxation at about 10oC is also seen for this sample. Once again these
relaxations correspond to thermal transitions observed in the DSC thermogram of this
sample.
Figure 5.29 DMA curves of B22-PUU100. Conditions: 5oC/min, 1 Hz, film in tensile mode.
-150 -100 -50 0 50 100106
107
108
109
10-2
10-1
100
Temp. (oC)
E' (Pa) E'' (Pa)
Tan δ
-150 -100 -50 0 50 100106
107
108
109
10-2
10-1
100
Tan δ
E' (Pa) E" (Pa)
Temp. (oC)
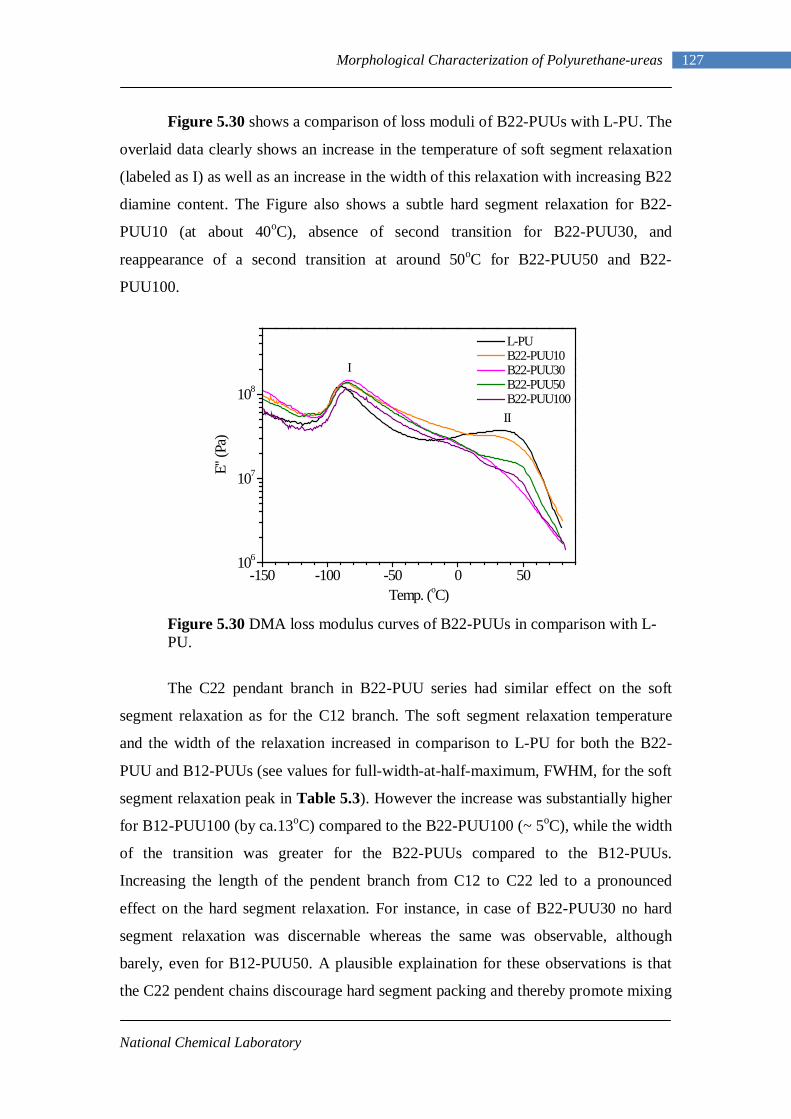
National Chemical Laboratory
127 Morphological Characterization of Polyurethane-ureas
Figure 5.30 shows a comparison of loss moduli of B22-PUUs with L-PU. The
overlaid data clearly shows an increase in the temperature of soft segment relaxation
(labeled as I) as well as an increase in the width of this relaxation with increasing B22
diamine content. The Figure also shows a subtle hard segment relaxation for B22-
PUU10 (at about 40oC), absence of second transition for B22-PUU30, and
reappearance of a second transition at around 50oC for B22-PUU50 and B22-
PUU100.
Figure 5.30 DMA loss modulus curves of B22-PUUs in comparison with L-PU.
The C22 pendant branch in B22-PUU series had similar effect on the soft
segment relaxation as for the C12 branch. The soft segment relaxation temperature
and the width of the relaxation increased in comparison to L-PU for both the B22-
PUU and B12-PUUs (see values for full-width-at-half-maximum, FWHM, for the soft
segment relaxation peak in Table 5.3). However the increase was substantially higher
for B12-PUU100 (by ca.13oC) compared to the B22-PUU100 (~ 5oC), while the width
of the transition was greater for the B22-PUUs compared to the B12-PUUs.
Increasing the length of the pendent branch from C12 to C22 led to a pronounced
effect on the hard segment relaxation. For instance, in case of B22-PUU30 no hard
segment relaxation was discernable whereas the same was observable, although
barely, even for B12-PUU50. A plausible explaination for these observations is that
the C22 pendent chains discourage hard segment packing and thereby promote mixing
-150 -100 -50 0 50106
107
108
L-PU B22-PUU10 B22-PUU30 B22-PUU50 B22-PUU100II
I
E'' (
Pa)
Temp. (oC)
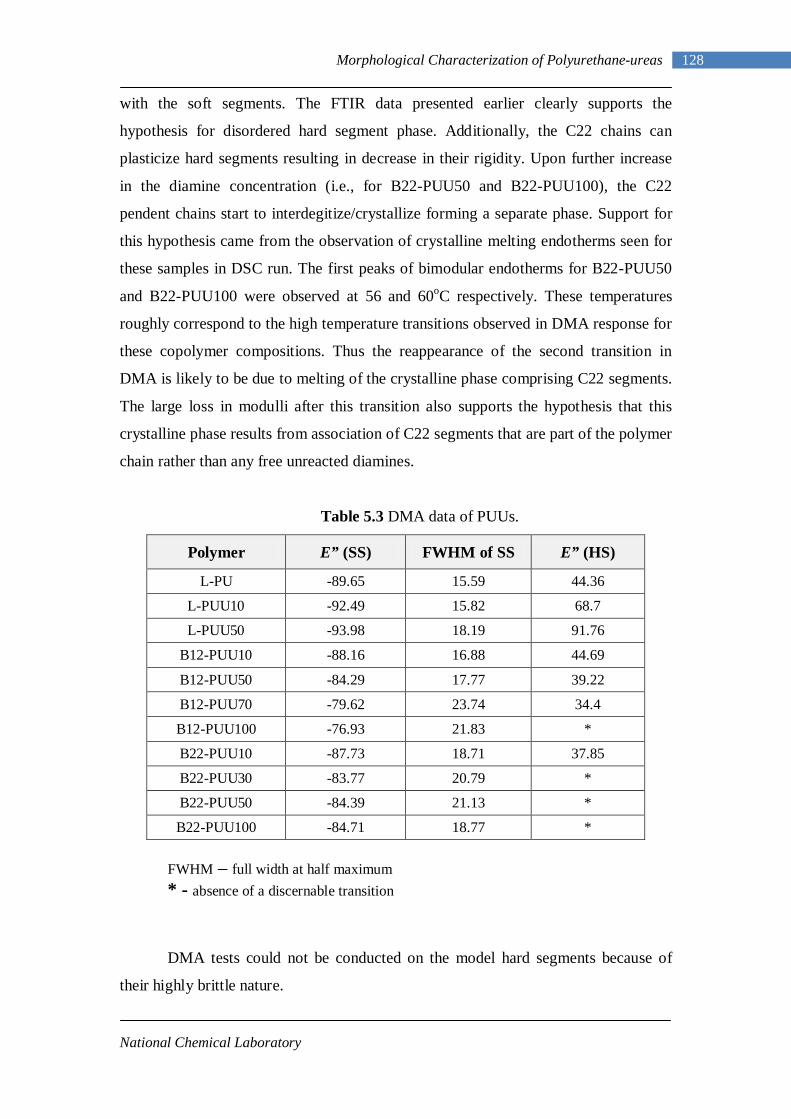
National Chemical Laboratory
128 Morphological Characterization of Polyurethane-ureas
with the soft segments. The FTIR data presented earlier clearly supports the
hypothesis for disordered hard segment phase. Additionally, the C22 chains can
plasticize hard segments resulting in decrease in their rigidity. Upon further increase
in the diamine concentration (i.e., for B22-PUU50 and B22-PUU100), the C22
pendent chains start to interdegitize/crystallize forming a separate phase. Support for
this hypothesis came from the observation of crystalline melting endotherms seen for
these samples in DSC run. The first peaks of bimodular endotherms for B22-PUU50
and B22-PUU100 were observed at 56 and 60oC respectively. These temperatures
roughly correspond to the high temperature transitions observed in DMA response for
these copolymer compositions. Thus the reappearance of the second transition in
DMA is likely to be due to melting of the crystalline phase comprising C22 segments.
The large loss in modulli after this transition also supports the hypothesis that this
crystalline phase results from association of C22 segments that are part of the polymer
chain rather than any free unreacted diamines.
Table 5.3 DMA data of PUUs.
Polymer E” (SS) FWHM of SS E” (HS)
L-PU -89.65 15.59 44.36
L-PUU10 -92.49 15.82 68.7
L-PUU50 -93.98 18.19 91.76
B12-PUU10 -88.16 16.88 44.69
B12-PUU50 -84.29 17.77 39.22
B12-PUU70 -79.62 23.74 34.4
B12-PUU100 -76.93 21.83 *
B22-PUU10 -87.73 18.71 37.85
B22-PUU30 -83.77 20.79 *
B22-PUU50 -84.39 21.13 *
B22-PUU100 -84.71 18.77 * FWHM – full width at half maximum * - absence of a discernable transition
DMA tests could not be conducted on the model hard segments because of
their highly brittle nature.
National Chemical Laboratory
129 Morphological Characterization of Polyurethane-ureas
5.4 Couchman Analysis
The data obtained from thermal (DSC) and thermo-mechanical (DMA)
experiments can be used to extract quantitative information on phase composition.
Towards this end the Couchman equations were used in the present study to calculate
the compositions of the soft and hard domains, each being assumed to be in a single
phase state, from the measured glass transition temperatures of the two domains. The
Couchman equation16 for predicting the glass transition of a single phase is
hsss
hsghsssgssg ww
TwTwT
.
. ,,
αα
+
+= (5.1)
Here, wss is the weight fraction of soft segments, whs the weight fraction of hard
segments, Tg,ss the Tg of pure soft segment phase, Tg,hs the Tg of pure hard segment
phase, and α is the ratio of heat capacity change for pure components:
ssphsp CC ,, / ∆∆=α (5.2)
where, ΔCp,hs is the heat capacity change for pure hard segment and ΔCp,hs is the heat
capacity change for pure soft segment.
Equation 5.1 when suitably rearranged can be used for the estimation of
composition of a specific phase in a microphase separated sample. Thus, the
composition of the soft phase containing dissolved hard segments can be estimated
using
( )
( ) ( )sghsgssg
sg
sghsgs
ss TTTTTT
w−+−
−=
,,
,
αα
(5.3)
Here sssw is the weight fraction of soft segments in the soft phase and s
gT is the Tg of
the soft phase. Similarly, the composition of the hard phase containing dissolved soft
segments can be estimated using
( )
( ) ( )hghsgssg
hg
ssgh
ghhs TTTT
TTw
−+−
−=
,,
,
α (5.4)
Here hhsw is the weight fraction of hard segments in the hard phase and h
gT is the Tg of
the hard phase.
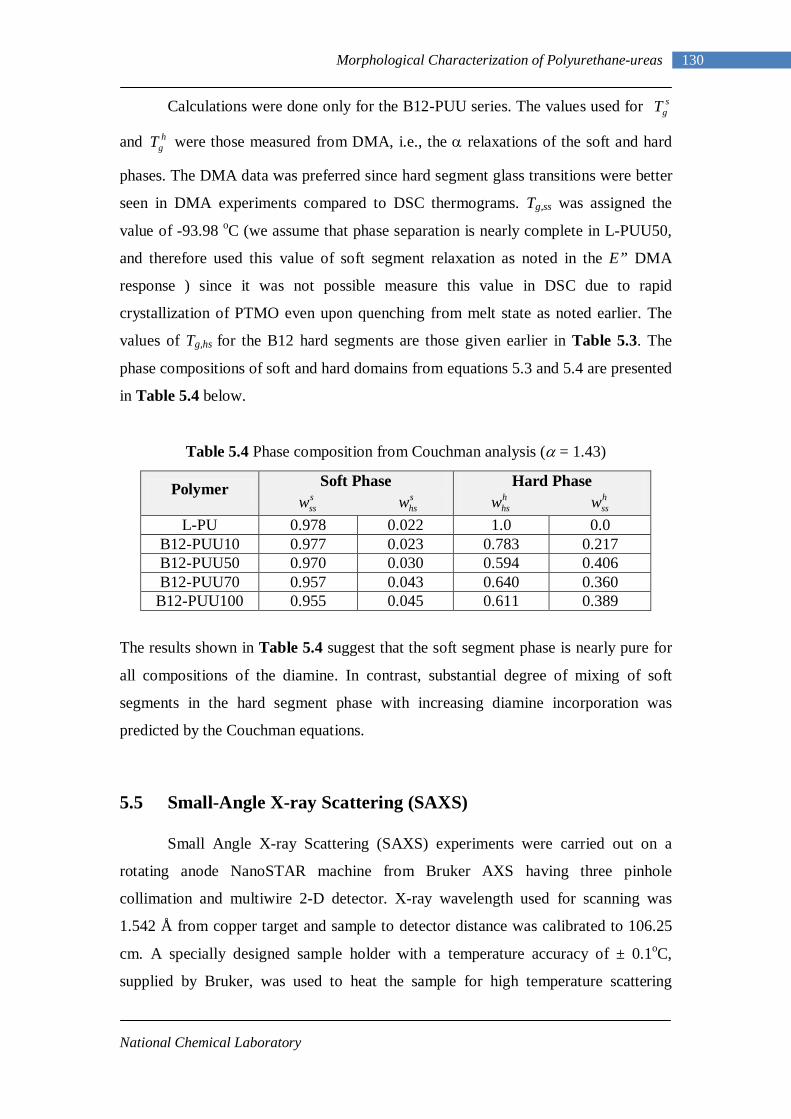
National Chemical Laboratory
130 Morphological Characterization of Polyurethane-ureas
Calculations were done only for the B12-PUU series. The values used for sgT
and hgT were those measured from DMA, i.e., the α relaxations of the soft and hard
phases. The DMA data was preferred since hard segment glass transitions were better
seen in DMA experiments compared to DSC thermograms. Tg,ss was assigned the
value of -93.98 oC (we assume that phase separation is nearly complete in L-PUU50,
and therefore used this value of soft segment relaxation as noted in the E” DMA
response ) since it was not possible measure this value in DSC due to rapid
crystallization of PTMO even upon quenching from melt state as noted earlier. The
values of Tg,hs for the B12 hard segments are those given earlier in Table 5.3. The
phase compositions of soft and hard domains from equations 5.3 and 5.4 are presented
in Table 5.4 below.
Table 5.4 Phase composition from Couchman analysis (α = 1.43)
Polymer Soft Phase s
ssw shsw
Hard Phase h
hsw hssw
L-PU 0.978 0.022 1.0 0.0 B12-PUU10 0.977 0.023 0.783 0.217 B12-PUU50 0.970 0.030 0.594 0.406 B12-PUU70 0.957 0.043 0.640 0.360
B12-PUU100 0.955 0.045 0.611 0.389
The results shown in Table 5.4 suggest that the soft segment phase is nearly pure for
all compositions of the diamine. In contrast, substantial degree of mixing of soft
segments in the hard segment phase with increasing diamine incorporation was
predicted by the Couchman equations.
5.5 Small-Angle X-ray Scattering (SAXS)
Small Angle X-ray Scattering (SAXS) experiments were carried out on a
rotating anode NanoSTAR machine from Bruker AXS having three pinhole
collimation and multiwire 2-D detector. X-ray wavelength used for scanning was
1.542 Å from copper target and sample to detector distance was calibrated to 106.25
cm. A specially designed sample holder with a temperature accuracy of ± 0.1oC,
supplied by Bruker, was used to heat the sample for high temperature scattering
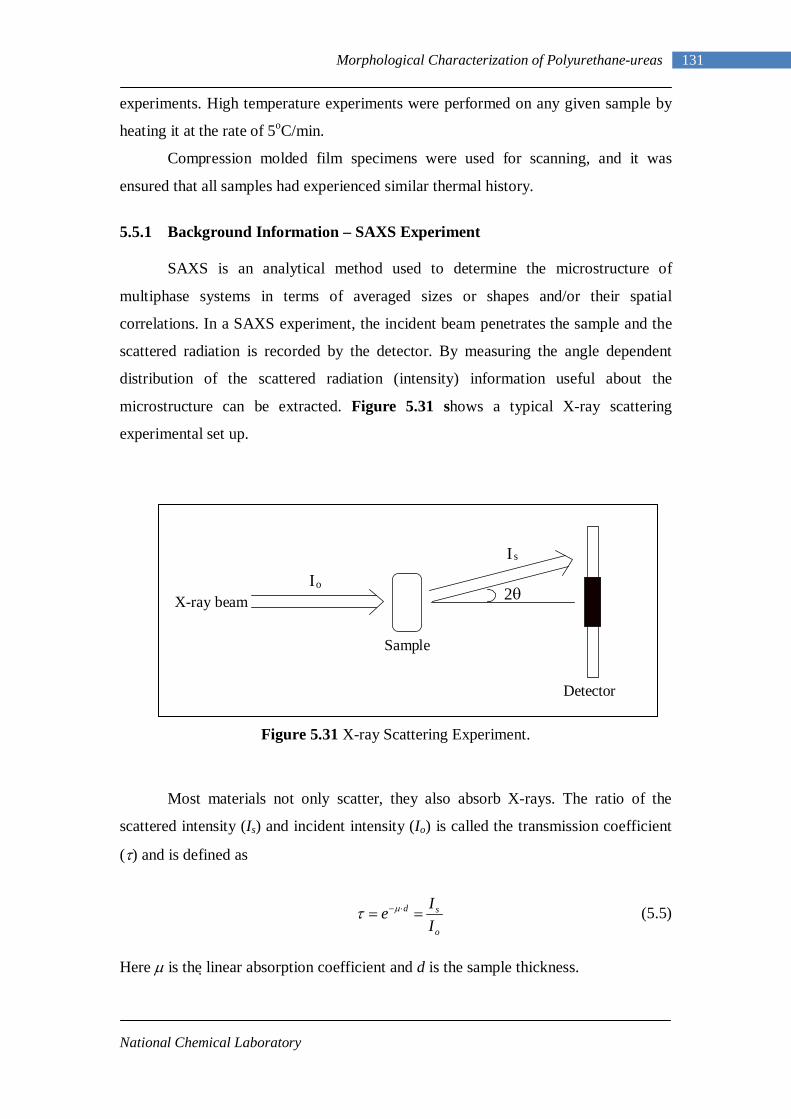
National Chemical Laboratory
131 Morphological Characterization of Polyurethane-ureas
experiments. High temperature experiments were performed on any given sample by
heating it at the rate of 5oC/min.
Compression molded film specimens were used for scanning, and it was
ensured that all samples had experienced similar thermal history.
5.5.1 Background Information – SAXS Experiment
SAXS is an analytical method used to determine the microstructure of
multiphase systems in terms of averaged sizes or shapes and/or their spatial
correlations. In a SAXS experiment, the incident beam penetrates the sample and the
scattered radiation is recorded by the detector. By measuring the angle dependent
distribution of the scattered radiation (intensity) information useful about the
microstructure can be extracted. Figure 5.31 shows a typical X-ray scattering
experimental set up.
Figure 5.31 X-ray Scattering Experiment.
Most materials not only scatter, they also absorb X-rays. The ratio of the
scattered intensity (Is) and incident intensity (Io) is called the transmission coefficient
(τ) and is defined as
o
sd
IIe == ⋅−µτ (5.5)
Here µ is the linear absorption coefficient and d is the sample thickness.
Io
I s
2θ
Detector
Sample
X-ray beam
National Chemical Laboratory
132 Morphological Characterization of Polyurethane-ureas
In order to determine the transmission coefficient for the sample (τs), the
intensity of the primary beam with and without the sample in the path must be
measured. With the present experimental facility used in this work, this is done by an
indirect method. This
method uses a glassy carbon sample, with a known transmission coefficient (τgc), as a
secondary standard to measure the transmission coefficient of sample as follows:
bgcgc
sgcgcss II
II..
ττ
τ−
−= + (5.6)
where, Igc is the scattered intensity from glassy carbon, Ib is the background (primary
beam) intensity, and Is + gc is the scattered intensity from sample and glassy carbon
held together in the beam path.
The scattered intensity that is required for SAXS data analysis is obtained after
background subtraction (I(sub.)). This step is essential as other sources such as thermal
density fluctuations, amorphous halo of the WAXS extending to small angles, etc. can
also contribute to the measured SAXS signal. In the present study this is done by
using the following formula.
bsssub III ⋅−= τ.)( (5.7)
The term SAXS signal (i.e, scattered intensity) used hereafter in the present work
implies background subtracted intensity. Since a 2D detector was used in the present
work the scattered intensity was averaged over the azimuthal angle to give I(q) versus
q data.
5.5.2 Background Information – SAXS Theory
SAXS provides extremely useful qualitative and quantitative information
about the morphology of a two phase system when there is sufficient electron density
contrast between the phases, and the domain sizes are on the order of nanometers. In
case of polyurethanes, SAXS data has been used for the measurements of interdomain
spacings, domain boundary diffuseness, and the extent of microphase separation. The
latter two measurements require detailed analyses of the data.
National Chemical Laboratory
133 Morphological Characterization of Polyurethane-ureas
The simplest of these data analyses is the estimation of average periodicity or
interdomain spacing (d) from the observed peak position (qmax), by a simple
application of the Bragg equation:
d = 2π / qmax (5.8)
where q is the modulus of the scattering vector defined as:
θλπ cos4
=q (5.9)
Here λ is the wavelength of the X-rays and the scattering angle is 2θ.
As noted in Chapter 3 the polymers studied in this work have an equivalent
amount of hard and soft segments. Based on studies on microphase morphologies in
diblock copolymers17 it is reasonable to assume that polyurethanes with equivalent
hard and soft segments are likely to have lamellar domains of hard segments
dispersed in soft segment phase. For such morphology the SAXS intensity is Lorentz
corrected to estimate the average periodicity / mean interdomain spacing. In the
present work d was estimated from the Lorentz corrected scattering intensity (i.e.,
using qmax from the plot of Iq2 vs q). However, the difference between the d values
calculated with and without Lorentz correction was found to be small.
For isotropic systems, scattering depends on q as:
I(q) = n. P(q).S(q) (5.10)
In eq (5.10) n is a constant which becomes important when the mass or the surface of
the particle is investigated. For this I(q) must be in absolute units. The form factor
P(q) describes the scattering observable from an isolated body in the absence of
interference effects and depends on the particle size, shape, and internal structure of
the particle. S(q) is the structure factor, which represents the effects of interference
due to neighboring scatterers and depends on their relative positions. It bears the
information about particle interaction, such as inter-particle distances and degree of
ordering. P(q) and S(q) can be studied even when I(q) is in arbitrary units, because the
information content lies in the q dependence only.
For the present purpose, we will regard polyurethane as a two phase system
with volume fractions of the two phases denoted by φ1, φ2 and average electron
National Chemical Laboratory
134 Morphological Characterization of Polyurethane-ureas
densities of the two phases denoted by ρ1 and ρ2. The invariant for an ideal system
with constant phase densities and sharp interfaces is given by
( )2
21212
max 2 ρρφφπ −=Q (5.11)
If ρ1 and ρ2 are equal, the x-ray beam does not ‘see’ the heterogeneity. The visibility
increases with increasing difference in the electron densities between the two phases.
Scattering from a heterogeneous system, such as polyurethane, is given by
∫∞
∆=0
22 )sin()(4)(
)( drqr
qrrrqVI
qI
e
γρπ (5.12)
where scattering intensity I(q) is normalized by sample volume V and single electron
scattering function Ie (q), 2ρ∆ is the mean square amplitude of electron density
fluctuations, and γ (r) is the density correlation function which carries information
about the spatial extent of the heterogeneity. The invariant Q is the integral of the
Lorentz corrected intensity
∫∞
∆==0
222 2d)(
)( ρπqqVI
qIqQe
(5.13)
The ratio of invariants Q/Qmax has been used as a measure of the extent of
microphase separation in polyurethanes. The ratio of invariants close to 1 indicates a
good microphase separation, whereas a value much less than 1 is indicative of
microphase mixing either at the interface or in the bulk. For polyurethanes the value
of this ratio has been reported to be less than 0.5.
SAXS data can also be employed to obtain valuable information about the
width of interfaces in biphasic systems. Small-angle X-ray scattering by an ideal two
phase system (i.e. system having sharp interfaces, and constant electron density within
each phase), as illustrated in Figure 5.32 (A), has been treated by Porod. For such
systems Porod’s law states that the scattered intensity decreases with the reciprocal
fourth power of the scattering vector q:
[ ] 4)(limqK
qI p
q=
∞→ (5.14)
National Chemical Laboratory
135 Morphological Characterization of Polyurethane-ureas
where Kp is called as Porod constant. In other words, at high angles the product I(q)q4
reaches a constant value, Kp, which is related to the interfacial area in the system.
Real multiphasic polymeric systems contain thermal density fluctuations and
diffuse phase boundaries which lead to deviations from the Porod law. The presence
of thermal density fluctuations or mixing within the phases, illustrated in Figure 5.32
(B), typically leads to enhanced scattering at high angles that is independent of the
scattering vector. Therefore a plot of Iq4 vs q2 tends to have positive slope. This is
called as a positive deviation from Porod’s law.
In the case of a diffuse boundary assuming that the boundary is characterized
by sigmoidal concentration (density) gradient, the Porod law can be modified as:
( ) ( )2224 4exp q
qK
qI p σπ−= (5.15)
For typical values of q the exponential decay can be approximated by retaining only
the first term in the series expansion of the exponential. This gives a negative slope to
the Iq4 vs q2 plot, and is known as negative deviation from Porod’s law (Figure 5.32
(C)). The net scattering from real multiphase systems is given by
( ) ( ) bp Iq
qK
qI +−= 2224 4exp σπ (5.16)
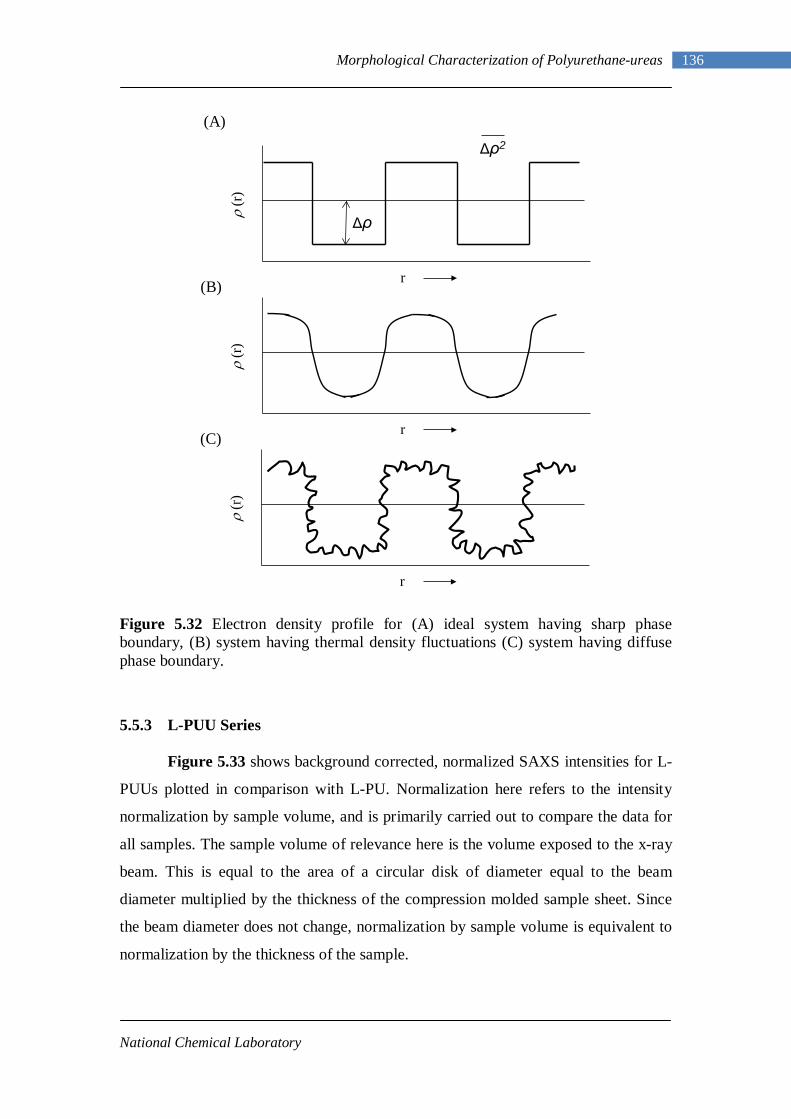
National Chemical Laboratory
136 Morphological Characterization of Polyurethane-ureas
(A)
(B)
(C)
Figure 5.32 Electron density profile for (A) ideal system having sharp phase boundary, (B) system having thermal density fluctuations (C) system having diffuse phase boundary.
5.5.3 L-PUU Series
Figure 5.33 shows background corrected, normalized SAXS intensities for L-
PUUs plotted in comparison with L-PU. Normalization here refers to the intensity
normalization by sample volume, and is primarily carried out to compare the data for
all samples. The sample volume of relevance here is the volume exposed to the x-ray
beam. This is equal to the area of a circular disk of diameter equal to the beam
diameter multiplied by the thickness of the compression molded sample sheet. Since
the beam diameter does not change, normalization by sample volume is equivalent to
normalization by the thickness of the sample.
ρ(r
)
r
Δρ
Δρ2
ρ(r
)
r
ρ(r
)
r
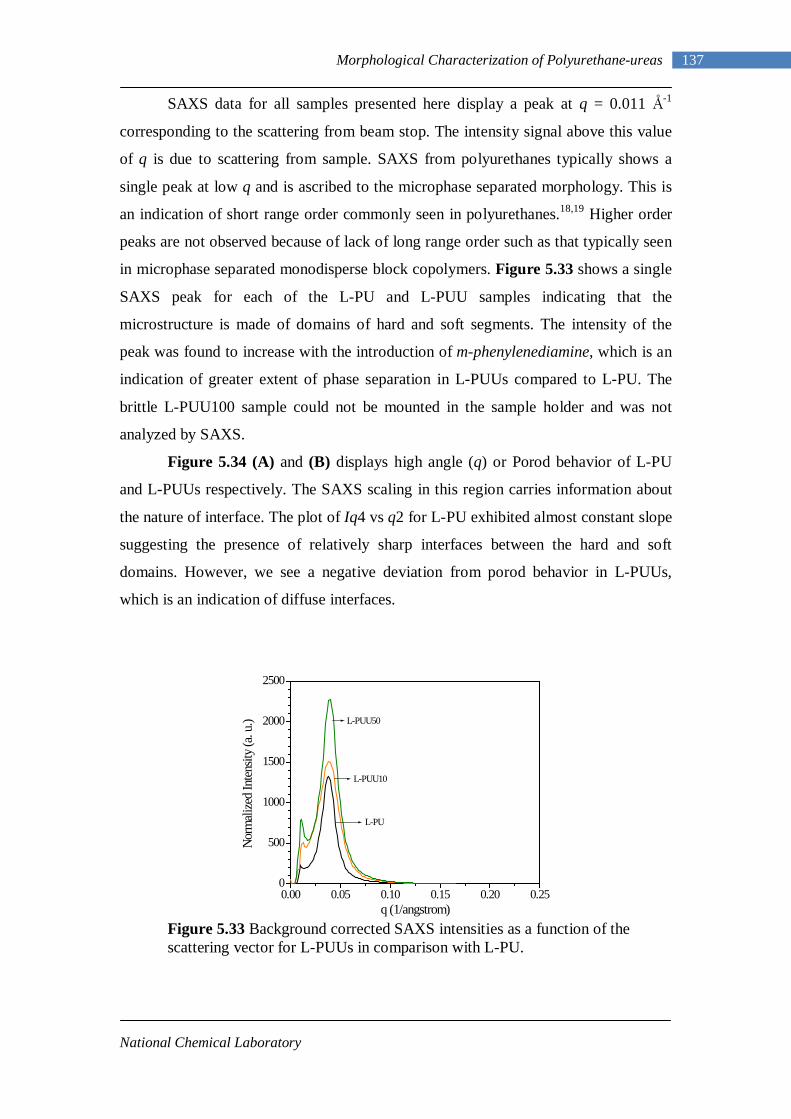
National Chemical Laboratory
137 Morphological Characterization of Polyurethane-ureas
SAXS data for all samples presented here display a peak at q = 0.011 Å-1
corresponding to the scattering from beam stop. The intensity signal above this value
of q is due to scattering from sample. SAXS from polyurethanes typically shows a
single peak at low q and is ascribed to the microphase separated morphology. This is
an indication of short range order commonly seen in polyurethanes.18,19 Higher order
peaks are not observed because of lack of long range order such as that typically seen
in microphase separated monodisperse block copolymers. Figure 5.33 shows a single
SAXS peak for each of the L-PU and L-PUU samples indicating that the
microstructure is made of domains of hard and soft segments. The intensity of the
peak was found to increase with the introduction of m-phenylenediamine, which is an
indication of greater extent of phase separation in L-PUUs compared to L-PU. The
brittle L-PUU100 sample could not be mounted in the sample holder and was not
analyzed by SAXS.
Figure 5.34 (A) and (B) displays high angle (q) or Porod behavior of L-PU
and L-PUUs respectively. The SAXS scaling in this region carries information about
the nature of interface. The plot of Iq4 vs q2 for L-PU exhibited almost constant slope
suggesting the presence of relatively sharp interfaces between the hard and soft
domains. However, we see a negative deviation from porod behavior in L-PUUs,
which is an indication of diffuse interfaces.
Figure 5.33 Background corrected SAXS intensities as a function of the scattering vector for L-PUUs in comparison with L-PU.
0.00 0.05 0.10 0.15 0.20 0.250
500
1000
1500
2000
2500
L-PU
L-PUU50
L-PUU10
Norm
alize
d In
tensit
y (a.
u.)
q (1/angstrom)
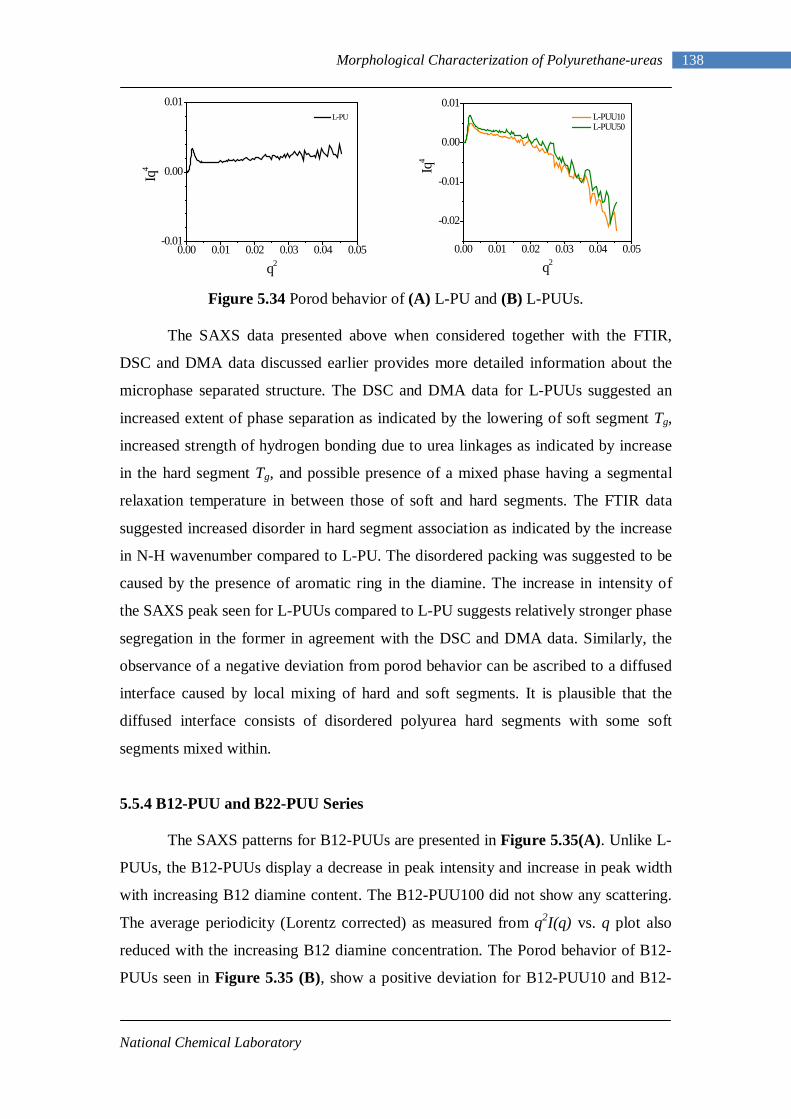
National Chemical Laboratory
138 Morphological Characterization of Polyurethane-ureas
Figure 5.34 Porod behavior of (A) L-PU and (B) L-PUUs.
The SAXS data presented above when considered together with the FTIR,
DSC and DMA data discussed earlier provides more detailed information about the
microphase separated structure. The DSC and DMA data for L-PUUs suggested an
increased extent of phase separation as indicated by the lowering of soft segment Tg,
increased strength of hydrogen bonding due to urea linkages as indicated by increase
in the hard segment Tg, and possible presence of a mixed phase having a segmental
relaxation temperature in between those of soft and hard segments. The FTIR data
suggested increased disorder in hard segment association as indicated by the increase
in N-H wavenumber compared to L-PU. The disordered packing was suggested to be
caused by the presence of aromatic ring in the diamine. The increase in intensity of
the SAXS peak seen for L-PUUs compared to L-PU suggests relatively stronger phase
segregation in the former in agreement with the DSC and DMA data. Similarly, the
observance of a negative deviation from porod behavior can be ascribed to a diffused
interface caused by local mixing of hard and soft segments. It is plausible that the
diffused interface consists of disordered polyurea hard segments with some soft
segments mixed within.
5.5.4 B12-PUU and B22-PUU Series
The SAXS patterns for B12-PUUs are presented in Figure 5.35(A). Unlike L-
PUUs, the B12-PUUs display a decrease in peak intensity and increase in peak width
with increasing B12 diamine content. The B12-PUU100 did not show any scattering.
The average periodicity (Lorentz corrected) as measured from q2I(q) vs. q plot also
reduced with the increasing B12 diamine concentration. The Porod behavior of B12-
PUUs seen in Figure 5.35 (B), show a positive deviation for B12-PUU10 and B12-
0.00 0.01 0.02 0.03 0.04 0.05-0.01
0.00
0.01 L-PU
q2
Iq4
0.00 0.01 0.02 0.03 0.04 0.05
-0.02
-0.01
0.00
0.01 L-PUU10 L-PUU50
Iq4
q2
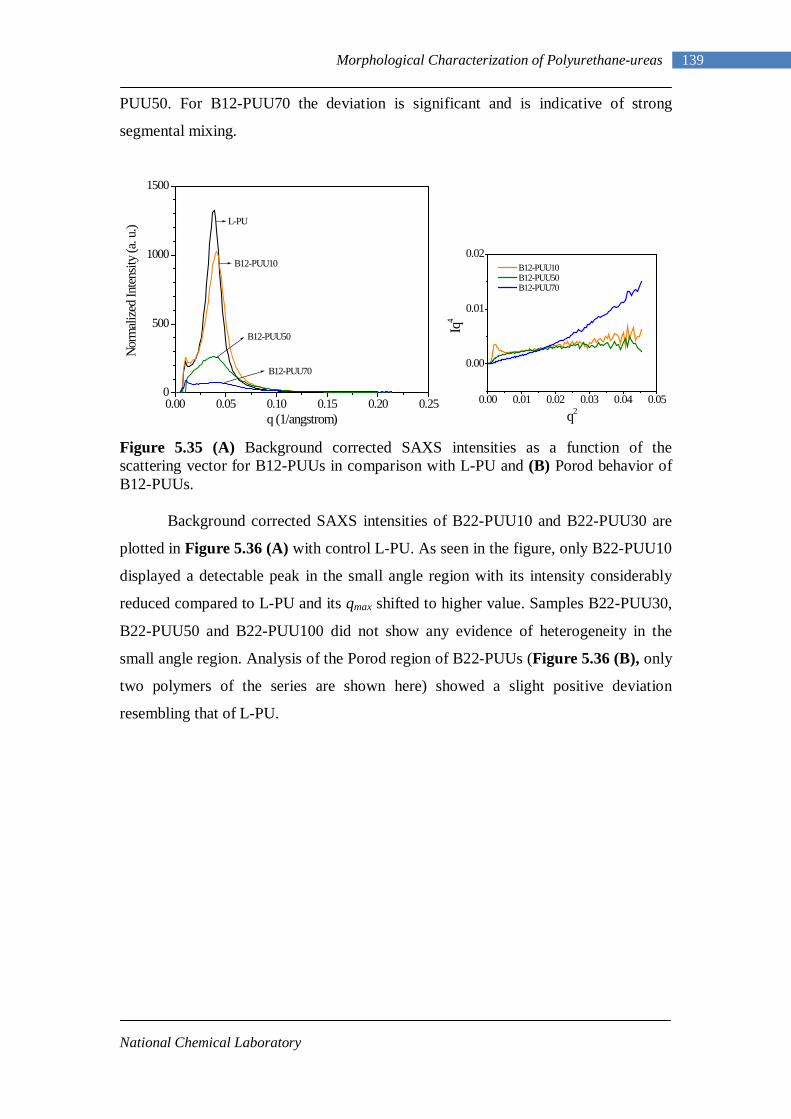
National Chemical Laboratory
139 Morphological Characterization of Polyurethane-ureas
PUU50. For B12-PUU70 the deviation is significant and is indicative of strong
segmental mixing.
Figure 5.35 (A) Background corrected SAXS intensities as a function of the scattering vector for B12-PUUs in comparison with L-PU and (B) Porod behavior of B12-PUUs.
Background corrected SAXS intensities of B22-PUU10 and B22-PUU30 are
plotted in Figure 5.36 (A) with control L-PU. As seen in the figure, only B22-PUU10
displayed a detectable peak in the small angle region with its intensity considerably
reduced compared to L-PU and its qmax shifted to higher value. Samples B22-PUU30,
B22-PUU50 and B22-PUU100 did not show any evidence of heterogeneity in the
small angle region. Analysis of the Porod region of B22-PUUs (Figure 5.36 (B), only
two polymers of the series are shown here) showed a slight positive deviation
resembling that of L-PU.
0.00 0.05 0.10 0.15 0.20 0.250
500
1000
1500
B12-PUU70
B12-PUU50
B12-PUU10
L-PU
Norm
alize
d In
tensit
y (a.
u.)
q (1/angstrom)0.00 0.01 0.02 0.03 0.04 0.05
0.00
0.01
0.02 B12-PUU10 B12-PUU50 B12-PUU70
Iq4
q2
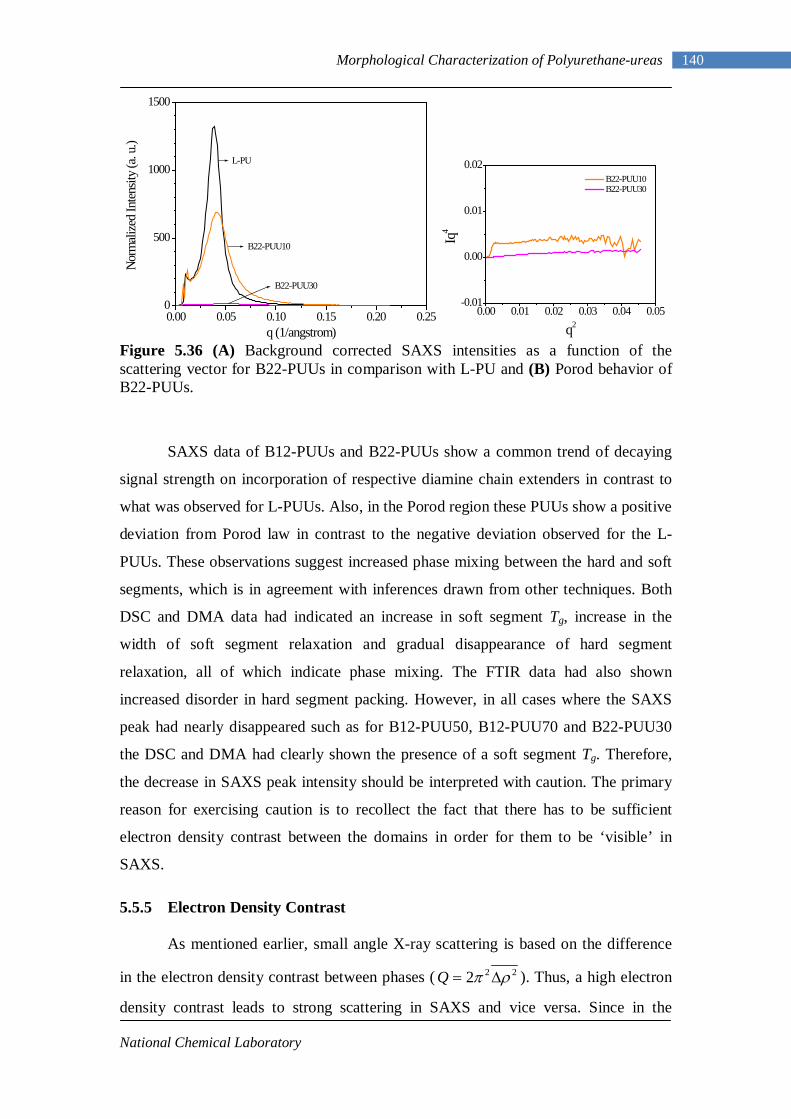
National Chemical Laboratory
140 Morphological Characterization of Polyurethane-ureas
Figure 5.36 (A) Background corrected SAXS intensities as a function of the scattering vector for B22-PUUs in comparison with L-PU and (B) Porod behavior of B22-PUUs.
SAXS data of B12-PUUs and B22-PUUs show a common trend of decaying
signal strength on incorporation of respective diamine chain extenders in contrast to
what was observed for L-PUUs. Also, in the Porod region these PUUs show a positive
deviation from Porod law in contrast to the negative deviation observed for the L-
PUUs. These observations suggest increased phase mixing between the hard and soft
segments, which is in agreement with inferences drawn from other techniques. Both
DSC and DMA data had indicated an increase in soft segment Tg, increase in the
width of soft segment relaxation and gradual disappearance of hard segment
relaxation, all of which indicate phase mixing. The FTIR data had also shown
increased disorder in hard segment packing. However, in all cases where the SAXS
peak had nearly disappeared such as for B12-PUU50, B12-PUU70 and B22-PUU30
the DSC and DMA had clearly shown the presence of a soft segment Tg. Therefore,
the decrease in SAXS peak intensity should be interpreted with caution. The primary
reason for exercising caution is to recollect the fact that there has to be sufficient
electron density contrast between the domains in order for them to be ‘visible’ in
SAXS.
5.5.5 Electron Density Contrast
As mentioned earlier, small angle X-ray scattering is based on the difference
in the electron density contrast between phases ( 222 ρπ ∆=Q ). Thus, a high electron
density contrast leads to strong scattering in SAXS and vice versa. Since in the
0.00 0.05 0.10 0.15 0.20 0.250
500
1000
1500
B22-PUU30
B22-PUU10
L-PU
Norm
alize
d In
tensit
y (a.
u.)
q (1/angstrom)0.00 0.01 0.02 0.03 0.04 0.05
-0.01
0.00
0.01
0.02 B22-PUU10 B22-PUU30
q2
Iq4
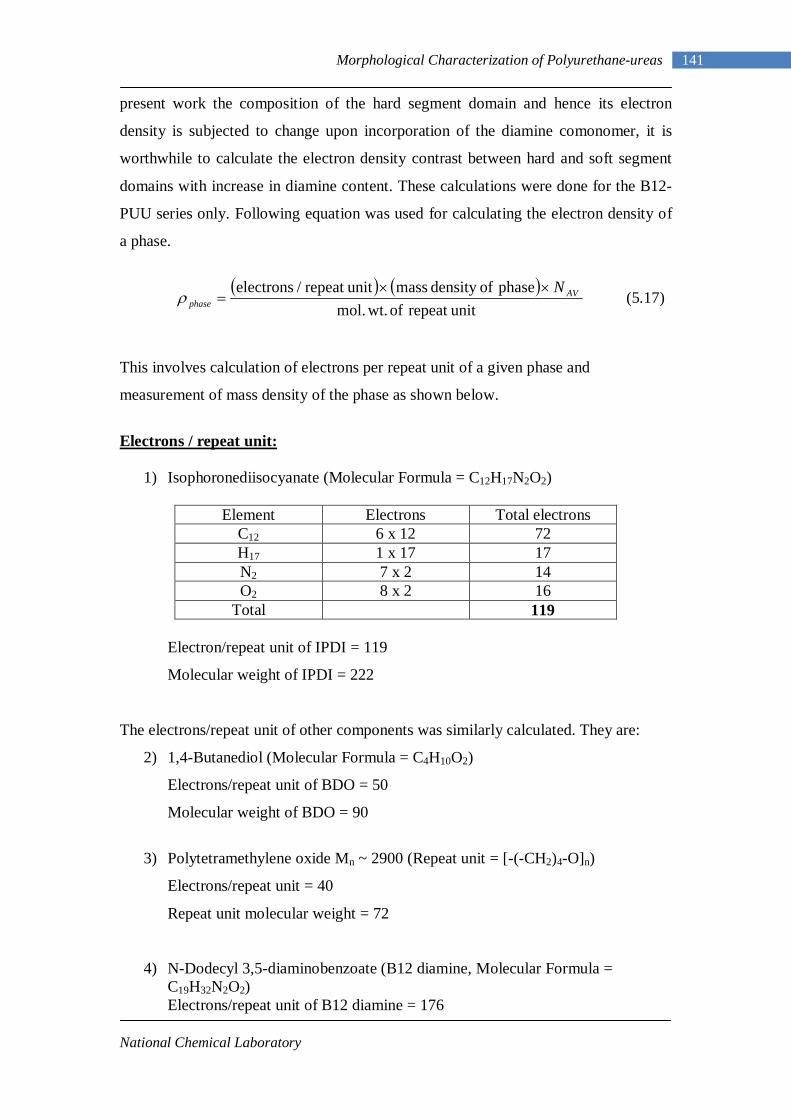
National Chemical Laboratory
141 Morphological Characterization of Polyurethane-ureas
present work the composition of the hard segment domain and hence its electron
density is subjected to change upon incorporation of the diamine comonomer, it is
worthwhile to calculate the electron density contrast between hard and soft segment
domains with increase in diamine content. These calculations were done for the B12-
PUU series only. Following equation was used for calculating the electron density of
a phase.
( ) ( )
unitrepeat of wt.mol.phase ofdensity massunitrepeat / electrons AV
phaseN××
=ρ (5.17)
This involves calculation of electrons per repeat unit of a given phase and
measurement of mass density of the phase as shown below.
1) Isophoronediisocyanate (Molecular Formula = C12H17N2O2)
Electrons / repeat unit:
Element Electrons Total electrons
C12 6 x 12 72 H17 1 x 17 17 N2 7 x 2 14 O2 8 x 2 16
Total 119 Electron/repeat unit of IPDI = 119
Molecular weight of IPDI = 222
The electrons/repeat unit of other components was similarly calculated. They are:
2) 1,4-Butanediol (Molecular Formula = C4H10O2)
Electrons/repeat unit of BDO = 50
Molecular weight of BDO = 90
3) Polytetramethylene oxide Mn ~ 2900 (Repeat unit = [-(-CH2)4-O]n)
Electrons/repeat unit = 40
Repeat unit molecular weight = 72
4) N-Dodecyl 3,5-diaminobenzoate (B12 diamine, Molecular Formula = C19H32N2O2) Electrons/repeat unit of B12 diamine = 176
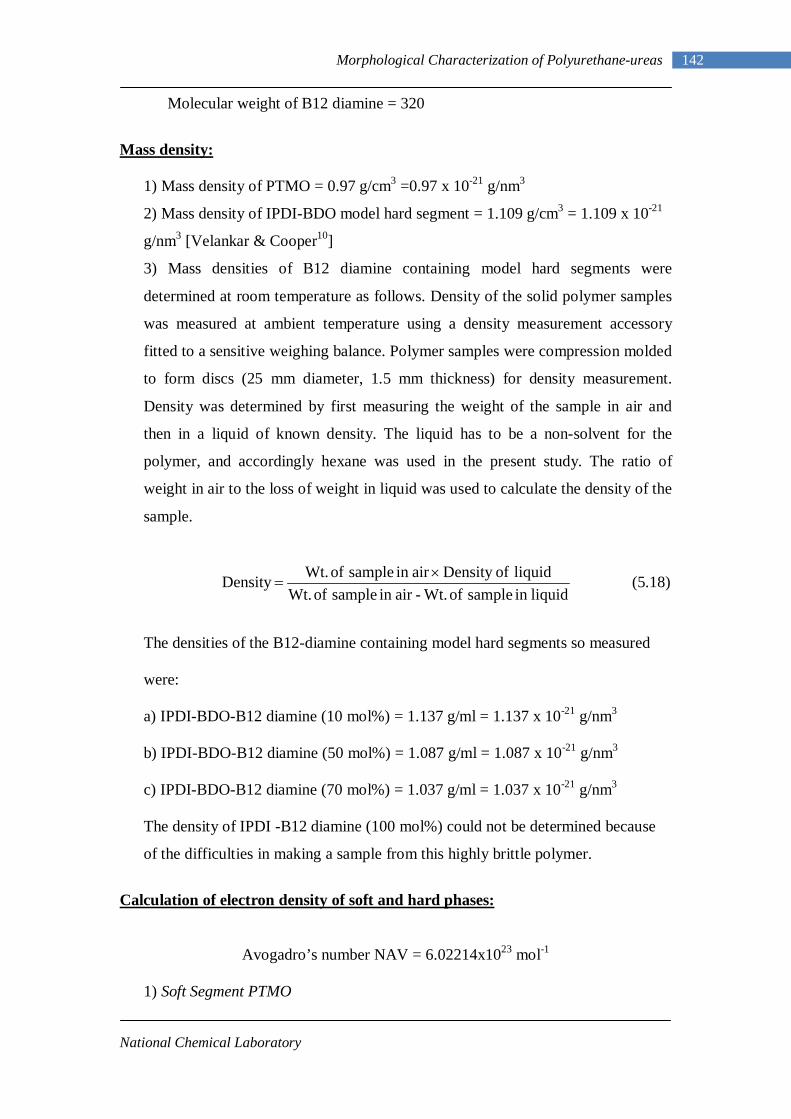
National Chemical Laboratory
142 Morphological Characterization of Polyurethane-ureas
Molecular weight of B12 diamine = 320
3) Mass densities of B12 diamine containing model hard segments were
determined at room temperature as follows. Density of the solid polymer samples
was measured at ambient temperature using a density measurement accessory
fitted to a sensitive weighing balance. Polymer samples were compression molded
to form discs (25 mm diameter, 1.5 mm thickness) for density measurement.
Density was determined by first measuring the weight of the sample in air and
then in a liquid of known density. The liquid has to be a non-solvent for the
polymer, and accordingly hexane was used in the present study. The ratio of
weight in air to the loss of weight in liquid was used to calculate the density of the
sample.
Mass density:
1) Mass density of PTMO = 0.97 g/cm3 =0.97 x 10⁻²¹ g/nm3
2) Mass density of IPDI-BDO model hard segment = 1.109 g/cm3 = 1.109 x 10⁻²¹
g/nm3 [Velankar & Cooper10]
liquidin sample of Wt.-air in sample of Wt.
liquid ofDensity air in sample of Wt. Density ×= (5.18)
The densities of the B12-diamine containing model hard segments so measured
were:
a) IPDI-BDO-B12 diamine (10 mol%) = 1.137 g/ml = 1.137 x 10⁻²¹ g/nm3
b) IPDI-BDO-B12 diamine (50 mol%) = 1.087 g/ml = 1.087 x 10⁻²¹ g/nm3
c) IPDI-BDO-B12 diamine (70 mol%) = 1.037 g/ml = 1.037 x 10⁻²¹ g/nm3
The density of IPDI -B12 diamine (100 mol%) could not be determined because
of the difficulties in making a sample from this highly brittle polymer.
Calculation of electron density of soft and hard phases:
Avogadro’s number NAV = 6.02214x10²³ mol-1
1) Soft Segment PTMO
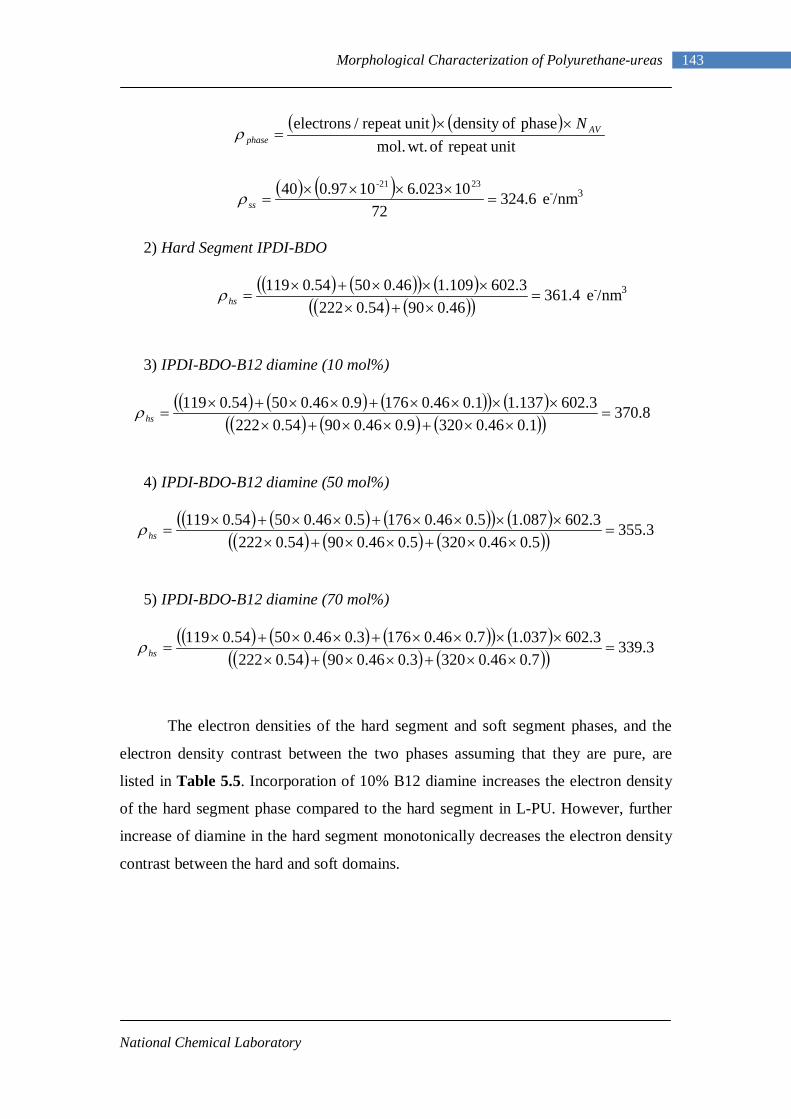
National Chemical Laboratory
143 Morphological Characterization of Polyurethane-ureas
( ) ( )
unitrepeat of wt.mol.phase ofdensity unitrepeat / electrons AV
phaseN××
=ρ
( ) ( ) 6.32472
10023.6100.9740 23-21
=××××
=ssρ e-/nm3
2) Hard Segment IPDI-BDO
( ) ( )( ) ( )
( ) ( )( ) 4.3610.46900.54222
3.6021.10946.0500.54119=
×+××××+×
=hsρ e-/nm3
3) IPDI-BDO-B12 diamine (10 mol%)
( ) ( ) ( )( ) ( )( ) ( ) ( )( ) 8.370
0.10.463200.90.46900.542223.6021.1371.046.01769.046.0500.54119
=××+××+×
××××+××+×=hsρ
4) IPDI-BDO-B12 diamine (50 mol%)
( ) ( ) ( )( ) ( )( ) ( ) ( )( ) 3.355
0.50.463200.50.46900.542223.6021.0875.046.01765.046.0500.54119
=××+××+×
××××+××+×=hsρ
5) IPDI-BDO-B12 diamine (70 mol%)
( ) ( ) ( )( ) ( )( ) ( ) ( )( ) 3.339
0.70.463200.30.46900.542223.6021.0377.046.01763.046.0500.54119
=××+××+×
××××+××+×=hsρ
The electron densities of the hard segment and soft segment phases, and the
electron density contrast between the two phases assuming that they are pure, are
listed in Table 5.5. Incorporation of 10% B12 diamine increases the electron density
of the hard segment phase compared to the hard segment in L-PU. However, further
increase of diamine in the hard segment monotonically decreases the electron density
contrast between the hard and soft domains.
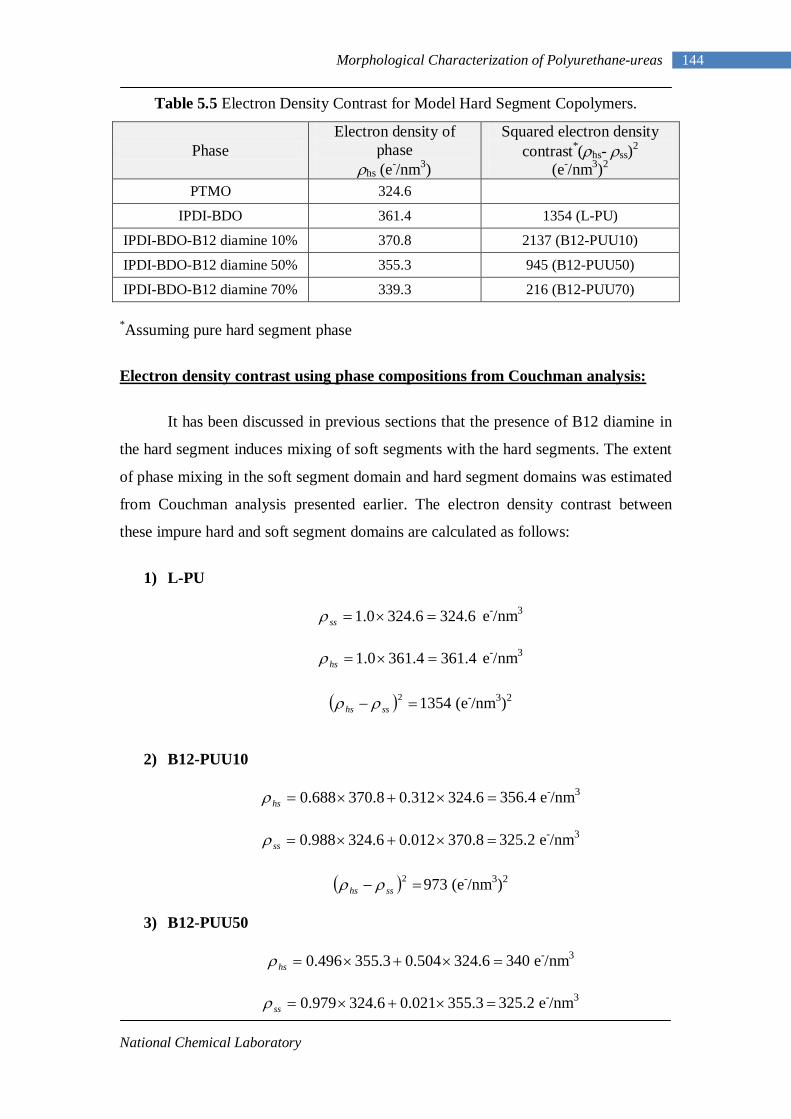
National Chemical Laboratory
144 Morphological Characterization of Polyurethane-ureas
Table 5.5 Electron Density Contrast for Model Hard Segment Copolymers.
Phase Electron density of
phase ρhs (e-/nm3)
Squared electron density contrast*(ρhs- ρss)2
(e-/nm3)2
PTMO 324.6
IPDI-BDO 361.4 1354 (L-PU)
IPDI-BDO-B12 diamine 10% 370.8 2137 (B12-PUU10)
IPDI-BDO-B12 diamine 50% 355.3 945 (B12-PUU50)
IPDI-BDO-B12 diamine 70% 339.3 216 (B12-PUU70)
*Assuming pure hard segment phase
1) L-PU
Electron density contrast using phase compositions from Couchman analysis:
It has been discussed in previous sections that the presence of B12 diamine in
the hard segment induces mixing of soft segments with the hard segments. The extent
of phase mixing in the soft segment domain and hard segment domains was estimated
from Couchman analysis presented earlier. The electron density contrast between
these impure hard and soft segment domains are calculated as follows:
6.3246.3240.1 =×=ssρ e-/nm3
4.3614.3610.1 =×=hsρ e-/nm3
( ) =− 2sshs ρρ 1354 (e-/nm3)2
2) B12-PUU10
=×+×= 6.324312.08.370688.0hsρ 356.4 e-/nm3
=×+×= 8.370012.06.324988.0ssρ 325.2 e-/nm3
( ) =− 2sshs ρρ 973 (e-/nm3)2
3) B12-PUU50
=×+×= 6.324504.03.355496.0hsρ 340 e-/nm3
=×+×= 3.355021.06.324979.0ssρ 325.2 e-/nm3
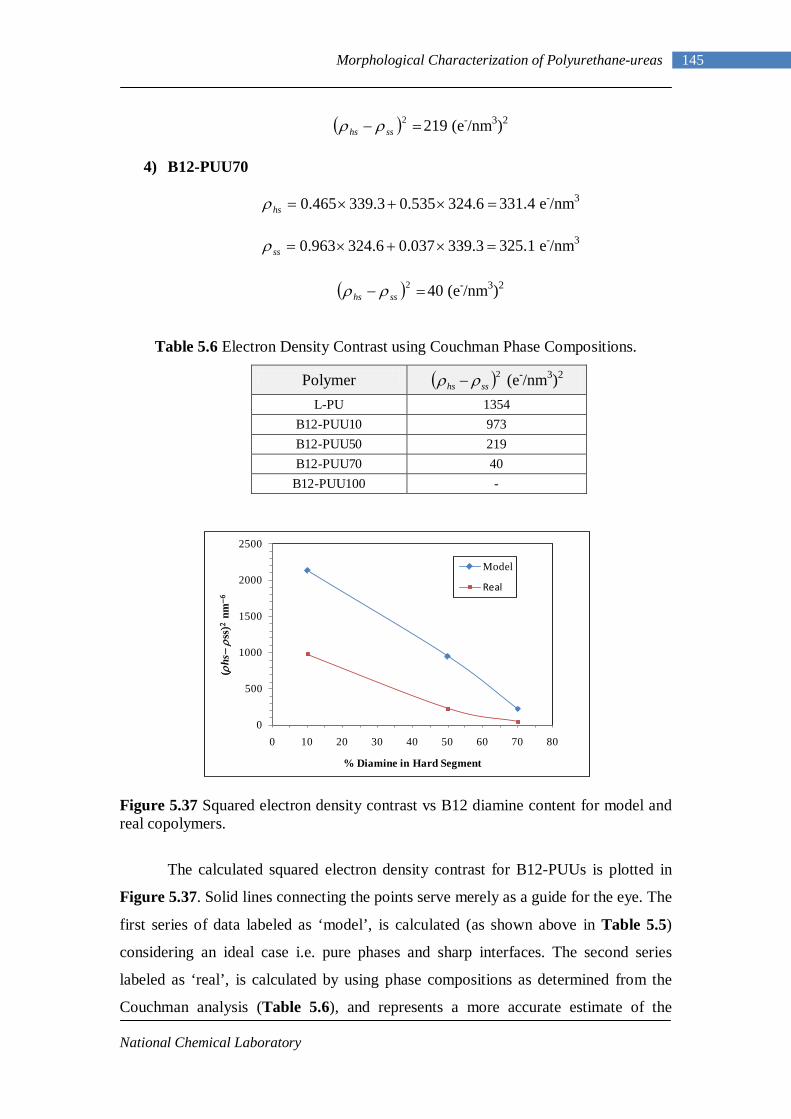
National Chemical Laboratory
145 Morphological Characterization of Polyurethane-ureas
( ) =− 2
sshs ρρ 219 (e-/nm3)2
4) B12-PUU70
=×+×= 6.324535.03.339465.0hsρ 331.4 e-/nm3
=×+×= 3.339037.06.324963.0ssρ 325.1 e-/nm3
( ) =− 2sshs ρρ 40 (e-/nm3)2
Table 5.6 Electron Density Contrast using Couchman Phase Compositions.
Polymer ( )2sshs ρρ − (e-/nm3)2
L-PU 1354 B12-PUU10 973 B12-PUU50 219 B12-PUU70 40
B12-PUU100 -
Figure 5.37 Squared electron density contrast vs B12 diamine content for model and real copolymers.
The calculated squared electron density contrast for B12-PUUs is plotted in
Figure 5.37. Solid lines connecting the points serve merely as a guide for the eye. The
first series of data labeled as ‘model’, is calculated (as shown above in Table 5.5)
considering an ideal case i.e. pure phases and sharp interfaces. The second series
labeled as ‘real’, is calculated by using phase compositions as determined from the
Couchman analysis (Table 5.6), and represents a more accurate estimate of the
0
500
1000
1500
2000
2500
0 10 20 30 40 50 60 70 80
(ρhs
−ρs
s)2
nm−
6
% Diamine in Hard Segment
Model
Real
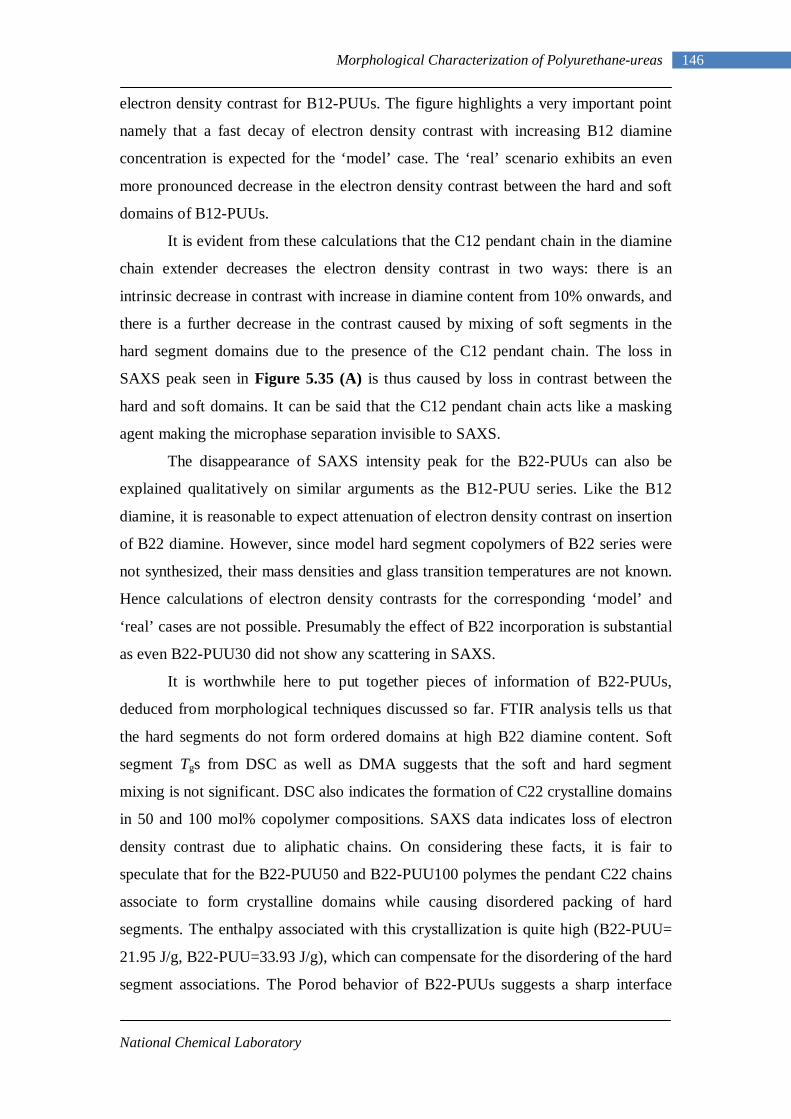
National Chemical Laboratory
146 Morphological Characterization of Polyurethane-ureas
electron density contrast for B12-PUUs. The figure highlights a very important point
namely that a fast decay of electron density contrast with increasing B12 diamine
concentration is expected for the ‘model’ case. The ‘real’ scenario exhibits an even
more pronounced decrease in the electron density contrast between the hard and soft
domains of B12-PUUs.
It is evident from these calculations that the C12 pendant chain in the diamine
chain extender decreases the electron density contrast in two ways: there is an
intrinsic decrease in contrast with increase in diamine content from 10% onwards, and
there is a further decrease in the contrast caused by mixing of soft segments in the
hard segment domains due to the presence of the C12 pendant chain. The loss in
SAXS peak seen in Figure 5.35 (A) is thus caused by loss in contrast between the
hard and soft domains. It can be said that the C12 pendant chain acts like a masking
agent making the microphase separation invisible to SAXS.
The disappearance of SAXS intensity peak for the B22-PUUs can also be
explained qualitatively on similar arguments as the B12-PUU series. Like the B12
diamine, it is reasonable to expect attenuation of electron density contrast on insertion
of B22 diamine. However, since model hard segment copolymers of B22 series were
not synthesized, their mass densities and glass transition temperatures are not known.
Hence calculations of electron density contrasts for the corresponding ‘model’ and
‘real’ cases are not possible. Presumably the effect of B22 incorporation is substantial
as even B22-PUU30 did not show any scattering in SAXS.
It is worthwhile here to put together pieces of information of B22-PUUs,
deduced from morphological techniques discussed so far. FTIR analysis tells us that
the hard segments do not form ordered domains at high B22 diamine content. Soft
segment Tgs from DSC as well as DMA suggests that the soft and hard segment
mixing is not significant. DSC also indicates the formation of C22 crystalline domains
in 50 and 100 mol% copolymer compositions. SAXS data indicates loss of electron
density contrast due to aliphatic chains. On considering these facts, it is fair to
speculate that for the B22-PUU50 and B22-PUU100 polymes the pendant C22 chains
associate to form crystalline domains while causing disordered packing of hard
segments. The enthalpy associated with this crystallization is quite high (B22-PUU=
21.95 J/g, B22-PUU=33.93 J/g), which can compensate for the disordering of the hard
segment associations. The Porod behavior of B22-PUUs suggests a sharp interface
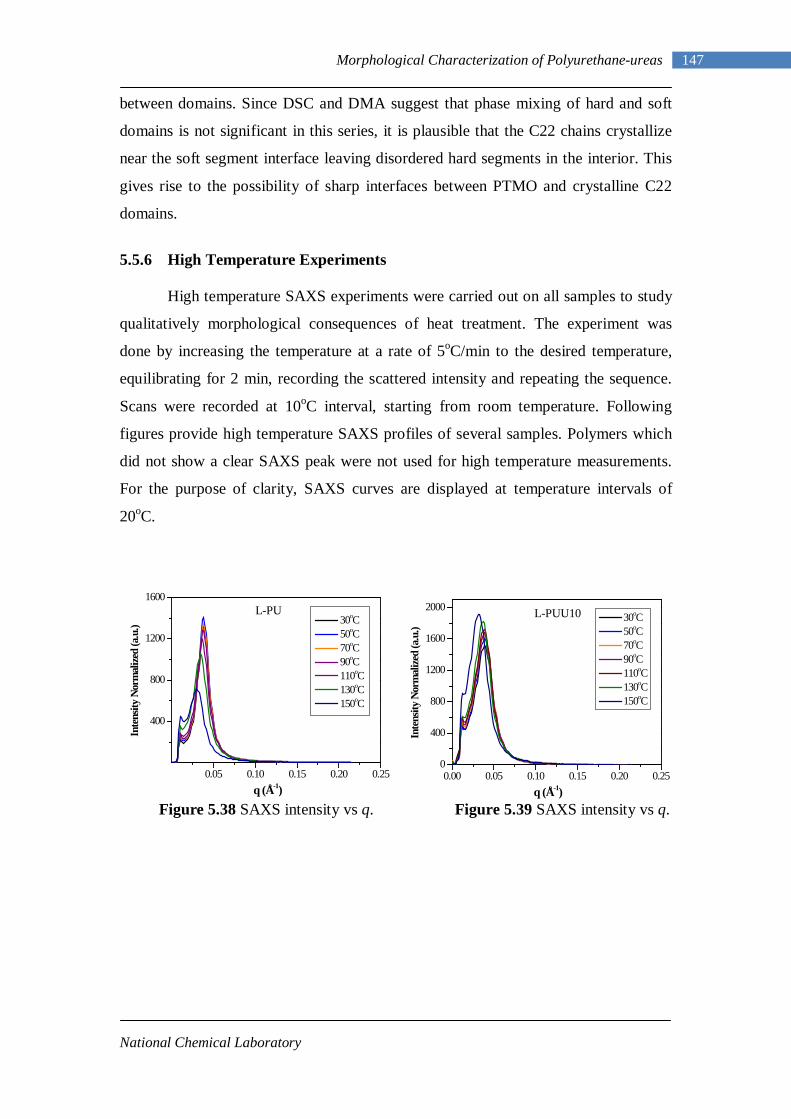
National Chemical Laboratory
147 Morphological Characterization of Polyurethane-ureas
between domains. Since DSC and DMA suggest that phase mixing of hard and soft
domains is not significant in this series, it is plausible that the C22 chains crystallize
near the soft segment interface leaving disordered hard segments in the interior. This
gives rise to the possibility of sharp interfaces between PTMO and crystalline C22
domains.
5.5.6 High Temperature Experiments
High temperature SAXS experiments were carried out on all samples to study
qualitatively morphological consequences of heat treatment. The experiment was
done by increasing the temperature at a rate of 5oC/min to the desired temperature,
equilibrating for 2 min, recording the scattered intensity and repeating the sequence.
Scans were recorded at 10oC interval, starting from room temperature. Following
figures provide high temperature SAXS profiles of several samples. Polymers which
did not show a clear SAXS peak were not used for high temperature measurements.
For the purpose of clarity, SAXS curves are displayed at temperature intervals of
20oC.
Figure 5.38 SAXS intensity vs q. Figure 5.39 SAXS intensity vs q.
0.05 0.10 0.15 0.20 0.25
400
800
1200
1600
o
Inte
nsity
Nor
mal
ized
(a.u
.)
q (A-1)
30oC 50oC 70oC 90oC 110oC 130oC 150oC
0.00 0.05 0.10 0.15 0.20 0.250
400
800
1200
1600
2000 30oC 50oC 70oC 90oC 110oC 130oC 150oC
o
Inte
nsity
Nor
mal
ized
(a.u
.)
q (A-1)
L-PU L-PUU10
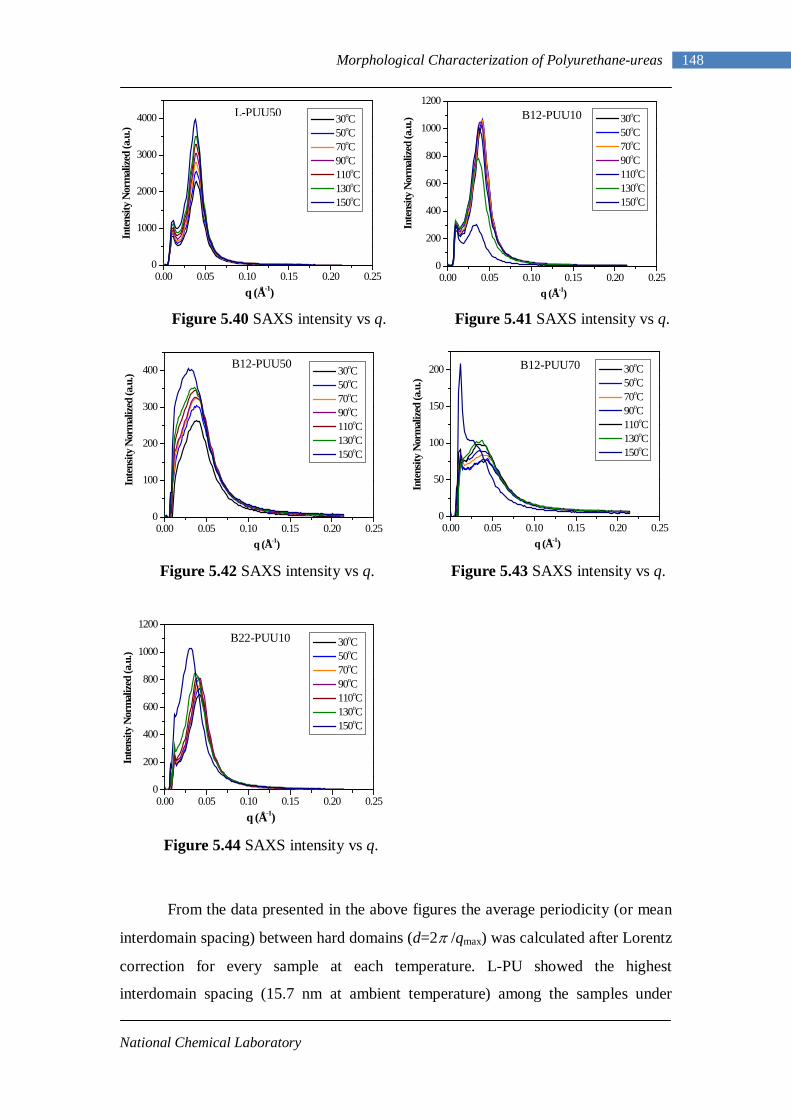
National Chemical Laboratory
148 Morphological Characterization of Polyurethane-ureas
Figure 5.40 SAXS intensity vs q. Figure 5.41 SAXS intensity vs q.
Figure 5.42 SAXS intensity vs q. Figure 5.43 SAXS intensity vs q.
Figure 5.44 SAXS intensity vs q.
From the data presented in the above figures the average periodicity (or mean
interdomain spacing) between hard domains (d=2π /qmax) was calculated after Lorentz
correction for every sample at each temperature. L-PU showed the highest
interdomain spacing (15.7 nm at ambient temperature) among the samples under
0.00 0.05 0.10 0.15 0.20 0.250
1000
2000
3000
4000 30oC 50oC 70oC 90oC 110oC 130oC 150oC
o
Inte
nsity
Nor
mal
ized
(a.u
.)
q (A-1)0.00 0.05 0.10 0.15 0.20 0.25
0
200
400
600
800
1000
1200
30oC 50oC 70oC 90oC 110oC 130oC 150oC
o
Inte
nsity
Nor
mal
ized
(a.u
.)
q (A-1)
0.00 0.05 0.10 0.15 0.20 0.250
100
200
300
400 30oC 50oC 70oC 90oC 110oC 130oC 150oC
o
Inte
nsity
Nor
mal
ized
(a.u
.)
q (A-1)0.00 0.05 0.10 0.15 0.20 0.25
0
50
100
150
200 30oC 50oC 70oC 90oC 110oC 130oC 150oC
o
Inte
nsity
Nor
mal
ized
(a.u
.)
q (A-1)
0.00 0.05 0.10 0.15 0.20 0.250
200
400
600
800
1000
1200
30oC 50oC 70oC 90oC 110oC 130oC 150oC
o
Inte
nsity
Nor
mal
ized
(a.u
.)
q (A-1)
L-PUU50 B12-PUU10
B12-PUU50 B12-PUU70
B22-PUU10
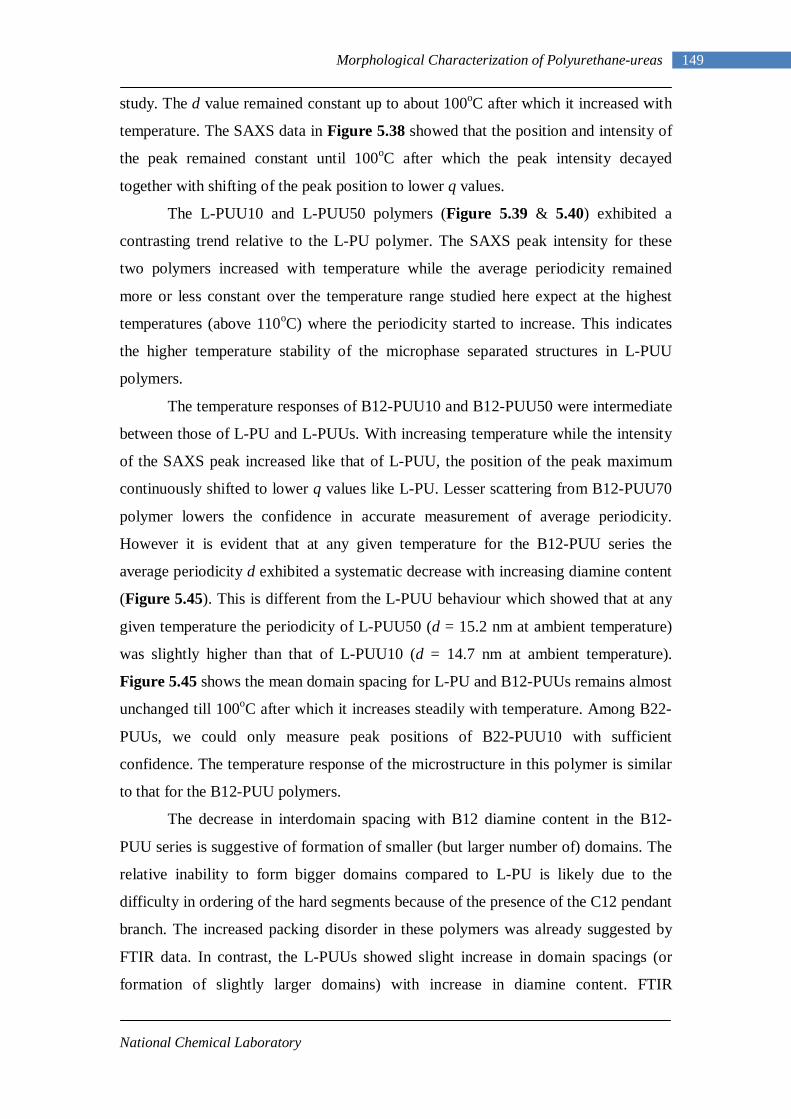
National Chemical Laboratory
149 Morphological Characterization of Polyurethane-ureas
study. The d value remained constant up to about 100oC after which it increased with
temperature. The SAXS data in Figure 5.38 showed that the position and intensity of
the peak remained constant until 100oC after which the peak intensity decayed
together with shifting of the peak position to lower q values.
The L-PUU10 and L-PUU50 polymers (Figure 5.39 & 5.40) exhibited a
contrasting trend relative to the L-PU polymer. The SAXS peak intensity for these
two polymers increased with temperature while the average periodicity remained
more or less constant over the temperature range studied here expect at the highest
temperatures (above 110oC) where the periodicity started to increase. This indicates
the higher temperature stability of the microphase separated structures in L-PUU
polymers.
The temperature responses of B12-PUU10 and B12-PUU50 were intermediate
between those of L-PU and L-PUUs. With increasing temperature while the intensity
of the SAXS peak increased like that of L-PUU, the position of the peak maximum
continuously shifted to lower q values like L-PU. Lesser scattering from B12-PUU70
polymer lowers the confidence in accurate measurement of average periodicity.
However it is evident that at any given temperature for the B12-PUU series the
average periodicity d exhibited a systematic decrease with increasing diamine content
(Figure 5.45). This is different from the L-PUU behaviour which showed that at any
given temperature the periodicity of L-PUU50 (d = 15.2 nm at ambient temperature)
was slightly higher than that of L-PUU10 (d = 14.7 nm at ambient temperature).
Figure 5.45 shows the mean domain spacing for L-PU and B12-PUUs remains almost
unchanged till 100oC after which it increases steadily with temperature. Among B22-
PUUs, we could only measure peak positions of B22-PUU10 with sufficient
confidence. The temperature response of the microstructure in this polymer is similar
to that for the B12-PUU polymers.
The decrease in interdomain spacing with B12 diamine content in the B12-
PUU series is suggestive of formation of smaller (but larger number of) domains. The
relative inability to form bigger domains compared to L-PU is likely due to the
difficulty in ordering of the hard segments because of the presence of the C12 pendant
branch. The increased packing disorder in these polymers was already suggested by
FTIR data. In contrast, the L-PUUs showed slight increase in domain spacings (or
formation of slightly larger domains) with increase in diamine content. FTIR
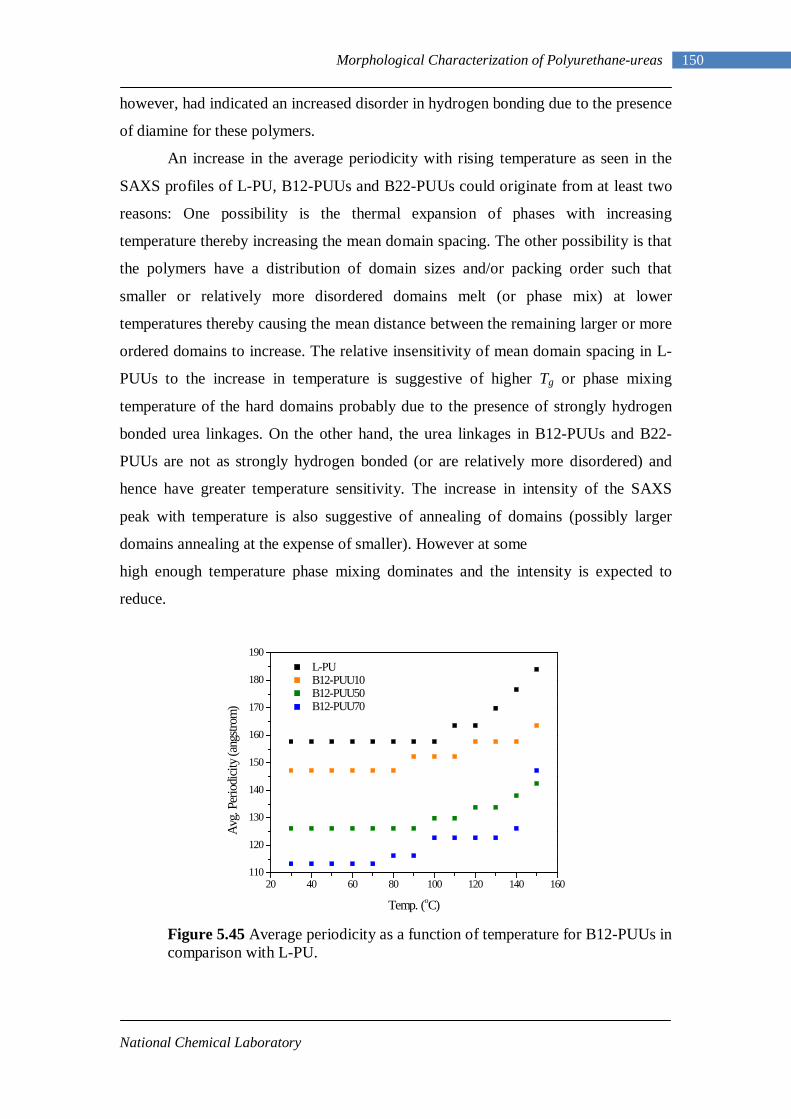
National Chemical Laboratory
150 Morphological Characterization of Polyurethane-ureas
however, had indicated an increased disorder in hydrogen bonding due to the presence
of diamine for these polymers.
An increase in the average periodicity with rising temperature as seen in the
SAXS profiles of L-PU, B12-PUUs and B22-PUUs could originate from at least two
reasons: One possibility is the thermal expansion of phases with increasing
temperature thereby increasing the mean domain spacing. The other possibility is that
the polymers have a distribution of domain sizes and/or packing order such that
smaller or relatively more disordered domains melt (or phase mix) at lower
temperatures thereby causing the mean distance between the remaining larger or more
ordered domains to increase. The relative insensitivity of mean domain spacing in L-
PUUs to the increase in temperature is suggestive of higher Tg or phase mixing
temperature of the hard domains probably due to the presence of strongly hydrogen
bonded urea linkages. On the other hand, the urea linkages in B12-PUUs and B22-
PUUs are not as strongly hydrogen bonded (or are relatively more disordered) and
hence have greater temperature sensitivity. The increase in intensity of the SAXS
peak with temperature is also suggestive of annealing of domains (possibly larger
domains annealing at the expense of smaller). However at some
high enough temperature phase mixing dominates and the intensity is expected to
reduce.
Figure 5.45 Average periodicity as a function of temperature for B12-PUUs in comparison with L-PU.
20 40 60 80 100 120 140 160110
120
130
140
150
160
170
180
190 L-PU B12-PUU10 B12-PUU50 B12-PUU70
Avg.
Perio
dicit
y (an
gstro
m)
Temp. (oC)
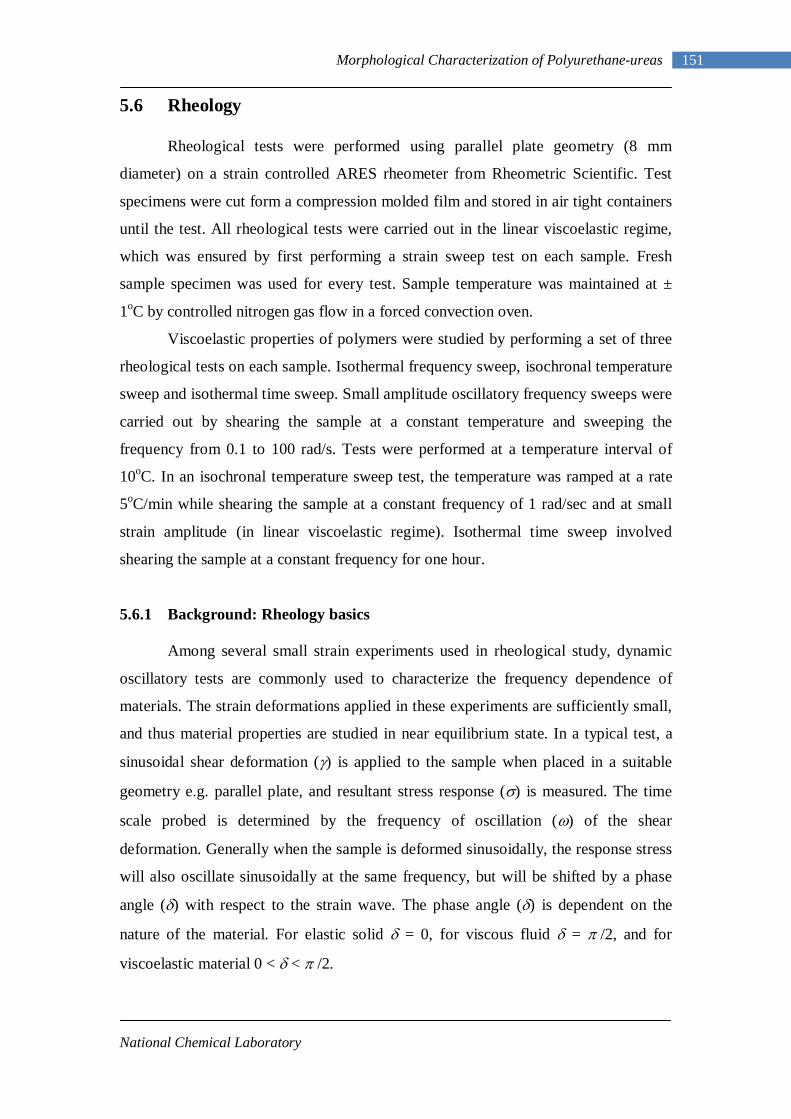
National Chemical Laboratory
151 Morphological Characterization of Polyurethane-ureas
5.6 Rheology
Rheological tests were performed using parallel plate geometry (8 mm
diameter) on a strain controlled ARES rheometer from Rheometric Scientific. Test
specimens were cut form a compression molded film and stored in air tight containers
until the test. All rheological tests were carried out in the linear viscoelastic regime,
which was ensured by first performing a strain sweep test on each sample. Fresh
sample specimen was used for every test. Sample temperature was maintained at ±
1oC by controlled nitrogen gas flow in a forced convection oven.
Viscoelastic properties of polymers were studied by performing a set of three
rheological tests on each sample. Isothermal frequency sweep, isochronal temperature
sweep and isothermal time sweep. Small amplitude oscillatory frequency sweeps were
carried out by shearing the sample at a constant temperature and sweeping the
frequency from 0.1 to 100 rad/s. Tests were performed at a temperature interval of
10oC. In an isochronal temperature sweep test, the temperature was ramped at a rate
5oC/min while shearing the sample at a constant frequency of 1 rad/sec and at small
strain amplitude (in linear viscoelastic regime). Isothermal time sweep involved
shearing the sample at a constant frequency for one hour.
5.6.1 Background: Rheology basics
Among several small strain experiments used in rheological study, dynamic
oscillatory tests are commonly used to characterize the frequency dependence of
materials. The strain deformations applied in these experiments are sufficiently small,
and thus material properties are studied in near equilibrium state. In a typical test, a
sinusoidal shear deformation (γ) is applied to the sample when placed in a suitable
geometry e.g. parallel plate, and resultant stress response (σ) is measured. The time
scale probed is determined by the frequency of oscillation (ω) of the shear
deformation. Generally when the sample is deformed sinusoidally, the response stress
will also oscillate sinusoidally at the same frequency, but will be shifted by a phase
angle (δ) with respect to the strain wave. The phase angle (δ) is dependent on the
nature of the material. For elastic solid δ = 0, for viscous fluid δ = π /2, and for
viscoelastic material 0 < δ < π /2.
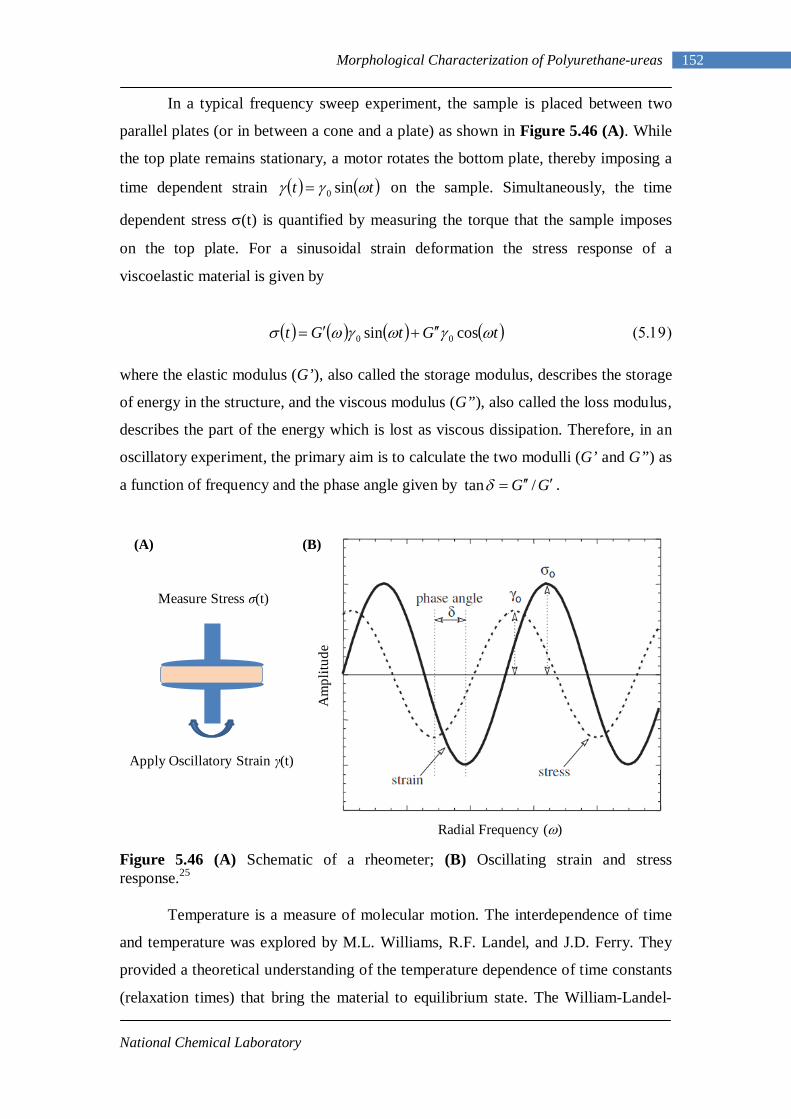
National Chemical Laboratory
152 Morphological Characterization of Polyurethane-ureas
In a typical frequency sweep experiment, the sample is placed between two
parallel plates (or in between a cone and a plate) as shown in Figure 5.46 (A). While
the top plate remains stationary, a motor rotates the bottom plate, thereby imposing a
time dependent strain ( ) ( )tt ωγγ sin0= on the sample. Simultaneously, the time
dependent stress σ(t) is quantified by measuring the torque that the sample imposes
on the top plate. For a sinusoidal strain deformation the stress response of a
viscoelastic material is given by
( ) ( ) ( ) ( )tGtGt ωγωγωσ cossin 00 ′′+′= (5.19)
where the elastic modulus (G’), also called the storage modulus, describes the storage
of energy in the structure, and the viscous modulus (G”), also called the loss modulus,
describes the part of the energy which is lost as viscous dissipation. Therefore, in an
oscillatory experiment, the primary aim is to calculate the two modulli (G’ and G”) as
a function of frequency and the phase angle given by GG ′′′= /tanδ .
Figure 5.46 (A) Schematic of a rheometer; (B) Oscillating strain and stress response.25 Temperature is a measure of molecular motion. The interdependence of time
and temperature was explored by M.L. Williams, R.F. Landel, and J.D. Ferry. They
provided a theoretical understanding of the temperature dependence of time constants
(relaxation times) that bring the material to equilibrium state. The William-Landel-
Apply Oscillatory Strain γ(t)
Measure Stress σ(t)
Radial Frequency (ω)
Am
plitu
de
(A) (B)
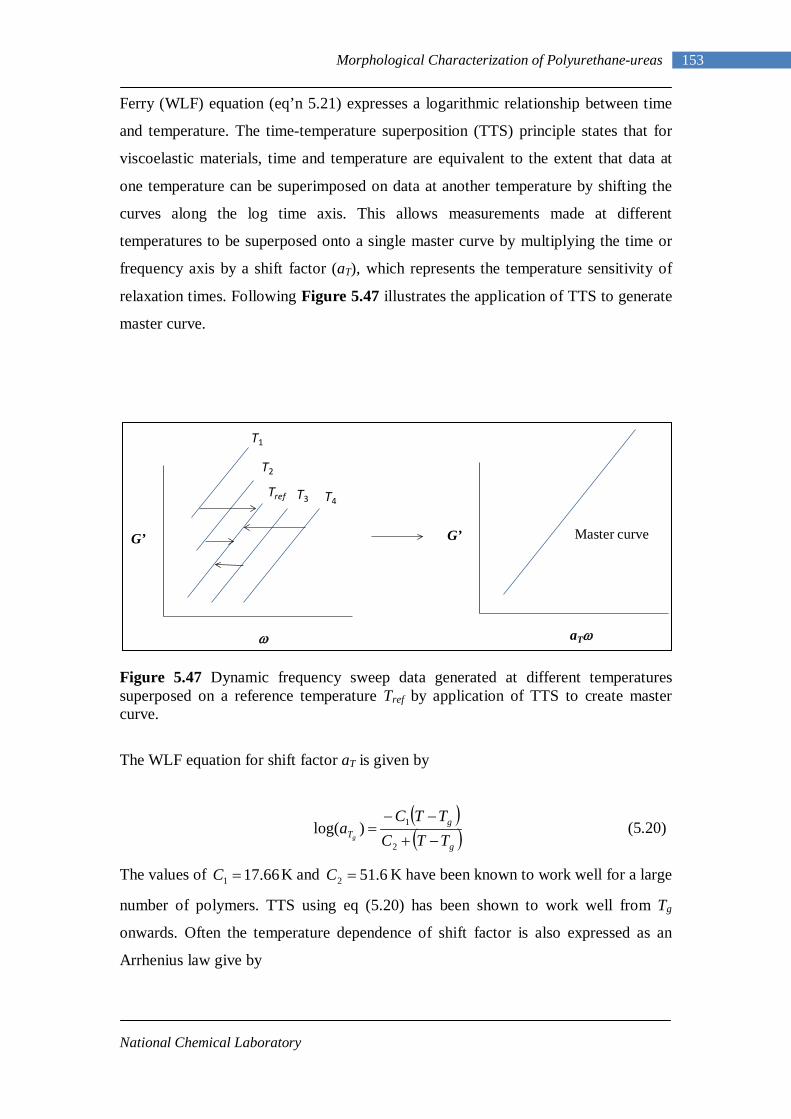
National Chemical Laboratory
153 Morphological Characterization of Polyurethane-ureas
Ferry (WLF) equation (eq’n 5.21) expresses a logarithmic relationship between time
and temperature. The time-temperature superposition (TTS) principle states that for
viscoelastic materials, time and temperature are equivalent to the extent that data at
one temperature can be superimposed on data at another temperature by shifting the
curves along the log time axis. This allows measurements made at different
temperatures to be superposed onto a single master curve by multiplying the time or
frequency axis by a shift factor (aT), which represents the temperature sensitivity of
relaxation times. Following Figure 5.47 illustrates the application of TTS to generate
master curve.
Figure 5.47 Dynamic frequency sweep data generated at different temperatures superposed on a reference temperature Tref by application of TTS to create master curve.
The WLF equation for shift factor aT is given by
( )( )g
gT TTC
TTCa
g −+
−−=
2
1)log( (5.20)
The values of 66.171 =C K and 6.512 =C K have been known to work well for a large
number of polymers. TTS using eq (5.20) has been shown to work well from Tg
onwards. Often the temperature dependence of shift factor is also expressed as an
Arrhenius law give by
G’
ω
T1
T2
Tref T3 T4
Master curveG’
aTω
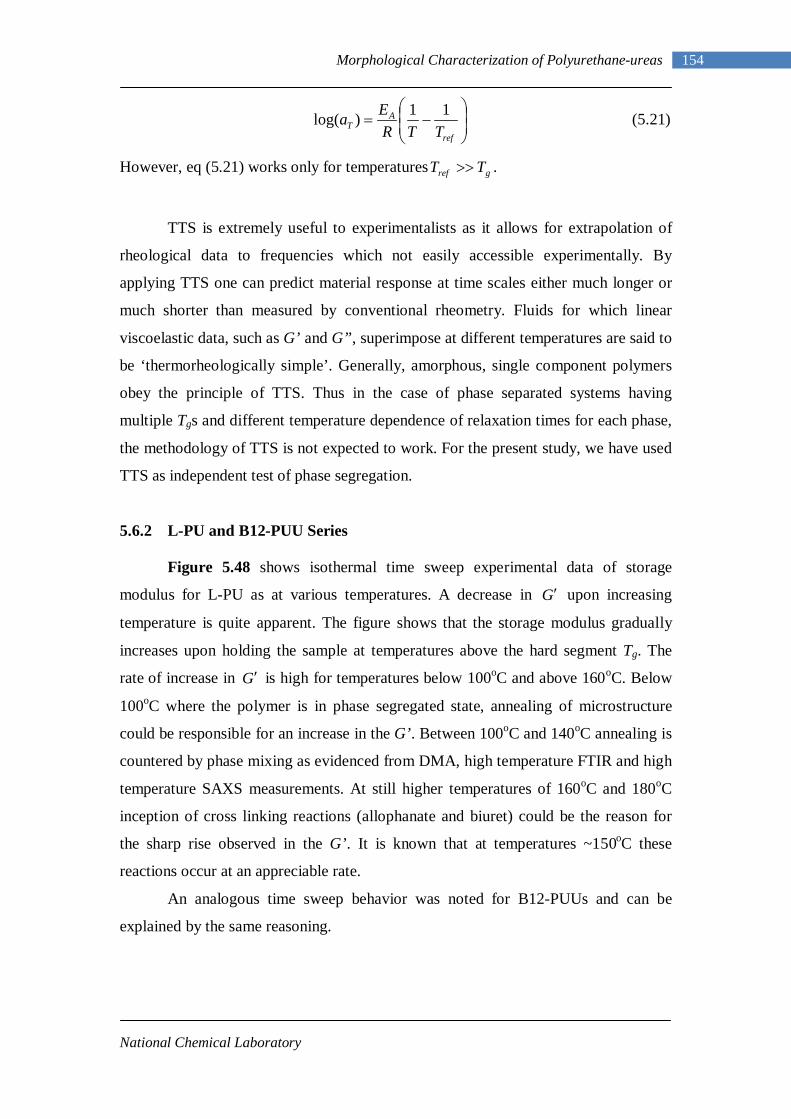
National Chemical Laboratory
154 Morphological Characterization of Polyurethane-ureas
−=
ref
AT TTR
Ea 11)log( (5.21)
However, eq (5.21) works only for temperatures gref TT >> .
TTS is extremely useful to experimentalists as it allows for extrapolation of
rheological data to frequencies which not easily accessible experimentally. By
applying TTS one can predict material response at time scales either much longer or
much shorter than measured by conventional rheometry. Fluids for which linear
viscoelastic data, such as G’ and G”, superimpose at different temperatures are said to
be ‘thermorheologically simple’. Generally, amorphous, single component polymers
obey the principle of TTS. Thus in the case of phase separated systems having
multiple Tgs and different temperature dependence of relaxation times for each phase,
the methodology of TTS is not expected to work. For the present study, we have used
TTS as independent test of phase segregation.
5.6.2 L-PU and B12-PUU Series
Figure 5.48 shows isothermal time sweep experimental data of storage
modulus for L-PU as at various temperatures. A decrease in G′ upon increasing
temperature is quite apparent. The figure shows that the storage modulus gradually
increases upon holding the sample at temperatures above the hard segment Tg. The
rate of increase in G′ is high for temperatures below 100oC and above 160oC. Below
100oC where the polymer is in phase segregated state, annealing of microstructure
could be responsible for an increase in the G’. Between 100oC and 140oC annealing is
countered by phase mixing as evidenced from DMA, high temperature FTIR and high
temperature SAXS measurements. At still higher temperatures of 160oC and 180oC
inception of cross linking reactions (allophanate and biuret) could be the reason for
the sharp rise observed in the G’. It is known that at temperatures ~150oC these
reactions occur at an appreciable rate.
An analogous time sweep behavior was noted for B12-PUUs and can be
explained by the same reasoning.
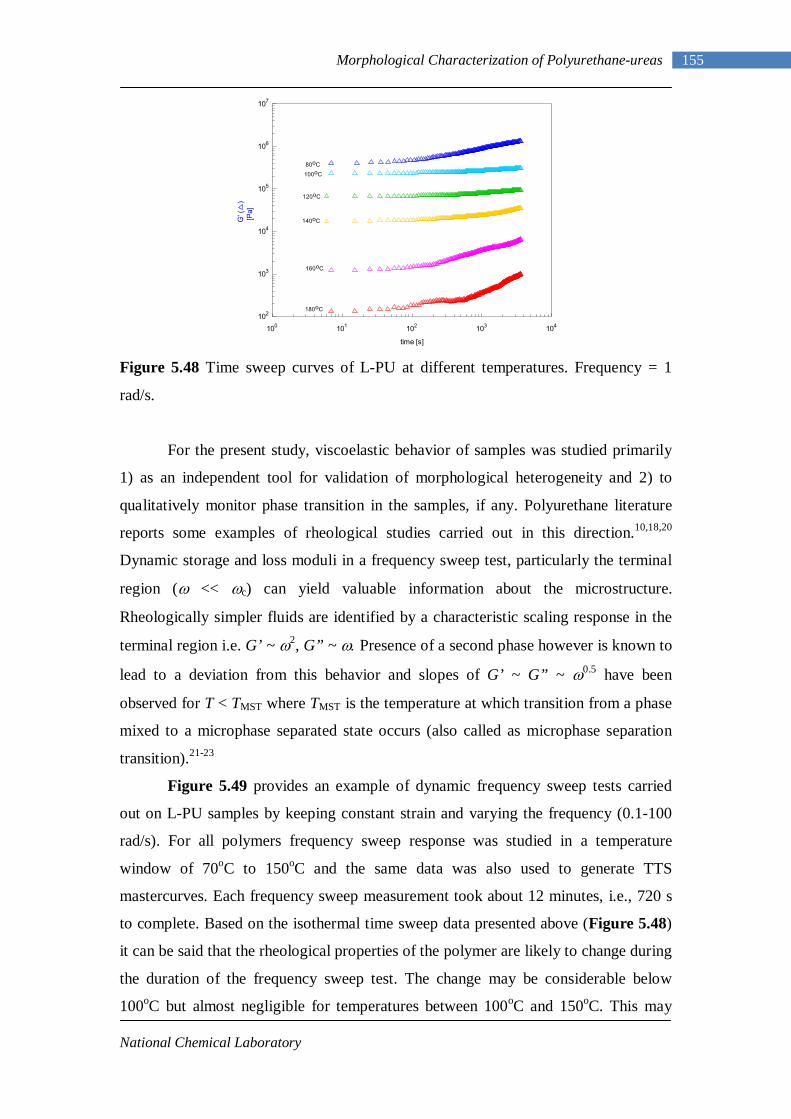
National Chemical Laboratory
155 Morphological Characterization of Polyurethane-ureas
Figure 5.48 Time sweep curves of L-PU at different temperatures. Frequency = 1
rad/s.
For the present study, viscoelastic behavior of samples was studied primarily
1) as an independent tool for validation of morphological heterogeneity and 2) to
qualitatively monitor phase transition in the samples, if any. Polyurethane literature
reports some examples of rheological studies carried out in this direction.10,18,20
Dynamic storage and loss moduli in a frequency sweep test, particularly the terminal
region (ω << ωc) can yield valuable information about the microstructure.
Rheologically simpler fluids are identified by a characteristic scaling response in the
terminal region i.e. G’ ~ ω2, G” ~ ω. Presence of a second phase however is known to
lead to a deviation from this behavior and slopes of G’ ~ G” ~ ω0.5 have been
observed for T < TMST where TMST is the temperature at which transition from a phase
mixed to a microphase separated state occurs (also called as microphase separation
transition).21-23
Figure 5.49 provides an example of dynamic frequency sweep tests carried
out on L-PU samples by keeping constant strain and varying the frequency (0.1-100
rad/s). For all polymers frequency sweep response was studied in a temperature
window of 70oC to 150oC and the same data was also used to generate TTS
mastercurves. Each frequency sweep measurement took about 12 minutes, i.e., 720 s
to complete. Based on the isothermal time sweep data presented above (Figure 5.48)
it can be said that the rheological properties of the polymer are likely to change during
the duration of the frequency sweep test. The change may be considerable below
100oC but almost negligible for temperatures between 100oC and 150oC. This may
100 101 102 103 104102
103
104
105
106
107
time [s]
G' (
)
[Pa]
80oC 100oC
120oC
140oC
160oC
180oC
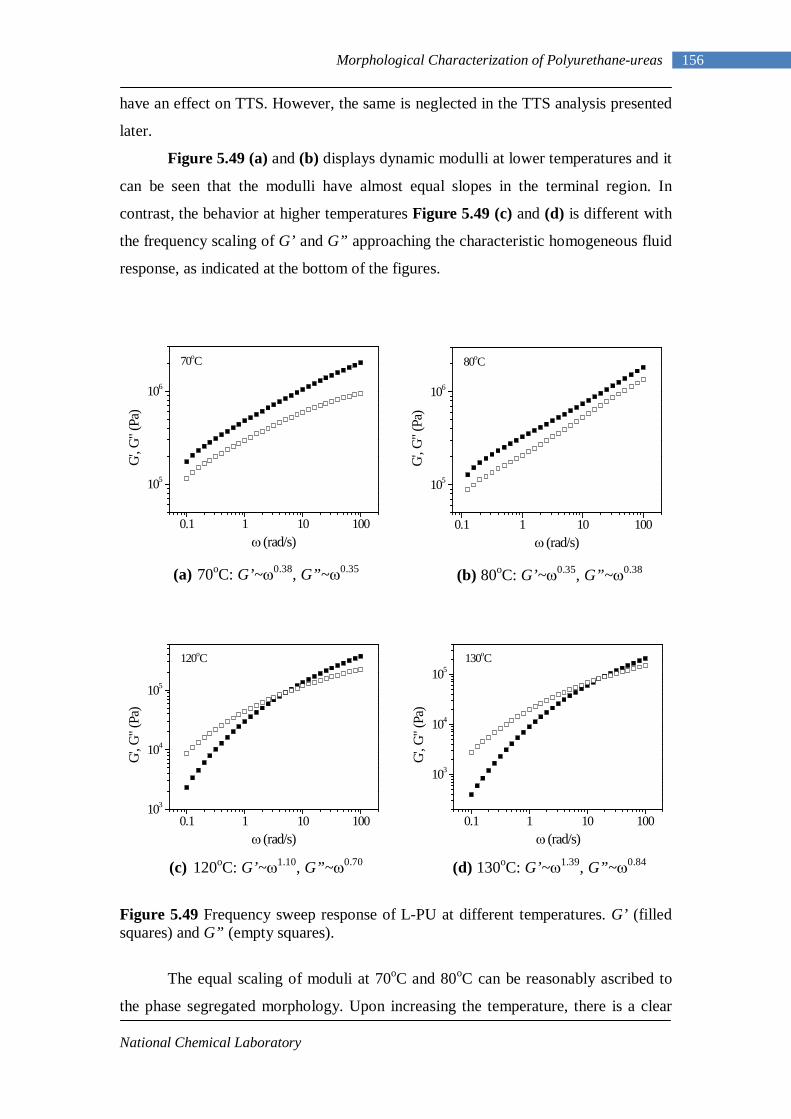
National Chemical Laboratory
156 Morphological Characterization of Polyurethane-ureas
have an effect on TTS. However, the same is neglected in the TTS analysis presented
later.
Figure 5.49 (a) and (b) displays dynamic modulli at lower temperatures and it
can be seen that the modulli have almost equal slopes in the terminal region. In
contrast, the behavior at higher temperatures Figure 5.49 (c) and (d) is different with
the frequency scaling of G’ and G” approaching the characteristic homogeneous fluid
response, as indicated at the bottom of the figures.
(a) 70oC: G’~ω0.38, G”~ω0.35
(b) 80oC: G’~ω0.35, G”~ω0.38
(c) 120oC: G’~ω1.10, G”~ω0.70
(d) 130oC: G’~ω1.39, G”~ω0.84
Figure 5.49 Frequency sweep response of L-PU at different temperatures. G’ (filled squares) and G” (empty squares).
The equal scaling of moduli at 70oC and 80oC can be reasonably ascribed to
the phase segregated morphology. Upon increasing the temperature, there is a clear
0.1 1 10 100
105
106
70oC
G', G
" (Pa
)
ω (rad/s)0.1 1 10 100
105
106
80oC
G', G
" (Pa
)
ω (rad/s)
0.1 1 10 100103
104
105
120oC
G', G
" (Pa
)
ω (rad/s)0.1 1 10 100
103
104
105130oC
G', G
" (Pa
)
ω (rad/s)
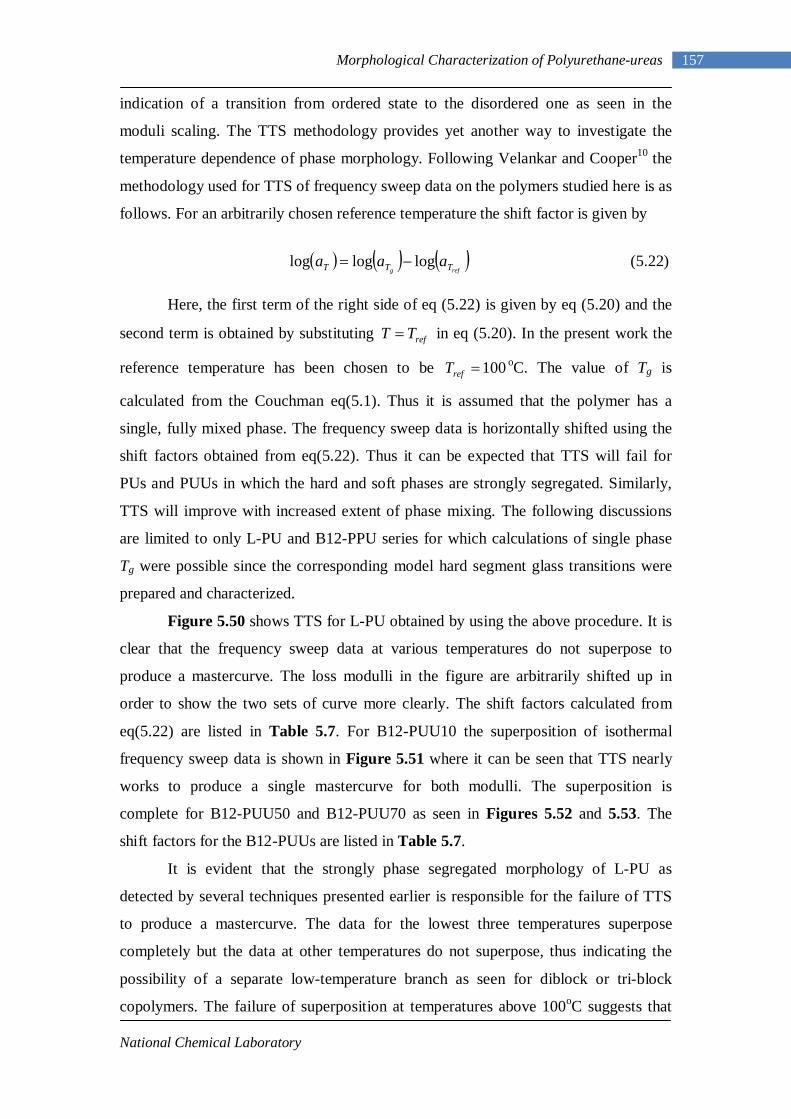
National Chemical Laboratory
157 Morphological Characterization of Polyurethane-ureas
indication of a transition from ordered state to the disordered one as seen in the
moduli scaling. The TTS methodology provides yet another way to investigate the
temperature dependence of phase morphology. Following Velankar and Cooper10 the
methodology used for TTS of frequency sweep data on the polymers studied here is as
follows. For an arbitrarily chosen reference temperature the shift factor is given by
( ) ( ) ( )
refg TTT aaa logloglog −= (5.22)
Here, the first term of the right side of eq (5.22) is given by eq (5.20) and the
second term is obtained by substituting refTT = in eq (5.20). In the present work the
reference temperature has been chosen to be 100=refT oC. The value of Tg is
calculated from the Couchman eq(5.1). Thus it is assumed that the polymer has a
single, fully mixed phase. The frequency sweep data is horizontally shifted using the
shift factors obtained from eq(5.22). Thus it can be expected that TTS will fail for
PUs and PUUs in which the hard and soft phases are strongly segregated. Similarly,
TTS will improve with increased extent of phase mixing. The following discussions
are limited to only L-PU and B12-PPU series for which calculations of single phase
Tg were possible since the corresponding model hard segment glass transitions were
prepared and characterized.
Figure 5.50 shows TTS for L-PU obtained by using the above procedure. It is
clear that the frequency sweep data at various temperatures do not superpose to
produce a mastercurve. The loss modulli in the figure are arbitrarily shifted up in
order to show the two sets of curve more clearly. The shift factors calculated from
eq(5.22) are listed in Table 5.7. For B12-PUU10 the superposition of isothermal
frequency sweep data is shown in Figure 5.51 where it can be seen that TTS nearly
works to produce a single mastercurve for both modulli. The superposition is
complete for B12-PUU50 and B12-PUU70 as seen in Figures 5.52 and 5.53. The
shift factors for the B12-PUUs are listed in Table 5.7.
It is evident that the strongly phase segregated morphology of L-PU as
detected by several techniques presented earlier is responsible for the failure of TTS
to produce a mastercurve. The data for the lowest three temperatures superpose
completely but the data at other temperatures do not superpose, thus indicating the
possibility of a separate low-temperature branch as seen for diblock or tri-block
copolymers. The failure of superposition at temperatures above 100oC suggests that
National Chemical Laboratory
158 Morphological Characterization of Polyurethane-ureas
the microphase separated morphology persists at higher temperature. High
temperature SAXS data presented earlier however did indicate a gradual
disappearance of the short range order above 100oC. This is however not reflected in
the TTS. It is worth noting here that instead of calculating Tg of the polymer using eq
(5.22), if it were to be used entirely as a fit parameter then a value of Tg = 42oC gives
rise to the TTS mastercurve shown in Figure 5.54. It appears here that the TTS
principle indeed works if the glass transition temperature of the polymer were chosen
to be nearly equal to that of the hard domain.
In case of B12-PUUs the polymer containing 10 mol% B12 diamine showed
failure of TTS although to a considerably lower extent than that observed for L-PU.
The corresponding SAXS data had shown a distinct peak indicating substantial extent
of short range order. DSC and DMA data had suggested presence of a relatively pure
soft phase, while FTIR and Couchman analysis had indicated respectively increased
disorder in hard segment packing and some amount (~30%) of mixing of soft
segments in the hard domains. The polymers containing 50 mol% and 70 mol%
diamine showed complete success of TTS to produce mastercurves. The
corresponding SAXS data for these two polymers had shown a significantly subdued
signal for short range order. This was however attributed to the loss in electron
density contrast. DSC and DMA data, and Couchman analysis of this data, had
suggested that there is an increased tendency of mixing between the hard and soft
segments, especially in the hard domain phase in these polymers. However all
indicators of microphase morphology did suggest the existence of a phase segregated
state. Hence the success of TTS for the B12-PUUs is indeed surprising. It seems that
mixing of greater than 30% of soft segments in the hard domain phase (as seen from
Couchman analysis) was enough to cause TTS to work. The above discussions
suggest that the success of TTS is determined by the temperature dependence of hard
segment mobility and it is perhaps not always a sensitive indicator of microphase
separation in polyurethane polymers.
National Chemical Laboratory
159 Morphological Characterization of Polyurethane-ureas
Table 5.7 Shift factors for L-PU and B12-PUUs.
L-PU B12-PUU10 B12-PUU50 B12-PUU70
Tg,ss (K) 179 Tg,ss (K) 179 Tg,ss (K) 179 Tg,ss (K) 179 Tg,hs (K) 317 Tg,hs (K) 359 Tg,hs (K) 410 Tg,hs (K) 422 Tg (K)* 260 Tg (K)* 285 Tg (K)* 315 Tg (K)* 322
T (oC) aT T (oC) aT T (oC) aT T (oC) aT
60 60 415.14 60 60 70 17.28 70 60.89 70 70 80 5.86 80 12.31 80 71.38 80 141.42 90 2.28 90 3.19 90 6.82 90 9.10 100 1.00 100 1.00 100 1.00 100 1.00 110 0.48 110 0.37 110 0.20 110 0.16 120 025 120 0.15 120 0.05 120 0.036 130 0.14 130 0.07 130 0.016 130 0.0098 140 0.082 140 140 0.006 140 0.0032 150 0.051 150 150 150
*
hsss
hsghsssgssg ww
TwTwT
.
. ,,
αα
+
+=
Figure 5.50 TTS for L-PU. Tref = 100oC.
10-2 10-1 100 101 102 103
102
103
104
105
106 L-PU
70oC 80oC 90oC 100oC 110oC 120oC 130oC 140oC 150oC
G' (p
a)
ω (rad/s)10-2 10-1 100 101 102 103
103
104
105
106 L-PU
70oC 80oC 90oC 100oC 110oC 120oC 130oC 140oC 150oC
G" (p
a)
ω (rad/s)
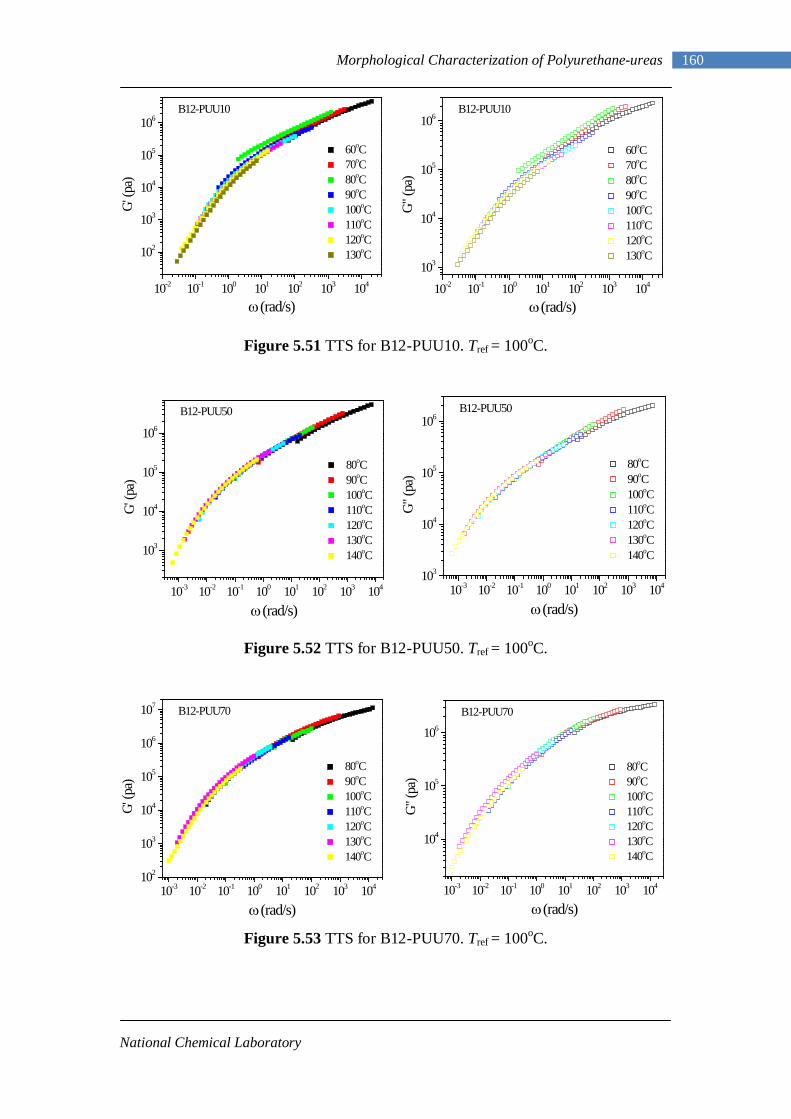
National Chemical Laboratory
160 Morphological Characterization of Polyurethane-ureas
Figure 5.51 TTS for B12-PUU10. Tref = 100oC.
Figure 5.52 TTS for B12-PUU50. Tref = 100oC.
Figure 5.53 TTS for B12-PUU70. Tref = 100oC.
10-2 10-1 100 101 102 103 104
102
103
104
105
106
60oC 70oC 80oC 90oC 100oC 110oC 120oC 130oC
B12-PUU10
G' (p
a)
ω (rad/s)10-2 10-1 100 101 102 103 104
103
104
105
106
60oC 70oC 80oC 90oC 100oC 110oC 120oC 130oC
B12-PUU10
G" (p
a)
ω (rad/s)
10-3 10-2 10-1 100 101 102 103 104
103
104
105
106
80oC 90oC 100oC 110oC 120oC 130oC 140oC
B12-PUU50
G' (p
a)
ω (rad/s)10-3 10-2 10-1 100 101 102 103 104
103
104
105
106
80oC 90oC 100oC 110oC 120oC 130oC 140oC
B12-PUU50
G" (p
a)
ω (rad/s)
10-3 10-2 10-1 100 101 102 103 104102
103
104
105
106
107
80oC 90oC 100oC 110oC 120oC 130oC 140oC
B12-PUU70
G' (p
a)
ω (rad/s)10-3 10-2 10-1 100 101 102 103 104
104
105
106
80oC 90oC 100oC 110oC 120oC 130oC 140oC
B12-PUU70
G" (p
a)
ω (rad/s)
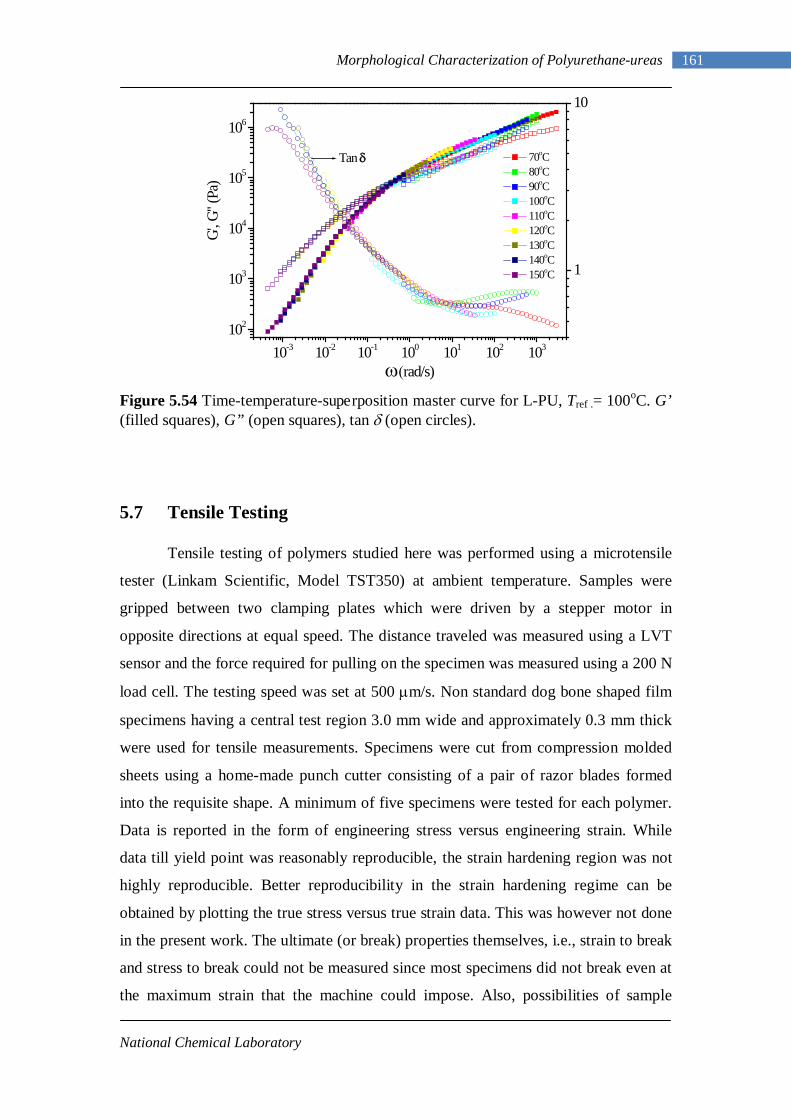
National Chemical Laboratory
161 Morphological Characterization of Polyurethane-ureas
Figure 5.54 Time-temperature-superposition master curve for L-PU, Tref .= 100oC. G’ (filled squares), G” (open squares), tan δ (open circles).
5.7 Tensile Testing Tensile testing of polymers studied here was performed using a microtensile
tester (Linkam Scientific, Model TST350) at ambient temperature. Samples were
gripped between two clamping plates which were driven by a stepper motor in
opposite directions at equal speed. The distance traveled was measured using a LVT
sensor and the force required for pulling on the specimen was measured using a 200 N
load cell. The testing speed was set at 500 µm/s. Non standard dog bone shaped film
specimens having a central test region 3.0 mm wide and approximately 0.3 mm thick
were used for tensile measurements. Specimens were cut from compression molded
sheets using a home-made punch cutter consisting of a pair of razor blades formed
into the requisite shape. A minimum of five specimens were tested for each polymer.
Data is reported in the form of engineering stress versus engineering strain. While
data till yield point was reasonably reproducible, the strain hardening region was not
highly reproducible. Better reproducibility in the strain hardening regime can be
obtained by plotting the true stress versus true strain data. This was however not done
in the present work. The ultimate (or break) properties themselves, i.e., strain to break
and stress to break could not be measured since most specimens did not break even at
the maximum strain that the machine could impose. Also, possibilities of sample
10-3 10-2 10-1 100 101 102 103
102
103
104
105
106
1
10
Tan δ 70oC 80oC 90oC 100oC 110oC 120oC 130oC 140oC 150oC
G
', G'' (
Pa)
ω (rad/s)
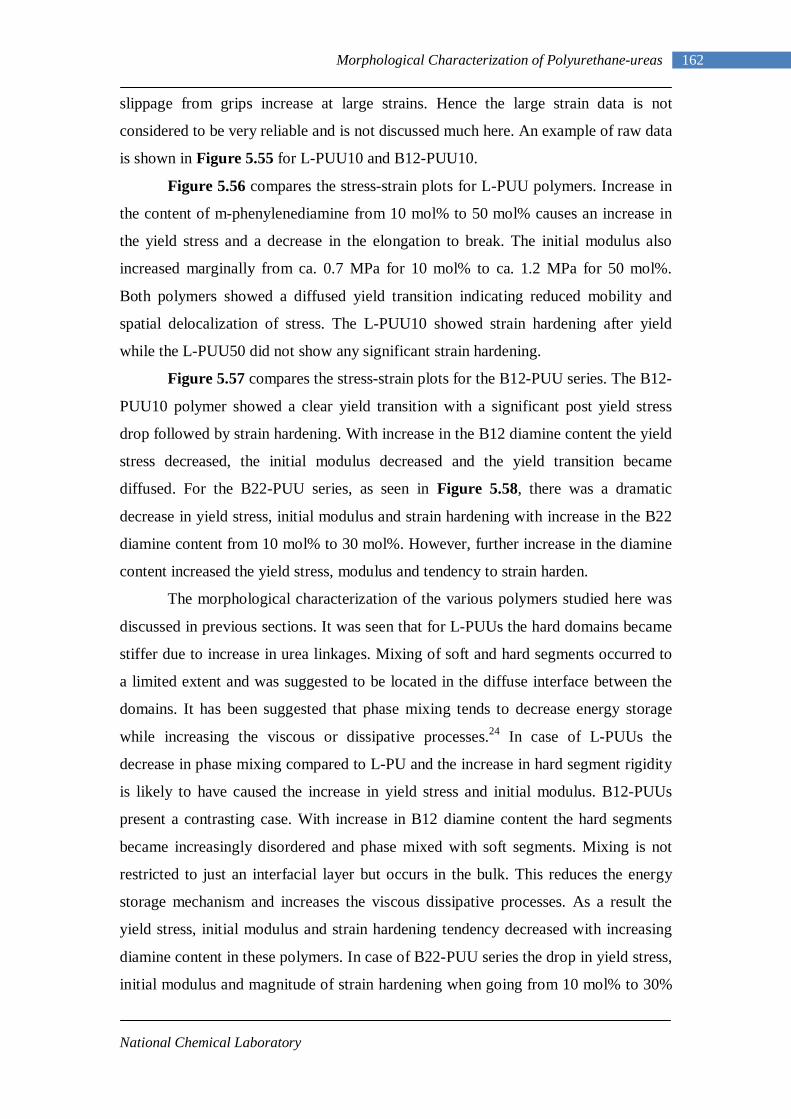
National Chemical Laboratory
162 Morphological Characterization of Polyurethane-ureas
slippage from grips increase at large strains. Hence the large strain data is not
considered to be very reliable and is not discussed much here. An example of raw data
is shown in Figure 5.55 for L-PUU10 and B12-PUU10.
Figure 5.56 compares the stress-strain plots for L-PUU polymers. Increase in
the content of m-phenylenediamine from 10 mol% to 50 mol% causes an increase in
the yield stress and a decrease in the elongation to break. The initial modulus also
increased marginally from ca. 0.7 MPa for 10 mol% to ca. 1.2 MPa for 50 mol%.
Both polymers showed a diffused yield transition indicating reduced mobility and
spatial delocalization of stress. The L-PUU10 showed strain hardening after yield
while the L-PUU50 did not show any significant strain hardening.
Figure 5.57 compares the stress-strain plots for the B12-PUU series. The B12-
PUU10 polymer showed a clear yield transition with a significant post yield stress
drop followed by strain hardening. With increase in the B12 diamine content the yield
stress decreased, the initial modulus decreased and the yield transition became
diffused. For the B22-PUU series, as seen in Figure 5.58, there was a dramatic
decrease in yield stress, initial modulus and strain hardening with increase in the B22
diamine content from 10 mol% to 30 mol%. However, further increase in the diamine
content increased the yield stress, modulus and tendency to strain harden.
The morphological characterization of the various polymers studied here was
discussed in previous sections. It was seen that for L-PUUs the hard domains became
stiffer due to increase in urea linkages. Mixing of soft and hard segments occurred to
a limited extent and was suggested to be located in the diffuse interface between the
domains. It has been suggested that phase mixing tends to decrease energy storage
while increasing the viscous or dissipative processes.24 In case of L-PUUs the
decrease in phase mixing compared to L-PU and the increase in hard segment rigidity
is likely to have caused the increase in yield stress and initial modulus. B12-PUUs
present a contrasting case. With increase in B12 diamine content the hard segments
became increasingly disordered and phase mixed with soft segments. Mixing is not
restricted to just an interfacial layer but occurs in the bulk. This reduces the energy
storage mechanism and increases the viscous dissipative processes. As a result the
yield stress, initial modulus and strain hardening tendency decreased with increasing
diamine content in these polymers. In case of B22-PUU series the drop in yield stress,
initial modulus and magnitude of strain hardening when going from 10 mol% to 30%
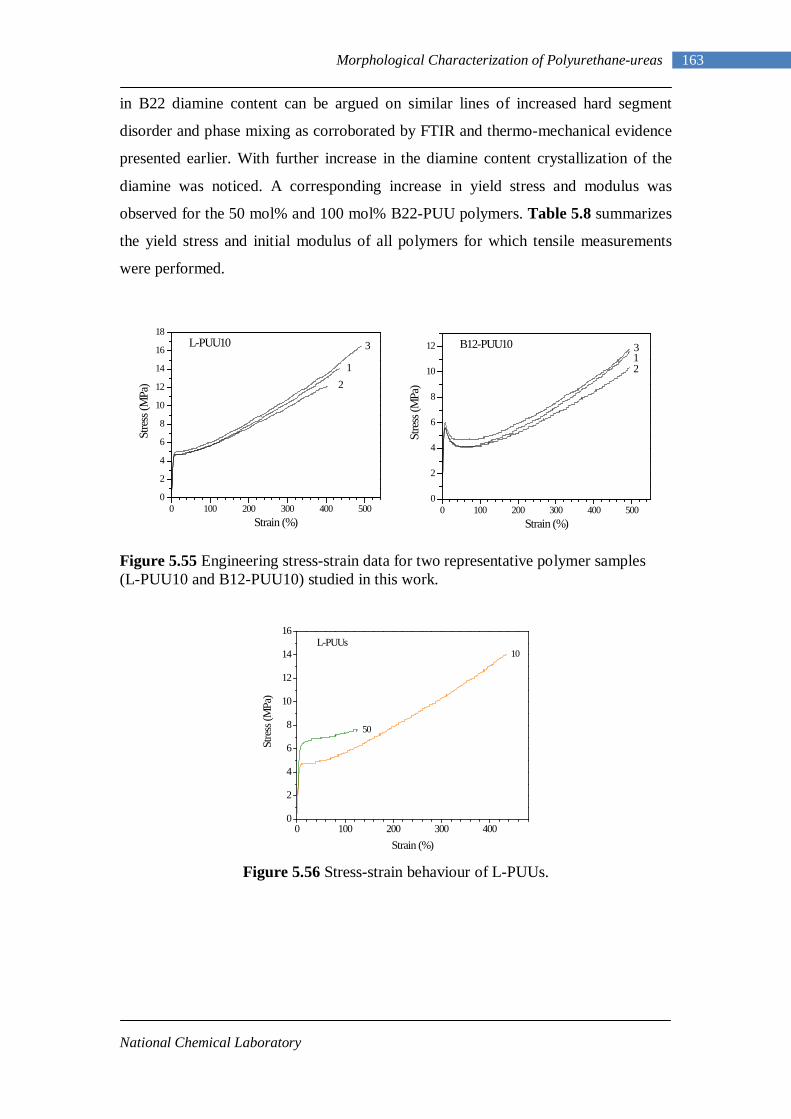
National Chemical Laboratory
163 Morphological Characterization of Polyurethane-ureas
in B22 diamine content can be argued on similar lines of increased hard segment
disorder and phase mixing as corroborated by FTIR and thermo-mechanical evidence
presented earlier. With further increase in the diamine content crystallization of the
diamine was noticed. A corresponding increase in yield stress and modulus was
observed for the 50 mol% and 100 mol% B22-PUU polymers. Table 5.8 summarizes
the yield stress and initial modulus of all polymers for which tensile measurements
were performed.
Figure 5.55 Engineering stress-strain data for two representative polymer samples (L-PUU10 and B12-PUU10) studied in this work.
Figure 5.56 Stress-strain behaviour of L-PUUs.
0 100 200 300 400 5000
2
4
6
8
10
12
14
16
183
21
L-PUU10
Stre
ss (M
Pa)
Strain (%)0 100 200 300 400 500
0
2
4
6
8
10
12 3
21
B12-PUU10
Stre
ss (M
Pa)
Strain (%)
0 100 200 300 4000
2
4
6
8
10
12
14
16L-PUUs
50
10
Stre
ss (M
Pa)
Strain (%)
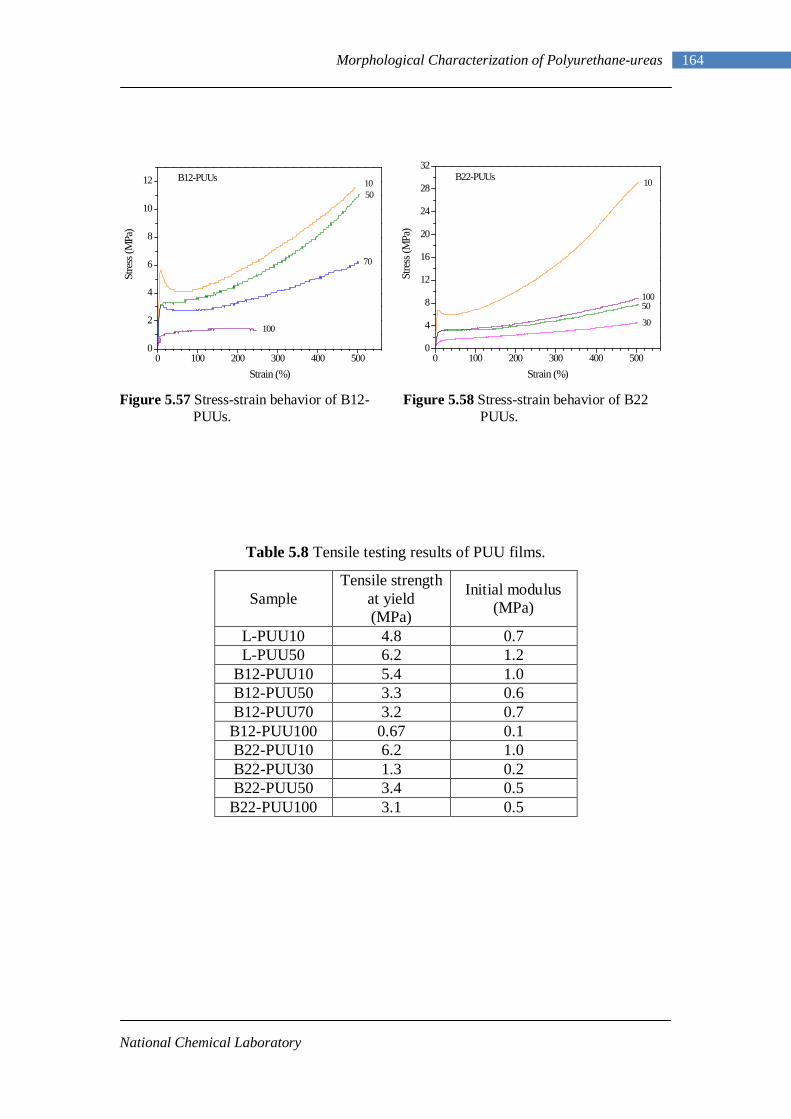
National Chemical Laboratory
164 Morphological Characterization of Polyurethane-ureas
Figure 5.57 Stress-strain behavior of B12- PUUs.
Figure 5.58 Stress-strain behavior of B22 PUUs.
Table 5.8 Tensile testing results of PUU films.
Sample Tensile strength
at yield (MPa)
Initial modulus (MPa)
L-PUU10 4.8 0.7 L-PUU50 6.2 1.2
B12-PUU10 5.4 1.0 B12-PUU50 3.3 0.6 B12-PUU70 3.2 0.7
B12-PUU100 0.67 0.1 B22-PUU10 6.2 1.0 B22-PUU30 1.3 0.2 B22-PUU50 3.4 0.5
B22-PUU100 3.1 0.5
0 100 200 300 400 5000
2
4
6
8
10
12 B12-PUUs
100
70
5010
Stre
ss (M
Pa)
Strain (%)0 100 200 300 400 500
0
4
8
12
16
20
24
28
32B22-PUUs
100
30
50
10
Stre
ss (M
Pa)
Strain (%)
National Chemical Laboratory
165 Morphological Characterization of Polyurethane-ureas
References: (1) Coleman, M. M.; Lee, K. L.; Skrovanek, D. J.; Painter, P. C. Macromolecules
1986, 19, 2149.
(2) Coleman, M. M.; Skrovanek, D. J.; Hu, J.; Painter, P. C. Macromolecules 1988, 21, 59. (3) Mattia, J.; Painter, P. C. Macromolecules 2007, 40, 1546. (4) Yilgor, I.; Yilgor, E.; Guler, G. I.; Ward, T. C.; Wilkes, G. L. Polymer 2006, 47, 4105. (5) Yilgor, I.; Mather, B. D.; Unal, S.; Yilgor, E.; Long, T. E. Polymer 2004, 45, 5829. (6) Yilgor, E.; Burgaz, E.; Yurtsever, E.; Yilgor, I. Polymer 2000, 41, 849. (7) Yilgor, I.; Yilgor, E. Polym. Rev. 2007, 47, 487.
(8) Teo, L. S.; Chen, C. Y.; Kuo, J. F. Macromolecules 1997, 30, 1793. (9) Yoon, P. J.; Han, C. D. Macromolecules 2000, 33, 2171. (10) Velankar, S.; Cooper, S. L. Macromolecules 1998, 31, 9181. (11) Ungar, G. Macromolecules 1986, 19, 1317.
(12) Sirota, E. B. Langmuir 1997, 13, 3849. (13) Sirota, E. B.; King Jr., H. E. Science 1998, 281, 143.
(14) Sirota, E. B.; Singer, D. M. J. Chem. Phys. 1994, 101, 10873.
(15) Sirota, E. B.; Herhold, A. B. Science 1999, 283, 529.
(16) Couchman, P. R. Macromolecules 1978, 11, 117.
(17) Bates, F. S.; Fredrickson, G. H. Annu. Rev. Phys. Chem. 1990, 41, 525.
(18) Ryan, A. J.; Macosko, C. W.; Bras, W. Macromolecules 1992, 25, 6277.
(19) Velankar, S.; Cooper, S. L. Macromolecules 2000, 33, 382.
(20) Nichetti, D.; Grizzuti, N. Polym. Eng. Sci. 2004, 44[8], 1514.
(21) Widmaier, J. M.; Meyer, G. C. Polym. Sci. , Polym. Phys. Ed. 1980, 18, 2217.
(22) Bates, F. S. Macromolecules 1984, 17, 2607.
National Chemical Laboratory
166 Morphological Characterization of Polyurethane-ureas
(23) Adams, J. L.; Graessley, W. W.; Register, R. A. Macromolecules 1994, 27,
6026.
(24) Sormana, J. L.; Maredith, J. C. Macromolecules 2004, 37, 2186. (25) Rheology for Chemists An Introduction, 2nd Ed., Jim W Goodwin, Roy W Hughes, 2008.

Conclusions and Future Work
Chapter - 6
National Chemical Laboratory
167 Conclusions and Future Work
6.1 Conclusions Design and synthesis of diamine chain extenders n-dodecyl 3,5-
diaminobenzoate and n-docosyl 3,5-diaminobenzoate, having different length of
pendent branch, starting from 3,5-dinitrobenzoylchloride was successfully carried out.
The pendent aliphatic branch in the two diamines respectively consisted of linear,
saturated hydrocarbon chains of twelve and eighteen carbons. The diamines were
obtained in high purity and good yields. The compounds were characterized by
elemental analysis and spectroscopic techniques. n-docosyl 3,5-diaminobenzoate is a
new compound synthesized in this work; the synthesis of this diamine is not yet
reported.
Additionally, linear polyurethane and a series of linear polyurethane-ureas
(with m-phenylenediamine chain extender) were synthesized via conventional two-
step solution polymerization scheme. These polymers served as control or benchmark
samples in understanding morphological consequences of incorporation of aliphatic
pendant branches on the hard segment. Spectroscopic characterization and molecular
weight analysis of synthesized polymers revealed respectively the evidence of
formation of urea linkages and build up of sufficiently high molecular weight.
Two series of short chain branched polyurethane-ureas namely, B12-PUUs
and B22-PUUs were synthesized by incorporation of pendent aliphatic chains on the
hard segments. An equivalent hard and soft segment composition was maintained in
order to achieve maximum phase separation. Also, a series of model hard segment
copolymers was synthesized by using IPDI and a combination of 1,4-butanediol and
n-dodecyl 3,5-diaminobenzoate in similar compositions as used in B12-PUUs. Glass
transitions of these hard segment copolymers were found to increase with the
concentration of diamine. Whereas, a progressive decrease in the mass density of
these copolymers was observed.
Morphology of PUUs was investigated to understand the role of systematic
variation of the amount and the length of the aliphatic chain in hard segment. The
morphologies of three series of PUUs were characterized at molecular, mesoscopic
and macroscopic length scales.
On the basis of the detection of the ordered hard segment hydrogen bonding
and the observation of two glass transitions in DSC and DMA, we conclude that the
National Chemical Laboratory
168 Conclusions and Future Work
control polyurethane sample L-PU synthesized in this study has a microphase
separated hard and soft phase morphology. Signature of soft segment crystallization
as seen in 2nd heat DSC scan also suggests purity of PTMO phase in the sample. The
presence of microphase separated morphology was validated by SAXS and
rheological analysis. L-PU showed a strong scattering in small angle region with
average domain periodicity of 15.7 nm and the presence of a sharp phase interface.
The sample displayed highest average periodicity possibly resulting from greater hard
segment ordering. There is a correlation seen in the high temperature FTIR and the
SAXS data of this sample. On heat treatment, hard segment hydrogen bonding
changes from a relatively more ordered state to an increasingly disordered state. The
average interdomain spacing increases with temperature, especially above 100oC.
Both evidences suggest gradual mixing of hard segments with soft segments with
increase in temperature. Rheological studies showed failure of time-temperature-
superposition (TTS) over the entire range of temperatures thereby independently
supporting microphase segregated morphology.
Presence of strong hard segment hydrogen bonding is also observed for L-
PUUs. However, the strength of the N-H hydrogen bonds was found to be lower than
that of L-PU as suggested by shifting of bonded N-H absorption peak to higher
wavenumbers with increasing concentration of m-phenylenediamine. This is thought
to be due to introduction of a defect or kink in the form of aromatic ring in hard
segments resulting in formation weaker hydrogen bonds than L-PU. Experimental
findings from DSC, DMA and SAXS indicate enhanced phase separation in this series
of PUUs. DSC and DMA provide a clear evidence of a relatively pure soft segment
phase as suggested by the reduced soft segment Tgs compared to L-PU. L-PUU50
sample displayed a peak due to soft segment crystallization. Increased hard segment
Tgs for these samples were more clearly resolved in DMA. One would expect an
increase in hard segment Tgs from a similar trend seen in the model hard segment
copolymers synthesized using B12-diamine. Small intermediate transitions around
(0oC) seen in these polymers, particularly well seen in DMA, can be attributed to the
diffuse phase interface. Porod scaling in the SAXS analysis provides a support to this
hypothesis. Average periodicities, as obtained from strong scattering of L-PUU10
(14.7 nm) and L-PUU50 (15.2 nm) are not very different from the periodicity of L-PU
(15.7 nm). Introduction of m-phenylenediamine was thus found to enhance phase
separation of hard and soft segments along with the formation of a diffuse interface.
National Chemical Laboratory
169 Conclusions and Future Work
B12-PUUs displayed progressively disordered hard segment hydrogen
bonding in FTIR. This correlates well with the DSC, DMA and rheology
measurements all of which suggest increased phase mixing of hard and soft segments
driven by the B12 diamine. Decaying SAXS signal for this series of copolymes could
be due to two reasons 1) pendent aliphatic chains favour phase mixing, and 2)
presence of aliphatic chains on the hard segment reduces the electron density contrast
between the phases and making them invisible in SAXS. SAXS analysis also reveals a
systematic decrease in average periodicity values relative to L-PU. Even a small
amount of mixing of soft segments in hard segments is found to favour successful
superposition of frequency sweep data by TTS. Incorporation of B12 diamine thus
leads to decreased hard segment packing as well as plasticization of hard segments
and their mixing with the soft segment phase. However, the presence of a discernable
soft segment Tg even in B12-PUU100, as seen in DSC and DMA, indicates that the
phase mixing is incomplete.
The microstructural organization of B22-PUUs is intriguing. FTIR analysis
demonstrates disordered hard segment hydrogen bonding. N-H absorption region in
B22-PUU100 also shows presence of free N-H groups as well N-H groups bonded to
soft segments. B22 diamine incorporation did not influence soft segment Tgs of B22-
PUUs indicating that the phase is relatively unmixed even at the highest diamine
content. DSC thermograms of B22-PUU50 and B22-PUU100 displayed endotherms
that can be ascribed to the crystalline melting of C22 pendent chains. In B22-PUU100
the endotherms had higher peak temperatures than those in B22-PUU50 and this
sample also showed a crystallization exotherm at 27oC. Presumably the concentration
of C22 chains is sufficient to form a 3D ordered crystalline phase. The fairly high
enthalpies observed for these melting transitions together with the WAXD evidence
supports the proposition of C22 chain crystallization. C22 chains are known to
crystallize into triclinic phase through a metastable rotator phase on heating and
cooling. The known lattice spacings for the rotator phase matched with those
observed in the B22-PUU100 sample. Intermediate endotherms around 10oC seen in
these samples could be originating from weak associations of C22 chains. The
temperature at which the first melting peak was observed in DSC corresponded with
the temperature at which segmental relaxation was observed in DMA response of
B22-PUU50 and B22-PUU100. Due to the loss of electron density contrast, SAXS
failed to give any information on the morphology. Based on FTIR, DSC and DMA
National Chemical Laboratory
170 Conclusions and Future Work
analysis we propose that B22-PUU50 and B22-PUU100 have three-phase
morphology: a soft segment phase, a hard segment phase and a crystalline C22 phase.
We do not have adequate experimental evidence to ascertain the location of the third
phase. But it is more likely to be located near the soft segment phase.
6.2 Future Work Series of short chain branched polyurethane-ureas synthesized in the present
work show interesting effects on the hard segment microstructure. A systematic effect
of the length as well as the amount of the aliphatic branch has been observed by
employing various morphological techniques. However, a real space morphological
analysis such as AFM imaging can provide a direct evidence of the microstructure.
AFM has been used widely for imaging polyurethane microstructure.
Following Figure 6.1 shows a plot of average periodicity values of L-PU,
B12-PUU10 and B22-PUU10 while heating and cooling cycles in SAXS scattering
experiments. Figure shows an interesting trend of hysteresis observed in the three
samples. It would be interesting to study this behavior further. We are not aware of
any literature reports on the observation of hysteresis in SAXS experiments on
polyurethanes.
Similar hysteresis has also been observed in rheological behavior (dynamic
temperature ramp test) of these samples as provided in the following figures 6.1, 6.2
and 6.3. These examples indicate the temperature sensitivity of morphology. Yoon
and Han1 report a similar rheological finding. Hysteresis of this kind has also been
noticed for microphase separated block copolymers2 and is an interesting area of
further investigations.
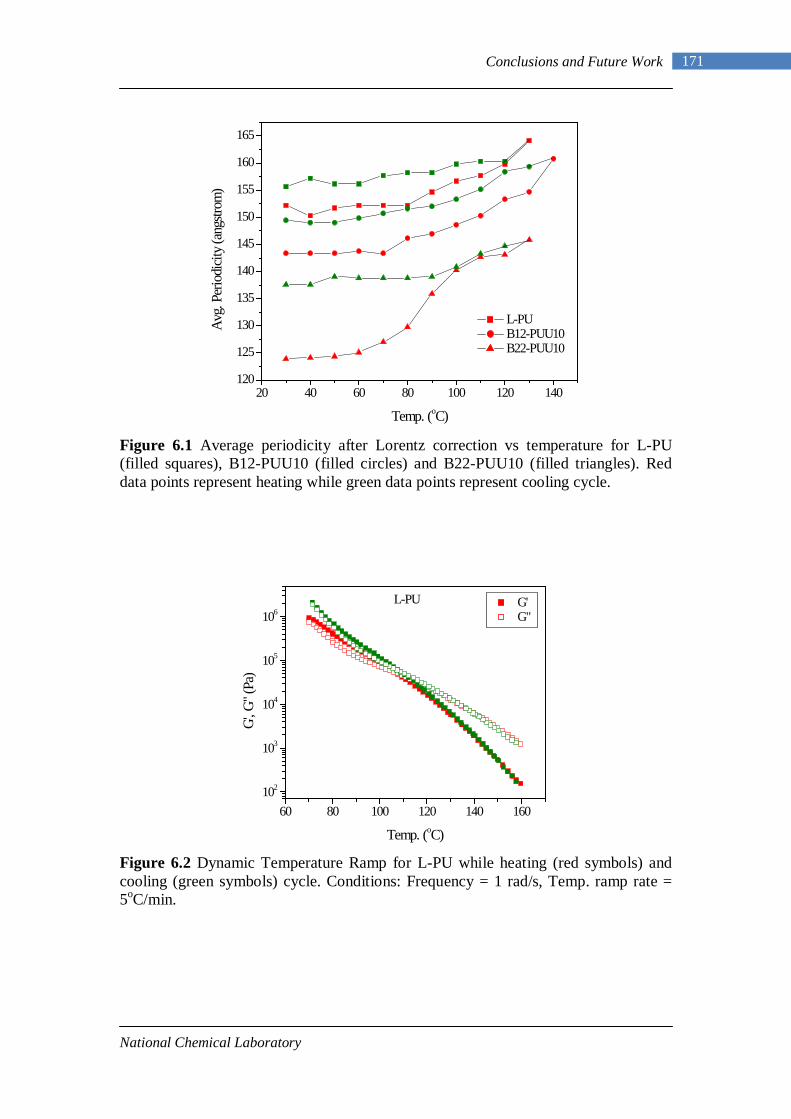
National Chemical Laboratory
171 Conclusions and Future Work
Figure 6.1 Average periodicity after Lorentz correction vs temperature for L-PU (filled squares), B12-PUU10 (filled circles) and B22-PUU10 (filled triangles). Red data points represent heating while green data points represent cooling cycle.
Figure 6.2 Dynamic Temperature Ramp for L-PU while heating (red symbols) and cooling (green symbols) cycle. Conditions: Frequency = 1 rad/s, Temp. ramp rate = 5oC/min.
20 40 60 80 100 120 140120
125
130
135
140
145
150
155
160
165
L-PU B12-PUU10 B22-PUU10
Avg.
Perio
dicit
y (an
gstro
m)
Temp. (oC)
60 80 100 120 140 160102
103
104
105
106L-PU
G', G
" (Pa
)
Temp. (oC)
G' G"
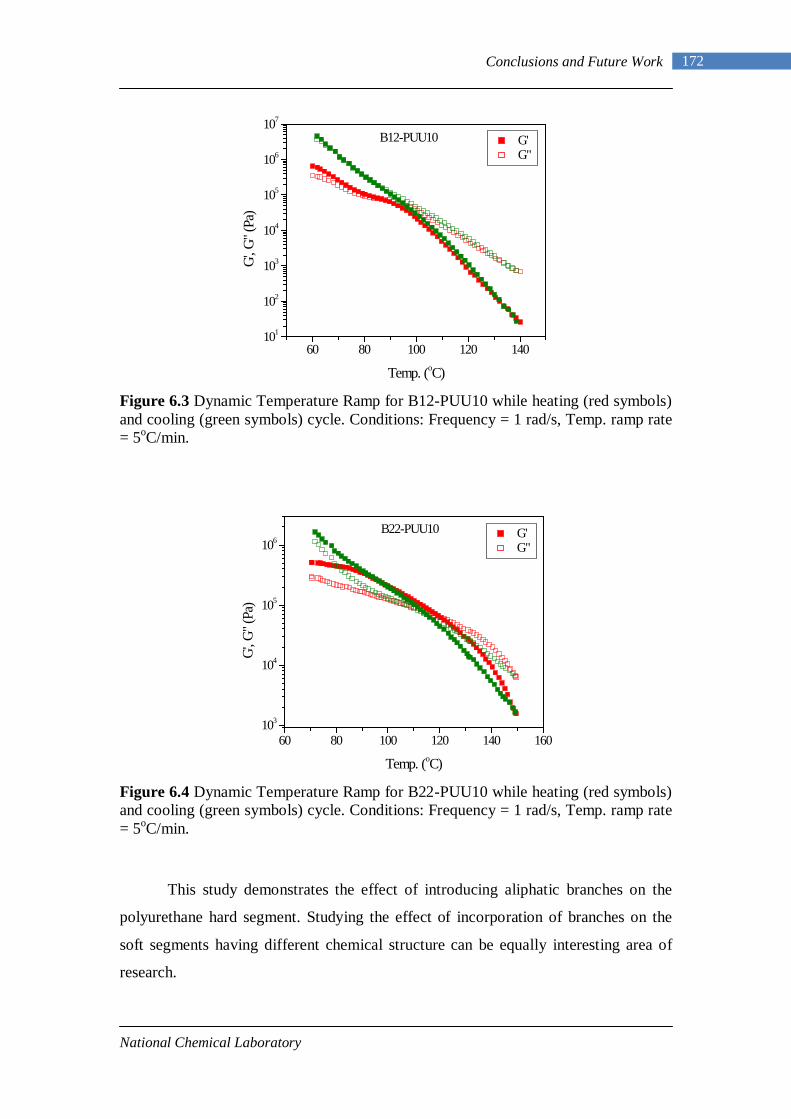
National Chemical Laboratory
172 Conclusions and Future Work
Figure 6.3 Dynamic Temperature Ramp for B12-PUU10 while heating (red symbols) and cooling (green symbols) cycle. Conditions: Frequency = 1 rad/s, Temp. ramp rate = 5oC/min.
Figure 6.4 Dynamic Temperature Ramp for B22-PUU10 while heating (red symbols) and cooling (green symbols) cycle. Conditions: Frequency = 1 rad/s, Temp. ramp rate = 5oC/min.
This study demonstrates the effect of introducing aliphatic branches on the
polyurethane hard segment. Studying the effect of incorporation of branches on the
soft segments having different chemical structure can be equally interesting area of
research.
60 80 100 120 140101
102
103
104
105
106
107
B12-PUU10
G', G
" (Pa
)
Temp. (oC)
G' G"
60 80 100 120 140 160103
104
105
106B22-PUU10
G', G
" (Pa
)
Temp. (oC)
G' G"
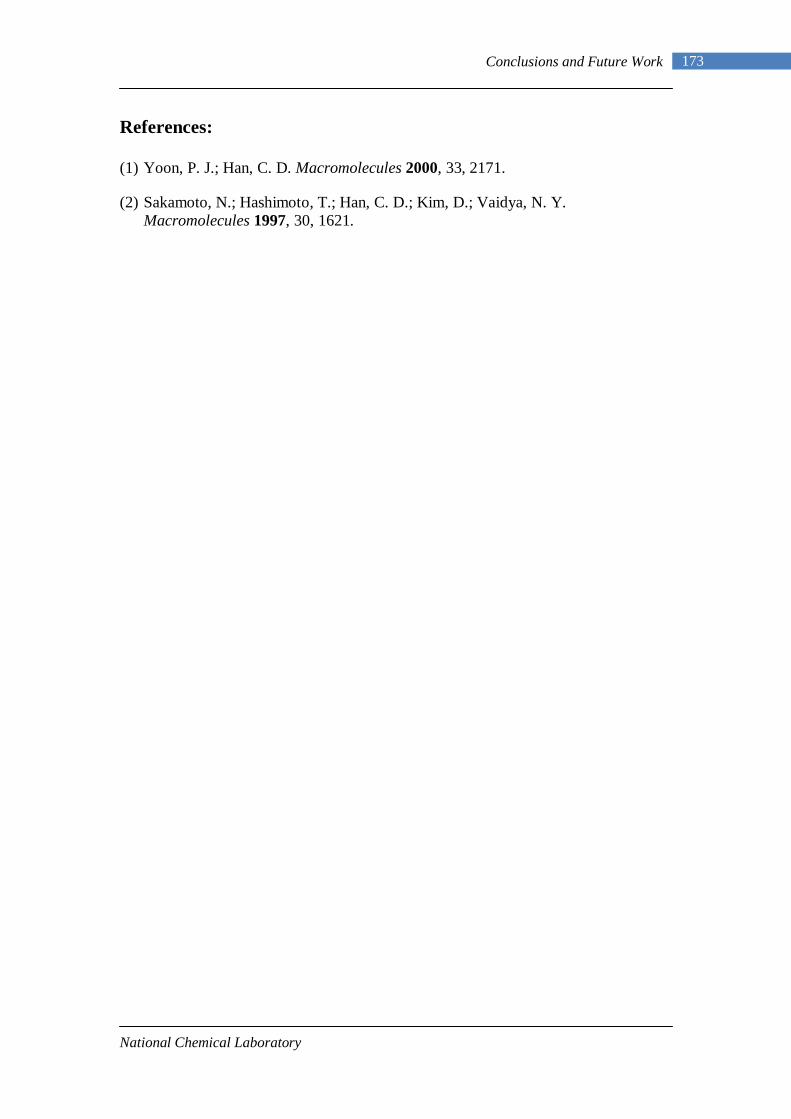
National Chemical Laboratory
173 Conclusions and Future Work
References:
(1) Yoon, P. J.; Han, C. D. Macromolecules 2000, 33, 2171.
(2) Sakamoto, N.; Hashimoto, T.; Han, C. D.; Kim, D.; Vaidya, N. Y. Macromolecules 1997, 30, 1621.