Embed Size (px)
Citation preview

Studies on Genetic Diversity, Al Tolerance Selection Method and Effectiveness of Al Tolerance Breeding Program in
Sorghum (Sorghum bicolor (L.) Moench)
2004. 3
Tokyo University of Agriculture and Technology United Graduate School of Agriculture Science Science of Plant and Animal Production Course
A N A S

Studies on Genetic Diversity, Al Tolerance Selection Method and Effectiveness of Al Tolerance Breeding Program in Sorghum
(Sorghum bicolor (L.) Moench)
by
A N A S
Born in Pamekasan, Indonesia
Doctoral Dissertation
Submitted to United Graduate School of Agricultural Science
Tokyo University of Agriculture and Technology
for the degree of Doctorate of Agriculture
March, 2004

This research was conducted from April 2001 to December 2003 at Utsunomiya
University. Some parts of this dissertation have been published in Plant Production
Science Journal (Crop Science Society of Japan – CSSJ –
http://wwwsoc.nii.ac.jp/cssj/pps/index.html).
1. Anas and Yoshida, T. 2000. Screening of Al–tolerant sorghum by hematoxylin
staining and growth response. Plant Prod. Sci. 3:246 – 253.
2. Anas and Yoshida, T. 2002. Genotypic difference of Sorghum bicolor in the callus
formation and callus growth on aluminum-containing medium. Plant Prod. Sci.
5:242 – 247.
3. Anas and Yoshida, T. 2004. Genetic Diversity among Japanese Cultivated Sorghum
Assessed with Simple Sequence Repeats Markers. Plant Prod. Sci. Vol.7. No.2. In
press.
4. Anas and Yoshida, T. 2004. Sorghum Diversity Evaluated by Simple Sequence
Repeat (SSR) markers and Phenotypic Performance. Plant Prod. Sci. Vol.7 No.3. In
press.
5. Anas and Yoshida, T. 2004. Heritability and Genetic Correlation of Al-tolerance
with Several Agronomic Characters in Sorghum Assessed by Hematoxylin Staining.
Plant Prod. Sci. Plant Prod. Sci. Vol.7 No.3. In press.

ii
Contents
GENERAL SUMMARY…………………………………………….….… iii SUMMARY……………………………………………………………..… iv
I. INTRODUCTION………………………………………………………… 1
II. EVALUATION OF SORGHUM GERMPLASM………………………… 8
2.1. Genetic Diversity among Japanese Cultivated Sorghum Assessed with
Simple Sequence Repeats (SSR) Markers………………………………... 8 2.2. Correlation between Molecular Analysis Using Simple Sequence Repeats
(SSR) Markers and Phenotypic Performance Data in Sorghum………….. 22
III. DEVELOPMENT OF AL TOLERANCE SCREENING METHOD……. 33
3.1. Screening of Al-tolerant Sorghum by Hematoxylin Staining Method….... 33
3.2. Screening of Al-tolerant Sorghum by Growth-response Method………… 40
IV. DEVELOPMENT OF SORGHUM TOLERANCE TO AL TOXICITY... 50
4.1. Genetic Correlation, Heritabiity and Genetic Gain of Al tolerance……... 50
4.2. Path Coefficient Analysis of Al tolerance and Several Agronomic
Characters of Sorghum…………………………………………………... 59
V. FUTURE DEVELOPMENT OF AL−TOLERANT GENOTYPE………. 67
5.1. Genotypic Difference of Sorghum in Callus Formation and Callus
Growth on Al-containing Medium………………………………………. 67
5.2. Direct Gene Transfer to Anther and Floret-derived Callus of Sorghum
by Particle Bombardment………………………………………………... 77
VI. GENERAL CONCLUSION……………………………………………… 87
ACKNOWLEDGEMENT……………………………………………….. 91
REFERENCES…………………………………………………………... 93

iii
General Summary
Breeding of sorghum tolerance to aluminum toxicity is necessary to improve
sorghum production in the arid and semi-arid tropical area. Therefore, evaluation of
sorghum germplasm, developments of Al tolerance screening technique and
development of sorghum genotypes with Al tolerance were carried out in this study.
SSR markers could discriminate the sorghum germplasm. Sorghum materials
used in this study revealed a wide genetic background. The field experiment also
exhibited a wide phenotypic and genotypic variation and a significant correlation was
found with genetic diversity assessed by SSR markers.
Hematoxylin staining method was proven to be an accurate indicator for Al
tolerance and showed a significant correlation with the method by Al-added soil in pots.
Some candidate parental lines were selected for using in the breeding program.
Crossings between Al-tolerant and high yield genotypes were conducted. The
moderately low heritability of Al tolerance and small genetic gain were observed. Dry
weight and plant height were most closely associated with Al tolerance based on path
analysis, indicating that selection for high dry weight and selection of Al tolerance in
early generations was more appropriate to maximize the Al tolerance.
Tissue culture was proven to be a useful tool for selecting Al-tolerant plants at
the callus level. The differences in callus growth and the percentage of callus formation
among genotypes were in agreement with those in the hematoxylin staining screening
method. Direct gene transfer into florets-derived sorghum callus using particle
bombardment gave GUS gene (gene encoding β-glucuronidase) activities in the callus.

iv
Summary
Results of experiments that were carried out in order to develop high yield
sorghum genotypes with Al tolerance are shown as follows:
1. All nine simple sequence repeats (SSR) markers showed polymorphic. Diversity
indices of each locus marker ranged from 0.70 (Sb6-34) to 0.94 (Sb1-10). Japanese
cultivated sorghum showed a wide genetic background, however genotypes from the
same place of collection tended to have a close genetic background. The breeding
materials in this study that included genotypes from ICRISAT, Japan and USA
showed a narrower genetic background than Japanese cultivated sorghum and were
distinctly separated from them.
2. Agronomic traits as 1000-grain weight, harvest index, length of head, plant height,
stalk diameter and dry weight showed highly significant differences and the
variation of heritabilities was observed. Principal component analysis could explain
71% of the total variation. The Spearman rank dissimilarity matrix obtained using
phenotypic data was significantly correlated with that obtained with SSR markers.
All combinations of phenotypic data were highly correlated with SSR marker data.
3. Hematoxylin staining screening method, which was conducted by staining seedling
roots, could be used to screen sorghum tolerance to Al toxicity. Variation of Al
tolerance was observed among sorghum genotypes and could be classified into three
groups: (i) tolerant genotypes (G4, Real 60, SPA2, SPAD, H11/C8, H11/H2); (ii)
susceptible genotypes (G2, G8, G9-1, C9/D12, C9/H11, C9/H13, C9/H2, H13/D12);
(iii) intermediate genotypes (G3, G6, G7, H11/H13, H11/D12, C8/D12,
TX403/H13).

v
4. By the growth-response method, which was conducted in Al-added soil in pots,
eight genotypes (G3, G4, G7, H11/C8, Real 60, SPA2, SPAD and PI533869)
showed tolerance to Al toxicity. Five genotypes (G4, H11/C8, Real 60, SPA2,
SPAD) showed tolerance to Al toxicity by both screening methods. C9/H13 showed
susceptibility to Al by both methods. These facts show that a similar evaluation for
Al tolerance can be obtained by these two methods. For evaluation of large number
of genotypes, the hematoxylin staining method is more convenient than the
growth-response method.
5. Heritability of Al tolerance in sorghum was moderately low (H = 0.35 and H = 0.43)
in two crosses. Consequently, low genetic gain of Al tolerance was also observed.
High allocation of resources in early generations for Al tolerance and high selection
intensity of Al tolerance must be applied if higher gain for Al tolerance is to be
obtained. Low genetic correlations in some agronomic traits and inconsistent
relationship with the phenotypic correlations were observed.
6. The correlations among agronomic traits for two crosses showed that dry weight,
length of head, grain weight plant-1 and plant height were significantly positively
correlated to each other. The same directions of correlations were shown by
agronomic traits and Al tolerance in both crosses. However, for one cross dry weight
and grain weight plant-1 were highly significantly correlated with Al tolerance in F3,
whereas dry weight, length of head, grain weight plant-1, days to flowering, plant
height and Al tolerance in F2 population showed a strong correlation with Al
tolerance in F3 for another cross.
7. The multiple linear regression model of two populations for six- independent
vi
agronomic variables explained the 50%∼60% variation of Al tolerance. Dry weight
and plant height were important components in relationships with Al tolerance.
However, based on the overall correlation data and path analysis data, the increasing
of dry weight and high selection intensity of Al tolerance was more appropriate to
maximize the Al tolerance in sorghum.
8. The percentage of callus formation and the callus growth on Al-containing medium
varied with the genotypes, indicating that the tissue culture could be used to screen
Al-tolerant genotypes. The differences in callus growth and the percentage of callus
formation among genotypes were in agreement with those in the hematoxylin
staining.
9. Activities of GUS genes were observed in floret-derived calli that were bombarded
with three DNA plasmids (pAct1-D, pWI-GUS and pEX7113). GUS activity was
observed in all of 2∼3 weeks old floret-derived calli, which was higher than that in
6∼7 weeks old floret-derived callus. The pWI-GUS construct carrying double
CaMV 35S promoter gave the highest gene transformation in sorghum callus.
10. In conclusion, genetic diversity of sorghum germplasm was assessed using DNA
markers, which also showed association with the phenotypic varia tion in field
experiment. Precise and reliable Al screening technique was established and
effectiveness of selection could be improved by available information of genetic
gain and direct or indirect effect of agronomic traits on Al tolerance. Tissue culture
could be used to assist in identification of Al-tolerant genotype. Direct gene transfer
using particle bombardment was possible. All of these findings could contribute to
the Al tolerance breeding in sorghum.

1
I. Introduction
Originally, sorghum (Sorghum bicolor (L.) Moench) is found in Africa about
5000 years ago. Ethiopia including adjacent areas of northeast of Africa is known as a
source of genetic diversity in native sorghum in the world (Poehlman and Sleper, 1995).
The world’s production of sorghum is about 54.5 million metric ton in 2002, making it
the world’s fifth leading cereal grain, after maize, rice, wheat, and barley (FAO, 2003).
Sorghum is extensively grown in the semi-arid tropics of Africa and Asia, and
was occupied more than 81% of the total area harvest in the world (FAO, 2003).
Sorghum also has the distinct advantage compared to maize of being drought-resistant
and is grown on a subsistence level by farmers in these regions as a staple food crop for
home consumption (Murty and Kumar, 1995). However, sorghum yields hectare-1 in
Africa and Asia are 0.86 and 0.98 ton, respectively, which are much lower than sorghum
yield in Europe (3.36 ton), Australia (2.55 ton) and USA (3.76 ton).
Although sorghum is well adapted in the semi-arid tropical area, the yield is
limited by chemical constraints such as high levels of phytotoxic minerals in the soil.
The most of the soil in this area are acidic in nature (Fig.1) and aluminum (Al) has been
recognized as a major problem in most of acidic soils (Baligar et al., 1989).
Approximately 68% of America’s tropical land, 38% of Asia’s tropical land and 27% of
Africa’s tropical land are classified as acid soil (Martinez and Estrella, 1999; Delhaize
and Ryan, 1995).
Sorghum is generally not tolerant to high Al saturation in the acid soil. Liming
is commonly recommended to raise the pH and change the Al exchangeable in order to
improve plant growth. However, lime is costly, difficult to obtain in many countries
and highly impractical for wide areas. There has been, therefore, a consideration to

Chapter 1 Introduction
2
Fig. 1. Map of world soil resources based on WRB and the FAO/UNESCO soil map of the world. Three colors ( , , ) show acid soil and soil with high Al contents (FAO/AGL-WRB Map of Soil Resource, 1990).
make efforts in breeding sorghum tolerant to Al.
Three of the important decisions in selection of parents for population
development include (i) identifying sources of parental germplasm, (ii) identifying the
characters to be improved, (iii) understanding how the characters are inherited (Fehr,
1987). Generally, evaluation of germplasm is the first step in the utilization of
germplasm. Evaluation of germplasm involves characterization of the plant performance,
observation of the genetic diversity and estimation of the genetic relationship among
plants. Genetic distance or genetic diversity among plants in germplasm will provide an
opportunity in selection of superior plants that can be used as a parent in a cultivar
development program.
Simple sequence repeats (SSR) technique is powerful for the studying genetic
diversity in some crops because it utilizes hypervariable regions of the genome comprised
of tandemly repeated simple sequences (Karp et al., 1996). There were some utilization

Chapter 1 Introduction
3
of SSR markers in study of the genetic diversity and genetic redundancy in sorghum
germplasm (Dje et al., 2000; Ghebru et al., 2002; Dean et al., 1999). However,
information of the genetic diversity among Japanese cultivated sorghum using
high-throughput SSR technology has not established yet. Moreover, information of the
relationship between Japanese cultivated sorghum and the breeding materials that have
some superior characters is very useful for an efficient sorghum-breeding program.
Performance of a plant in field will determine whether it would be chosen in a
breeding program. Phenotypic variances that are basically resulted from interaction
between environment variance and genotypic variance should have correlations with
genetic diversity in the molecular level. If genetic basis of plant variation is known,
effectiveness of plant breeding will also increase (Fehr, 1987). Therefore, phenotypic
variance that closely related to the gene diversity would increase the effectiveness of plant
breeding. Reif et al. (2003) reported that there was relationship between SSR markers and
the heterosis grouping in a tropical maize population. However, few papers about
correlations between phenotypic performance and SSR data markers in sorghum were
reported.
The effectiveness of Al tolerance breeding program also depends on the
efficiency of the screening method that can visually identify the most desirable character
of a plant. Development of Al-screening method that has high accuracy in screening of
Al-tolerant plants is very helpful in a plant breeding program. Almost all the Al-screening
methods have used seedling or root development as parameters of Al tolerance. Konzak et
al. (1976) suggested that the screening systems not dependent on the rate of seedling or
root development would greatly improve the success of the Al-screening procedure.
Hematoxylin staining screening method that could combine the accuracy and
simplicity would be more useful than other screening methods. However, there have been

Chapter 1 Introduction
4
no reports on the use of hematoxylin staining method in the screening of Al-tolerant
sorghum.
It is hard to find the homogeneous acid soil in a field and environmental factors
interacting with soil Al may sometimes mask the expression of Al tolerance (Campbell
and Carter, 1990). Therefore, screening by using the growth response to Al added to the
soil in pots in a greenhouse may be superior in this respect. The hematoxylin staining
screening methods will be more powerful if it also shows a correlation with Al-screening
in the pots.
Understanding of the inherited pattern of Al tolerance will determine the
efficiency of Al-screening methods (Fehr 1987). Genotypic variance of Al tolerance in
sorghum has been reported (Flores et al., 1988) and variation in genetic controls of Al
tolerance was also reported (Martinez et al., 1999). Boye-Goni and Marcarian (1985)
estimated the high narrow-sense and broad-sense heritability of Al tolerance in sorghum
using nutrient solution culture method. On the other hand, Gourley et al. (1990) reported
that Al tolerance was inherited as a dominant character with low narrow sense heritability
for shoot and root dry matter production based on green house acid soil study. Therefore,
estimation of Al tolerance heritability using hematoxylin staining screening method is
necessary in this respect.
Since the Al tolerance must be identified as an important agricultural trait,
correlations between Al tolerance with primary agronomic traits will be most important.
The studies on correlated characters are important to know how the improvement of one
character will cause simultaneous changes in other characters (Falconer and Mackay,
1996). Therefore, studies on genetic correlations between Al tolerance and several
agronomic characters will lead to the efficiency in Al-breeding methods.
Consideration of correlated responses suggests that indirect selection might be

Chapter 1 Introduction
5
possible to achieve more rapid progress than direct selection for the desired character itself
(Falconer and Mackay, 1996). Significant correlations might be observed between Al
tolerance and several agronomic characters and path analysis is necessary to partition the
relative contribution of components via standardized partial-regression coefficient and
measures the direct influence of one variable upon another (Dewey and Lu, 1959).
Genetic gain of Al tolerance is very important information for allocation of
resources in each generation of selection. Selection intensity and effectiveness of direct
selection can be determined appropriately if the genetic gain information is also available.
Moreover, information of genetic gain would guide the breeders toward optimum
allocation of resources in one stage of selection (Martin and Futi, 2000). However, few
published researches about genetic gain of Al tolerance in sorghum are available.
The use of tissue culture to select Al tolerance genotypes at the cellular level has
been reported in a number of crop species (Ojima and Ohira, 1983; Smith et al., 1983;
Duncan et al., 1995; Conner and Meredith, 1985a; Barnabas et al., 2000). Unfortunately,
almost all of the previous selection of tolerant callus was dependent on the variation of Al
tolerance appeared during the culture process, but was not in the original explants. Parrot
and Bouton (1990) reported that alfalfa plants from the Al- tolerant germplasm rapidly
expressed Al tolerance at the callus stage and consequently the selection by tissue culture
can be applied to identify Al-tolerant plants. However, this approach has not been applied
to sorghum.
The biolistic system, particle bombardment, is widely used for delivery of genetic
materials directly into intact cells and tissues. Liu et al. (2003) reported that the promoter
played a crucial role in successful gene transformation studies. The different activities of
some promoters were observed in sorghum (Emani et al., 2002), sugarcane (Liu et al.,
2003) and tall fescue (Takamizo, 1996). The usefulness of promoters (DNA plasmids) in

Chapter 1 Introduction
6
genetic engineering depends on the number of genes expressed in target cells or tissues
after bombardment. Therefore, preliminary evaluation of usefulness of DNA plasmid must
be constructed on the transient GUS expression in anther and floret-derived callus of
sorghum.
Some series of experiments were carried out in this study in order to resolve the
problems in breeding of Al-tolerant sorghum, and look for the efficient selection and
breeding method of Al tolerance in sorghum. Generally, all experiments in this study can
be summarized into four main topics as follow: (1) germplasm evaluation; (2)
identification of character to be improved; (3) understanding how the character is inherited,
(4) practical aspect of a development program. Illustration of the entire experiments,
which show the systematical method employed in this study, is shown in Fig. 2. In this
study, a series of experiments are included as follows:
1. Genetic diversity among Japanese cultivated sorghum assessed with molecular analysis
using simple sequence repeats (SSR) markers.
2. Correlation between molecular analysis using simple sequence repeats (SSR) markers
and phenotypic performance data in sorghum.
3. Screening of Al-tolerant sorghum by hematoxylin staining method.
4. Screening of Al-tolerant sorghum by growth-response method.
5. Genetic correlation, heritabiity and genetic gain of Al tolerance.
6. Path coefficient analysis of Al tolerance and several agronomic characters of sorghum.
7. Genotypic difference of sorghum in the callus formation and callus growth on
Al-containing medium.
8. Direct gene transfer to anther and floret-derived callus of sorghum by particle
bombardment.

Chapter 1 Introduction
7
Fig. 2. A flow chart of the systematical method of Al tolerance breeding employed in this
study.
Evaluation of Sorghum Germplasm
Phenotypic and genotypic variation in field experiment
Gene diversity based on DNA technology relationship
Hematoxylin staining screening method
Pot method with Al-added soil (Growth response method)
Development of sorghum tolerance to Al toxicity
correlation
Callus performance on Al-stressed
medium
Tolerant X Susceptible
Field
performance
of progenies
Direct gene transfer using particle bombardment
High yield sorghum with tolerance to Al
Heritability, genotypic correlation,
genetic gain, direct and indirect effect
on Al tolerance

8
II. Evaluation of Sorghum Germplasm
2.1. Genetic Diversity among Japanese Cultivated Sorghum Assessed with Simple Sequence Repeats (SSR) Markers
Simple sequence repeats (SSR) or microsatellite is a short specific sequence of
DNA bases or nucleotides, which can contains mono, di, tri, or tetra tandem repeats.
Microsatellites are highly variable between individuals and distribute widely throughout
the genome. SSR markers are highly discriminative and are often used to distinguish
varieties, or even individuals, and reveal parentage and identity (Karp et al., 1996).
SSR markers are useful indices for the studying the genetic diversity of the world
sorghum germplasm, and were used for the study of Eritrean sorghum landraces, the elite
sorghum inbred lines and the sorghum from Southern Africa (Djè et al., 2000; Ghebru et
al., 2002; Smith, et al., 2000; Uptmoor et al., 2003); genetic redundancy in the ‘Orange’
sorghum (Dean et al., 1999); and mapping of sorghum genome (Bowers et al., 2003; Menz
et al., 2002). SSR fingerprints revealed parentage and identity (Karp et al., 1996) and
grouping the maize germplasm based on heterotic groups (Reif et al., 2003). The other
advantages of SSR markers include the need of only small quantities of a DNA sample,
and technical simplicity.
Sorghum is believed to have been brought to Japan about 700~1100 years ago,
probably from China through Korea (Matano, 2000). Recently, sorghum is generally used
as feed and green fodder for livestock in Japan. In recent years, sorghum has been
introduced to Japan from USA and some sorghum cultivars in Japan are probably derived
from them. For effective conservation, selection and use of crop genetic resources in plant
breeding programs, a population should be characterized by the amount and type of
genetic variability it contains (Fehr, 1987). However, the detail of the pedigree history
information of Japanese cultivated sorghum was not known and information of genetic

Chapter 2 Evaluation of sorghum germplasm
9
background and genetic diversity of Japanese cultivated sorghum was not reported yet at
least at the DNA level.
The author and co-workers had bred inbred sorghum lines with superior
characters, such as early maturity, short plant height, high yield and tolerance to Al
toxicity (Anas and Yoshida, 2000; 2002; Can and Yoshida, 1999a; 1999b; Can et al., 1997).
Almost all of the breeding materials were from ICRISAT-India, Kansas-USA and
Chugoku Agriculture Experimental Station-Japan. However, information about genetic
background of these materials using DNA-based techniques and relationship with
Japanese cultivated sorghum was not observed yet.
The objectives of this study were (i) to determine the genetic diversity of
Japanese cultivated sorghum, (ii) to know the diversity of the breeding germplasm and
their relationship with Japanese cultivated sorghum, using high throughput SSR
technology.
Materials and Methods
Plant materials
The sorghum genotypes evaluated in this study, their origins and genotype
grouping are listed in Table 1. Dr. H. Nakagawa (National Institute of Livestock and
Grassland Science-Japan) kindly provided the seeds of Japanese cultivated sorghum,
which are the commercial hybrid sorghum cultivated widely in Japan (entry no. 13~31).
Some of Japanese cultivated sorghums were introduced from USA and some of them were
collected from Nagano and Hiroshima prefecture Japan. They include grass sorghum and
sweet sorghum.
Seed sources of the breeding germplasm (entry no. 1~12) that were derived from
the Institute for the Semi-Arid Tropics (ICRISAT), USA and Chugoku Agriculture
Experimental Station – Japan were obtained as described by Can and Yoshida (1999a).

Chapter 2 Evaluation of sorghum germplasm
10
Table 1. List of genotypes used in this study. EntryNo.
Name Origin/donated Line grouping Agronomic groups and morphological note
1 C9/H11 Utsunomiya University Japan-U.S.A.
(JU)
grain sorghum, early maturity,
Al - susceptible
2 C9/H13 Utsunomiya University Japan-U.S.A.
(JU)
grain sorghum, tall, late
maturity, Al - susceptible
3 H11 Kansas University U.S.A. (U) grain sorghum
4 H13 Kansas University U.S.A. (U) grain sorghum
5 C9 Chugoku Natl. Agric . Exp . Stn. Japan (J) grain sorghum, early maturity
6 C8 Chugoku Natl. Agric . Exp . Stn. Japan (J) grain sorghum
7 ICR3 ICRISAT-India ICRISAT (I) grain sorghum, dwarf, late
maturity, Al tolerance
8 SPA2 ICRISAT-India ICRISAT (I) grain sorghum, Al tolerance
9 Real 60 ICRISAT-India ICRISAT (I) Al tolerance
10 D12 ICRISAT-India ICRISAT (I) grain sorghum
11 SPAD ICRISAT-India ICRISAT (I) grain sorghum, Al tolerance
12 TX403 Kansas U.S.A. (U)
13 Haysudan U.S.A. U.S.A. (U) sudangrass
14 Green A Hiroshima Pref. Agric. Res. Cent. Japan (J) sudangrass
15 Tentaka Nagano Animal Exp. Stn. Japan (J) very late
16 High Sugar Sorgo U.S.A. U.S.A. (U) sorgo
17 Piper U.S.A. U.S.A. (U) sudangrass
18 Suzuho Nagano Animal Exp. Stn. Japan (J) sorgo, silage, fodder
19 Touzan Kou 20 Nagano Animal Exp. Stn. Japan (J)
20 Sendachi Hiroshima Pref. Agric. Res. Cent. Japan (J) sudangrass
21 Dry Sudan II U.S.A. U.S.A. (U) sudangrass
22 Green Hope Hiroshima Pref. Agric. Res. Cent. Japan (J) sudangrass, early green
23 Ryuujin-wase Nagano Animal Exp. Stn. Japan (J) sorgo, early green, silage, fodder
24 Koutobun Snow Brand Seed Co. Ltd. U.S.A. (U) sorgo, high sugar
25 Hybrid Sorgo NK326 Takii & Co. Ltd. U.S.A. (U)
26 Green A (010134) U.S.A. U.S.A. (U)
27 Cyrup Sorgo No.2 U.S.A. U.S.A. (U) sorgo
28 MTCI-Sunrise U.S.A. U.S.A. (U) sudangrass
29 Kazetachi Nagano Animal Exp. Stn. Japan (J) very late, dwarf
30 Sugar Grace U.S.A. U.S.A. (U) sorgo, high sugar
31 Natsuibuki Nagano Animal Exp. Stn. Japan (J) sorgo, silage, fodder
Note: Entry No.1 to 12 are sorghum breeding germplas m and No.13 to 31 is Japanese cultivated sorghum (sorghum lines cultivated in Japan).

Chapter 2 Evaluation of sorghum germplasm
11
Entry no. 1~12 had been selected by the pedigree selection method (early maturity,
short plant height, high yield and Al tolerance) in the same place at the Crop Science
Laboratory – Utsunomiya University.
DNA preparation
Seeds were grown in a growth chamber at 27oC with 12 hours daylight. Genomic
sorghum DNA was isolated from leaves collected from 10- to 15-day-old seedlings using
Nucleon Phytopure (Amersham). Total DNA was extracted from 0.1g fresh weight of
leaves following supplied instructions that yielded about 20 to 100ng total DNA. A 100
dilution of these total DNA extracts was consecutively used for PCR reactions.
SSR primers
In all, nine primer pairs were used for genotyping (Table 2). These
oligonucleotide sequences were derived from SSR-containing clones isolated from a
size-fractionated genomic DNA library of sorghum cultivar RTx430 (Brown et al., 1996).
The SSR markers used are distributed widely across the sorghum linkage groups (A-I),
thus giving the comprehensive coverage of the sorghum genome.
PCR amplification
PCR amplification was performed in a volume of 20µL containing approximately
20ng of templete DNA solution (1µL), 1.23 µg to 4.55 µg of each primer, 1 U Qiagen
PCR buffer, 200 µM of each dNTP, 15 mM MgCl2 and 2.5 U Taq DNA Polymerase (Core
Kit-Qiagen). For maximum yield and specificity, annealing temperature (Tm) and cyling
times were optimized for each primer pair. Annealing temperature was generally set 2oC
below the highest Tm of each primer pair.
Reactions were run in a Takara PCR Thermocycler MP TP3000 (Takara,
Biomedicals) with an initial denaturation step for 4 minutes at 94oC; followed by 30
cycles of 94oC for 1 minute, 60oC to 70oC (depend on primers, Table 2) for 2 minutes and

Chapter 2 Evaluation of sorghum germplasm
12
72oC for 1 minute; followed by a final extension at 72oC for 10 minutes. Samples were not
diluted prior to electrophoresis.
Electrophoresis and detection
In order to obtain a precise estimate of fragment size and to identify small size
differences between fragments, polymorphic PCR products were electrophoresed on 8%
non-denaturing polyacrylamide gels (10 cm length) running vertically. After ethidium
bromide staining, amplified fragments were visualized using LAS-1000UV mini (Fuji
Photo Film Co, LTD) connected with Image Reader Software Version 1.01 (Fuji Photo
Film Co, LTD) and size of DNA fragments was determined using Science Lab. 2001 –
Image Gauge Ver.4.0 software (Fuji Photo Film Co, LTD), which could automatically
recognize the lane and band (the peaks region) and measure the fragment size. Only allele
size of loci that were recognized in some literatures as an amplification product of SSR
was used for genotyping (Table 2). The size of the DNA fragments was determined
relative to the size standard from the 1-kb size marker GIBCO/BRL.
Statistical analyses
Genotypes of individual plants were represented by the allele size at all SSR loci.
Genetic distance was estimated by the pairwise difference method and was calculated for
each haplotype pair using the parameters FST in Arlequin ver. 2.000 software program
(Schneider et al., 2000). Distances (dxy) were estimated by simply counting the number of
different alleles between two haplotypes:
where xyδ (i) is the Kronecker function, equal to 1 if the alleles of the ith locus are identical
for both haplotypes and equal to 0 otherwise.
The resulting dissimilarity matrix was employed to construct dendograms by the
( )idL
ixyxy ∑
=
=1
ˆ δ

Chapter 2 Evaluation of sorghum germplasm
13
neighbor-joining method of Saitou and Nei (1987) and the UPGMA method of clustering
using ‘Neighbor’ program in the Phylip package programs (Felsenstein, 1993).
Performance of tree was optimized by ‘Treeview’ application software (Page, 1996).
The genetic variation of each locus which shows the utility and general
information of the informativeness of each SSR as a tool was measured in terms of the
number of observed alleles and diversity index (Saghai-Maroof et al., 1994) as DI = 1 - ∑
pi2, where pi is the frequency of the ith SSR allele.
Results
Amplification product and estimation of genetic diversity
In this study, null alleles were consistently observed for Sb6-342 in entry no. 4
and its progeny (entry no. 2) that was developed from crossing of the parent. The higher
molecular weight (he teroduplex and faint minor band) than SSR allele band was also
observed in some amplification product. However, nine SSR markers produced all the
expected SSR allele size as were reported in literatures. To confirm the nature of these
SSR alleles, an example of polymorphic SSR alleles of ‘Tentaka’ (entry no. 15) and
‘Touzan Kou 20’ (entry no. 19) was sequenced. Different repeats numbers in SSR alleles
of these genotypes that were amplified using Sb6-342 primer were observed (Fig. 3).
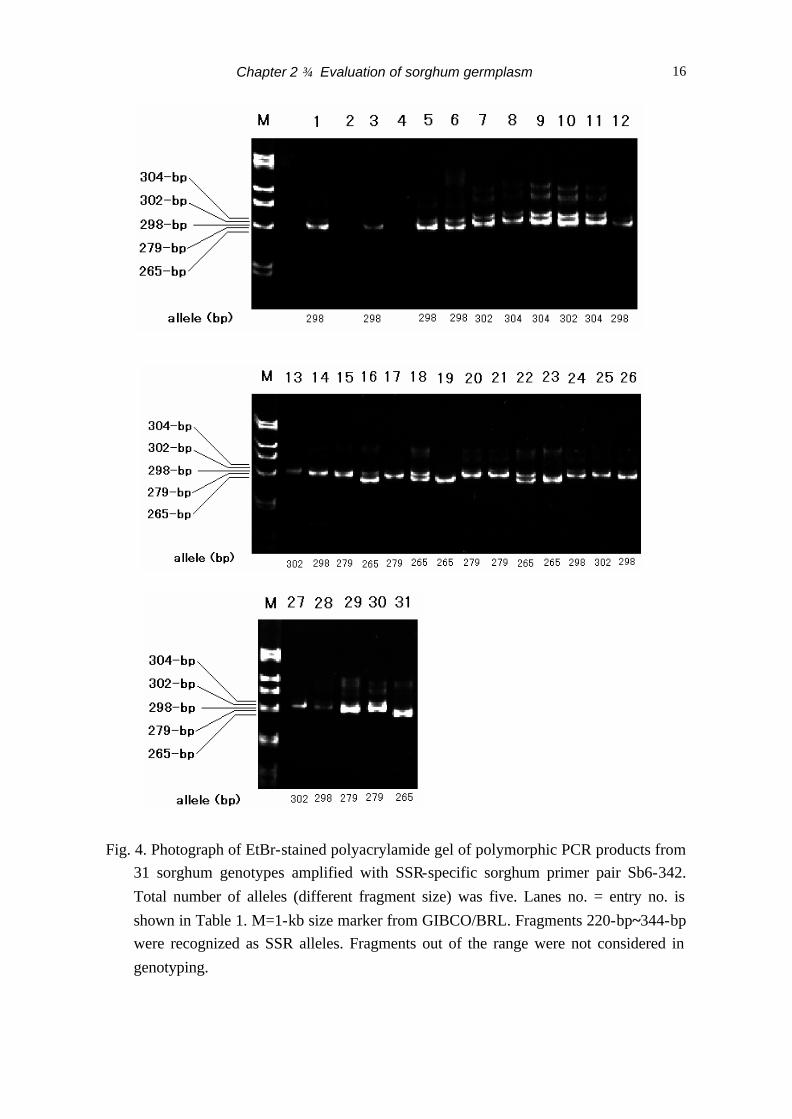
In total, 70 SSR alleles (different fragment size) were observed in this study
(Table 2). All nine loci were polymorphic. Fig. 4 shows the example of the polymorphic
PCR product from 31 sorghum genotypes amplified with SSR-specific sorghum primer
pair Sb6-342. Total number of observed alleles was five. A summary of the number of
alleles and diversity indices for each locus is presented in Table 2. The number of alleles
per locus ranged from four (Sb5-256 and Sb6-34) to 20 (Sb1-10), and the average number
of alleles per locus was 7.2. Diversity indices of each locus ranged from 0.70 (Sb6-34) to
0.94 (Sb1-10).

Chapter 2 Evaluation of sorghum germplasm
14
(A)
repeat region
(B)
repeat region
Fig. 3. Sequence analysis of the SSR alleles amplified with reverse primer Sb6-342 in association with (AC)n repeat number. (A) ‘Tentaka’ (AC)17 (entry no. 15); (B)‘Touzan Kou 20’ (AC)13 (entry no. 19).
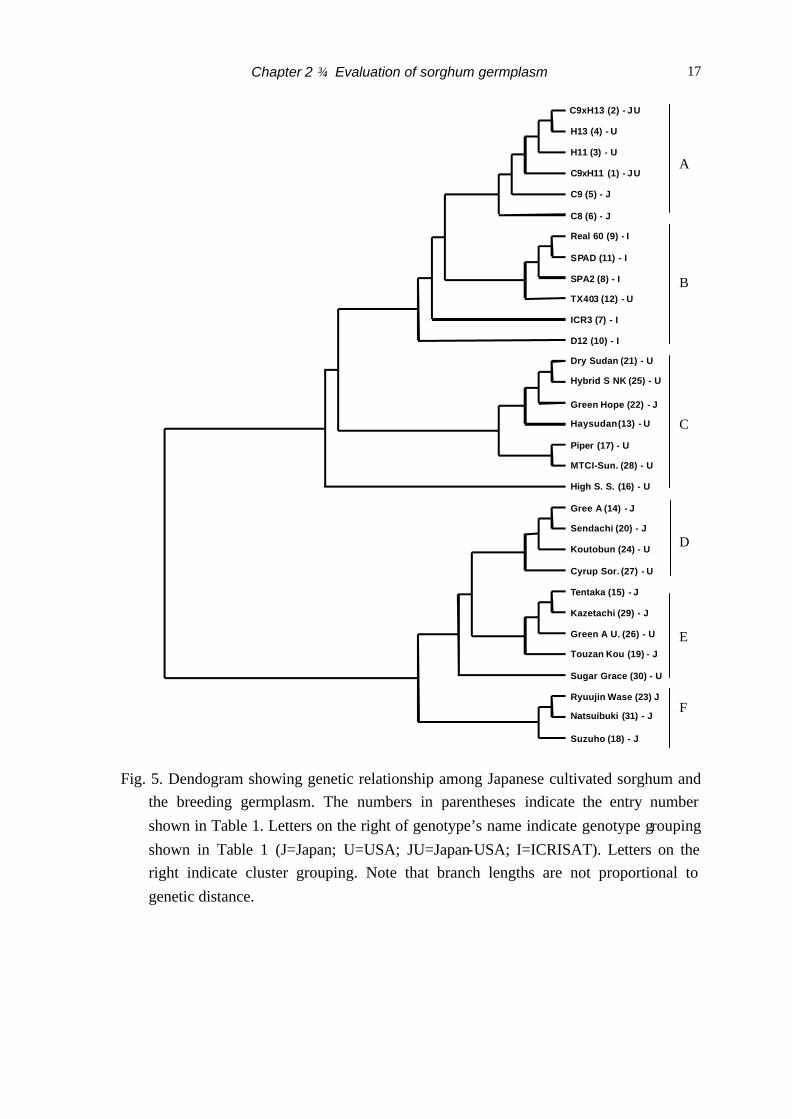
Genetic relationship among genotypes
All of the sorghum genotypes included in this study could be uniquely identified
by nine SSR loci. The clustering of the sorghum genotypes is shown in Fig. 5. All
genotypes were distinctly placed in this dendogram, and showed clustering into six groups
(A – F).
All genotypes from ICRISAT (I genotype) and their progenies (entry no. 7, 8, 9,
10, 11) were clustered into a cluster group B, which were closely neighboring. Genotypes
from Japan (J genotype) were widely scattered into five cluster groups (A, C, D, E and F)
and genotypes from USA (U genotype) scattered into five cluster groups (A, B, C, D, and
E).

Chapter 2 Evaluation of sorghum germplasm
15
Table 2. Characteristic of the nine SSR loci analyzed.
1) RM=repeat motif original publications (Brown et al.,1996); 2) LG=linkage group (Dean et
al.,1999); 3) FS=fragment size (bp); 4) AT=Total No. of observe alleles; 5) DI=diversity index
(Saghai-Maroof et al., 1994).
All genotypes from Nagano or Hiroshima prefecture or Chugoku National
Agriculture Experimental Station tended to be placed in the same cluster group.
Genotypes from Nagano were placed in cluster groups E and F, while genotypes from
Hiroshima were clustered within groups C and D. Genotypes from Chugoku National
Agriculture Experimental Station was clustered within a group A.
SSR
locus
Flanking sequences RM1) LG2) FS3) AT4) DI5)
Sb5-236 F: TGC TTG TGA GAG TGC CTC CCT
R: GTG AAC CTG CTG CTT TAG TCG ATG
(AG)20 G 165-229 10 0.82
Sb6-342 F: TGC TTG TGA GAG TGC CTC CCT
R: GTG AAC CTG CTG CTT TAG TCG ATG
(AC)25 A 265-304 5 0.75
Sb1-1 F: TCC TGT TTG ACA AGC GCT TAT A
R: AAA CAT CAT ACG AGC TCA TCA ATG
(AG)16 H 227-295 9 0.82
Sb1-10 F: GTG CCG CTT TGC TCG CA
R: TGC TAT GTT GTT TGC TTC TCC CTT CTC
(AG)27 D 225-492 20 0.94
Sb5-256 F: AAT TTG CTT TTT GGT CCG TTT
R: TAG GAA AGA CAG TAC TAG AGG TCA
(AG)8 C 154-188 4 0.87
Sb6-84 F: CGC TCT CGG GAT GAA TGA
R: TAA CGG ACC ACT AAC AAA TGA TT
(AG)14 F 164-218 6 0.80
Sb4-72 F: TGC CAC CAC TCT GGA AAA GGC TA
R: CTG AGG ACT GCC CCA AAT GTA GG
(AG)16 B 181-209 7 0.74
Sb5-206 F: ATT CAT CAT CCT CAT CCT CGT AGA A
R: AAA AAC CAA CCC GAC CCA CTC
(AC)13
/(AG)20
E 101-149 5 0.76
Sb6-34 F: AAC AGC AGT AAT GCC ACA C
R: TGA CTT GGT AGA GAA CTT GTC TTC
(AC)
/(AG)15
I 180-202 4 0.70
Chapter 2 Evaluation of sorghum germplasm
16
Fig. 4. Photograph of EtBr-stained polyacrylamide gel of polymorphic PCR products from
31 sorghum genotypes amplified with SSR-specific sorghum primer pair Sb6-342. Total number of alleles (different fragment size) was five. Lanes no. = entry no. is shown in Table 1. M=1-kb size marker from GIBCO/BRL. Fragments 220-bp~344-bp were recognized as SSR alleles. Fragments out of the range were not considered in genotyping.
Chapter 2 Evaluation of sorghum germplasm
17
A
B
C
D
E
F
Fig. 5. Dendogram showing genetic relationship among Japanese cultivated sorghum and the breeding germplasm. The numbers in parentheses indicate the entry number shown in Table 1. Letters on the right of genotype’s name indicate genotype grouping shown in Table 1 (J=Japan; U=USA; JU=Japan-USA; I=ICRISAT). Letters on the right indicate cluster grouping. Note that branch lengths are not proportional to genetic distance.
C9xH13 (2) - JU
H13 (4) - U
H11 (3) - U C9xH11 (1) - JU
C9 (5) - J
C8 (6) - J Real 60 (9) - I
SPAD (11) - I
SPA2 (8) - I TX403 (12) - U
ICR3 (7) - I D12 (10) - I Dry Sudan (21) - U Hybrid S NK (25) - U
Green Hope (22) - J Haysudan (13) - U
Piper (17) - U MTCI-Sun. (28) - U High S. S. (16) - U
Gree A (14) - J Sendachi (20) - J Koutobun (24) - U
Cyrup Sor. (27) - U
Tentaka (15) - J Kazetachi (29) - J
Green A U. (26) - U Touzan Kou (19) - J
Sugar Grace (30) - U
Ryuujin Wase (23) J Natsuibuki (31) - J
Suzuho (18) - J

Chapter 2 Evaluation of sorghum germplasm
18
A cluster group A had two genotypes from USA and a cluster group C included
five genotypes from USA. While two and one genotype from USA were clustered within
groups D and E, respectively.
The breeding germplasm collections that included genotypes from Japan, USA,
ICRISAT and Japan-USA were clustered into cluster groups A and B, and they were
distinctly separated from Japanese cultivated sorghum (cluster groups C, D, E and F).
Within the breeding germplasm, all genotypes from ICRISAT were distinctly placed in a
different cluster group from the genotypes from Japan and USA.
Discussion
SSR diversity and genotyping
Nine of the SSR markers that were applied for the genetic diversity in this study
showed polymorphisms with a relatively high diversity index (Table 2). Brown, et al.
(1996) also observed polymorphisms with a high diversity index. The diversity index of
each SSR locus ranged from 0.70~0.94, which allowed to discriminate each of 31
sorghum genotypes. This suggests that the utility of each SSR maker as a tool in
categorizing sorghum germplasm is high. The diversity index value for comparison with
other types of molecular marker can also be used (Brown, et al., 1996). Nine SSR
markers listed in this study almost covered all different sorghum genomes (Dean et al.,
1999). Thus, these markers should represent a genetic diversity among these sorghum
genotypes.
Null alleles were observed only in one inbred line (parent) and its progeny. There
seemed to be a close relationship between the parents and the progeny in the capability of
SSR amplification. Dean et al. (1999) also observed null alleles for one SSR marker in all
five individual samples of sorghum ‘Orange’. Studies on null alleles in microsatellite
amplification in humans and other mammals have revealed that null alleles are generally

Chapter 2 Evaluation of sorghum germplasm
19
as a result of mutation in the priming region (Callen et al., 1993; Paetkau and Strobeck,
1995).
The minor bands (heteroduplex, faint and shadow bands) have no affect on
occurrence of the SSR allele bands; in fact, they can be useful during gel scoring for
genotype verification because the minor bands are generally consistent (Wang et al., 2003;
Rodriguez et al., 2001). Fait bands were believed to be PCR artifact in homozygous
individuals and heteroduplex was caused by the reannealing of non-complementary
strands during the later rounds of PCR and only occur in heterozygous individuals
(Rodriguez et al., 2001). However in this study, heteroduplex and faint bands were not
considered in scoring and genotyping.
Genetic diversity of sorghum germplasm
Japanese cultivated sorghum that included genotypes from Japan and USA
(genotype grouping J and U) showed a wide genetic background (scattered into groups C,
D, E and F). However, the greater degrees of gene diversity among Japanese cultivated
sorghum were found to be associated with the genotypes from Japan (genotype grouping
J), which were widely scattered in these cluster groups.
Japanese cultivated sorghum that had been collected from various origins in
Japan including research centers and private companies affected apparently a wide genetic
diversity in their background. However, genotypes from the same place of collection
tended have a close genetic background. For example, three pairs of genotypes from Japan
that were placed in the same branch in this study were from the same origin: (1) entry
no.14 and 20; (2) entry no.15 and 29; and (3) entry no.23 and 31.
Yang et al. (1996) using DNA markers (RAPDs and ISSRs) also reported that half
of the Chinese sorghum from the same area (Liaoning) belonged to one group. This
suggests that sorghum genotypes introduced or collected from the same place or country

Chapter 2 Evaluation of sorghum germplasm
20
tended to have a close genetic background. The same or limited genetic source of one’s
country or research center might have caused low genetic diversity among breeding lines.
Except for entry no. 19 (no maturity information), all genotypes from Nagano
within a cluster group E were late or very late maturing (data not shown). This might be
why they were distinctly separated from cluster group F. Ghebru et al. (2002) using
Eritrean sorghum landraces reported that SSR data reflected their morphological
characteristic.
The breeding germplasm (cluster groups A and B) that included genotypes from
ICRISAT, Japan, USA and Japan-USA showed a narrower genetic background than
Japanese cultivated sorghum. Ent ry no. 4 and 5 were parents of no. 2 and they were placed
in the same branch, while no. 1 is the progeny of no. 3 and no. 5 and they were also placed
in the same cluster. Except for no. 9, most of the genotypes from ICRISAT were selected
for resistance to leaf diseases, early vigor, stay-greenness, high yield and Al tolerance.
Smith et al. (2000) reported that SSR data was in agreement with the pedigree information
or performance information.
Conclusion
To my knowledge, this is the first report on genetic relationship among Japanese
cultivated sorghum genotypes based on microsatellite markers. Japanese cultivated
sorghum that included genotypes from Japan and USA showed a wide genetic background,
however genotypes from the same place of collection tended have a close genetic
background. The breeding germplasm that included genotypes from ICRISAT, Japan, USA
and Japan-USA showed a narrower genetic background than Japanese cultivated sorghum
and were distinctly separated from them. The efficiency of using germplasm as a genetic
resource and its use can be improved if genetic diversity information is available. For

Chapter 2 Evaluation of sorghum germplasm
21
example, further crossings between the breeding materials and genotypes located in
cluster groups D~F might give a wide range of ancestors, which could include promising
lines with high yield.

Chapter 2 Evaluation of sorghum germplasm
22
2.2. Correlation between Molecular Analysis Using Simple Sequence Repeats
(SSR) Markers and Phenotypic Performance Data in Sorghum
Measurement of phenotypic and genotypic variance in field trials is a common
and traditional approach to resolve the genetic differences among genotypes. A field
experiment is simpler and cheaper than DNA-based technology. However,
environmental variation in the field trials that cannot be removed may mask the actual
genetic potency of a genotype. On the other hand, the SSR markers have been proved as
a powerful technique for studying the genetic diversity in sorghum (Dje et al., 2000;
Ghebru et al., 2002; Smith, et al., 2000; Yang et al., 1996).
Reif et al. (2003) reported a relationship between genetic distance based on
SSR markers and heterosis in tropical maize population. This suggested the relationship
between phenotypic performance and SSR molecular data. However, there are few
reports about the relationship between molecular data and the phenotypic performance
in sorghum.
The objectives of this study are: (i) to elucidate the relationship between
phenotypic performance and genetic diversity determined with SSR markers; (ii) to
study the possibility of grouping inbred lines based on phenotypic performances; and
(iii) to estimate the genotypic and phenotypic variation of yield, yield components and
primary agronomic traits among inbred lines.
Materials and methods
Field experiment
Twenty-two inbred lines were grown in the field (Table 3). Most of the

Chapter 2 Evaluation of sorghum germplasm
23
Table 3. List of inbred lines and their origin for the study of field and SSR analysis.
* = Lines were used both in field experiment and SSR analysis marker; SPA2 = SPA2 94039B; SPAD = SPAD 940006B.
parental inbred lines were derived from ICRISAT - India, Kansas - USA and Chugoku
Agriculture Experimental Station - Japan. The experimental design was a randomized
complete block design with two replications. The plot size was 1.5 x 2.0 cm2 with 25
cm spacing between plants and 75 cm spacing between rows. The nominal plant density
was 10 plants m-2. Fertilizer was applied at the rate of 2 g m-2 of N, P2O5 and K2O as a
basal dressing. Hand weeding and watering were practiced as necessary.
Seed yield (grain weight per plot) was recorded for every plot. The yield
components consisted of the length of head (from the base of head to tip) and harvest
index (ratio of grain weight to total above-ground weight). The primary agronomy traits
involved plant height at maturity (from the ground to the tip of panicle of the main
stalk), days to flowering (50% of plants in the plot was heading), dry weight, stalk
diameter (three cm above the ground) and 1000-grain weight.
Inbred line Note
H11*, H13*, H2, TX403* Parental inbred lines, Kansas, USA
C9*, C8* Parental inbred lines, Chugoku Natl.
Agric. Exp. Station, Japan.
SPA2*, SPAD*, D12* Parental inbred lines, ICRISAT, India
C9/D12, C9/H11*, C9/H13*, C9/H2,
C9/TX403, H11/D12, C8/D12, C8/H2,
TX403/H11, TX403/H2, TX403/D12,
H13/D12, H13/H2
Developed inbred lines. Crop Sci. Lab.,
Utsunomiya Univ., selected from the cross
mentioned in the name.

Chapter 2 Evaluation of sorghum germplasm
24
Plant height, stalk diameter and days to flowering were measured before
harvesting. Grain weight plot-1, length of head, dry weight, 1000-grain weight and
harvest index were recorded after harvesting. Stalks (including leaves) were dried at
80oC for four days and weighed to determine total plant dry matter. Heads were dried at
40oC for three days, weighed and threshed to determine grain yield, head yield and
1000-grain weight. The yield components and primary agronomy traits were examined
for six plants in the middle of each plot.
SSR amplification
Ten inbred lines with an asterisk were evaluated for SSR analysis (Table 3).
Nine primer pairs used for genotyping, DNA sample preparation, PCR amplification
and electrophoresis were same with materials and methods in section 2.1.
Statistical analysis
The components of variances were obtainable from the analysis of variance
(ANOVA) (Halloran, 1979). Phenotypic variance (σ2ph) and genotypic variance (σ2
g)
among population of inbred lines were estimated from expected means square (EMS).
All phenotypic observation variables were subjected as phenotypic data in genetic
population analysis. Associations among the populations were revealed by principal
component analysis (PCA) based on Pearson’s correlation coefficients.
The Spearman rank dissimilarity (SDM) analysis was performed to estimate
the similarity among inbred lines (Steel and Torrie, 1980) for both SSR marker data
(base pair size) and phenotypic marker data (phenotypic performance). The Mantel test
using Pearson’s correlation coefficient was performed to study the correlation between
two matrixes and to evaluate the significance of the matrixes.

Chapter 2 Evaluation of sorghum germplasm
25
Results
Field experiment
Six traits of the 21 sorghum lines, 1000-grain weight, harvest index, length of
head, plant height, stalk diameter and dry weight, showed highly significant (p<0.01)
differences in analysis of variance (ANOVA), but for grain weight per plot and days to
flowering did not (Table 4). Generally, coefficients of phenotypic variance were slightly
higher than coefficients of genotypic variance in the six traits. The highest coefficient of
genotypic variance was observed in 1000-grain weight (4.91) and the lowest in days to
flowering (1.89). Phenotypic variance of grain weight per plot and days to flowering
showed a great difference from their genotypic variance.
The six traits showed variation of heritability. The highest heritability was
observed in plant height (0.95) and the lowest in grain weight per plot (0.08) (Table 4).
The days to flowering also showed low heritability in comparison with other traits. The
days to flowering ranged from 40 days to 62 days. SPA2 flowered very late and
produced only a few seeds.
Table 5 shows the phenotypic performance and ranking position of inbred lines.
The ranking position of inbred lines for each trait was intended for principal component
analysis (PCA). D12 showed the highest 1000-grain weight and TX403 the lowest
1000-grain weight (Table 5). D12 also showed a high harvest index (48.34), whereas,
H13, TX403, SPAD and SPA2 showed a low harvest index. These inbred lines also
showed a poor vegetative growth. In the principal component analysis using Pearson’s
correlation coefficient for six phenotypes in 22 lines, the first and second principal
component (PC 1 and PC 2) explained 48% and 24% of the total variation, respectively
Chapter 2 Evaluation of sorghum germplasm
26
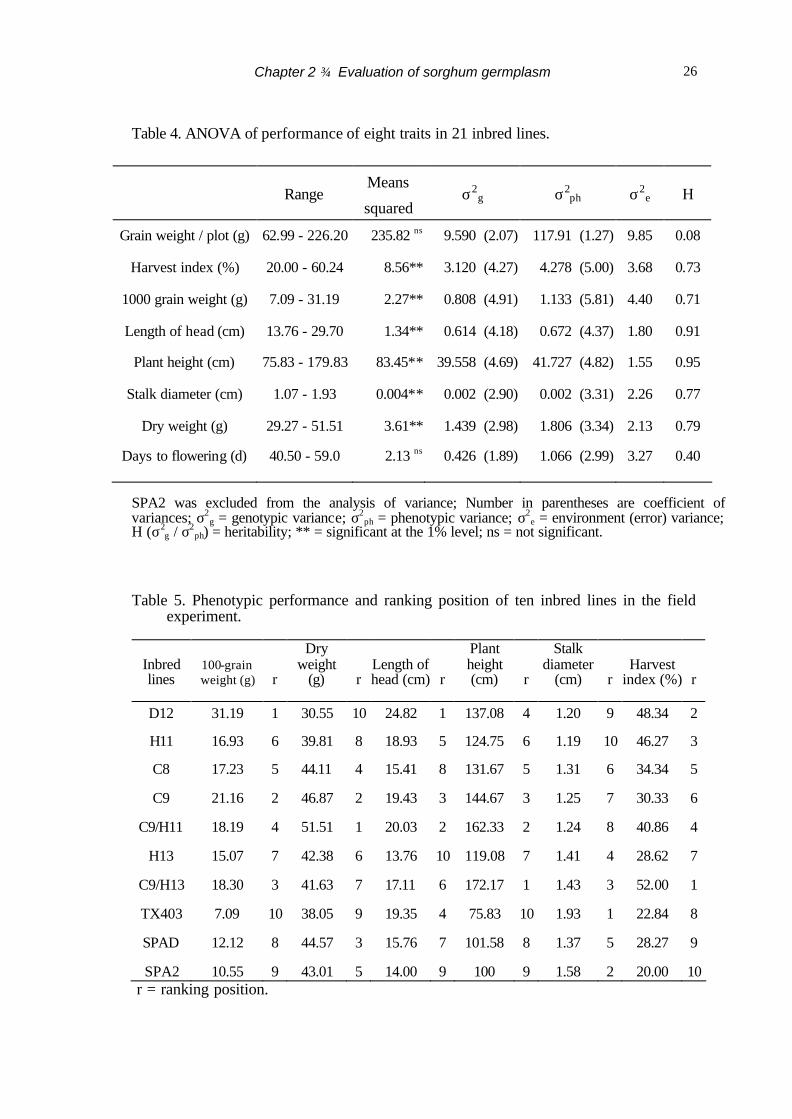
Table 4. ANOVA of performance of eight traits in 21 inbred lines.
SPA2 was excluded from the analysis of variance; Number in parentheses are coefficient of variances; σ2
g = genotypic variance; σ2ph = phenotypic variance; σ2
e = environment (error) variance; H (σ2
g / σ2ph) = heritability; ** = significant at the 1% level; ns = not significant.
Table 5. Phenotypic performance and ranking position of ten inbred lines in the field
experiment.
r = ranking position.
Range Means
squared σ2
g σ2ph σ2
e H
Grain weight / plot (g) 62.99 - 226.20 235.82 ns 9.590 (2.07) 117.91 (1.27) 9.85 0.08
Harvest index (%) 20.00 - 60.24 8.56** 3.120 (4.27) 4.278 (5.00) 3.68 0.73
1000 grain weight (g) 7.09 - 31.19 2.27** 0.808 (4.91) 1.133 (5.81) 4.40 0.71
Length of head (cm) 13.76 - 29.70 1.34** 0.614 (4.18) 0.672 (4.37) 1.80 0.91
Plant height (cm) 75.83 - 179.83 83.45** 39.558 (4.69) 41.727 (4.82) 1.55 0.95
Stalk diameter (cm) 1.07 - 1.93 0.004** 0.002 (2.90) 0.002 (3.31) 2.26 0.77
Dry weight (g) 29.27 - 51.51 3.61** 1.439 (2.98) 1.806 (3.34) 2.13 0.79
Days to flowering (d) 40.50 - 59.0 2.13 ns 0.426 (1.89) 1.066 (2.99) 3.27 0.40
Inbred lines
100-grain weight (g) r
Dry weight
(g) r Length of head (cm) r
Plant height (cm) r
Stalk diameter
(cm) r Harvest
index (%) r
D12 31.19 1 30.55 10 24.82 1 137.08 4 1.20 9 48.34 2
H11 16.93 6 39.81 8 18.93 5 124.75 6 1.19 10 46.27 3
C8 17.23 5 44.11 4 15.41 8 131.67 5 1.31 6 34.34 5
C9 21.16 2 46.87 2 19.43 3 144.67 3 1.25 7 30.33 6
C9/H11 18.19 4 51.51 1 20.03 2 162.33 2 1.24 8 40.86 4
H13 15.07 7 42.38 6 13.76 10 119.08 7 1.41 4 28.62 7
C9/H13 18.30 3 41.63 7 17.11 6 172.17 1 1.43 3 52.00 1
TX403 7.09 10 38.05 9 19.35 4 75.83 10 1.93 1 22.84 8
SPAD 12.12 8 44.57 3 15.76 7 101.58 8 1.37 5 28.27 9
SPA2 10.55 9 43.01 5 14.00 9 100 9 1.58 2 20.00 10

Chapter 2 Evaluation of sorghum germplasm
27
(Fig. 6). These principal components could explain 71% of the total variation. Sixteen
lines were pooled in one group and six lines were clearly separated from the group (D12,
H2, TX403, SPA2, SPAD and H13).
Fig. 6. Principal component analysis of 22 inbred lines using data for six phenotypic
data. PC1 and PC2 are the first and second principal component, respectively. ¦ =
inbred lines used in both field experiment and SSR analysis marker; ? = inbred
lines used only in field experiments; Italic letters are parental inbred lines; Plain
letters are developed inbred lines.
Relationship between phenotypic and SSR marker data
Ten inbred lines were analyzed with both field experiment and SSR markers.
The dissimilarity matrix of molecular data was plotted against the dissimilarity matrix
of single phenotypic to a combination of six phenotypic data in a mantel test and was
analyzed using Pearson’s correlation (Table 6). Generally, the Spearman rank
SPA2
H13xH2
H13xD12
C9xH11
TX403xH11
TX403xH2
C9xH13
C8xH2
C8xD12
C9xTX403
TX403xD12
H11xD12
C9xH2
C9xD12
SPADC9
C8
TX403
H13
H11
H2
D12
-3
-2.5
-2
-1.5
-1
-0.5
0
0.5
1
1.5
2
2.5
-5 -4 -3 -2 -1 0 1 2 3 4
PC 1 (46 %)
PC2
(24
%)

Chapter 2 Evaluation of sorghum germplasm
28
Table 6. Correlations of dissimilarity distance matrix between SSR markers and all possible combinations of phenotypic data based on Pearson’s correlation.
Correlations between matrixes were analyzed by the Mantel test; GW was included only in a combination of six phenotypic data; DW=dry weight; LE=length of head; PH=plant height; SD=stalk diameter; HI=harvest index; GW=1000-grain weight; *, ** = significant at the 5% and the 1% level, respectively; ns = not significant.
Correlation between SSR data and single phenotypic data.
DW LE PH SD HI
SSR ns ns ns ns ns
Correlation between SSR data and a combination of two phenotypic data.
DW,LE DW,PH DW,SD DW,HI
SSR ns ns ns ns
LE,PH LE,SD LE,HI
SSR 0.325* 0.574** ns
PH,SD PH,HI
SSR 0.320* 0.306*
SD,HI
SSR 0.446*
Correlation between SSR data and a combination of three phenotypic data.
DW,LE,PH DW,PH,SD DW,SD,HI
SSR ns 0.297* 0.396*
LE,PH,SD LE,SD,HI
SSR 0.606** 0.589**
PH,SD,HI
SSR 0.460**
Correlation between SSR data and a combination of four phenotypic data.
DW,LE,PH,SD DW,PH,SD,HI LE,PH,SD,HI
SSR 0.549** 0.409* 0.630**
Correlation between SSR data and a combination of five and six phenotypic data.
DW,LE,PH,SD,HI GW,DW,LE,PH,SD,HI
SSR 0.568** 0.444**

Chapter 2 Evaluation of sorghum germplasm
29
dissimilarity obtained using of SSR markers was significantly correlated with that
obtained with phenotypic data (Fig. 7).
None of the dissimilarity distance matrixes based on single phenotypic data
showed significant correlation with the dissimilarity distance matrix of SSR markers
(Table 6). Five matrixes obtained for the combination of two phenotypic data
significantly correlated with the SSR marker data. All combinations of four, five and six
phenotypic data gave results highly correlated with SSR marker data.
Fig. 7. Correlation between dissimilarity matrix obtained using SSR markers and dissimilarity matrix obtained using a combination of six phenotypic data.
r = 0.444**
0
0.2
0.4
0.6
0.8
1
1.2
0 0.2 0.4 0.6 0.8 1
SSR dissimilarity matrix
Phen
otyp
ic d
issi
mila
rity
mat
rix

Chapter 2 Evaluation of sorghum germplasm
30
Discussion
Variation of phenotypic traits
Six traits showed high heritability values in this study. Genetic factors greatly
affected the 1000-grain weight, dry weight, length of head, plant height, stalk diameter
and harvest index. On the other hand, environmental factors influenced performance of
grain yield per plot. Grain weight per plot showed a very low habitability. Including the
grain yield in principal component analysis and Spearman rank dissimilarity analysis
significantly reduced the correlations of their dissimilarity matrix (data not shown).
Therefore, grain yield per plot was not included as a phenotypic marker in correlation
analysis, hereafter.
There was no significant difference in days to flowering among inbred lines.
All sorghum inbred lines used in this study, except SPA2 and SPAD, were routinely
planted in the same area. Craufurd et al. (1999) reported that adaptation of sorghum to
the diverse environments was largely determined by photoperiod sensitivity and the
minimum time to flower. Consequently, a very small genetic variation will be observed
in days to flowering (Table 4), and therefore, days to flowering might not be a useful
phenotypic marker in this study.
Grouping of inbred lines based on principal component analysis
Principal component analysis using phenotypic data clearly separated the
developed inbred lines from the parental inbred lines. On the basis of their performance
data, developed inbred lines were included in one group (bold circle in Fig. 6) because
the members of this group had a relatively similar phenotypic performance (Table 5).
All inbred lines in this group were previously selected for short plant statue, early

Chapter 2 Evaluation of sorghum germplasm
31
maturity and high yield. In addition, they were grown at the same place for many years.
Two inbred lines from ICRISAT (SPA2 and SPAD) showed a poor
performance in the field experiment. SPA2, SPAD and TX403 showed a similar in
1000-grain weight, plant height and harvest index (Table 5). According to the principal
component analysis, TX403, SPA2 and SPAD were clearly separated from the
above-mentioned group and positioned relatively close to each other (broken circle in
Fig. 6).
D12 showed a great difference from other inbred lines in 1000-grain weight,
length of head and harvest index. D12 was greatly separated from SPA2, SPAD and
TX403 in PCA analysis (double circle in Fig. 6). Two inbred lines (C9/H11 and
C9/H13) were generated from the same parent and have a genetic background closely
related to C9.
Correlations between phenotypic performance and molecular data
Reif et al. (2003) reported that there were significant correlations between SSR
molecular data and panmictic midparent heterosis for grain yield, days to silking and
plant height in tropical maize population. Their study is theoretically slightly different
from this study, but it suggested that there was a relationship between SSR molecular
data and phenotypic performance data.
The significant correlation between dissimilarity matrix of molecular data and
phenotypic data (Fig. 7) suggested that there was a close association between
distribution of the SSR markers in sorghum genome and distribution of genes which
controlled the six phenotypic variables in sorghum genome. The correlation values
increased in parallel with the increase in the number of phenotypic analyzed in

Chapter 2 Evaluation of sorghum germplasm
32
combination (Table 6). The Spearman rank dissimilarity for less than four phenotypic
data in combination showed a lower va lue with the molecular marker data. Single
phenotypic data did not show any significant correlation with the molecular data marker
(Table 6). This suggested that using more phenotypic markers should provide a good
description of the genotype.
All combinations of phenotypic data including length of head and stalk
diameter always gave a high correlation with the nine SSR data markers. Even in the
combination of two phenotypic data, these two phenotypes showed a highly significant
correlation with SSR markers (Table 6). This suggested that combination performance
of length of head and stalk diameter were portrayed by nine SSR markers.
Conclusion
The results of analysis using a combination of more than four phenotypic data
fairly correlated with SSR marker data. The SSR markers highly correlated with the
combination of phenotypic data that included the length of head and stalk diameter.
Generally, grouping of inbred lines based on their phenotypic performance data
(combination of the six phenotypic data) was similar to that based on SSR markers.
However, SSR markers gave more accurate and detailed grouping of inbred lines. On
the basis of the phenotypic performance, D12, H11, C9/H13 and C9/H11 were
promising parents that could be used in future plant breeding programs.

33
III. Development of Al tolerance Screening Method 3.1. Screening of Al-tolerant Sorghums by Hematoxylin Staining Method
Aluminum (Al3+) toxicity is considered as a major constraint for the production
of maize, sorghum, and rice in acid soil. Al damages the root apex (root cap) and
inhibits root hair growth, resulting in nutrient deficiency and leaf disorder (Delhaize and
Ryan, 1995; David et al., 1997; Chang et al., 1998; Godbold and Jentschke, 1998).
In general, the Al-screening technique can be classified into laboratory
screening and field screening. Laboratory screening methods include screening of plants
with solution-soaked paper and solution culture (Konzak, et al., 1976), soil-petri dish
(Hill et al., 1989), and screening in pots in a greenhouse (Baligar et al., 1989). For
sorghum, screenings in the field (Duncan, 1988; Flores et al., 1988; Miller et al., 1992),
and in pots or nutrient solution (Furlani and Clark, 1981; Boye-Goni and Marcarian,
1985; Gourley et al., 1990; Miller et al., 1992) are commonly used for selection of
Al-tolerant genotypes.
A rapid screening method is needed to select a large number of new genotypes
or new inbred lines in plant breeding, such as solution-soaked paper, solution culture
and soil-petri dish methods used to evaluate Al- tolerant sorghum. All of these rapid
screening techniques use the response to Al of the rate of seedling germination and root
development. However, the method using such growth responses would curtail the
accuracy of screening. Detection systems not dependent on the rate of seedling or root
development would greatly improve the success of screening procedure (Konzak et al.,
1976).

Chapter 3 Development of Al tolerance Screening Method
34
Screening by using hematoxylin staining of seedling roots (hematoxylin
staining method), which requires less time and simpler pH management than the other
methods, is very useful for selection or screening a relatively large population in a
breeding program. Measurement of Al tolerance is based on the staining pattern of the
root. The hematoxylin staining method is a very common technique for the evaluation
of Al tolerance in wheat (Polle et al., 1978; Takagi et al., 1981; Wallace et al., 1982)
and barley (Minella and Sorrells, 1992), but there have been no reports on the screening
of Al-tolerant sorghum.
Materials and Methods
Genotype
Twenty-two sorghum genotypes were evaluated, which consisted of parental
lines, inbred lines and Al-tolerant lines. Parental lines and inbred lines were obtained
from the germplasm collection of Crop Science Laboratory, Utsunomiya University and
Chuugoku National Agricultural Experiment Station, Japan. ICRISAT (India) and
USDA (USA) kindly provided tolerant lines. Real 60, SPA2 and SPAD (tolerant lines)
have been screened under 60%-80% Al saturation at Carimagua, Matazul and
Chilichau-Columbia by ICRISAT (Reddy, personal communication). Table 7 lists the
genotypes and their origin.
Hematoxylin staining method
A hematoxylin staining method based on the technique of Polle et al. (1978) with
some modifications was used. Levels of Al concentration of 0, 17.87, 35.73, 53.60, and
71.46 ppm Al (0, 74, 148, 222, and 296 µM) were designed. Al was added to the
Chapter 3 Development of Al tolerance Screening Method
35
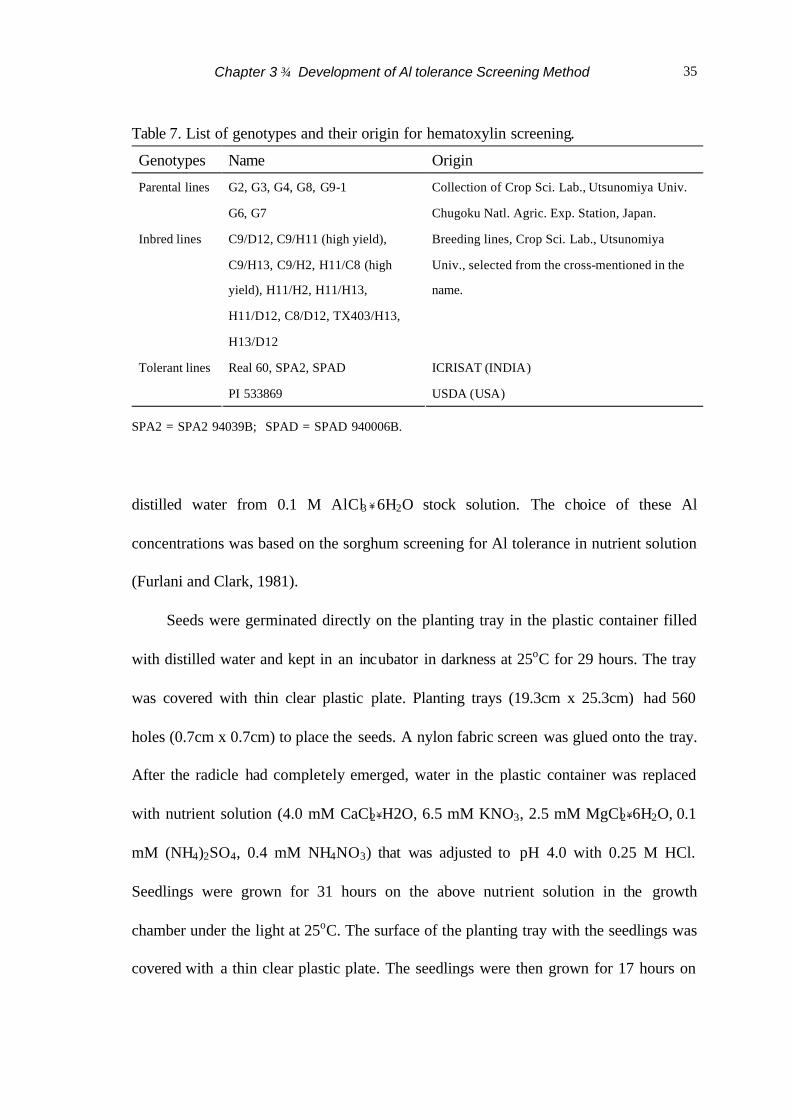
Table 7. List of genotypes and their origin for hematoxylin screening.
Genotypes Name Origin
G2, G3, G4, G8, G9-1 Collection of Crop Sci. Lab., Utsunomiya Univ. Parental lines
G6, G7 Chugoku Natl. Agric. Exp. Station, Japan.
Inbred lines C9/D12, C9/H11 (high yield),
C9/H13, C9/H2, H11/C8 (high
yield), H11/H2, H11/H13,
H11/D12, C8/D12, TX403/H13,
H13/D12
Breeding lines, Crop Sci. Lab., Utsunomiya
Univ., selected from the cross-mentioned in the
name.
Real 60, SPA2, SPAD ICRISAT (INDIA) Tolerant lines
PI 533869 USDA (USA)
SPA2 = SPA2 94039B; SPAD = SPAD 940006B.
distilled water from 0.1 M AlCl3 ・ 6H2O stock solution. The choice of these Al
concentrations was based on the sorghum screening for Al tolerance in nutrient solution
(Furlani and Clark, 1981).
Seeds were germinated directly on the planting tray in the plastic container filled
with distilled water and kept in an incubator in darkness at 25oC for 29 hours. The tray
was covered with thin clear plastic plate. Planting trays (19.3cm x 25.3cm) had 560
holes (0.7cm x 0.7cm) to place the seeds. A nylon fabric screen was glued onto the tray.
After the radicle had completely emerged, water in the plastic container was replaced
with nutrient solution (4.0 mM CaCl2・H2O, 6.5 mM KNO3, 2.5 mM MgCl2・6H2O, 0.1
mM (NH4)2SO4, 0.4 mM NH4NO3) that was adjusted to pH 4.0 with 0.25 M HCl.
Seedlings were grown for 31 hours on the above nutrient solution in the growth
chamber under the light at 25oC. The surface of the planting tray with the seedlings was
covered with a thin clear plastic plate. The seedlings were then grown for 17 hours on

Chapter 3 Development of Al tolerance Screening Method
36
the nutrient solution with 0 to 296 µM Al without plastic cover and kept in the growth
chamber in the light at 25oC. The planting tray was then placed on distilled water for 30
minutes and placed in a container with 0.2% hematoxylin solution for 15 minutes. Prior
to evaluation of staining, seedlings were washed with distilled water for 30 minutes.
Stained root tips of six seedlings per genotype were then evaluated for scoring based on
the staining of roots as shown in Table 8.
Table 8. Scoring of hematoxylin staining at various Al concentrations and the relative root length (RRL) in acid soil containing 447 ppm in relation to Al tolerance.
Staining pattern of root tips
Al concentration (ppm)
RRL (%)
17.87 35.73 53.60 71.46 447 ppm Al
Score
Remark
NS NS NS NS 79.2 ≤ 91.9 1 Very tolerant
NS NS NS S 66.5 ≤ 79.2 2 Tolerant
NS NS S S 53.8 ≤ 66.5 3 Intermediate
NS S S S 41.1 ≤ 53.8 4 Susceptible
S S S S 0 ≤ 41.1 5 Very susceptible
NS = not stained; S = stained; RRL = relative root length, which will be described in the 3.2 section.
Results and Discussion
Six seedlings per genotype with well-developed roots 1.5 cm or longer were
chosen for scoring in the hematoxylin staining test. Although the length of seedling
roots varied either in the solution with or without Al, Polle et al. (1978) found no
relationship between the staining response of genotype and the length of seedling roots
in the hematoxylin staining test. In addition, the seedlings were treated with Al for a

Chapter 3 Development of Al tolerance Screening Method
37
short time.
The score ranged from 1 to 5 (Table 9). Eight genotypes showed the score for 4
or 5 (susceptible ); seven genotypes showed score 3 (intermediately tolerant); and six
genotypes showed score 1 or 2 (tolerant). Variation in the hematoxylin score from
complete staining to no staining was also observed in wheat, barley and pearl millet
(Takagi et al., 1981; Minella and Sorrells, 1992; Yoshida and Shigemune, 1999).
Minella and Sorrells (1992) observed difference in staining pattern of root to select 37
barley genotypes, and determined the loci number and allelic relationships among
barley genotypes of diverse origins.
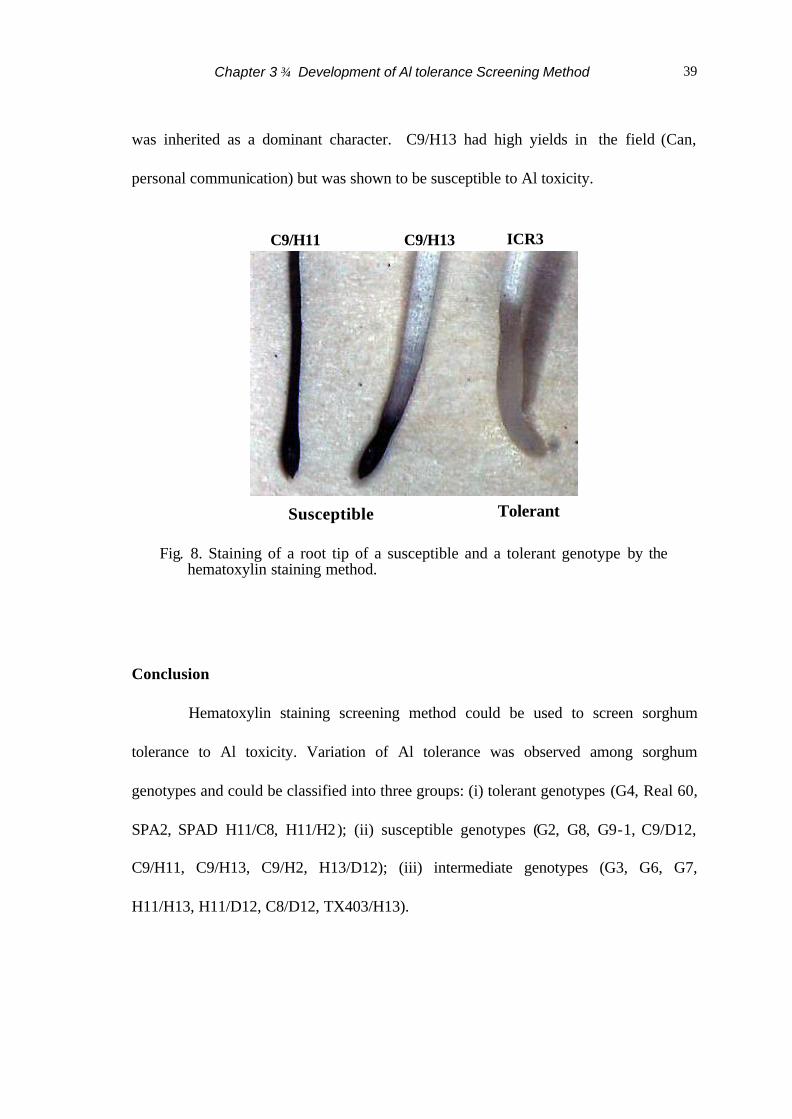
Roots of G4 and SPA2 were not stained at any Al level, indicating that they
were very tolerant (Table 9 and Fig. 8). Polle et al. (1978) and Takagi et al. (1981)
reported that the roots of a tolerant wheat genotype were not stained with hematoxylin.
This may be mainly due to the high pH of the cell wall in a tolerant plant. The high
pH immobilizes Al and thus protects the plants from Al- toxicity (Ownby, 1993; Andrade
et al., 1997).
All genotypes from ICRISAT (Real 60, SPA2, SPAD) showed tolerant
conformity with the score of hematoxylin staining. These genotypes were classified by
ICRISAT as tolerant genotypes, and their roots were not stained in a solution even with
53.60 ppm Al (Table 8). In contrast, roots of G2, G8 and G9-1 exhibited complete
staining at all Al levels and were classified as very susceptible genotypes.
G3, G6, G7, H11/H13, H11/D12, C8/D12 and TX403/H13 were classified as
genotypes with intermediate tolerance. Their roots exhibited staining either at 53.60 or

Chapter 3 Development of Al tolerance Screening Method
38
Table 9. Aluminum tolerance of sorghum genotypes evaluated by hematoxylin staining and growth response method.
SPA2 = SPA294039B; SPAD = SPAD940006B; 1) Score of hematoxylin staining was based on staining pattern of root; 2) Score of growth-response was based on RRL at 447 ppm Al, which will be described in the next section.
71.46 ppm Al. Although the segregation pattern was not studied here, crossing between
the parents of intermediate tolerance (G7 and G3) resulted in a susceptible progeny
(C9/H13). Boye-Goni and Marcarian (1985) reported that predominantly additive
genetic effects with some degree of dominance controlled the Al tolerance trait in
sorghum, while Gourley et al. (1990) reported that tolerance to Al-toxicity in sorghum
No Geno-
type
Score of
hematoxylin
staining1)
Score of
RRL2)
No Geno-
type
Score of
hematoxylin
staining
Score of
RRL
1 G2 5 - 12 H11/C8 2 2
2 G3 3 1 13 H11/H2 2 -
3 G4 1 1 14 H11/H13 3 -
4 G6 3 4 15 H11/D12 3 -
5 G7 3 1 16 C8/D12 3 3
6 G8 5 3 17 TX403/H13 3 -
7 G9-1 5 - 18 H13/D12 4 -
8 C9/D12 4 - 19 Real 60 2 1
9 C9/H11 4 3 20 SPA2 1 1
10 C9/H13 4 5 21 SPAD 2 1
11 C9/H2 4 - 22 PI 533869 - 2
Chapter 3 Development of Al tolerance Screening Method
39
was inherited as a dominant character. C9/H13 had high yields in the field (Can,
personal communication) but was shown to be susceptible to Al toxicity.
Fig. 8. Staining of a root tip of a susceptible and a tolerant genotype by the hematoxylin staining method.
Conclusion
Hematoxylin staining screening method could be used to screen sorghum
tolerance to Al toxicity. Variation of Al tolerance was observed among sorghum
genotypes and could be classified into three groups: (i) tolerant genotypes (G4, Real 60,
SPA2, SPAD H11/C8, H11/H2); (ii) susceptible genotypes (G2, G8, G9-1, C9/D12,
C9/H11, C9/H13, C9/H2, H13/D12); (iii) intermediate genotypes (G3, G6, G7,
H11/H13, H11/D12, C8/D12, TX403/H13).
Susceptible Tolerant
C9/H11 C9/H13 ICR3

Chapter 3 Development of Al tolerance Screening Method
40
3.2. Screening of Al-tolerant Sorghums by Growth-response Method
For selection of Al- tolerant genotypes, a precise screening technique to
evaluate sensitivity of plants to Al is necessary. Therefore, the results of the
hematoxylin staining method should be compared with other screening methods. It is
important to compare the laboratory screening methods with the field screening
methods.
Field screening for Al tolerance would be the best approximate for selecting
Al-tolerant plants. In practice, however, reliable ranking of tolerance in the field
screening is difficult because the Al concentration in soil may not be uniform and
because environmental factors interact with soil Al to mask the expression of Al
tolerance (Campbell and Carter, 1990). Screening by using the growth response to Al
added to the soil in pots in a greenhouse (referred to as growth-response method
hereafter) may be superior in this respect.
There was a correlation between the performance of sorghum in the greenhouse
study and grain yield in the field (Baligar et al., 1989). The plants that showed severe
reduction of shoot or root weight in a greenhouse showed also low grain yield in the
field. There was also a similar genotype response to Al- induced stress in nutrient
solution and to acid-soil stress in the field (Duncan et al., 1983).
The objectives of this research are to compare the results of Al tolerance
assessed by hematoxylin staining screening method with those obtained by the
growth-response method mentioned above.
Chapter 3 Development of Al tolerance Screening Method
41
Materials and Methods
Genotype
Twelve genotypes selected by the hematoxylin staining method were evaluated
again for acid soil tolerance in a pot: G3, G4, G6, G7, G8, H11/C8, C9/H11, C8/D12,
C9/H13, Real 60, SPA2, and SPAD. These genotypes were chosen for a wide range of
Al tolerance. Based on the data obtained by hematoxylin staining method, SPA2 and
C9/H11 were selected as representative tolerant and susceptible genotypes, respectively.
Although C9/H11 genotype was not the most susceptible genotype with the
hematoxylin staining method, it was chosen because it had also early maturity character
in the field (Can and Yoshida, 1999c, d). Genotype PI 533869 was evaluated only by the
culture on acid soil, because the number of seeds was very limited. In addition, the
growth of PI 533869 genotype was very poor during the preliminary test by the
hematoxylin staining method.
Growth-response method
The homogenous soil “Kumiai Kokuryuubaido” (Zennou, Japan) was used for
pot experiment. The “Kumiai Kokuryuubaido” contains micronutrients, heat dried
humus and fertilizer (0.28 N Kg-1, 0.28 P Kg-1, 0.28 K Kg-1). About 350 g soil in a pot,
9.5 cm in diameter and 9 cm in depth, was mixed with 100 mL AlCl3・6H2O solution at
various concentrations (8.32, 16.5 and 24.9 mM) to prepare the soil with different
acidity.
The Al solution was adjusted to around pH 3 to 3.5 by HCl. The soil mixed
with Al solution was kept for 24 hours and then the seeds were sown in a greenhouse.

Chapter 3 Development of Al tolerance Screening Method
42
The greenhouse temperature during the experiment ranged from 25oC to 28oC in the
daytime and 23oC to 25oC at night. Five seeds were sown per pot and thinned to four
plants after seedling emergence. Three days after sowing, 40 mL of distilled water was
added to keep the soil moist. Seven days after planting, 40 mL of AlCl3・6H2O solution
was added to the soil.
In a preliminary experiment, Al at various concentrations (11.18 to 671.00 ppm
Al) was added to the soil to determine the Al concentration that gives the widest range
of toxic symptoms in the root. The soils containing 224 ppm, 447 ppm and 671 ppm
Al (8.32, 16.5 and 24.9 mM) gave significant differences in the root symptoms (data not
shown), and used for screening in this experiment. Baligar et al. (1993) used dark red
latosol soil with 2, 41 and 64 % Al saturation to observe the growth and uptake
parameter of sorghum. Flores et al. (1988) used 40% and 60% Al saturation of acid
ultisol soil to determine the effects of Al saturation on the growth and yield of sorghum.
De Sousa (1998) used acid soil (pH 4.2 to 4.9) that contained 25 to 42.7 mM Al for
classification of Al tolerance of wheat cultivars. On the other hand, the Al at the
concentration of 0 to 296 µM was usually added to the complete nutrient solution for
the selection of tolerant sorghum or physiological investigation (Gourley et al., 1990;
Tan and Keltjens, 1995; Furlani and Clark, 1981).
Plants were harvested 15 days after sowing, roots were rinsed with stream flow
of water tap, and data for the longest root length (from the base of the stem to root tip)
and shoot length (from the base of stem to the longest tip of the longest leaf) was
measured. The relative root length (RRL) ([the longest root length in soil with Al / the

Chapter 3 Development of Al tolerance Screening Method
43
longest root length in soil without Al] x 100) was scored as shown in Table 8.
To achieve a greater degree of precision for genotype comparison than for Al
concentration response, the split plot experimental design was used with genotype
assigned to the sub plot and Al concentration to the main plot.
Results and Discussion
The solubility of the Al compound and severity of their toxic effect on the plant
are influenced by many chemicals and physical factors such as pH and organic matter
(Dong et al., 1999; Shuman et al., 1990; Kapland and Estes, 1985). The soil pH was still
under 4.7 in all pots at the end of experiment, indicating that Al3+ in the soil was
available to the plant throughout the experiment, whereas high concentration of Al (8.32,
16.5 and 24.9 mM) was needed to obtain significant effect on root growth among
genotypes.
RRL of all genotypes decreased in response to the increase in Al concentration
(Fig. 9), and roots tended to become swollen with a stubby appearance in response to Al.
Tan and Keltjens (1995) reported that Al toxicity was expressed by the direct damage of
roots (stubby and discolored root) with a concomitant reduction in specific root length.
Negative values of correlation coefficients between RRL and Al concentration were
observed for all genotypes (Table 10). Inhibition of root elongation is widely
recognized as Al stress symptoms in plants (Delhaize and Ryan, 1995; Gallego and
Benito, 1997; Martinez and Estrella, 1999).
Utilizing shoot length as a criterion of selection for Al toxicity was not reliable,
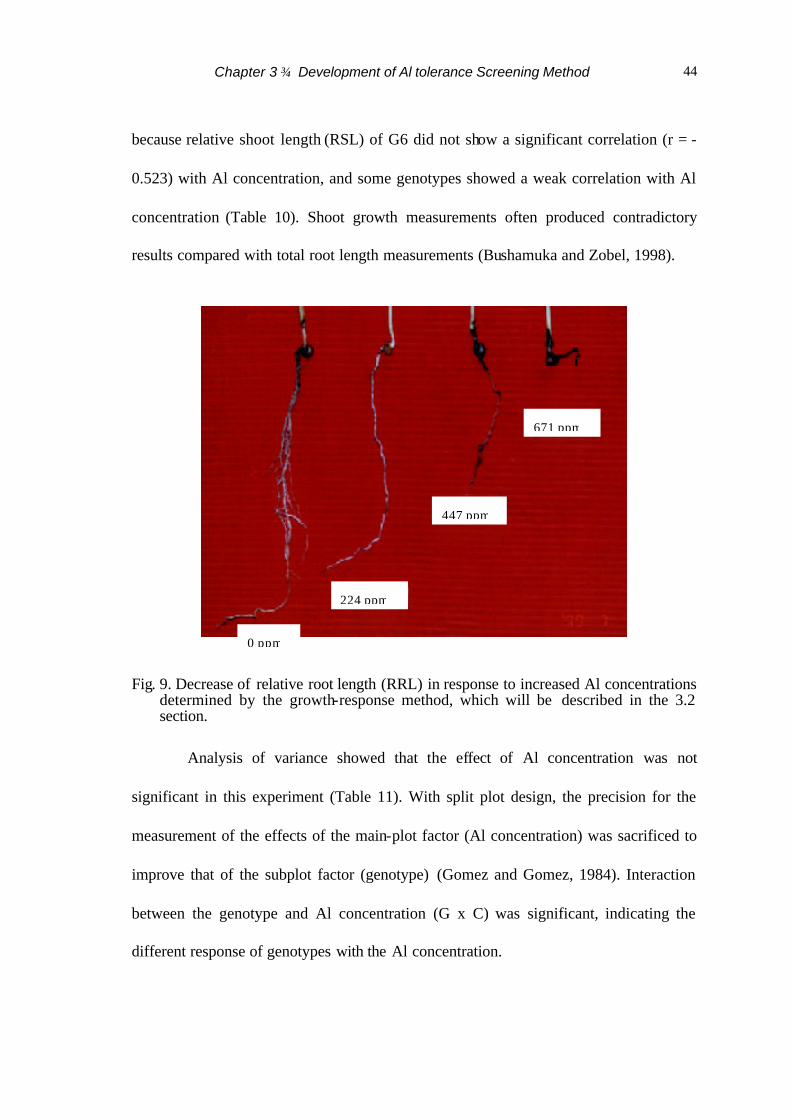
Chapter 3 Development of Al tolerance Screening Method
44
because relative shoot length (RSL) of G6 did not show a significant correlation (r = -
0.523) with Al concentration, and some genotypes showed a weak correlation with Al
concentration (Table 10). Shoot growth measurements often produced contradictory
results compared with total root length measurements (Bushamuka and Zobel, 1998).
Fig. 9. Decrease of relative root length (RRL) in response to increased Al concentrations determined by the growth-response method, which will be described in the 3.2 section.
Analysis of variance showed that the effect of Al concentration was not
significant in this experiment (Table 11). With split plot design, the precision for the
measurement of the effects of the main-plot factor (Al concentration) was sacrificed to
improve that of the subplot factor (genotype) (Gomez and Gomez, 1984). Interaction
between the genotype and Al concentration (G x C) was significant, indicating the
different response of genotypes with the Al concentration.
224 ppm
447 ppm
671 ppm
0 ppm

Chapter 3 Development of Al tolerance Screening Method
45
Table 10. Correlation coefficients between root length (RRL) or relative shoot length (RSL) and Al concentration of 13 genotypes determined by the growth-response method.
Genotype Root length Shoot length
G3 - 0.843 ** - 0.617 *
G4 - 0.873 ** - 0.859 **
G6 - 0.984 ** - 0.523
G7 - 0.819 ** - 0.995 **
G8 - 0.936** - 0.936 **
H11/C8 - 0.924 ** - 0.958 **
C9/H11 - 0.969 ** - 0.934 **
C8/D12 - 0.968 ** - 0.993 **
C9/H13 - 0.969 ** - 0.854 **
Real 60 - 0.867 ** - 0.972 **
SPA2 - 0.950 ** - 0.605 *
SPAD - 0.834 ** - 0.877 **
PI533869 - 0.931 ** - 0.878 **
*, ** = signif icant at the 5% and 1% level, respectively.
Table 11. Analysis of variance for relative root length (RRL) and relative shoot length (RSL) determined by the growth-response method.
Means square Source df
RRL RSL
Replication 1 164.934 135.387
Al level ( C ) 3 35529.999 16882.172
Error a 3 135.864 268.862
Genotype ( G ) 12 503.238** 947.498**
G x C 36 275.501** 523.770**
Error b 48 128.119 220.754
** = significant at the 1% level.

Chapter 3 Development of Al tolerance Screening Method
46
Fig 10. Correlation between the score of hematoxylin staining and that of relative root
length (RRL). **Significant at the 1% level. ? G6, G8, C9/H11, C9/H13, H11/C8, C8/D12; ¦ ¦ G4 and SPA2; ? ? Real 60 and SPAD; ?? G3 and G7.
Fig 11. Correlation between the score of hematoxylin staining and relative root length
(RRL) in the soil containing 447 ppm Al. * Significant at the 5% level.
r = 0.666**
0
1
2
3
4
5
0 1 2 3 4 5 6
Score of hematoxylin staining
Scor
e of
RR
L
r = - 0.622*
0
20
40
60
80
100
0 1 2 3 4 5 6Score of hematoxylin staining
RR
L (
% )

Chapter 3 Development of Al tolerance Screening Method
47
Fig. 12. Correlation between the score of hematoxylin staining and relative shoot length
(RSL) determined in the soil containing 447 ppm Al. ?? G7 and C8xD12, ? G3, G4, G6, G7, C9/H11, C9/H13, H11/C8, Real 60, SPA2, and SPAD.
Tan and Keltjesns (1995) reported that root damage well reflected genetic differences in
response to Al at a high acidity.
The mean RRL at different Al concentrations showed that the 447 ppm Al gave
the widest range of toxic response among genotypes. Eight genotypes were tolerant,
three intermediately tolerant and two susceptible (Table 9). G3, G4, G7, Real 60, SPA2
and SPAD were significantly more tolerant than G6, G8, C9/H13 and C9/H11 (Table
12). RRL of plants grown with 224 ppm Al and 671 ppm Al showed Al toxicity
symptoms but differences among genotypes were difficult to distinguish (Table 12).
Correlation between hematoxylin staining method and growth-response method
The score of hematoxylin staining showed a significant correlation with the
score of RRL (r = 0.666**) (Fig.10) and RRL (r = - 0.622*) (Fig.11). Genotypes that
were not stained (tolerance) by hematoxylin staining method also tended to have long
roots (tolerance) in the soil with the growth-response method (Table 9). Polle et al.
(1978) reported that the results of the hematoxylin test were in good agreement with
r = - 0.114
5565758595
105115125
0 1 2 3 4 5 6Score of hematoxylin staining
RSL
( %
)

Chapter 3 Development of Al tolerance Screening Method
48
those of the acid soil-screening method in wheat. Takagi et al. (1981) also reported
that scoring of Al tolerance of wheat by the hematoxylin staining method strongly
coincided with the scoring of Al tolerance in nutrient solution with Al.
Table 12. Means of relative root length (RRL) and relative shoot length (RSL) of 13 genotypes determined by the growth-response method.
RRL (%) RSL (%)
Al concentration (ppm)
Genotype
0 224 447 671 0 224 447 671
G3 100 a 100.910 a 85.830 ab 4.505 b 100 a 110.805 ab 121.670 a 32.120 b
G4 100 a 80.865 ab 82.500 abc 13.160 b 100 a 73.405 cd 84.120 abc 32.860 b
G6 100 a 62.135 b 49.585 de 18.430 b 100 a 57.635 d 112.220 ab 30.910 b
G7 100 a 99.500 a 91.900 a 8.470 b 100 a 82.200 a-d 60.190 d 31.855 b
G8 100 a 99.380 a 64.215 b-e 17.145 b 100 a 95.780 abc 76.495 cd 37.590 b
H11/C8 100 a 84.155 ab 73.880 a-d 15.330 b 100 a 94.060 abc 72.835 cd 39.990 b
C9/H11 100 a 87.430 a 54.530 de 7.115 b 100 a 90.895 a-d 76.765 cd 32.090 b
C8/D12 100 a 87.270 a 58.910 cde 12.710 b 100 a 78.050 bcd 60.400 d 28.945 b
C9/H13 100 a 92.075 a 41.135 e 5.660 b 100 a 78.340 bcd 86.880 bcd 32.910 b
Real 60 100 a 89.295 a 83.805 abc 11.260 b 100 a 86.375 a-d 75.040 cd 46.785 b
SPA2 100 a 97.360 a 86.185 ab 67.600 a 100 a 114.615 a 102.235 abc 118.385 a
SPAD 100 a 96.360 a 90.345 ab 17.365 b 100 a 111.805 ab 76.525 cd 47.285 b
PI 533869 100 a 100.920 a 68.635 a-d 26.675 b 100 a 114.310 a 58.715 d 38.520 b
Means followed by a common letter in the column are not significantly different at the 5% level by DMRT.
The relative shoot length (RSL) showed no significant correlation with the
score of hematoxylin staining (Fig. 12). This is in agreement with the fact that shoot
length was not correlated with Al concentration in the growth-response method.

Chapter 3 Development of Al tolerance Screening Method
49
Conclusion
Eight genotypes (G3, G4, G7, H11/C8, Real 60, SPA2, SPAD and PI533869)
showed tolerance to Al toxicity by the growth-response method. Five genotypes (G4,
H11/C8, Real 60, SPA2, SPAD) showed tolerance to Al toxicity by both screening
methods. C9/H13 showed susceptibility to Al by both methods. These facts show that
a similar evaluation for Al tolerance can be obtained by these two methods.
For evaluation of large number of genotypes, the hematoxylin staining method
is more convenient than the growth-response method. The hematoxylin staining
procedure is simple and requires little space and labor. However, screening Al- tolerant
sorghum to Al toxicity in the field (natural acid soil) is still necessary, especially for
comprehensive information about yield and growth of the tolerant plants. The
growth-response method can be used as a preliminary test for the field test.

50
IV. Development of Sorghum Tolerance to Al toxicity 4.1. Genetic Correlation, Heritability and Genetic Gain of Al tolerance
The different genetic controls of Al tolerance were reported among crop
species. Boye-Goni and Marcarian (1985) estimated the high narrow-sense and broad
sense heritability among sorghum genotypes by a nutrient solution screening method.
While, Gourley et al. (1990) reported that Al tolerance was inherited as a dominant
character with low narrow sense heritability for shoot and root dry matter production
based on green house acid soil study.
Genetic gain of Al tolerance is very important information for allocation of
resources in each generation of selection. Testing of genotypes in a large number of
plants is very costly and handling of selection will be more difficult if the number of
plants and genotypes to be tested increase. Discarding inferior genotypes as early as
possible needs genetic gain information.
Furthermore, application of selection intensity in each generation can be more
appropriate if genetic gain information is available. Information of genetic gain would
guide breeders toward optimum allocation of resources in one stage of selection (Martin
and Futi, 2000). However, there are few reports about genetic gain of Al tolerance and
several agronomic characters in sorghum.
In this section, sorghum genotypes from various origins were used as parents.
Crossings were done between Al-tolerant and susceptible genotypes, and two cycles of
selection for Al tolerance using hematoxilyn staining screening method were conducted
for genetic correlation, heritability and genetic gain study.

Chapter 4 Development of sorghum tolerance to Al-toxicity
51
The objectives of this study are: (i) to estimate the realized heritability of Al
tolerance and genetic correlation between Al tolerance and several agronomic traits and
yield components (easily visible characters), (ii) to estimate genetic gain of Al tolerance
and several agronomic traits of sorghum.
Materials and Methods
Plant materials
The materials used were two series of crosses, C9/H11//ICR3 and
C9/H13//ICR3. C9/H11 originated from a cross between C9 (introduced from Chugoku
Exp. Sta.-Japan, Can et al., 1997) and H11 (introduced from USA). H13 was introduced
from USA and ICR3 was introduced from ICRISAT. ICR3 was used as an Al- tolerant
parent in this experiment. General characters of genotypes are shown in Table 13.
Table 13. General characters of the parents for genetic correlation and path coefficient analysis study.
Two cycles of selection of Al tolerance and agronomic traits were conducted in
F2 and F3 population. Two hundred F2 plants and sixty F3 plants were grown in field
C9/H11 C9/H13 ICR3
Al tolerance susceptible susceptible tolerance
Day to flowering early (± 47 d) late (± 68 d) medium (± 54 d)
Plant height medium (± 104 cm) tall (± 241 cm) short (± 66 cm)
Yield high high medium

Chapter 4 Development of sorghum tolerance to Al-toxicity
52
for first and second year, respectively. For genetic gain study, F3 population was
separated into three categories (population) based on information obtained from field
and laboratory. They were an Al-tolerant population, an early maturity population and a
short plant height population. The term population refers to the character that selection
was applied directly to it. Genetic gain was estimated from each population.
The field experiment and data collection was conducted as described in the
previous chapters.
Hematoxylin-staining screening method at 148 µM and 222 µM aluminum was
applied for evaluating Al tolerance for six seedlings per Al concentration with three
replications. The group with no roots stained was scored 1 (very tolerant) and the group
in which the roots of five seedlings stained was scored 5 (very susceptible).
Calculation
The realized heritability was calculated as follows (Fehr, 1987);
Realized heritability = (M high F3 – M low F3) / (M high F2 – M low F2)
where, M high F3 is a mean performance of F3 progenies of F2 plants selected in the high
group; M low F3 is a mean performance of F3 progenies of F2 plants selected in the low
group; M high F2 is a mean performance of F2 plants in the high group; and M low F2 is a
mean performance of F2 plants in the low group.
Genetic correlation (rA) was calculated as follows (Fehr, 1987);
rA = CRx ix hx / Rx iy hy
where, CRx is amount of improvement of primary character obtained by indirect
selection for secondary character; Rx is amount of improvement obtained by direct
selection for primary character; ix and iy are selection intensity for primary and
Chapter 4 Development of sorghum tolerance to Al-toxicity
53
secondary character, respectively; hx and hy are square root of realized heritability,
instead of narrow sense heritability, of primary and secondary character, respectively.
The realized genetic gain is calculated as follows (Martin and Futi, 2000);
Genetic gain = (Xs – Xps) – (X – Xpo)
where, Xs is a mean of selected population in successor test, and Xps is a mean of
parents in successor test; X is a mean of original population; Xpo is a mean of parents
in original population.
The changing of the selection intensity for each character at any population
was estimated by calculating the selection differential. Selection differential is
calculated as follows;
Selection differential = (Xs – X) / σp
where, Xs is a mean of selected plants; and X is a overall mean of the original
population and σp is a standard deviation of original population.
Results and Discussion
Genetic correlation and heritability of Al tolerance and agronomic traits
Genotypic correlations of length of head, early days to flowering and short
plant height with Al tolerance were similar in both C9/H11//ICR3 and C9/H13//ICR3
crosses (Table 14). The relatively high positive genotypic correlations with Al tolerance
were observed for high performance of dry weight and grain weight plant-1 in the
C9/H11//ICR3 cross. On the other hand, early days to flowering and harvest index
showed relatively high genotypic correlations with Al tolerance in the C9/H13//ICR3
cross.

Chapter 4 Development of sorghum tolerance to Al-toxicity
54
Table 14. Heritability and genotypic correlation between six agronomic traits and Al tolerance in sorghum.
1) H=heritability; High performances of dry weight, grain weight per plant and harvest index, short plant height and early days to flowering were used in genotypic correlation analysis.
Table 15. The phenotypic correlations between Al tolerance and six agronomic traits of sorghum.
Upper value is C9/H11//ICR3 crossing and low value is C9/H13//ICR3 crossing.
Some agronomic traits showed a small genotypic correlation with Al tolerance.
A small genotypic correlation and inconsistent relationship with the phenotypic
correlation suggested that environmental factors extremely affected phenotypic
performance in field experiment.
Genotypic correlations between days to flowering and Al tolerance were
negative as in the phenotypic correlations in both series of crossing (Table 15). This not
only showed negative phenotypic correlations between days to flowering and Al
Dry
weight Length of
head Grain weight
plant-1 Days to
flowering Plant height
Harvest index H1)
Al tolerance (C9/H11//ICR3)
0.497 0.249 0.706 -0.391 0.060 -0.485 0.35
Al tolerance (C9/H13//ICR3)
0.119 0.344 0.025 -0.468 -0.158 0.728 0.43
Dry
weight Length of
head
Grain weight plant-1
Days to flowering
Plant height
Harvest index
Al tol. in F2
-0.119 -0.174 -0.201 -0.232 0.053 -0.201 Al tolerance in F2
-0.265* -0.258 -0.209 -0.382** -0.376** -0.183
-0.505** -0.267* -0.488** -0.207 0.115 -0.350** 0.268* Al tolerance in F3
-0.387** -0.408** -0.370** -0.385** -0.661** -0.254 0.597**

Chapter 4 Development of sorghum tolerance to Al-toxicity
55
tolerance but also suggested that early maturity and low Al tolerance were linked
genetically or they might be pleiotropically controlled.
The genotypic correlation of harvest index with Al tolerance was different
between C9/H11//ICR3 and C9/H13//ICR3 crosses. This result is somewhat disturbing,
but perhaps these might result from the use of different parents for the cross. There are
some reports showing that different genes control Al tolerance in the same plant species.
It was reported that several genes in some of wheat cultivars controlled Al tolerance but
simple dominant genes controlled Al tolerance in other wheat cultivars (Martinez et al.,
1999).
The realized heritability of Al tolerance was moderately low (H = 0.35 and H =
0.43) in C9/H11//ICR3 and C9/H13//ICR3 crossing (Table 14). Using a nutrient solution
culture, Boye-Goni and Marcarian (1985) reported that narrow-sense and broad-sense
heritabilities were 0.78 and 0.99, respectively. Gourley et al. (1990) reported that the
narrow-sense heritability assessed by the green house acid soil study method was
different from that assessed by the solution culture method even when the same
materials were being examined. The narrow-sense heritabilities assessed by the green
house acid soil method and solution culture method were between 0.05~0.31 and
0.65~0.72, respectively.
Heritability was moderately low in this study, confirming that several genes
controlled Al tolerance. Al tolerance in wheat cv. Atlas 66 was controlled by two or
more major genes (Berzonsky, 1992); dominant or semidominant genes in Arabidopsis
thaliana (Larsen et al., 1996).
Al tolerance in sorghum was inherited as a dominant character and

Chapter 4 Development of sorghum tolerance to Al-toxicity
56
predominantly additive genetic effect with some degree of dominance controlled it
(Boye-Goni and Marcarian, 1985). Gourley et al. (1990) using solution culture
screening method also reported that the additive variance of Al tolerance in sorghum
was much greater than the variance in the degree of dominance. However, direct
selection of Al tolerance might difficult for improving Al tolerance character judging
from the data obtained in this study. Consequently, indirect selections, selections with a
more accurate evaluation method for Al tolerance, use of wider germplasm with high Al
tolerance and a larger number of progeny plants are necessary for increasing Al
tolerance.
Genetic gain
Overall mean genetic gain of Al tolerance for all populations was 0.86, despite
selection differential of –94.2% for Al tolerance (Table 16). This suggested that multiple
genes rather than a single gene might control Al tolerance character in sorghum. These
results also confirmed the reports that two or more dominant genes controlled Al
tolerance character in a lot of plant. Therefore, for improvement of Al tolerance
characters, several cycles of selections might be needed to make this character more
stable.
The overall genetic gain for plant height and dry weight were relatively high
–1.12 and –0.35, respectively (Table 16 and 17). This showed that there were significant
reductions of plant height and dry weight in successor population. Significant reduction
in plant height and dry weight may also cause a small improvement of genetic gain in
Al tolerance. The author observed that dry weight and plant height were important
component factors in Al tolerance path analysis, in which these characters gave the

Chapter 4 Development of sorghum tolerance to Al-toxicity
57
Table 16. Standardized genetic gain (GG), unstandardized genetic gain (RV) and selection differential (SD) of Al tolerance, dry weight, length of head and grain weight plant-1 conducted in the early stage of sorghum development.
Genetic gains of particular populations are within a row and genetic gains of particular character are within a column. 1) GG = standardized genetic gain of average from two series of crossing C9/H11//ICR3 and C9/H13//ICR3; 2) Overall genetic gain of particular characters over three populations sorghum.
Table 17. Standardized genetic gain (GG), unstandardized genetic gain (RV) and
selection differential (SD) of harvest index, plant height and days to flowering conducted in the early stage of sorghum development.
Genetic gains of particular populations are within a row and genetic gains of particular character are within a column; 1) GG = standardized genetic gain from two series of crossing C9/H11//ICR3 and C9/H13//ICR3; 2) Overall genetic gain of particula r characters over three populations sorghum.
Population Al tolerance Dry weight Length of head Grain weight plant-1
GG1) RV SD
(%) GG RV (g)
SD(%) GG RV
(cm)SD
(%) GG RV (g)
SD (%)
Al-tolerant population 0.50 0.56 -94.2 -0.12 -1.61 18.7 4.93 7.40 28.9 0.43 6.03 119.4
Early maturity
population 0.99 1.11 -3.6 -0.58 -7.64 -39.7 1.99 7.71 10.6 -0.52 -6.37 23.5
Short plant height
population 0.81 0.98 0.9 -0.76-10.23 -63.5 1.87 7.34 -14.7 0.29 6.95 -21.6
Overall2) 0.86 -0.35
1.95 0.26
Population Harvest index Plant height Days to flowering
GG1) RV SD
(%) GG RV (cm)
SD (%) GG RV
(d)SD
(%)
Al-tolerant population 0.02 0.60 71.5 -0.91 -40.31 1.0 0.04 0.51 -6.1
Early maturity population -0.16 -3.97 56.0 -1.21 -54.23 -31.8 -0.15 -1.71 -83.0
Short plant height population 0.32 7.30 -22.0 -1.39 -62.46 -98.4 0.22 2.74 -32.4
Overall2) 0.11 -1.12 0.21

Chapter 4 Development of sorghum tolerance to Al-toxicity
58
great influence both directly and indirectly on Al tolerance. More detailed explanation
about Al path analysis can be seen in section 4.2.
Relatively high genetic gain of 0.50 for Al tolerance in the population that was
specially selected for Al tolerance (Al tolerance population) was because of the greatest
selection differential (selection intensity) for Al tolerance in this population, compared
to the other populations, early maturity and short plant height population (Table 16).
This suggests that high allocation of resources in early generations for Al tolerance and
high selection intensity must be applied if relatively high genetic gain of Al tolerance is
to be obtained.
Selection pressure for early maturity gave negative gains for grain weight per
plant (-0.52) and dry weight (-0.58). In consequence of these results, the gain for
harvest index was also negative. Martin and Futi (2000) reported that the negative gain
for yield in the F3 in a soybean breeding program was observed when strong selection
for earliness was applied to this stage.
Conclusion
Heritability of Al tolerance in sorghum was moderately low in both series of
crosses. Consequently, low genetic gain of Al tolerance was observed in both
populations. High allocation of resources in early generations for Al tolerance and high
selection intensity of Al tolerance must be applied if higher gain for Al tolerance is to be
obtained. Low genetic correlations in some agronomic traits and inconsistent
relationship with the phenotypic correlations were observed.

Chapter 4 Development of sorghum tolerance to Al-toxicity
59
4.2. Path Coefficient Analysis of Al tolerance and Several Agronomic Characters
of Sorghum
Common breeding for Al tolerance was conducted by empirical selection of
tolerant plants with little regard for the physiological relationships of both Al- tolerant
and susceptible genotypes. The studies on correlated characters are important to know
how the improvement of one character will cause simultaneous changes in other
characters (Falconer and Mackay, 1996). The relationships among characters were
usually measured with correlation coefficients. If more variables are considered in the
correlation table, these indirect associations become more complex, less obvious and
somewhat perplexing (Dewey and Lu, 1959). At this point, path analysis is used to
partition the relative contribution of components via standardized partial-regression
coefficient and measures the direct influence of one variable upon another.
Path analysis was often used to identify important yield components on yield in
various crops including rice, wheat and soybean (Ball et al., 2001). Using the same
idea with yield components, a tolerant plant to Al toxicity can be considered if it has a
good phenotypic performance in acid soil stress condition, such as good root system,
plant height, dry weight and yield. However, for field-grown plants, root traits are
difficult to measure (Flores et al., 1988), thus evaluations from the other traits were
commonly used to evaluate field-grown plants for tolerance to soil acidity, such as plant
survival, plant vigor, grain yield and mineral element content.
Al tolerance assessed by using hematoxylin staining method correlated with
several agronomic traits in sorghum as described in previous chapters. It was reported
that Al-tolerant plants had a better phenotypic performance than susceptible plants in

Chapter 4 Development of sorghum tolerance to Al-toxicity
60
acid soil and the different response of the sorghum agronomic traits in acid soil stress
condition was also reported (Flores et al., 1988; Miller et al., 1992). However, there are
few reports about direct and indirect effect of agronomic traits on Al tolerance through
path analysis.
The different genetic controls of Al tolerance were reported even in the same
crop species (Martinez et al., 1999). The refore, sorghum genotypes from various origins
were used as a parent in plant breeding program and two crosses of sorghum were used
for this path analysis study.
Materials and Methods
Field experiment and hematoxylin analysis
The materials used in this study are shown in Table 13. The field trial and
hematoxylin staining screening method are same with methods in previous sections.
Data were obtained from average of two planted seasons (two years).
Calculation
The linear interrelationship among Al tolerance and other agronomic traits is
illustrated in the regression model;
Al tolerance in F3 = βo + β1(dry weight) + β2(length of head) + β3(days to flowering) +
β4(plant height) + β5(harvest index) + β6(Al tolerance in F2)
A path coefficient is defined as the portion of the standard deviation of
dependent variable that is due to the variation of in independent variable and is simply a
standardized partial-regression coefficient (Li, 1956; Dewey and Lu, 1959) as follows;
Pxy = Bσx / σy

Chapter 4 Development of sorghum tolerance to Al-toxicity
61
where, Pxy is path coefficient for the direct path from X (independent variable) to Y
(dependent variable); B is regression coefficient of Y on X; σx and σy are standard
deviation of X and Y, respectively.
A path diagram is shown in Fig. 13, where P17, P27, P37, P47, P57 and P67
represent path coefficients to Al tolerance in the F3 from dry weight, length of head,
days to flowering, plant height, harvest index and Al tolerance in F2 population,
respectively. The direct effect of each variable component on Al tolerance is a path
coefficient from that component to Al tolerance. The indirect effect of one component
through a second component is the product of the path coefficient from the second
component and the correlation between the two components.
Collinearity diagnostic was performed to increase accuracy of the regression
model and screening the unstable variable’s regression coefficients. Pearson correlation,
multiple linear regression analysis and data validation were analyzed using SPSS 10.1
for Windows software program (SPSS for Windows, 1999).
Results
Correlation and multiple linear regression model
Grain weight plant-1 was excluded from the linear regression model because it
was almost a linear combination of the other independent variables. Based on
collinearity statistic analysis, the tolerance test of grain weight plant-1 was very small
(near zero- Table not shown). This suggested that the other independent variables could
explain the almost 99.9% variability of grain weight plant-1 in both C9/H11//ICR3 and
C9/H13//ICR3. Therefore, it was no surprising if grain weight plant-1 showed significant

Chapter 4 Development of sorghum tolerance to Al-toxicity
62
correlations with the others independent variables in both series of crosses (Table 18
and 19).
ANOVA of multiple linear regression coefficients were significant for both
C9/H11//ICR3 and C9/H13//ICR3 (Table not shown), indicating that there was a linear
relation between six independent variables and dependent variable in the model of
multiple linear regressions. The multiple linear regression models of C9/H11//ICR3 and
C9/H13//ICR3 for six- independent variables explained the variation in Al tolerance with
R2 value 0.501 and 0.555, respectively. It means that six agronomic variables that were
included in this model explained more than 50% variability of Al tolerance.
C9/H11//ICR3 cross
Generally, dry weight mainly affected Al tolerance through its direct effect
(Table 20). The greatest direct influence was registered by dry weight on Al tolerance in
F3. The indirect effect of dry weight on Al tolerance via days to flowering and plant
height were contradictory but relatively small, reflecting the fact that plant height and
days to flowering were less correlated with Al tolerance (Table 20).
A small direct effect of harvest index and Al tolerance in F2 population on Al
tolerance in F3 was registered and a negligible direct effect of length of head on Al
tolerance in F3 was seen in this cross. A low heritability 0.35 of Al tolerance (Table 14)
caused a small contribution of Al tolerance in F2 population to the improvement of Al
tolerance in F3. All indirect effects of Al tolerance in F2 population on Al tolerance in F3
were generally negligible. Harvest index and length of head affected Al tolerance
mainly through their indirect effect via dry weight.

Chapter 4 Development of sorghum tolerance to Al-toxicity
63
C9/H13//ICR3 cross
There was the greatest direct influence from plant height on Al tolerance, with
harvest index of next magnitude, then Al tolerance in F2 population (Table 21).
Generally high influence was registered by plant height both directly and indirectly on
Al tolerance in F3.
A strong positive effect (0.544) was registered directly by Al tolerance in F2
population on Al tolerance in F3 for C9/H13//ICR3 (Table 21). This magnitude was
higher than direct effect of Al tolerance in F2 for C9/H11//ICR3. The indirect effect of
Al tolerance in F2 population on Al tolerance in F3 via plant height had also positive
influence due to the fact that the plant height was correlated with Al tolerance in this
cross. The length of head and dry weight mainly affected Al tolerance through its
indirect effect of plant height that was higher in magnitude than their direct effect.
Discussion
Generally, two crosses used in this study showed a similar correlation with Al
tolerance. Partitioned into each components show different direct and indirect effects on
Al tolerance between these crosses. However, the examination of the path analysis
revealed that dry weight or plant height exerted the great influence both directly and
indirectly on Al tolerance (Table 20 and 21). The different direct effect on Al tolerance
between these genotypes might be attributable to: (i) a different genetic control between
these genotypes, (ii) an environmental factor that influenced the Al tolerance.

Chapter 4 Development of sorghum tolerance to Al-toxicity
64
Table 18. Pearson’s correlation coefficients for six agronomic traits and Al tolerance of C9/H11//ICR3 sorghum genotype.
**, * = significant at the 1% and 5% level, respectively.
Table 19. Pearson’s correlation coefficients for six agronomic traits and Al tolerance of
C9/H13//ICR3 sorghum genotype.
Dry
weight
Length of
head
Grain
weight
per plant
Days to
flowering
Plant
height
Harvest
index
Al-tol. in
F2
n
Length of head 0.611** 119
Grain weight per plant 0.628** 0.377** 115
Days to flowering 0.440** 0.236** 0.002 120
Plant height 0.727** 0.280** 0.624** 0.270** 111
Harvest index 0.128 0.139 0.852** -0.331** 0.298** 119
Al tolerance in F2 -0.265* -0.258 -0.209 -0.382** -0.376** -0.183 57
Al tolerance in F3 -0.387** -0.408** -0.370** -0.385** -0.661** -0.254 0.597** 57 **, * = significant at the 1% and 5% level, respectively.
Dry
weight
Length of
head
Grain
weight
plant-1
Days to
flowering
Plant
height
Harvest
index
Al-tol. in
F2
n
Length of head 0.514** 138
Grain weight per plant 0.619** 0.450** 138
Days to flowering 0.632** 0.251** 0.639** 131
Plant height 0.467** 0.292** 0.503** 0.237** 138
Harvest index 0.096 0.216** 0.841** -0.097 0.265** 138
Al tolerance in F2 -0.119 -0.174 -0.201 -0.232 0.053 -0.201 57
Al tolerance in F3 -0.505** -0.267* -0.488** -0.207 0.115 -0.350** 0.268* 57

Chapter 4 Development of sorghum tolerance to Al-toxicity
65
Table 20. Direct (underline) and indirect effect of dry weight, length of head, days to flowering, plant height and Al tolerance in F2 on Al tolerance for C9/H11//ICR3 genotype.
Dry
weight
Length of
head
Days to
flowering
Plant
height
Harvest
index Al-F2 r
Dry weight -0.764 -0.004 0.166 0.238 -0.093 -0.029 -0.486**
Length of head -0.334 -0.010 0.046 0.140 -0.082 -0.026 -0.265*
Days to flowering -0.492 -0.002 0.258 0.169 -0.069 -0.049 -0.185
Plant height -0.385 -0.003 0.093 0.471 -0.069 0.012 0.119
Harvest index -0.387 -0.004 0.098 0.178 -0.183 -0.030 -0.329*
Al-F2 0.113 0.001 -0.065 0.030 0.029 0.195 0.303*
Number of sample was 57. Variables were transformed by the natural logarithm. Direct and indirect effects of particular components are within a row. **, * = significant at the 1% and 5% level, respectively; r = correlation in path analysis.
Table 21. Direct (underline) and indirect effect of dry weight, length of head, days
to flowering, plant height and Al tolerance in F2 on Al tolerance for C9/H13//CR3 genotype.
Dry
weight
Length
of head
Days to
flowering
Plant
height
Harvest
index Al-F2 r
Dry weight 0.091 -0.195 0.109 -0.688 0.451 -0.141 -0.372**
Length of head 0.079 -0.224 0.074 -0.549 0.372 -0.116 -0.364**
Days to
flowering 0.026 -0.044 0.375 -0.422 -0.093 -0.238 -0.395**
Plant height 0.070 -0.138 0.178 -0.888 0.440 -0.196 -0.535**
Harvest index 0.068 -0.138 -0.058 -0.645 0.606 -0.094 -0.261
Al-F2 -0.024 0.048 -0.164 0.321 -0.104 0.544 0.621**
Number of samples is 57. Variables were transformed by the natural logarithm. Direct and indirect effects of particular components are within a row. **, * = significant at the 1% and 5% level, respectively; r = correlation in path analysis.

Chapter 4 Development of sorghum tolerance to Al-toxicity
66
Dry weight was an important component in C9/H11//ICR3 and plant height
was an important component in C9/H13//ICR3 (Table 20 and 21). Determining whether
this phenomenon is unique to these lines used in the current study or is related to the
genetic control of the Al tolerance mechanism will take additional studies. Shuman et al.
(1990) reported sorghum plant height decreased linearly with Al3+ activity, while plant
weight vs. Al3+ decreased in curvilinear. Flores et al. (1988) reported that the severe acid
soil affected more extensively the dry matter, stover, grain and head yields, seeds per
head and seed weight traits than the growth traits of sorghum.
Conclusion
Dry weight and plant height were most closely associated with Al tolerance.
Based on the overall correlation data and path analysis data, a way to maximize the Al
tolerance in sorghum is proposed as follows. Increasing of dry weight and selection of
Al tolerance in F2 was more appropriate to maximize the Al tolerance in sorghum
because correlation of dry weight and Al tolerance was more stable than plant height,
and its direct and indirect effect on Al tolerance were high.

67
V. Future Development of Al-tolerant Sorghum 5.1. Genotypic Difference of Sorghum in Callus Formation and Callus Growth on
Al-containing Medium
The use of tissue culture for selection of several Al-tolerant plants has been
reported (Ojima and Ohira, 1983; Smith et al., 1983; Duncan et al., 1995; Conner and
Meredith, 1985a; Barnabas et al., 2000). However, previous screening by tissue culture
was generally made based on the growth of calli derived from the explants of each
genotype on Al-containing medium. Even when the variation in Al tolerance was not
detected in the original explants, it appeared during the culture process.
Parrot and Bouton (1990) reported that alfalfa plants from the Al-tolerant
germplasm rapidly expressed Al tolerance at the callus stage. If the performance of Al
tolerance in tissue culture is similar to that at the plant level, tissue culture may be more
useful for breeding programs because selection can be earlier and faster than that in the
field. Moreover, the selection by tissue culture can be applied to identify Al- tolerant
plants in a segregating population.
Although this approach has not been applied to sorghum, previous work with
alfalfa showed that Al tolerance of plants was also expressed at the cellular level (Parrot
and Bouton, 1990). The present study aims to study the genetic variation of Al tolerance
in sorghum and to elucidate the callus performance of the Al-tolerant and Al-susceptible
genotypes on the Al-containing medium with high availability Al3+ for the callus.
Materials and Methods
Plant materials and explant preparation
Ten selected sorghum genotypes were used in this experiment (Table 22). All of

Chapter 5 Future development of Al-tolerant sorghum
68
these genotypes except G1 were screened for Al tolerance by hematoxylin staining and
the growth on the soil in pots with Al added in the previous chapters. G4, SPA 2, and
SPAD were considered as tolerant genotypes and G2, G5, C9/H11, C9/H13 were
considered as susceptible genotypes (Table 22). The G1 genotype was chosen because of
its high cell proliferation rate in tissue culture (Can and Yoshida, 1999b).
Seeds were surface-sterilized with TWEEN and calcium hypochlorite (60%) and
were then soaked in sterile water at room temperature. After small radicles had emerged,
seeds were allowed to grow on a solidified hormone-free MS medium and were then kept
in an incubator in darkness at 25oC.
Media
Calli were induced on the medium containing Murashige and Skoog (MS)
inorganic salts, 2.0 mg L-1 kinetin, 1.0 mg L-1 IAA and 2.5 mg L-1 2,4-D, from the cut
pieces of mesocotyl (called explants, hereafter) at zones III and IV, which were specified
by Gendy et al. (1996) (Fig. 14). The culture medium was adjusted to pH 5.8. This
medium was referred to as Al-free medium.
To examine the Al toxicity, the standard MS medium modified according to the
report by Conner and Meredith (1985b) was used. The pH of the culture medium was
adjusted to pH 4, at which Al3+ was considered as the dominant form of Al in the
solution (Koyama et al., 1990). The phosphate concentration was reduced from 1250 µM
to 10 µM and calcium was reduced from 3000 µM to 100 µM to give high effect of Al
toxicity on callus (Ojima and Ohira, 1983; Conner and Meredith, 1985b). The Al
concentration of the Al-containing medium was adjusted to 400 µM by adding AlCl3・

Chapter 5 Future development of Al-tolerant sorghum
69
Table 22. Sorghum genotypes used in callus selection and their aluminum tolerance score.
Score 1 = tolerant; score 5 = susceptible; RRL = relative root length in growth response method; G2 = Hegari; G5=RTx403; 1) Data were copied from section 3.1. 2) Data from Duncan et al. (1995).
Fig. 14. Sorghum mesocotyl. The transverse thin cell layer (1 - 0.3 mm) was cut from the mesocotyl at zones III and IV. Zone III is the sub-apical zone and zone IV is the base of the apical meristem.
Al tolerance score Genotype
Hematoxylin staining RRL1) Acid soil2)
G1 - - -
G2 5 (susceptible) - susceptible
G3 3 (intermediate) 1 (tolerant)
G4 1 (tolerant) 1 (tolerant)
G5 - - susceptible
G7 3 (intermediate) 1 (tolerant)
SPA 2 1 (tolerant) 1 (tolerant)
SPAD 2 (tolerant) 1 (tolerant)
C9/H11 4 (susceptible) 3 (intermediate)
C9/H13 4 (susceptible) 5 (susceptible)
Zone IVZone IVZone IIIZone III
nodenode1 cm1 cm
Zone IVZone IVZone IIIZone III
nodenode1 cm1 cm

Chapter 5 Future development of Al-tolerant sorghum
70
6H2O to the medium (Taylor, 1995; Conner and Meridith (1985b), after autoclaving but
immediately prior to gelling of the medium.
Culture condition
The explants were cultured on 20 mL of the media with and without Al added
for the observation of the callus formation. For each treatment, at least 1050 explants
were planted over three replications. Petri dishes with explants were placed in an
incubator in darkness at 30oC. Observations were made at two, five and eight weeks after
planting.
To examine the effect of Al on the callus growth, calli were subcultured twice on
Al-free medium before the treatment with Al. The calli were cut into small pieces as
uniform as possible and planted on the medium with or without Al added in petri dishes.
At least 30 calli per treatment were used for one replication. The weight and size of each
callus was measured at three-week intervals up to the 11th week. Callus was transferred
to fresh medium at three weeks intervals to eliminate micronutrient deficiency.
Calculation and experimental design
The percentage of callus formation (CF) is calculated as;
CF = (number of explants with calli)(total number of explants)-1 x 100.
The relative suppression of CF by Al (RSC) is calculated as;
RSC = 100 – {(CF on Al-containing medium)(CF on Al-free medium)-1} x 100.
Fresh callus weight was determined as the difference between the weight of a petri dish
with callus and that after removal of the callus. The percent growth of callus in fresh
weight (GW) is calculated as (Conner and Meredith 1985a);
GW = {100 x (Wf – Wi)}(Wi)-1

Chapter 5 Future development of Al-tolerant sorghum
71
where, Wi and Wf are the initial and final fresh weight of callus, respectively. GW on
Al-containing medium relative to that on Al-free medium is expressed by relative growth
in weight (RGW) and calculated as;
RGW = {(GW on Al-containing medium)(GW on Al-free medium)-1} x 100.
A multiplication of the longest and the widest axes of callus was used to show callus size.
The percent growth in size of callus (GS) is calculated as;
GS = {100 x (Sf – Si)}(Si)-1
where Si and Sf are the initial and final size of callus, respectively. GS on Al-containing
medium relative to that on Al-free medium was shown by relative growth in size (RGS)
and calculated as;
RGS = {(GS on Al-containing medium)(GS on Al-free medium)-1} x 100.
The CF, RSC, RGW and RGS of each genotype were then analyzed in
randomized complete block design. Three replications were designed both in Al-free
medium and Al-containing medium. Those with a similar planting time were regarded as
one replication in this experiment.
Results and Discussion
All genotypes used in this experiment formed calli on Al-free medium, but the
percentage of the explants that formed calli (CF) significantly varied with the genotypes
(p < 0.01) either on Al-free or Al-containing medium (Fig. 15). Genotype SPA2, G1 and
G3 formed more calli on Al-free medium than the other genotypes, and the SPAD formed
the fewest calli on Al-free medium, suggesting the poor callus formation in tissue culture.
Addition of Al to the medium with low pH, low Ca and low phosphate resulted

Chapter 5 Future development of Al-tolerant sorghum
72
in a severe decrease in the percentage of callus formation (CF) in both Al- tolerant and
Al-susceptible genotypes (Fig. 16). Parrot and Bouton (1990) reported that medium
modification other than of Al (low pH, low Ca, low phosphate) resulted in a depression
of callus growth relative to that on standard medium for both Al-tolerant and
Al-susceptible genotypes. However the addition of Al to this modified medium resulted
in an additional decrease in callus growth of the Al-susceptible population of Alfalfa, but
not in the Al-tolerant population.
In all cases, the genetic variance was higher than the individual variance (Table
23), suggesting that the difference in callus performance among genotypes was genetic.
The relative suppression of callus formation by Al (RSC) in the Al- tolerant genotypes
was lower than that in the susceptible genotypes (Table 23). This suggested that the
Al-tolerant genotypes were more capable of forming callus than susceptible genotypes on
Al-containing medium. Some of the susceptible genotypes did not form calli on
Al-containing medium and were shown by 100% RSC (Table 23 and Fig. 15). There was
a significant negative correlation (r = –0.664*) between RSC and CF on Al-containing
medium. Genotypes that showed low RSC also showed high capability of callus
formation on Al-containing medium.
The RGW and RGS of tolerant genotypes was still higher than that of the other
genotypes with exception of SPAD (Table 23) because SPAD showed a low callus
formation even in Al-free medium as was mentioned above and shown in Fig. 15.
Al-susceptible population of Alfalfa also showed an additional decrease in callus growth
when it was planted in the modification medium supplemented with Al (Parrot and
Bouton, 1990).

Chapter 5 Future development of Al-tolerant sorghum
73
Fig. 15. Percentage of callus formation (CF) on Al-free medium, that on Al-containing
medium and percent relative suppression of callus formation by Al (RSC) at eight weeks after planting. A common letter on a graph is not significantly different at the 5% level by Duncan’s multiple range test. Genotype G2, G5 and C9xH13 were excluded from the analysis because no callus variation over replications was observed.
Fig. 16. Differences in callus formation and callus growth of the same genotype (G1)
between Al-free medium and Al-containing medium. A, callus formation on Al-free medium (formed callus are enclosed by circle); B, callus formation on Al-containing medium; C, callus growth on Al-free medium; D, callus growth on Al-containing medium.
CF on Al-freemedium
CF on Al-containingmedium
d cde
bc
f
ab a
RSC
0
20
40
60
80
100
G1 G2 G3 G4 G5 G7SP
A2SP
AD
C9xH11
C9xH13
Genotype
( % )

Chapter 5 Future development of Al-tolerant sorghum
74
Table 23. Percent relative suppression of callus formation by Al (RSC), relative growth in fresh weight of callus on Al-containing medium (RGW) and relative growth in size of callus on Al-containing medium (RGS) at 11th week after planting in various sorghum genotypes.
Values followed by a common letter in the column are not significantly different at the 5% level by Duncan’s Multiple Range Test. Genotype G2, G5, C9xH13 were excluded from the analysis because of no variation over replications.
Table 24. Correlations among relative suppression of callus formation (RSC), relative
growth in fresh weight of calli on Al-containing medium (RGW), relative growth in size of calli on Al-containing medium (RGS), hematoxylin staining score on Al medium (HS) and score of growth response to Al added in the soil in pot (ASP).
*, ** = significant at the 5% and the 1% level, respectively; 1) Data were copied from section 3.2. CF was measured at eight week after planting; GS and GW were measured at 11th week after planting.
Genotype RSC (%) RGW (%) RGS (%)
G1 78.00 cd 21.115 ab 39.968 cd
G2 100.00 10.655 a 11.831 a
G3 88.15 cd 30.495 b 16.491 ab
G4 18.83 a 50.073 c 70.617 e
G5 100.00 10.243 a 11.509 a
G7 66.39 bc 23.397 b 29.275 bc
SPA2 48.47 b 71.910 d 51.577 d
SPAD 85.00 cd 10.017 a 11.667 a
C9/H11 99.17 d 10.139 a 11.745 a
C9/H13 100.00 10.033 a 11.402 a
Genetic Variance (σg2) 3.71 429.154 420.076
Individual Variance (σe2) 0.68 35.753 63.036
RGW RGS HS1) ASP1)
RSC − 0.820** − 0.956** 0.852** 0.583
RGW 0.824** − 0.787* − 0.514
RGS − 0.792* − 0.472
HS 0.666**

Chapter 5 Future development of Al-tolerant sorghum
75
The RGW and RGS showed a significant correlation (r = 0.824**) at the 11th
week after planting (Table 24). RGW and RGS also showed a significant negative
correlation (r = –0.820** and r = –0.956**) with RSC. Genotypes that showed a high
RGW and RGS also showed low RSC, as was shown for Al-tolerant genotypes such as
G4 and SPA2 (Table 23).
The variations in Al tolerance among these genotypes were observed by
hematoxylin staining and the growth on the soil with Al in pots as described in the
previous chapters. In all cases, the callus performance (RGS, RGW, RSC) showed a
significant correlation with the Al tolerance score in hematoxylin staining (Table 24),
which suggested that Al might be the major limiting factor that affected the callus
growth in Al-containing medium in this experiment. Genotypes that showed a low RSC
(G4 and SPA2) showed high tolerance score 1 by the hematoxylin staining screening
method.
Callus performance was not significantly correlated with the score of growth
response to Al in the soil in pot (Table 24). The evaluation of tolerant genotype by a
short-term (15 days) growth response to the Al by the pot method might curtail the
accuracy of the screening method. However, the growth-response to Al in pot method
showed a significant correlation with the score as described in the previous chapters.
Conclusion
The percentage of callus formation and the callus growth on Al-containing
medium varied with the genotypes, indicating that the tissue culture could be used to

Chapter 5 Future development of Al-tolerant sorghum
76
screen Al-tolerant genotypes. The differences in callus growth and the percentage of
callus formation among genotypes were in agreement with those in the hematoxylin
staining.

Chapter 5 Future development of Al-tolerant sorghum
77
5.2. Direct Gene Transfer to Anther and Floret-derived Callus of Sorghum by
Particle Bombardment
Traditional plant breeding methods have mostly been used to combine the
desirable characters in one sorghum plant. This approach is laborious and
time-consuming compared with genetic engineering (Liu et al. 2003). However,
improvements through genetic engineering have been slow in sorghum because of
sorghum recalcitrance to genetic transformation (Emani et al., 2002).
The biolistic system, particle bombardment, is widely used for delivery of
genetic materials directly into intact cells and tissues. Microprojectile bombardment
represents a powerfull method for the transformation of various organisms and tissue
(Kruse et al., 2002; Liu et al., 2003). Transformed tissue can be easily visualized using
green fluorescent protein (GFP) or staining of GUS expression. However,
transformation efficiency of the bombardment method in sorghum is still low
(0.2~0.5%) compared with Agrobacterium method (Emani et al., 2002).
The promoter plays a crucial role in successful transformation studies. The
viral Cauliflower Mosaic Virus 35S (CaMV 35S) promoter has been widely used in the
transformation of many dicot and monocot crops (Liu, et al 2003). Some promoters
showed different activity in sorghum (Emani et al., 2002), sugarcane (Liu et al., 2003)
and tall fescue (Takamizo, 1996). Most of these promoters were rice (actin and
polyubiquitin) promoter, maize ubiquitin promoter and Cauliflower Mosaic Virus 35S
promoter.
The preliminary microprojectile bombardment experiment was carried out in

Chapter 5 Future development of Al-tolerant sorghum
78
this study to evaluate the utility and effect of different DNA constructs on transient GUS
expression in anther and floret-derived callus of sorghum.
Materials and Methods
Plant materials and culture media
Sorghum genotype SPA2, C9/H11//C9/H13, C9/H11//SPA2, C9/H13//SPA2,
C8/H2 were used for anther and floret callus induction. Tall fescue suspension cultures
were used as a control in this experiment. Tall fescue callus induction media was MS
medium with 3% sucrose (pH 5.8) and was supplemented with 5 mg L-1 2,4-D and 500
mg L-1 casein hydrolysate.
Plants were grown in pots (20 cm in diameter) at a greenhouse and were
fertilized with N, P2O5 and K2O at the rate of 1.44g per pot. Anther culture method was
carried out according to the protocol of Nakamura et al. (1997). Anthers and floret were
harvested from panicle when about 2cm of flag leave sheath arose from culm. Spikelets
at one-third from the upper part were excised and sterilized with 60% EtOH for 3
minutes. Anthers and florets were washed three times with sterilized distilled water
prior inoculation. Thirty anthers and 15 florets were inoculated onto Murashige and
Skoog medium supplemented with 2.0 mg L-1 kinetin, 1.0 mg L-1 IAA and 2.5 mg L-1
2,4-D. Selective medium for stable trans formation was supplemented with 100 mgL-1
hygromycin.
DNA transformation constructs.
Three DNA constructs, namely, pAct1-D (rice actin promoter), pWI-GUS
(double CaMV 35S promoter), pEX7113 (improved CaMV 35S promoter) were used to

Chapter 5 Future development of Al-tolerant sorghum
79
drive transient β-glucuronidase (GUS) expression in sorghum calli. All apparatus and
plasmids for particle bombardment in this experiment were kindly arranged and
provided by Dr. Tadashi Takamizo, National Grassland and Research Institute. The
plasmid pAcH1, kindly provided by Dr. G. Spangenberg (La Trobe University,
Australia) carrying the selectable marker gene for hygromycin resistance (hpt), was
used for stable transformation experiment under the control of rice actin 1 gene
promoter (Spangenberg et al., 1995).
Microcarrier preparation (1~1.6 µM gold particles)
Thrirty milligram gold particles were washed first with 1 mL 100% EtOH and
particle suspension was sonicated using ultra sonic wave for 60 minutes. The gold
suspension was allowed to settle under gravity at room temperature for about 15
minutes and suspension was then transferred into a new sterile microtube (hard particles
were removed). The gold suspension was centrifuged at 9000 rpm for 10 seconds and
supernatant (ethanol) were then removed. Pellet was added with 1 mL sterile water and
then mixed using vortex and settled under gravity for a minute. Washing process was
repeated three times with centrifugal interruption for about 10 second at the end of each
step. The gold was finally resuspended in 600 µL 50% glycerol.
DNA coating (for 10 shooting)
100 µL of gold suspension, 10~20 µL of plasmid DNA, 100 µL of 2.5 M CaCl2
and 40 µL 0.1 spermidine were added sequentially to the particle suspension. After
thorough mixing by short spurts of vortexing (about 3 minutes), the gold-DNA
suspension was settled under gravity at room temperature for about 30 minutes. The

Chapter 5 Future development of Al-tolerant sorghum
80
supernatant was carefully removed and pellets were then washed with 200 µL 70%
ethanol. The gold-DNA suspension was settled under gravity (or slightly centrifuge) for
a minute. Washing process was repeated two times and finally resuspended in 110 µL
100% ethanol. Ten µL of this suspension was spread onto sterile macrocarrier discs for
bombardment. The macrocarrier discs were air-dried prior setting for bombardment.
Particle bombardment and plant transformation
Anther calli and floret-derived calli of sorghum were subculture on fresh MS
medium with 2% (w/v) sucrose in 2~9 weeks after induction supplemented with 2
mgL-1 kinetin and 2.5 mg L-1 2,4-D. All anther-derived calli were divided into small
pieces (0.5~0.8 cm in diameter) before bombardment. Calli were transferred on to fresh
medium and placed at the center of a petri dish a day prior to bombardment. More than
30 anther calli were placed in a petri dish. Floret-derived calli were not divided into
small pieces prior to bombardment and were bombarded in bigger calli size (0.7~1.5
cm in diameter). About 10~15 florets were planted in a petri dish. Regeneration medium
for tall fescue was MS medium with 3% (w/v) sucrose supplemented with 0.2 mgL-1
kinetin.
A biolistic PDS-1000/He (Bio-Rad) was used for transformation. The standard
bombardment parameters were used for routine microprojectile bombardment (Fig. 17).
The distance from rupture dish to microcarrier, from microcarrier to stopping screen
aperture and from stopping screen aperture to target tissue was 2.5, 1.0 and 9.5 cm,
respectively. Bombardment was conducted twice per petri dish with 1100psi
bombardment pressure.

Chapter 5 Future development of Al-tolerant sorghum
81
B.
C. Bombardment parameters:
Apparatus PDS-1000/He (Bio-Rad)
a. Gold particle: 1.5–3.0 mm (Aldrich).
b. Gold load per bombardment: 0.6 mg.
c. DNA load per bombardment: 2 mg.
d. Bombardment pressure: 1100 psi.
e. Number of bombardment: 2
Bombardment distance:
a. Gap distance: 2.5 cm.
b. Stopping screen aperture: 1 cm.
c. Target distance: 9.5 cm.
d. Vacuum pressure: 125 kPa.
Fig. 17. PDS-1000/He (Bio-Rad) apparatus was used for particle delivery (A); Diagram
of PDS-1000/He (Bio-Rad) apparatus showed component parts in detail (B); Bombardment parameters used in this study (C).
Rupture disc
Macro carrier
Gold particles
coated with DNA
Stopping screen aperture
Target callus
Bombardment pressure
Target distance

Chapter 5 Future development of Al-tolerant sorghum
82
Histochemical GUS assay and stable transformation
Following bombardment, the calli were incubated for three days on the same
medium and GUS gene expression was assayed histochemically with
5-bromo-4-chlorol-3-indolylglucuronide (X-Gluc, Gold Biotechnology, Inc) substrate
according to Jefferson et al. (1987). Bombarded calli were incubated over night at 37oC
in an assay solution containing phosphate buffer (150 mM NaPO4, 0.1% (v/v) Triton
X-100, pH 7.0) with 1.0 mM X-Gluc and 20% (v/v) methanol, and examined under a
dissecting microscope for blue precipitate in a cell. Each distinct spot was counted as
one expression event.
For stable transformation, calli were transferred onto MS medium
supplemented with 200 mgL-1 hygromycin. This hygromycin concentration absolutely
repressed the number of colonies and fresh weight of tall fescue protoplast (Takamizo,
1996). Calli were incubated at 25oC for one month for identification of hygromycin
resistant callus. Only the survived calli were considered for transformation result.
Results and Discussion
The overall percentage of anther and floret-callus induction varied among
genotypes. The percentage of anther-callus induction ranged from 10% to 35% and
floret-callus induction ranged from 68% to 80% from the total induced explants (Fig.
18). Embryogenic calli were observed in some florets and anther-derived callus and
browning was also observed in anther-derived calli (Fig. 18c,d).
Activity of GUS genes were observed for all DNA plasmids in both sorghum
callus and tall fescue suspension cultured cells. Presence of any blue spots in sorghum

Chapter 5 Future development of Al-tolerant sorghum
83
Fig. 18. Anther-derived calli (A) and floret-derived calli (B) of srghum. Embryogenic
calli of floret-derived sorghum callus (C) and browning in anther-derived sorghum callus (D).
Fig. 19. The transient GUS expression (blue spots by arrow-marked) in floret-derived
sorghum calli bombarded with pAct-D (A), pWI-GUS (B), pEX7113 (C).
A B C
D
A B C

Chapter 5 Future development of Al-tolerant sorghum
84
callus indicated transient expression of the gus gene (Fig. 19). This suggested that
three DNA constructs (pAct1-D, pWI-GUS and pEX7113) could deliver
introduce-genes into sorghum cells and could be used in gene transformation technique.
GUS expression was detected three days after bombardment ind icating that division and
growth of the cell to which DNA was delivered has occurred (Casas et al., 1993). The
pWI-GUS construct carrying double CaMV 35S promoter gave the highest gene
transformation in sorghum callus (Fig. 20). This DNA construct (pWI-GUS) also gave
the highest number of blue spots in tall fescue compared with five others DNA
constructs (Takamizo, 1996).
The number of blue spots per petri dish in sorghum callus (2~8 blue spots) was
lesser than blue spots per petri dish in tall fescue suspension cell culture (57 blue spots).
Tall fescue was used as a control because all protocols and bombardment parameters
were routinely used for tall fescue, thus it was not surprising if the number of blue spots
in tall fescue was much higher than in sorghum callus. Takamizo (1996) reported
difference of transient GUS expression in suspension cultured cells among species, in
which the number of blue spots in tall fescue (104 spots) was much higher than meadow
fescue (1.7 spots) and Italian ryegrass (8.0 spots). The optimization of bombardment
parameters; i.e. vacuum condition, distance between microparticles and target cell, size
and density of the microparticles and driving power, were needed for more efficient
gene transfer.
No GUS activities were observed in anther-derived callus because dividing of
sorghum anther-derived callus prior bombardment caused browning of all anther callus.

Chapter 5 Future development of Al-tolerant sorghum
85
Fig. 20. Transient expression of GUS gene in floret-derived sorghum callus bombarded
with 3 different plasmids.
Fig. 21. Effect of callus age on transient expression of GUS gene in floret-derived
sorghum callus bombarded with 3 different plasmids. GUS activity were evaluated over plasmids.
05
101520253035404550
pAct1-D pWI-GUS pEX7113
Plasmid
Per
cent
age
of b
lue
spot
s
0
5
1015
2025
30
35
40
45
3 weeks after inoculation 6 weeks after inuculation
Floret-derived callus
Per
cent
age
of b
lue
spot
s

Chapter 5 Future development of Al-tolerant sorghum
86
GUS activity was observed in 2~3 weeks age of all floret-derived calli and were higher
than GUS gene activities in 6~7 weeks age floret callus (Fig. 21). These results suggest
that young, vigorously growing fresh callus is more suitable for direct gene transfer. In
addition, callus without physical interference at least a day before bombardment was
important in efficient gene transfer.
Hygromycin resistant calli could not be selected in this study because number
of escaped callus in hygromycin medium was too high (more than 90% callus survival
rate was observed). Takamizo (1996) reported that callus size affected the successful
selection of callus and number of escaped callus in the hygromycin-containing medium.
Conclusion
Activities of GUS genes were observed in both sorghum floret-derived callus
and tall fescue suspension cultured cells that were bombarded with three DNA plasmids
(pAct1-D, pWI-GUS and pEX7113). GUS activity was observed in all 2~3 weeks age
floret-derived calli and were higher than GUS gene activities in 6~7 weeks age floret
callus. The pWI-GUS construct carrying double CaMV 35S promoter gave the highest
gene transformation in sorghum callus.

87
VI. General Conclusion
For effective Al-tolerant sorghum breeding program, (i) well understanding in
genetic diversity and genetic background of the intended germplasm; (ii) accurate Al
screening technique ; (iii) understanding how the Al tolerance is inherited; and (iv)
efforts to try the new breeding method of genetic engineering are needed. All these
problems were subjected in this thesis.
High phenotypic and genotypic variations were observed among the sorghum
breeding germplasm used in this study. Generally, harvest index, 1000-grain weight,
length of head, plant height, stalk diameter and dry weight showed high variation. The
highest phenotypic and genotypic variations were shown by 1000-grain weight, with
harvest index of next magnitude, then plant height, length of head, dry weight and stalk
diameter. High phenotypic variation among plants in germplasm will provide an
opportunity in selection of superior plants that can be used as a parent in a cultivar
development program.
High phenotypic and genotypic variations in field experiments were also
supported by their genetic diversity assessed using SSR markers. Phenotypic or
genotypic variation that closely related to the gene diversity would increase the
effectiveness of selection. All breeding materials were distinctly placed at different
clusters in a dendogram. Japanese and almost USA populations were separately
clustered from ICRISAT populations. These populations were basic populations for
development of sorghum tolerance to Al toxicity in this study. Further crossings
between the materials and germplasm of separated groups were proposed for high yield
progenies.

Chapter 6 General Conclusion
88
From the markers technology side, using nine SSR markers out of 15 SSR
markers, which were usually used for genetic diversity study in multiplex PCR process,
satisfied enough for genetic diversity study in sorghum. It was shown by relatively high
diversity indices of each SSR marker and polymorphism of all SSR markers. Diversity
indices of each locus ranged from 0.70 (Sb6-34) to 0.94 (Sb1-10).
Hematoxylin staining screening method was applied to select Al- tolerant
genotypes in this study because it was simpler than other Al screening techniques and
had a significant correlation with Al screening technique in Al-added soil in pot method.
Hematoxylin staining screening method was also in agreement with performance
information at field with high Al saturation. This gave a basis of accurate Al tolerance
evaluation and was used all through this study.
Rapid evaluation of Al-tolerant genotypes at the cellular level could be
detected by tissue culture. The differences in callus growth and the percentage of
callus formation among genotypes were also in agreement with those in the
hematoxylin staining screening method, indicating that cell culture should be feasible to
develop a strategy based on the use of callus culture to assist in identification of
Al-tolerant or susceptible genotypes for use as parents in a breeding program.
Crossings of breeding lines that genetically showed a different genetic
background were conducted for development of Al-tolerant genotypes and for genetic
study of Al tolerance. Some breeding lines were chosen as parents in the cultivar
development program based on the results revealed in this study: (i) their performance
in field trials; (ii) their relationship in diversity study using SSR markers technology and
(iii) their performance in hematoxylin staining screening technique.
Moderately low heritability (H = 0.35 and H = 0.43) of Al tolerance was

Chapter 6 General Conclusion
89
observed in two crosses of sorghum and low genetic gain of Al tolerance was also
observed. It shows that high allocation of resources in early generations for Al tolerance
must be applied if higher gain for Al tolerance is to be obtained.
Indirect selection, which is believed to be effective for improvement of Al
tolerance, might be possible to achieve more rapid progress in breeding of Al- tolerant
genotypes. Based on the overall correlation data and path analysis data, dry weight was
the important component in the relationship with Al tolerance. Therefore, it was
suggested that increasing of dry weight and selection of Al tolerance in early
generations were more appropriate to maximize the Al tolerance in sorghum.
As it was mentioned above that cell culture was possible to assist in
identification of Al- tolerant genotypes, direct gene transfer into sorghum callus using
particle bombardment should be an alterna tive for development of Al- tolerant cultivars
through gene transformation. Transient expressions of the GUS gene were observed in
floret-derived sorghum calli bombarded with three DNA plasmids (pAct1-D, pWI-GUS
and pEX7113). The pWI-GUS construct carrying double CaMV 35S promoter gave the
highest gene transformation in floret-derived sorghum calli. The young and vigorously
growing fresh callus was more suitable for direct gene transfer using particle
bombardment. However, more studies are necessary for optimization of bombardment
parameters; i.e. vacuum condition, distance between micro particles and target cell, size
and density of the micro particles.
Finally, since the gene control of Al tolerance in sorghum is not well
understood, the conventional plant breeding program is still important for development
of Al-tolerant sorghum. Improvement of efficiency of the conventional plant breeding
program that was judged from results obtained in this study might be gained through: (i)
Chapter 6 General Conclusion
90
precise selection of parents that will be used for development of Al-tolerant population;
(ii) adequate number of plants in early generations for selection of Al tolerance; (iii) use
of indirect selection via increasing of dry weight that was closely correlated with Al
tolerance; (iv) use of cell culture assay procedure to assist identification of Al- tolerant
genotypes. Further development of DNA markers, including SSR markers for Al
tolerance and understanding of gene control of Al tolerance that can be utilized in direct
gene transfer will more improve the efficiency of the conventional plant breeding
program.
This thesis includes new findings about: (i) genetic relationship and genetic
background of the Japanese cultivated sorghum and the elite breeding germplasm; (ii)
association between SSR markers and agronomic traits in sorghum; (iii) efficient and
reliable Al screening technique in sorghum; (iv) genetic gain of Al tolerance and direct
or indirect effect of agronomic traits on Al tolerance. All of this information, which I
believe, should contribute to the improvement of efficiency in the sorghum-breeding
program and support to the gain in world food production for mankind welfare.

91
Acknowledgments
In the name of Allah, Most Gracious, Most Merciful. All praise and thanks due
to Allah, Who always protects, guides, support us in all activities and peace and blessing
be upon His Messenger.
I owe Prof. Dr. Tomohiko Yoshida, Laboratory of Crop Science, Utsunomiya
University more than thanks, who has supported me all the way long since 1998 when
we first met during my M.Sc. study which he has supervised. I am also very grateful
unto him for the chance given me to do my Ph.D. at the United Graduate School of
Agriculture Science, Tokyo University of Agriculture and Technology, without which I
wouldn’t have attained. I definitely thank him for all the supervision and the support
during the course of the study, which characterized by patience, kindness and wisdom
while resolving all the academic and research issues.
I wish to express my deep gratitude to Prof. Dr. Tadashi Hirasawa, Professor of
the Tokyo University of Agriculture and Technology, who has kindly accepted to
supervise this thesis and I appreciate his input to improve the thesis.
I am also very grateful to Prof. Dr. Hitoshi Honjo, Professor of the Utsunomiya
University, and Prof. Dr. Toshiaki Matsuda, Professor of the Ibaraki University, for their
generous encouragement and valuable suggestion in preparing of the manuscript.
I would also like to thanks to the Dr. Yoshiharu Wada, Associate Professor of
Crop Science Laboratory, Utsunomiya University for his support and kind suggestion in
laboratory and fieldwork and miscellaneous matter.
I am indebted to the following Professors of Utsunomiya University: Prof. Dr.
Tomohide Natsuaki, Laboratory of Plant Pathology for his guidance in the genetic

Acknowledgments
92
molecular laboratory work and allowed me to work at Genomic Research Center of
Utsunomiya University; Prof. Dr. Maeda Tadanobu, University Farm for his kindly
support and introducing me to the real live of Japanese farmers and the various Japanese
culture.
I would like to convey my sincere thanks to Prof. Achmad Baihaki and all staff
at the Laboratory of Plant Breeding, Padjadjaran University-Indonesia for their
generous encouragement and the chance given me to study abroad.
Appreciations are extended to the Japanese Government for given me the
long-term Mombusho Scholarship throughout my M.Sc. and Ph.D study in nearly six
years.
My thanks are due to all the former and the present students of Laboratory of
Crop Science, Utsunomiya University for nice company and diverse support.
I want to express my grateful to my parents, sisters and brothers for their love,
encouragement and their constant support me. My hearty thanks to my dear wife
Aliyah and daughter Faza Haula Usman whose time I robbed, yet endured with me
throughout this study. Finally part of my family are all my brothers and sisters in Islam
who have supported me in all ways, Allah bless you.

93
References
Anas and Yoshida, T. 2000. Screening of Al – tolerant sorghum by hematoxylin staining and growth response. Plant Prod. Sci. 3:246 – 253.
Anas and Yoshida, T. 2002. Genotypic difference of Sorghum bicolor in the callus
formation and callus growth on aluminum-containing medium. Plant Prod. Sci. 5:242 – 247.
Andrade, L.R.M., Ikeda, M. and Ishizuka, J. 1997. Localization of aluminum in root tip
tissues of wheat varieties differing in aluminum tolerance. J. Fac. Agr., Kyushu Univ. 41:151 −156.
Baligar, V.C., Dos Santos, H.L., Pitta, G.V.E., Filho, E.C., Vasconcellos, C.A. and
Filho, A.F.D.C.B. 1989. Aluminum effects on growth, grain yield and nutrient use efficiency ratios in sorghum genotypes. Plant and Soil 116:257 − 264.
Baligar, V.C., Schaffert, R. E., Dos Santos, H. L., Pitta, G. V. E. and Filho, A.F.D.C.B.
1993. Growth and nutrient uptake parameters in sorghum as influenced by aluminum. Agron. J. 85:1068 – 1074.
Ball, R.A., McNew, R.W., Vories, E.D., Keisling, T.C. and Purcell, L.C. 2001. Path
analyses of population density effects on short-season soybean yield. Agron. J. 93:187 – 195.
Barnabas, B., Kovacs, G., Hegedus, A., Erdei, S., and Horvath, G. 2000. Regeneration of
double haploid plants from in vitro selected microspores to improve aluminum tolerance in wheat. J. Plant Physiol. 156:217 – 222.
Bernzonsky, W.A. (1992). The genomic inheritance of aluminum tolerance in “Atlas
66” wheat. Genome 35, 689 – 693. Bowers, J.E., Abbey, C., Anderson S., Chang, C., Draye, X., Hoppe, A.H., Jessup, R.,
Lemke, C., Lennington, J., Li, Z., Lin, Y.R., Liu, S.C., Luo, L., Marler, B.S., Ming, R., Mitchell, S.E., Qiang, D., Reischmann, K., Schulze, S.R., Skinner, D.N., Wang, Y.W., Kresovich, S., Schertz, K.F. and Peterson, A.H. 2003. A high-density genetic recombination map of sequence-tagged sites for sorghum, as a framework for comparative structural and evolutionary genomics of tropical grains and grasses. Genetics 165:367 – 386.
Boye-Goni, S.R. and Marcarian, V. 1985. Diallel analysis of aluminum tolerance in
selected lines of grain sorghum. Crop Sci. 25:749 − 752. Brown, S.M., Hopkins, M.S., Mitchell, S.E., Senior M.L., Wang, T.Y., Duncan, R.R.,
Gonzales-Candelas, F. and Kresovich, S. 1996. Multiple methods for the identification of polymorohic simple sequence repeats (SSRs) in sorghum [Sorghum bicolor (L.) Moench]. Theor. Appl. Genet. 93:190 –198.

References
94
Bushamuka, V.N. and Zobel, R.W.1998. Maize and soybean tap, basal and lateral root responses to a stratified acid, aluminum-toxic soil. Crop Sci. 38:416 − 421.
Callen, D.F., Thompson, A.D., Shen, Y., Phillips, H.A., Richards, R.I., Mulley, J.C. and
Sutherland, G.R. 1993. Incidence and origin of "null" alleles in the (AC)n microsatellite markers. Am. J. Hum. Genet. 52:922 – 927.
Campbell, G.K.A. and Carter, Jr. T.E. 1990. Aluminum tolerance in soybean: I.
Genotypic correlation and repeatability of solution culture and greenhouse screening method. Crop Sci. 30:1049 −1054.
Can, N.D., Nakamura, S. and Yoshida, T. 1997. Combining ability and genotype x
environmental interaction in early maturing grain sorghum for summer seeding. Jpn. J. Crop. Sci. 66:698 – 705.
Can, N.D. and Yoshida, T. 1999a. Breeding for high yield, early maturity and short plant
height in sorghum: heterosis and combining ability. Proc. Int. Symp."World Food Security", Kyoto: 129 –132.
Can, N.D. and Yoshida, T. 1999b. Combining albility of callus induction and plant
regeneration in sorghum anther culture. Plant Prod. Sci. 2:125 – 128. Can, N.D. and Yoshida, T. 1999c. Genotypic and phenotypic variances and covariances
in early maturing grain sorghum in a double cropping. Plant Prod. Sci. 2:67 – 70. Can, N.D. and Yoshida, T. 1999d. Grain yield of sorghum cultivars in a double cropping
system. Plant Prod. Sci. 2:121–124. Casas, A.M., Kononowicz, A.K., Zehr, U.B., Tomes, D.T., Axtell, J.D., Butler, L.G.,
Bressan, R.A. and Hasegawa, P.M. 1993. Transgenic sorghum plant via microprojectile bombardment. Proc. Natl. Acad. Sci. USA. 90:11212 – 11216.
Chang, Y.C., Ma, J.F. and Matsumoto, H. 1998. Mechanisms of Al- induced iron clorosis
in wheat (Triticum aestivum L.). Al- inhibited biosynthesis and secretion of phytosiderophore. Physiologia Plantarum 102:9 −15.
Conner, A.J. and Meredith, C.P. 1985a. Strategies for the selection and characterization
of aluminum-resistant variants from cell cultures of Nocotiana plumbaginifolia. Planta 166: 466 – 473.
Conner, A.J. and Meredith, C.P. 1985b. Stimulating the mineral environment of
aluminum toxic soils in plants cell culture. J. of Experimental Botany 36:870 – 880.
Craufurd, P.Q., Mahalakshmi, V., Bidinger, F.R., Mukuru, S.Z., Chantereau, J.,
Omanga, P.A., Qi, A., Robert, E.H., Ellis, R.H., Summerfield, R.J. and Hammer, G.L. 1999. Adaptation of sorghum: characterisation of genotypic flowering responses to temperature and photoperiod. Theor. Appl. Genet. 99:900 – 911.

References
95
David, J., Simon, G., Paul, L., Stephen, H. and Leon, K. 1997. Effect of aluminum
oxidative, anaerobic and mechanical stress on cytoplasmic CA2+ homeostasis in roots hairs of Arabidopsis thaliana. Tetran-Agricultural Research Servive Home page-US.
Dean, R.E., Dahlberg, J.A., Hopkins, M.S., Mitchell, S.E., and Kresovich, S. 1999.
Genetic redundancy and diversity among ‘Orange’ accession in the U.S. National sorghum collection as assessed with simple sequence repeats (SSR) markers. Crop Sci. 39:1215 – 1221.
Delhaize, E. and Ryan, P.R. 1995. Aluminum toxicity and tolerance in plants. Plant
Physiol. 107:315 − 321. De Sousa, C. N. A. 1998. Classification of Brazillian wheat cultivars for aluminium
toxicity in acid soils. Plant Breeding 117:217 – 221. Dewey, D.R. and Lu, K.H. 1959. A correlation and path-coefficient analysis of
components of crested wheatgrass seed production. Agron. J. 51:515 – 518. Djé, Y., Heuertz, M., Lefébvre, C. and Vekemans, X. 2000. Assessment of genetic
diversity within and among germplasm accessions in cultivated sorghum using microsatellite markers. Theor. Appl. Genet. 100:918 − 925.
Dong, D., Xie, Z., Du, Y., Liu, C. and Wang, S. 1999. Influence of soil pH on
aluminum availability in the soil and aluminum in tea leaves. Commun. Soil Sci. Plant Anal. 30:873 − 883.
Duncan, R.R., Clark, R.B. and Furlani, P.R. 1983. Laboratory and field evaluations of
sorghum for response to aluminum and acid soil. Agron. J. 75:1023 − 1026. Duncan, R.R. 1988. Sequential development of acid soil tolerant sorghum genotypes
under field stress conditions. Commun. Soil Sci. Plant Anal. 19:1295 − 1305. Duncan, R.R. Waskom, R.M. and Nabors, M.W. 1995. In vitro screening and field
evaluation of tissue-culture regenerated sorghum (Sorghum bicolor (L.) Moench) for soil stress tolerance. Euphytica 85:373 – 380.
Emani, C., Sunilkumar, G., Rathore, K.S. 2002. Transgene silencing and reactivation in
sorghum. Plant Science 162:181 – 192. FAO, 2003. http://apps.fao.org/. Falconer, D.S. and Mackay, T.F. 1996. Introduction to quantitative genetics. 4nd ed.
Longman Group, London.
Fehr, W.R. 1987. Principles of Cultivar Development Vol.1. Theory and technique. Macmillan Publishing Company, New York.

References
96
Felsenstein, J. 1993. PHYLIP (Phylogeny Inference Package) version 3.5c. Distributed
by the author. Department of Genetics, University of Washington, Seattle. Flores, C.I., Clark, R.B. and Gourley, L.M. 1988. Growth and yield traits of sorghum
grown on acid soil at varied aluminum saturation. Plant and Soil 106:49 – 57. Furlani, P.R. and Clark, R.B. 1981. Screening sorghum for aluminum tolerance in
nutrient solution. Agron. J. 73:587 − 594. Gallego, F.J. and Benito, C. 1997. Genetic control of aluminium tolerance in rye
(Secale cereale L.). Theor. Appl. Genet. 95:393 − 399. Gendy, C., Sene, M., Le, B.V., Vidal, J. and Van, K.T.T. 1996. Somatic embryognesis
and plant regeneration in Sorghum bicolor (L.) Moench. Plant Cell Reports. 15:900 – 904.
Ghebru, B., Schmidt, R.J. and Bennetzen, J.L. 2002. Genetic diversity of Eritrean
sorghum landraces assessed with simple sequence repeat (SSR) markers. Theor. Appl. Genet. 105:229 – 236.
Godbold, D.L. and Jentschke, G. 1998. Aluminium accumulation in root cell walls
coincides with inhibition of root growth but not with inhibition of magnesium uptake in Norway spruce. Physiol. Plant. 102:553 − 560.
Gomez, K.A. and Gomez, A.A. 1984. Statistical Procedures for Agricultural Research.
John Wiley & Sons, New York. 85 −129. Gourley, L.M., Rogers, S.A., Gomez, C.R. and Clark,R.B. 1990. Genetic aspects of
aluminum tolerance in sorghum. Plant and Soil 123:211 − 216. Halloran, G.M., Knight, R., McWhirter, K.S. and Sparrow, D.H.B. 1979. Plant Breeding.
Poly-Graphics Pty. Ltd., Brisbane. 48 – 62. Hill, P.R., Ahlrichs, J.L. and Ejeta, G. 1989. Rapid evaluation of sorghum for aluminum
tolerance. Plant and Soil 114:85 − 90. Jefferson, R.A., Kavanagh, T.A. and Beven, M.W. 1987. GUS fusions: β-glucuronidase
as a sensitive and versatile gene fusion marker in higher plants. EMBO J. 6:3901− 3907.
Kaplan, D.I. and Estes, G.O. 1985. Organic matter relationship to soil nutrient status and
aluminum toxicity in alfalfa. Agron. J. 77:735 − 738. Karp, A., Seberg, O. and Buiatti, M., 1996. Molecular techniques in the assessment of
botanical diversity. Annals of Botany 78:143 – 149.

References
97
Konzak, C.F., Polle E. and Kittrick, J.A. 1976. Screening several crops for aluminum tolerance. In Wright, M.J and Ferrari, A.S. (eds). Proceeding of Workshop on Plant Adaptation to Mineral Stress in Problem Soils (Beltsville, MD) Cornell Univ. Press, Ithaca, New York. 311 − 327.
Koyama, H., Ojima, K. and Yamaya, T. 1990. Utilization of anhydrous aluminum
phosphate as sole source of phosphorus by a selected carrot cell line. Plant and Cell Physiol. 31:173 – 177.
Kruse, C., Boehm, R., Voeste, D., Barth, S., Schnabl, H. 2002. Transient transformation
of Wolffia columbiana by particle bombardment. Aquatic Botany 72:175 –181. Larsen, P.B., Tai, C-Y., Kochian, L.V., and Howell, S.H. 1996. Arabidopsis mutants with
increase sensitivity to aluminum. Plant Physiol. 110, 743 – 751. Li, C.C. 1956. The concept of path coefficient and its impact on population genetics.
Biometrics 12:190 – 210. Liu, D., Oard, S.V. and Oard, J.H. 2003. High transgene expression levels in sugarcane
(Saccharum officinarum L.) driven by the rice ubiquitin promoter RUBQ2. Plant Science 165:743 – 750.
Martin, S.K. and Futi, X. 2000. Genetic gain in early stages of soybean breeding
program. Crop Sci. 40:1559 – 1564. Martinez, J.M.D.F. and Estrella, L.H. 1999. Advance in the understanding of aluminum
toxicity and the development of aluminum tolerant transgenic plants. In Donald L.P. (ed). Advances in Agronomy Vol.66. Academic Press, San Diego-USA. 103 −120.
Matano, T. 2000. Sorghum. In. Crop Science – Eatable Crops. Ishii, R. (ed).
(Translation from Japanese). Bun-ei-dou Publishing Co., Tokyo. 150 – 156. In Japanese.
Menz, M.A., Klein, R.R., Mullet, J.E., Obert, J.A., Unruh, N.C. and Klein, P.E. 2002. A
high-density genetic map of Sorghum bicolor (L.) Moench based on 2926 AFLP,
RFLP, and SSR markers. Plant Mol. Biol. 48:483 – 499.
Miller, D.R., Waskom, R.M., Duncan, R.R., Chapman, P.L., Brick, M.A., Hanning,
G.E., Timm, D.A. and Nabors, M.W. 1992. Acid soil stress tolerance in tissue culture-derived sorghum lines. Crop Sci. 32:324 − 327.
Minella, E. and Sorrells, M.E. 1992. Aluminum tolerance in barley: genetic
relationships among genotypes of diverse origin. Crop Sci. 32:593 − 598. Murty, D.S. and Kumar, K.A. 1995. Traditional uses of sorghum and millets. In

References
98
Sorghum and Millets: Chemistry and Technology. Dendy, D.A.V. (ed). American Association of Cereal Chemists, St Paul, MN, USA. 185 − 221.
Nakamura, S., Can, N.D. and Yoshida, T. 1997. Study on callus induction from anther
culture and inflorescense culture of sorghum. J. Fac. Agr., Kyushu Univ. 42:1 – 9.
Ojima, K., and Ohira, K. 1983. Characterization of aluminum and manganese tolerant
cell line selected from carrot cell culture. Plant and Cell Physiol. 24:789 – 797. Ownby, J.D. 1993. Mechanisms of reaction of hematoxylin with aluminum-treated
wheat roots. Physiol. Plant. 87:371 − 380. Paetkau, D. and Strobeck, C. 1995. The molecular basis and evolutionary history of a
microsatellite null allele in bears. Mol. Ecol. 4: 519-520.
Page, R.D.M. 1996. TREEVIEW: An application to display phylogenetic trees on
personal computers. Computer Applications in the Biosciences 12: 357-358. Parrot, W.A. and Bouton, J.H. 1990. Aluminum tolerance in alfalfa as expressed in
tissue culture. Crop Sci. 30:387 – 389. Poehlman, J.M. and Sleper, D.A. 1995. Breeding Field Crops. Fourth Edition. Iowa
State University Press, Ames. 345 – 366. Polle, E., Konzak, C.F. and Kittrick, J.A. 1978. Visual detection of aluminum tolerance
levels in wheat by hematoxylin staining of seedling root. Crop Sci. 18:823 − 827.
Reif, J.C., Melchinger, A.E., Xia, X.C., Warburton, M.L., Hoisington, D.A., Vasal, S.K.,
Srinivasan, G., Bohn, M., and Frisch, M. 2003. Genetic distance based on simple sequence repeats and heterosis in tropical maize populations. Crop Sci. 43:1275 – 1282.
Rodriguez, S., Visedo, G. and Zapata, C. 2001. Detection of errors in dinucleotide repeat
typing by nondenaturating electrophoresis. Electrophoresis 22:2656 – 2664. Saghai-Maroof , M.A., Biyashev, R.M., Yang, G.P., Zhang, Q., and Allard, R.W. 1994.
Extraordinarily polymorphic microsatellite DNA in barley: species diversity, chromosomal locations, and population dynamics. Proc. Natl. Acad. Sci. (USA) 91:5466 – 5470.
Saitou, N. and Nei, M. 1987. The neighbor-joining method: a new method of
reconstructing phylogenetic trees. Mol. Biol. Evol. 4:406 – 425. Schneider, S., Roessli, D. and Excoffier, L. 2000. Arlequin ver. 2000; A software for
population genetics data analysis. Genetics and Biometry Laboratory, University

References
99
of Geneva, Switzerland. Shuman, L.M., Ramseur, E.L. and Duncan,R.R. 1990. Soil aluminum effects on the
growth and aluminum concentration of sorghum. Agron. J. 82:313 − 318. Smith, J.S.C., Kresovich, S., Hopkins, M.S., Mitchell, S.E., Dean, R.E., Woodman,
W.L., Lee, M., and Porter, K., 2000. Genetic diversity among elite sorghum inbred lines assessed wit simple sequence repeats. Crop Sci. 40:226 – 232.
Smith, R.H., Bhaskaran, S. and Schertz, K. 1983. Sorghum plant regeneration from
aluminum selection media. Plant Cell Reports. 2:129 – 132. Steel, R.G.D., and Torrie, J.H. 1980. Principles and procedures of statistics. 2nd ed.
McGraw-Hill, New York. Spangenberg, G., Wang, Z.Y., Wu, X., Negel, J., Potrykus, I. 1995. Transgenic perennial
ryegrass (Lolium perenne) plants from micropojectile bombardment of embryogenic suspension cells. Plant Science 108:209 – 217.
SPSS for Windows. 1999. Release 10.0.1 Standard version. Copyright SPSS Inc., 1989
– 1999. Takagi, H., Namai, H. and Murakami, K. 1981. Evaluation of the hematoxylin staining
method for detecting wheat tolerance to aluminum. Japan J. Breed. 31:152 −160. In Japanese with English summary.
Takamizo, T. 1996. Studies on somatic hybridization and genetic transformation in tall
fescue breeding. Bull. Natl. Grassl. Res. Inst. 53:73 – 117. In Japanese with English summary.
Tan, K. and Keltjens, W.G. 1995. Analysis of acid-soil stress in sorghum genotypes
with emphasis on aluminium and magnesium interactions. Plant and Soil 171:147 −150.
Taylor, G.J. 1995. Overcoming barriers to understanding the cellular basis of aluminum
resistance. Plant and Soil. 171:89 – 103. Uptmoor, R., Wenzel, W., Friedt, W., Donaldson, G., Ayisi, K. and Ordon, F. 2003.
Comparative analysis on the genetic relatedness of Sorghum bicolor accessions from Southern Africa by RAPDs, AFLPs and SSRs. Theor. Appl. Genet. 106:1316 – 1325.
Wallace, S.U., Henning, S.J. and Anderson, I.C.1982. Elongation, Al concentration, and
hematoxylin staining of aluminum-treated wheat roots. Iowa State J. of Research. Vol. 57, No.1: 97 −106.
Wang, D., Shi, J., Carlson, S.R., Cregan, P.B., Ward, R.W. and Diers, B.W. 2003. A
low-cost, high-throughput polyacrylamide gel electrophoresis system for

References
100
genotyping with microsatellite DNA markers. Crop Sci. 43:1828 – 1832. Yang, W., Oliviera, A.C.de., Godwin, I., Schertz, K., and Bennetzen,L. 1996.
Comparison of DNA marker technologies in characterizing plant genome diversity: variability in Chinese sorghums. Crop Sci. 36:1669 – 1676.
Yoshida, T. and Shigemune, A. 1999. Mass selection for drought, salt, aluminum
tolerance and heritabilities in pearl millet. Rep. Kyushu Br. Crop Sci. Soc. Japan. 65:54 − 56. In Japanese.