Embed Size (px)
Citation preview
STATE OF CALIFORNIA
DEPARTMENT OF FISH AND GAME
FISH BULLETIN No. 92
Studies on Fish Preservation at the Contra Costa Steam Plant of the Pacific Gas and Electric Company
By JAMES E. KERR
BECHTEL CORPORATION
1 953

TABLE OF CONTENTS Page
FOREWORD 5
PART I. INTRODUCTION 6
PART II. HISTORICAL BACKGROUND 9 1. The Plant Location—Delta Area 9 2. Fisheries of the Area 9 3. The Contra Costa Steam PLANU 11
4. The Condenser Cooling Water System 11
5. Design Factors for Preservation of Fish 13
6. Provisions Made for Saving Fish Life 13
7. The Start-Up of the Three-Unit Plant 15
8. Common and Scientific Names of Fishes 16
PART III. RESCUE MEASURES AND A SEARCH FOR A QUICK
SOLUTION TO THE FISH PROBLEM 17 1. The Fish Rescue Program 17 2. The Search for a Permanent Solution 19 3. Appraisal of the Problem and of the Work Accomplished 19 4. The Research Approach to the Problem 19
PART IV. THE RESEARCH PROGRAM 20
1. Basic Objectives 20 2. Organization and Personnel 20 3. Statistical Data and Records 21 4. Experimental Facilities 21 5. Fish Characteristics and Behavior Studies 22 6. Velocity Studies 24 7. Screen Mesh Size Studies 35 8. Temperature Studies 36 9. Continuous versus Intermittent Screen Operation 38
10. Fish Stratification Studies 40 11. Investigation of Electric Fish Screens 41 12. Development of the Fish Collector 42 13. Velocity Barrier Investigation 52 14. Summary of the Research Project 56
PART V. APPLICATION OF RESEARCII DATA 59 1. Provisions for Fish Preservation at Contra Costa 59 2. Provisions for Fish Preservation at Pittsburg 64
REFERENCES 65
( 3 )

FOREWORD The construction of a large steam plant on the San Joaquin River near
the City of Antioch, California, presented a grave potential threat to the valuable salmon and striped bass resources of the area. The studies described in this report reflect the cooperative effort of industry and government agencies to solve this difficult problem in conserving natural resources.
Acknowledgment of those contributing to the success of the project is believed to be fitting.
The studies were financed by the Pacific Gas and Electric Company. While an element of necessity required that an effort be made to save fish life at Contra Costa, the scope of the project was greatly enlarged to gain knowledge generally and to further the cause of protection of fish in relation to water use. Mr. H. V. Lutge, Chief Civil Engineer, was a staunch supporter of the project, as were Mr. F. F. Mautz, the project's consulting engineer, Mr. William 0. Cheney, project field engineer, and Mr. E. N. Lorenzen, assistant project field engineer.
The California State Department of Fish and Game contributed greatly to the undertaking. Their understanding of the complexity of the problem and their encouragement were helpful. Dr. A. J. Calhoun, Chief, Inland Fisheries Branch, gave much of his time to the work as a consultant and his advice was most valuable. Mr. George H. Warner, Assistant Fisheries Manager, was assigned to the project for several months and his knowledge and experience were of material assistance in conducting the experimental work. Many others in the department helped in various phases of the work and their efforts are gratefully acknowledged.
Close liaison existed betwen the studies at Contra Costa and the work on fish protection at the U. S. Bureau of Reclamation's pumping plant for the Delta-Mendota Canal at Tracy, California. Exchange of data with the U. S. Fish and Wildlife Service at Tracy was of assistance during the course of the program.
We also wish to acknowledge the keen interest evidenced and the hard work done by our own people connected with this job. April, 1953.
J. E. KERR, Senior Engineer Bechtel Corporation, San Francisco
2-80796 ( 5 )

PART I
INTRODUCTION
Making the most of our natural resources often poses complex prob-lems. This is particularly true when the utilization of one natural resource conflicts with another.
An example is the preservation of fish present in water needed for industrial use.
With the expanding requirements for water in greater and greater quantities and the increasing interest of federal, state and sportsmen's groups in the conservation of fish and wildlife, the complexities are being rapidly forced to the forefront and are not always faced realistically.
Federal and state regulations control the use, diversion and pollution of public waters and from time to time new regulations are added. To protect fish life, electric utility companies in Oregon and Washington now are finding restrictions placed on building new hydroelectric plants. Country-wide the problem is felt where the conservation of fish life is involved.
In some quarters it is argued the two interests, fish life and the indus-trial use of water, are not compatible and that one will have to be sacri-ficed to the other.
Differentiating between the words "use " and " consume, " the electric utility industry is unique in that it actually consumes only a relatively small part or none of the water it takes from the streams, lakes and bays of the country.
Whereas the steam electric generating plant uses large quantities of water, most of it goes for condenser cooling purposes and only a small part is consumed in steam. The hydroelectric plant uses the dynamic energy of falling water and none of it is consumed. In both cases the used but unconsumed water is returned to the parent body.
The problem then for electric utilities resolves into providing safety for fish life during the time of water use. This can be done by safely separating fish from the water before the water is used or by providing a safe passage for fish as the water passes through the plant facilities. Both are difficult to accomplish in most instances.
The Contra Costa Steam Plant of the Pacific Gas and Electric Com-pany, engineered and constructed by the Bechtel Corporation, was con-fronted with a need for large quantities of water from the San Joaquin River and at the same time a method for preserving the fish life present.
The Pacific Gas and Electric Company believed both natural resources, the fisheries and water, could be utilized without sacrifice of one or the other and assigned the development of a solution to the Bechtel Corpo-ration.
The purpose of this report is to make available to the industry the details of the investigation, the information gathered, and the things learned from a research and experimental project lasting more than a year.
( 6 )

STUDIES ON FISH PRESERVATION 7
These data and conclusions are believed to represent a significant step forward in utilizing water resources to the fullest and it is hoped they will be of value to others with similar conditions to be met. Admittedly, the field of fish preservation is large and the problems are numerous and complex, and therefore no claims are made beyond the scope of the project described on the following pages.
The monograph is divided into parts following a chronological order of events.
The one on "Historical Background'' describes the locale, the fisheries of the area, the Contra Costa Steam Plant and its condenser cooling water system, the original design considerations given for fish preserva-tion and the problem that developed with the plant in operation.
The next part deals entirely with fish rescue measures taken as an expediency, an attempt for a quick solution to the problem and a decision to embark on a long-range practical research program.
The research project is dealt with in the fourth part of this monograph and covers the major phases of the research work and a summary of the program.
Part V, "Application," describes the solution developed at Contra Costa and the proposed methods to be employed for fish preservation at the new Pittsburg Steam Plant of the Pacific Gas and Electric Company.

7 55
I 2 0o' 4 22°06 4 te 30' ACRAMEN TO
30.
'V 0
C A L I F O R N
NAP
I
AL ,
-.
0 %
, SAN PABLO
VALLEJO
\ --Ml ifierAll..-
•
DN' ef.,b.
._,Z igrAlic----
,
WOO'
4
o 0
.c., V fr 1 I'
LAND •,::.,-
4 ANTIOCH
a'l •
4.
* 1
4
rip
MIVE0
. a...
.1
SA JO SE 122°00.
30'
IS I n° 00' 4 121°30'
FIGURE 1. Vicinity map of the Delta showing the locations of t le Contra Costa and Pittsburg Steam Plants of the Pacific Gas and Electric Company.
I 8 1

PART II
HISTORICAL BACKGROUND
1. THE PLANT LOCATION—DELTA AREA
The Contra Costa Steam Plant is built on the south bank of the San Joaquin River approximately two and one-half miles upstream from the City of Antioch, California.
The area is referred to as the Delta. It is here the Sacramento and the San Joaquin Rivers flow into Suisun Bay, an arm of San Francisco Bay. The two great rivers are interlaced by many cross channels, forming a delta area of sloughs, low islands, and tule marshes. Tidal conditions prevail and during the summer months salinity runs as high as 2,000 to 3,000 parts per million. Extreme tidal range is approximately eight feet at the plant site.
2. FISHERIES OF THE AREA1
The Delta abounds in fish life. Both anadromous and resident fishes of many species are found here.
Since our studies are to deal with fish, it follows that a knowledge of fish of the area is necessary.
The following information has been gathered on the subject from writings by state and federal fishery agencies and is offered here for our better understanding of the program :
Anadromous fishes are defined as those which ascend rivers from the sea at certain seasons for breeding, and the following species in this cate-gory are present : king salmon, striped bass, shad, steelhead rainbow trout, Pacific lamprey, white sturgeon, and green sturgeon.
Of the fishery resources of the State affected by the Contra Costa Steam Plant, striped bass and king salmon are by far the most important. Striped Bass (Roccus saxatilis)
The striped bass fishery has been protected against commercial fishing since 1935 and these fish are now caught only by sportsmen. It is esti-mated that 200,000 anglers catch about 1,500,000 bass a year, and that $10,000,000 is spent annually on bass fishing (Calhoun, 1952).
The principal spawning and nursery ground for striped bass in Cali-fornia is the Delta. Juvenile striped bass are to be found in this area the year around in abundance. Adults are present in large numbers from October to May, inclusive.
For the purpose of this paper, striped bass are arbitrarily divided into three classifications :
(1) Eggs and larvae are defined as striped bass inch or less in length, including the egg stage. The eggs before they are spawned are bright green in color and are about 1/25 inch in diameter. Within a few hours Scientific names of fishes referred to may be found at the end of this part.
( 9 )
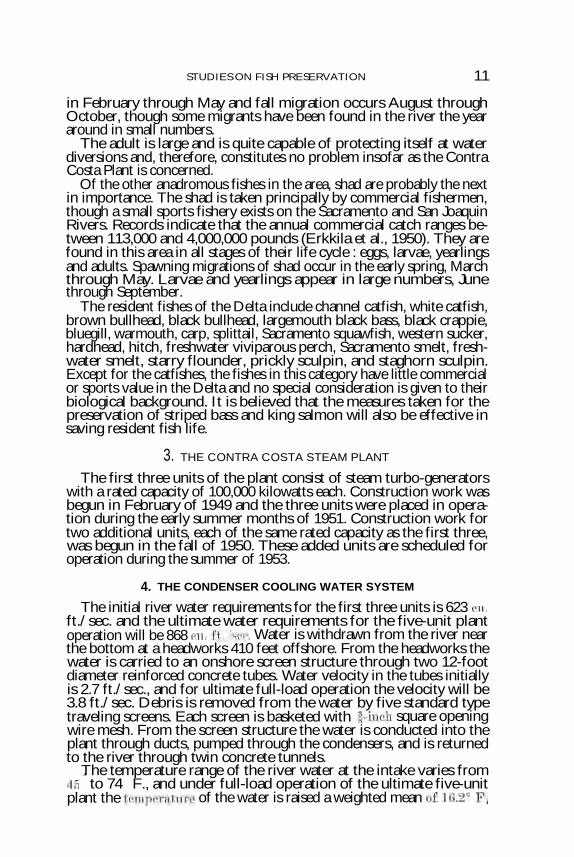
10 DEPARTMENT OF FISH AND GAME
after their release, the eggs absorb water and grow to the size of about * inch in diameter. In this stage they are almost transparent and are little heavier than water, free-floating, and are subject to the stream currents. Baby bass hatch in two to three days, depending on water temperature. They are tiny and fragile, and have little or no ability of self-propulsion. However, their growth rate is rapid. During the summer months they attain a length of approximately three inches.
The spawning season begins in the latter part of April and continues on through May and June, depending on water temperature and stream flow conditions. A single female bass will spawn 250,000 to 1,250,000 eggs in one season. It has been estimated that a 75-pound female bass may spawn as many as 10,000,000 eggs (Calhoun, 1952).
The Antioch area is one of the principal breeding grounds of striped bass and from the above it may be seen that striped bass eggs and larvae are to be expected in astronomical numbers.
(2) Juveniles are defined as being greater than inch and under 12 inches in length. Yearlings, ranging from * inch to 6 inches in this classi-fication, are found in great abundance from July through December, and the larger juveniles, in varying numbers, are found throughout the year.
Yearling and juvenile bass are able to propel themselves against cur-rents with an ability proportionate to their length, "probably in the proportion of one foot per second velocity for each inch of length" (Erkkila et al„ 1950). Authorities, however, do not agree on this, nor do they know the endurance factor of yearlings and juveniles in various velocities.
(3) Adult bass are defined as those 12 inches or more in length. Male striped bass reach sexual maturity when they are about 12 inches in length and females reach sexual maturity when they are about 22 inches in length. Adult bass are strong swimmers and are capable of taking care of themselves. No great problem is presented in keeping these larger fish out of hazardous areas. King Salmon (Oncorhynchus tshawytscha)
The king salmon fishery is an important resource of the State of Cali-fornia. The estimated annual commercial catch of king salmon attribu-table to this area is 5,600,000 pounds, plus 63,000 pounds caught by sports fishermen (Erkkila et al., 1950).
King salmon spawn in the upper reaches of the Sacramento and San Joaquin River systems, and not in the delta area. They do pass through the delta on their upstream migration to spawning grounds, and the young salmon pass through on their seaward migration each year.
For the purpose of this paper, these fish have arbitrarily been divided into two broad classifications :
(1) Juveniles are defined as king salmon passing through the area on their seaward migration. These fish average from 1 to 5 inches in length. Their migration begins in late January and continues on through April. Heavy migration occurs during periods of heavy runoff, and higher water temperatures increase the exodus of salmon to the ocean (Erkkila et al., 1950).
(2) Adults are defined as king salmon passing through the area on their upstream migration to spawning grounds. Spring migration occurs
STUDIES ON FISH PRESERVATION 11
in February through May and fall migration occurs August through October, though some migrants have been found in the river the year around in small numbers.
The adult is large and is quite capable of protecting itself at water diversions and, therefore, constitutes no problem insofar as the Contra Costa Plant is concerned.
Of the other anadromous fishes in the area, shad are probably the next in importance. The shad is taken principally by commercial fishermen, though a small sports fishery exists on the Sacramento and San Joaquin Rivers. Records indicate that the annual commercial catch ranges be-tween 113,000 and 4,000,000 pounds (Erkkila et al., 1950). They are found in this area in all stages of their life cycle : eggs, larvae, yearlings and adults. Spawning migrations of shad occur in the early spring, March through May. Larvae and yearlings appear in large numbers, June through September.
The resident fishes of the Delta include channel catfish, white catfish, brown bullhead, black bullhead, largemouth black bass, black crappie, bluegill, warmouth, carp, splittail, Sacramento squawfish, western sucker, hardhead, hitch, freshwater viviparous perch, Sacramento smelt, fresh-water smelt, starry flounder, prickly sculpin, and staghorn sculpin. Except for the catfishes, the fishes in this category have little commercial or sports value in the Delta and no special consideration is given to their biological background. It is believed that the measures taken for the preservation of striped bass and king salmon will also be effective in saving resident fish life.
3. THE CONTRA COSTA STEAM PLANT
The first three units of the plant consist of steam turbo-generators with a rated capacity of 100,000 kilowatts each. Construction work was begun in February of 1949 and the three units were placed in opera-tion during the early summer months of 1951. Construction work for two additional units, each of the same rated capacity as the first three, was begun in the fall of 1950. These added units are scheduled for operation during the summer of 1953.
4. THE CONDENSER COOLING WATER SYSTEM
The initial river water requirements for the first three units is 623 Cu. ft./sec. and the ultimate water requirements for the five-unit plant operation will be 868 Cu. ft./sec. Water is withdrawn from the river near the bottom at a headworks 410 feet offshore. From the headworks the water is carried to an onshore screen structure through two 12-foot diameter reinforced concrete tubes. Water velocity in the tubes initially is 2.7 ft./sec., and for ultimate full-load operation the velocity will be 3.8 ft./sec. Debris is removed from the water by five standard type traveling screens. Each screen is basketed with 1-inch square opening wire mesh. From the screen structure the water is conducted into the plant through ducts, pumped through the condensers, and is returned to the river through twin concrete tunnels.
The temperature range of the river water at the intake varies from 45
0 to 74° F., and under full-load operation of the ultimate five-unit
plant the temperature of the water is raised a weighted mean of 16.2° F,
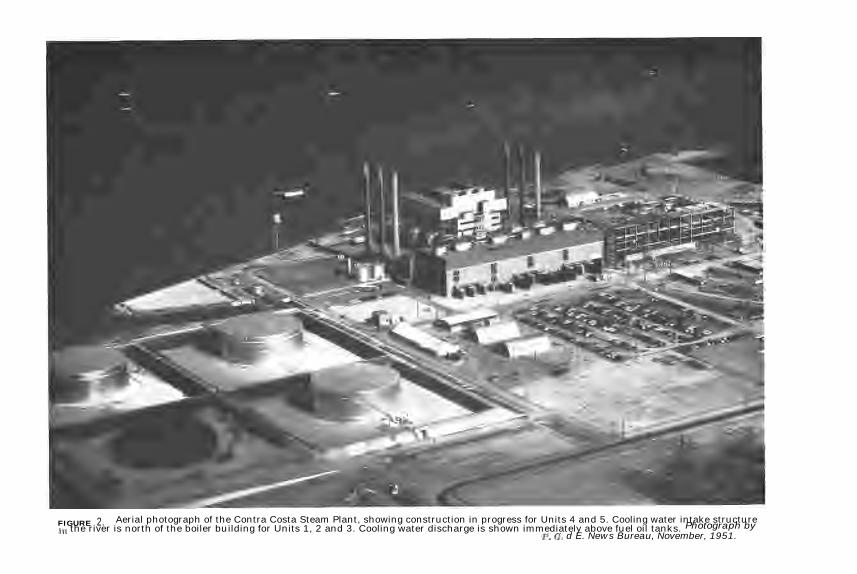
FIGURE 2. Aerial photograph of the Contra Costa Steam Plant, showing construction in progress for Units 4 and 5. Cooling water intake structure In the river is north of the boiler building for Units 1, 2 and 3. Cooling water discharge is shown immediately above fuel oil tanks. Photograph by
P. G. d E. News Bureau, November, 1951.

STUDIES ON FISH PRESERVATION 13
in its passage through the condensers. Condensers for Units 1, 2 and 3 are the single pass type and condensers for Units 4 and 5 are the double pass type. Two pumps supply water to each condenser, and it is the operating practice, regardless of load conditions, to operate both pumps.
Water velocities through the cooling water system average below 7 ft./sec. Calculated screen approach velocities average about 1.3 ft./sec. with velocities through the wire of approximately 2.0 ft./sec.
Passage time for fish, from the traveling screens through the plant to the discharge structure, is estimated to be under four minutes.
5. DESIGN FACTORS FOR THE PRESERVATION OF FISH
A need for provisions to protect fish life in the river water used for condenser cooling was recognized in the early stages of design for the Contra Costa Steam Plant.
Conferences and discussions on the subject were held with representa-tives of the California Department of Fish and Game. From these dis-cussions much useful biological information was gained. However, from the standpoint of the engineer, faced with the design of facilities for diverting or preserving fish life, little was learned. Too little knowledge of the subject was available.
In the past, state and federal fishery agencies have been fully occupied with biological research and fishery management. They have had little time or money available to study methods for saving fish at large water diversions. Nor had private initiative seriously attacked the problem. Precedent was lacking..
To add to the complexity, no two situations are identical and usually the similarity is slight. Economic, physical, and biological factors at each locality may differ widely.
Fish ladders around dams, revolving screens in irrigation ditches, and electric fish screens are presently in use, but their effectiveness in many cases is questionable.
The U. S. Bureau of Reclamation, in the development of the Central Valley Project in California, recognized the importance of preserving fish life where large quantities of water are consumed for irrigation. A study of this problem was undertaken on a large scale by the U. S. Fish and Wildlife Service in the fall of 1946 at Tracy, California. The study is still continuing and progress is being made toward the solution there. However, in the spring of 1949 their work had not progressed to a point where it was of assistance to us in our similar work at Contra Costa.
The quantities of water needed at Contra Costa were fixed by the requirements of the plant, as was the heat input into the water passing through the condensers. Screen mesh size, velocities, fish temperature tolerance, and facilities for safely removing screened fish from the screen structure needed special design consideration.
6. PROVISIONS MADE FOR SAVING FISH LIFE
To stop larvae and small juveniles from passing through the plant, screens of extremely fine mesh would be necessary. Paradoxically, the hazard to these delicate fish was thought to be less in passing through the plant at the temperature rise anticipated than by being impinged
0 o'G 6 9'
1 t, . ■.1 ost% 0 , w /P" '
TO COLLECTION BOX
AC°e■4 1'14t4-15t4 066 0010101
111E At:1°61 6 (C AS
SLOTTED FISH COLLECTOR PIPE
14 DEPARTMENT OF FISH AND GAME
on fine mesh screens. It was finally agreed that 1-inch mesh screens represented the most satisfactory compromise.
Following the decision on screen size, velocities were next considered. Screen approach velocities of 1.5 ft./sec. and water velocities through the wire of 2.7 ft./sec. seemed to present no undue hazard to fish life and were accepted.
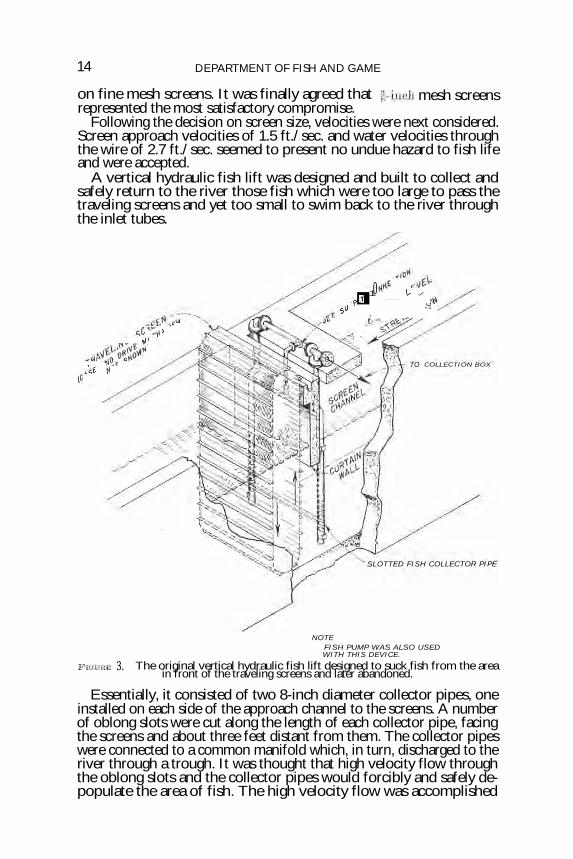
A vertical hydraulic fish lift was designed and built to collect and safely return to the river those fish which were too large to pass the traveling screens and yet too small to swim back to the river through the inlet tubes.
NOTE— FISH PUMP WAS ALSO USED WITH THIS DEVICE.
FIGURE 3. The original vertical hydraulic fish lift designed to suck fish from the area in front of the traveling screens and later abandoned.
Essentially, it consisted of two 8-inch diameter collector pipes, one installed on each side of the approach channel to the screens. A number of oblong slots were cut along the length of each collector pipe, facing the screens and about three feet distant from them. The collector pipes were connected to a common manifold which, in turn, discharged to the river through a trough. It was thought that high velocity flow through the oblong slots and the collector pipes would forcibly and safely de-populate the area of fish. The high velocity flow was accomplished

STUDIES ON FISH PRESERVATION 15
using the hydraulic eductor principle. Surplus water from the screen wash pumps was introduced into the collector system at a venturi section in the line.
It was recognized that this device would need field adjustment and experimentation to perfect its performance. Therefore, only one of them was made at the beginning. See Figure 3 for details of the original vertical hydraulic fish lift.
7. THE START-UP OF THE THREE-UNIT PLANT
The first unit was placed in operation on May 30, 1951, followed in succession a few weeks apart by Units 2 and 3. During the start-up period, construction work on Units 4 and 5 was advancing and for construction reasons only one inlet tube from the river to the screen structure was used. Also, a portion of the screen structure was blocked off, allowing operation of only three of the four traveling screens of the initial installation. Velocity in the one operating tube was twice the design velocity and velocities in front of the three operating screens were higher than was originally planned. This condition greatly ag-gravated the fish problem, which soon became apparent with the advent of the three-unit operation.
The vertical hydraulic fish lift proved inadequate in removing the great numbers of fish present in the screen structure and survival of the fish recovered by the lift was low.
Concentrations of live fish started building up ahead of the traveling screens, and because of overpopulation and impingement on the screens the death rate began to rise.
State Department of Fish and Game biologists recovered numbers of dead bass by netting operations in the discharged cooling water. This loss of life was attributed to the 12° F. temperature rise of the cooling water. Also, it was said that yearling salmon probably would not have the temperature tolerance of bass.
The temperature rise of 12° F., higher than that anticipated during design, was due to full load testing of the new plant. Under normal operation during this season of the year, hydroelectric plants carry most of the system load and steam plants are usually operated well below rated capacity with a resulting lower temperature rise of the cooling water.
Naturally, the Department of Fish and Game was alarmed over con-ditions at the Contra Costa plant. Sportsmen's groups were incensed. Claims and counterclaims were made as to the number of fish killed and the best method to employ for saving them, all unsubstantiated by fact.
In the latter part of July the Department of Fish and Game recom-mended that the plant load be reduced to a point where the temperature rise of the cooling water would not exceed 10° F. and also suggested that finer mesh screens be used during the season of small bass and salmon.
Later, screen size of %4-inch openings was advocated and it was sug-gested the traveling screens should be located at the intake headworks in the river.

16 DEPARTMENT OF FISH AND GAME
Fishery biologists estimated that as many as 19,000,000 small bass might conceivably pass through the plant and be killed each year between the months of April and mid-August.
8. COMMON AND SCIENTIFIC NAMES OF FISHES
ANADROMOUS FISHES Pacific lamprey ( Entosphenus tridentatus) White sturgeon ( Acipenser transmotanus) Green sturgeon ( Acipenser medirostris) Shad ( Alosa sapidissima) King salmon ( Oncorhynchus tshawytscha) Steelhead rainbow trout ( Salmo gairdneri) Striped bass ( Roccus saxatilis)
RESIDENT FISHES
Sacramento smelt ( Spirinchus thaleichthys) Freshwater smelt ( Hypomesus olidus) Western sucker (Catostomus occidentalis) Carp ( Cyprinus carpio) Hardhead (Mylopharodon conocephalus) Hitch ( Lavinia exilicauda) Sacramento squawfish ( Ptychocheilus grandis) Splittail (Pogonichthys macrolepidotus) Channel catfish (lctalurus punctatus) White catfish (Ictalurus catus) Brown bullhead ( Ameiurus nebulosus) Black bullhead ( A meivrus melas) Starry flounder ( Platichthys stellatus) Largemouth black bass ( Micropterus salmoides) Warmouth ( Chaenobryttus coronarius) Bluegill ( Lepomis macrochirus) Black crappie ( Pomoxis nigro-maculatus) Freshwater viviparous perch (Ilysterocarpus traski) Prickly sculpin (Coitus asper) Staghorn sculpin ( Leptocottus armatus)

PART III
RESCUE MEASURES AND A SEARCH FOR A QUICK SOLUTION TO THE FISH PROBLEM
The urgency of the situation at Contra Costa and pressure from the Department of Fish and Game dictated the finding of a "quick solution." Any idea advanced for preserving fish life was given careful considera-tion.
1. THE FISH RESCUE PROGRAM
The rapid build-up of fish concentration in the screen structure made immediate rescue measures a necessity.
Periodic hand dip netting of fish from in front of the traveling screens was tried with success. Later, timber netting platforms were constructed in the screen structure in the compartments ahead of the traveling screens. On August 19, 1951, hand dip netting of live fish from in front of the screens and returning them to the river was begun and was con-tinued without interruption until December 21, 1951. During periods of high fish concentration dip netting activities were carried on on a 24-hour, 7-day week basis. From August 30th to November 1st approximately 12,000 bass ranging in size from 2 inches to 16 inches in length were res-cued and returned to the river alive.
Noise was suggested as a means of frightening fish away from the water intake structure in the river. Several noisemaking devices and vibrating contraptions were tried—all without effective results.
The traveling screens were intended to operate intermittently, depend-ing upon the amount of debris present in the water. It was suggested that by continuous operation impinged fish on the screens could be raised quickly to the surface, washed off and returned to the river alive. Pres-sure of the screen washing jets was greatly reduced, and several experi-ments were conducted to test the efficacy of this• plan. The results of the tests were contradictory, but it was finally agreed that the mortality was reduced less than 10 percent by continuous screen operation.
Equipping the traveling screens with cups was studied. The manufac-turer of the screens was consulted. A search for precedents was made and none was found. It was finally concluded that cups on the traveling screens would be of little value in rescuing fish.
Lights were tried as a means of attracting fish from hazard areas. Lights were also tried for attracting fish to areas where they could be rescued. Lights appeared to have an attraction for larger fish, but only of a secondary nature. Other stronger unknown factors dominated their behavior.
Metal frames enclosed in wire mesh, mechanically operated, were tried for rescuing fish and were abandoned as useless experiments.
Several types of traps were constructed and installed in quiet areas where fish were believed to congregate, all with negative results.
( 17 )
T „1111
1 1
\‘ 7/1R)e)N1 1 I
A --4 gl • 1 , j... ' ........, '.,lii -'-‘_4:j I i
i.. N R-...„ ',....,1 1 - „......-- \
I 4-ITT'A
LS ,--'4 . . , - - 1 J ..... „, .. \
....
\ /
/
/
- OC'
18 DEPARTMENT OF FISH AND GAME
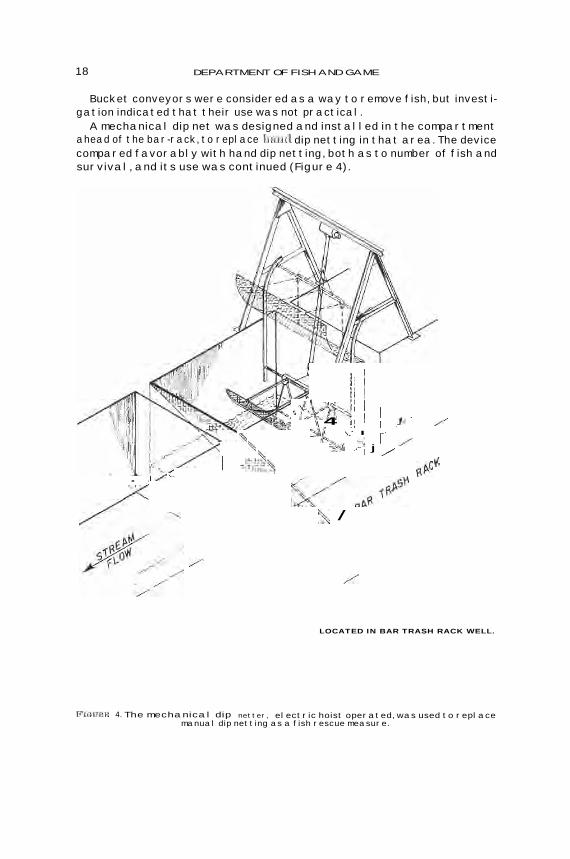
BUCKET CONVEYORS WERE CONSIDERED AS A WAY TO REMOVE FISH, BUT INVESTI-GATION INDICATED THAT THEIR USE WAS NOT PRACTICAL.
A MECHANICAL DIP NET WAS DESIGNED AND INSTALLED IN THE COMPARTMENT AHEAD OF THE BAR-RACK, TO REPLACE BAND DIP NETTING IN THAT AREA. THE DEVICE COMPARED FAVORABLY WITH HAND DIP NETTING, BOTH AS TO NUMBER OF FISH AND SURVIVAL, AND ITS USE WAS CONTINUED (FIGURE 4).
LOCATED IN BAR TRASH RACK WELL.
FIGURE 4. THE MECHANICAL DIP NETTER, ELECTRIC HOIST OPERATED, WAS USED TO REPLACE MANUAL DIP NETTING AS A FISH RESCUE MEASURE.

STUDIES ON FISH PRESERVATION 19
2. THE SEARCH FOR A PERMANENT SOLUTION
Concurrently with rescue operations a search for a permanent solution was carried on.
The vertical hydraulic fish lift was not abandoned and field develop-ment work was continuing in an effort to improve its effectiveness. Fish removed by this device varied from 13 to 32 bass per hour, ranging from 2 to 7 inches in length, with survival of 13 percent.
As an outgrowth of the vertical hydraulic fish lift, construction of a horizontal hydraulic fish lift was started. Fish were observed to move laterally across the screen channel in a horizontal plane ; therefore, it was thought a horizontal lift might be more effective.
A bladeless impeller centrifugal pump, identical in design to pumps being used by the U. S. Fish and Wildlife Service in their experiments at Tracy, California, and referred to as a "fish pump," was purchased.
Velocity traverses were run in the river near the intake structure in search of clues having a bearing on the problem. Little helpful informa-tion was gained from this work and further study of current velocities in the river was abandoned.
Water recording thermometers were installed at the intake structure and at the discharge works to record accurately the temperature differ-ential of the water in passing through the plant.
For a time it was believed possible, on the basis of findings at the Tracy project, that fish concentration was heaviest in the upper strata of the river, probably to a depth not exceeding 10 feet. It was reasoned that if such was the case a hanging curtain wall, extending 10 feet below the surface, could be constructed around the tube entrances thereby prevent-ing great numbers of fish from entering the screen structure. With this thought in mind experiments were begun to determine if fish tended to favor one stratum of water over another.
3. APPRAISAL OF THE PROBLEM AND OF THE WORK ACCOMPLISHED
In October of 1951 an appraisal of the work was made to determine progress toward a solution. Rescue work as a temporary measure had been reasonably successful in saving fish life during the critical period. Progress toward a permanent solution was discouraging and it was real-ized that more knowledge must be had before a solution could be reached. It was recognized that a research program of at least a year's duration would be required to answer the questions involved in the design of facilities for preserving fish life.
4. THE RESEARCH APPROACH TO THE PROBLEM
Pacific Gas and Electric Company asked the Bechtel Corporation to undertake a research program to solve the question of fish preservation. Field operations already begun continued uninterrupted, but new objec-tives were set up and the approach to the experiments became more delib-erate and analytical.

PART IV
THE RESEARCH PROGRAM
1. BASIC OBJECTIVES
The trial and error course pursued the first few months did not pro-duce a solution of fish preservation at Contra Costa. It did produce an evolution in thinking and a more accurate appraisal of the program and much was learned.
Fish life in the Delta presents an ever-changing picture. The eggs of one day are small larvae two or three days later, and they are fish two or three inches in length within several months. The life cycle of one species is not necessarily coincidental with the life cycle of another, adding to the complexity of the investigations. Studies of a least a one-year cycle were needed to get answers to questions involved.
Much more knowledge was required of the habits and general behavior of the species of fish involved, and answers to specific questions were needed. What were the effects on fish of currents of various velocities in screen channels ? At what velocities were they safe against impingement on traveling screens ? Could fish stand impingement for any length of time ? What size screen mesh should be used to best preserve fish life ? How are fish of various sizes affected by these factors ? Could fish stand a sudden temperature rise of the water, and if so, what was a lethal tem-perature rise ? What were the maximum temperature tolerances of fish ? Was there a greater concentration of fish near the surface, or were they equally dispersed throughout the river strata ? These ques-tions and many others had to be answered before an economical and intelligent solution could be found.
The answers to these questions then became the basic objectives of the research program.
2. ORGANIZATION AND PERSONNEL
In setting up the research program it was imperative to correlate the theoretical and practical aspects of the problem. To accomplish this, men of varied ability, training and experience were needed.
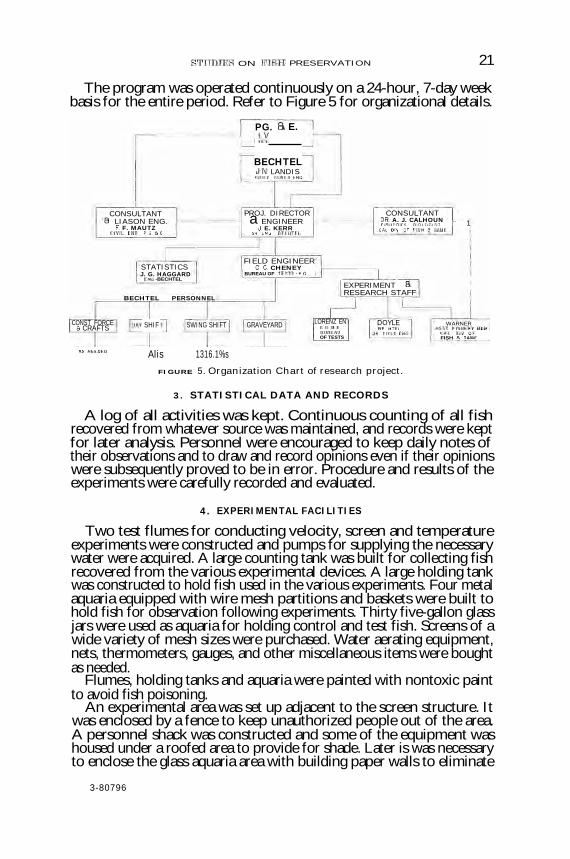
Personnel from the California State Department of Fish and Game, from the Pacific Gas and Electric Company's Engineering Department and its Bureau of Tests, and engineering and construction personnel from Bechtel Corporation were drawn together into one group headed by a Bechtel engineer as project director. Necessarily the group had to be closely knit and work as a team to realize the desired results.
A biologist from the State Department of Fish and Game and a civil engineer from the Pacific Gas and Electric Company were consultants for the project director.
Management control originated through the Chief Civil Engineer for the Pacific Gas and Electric Company and the Chief Power Engineer of the Bechtel Corporation.
( 20 )
PROJ. DIRECTOR a ENGINEER J. E. KERR
SR ENG BECHTEL
- —1 CONSULTANT a LIASON ENG.
F. F. MAUTZ CIVIL ENG PG SE
PG. a E. Cx
BECHTEL J.N. LANDIS CHIEF POWER ENG
CONSULTANT DR, A. J. CALHOUN FISHERIES BIOLOGIST
CAL DIV OF FISH IS GAME
STATISTICS J. G. HAGGARD
ENS -BECHTEL
BECHTEL PERSONNEL
FIELD ENGINEER C C. CHENEY
BUREAU OF TESTS • P G
EXPERIMENT a RESEARCH STAFF
CONST FORCE 8 CRAFTS [DAY SHIF T1 SWING SHIFT GRAVEYARD LORENZ EN
PGGE BUREAU OF TESTS
DOYLE BE HTEL
FIELD ENG
WARNER ASST FISHERY MGR
CAL DIV. OF FISH a GAME
STUDIES ON FISII PRESERVATION 21
The program was operated continuously on a 24-hour, 7-day week basis for the entire period. Refer to Figure 5 for organizational details.
AS NEEDED Alis 1316.1%s FIGURE 5. Organization Chart of research project.
3. STATISTICAL DATA AND RECORDS
A log of all activities was kept. Continuous counting of all fish recovered from whatever source was maintained, and records were kept for later analysis. Personnel were encouraged to keep daily notes of their observations and to draw and record opinions even if their opinions were subsequently proved to be in error. Procedure and results of the experiments were carefully recorded and evaluated.
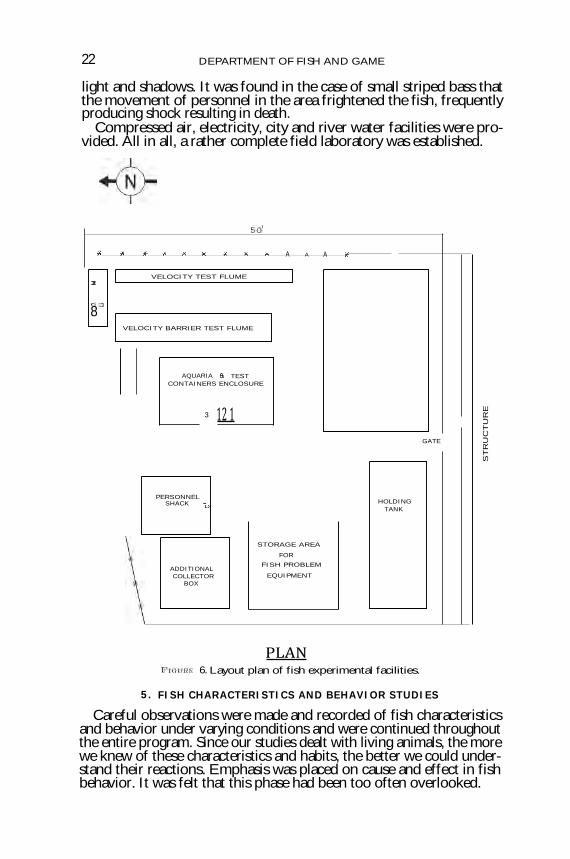
4. EXPERIMENTAL FACILITIES
Two test flumes for conducting velocity, screen and temperature experiments were constructed and pumps for supplying the necessary water were acquired. A large counting tank was built for collecting fish recovered from the various experimental devices. A large holding tank was constructed to hold fish used in the various experiments. Four metal aquaria equipped with wire mesh partitions and baskets were built to hold fish for observation following experiments. Thirty five-gallon glass jars were used as aquaria for holding control and test fish. Screens of a wide variety of mesh sizes were purchased. Water aerating equipment, nets, thermometers, gauges, and other miscellaneous items were bought as needed.
Flumes, holding tanks and aquaria were painted with nontoxic paint to avoid fish poisoning.
An experimental area was set up adjacent to the screen structure. It was enclosed by a fence to keep unauthorized people out of the area. A personnel shack was constructed and some of the equipment was housed under a roofed area to provide for shade. Later is was necessary to enclose the glass aquaria area with building paper walls to eliminate
3-80796
AQUARIA a TEST CONTAINERS ENCLOSURE
3 12 1
STORAGE AREA
FOR FISH PROBLEM
EQUIPMENT
VELOCITY TEST FLUME
VELOCITY BARRIER TEST FLUME
2
Co 8 •
GATE
PERSONNEL SHACK -0
ADDITIONAL COLLECTOR
BOX
HOLDING TANK
22 DEPARTMENT OF FISH AND GAME
light and shadows. It was found in the case of small striped bass that the movement of personnel in the area frightened the fish, frequently producing shock resulting in death.
Compressed air, electricity, city and river water facilities were pro-vided. All in all, a rather complete field laboratory was established.
50'
X X x x x x x A x A A A x
STRU
CTU
RE
PLAN FIGURE 6. Layout plan of fish experimental facilities.
5. FISH CHARACTERISTICS AND BEHAVIOR STUDIES
Careful observations were made and recorded of fish characteristics and behavior under varying conditions and were continued throughout the entire program. Since our studies dealt with living animals, the more we knew of these characteristics and habits, the better we could under-stand their reactions. Emphasis was placed on cause and effect in fish behavior. It was felt that this phase had been too often overlooked.

STUDIES ON FISH PRESERVATION 23
Larval and small yearling striped bass were found to be easily frightened into a state of shock, which is evidenced by erratic movement, twitching, rigidity and distension of gills. It was followed often by death. The shock characteristic was an upsetting factor to be contended with in all experimental work. Every effort was made to avoid conditions causing it. Shock was less serious with older yearling and juvenile bass.
Great numbers of fish were required in the work, necessitating plans for their care before and after the experiments. Clear water was needed in the experiments to see fish reaction. Untreated river water was turbid and could not be used for this purpose. The use of city chlorinated water raised the question of its effect upon fish. An investigation was made to determine if this water would be injurious to fish life. Tests of river and city water on fish indicated no appreciable difference in survival.
Subsequently, in connection with a special investigation of temper-ature tolerances, comparisons were made holding small bass in untreated river water, city water, and river and city water each blended with ocean water, the chloride content of the blend being 3,000 parts per million. In all cases, the mortality rate in city water was less than that in river water, and the mortality rate in city water blended with ocean water was the lowest. In fact, the city-ocean water mixture seemed to produce a beneficial physiological reaction and acted as a stimulant with no bad after effects.
Striped bass 31 to 5i inches long and / to 1i inches long were used in these tests.
Notwithstanding beliefs to the contrary, it was found that bass accli-mated to the city-ocean water mixture would survive upon being returned to fresh water with no apparent ill effects.
Water absorption of zinc from galvanized sheet metal aquaria and experimental facilities was investigated to determine if the contamina-tion was great enough to prove injurious to fish life. City water, river water, and brackish water (3,000 parts per million chloride) taken from galvanized tanks and pails were analyzed. Zinc absorption ranged from 2 to 7.5 parts per million and river water zinc content was found to be 1 part per million. A zinc content of 2. parts per million or less did not appear to be injurious to small fish of the various species held, and in the case of larger fish in the yearling and juvenile stages a higher zinc con-tent was tolerated without evident ill effects. However, all galvanized tanks were painted to rule out zinc toxicity as a complicating factor.
Baby bass and salmon are voracious eaters under suitable conditions. Bass were fed very small freshwater shrimp ( Neomysis) and salmon were fed ground liver. The larger bass are fish eaters and their food re-quirements seemed to be small during the brief period of captivity.
Aeration of water in the holding tanks and aquaria was not necessary provided the fish were not overcrowded. Fish held for long periods devel-oped fin rot and fungus growth even with the constant changing of the water, and there was a noticeable increase in disease if the tanks were overpopulated.
Fish in moving water assume a directional attitude toward the flow, heading into the current. In quiet water fish were observed moving in all directions, but with the first water movement began to align themselves with their heads into the current and as the velocity increased this char-acteristic became more definite, with little tendency to deviate from it.
24 DEPARTMENT OF FISH AND GAME
Flume experiments have confirmed this observation in velocities from zero to several feet per second. Fish were rarely observed swimming with the current except when frightened or exhausted and desperately looking for a refuge. It is believed that fish swim against the current to facilitate breathing and, in their natural environment, for the purpose of feeding more easily on passing food.
It should be noted that different species of fish respond differently. However, as a general rule, bass and salmon behave consistently in this manner and this was an important factor in the solution of our problem.
It was observed that fish avoided areas of high turbulence and would not cross through vertical stream lines having a wide differential in veloc-ity between them. The fish instinctively avoided these areas of abrupt changes in stream flow and invariably sensed and sought lower uniform velocities. This characteristic suggests many possibilities in the control of fish movement. It also explains why some devices fail in their purpose.
Re-entrant corners in water structures have a tendency to trap fish, and especially if the direction of the currents causes fish to orient towards the corner, and if the corner restricts their lateral movement.
Striped bass appear to move en masse during tidal flows from one locality to another, apparently riding the flow. Seaward migration of young salmon is the greatest during periods of heavy stream runoff in the spring.
Striped bass and salmon sense a screened obstruction in a channel before they reach it. It was observed that if the current speed was slow enough for them to swim against it, they would swim away from the obstruction. If the current was equal to their swimming ability they would move laterally in front of the obstruction, seeking a refuge or area of lower velocity that they could negotiate. Only when a fish became exhausted or the current was beyond its swimming ability did the fish become impinged upon a screen. It should be noted that this characteristic varies with the species of fish, the fish's physical condition, and its fight-ing spirit, but was strikingly true of the striped bass and king salmon.
From observations made during the program it is believed fish can be moved in a column of water at least 10 ft. /sec. without ill effect, even though the cross sectional flow pattern is not uniform. Sudden contrac-tion or enlargement with abrupt velocity changes in a column of water is hazardous to fish life. Cascading turbulent flow is extremely hazardous.
Centrifugal forces from the rotational movement of a column of water do not have a tendency to force the fish to the outer edge. On the contrary, fish followed a path near the center where the rotational effect was least felt. An experiment using a circular, helical vaned duct was de-signed to demonstrate this point.
6. VELOCITY STUDIES
During the course of the research program much time was spent inves-tigating and studying the effect of water velocity upon fish, both in the screen structure and experimentally in test flumes.
A velocity flow traverse was made in front of each of the four operat-ing traveling screens with both of the two intake tubes from the river in service. The traverse was similar to one made earlier, when the plant was operating on one intake tube and three screens.
• 23 % ' • Q 26 % •■■
1.22 F/S 1.52 F/S 1.14 F/S AVE. VELOCITY. 1. 39 F/S 1.32 TOTAL
PLAN-INLET SCREEN STRUCTURE EL. +9.0
d
..
.
1,
EL
6
a
•
• b ' SCREEN N° 4 11-2'
SCREEN N° 3 I e- 2"
SCREEN N° 2 Ii'- 2"
SCREEN N° 1 11.-2"
WATER LEVEL +0.0
a
. .4 a
\P
r
1
0
STUDIES ON FISH PRESERVATION 25
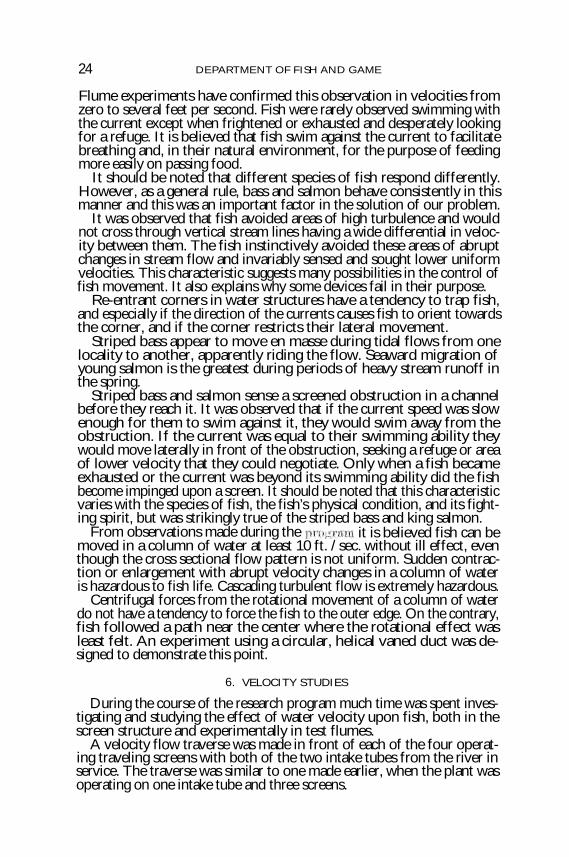
Velocities were measured by a conventional type rotating cup meter and direction of flow by a special device developed by the testing lab-oratory. Readings were taken in a quadrangular pattern of 2-foot inter-vals during a tidal range of +1.0 to +3.0 feet.
As was to be expected, the flow pattern was not uniform over the area of each screen channel, nor was the average velocity of one channel the same as another. Averages for individual channels ranged from 1.14 ft./sec. to 1.52 ft./sec., with an over-all average of 1.32 ft./sec. The velocity traverse is shown in Figure 7.
SECTION A-A SHOWING VELOCITY CONTOURS
FIGURE 7. Velocity contours taken in front of the four operating traveling screens during water flow of 600 Cu. ft./sec.

FIGURE 8. Velocity study of fish in test flume. Photograph by P. G. & E. News Bureau, April, 1952.
This was a great improvement over the one-tube, three-screen opera-tion, which showed an average range from 0.76 to 2.78 ft./sec.
Since the traverses were taken in each individual screen channel ap-proximately 3 feet in front of the traveling screens, the averages were approach velocities and these were not considered high.
There was much speculation as to whether fish concentration in the screen structure was a function of velocity in the intake tubes supplying the screen structure, as well as a function of the quantity of water used. It was argued by some that fish build-up in front of the screens was directly proportional to the tube velocity. It was contended by others that velocity had little bearing on fish concentration and that fish concen-trations were simply proportional to the quantities of water used. To determine the relationship existing between fish concentration in the screen structure and water intake from the river, observations were made at times when two, four, or six circulating pumps and one or two tubes were in service. The observations were made over a five-month period to fit in with regular plant operation. Table 1 gives the data gathered dur-ing the period and involves approximately 145,000 fish recovered.
A proportional relationship between fish concentration in the screen structure and rate of flow through the intake tubes is suggested by these data, plotted in graph form and shown in Figure 9.
It was recognized that any conclusions reached from these data were clouded by the constantly changing density of fish in the river at the water diversion. Tidal currents continually carry different water masses

10 8.5
20
AVERAGE FISH PER 1 00,000 CU. FT. - 6.7
STUDIES ON FISH PRESERVATION 27
TABLE 1
SCREEN STRUCTURE FISH CONCENTRATION STUDY
November 18, 1951, to April 15, 1952
Rate of flow, Cu. ft./see.
Tube area, sq. ft.
Tube velocity, ft./see.
Fish per 100,000 cu. ft.
of water
Fish per
hour
Total hours
200 - - - - - - - - - - - - - - - - - - - - - - - - 266* 0.88 0.78 6 144
200 - - - - - - - - - - - - - - - - - - - - - - - 113 1.77 3.4 25 144
400 - - - - - - - - - - - - - - - - - - - - - - - - 226* 1.77 1.2 17 360
400 - - - - - - - - - - - - - - - - - - - - - - - - 113 3.54 6.1 88 48
400 - - - - - - - - - - - - - - - - - - - - - - - - 113 3.54 18.2 72 96
600 - - - - - - - - - - - - - - - - - - - - - - - - 113 5.3 6.1 131 168
600 - - - - - - - - - - - - - - - - - - - - - - - - 113 5.3 11.2 242 216
600 - - - - - - - - - - - - - - - - - - - - - - - - 113 5.3 6.7 144 336
Average - - - - - - - 6.7 91
* Two-tube operation.
NUMBER OF FISH VERSUS RATE OF FLOW
200 400 600 RATE OF FLOW-CU. FT. PER SECOND
FIGURE 9. Curve shows relationship between rate of flow and fish recovered per 100,000 cu. ft. of water used.
with varying fish population across the intake. Notwithstanding this fact, however, the length of time and number of fish involved in this study do give weight to the data gathered and it was believed reasonable to assume :
(a) That fish concentration varies proportionally with the rate of flow for a given tube area.
(b) That the rate of increase of fish concentration is several times faster with an increase of velocity in the lower velocity ranges, but that the rate of increase becomes slower in.the higher velocity ranges.
Later, tests were made with all six circulating pumps in operation, manipulating the stop-log gates in the screen structure to produce de-sired velocity conditions in the tubes.
Counts were made of fish recovered by each traveling screen and from the four collectors by pairs (Collectors 1-2 and 3-4). The tests covered three consecutive days, each 24-hour period devoted to one phase of the
AVERAGE FISH
TUBE AREA II
PER 100 000 C
3 SO. FT.
U. P1-8.6 AO
12.1
3.4
0.78
TUBE ARE 226 SQ. FT.
AVERAGE FISH PER 100.000 CU. FT. - 0.99
28 DEPARTMENT OF FISH AND GAME
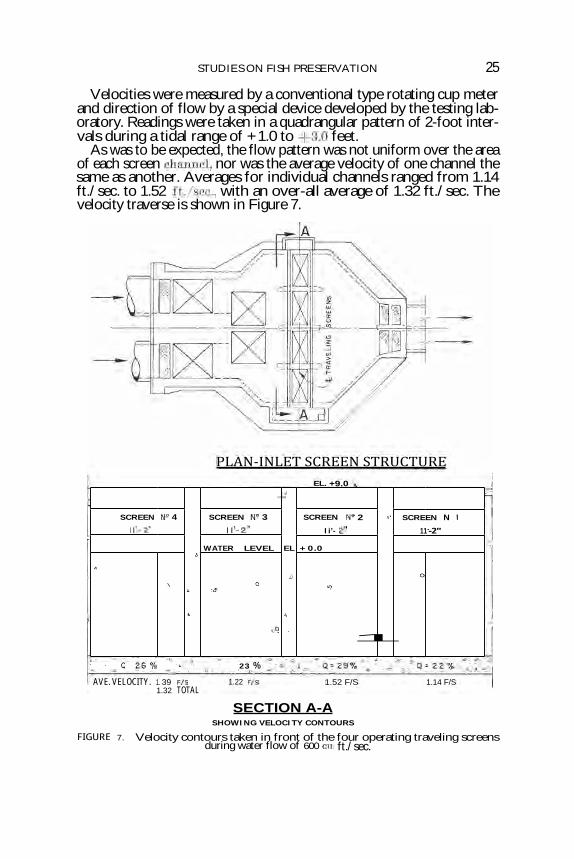
experiment. All four traveling screens were in service. The plant flow was constant at approximately 600 cu. ft./sec. (52 million Cu. ft./24 hrs.) .
Test data on bass for this three-day investigation are given in Table 2 and involve approximately 26,000 fish.
TABLE 2
SCREEN STRUCTURE BASS CONCENTRATION STUDY
August 5, 1952, to August 9, 1952
Rate of flow, cu ft./sec.
Tube area, sq. ft.
Tube velocity, ft./sec.
Bass per 100,000 Cu. ft.
of water
Bass per
hour
Total hours
600 - - - - - - - - - - - - - 600 - - - - - - - - - - - - - 600 - - - - - - - - - - - - -
Average - - - - - - -
226* 113 226*
2.7 5.3 2.7
10.2 21.4 18.1
221 463 391
24 24 24
16.6 358
* Two-tube operation.
By doubling the intake tube velocity for the same rate of flow, fish concentration in the screen structure was increased many times in the lower velocity ranges, as indicated by Figure 10. However, the curve showing the accelerated velocity turns downward as the rate of flow increases above 400 cu. ft./sec. This appears consistent with the behavior characteristics of fish of avoiding zones of high differential velocities, observed during the research and described later.
NUMBER OF FISH VERSUS RATE OF FLOW 20
Li? O
u_ 0 o 0 10
Jcc
cr co ° n Z UJ
0-
200 400 600
RATE OF FLOW-CU. FT. PER SEC.
FIGURE 10. Curve shows relationship between rate of flow and fish recovered per 100,000 cu. ft. of water used under two velocity conditions.
Again, the experiment was open to some criticism due to the unknown daily variation of fish density in the river. However, since tests covered about the same tidal cycle and were run on consecutive days, they do offer a reasonable comparison. Fish density in the river during this season of the year is normally much greater than when the earlier studies were made. This accounts for the much higher rate of recovery.
Referring to Table 2, bass concentration increased 1.5 times (average of two days at lower velocity) during the time the velocity was doubled.
MIIIIMIE1116111 1M1 • ■■••111EL IMIIIIM111■11111111111MI■111111•1 •
I 1,1 _ Al
DRAIN SECTION TEST 121
WINDOW DETAILS SCALE: e•
INLET PIPE ARRANGEMENT
SCAI.E i'-o"
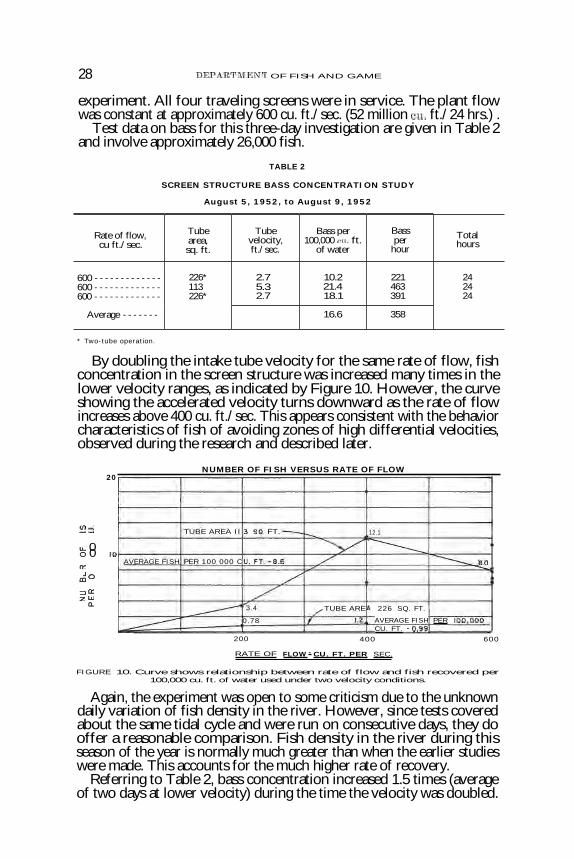
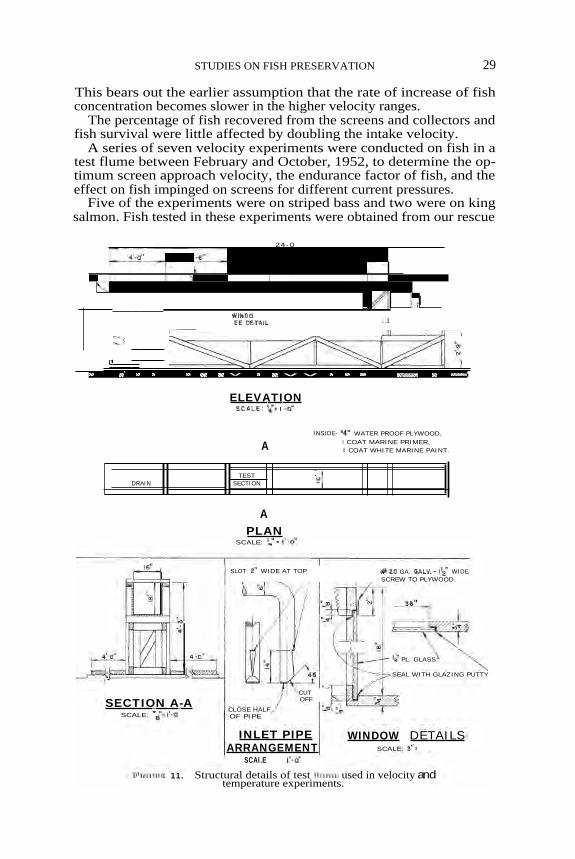
FIGURE 11. Structural details of test Hume used in velocity and temperature experiments.
SCALE: 14. =
SLOT e WIDE AT TOP 4020 GA. GALV.- lc' WIDE SCREW TO PLYWOOD.
56"
4'
45°
CUT OFF
CLOSE HALF OF PIPE
111/111. V PL. GLASS
f-E2W,
SECTION A-A SCALE: 31Er.e-0*
SEAL WITH GLAZING PUTTY
EMI
II
STUDIES ON FISH PRESERVATION 29
This bears out the earlier assumption that the rate of increase of fish concentration becomes slower in the higher velocity ranges.
The percentage of fish recovered from the screens and collectors and fish survival were little affected by doubling the intake velocity.
A series of seven velocity experiments were conducted on fish in a test flume between February and October, 1952, to determine the op-timum screen approach velocity, the endurance factor of fish, and the effect on fish impinged on screens for different current pressures.
Five of the experiments were on striped bass and two were on king salmon. Fish tested in these experiments were obtained from our rescue
24-0
-;)
WINDO EE DETAIL
IMM••■
W■1/%111 .11■11-MI
•
V ,N, V N 'a '€. V V • V V V • V V V/V V VS
ELEVATION SCALE. 14% I.-0"
INSIDE- 54" WATER PROOF PLYWOOD, I COAT MARINE PRIMER, I COAT WHITE MARINE PAINT.
A PLAN
A

30 DEPARTMENT OF FISH AND GAME
operations, except in the case of salmon. In some salmon experiments hatchery-reared fish were used.
Details of the test flume are shown in Figure 11. Each end of the flume was screened to confine the fish in the test area where velocity was reasonably uniform. Screen mesh was either No. 3 or No. 5, depend-ing upon the size of fish being tested.
All experiments were started by carefully placing the fish in the flume in still water, to avoid shock. They were allowed to rest several minutes before the velocity was built up to test speed. Each test of a given velocity was run for 10 minutes and the numbers of fish swimming at the end of three, five, and ten-minute intervals were recorded. The per-centage of fish swimming at the end of the 10-minute test is referred to as the "endurance factor." The mortality curves show the fish actu-ally dead at the end of the test. Larger fish may be impinged on the screen but still survive.
Emphasis should again be placed on the fact that we were dealing with living animals, influenced in their behavior by physiological and psychological reactions.
Obviously, the physical condition of the experimental fish was below that of fish living under natural conditions. Great care was taken in selecting specimens for the experiments to insure that conclusions drawn from the results would not be misleading. Even so, the results obtained are believed to be extremely conservative. It should be noted that fish are confined in the test flume and must submit to the test velocity. No refuge areas were available for escape.
Due to the season of the year when they were made (February), the first experiments were conducted with yearling bass 3 to 54 inches in length. Roughly 1,000 fish were tested in groups of 25 each at velocities varying from 0.5 to 2.9 ft./sec. The fish used in the first experiment were picked at random, without regard to their physical condition. It was found that 20 percent of these fish could not withstand velocities of 1 ft./sec. This confirmed the poor physical condition of our test speci-mens. After correcting for this condition it was found that the stronger bass of these sizes could swim against a velocity of 2 ft./sec., establishing an endurance factor and survival of 100 percent.
0.5 I 0 1 5 20 2.2 2.5 2.9
VELOCITY- FT. PER SECOND
FIGURE 12. Curves show the 10-minute velocity endurance and mortality factors for striped bass 3 to 5i inches long. Results are for 40 tests involving approximately 1,000
fish.
100
90
80
70
60
50
40
30
20
1 0
0 0
10 MIN. MORTA LITT
10 MIN. ENDUR ANCE
PE
RC
EN
T
STUDIES ON FISH PRESERVATION 31
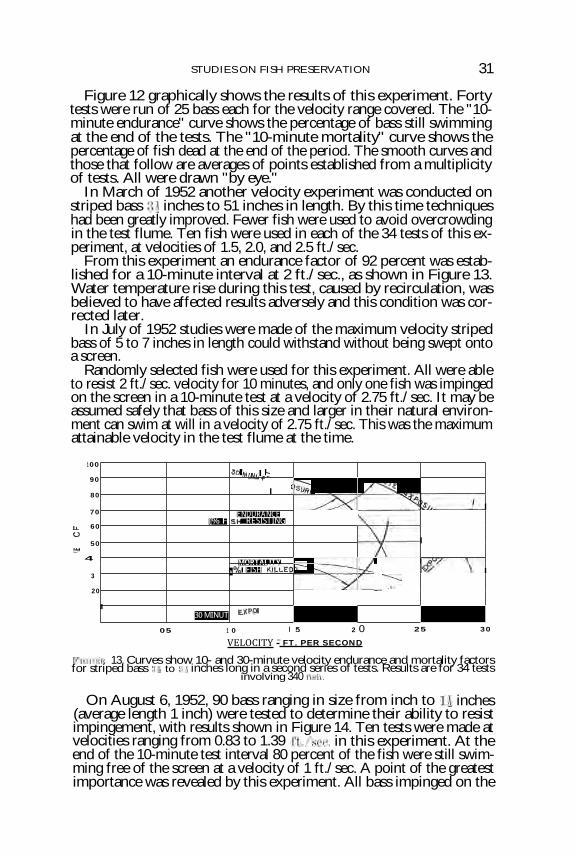
Figure 12 graphically shows the results of this experiment. Forty tests were run of 25 bass each for the velocity range covered. The "10-minute endurance" curve shows the percentage of bass still swimming at the end of the tests. The "10-minute mortality" curve shows the percentage of fish dead at the end of the period. The smooth curves and those that follow are averages of points established from a multiplicity of tests. All were drawn "by eye."
In March of 1952 another velocity experiment was conducted on striped bass 3-1, inches to 51 inches in length. By this time techniques had been greatly improved. Fewer fish were used to avoid overcrowding in the test flume. Ten fish were used in each of the 34 tests of this ex-periment, at velocities of 1.5, 2.0, and 2.5 ft./sec.
From this experiment an endurance factor of 92 percent was estab-lished for a 10-minute interval at 2 ft./sec., as shown in Figure 13. Water temperature rise during this test, caused by recirculation, was believed to have affected results adversely and this condition was cor-rected later.
In July of 1952 studies were made of the maximum velocity striped bass of 5 to 7 inches in length could withstand without being swept onto a screen.
Randomly selected fish were used for this experiment. All were able to resist 2 ft./sec. velocity for 10 minutes, and only one fish was impinged on the screen in a 10-minute test at a velocity of 2.75 ft./sec. It may be assumed safely that bass of this size and larger in their natural environ-ment can swim at will in a velocity of 2.75 ft./sec. This was the maximum attainable velocity in the test flume at the time.
100
90
80
70
uj 60 0
50 CL 4
3
20
3o &lift r e ttil
1111WMIMIIMMI
Alk■
Ell
(% F
ENDURANCE SH RESISTING
NTI
UMIE A
MORTALITY
FISH KILLE.1 \
M
1111
INIMWMI
IM%
1
30 MINUT EXPO
05 1 0 I S 2 0 25 30
VELOCITY - FT. PER SECOND
FIGURE 13. Curves show 10- and 30-minute velocity endurance and mortality factors for striped bass 3i to 51 inches long in a second series of tests. Results are for 34 tests
involving 340 fish.
On August 6, 1952, 90 bass ranging in size from inch to 11 inches (average length 1 inch) were tested to determine their ability to resist impingement, with results shown in Figure 14. Ten tests were made at velocities ranging from 0.83 to 1.39 ft./sec. in this experiment. At the end of the 10-minute test interval 80 percent of the fish were still swim-ming free of the screen at a velocity of 1 ft./sec. A point of the greatest importance was revealed by this experiment. All bass impinged on the

32 DEPARTMENT OF FISH AND GAME
screen at the end of the test periods were dead, indicating that fish of this small size cannot stand impingement. This was not true with larger bass.
VELOCITY ENDURANCE CURVE 34 INCH TO 1 12 INCHES STRIPED BASS
100
90
80
70
60
50
40
30
20
C O
09 1 0 11 1 2
1 3
1 4
VELOCITY - FT. PER SECOND
FIGURE 14. TEN-MINUTE VELOCITY ENDURANCE CURVE FOR STRIPED BASS AVERAGING ONE INCH LONG. NINETY FISH WERE INVOLVED IN THIS EXPERIMENT.
0 0.8
The last velocity experiment conducted on bass was in October with 55 fish ranging from 1 to 3 inches in length. Bass of this size were able to withstand velocities of 2 ft./sec. for 10 minutes with a survival of 95 percent, as shown in Figure 15.
1- 0 80 EL 0
70 ow Z — 60
Z 50
0 40
Z
-
30 W 0 CE 0 20 UJ Z
LL1 10
1 0 1 5 2.0 2.5
30
VELOCITY- FT. PER SECOND
FIGURE 15. TEN-MINUTE VELOCITY ENDURANCE CURVE FOR STRIPED BASS ONE TO THREE INCHES LONG. NINETY FISH WERE INVOLVED IN THIS EXPERIMENT.
Test flume velocity experiments with king salmon indicate that they are a much hardier fish than the striped bass and are able to withstand screen impingement without loss of life far better than bass.
The first experiment conducted on salmon was in March, 1952, using 160 hatchery fish of 11 to 1i inches in size. At the end of the 10-minute interval, 92 percent of the fish were swimming in a velocity of 1 ft./sec. At the conclusion of the test with a reduction of the velocity to zero, the
00.5
100
90
X

. \
STUDIES ON FISH PRESERVATION 33
IMPINGED FISH ON THE SCREEN SWAM FREE AND THERE WERE NO SALMON FATALI-TIES FROM THE EXPERIMENT. ELEVEN SEPARATE TESTS WERE MADE AND FIGURE 16 SHOWS THE RESULT. VELOCITIES TESTED RANGED FROM 0.5 TO 2.0 FT./SEC.
100
90
I— 0 <2 80
_ 2 60 2
50 (-N 0
- 40
Z
-
Li
W 0 30
CC 0 20 W Z • W
0.5 1.0 1 5 2.0
VELOCITY —FT. PER SECOND
FIGURE 16. TEN-MINUTE VELOCITY ENDURANCE CURVE FOR KING SALMON lh INCHES LONG. ELEVEN TESTS WERE MADE INVOLVING 160 FISH.
LATER, THE SAME EXPERIMENT WAS REPEATED WITH 112 WILD SALMON (EIGHT TESTS) TAKEN FROM A TRIBUTARY RIVER NEARBY. THE RESULTS OF THIS EXPERI-MENT AT VELOCITIES RANGING FROM 0.5 TO 1.5 FT./SEC., WERE SIMILAR TO THE FIRST AND WITH NO DEATHS (FIGURE 17). RESULTS OF TEST FLUME VELOCITY EXPERIMENTS ON SALMON WERE CLEAR-CUT AND FURTHER WORK ON THIS PHASE WAS DEEMED UNNECESSARY FOR OUR PURPOSE.
1 0
100
90
1— 0 <2 80
• 70 _ 2 . 60
Z M 50
CN
40
Z LIJ 0 30
0 20 Z
11.1 1 0
0 0 0.5 1 0 1 5 2.0
VELOCITY-FT. PER SECOND
FIGURE) 17. TEN-MINUTE VELOCITY ENDURANCE CURVE FOR KING SALMON 1.25 TO 1.89 INCHES LONG. EIGHT TESTS WERE MADE INVOLVING 112 FISH.

34 DEPARTMENT OF FISH AND GAME
It was concluded that the optimum velocity for salmon of the sizes tested was approximately 1 ft./sec., and that even though the salmon might be impinged on screens for short periods of time, they will still survive upon release.
From time to time test flume velocity experiments were conducted on other species of fishes for corroborative evidence and the results obtained closely confirmed the bass and salmon experiments.
Several important points of interest were noted during the test flume experiments on bass and salmon.
(a) Bass and salmon always swim headed into the stream flow. (b) Bass and salmon have an unerring sense for finding low velocity
areas of a channel. (c) When bass and salmon are carried along with the current they
will sense the approaching presence of a screen obstruction at a distance of several inches, the distance depending on the speed of approach. They will make every effort to swim away from the obstruction and failing in this, will move laterally a few inches in front of the screen looking for a refuge. Impingement followed only when they were exhausted and were unable to find a way of escape. For brief periods their swimming ability was about twice that shown by the "10-minute endurance" curves.
(d) The impingement of salmon 11 inches or longer on screens for a period of 10 minutes was not harmful. On release of the pressure the fish swam freely away and no physical damage was observed. Long periods of impingement will undoubtedly cause death by suffocation, the pressure closing their gills.
(e) Impingement of larval and small yearling bass results in a high mortality immediately. These small fish are delicate and appar-ently suffer physical damage and shocks as well as suffocation.
Conclusions reached from these experiments were as follows : (a) The swimming ability of juvenile striped bass and king salmon
increases with size. For example, bass one inch long can stem a current of about one foot per second for 10 minutes (Figure 14) ; while bass four inches long can stem about two feet per second for 10 minutes (Figure 13). However, fish of one age group will vary an inch or more in length and in many instances the smaller fish of one age group were still swimming when the larger fish were impinged on the screen. Little difference was observed between the swimming ability of comparable yearling salmon and bass, which varied from 1 ft./sec. for the fish approximately 1 inch long to over 2.75 ft./sec. for bass in the 5 to 7 inch group.
(b) Many variables were involved in evaluating the endurance factor of bass and salmon, and again the endurance of striped bass and king salmon appears to be a function of age and physcial condi-tion as well as size. Barring physical injury, the hardiness of juvenile striped bass and salmon is amazing.
(c) Velocity as a function of fish mortality seems to be a logical way to determine the optimum velocity, and this then raises the ques-tion of screen mesh size. This will be dealt with later.

STUDIES ON FISH PRESERVATION 35
(d) The impingement of eggs and larval bass appears to be fatal, and impingement on fine mesh screens is certain, for they have little or no swimming ability. Salmon appear to withstand impinge-ment without serious injury in the sizes we have to contend with at Contra Costa.
(e) A maximum average design approach velocity of 1.5 ft./sec. seems reasonable when all factors are considered. Striped bass and king salmon that can be safely screened from water at any lower velocity can negotiate a current of 1.5 ft./sec. This is especially true if nearby areas of escape are provided.
7. SCREEN MESH SIZE STUDIES
Experiments were conducted on striped bass and king salmon in April, May and August of 1952, to determine the optimum size of screen for stopping fish of various sizes and age groups.
A test flume was equipped with interchangeable screens and fish taken from the rescue operations were used. Mesh sizes used were as follows :
(a) 5-mesh screen with clear opening of 0.159 inches; (b) 4-mesh screen with clear opening of 0.196 inches ; (c) 3-mesh screen with clear opening of 0.253 inches; (d) 2-mesh screen with clear opening of 0.375 inches.
The physical shape of fishes varies with species and also varies indi-vidually within the same species. Fish of the same age group may be long and slender or may be short and broad. Also, it was found that fish may be effectively stopped by a screen even though they are small enough to pass the wire openings. Invariably they land on the screen broadside following exhaustion, and they do not go through the screen tail first (their normal swimming position relative to the screens).
Test fish were placed in the screen flume and held in a water velocity of 2 ft./see. until they became impinged on the screen or had passed through it. These tests were severe and left no voluntary choice to the fish other than escape through the screens or to become impinged on them. A total of 97 salmon were used in ten tests, varying from 1.25 to 3.7 inches long.
A summary of the results of two experiments with king salmon are as follows :
(a) The 5-mesh screen stopped salmon 1.30 inches in length; (b) The 4-mesh screen stopped salmon 1.53 inches in length ; (c) The 3-mesh screen stopped salmon 1.69 inches in length ; (d) The 2-mesh screen stopped salmon 2.16 inches in length. An experiment with striped bass (64 bass from 0.83 to 2.1 inches long
were used in four tests) duplicating the test made with salmon produced the following results :
(a) The 5-mesh screen stopped striped bass 1.12 inches in length ; (b) The 4-mesh screen stopped striped bass 1.12 inches in length; (c) The 3-mesh screen stopped striped bass 1.18 inches in length; (d) The 2-mesh screen stopped striped bass 1.97 inches in length.
36 DEPARTMENT OF FISH AND GAME
In analyzing these experiments the question is resolved into what size fish are to be stopped, bearing in mind the high mortality rate of small fish from impingement.
Any size fish can be stopped by screens of fine enough mesh, but if they are killed by impingement nothing has been accomplished.
The swimming ability of small fish at a given velocity and their chances of survival from impingement on the screen appear to be the deciding factors in the choice of mesh size. Extremely small fish with little or no ability of self-propulsion will be impinged and killed at extremely low velocities and their chances of survival in the case at hand are greater if they are allowed to pass through the screen.
Taking into account the velocity experiments conducted, a screen of f-inch mesh clear opening with an approach velocity of 1.5 ft. /sec. appears to be optimal when avenues of escape are provided for the fish.
Experiments with screens placed diagonally to or at a slope angle to the water flow were tried. Angularity of screen placement appears to have little or no bearing on mesh size. However, fish definitely were guided into the acute angle formed by the screen and flume wall or to the upper stratum of the channel by sloping screens. It is believed this method may offer opportunities for concentrating fish in a collection area or by-passing them around hazards.
Screen mesh size experiments were also conducted on other species of fish, notably splittails. In June, 1952, a heavy run of these fish was pres-ent in the river. Over 8,000 were recovered by the fish collectors in nor-mal operation in 15 days. They averaged 1.48 inches in length, the smallest being 0.79 inch, and yet they were recovered from in front of traveling screens basketed with mesh having a clear opening of 0.196 inches (No. 4 mesh). In subsequent flume tests on these fish it was found 50 percent could actually pass a No. 4 mesh and a substantial number could even pass a No. 5 mesh screen.
Under normal operating conditions of fish collectors and traveling screens, great numbers of very small bass, salmon and many other species of fishes were recovered from in front of screens large enough to pass them. Apparently they were not carried through the wire because they sensed the approaching hazard.
8. TEMPERATURE STUDIES
Since the water taken from the river by the Contra Costa Steam Plant is "used" and not " consumed, " the question of safety in allow-ing small fish to pass through the plant was extremely important.
A comparison of hazards to small fish between impingement on screens or a trip through the cooling water system was attempted.
The principal hazard to fish life in the trip through the plant is the temperature rise of the water. Experiments were conducted on striped bass and king salmon between February and October, 1952, to determine :
(a) The maximum temperature rise that small bass and salmon able to pass a No. 2 mesh screen can withstand ;
(b) Their maximum temperature tolerance ; (c) The optimum temperature rise and maximum temperature toler-
ance to be used for design criteria when allowing small yearlings to pass through the cooling water system.

STUDIES ON FISH PRESERVATION 37
The experiments were conducted on the two species of fish in a test flume and later in an actual operating condenser. Bass taken from the rescue operation and hatchery, wild, and rescued salmon were used in the experiments.
The same test flume used for the velocity studies was used for these experiments. Temperature of the water was raised approximately 1° F. every 5 minutes by the energy input of pumping through a recirculating system. All flume tests lasted 10 minutes.
The plant condenser experiments were made by passing live fish through an operating condenser tube while the unit was on full load.
A condenser tube was brought out on each end through the water box walls and it was connected to hoses. The hoses in turn were connected to dispersing and receiving tanks for the fish. Length of time and travel con-ditions through the condensers on the hot side of the system simulated ac-tual conditions as nearly as possible. The time of exposure of fish to ele-vated temperatures in the condenser tests varied from 3i to 5 minutes.
King salmon varying in length from 1.34 to 2.40 inches were flume-tested at temperature rises in increments from 0 to 27° F. and from a minimum water temperature of 55-56° F. to a maximum water tempera-ture of 83° F.
The fish were removed from the holding tanks at normal temperature and immediately immersed in the test flume water of the higher test tem-peratures. No acclimating procedure was permitted. Water in the test flume was kept moving at a constant velocity of 0.5 ft./sec.
It was found from these experiments that small yearling salmon could withstand an instantaneous temperature rise of 25° F. without loss of life and that their maximum temperature tolerance was approximately 83° F.
Condenser tests on yearling salmon of the same size range, using 100 fish in 10 tests, demonstrated that these fish withstood the 16-degree tem-p.erature rise of the condenser with no fatalities.
Flume-tested salmon were held for observation 24 hours with no fatalities and condenser-tested fish were held for 10 days (in one case they were held 21 days) with 3 percent fatalities, which can be con-sidered normal mortality at this age. Fish released at the end of the holding period appeared to be in excellent condition.
The conclusion reached for yearling king salmon of the sizes able to pass a f-inch mesh screen was that passage through the plant constitutes no great hazard and that the survival will be extremely high.
Similar experiments were conducted with striped bass, but the problem was greatly complicated by unknown factors having to do with their physiological and psychological make-up. Small bass in fresh water very readily go into a state of shock without apparent cause.
From test flume results it would appear that small yearling bass in the 1.85 to 3.27 inch range can withstand an approximate 20° F. tem-perature rise with a survival of 85 percent at the end of the 5-day observation period and an 18° F. temperature rise with a survival of approximately 90 percent.
Condenser tests on bass 0.83 to 1.81 inches in length indicate that they can withstand the 16° F. temperature rise with a survival rate of 94

38 DEPARTMENT OF FISH AND GAME
percent at the end of the 5-day observation period. Results of tests are shown in Figure 18. Test fish held in blended water of 3,000 parts per million of salt added show an even higher survival.
PERCEN
T S
URVIV
AL
0
10
20
30
40
50
60
70
80
90
100 0 2 4 6 8 10 12 14 16 18 20 22 24 26 28
TEMPERATURE RISE °F
NORMAL WATER TEMPERATURE 72° FIGURE 18. Curve showing relationship between survival rate and temperature rise.
Striped bass 1 to 31 inches long.
The consistency of the salmon experiments did not occur in the experi-ments on bass, and many of the experiments were entirely contradictory. Test flume experiments on bass 3 to 6 inches in length indicate that they have a greater ability to withstand temperature rise than the smaller fish, probably because they are less subject to shock.
It would appear from the test that maximum temperature tolerated by bass is higher than that of salmon, being in the range of 90° F. or more.
It should be noted that while bass apparently cannot withstand the temperature rise of salmon, the initial water temperature at which the bass experiments were conducted was much higher than that for salmon
The results from these experiments, preliminary tests, and other data gathered during the course of the research program indicate that small striped bass and king salmon can pass through the plant with a high survival rate.
9. CONTINUOUS VERSUS I NTERMITTENT SCREEN OPERATION The effect on fish recovery and fish survival of intermittent or continu-
ous screen operation was a recurring question during the entire fish program at Contra Costa.
In September of 1951 a series of experiments was conducted in an effort to answer this question.

STUDIES ON FISH PRESERVATION 39
From these early experiments, with one intake tube and three screens in service, results indicated that from 5 to 19 percent more fish were recovered from the screens during intermittent operation than during continuous operation. However, these figures can be misleading, since the number of fish present varies widely from day to day, due to fluctu-ating fish abundance in the water drawn upon by the plant.
The bass survival during continuous operation was found to be 9.9 percent and during intermittent operation was 9.6 percent. The differ- ence of 0.3 percent was obviously not significant. It was clear that little if any difference existed between the two methods of screen operation.
Further investigation continued in November substantiated earlier findings that approximately 10 percent of the bass recovered from the screens during intermittent operation were alive and of the total fish recovered from the three screens 45 percent came from screen No. 2.
With the addition of a fish collector (covered later) in front of screen No. 2 and all screens operating intermittently, 55 percent of the total fish recovered came through the collector and the recovery from screen No. 2 dropped from 45 percent to 5 percent. Survival of fish from the collector was approximately 90 percent.
Under continuous screen operation the recovery by the fish collector increased only 10 percent, with a slight improvement in survival.
It was concluded that the slight improvement during continuous operation was of negligible benefit except during periods of high fish concentration.
In August, 1952, a more accurate experiment was conducted with both intake tubes and four screens in service. By this time, all four screen channels were equipped with fish collectors. Under these conditions only about 4 percent of the total fish recovered were taken from the traveling screens, and there was less than 1 percent difference between continuous and intermittent operation.
All bass recovered from the screens were considered dead, for it was found by observation that while fish might show signs of life immedi-ately after recovery, only a fractional percentage survived in holding tanks.
These experiments indicated a survival of about 60 percent for bass passing through the collectors. This, of course, was a great improvement over the 10 percent survival without the use of collectors. It should be noted here, however, that the survival of 60 percent through the col-lectors is not a true representation of the efficiency of the collectors. The survival rate and efficiency of the collectors are handled in a separate part of this report.
Nothing learned during the program clearly indicated that bass sur-vival is increased by continuous screen operation. However, during peri- ods of high fish concentration the efficiency of the collectors appeared to improve with continuous screen operation. It is believed that im-pingement in itself is fatal to small bass, and the likelihood of impinge- ment is not altered by method of screen operation. Therefore, the only justification for continuous screen operation would seem to be the im-provement in collector efficiency during periods of high fish concen. tration and even then the difference is slight, judging from the last experiment conducted.
40 DEPARTMENT OF FISH AND GAME
10. FISH STRATIFICATION STUDIES
Little was known of the dispersal of fish in the river strata and nothing was known of fish distribution at various depths in the screen structure. If it could be proved that a great majority of small fish occupied the upper 6-foot stratum of water it would be comparatively simple to con-struct a submerged hanging curtain barrier to a depth of 6 to 10 feet at the headworks around the intake tubes, thus barring their entrance to the plant. There seemed a possibility that this might be the case. Likewise, it was necessary to determine if stratification of fish existed in the screen structure, so that the collecting devices could be properly located at points of high fish concentration.
With these two objectives in mind an investigation was started in October of 1951 to determine at what elevation in the screen structure the heaviest fish concentration was to be found. A 5-inch bladeless impel-ler, horizontal centrifugal trash-type pump was used. Connected to the pump was a variable slotted suction pipe for sampling the water at differ-ent depths.
After carefully evaluating all data from this experiment and other activities being concurrently conducted in the screen structure, it ap-peared that bass favored the upper stratum of water only slightly, if at all.
There was also some justification for believing fish occupancy of one stratum over another may vary from day to day or that the dispersal of fish throughout the water depth may be generally uniform.
Similar experiments were continued in the river opposite the head-works in November of 1951. The same pump was used, supported on a barge 25 feet in front of the intake tube. The suction pipe was fitted with a large cone scoop and was adjustable for various depths in the river. Results from this experiment were negative, and the surprising thing was that only one fish was recovered after approximately 80 hours of operation.
Nothing more was done on this phase of the program until May of 1952, when a new approach to the problem was undertaken.
Plankton nets were towed behind a motorboat in the river near the intake structure. The depth of nets towed in this way could not be readily controlled. Several different types of float attachments from which nets were suspended were tried with some success. Finally the nets were rigged directly off the stern of the motorboat, fastened to long pipes adjustable for depth, as shown in Figure 20. Three nets set at different depths were towed simultaneously. This rig proved highly satisfactory and much time was spent sampling the river strata with it.
It was discovered that bass eggs and larvae were present at all depths, with no clear-cut stratification. They move about freely and are subject to river turbulence and current movement.
Unfortunately, the gear used did not take fish larger than about one-half inch with any efficiency, so nothing was learned of their vertical distribution. It seems evident that the larger fish sense the approach of the net and are able to avoid it, and unless the net is towed through an area of high fish concentration there is little likelihood that a repre-sentative number of fish will be caught.

Fmuun 19. Retrieving fyke net from tow-raft during fish stratification investigation on San Joaquin River. Photograph by P. G. cf E. News Bureau, April, 1952.
11. INVESTIGATION OF ELECTRIC FISH SCREENS
The use of electric fish screens for diverting fish away from the en-trances to the intake tube was first given consideration in August of 1951. A manufacturer of electric fish screens was employed to investigate our problem and submit recommendations.
After reviewing the consultant 's report it was decided to conduct a series of experiments at the intake headworks structure. The Department of Fish and Game cooperated in the experiments by loaning the project two electronic impulse generators it had previously used.
Essentially the equipment consists of two electrodes, one being grounded, and the electronic generator. Electric service requirements are 3 phase, 60 cycle, 230 volts with a maximum load of 7.5 kva. The frequency of the electrical impulse discharge is adjustable and can be varied from 4 to 10 per second. The duration of the impulse is only a few microseconds and the potential is in the neighborhod of 1,400 volts.
The grizzly bars at the headworks were used as the grounded electrode and the other electrode was designed, constructed, and installed.
The constantly changing salinity of the water and the wide variation in fish size added to the complexity of the problem of diverting fish from the intake tubes by means of an electric screen.
Currents of sufficient strength to divert small fish would be harmful to large fish, and the constantly changing salinity of the water necessitated continuous adjustments of the equipment.
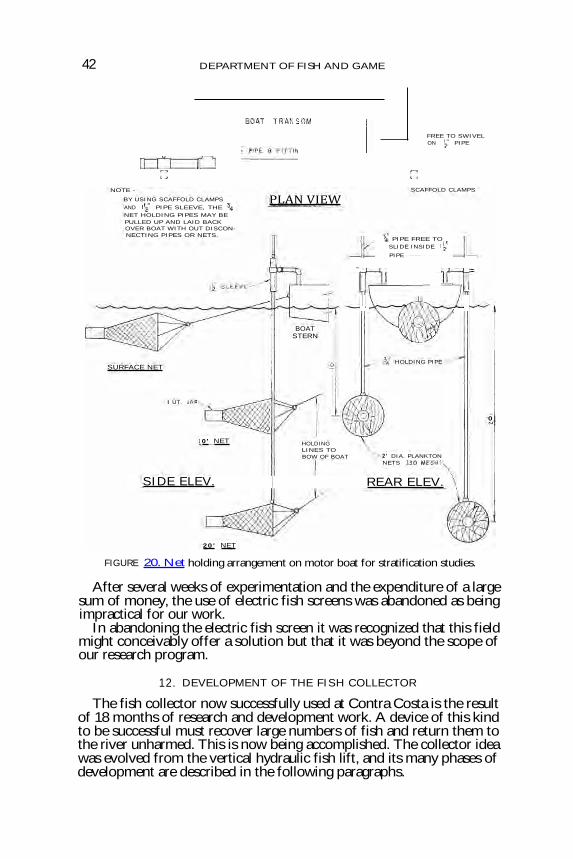
HOLDING LINES TO BOW OF BOAT 2' DIA. PLANKTON
NETS (30 MESH)
BOAT STERN
NOTE -
BY USING SCAFFOLD CLAMPS AND IV PIPE SLEEVE, THE 24
NET HOLDING PIPES MAY BE PULLED UP AND LAID BACK OVER BOAT WITH OUT DISCON-NECTING PIPES OR NETS.
SCAFFOLD CLAMPS
13; PIPE FREE TO
SLIDE INSIDE I V 1 PIPE
I c -ri Till
IIWIIIIIIIIIIIIFA
1111,41,'
#4,411,4 44e, ■ 0
HOLDING PIPE SURFACE NET
I UT. JAR
-0
SIDE ELEV. I REAR ELEV.
20' NET
PLAN VIEW
1 0' NET
42 DEPARTMENT OF FISH AND GAME
BOAT T RAN S OM
c= 1 • m:1_0 •
FREE TO SWIVEL ON I V PIPE
FIGURE 20. Net holding arrangement on motor boat for stratification studies.
After several weeks of experimentation and the expenditure of a large sum of money, the use of electric fish screens was abandoned as being impractical for our work.
In abandoning the electric fish screen it was recognized that this field might conceivably offer a solution but that it was beyond the scope of our research program.
12. DEVELOPMENT OF THE FISH COLLECTOR
The fish collector now successfully used at Contra Costa is the result of 18 months of research and development work. A device of this kind to be successful must recover large numbers of fish and return them to the river unharmed. This is now being accomplished. The collector idea was evolved from the vertical hydraulic fish lift, and its many phases of development are described in the following paragraphs.

APPROVED /430
8'5TD. SLIP I... ON WELL 'NCI FL ANGE -
4 " k
R
FABR. FR.OrA 8" 90° LONG R.. EL. 1=10.
Q; Tn. WELD FL.
9" OUT TO OUT
go 1-•
sAR-2.- x-3
IG
I" BENT it
A-A WELD 1111.
-ALL ARMIN:, WATER TIGHT
- ;/ rAi:111.
: Ngly DETAIL
140TE6 V-0" I. ALL PIPE TO BE STEEL,
STD. WT., E. WE LD, GALV.
a, ALL FLANGES STEEL, ETD. SUP-ON WELD TYPE
3. ETRUCT. BRACE,. FIT To PIPE AND WELDED
4. USE SUCTION I-10SE B FOR FLEXIBLE SPOOL
5.WT. OF ASSEMBLy 1 970#
G, GALV. AFTER FABRICATION
7. ALL -JOINTS TO BE FINIsNEO INSIDE PIPE
FLOW
C. 6.7
B-
Gx4 ECCEN. REDUCER_
A kr.syt.. WELDING CAP
1 0=5" cr_ TO 4 PIPES IV-9" OUT TO OUT
4 "- 9 0 °L0 NG FAD. EL \,
MARE ONE ASSEMBLY—AS S1-10"1 SCALE- 3 ''=-• ii-o"
REF.DWG.40459G RFTITLIV,O A
By J.E. KERR- DR, W. REMUS
0. K. r,r,". , DATE SCALE
9-22- AS NOTE
BECHTEL CORPORATION SAN FRANCISCO, CALIF.
INLET SCREEN STRUCT:-DETAIL,HYDRAULIC ASH LIFT CONTRA COSTA STEAM AAAAA PACIFIC GAS AND ELECTRIC COMPANY
SAN FRANCISCO. CAL.
SU PPPPPP IV
EST NO SHEETS
024829 "5
STUDIES ON FISH PRESERVATION 43
The original vertical hydraulic fish lift was designed to suck up fish trapped in the screen structure and to return them to the river. Essen-tially it consisted of two slotted collector pipes set vertically, one on each side of the screen approach channel approximately 3 feet in front of the traveling screen. Suction through the slotted openings was produced by employing the hydraulic eductor principle, introducing a high velocity
WINS S.0 IN
FABRic ATE PT;LCM)
RAL. REDUCING EL'S. BAR_ x 122-8" 2-
c-8" STD. P PE
•••••" SYM M. ABOUT
FIGURE 21. Structural details—vertical hydraulic fish lift.

c 14t415t4
c, SCtA -C14) 1‘ cl.,114
ft-tq l4Ogi t1
c 140 / / (GA
, z orb- 4.0
BO( 01
o c01*.e;
■"•■• •
44 DEPARTMENT OF FISH AND GAME
jet through a venturi section of each collector pipe near the top. The collector pipes were connected to a common header which discharged into a river return flume. Jet water was supplied from the screen wash pumps and the most efficient jet pressure was found to be 25 to 30 lbs./sq. in. Figure 21 shows the structural details of this device.
Many modifications were tried between July and December, 1951, in an effort to improve its efficiency and gain information generally. Tests conducted in October, 1951, showed an average recovery rate of 13 fish per hour of all species, with a survival of 19 percent. Bass recovery rate reached a high of 32 per hour during one test, but survival dropped to 7 percent.
A collecting device to handle large numbers of fish must be placed in an area of high fish concentration and it became evident that the vertical hydraulic fish lift was not so located.
FIGURE 22. The horizontal hydraulic fish lift succeeded the vertical lift in the sequence of development.

STUDIES ON FISH PRESERVATION 45
To overcome this handicap, a new horizontal device was constructed and located in an area where fish were believed to congregate. It con-sisted of one slotted collector pipe and employed the same suction prin-ciple as its predecessor. The collector pipe was placed horizontally be-neath a hanging curtain wall across the screen approach channel about 18 inches in front of the traveling screen. In all other respects the device was similar in design to the vertical lift. See Figure 22.
The horizontal hydraulic fish lift was only slightly better than the vertical lift. Tests in October, 1951, showed a recovery rate of 16 fish per hour of all species, with a survival of 36 percent. Bass recovery rate and survival were below this.
The original concept of the operation of the lifts with high suction was beginning to be doubted. Observation of fish behavior indicated that they avoided areas of high suction. Moreover, it was becoming in-creasingly clear that the few fish entering the collector were being in-jured by the jets producing the suction. With reduction of jet pressures the fish lifts became ineffective.
Concurrently with experiments on the hydraulic fish lifts, experiments were started with a 5-inch bladeless impeller-type pump having a capac-ity of 550 gallon/minute. The pump was similar to ones used by the U. S. Fish and Wildlife Service at Tracy, California, in their fish recov-ery experiments, and was referred to as a "fish pump."
A variable depth, slotted suction pipe was used as a collector on the pump and the collector pipe was portable, so that it could be moved from place to place in the screen structure to locate areas of high fish concentration. With the use of this device the concept of drawing fish to the collector by a high suction was abandoned. Figure 23 shows one version of this device, but many modified arrangements were tried.
In 234 hours of testing, fish of all species, including striped bass, were recovered at the rate of 6 fish per hour, with a survival of 77 percent. The recovery rate was less than by either of the hydraulic fish lifts, but survival was improved markedly.
The next step was the modification of the two hydraulic fish lifts for pump operation. This was accomplished by cutting out the venturi sec-tions and connecting the pump suction to the lifts. Survival rates with both the vertical and horizontal lifts pump-operated were most encourag-ing, but still the collection rate per hour was discouragingly low. Figure 24 shows the horizontal hydraulic fish lift modified for pump operation.
The search for areas of high fish concentration continued and one of 15 sq. ft. was found between the hanging curtain wall and the travel-ing screen. A new device, called the fish collector, was installed in this area.
The first fish collector, shown in Figure 25, was a pan 6 inches deep, hung from the under side of the curtain wall, projecting into the area of fish refuge with a lip approximately 5 inches away from the traveling screen and extending the full width of the screen approach channel. The top of the pan was open in the refuge area until it reached the curtain wall. From the curtain wall the pan was covered and gradually converged to a 6-inch diameter suction pipe connected to the fish pump
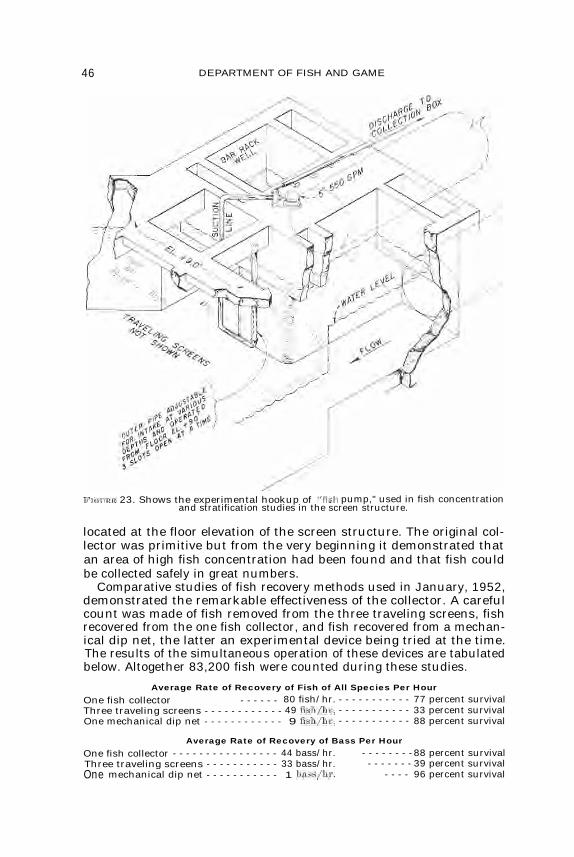
46 DEPARTMENT OF FISH AND GAME
FIGURE 23. Shows the experimental hookup of "fish pump," used in fish concentration and stratification studies in the screen structure.
located at the floor elevation of the screen structure. The original col-lector was primitive but from the very beginning it demonstrated that an area of high fish concentration had been found and that fish could be collected safely in great numbers.
Comparative studies of fish recovery methods used in January, 1952, demonstrated the remarkable effectiveness of the collector. A careful count was made of fish removed from the three traveling screens, fish recovered from the one fish collector, and fish recovered from a mechan-ical dip net, the latter an experimental device being tried at the time. The results of the simultaneous operation of these devices are tabulated below. Altogether 83,200 fish were counted during these studies.
Average Rate of Recovery of Fish of All Species Per Hour One fish collector - - - - - - 80 fish/hr. - - - - - - - - - - - 77 percent survival Three traveling screens - - - - - - - - - - - - 49 fish/hr. - - - - - - - - - - - 33 percent survival One mechanical dip net - - - - - - - - - - - - 9 fish/hr. - - - - - - - - - - - 88 percent survival
Average Rate of Recovery of Bass Per Hour One fish collector - - - - - - - - - - - - - - - - 44 bass/hr. - - - - - - - -88 percent survival Three traveling screens - - - - - - - - - - - 33 bass/hr. - - - - - - - 39 percent survival One mechanical dip net - - - - - - - - - - - 1 bass/hr, - - - - 96 percent survival

STUDIES ON FISH PRESERVATION 47
Flamm 24. The horizontal hydraulic fish lift modified for fish pump operation. This device was the forerunner of the fish collector to be developed later.
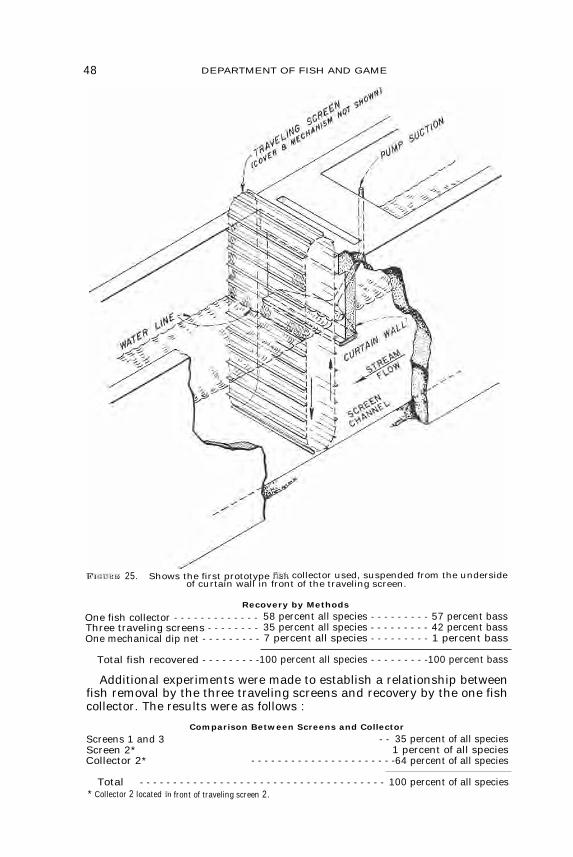
48 DEPARTMENT OF FISH AND GAME
FIGURE) 25. Shows the first prototype fish collector used, suspended from the underside of curtain wall in front of the traveling screen.
Recovery by Methods One fish collector - - - - - - - - - - - - - 58 percent all species - - - - - - - - - 57 percent bass Three traveling screens - - - - - - - - 35 percent all species - - - - - - - - - 42 percent bass One mechanical dip net - - - - - - - - - 7 percent all species - - - - - - - - - 1 percent bass
Total fish recovered - - - - - - - - -100 percent all species - - - - - - - - -100 percent bass
Additional experiments were made to establish a relationship between fish removal by the three traveling screens and recovery by the one fish collector. The results were as follows :
Comparison Between Screens and Collector Screens 1 and 3 - - 35 percent of all species Screen 2* 1 percent of all species Collector 2* - - - - - - - - - - - - - - - - - - - - - -64 percent of all species
Total - - - - - - - - - - - - - - - - - - - - - - - - - - - - - - - - - - - - - 100 percent of all species * Collector 2 located in front of traveling screen 2.

STUDIES ON FISH PRESERVATION 49
These results led to the eventual equipping of all screens with collectors. Experiments were conducted in February, 1952, to determine bass dis-
tribution in the screen structure, and to throw some light on how long fish were remaining there before entering the collector. For this test 817 market bass were released in the bar rack well and a record was kept of the marked fish recovered on screens 1, 2, and 3 and by the fish collector. Of all fish released 50 percent were recovered within the first 40 min-utes, 75 percent were recovered in four hours, and the remaining 25 percent were unaccounted for but were presumed to be in the screen structure and alive. Fish used were of random size, from 4 to 7 inches in length, taken from our holding tank.
Distribution of Bass Recovered Screen 1 10 percent recovery - - - - - - - - - - -49 percent survival Screen 2* 0.17 percent recovery - - - - - - - - - - - 0 percent survival Screen 3 45 percent recovery - - - - - - - - - - -26 percent survival Fish collector* - - - - - - - - - - - -45 percent recovery - - - - - - - - - - -50 percent survival * Fish collector located in front of screen 2.
Experiments indicate that a sudden influx of fish into the screen struc-ture can be dissipated in a short time. It is also interesting to note that only one fish was removed from screen 2, the only screen protected by a fish collector. The low survival rate is not considered significant since the experimental fish were in a weakened condition from marking and being held in captivity. The experiment confirmed previous indications of the effectiveness of the fish collector. It was highly encouraging to learn that bass were being removed so rapidly.
Up to this time the plant had operated on one intake tube and three traveling screens, due to construction reasons previously explained. In March, 1952, normal three-unit plant operation was begun with two inlet tubes and four traveling screens in service and this condition prevailed for the balance of the investigation, except during certain special phases of experiments. During the period of plant shutdown for conversion to two tube-four screen operation, newly designed fish collectors were in-stalled in each of the four screen channels.
Pumps were needed for the new fish collectors, so an investigation was made of pumps best suited for the handling of live fish. Canneries in the area were using a trash disposal type of pump for unloading fishing boats, pumping fish hundreds of feet to the cannery at a rate of 65 tons per hour, with excellent results.
It was decided to buy one of these pumps as an experiment for parallel connection to two collectors. The original fish pump was a 5-inch blade-less impeller-type centrifugal pump. The new one was an 8-inch open impeller type. The smaller horizontal pump had a rated capacity of 550 gallon/minute and the new vertical type was to have a capacity of 2,000 gallon/minute. It was thought additional capacity would be required to handle two collectors simultaneously.
Before the arrival of the larger pump the 5-inch fish pump was con-nected to two collectors both operating simultaneously and results were reasonably satisfactory. Tests, however, indicated that more flow through each collector was needed to get maximum efficiency. Also, it was learned that screen channel approach velocities had a bearing on the recovery rate of the collectors. Low approach velocities lowered the collector re-covery rate and, on the other hand, high approach velocities decreased
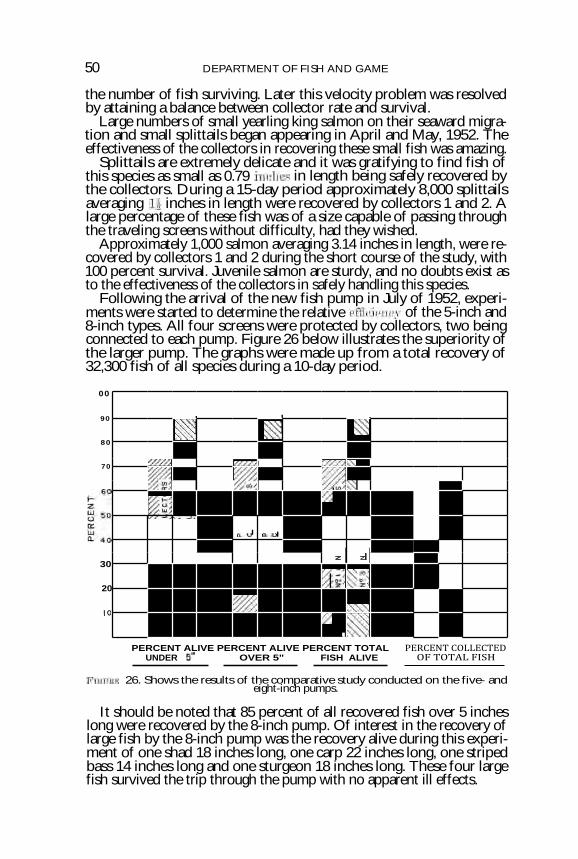
00
90
80
70
30
20
1 0
50 DEPARTMENT OF FISH AND GAME
the number of fish surviving. Later this velocity problem was resolved by attaining a balance between collector rate and survival.
Large numbers of small yearling king salmon on their seaward migra-tion and small splittails began appearing in April and May, 1952. The effectiveness of the collectors in recovering these small fish was amazing.
Splittails are extremely delicate and it was gratifying to find fish of this species as small as 0.79 inches in length being safely recovered by the collectors. During a 15-day period approximately 8,000 splittails averaging 1-i inches in length were recovered by collectors 1 and 2. A large percentage of these fish was of a size capable of passing through the traveling screens without difficulty, had they wished.
Approximately 1,000 salmon averaging 3.14 inches in length, were re-covered by collectors 1 and 2 during the short course of the study, with 100 percent survival. Juvenile salmon are sturdy, and no doubts exist as to the effectiveness of the collectors in safely handling this species.
Following the arrival of the new fish pump in July of 1952, experi-ments were started to determine the relative efficiency of the 5-inch and 8-inch types. All four screens were protected by collectors, two being connected to each pump. Figure 26 below illustrates the superiority of the larger pump. The graphs were made up from a total recovery of 32,300 fish of all species during a 10-day period.
1 N N
M M 04, WW R
au ao
z z
E El . m
, R , ..4
PERCENT ALIVE PERCENT ALIVE PERCENT TOTAL PERCENT COLLECTED UNDER 5" OVER 5" FISH ALIVE OF TOTAL FISH
FIGURE 26. Shows the results of the comparative study conducted on the five- and eight-inch pumps.
It should be noted that 85 percent of all recovered fish over 5 inches long were recovered by the 8-inch pump. Of interest in the recovery of large fish by the 8-inch pump was the recovery alive during this experi-ment of one shad 18 inches long, one carp 22 inches long, one striped bass 14 inches long and one sturgeon 18 inches long. These four large fish survived the trip through the pump with no apparent ill effects.

STUDIES ON FISH PRESERVATION 51
An experiment with 500 marked carp averaging 3 inches in length was conducted in July, 1952, to determine collector efficiency and fish distri-bution. The carp were all introduced into No. 1 bar-rack well simulta-neously. At the end of 175 hours, when the test was discontinued, 279 carp had been recovered. The disposition of the remaining fish is un-known. The following summary shows the results of this experiment.
Carp recovered in one hour 28 percent of total Carp recovered in 175 hours 56 percent of total Recovered by 5-inch pump (collectors 1 and 2) 53 percent of recovered fish Recovered by 8-inch pump (collectors 3 and 4 )____ A6 percent of recovered fish Recovered by four traveling screens 0.7 percent of recovered fish
The interesting thing about this experiment with carp is the relative efficiency of the collectors with other species of fish. In this case, of the total of 279 fish recovered, only two were recovered from the traveling screens. It should be noted that an experiment of this kind is severe and not comparable to normal conditions. Fish have little time to become ori-ented after being placed in the bar-rack well in fast moving water before they reach the screens. This accounts for the greater number recovered by the 5-inch pump.
A similar experiment was conducted in August, 1952, with 150 marked bass ranging in size from 5 to 10 inches in length. In this experiment the screen structure was divided by a center line stoplog gate separating screens 1 and 2 from screens 3 and 4 together with their respective col-lectors. The market fish were again introduced into No. 1 bar-rack well. The results of this experiment were as follows :
Bass recovered in one hour 24 percent of total Bass recovered in 49 hours 68 percent of total Recovered by 5-inch pump (collectors 1 and 2) 65 percent of recovered fish Recovered by screen 1 10 percent of recovered fish Recovered by screen 2 25 percent of recovered fish
This concentration suggests that the smaller pump is inadequate for handling a rapid build-up of fish of the larger sizes, and it confirms results of previous experiments. Of particular interest was the recovery of one 10-inch marked bass on screen 4 10-i hours after the release of the fish in No. 1 bar-rack well. The only possible conclusion is that the fish returned to the river by tube No. 1 and again reentered the screen struc-ture by tube No. 2 and was later recovered by the traveling screen.
During the long period of development of the fish collector many other related experiments were conducted on a round-the-clock basis, and a continuous record was kept of all fish recovered, both dead and alive. Laboratory experiments were verified with full-scale prototype tests in the screen structure.
Progress in the rate of recovery and survival of fish was measured con-tinually and while individual experiments occasionally did not reflect improvement, the over-all trend did.
Tests were conducted in August, 1952, to verify recovery rates and survival data previously assembled. It was learned that many fish were killed in the course of counting and classifying and survival figures under normal operating conditions will clearly be much higher. By slight improvements in methods of handling fish, survival rates were improved 20 percent.
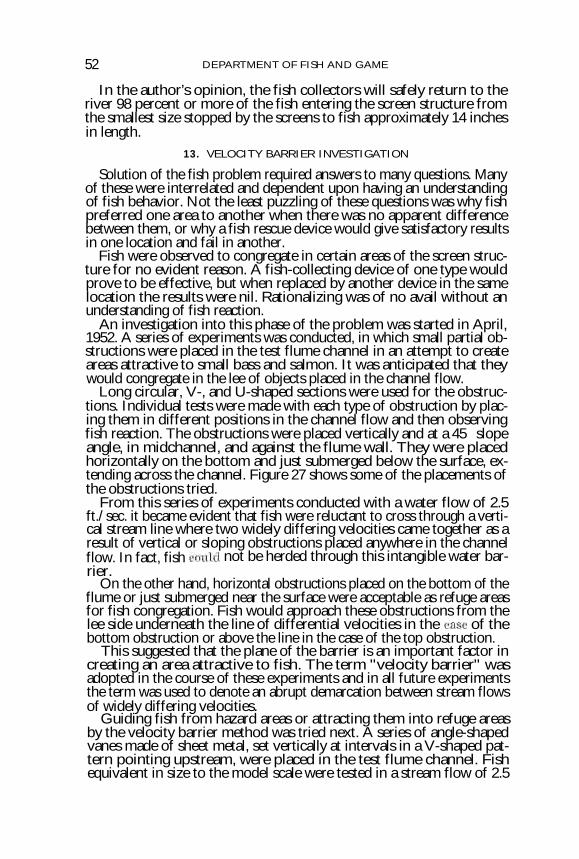
52 DEPARTMENT OF FISH AND GAME
In the author's opinion, the fish collectors will safely return to the river 98 percent or more of the fish entering the screen structure from the smallest size stopped by the screens to fish approximately 14 inches in length.
13. VELOCITY BARRIER INVESTIGATION
Solution of the fish problem required answers to many questions. Many of these were interrelated and dependent upon having an understanding of fish behavior. Not the least puzzling of these questions was why fish preferred one area to another when there was no apparent difference between them, or why a fish rescue device would give satisfactory results in one location and fail in another.
Fish were observed to congregate in certain areas of the screen struc-ture for no evident reason. A fish-collecting device of one type would prove to be effective, but when replaced by another device in the same location the results were nil. Rationalizing was of no avail without an understanding of fish reaction.
An investigation into this phase of the problem was started in April, 1952. A series of experiments was conducted, in which small partial ob-structions were placed in the test flume channel in an attempt to create areas attractive to small bass and salmon. It was anticipated that they would congregate in the lee of objects placed in the channel flow.
Long circular, V-, and U-shaped sections were used for the obstruc-tions. Individual tests were made with each type of obstruction by plac-ing them in different positions in the channel flow and then observing fish reaction. The obstructions were placed vertically and at a 45° slope angle, in midchannel, and against the flume wall. They were placed horizontally on the bottom and just submerged below the surface, ex-tending across the channel. Figure 27 shows some of the placements of the obstructions tried.
From this series of experiments conducted with a water flow of 2.5 ft./sec. it became evident that fish were reluctant to cross through a verti-cal stream line where two widely differing velocities came together as a result of vertical or sloping obstructions placed anywhere in the channel flow. In fact, fish could not be herded through this intangible water bar-rier.
On the other hand, horizontal obstructions placed on the bottom of the flume or just submerged near the surface were acceptable as refuge areas for fish congregation. Fish would approach these obstructions from the lee side underneath the line of differential velocities in the case of the bottom obstruction or above the line in the case of the top obstruction.
This suggested that the plane of the barrier is an important factor in creating an area attractive to fish. The term "velocity barrier" was adopted in the course of these experiments and in all future experiments the term was used to denote an abrupt demarcation between stream flows of widely differing velocities.
Guiding fish from hazard areas or attracting them into refuge areas by the velocity barrier method was tried next. A series of angle-shaped vanes made of sheet metal, set vertically at intervals in a V-shaped pat-tern pointing upstream, were placed in the test flume channel. Fish equivalent in size to the model scale were tested in a stream flow of 2.5

STUDIES ON FISH PRESERVATION 53
ON FLUME WALL
l ie r ,
1l
/
1
1
1
1 IV I IN MID-CHANNEL
PLAN VIEW F
LU
ME
WA
LL
VERTICAL VELOCITY BARRIER PLACEMENTS
4...WATER SURFACE _
—
-
FLOW
'
BOTTOM OF TEST FLUME-'
ELEVATION HORIZONTAL VELOCITY BARRIER PLACEMENTS
FIGURE 27. Shows the various shapes and locations of partial obstructions placed in test flume during velocity barrier studies.

TYPE 2
DEFLECTOR VANES
COLLECTOR PIPE
COLLECTOR SHIELD
54 DEPARTMENT OF FISH AND GAME
ft./sec. and their actions observed. Fish sensing the approach of the veloc-ity barrier moved to either side of the channel as they were swept down-stream.
The same experiment was repeated with the vanes placed in a straight line diagonally across the channel and with a collector installed on the downstream wall of the flume at the point of convergence with the bar-rier. Three-inch salmon and 14-inch bass were satisfactorily recovered.
The reluctance of fish to cross through a vertical line of high differen-tial velocity was again confirmed. The spacing between the vanes was ample for fish to pass through without trouble, had they wished. In no sense was the obstruction like a screen or a bar-rack. The purpose of the obstruction was the creation of a definite vertical line of high velocity crossflow. Approach velocities of 2.5 ft./sec. were considered the mini-mum and the velocity must be greater than the swimming ability of the fish to be deflected or they will swim upstream away from the barrier. Figure 28 illustrates the pattern of the deflecting vanes in the channel used in these two experiments.
SCREEN FIGURE 28. Shows arrangement of deflecting vanes placed in test flume channel during
velocity barrier tests.
Using Type 1 arrangement of deflector vanes, 100 percent of all ex-perimental fish were deflected to the sides of the channel with water veloc-ities sufficient to move fish downstream. As this arrangement would require two collectors, work was concentrated on the Type 2 device with a single collector. Initially this arrangement was tried with a single slot-ted collector pipe behind the last vane. Under these conditions a rotary

48"
.1...-.2-14" HOLES SCREEN DETAIL
2 REQ.12„
6"
GALV. 90°
COLLECTION PAN
GALV. 5"
STUDIES ON FISH PRESERVATION 55
turbulence was developed, which was unsatisfactory for collecting fish. A collector shield which was sealed to the flume wall was then introduced. This device proved exceptionally satisfactory in collecting fish.
Here were the answers to some of the puzzling questions : why certain collecting devices were ineffective, why the pump fish sample experiment failed, and why some areas were more attractive to fish than others.
CI 'V
—112nr— i il r'l - -V.
I
I 111E1=111M
111MILLINLIbLATI MI -1M
111,011.__AIi-
DA ■ 11.■ A 1 2000 GPM PUMP
1 6 GA. VANE ADJUSTER-, (SUPPLEMENTAL)
4e _
II! FLOW ',,,,
_...., Ins.•
___-..mWeallillide
6" 1500 GPM PUMP COLLECTION BAY DETAIL
PAINT- I COAT MARINE PRIMER 2 COATS MARINE WHITE
I" CHANNEL
*\ C+ E 51 0.c. \
TOP VANE GUIDE OPEN AT BOTTOM INLET PIPE DETAIL
3.; MARINE PLYWOOD
TACK WELD I; ROD TO 16 GA. It. SECTIONAL VIEW
1 6 GA. EXPANDED METAL SCREEN
NOTE: DRILL 5
16" HOLES IN
BOTTOM OF FLUME FOR VANE GUIDES.
5"
DEFLECTOR VANE DETAIL
I V DRAIN ROCK PLACED IN FORWARD BAFFLE CHAMBER
4" SPACINGS
FLUME BAFFLE DETAIL
FIGURE 29. Structural details of velocity barrier test flume.

56 DEPARTMENT OF FISH AND GAME
In August, 1952, a larger test flume was constructed to further develop and to increase the scope of the velocity barrier experiments. Barriers of angle-shaped vanes, pipe sections, and compressed air were all tried with encouraging results.
The angle vanes were rigged to an adjustable frame, so that the deflec-tion angle of the barrier across the channel could be varied. Also, the angle vanes were pivoted so that the angle of incidence to the stream flow could be altered for different tests. Deflection angles from 27° to 45° and vane angles from 6° to 33° were tested. Vane width equaled the vane spacing interval. Velocities from 1.15 ft./sec. to 2.0 ft./sec. were tried.
Altogether, 16 vane experiments were made, using from 50 to 100 fish in each one. Bass and steelhead ranging from 0.63 to 3.66 inches in length were used. Recovery of 92 percent resulted with a 30° deflection angle, a 10° vane angle and a velocity of 1.85 ft./sec. See Figure 29 for barrier arrangement.
Four experiments were conducted with the pipe barrier made of 1-inch OD pipe spaced inch apart on a deflection angle of 30°. In each of these experiments 30 bass of about 1.38 inches in length were used. Aver-age recovery of 93 percent resulted, with a velocity of 1.85 ft./sec.
The compressed air barrier was created by a 1-inch pipe drilled with 0.034-inch holes on 1-inch centers laid at a 30° deflection angle in the bottom of the flume and connected to the local compressed air supply. Only preliminary, nonquantitative experiments were carried on with this device, but results were comparable with those in the other experi-ments.
All velocity barrier experiments were on a laboratory scale and the results are far from being conclusive. It appears, however, that the veloc- ity barrier method of controlling fish movement offers great possibilities in large water diversions. In providing such a barrier it is of equal im-portance to provide an easy and acceptable bypass channel for fish.
The use of the velocity barrier method is only applicable to the diver-sion of a part of the total stream flow. Sufficient water must be bypassed to handle adequately the fish population involved and it does have limita- tions in this respect. A considerable loss of head by the creation of a velocity barrier is another disadvantage of this method where head loss is critical. Also, it is presupposed that the fish being controlled are capable of self-propulsion. It has no value in preserving fish life in the egg and larval stage.
14. SUMMARY OF THE RESEARCH PROJECT
The fish research program at Contra Costa was the consequence of the serious fish problem that developed there after the plant began operating in June, 1951. The program covered a period of 17 months and was con-cluded in October, 1952.
The primary objective was to discover bow to save fish present in the water used for condenser cooling at the Contra Costa Steam Plant. A second objective was to obtain basic information needed to protect fish at future installations using large quantities of water.
The research program was conceived as a realistic and a practical ap-proach to the problem and the data gathered were applied in the same way to the solution. Every attempt was made to learn the facts, regard-less of established belief or wish.
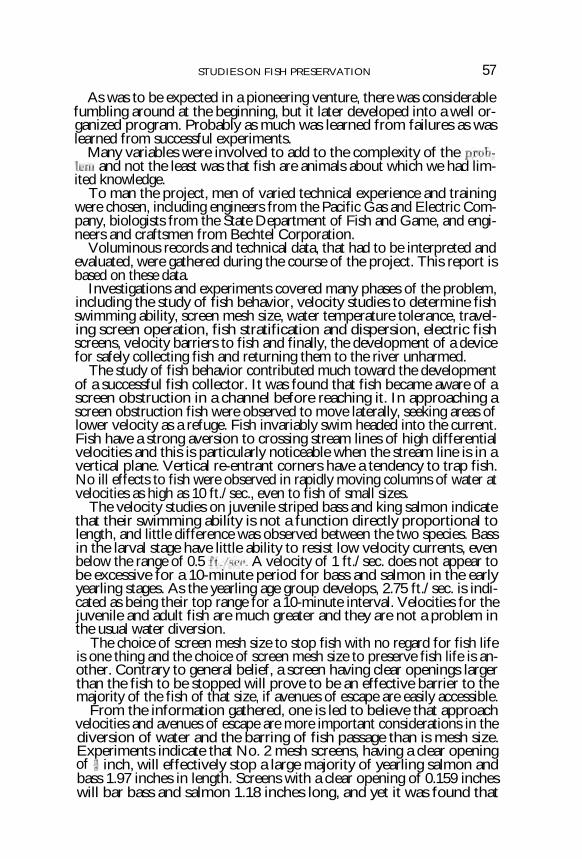
STUDIES ON FISH PRESERVATION 57
As was to be expected in a pioneering venture, there was considerable fumbling around at the beginning, but it later developed into a well or-ganized program. Probably as much was learned from failures as was learned from successful experiments.
Many variables were involved to add to the complexity of the prob-lem and not the least was that fish are animals about which we had lim-ited knowledge.
To man the project, men of varied technical experience and training were chosen, including engineers from the Pacific Gas and Electric Com-pany, biologists from the State Department of Fish and Game, and engi-neers and craftsmen from Bechtel Corporation.
Voluminous records and technical data, that had to be interpreted and evaluated, were gathered during the course of the project. This report is based on these data.
Investigations and experiments covered many phases of the problem, including the study of fish behavior, velocity studies to determine fish swimming ability, screen mesh size, water temperature tolerance, travel-ing screen operation, fish stratification and dispersion, electric fish screens, velocity barriers to fish and finally, the development of a device for safely collecting fish and returning them to the river unharmed.
The study of fish behavior contributed much toward the development of a successful fish collector. It was found that fish became aware of a screen obstruction in a channel before reaching it. In approaching a screen obstruction fish were observed to move laterally, seeking areas of lower velocity as a refuge. Fish invariably swim headed into the current. Fish have a strong aversion to crossing stream lines of high differential velocities and this is particularly noticeable when the stream line is in a vertical plane. Vertical re-entrant corners have a tendency to trap fish. No ill effects to fish were observed in rapidly moving columns of water at velocities as high as 10 ft./sec., even to fish of small sizes.
The velocity studies on juvenile striped bass and king salmon indicate that their swimming ability is not a function directly proportional to length, and little difference was observed between the two species. Bass in the larval stage have little ability to resist low velocity currents, even below the range of 0.5 ft./sec. A velocity of 1 ft./sec. does not appear to be excessive for a 10-minute period for bass and salmon in the early yearling stages. As the yearling age group develops, 2.75 ft./sec. is indi-cated as being their top range for a 10-minute interval. Velocities for the juvenile and adult fish are much greater and they are not a problem in the usual water diversion.
The choice of screen mesh size to stop fish with no regard for fish life is one thing and the choice of screen mesh size to preserve fish life is an-other. Contrary to general belief, a screen having clear openings larger than the fish to be stopped will prove to be an effective barrier to the majority of the fish of that size, if avenues of escape are easily accessible.
From the information gathered, one is led to believe that approach velocities and avenues of escape are more important considerations in the diversion of water and the barring of fish passage than is mesh size. Experiments indicate that No. 2 mesh screens, having a clear opening of f inch, will effectively stop a large majority of yearling salmon and bass 1.97 inches in length. Screens with a clear opening of 0.159 inches will bar bass and salmon 1.18 inches long, and yet it was found that

58 DEPARTMENT OF FISH AND GAME
substantial numbers of fish smaller than 1.18 inches are recovered by the collector in front of a i-inch clear opening screen. The survival of larval and small yearling bass from impingement on screens, even for a short period of time, is extremely low and the contrary was found to be true of yearling salmon.
Yearling bass and salmon subjected to sudden water temperature rises were found able to withstand a higher differential range than was originally believed. Yearling bass can withstand a temperature rise of 16° F. and a maximum temperature tolerance of about 90° F. with a survival of approximately 90 percent. Yearling salmon can survive a temperature rise of 25° F. without loss of life, and their maximum temperature tolerance is about 83° F.
Little difference in effect on fish life was noticed between continuous and intermittent screen operation.
The dispersion or stratification of bass eggs, larvae, and small yearlings in the river strata appears to be uniform insofar as fish preference is concerned, but is variable under changing tidal conditions and river turbulence. The results confirm the general belief that bass eggs, larvae, and small yearlings have little ability at self-propulsion and are free-floating and at the mercy of the water currents.
Experiments with electric fish screens for diverting fish from the water intake at the plant were not conclusive and were abandoned as not being easily adaptable to variable conditions at Contra Costa.
Probably the most outstanding single accomplishment of the program was the fish collector. The development of a successful collector for safely returning entrapped fish to the river was the composite result of all ex-periments and things learned from the research program. Each collector is capable of safely handling hundreds of fish per hour in sizes from the smallest to 14 inches in length with a survival of 98 percent or more. By providing collectors in front of each traveling screen, fish recovery by the screens is reduced to less than 1 percent of the total fish recovered. In considering the economics of the problem, the cost of providing fish collectors for the traveling screens is relatively low and it is not expected that operating and maintenance costs will be high.
The velocity barrier investigation was not directly applicable to the problem at Contra Costa except as it enlarged our knowledge of fish be-havior and answered questions of why fish had a preference for one area over another and would avoid collection devices tried earlier in the pro-gram. The investigation does suggest great possibilities in the control of fish movement at water diversions and is particularly applicable to places where water is consumed. Again differentiating between the words "water consumed" and "water used ", it becomes highly important in a fish preservation program to bar all fish from diversions consuming water and it is believed that the velocity barrier method may be a solution.

PART V
APPLICATION OF RESEARCH DATA 1. PROVISIONS FOR FISH PRESERVATION AT CONTRA COSTA
For hydrographic reasons and on the basis of other engineering con-siderations the screen structure at the Contra Costa Steam Plant was lo-cated 410 feet from the point of cooling water diversion. It became evi-dent after the plant began operating that small fish once in the screen structure were incapable of returning to the river, resulting in a contin-ual build-up of the fish population and a high mortality at the traveling screens.
The problem was twofold : (1) to depopulate the screen structure of fish barred from passing through the plant by the traveling screens, re-turning them to the river unharmed ; and (2) to determine if fish passing the traveling screens could survive a trip through the plant.
The twofold objective was accomplished by providing fish collectors in front of each traveling screen and by demonstrating that fish that pass through the screens can pass through the plant and withstand the tem-perature rise of the condenser cooling water without seriously affecting them.
From test data gathered it was found that the fish collectors will de-populate the screen structure and that the survival of fish passing through the collectors is 98 percent or more.
From operating condenser tests and laboratory experiments it was demonstrated that small striped bass and king salmon can safely pass through the condensers under maximum load conditions and that fish survival is 95 percent or greater. Maximum plant loads do not normally occur during the season when small bass and salmon pass through the plant, further improving the fish survival rate. Tables 3 and 4 give actual temperature differences between river and discharged water for July and August, 1952. These temperature differences are considered typical.
Bechtel Drawing 406371-1 is a composite drawing showing the cooling water system of the five-unit plant. Drawings 406385-0 and 404390-2 are structural drawings of the fish collectors and piping system for returning fish to the river from the screen structure. See Figures 33, 34 and 35.
A hypothetical evaluation was made of the effect the Contra Costa Plant will have on the adult bass population of the Delta. It was based on results of the research program and from data contained in two Depart-ment of Fish and Game publications.
The reference publications were the "Striped Bass Fishing Map" (Calhoun, 1952) and the "Distribution of striped bass fry in relation to major water diversions" (Calhoun, 1953).
The total number of adult bass in the Delta is unknown. However, from the second reference 35,000,000 fingerling bass, approximately one inch long, were estimated to be in the Delta area during mid-July of 1951.
( 59 )

FIGURE 30. Shows screen structure and five traveling screens in the foreground and water intake structure in the river. Building at the right houses cooling water pumps for Units 4 and 5. Tide at time of picture at approximately elevation —2.0 feet. Photograph by Don Krogh,
P. G. & E. News Bureau, March, 1953.
Also, from the same source, Table 4 gives estimates of the number of bass fry to be found per 1,000 cu. ft. of water for the different regions of the area.
It is inferred in the "Striped Bass Fishing Map" that the bass popula-tion appears to be in equilibrium, that is, that the adult population is presently remaining constant even though 1,500,000 are caught annually by sportsmen.
Assuming the 35,000,000 fingerlings are an annual representative average, it then follows that this is the number of fish needed annually to maintain population equilibrium, compensating for the sportsmen 's catch and normal mortality. On this basis, the normal mortality due to natural causes between the fingerling and adult stages is 95 percent.
The number of bass fry involved by the 868 cu. ft./sec. of water "use" at Contra Costa was calculated to be 3,476,000 from bass distribution figures in Table 4 of the second reference.1 This is a maximum figure, based on the assumption that all fish present in the water drawn in will enter the plant. It is estimated that 79 percent of the time the fish passing through the plant will be subjected to a temperature of 10° F. or less. Survival of 100 percent is anticipated for these fish. The remainder of the period when bass are small enough to pass the screens they will be subjected to a temperature rise of from 10
0 to 16° F. A 6 percent loss is
1 868 Cu. ft./sec. X 3,888,000 seconds (45 days) X 0.00103 bass fry = 3,476,000.

CO
OLIN
G W
AT
ER
TE
MP
ER
AT
UR
E D
IFFER
EN
TIA
L P
LA
NT
OP
ER
AT
ION
FO
R J
UL
Y, 1
95
2
(•A
sa
aa
6a
a)
oo
00
River Water Temperature Max. 73° MM. 68° Discharge Water Temperature Max. 87° Min. 70°
WWNWNWNWNNnoN . 1-, CC00.4 00 00 14 WN0=00-4WWIA0000. 00,000-4 00 WW.W 02
WWWWW WWWNONWNWWWWNWWWWWWW.WW
pP.. 4 0303030300000030200030302 00 030303030203030003 W
4t.. 4 030303030300. 00030203030303000 030303040300030203
FP W4s-4W WWWWN.NWNWWWWWWWWWNWWWWW
&W&&WWWWWWW&WWNWWWWWWWWWNWWWWW
lAW4,WWWWWWWNWNWNWWWWWWWWWNWWWWW
4> 03 Mplt..0303000300 03000300 03 00 03 W03W 002 W002 0000 W03WW
14 W&WW&WWWW&WWW,PWW&WWWWWWNWWwWW
00.400IA0000 00 O.WIA.4 03 00.4 W 002033 P.00032 0303 03030200
00 00 = 00 o0. 0000=-40000...4005-4= 0. 00300WWW W w030030.02 0.02 W
.....
0000 0. c..-0 0 0 3-. 0 00 -4 00000003 w w -4-4=-4 0303 w 0.03 033
3- 0000003 .4.- 0000 ,—,, .00-4-14: 0000 -4-4m00 0303030000
.0.04, 14.1 0P-4.,100W,PWW, 0000=-4WWWWW
o-, ....14WNI-L .<000■-, M-4WW&WCWW-4.,I WIAWW14
000p0.,0.000-0 3- 3-00000000-40000,0.0000 00 00-40002&0.0300033
..... 00 0.00300 .00 3- 00 0 0000000 FI, 0000400 -4 -40030.030003
..... 0000 03 00 .00 0--. 00000000O000034,W 0000000203
.
▪
00= 002 ri.. .O 000000 OC=00-400 00 & 00 -4 1.4 0000000200
00 O00O0.WJ-.000.4000.=00..400000.005=0.A.4000200000003 00
--I pool-, W14 0O 0W W•4 0., WM-4WW&W WWWWNW -4
-400000 000. -4 00.00002IP 0000 02 03 03020-, 033
8-4000W4, 0000 100p
▪
0300-400 00 0000 -4.0.02 02 02.03
-4 w, w8cs'nl 000002020000 8 0.03 -4 00000. m 0.03 00000.03 -4020000030 033
003 00200.00 000003000003 8e0032 ,p. 0000330.030000000.030003003-03
NOLLVAIlaSa71c1 FISM NO Salt:MIS 19
P
.4 no E
-4
oo
■-•
Z - 0 O
00
CO
01
CO
00
C4
co
00
03.

TABLE 4
COOLING WATER TEMPERATURE DIFFERENTIAL (Degrees F.)
PLANT OPERATION FOR AUGUST, 1952
Mid. Time
Noon Date 12 1 2 3 4 5 6 7 8 9 10 11 12 1 2 3 4 5 6 7 8 9 10 11
August 1 3 4 4 4 4 4 4 4 8 11 11 10 11 11 10 10 11 11 10 8 7 10 11 8 2 4 3 3 3 3 3 3 3 3 6 11 10 12 12 12 12 12 12 12 10 10 10 7 7 3 8 6 5 3 3 3 4 4 3 3 4 4 5 4 3 3 3 3 4 4 4 4 4 2 4 3 3 2 3 3 3 3 3 6 10 10 11 11 11 11 10 10 10 10 10 11 11 8 4 5 3 3 3 3 3 3 3 3 7 9 10 11 11 12 12 11 11 10 10 10 10 10 8 4 6 4 4 3 3 2 2 2 2 8 10 10 10 11 11 11 11 11 11 10 10 10 10 8 4
I t 7 4 4 4 3 3 2 2 3 6 9 10 10 10 11 11 11 11 10 10 10 10 10 9 4
a n 8 4 4 5 5 4 4 4 4 6 8 8 8 9 9 10 11 10 10 9 9 8 9 8 6 9
0, 10 6 5 5 6 6 6 6 5 5 6 8 8 5 4 1 2 2 2 3 3 2 3 6 7 7 7 6 4 6 6 6 6 6 5 5 5 6 3 4 5 3 3 5 6 6 5 5 3
fr.; 06 11 3 3 3 2 2 2 3 3 6 8 9 8 8 9 8 8 8 9 9 9 9 10 4 3 A A 12 2 2 2 2 2 2 2 2 7 8 9 9 8 8 8 10 9 9 9 10 9 9 4 3 4 13 2 3 2 5 5 5 5 5 8 9 8 8 8 8 6 8 9 8 9 7 9 10 9 9
14 9 9 10 9 9 9 9 9 9 9 9 9 9 8 8 9 8 9 9 9 9 9 7 7 `g 15 4 3 3 3 3 2 2 2 10 10 10 10 9 8 7 9 9 10 10 9 9 8 7 5
ra re 16 7 11 13 10 9 9 8 9 9 6 6 5 6 6 6 8 8 10 10 10 10 10 8 7 G 17 7 7 8 8 7 7 7 7 6 5 4 2 2 3 2 2 3 3 3 3 3 4 4 4 g g 18 3 2 2 3 3 3 2 3 5 10 10 10 10 10 10 11 10 11 10 11 10 11 7 6
g 19 6 5 6 5 4 3 3 3 6 8 9 10 10 10 10 10 10 11 10 10 10 10 9 4 L. L. 20 4 6 6 6 7 4 4 4 8 9 10 10 10 10 10 10 10 10 10 11 10 10 6 6
21 4 5 5 4 5 4 4 4 22 23
e. 24 .p.4.,1 25
Recorders Damaged and Out of Service due to Construction Accident
.§ 26 A 27
28 29 10 10 10 10 11 12 10 10 10 10 9 9 10 7 7 7 30 10 9 9 9 10 10 10 9 9 7 7 7 9 10 9 9 10 10 10 11 11 11 11 10 31 11 10 10 6 6 6 4 4 4 4 3 3 3 4 4 4 4 4 4 4 4 4 4 4
Sept. 1 4 4 4 4 4 4 4 4 4 4 4 4 3 4 4 4 4 4 4 5 5 4 5 7 2 7 6 6 7 8 8 8 8 9 11 11 11 11 11 10 10 11 11 11 12 12 12 12 8
12 1 2 3 4 5 6 7 8 9 10 11 12 1 2 3 4 5 6 7 8 9 10 11 Mid, Noon

FIGURE 31. Shows the layout and location of the two eight-inch vertical and one five-inch horizontal fish pumps, together with allied piping. Each vertical pump is connected in parallel to two collectors and is in operation. The horizontal pump is connected to a single collector and will be in service when Screen 5 starts operating this summer. Photograph by Don Krogh,
P. G. & E. News Bureau, March, 1953.
anticipated under these conditions, on the basis of the experiments de-scribed earlier, amounting to 43,800 fish.2
Only about 5 percent, or 2,200, of these fry could have been expected to survive long enough to enter the fishery, as discussed above.
The period of 45 days was used in the foregoing analysis on the basis that the abundance of bass larvae and fry capable of passing through the screens builds up from zero to maximum and back to zero in the course of about 90 days.
Turning now to the losses after the bass are large enough for the screens to stop, it is believed 98 percent of these fish will be picked up by the collectors and returned alive to the river. The estimated annual col-lector recovery at Contra Costa is 560,000 juvenile striped bass. This is based on a complete count there over an 11-month period. Two percent amounts to 11,200 juveniles. Five percent survival of these represents 560 adults. Addition of the 2,200 from the fish passing the screens brings the estimated total annual loss to the fishery to 2,760. This, in turn, represents 0.18 percent of the estimated annual bass take of about 1,500,-000 fish.
The conclusion then, is that the Contra Costa Plant will not signifi-cantly affect the striped bass population of the Delta. 2 0.06 X 0.21 X 3,476,000 = 43,800.
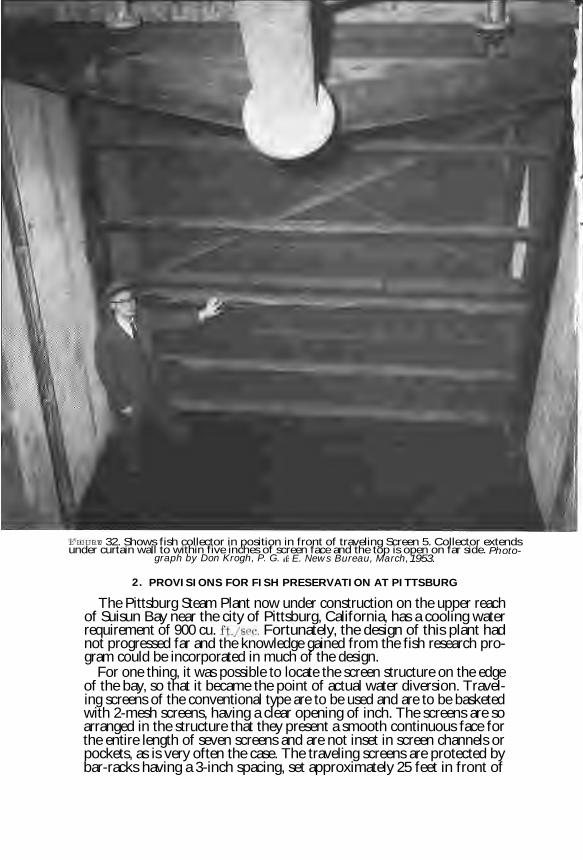
FIGURE 32. Shows fish collector in position in front of traveling Screen 5. Collector extends under curtain wall to within five inches of screen face and the top is open on far side. Photo-
graph by Don Krogh, P. G. te E. News Bureau, March, 1953.
2. PROVISIONS FOR FISH PRESERVATION AT PITTSBURG
The Pittsburg Steam Plant now under construction on the upper reach of Suisun Bay near the city of Pittsburg, California, has a cooling water requirement of 900 cu. ft./see. Fortunately, the design of this plant had not progressed far and the knowledge gained from the fish research pro-gram could be incorporated in much of the design.
For one thing, it was possible to locate the screen structure on the edge of the bay, so that it became the point of actual water diversion. Travel-ing screens of the conventional type are to be used and are to be basketed with 2-mesh screens, having a clear opening of inch. The screens are so arranged in the structure that they present a smooth continuous face for the entire length of seven screens and are not inset in screen channels or pockets, as is very often the case. The traveling screens are protected by bar-racks having a 3-inch spacing, set approximately 25 feet in front of

STUDIES ON FISH PRESERVATION 65
the traveling screens. These are designed to handle heavy floating debris that might otherwise damage the traveling screens. The forebay in front of the traveling screens is so designed that fish have free movement and are not restricted from moving laterally out the sides or back out the front of the screen structure. Also, by this open type of construction, tidal currents moving up and down the bay have a clear sweep across the screens. Re-entrant corners have been eliminated and everything possible has been done to assure a uniform flow pattern in the forebay. Velocities in this area are less than 0.5 ft./sec.
The approach channel to the screen structure has been dredged out for a wide area between the shore and the ship channel of the bay. Every effort has been made to provide free movement for fish away from the water intake area and to avoid conditions that might constitute a trap. Maximum screen approach velocities average well below 1.5 ft./sec. for extreme tidal conditions and areas of turbulence have been eliminated insofar as possible.
Fish collectors are not provided in this installation, for it is believed that the design of the screen structure will not require them. Ample avenues of escape are provided and no hazardous entrapment conditions exist.
As demonstrated at Contra Costa, fish life with little or no ability at self-propulsion will be allowed to pass through the plant. The maximum temperature rise of the cooling water under full load conditions is 15.6° F. and as was proven at Contra Costa, survival for a temperature rise of this magnitude is high.
In designing the cooling water system consideration was given to safe fish passage through the plant and care was taken to eliminate areas of high turbulence and abrupt changes in velocities. The downcomers from the condensers have been streamlined so that the discharging water will move as a column and the individual condenser lines discharging into a common duct likewise have been streamlined to avoid turbulence and abrupt velocity changes. Maximum velocities through the system are an-proximately 8 ft./sec. The time of fish passage through the plant is esti-mated to be in the range of five minutes, which is about one-half the time used in the experimental work at Contra Costa.
Fish survival is expected to equal or exceed that prevailing at Con-tra Costa.
Bechtel Drawing No. 410862-1 (Figure 36) is a complete layout of the cooling water system for the Pittsburg Steam Plant for the Pacific Gas and Electric Company.
REFERENCES Calhoun, A. J.
1952. Striped bass fishing map. Calif. Dept. Fish and Game. 1953. Distribution of striped bass fry in relation to major water diversions. Calif.
Fish and Game, vol. 39, no. 3, p. 279-299. Calhoun, A. J., and C. A. Woodhull
1948. Progress report on studies of striped bass reproduction in relation to the Cen- tral Valley Project. Calif. Fish and Game, vol. 34, no. 4, p. 171-188.
Collins, Gerald B. 1952. Factors influencing the orientation of migrating anadromous fishes. U. S.
Fish and Wildl. Serv., Fish. Bull. vol. 52, no. 73, p. 373-396.

66 DEPARTMENT OF FISH AND GAME
Doudoroff, Peter 1942. The resistance and acclimatization of marine fishes to temperature changes.
I. Experiments with Girella nigricans (Ayres ). Biol. Bull., vol. 83, no. 2, p. 219-244.
1945. The resistance and acclimatization of marine fishes to temperature changes. II. Experiments with F undulus and Atherinops. Biol. Bull., vol. 88, no. 2, p. 194-206.
Erkkila, Leo F., J. W. Moffett, O. B. Cope, B. R. Smith, and R. S. Nielson 1950. Sacramento-San Joaquin Delta fishery resources : Effects of Tracy Pumping
Plant and Delta Cross Channel. U. S. Fish and Wildl. Serv., Spec. Sci. Rept. : Fish. no. 56, 109 p.
Holmes, Harlan B. 1948. History, development, and problems of electric fish screens. U. S. Fish and
Wildl. Serv., Spec. Sci. Rept., no. 53, 62 p. Leitritz, Earl
1952. Stopping them : the development of fish screens in California. Calif. Fish and Game, vol. 38, no. 1, p. 53-62.
Wales, J. H. 1945. A new fish screen for hatchery use. Calif. Fish and Game, vol. 31, no. 3, p.
157-159. 1948. California's fish screen program. Calif. Fish and Game, vol. 34, no. 2, p. 45-51.
Wales, J. H., E. W. Murphey, and John Handley 1950. Perforated plate fish screens. Calif. Fish and Game, vol. 36, no. 4, p. 392-403.

DEPARTMENT OF FISH AND GAME OF CALIFORNIA
FISH BULLETINS
* No. 1. Report on Fish Conditions. 1913; 48 pp., 3 figs. * No. 2. The Scientific Investigation of Marine Fisheries, as Related to the Work
of the Fish and Game Commission in Southern California. By Will F. Thompson. 1919; 27 pp., 4 figs.
* No. 3. The Spawning of the Grunion (Leuresthes tenuis). By Will F. Thomp-son, assisted by Julia Bell Thompson. 1919; 29 pp., 9 figs.
* No. 4. The Edible Clams, Mussels and Scallops of California. By Frank W. Weymouth. 1920; 72 pp., 19 pls., 26 figs.
* No. 5. A Key to the Families of Marine Fishes of the West Coast. By Edwin C. Starks. 1921; 16 pp., 4 figs.
* No. 6. A History of California Shore Whaling. By Edwin C. Starks. 1923; 38 pp., 22 figs.
* No. 7. The Life-History and Growth of the Pismo Clam. By Frank W. Wey-mouth. 1923; 120 pp., 15 figs., 18 graphs.
* No. 8. Racial and Seasonal Variation in the Pacific Herring, California Sardine and California Anchovy. By Carl L. HUBBS. 1925; 23 pp., 4 pls.
* No. 9. Preliminary Investigation of the Purse Seine Industry of Southern Cali-fornia. By TAGE SKOGSBERG. 1925; 95 pp., 23 figs.
* No. 10. The Life History of Leuresthes tennis, an ATHERINE Fish with Tide Con-trolled Spawning Habits. By Frances N. Clark. 1925; 51 pp., 6 graphs, 7 pls.
* No. 11. The California Sardine. By the Staff of the California State Fisheries Laboratory. 1926; 221 pp., 74 figs.
* No. 12. The Weight-Length Relationship of the California Sardine (Sardine caerulea) at San Pedro. By Frances N. Clark. 1928; 58 pp., 11 figs.
* No. 13. The Seasonal Average Length Trends at Monterey of the California Sardine (Sardine caerulee). By Carroll B. Andrews. 1928; 12 pp., 6 figs.
* No. 14. Report on the Seals and Sea Lions of California. By Paul BONNOT. 1928; 61 pp., 38 figs.
* No. 15. The Commercial Fish Catch of California for the Years 1926 and 1927. By the Bureau of Commercial Fisheries. 1929; 93 pp., 52 figs.
* No. 16. The Life History of the California Jack Smelt ( Atherinopsis californi-ensis). By Frances N. Clark. 1929; 22 pp., 12 figs.
* No. 17. Sacramento-San Joaquin Salmon (Oncorhynchus tschawytscha) Fishery of California. By G. H. Clark. 1929; 73 pp., 32 figs.
* No. 18. The Pismo Clam : Further Studies of Its Life History and Depletion. By William C. Herrington. 1930; 67 pp., 16 figs.
* No. 19. Sardine Fishing Methods at Monterey, California. By W. L. Scofield. 1929; 61 pp., 27 figs.
* No. 20. The Commercial Fish Catch of California for the Year 1928. By the Staff of the Bureau of Commercial Fisheries. 1930; 109 pp., 62 figs.
* No. 21. Analysis of Boat Catches of White Sea Bass ( Cynoscion nobilis) at San Pedro, California. By S. S. Whitehead. 1930; 26 pp., 20 figs.
* No. 22. A Bibliography of the Tunas. By Genevieve Corwin. 1930; 103 pp. * No. 23. Success of the Purse Seine Boat in the Sardine Fishery at Monterey,
California (1929-1930 Fishing Season). By J. B. Phillips. 1930; 28 pp., 19 figs.
* No. 24. An Analysis of the Catch Statistics of the Striped Bass ( Roccus LINEATUS) Fishery of California. By J. A. Craig. 1930; 41 pp., 22 figs.
• Out of Print

* No. 25. Fishing Areas Along the California Coast for the Sardine (Sardina caerulea). By the California State Fisheries Laboratory. 1930; 44 pp., 25 figs.
* No. 26. Seasonal Changes in the Daily Average Length of the California Sardine, Sardina caerulea. By Frances N. Clark. 1930; 20 pp., 11 figs.
* No. 27. The Ring Net, Half Ring Net, or Purse Lampara in the Fisheries of Cali-fornia. By Donald H. Fry, Jr. 131; 65 pp., 28 figs.
* No. 28. Handbook of Common Commercial and Game Fishes of California. By Lionel A. Walford. 1931; 181 pp., 137 figs.
* No. 29. The Striped Bass of California ( Roccus lineatus). By Eugene C. Sco-field. 1931; 82 pp., 47 figs.
* No. 30. The Commercial Fish Catch of California for the Year 1929. By the Staff of the Bureau of Commercial Fisheries. 1931; 133 pp., 75 figs.
* No. 31. Studies of the Length Frequencies of the California Sardine (Sardina caerulea). By the California State Fisheries Laboratory. 1931; 53 pp., 24 figs.
* No. 32. The California Halibut ( Paralichthys californicus) and an Analysis of the Boat Catches. By G. H. Clark. 1931; 52 pp., 25 figs.
* No. 33. Fishing Methods for the Bluefin Tuna ( Thunnus thynnus) and an Analysis of the Catches. By S. S. Whitehead. 1931; 32 pp., 22 figs.
* No. 34. Salmon of the Klamath River, California. By John 0. Snyder. 1931; 130 pp., 44 figs.
* No. 35. A Distributional List of the Species of Freshwater Fishes Known to Occur in California. By Barton W. Evermann and Howard Walton Clark. 1931; 67 pp.
* No. 36. A Bibliography of the Sardines. By Genevieve C. Wheeler. 1931; 133 pp. * No. 37. The California Barracuda ( Sphyraena argentea). By Lionel A. Walford.
1932; 120 pp., 32 figs., 6 pls. * No. 38. The California Shrimp Industry. By Paul Bonnet. 1932; 20 pp., 11 figs. * No. 39. Fluctuations in the Abundance of Striped Bass ( Roccus lineatus) in
California. By G. H. Clark. 1933; 18 pp., 7 figs. * No. 40. The California Mackerel Fishery. By Richard S. Croker. 1933; 149 pp.,
73 figs. * No. 41. Early Life History of the California Sardine (Sardina caerulea), with
Special Reference to Distribution of Eggs and Larvae. By Eugene C. Scofield. 1934; 48 pp., 24 figs.
No. 42. Maturity of the California Sardine (Sardina caerulea), determined by Ova Diameter Measurements. By Frances N. Clark. 1934; 49 pp., 19 figs.
No. 43. The Sizes of California Sardines Caught by the Different Fishing Gear and in the Different Localities of the Monterey and San Pedro Regions. By the California State Fisheries Laboratory. 1935; 59 pp., 27 figs.
* No. 44. The Commercial Fish Catch of California for the Years 1930-1934, Inclu-sive. By the Staff of the Bureau of Commercial Fisheries. 1935; 124 pp., 19 figs.
* No. 45. The Sharks and Rays of California. By Lionel A. Walford. 1935; 66 pp., 58 figs.
* No. 46. A Contribution Toward the Life Histories of Two California Shrimps, Crago franciscorum ( Stimpson) and Crago nigricauda (Stimpson). By Hugh R. Israel. 1936; 28 pp., 9 figs.
No. 47. Interseasonal and Intraseasonal Changes in Size of the California Sardine ( Sardinops caerulea). By Frances N. Clark. 1936; 28 pp., 11 figs.
No. 48. Fishing Localities for the California Sardine, Sardinops caerulea, 1928-1936. By Frances N. Clark. 1937; 11 pp., 5 figs.
* No. 49. The Commercial Fish Catch of California for the Year 1935. By the Bureau of Commercial Fisheries. 1937; 170 pp., 114 figs.
No. 50. Sizes of California Sardines Caught in the Different Areas of the Monterey and San Pedro Regions. By J. B. Phillips. 1937; 31 pp., 12 figs.
• Out of Print.

* No. 51. The High Seas Tuna Fishery of California. By H. C. GODSIL. 1938; 41 pp., 20 figs.
* No. 52. Historical Account of the Los Angeles Mackerel Fishery. By Richard S. CROKER. 1938; 62 pp., 37 figs.
No. 53. Measures of Abundance of the Sardine, Sardinops caerulea, in California Waters. By Frances N. Clark. 1939; 45 pp., 19 figs.
No. 54. The Fishes of the Family SCIAENIDAE (Croakers) of California. By TAGE SKOGSBERG. 1939; 62 pp., 16 figs.
No. 55. Report on Returns of Drift Bottles Released Off Southern California, 1937. By Richard B. TIBBY. 1939; 36 pp., 22 figs.
* No. 56. Development of the Eggs and Early Larvae of Six California Fishes. By Paul L. Budd. 1940; 50 pp., 13 pls.
No. 57. The Commercial Fish Catch of California for the Years 1936-1939, Inclu-sive. By the Staff of the Bureau of Marine Fisheries. 1940; 100 pp., 9 figs.
No. 58. The Commercial Fish Catch of California for the Year 1940. By the Staff of the Bureau of Marine Fisheries. 1942; 47 pp., 7 figs.
No. 59. The Commercial Fish Catch of California for the Years 1941 and 1942. By the Staff of the Bureau of Marine Fisheries. 1944; 68 pp., 8 figs.
* No. 60. A Systematic Study of the Pacific Tunas. By H. C. GODSIL and Robert D. Byers. 1944; 131 pp., 76 figs.
* No. 61. Results of Tagging Experiments in California Waters on the Sardine (Sardinops caerulea). 1945; 90 pp., 15 figs.
* No. 62. Catch per-Unit-of-Effort in California Waters of the Sardine ( Sardinops caerulea) 1932-42. By Ralph P. SILLIMAN and Frances N. Clark. 1945; 76 pp., 22 figs.
No. 63. The Commercial Fish Catch of California for the Years 1943 and 1944. By the Staff of the Bureau of Marine Fisheries. 1946; 81 pp., 6 figs.
* No. 64. The Biology of the Soupfin, Galeorhinus zyopterus,ancl Biochemical Studies of the Liver. 1946; 93 pp., 41 figs.
No. 65. Analysis of Populations of the Pacific Sardine on the Basis of Vertebral Counts. By Frances N. Clark. 1947; 26 pp., 3 figs.
No. 66. Drift and Set Line Fishing Gear in California. By W. L. Scofield. 1947; 38 pp., 16 figs.
No. 67. The Commercial Fish Catch of California for the Years 1945 and 1946. By the Staff of the Bureau of Marine Fisheries. 1947; 80 pp., 7 figs.
* No. 68. Common Marine Fishes of California. By Phil M. ROEDEL. 1948; 150 pp., 111 figs.
* No. 69. Age and Length Composition of the Sardine Catch off the Pacific Coast of the United States and Canada, 1941-42 through 1946-47. By Frances E. FELIN and Julius B. Phillips. 1948; 122 pp.
* No. 70. A Preliminary Population Study of the YELLOWFIN Tuna and the Albacore. By H. C. GODSIL. 1948; 90 pp., 22 figs.
* No. 71. Growth of the Sardine, Sardinops eaerulea, 1941-42 through 1946-47. By Julius B. Phillips. 1948; 33 pp., 12 figs.
No. 72. Trawling Gear in California. By W. L. Scofield. 1948; 60 pp., 24 figs. * No. 73. Tagging Experiments on the Pacific Mackerel ( Pneumatophorus diego).
By Donald H. Fry, Jr. and Phil M. ROEDEL. 1949; 64 pp., 15 figs. No. 74. The Commercial Fish Catch of California for the Year 1947 With an
Historical Review, 1916-1947. By the Staff of the Bureau of Marine Fisheries. 1949; 267 pp., 99 figs.
No. 75. California Sharks and Rays. By Phil M. ROEDEL and Wm. Ellis Ripley. 1950; 88 pp., 65 figs.
No. 76. Average Lunar Month Catch by California Sardine Fishermen, 1932-33 through 1948-49. By Frances N. Clark and Anita E. Daugherty. 1950; 28 pp., 6 figs.
* Out of Print.
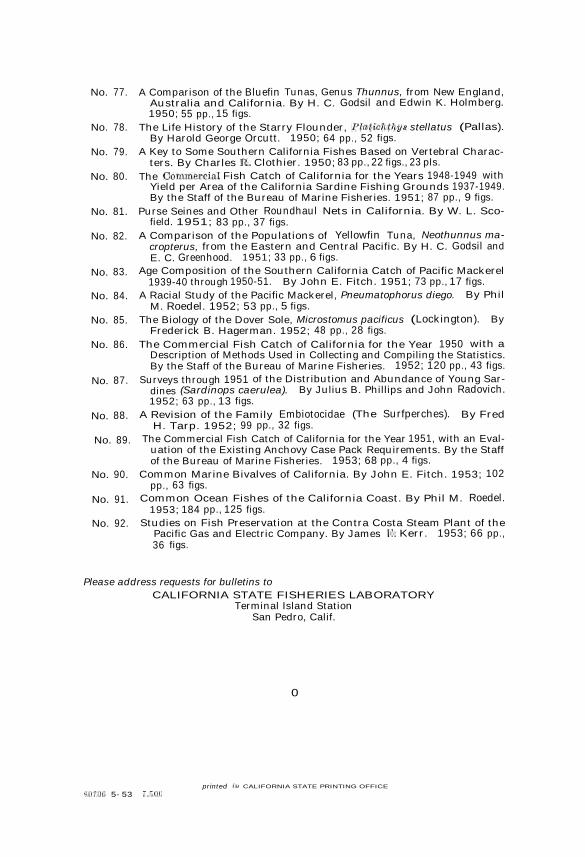
No. 77. A Comparison of the Bluefin Tunas, Genus Thunnus, from New England, Australia and California. By H. C. Godsil and Edwin K. Holmberg. 1950; 55 pp., 15 figs.
No. 78. The Life History of the Starry Flounder, Platichthys stellatus (Pallas). By Harold George Orcutt. 1950; 64 pp., 52 figs.
No. 79. A Key to Some Southern California Fishes Based on Vertebral Charac-ters. By Charles R. Clothier. 1950; 83 pp., 22 figs., 23 pls.
No. 80. The Commercial Fish Catch of California for the Years 1948-1949 with Yield per Area of the California Sardine Fishing Grounds 1937-1949. By the Staff of the Bureau of Marine Fisheries. 1951; 87 pp., 9 figs.
No. 81. Purse Seines and Other Roundhaul Nets in California. By W. L. Sco-field. 1951; 83 pp., 37 figs.
No. 82. A Comparison of the Populations of Yellowfin Tuna, Neothunnus ma-cropterus, from the Eastern and Central Pacific. By H. C. Godsil and E. C. Greenhood. 1951; 33 pp., 6 figs.
No. 83. Age Composition of the Southern California Catch of Pacific Mackerel 1939-40 through 1950-51. By John E. Fitch. 1951; 73 pp., 17 figs.
No. 84. A Racial Study of the Pacific Mackerel, Pneumatophorus diego. By Phil M. Roedel. 1952; 53 pp., 5 figs.
No. 85. The Biology of the Dover Sole, Microstomus pacificus (Lockington). By Frederick B. Hagerman. 1952; 48 pp., 28 figs.
No. 86. The Commercial Fish Catch of California for the Year 1950 with a Description of Methods Used in Collecting and Compiling the Statistics. By the Staff of the Bureau of Marine Fisheries. 1952; 120 pp., 43 figs.
No. 87. Surveys through 1951 of the Distribution and Abundance of Young Sar-dines (Sardinops caerulea). By Julius B. Phillips and John Radovich. 1952; 63 pp., 13 figs.
No. 88. A Revision of the Family Embiotocidae (The Surfperches). By Fred H. Tarp. 1952; 99 pp., 32 figs.
No. 89. The Commercial Fish Catch of California for the Year 1951, with an Eval-uation of the Existing Anchovy Case Pack Requirements. By the Staff of the Bureau of Marine Fisheries. 1953; 68 pp., 4 figs.
No. 90. Common Marine Bivalves of California. By John E. Fitch. 1953; 102 pp., 63 figs.
No. 91. Common Ocean Fishes of the California Coast. By Phil M. Roedel. 1953; 184 pp., 125 figs.
No. 92. Studies on Fish Preservation at the Contra Costa Steam Plant of the Pacific Gas and Electric Company. By James E. Kerr. 1953; 66 pp., 36 figs.
Please address requests for bulletins to CALIFORNIA STATE FISHERIES LABORATORY
Terminal Island Station San Pedro, Calif.
0
printed in CALIFORNIA STATE PRINTING OFFICE
S0796 5-53 7,500
FIGURE 33 F.cu
FIGURE 34
0

FIGURE 35
FIGURE 36
es