Embed Size (px)
Citation preview

ORIGINAL ARTICLE
Studies on electrical properties of wheat as a function ofmoisture contentRitula Thakur1, Shantanu Chatterji1, Amod Kumar2 & Babankumar S. Bansod2
1 National Institute of Technical Teachers Training & Research, Chandigarh, India2 Central Scientific Instruments Organization, Chandigarh, India
Keywordselectrical properties variation; moisturecontent (MC); moisture prediction model;partial least squares; principal componentanalysis (PCA); statistical analysis.
Correspondence:Ritula Thakur, National Institute of TechnicalTeachers Training & Research, Sector 26,Chandigarh, India-160019. Tel:+91-9888520284; Fax: +91-172-2791366,+91-172-2793893; Email:[email protected]
Received 3 March 2011; Revised 11 May2011; Accepted 29 May 2011
doi: 10.1111/j.1757-837X.2011.00110.x
AbstractIntroduction Moisture content of cereal grains is one of the most important char-
acteristics for determining quality of grains. Objectives The electrical properties of
Indian wheat with moisture content range of 14.3% to 29.38% were characterized
to develop a moisture prediction model. Methods A specially designed coaxial
cylindrical cell was used for the purpose and electrical properties characterization
system was used to carry out measurements of these properties. The studies were
conducted for frequency range of 100 kHz–10 MHz and a fixed frequency was
selected based on best correlation basis. Principal Component Analysis (PCA) was
used to study the moisture dependence of various electrical properties such as
Capacitance (C), Conductance (G), Impedance (Z), Theta (q) and Dissipation
Factor (D) of Indian wheat. The various statistical studies were conducted using
The Unscrambler Version X, a multivariate Statistical Analysis Software. Results It
was observed that Conductance (G) and capacitance (C) show the maximum
variation with moisture. Partial Least Square (PLS) Regression was then used to
develop the moisture prediction model based on these two electrical properties.
Conclusion The developed model is highly accurate with high correlation of
0.973.
Thakur R, Chatterji S, Kumar A, Bansod BS (2011). Studies on electrical properties of wheat as a function ofmoisture content. Quality Assurance and Safety of Crops & Foods, 3, 198–204.
Introduction
Moisture content (MC) of cereal grains is one of the most
important characteristics for determining the quality of
grains. Measurement of moisture is an important aspect in
harvesting, drying, storing and processing of agricultural
products. Some of these products, when freshly harvested,
may have a MC in the range of 20–40%. For trading,
processing or storage, these moisture levels have to be
decreased to a recommended level, that is up to 13%,
13.5% and 10.5% for shelled corn, soft red winter wheat
and peanuts, respectively (Lower et al., 1994). Interest in
electrical properties of grains for moisture determination
dates back more than 100 years; Briggs (1908) studied the
direct current electrical resistance of grain for the purpose
of rapidly determining its MC. Later on, studies on alter-
nating current measurements were reported based on the
changes in the capacitance of sample-holding capacitors,
when wheat samples were introduced between the capaci-
tor plates. This was correlated with grain MC and used for
grain moisture measurement (Burton & Pitt, 1929). Dielec-
tric properties of cereal grains are highly correlated with
MC (Nelson, 1981, 1991). Therefore, the development of
electrical grain moisture meter based on electrical proper-
ties has been reviewed by a number of authors (Hart &
Golumbic, 1963; Nelson, 1973, 1977; Ban & Suzuki, 1977).
The performance evaluation of digital grain moisture
meter for Indian wheat using capacitance variation has also
Quality Assurance and Safety of Crops & Foods 2011, 3, 198–204
© 2011 Blackwell Publishing Ltd198

been reported recently (Babankumar & Ritula, 2011). Elec-
trical impedance spectroscopy technique is a relatively
powerful method of characterizing electrical properties of
solid, liquid and combined solid–liquid materials (Li,
2003). It has been effectively used for moisture estimation
in paper pulp (Sundara-Rajan et al., 2004) and to measure
moisture dynamics in cookies (Li, 2003). Bhatt & Nagaraju
(2010) investigated the effect of MC and its migration on
the electrical properties, mainly impedance, capacitance
and resistance of wheat bread crust and crumb during
storage for 120 h. Mizukami et al. (2006) developed a new
method for the moisture measurement of tea leaves by
using measurements obtained by electrical spectroscopy.
The present paper reports the development of a moisture
prediction model for Triticum aestivum, a cultivar of
Indian wheat grain, based on the characterization of
various electrical properties such as capacitance (C), con-
ductance (G), impedance (Z), theta (q) and dissipation
factor (D) with MC range of 14.3–29.38%.
Materials and methodsGrain sample preparation
An appropriate number of samples for Indian short wheat
grain were prepared artificially to conduct studies at
100 kHz–10 mHz frequency band at room temperature. In
preparing conditioned samples, a fixed quantity (150 g) of
grain was taken and weighed. The broken kernels and
foreign materials were removed. Distilled water was added
to the sample to raise its MC to predetermined calculated
levels (14.3–29.38% w.b.). The sample was stirred during
the addition of water and the conditioned samples were
stored in the sealed jars at 2–4 °C in cold storage for at least
4–5 days, before its electrical properties were measured.
During this conditioning period, the sealed jars were
shaken periodically to aid the uniform distribution of
moisture. The MC of each sample was determined by
standard dry oven technique by grinding 5–10 g each
samples and drying them for 2 h at 130 °C. Two hot-air dry
ovens were used during the experimentation period to
increase experimental throughput and avoid time lag.
Refrigerated samples in sealed jars were permitted to reach
room temperature (22 °C) before opening them for electri-
cal measurements. Altogether, 19 samples covering the
range of 14.3–29.38% (w.b.) moisture values were prepared
for the room temperature studies.
Experimental setup
For the measurement of electrical properties, 100 g of each
sample was used at room temperature. Various electrical
properties such as C, G, Z, q and D were measured using
Keithley 4200 SCS model (Keithley Instruments, Inc., Cleve-
land, OH, USA). A specially designed concentric cylinder
dielectric cell was used for the purpose. The outer cylinder is
58 mm long, with an internal diameter of 90 mm and has a
wall with a thickness of 2 mm. The inner cylinder has outer
Figure 1 Moisture dependence of the capacitance of wheat grains at 100–1000 kHz frequency.
Quality Assurance and Safety of Crops & Foods 2011, 3, 198–204 R. Thakur et al. Electrical properties of Indian wheat
© 2011 Blackwell Publishing Ltd 199
diameter of 45 mm. These cylinders are joined on the single
plate of Teflon. In order to improve the quality of the sensing
cell, the cylinders are given an anodized and non-conducting
material surface coating treatment on the walls to avoid
capacitor leakage charging current. It forms a concentric
cylindrical type dielectric cell, joined with shielded coaxial
cable of low capacitance. These two leads from cylinder are
connected to the two ports of Keithley characterization
system. The measurement data were automatically transmit-
ted from this system to a personal computer (PC) through an
interface that connects the PC and the instrument serially.
The calibration compensation was performed for the cylin-
der test leads before starting electrical measurements in order
to avoid errors against terminal connections and residuals.
The studies were conducted for frequency range of
100 kHz–10 mHz and a fixed frequency was selected based
Figure 2 Moisture dependence of the conductance of wheat grains at 100–1000 kHz frequency.
Figure 3 Moisture dependence of the Theta of wheat grains at 100–1000 kHz frequency.
Quality Assurance and Safety of Crops & Foods 2011, 3, 198–204 R. Thakur et al. Electrical properties of Indian wheat
© 2011 Blackwell Publishing Ltd200
on best correlation basis. Statistical analysis techniques such
as principal component analysis (PCA) and partial least
square (PLS) regression were applied using The Unscram-
bler Version X (CAMO Software AS., Oslo, Norway), a multi-
variate Statistical Analysis Software. PCA is a statistical
technique used to identify patterns in data and then express-
ing the data in such a way as to highlight their similarities
and differences. In the present work, it was used to show the
dependency of electrical properties of wheat samples with
moisture in a multivariate environment, and the plots gen-
erated were used to interpret differences and similarities
among samples. G and C show the maximum variation with
moisture and moisture prediction model was developed
based on these electrical properties using PLS. It is a method
for constructing predictive models when the factors are
highly collinear. The accuracy of the developed moisture
prediction model was studied using the plots generated by
PLS.
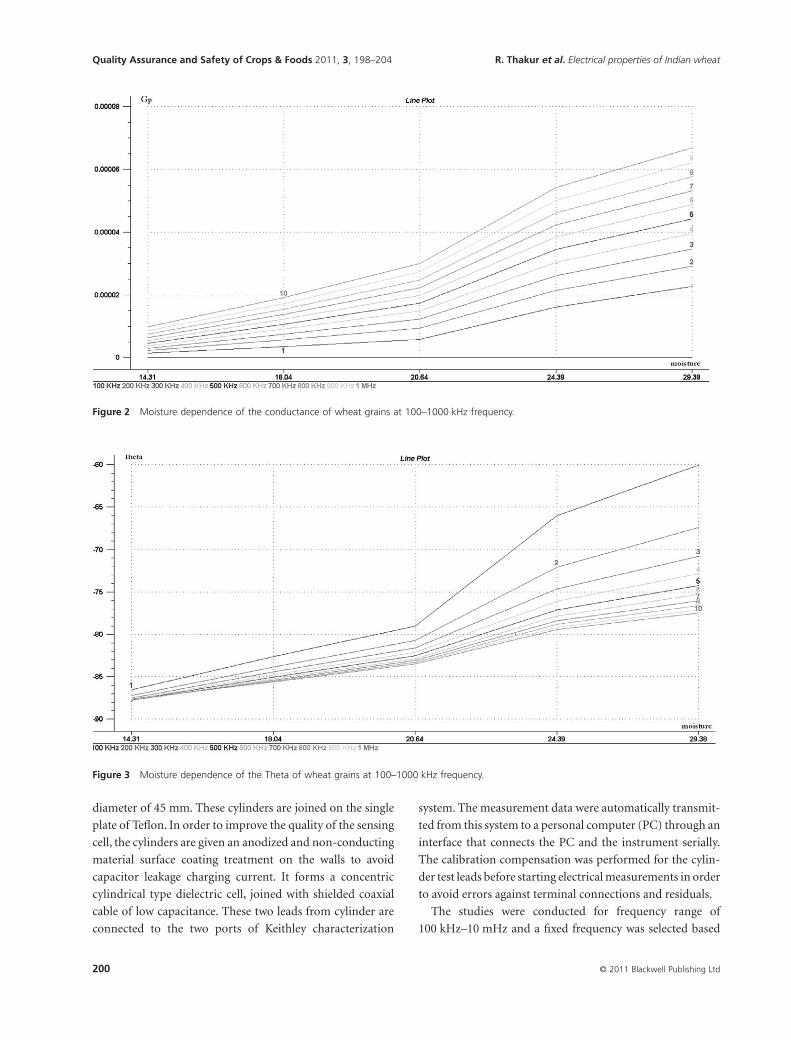
Figure 4 Moisture dependence of the impedance of wheat grains at 100–1000 kHz.
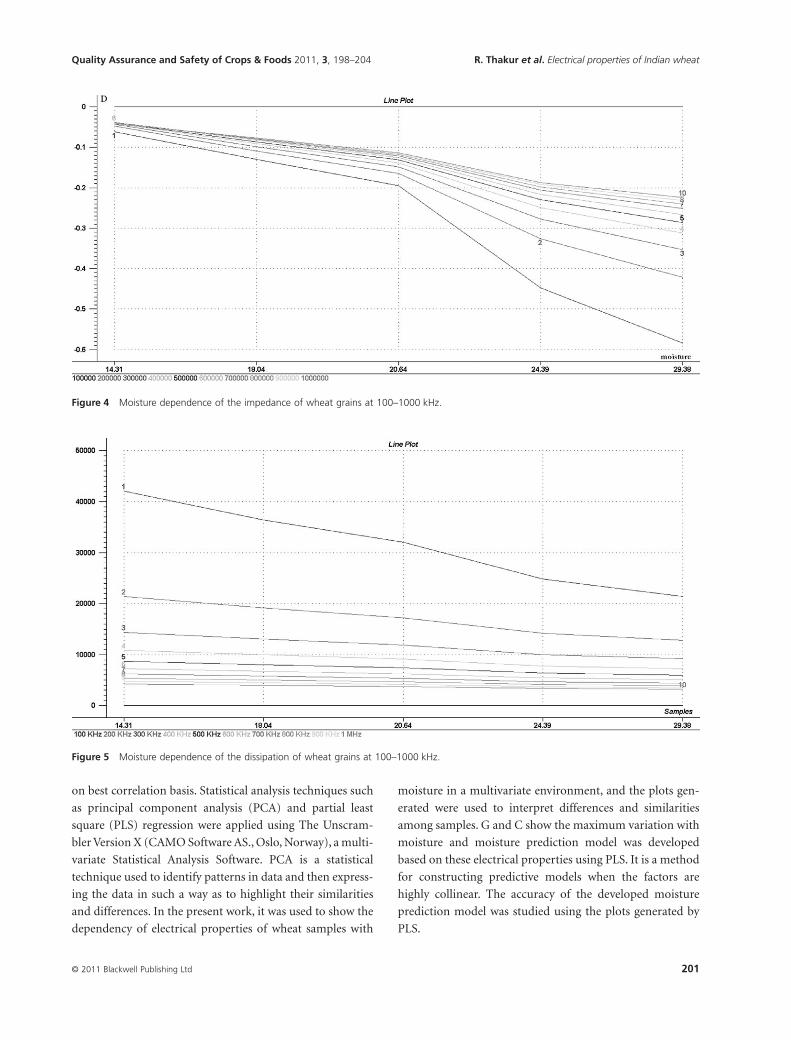
Figure 5 Moisture dependence of the dissipation of wheat grains at 100–1000 kHz.
Quality Assurance and Safety of Crops & Foods 2011, 3, 198–204 R. Thakur et al. Electrical properties of Indian wheat
© 2011 Blackwell Publishing Ltd 201
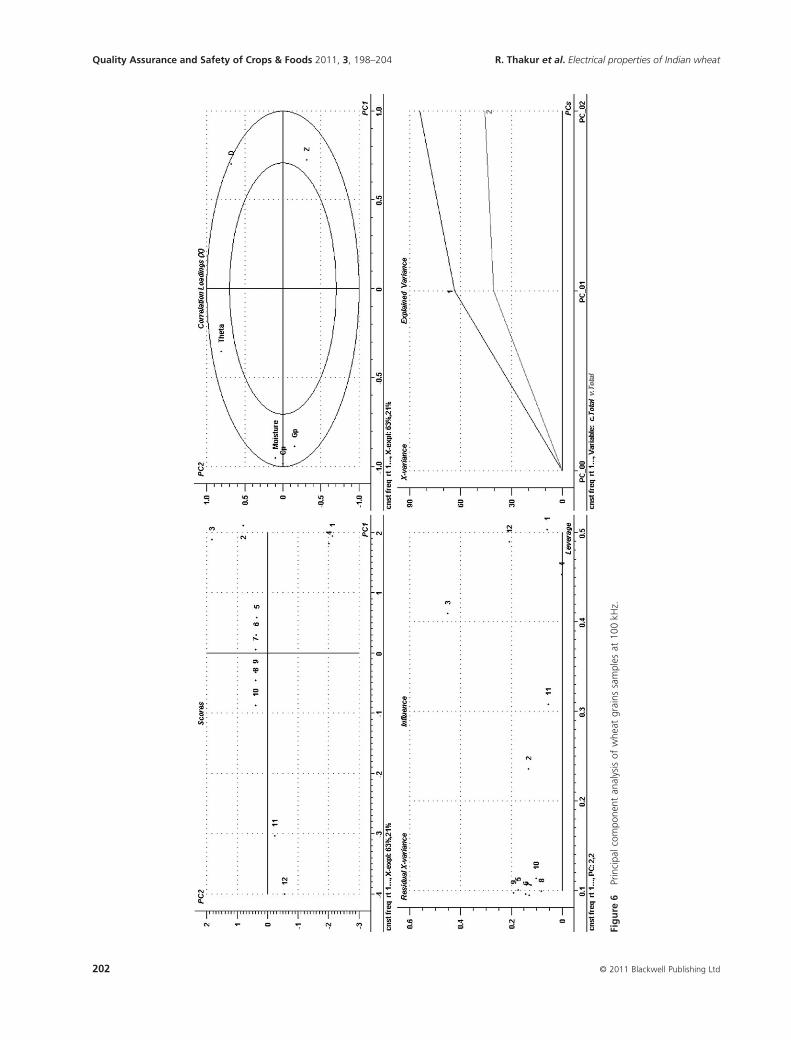
Fig
ure
6Pr
inci
palc
ompo
nent
anal
ysis
ofw
heat
grai
nssa
mpl
esat
100
kHz.
Quality Assurance and Safety of Crops & Foods 2011, 3, 198–204 R. Thakur et al. Electrical properties of Indian wheat
© 2011 Blackwell Publishing Ltd202

Fig
ure
7Pa
rtia
llea
stsq
uare
regr
essi
onan
alys
isof
grai
nsa
mpl
esat
100
kHz.
Quality Assurance and Safety of Crops & Foods 2011, 3, 198–204 R. Thakur et al. Electrical properties of Indian wheat
© 2011 Blackwell Publishing Ltd 203

Results and discussionMoisture dependence of electrical properties atvarious frequencies
Moisture dependence of various electrical properties such
as C, G, Z, q and D of Indian wheat was studied in the
frequency range of 100 kHz–1 mHz and MC ranging from
14.3% to 29.38% as shown in Figures 1–5.
On the best correlation basis, it was found that all electri-
cal properties have best correlation at 100 kHz frequency, So
further studies were done at this frequency.
Moisture dependence of electrical properties at100 kHz using PCA
PCA was used to show the dependency of electrical proper-
ties of wheat samples at a frequency of 100 khz (Figure 6).
These plots can be used to interpret differences and simi-
larities among samples. As can be observed from correla-
tions loading plot that G and C are very close to moisture
and, hence show maximum variation with change in MC.
These two values are further used to develop moisture pre-
diction model using PLS regression. All statistical techniques
were carried out using The Unscrambler version X statistical
analysis software.
Moisture predicting model of wheat grains byusing PLS regression analysis
After analysing data with PCA, it was found that G and C
show largest variation with moisture. PLS regression tech-
nique was used to build moisture prediction model using
these electrical properties (Figure 7).
The following is the moisture predicting equation:
M e Cp e Gp= + ∗ + + ∗ +4 552 11 1 569 5 4 542132. . .
A high correlation of 0.973 was achieved by comparing this
prediction model with values obtained by dry oven tech-
nique. This shows that the developed prediction model is
highly accurate.
Conclusion
The present paper deals with the development of moisture
prediction model for Indian wheat using characterization of
electrical properties with MC range of 14.3–29.38%. A
Keithley 4200 SCS model (Keithley Instruments, Inc.) was
used to carry out measurements of these properties: viz. C,
G, Z, q and D. The studies were conducted for a frequency
range of 100 kHz–10 mHz and a fixed frequency was
selected based on best correlation basis. PCA was used to
study the moisture dependence of various electrical proper-
ties of Indian wheat. It was observed that G and C show the
maximum variation with moisture. PLS regression was then
used to develop the moisture prediction model based on
these two electrical properties. The developed model is
highly accurate with high correlation of 0.973.
References
Babankumar S.B., Ritula T. (2011) Performance evaluation of
digital grain moisture meter analyzer for Indian wheat.
Journal of Scientific and Industrial Research, 70, 41–44.
Ban T., Suzuki M. (1977) Studies on electrical detection of grain
moisture content in artificial drying, (Japanese). Techn. Rpt.
No. 11. Institute of Agricultural Machinery, Omiya, Japan.
Bhatt C.M., Nagaraju J. (2010) Studies on electrical properties
of wheat bread as a function of moisture content during
storage. Sensing and Instrumentation for Food Quality and
Safety, 4, 61–66 DOI 10.1007/s11694-010-9095-z.
Briggs L.J. (1908) An electrical resistance method for the rapid
determination of the moisture content of grain. Bureau of
Plant Industry, Circular No. 20, U. S. Dept. Agriculture.
Burton E.F., Pitt A. (1929) A new method for the rapid
estimation of moisture in wheat. Canadian Journal of
Research, 1, 155–162.
Hart J.R., Golumbic C. (1963) Methods of moisture
determination in seeds. Proceedings of International Seed
Testing Association, 28 (4), 911–933.
Li X. (2003) Impedance spectroscopy for manufacturing control
of material physical properties. Masters Thesis, Department
of Electrical Engineering, University of Washington.
Lower O.J., Bridges T.C., Bucklin R.A. (1994) On-Farm Drying
and Storage Systems. American Society of Agricultural
Engineers, St. Joseph, MI.
Mizukami Y., Sawai Y., Yamaguchi Y. (2006) Moisture content
measurement of tea leaves by electrical impedance and
capacitance. Biosystems Engineering, 93 (3), 293–299.
Nelson S.O. (1973) Electrical properties of agricultural products
a critical review. Transactions of ASAE, 16 (2), 384–400.
Nelson S.O. (1977) Use of electrical properties for
grain–moisture measurement. Journal of Microwave Power,
12 (1), 67–72.
Nelson S.O. (1981) Review of factors influencing the dielectric
properties of cereal grains. Cereal Chemistry, 58 (6), 487–432.
Nelson S.O. (1991) Dielectric properties of agricultural
products – measurements and applications. IEEE
Transactions on Electrical Insulation, 26 (5), 845–869.
Sundara-Rajan K., Byre L., Mamishev A.V. (2004) Moisture
content estimation in paper pulp using fringing filed
impedance spectroscopy. IEEE Sensors Journal, 4 (3),
378–383.
Quality Assurance and Safety of Crops & Foods 2011, 3, 198–204 R. Thakur et al. Electrical properties of Indian wheat
© 2011 Blackwell Publishing Ltd204