Embed Size (px)
Citation preview

NATIONAL TOXICOLOGY PROGRAM Technical Report Series No. 433
TOXICOLOGY AND CARCINOGENESIS
STUDIES OF TRICRESYL PHOSPHATE
(CAS NO. 1330-78-5)
IN F344/N RATS AND B6C3F, MICE
(GAVAGE AND FEED STUDIES)

FOREWORD
The National Toxicology Program (NTP) is made up o f four charter agencies of the U.S. Department o f Health and Human Services (DHHS): the National Cancer Institute (NCI), National Institutes of Health; the National Instituteo f Environmental Health Sciences (NIEHS), National Institutes o f Health; the National Center for Toxicological Research (NCTR), Food and Drug Administration; and the National Institute for Occupational Safety and Health (NIOSH), Centers for Disease Control. In July 1981, the Carcinogenesis Bioassay Testing Program, NCI, was transferred t o the NIEHS. The NTP coordinates the relevant programs, staff, and resources from these Public Health Service agencies relating to basic and applied research and t o biological assay development and validation.
The NTP develops, evaluates, and disseminates scientific information about potentially toxic and hazardous chemicals. This knowledge is used for protecting the health o f the American people and for the primary prevention o f disease.
The studies described in this Technical Report were performed underthe direction o f the NIEHS and were conducted in compliance with NTP laboratory health and safety requirements and must meet or exceed all applicable federal, state, and local health and safety regulations. Animal care and use were in accordance with the Public Health Service Policy o n Humane Care and Use o f Animals. The prechronic and chronic studies were conducted in compliance with Food and Drug Administration (FDA) Good Laboratory Practice Regulations, and all aspects o f the chronic studies were subjected t o retrospective quality assurance audits before being presented for public review.
These studies are designed and conducted to characterize and evaluatethe toxicologic potential, including carcinogenic activity, o f selected chemicals in laboratory animals (usually two species, rats and mice). Chemicals selected for NTP toxicology and carcinogenesis studies are chosen primarily on the bases of human exposure, level o f production, and chemical structure. Selection per se is not an indicator of a chemical's carcinogenic potential.
These NTP Technical Reports are available for sale from the National Technical Information Service, U.S. Department o f Commerce, 5285 Port Royal Road, Springfield, VA 22161(703-487-4650). Single copies o f this Technical Report are available without charge while supplies last from NTP Central Data Management, NIEHS, P.O. Box 12233, MD AO-01 Research Triangle Park, NC 27709 (919-541-1371).

NTP TECHNICAL REPORT
ON THE
TOXICOLOGYANDCARCINOGENESIS .
STUDIES OF TRICRESYL PHOSPHATE
(CAS NO. 1330-78-5)
IN F344/N RATS AND B6C3F, MICE
(GAVAGE AND FEED STUDIES)
NATIONAL TOXICOLOGY PROGRAM P.O. Box 12233
ResearchTrianglePark, NC 27709
September 1994
NTPTR 433
NIII I’ublication No. 94-3164
U.S. DEPARTMENT OF HEALTH AND HUMANSERVICES Public HealthService
National Institutes of Health

2 Tricresyl Phosphate, NTP TR 433
CONTRIBUTORS
National Toxicology Program Evaluated and i r l t c r y r e t e d results atid report firldirrgs
K.M. Abdo, Ph.D. C.J. Alden, Ph.D. G.A. Boorman, D.V.M., Ph.D. D.A. Bridge, B.S. J.R. Bucher, Ph.D. S.L.Eustis, D.V.M., Ph.D. T.J. Goehl, Ph.D. J.R. Hailey, D.V.M. J.K. Haseman, Ph.D. R.D. Irwin, Ph.D. G.N. Rao, D.V.M., Ph.D. J.H. Roycroft, Ph.D. B.A. Schwetz, D.V.M., Ph.D. C.C. Shackelcord, D.V.M., M.S., Ph.D. D.B. Waiters, Ph.D. K.L. Witt, M.S., OakRidgeAssociatedUniversities
Battelle Columbus Laboratories Conducted 16-day and 13-wcek sntdics, cvalrratcd pathologv findings
A.C. Peters, D.V.M., PrincipalInvestigator M.J. Ryan, D.V.M., Ph.D. P.C. Stromberg, D.V.M., Ph.D.
Conducted ?-year S h r d i e S , evalitarcd po tho lop jhdings
P.J. Kurtz, Ph.D., PrincipalInvestigator M.J. Ryan, D.V.M., Ph.D. A.W. Singer, D.V.M.
Experimental Pathology Laboratories, Inc. Provided pathology qrtaliy ossltrmce
J.F. Hardisty, D.V.M., Principal Investigator K. Yoshitomi, D.V.M., Ph.D. E. Gaillard, D.V.M.
Dynamac Corporation Prlyared q t t a l i ? asswance audits
S. Brecher, Ph.D., PrincipalInvestigator
NTP Pathology Working Group E\*ollratcd slicks, prcl>arcd pa tho log^ rcport ot1 rats (5,Ocrohcr 1991)
P.K. Hildcbrandt, D.V.M., Chair PATHCO, Inc.
W.W. Carlton, D.V.M., Ph.D. Purdue University
J.R. Hailey, D.V.M. National Toxicology Program
M.M. McDonald, D.V.M., Ph.D. National ToxicologyProgrill11
R.C. Si l l s , D.V.M., Ph.D. Natiollal Toxicology Program
K. Yosh,itomi, D.V.M., Ph.D. Experimental PatholokT Laboratories
J.R. Leininger, D.V.M., Ph.D., Chair Pathology Associates, Inc.
E. Gaillard, D.V.M. ExpcrimentalPathology hboratories
R.A. Herbert, D.V.M., Ph.D. NationalTosicologyProgram
M.P. Jokinen, D.V.M. Niltional Tosicology I’rogr;~m
J. Kanno, M.D., Ph.D. Tokyo Mcdical and Dcntal University
M.M. McDonald, D.V.M., Ph.D. National Toxicology Program
R. Miller, D.V.M. Chemical Industry Institute o f Tosicology
Biotechnical Services, Inc. I’rq>ared Tcchical Reyort
D.D. Lambright, Ph.D., l’rincipalInvestigator J.R. Bcverly, B.A. P. Chaffin, B.S.E. G. Gordon, M.A. E.S. Rathman, MS.

3
CONTENTS
ABSTRACT . . . . . . . . . . . . . . . . . . . . . . . . . . . . . . . . . . . . . . . . . . . . . . . . . . . . . . . . . . . . . . . . . . . 5
APPENDIX A Summary of Lesionsin Male Rats in the 2-Year FeedStudy
APPENDIXC Summary of LesionsinMale Mice i n the 2-Year Feed Study
APPENDIXD Summary of LesionsinFemaleMicein the 2-Year Feed Study
EXPLANATION OF LEVELS OF EVIDENCE OF CARCINOGENIC ACTIVI‘lY . . . . . . . . . . . . . . . 10
TECIINICAL REPORTS REVIEW SUBCOMMITTEE ................................... 11
SUMMARY OF TECIINICAL REPORTS REVIEW SUBCOhIMIT?’EE CORIhIENTS ........... 12
INTRODUCTION . . . . . . . . . . . . . . . . . . . . . . . . . . . . . . . . . . . . . . . . . . . . . . . . . . . . . . . . . . . . . . 13
hlATERMLSANDhlETIIODS . . . . . . . . . . . . . . . . . . . . . . . . . . . . . . . . . . . . . . . . . . . . . . . . . . . . 21
RESULTS . . . . . . . . . . . . . . . . . . . . . . . . . . . . . . . . . . . . . . . . . . . . . . . . . . . . . . . . . . . . . . . . . . . . 33
DISCUSSION AND CONCLUSIONS . . . . . . . . . . . . . . . . . . . . . . . . . . . . . . . . . . . . . . . . . . . . . . . . 67
REFERENCES . . . . . . . . . . . . . . . . . . . . . . . . . . . . . . . . . . . . . . . . . . . . . . . . . . . . . . . . . . . . . . . . 73
of Tricresyl Phosphate . . . . . . . . . . . . . . . . . . . . . . . . . . . . . . . . . . . . . . . . . . . . . . 79
APPENDIXB Summary of Lesionsin Fem:lle Rats i n the 2-Yew Feed Study of Tricresyl Phosphate . . . . . . . . . . . . . . . . . . . . . . . . . . . . . . . . . . . . . . . . . . . . . . 111
of Tricresyl Phosphate . . . . . . . . . . . . . . . . . . . . . . . . . . . . . . . . . . . . . . . . . . . . . . 145
of Tricresyl Phosphate . . . . . . . . . . . . . . . . . . . . . . . . . . . . . . . . . . . . . . . . . . . . . . 185
APPENDIXE GeneticToxicology . . . . . . . . . . . . . . . . . . . . . . . . . . . . . . . . . . . . . . . . . . . . . . . . . 229
APPENDIXF Organ Weights and Org:rn-Weight-to-Ilotly-\Yei~l~tRatios .................... 237
APPENDIXG IIematology and Clinical Chemistry I<esolts . . . . . . . . . . . . . . . . . . . . . . . . . . . . . . 263
APPENDIXI€ Neurobehavioral Studies . . . . . . . . . . . . . . . . . . . . . . . . . . . . . . . . . . . . . . . . . . . . . 275
APPENDIXI Chemical Characterization and Ilose Formulation Studies . . . . . . . . . . . . . . . . . . . 293
APPENDIXJ Feed and Compound Consumption i n the 2-Year Feed Studies of Tricresyl Phosphate . . . . . . . . . . . . . . . . . . . . . . . . . . . . . . . . . . . . . . . . . . . . . . 309
:rminant I.evelsAPPENDIXK Ingredients. Nutrient Composition. and Contin N I I I - 0 7 Rat and Mouse Ration . . . . . . . . . . . . . . . . . . . . . . . . . . . . . . . . . . . . . . 315
APPENDIXL Sentinel Animal Program . . . . . . . . . . . . . . . . . . . . . . . . . . . . . . . . . . . . . . . . . . . . 321

ABSTRACT
TRICRESYL PI-IOSPIIATE
C A S NO. 1330-78-5
Chemical Formula: C,IH210,P
Tricresyl phosphate is an organophosphate plasticizer widely used in vinyl plastics and as a fire retardant additive for hydraulic fluids. Toxicology and carcino- genesis studies wereconducted by administering a mixed isomer preparationo f 79% tricresyl phosphate esters (consisting o f 21% tri-nz-cresyl phosphate, 4% tri-p-cresyl phosphate, less than 1% tri-o-cresyl phosphate, and otherunidentified tricresyl phosphate esters) by gavage t o groups of F344/N rats and B6C3Fl mice for 16 days and 13weeks, and in feed to groups o f F344/N rats and B6C3F1 mice for 13weeks and2 years. Genetic toxicology studies wereconducted in Salmonella t),phinzurium andcultured Chinese hamster ovary cells.
16-DAY GAVAGESTUDY IN RATS Groups o f 10male and 10 female rats received tricresyl phosphate in corn oil by gavage at doses o f 0,360, 730, 1,450, 2,900,o r 5,800 mgkg body weight, 5 days per week, for a total o f 13 o r 14 doses in a 16-day period. One female receiving 1,450 mgkg and five males and eight females receiving 2,900 mgkg died before the end o f the study. Final mean body weights o f male and female rats that received 1,450, 2,900, or 5,800 mgkg were significantly lower than those o f the controls. Necrosis o f the mandibular lymph node, spleen, and thymus occurred primarily in rats receiving 2,900 and 5,800 m a g . Diffuse
Molecular Weight: 368.36
aspermatogenesis occurred in the testes o f male rats that received 2,900 and 5,800 mgntg. Changesin neurobehavioral parameters in groups that received 1,450, 2,900, o r 5,800 mgkg were confounded by mortality and reduced body weights and were not attributed to a direct neurotoxic response.
16-DAY GAVAGESTUDY I N MICE Groups o f 10 male and 10 female mice received tricresyl phosphate in corn oil by gavage at doses of 0,360, 730, 1,450, 2,900,o r 5,800 mgntg body weight, 5 days per week, for a total of 13 or 14 doses in a 16-day period. Five males and all females that received 1,450 mgkg, all mice that received 2,900 mg/kg, and four males and one female that received 5,800 mgkg died before the end o f the study. Final mean body weights o f male mice that received 1,450 and 5,800 mg/kg were significantly lower than that o f the controls.Finalmean body weights o f female mice that received 360, 730, or 5,800 mgntg were significantly greater than thato f the controls. Necrosis of the mandibular lymph node, thymus, and spleenoccurred primarily in mice receiving 2,900 and 5,800 mgntg. Hindlimbgrip strengths o f male mice that received 360 and 1,450 mgkg and male and female mice that received 730 and 5,800 mgkg were significantly lower than those of the controls at the end o f the study.

6
13-WEEK GAVAGESTUDY IN RATS Groups of 10maleand10femaleratsreceived tricresyl phosphate in corn oil by gavage a t doses of 0, 50, 100,200,400, o r 800 mg/kg bodyweight. A l l ratssurvivedto the end of the study. Finalmean bodyweightsofmaleratsreceiving200,400, and SO0 mgkg were significantly lower than that of the controls.Cytoplasmicvacuolization o f the adrenal cortex occurred in all dosed groups and the severity increased with dose.Ovarianinterstitialcellhypertrophyoccurredinalldosedgroups offemales. Atrophy of the seminiferous tubules occurredin male rats that received 400 and SO0 mgkg. There were no biologicallysignificantchanges in neurobehavioral parameters in rats.
13-WEEK GAVAGESTUDY IN MICE Groups of 10 male and 10 femalemicereceived tricresyl phosphate in corn oil by gavage a t doses of 0, 50, 100,200, 400, o r 800 m&/kg bodyweight.All micesurvived to the end of thestudy.Final mean body weights of male mice receiving 200 and ofm@g male and femalemicereceiving400 a n d SO0 m@g weresignificantlylower than those of the controls. Cytoplasmicvacuolization of theadrenalcortex occurred in a l l dosed groups of mice and the severity increased with dose. Ovarian interstitialcellhypertrophy was present in a l l dosed groups of female mice.Multifocal degeneration of the spinal cord occurred in males and females that received 100,200, 400, and SO0 mgkg, and multifocal degeneration of the sciatic nerve occurredin males that received 200, 400, and SO0 m g k g a n d females that received100, 200,400, and SO0 mg/kg. Hindlimb grip strengths of male mice that received 200, 400, or 800 m g k g were significantlylower than tha t of the controls a t the end of the study.
13-WEEK FEEDSTUDY I N RATS Groups of 10 male and 10 female rats were fed diets containing 0, 900, 1,700, 3,300, 6,600,o r 13,000 ppm of tricresyl phosphate. All rats survived to the end of the study. Finalmeanbodyweightsofmalesand females exposed to 6,600 and 13,000 ppm a n d females exposed to 3,300 ppm were significantly lower than those of controls. Feed consumption by male a n d femaleratsexposed lo 13,000 ppm waslower than that by controls dur ing thefirstweekof the study. Dietarylevels of 900, 1,700,3,300, or6,600
Tricresyl Phosphate, NTP TR 433
13,000ppm tricresylphosphatewereestimatedto deliver daily doses of 55, 120, 220,430, o r 750 m g k g bodyweight (males)and65,120,230,430, o r 770 m g k g (females).Therewerenobiologically significant changesin neurobehavioral parameters in rats.
Cytoplasmicvacuolization of the adrenal cortex occurred in all exposed groups of rats. Hyperplasia of ovarian interstitial cells and inflammation of the ovarian interstitium occurred inall exposed groups of females.Renalpapillaryedemaandrenalpapillary necrosis occurred in 13,000ppmmalesandfemales a n d i n 6,600 ppm females. Basophilic hypertrophy of the pituitary gland parsdistalis and atrophy of the seminiferoustubulesoccurred in 6,600and 13,000 ppm males.
Dose selection for the 2-year study in rats was based onlowermeanbodyweights;toxicresponses observed in the kidney, pituitary gland, and testis o f males a n d the kidney of females exposed to 6,600 and 13,000 ppm; the presence of cytoplasmicvacuolization of the adrenal cortex i n exposedmalesand females;and the occurrence of ovarian interstitial cell hyperplasia in females exposed to 900 and 1,700 ppm.
13-WEEK FEEDSTUDY IN MICE Groups of 10 male and 10 female mice were feddiets containing 0, 250, 500, 1,000, 2,100, o r 4,200 ppm of tricresyl phosphate. All mice survived to the end of the study. Meanbodyweights of 4,200 ppm males and of females exposed to 2,100 and 4,200 ppm were lower than those of controls throughout the study. Feed consumptionby females exposed to 1,000,2,100, or 4,200 ppm was lower than that by controls during week12.Dietarylevelsof250, 500, 1,000,2,100, o r 4,200 ppm tricresylphosphatewereestimatedto deliveraverage daily dosesof45,110, lS0, 380, o r 900 mg/kg body weight (males) and 65,130,230,530, or1,050 m g k g (females). Interpretation of grip strength changes observed in groups receiving 2,100 or 4,200 ppm were confounded by the reduced body weights of these groups.
Cytoplasmicvacuolization of the adrenal cortex occurred in all exposedgroupsofmale and female mice with the exception of 250 ppm males. Papillary hyperplasiaof thegallbladdermucosaoccurredin malemiceexposedto 500 ppm o r moreandin female mice exposed to 1,000 ppm or more. Axonal

7 Tricresyl Phosphete, NTI' TR 433
degeneration occurredin males and females exposed to 2,100 and4,200 ppm and femalesexposedto 1,000 ppm. Renal tubule regeneration occurredi n a l l 4,200 ppm male mice.
Dose selection for the 2-year study in mice was based on the presence of axonal degenerationa t concentrations of 1,000 ppm or more and Lytoplasmic vacuolization of the adrenal cortex a t concentrations of 500 ppm o r more i n males a n d i n a l l exposed groups of females.
&YEAR FEEDSTUDY IN RA'I'S Groups o f 95 male a n d 95 female rats were fed diets containing 0, 75,150, or 300 ppm oftricresyl phosphate. A n additionalgroup of95male and 95 female rats were fed diets containing 600 ppm of tricresylphosphatefor 22 weeks and thenreceived only control feed.After 3, 9, a n d 15 months of chemical exposure,u p to 15 males a n d 15 females per group were evaluated for forelimba n d hindlimb grip strength, thennecropsied and evaluated for histopathologic lesions.
Survival, Mean Body Weights, and Feed Consumption Survivalofexposedratswas similar to t h a t of controls. The final mean body weights of all exposcd groups of males and females were similar to those of the controls. Feedconsumption by exposedgroups ofmale and femaleratswas similar to t h a t by the controls.Dietarylevelsof75,150, o r 300 ppm tricresyl phosphate were cstimated to deliver average d a i l y doses of 3, 6, o r 13 m g k g body weight (males) and 4, 7, o r 15 mg/kg (females).
Pathology Findings There were no chemical-related increased incidences o f neoplasms in rats.Cytoplasmic vacuolization o f the adrenal cortexoccurred i n 600 p p m males a n d 150,300, a n d 600 ppm females a t the3-month interim evaluation. A t 9 a n d 15 months, Lytoplasmic vacuolization occurred only i n fernale rats, primarily in the 300 ppm group. Cytoplasmic vacuolization of the adrenal cortex and ovarian interstitial cell hyperplasiaoccurred i n female rats exposed t o 300 ppm throughoutthe 2-year s t u d y a n d theincidence a n d severity weresignificantly increased a t the end of the study.
&YEAR FEE11s1'UI)Y IN MICE Groups of 95 male and 95 female mice were fed diets containing 0, 60, 125, or 250 ppm of tricresyl phosphate. After 3, 9, a n d 15monthsofchemicalexposure, u p to 15 males a n d 15 females per group were evaluatedforforelimb a n d hindlimb grip strength, thennecropsied and evaluatedforhistopathologic lesions.
Survival, Mean Body Weights, and Feed Co1zsrrn~ptiort Surviva l of exposed groups of male and female mice was similar to tha t of the controls.The final mean body weights of males and females receiving tricresyl phosphatewere similar tothose of controls. Feed consumption by exposed groups of male and female micewas similar to tha t by thecontrols.Dietary levels of 60,125, o r 250 ppm tricresyl phosphate were estimated to deliver average dai ly dosesof 7, 13, or 27 m u k g body weight (males) and S, lS, o r 37 mgkg (females).
Pathology Firzdings Thcre were no chemical-related increased incidences of neoplasms in mice.Ceroidpigmentationof the adrenalcortexoccurred i n a l l groups ofmice throughout most of the 2-year study,with the excep- tionof60 a n d 125 ppm females a t the 3-month i n t e r i m evaluation; the severitywashowever, markedly incrcascdi n female mice receiving 250 ppm. Incidences of clear cell foci, Fdtty change, and ceroid pigmentation o f the liver were significantly increased in male mice t h a t received125 o r 250 ppm.
GENE'I'IC TOXICOLO~Y Tricresyl phosphatewas not mutagenic i n Salnzonella fyphinzwi~~mstrains TA98, TA100,TA153.5,or TA1537, nor did it induce chromosomal aberrations o r sisterchromatidexchanges in culturedChinese hamstcrovarycells.These i n t in -o assayswere al l conducted w i t h a n d withoutexogenousmetabolic activation (S9).
CONCLUSIONS Undertheconditions of these 2-yearfeedstudies, there was no evidence of carcinogenicactivity* of tricrcsylphosphate i n maleorfemaleF344/Nrats t h a t received 75, 150,or300 ppm. There was no

8 Tricresyl Phosphate, NTP TR 433
evidence ofcarcinogenic acrivir?,o f tricresyl phosphate in male o r female B6C3Fl mice that received 60, 125, o r 250 ppm.
Nonneoplastic lesions associated with exposure t o tricresylphosphateincludedcytoplasmicvacuolization
o f the adrenal cortex and ovarian interstitial cell hyperplasia in female rats, increased incidences of clear cell fatty change, and ceroid pigmentation focus, o f the liver in male mice, and increased severity o f ceroid pigmentation o f the adrenal cortex in female mice.
l Explanation o f Levels o f Evidence o f Carcinogenic Activity is on page10. A summary o f the Technical Reports Review Subcommittee comments and the public discussion on this report appears o n page 12.

9 Tricresyl Phosphate, NTP TR 433
Summary of the 2-Year Carcinogenesis and Genetic Toxicology Studies of Tricresyl Phosphate
Variable Male Female nktle Female F344/N Rats F344/N Rats 156C3F,Mice 156C3F, Mice
Doses 0, 75, 150, or 0, 75, 150. o r 0, 60, 125, o r 0, 60, 125, or 300 ppm in feed 300 ppm in fecd 250 ppm in feed 250 ppm i n feed (Approximately 3, 6, (Approximately 4,7, (Approximately 7, 13, (Approximately8, or 13 m@g) or 15 mghqg) or 27 m@g) 18, or 37 m&g)
Body weights Exposed groups Exposed groups &posed groups Exposed groups similar t o controls similar t o controls similar t o controls similar t o controls
2-Year survival 32/51, 30/50, 35/50, 34/51, 38/53, 30/50, 43/51. 13/19, 44/19. 41/50, 3 / 5 0 , 42/48, rates 28/50 26/49 42/50 45/51
Nonneoplastic None Adrenal cortex: Liver:ceroid Adrenal cortex: effects cytoplasmic pigmcntation (0152, ceroid pigmentation
vacuolimtion (14/51. 0/49. 30/49, 28/50); (severity grades - 1.2, 12/53, 16/50. 36/50); clear cell C o c u s (5/52, 1.6, 2.5, 3.9) Ovary:interstitial 8/49,17/49,12/50); hyperplasia (0/51, f a t t y change (6152, 0/53,0/50, 15/50) 10/49, 23/19, 22/50)
Neoplastic effects None None None None
Level of evidence No evidence No evidence No evidence No evidence of carcinogenic activity
Genetic toxicology sa/motle//a l)!phifntlrictm genemutation:Negative with and witllout S9 i n strains TA98, TA100, TA1535, and TA1537 Sister chromatid exchanges
Chinese hamster ovary cells in rirro: Negative w i t h and without S9 Chromosomal aberrations
Chinese hamster ovary cellsi n vitro: Negative with and without SF)

Tricresyl Phosphate, NTP TR 433
EXPLANATION OF LEVELS OF EVIDENCE OF CARCINOGENIC ACTMTY
The National Toxicology Program describes the results of individual experiments on a chemical agent and notes the strength of the evidence for conclusions regarding each study. Negative results, i n which the study animals do not have a greater incidence of neoplasia than control animals, do not necessarily mean tha t a chemical is not a carcinogen, inasmuch as the experiments are conducted under a limited set of conditions. Positive results demonstrate that a chemical is carcinogenic for laboratory animals under the conditions o f the study and indicate tha t exposure to the chemical has the potential for hazard to humans. Other organizations, such as the International Agency for Research on Cancer. assign a strength o f evidence for conclusions based on a n examination of all available evidence, includinganimal studies such as those conducted by the NTP, epidemiologic studies, and estimates of exposure. Thus, the actual determination of risk to humans from chemicals found to be carcinogenic in laboratory animals requiresa wider analysis that extends beyond the purview of these studies.
Five categories o f evidence of carcinogenic activity are used i n the Technical Report series to summarize the strength of the evidence observed i n each experiment: two categories for positive results (clear evidence and some evidence); one category for uncertain findings (equivocal evidence); one categoryfor no obsewable effects (no evidence); and one category for experiments that cannot be evaluated because of major flaws (inadequate sludy). These categories of interpretative conclusions were first adoptedi n June 1983 and then revised in March 1986 for use i n the Technical Report series to incorporate more specifically the concept of actual weight of evidence o f carcinogenic activity. For each separate experiment (male rats, female rats, male mice, female mice), one of the following five categories is selected to describe the findings. These categories refer to the strength of the experimental evidence and not to potency or mechanism.
l Clear evidence of carcinogenic activity is demonstrated by studies t h a t are interpreted as showing a dose-related (i) increase of malignant neoplasms, (ii) increase of a combination o f malignant and benign neoplasms, or (iii) marked increase o f benign neoplasms if there is a n indication from this or other studies of the abili ty o f such lesions to progress to malignancy.
l Some evidence of carcinogenic activity is demonstrated by studies tha t are interpreted as showing a chemical-related increased incidence of neoplasms (malignant, benign, or combined) in which the strength of the response is less than tha t required for clear evidence.
l Equivocal evidence of carcinogenic activity is demonstrated by studies t h a t are interpreted as showing a marginal increase o f neoplasms tha t may be chemical related.
l No evidence of carcinogenic activity is demonstrated by studies t h a t are interpreted as showing no chemical-related increases i n malignant or benign neoplasms.
l Inndequalestudy o f carcinogenic activity is demonstrated by studies t h a t , because of major qualitative or quantitative limitations, cannot be interpreted as valid for showing either the presence or absence of carcinogenic activity.
When a conclusion statement for a particular experiment is selected, consideration must be given to key factors t h a t would extend the actual boundary o f a n individual category of evidence. Such consideration should allow for incorporation of scientific experience and current understandingo f long-term carcinogenesis studies i n laboratory animals, especially for those evaluations that may be on the borderline between two adjacent levels. These considerations should include:
l adequacy o f the experimental design and conduct; l Occurrence o f common versus uncommon neoplasia; l progression (or lack thereof) from benign to malignant neoplasia as well as from preneoplastic to neoplastic lesions; l some benign neoplasms have the capacity to regress b u t others (of the same morphologic type) progress. At present,
it is impossible to identify the difference. Therefore, where progression isknown to be a possibility, the most prudent course is to assume t h a t benign neoplasms of those types have the potential to become malignant;
l combining benign and malignant tumor incidence known o r thought to represent stages of progression in the same organ or tissue;
l latency i n tumorinduction; l multiplicity i n site-specificneoplasia: l metastases; l supporting information from proliferative lcsions (hyperplasia) i n the same site of neoplasia or i n other experiments
(same lesion in another sex o r species); l presence or absenceofdoserelationships: l statisticalsignificanceoftheobservedtumorincrease: l concurrent control tumor incidence as well as the historical control rate a n d variability for a specific neoplasm; l survival-adjusted analyses and falsepositive or false negative concerns; l structure-activitycorrelations: a n d l in somecases,genetictoxicology.

11 Tricresyl Phosphate, NTP TR 433
NATIONAL TOXICOLOGY PROGRAMBOARD OF SCIENTIFIC COUNSELORS TECHNICAL REPORTS REVIEW SUBCOMMITTEE
The members of the Technical Reports Review Subcommittee who evaluated the draft NTP Technical Report on tricresyl phosphate on June 22, 1993,are listed below. Subcommittee members serve as independent scientists, not as representatives of any institution, company, or governmental agency. In this capacity, subcommittee members have five major responsibilities in reviewing NTP studies:
l to ascertain that all relevant literature data have been adequately cited and interpreted, l to determine if the design and conditions of the NTP studies were appropriate, l to ensure that the Technical Report presents the experimental results and conclusionsfully and clearly, l to judge the significanceo f the experimental results by scientific criteria, and * to assess the evaluationo f the evidence of carcinogenic activity and other observed toxic responses.
Curtis D. Klaassen, Ph.D., Chair Department o f Pharmacology and Toxicology University o f Kansas Medical Center Kansas City, KS
Paul T.Bailey, Ph.D., Principal Reviewer Environmental and Health Sciences Laboratory Mobil Oil Corporation Princeton, NJ
Louis S.Beliczky, MS., M.P.H.* Department of Industrial Hygiene United Rubber Workers International Union Akron, OH
Arnold L. Brown, M.D. University of Wisconsin Medical School Madison, WI
Kowetha A. Davidson, Ph.D., PrincipalReviewer Health and Safety Research Division Oak Ridge National Laboratory Oak Ridge, T N
Harold Davis, D.V.M., Ph.D. Medical Research Division American Cyanamid Pearl River, NY
Daniel S.Longnecker, M.D.* Department of Pathology Dartmouth Medical School Lebanon, NH
* Didnot attend
Louise Ryan, PbD. Division of Biostatistics Howard School of Public Health and Dana-Farber Cancer Institute Boston, MA
Ellen K. Silbergeld, Ph.D.* University of Maryland Medical School Baltimore, MD
Robert E. Taylor, M.D., Ph.D. Department of Pharmacology Howard University College of Medicine Washington, DC
Matthew J. van Zwieten, D.V.M., Ph.D., Principal Reviewer Department of Safety Assessment Merck Research Laboratories West Point, PA
Jerrold M. Ward, D.V.M., Ph.D. National Cancer Institute Frederick, MD
Lauren Zeise, Ph.D. Reproductive and Cancer Hazard Assessment Section California Environmental Protection Agency Berkeley, CA

12 Tricresyl Phosphate, NTP TR 433
SUMMARY OF TECHNICAL REPORTS REVIEW SUBCOMMITTEE COMMENTS
On June 22,1993, the draft Technical Report onthe toxicology and carcinogenesis studies o f tricresyl phosphate received public review by the National Toxicology Program Board o f Scientific Counselors Technical Reports Review Subcommittee. The review meeting was held at the National Institute o f EnvironmentalHealth Sciences, Research Triangle Park, NC.
Dr. R.D. Irwin, NIEHS, introduced the toxicology and carcinogenesis studies o f tricresyl phosphate by discussing the uses and rationale for study, describing the experimental design, reporting on survival and body weight effects, and commenting on compound-related nonneoplastic lesions in rats and mice. The proposed conclusions wereno evidence of carcinogenic activity o f tricresyl phosphate in male o r female rats o r mice.
Dr. van Zwieten, aprincipal reviewer, agreed with the proposed conclusions. He thought the description o f the rationale for maximum tolerated dose was extremely well done.
Dr. Davidson, the second principal reviewer, agreed with the proposed conclusions. She asked for an explanation why there was high mortality in male and female rats that received 2,900 mg/kg in the 16-day gavage study, while at double that dose there was no mortality. Similarresultswere observed in mice. Dr. Irwin said the higherdose was pure tricresyl phosphate, which is a liquid, while the lower dose was the chemical diluted with an equal amount o f corn oil.
He speculated that the corn oil may have enhanced the absorption. Because dosed feed was used in the 2-year studies, thisobservation was not pursued further.
Dr. Bailey, the third principal reviewer, also agreed with the proposed conclusions. He said that mention needed to be made in the introductory toxicity section that tricresyl phosphate esters with only one ortho-cresyl substituent are much morepotent neurotoxicants than the tri-ortho-cresyl ester. He provided a reference.
Dr. Ryan inquired as to why extensive neurotoxicity testing was reported in an appendix but there was little discussion o f the results. Dr. Irwin replied that neurotoxicity was considered to be a possible complicating factor that might interfere with evaluation of carcinogenic potential. Tests such as measurementof gripstrength in response to acousticandthermal stimuli were intendedt o determine whether therewas neurotoxicity present. In public comments, Dr. Mary Barth, Mobil Oil Corporation, reportedthat there are several unpublished studies that indicate tricresyl phosphate is somewhat more toxic with corn oil as a vehicle than with mineral oil as a vehicle.
Dr. van Zwieten moved that, the Technical Report on tricresyl phosphate be accepted with the revision discussed and with the conclusions as written for male and female rats and mice, no evidence of carcinogenic activity. Dr. Bailey seconded the motion, which was accepted unanimously with nine votes.

13
INTRODUCTION
TRICRESYL PI-IOSPHATE
CAS NO.1330-78-5
ChemicalFormula: &,H,,O,P
PHYSICAL AND CHEMICAL PROPERTIES Tricresyl phosphate is a clear, colorless,viscous liquid with a specific gravity o f 1.15 t o 1.16,a freezing point o f -33" C, andboilingpoint o f 240" to 250" C at 4mm Hg (Merck Index, 197G). Structurally, tricresyl phosphate is a triester o f cresol and phosphoric acid. Cresol can exist as three isomers (ortho-, meta-, and para-)dependingontherelativepositions o f the methyl and phenolic hydroxyl groups, resulting in 10 structurallydistinguishabletriesters o f cresoland phosphoric acid.
PRODUCTION, USE, AND HUMANEXPOSURE Themostcommonmethodfor the synthesis o f tricresyl phosphate involves the reaction o f phosphorusoxychloride with apreparation o f cresols composed o f a mixture o f the three isomers. Therefore, the compositiono f the final product depends on the isomeric composition o f the cresol preparation and may include a certain percentage o f each o f the tendistinguishabletriesters. A commonsource o f cresol preparations has beenthe high-boiling phenolic fractions obtainedduringpetroleum refining. Morerecently,however, the petroleumfeedstocks which are oftencontaminated with other phenolic compounds have been replaced by cresols prepared synthetically, which produce a more uniform product (IPCS, 1990).
MolecularWeight: 363.36
Tricresyl phosphate is primarily used as a vinyl plasticizer in the manufacture o f vinyl plastics for automotive interiors and as a fire-retardant and anti-wearadditive to industrial suchlubricants as hydraulic fluids, extreme pressure fluids, cutting oils, machine oils, automotive transmission fluids, and certain lubricants.Currentcooling production figures for tricresyl phosphateareunavailable; however, the use o f tricresyl phosphate in these applications has declined considerably over the last 5 years because o f itsreplacement by lower cost synthetic(tri-isopropylphenyltriaryl and tri-t-butylphenyl-) phosphates and high water-based o i l emulsions in hydraulicandindustrial fluids (Chemical and Economics Handbook, 1988).
Tricresyl phosphate hasbeendetectedinair,soil, sediment, water, and various aquatic organisms, with the greatest contamination present in heavily indus- trializedareas.Concentrationsmeasuredintheair overproduction facilities in the U.S. rangedfrom 0.01 to 2 ng/m3, however levels as high as 26 to 70 ng/m' have been detected over the Japanese city o f Matsuyama. Tricresyl phosphate hasbeendetected at low concentrations in surface water near production sites. Although i t is not very soluble in water, it is readily absorbed intosediment; levels of 400 to 600 ng/g have beenmeasuredinsedimentfrom Baltimore Harbor and230 t o 1,300 ng/g in sediments from the Detroit River. Tricresyl phosphate has been detected at concentrations o f up to 40 ng/g of tissue

14
in sturgeon from the Columbia River and2 t o 5 ng/g o f tissuein fish inhabiting lakesand rivers near tricresyl phosphate manufacturing facilities (IPCS, 1990).
METABOLISM,EXCRETION,DISTRIBUTION,AND ABSORPTION Studies o f the metabolism, distribution, and pharmacokinetics o f tricresyl phosphate publishedtodate haveexaminedisomericallypuretriestersin which onlyasinglecresolisomerwasesterified to phosphoric acid. There have been no studies which have attempted to characterize the metabolism o f tricresyl phosphate prepared from mixed isomers.
Tri-o-cresyl phosphate is the most widely studied tricresyl phosphate. Themetabolism of thiscompound has been examined in rats (Casida et of.,1961; Abou-DoniaandNomeir, 1986; Somkutiand Abou-Donia,1990),chickens(Abou-Donia et af., 1990), and cats (Nomeir and Abou-Donia,1986) and can be described by the pathways shown in Figure 1. However,therearespeciesspecificquantitative differences inthe relative amountso f various metabolites produced and in the rate o f their formation and excretion. The initial step appears to involve oxida- tion o f the ring methyl group o f one o r more o f the three o-cresyl groups to produce an o-hydroxy benzyl alcohol(saligenin)residue(Et0 e r of., 1962). This reaction occurs in the liver and is catalyzed by mixed function oxidases. The product o f the reaction then cyclizes via an internal group displacement reaction in which the hydroxyl group o f anortho-hydroxy benzyl alcohol residue displaces a neighboring cresol/ o-benzyl alcohol group. This reaction, and hence the formation o f the cyclic phosphate has been shownto occuronlywith tri-o-cresyl phosphate; however, in theoryitcouldoccurwheneverone o f the cresol groupsesterified to phosphoricacid was o-cresol. The positiono f the methyl group in n l - o r p-cresol is such that the corresponding benzyl alcohol residue cannot participate in this type o f internal cyclization when these latter compounds are esterified t o phosphoric acid. Since no“C02 is formed when the label is in the cresol ring, the ring is not degraded, and the finalproduct o f the pathway is o-hydroxy benzoic acid, which is excreted in the urine either free or as a conjugate.
The metabolism o f tri-p-cresyl phosphate has been evaluatedinWistarrats(Kurebayashi et nl., 19S5)
Tricresyl Phosphate, NTP TR 433
and the pathways leading to the formation o f the major metabolites are shown in Figure2. Once again the initial reaction is the oxidation o f a ring methyl group t o formap-hydroxy benzyl alcohol residue; however, as mentionedabovethismetabolitedoes not cyclize like the corresponding metabolite of the o-cresol triester. The final product o f the degradationpathway is p-hydroxybenzoicacidwhich is excreted in the urine. The metabolism of tri-m-cresyl phosphate has not been evaluated.
The distribution and excretiono f 14C-labeled isomer- ically pure tri-o-, t r im- and tri-p-cresyl phosphates hasbeenexaminedinF344/Nrats (NTP, unpublished). Groups o f male rats were administered2,20, or 200 m a g o f the respective 14C-labeled isomeric- ally pure tricresyl phosphate in corn oil by gavage, o r 20 mg/kg was administered intravenously. All three compounds were well absorbed afteroral administration; however, the patterno f excretion o f each o f the threetriesters was different. Tri-o-cresyl phos- phate was excretedprimarilyin the urinewith approximately 70% o f the label appearing in urine and 20% in feces within 24 hours for all three dose levels administered. Tri-nz-cresyl phosphate was excreted primarily in the feces at all four dose levels administered (0.5, 2, 20, o r 200 mg/kg); however, as the dose increasedthepercentageexcretedinthe feces also increasedandthatexcretedinurine decreased. Tri-p-cresyl phosphate exhibitedyeta differentexcretionpattern;atlow doses (0.5 o r 2 mg/kg) the primaryroute o f excretionwasthe urine, whereas at higherdoses (20 o r 200 mg/kg) the primary route o f excretion was the feces.
Evaluation o f biliary excretion following intravenous administration indicated that after administration of 2 o r 20 mg/kg tri-o-cresyl phosphate o r tri-nt-cresyl phosphate approximately 40% t o 60% o f the label was excreted in the bile withinthefirst 6 hours. However, tri-p-cresyl phosphate exhibitedadose dependentincreasewhichrepresentedanapproximatedoubling o f biliary excretionbetween the 2 mg/kg and 20 mg/kg doses. The percentage o f administered label appearing in feces was less than that excreted inbile for all three triesters, suggesting that enterohepatic recyclingsubstantial occurs. Within 3 days afteradministrationessentially 100% o f the label o f allthreeisomershadbeen excreted. All three isomers were rapidly distributed t o muscle and liver and then redistributed to adipose tissue and skin; however,the parent compounds were

CHJ 0 CHJ
O-o-i-o-b o
c6r~' , CHJ 0 CHJ
O-o-i-o-b o
fy~ do<' U /' 19 " d~' " c~ Q;-o - r -, Q;-o-j-o-y
~~ + 0_ CHJ 0 /
d HJ " O-O-~-OH Q;-~ !
©i~~ +
, CHJ 0
. O-O-~-~ I
+ OH
- -
Introduction 15
FIGURE 1
Metabolic Pathway of Tri-o-cresyl Phosphate

o
~-©-O-~-O-©-CH' o
~ CH,
o
M,c-©-O-~-O-©-CM~
~ 0
M,c-©-O-~-O-©-COON o
~ COON , o
H,c-©-OW + H,c-©-O-~-ow ow
o
MIC-©-O-~-ow + o
~ COON
16 Tricresyl Phosphate, NTP TR 433
FIGURE 2 Metabolic Pathway of Tri-p-cresyl Phosphate

Introduction
rapidly clearedwith no tendency t o bioaccumulate in specific organs o r tissues.
Within12hoursofdermaladministration o f a 50 mgkg dose of 14C-tri-o-cresyl phosphate to the intrascapular region o f cats, 73% of the radioactivity haddisappearedfromthesite o f application,and within 24 hours it reached its maximum concentra- tion in all organs and tissues examined (Nomeir and Abou-Donia, 1986). Within 10 days after administration, 28% o f the appliedradioactivityhadbeen excreted in the urine and20% in the feces. Although studies o f skin absorption have not been conducted withotherisomeric tricresyl phosphate esters,the similarity o f structure and physical properties (solubility, etc.) make it likely that these compounds are also absorbed through the skin.
TOXICITY Experimental Animals The values reported for the LD,, o f tricresyl phos- phatepreparedfrom mixed cresol isomersshow considerablevariationasillustrated in Table 1. As the values for the pure isomers suggest, the orthoisomer is more toxic than the meta- or para- isomer.
The centralandperipheralnervous systems have been identified as target organs sensitive to tricresyl phosphate toxicity. Neurotoxicity causedby exposure to tri-o-cresyl phosphate(andotherneurotoxic organophosphates) is characterized by a delay in the development o f symptoms until1t o 3 weeks after the initial exposure. A s a result it is commonly referred toasdelayedneurotoxicity o r organophosphateinduceddelayedneurotoxicity(OPIDN) (Davies, 1963; Abou-DoniaandNomeir, 1986). Insensitive animal species such as the chickeno r cat, the clinical course usuallybegins with ataxia approximately 1week after exposure andprogressively develops into complete paralysis o f t h e hind limbs. Following the development o f complete paralysis, there is usually a period o f partialclinical recoverywhich may be minimal in severe cases o f poisoning.
The other major site o f tricresyl phosphate toxicity is the reproductive system. Tricresyl phosphate (mixed isomers) administered orally reduced fertility in both ratsand mice and causedtesticularandovarian toxicity. Exposure to tricresyl phosphate prior t o and during mating caused a significant reduction o f the
17
fertility index and mean litter size in Long-Evans rats (Carlton et al., 1987). Among F, males there was a dose-relateddecreaseinepididymalweightand a markedincreasein the percentage o f spermwith abnormalmorphologyineach dose group.In the high-dose group, sperm concentration, motility, and progressive linear movement were significantly lower thanthatin the controls.Exposure to tricresyl phosphate prior t o and during a 98-day continuous breeding study did not reduce the fertility index of Swiss (CD-l@) mice; however, the number o f litters perbreedingpairdecreasedwithdoseandthe proportion o f live-born pups and mean pup weight were significantly decreased in groups receiving the highestdose o f tricresyl phosphate (0.2% in feed; Chapin et al., 1988). A crossovermatingtrial revealed impaired fertility in both males and females. Epididymalweights o f high-dose F, males were significantly reduced and histopathologic examination indicateddose-relatedatrophy o f the seminiferous tubules.Therewerenochemical-associatedhistopathologic lesions found in the reproductive tract of F, females. The last born litter during the continuous breeding study was reared to 74 days o f ageandpairswithin the same dose groupswere allowed t o mate. The fertility index and the number and proportion o f live pups born were decreased in animals from the high-dose group. Among F,males sperm concentration and morphology were normal; however, motility was lower than that o f controls in tricresyl phosphate exposure groups.
Humans Thecentralandperipheralnervous systems of humans are also a siteo f tricresyl phosphate toxicity. The first indication that tricresyl phosphate was a neurotoxindates back to 1896 whenneurological symptomswerereportedintuberculosispatients treatedwithphosphocreosote.However, the most definitive studies were those reported by Smith and Elvove (1930) involving anoutbreakof paralysis associatedwiththeconsumptionbeveragesofcontainingagingerextract.UnitedStatesPharmacopeia fluid extracts o f gingercontainedahigh content o f alcohol (up t o 75% by volume); however, during prohibitionthe Prohibition Bureau considered it a non-potable beverage and therefore not subject t o regulation.Notsurprisingly,itbecame very popular for use as a beverage base, especially in rural areas o f Ohio,Tennessee,andKentucky,and was often rebottled and distributed locally under several

Tricresyl Phosphate, NTP TR 43318
TABLE1 The Acute Toxicity of Tricresyl Phosphate to Different Speciesa
Compounds Route of Species Administration
phosphateTricresyl ora l rat oral isomers)(mixed rat
oral mouse oral chicken dermal rabbit dermal cat
Tri-ocresylphosphate ratoral oral rat oral rabbit oral chicken oral chicken
Tri-p-cresylphosphate rabbitoral chicken
Tri-m-cresylphosphate rabbitoral oral chicken
a FromIPCS(1990).
different brand names. It was in association with the consumption o f aparticular lot o f beveragethat severalhundredcases o f paralysis werereported beginning in February1930. In subsequent investiga- tions, Smith (1930) was able to identify t h e offending substance in the beverage as tricresyl phosphate,.and in particular tri-o-cresol phosphate, which was added as a flavoring agent. Since then, tenso f thousands o f people have suffered varying degrees o f neurotoxicity asaresult o f exposure t o tricresyl phosphate. In most cases the exposure has resulted from accidental ingestion o f hydraulic fluid, lubricating oil , mineral oil , or some similar fluid which contained tricresyl phosphate. Cooking oil contaminated with hydraulic fluid o r lubricating oil has beenthe source o f several large scale human exposures which have resulted in the development o f polyneuropathy (IPCS, 1990).
Insensitiveanimalspecies,symptoms o f tricresyl phosphateneurotoxicityorthatcaused by other neurotoxic organophosphates develop 1 to 3 weeks after the initialexposure. In humans, the first noticeable symptom is soreness and/or weakness o f the legmuscles which may begin from 5 days t o 2 weeks after exposure (IPCS, 1990). Over the next several days the symptoms may progress t o partial
LD, (mdkg) Reference
5,190 Marhold (1972) > 15,800 Johannsen (1977)
3,900 Izmerov (1982) > 10,000 Johannsen et al. (1977) > 7,900 Johannsen er al. (1977)
1,500 Abou-Donia et aL (1980)
8,400 Johannsen et al. (1977) 1,150 Varonesi et al. (1984) 3,700 Johannsen el aL (1977)
500 Kimmerle and h s e r (1974) 100-200 Smith et al. (1932)
> 3,000 Smith er al. (1932) > 1,000 Smith et al. (1932)
> 3,000 Smith et al. (1932) > 2,000 Smith et al. (1932)
paralysis o f the extremities in mild caseso r complete paralysis in more severe cases. A s in sensitive animal species, the development o f complete paralysis may be followed by a period o f partialclinical recovery that may be minimalinsevere cases o f poisoning. Follow-up studies conducted after several large scale humanexposureshaveindicatedthatneurological disorders may persist for many years; for instance, o f the 11survivors o f the 1930 poisoning in the southwest U.S. still living 47 yearslater,allexhibited spasticity and abnormal reflexes characteristic of an uppermotorneuronsyndrome and(MorganPenovich, 1978).
Inbothhumansandsensitiveanimalspecies,the onset o f delayed neurotoxicity is associated with the presence o f a distal axonopathy whichis most prominent in lofig, large diametermyelinatedaxonsof peripheralnervesandlongspinal tracts(Cavanagh andPatangia, 1965; Bouldin andCavanagh, 1979a; 1979b). Theaxonopathybeginsinitiallyasanonterminal focal lesion resembling a transection o f the axon; the portion o f the severed axon distal to the site o f transectionthendegeneratesfollowed by degeneration o f the myelin sheath surrounding this distalportion o f the neuron. During the period of

19 Introduction
clinicalrecovery, peripheral nerve fibers regenerate relatively quickly (weeks), however recovery of long spinal tracts occurs much more slowly or not at all. The strong correlation between the development of symptoms o f delayed neurotoxicity and the appearance and progression of the axonopathy suggest a causal relationship.
Only tricresyl phosphates in which at least one of the cresol residues is an ortho-isomer are neurotoxic; triesters which contain only meta- or para- isomers (or both) are not neurotoxic. Since metabolism of the ortho residue leads to the formation of a reactive cyclic phosphate which cannot form frommeta- or para- cresol residues, the reaction of the cyclic phosphate with a particular target molecule(s) has been proposed as a critical step in t h e ultimate development of axonopathy and, hence, neurotoxicity. Moreover, the cyclic phosphate, when administered directly, is much more neurotoxic than an equivalent amount of parent tri-o-cresyl phosphate, providing further support for its importance i n the development of axonopathy (Jortner and Ehrich, 1987). Henschler (1958) examined the neurotoxicity of tricresyl phosphate containing various isomeric compositions, and the results indicated that preparations in which o-cresol was present predominantly as a mono-ester, with the remaining two positions being occupied by m -and/orp-cresol, were more neurotoxic to chickens than preparations containing predominantly tri-ocresyl phosphate. Therefore, preparations composed of o-cresol containing mixed triesters exhibit toxicity similar to that usually associated with tri-o-cresyl phosphate.
CARCINOGENICITY Experimental Animals There are no published studies which have evaluated the carcinogenic potential of tricresyl phosphate or the consequences of long-term exposure in animals.
Humans No case reports or epidemiological studies considered pertinent to an assessment of human carcinogenicity were found in the literature.
GENETICTOXICOLOGY Tricresyl phosphate did not induce gene mutations in Sdntonello r)phintnriz.mt strains, with o r without S9 (Haworth et nl., 1983)
STUDYRATIONALE Because of the documented sensitivity of humans to tricresyl phosphate, its use in functional fluids and the associated potential for occupational exposure, the possibility of increased environmental contamina- tion, and the absence of information about the consequences of long-term exposure, tricresyl phosphate was selected as a representative organo- phosphate for in-depth toxicologic testing and evalua- tion of its carcinogenic potential. Since the toxicity of isomerically mixed preparations had not been well characterized, the prechronic studies were conducted by two routes o f administration: gavage and dosed feed.

21
MATERIALS AND METHODS
PROCUREMENT AND CI-IARACTERIZATION OF TRICRESYLPHOSPHATE Tricresyl phosphate was obtained as a clear, colorless liquid from Stauffer Chemical Company (Westport, CT) in one lot (1202A-2-7) which was used through- out the 16-day,13-week, and 2-year studies in rats and mice. Identity, purity, and stability analyses were conducted by the analyticalchemistrylaboratory, MidwestResearchInstitute(Kansas City, MO). Confirmatoryanalyseswereconducted by Radian Corporation (Austin, TX).
Thechemical was characterized by infrared, ultravioletbisible,andnuclearmagneticresonance spectroscopy.Purity was determined by elemental analyses, KarlFischerwater analysis, thin-layer chromatography, and gas chromatography. Elemental analyses for carbon, hydrogen, and phosphorus were in agreement with the theoretical values for tricresyl phosphate. K a r l Fischerwater analysis indicated 0.072% water. Thin-layer chromatography indicated only one major spot in eachsystem. Gas chromatography indicated 28 components, with nine o f these having peak areasgreaterthan2% o f thetotal chromatographicpeakarea. The concentrations o f tri-m-cresyl phosphate and tri-p-cresyl phosphate wereestimatedat 21% and 4% o f the total. T h e concentration o f tri-o-cresyl phosphate was estimated at less than 0.1%.
Special analyses using gas chromatography and mass spectrometrywereperformedto identify the other sevencomponents o f tricresyl phosphate, which representgreaterthan2% o f the totalchromatographic peak area. Two peaks representing 24% and 30% of the totalchromatographicpeakareawere
phosphateesterswereidentifiedas tri-rn-cresyl phosphate (21%) and tri-p-cresyl phosphate (4%) with no detectable tri-o-cresyl phosphate (<0.1%).
Stabilitystudieswereperformed by the analytical chemistrylaboratoryusinggaschromatography. Thesestudiesindicatedthat tricresyl phosphate, based o n the four major components, was stable asa bulkchemical for atleast2weekswhenstored protectedfromlightattemperaturesupto 60" C. The stability o f the bulkchemical was monitored periodically at the study laboratory with ultraviolet spectroscopy and gas chromatography methods similar t o those described above. No degradation of the bulk chemical was observed.
PREPARATION AND ANALYSIS OF DOSEFORMULATIONS T h e dose formulationsuspensionsfor the gavage studies were prepared by mixing tricresyl phosphate in USP grade corn oil , except the high dose in the 16-day studies, which was given neat. Dose formulations for t h e feed studies were prepared by mixing tricresyl phosphate withfeed in a blender (Patterson-Kelley Twin Shell with intensifier bar) for15 minutes (Table 11). Doseformulationswerepreparedonce for t h e 16-day studies and weekly for the 13-week and 2-year studies. The stability o f the gavage dose formulations was confirmed, based on the four major components, for at least 2 weeks at room temperature when stored in the dark, and for 3 hours when exposed t o airand light. Forthe feed studies, homogeneity was confirmed and the stability o f the dose formulations was established, again basedon the four major components, for at least 2 weekswhen stored in the dark at 23" C.
identified astricresyl phosphate esters whose isomeric compositions couldn o t be confirmed. The remaining Periodic analyseso f the dose formulations o f tricresyl five peaks (2%, 3%, 3%, 4%, and 5%) were identi- phosphatewereconducted by thestudylaboratory fied as dicresyl phosphate esters,butagain the using ultraviolet spectroscopy (16-day and 13-week isomeric composition could not be confirmed. gavage studies), high performance liquidchroma
tography (13-week feed studies),andgaschroma-To summarize, the test chemical is a complex mixture tography (13-week and 2-year feed studies). All dose consisting o f 18% dicresyl phosphate estersand formulations were analyzed duringthe 16-day studies 79% tricresyl phosphate esters. Two o f the tricresyl (Table 12). During the 13-week studies, the dose

22
formulationswereanalyzedatbeginning,themidpoint, and end o f the studies (Tables I3 and 14). During the 2-year studies, the dose formulations were analyzed every 6 t o 10 weeks(Table 15). Inthe 2-year studies all dose formulations (89/89) were within 10% o f the target concentrations. Results o f theperiodicrefereeanalysesperformed by the analyticalchemistrylaboratorywereinagreement with the resultsobtained by the studylaboratory (Tables 16 and 17).
DAY GAVAGESTUDIES Male and female F344M rats and B6C3Fl mice were obtained from Charles River Breeding Laboratories (Kingston, NY). At receiptthe rats were 30 days old and mice were 40 days old. The animals were quarantinedfor 20 t o 22 days before dosing began. During this time two males and two females o f each specieswererandomlyselectedandevaluatedfor evidence o f disease.
Groups o f 10 maleand 10 femaleratsand mice received tricresyl phosphate gavage at doses o f 0,360, 730, 1,450, or 2,900 mgkg body weight (in corn oil), o r 5,800 mgkg body weight (neat) for 13 or 14 days. Animals were housed five per cage; water and feed wereavailable ad l i b h r n l . Clinicalfindings were recorded once daily. Animals were weighed at s tudy initiation, oncea week, and a t the end o f t h e studies. Details of study design and animal maintenance are summarized in Table 2.
Neurobehavioralassessmentswereperformedone week before the beginningo f the studies and the day beforescheduled necropsy. All ratsandmicewere tested for spontaneous motor activity, forelimb and hindlimb grip strength, startle response, andpaw-lick latency. Further details are provided in Appendix H.
A gross necropsy was performed on all rats and mice. The brain, heart, right kidney, liver, lung, right testis, and thymus o f rats and mice were weighed. Tissues for microscopic examination were embeddedin paraf- fin, sectioned to a thicknessof 4 to6 pm, and stained with hematoxylin and eosin. Histopathologic examinations conductedonallratswere receiving 5,800mgkg, all rats dying early, and all mice receiv- ing 2,900 mgkg. In addition, the mandibular lymph node,spleen,andthymus o f allcontrols,ratsand surviving male mice that received1,450 m a g , rats that received 2,900 mgkg,and survivingmice tha t
Tricresyl Phosphate, NTP TR 433
received 5,800 mgkgwereexamined. The tissues examined microscopically are listed in Table 2.
1 3 - w ~ ~ ~GAVAGESTUDIES The 13-week gavage studieswereconducted to evaluate the cumulative toxic effects o f repeated exposure t o tricresyl phosphate.
Male and femaleF344/N rats and B6C3Fl mice were obtained from Simonsen Laboratories, Inc. (Gilroy, CA); rats were 40 days old and mice were 41days old upon receipt. Rats were quarantined 27 to 30 days andmicewerequarantined 19 t o 22 days before dosingbegan. A t this time, five males and five females o f each species were randomly selected and evaluated for evidence o f disease. At the endof the study, serology samples were collected fromfive male and five female control rats for murine virus antibody determinations (Appendix L).
Groups o f 10 maleand 10 femaleratsandmice received tricresyl phosphate in corn oil by gavage a t doses of 0,50,100, 200, 400, o r 800 mgkg body weight 5 days per week for 13weeks. Rats and mice werehoused five per cage; water and feed were available ad l ibinmt. Clinical findings were recorded once weekly. The animalswereweighedatstudy initiationand weekly thereafter. Furtherdetails o f s tudy design and animal maintenance are summarized in Table 2.
Neurobehavioral assessments o f spontaneous motor activity, forelimb and hindlimb grip strength, startle response, and paw-lick latency were performed on all ratsand mice one weekbeforedosingbeganand again onthe dayprior t o scheduled necropsy. Further details are provided in Appendix H.
At the end o f the 13-week gavage studies, blood was collectedfromthevena cava (rats) or by cardiac puncture (mice) for hematology and clinical chemistry analyses. The parameters measured are listed in Table 2.
A necropsy was performed o n all animals. The brain, heart, right kidney, liver, lung, left testis, and thymus o f ratsandmicewere weighed. Tissuesformicroscopicexaminationwereembeddedinparaffin, sectioned t o a thickness o f 4 t o 6 pm, and stained with hematoxylin and eosin. A complete histopathologic examination was performed on all controls, all

23 Materials and Methods
animals dying early, and all rats and micereceiving 800 mgkg. In addition, the adrenal gland,ovary, and spinalcord and sciaticnerveof a l l dosedratsand mice andtestes of ratswereexaminedmicroscopically. The tissues examined microscopically are listed in Table 2.
13-WEEK FEEDSTUDIES The 13-week feed studies were conducted to evaluate the cumulative toxic effects of repeated exposure to tricresyl phosphateand to determine the appropriate doses to be used i n the 2-year studies.
Male and female F344/N rats and B6C3Fl mice were obtainedfromFrederickCancerResearchFacility (Frederick, MD); all rats and mice were 28 days old uponreceipt.Theanimalswerequarantinedfor 15 or 16 days before exposure began.At this time, fivemalesandfivefemalesofeachspecieswere randomlyselected and evaluatedforevidence o f disease. At the end of the studies, serology samples were collected from fiverats a n d mice of each control groupformurinevirusantibodydeterminations (Appendix L).
Groups of 10 male and 10 female rats were fed diets containing 0, 900, 1,700, 3,300, 6,600, or 13,000 ppm of tricresyl phosphate 7 days per week for 13 weeks; groups of 10 male and 10 female mice were fed diets containing 0, 250, 500, 1,000,2,100, or 4,200 ppm of tricresylphosphate 7 days perweekfor 13 weeks. Rats were housedfivepercage;micewerehoused individually.Water a n d feedavailableweread l i b i n m t . Feedconsumption wasmeasured once weekly, and clinicalfindingswererecordedonce weekly. The animals were weigheda t study initiation and weekly thereafter. Further details of study design and animal maintenance are summarized in Table 2.
Neurobehavioral assessments of forelimb and hind-limb grip strengthwereperformed on a l l rats and mice the day before the beginning of the studies,and again on the day priortoschedulednecropsy. Further details are provided i n Appendix H.
At the end of the 13-week feed studies, blood was collectedfrom the orbital sinus o f a l l animalsfor hematology analysesand from the vena cava (rats) or by cardiacpuncture(mice)forclinicalchemistry analyses.Theparametersmeasured are listed in Table 2.
A necropsy was performed on all animals. The brain, heart, right kidney,liver,lung, right testis,and thymusof rats and micewereweighed.Tissuesfor microscopic examination were embedded in paraffin, sectioned to a thicknessof 4 to 6 pm, and stained with hematoxylin and eosin. A complete histopathologic examination was performedon all controls, rats exposedto13,000ppm, and miceexposed to 4,200 ppm. In addition, the adrenal gland, epididymis, kidney, ovary, pi tui tary gland (males), and testis of rats exposed to900, 1,700,3,300, or 6,600 ppm and the adrenal gland, gallbladder, kidney, ovary, sciatic nerve, and spinal cord of miceexposedto250, 500, 1,000, or 2,100ppm were examined. Table 2 lists the tissues and organs micro-routinelyexamined scopically.
%YEAR FEEDSTUDIES Study Design Groups of 95 male a n d 95 female rats were fed diets containing 0, 75, 150, or 300 ppm of tricresyl phosphate for104weeks;groupsof 95 maleand 95 female mice were fed diets containing 0, 60, 125, or 250 ppm oftricresyl phosphatefor 105 weeks. Fifteen male and 15 female rats and mice per exposuregroupwererandomlyselectedforinterim evaluationsafter3, 9, and 15months ofchemical administration. An additional group of 95 male and 95 female rats were fed diets containing 600ppm of tricresylphosphatefor22weeksandthenreceived onlycontrolfeed.Basedon thefindings a t the 3-month interim evaluation, the core group of male a n d femaleratsreceiving600 ppm werekilledand discarded; the remaining 30 maleand 30 female rats fed600 ppm were examined a t the 9- and 15-month interim evaluations.
Source and Specification of Animals Male and female F344/N rats and B6C3Fl mice were obtained from Simonsen Laboratories, Incorporated (Gilroy, CA) for use in the 2-year feed studies. Rats and micewere quarantined for 11 to 14 days before the beginning of the studies. Five rats and five mice of each sex were randomly selectedand evaluated for evidence of disease. Serology samples were collected for viral screening. Rats and mice were 6 weeks old a t the beginning of the 2-year studies. The health of theanimals was monitored during the studies accordingtotheNTPSentinelAnimalProgram (Appendix L).

24 Tricresyl Phosphate, NTP TR 433
Animal Maintenance Rats were housed five per cage; mice were housed individually. Feed and water were available ad libitum, and feed consumption was measured once monthly (Appendix J). Cages were rotated every 2 weeks. Further details of animal maintenance are given in Table 2. Information on feed composition and contaminants is provided in Appendix K.
Clinical Examinations and Pathology All animals were observed twice daily. Clinical findings and body weights were recorded initially, weekly for 13 weeks, then monthly and at the interim evaluations. Neurobehavioral assessments were performed before exposure began and prior to necropsy at the 3-, 9-, and IS-month interim evaluations. Further details are given in Appendix H. Blood was collected from the orbital sinus of all animals at the 3-, 9-, and IS-month interim evaluations for hematology and clinical Chemistry. The parameters measured are listed in Table 2. The left and right adrenal gland, brain, left and right kidney, liver, and left and right testis of rats and mice were weighed at the 3-, 9-, and IS-month interim evaluations.
A necropsy was performed on all animals. At necropsy, all organs and tissues were examined for gross lesions, and all major tissues were fixed and preserved in 10% neutral buffered formalin, processed and trimmed, embedded in paraffin, sectioned, and stained with hematoxylin and eosin for microscopic examination. In addition, up to five male and female rats and mice per dose group were selected for special neuropathology at the interim evaluations. The animals were anaesthetized with sodium pentobarbital and total body perfusion was accomplished with 2% heparinized Ringer's solution followed by 2.5% glutaraldehyde. The brain, sciatic nerve, and spinal cord were removed and placed in 10% neutral buffered formalin, processed as described above, and stained with hematoxylin and eosin, luxol fast bluel cresyl fast violet, and Bodian's stain. Complete histopathologic examinations were performed on all rats and mice and on all tissues with grossly visible lesions. Tissues examined are listed in Table 2.
MiCroscopic evaluations were completed by the study laboratory pathologist, and the patholoh'Y data were entered into the Toxicology Data Management
System. The microscopic slides, paraffin blocks, and residual wet tissues were sent to the NTP Archives for inventory, slide/block match, and wet tissue audit. The slides, individual animal data records, and pathology tables were evaluated by an independent quality assessment laboratory. The individual animal records and tables were compared for accuracy, the slide and tissue counts were verified, and histotechnique was evaluated. The quality assessment pathologist reviewed the pituitary gland and liver of male rats and the adrenal cortex, ovary, and liver of female rats to verify the incidence and severity of selected nonneoplastiC lesions. Neoplasms of the pituitary gland pars distalis, skeletal muscles, and liver of male rats and neoplasms of the liver of female rats were also reviewed to verify the diagnoses. The spleen and liver of male and female rats were also reviewed to verify the incidences of mononuclear cell leukemia. For mice, the quality assessment pathologist reviewed the adrenal gland of males and females and the liver of males to verify the incidence and severity of selected nonneoplastic lesions. Further, neoplasms of the adrenal medulla and harderian gland of male and female mice, neoplasms of the small intestine, pancreatic islets, and gallbladder of male mice, and neoplasms of the liver, pituitary gland pars intermedia, skeletal muscle, and ovary of female mice were reviewed to verify the diagnoses.
The quality assessment report and slides were submitted to the NTP Pathology Working Group (PWG) chair. Representative histopathology slides containing examples of disagreements in diagnosis between the laboratory and quality assessment pathologists, or lesions of general interest were presented by the chair to the PWG for review. The PWG consisted of the quality assessment pathologist and other pathologists experienced in rodent toxicologic pathology. This group examined the tissues without any knowledge of dose groups or previously rendered diagnoses. When the consensus opinion of the PWG differed from that of the laboratory pathologist, the diagnosis was changed. Thus, the final diagnoses represent a consensus of contractor pathologists and the PWG. Details of these review procedures have been described, in part, by Maronpot and Boorman (1982) and Boorman et af. (1985). For subsequent analyses of pathology data, the diagnosed lesions for each tissue type were evaluated separately or combined according to the guidelines of McConnell et af. (1986).
25 Materials and Methods
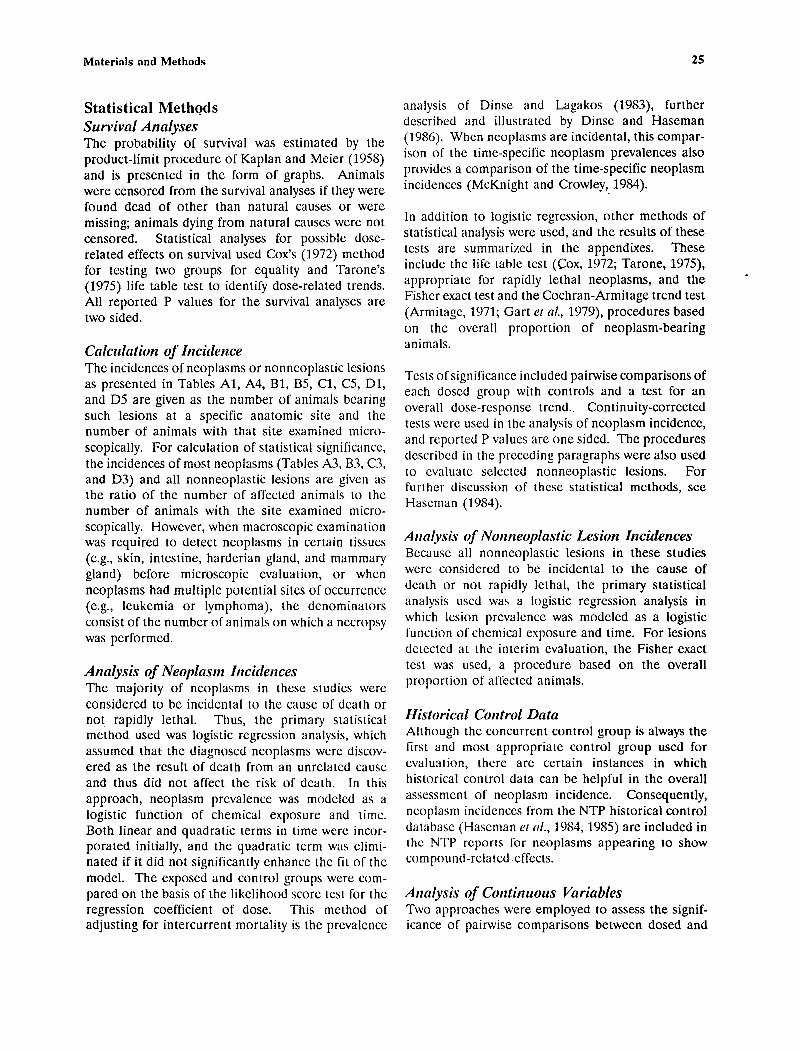
Statistical Methods Survival Analyses The probability of survivalwas estimated by the product-limit procedure of Kaplan and Meier (195s) and is presented i n the form of graphs. Animals were censored from the survival analyses i f they were founddead of other t h a n natural causes or were missing; animals dying from natural causes were not censored.Statisticalanalysesforpossibledoserelated effects on survival used Cox's (1972) method fortesting two groups forequality and Tarone's (1975) life table test to identify dose-related trends. A l l reported P valuesfor the survival analyses are two sided.
Calculation of Incidence The incidences of neoplasms or nonneoplastic lesions as presented in Tables Al, A4, B1, B5, C1, C5, Dl, and D5 are given as the number of animals bearing suchlesions a t a specificanatomic site a n d the number of animals wi th tha t site examined microscopically. For calculation of statistical significancc, the incidences of most neoplasms (TablesA3, B.3, C3, and D3) and a l l nonneoplastic lesions are b'wen as the ratio of the number of affected animalstothe number of animals wi th the site examined microscopically. However, when macroscopic examination was required todetectneoplasms in certaintissues (e.g., skin, intestine, harderian gland, a n d mammary gland)beforemicroscopicevaluation, or when neoplasms had multiple potential sites of occurrence (e.g.,leukemia or lymphoma),thedenominators consist of the number of animals on which a necropsy was performed.
Analysis of Neoplasnt Incidences Themajority of neoplasms i n thesestudies were considered to be incidental to the cause of death or not rap id ly lethal.Thus,the primary statistical method used was logisticregressionanalysis, which assumed that the diagnosed neoplasms were discovered as the result of death from an unrelated cause and thus did notaffect the risk o f death. In this approach, neoplasm prevalence wasmodeledas a logisticfunction of chemical exposure a n d time. Both linear and quadratic terms in t i m e were incorporated init ially, and the quadratic term was eliminated if it did not significantly enhance the f i t of the model.Theexposed a n d controlgroupswerecompared on the basis of the likelihood score test for the regressioncoefficient of dose.Thismethod o f adjusting for intercurrent mortality is the prevalence
analysis o f Dime and Lagakos(19S3), further described and illustrated by Dinse a n d Haseman (19S6). When neoplasms are incidental, this comparisonof thetime-specificneoplasmprevalencesalso provides a comparison of the time-specific neoplasm incidences (McKnight and Crowley, 1984).
I n addition to logistic regression, other methods of statistical analysis were used,and the results of these tests are summarized in the appendixes. These include the life table test (Cox, 1972; Tarone, 1975), appropriate for rapidly lethalneoplasms, and the Fisher exact testand the Cochran-Armitage trend test (Armitage, 1971; Gart et ol., 1979), procedures based on the overall proportion of neoplasm-bearing animals.
Tests of significance included painvise comparisonsof eachdosedgroup w i t h controls and a testforan overalldose-responsetrend..Continuity-corrected tests were used i n the analysis of neoplasm incidence, a n d reported P values are one sided. The procedures described i n the preceding paragraphs were also used eva1u:lteto selectednonneoplasticlesions. For furtherdiscussion of these statisticalmethods,see Haseman (19".
Analysis c$ Nonnec~plnstic Lesion Incidences Because a l l nonneoplasticlesions in thesestudies wereconsideredtobeincidental to the cause of death or not rapidly lethal, the primary statistical analysisusedwas a logisticregressionanalysis in which lesionprevalence was modeled as a logistic function of chemical exposure a n d time. For lesions dctected a t theinterimevaluation, the Fisher exact test was used, a procedurebased on the overall proportion o f affected animals.
Historical Control Data Although the concurrent control group is always the first and most appropriate control group used for evaluation, there are certaininstances in which historicalcontrol data canbehelpful i n the overall assessment of neoplasm incidence.Consequently, neoplasm incidences from the NTP historical control database (Hascman el ol., 19S4, 19S5) are included in t h c N T P reports f o r neoplasms appearing to show compound-related .effects.
Analysis of Continuous Variables Two approaches were employed to assess the signif- icance of painvise comparisons between dosed and

26
control groups in the analysis of continuous variablcs. Organ a n d bodyweight data, which haveapproximately normal distributions, were analyzedusing the parametric comparisonproceduresmultiple of Dunnett(1955) and Wil l iams (1971, 1972). Clinical chemistry,hematology, and neurobehavioral data , which have typically skewed distributions, were analyzed using the nonparametric multiple comparisonmethods of Dunn (1964) a n d Shirley(1977). Jonckheere’stest(Jonckheere,1954) was usedto assess the significance of the dose-responsetrends and todeterminewhether a trend-sensitivetest (Williams’ or Shirley’s test) was more appropriate for pairwisecomparisons than a test tha t doesnot assume a monotonic dose-response trend (Dunnett’s o r Dunn’stest).Averageseverityvalueswcre a n a lyzed for significance using the Mann-WhitneyU test (Hollander and Wolfe, 1973).
Quality Assurance Methods The 13-week and 2-yearstudieswereconducted in compliance with Food a n d Drug Administralion GoodLaboratoryPracticeRegulations(21CFR, Part 5s). In addition,asrecords fromthe2-year studiesweresubmittedtothe NTPArchives,they were audited retrospectively by an independent quality assurance contractor. Separate a u d i t s covering completeness and accuracy of the pathologyd a t a , pathology specimens,f ina l pathology tablcs,and s t a f f review draft o f this NTPTechnical Report wcre conducted.Auditprocedures and findings are presented in the reports and are on rile a t N I E H S . The audi t findingswerereviewed a n d assesscd by NTP staff so t h a t all discrepancies had bccn resolved or were otherwise addressed d u r i n g the preparation of this Technical Report.
GENETICTOXICOLOGY Thegenetictoxicity of tricresylphosphate was assessed by testingthe a b i l i t y of the chemicalto inducemutations i n various strains o f S n l ~ n o ~ w l l n
Tricresyl Phosphate, NTP TR 433
rphinmrirm a n d chromosomaldamageincultured Chinese hamster ovary cells. The protocols for these studies a n d the rcsults are given in Appendix E.
The genetic toxicity studies of tricresyl phosphate are pa r t of a largercffort by the NTP to develop a database t h a t would permit the evaluation of carcino- gcnicity in experimental animals from thestructure of the chcmical a n d its responses i n short-term in vitro and in rive genetictoxicitytests.Thesegenetic toxicitytcstswereoriginallydeveloped to study mcchanisms of chemically induced DNA damage and topredictcarcinogenicity i n animals,basedon the electrophilic theory of chemicalcarcinogenesis and the somatic mutation theory (Miller and Miller,1977; Straus, 19S1; Crawford, 19SS).
There is a strongcorrelationbetween a chemical’s potentialelcctrophilicity (s t ructural alerttoDNA reactivity),mutagcnicity i n Snlnlonella, and carcinogenicity i n rodents.Thecombination of electro- philicity a n d S(iln1onelln mutagenicity is highly corrclatcd with theinduction of carcinogenicity in rats a n d mice and/or a t multiple tissue sites (Ashby a n d Tennant, 1991). Other in v i v o genetic toxicity tests do not correlatc wellwith rodent carcinogenicity (Tennant e r nl., 19S7;Zeiger e r of., 1990), although these other tests can provideinformation on the typesof D N A and chromosome effects that canbe induccd by t h e chcmical bcinginvestigated.Data f r o m t h c N T P studies show tha t a positive response i n Solnzonello is current ly the most predictive in vitro tcst t o r roden1 carcinogenicityof the(S9% S d n ~ o ~ w l l nmutagens wcre rodcnt carcinogens), and t h a t there is no complimentarily among the in vim0 genetic toxicity tests. That is, no battery of tests that included thcSnln1onelln test improved the predictivity of the Snlnlonellrr testalone. The predictivity for carcinogenicityo f a positive responsei n bone marrow chromosome aberration or micronucleus tests is not yet defined.

(male)
27 Materials and Methods
TABLE2 Experimental Design and Materials and Methods in the Studies of Tricresyl Phosphate
~ ~~ ~ ~
13-Week StudiesFeed
Battelle Columbus (Columbus, OH)
Rats:F344/N Mice:B6C3Fl
Frederick Cancer Research Facility (Frederick, MD)
15 or 16 days
6 weeks
Rats:28-29November1984 Mice:5-6December1984
90 days
Rats:FebruaryRats:26-27 1985 Mice:5-6March1985
~~~ ~~
2-Year StudiesFeed
Battelle Columbus (Columbus, OH)
Rats:F344/N Mice:B6C3Fl
Simonsen Laboratories, Inc. (Gilroy, CA)
11to 14 days
6 weeks
Rats:Core 29 September 1986 Stop exposure 18 September 1986
Mice:13October1986
Rats:Core 104 weeks Stop exposure 22 weeks
Mice:105weeks
Core19 September 1988 Stop exposure 20 February 1987
Mice: 10October1988
~~ ~ ~
16-Day Gavage Studies
Study Laboratory Battelle Columbus (Columbus, OH)
Strain and Species Rats:F344/N Mice:B6C3Fl
Animal Source Charles River Breeding Laboratories (Kingston, NY)
Time Held Before Studies 20 days (male) 21 or 22 days (female)
Average Age When Studies Began
~~~~
13-Week StudiesGavage
Battelle Columbus (Columbus, OH)
Rats:F344/N Mice:B6C3Fl
Simonsen Laboratories, Inc. (Gilroy, CA)
Rats:27to 30 days Mice:19to22days
Rats: 8 weeks Mice: 9 weeks
Date of First Dose Rats: 12 April 1982(male)
13-14 April 1982 (female)
Mice: 19 April 1982(male) 20-211982 OctoberApril 18-19 1982Mice:(female)
Duration of Dosing 13or 14 days
Date of Last Dose Rats:26-27 Apr i l 1982
(male)28-29 April 1982 (female)
Mice:3-4 May 1982 (male) 5-6 May 1982(female)(male)
Rats: 10 weeks Mice: 9 weeks
Rats:27-28December1982 (ma le)29-30 December 1982 (female)
20-21October1982 (female)
90 days
Rats:28-29March1983 (male)30-31March1983 (female)
Mice:17-18January1983
19-20 January 1982 (female)

28 Tricresyl Phosphate, NTP TR 433
TABLE2 Experimental Design and hlaterials and Methods in the Studies of Tricresyl Phosphate (continued)
16-Day Gavage Studies 13-Week Gavage Studies
Necropsy Dates Rats: 27-28 April 1982 Rats: 29-30 March1983
(male) (male) 29-30 April 1982 31 March-1April 1983 (female) (female)
Mice: 4-5 May 1982 (male) Mice: 18-19 January 1983 6-7 May 1982 (female) (male)
20-21 January 1983 (female)
Average Age at Necropsy Rats: 10 weeks Rats: 23 weeks Mice: 11weeks Mice:22weeks
Size of Study Groups 10 males and 10 females
Method of Distribution Animals randomized Same as t h e 16-day studies according to body weight using a table of random numbers.
Animals per Cage 5 5
Method of Animal Identification Ear tag Ear t a g
Diet NIH-07 open formula Same as the 16-day studies pelleted diet (Zeigler Bros., Inc., Gardners, PA), available ad libiarm
Maximum Storage Time for Feed Not available Not available
Water City o f Columbus. OH, municipal water supply, via automatic watering system (Edstrom Industries, Inc., Waterford, WI), available ad libinrrn
Sametheas16-day studies
Cages Polycarbonate (Lab Products, Inc., Rochelle, NJ), changed twice weekly
Sameasthe16-day studies
13-Week Feed Studies
Rats: 26-27 February 1985 Mice: 5-6 March1985
1 9 weeks
Animals randomized according t o body weight using a computer generated table o f random numbers.
Ear lag
120 days alter milling
S a m e as the 16-day studics
I’olycarboniltc (Lab Products. Inc., Carlicld, NJ), changed twicc weekly
2-Year StudiesFeed
Rats: 26-29 September 1988 Mice: 17-21 October 1988
Rats: 110 weeks Mice: 112 weeks
9 5 males and 95 females
Same as the 13-week feed studies
Rats: 5 Mice: 1
Ear tag and toe clip
Same as the 13-week feed studies
120 days after milling
Same as the 16-day studies
Polycarbonate (Lab Products,Inc., Maywood, NJ), changed twice weekly

29 Materials and Methods
TABLE2 Experimental Design and Materials and Methods in the Studies of Tricresyl Phosphate (continued)
16-Day Gavage Studies
Bedding Not available
Cage Filters Spun-bonded polyester (DuPont 2024), changed once every two week
Racks Stainless steel (Lab Products, Inc,, Rochelle, NJ), changed once every two weeks
Animal Room Environment Temperature: 21"-23" C Relative humidi ty: 40%-60% Fluorescent light:
12 hours/day Room air changes:
15 changeshour
Doses 0,360, 730, 1,450, or 2,900, i n corn oil by gavage or 5,800 mgkg neat by gavage
13-Week StudiesGavage
Ab-Sorb-Dri@ hardwood chips (Ab-Sorb-Dri. Inc.), changed twice weekly
Same as the 16-day studies
Same as the lcj-day studies
Temperature: 21"-23" C Relative humidity: 40704070 Fluorescentlight:
12 hourslday Room air changes:
15 changes/hour
0, 50. 100. 200. 400, or 800 mg/kg in corn oil by gavage
Type and Frequency of Observation Obsewed once daily; animalsObservedtwicedaily;clinical weighedinitially,weekly,andfindingsrecordedweekly; a t the end of the studies. animals weighed i n i t i a l l y ~
weekly. and a t the end o f the studies.
Method of Sacrifice Carbon dioxide Pentobarbital injcction
13-Week Feed Studies
BetaChips@, heat-treated hardwood chips (Northeastern Products, Inc., Warrensburg, NY), changed twice weekly
Spun-bonded polyester (Snow Filtration. Co., Cincinnati, 0 1 I), ch;1nged once evcry two wceks
Stilinless steel (Lab Products, Inc., Garfield, NJ), changed once every t w o weeks
Average temperature: 22" C Ilelative humidity:
45%-S6% (rats) 4670-5770 (mice)
L%mrescentlight: I2 I1ours/day
l h ~ mair cllanges: 1 5 changes/hour
l&ItS 0. 900. 1,700. 3.300. 6.600, or 13,000 pptn in feed Mice: 0, 250, 500, 1.000. 2.100, or 4,200 ppm in feed
Observcd twice daily; clinical findings recorded weekly; anilnals weighed i n i t i a l l y , weekly. and at the end o f the studics: fced consumption measurcd \veekly.
Carhon dioxide
2-Year StudiesFeed
BetaChips@, heat-treated hardwood chips (Northeastern Products, Inc., Warrensburg, NY) u n t i l 21May 1988, then SaniChips, hardwood chips (P.J. Murphy Forest Products C o p , Montville, NJ), changed twice weekly
Same as the 13-week feed studies
Stainless steel (Lab Products, Inc.! Maywood, NJ), changed once every two weeks
Average temperature: 22" C Average relative humidity:
49% Fluorescent light:
12 hours/day Room air changes:
15 changes/hour
Rats: 0, 75, 150, or 300 ppm i n feed Stop-eyposure rats: 600 ppm i n feed Mice: 0,60,125, or 250ppm i n feed
Observed twice daily; clinical findings and animal weights recorded weekly for first 13 weeks and monthly thereafter; feed consumption measuredmonthly.
Carbon dioxide

30 Tricresyl Phosphate, N T P TR 433
TABLE2 Experimental Design and Materials and Methods in the Studies of Tricresyl Phosphate (continued)
16-Day Gavage Studies
Necropsy Necropsy was performed on a l l animals.Organweights were recorded for brain, heart, right kidney, liver, lung, right testis, and thymus.
Clinical Pathology None
Neurobehavioral Studies Spontaneous motor activity, forelimb and hindlimb grip strength, startle response, and paw-lick latency were measured in all rats and mice one week before dosing began and on the day before necropsy.
13-Week StudiesGavage
Necropsy was performed on a l l animals.Organweights were recorded for brain. heart, right kidney, liver, lung, left testis, a n d thymus.
Blood was collected from the vena cava (rats) or by cxdiac puncturc (mice) [or hematology and clinical chemistry. II~obgy:erythrocytes. hemoglobin, hematocrit, mean erythrocyte hemoglobin, mean erythrocyte hemoglobin concentration. m e a n erythrocyte volume, a n d total and differential leukocyte counts clinical chemislly: cholinesterase
Spontaneous motor activity, forelimb and hindlimb grip strength, startle response. and paw-lick latency were measured i n a l l rats a n d mice one week before dosing began a n d on the day before necropsy.
13-Week Feed Studies
Necropsy was performed on a l l animals.Organweights recorded for brain, heart. right kidney, liver, lung , right testis, a n d thymus.
I 3 l o o d w a s collected from the orhital sinus o f a l l animals for hematology. and vena cava (rats) o r by cardiac puncture (mice) for clinical chemistry. I f c w l o ~ :erythrocytes, hemoglobin, hematocrit, nican erythrocyte hemoglobi~i.mean erythrocyte hemoglobin concentration, mean erythrocyte volume. platelets. reticulocytes,and total and differential leukocyte counts clinical chrmislly: cholinesterrlse
Forelimb and h i n d l i m b srip strength mcasured i n a l l rats and mice before esposure and on the day before necropsy.
2-Year Feed Studies
G
Necropsy was performed on allanimals.Organweights recorded for left and right adrenal gland, brain, left and right kidney, liver, and left and right testis at the 3-, 9-, a n d 15-month interim evaluations.
Blood was collected from the orbital sinus of a l l animals for hematology and clinical chemistry at the 3-, 9-, and 15-month interim evaluations. I l e t m f u k ~ :erythrocytes, hemoglobin, hematocrit, mean erythrocyte hemoglobin, mean erythrocyte hemoglobin concentration, mean erythrocyte volume, platelets, reticulocytes, nucleated erythrocytes, and total and differential leukocyte counts clinical c m : cholinesterase
Forelimb and hindlimb grip strength measured i n all rats and mice before exposure and prior to necropsy at the 3 , 9-, and 15-month interim evaluations.

Materials and Methods 31
TABLE 2 Experimental Design and Materials and Methods in the Studies of Tricresyl Phosphate (continued)
16-Day Gavage Studies 13-Week Gavage Studies 13-Week Feed Studies 2-Year Feed Studies
IIistopathology Histopathologic examinations were conducted on all rats receiving 5,800 mg/kg, all rats dying early, and all mice receiving 2,900 mg/kg. In addition, the mandibular lymph node, spleen, and thymus of all controls, rats and surviving male mice that received 1,450 mg/kg, rats that received 2,900 mg/kg, and surviving mice that received 5,800 mg/kg were examined.
Complete histopathology W;lS
performed on all controls, all animals dying early, and all rats and mice recciving 800 mg/kg. In addition to gross lesions, the tissues examined included: adrenal gland, bone (including marrow). brain, clitoral gland (rats), epididymis, esophagus, gallbladder (mice), heart, kidney. large intestine (cecum. colon. rectum). liver, lung, mandibular and mesenteric lymph node. fllammary gland. nose. ovary. pancreas, parathyroid gland. pituitary gland. preputial gland (rats). prostate gland. salivary gland. sciatic nerve. seminal vesicle. skin. small intestine (duodenuill. jejunum, ileum). spinal cord. spleen. stomach. testis. thymus, thyroid gland. trachea. urinary bladder. and uterus. In addition. the adrenal gland. ovary, and spinal cord and sciatic ncrvc of all dosed rats and mice and testis of dosed rats wcrc examined.
Complctc histopathology was perform cd on all control and high-dose rats and mice. In addition to gross lesions. the tissues examined included: adrenal gland, bone (including marrow). brain, clitoral gland (rl1ls), epididymis. esophagus. gallbladder (mice), heart, kidney, large intestine (cecum. colon. rectum). liver. lung. mandibular and mcsenteric lymph node. mammary gland. nose. OVl\Iy.
pancreas. parathyroid gland. pituitary gland, preputial gland (rats), prostate gland. salivary gland, sciatic nerve, seminal vesicle. skin, small intestine (duodenum. jejunum. ileum). spinal cord. spleen. stomach. testis. thymus, thyroid gland.
trachea. urinary hladder, and utcrus. In addition. the adrenal gland. epididymis. kidney, ovary, pituitary gland (malcs). and ((:stis of rats cxposcd to <)00. l.700. 3.300. or 6.1J()0 ppm and thc adrenal gland. gallbladdcr. kidney. ovary. sciatic ncrve. ilnd spinal cord of micc exposed to 250. 500. 1.000. or 2.100 ppm were examined.
Complete histopathology was performed on all rats and mice. In addition to gross lesions and tissue masses, the tissues examined included: adrenal gland, brain, bone and marrow, clitoral gland (rats), large intestine (cecum, colon, rectum), epididymis, esophagus, gallbladder (mice), heart, kidney, liver, lung, mandibular and mesenteric lymph nodes, milmmary gland, nose, ovary, pancreas, parathyroid gland, pituitary gland, preputial gland (rats), prostate gland, salivary gland, sciatic nerve, seminal vesicle, skin, small intestine (duodenum, jejunum, ileum), spinal cord, spleen. stomach (forestomach and glandular), testis, thymus, thyroid gland, trachea, urinary bladder, and uterus.

33
RESULTS
RATS 16-DAY GAVAGE STUDY One control male and one control female rat, one malereceiving 730 mg/kg, one female receiving 1,450 mgkg, and five males and eight females receiv- ing 2,900 mgkgdiedduring the study(Table 3). Reduced survival in the 2,900 mg/kg groups was related t o chemical administration. The final mean body weights and mean bodyweight gains o f male andfemaleratsthat received 1,450, 2,900, and 5,800 mgkg were significantly lower than thoseo f t h e
TABLE3
controls. The only related tofindingclinical chemical administrationwas diarrhea, which occurred in six males receiving 730 mgkg and all males and females receiving 1,450, 2,900, o r 5,800 mgkg.
T h e deaths o f one control male, one control female, one male that received 730 m u g , and one male and one female that received 2,900 mg/kg were due t o improper gavage technique and the introduction of gavage fluid into the lungs. Lesions compatible with sialodacryoadenitis virus infection were observed in
Survival and Mean Body Weights of Rats in the 16-Day Gavage Study of Tricresyl Phosphate
Mean Body Weightb (2) Final Weight Dose Initial Survival' Final Change Relative to Controls
( m d k s ) ( W
Male
0 0'911 158 f 3 214 f 6 5 5 - c 4 360 730
1,450 2,900 5,800
Female
0 360 730
1,450 2/1og 2,900
1ono 9/1Od
loll0 5/10e
1o n0
9/1Od 10/10 10/10 9/1Of
16of2 160 f 2 158 f 3 162 f 3 163 & 3
121 f 3 123 & 1 127 f 3 123 f 3
209 f 4 199 f 4 178 f 5 * * 164 f 16** 168 f 9**
148 f 2 154 f 2 153 f 4 136 2 4'
4 9 2 2 4 0 f 2 20 -c 4" 4 f 13" 5 f 9..
2 8 2 1 31 f 2 26 f 2 14 f S B *
98 93 83 76 78
104 103 92
125 & 2 122 f 7** -4 2 281 83 5,800 10/10 124 ? 2 125 f 5** 2 & 4** 85
* Significantlydifferent (PSO.05) fromthecontrol group by Williams' or Dunnett'stest * * PSO.01 a Number of animalssurvivinghumber i n i t i a l l y in group
Weights and weightchangesaregivenasmean f standard error. Subsequent calculationsare based on the number o f animals surviving t o the end o f the study. Day of death: 6 Day of death: 12
e Day of death: 6, 10, 12, 12, 16 Day of death: 13
g Day o f death: 9. 10, 11, 11, 11, 12, 14, 14

34
one female that received 1,450 mgkg and five males that received 2,900 mg/kg and may have contributed to theirdeaths.Deaths o f otheranimalswere considered to be the result o f chemical exposure.
Total activity recorded at the endo f the 16-day study decreased with dose among groups o f male rats but was not significantly differentfromthat o f the controls(TableHl).Amongfemales,total activity for groups that received 1,450,2,900, o r 5,800 mgkg was significantly lower than that o f the controls, and the change in group mean total activity(activity at day 14 minus activity at day 0) wassignificantly greater than the change in activity recorded for the controls.Slightdifferenceswerenotedinstartle response latency for afew groups, but the differences were small in magnitude and not considered biologically meaningful. Significantincreasesinstartle response amplitude occurred in females thatreceived 1,450 mgkg andmalesandfemalesthat received 2,900 o r 5,800 mgkg. Paw-lick latency in males was unaffected by chemical administration,but latency wassignificantlyincreasedinfemalesthat received 1,450,2,900, o r 5,SOO mgkg. Forelimb grip strengths were significantly reduced at the end o f the study in femalesthat received1,450 mgkgandmalesand femalesthat received 2,900 or 5,SOO mgkg,and hindlimb grip strengths were significantly reduced at theend o f the studyinmalesthat received 2,900 mg/kg and malesandfemalesthat received 5,800 mg/kg.
Almostallsignificantchanges in neurobehavioral measuresoccurred in groups that received 1,450,
Tricresyl Phosphate, NTP TR 433
due t o a direct chemical effect on the nervous system from changes resulting from toxicity.
Absolute thymus weights o f males and absolute and relativethymusweights o f femalesthatreceived 1,450 mgkg, andabsoluteandrelativethymus weights o f males and females that received 2,900 or 5,800 mgkg were significantly lower than those o f controls(TableFl).Relativeliverweights o f all groups o f dosed males and absolute and relativeliver weights o f all groups o f dosed females were signif- icantlygreaterthan those o f the controls.Other differences in organ weights were considered to be due t o the lower final mean body weightso f rats that received 1,450, 2,900, and 5,800 mg/kg.
Therewere nogross lesions observed at necropsy that wereconsidered t o be related to chemicaladministration.Diffuseaspermatogenesiswaspresentin the testes o f maleratsthat received 2,900 and 5,SOO mg/kg. Mild necrosis o f the spleen and mandibular lymph node was observed in male ratsreceiving 5,800 mgkg, and mild thymic lymphoid depletion was observed infcmaleratsreceiving 5,800 mg/kg. Necrosis o f the mandibular lymph node and spleen, and necrosis and lymphoid depletion o f the thymus were observed in male and female rats that received 2,900 mg/kg (Table 4).
Dose selecrion rutionale: Duetodose-relateddecreases in final mean body weights in rats receiving 1,450,2,900, and 5,800 mgkg, chemical-related deaths in rats receiving 2,900 mgkg, andchemical-related microscopiclesionsinratsreceiving 2,900 and
2,900, o r 5,SOO mgkg, doses that were also associated5,SOO m a g , the high dose selected for the 13-week withmortalityand/orlowermean bodyweights. gavage study was SO0 mg/kg. The other doses Therefore, it was not possible to distinguish changes selected were 50, 100, 200, and 400 mgkg.

Results 35
TABLE4 Selected Incidences of Nonneoplastic Lesions in Rats i n the 16-Day Gavage Study of Tricresyl Phosphate
Dose (mdkg)
Male
0 730 2,900 1,4505,800
na 10 1 10 10 10
Harderian Gland Necrosis, Multifocalb -C 2 (I.5)d 0
Necrosis, Multifocal Mandibular Lymph Node
0 1 (3.0) 0 2 (1.0) 6*'(1.8)
Multifocal
NasolacrimalDuct
Necrosis, Diffuse
Inflammation, Acute,
1 (4.0) 1 (2.0)
0 0
Salivary Gland Necrosis. Diffuse 2 (4.0) 0
Spleen Necrosis,Multifocal 0 1 (2.0) 0 4*(2.3) 5*(1.8)
Testis Aspermatogenesis, Diffuse 5 (3.0) 10 (4.0)
Thymus
LymphoidDepletion,Diffuse Necrosis,Multifocal
0 0
0 0 1*(1.5)
6'*(3.7) 0 0
(continued)

36 Tricresyl Phosphate, NTP TR 433
TABLE4 Selected Incidences of Nonneoplastic Lesions in Rats in the 16-Day Gavage Studyof Tricresyl Phosphate (continued)
0 730 1,450 2,900 5,800
Female
n 1 0 10 10 10
Harderian Gland Necrosis, Diffuse 1 (3.0) 0 Necrosis, Multifocal 4 (2.3) 0
Mandibular Lymph Node Necrosis, Multifocal 0 1 (2.0) 6**(2.2) 0
Nasolacrimal Duct Inflammation, Acute,
Multifocal 0 3 (2.0) 0 Necrosis, Diffuse 0 2 (2.5) ' 0 Necrosis, Multifocal 1 (3.0)e 0 0
Salivary Gland Necrosis, Diffuse 0 5 (4.0) 0 Necrosis, Multifocal 1 4 (1.5) 0
Spleen Necrosis, Diffuse 0 1 (3.0) 5*(3.0) 0
Thymus Necrosis, Diffuse 0 1 (4.0) 8**(4.1) 0 Lymphoid Depletion, Diffuse 0 2 (3.5) 7**(3.9) 2 (1.5)
* Significantly different (PSO.05) from the control group by theFisherexacttest * * PSO.01 a Number of animals examined microscopically: females receiving 730 m@g not examined microscopically.
Number o f animals wi th lesion Organ not examined i n this dose group Averageseveritygradeoflesions i n affected animals: 1 = m i n i m a l , 2 = mild, 3 = moderate. 4 = marked, 5 = severe.
e n = I

Results 37
mean body weights and mean body weight gains o fI S W E E K GAVAGESTUDY males receiving 200, 400,and 800 mgkg were signif-
All rats survived to the end o f the study (Table 5). icantly lower thanthoseofthecontrols.Thefinal Therewerenoclinical findingsclearly related t o mean body weights o f dosed groups o f female rats tricresyl phosphate Mean were similar to that of the controls.Average dailyadministration. body weights o f male rats that received 800 m a g were feed consumption by male andfemaleratsthat lowerthan those o f thecontrolsthroughoutthe received 800 mgkg was slightly greaterthan feed study, whereas mean body weights o f malesthat consumption by controls; however, feed consumption received 200 or 400mg/kg were lower than those o f by groups receiving lower doses wassimilar t o controls during the latter half o f the study. The final consumption by controls.
TABLE5 Survival and Body Weights of Rats in the 13-Week Gavage Study of Tricresyl Phosphate
fi Final Weight Dose Initial Survivala Final Change Relative to Controls
( m d k s ) ( W
Male
0 10/10 199 f 5 373 f 6 174 f 4 50 1on0 191 f 4 361 f 5 170 f 5 97
100 10/10 195 f 4 3 6 2 f 8 167 f 5 97 200 10/10 193 2 4 346 f 7** 153 f 5*' 93 400 1on0 191 2 4 343 f 5** 152 f 6*' 92 800 10/10 195 f 4 324 f 5'. 129 f 5'. 87
Female
0 1on0 144 -t 2 205 f 5 60 f 3 50 1 O D O 146 f 2 208 f 3 62 f 2 102
100 10/10 144 -c 2 208 f 2 64 f 2 102 200 10/10 147 k 2 212 f 3 65 f 2 104 400 10/10 143 2 3 205 2 3 63 2 3 100 800 10/10 145 2 2 213 ? 3 68 f 2' 104
* Significantly different (PsO.05) fromthecontrolgroup by Williams' or Dunnett's test * * PsO.01 a Numberofanimalssutviving a t 13weeb/number initially in group
Weights and weight changes are given as mean k standard error.
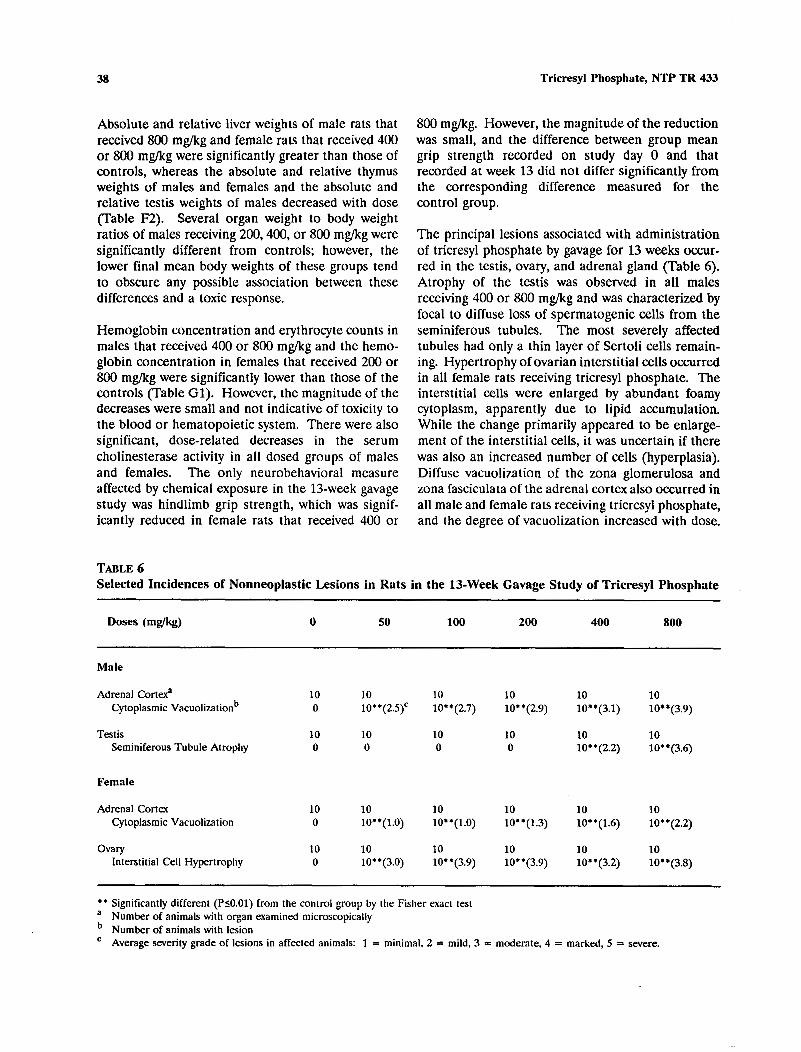
38
Absolute and relative liver weights o f male rats that received 800 mgikg and female rats that received 400 o r 800 mg/kg were significantly greater than thoseo f controls,whereas the absolute and relative thymus weights o f males and females and the absolute and relative testis weights o f males decreased with dose (Table F2). Several organ weight t o body weight ratios o f males receiving 200,400, o r 800 m&/kg were significantly different from controls; however, the lower final mean body weights o f these groups tend toobscure any possible association between these differences and a toxic response.
Hemoglobin concentration and erythrocyte countsin males that received 400 o r SO0 mg/kg and the hemoglobin concentration in females that received 200 or SO0 m a g were significantly lower than those o f the controls (Table Gl). However, the magnitude o f the decreases were small and not indicative o f toxicity t o the blood o r hematopoietic system. There were also significant, dose-relateddecreases in the serum cholinesterase activity in all dosed groups of males and females. The only neurobehavioral measure affected by chemical exposure in the 13-week gavage study was hindlimb grip strength, whichwas significantly reduced in female ratsthat received 400 or
TABLE6
Tricresyl Phosphate, NTP TR 433
S 0 0 mag. However, the magnitude o f the reduction was small, and the difference betweengroupmean gripstrengthrecorded on study day 0 andthat recorded at week 13 did not differ significantly from the correspondingdifferencemeasuredfor the control group.
The principal lesions associated with administration o f tricresyl phosphate by gavage for 13weeks occur- red in the testis, ovary, and adrenal gland (Table 6). Atrophy o f the testis was observedinall males receiving 400 o r 800 m@g and was characterized by focal to diffuse loss o f spermatogenic cells from the seminiferous tubules. The most severely affected tubules had only a thin layer o f Sertoli cells remain- ing. Hypertrophy o f ovarian interstitial cells occurred in all female rats receiving tricresyl phosphate. The interstitial cells wereenlarged by abundant foamy cytoplasm, apparently due to lipid accumulation. While the change primarily appeared to be enlarge- ment o f t h e interstitial cells, it was uncertain if there was also an increased number o f cells (hyperplasia). Diffuse vacuolization of the zona glomerulosa and zona fasciculata o f the adrenal cortex also occurredin all male and female ratsreceiving tricresyl phosphate, and the degree o f vacuolization increased with dose.
Selected Incidences of Nonneoplastic Lesions in Rats in the 13-Week Gavage Study of Tricresyl Phosphate
Doses (mgkg)
Male
Adrenal Cortexa Cytoplasmic Vacuolizationb
Testis Seminiferous Tubule Atrophy
Female
Adrenal Cortex Cytoplasmic Vacuolization
Ovary Interstitial Cell Hypertrophy
0 so
10 10 0 10**(2.5)'
10 10 0 0
10 10 0 lO**( l .O)
10 10 0 10*'(3.0)
100 200 400 800
0 10
10**(2.7) 10
0 10
10**(2.9) 10
10
10**(3.1) 10
10**(2.2) 10**(3.6) 10
10**(3.9) 10
10 lO**(l.O)
lO"(3.9) 10
10**(3.9) 10
10**(1.3) 10
10**(3.2) 10
10**(1.6) 10 10
10**(2.2)
10**(3.8) 10
* * Significantly different (P~0.01)from the control group by the Fisher exact test a Numberofanimals w i t h organexaminedmicroscopically
Number of animals wi th lesion Average severity grade o f lesions i n affected animals: 1 = minimal, 2 = mild, 3 = moderate, 4 = marked, 5 = severe.

39 Results
13-WEEK FEEDSTUDY A l l rats survived t o the end o f the s tudy (Table 7). Final meanbody weights and meanbody weight gains o f femalesexposed t o 3,300 ppm and males and females exposed t o 6,600 or 13,000 ppm were signi- ficantly lower than those o f the controls. During the first week o f the study feed consumption by groups of male and female rats exposedt o 13,000 ppm was 58% and 50% lowerthanthat by the controlsand remained somewhat lower than the controls throughout the study, indicating reduced palatability o f feed containing tricresyl phosphate at this concentration. Feed consumption by males exposed t o 6,600 ppm was 16% lower than that by controls during the first week o f the study. Dietary levels o f 900, 1,700,3,300, 6,600, and 13,000 ppm tricresyl phosphate were estimated t o deliver daily doses o f 55, 120, 220, 430, and 750 mg/kg body weight t o males and 65,120,230,
TABLE7 Survival, Mean Body Weights, and Feed Consumption of Tricresyl Phosphate
430, and 770 mg/kg t o females. The only chemical-related clinical finding was emaciation, which was observed by day 23 in males and by day 10 in females exposed t o 13,600ppm.
There were no biologically significant changes in the neurobehavioralmeasurements o f ratsexposed to tricresyl phosphate H3). Relative(Table liver weights of males and females exposedto 1,700,3,300, 6,600, and 13,000 ppm and absolute liver weights of 6,600 ppm malesandfemalesand o f 13,000 ppm females were significantly greater than those of controls(Table F3). Absolute andrelativeright testis weights o f malesexposed t o 6,600 and 13,000ppm were significantly lower than those of the controls. Other organ weight differences were most likely due t o the reduced body weights o f groups
of Rats in the 13-Week Feed Study
Final Weight Mean ~ o d yWeietltb (e) Feed Relative
Dose InitialSurvival' Final Chnnge to Controls Consumption' ( P P I ("/.I Week 1 Week 12
Male
0 10/10 151 f 4 359 f 7 209 f 6 16.1 16.2 900 10/10 149 f 4 355 f 8 206 f 10 99 14.0 16.1
1,700 10/10 150 f 4 363 f 6 213 f 5 101 19.7 15.9 3,300 10/10 147 * 4 340 f 4 193 f 5 95 16.4 16.1 6,600 10/10 142 rt 5 327 f 8** 185 f 5 ' . 91 13.5 16.8
13,000 10/10 136 f 4* 242 f 8** 106 f 5** 67 6.8 15.0
Female
0 10/10 117 f 2 198 f 3 8 1 2 2 11.1 9.7 900 10/10 116 f 2 191 +. 4 7 5 f 3 97 11.5 10.5
1,700 10/10 118 f 2 192 f 3 7 4 2 3 97 11.5 9.5 3,300 10/10 116 f 2 187 3* 71 f 3** 94 11.4 9.3 6,600 10/10 112 f 2 177 f 3:' 65 f 3** 89 10.1 8.7
13,000 10/10 107 f 2.' 175 f 3.' 68 f 3** 88 5.6 11.1
* Significantly different (PsO.05) from the control group by Williams' or Dunnett's test * * Ps0.01 a Number o f animals surviving at 13weekslnumber initially i n group
Weights and weight changes are given as lnean ? standard error.' Feed consumption is expressed as g r a m per animal per day.

40
exposed to 3,300,6,600,and 13,000ppm. There were no differences inthe hematological parameters which were considered to be related t o chemical exposure. Significantdose-relateddecreasesintheserum cholinesterase activity was present in all exposed groups o f rats (Table G2).
A t necropsy adrenal gland enlargementwas observed in two males and four females exposedt o 6,600 ppm andfourmalesand six females exposed t o 13,000 ppm. In addition, small testes were observed inone6,600ppmandfour 13,000 ppm males. Microscopic associated with chemicallesions exposurewerepresentin the testis, epididymis, adrenal gland, pituitary gland, and kidney o f males, and the ovary, adrenal gland, and kidney o f females (Table 8).
The lesions in the testis, ovary, and adrenalgland were similar t o those observed in the 13-week gavage study. Small focal accumulations o f mononuclear inflammatory cells (chronic inflammation) were also observed in the ovary o f some exposed females but the incidence and severitydid not increase with dose. Small groups o f lymphocytes were also observed in the adrenalcortex o f somemaleandfemalerats exposed t o tricresyl phosphate.
Hypertrophy o f basophils o f the pars distalis o f the pituitary gland was observed in several males exposed t o 3,300, 6,600, o r 13,000 ppm tricresyl phosphate. Scattered individual basophils were enlarged and had palestaining o r clearcytoplasm. This effect is consistentwith the testicularatrophyobscrved in males, and may be due to loss o f feedback inhibition o f secretion o f gonadotropinreleasinghormone (GnRH)in the hypothalamuswithaconsequent stimulation o f pituitary secretion o f gonadotropins. A similar effect has been observedin castrated males.
Edemaand/ornecrosis o f therenalpapilla was observed in nearly all male and female rats exposed t o 13,000 ppm and most rats exposed t o 6,600 ppm. The interstitium was distended,presumablyfrom edema,andthere was coagulative necrosis o f t h e epithelium lining the papillary ducts and thin limbs o f the loop o f Henle with no accompanying inflammatoryresponse. Oneora few scattered foci o f
Tricresyl Phosphate, NTP TR 433
tubule regeneration consistent with an early stageo f nephropathywerealsoobservedin the kidney o f most rats in the 13,000 ppm groups, but not in the controls.
Dose selection rationale: Dietscontaining 6,600 o r 13,000 ppm tricresyl phosphate were initially unpalatable to male and female rats, and groups receiving these diets hadsignificantlylowerfinalmeanbody weights and mean body weight gains. Histopathologic lesions consistentwith very early stagesof nephropathypapillarynecrosis also and wereobserved in males and females exposed to 6,600 and 13,000 ppm. Over the duration o f the 2-year study, the renal lesions and lower mean body weight gain could become life threatening; therefore these concentrationswereconsidered too high for the high exposure level ina 2-year feed study. At exposure levels o f 3,300 ppm and lower, t he most significant lesion was cytoplasmic vacuolization o f the adrenal cortex. T h e severity o f this lesionincreasedwith exposure level and occurred in all exposed groups of rats b u t notincontrols,andthereforewas clearly associatedwithchemicalexposure.Even atthe lowest exposure level (900 ppm) the lesion was presentinallmalesandfemales,withaverage severity grades o f 1.6 (males)and 1.4 (females). While the biological significance o f this lesion was unknown, accumulation o f cytoplasmic vacuoles was believed t o representanalterationinsteroid metabolism.Sinceadrenalcorticalsteroidsare essentialfornormalfunctioning o f severalorgan systems, this change was considered potentially life threatening. Based o n this assessment, 900 ppm was considered too high for t h e high exposure level in a 2-year feed study. Therefore, the decision was made t o begin the 2-year feed study with exposure levels o f 75, 150, 300, and 600 ppm.After 13 weeks, 10 animalspergroupwould be evaluatedfor the presence o f adrenalglandlesions; if lesions were present in the 600 ppm group then this group would be terminated. If no adrenalglandlesionswere present in the 600 ppmgroup,then the 75 ppm group would be terminated. If adrenal gland lesions were present in all groups, a decision wouldbe made based o n the incidence and severity o f the lesions in the various groups.

Results
Selected Incidences of Nonneoplastic Lesions in Rats in the 13-Week Feed Study TABLE8
Dose (PPm) 0 900 1,700 3,300
of Tricresyl Phosphate
6,600 13,000
Male
na 10
Adrenal Cortex Cytoplasmic Vacuolization,
10 10 10 10 10
Bilateralb 0 10**(1.6)' 10**(2.9) lO"(3.0) 10*'(4.0) lO"(4.0)
Kidney Nephropathy 0 0 0 0 0 9**(1.0) Renal Papilla, Edema 0 0 0 0 1 10.' Renal Papilla, Necrosis 0 0 0 0 0 9' *
Pituitary Gland (Pars Distalis) Basophilic Hypertrophy 0 0 0 6.' 8.' 8' *
Testis Seminiferous Tubules, Atrophy,
Bilateral 0 0 0 0 10**(2.2) 10**(4.0)
Female
n 10 10 10 10 10 10
Adrenal Cortex Cytoplasmic Vacuolization,
Bilateral 0 10**(1.4) 10**(2.7) lO"(3.0) 10*'(4.0) 10**(4.0)
Kidney Nephropathy 0 0 0 0 2 (1.0) 10**(1.0)Renal Papi l la , Edema 0 0 0 0 9*+ 9' * Renal Papilla, Necrosis 0 0 0 0 6** 9. *
OvaryInterstitial Cel l s ,
Hypertrophy 0 9**(4.0) 10**(4.0) 10**(3.9) 9**(4.0) 10**(4.0) Interstitium, Inflammation,
Chronic, Bilateral 0 8**(2.3) 4*(1.8) 4*(1.5) 6**(1.7) 4*(1.3)
l Significantly different (PSO.05) from the control group by the Fisher exact test * * PSO.01 a Number of animalsexaminedmicroscopically
Number o f animals w i t h lesion' Averageseveritygradeoflesions i n affectedanimals: 1 = min ima l , 2 = mild, 3 = moderate, 4 = marked, 5 = severe.

42
2-YEAR FEEDSTUDY Survival Estimates o f survival probabilities for male and female rats are shown in Table 9 and in the Kaplan-Meier curves in Figure 3. Survival o f exposed rats was similar to that o f the controls.
Body Weights, Feed and Compound Consumption, and Clinical Findings The mean body weights o f exposed groups o f male andfemaleratsweresimilar t o those o f controls
TABLE9
Tricresyl Phosphate? NTP TR 433
throughout the study (Tables 10 and 11 and Figure 4). Feed consumption by exposed groups o f male and female rats was similar to that by controls (Tables J1 and J2). Dietary levels o f 75, 150, and 300 ppm tricresyl phosphate wereestimated to deliver average daily doses o f 3, 6, o r 13 mgkg body weight t o males and 4, 7, o r 15 mg/kg to females. There were no chemical-related clinical findings noted in male o r female rats.
Survival of Rats in the 2-Year Feed Study of Tricresyl Phosphate
Male
Animals initially i n study
3-Month interim evaluation’ 9-Month interim evaluation’ 15-Month interim evaluationa Natural deaths Moribund kills Animals surviving t o study termination Percent probability of survival a t end of studyh Mean survival (days)c
Survival analysisd
Female
Animals ini t ia l ly in study
3-Month interim evaluation’ 9-Month interim evaluationa 15-Month interim evaluationa Natural deaths Moribund kills Accidental deathsa Missinga Animals surviving to study termination Percent probability of suwival a t end of study Mean survival (days)
Survival analysis
’ Censoredfromsurvivalanalyses
75 PPm 150 ppm 300 ppm
95 95 95 95
15 15 15 15 14 15 15 15 15 15 15 15 5 4 4 6
14 16 11 16 32e 30 35 28 63 61 71 56
494 489 492 493
P=O.664 P = O . 8 6 8 P=0.604N P=O.606
95 95 95 95
15 15 15 14 15 14 15 15 14 13 15 15 3 3 5 5
14 12 15 18 0 0 0 1 0 0 0 1
34 38e 30 26 67 73 60 54
488 496 499 478
P=O.141 P=0.681N P=0.877 P=O.357
Kaplan-Meier determinations based on the number of animals alive on the first day of terminal sacrifice Meanof a l l deaths (uncensored, censored,a n d terminal sacrifice) The result of the life table trend test (Tarone, 1975) is in the control column. and the results of the life table pairwise comparisons (Cox, 1972) wi th the controls are i n the dosed columns. A lower mortality i n a dose group is indicated by N.
e Includes one a n i m a l tha t diedduringthelastweekofthestudy.

,.0,----t=. ==~.::::::~=t.=====t=. T]];:···~~-···r-·l-----· 0.9 ················'!"················!················t··· ............. ! ................ ~....... .~ .................•. ; ................ .
~ I I I I I . ,;.~ ~ l l l l ! VI 0.8 .... _u·········f·········· .. ····!············ .. ···~······ .. ·········!····· .. ··.-·····1···· .... · ...... ···. . ....... f::,,:: ................. . &.. ::::::
o l l l l l l 5 ~ ~ ~ ~ ~ ~ ~ 0.7 ······ .. ······ .. f·· .. ······· .. ···~····· .. ··· .. ····t·· .. · .. ··········~······· .. ·· .. ···f· .. ·· .. ···· .. ····~······ ,.
~ • M:p~ RATS' I I I I 0.' ......... ~ :O~ ·············r··············T···············r·············T·········· ................ .
: : : : ~ i 1 ~
0300 ......
~ ~ ~ ~ 0.5~----~------~------~-----r------r------r------r-----~
o 15 30 AS 60 75 90 105 120 WEEKS ON STUDY
.. .. .. ..
,.0ra==Ti==~~5~··~····!=·····=·····f····~··t·f·····=j··········l················r-··············· : :
1 I, E .. • .. :
~ 0.8 ················r············r·············r·············"1"···············1···=="""'· ................ ,~:.~ ................ .
~ iii l i , 0.8 ·· .. ············t·········· .. ·····i············· .. ·1············· .. ··i············ .. ··1······· .. · .. ····· . '.' ........ ~:;:, ........... U •••••
~ ::::: : : : i :
~ :::::
:J !!! I ! . ~ 0 7 ·••• .. · .... ······~···· .. •· .. ······I .. ······ .. ······<····· .. ···u ...... , ................ «o ••••••• ••• ••• • •• , •••••••••
~. rr~ALE RA~ iii I : : : :
~ ~ ~ ~ ············T··· .. ···········~················r········ ........ ? .......... .
~ ~ ~ ~ : : : :
.0,.".
0.6 •••.•.••• 0 75 ...... A 150' .... o lOO,., ..
: : : :
~ ~ ~ ~ O.5~----~------~------~-----r------T------+------+-----~
o 15 30 AS 60 75 90 105 WEEKS ON STUDY
120
Results 43
FIGURE 3
Kaplan-Meier Survival Curves for Male and Female Rats Administered Tricresyl Phosphate in Feed for 2 Years

44 Tricresyl Phosphate, NTP TR 433
TABLE10 Mean Body Weights and Survival of Male Rats in the 2-Year Feed Study of Tricresyl Phosphate
WeCkS 0 ppm I5 ppm 150 ppm 300 ppm on Av. W L No. of Av. Wl. W L (%of No. of Av. W L W L (%of No. of Av. W L W L (%of No. of
Study (9) Survivors (9) controls) Survivors (9) conlrols) Survivors (8) controls) Survivors
1 105 95 103 98 95 106 101 95 102 97 95 2 140 95 138 99 95 139 99 95 137 98 95 3 175 95 170 97 95 174 99 95 173 99 95 4 205 95 202 99 95 204 100 95 203 99 95 5 230 95 225 98 95 230 100 95 228 99 95 6 250 95 246 98 95 250 100 95 248 99 95 7 264 95 264 100 95 266 101 95 263 100 95 8 274 95 278 102 95 279 102 95 276 101 95 9 289 95 291 101 95 292 101 95 289 1 0 0 95
10 299 95 302 101 95 301 101 95 299 100 95 11 309 95 311 101 95 314 102 95 310 100 95 12 315 95 318 101 95 320 102 95 315 100 95 13 323 94 326 101 94 323 100 94 323 100 94 17a 354 79 352 100 80 353 100 80 352 100 80 20 377 79 378 100 80 380 101 80 374 99 80 21 373 79 373 100 80 366 98 80 365 98 80 24 394 79 399 101 80 401 102 80 392 100 80 25 385 79 393 102 80 381 99 80 380 99 80 28 411 79 411 100 80 412 100 80 403 98 80 29 404 79 400 99 80 398 99 80 396 98 80 32 423 79 420 99 80 429 101 80 418 99 80 33 408 79 410 100 80 404 99 80 401 98 80 36 429 79 426 Y! 80 434 101 80 420 98 80 37 415 79 417 100 80 408 98 80 406 98 80 40a 431 65 442 103 64 436 101 64 432 100 65 41 423 65 427 101 64 415 98 64 414 98 65 44 441 65 440 100 64 449 102 64 446 101 65 45 429 65 430 100 64 418 97 64 419 98 65 48 455 65 452 99 64 454 100 64 455 100 65 49 438 65 441 101 64 429 98 64 426 97 65 52 455 65 453 100 64 458 101 64 456 100 65 53 429 65 446 104 64 428 100 64 422 98 65 56 453 65 456 101 64 455 101 64 454 100 65 57 438 65 443 101 64 432 98 64 426 97 65 60 457 65 460 101 64 458 100 64 460 101 65 61 442 65 444 1 0 0 64 435 98 64 429 97 65 64 467 65 464 100 64 462 99 64 466 100 65 65a 441 5 0 450 102 49 436 99 49 431 98 50 69 442 49 450 102 48 434 98 48 433 98 50 73 445 47 453 102 47 441 99 46 437 98 49 77 445 47 450 101 47 444 100 45 436 98 49 81 443 46 450 102 46 441 100 44 436 99 48 85 444 45 444 100 45 439 99 44 427 96 46 89 445 44 443 99 41 436 98 43 421 95 43 93 432 43 435 101 39 434 101 40 428 99 38 97 437 40 440 101 36 433 99 40 430 98 34
101 421 35 426 101 32 428 102 38 417 99 32 104 412 33 421 102 31 424 103 35 419 102 28
Mean for weeks 1-13 244 244 100 246 101 244 100 14-52 414 415 100 413 100 409 99 53-104 441 446 101 439 100 434 98
a Interim evaluations occurred during w e e k 14, 40, and 65.

Results 4s
TABLE11 Mean Body Weights and Survival of Female Rats in the 2-Year Feed Study of Tricresyl Phosphate
Weeks 0 ppm I5 ppm IS0 ppm 300 ppm on Av. WL No. of Av. WLWL (%of No. of Av. WLWL (96of No. of Av. WL WL (%of No. of
Study (€9 Survivors (9) controls) Survivors (8) controls) Survivors (9) controls) Survivors
1 91 95 91 99 95 92 100 95 90 99 95 2 111 95 110 99 95 112 101 95 110 99 94 3 126 95 125 99 95 128 101 95 126 100 94 4 140 95 139 99 95 141 101 95 140 100 94 5 150 95 149 100 95 152 101 95 150 100 93 6 158 95 159 101 95 160 101 95 158 100 93 7 164 95 168 102 95 168 102 95 166 101 93 8 170 95 173 102 95 173 102 95 171 101 93 9 174 95 175 101 95 177 102 95 175 101 93 10 179 95 179 100 95 181 101 95 179 100 93 11 182 95 181 99 95 183 101 95 183 101 93 12 182 95 184 101 95 186 102 95 183 1 0 0 93 13 185 94 186 101 94 188 102 94 186 101 92 17a 1% 80 195 99 80 199 101 80 197 101 78 20 208 80 211 102 80 204 98 80 206 99 78 21 204 79 203 99 80 207 102 80 201 99 78 24 215 79 219 102 80 210 98 80 213 99 78 25 210 79 209 100 80 214 102 80 210 100 78 28 220 79 226 103 80 218 99 80 218 99 78 29 216 79 213 99 80 222 103 80 214 99 78 32 225 79 230 102 79 226 100 80 226 100 78 33 220 79 219 100 78 224 102 80 221 100 78 36 231 79 229 99 78 228 99 80 229 99 78 37 228 79 224 98 78 232 102 80 226 100 78 40' 236 64 241 102 64 235 99 65 237 100 63 41 234 64 232 99 64 239 102 65 234 100 63 44 241 64 246 102 63 244 101 65 242 101 63 45 242 64 237 98 63 248 103 65 241 100 63 48 256 64 262 102 63 260 101 65 255 100 63 49 252 64 249 99 63 259 103 65 249 99 63 52 261 64 274 105 63 270 103 65 264 101 62 53 262 64 256 98 63 258 99 65 257 98 62 56 264 64 281 106 63 275 104 64 268 102 62 57 268 64 263 98 63 274 102 64 264 98 62 60 275 63 288 105 62 283 103 64 282 103 62 61 279 63 273 98 62 285 102 64 270 97 62
6Sa 64
289 286
49 63
285 301
99 105
49 62
297 297
103 104
49 64
286 298
99 104
47 62
69 299 49 294 98 48 303 101 49 292 98 47 I3 310 47 304 98 48 312 101 49 304 98 47 77 312 47 308 99 48 317 102 49 307 99 47 81 319 44 315 99 47 324 101 49 312 98 44
89 85
323 325
41 42
323 322
100 99
47 47
328 332
101 102
47 49
317 318
98 98
42 43
93 326 39 330 101 45 335 103 43 324 99 40 97 328 36 331 101 44 336 102 39 319 97 36 101 319 36 327 103 42 332 104 38 312 98 31 104 315 34 320 102 38 332 106 30 313 99 26
Mean for weeks 1-13 155 155 100 157 101 155 100 14-52 228 229 100 230 101 227 100 53-104 300 301 100 307 102 297 99
a Interim evaluations occurred during weeks 14, 40.and 65.

SOO
~
V'l 400
~ < a: 3S0 ~
~ ... 300 :x
~ i:i ~ 2SO >-0 0 m
200 :z < w ~ ISO
I!!I •·········· .. ···r·················"j'"·················t-·················T··················i .. ~;~~TS
100 ................. ·t .... · ...... ·· .... ··· j .. ·· ...... · ...... · .. j .. ·· .. ·· .. · .. · .... ··1 ........ · .. ·· .. ··· .. 1· .. · ~ ::: ~ ~ L-_-,-__ .J
SO+----r---;---r---~---r--~--~ o 15 30 45 60 75 90 lOS
WEEKS ON STUDY
SOO~------~----~------~------~----~------~------,
450 .................... ~ .................... , ......... -... ~ .................... : ..... --
3S0
... :x 300 ~ i:i ~ 2S0 >-o o m :z 200 < w ~ ISO
: : . : : .................... : .................... : .................... : .................... ~ .................... ~ .................... ~ ................... . . . : : :: ..
........ -............ ~ ....... -........... ··1····················~·· _........... . ..... ~ ....... ,_ .... -....... ~ ................ -.. . 1 ............ -.- .... . :: :~ ~ ~ ~ A ~ @ ................... :- .................... [ .................... ]" ............. ~ ... ;a ··i··~··8.; .................... 'f ................... . : ' :!I e a , ,
::]~:a~:~~ri__I:I::I ··~·l··············+·············,·····-·············· ..... _,. rr;A~TS
loo! ................ ~ .................. ~ .................... , ..................... i ................. .. i.... ~ :::
so+-------~-----+------~------~.------~----~~----~ o 15 30 45 60 75 90 WEEKS ON STUDY
lOS
Tricresyl Phosphate, NTP TR 433 46
FIGURE 4 Growth Curves for Male and Female Rats Administered Tricresyl Phosphate in Feed for 2 Years

47 Results
Hematology, Clinical Chemistry, and Neurobehavioral Results There were no significant differences in hematology parametersmeasuredat the 3-, 9-, or15-month interim evaluations that could be related t o chemical exposure (Tables G3, G4, and G5). Serum cholinesterase activity in females thatwere exposed t o 150 ppm and in males and females that were exposed t o 300 or 600 ppm were significantly lower than those in the controls atthe 3-month interim evaluation. At the 9-month evaluation, serum cholinesteraseactivity o f 150 ppm males and females and 300 ppm females were significantly lower than those ofcontrols. At the 15-monthevaluation, cholinesteraseserumactivities in all exposed groups o f female rats and in 300 ppm male rats weresignificantly lower than those in the controls.
Hindlimbgripstrengths in 300 ppmmalesand in males and females exposed t o 600 ppm were significantly lower than those o f controls at t h e 3-month interim evaluation (Table H4). The change in group mean hindlimb grip strength i n 300 ppm males was significantlylower than that o f t h e controls. There wereno significantchanges in neurobehavioral measurements among any groupso f rats at the 9- and 1s-month interim evaluations (Tables H5 a n d H6).
Pathology and Statistical Analyses of Results This section describes the statisticallysignificant or biologically noteworthy changes in t h e incidences o f nonneoplastic lesions o f the adrenal gland, ovary, and kidney and in the incidence o f mononuclear cell leukemia. Summaries o f t h e incidences o f neoplasms andnonneoplastic lesions, individual animal tumor diagnoses, andstatistical analyses o f primary neoplasms that occurred with an incidence o f at least 5% inat least one animalgrouparepresented in
femalesexposed t o 300 and 600 ppm, and was characterized by increased numbers ofsmall,fine vacuoles in the cortical cells o f the zona fasciculata, resulting in aground glass appearanceandan increase in cell size. Cells o f the zona reticularis in exposed ratsweremorecompactthanthosein controls and sinusoids were less apparent, giving the impressionthat t h e size o f cellsin thezona fasciculata might have caused some compression. In 300 ppm females, t h e fine cytoplasmic vacuoles were still present t o a minimal degree; however, cell size in thezona fasciculata was not increased t o the same degreeasthat observedin 600 ppm females, and therefore, compressiono f the zona reticularis was less apparent. Based on these results, the decision was made t o stop chemical exposureof the 600 ppm groups and maintain these animals on control feed.
At t h e 9-monthinterimevaluation,allfemales exposed t o 300 ppm and three 150 ppm females had cytoplasmicvacuolizationof theadrenal cortex; however, the severity o f the lesions was less than that observed at the 3-monthevaluation(Tables12 and BS). A t the 15-monthinterimevaluation cytoplasmicvacuolization o f the adrenalcortex was observed in all 300 ppm females, but the severity was minimal. A t the end o f the 2-yearstudy, the incidence o f cytoplasmicvacuolization o f theadrenal cortex was significantly increased in females exposed t o 300 ppm (Tables 12 and BS). Although the lesion was also present in controls (Plate l), the pathology working group consideredt h e severity o f the lesion in t h e 300 ppm group (Plate2) t o be slightly greater than and distinguishable from that in the controls.
Ovoly: Minimal t o mild interstitial cellhyperplasia was present in female rats exposed to 150or 300 ppm at the 3-,9-, and 15-month interim evaluations and in
Appendix A for male rats and Appendix B for female600 ppmfemales at9months(Tables 12 and BS). rats.Historicalcontrol incidences for leukemia in female rats appear in Appendix B.
Adrenal gfond: At the 3-monthinterimevaluation, the absoluteandrelativeadrenal glandweights o f females exposed t o 300 or 600 ppm were significantly greaterthanthose o f controls(Table F4). Cytoplasmicvacuolization o f t h e adrenal cortex was observed in one 150ppm female, all300 ppm females and 600 ppm males, and nine 600 ppmfemales (Tables 12 and B5). The lesion was most severe in
Thislesionoccurredwith moderate severityin 600 ppmfemales at 3 months. The lesion was the same as that diagnosed as hypertrophy inthe 13-week studies. At the end o f the 2-year study the incidence o f interstitialhyperplasia significantlycell was increased i n femalerats exposed t o 300 ppm. The lesion was characterized by an increase in size and possibly number o f interstitial cells (Plates 3 to 6). There was no particular alteration o f ovarian architecture, b u t ratheranenhancedprominence o f interstitial cells in animals with this lesion.
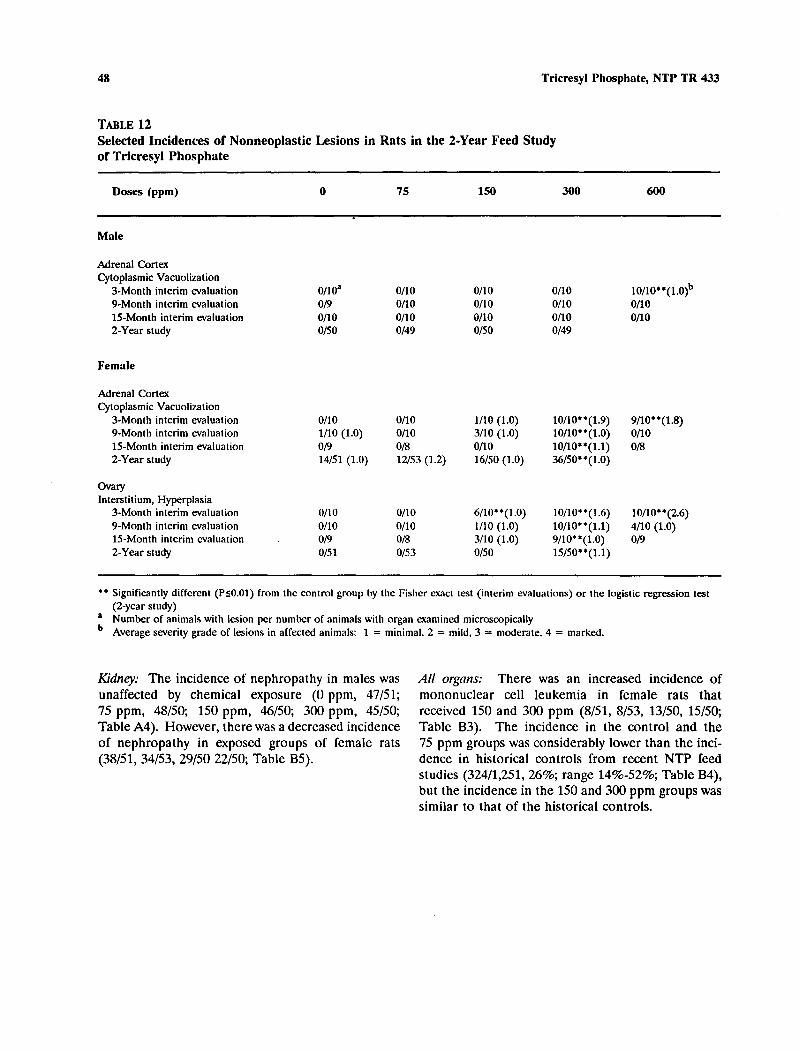
48 Tricresyl Phosphate, NTP TR 433
TABLE12 Selected Incidences of Nonneoplastic Lesions in Rats in the 2-Year Feed Study o l Tricresyl Phosphate
Doses (ppm) 0 75 150 300 600
Male
Adrenal Cortex Cytoplasmic Vacuolization
3-Month interim evaluation 0/1oa 0/10 0/10 0/10 10/lO**(l.O)b 9-Month interim evaluation 0/9 0/10 on0 0/10 on0 15-Month interim evaluation on0 O/l0 on0 0/10 0/10 2-Year study 0/50 0/49 0/50 0/49
Female
Adrenal Cortex Cytoplasmic Vacuolization
3-Month interim evaluation Oh0 0/10 1/10 (1.0) 10/10**(1.9)9/lO**(l.S) 9-Month interim evaluation 1no (1.0) O h 0 3/10 (1.0) lono**(l.o) 0/10 15-Month interim evaluation O B O B 0/10 10/10**(l.l) 0/8 2-Year study 14/51(1.0) 12/53 (1.2) 16/5036/50**(1.0)(1.0)
OvaryInterstitium, Hyperplasia
3-Month interim evaluation 0/10 Q/10 6/10**(1.0) 10/10**(1.6)10/10**(2.6) 9-Month interim evaluation 0/10 0/10 1/10 (1.0) 10/10**(1.1)4/10(1.0)15-Month interim evaluation 0/9 O B 3/10 (1.0) 9/10**(1.0) 0/9 2-Year study 0/51 0/53 O b 0 15/50**(1.1)
* * Significantly different (PSO.01) from the control group by the Fisher exact test (interim evaluations) or the logistic regression test (2-year study)
a Number o f animals wi th lesion per number o f animals w i t h organ examined microscopically Averageseveritygradeoflesions i n affected animals: 1 = minimal , 2 = mild, 3 = moderate, 4 = marked.
Kidney: The incidence o f nephropathy in males was AN orgcms: Therewasanincreasedincidence of unaffected by chemicalexposure (0 ppm, 47/51; mononuclearcellleukemiainfemaleratsthat 75 ppm, 48/50; 150 ppm, 46/50; 300 ppm, 45/50; received 150 and 300 ppm (8/51, 8/53,13/50, 15/50; Table A4). However, there was a decreased incidence Table B3). The incidence in the controlandthe o f nephropathy in exposed groups o f femalerats 75 ppm groups was considerably lower thanthe inci(38/51, 34/53, 29/50 22/50; Table BS). denceinhistoricalcontrolsfromrecent NTF' feed
studies (324/1,251,26%; range 14%-52%; Table B4), but the incidence in the 150and 300 ppm groups was similar t o that o f the historical controls.

Results 49
MICE Totalspontaneous activity at day 14 inmalemice 16-DAY GAVAGESTUDY that received 1,450 and 5,800 mgkg was significantly Fivemalemiceandallfemalemice receiving lower than that in controls (Table H7). Startle 1,450 mgkg,allmaleandfemale micereceiving response latency in male mice receiving 730, 1,450, 2,900 mgkg,andfourmale mice and onefemale and 5,800 mg/kg was significantly longer than that of mouse receiving 5,800 mgkg died before the end o f controls at day 14. Forelimb grip strengths of male the study (Table13); these deaths were attributed to mice that received 1,450 mg/kg and o f malesand chemical The final mean body females that received 5,800 mgkg were significantly administration. weights o f males that received 1,450 and 5,800 mg/kg lowerthanthose o f controlsatday 14. Hindlimb were significantly lower thanthat o f thecontrols, grip strengths o f 360 mgkg males, 730 mgkg males whilethefinalmean body weights andmean body and females, 1,450 mg/kgmales, and 5,800 mg/kg weight gains of females that received 360, 730, and males and females were significantly lower than those 5,800 mgkg were significantly greater than those o f of the controls on day 14 o f the study. The absolute the controls. The primary clinical observation was andrelativethymusweights o f malesandfemales roughhaircoat which occurred in sevenmales receiving 5,800 mgkg were significantly lower than receiving 1,450 mgkg and 10 males and four females those o f the controls(Table M). Absolute liver receiving 5,800 mg/kg. weights of males that received 360 o r 730 mgkg and
TABLE13 Survival and Mean Body Weights of Mice in the 16-Day Gavage Study of Tricresyl Phosphate
Mean Bodv Weiphtb (2)
Final
27.4 f 0.3 27.9 & 0.3 27.8 f 0.6 24.5 f 0.6.
-
26.3 f 1.0.
20.8 f 0.3 22.6 f 0.3.' 24.3 & 0.4..
23.3 f 0.4..
Dose (mdkg)
Male
0 360 730
1,450 2,900 5,800
Female
0 360 730
' 1,450 2.900 5,800
Final Weight Relative to Controls
(%)
102 101 89 -
96
109 117
-112
* Significantly different (PSO.05) from the control group by Williams' or Dunnett's test * * P10.01 a Numberofanimalssurviving a t 16 days/number ini t ia l ly i n group
Weights and weight changes are given as mean 2 standard error. Subsequent calculations are based on the number of animals surviving to the end of the study. N o data calculated for groups w i t h 100% mortality. Dayof death: 14, 15, 15, 16, 16 Day o f death: 6, 6, 7, 9, 10, 11, 11, 12, 13, 15
e Dayof death: 15,15,16,16 Day o f death: 13, 13, 13, 14, 14, 14, 14, 14, 14, 15 Dayof death: 3,4, 8, 9, 9, 10.10. 12,12,12 Dayof death: 5
Survivala
10/10 1on0 10/10 5/1oc OllOd 6/10e
loll0 loll0 loll0 0/10f O/lOS 9/10h
Initial
26.0 % 0.4 25.8 rt 0.3 25.0 f 0.4 26.0 f 0.5 26.3 f 0.3 26.2 f 0.4
19.9 f 0.4 20.3 & 0.2 20.4 f 0.4 19.9 f 0.3 20.8 f 0.4 20.8 f 0.2
Change
1.4 '. 0.3 2.1 f 0.2 2.8 f 0.3.
-1.7 fOB*. -
-0.1 f 0.7
0.9 f 0.3 2.3 t 0.2** 3.9 f 0.4**
-2.4 f 0.3**

50 Tricresyl Phosphate, NTP TR 433
all dosed groups o f females were significantly greater marked. Lymphoid depletion and necrosis o f the than thoseo f the controls; relative liver weights o f all spleen and thymus also occurred in a few males and dosed groups o f males and females were significantly females that received 5,800 m@g, but the severity greater than those of the controls. ranged from minimal to moderate. Mild lymphoid
depletion o f the thymus was also observed in four No gross lesions observed at necropsy were related t o males receiving 1,450 mg/kg. chemical administration. Microscopic lesions includ- ing lymphoid depletion and/or necrosis o f the mandi- Dose selection rationale: Due to reduced survival and bular lymph node, spleen, and thymus were observed the occurrence o f lymphoid depletion of the spleen primarily in males and females that received and thymus in male and female mice receiving 1,450, 2,900 mg/kg (Table 14). Maleand female mice 2,900, and 5,SOO mg/kg, these doses were considered receiving 2,900 mg/kg had increased incidences o f too high for the high dose in a 13-week gavage study. lymphoid depletion and necrosis o f the spleen and Therefore, 800 mgkg was selected as the high dose thymus and necrosis o f the mandibular lymph node; for the 13-week gavage study, with the remaining the severity o f these lesions ranged from mild t o doses being 50, 100, 200, and 400 m@g.
TABLE14 Selected Incidences of Nonneoplastic Lesions in Mice in the 16-Day Gavage Study of Tricresyl Phosphate
Doses (mdkg) 0 1,450 2,900 5,800
Male
na 10 5 10 6
Mandibular Lymph Node Necrosis, Multifocalb 0 0 5*(2.O)' 0
Spleen Necrosis, Multifocal 0 0 9**(2.4) 0 Lymphoid Depletion, Diffuse 0 0 lO"(3.5) 2 (2.0)
Thymus Necrosis, Diffuse 0 0 3 (3.7) 0 Necrosis, Multifocal 0 0 3 (3.0) 0 Lymphoid Depletion, Diffuse 0 4**(2.3) 6**(3.7) 3*(2.3)
Female n 10 10 9
Mandibular Lymph Node Necrosis, Multifocal 0 8**(2.4) 0
Spleen Necrosis, Multifocal 0 10**(2.4) 0 Lymphoid Depletion, Diffuse 0 10**(3.4) 0
Thymus Necrosis, Diffuse 0 8**(3.9) 0 Necrosis, Multifocal 0 0 1 (1.0) Lymphoid Depletion, Diffuse 0 SO'(3.3) 1 (2.0)
* Significantly different (PsO.05) from the control group by the Fisher exact test * * P50.01 a Number of animals wi th oigan examined microscopically; males and females receiving 360 a n d 730 m g k g and females receiving
1,450 mgkg not examined microscopically. Number of animals wi th lesion
' Averageseveritygradeoflesions in affectedanimals: 1 = minimal. 2 = mild, 3 = moderate, 4 = marked, 5 = severe.

Results 51
13-WEEK GAVAGESTUDY All mice survived t o the end o f the s tudy (Table 15). mice receiving 800 mgkg beginning at approximately The final mean body weights and mean body weight day 60. Hindlimb weakness was also observed in all gainsofmalemicethat received 200,400, and females receiving 400 mgkg(Table H8). Absolute 800 mgkg were significantly lower than those o f the and relative liver weights in female mice that received controls, and the final mean body weights and mean 200,400, o r 800 mgkg were significantly greater than bodyweight gains o f female mice that received those o f the controls; however, other organ weight 400 and 800 mg/kg were significantlylower than diffcrencesweremost likely related t o lowerfinal those ofcontrols. Feed consumption by groups o f mean body weights of these groups (Table F8). exposed mice was similar to that by controls. There were no differences in hematologic parameters
related to chemical administration (TableG6). There Clinical findingsrelated to chemical administration were significant, dose-relateddecreasesinserum
weaknesshindlimb all dosed groups of males consisted o f hindlimb and cholinesterase activity in tremors, which were observed in all male and female and females.
TABLE15 Survival and Body Weights of Mice in the 13-Week Gavage Study of Tricresyl Phosphate
Mean Body Weightb (g) Final Weight Dose Survivala Initial Final Change Relative to Controls
(wdkg) ( W
Male
0 10/10 26.5 f 0.5 38.6 f 0.5 12.1 2 0.8 50 10/10 25.5 f 0.5 39.7 f 0.8 14.2 f 0.8 103
100 10/10 25.1 1 0.7 40.6 f 0.8 15.5 f 0.9 105 200 10/10 26.0 2 0.5 35.3 2 0.7** 9.3 f O S * * 91 400 10/10 25.0 2 0.5 33.9 2 0.5.. 8.9 f 0.6.. 88 800 1ono 25.3 2 0.5 29.3 f 0.5'. 4.0 f O S * * 76
Female
0 10/10 18.8 d 0.3 27.9 f 0.1 9.1 f 0.6 50 1ono 19.3 f 0.5 2 8 . 1 f 1.4 8.8 f 1.1 101
100 10/10 19.6 f 0.4 29.3 f 0.7 9.1 2 0.7 105 200 10/10 19.3f 0.3 27.2 f 0.3 7.9 2 0.4 97 400 1 Oh0 20.0 f 0.5 24.7 2 0.5" 4.7 f 0.3'. 89 800 10/10 19.5 2 0.2 22.6 f 0.3" 3.1 f 0.2.. 81
* * Significantly different (PSO.01) from the control group by Williams' or Dunnett's test a Number o f animals surviving at 13weeks/numkr initially in group
Weights and weight changes are given as mean 2 standard error.

52 Tricresyl Phosphate, NTP TR 433
The total activity o f maleandfemalemice that The principal lesions associated with administration received S 0 0 mgkg was significantly lower than that of tricresyl phosphate occurred in the adrenal gland, of controls at the end of the study. Although the ovary, spinal cord, and sciatic nerve (Table 16). The change in group mean activity was significant for lesions in the ovary and adrenal gland were similar to females that received SO0 mg/kg, i t was not significant those described for rats. Multifocal axonal degenera- for SO0 mgkg males. Post-exposure startle response tion of the spinal cord and sciatic nerve was observed latency was significantly longer i n groups of males in mice that received 100 mgkg o r greater. The and females that received 400 o r SO0 m a g than that lesions were characterized by scattered swollen axom measuredfor controls. Forelimb and hindlimb grip o r clear vacuoles representing dilated myelin sheaths. strength of 400and 800 mgkg males and females was The number of affected axonsgenerallyincreased significantlylower than that measured for controls. with dose. There were also occasional aggregates of Forelimb and hindlimb grip strength of 200 mgkg mononuclear inflammatory cellsobservedin the females and hindl imb grip strength of 200 mg/kg sciatic nerve o f some of the affected mice. males were also lower thansignificantly tha t measured for controls.
TABLE16 Selected Incidences of Nonneoplastic Lesions in Mice in the 13-Week Gavage Study of Tricresyl Phosphate
~~ ~~
Doses (mdkg) 0 -50 100 200 400 800
Male
Spinal Corda 10 10 10 10 10 10 Multifocal Axonal Degenerationb 0 0 2 (1.O)C 9**(1.2) 9**(1.3) 10**(2.1)
Sciatic Nerve 10 10 10 10 9 10 Multifocal Axonal Degeneration 0 0 0 6**(1.0) 9**(1.5) 10**(3.0)
Adrenal Cortex 10 10 10 10 10 10 Cytoplasmic Vacuolimtion 0 lO**(l.S) 10**(1.4) lO'L(2.0) 10**(2.0) 10**(3.0)
Female
Spinal Cord 10 9 10 10 10 10 Multifocal Axonal Degeneration 0 0 S ( l . 0 ) 9**(l.S) lO"(2.2) 10**(2.2)
Sciatic Nerve 10 9 10 10 10 10 Multifocal Axonal Degeneration 0 0 l ( l . 0 ) 10**(1.5) 10**(1.6) 9**(2.7)
Adrenal Cortex 10 10 10 10 10 10 Cytoplasmic Vacuolization 0 lO**(l.O) 10**(2.4) 10**(3.0) 10**(3.0) 10**(4.0)
Ovary 10 10 10 10 10 10 Interstitial Cell Hypertrophy 0 9**(1.2) lO"(1.5) 10*'(1.7) 10**(2.3) 10**(2.6)
* Significantly different (PjO.0S) from the control group by the Fisher exact test * * Ps0.01 a Number of animals wi th organ esaniined microscopically
Number o f animals w i t h lesion Average severity grade of lesions in affected animals: 1 = min ima l , 2 = mild, 3 = moderate, 4 = marked, 5 = severe,

53
20.9
16.5
Results
I S W E E K FEEDSTUDY All mice survived t o the endo f the study (Table17). The final mean body weights and mean body weight gains of 2,100 ppm females and males and females exposed to 4,200 ppm were significantly lower than those o f the controls. A t week 12, feed consumption by female mice was progressively less with increasing concentration,andconsumption by the 4,200 ppm group was less than at week1. Feed consumption by
TABLE17 Survival, Mean Body Weights, and Feed Consumption of Tricresyl Phosphate
~ ~ ~~ ~ ~~~~~
other exposed groups o f mice was similar t o that by the controls. Dietary levels o f 250, 500, l,ooO, 2,100, and 4,200 ppm tricresyl phosphate were estimatedt o deliver average daily doses o f 45, 110, 180, 380, and 900 m a g body weight to males and 65, 130, 230, 530, and 1,050 mgkg t o females. The only clinical findings considered t o be relatedtochemical exposure were tremors, which occurred on day 86 in two males and three females exposed t o 4,200 ppm.
of Mice in the 13-Week Feed Study
~~~~~~~ ~~ ~~~
Final Weight Menn Body Weiehtb (e) Feed Relative
Dose Survivala Final Change ControlsConsumptionCInitial to(PPm) ("/.I Week 1 Week 12
Male
0.4 f21.331.4 0.2 250 1o n0 21.432.4f
0 1o n0 1.0 f10.1 f 0.7 4.1 4.9 0.7 f103 5.3 4.4 0.8 f11.0
0.9 f9.931.4 0.64.6f 8.8 0.2" -c25.95.0
0.4 f31.121.2 1,m 1o n0 21.5 f 0.4
0.5 f30.021.3
500 1on0 0.4 f 99 5.9 5.50.7 f9.8 0.7 f100 4.2 5.2
2,100 1ono 0.4 f 96 4.6 l o n o 4,200 -c 0.3 0.3** 82 5.3 4.7
Female
0 lo/] 0 0.3 f17.128.2 250 16.6 f 0.3
f 0.9 6.50.6 f28.111.6
0.8 f11.15.1 1o/lo f 0.6 5.0 6.4 100
500 1o n0 98 5.2 10.5 27.6 0.7 f0.4 f17.1 I0.4 6.2
f 0.4**5.4 0.3 1o n0 17.127.0f 0.8I96 4.2 5.9 0.9 f9.9 1,0oo
2,100 1o n0 24.1 0.3 f16.9 0.5.' f7.2 86 5.0 l o n o 4,200 22.6 0.3 f f 0.3** 80 5.30.3** 4.2f6.1
* * Significantly different (PSO.01) from the control group by Williams' or Dunnett's test a Number o f animalssurviving a t 13 weeks/number initially i n group
Weights and weightchangesaregivenasmean f standarderror. Feed consumptionis expressed as grams per animal per day. /

54
Forelimb grip strength of male and female mice exposed to 2,100 and 4,200 ppm and hindlimb grip strength o f 2,100ppmfemales and of males and femalesexposed to 4,200ppmweresignificantly lower than those o f controls (Table H9). Differences in organ weights were most likely due to the lower final mean body weights (Table F9). Slight decreases in hemoglobin and mean erythrocyte hemoglobin concentration were observed in male mice exposedto 4,200ppm, and greater numbers of segmented neutrophils were observed in2,100 and 4,200 ppm males than in the controls (Table G7). However, these slight differences were not considered to be related to chemical exposure. There was a significant dose-related decrease in the serum cholinesterase values in all exposed groups o f male and female mice.
Lesions associated with chemical exposure occurred in the spinal cord, sciatic nerve, adrenal gland, gallbladder, ovary, and kidney (Table 18). Axonal degeneration was observed in both the spinal cord and sciatic nerve, but appeared to be more severe in the sciatic nerve (Plate 7). The lesion was similar to that observed in mice in the 13-week gavage study. While there also appeared to be some loss o f myelin sheaths, this was difficult to determine from the routine paraffin embedded sections. The adrenal gland and ovary lesions were also similar to those seen miceinin the 13-week study.gavage
Tricresyl Phosphate, NTP TR 433
Cytoplasmic vacuolization o f the adrenal cortex occurred in all exposed groups of female mice and in malemiceexposed to 500, l,OOO, 2,100, and 4,200ppm. Scattered individual or multiple small foci o f tubule regeneration were observed in the kidney of all 4,200 ppm male mice; none were observed in female mice or in controls.
Hyperplasia of the mucosal epithelium of the gallbladder was observed in male mice exposed to 500 ppm or more and in female mice exposed to 1,OOOppm or more tricresyl phosphate. The hyper- plasia was characterized by enlargement and crowding of the epithelial cells to form short, blunt, mucosal folds.
Dose selection rationale: The occurrence o f axonal degeneration in male and female mice exposed to l,OOO, 2,100, and 4,200 ppm indicated that these concentrations were too high for the highest exposure level in a 2-year feed study. Because of the presence of adrenal cortex lesions in males and females receiving500ppm and the cumulative and potentially irreversible nature of axonal degeneration from continued chemical exposure, 500 ppm was not con- sidered to be an appropriate high exposure level for the 2-year feed study. Since the adrenal cortex lesions were minimal in females and absent in males that received 250ppm, this was selected asthe highest exposure level for the 2-year feed study.

ResuI ts 55
TABLE18 Selected Incidences of Nonneoplastic Lesions in Mice in the 13-Week Feed Study of Tricresyl Phosphate
Doses (ppm) 0 250 500 1,000 2,100 4,200
Male
Adrenal Cortexa 10 10 10 10 10 10 Cytoplasmic Vacuolization,
Bilateralb 0 0 lO**(l.l)C 10**(1.3) 10**(2.1) 10**(3.0)
Gallbladder 9 9 10 10 10 9 Mucosa, Hyperplasia, Papi l la ry 0 0 4 (1.5) 6**(1.2) 3 (2.3) 3 (1.7)
Kidney 10 10 10 10 10 10 Renal Tubules, Regenerationd 0 0 0 0 0 10**(1.0)
Sciatic Nente 10 10 10 10 10 10 Axonal Degeneration 0 0 0 0 3 (2.7) 10**(2.7)
Spinal Cord 10 10 10 10 10 10 Axonal Degeneration 0 0 0 0 3 (1.0) 4*(1.0)
Female
Adrenal Cortex 10 10 10 10 10 10 Cytoplasmic Vacuolization,
Bilateral 0 10**(3.0) 10**(3.0) 10**(3.8) 10**(4.0) 10**(4.0)
Gallbladder 10 9 9 10 10 10 Mucosa, Hyperplasia, Papillary 0 0 0 10**(2.2) 7**(2.1) 8**(2.4)
Ovary 10 10 10 10 10 10 Interstitial Cel l s , Cytoplasmic
Vacuolization, Bilateral 0 0 0 2 (1.0) 5*(l.O) 10**(1.0)
Sciatic Nerve 9 9 10 10 10 10 Axonal Degeneration 0 0 0 4 (1.0) 10**(2.7) 8**(3.0)
Spinal Cord 10 10 10 10 10 10 Axonal Degeneration 0 0 0 0 6**(1.0) 6**(1.0)
l Significantly different (P50.05) from the control group by theFisherexacttest * * P50.01 a Numberofanimalsexaminedmicroscopically
Number o f animals w i t h lesion Average severity grade o f lesions i n affected animals: 1 = min ima l , 2 = mild, 3 = moderate, 4 = marked, 5 = severe. Diagnosed as cytoplasmic alteration by the laboratory pathologist

56 Tricresyl Phosphate, NTP TR 433
%YEAR FEEDSTUDY of the controlsthroughoutthestudy(Tables 20 Survival and 21 and Figure 6). Thefinalmeanbodyweights Estimates of survivalprobabilitiesformale and of all exposed groups of mice were similarto those of female mice are shown in Table19 and in the thecontrols.Feedconsumption by exposedgroups Kaplan-Meier curvesin Figure 5. Survival of exposed ofmaleandfemalemicewassimilar to that by groups was similar to that of the controls. controls (Tables53 and J4). Dietary levels of 60,125,
and250 ppm tricresyl phosphate were estimated to Body Weights, Feed and Compound deliver average daily doses of 7,13, o r 27 mgkg bodyConsumption, and Clinical Findings weighttomales and 8,18, or 37 mgkg to females. Themeanbodyweightsofmale and femalemice N o chemical-related clinical findings of toxicity were exposed to tricresyl phosphate were similar to those noted in male o r female mice.
TABLE19 Survival of Mice in the 2-Year Feed Study of Tricresyl Phosphate
0 PPm 60 PPm 125 ppm 250 ppm
Male
Animals initially i n study 95 95 95 95
3-Month interim evaluationa 13 15 15 15 9-Month interim evaluation" 15 15 15 15 15-Month interim evaluationa 15 15 15 1.5 Natural deaths 4 5 4 6 Moribund kills 4 1 1 2 Accidental deaths" 1 0 0 0 Missinga 0 1 1 0 Animals surviving to study termination 43 43 44 42 Percent probability of survival a t end of studyb 86 88 90 85 Mean survival (days)c 504 504 509 5 0 4
survival analysisd P=O.979 P=0.763N P=0.551N P=O.807
Female
Animals ini t ia l ly i n study 95 95 95 95
3-Month interim evaluation' 15 15 15 15 9-Month interim evaluation' 15 15 15 15 15-Month interim evaluation" 15 15 15 14 Natural deaths 5 7 2 3 Moribund kills 4 5 4 3 Miss inga 0 0 2 0 Animals surviving t o study termination 41' 38' 42 45 Percent probability of survival a t end of study 82 77 88 89 Mean survival (days) 508 504 499 507
Survival analysis P=0.263N P=O.607 P=0.603N P=0.570N
a Censoredfromsurvivalanalyses Kaplan-Meier determinations based on the number of animals alive on the first day of terminal sacrifice Mean o f all deaths (uncensored. censored, a n d terminal sacrifice) The result o f the life table trend test (Tarone. 1975) is in the control column, a n d the results o f the life table pailwise comparisons (Cox, 1972) w i t h the controls are in the dosed columns. A negative trend or a lower mortality i n a dose group is indicated by N.
' Includes one a n i m a l t h a t died dur ing thelastweekof the study.

i :::~;:1=i=t===t:==:t==~~~i=:tJ'-"i--""r---' v.. .J' ......... * •• _ •••
...... o
5 iii ~ o IE 0.8 MALE MICE .0 ....
010"'"
~
5 3
/}. 1%5 ......
o DD""
O.7!O---j:---:t:---±---i----+---i----i----I ~ ~ ~ ~ ~ ~ ~ 120
W£D<S ON STUDY
1.0.---l!Ir-r~---------t:-------i.-=~b--=--=-=-=lilF··::;:····=t···_···_···+t·_···_···_···..,······I················t··············· : : : :
, I
o IE 0.8 FrMAL( MICE .0',.. 0.0 .... /}. 1%5 ......
ODD ....
O.710:---:±~:---:,:tO---~i:----i.o---475---IOi----I05i---t2-10 W£D<S ON STUDY
FIGURE 5 Kaplan-Meier Survival Curves for Male and Female Mice Administered Tricresyl Phosphate in Feed for 2 Years
57 Results

58 Tricresyl Phosphate, NTP TR 433
TABLE 20 Mean Body Weights and Survival of Male Mice in the 2-Year Feed Study of Tricresyl Phosphate
wuks 0 upm 60 ppm 125 ppm 250 pum on Av. W L No. of Av. W LW L (%of No. o f Av. W LW L (%of No. of Av. W L W L (%of No.of
Study (9) Survivors (9) controls) Survivors (g) controls) Survivors (9) controls) Survivors
1 22.2 95 22.3 101 95 22.1 100 95 22.2 100 95 2 23.6 95 23.5 100 95 23.4 99 95 23.5 100 95 3 24.4 95 24.2 99 95 24.4 100 95 24.4 100 94 4 25.6 95 25.5 100 95 25.4 99 95 25.5 100 94 5 26.3 95 26.1 99 95 26.4 100 95 26.3 100 94 6 27.2 95 27.3 100 95 27.3 100 95 27.3 100 94 7 27.9 94 27.7 99 95 27.7 99 95 28.1 101 94 8 28.6 94 28.5 100 95 28.6 100 95 28.8 101 94 9 29.4 94 29.4 100 94 29.3 100 95 29.4 100 94 10 29.9 94 30.1 101 95 30.1 101 95 30.3 101 94 11 30.4 93 30.1 99 94' 30.1 99 95' 30.3 100 94' 12 31.8 93 31.7 100 94 31.4 99 95 31.8 100 94 13 32.0 93 32.0 100 94 31.9 100 95 32.3 101 94 17b 34.6 79 34.6 100 79 35.0 101 80 35.5 103 79 21 36.5 79 36.4 100 79 36.8 101 80 37.2 102 79 25 38.3 79 38.5 101 79 38.9 102 80 39.7 104 79 29 39.6 79 39.5 100 79 39.8 101 80 40.8 103 79 33 41.O 79 40.9 100 79 41.4 101 80 41.9 102 79 37 42.9 79 43.1 101 79 43.5 101 79 44.1 103 79 41b 42.9 64 42.4 99 64 42.8 100 64 44.1 103 64 45 43.6 64 43.9 101 64 44.3 102 64 45.7 105 64 49 45.3 64 45.5 100 64 45.7 101 64 47.3 104 64 53 45.2 64 45.8 101 64 46.3 102 64 47.4 105 64 57 46.2 64 46.4 100 64 46.3 100 64 47.9 104 64 61 46.4 64 47.0 101 63 47.7 103 64 48.3 104 64 65 47.2 64 41.8 101 63 48.4 103 64 48.6 103 64 69b 48.0 49 47.7 99 48 49.1 102 49 48.7 102 49 73 46.5 49 47.6 102 47 49.0 105 49 48.1 103 49 77 48.0 49 48.8 102 41 50.2 105 49 49.6 103 47 81 47.3 48 48.5 103 41 50.1 106 49 49.2 104 47 85 46.3 47 47.7 103 47 49.0 106 47 47.7 103 46 89 47.3 46 48.7 103 47 50.1 106 47 49.2 104 46 93 46.6 44 46.9 101 47 49.1 105 47 48.3 104 46 97 47.2 44 47.4 100 47 48.7 103 46 48.5 103 46 101 46.1 43 45.8 99 44 48.6 105 45 46.9 102 44 105 44.7 43 43.7 98 43 47.0 105 44 44.3 99 43
Mean for weeks 1-13 27.6 21.5 100 27.6 100 27.7 100 14-52 40.5 40.5 100 40.9 101 41.8 103 53-105 46.6 47.1 101 48.5 104 48.1 103
' The number o f animals weighed for this week is fewer than thenumber o f animals surviving. Interim evaluationsoccurred during weeks 14,40,and 66.

Results 59
TABLE21 Mean Body Weights and Survival of Female Mice in the 2-Year Feed Study of Tricresyl Phosphate
Weeks 0 ppm 60 ppm 125 ppm 250 pprn on Av. Wt. NO. or AV. wt. wt. (got NO. or AV. wt. wt. (%or NO. or AV. wt. wt.(96or N O . O ~
Study (g) Survivors (g) controls) Sutvivors (g) controls) Survivors (9) controls) Survivors
1 18.4 95 18.5 101 95 18.4 100 95 18.3 100 95 2 19.8 95 19.8 100 95 19.7 100 95 19.6 99 95 3 20.7 95 20.9 101 95 m.9 101 95 20.7 100 95 4 22.2 95 22.2 100 95 22.1 100 94 21.8 98 95 5 22.8 95 23.1 101 95 23.1 101 94 23.0 101 95 6 24.0 95 24.1 100 95 24.3 101 94 24.1 100 95 7 24.6 95 25.0 102 95 24.9 101 94 24.8 101 95 8 25.5 95 26.1 102 95 25.9 102 94 25.9 102 95 9 26.3 95 26.7 102 95 26.9 102 94 26.3 100 95
10 27.3 95 27.6 101 95 27.7 102 94 27.0 99 95 11 28.1 9 9 29.1 104 95a 28.6 102 94a 28.1 100 95a 12 28.4 95 29.3 103 95 29.1 103 94 28.6 101 94 13 29.1 95 29.7 102 95 29.9 103 94 29.2 100 94 17b 31.9 80 33.3 104 80 33.2 104 79 32.9 103 79 21 34.8 80 35.7 103 80 35.5 102 79 35.2 101 79 25 37.1 80 38.3 103 80 38.3 103 79 37.5 101 79 29 38.6 80 39.3 102 80 39.2 102 79 39.0 101 79 33 40.0 80 41.0 103 80 40.9 102 I9 40.5 101 79 37 41.6 80 42.9 103 80 42.4 102 79 42.3 102 79 41b 42.1 65 41.7 99 65 41.7 99 63 41.6 99 64 45 43.0 65 43.9 102 65 43.8 102 62 43.8 102 64 49 44.9 65 45.0 100 65 45.7 102 62 45.5 101 64 53 45.2 65 45.8 101 65 45.5 101 62 46.3 102 64 57 45.6 65 46.4 102 65 45.9 101 62 46.5 102 64 61 47.0 65 47.9 102 64 47.8 102 62 47.9 102 64 65 47.8 64 49.1 103 64 49.1 103 62 49.0 103 64 69b 49.0 49 50.3 103 48 50.2 102 47 49.7 101 49 73 48.8 49 50.0 I03 48 50.1 103 47 49.6 102 49 77 50.9 48 51.6 101 48 51.1 100 47 50.9 100 49 81 50.8 46 51.6 102 47 51.3 101 47 51.6 102 47 85 49.7 46 50.9 102 46 50.4 101 47 50.1 101 47 89 50.8 46 51.7 102 45 51.1 101 46 51.3 101 46 93 50.3 45 51.1 102 44 50.6 101 45 50.5 100 46 97 50.2 45 50.6 101 42 49.7 99 44 50.8 101 -46
101 49.1 42 50.4 103 38 49.0 100 44 48.9 100 46 105 46.7 41 47.0 101 38 47.1 101 42 46.0 99 45
Mean for weeks 1-13 24.4 24.8 1 02 24.7 101 24.4 100 14-52 39.3 40.1 102 40.1 102 39.8 101 53-105 48.7 49.6 102 49.2 101 49.2 101
a The number o f animals weighed for this week is fewer than the number o f animals surviving. Interim evaluations occurred duringw e e b 14, 40, and 66.

l
60 Tricresyl Phosphate, NTP TR 433
50- .................. .................. .................. ......... ...... .................. ................
v1' 45 - ..... ..................................................z a a c)z 40- .............................................................................................................
cI ; @ f0 35- .................. iQ............. + ................. i .................. i .................. i ................. i................. i................s
......... ................. f.................. j .........................................................................
WI 25 ............ :................. L................. :.................. :.................. :
I n O P P Y
20- ................. .i................. .;. ................. I.. ............... .i................. .;. ................
. .
1s 0
I 15 30
I 4s
I 60 I
75 I
90 I
105 I
1
WEEKS O N STUDY
................. i.................. ................. i r ......... p - $ . M . & @ . i . ; .................. 8 @ o...:............... ' 0 I a m ;
................. ................. ;................. Lp [email protected]................. .i -................................. 8.............. ; B o ;or
................. i .................. :.Q............. i.................................... .i..................................... .i ............... ; a ;f i
- . ...................... fi ........ ;......................................................................... ;..................................
'1 : .> ..................................... ;.................. i.................................... :.................. :...............
...................
0 6OPPY ........... ;.................. :.................. (..................
I
I I I I I I I 1 s 30 4s 60 75 90 105
WEEKS ON STUDY
FIGURE6 Growth Curves for Male and Female Mice Administered Tricresyl Phosphate in Feed for 2 Years

Results 61
Hematology, Clinical Chemistry, and Neurobehavioral Results There were no biologically significant differences in hematologyparametersmeasuredat the 3-, 9- or 15-monthinterimevaluations(Tables GS, G9,and G10). There were significant dose-related decreases in the serum cholinesterase activity in all groups o f exposedmice at the 3-, 9-, and15-monthinterim evaluations.Hindlimbgripstrengthin 250 ppm female mice was significantly lower than that in the controls the 3-month evaluation at interim(Table H10). At the 9- and 15-month interim evaluations, the hindlimb and forelimb grip strengths o f exposed male and female mice were similar t o those of the controls (Tables H11 and H12).
Pathology and Statistical Analyses of Results This section describes the statistically significant or biologically noteworthy changes in t h e incidences o f neoplasms and nonneoplastic lesions o f the adrenal gland, liver, and harderian gland. Summaries o f t h e incidences of neoplasms and nonneoplastic lesions, individual animal tumor diagnoses, statisticalanalyses o f primary neoplasms that occurredwith an incidence
o f atleast 5% inatleastoneanimalgroup,and historicalincidencesfor liver and harderiangland neoplasms are presentedinAppendix C for male mice and Appendix D for female mice.
Adrennl glnnd: An increase in the severity o f ceroid pigmentation in the adrenal cortex o f most exposed groups o f male and female micewas first noted at the 9-month interim evaluation (Tables22, C5, and D5). A t the 15-month interim evaluation,the absolute and relative adrenal gland weights o f 250 ppm males were significantly lowerthan those of the controls (Table F12), and the absolute and relative adrenal gland weights of 250 ppm females were significantly greater than thoseo f the controls. There was adoserelated increase in t h e severityo f ceroid pigmentation o f the adrenalcortex in females at the 15-month interim evaluation (Tables 22, C5, and D5). A t the end o f the 2-year study, ceroid pigmentation o f the adrenal cortex was present in most exposed and control mice; however, adose-relatedincreaseinthe severity o f yellow-brown ceroid pigmentation was present in the innermost area o f the zona reticularis o f the adrenalcortex in exposed maleandfemale
TABLE 22 Incidences of Nonneoplastic Lesions of the Adrenal Cortex of Mice in the 2-Year Feed Study of Tricresyl Phosphate
Doses (ppm) 0 60 125 250
Male
Ceroid Pigmenlation 3-Month interim evaluation O B a 3/10 (1.O)b 3/10 (1.O) 6/10*(1.0) 9-Month interim evaluation (1.1)10/10(1.0)10/10(1.0)10/10 10/10(1.6) 15-Month interim evaluation (1.0)10/10(1.1)10/10(1.2)10/10 10/10 (1.3) 2-Year study 48/52 (1.0) 47/49 (1 .O) 49/49 49/50 (1.2) (1.1)
Female
Ceroid Pigmentation 3-Month interim evaluation 0/10 0/10 0/10 1/10 (1.0) 9-Month interim evaluation 9/10 (1.0) (1.8)10/10(1.0)10/10 10/10 (3.1) 15-Month interim evaluation 10/10 (1.0) (1.0)10/10 loll0 (2.0) 919 (3.8) 2-Year study (2.5) (1.6)49/5/50(1.2) 51/51(3.9) 47/48 49/49
* Significantly different (PsO.05) from the control group by the Fisher exact test a Number o f animals with lesion per number of number o f animalswi th adrenal cortex examined microscopically
Averageseveritygradeoflesions in affectedanimals: 1 = minimal, 2 = mild, 3 = moderate, 4 = marked.

62 Tricresyl Phosphate, NTP TR 433
mice(Plates 8 and 9). Thelesionconsisted of contained one or more medium to large clear spaces macrophages and/or epithelial cellsin various stages in the cytoplasm. Thefatty change consisted of small of distension from the accumulationof yellow-brown vacuoles in individual hepatocytes, randomly distribcytoplasmic pigment (Plates10and 11). The severity utedthroughouttheliver.Theseverityincreased of pigmentation was minimal to mild in exposed with exposure level but wasneverconsideredtobe groupsofmalemice and moderatetomarked in more than moderate i n any group. exposedgroupsoffemalemice,especiallythose receiving 125 and 250 ppm.
Ceroidpigmentationconsistedofcellscontaining Liver: At the end of the 2-year study, the incidences fine,yellow-browngranules in theircytoplasm.In of clear cell focus, fatty change, and ceroid pigmen- mice exposed to 250 ppm,the cells were enlarged and tationweresignificantlyincreasedinmalemice groupedintoclusters.Periodicacid-Schiffand oil receiving 125 and 250 ppm (Tables 23 and C 5 ) . red 0 stainingweredonein an attempt to further
characterize the pigment; the results confirmed the Clear cell foci were usually smaller than thesizeof presence of lipid in the affected cells consistentwith one lobule and showed partial compression of adja- identification of the pigmentasceroidoracidfast centlivercells.Cells within fociwereenlarged a n d lipofuscin.
TABLE23 Incidences of Nonneoplastic Lesions of the Liver of Mice in the 2-Year Feed Study of Tricresyl Phosphate
Male
9-Month Interim Evaluation
Live? 10 10 10 10 Clear c e l l FOCW~ 0 0 1 0 Ceroid Pigmentation 0 0 0 1 (1.O)C
15-Month Interim Evaluation
Liver 10 10 10 10 Clear C e l l Focus 0 1 0 0 Fatty Change 1 (2.0) 3 (1.7) 5 (1.8) 5 (1.8) Ceroid Pigmentation 0 0 4*(1.0) 2 (1.0)
2-Year Study
Liver 52 49 49 50 Clear C e l l Focus 5 8 17** 12' Fatty Change 6 (1.3) 10 (1.1) 23*'(1.3) 22**(2.0) Ceroid Pigmentation 0 0 30**(1.0) 28**(1.1)
(continued)

Results 63
TABLE23 Incidences of Nonneoplastic Lesions of the Liver of Mice in the 2-Year Feed Study of Tricresyl Phosphate (continued)
Doses(pprn) 0 60 125 250
Fernale
9-Month Interim Evaluation
Liver 1 0 1 0 10 10 Basophilic Focus 0 1 0 0
15-Month Interim Evaluation
Liver 10 1 0 10 Basophilic Focus 0 1 0 Clear Cell Focus 0 0 0 Eosinophilic Focus 0 0 0
2-Year Study
Liver 50 50 48 51 Basophilic Focus 4 1 1 0 Clear Cell Focus 0 0 0 3 Eosinophilic Focus 8 4 5 6 Mixed Cell Focus 1 0 2 2
l Significantly different (P~0.05)from the control group by the Fisher exact test (interim evaluations) or by the logistic regression tes t (2-year study)
** PSO.01 a Number of animals wi th liverexaminedmicroscopically
Number o f animals wi th lesion Average severity grade of lesions i n affected animals: 1 = min ima l . 2 = mild, 3 = moderate, 4 = marked.
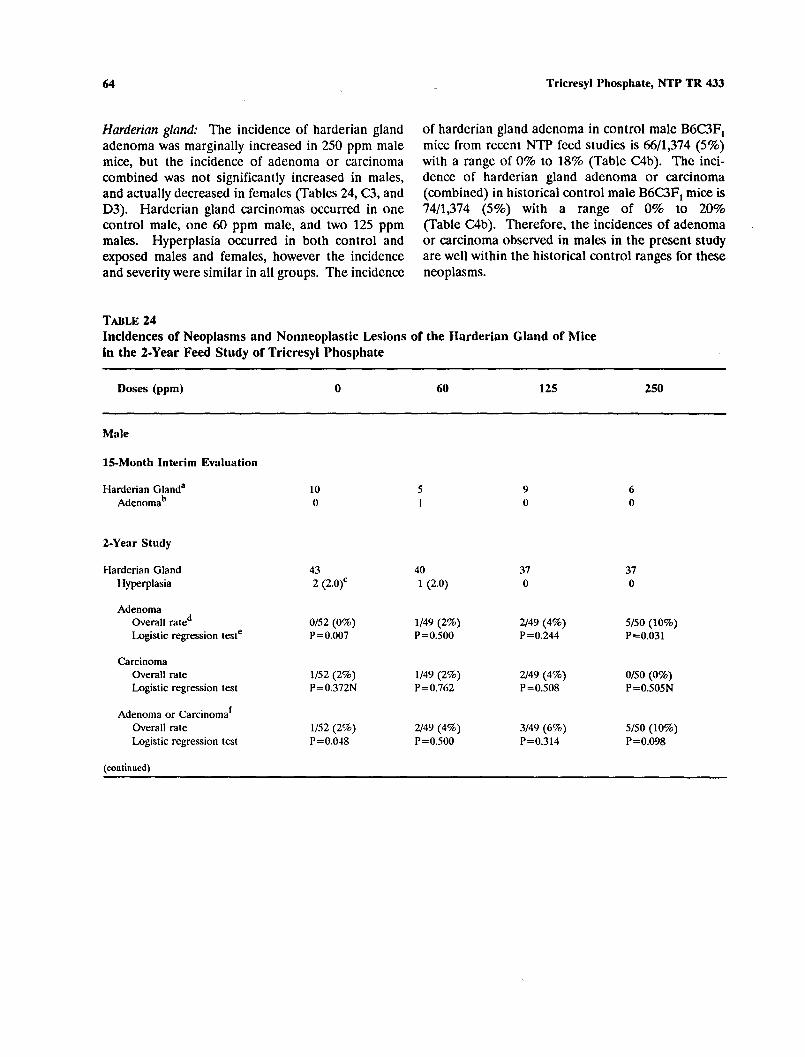
64
Hurderinn glnnd: The incidence of harderian gland adenoma was marginally increased i n 250 ppm male mice, but the incidence of adenoma or carcinoma combined was not significantly increased in males, and actually decreased in females (Tables 24, C3,and D3). Harderian gland carcinomas occurred in one control male, one 60 ppm male, and two 125 ppm males. Hyperplasiaoccurred in both controland exposed males and females, however the incidence and severity were similar in all groups. The incidence
TABLE24
Tricresyl Phosphate, NTP TR 433
o f harderian gland adenoma in control male B6C3Fl mice from recent NTF’ feed studies is 66/1,374 (5%) with a range o f 0% t o 18% (Table C4b). The incidence of harderian gland adenoma or carcinoma (combined) in historical control maleB6C3Fl mice is 74/1,374 (5%) with a range o f 0% to 20% (Table C4b). Therefore, the incidences o f adenoma or carcinoma observed in males in the present study are well within the historical control ranges for these neoplasms.
Incidences of Neoplasms and Nonneoplastic Lesions of the IIarderian Gland of Mice in the 2-Year Feed Study of Tricresyl Phosphate
Doses (ppm)
Male
15-Month Interim Evaluation
Harderian Glanda Adenomab
2-Year Study
Harderian Gland Hyperplasia
Adenoma Overall rated ~ o g i s t i c regression teste
Carcinoma Overall rate Logistic regression test
Adenoma or Carcinoma‘ Overall rate Logistic regression test
(continued)
0 125
~
250
10 5 9 6 0 1 0 0
43 40 37 37 2 (2.O)C 1 (2.0) 0 0
0/52 (0%) 1/49 (2%) 2/49 (4%) 5/50 (10%) P=O.O07 P=O.500 P=O.244 P=O.O31
1/52 (2%) 1/49 (2%) 2/49 (4%) 01.50 (0%) P=0.372N P =0.762 P=O.508 P=0.505N
1/52 (2%) 2/49 (4%) 3/49 (6%) 5/50 (10%) P=O.O48 P=O.500 P=O.314 P=O.O98

. " , .. ' .. .... " .. , ;' ... . .. ,. .. . .' • • • • •• .. .. . , .-'.
PLATE 1 PLATE 2 Adrenal cortex from a control female F344/N rat in the 2-year feed study Cytoplasmic vacuolation of cortical cells in the zona glomerulosa (G) and of tricresyl phosphate. Note the zona glomerulosa (G) and zona zona fasciculata (F) in a female F344/N rat exposed to 300 ppm tricresyl fasciculata (F). H&E, SOx phosphate in the 2-year feed study. H&E, SOx
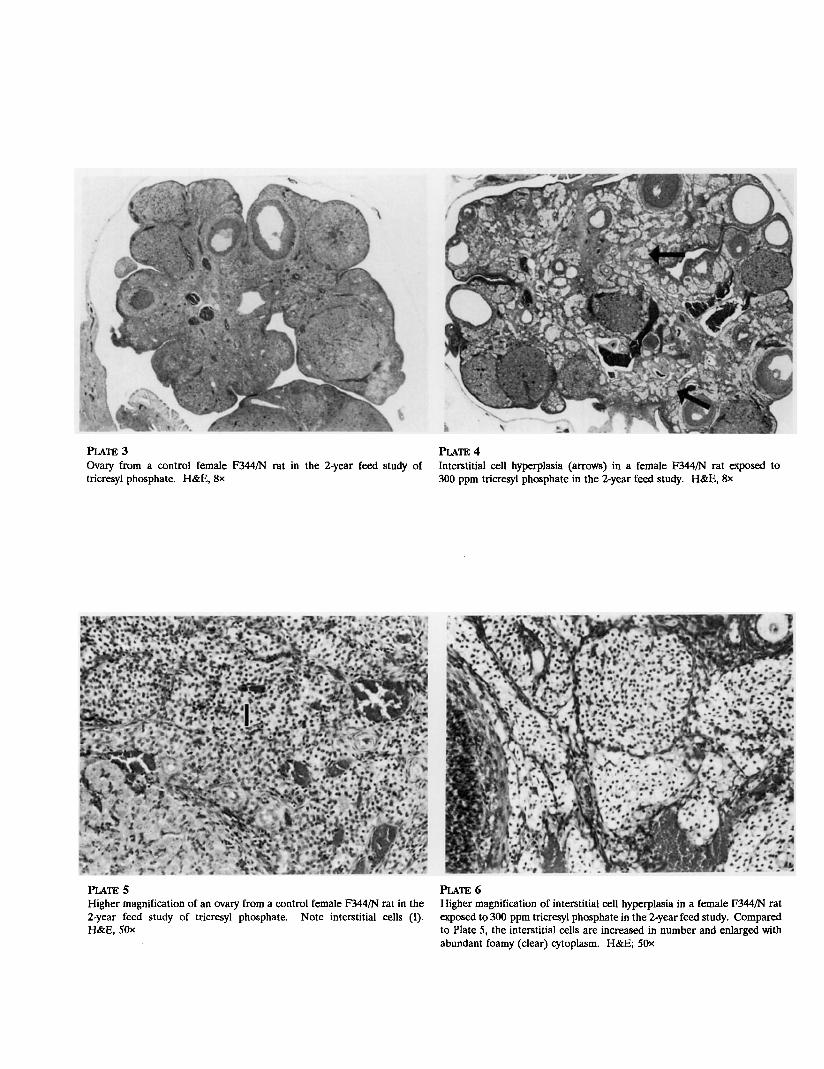
PLATE 3 PLATE 4 @sly from a controlfemale W/Nrat in the2-yearfeedstudy of Interstitial cell hyperplasia(arrows)in a female M44/N rat exposed to tricresylphosphate. HLE, 8 x 300 ppm tricresyl phosphate in the 2-year feed study. H&E, 8 x
PLATE 5 PLATE 6 Higher magnification of an ovary from a control femaleF344/N rat in the Higher magnification of interstitial cell hyperplasia in a female F344/N rat 2-year feed study oftricresylphosphate.Noteinterstitialcells (I). exposed to 300 ppmtricresylphosphate in the2-yearfeedstudy.Compared
Plate to 5, the cells are increased withinandHLE, SOX interstitial numberenlarged abundantfoamy(clear)cytoplasm. H&E; 5 O x

PLATE 7 Multifocal axonal degeneration with dilatation of myelin sheaths of the sciatic nerve ina female B6C3Fl mouse exposed t o 4,200 ppm tricresyl phosphate in the13-weekfeedstudy.Note occasional shrunken sons (arrows) and swollen axons (arrow heads). H&E, 8Ox

PLATE 8 PLATE 9 Adrenalglandshowingthecortex (C) andmedulla (M)from a control Ceroidpigmentationinthecytoplasm of cortical cells within the zona female B6C3Fl mouseinthe2-yearfeedstudyoftricresylphosphate.reticularis(arrows) in a female B6C3FI mouseexposed to 250ppmtricresyl H&E, SOX phosphate in the 2-year feed study. H&E, 5Ox
PLATE 10 PLATE 11 Higher magnification of cortical cells within the zona reticularis (R) from Higher magnification of cortical cells in the zona reticularis containing fine a control female B6C3Fl mouse in the2-yearfeedstudyoftricresylgranularceroidpigment(arrows) in a female B6C3FI mouseexposed to phosphate. Note theadjacentmedulla (M). H&E, 66x 250ppmtricresylphosphate in the2-yearfeedstudy.Note cells withinthe
adjacent medulla (M) lack ceroid pigment. H&E; 66x

Results 65
TABLE24 Incidences of Neoplasms and Nonneoplastic Lesions of the IIarderian Gland of Mice in the 2-Year Feed Study of Tricresyl Phosphate (continued)
Female
15-Month Interim Evaluation
Harderian Gland Hyperplasia
7 1 (1.0)
4 0
5 0
8 0
%Year Study
Harderian Gland Hyperplasia
47 2 (2.5)
38 l ( l .0 )
29 1 (1.0)
36 0
Adenoma Overall rate Logistic regression test
5/50 (10%) P=0.007N
3/50 (6%) P=0.365N
0/48 (0%) P=0.031N
0/51 (0%) P=0.026N
Carcinoma Overall rate Logistic regression test
0/50 (0%) P=O.693
0/50 (0%)2
1/48 (2%) P=O.495
0/51 (0%)-
Adenoma or Carcinomah Overall rate Logistic regression test
5/50 (10%) P=0.012N
3/50 (6%) P=0.365N
1/48 (2%) P=0.098N
0/51 (0%) P=0.026N
a Numberofanimals w i t h harderian gland examinedmicroscopically Number of animals w i t h lesion Average severity grade o f lesions in affectedanimals: 1 = minimal, 2 = mild, 3 = moderate, 4 = marked. Number of animals wi th neoplasm per number o f animals necropsied
e In the control column are the P values associated wi th the trend test. In the exposed group columns are the P values corresponding t o pairwise comparisons between the controls and that exposure group. The logistic regression test regards these lesions as nonfatal. A negative trend or a lower incidence i n an exposure group is indicated by N. Historicalincidence for 2-year feed studies w i t h untreatedcontrolgroups(mean standard deviation): 74/1,374 (5.4% f 4.5%); range 0%-20%
g Notapplicable:noneoplasms i n a n i m a l group Historicalincidence: 5W1.371(4.0% & 3.2%);range 0%-10%

66
GENETICTOXICOLOGY Tricresyl phosphate (100 to 10,OOO pdplate) was tested by two laboratories for the induction o f gene mutations in Salntonella typhinturiunt strains TA98, TA100, TA1.535, and TA1537 with and without S9 (Table El; Haworth et al., 1983). No induction of gene mutations was observed by either laboratory in any o f the four testerstrains.Precipitation o f tricresyl phosphate was noted at concentrations o f 3,333 pglplate and above in the study conducted at SRI, International.
Tricresyl Phosphate, NTP 433TR
In cytogenicity tests with cultured Chinese hamster ovary cells, tricresyl phosphate did not induce sister chromatid exchanges (Table E2) or chromosomal aberrations(TableE3), with or withoutAroclor 1254-induced male Sprague-Dawley rat liver S9. The highest concentration tested in all trials except the sister chromatid exchange trial was 5,OOO pg/mL. In the sister chromatid exchange trials inthe absence o f S9, the highest concentration o f tricresyl phosphate for which results could be obtained was 16 pg/mL. No tricresyl phosphate-induced cell cycle delay was observed in either o f these two assays.

67
DISCUSSION AND CONCLUSIONS
Tricresyl phosphate is a widely used vinyl plasticizer and fire retardant additive for functional fluids such ashydraulic and brakefluids. It wasnominated by theNationalCancerInstituteas a representative aromaticorganophosphateplasticizer. I t hasbeen known since the 1930'sthat tri-orrho-cresyl phosphate (TOCP), one of the isomeric componentsof tricresyl phosphate, peripheralneuropathyproduces in humans and experimental afteranimals acuteexposureto highsufficiently concentrations. However,thetoxicityofindustrialpreparations composed of isomeric mixturesoftricresylphosphates had notbeenexamined in detail.Moreover,
of the seminiferoustubules,reducedcaudaland epididymalweights,reducedspermmotility,and abnormalspermheadmorphologyoccurredin exposedgroupsofmalerats.Althoughnohistopathologic lesions were observedin the testes of male mice, reducedcaudal and epididymal weights, reduced sperm motility, and abnormal sperm head morphology occurred in groups that receivedthehighest concentrations of tricresylphosphate (NTP, 1983, 1985). Microscopic lesionsin nervous tissue occurred only in exposed groups of mice; degenerative lesions occurred in the lumbar spinal cord and sciatic nerve ofmalemiceexposedto2,100 and 4,200 ppm and
the consequences of long-term exposure to low doses,female mice exposed to 1,000 ppm o r more. as might occur in an occupationalsetting, had not beeninvestigated.Thepresentstudiesexaminethe toxicresponseof F344/N rats and B6C3Flmiceto short-termand long-term exposures involvinga broad range of concentrations.
Tricresyl phosphate is well absorbed through the skin and lungs and from the gastrointestinaltract a n d can reach systemic circulation throughany of these exposure routes. 'Administrationin the diet was selected for the long-term studies because this would provide daily exposure to low concentrations similar t o what might occur in a n occupational setting. Since i t was
As a means of monitoring the potential neurotoxicity of phosphate,severaltricresyl neurobehavioral parameterswereevaluated during the16-dayand 13-week studies.In most instances, treatment-related differences were observed onlya t concentrations that caused mortality, lower mean body weights,or other indications of toxicity. Therefore it was not possible t o distinguish between specific effects on the nervous system a n d other types oftoxicity.However, the reductions in hindl imb grip strength of malemice administered 363 or 726 m g k g in the 16-day gavage study or200 m g k g in the 13-week gavage study were
unclear whether enough tricresyl phosphate would benot confounded by body weight differences or other consumed by this route to enable the toxicity tobe wellcharacterized,the13-weekstudieswere conducted using administrationby gavage in corn oil vehicle and exposure by dosed feed.
During the 13-week gavagea n d feed studies, tricresyl phosphate produced a similar spectrum of lesions in rats and mice involving primarily the adrenal cortex and gonads. Cytoplasmic vacuolization of the adrenal cortexoccurred in a l l exposedgroups o f male a n d female rats and mice, w i t h the exception of 250 ppm mice;theseverityincreased with exposurelevel. Since the lesion was not observedi n control animals, it was considered to be related to chemical exposure. Ovarian interstitial cell hypertrophy/hyperplasiaand inflammationoftheinterstitiumoccurred in a l l exposed groups of female rats and fcmale mice in the 13-week feed studies. Aspermatogenesisand atrophy
indications of toxicity and appeared to be treatment-related effects. Based on these results, grip strength appearedtobetheparametermostusefulfor monitoring potential neurotoxicity and was the only neurobehavioralparameterevaluatedinthefeed studies. During the13-weekfeedstudiessignificant reductions in hindl imb grip strength occurred onlyat the highest concentrations where interpretation was confounded by lower mean body weights.
The selection of exposure levels for the 2-year feed studies was complicated by the fact that a no-effect levelwasnotachieved i n the13-weekstudies. Cytoplasmic vacuolization of the adrenal cortex was present i n a l l exposed groups of rats and mice, with the exception of male mice exposed to 250 ppm. In eachsex and species,lesionseverityincreased with exposure level,and the most severe lesions occurred

68
in exposed females. This lesion was not observed in controlanimals.Althoughit wasdifficult t o judge the character or the potential for progression, those regions o f the adrenal cortex involved are major sites o f steroid hormone production and are essential for life. Partial or complete loss o f their functionover the duration o f a 2-year s tudy would be potentially life threatening. Therefore, the 2-year rat study was designedwith five exposure concentrations: 0, 75, 150.300, o r 600 ppm.
After 3 monthsofexposure,up t o 10 maleand 10 femaleratspergroupwereevaluatedfor the presence o f adrenal cortex lesions. None were found inanimalsexposed to 75 ppmandthelesion occurred in only one 150 ppm female. However,it occurred at a high incidence in females exposed t o 300 or 600 ppmandin 600 ppm males. To determinewhether the lesionwouldpersistand/orprogress in the absenceo f continued chemical exposure, groups that received diets containing 600 ppm for the first 3 months o f the study were fed control diets for the remainder o f the study,whilegroupsthathad received 75, 150, or 300 ppmcontinued t o receive these same diets. Interim evaluations were conducted during months 9 and 15 o f the 2-year studies.
Selection o f exposure levels for mice was based primarily on the occurrence o f lesions o f t h e adrenal cortexandnervoussystem.Axonaldegeneration occurredinfemalemiceexposed to 1,000 ppm o r more and in males exposed t o 2,100 ppm o r more. Althoughaxonaldegeneration was not observedat lowerexposure levels, subtle axonallesionsare difficult t o detect histopathologically. In the presence o f continued exposure t o tricresyl phosphate, lesions that were below the limit o f detection at 13 weeks could becomedebilitatingduringa 2-year study. Therefore, 500 ppmwasconsidered too close t o 1,000 ppm for the high exposure concentration in a 2-year feed study. Cytoplasmic vacuolization o f the adrenalcortexoccurred in male andfemale mice exposed to 500 ppm o r moreand in 250 ppm females. As a result, 250 ppm was selected as the highexposure level for the mouse study; other exposure levels selected were 60 and 125 ppm.
Analysis o f the lo t o f tricresyl phosphate used in the presentstudiesindicatedthat it was composed o f 79% tricresyl phosphate estersand lS% dicresyl phosphate esters (Table 12). The tricresyl phosphate esterscontained21% tri-m-cresyl phosphate and
Tricresyl Phosphate, NTP TR 433
4% trip-cresyl phosphate; the remaining 75% was mixed triesters. Analysis of the bulk chemical failed to detectthepresence o f tri-o-cresyl phosphate (TOCP), indicating thatif present, it couldbe present atmostataconcentration o f lessthan 0.1% (Table 12). However, the toxic responses observed in the 13-week feed and gavage studies, especially the axonal degeneration that occurred in the spinal cord and sciatic nerve o f mice and the testicular lesions that occurred in male rats, were essentially the same asthoseobserved for isomericallypureTOCP. Neither tri-m-cresyl nor tri-p-cresyl phosphate produce these types o f lesions.
Based on the resultso f a 63-day study in which pure TOCP was administered in corn oilby gavage to male F344/N rats, Somkuti el nl. (1987a,b) estimated that t h e minimum effective dose for observable testicular toxicity was between 10and 25 mg/kg per day. In the 13-week gavage study reported here, atrophy o f the seminiferous tubules occurred in the male rats that received 400 m&/kg per day, but no testicular lesions were observed at lowerdoses. Therefore, less than a 20-fold difference in dose between pure TOCP and theisomerically mixed tricresyl phosphatesample used for the present studies produceda similar result.
In the 13-week gavage studyin mice, multifocal axonal degeneration was present in the spinalcord of maleandfemalemice that received 100 mg/kg per day o r greater. If 0.1% o f the administered mixed isomerpreparationwas TOCP, 100 mg/kg per day would correspond t o 0.1 mg/kg per day o f TOCP, a no-effect dose eveninassensitivespeciesasthe chicken.Therefore,theaxonaldegenerationand other signs o f neurotoxicity observed in the present study cannot be attributed to the potential presence o f undetectable quantities of TOCP. Veronesi et al. (1991) produced axonaldegenerationin the spinal cord o f Swiss (CD-l@) mice evaluated 14 days after administering single gavage doses o f TOCP ranging from 5 S O t o 2,320 m@g. Although the two studies cannot be directlycompared, t he doses are similar enough (even when the comparison is based o n the totalcumulative dose administeredduring the 13-week study) t o illustrate that the effects produced with mixed isomerpreparationcannotbethe explained by the presence o f contaminating TOCP. However, toxicity o f the mixed isomerthe preparation may be due t o the presence of o-cresol groups in the mixed triester fraction.

69 Discussion and Conclusions
During the 2-year feed studies, survival rates, mean bodyweights,andfeedconsumption o f exposed groups o f ratsandmiceweresimilar to those o f controls.Therewerenoclinicalfindingsobserved during the 2-year studies that were considered t o be associated with exposure to tricresyl phosphate.
The hindlimb grip strengths o f male rats exposed to 300 o r 600ppm, 600ppm female rats, and 250 ppm femalemicewere significantly lower thanthose o f controlsat 3 months.However, at t h e 9- and 15-month interim evaluations forelimb and hindlimb gripstrengths o f exposedgroupsofratsandmice were similar t o those o f the controls. Moreover, no histopathologic lesions of the spinal cord or sciatic nerve in rats or mice were associated with chemical exposure.Therefore, i t is difficult to judge the significance o f the transient decrease in hindlimb and forelimbgripstrengthsobservedat the 3-month interim evaluations.
Somkuti et al. (1988) administered TOCP (10 to 100 mgkg) t o maleF344rats daily by gavage for 63 days. Although the activities of brain neurotoxic esterase (NTE) and acetylcholinesterase were inhibited in a dose-dependent fashion in treated animals, noconsistentdifferencesoccurrcd in forelimb/ hindlimb grip strength, spontaneous motor activity, tremor, or response to a thermal stimulus. N o toxic lesionswereobservedhistopathologically in the spinalcord or peripheral 'nerves. T h e authors concludedthat the F344rat was insensitive t o the delayedneurotoxic effect o f TOCP.Inanother report, Veronesi (1984) found spinal cord lesions in Long-Evans rats following daily administration o f a similar dose (116 m a g ) for 6 weeks. Therefore, rats appear t o exhibit strain differences insensitivity t o TOCP neurotoxicity.
Although no neurobehavioral data ont h e response o f mice t o TOCP were found in the literature, spinal cord lesions and inhibitiono f NTE activity have also beenreported in Swiss (CD-l@) mice receiving a singleoral dose ofTOCPrangingfrom 580 to 3,480mgikg (Veronesi et al., 1991). The results observedinthepresentstudiesare,therefore, consistent with previous observations.
Consumptionof tricresyl phosphate in feed for 2 years did not increase the incidence o f neoplasms in rats. The increased incidence o f mononuclear cell leukemia in female rats exposed t o 150 or 300 ppm
was not consideredto be associatedwithchemical exposure for several reasons. The concurrent control incidence is lower thanthehistoricalcontrol incidence, while the incidences in the 150 and 300 ppm groupsarecomparable to historicalcontrol incidences. In addition, the incidences for all groups fall within the historical control range. The severity of mononuclear cell leukemia did notincreasein exposedfemaleratsandtherewasnoindicationof reducedlatencyassociatedwith theincreased incidences o f mononuclear cell leukemia. Moreover, the survival rate o f 300 ppm female rats was similar to that o f thecontrols.Therefore,theincreased incidence may be the result o f the variabilityof mononuclear ce l l leukemiaamongthetreatment groups rather than an effect of chemical exposure.
Chemicalexposurealso did notincrease the incidence o f neoplasms in mice. There was a significant positivetrend in the incidence o f harderiangland adenomas the incidencesignificantly and wasincreasedin250ppmmales,buttherewere no increased incidenceso f hyperplasia. Harderian gland carcinomasoccurred in onecontrolmale,one 60 ppm male, and two 125 ppm males; however, no carcinomas occurred in 250 ppm males and the inci- dence o f harderianglandadenomasorcarcinomas (combined) was not significantly. Inincreased exposedgroups o f females,there was a decreased incidcnce o f harderian gland adenomaso r carcinomas (combined).Therefore, the increasedincidence o f harderian gland adenomas inmales was not attributed t o chemical exposure.
Nonneoplastic lesions similar to those found in the 13-week studies occurredinratsduringthe 2-year feed study. A t the 3-month interim evaluation, cyto- plasmic vacuolization o f the adrenal cortex occurred in 600 ppm male rats and in300 and 600 ppm female rats. At the 9- and15-monthinterimevaluations, this lesion occurred only in female rats, primarily in the 300 ppm group. At the end of the 2-year study, this lesion was present in control and exposed groups o f females, but the incidence and severity weresignificantly increased only in 300 ppm females. Although there was a suggestiono f inflammation of the adrenal cortex in some animalsfromthe13-weekstudies, there was no evidence o f inflammation o r degenerative processes occurring duringthe 2-year feed study. Therefore, over the duration ofthe study, the adrenal cortex lesion was not related to cytotoxicity, although

70
the increased incidence was clearly related to tricresyl phosphate exposure.
Ovarianinterstitialcellhyperplasiaoccurred in 150and 300 ppm female rats at the 3- and 9-month
. interim evaluations, but atthe end o f t he 2-year study the lesion occurred only in the 300 ppm group. This lesion was not observed in control rats.
Nonneoplastic lesions also occurred in mice during the 2-year study. Ceroid pigmentation o f the adrenal cortex occurred in several animals inthe control and exposed groups a t the 3-, 9-, and 15-month interim evaluations; however, at the end o f the 2-year study the severity o f pigmentation in exposed groups was greater than in controls, especially in females.
There were significantly increased incidenceso f liver lesionsinmalemiceexposed t o 125 or 250 ppm. These lesionsincludedclearcell foci,fatty change, and ceroid pigmentation.
Overall, the mostconsistent biological response associated with exposure t o tricresyl phosphate was increasedcytoplasmicvacuolization o f cells o f t h e zona glomerulosa and zona fasciculata o f t h e adrenal cortex. These regionsare activelyinvolvedin the biotransformation o f cholesterolintosteroidhormones.Severalreactions involvedin the formation of these products arecatalyzed by cytochrome P-450- containing enzymes, and these tissues contain significant levels o f P-450 activity. Therefore, tricresyl phosphate may be activateddirectly in the adrenal cortex by an endogenous enzyme resulting in disruption o r partial inhibition o f one or more biosynthetic reactionsand,ultimately,accumulation of lipid-containing vacuoles. A disruption in lipid metabolism could alsoaccount for t h e lesionsobserved in the livers o f male mice; however, a similar response wouldhavebeenexpected in female mice, b u t was not observed.
Another consistent finding was involvement o f the gonads. 13-week thetestes/During studiesepididymides o f male rats were severelyaffected by exposure to tricresyl phosphate, resulting in atrophy and cessation o f spermatogenesis. Male mice did not exhibit degeneration o f the testes and epididymides; however, sperm motility was markedly reduced and abnormalspermwerepresent(NTP, 1983, 1985). Somkuti et 01. (1987a,b) have shown that after oral administration o f TOCP, the qcl ic saligenin
Tricresyl Phosphate, NTP TR 433
phosphate metabolite is present in the testis o f male F344 rats at a4-fold higher concentration than in the blood. Chapin et 01. (1990, 1991) have demonstrated in vino that Leydig cells, sites o f active steroidogenesis, can metabolize TOCP to the cyclic phosphate intermediate, which then produces toxicity in Sertoli cells. Therefore,there is goodevidence that the testicular toxicity of tricresyl phosphate is the result o f testicular metabolism by Leydig cells.
Ovarianinterstitialcellsalsopossesssignificant steroidogenic activity and, therefore, may also be able to metabolize tricresyl phosphateto active intermediates.However, the hyperplasia o r hypertrophy that occurred was not regenerative as would be expected fortherepair o f a cytotoxicinsult,norwasthere otherindication o f cytotoxicity in the ovarian interstitium.
In view o f the complex controlo f adrenal cortical and gonadal function by the anterior pituitary and hypothalamus, altered hormonal regulation may have also contributed t o development of the observed lesions. Smallridge et a/. (1991) studied the effect of diisopropylfluorophosphate (DFP) o n the levels of several pituitary gland hormones in an effort t o evaluate the contribution o f cholinergicpathways to hormone secretionin the anteriorpituitarygland. DF'P is a neurotoxic organophosphate ester that also produces testiculardamageinrodents.Within 1 hourafter administeringanintraperitoneal dose of DFP (0.6 m a g ) t o F344rats,serumlevelsofadrenocorticotropic (ACTH) increasedhormone were 2.5-fold, corticosterone wasincreased 4-fold, and luteinizing hormone (LH) was increased %fold over control values. Moreover,theconcentrations o f ACTH and corticosterone remained elevated for9 to 1 8 hours.
Administration o f higher doses o f DFP, in addition t o increasing ACTH and corticosterone, suppressed LH, thyroid stimulating hormone (TSH), and prolactin (PRL) concentrations. Adrenalectomy abolished theDFP-stimulatedincreaseincorticosteronebut had no effect on the suppression o f TSH, LH, or PRL, thus eliminating the possibility that the high corticosterone levels were responsible for suppression o f TSH, LH,andPRLsecretion.InDFP-treated animals,secretion o f corticosteronecaused by corticotropin releasing factor (CRF) was similar to thatobserved in controls. ThereforeDFPdidnot alter the ability o f t he pituitary gland to respond to

71 Discussion and Conclusions
hypothalamic releasing hormones. Administrationo f atropineprior t o DFPeliminated the increasein corticosterone, suggesting the involvemento f muscarinicreceptorsinthesecretion o f CRF.This observation was consistent with previous reports that cholinergicagonistsactivate ACTH secretion by stimulating C R F release mechanismthrougha involving primarily muscarinic receptors (Smallridge et d , 1991). The authors suggest that becauseo f t h e long duration o f pituitary-adrenal gland stimulation, repeatedlong-termexposure to low doses o f a cholinesteraseinhibitorcouldproduce biologically significant impairment o f pituitaryfunction.In the presentstudies,serumcholinesterase activity was significantly decreased at the 3-, 9-, and15-month interim evaluations in all exposed groupso f mice, in 300 ppm male rats, and 150 and300 ppm female rats. This raises the possibility that ACTH secretion may have been increased in these groups throughout t h e 2-year study.
Adrenocorticotropichormoneactson t h e adrenal cortex t o increase the activity o f cholesterolside chain cleavage enzyme, a mitochondrial enzymewhich catalyzes the first and primary regulatory step in the steroidbiosynthetic pathway. Therefore,increased secretion o f ACTH might lead t o increased lipid content in the adrenal cortex, and, infact, thishas been observed in rats receiving da i ly doses o f ACTH for14 days (Szabo et a/., 1992). If LH werealso increasedasobserved by Smallridge et a/. (1987), thentheincreasecould conceivably be partially responsible forthe ovarian interstitial cell hyperplasia observed in female rats.
Mice did not exhibit the same sensitivity t o tricresyl phosphate toxicity asrats in spite o f the greater extent o f serum cholinesterase inhibition. Moreover, ovarian lesions were not observed in female mice in the 2-year study althoughtheyoccurred in female mice at the higherexposure levelsusedin t h e 13-week study. Clearly, t h e response o f rats and mice is somewhat different. However, cytoplasmic vacuoli- zation occurred in the adrenal cortex in t h e 13-week studies and ceroid occurred in the adrenal cortex o f exposed animals during t h e 2-year studies. Ceroid is the generic name given t o a family o f lipopigments that accumulate in associationwith lipid degeneration or lipid excess (Harman, 1989; Jolly andDalefield, 19S9)and is considered an indicationo f the presence o f anongoingpathologic process. Therefore, its greateraccumulationandearlierappearance in
exposedmiceduring the 2-year study is consistent with anincreaseinsteroidogenesis,albeitnot as obvious as that observed in rats.
Two other organophosphate esters have been evaluated in NTP 2-year studies. Dimethylmethylphosphonate (methyl phosphonic acid dimethyl ester),was administered in cornoil by gavage at doses o f 500 or 1,000 mgkg t o F344N rats and1,000or 2,000 mgkg to B6C3Fl mice for 2 years (NTP, 1987). The inci- dences of renal transitional cell papillomas and renal tubule cell adenomas were increased in male rats, but therewerenotreatment-related orneoplasmsnonneoplastic lesions in female rats or mice.
Dichlorvos (2,2-dichlorovinyl dimethyl phosphate) was administered in corn oil by gavage at doses of 4 or 8 mgkg t o F344/N rats, 10 or 20 mgkg t o male B6C3Fl mice, and 20 or 40 mgkg t o female B6C3Fl mice (NTP, 1989).Dichlorvosadministration was associated with increased incidences o f mononuclear cell leukemia in male rats, fibroadenomas in female rats,andpancreaticadenomasinmaleandfemale rats. The most significant response was an increased incidence o f squamous cell papillomas o f the forestomachinmaleandfemale mice. Althoughmice did not develop any treatment-related nonneoplastic lesions in the 2-year study, increasedincidences of cytoplasmicvacuolization o f the adrenalcortex occurred in male and female rats.
Based on t h e doses usedin the 2-year studies, the toxicity o f dichlorvos appears to be more like that of tricresyl phosphate than does t h e toxicity o f dimethyl methylphosphonate. However, dose selection for the 2-year studies o f dichlorvos was based on mortality andlowermeanbody weights; therewereno compound-relatedmicroscopiclesionsobservedin the 13-week studies. Therefore, there appears t o be very l i t t l e similarity in the toxic response observed for the three compounds.
The biological and toxicological significance o f responsessuchas those observedinthepresent studies is particularly difficult to judge in the context o f selecting doses or evaluatingthe adequacy of exposure. A chemical-related lesion that has the potential t o markedlyalterthefunctionorintegrity of the adrenal cortex must be considered a toxic effect. In cellsactivelyinvolved insteroidbiosynthesis the accumulation o f lipid-containing cytoplasmicvacuoles couldsignalinhibition ordisruption o f normal

72 Tricresyl Phosphate, NTP TR 433
biosynthetic processes that could eventually result in cell death.
A t the concentrations used in the 2-year studies, the adrenal gland lesionsdid n o t become noticeably cyto- toxic and were not present in male rats at the endo f the study. However,it is difficult to judgewhat mighthavehappenedathigherconcentrations. In 300 ppm female rats and 250 ppm female mice, the severityofadrenalglandlesionswas significantly increased, and it is doubtful that these groups could have toleratedadoubling of the concentration. At the 3-month interim evaluations in the2-year studies, cytoplasmic vacuolization was present in the adrenal cortex o f 600 ppm male rats, but was not present in males exposed to lower concentrations; therefore, it is possible thatmalerats may have beenable t o tolerateconcentrationsup t o 600 ppm.Even if higher concentrations had been administeredt o male rats, it is stillunlikely a thatcarcinogenicor preneoplasticresponsewouldhaveoccurred. The highest concentration that did not cause mortalityo r lowermean body weightsinmaleratsduring the 13-week study was 1,700 ppm, a 5-fold increase over the high concentration i n the 2-year study. A t this concentration, the adrenal cortex and testes were the major sites o f toxicity with essentially n o response in any systemthatcould be consideredorgan preneoplastic.
Inmale mice, cytoplasmicvacuolization o f the adrenal cortex did not occur in the 250 ppm group, but was present in the 500 ppm group at t h e end o f the13-weekfeed study. However,degenerative lesions occurred inthe sciatic nerveo f mice receiving 1,000ppm; therefore, it is questionable whether male
mice could havetoleratedconcentrationsupto 500 ppm for2 years without complications associated with lesions in the nervous system, Exposure levels greaterthan 500 ppmwouldclearlyhavebeen unacceptable for mice.
Therefore, dose selection in these studies was limited by the presenceoftoxiclesionsinorganshissues involved in functions critical for life. The potential hazard associated with the presence o f these lesions dictated that concentrations be selected to minimize their severity. Moreover, thedose response was such that the lesions would have become debilitating o r fatal at concentrationshighenough to elicitmore conventional toxic responses suchaslowermean body weights.
CONCLUSIONS Under the conditionsofthese 2-year feed studies, there was no evidence of carcinogenic activity* of tricresyl phosphate in male orfemaleF344/Nrats that received 75, 150, or 300 ppm.Therewas no evidence ofcarcinogenic acriviry of tricresyl phosphate in male or female B6C3F, mice that received6 0 , 125 o r 250 ppm.
Nonneoplasticlesionsassociatedwithexposure to tricresyl phosphateincluded cytoplasmicvacuolization o f the adrenalcortexandovarianinterstitialcell hyperplasia in female rats, increasedincidences of clear cell focus, fatty change, and ceroid pigmentation o f the liver in male mice, and increased severity of ceroid pigmentation o f the adrenal cortex in female mice.
l Explanation o f Levels o f Evidence o f Carcinogenic Activity is o n page 10. A summary o f the Technical Reports Review Subcommittee comments and the public discussion on this report appears on page 12.

73
REFERENCES
Abou-Donia, M.B., and Nomeir, A.A.(1986). The role of pharmacokinetics and metabolism in species sensitivity to neurotoxicagents. Fwzdanz. Appl. Toxicol. 6, 190-207.
Abou-Donia, M.B., Varga, P.A., Graham, D.G., a n d Kinnes,C.G.(1980).Delayedneurotoxicityof a singledermal administration o f o-ethyl o-4-nitro- phenyl phenylphosphonothioate and tri-o-cresyl phosphate to cats. Toxicol. Lett. 1, 141.
Abou-Donia, M.B., Suwita, E., and Nomeir,A.A. (1990). Absorption, distribution, and elimination of a single oral dose of ['4C]tri-o-cresyl phosphate i n hens. Toxicology 61, 13-25.
Armitage, P. (1971). Statistical Merhods in Medical Research, pp,362-365. John Wiley a n d Sons, New York.
Ashby,J., a n d Tennant, R.W. (1991).Dcfinitive relationshipsamongchemical structure, carcinogenicity,and mutagenicity for 301 chemicals testedby the U.S. NTP. Mutat. Res. 257, 229-306.
Boorman, G.A., Montgomery, C.A., Jr., Eustis, S.L., Wolfe,M.J.,McConnell,E.E., and Hardisty,J.F. (1985).Qualityassurance in pathologyforrodent carcinogenicity studies. In Handbook of Carcinogen Tesring (H.A.Milman and E.K. Weisburger,Eds.), pp.345-357.NoyesPublications,ParkRidge,NJ.
Bouldin, T.W., and Cavanagh, J.B. (1979a). A teased-fiberstudy o f the spatio-temporal spread of axonal degeneration. Am. J. Pathol. 94, 241-252.
Bouldin, T.W., and Cavanagh, J.B. (1979b). A fine- structural study o f theearlystages of axonal degeneration. Am. J. Pathol. 94, 253-270.
Carlton, B.D., Basaran, A.H., Mezza,L.E., a n d Smith, M.K. (1987). Examination of the rcproductive effects o f tricresyl phosphate administercd t o Long-Evansrats. Toxicology 46, 321-328.
Casida,J.E., Eto, M., and Baron, R.L. (1961). Biological of aactivity tri-o-cresyl phosphate metabolite. Nanwe (Lond.) 191, 1396-1397.
Cavanagh, J.B., and Patangia, G.N. (1965).Changes in the central nervous system in the cat as the result o f tri-o-cresyl phosphate poisoning. Brain 38, 165-1SO.
Chapin R.E., George, J.D., a n d Lamb, J.C.,IV (19SS). Reproductive toxicity oftricresyl phosphate i n a continuous breeding protocol in Swiss (CD-1) mice. Fmdanl. Appl. Toxicol. 10, 344-354.
Chapin, R.E., Phelps,J.L., S.G.,Somkuti, Hcindel, J.J.,a n d Burka, L.T. (1990). The interaction of Sertoli and Leydig cellsin the testicular toxicity of tri-o-cresyl phosphate. Toxicol.Appl. Phamtacol. 104, 433-49s.
Chapin, R.E., Phelps, J.L., Burka, L.T., Ahou-Donia, M.B., a n d Heindel, J.J. (1991). The efccts o f tri-o-crcsylphosphate and metabolites on r a t Sertolicellfunction i n primary culture. Toxicol. Af'pl. Phnrn1acol. 108, 194-204.
Chemical and EconomicsHandbook(1988). SRI International, Menlo Park, CA.
Code o f Federal Regulations (CFR) 21, Part 58.
Cox, D.R. (1972). Regression models and life-tables. J. R. Slut. SOC.1j34, 187-220.
Crawford, B.D. (1985). Perspectives on the somatic mutationmodel of carcinogenesis. In Advances in Modern Environmental Toxicology (M.A.Mehlman, W.G.Flamm, and R.J. Lorentzen, Eds.), pp. 13-59. PrincetonScientificPublishingCo.,Inc.,Princeton, NJ.
Davies,D.R.(1963).Neurotoxicity o f organophosphorous In Handbuchcompounds. der Expa-immtollen Pharmakologie (G. Koelle, Ed.).

I4
Dinse, G.E., and Haseman, J.K. (19S6).Logistic regressionanalysis o f incidental-tumor data fromand animal carcinogenicity experiments. Frrndnnl. AppI. TOX~CO~.6, 44-52.
Dinse, G.E., and Lagakos, S.W. (1983).Regression analysis o f tumour prevalence data. Appl. Sfnrisr. 32, 236-24s.
Dunn, O.J. (1964). Multiple comparisons using rank sums. Technonmics 6, 241-252.
Dunnett, C.W. (1955). A multiple comparison procedure for comparing several treatments w i t h a control. J. Am. Srnf . Assoc. 50, 1095-1 121.
Eto, M., Casida, J.E., and Eto, T. (1962).Hydroxylation andcyclization reactions involvcd in thc metabolism of tri-o-cresyl phosphate. Biochnt . Phnrnmol. 11, 337-352.
Galloway,S.M., Armstrong, M.J., Reuben, C., Colman, S., Brown, B., Cannon, C., Bloom,A.D., Nakamura, F., Ahmed, M., Duk, S., Rimpo, J., Margolin, B.H., Resnick, M.A., Anderson, B., and Zeiger, E. (19S7). Chromosome aberrations and sister chromatid exchanges i n Chinese hamster ovary cells: Evaluations of 10s chemicals. Environ. Mol. Mutngen. 10 (Suppl. lo), 1-175.
Gart, J.J., Chu, KC., and Tarone, R.E. (1979). Statistical issues in interpretation of chronic bioassay tests for carcinogenicity. J. Nnrl. Cnncer Inst. 62, 957-974.
Harman, D. (19S9). Lipofuscin and ceroid formation: The cellular recycling system. A h . Exp. Med. Biol. 266, 3-16.
Haseman, J.K. (19S4). Statistical issues i n the design, analysis and interpretation of animal carcinogenicity studies. Environ. Henlrh Perspcr. 58, 385-392.
Haseman, J.K., Huff, J., and Boorman, G.A. (198.1). Use of historical control data i n carcinogenicity studies in rodents. Toxicol. Pothol. 12, 126-135.
Haseman, J.K., Huff,J.E., Rao, G.N., Arnold, J.E., Boorman, G.A., and E.E. (19S5).McConncll, Neoplasms observedin untrcated and corn oil gavage control groups of F344/N rats a n d (C57BLI6N x C3H/HeN)F, (BbC3FJ mice. JNCI 75, 975-9S4.
Tricresyl Phosphate, NTP TR 433
Haworth, S., Lawlor, T., Mortelmans, K., Speck, W., Zciger, E. (19S3). Snlntonelln mutagenicity test
results for250chemicals.Environ. Mutagen. 5 (Supl>I. I), 3-142.
Hcnschlcr, D. (1958). Relationships between the chcmical structure and the paralyzing action o f triaryl phosphates. (Besiehungen zwischen chemischer struktur u n d lahmungawirkungvon triarylphosphaten.) Nnrrn)ln-ScPInziedebepg'sArch.Exp. Path. U.Phtlrnlnk., Vol. 237, pp. 459-472.
Hollandcr, M., a n d Wolfe, D.A.(1973).NonparanlerricSftlristicolMethods, pp. 120-123. John Wilcy and Sons, New York.
International Programme on Chemical Safety(IPCS) (1990). Environmcntal Health Criteria 110: Tricrcsyl Phosphate. World Health Organization, Geneva.
Izmcrov, N.F., Sanotsky, I.V., and Sidorov, K.K. (19S2). To.riconwtric Paronrerers of Indrrsirinl Toxic Chcnticols Undcr Single Exposlm. Moscow, Centre of Intcrnntionnl Projects, GKNT, p. 114.
Johannscn, F.R., Wright, Gordon, D.E.,P.L., Lcvinskas, G.J., Radue, R.W., and Graham, P.R. (1977). Evaluation of delayedneurotoxicity and dose-response relationships o f phosphate esters in the a d u l r hen. Toxicol. Appl . P/~nrnlncol.41, 291-304.
Jolly, R.D., and Daleficld, R.R. (1939). Lipopigments i n veterinary pathology: Pathogenesis and tcnninolo&y. Adr? E Y ~ .Mcd. Biol. 266, 157-168.
Jonckhcere, A.R.(1951). A distribution-free k-sample test against ordercd alternatives. Bion~etrika i l l , 133-14s.
Jortncr, B.S., and Ehrich, M. (19S7). Neuropathological effects o f phenyl saligenin phosphate in chickens. Ne~rro/o.xicology8, 303-314.
Jortner, B.S., Shell, L., El-Fawal, H., and Ehrich, M. (1%9). Myclinatcdnervefiber regeneration following orpnophosphorus ester-induced delayed ncuropalhy. Neuroto.xicolqy 10, 717-726.
Kaplan, E.L.,and Meicr, P. (1958). Nonparametric cstimarion f r o m incomplcte obscrvations. J. Am. S/O/.ASSOC.33, 457-481.

75 References
Kimmerle,G., antd DelayedLoeser, E. (1974).neurotoxicity of organophosphorus compounds and copper concentration i n the serum of hens. Environ. Qual. Sa$ 3, 174-178.
Kurebayashi, H., Tanaka, A., a n d Yamaha, T. (19SS). Metabolism a n d disposition of the flame retardant plasticizer, tri-p-cresyl phosphate, i n the rat. To.xico1. Appl. Phrntacol. 77, 395-404.
Marhold, J.V. (1972).Collection of Results of To.ricologic01 Assessnlents of Compounds and Fornlulations Tested at the Department of Toxicology,Resenrch Innstinite for Organic Syntheses. Prague, lnstitute f o r Management Training i n the Chemical Industry.
McConnell,E.E., Solleveld, H.A.,Swenbcrg, J.A.,and Boorman, G.A. (1986).Guidelinesforcombining neoplasmsforevaluation of rodent carcinogencsis studies. JNCI 76, 283-289.
McKnight, B., and Crowley, J. (1984). Testsfor differences in tumorincidencebasedon animal carcinogenesisexperiments. J. Anz. Smt. Assoc. 79, 639-648.
Maronpot, R.R., Boorman,(19S2).a n d G.A. Interpretation o f rodent hepatocellular proliferative alterations and hepatocellulartumors i n chemical safetyassessment. Toxicol. Pathol. IO, 71-SO.
The Merck Index. (1976). 9th ed. (M. Windholz, Ed.). Merck and Co., Rahway, NJ.
Meyer, Tilson, H.A., Byrd, W.C., andO.A., Riley, M.T. (1979). A method for the routine assess- ment of fore- and hindl imb grip strength of rats and mice. Neurobehav. Toxicol. 1, 233-236.
Miller, R.G. (1981). Sinzldtaneolrs Smlislictrl
Inference, p. 67. Springer-Verlag, New York.
Miller, J.A., and Miller,E.C.(1977).Ullimatc chemical asmutageniccarcinogensreactive electrophiles. I n Origins of Hunzan Cancer (H.H. Hiatt, J.D. Watson, a n d J.A.Winsten,Eds.), pp. 605-627.Cold.Spring Harbor Laboratory, Cold Spring Harbor, NY.
Morgan,J.P., anc3 Penovic:h, P. (1978).Jamaica GingerParalysis:Forty-seven-yearfollow-up. Arch. Nelrrol. 35, 530-532.
NationalCancer Institute (NCI) (1976).Guidelines for Carcinogen Bioassay i n Small Rodents. Technical Report Series No.1.NIHPublication No.76-801. U.S. Department of Health, Education, a n d Welfare, P u b l i c Health Service, National Institutes of Health, Bcthcsda, MD.
NationalInstitutes of Health (NIH) (1978). Open Formula Rat and Mouse Ration (NIH-07). SpecificationNIH-11-1335. U.S. Department of Health, Education, a n d Welfare,PublicHealth Service, National Institutes of Health, Bethesda, MD.
NationalTosicologyProgram(NTP)(1983). Report on Sperm Morphology a n d V a g i n a l Cytology in Rats a n d Micc Administered Tricresyl Phosphate (Gavage Studies). U.S. Department o f Health and Human Services, Public Health Service, NationalInstitutes of Health, Research Triangle Park, NC.
National Toxicology Program (NTP) (1985). Report onspermmorphology and vaginal cytology in rats a n d mice administered tricresyl phosphate (Feed Studies). U.S. Department of Health and Human Services,Public Health Service, National Institutes of Health, Research Triangle Park, NC.
National Program(1987).Toxicology (NTP) Tosicology and CarcinogenesisStudies of Dimethyl Methylphosphonate(CAS No. 756-79-6) in F344M Rats a n d BGC3F,Mice (Gavage Studies). Technical Report SeriesNIHPublication323.No.No. SS-2579. U.S. Department of Health and Human Services, Public Health Service, NationalInstitutes o f Health, Rcscarch Triangle Park, NC.
National Program(1989).Toxicology (NTP) Tosicology a n d Carcinogenesis Studieso f Dichlorvos (CAS No. 62-73-7)in F344/N Rats a n d B6C3Fl Mice (Gavage Studies). Technical Report Series No. 342. NIH Publication No.89-2598. U.S. Department of Hcalth a n d HumanServices,Public Health Service, National Institutes of Health, Research Triangle Park, NC.

76
Nomeir, A.A., a n d Abou-Donia, M.B. (19S6). Studies on the metabolism of the neurotoxic tri-o-cresyl phosphate, distribution, excretion, and metabolism in male cats after a singlc, dermal application. Toxicofogy38, 15-33.
Sndrfer Stnndnrd Spectra. UV10. SadtlerNo. Research Laboratories, Philadelphia, PA.
Shirley, E. (1977). A non-parametric equivalent of Williams’ test for contrasting increasing dose levelso f a treatment. Biometrics 33, 3SG-3S9.
Smallridge, R.C., Carr, F.E., and Fein, H.G. (1991). Diisopropylfluorophosphate (DFP) reduces serum prolactin, thyrotropin, luteinizing hormone, a n d growth hormone and increases adrenocorticoiropin and corticosterone in rats:Involvement of dopaminergic and somatostatinergic as well as cholinergic pathways. Toxicol. Appl. Plwrtmcol. 108, 284-295.
Smallridge, R.C. Thyrotropin-secreting(1987). pituitary tumors. Endocrinol. Metnb. Clin. Norlh Am. 16, 765-792.
Smith, M.I., and Elvove, E. (1930). Pharmacological and chemical studies o f t he cause of so-called ginger paralysis. Public Health Rep. 45, 1703- .
Smith, M.I., Engel, E.W., and Stohlman, F.F. (1932). Further studies on the pharmacology o f certain phenol esters with special reference to the relation of chemical constitution and physiologic action. N m f .
Inst. Health Buff.160, 1-53.
Somkuti, S.G, and Abou-Donia, M.B. ( 1 9 W ) . Disposition, elimination, and metabolism o C tri-o-cresyl following dailyphosphate oral administration in Fischer344 male rats. Arch. Toxicol. 64
Somkuti, S.G., Lapadula, D.M., Chapin, R.E., Lamb, J.C., IV, and Abou-Donia, M.B. (19S7a). Reproductive tract lesions resulting from subchronic administration (63 days) of tri-o-cresyl phosphate i n male rats. Toxicol. Appl. Phnmncol. 89, 49-63.
Tricresyl I’hosphnte, NTP TR 433
Somkuti, S.G., Lapadula, D.M., Chapin, R.E., Lamb, J.C., IV, a n d Abou-Donia, M.B. (1987b). Time course of the tri-o-cresyl phosphate-induced testicular lesion i n F-344 rats: Enzymatic, hormonal, and sperm parameter studies. Toxicol. Appl. P/1amlncol. 89, 64-72.
Somkuti, S.G., Tilson, H.A.,Brown, H.R., Campbell, Lapadula, andG.A., D.M., Abou-Donia, M.B. (19SS). Lack o f delayed neuro- toxic effect after tri-o-cresyl phosphate treatment in malc Fischer 344 rats: Biochemical, neurobehavioral, and neuropathological studies. Fundant. Appl. Tox-icol. to, 199-205.
Straus, D.S. ( 2 9 8 1 ) . Somatic mutation, cellular dillercnlintion, a n d canccr causation. JNCZ 67, 233.
Szab6, D., C z a k 6 , E , Tbth, LE., Szalay, KSz., Krasznai, K., and Stark, E. (1992). Effect of chronic ACTH treatment on t h e physical state of lipid droplets in rat adrenocortical cells. J . Steroid B ~ O C ~ C I ~ Z .Mol. Biol. 41, 781-784.
Tarone, R.E. (1975). Tests for trend in life table analysis. .Bionzetr-ikn 62, 679-682.
Tennant, R.W., Margolin, B.H., Shelby, M.D., Zeiger, E., Haseman, J.K., Spalding, J., Caspary, W., Resnick, M., Stasiewicz, S . , Anderson, B., and Minor, R. (19S7). Prediction o f chemical carcino- genicity i n rodents from in vitro genetic toxicity assays. Science 236, 933-941.
Vcronesi B. (19S4). Effect o f metabolic inhibition w i t h pipcronylbutoxide on rodent sensitivity to tri-ortho-cresyl phosphatc. Erp. Nenrol. 85, 651-660.
Vcroncsi, B., Newland,D.,and Inman, A. (1984). T h e ellect of metabolic interference on rodent-sensitivity to lri-ortho-cresyl phosphate. Toxicologist 4, 55. (Abstr.)
Veronesi, B., Padilla, S., Blackmon, K., and Pope, C. (1991). Murine susceptibility to organophosphorus- induced delayed neuropathy (OPIDN). Toxicol. Appl. P h n m l ~ c o f .107, 311-324.

77 References
Williams, D.A. (1971). A test for differences between treatment meanswhenseveraldoselevels are compared with a zero dosecontrol. Bionrcrrics 27, 103-117.
Williams, D.A. (1972). Thecomparison o f several dose levels with a zero dose control. Bionrctrics 28, 519-531.
Zciger, E., Haseman, J.K., Shelby, M.D., Margolin, B.H., a n d Tennant, R.W. (1990). Evaluation of four in virro genetictoxicitytestsfor prcdiclingrodcntcarcinogenicity:Confirmation of earlicr results w i t h 41 addilional chemicals. Environ. Mol. M u t r g c n . 16 (Suppl. IS), 1-14.

79
APPENDIX A SUMMARY OF LESIONS INMALE RATS
IN THE 2-YEAR FEED STUDY OF TRICRESYL PHOSPHATE
TABLEA1 Summary of the Incidence of Neoplasms in Male Rats in the 2-Year Feed Study of Tricresyl Phosphate ............................. 80
TABLEA2 Individual Animal Tumor Pathology of Male Rats in the 2-Year Feed Study of Tricresyl Phosphate ............................. 84
TABLEA3 Statistical Analysis of Primary Neoplasms in Male Rats in the 2-Year Feed Study of Tricresyl Phosphate ............................. 102
TABLEA4 Summary of the Incidence of Nonneoplastic Lesions in Male Rats in the 2-Year Feed Study of Tricresyl Phosphate ............................. 106

80 Tricresyl Phosphate, NTP TR 433
TABLEA1 Summary of the Incidence of Neoplasms in Male Rats in the 2-Year Feed Study of Tricresyl Phosphatea
Disposition Summary Animals initially i n study 95 9s 95 95 3 - M o d buaim cvalkptionb 1.5 15 15 15 9” irusim cv-b 14 15 15 15 IS-Monrh irusim cv-b 1s 15 15 15 Early deaths
Moribund 1 4 1 6 1 1 16 Natural deaths 5 4 4 6
Survivors Died last week o f study 1 Terminal sacrifice 31 30 35 28
Animals examined microscopically 95 95 95 95
Systems Examined at 3, 9, and 15 Months With No Neoplusms Observed Alimentary System Cardiovascular System Endocrine System General Body System Genital System Hematopoietic System Integumentary System Musculoskeletal System Nervous System Respiratory System Special Senses System Urinary System
2-Year Study Alimentary System Intestine small, jejunum (49)
Mastcell tumorbenign 1 (2%) Liver (50)
Hepatocellular adenoma 1 (2%) Mesentery (6)
Liposarcoma 1(17%) Schwannoma malignant
Pancreas Stomach, forestomach
Squamous cell papilloma
Cardiovascular System Heart
Endocrine System Adrenal cortex (50) (4‘)) (30) (49)
Adenoma 1 (2%) 2 (4%) 2 (4%) 3 (6%)
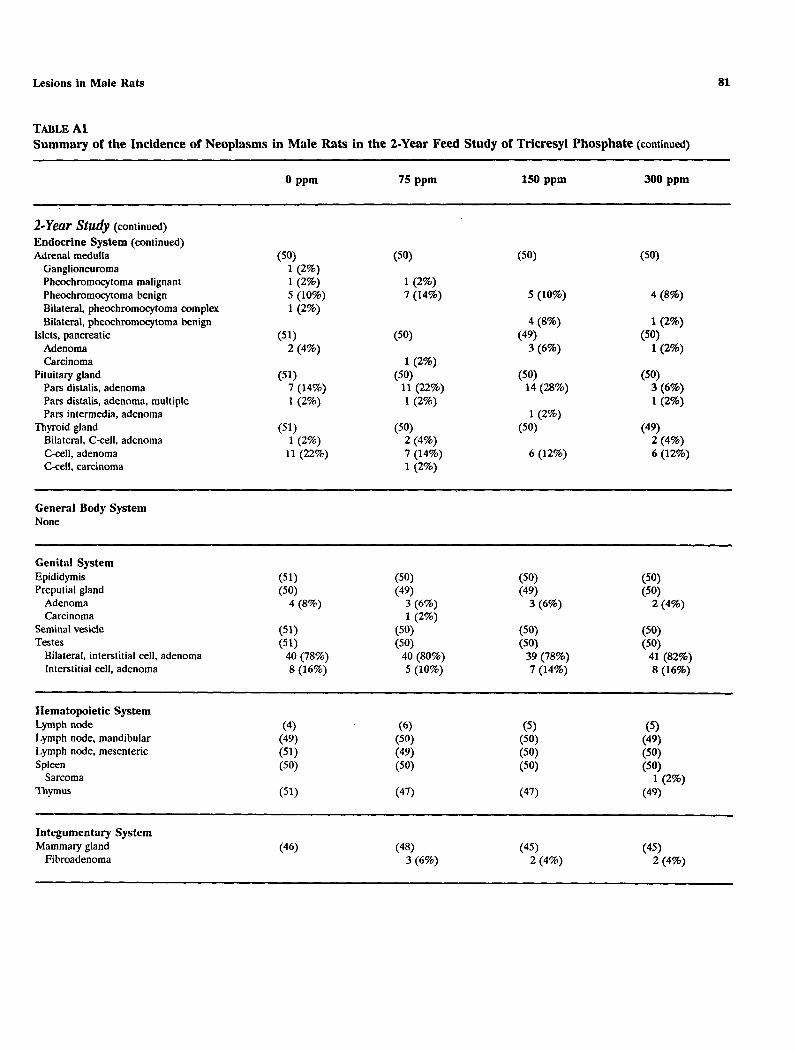
Lesions in Male Rats 81
TABLE Al Summary of the Incidence of Neoplasms in Male Rats in the 2-Year Feed Study of Tricresyl Phosphate (continued)
o ppm 75 ppm 150 ppm 300 ppm
2-Year Study (continued)
Endocrine System (continued) Adrenal medulla
Ganglioneuroma Pheochromocytoma malignant Pheochromocytoma benign Bilateral, pheOChromocytoma complex Bilateral, pheochromocytoma benign
Islets, pancreatic Adenoma Carcinoma
Pituitary gland Pars distalis, adenoma Pars distalis, adenoma, multiple Pars intermedia, adenoma
Thyroid gland Bilateral, C-cell, adenoma C-ce1l, adenoma C-cell, carcinoma
(50) 1 (2%) 1 (2%) 5 (10%) 1 (2%)
(51) 2 (4%)
(51) 7 (14%) 1 (2%)
(51) 1 (2%)
11 (22%)
(50)
1 (2%) 7 (14%)
(50)
1 (2%) (50)
11 (22%) 1 (2%)
(50) 2 (4%) 7 (14%) 1 (2%)
(50)
5 (10%)
4 (8%) (49)
3 (6%)
(50) 14 (28%)
1 (2%) (50)
6 (12%)
(50)
4 (8%)
1 (2%) (50)
1 (2%)
(50) 3 (6%) 1 (2%)
(49) 2 (4%) 6 (12%)
General Body System None
Genital System Epididymis Preputial gland
Adenoma Carcinoma
Seminal vesicle Testes
Bilateral, interstitial cell, adenoma Interstitial cell, adenoma
(51) (50)
4 (8%)
(51) (51)
40 (78%) 8 (16%)
(50) (49)
3 (6%) 1 (2%)
(50) (50)
40 (80%) 5 (10%)
(50) (49)
3 (6%)
(50) (50)
39 (78%) 7 (14%)
(50) (50)
2 (4%)
(50) (50)
41 (82%) 8 (16%)
Hematopoietic System Lymph node Lymph node, mandibular Lymph node, mesenteric Spleen
Sarcoma Thymus
(4) (49) (51) (50)
(51)
(6) (50) (49) (50)
(47)
(5) (50) (50) (50)
(47)
(5) (49) (50) (50)
1 (2%) (49)
Integumentary System Mammary gland
Fibroadenoma (46) (48)
3 (6%) (45)
2 (4%) (45)
2 (4%)

82 Tricresyl Phosphate, NTP TR 433
TABLE Ai Summary of the Incidence of Neoplasms in Male Rats in the 2·Year Feed Study of Tricresyl Phosphate (continued)
o ppm 75 ppm 150 ppm 300 ppm
2-Year Study (continued) Integumentary System (continued) Skin
Basal cell adenoma Basosquamous tumor benign Fibroma Keratoacanthoma Squamous cell carcinoma Subcutaneous tissue, fibroma Subcutaneous tissue, fibrosarcoma Subcutaneous tissue, fibrous histiocytoma Subcutaneous tissue, lipoma Subcutaneous tissue, sarcoma Subcutaneous tissue, schwan noma malignant
(51) 1 (2%) 1 (2%) 1 (2%) 2 (4%) 1 (2%)
1 (2%) 1 (2%)
1 (2%)
(50)
1 (2%)
(50)
1 (2%)
(50)
1 (2%)
1 (2%)
Musculoskeletal System None
Nervous System Brain
Astrocytoma benign Granular cell tumor benign Oligodendroglioma benign
Peripheral nelVe Spinal cord
(51) 1 (2%) 1 (2%)
(51) (51)
(50)
(50) (50)
(50)
1 (2%) (50) (50)
(50)
(50) (49)
Respiratory System Lung
Alveolarlbronchiolar carcinoma Nose
Squamous cell carcinoma
(51) 1 (2%)
(51)
(50)
(50)
(50)
(50)
(50)
(50) 1 (2%)
Special Senses System Ear
Pinna, fibrosarcoma Zymbal's gland
Carcinoma (1)
1 (100%) (1)
1 (100%)
(1)
(1) 1 (100%)
(1) 1 (100%)
(1) 1 (100%)
Urinary System Kidney Urinary bladder
(51) (51)
(50) (50)
(50) (50)
(50) (50)
Systemic Lesions Muliiple organsC
Leukemia mononuclear Mesothelioma malignant
(51) 20 (39%) 1 (2%)
(50) 18 (36%)
(50) 16 (32%) 1 (2%)
(50) 20 (40%)

83 Lesions in Male Rats
TABLEA1 Summary of the Incidence of Neoplasms in Male Rats in the 2-Year Feed Study of Tricresyl Phosphate (continued)
0 PPm 75 PPm 150 ppm 300 ppm
Neoplasm Summary Total animals with primary neoplasmsd 50 49 49 50
Total primary neoplasms 120 106 107 103 Total animals w i t h benign neoplasms 49 48 48 50
Total benign neoplasms 90 83 88 77 Total animals wi th malignant neoplasms 28 23 19 24
Total malignant neoplasms 30 23 19 26 Total animals wi th metastatic neoplasms 1
Total metastatic neoplasms 2
a Number of animals examined microscopically a t site a n d number of animals w i t h neoplasm Includes up to five animals per dose group subjected to total body perfusion for special neuropathology Number of animals w i t h a n y tissue examined microscopically Primary neoplasms: a11neoplasms except metastatic neoplasms

84 Tricresyl Phosphate, NTP TR 433
TABLEA2 Individual Animal Tumor Pathology of Male Rats in the 2-Year Feed Study of Tricresyl Phosphate: 0 ppm
Number of Days on Study
Carcass ID Number
Alimentary System Esophagus Intestine large, colon Intestine large, rectum Intestine large, cecum Intestine small, duodenum Intestine small, jejunum
Mast cell tumor benign Intestine small, ileum Liver Mesentery
Schwannoma malignant Pancreas Salivary glands Stomach, forestomach
Squamous cell papilloma Stomach, glandular
Cardiovascular System Heart
Mesothelioma malignant, metastatic, lung
Endocrine System Adrenal cortex
Adenoma Adrenal medulla
Ganglioneuroma Pheochromocytoma malignant Pheochromocytoma benign Bilateral, pheochromocytoma complex
Islets, pancreatic Adenoma
Parathyroid gland Pituitary gland
Pars distalis, adenoma Pars distalis, adenoma, multiple
Thyroid gland Mesothelioma malignant. metastatic,
lung Bilateral, C a l l , adenoma C-cell, adenoma
General Body System None
+: Tissue examined microscopically A: Autolysis precludes examination
0 4 4 5 5 5 5 6 6 6 6 6 6 6 7 7 7 7 7 7 7 7 7 7 7 8 7 8 0 5 7 9 2 4 4 7 8 8 9 0 0 0 2 2 3 3 3 3 3 3 7 8 6 0 8 2 2 5 7 7 3 0 3 0 1 1 2 2 5 0 1 1 2 2 2
0 4 5 5 5 4 4 5 4 5 5 5 5 4 5 5 5 5 4 5 4 4 4 4 4 0 8 1 2 3 9 8 1 8 1 2 2 2 9 0 0 2 1 9 0 8 8 8 8 8 9 1 3 1 0 1 7 2 8 7 7 3 2 6 6 9 9 1 0 2 2 3 4 5 6
. . . . . . . . . . . . . . . . . . . . . . . . . + + + + + + + + + + + A + + + + + + + + + + + + + . . . . . . . . . . . . . . . . . . . . . . . . . + + + + + + + + + + + A + + + + + + + + + + + + + . . . . . . . . . . . . . . . . . . . . . . . . . + + + + + + + + + + + A + A + + + + + + + + + + +
+ + + + + + + + + + + A + A + + + + + + + + + + + + + + + + + + + + + + + + + + + + + + + + + + M +
+ + . . . . . . . . . . . . . . . . . . . . . . . . . . . . . . . . . . . . . . . . . . . . . . . . . . . . . . . . . . . . . . . . . . . . . . . . . . .
. . . . . . . . . . . . . . . . . . . . . . . . .
. . . . . . . . . . . . . . . . . . . . . . . . .
X
+ + + + + + + + + + + + + + + + + + + + + + + M +
+ + + + + + + + + + + + + + + + + + + + + + + M +
X
. . . . . . . . . . . . . . . . . . . . . . . . . X
M + + M + + + + + M + M + + M + + + + + + + + + + . . . . . . . . . . . . . . . . . . . . . . . . .
X x x x x
. . . . . . . . . . . . . . . . . . . . . . . . .
X X
X x x x x
M: Missing tissue X Lesionpresent I: Insufficient tissue BlankNot examined

85 Lesions in Male Rats
TABLEA2 Individual Animal Tumor Pathology of Male Rats in the 2-Year Feed Study of Tricresyl Phosphate: 0 ppm (continued)
Number of Days on Study
Carcass ID Number
Alimentary System Esophagus Intestine large, colon Intestine large, rectum Intestine large, cecum Intestine small, duodenum Intestine small, jejunum
Mast c e l l tumor benign Intestine small, ileum Liver Mesentery
Schwannoma malignant Pancreas Salivary glands Stomach, forestomach
Squamous cell papilloma Stomach, glandular
Cardiovascular System Heart
Mesothelioma malignant, metastatic, lung
Endocrine System Adrenal cortex
Adenoma Adrenal medulla
Ganglioneuroma Pheochromocytoma malignant Pheochromocytoma benign Bilateral, pheochromocytoma complex
Islets, pancreatic Adenoma
Parathyroid gland Pituitary gland
Pars distalis, adenoma Pars distalis, adenoma, multiple
Thyroid gland Mesothelioma malignant, metastatic,
lung Bilateral, C-cell, adenoma C-cell, adenoma
General Body System None
7 7 7 7 7 7 7 7 7 7 7 7 7 7 7 7 7 7 7 7 7 7 7 7 7 7 3 3 3 3 3 3 3 3 3 3 3 3 3 3 3 3 3 3 3 3 3 3 3 3 3 3 2 2 2 2 2 2 2 2 2 2 2 2 2 2 2 2 2 2 2 2 2 2 2 2 2 2
4 4 4 4 4 4 4 4 5 5 5 5 5 5 5 5 5 5 5 5 5 5 5 5 5 5 Total 8 9 9 9 9 9 9 9 0 0 0 0 0 0 0 1 1 1 1 1 1 2 2 2 2 2 Tissues/ 9 2 3 4 5 7 8 9 0 1 3 4 5 7 8 0 4 5 6 8 9 0 4 5 6 8 Tumors
. . . . . . . . . . . . . . . . . . . . . . . . . . 51
. . . . . . . . . . . . . . . . . . . . . . . . . . 50
. . . . . . . . . . . . . . . . . . . . . . . . . . 51
. . . . . . . . . . . . . . . . . . . . . . . . . . 50
. . . . . . . . . . . . . . . . . . . . . . . . . . 51
. . . . . . . . . . . . . . . . . . . . . . . . . . 49 X 1
. . . . . . . . . . . . . . . . . . . . . . . . . . 49
. . . . . . . . . . . . . . . . . . . . . . . . . . 50 + + 4 X 1
. . . . . . . . . . . . . . . . . . . . . . . . . . 51
. . . . . . . . . . . . . . . . . . . . . . . . . . 51
. . . . . . . . . . . . . . . . . . . . . . . . . . 51 X 1
. . . . . . . . . . . . . . . . . . . . . . . . . . . 51
. . . . . . . . . . . . . . . . . . . . . . . . . . 51
1
. . . . . . . . . . . . . . . . . . . . . . . . . . 50 X 1
. . . . . . . . . . . . . . . . . . . . . . . . . . 50 X 1
X 1 X x x X 5
X 1 . . . . . . . . . . . . . . . . . . . . . . . . . . 51
X 2 + + + + + + + + + + + + + + + + M + + M + + + + + + 44 . . . . . . . . . . . . . . . . . . . . . . . . . . 51
X X X 7 1
. . . . . . . . . . . . . . . . . . . . . . . . . . 51
1 1
X x x x x x 11

86 Tricresyl Phosphate, NTP TR 433
TABLEA2 Individual Animal Tumor Pathology of Male Rats in the 2-Year Feed Study of Tricresyl Phosphate: 0 ppm (continued)
Number of Days on Study
Carcass ID Number
Genital System Epididymis Preputial gland
Adenoma Prostate Seminal vesicle Testes
Bilateral, interstitial cell, adenoma Interstitial cell, adenoma
Hematopoietic System Bone marrow Lymphnode Lymph node, mandibular Lymph node, mesenteric Spleen Thymus
Integumentary System Mammary gland Skin
Basal cell adenoma Basosquamous tumor benign Fibroma Keratoacanthoma Squamous cell carcinoma Subcutaneous tissue, fibrosarcoma Subcutaneous tissue, fibrous histiocytoma
Subcutaneous tissue, schwannoma malignant
Musculoskeletal System Bone Skeletal muscle
Nervous System Brain
Astrocytoma benign Granular cell tumor benign
Peripheral nerve Spinal cord
Respiratory System Lung
Alveolar/bronchiolar carcinoma NOX Trachea
0 4 4 5 5 5 5 6 6 6 6 6 6 6 7 7 7 7 7 7 7 7 7 7 7 8 7 8 0 5 7 9 2 4 4 7 8 8 9 0 0 0 2 2 3 3 3 3 3 3 7 8 6 0 8 2 2 5 7 7 3 0 3 0 1 1 2 2 5 0 1 1 2 2 2
0 4 5 5 5 4 4 5 4 5 5 5 5 4 5 5 5 5 4 5 4 4 4 4 4 0 8 1 2 3 9 8 1 8 1 2 2 2 9 0 0 2 1 9 0 8 8 8 8 8 9 1 3 1 0 1 7 2 8 7 7 3 2 6 6 9 9 1 0 2 2 3 4 5 6
. . . . . . . . . . . . . . . . . . . . . . . . . + + + + + + + + + + + + + + + + + + + + + M + + +
X . . . . . . . . . . . . . . . . . . . . . . . . . . . . . . . . . . . . . . . . . . . . . . . . . . . . . . . . . . . . . . . . . . . . . . . . . . .
x xx x x x x x x x x x xx xx x x x X X X
. . . . . . . . . . . . . . . . . . . . . . . . . + + + +
+ + + M + + + + + + + ' + + + + M + + + + + + + + + . . . . . . . . . . . . . . . . . . . . . . . . . + + + + + + + + + + + + + + + + + + + + + + + M + . . . . . . . . . . . . . . . . . . . . . . . . .
M + + + + + + + + + + M + + + + + + + + M + + + + . . . . . . . . . . . . . . . . . . . . . . . . .
X
X
X
X
. . . . . . . . . . . . . . . . . . . . . . . . . +
. . . . . . . . . . . . . . . . . . . . . . . . . X
X . . . . . . . . . . . . . . . . . . . . . . . . . . . . . . . . . . . . . . . . . . . . . . . . . .
. . . . . . . . . . . . . . . . . . . . . . . . .
. . . . . . . . . . . . . . . . . . . . . . . . . . . . . . . . . . . . . . . . . . . . . . . . . . . . .

87 Lesions in Male Rats
TABLEA2 Individual Animal Tumor Pathology of Male Rats in the 2-Year Feed Study of Tricresyl Phosphate: 0 ppm (continued) ~~ ~
Number of Days on Study
Carcass ID Number
Genital System Epididymis Preputial gland
Adenoma Prostate Seminal vesicle Testes
Bilateral, interstitial cell, adenoma Interstitial cell, adenoma
Hematopoietic System Bone marrow Lymphnode Lymph node, mandibular Lymph node, mesenteric Spleen Thymus
Integumentary System Mamrnaty gland Skin
Basal cell adenoma Basosquamous tumor benign Fibroma Keratoacanthoma Squamous cell carcinoma Subcutaneous tissue, fibrosarcoma Subcutaneous tissue, fibrous histiocytoma
Subcutaneous tissue, schwannoma mal ignant
Musculoskeletal System Bone Skeletal muscle
Nervous System Brain
Astrocytomabenign Granular cell tumor benign
Peripheral nerve Spinal cord
Respiratory System Lung
Alveolaribronchiolar carcinoma Nose Trachea
7 7 7 7 7 7 7 7 7 1 1 7 7 7 7 7 7 7 7 7 7 7 7 7 7 7 7 7 7 3 3 3 3 3 3 3 3 3 3 3 3 3 3 3 3 3 3 3 3 3 3 3 3 3 3 2 2 2 2 2 2 2 2 2 2 2 2 2 2 2 2 2 2 2 2 2 2 2 2 2 2
4 4 4 4 4 4 4 4 5 5 5 5 5 5 5 5 5 5 5 5 5 5 5 5 5 5 8 9 9 9 9 9 9 9 0 0 0 0 0 0 0 1 1 1 1 1 1 2 2 2 2 2 9 2 3 4 5 7 8 9 0 1 3 4 5 7 8 0 4 5 6 8 9 0 4 5 6 8
. . . . . . . . . . . . . . . . . . . . . . . . . .
. . . . . . . . . . . . . . . . . . . . . . . . . . X X X
. . . . . . . . . . . . . . . . . . . . . . . . . .
. . . . . . . . . . . . . . . . . . . . . . . . . .
. . . . . . . . . . . . . . . . . . . . . . . . . . x x x x x x x x x x x x x x x x x x x x x x x
X X X
. . . . . . . . . . . . . . . . . . . . . . . . . .
. . . . . . . . . . . . . . . . . . . . . . . . . .
. . . . . . . . . . . . . . . . . . . . . . . . . .
. . . . . . . . . . . . . . . . . . . . . . . . . .
. . . . . . . . . . . . . . . . . . . . . . . . . .
+ + + + + + + + + + + M + + + + M + + + + + + + + + . . . . . . . . . . . . . . . . . . . . . . . . . .
X X
X X
X
. . . . . . . . . . . . . . . . . . . . . . . . . .
. . . . . . . . . . . . . . . . . . . . . . . . . .
. . . . . . . . . . . . . . . . . . . . . . . . . .
. . . . . . . . . . . . . . . . . . . . . . . . . .
. . . . . . . . . . . . . . . . . . . . . . . . . . X
. . . . . . . . . . . . . . . . . . . . . . . . . .
. . . . . . . . . . . . . . . . . . . . . . . . . .
Total Tissues/ Tumors
51 50 4 51 51 51 40 8
51 4 49 51 50 51
46 51 1 1 1 2 1
51 1
51 1 1 51 51
~ ~~~
51 1
51 51

88 Tricresyl Phosphate, NTP TR 433
TABLEA2 Individual Animal Tumor Pathology of Male Rats in the 2-Year Feed Study of Tricresyl Phosphate: 0 ppm (continued)
Number of Days on Study
Carcass ID Number
Special Senses System EyeZymbal's gland
Carcinoma
Urinary System Kidney Urinary bladder
Systemic Lesions Multiple organs
Leukemia mononuclear Mesothelioma malignant
0 4 4 5 5 5 5 6 6 6 6 6 6 6 7 7 1 7 7 1 7 7 1 1 1 8 7 8 0 5 7 9 2 4 4 7 8 8 9 0 0 0 2 2 3 3 3 3 3 3 7 8 6 0 8 2 2 5 1 7 3 0 3 0 1 1 2 2 5 0 1 1 2 2 2
0 4 5 5 5 4 4 5 4 5 5 5 5 4 5 5 5 5 4 5 4 4 4 4 4 0 8 1 2 3 9 8 1 8 1 2 2 2 9 0 0 2 1 9 0 8 8 8 8 8 9 1 3 1 0 1 7 2 8 1 7 3 2 6 6 9 9 1 0 2 2 3 4 5 6
+ + + + + + X
. . . . . . . . . . . . . . . . . . . . . . . . .
. . . . . . . . . . . . . . . . . . . . . . . . .
. . . . . . . . . . . . . . . . . . . . . . . . . x x x x x xx x x x x x xx x
X

89 Lesions in Male Rats
TABLEA2 Individual Animal Tumor Pathology of Male Rats in the 2-Year Feed Study of Tricresyl Phosphate: 0 ppm (continued)
Number of Days on Study
Carcass ID Number
Special Senses System EyeZyrnbal’s gland
Carcinoma
Urinary System Kidney Urinary bladder
Systemic Lesions Multiple organs
Leukemia mononuclear Mesothelioma malignant
7 7 7 7 7 7 7 7 7 7 7 7 7 7 7 7 7 7 7 7 7 7 7 7 7 7 3 3 3 3 3 3 3 3 3 3 3 3 3 3 3 3 3 3 3 3 3 3 3 3 3 3 2 2 2 2 2 2 2 2 2 2 2 2 2 2 2 2 2 2 2 2 2 2 2 2 2 2
4 4 4 4 4 4 4 4 5 5 5 5 5 5 5 5 5 5 5 5 5 5 5 5 5 5 Total 8 9 9 9 9 9 9 9 0 0 0 0 0 0 0 1 1 1 1 1 1 2 2 2 2 2 Tissues/ 9 2 3 4 5 7 8 9 0 1 3 4 5 1 8 0 4 5 6 8 9 0 4 5 6 8 Tumors
+ + 7 1 1
. . . . . . . . . . . . . . . . . . . . . . . . . . 51
. . . . . . . . . . . . . . . . . . . . . . . . . . 51
. . . . . . . . . . . . . . . . . . . . . . . . . . 51 x x x X X 20
1

90 Tricresyl Phosphate, NTP TR 433
TABLEA2 Individual Animal Tumor Pathology of Male Rats in the 2-Year Feed Study of Tricresyl Phosphate: 75 ppm
Number of Days on Study
Carcass ID Number
Alimentary System Esophagus Intestine large, colon Intestine large, rectum Intestine large, cecum Intestine small, duodenum Intestine small, jejunum Intestine small, ileum Liver
Hepatocellular adenoma Mesentery Pancreas Salivaly glands Stomach, forestomach Stomach, glandular
Cardiovascular System Heart
Endocrine System Adrenal cortex
Adenoma Adrenal medulla
Pheochromocytoma malignant Pheochromocytoma benign
Islets, pancreatic Carcinoma
Parathyroid gland Pituitary gland
Pars distalis, adenoma Pars distalis, adenoma, multiple
Thyroid gland Bilateral, C-cell, adenoma C-cell, adenoma C-cell, carcinoma
General Body System None
Genital System Epididymis Preputial gland
Adenoma Carcinoma
Prostate Seminal vesicle Testes
Bilateral, interstitial cell, adenoma Interstitial cell, adenoma
2 4 4 5 5 5 6 6 6 6 6 6 6 6 6 6 6 7 7 7 7 7 7 7 7 6 5 9 3 8 9 1 1 1 3 4 4 5 6 9 9 9 0 0 2 3 3 ’ 3 3 3 3 5 8 7 6 0 1 4 4 5 0 8 2 2 0 1 9 1 2 5 0 0 0 0 1
5 5 5 5 5 5 5 5 5 5 5 5 5 5 5 5 5 5 5 5 5 5 5 5 s 6 6 7 3 3 3 6 3 7 3 5 6 7 3 4 3 7 6 5 5 3 3 4 4 4 7 6 2 2 7 1 9 3 0 9 4 4 9 8 8 5 1 1 6 5 4 6 0 1 2
+ + + + + + + + + + + + + + + + M + + + + + + + + M + + + + + + + + + + + + + + + + + + + + + + + + + + M + + + + + + + + + + + + + + + + + + + + + + . . . . . . . . . . . . . . . . . . . . . . . . . . . . . . . . . . . . . . . . . . . . . . . . . . + + + + + + + + + + + + + + + + A + + + + + + + + + + + + + + + + + + + + + + + + A + + + + + + + + . . . . . . . . . . . . . . . . . . . . . . . . .
+ + . . . . . . . . . . . . . . . . . . . . . . . . . . . . . . . . . . . . . . . . . . . . . . . . . . . . . . . . . . . . . . . . . . . . . . . . . . . . . . . . . . . . . . . . . . . . . . . . . . . .
. . . . . . . . . . . . . . . . . . . . . . . . .
. . . . . . . . . . . . . . . . . . . . . . . . . X
. . . . . . . . . . . . . . . . . . . . . . . . . X
X X . . . . . . . . . . . . . . . . . . . . . . . . .
+ + + + + M + + + + + + + + + + + + + + + + + + M . . . . . . . . . . . . . . . . . . . . . . . . .
X x x
. . . . . . . . . . . . . . . . . . . . . . . . . X X
x x x X
. . . . . . . . . . . . . . . . . . . . . . . . .
. . . . . . . . . . . . . . . . . . . . . . . . . X X
. . . . . . . . . . . . . . . . . . . . . . . . .
. . . . . . . . . . . . . . . . . . . . . . . . .
. . . . . . . . . . . . . . . . . . . . . . . . . x x x x x x x x x xx x x x x x x x x
X x x

adenoma
91 Lesions in Male Rats
TABLEA2 Individual Animal Tumor Pathology of Male Rats in the 2-Year Feed Study of Tricresyl Phosphate: 75 ppm (continued)
Number of Days on Study
Carcass ID Number
Alimentary System Esophagus Intestine large, colon Intestine large, rectum Intestine large, cecum Intestine small, duodenum Intestine small, jejunum Intestine small, ileum Liver
Hepatocellular adenoma Mesentery Pancreas Salivary glands Stomach, forestomach Stomach, glandular
Cardiovascular System Heart
Endocrine System Adrenal cortex
Adenoma Adrenal medulla
Pheochromocytoma mal ignant Pheochromocytoma benign
Islets, pancreatic Carcinoma
Parathyroid gland Pituitary gland
Pars distalis, adenoma Pars distalis, adenoma, multiple
Thyroid gland Bilateral, C-cell, adenoma C-cell, adenoma C-cell, carcinoma
General Body System None
Genital System Epididymis Preputial gland
Adenoma Carcinoma
Prostate Seminal vesicle Testes
Bilateral,interstitialcell,adenoma Interstitial
7 7 7 7 7 7 7 7 7 7 7 7 7 7 7 7 7 7 7 7 7 7 7 7 7 3 3 3 3 3 3 3 3 3 3 3 3 3 3 3 3 3 3 3 3 3 3 3 3 3 1 1 1 1 1 1 1 1 1 1 1 1 1 1 1 1 1 1 1 1 1 1 1 1 1
5 5 5 5 5 5 5 5 5 5 5 5 5 5 5 5 5 5 5 5 5 5 5 5 5 Total 4 4 4 4 4 4 5 5 5 5 5 5 5 6 6 6 6 6 7 7 7 7 7 7 8 Tissuesf 3 4 5 6 7 9 0 1 2 3 7 8 9 0 2 3 5 8 3 4 5 6 7 8 0 Tumors
. . . . . . . . . . . . . . . . . . . . . . . . . 49
. . . . . . . . . . . . . . . . . . . . . . . . . 49
. . . . . . . . . . . . . . . . . . . . . . . . . 49
. . . . . . . . . . . . . . . . . . . . . . . . . 50
. . . . . . . . . . . . . . . . . . . . . . . . . 50
. . . . . . . . . . . . . . . . . . . . . . . . . 49
. . . . . . . . . . . . . . . . . . . . . . . . . 49
. . . . . . . . . . . . . . . . . . . . . . . . . 50 X 1
+ + + + + + 8 . . . . . . . . . . . . . . . . . . . . . . . . . 50 . . . . . . . . . . . . . . . . . . . . . . . . . 50 . . . . . . . . . . . . . . . . . . . . . . . . . 50 . . . . . . . . . . . . . . . . . . . . . . . . . 50
. . . . . . . . . . . . . . . . . . . . . . . . . 50
+ + + + + + + + + + + + + + + + + + + + + + + + 49 X 2
. . . . . . . . . . . . . . . . . . . . . . . . . 50 1
X X X x x 7 . . . . . . . . . . . . . . . . . . . . . . . . . 50
X 1 + + + M M + M + + + + + + + + + + + M + + + + + + 44 . . . . . . . . . . . . . . . . . . . . . . . . . 50
x x x x x x x X 11 X 1
. . . . . . . . . . . . . . . . . . . . . . . . . 50 2
X x x X 7 1
. . . . . . . . . . . . . . . . . . . . . . . . . 50 + + + + + + + + + + + + + + + + + + + + + + + + M 49
X 3 X 1
. . . . . . . . . . . . . . . . . . . . . . . . . 50
. . . . . . . . . . . . . . . . . . . . . . . . . 50
. . . . . . . . . . . . . . . . . . . . . . . . . 50 x x x x x x x x x x x x x x x x x x x x x 40
cell, x x 5

92 Tricresyl Phosphate, NTP TR 433
TABLEA2 Individual Animal Tumor Pathology of Male Rats in the 2-Year Feed Study of Tricresyl Phosphate: 75 ppm (continued)
Number of Days on Study
Carcass ID Number
Hematopoietic System Bone marrow Lymph node Lymph node, mandibular Lymph node, mesenteric Spleen Thymus
Integumentary System Mammary gland
Fibroadenoma Skin
Subcutaneous tissue, fibroma
MusculoskeletalSystem Bone Skeletal muscle
Nervous System Brain Peripheral n e n e Spinal cord
Respiratory System Lung Nose Trachea
Special Senses System EyeZymbal’s gland
Carcinoma
Urinary System Kidney Urinary bladder
Systemic Lesions Multiple organs
Leukemia mononuclear
2 4 4 5 5 5 6 6 6 6 6 6 6 6 6 6 6 7 7 7 7 7 7 7 7 6 5 9 3 8 9 1 1 1 3 4 4 5 6 9 9 9 0 0 2 3 3 3 3 3 3 5 8 7 6 0 1 4 4 5 0 8 2 2 0 1 9 1 2 5 0 0 0 0 1
5 5 5 5 5 5 5 5 5 5 5 5 5 5 5 5 5 5 5 5 5 5 5 5 5 6 6 7 3 3 3 6 3 7 3 5 6 7 3 4 3 7 6 5 5 3 3 4 4 4 7 6 2 2 7 1 9 3 0 9 4 4 9 8 8 5 1 1 6 5 4 6 0 1 2
. . . . . . . . . . . . . . . . . . . . . . . . . + + + + +
. . . . . . . . . . . . . . . . . . . . . . . . .
. . . . . . . . . . . . . . . . . . . . . . . . .
. . . . . . . . . . . . . . . . . . . . . . . . . + + + + + + + + + + + + M + + + + + + + + + + + +
+ + + + + + + + + + + + + M + + + + + + + + + + + X X X
. . . . . . . . . . . . . . . . . . . . . . . . . . X
. . . . . . . . . . . . . . . . . . . . . . . . . +
. . . . . . . . . . . . . . . . . . . . . . . . .
. . . . . . . . . . . . . . . . . . . . . . . . .
. . . . . . . . . . . . . . . . . . . . . . . . .
. . . . . . . . . . . . . . . . . . . . . . . . .
. . . . . . . . . . . . . . . . . . . . . . . . . + + + + + + + + + + + + + + + + M + + + + + + + +
+ +
. . . . . . . . . . . . . . . . . . . . . . . . .
. . . . . . . . . . . . . . . . . . . . . . . . .
. . . . . . . . . . . . . . . . . . . . . . . . . x x x x xx xx x x x x x x

93 Lesions in Male Rats
TABLEA2 Individual Animal Tumor Pathology of Male Rats in the 2-Year Feed Study of Tricresyl Phosphate: 75 ppm (continued)
Number of Days on Study
Carcass ID Number
IIematopoietic System Bone marrow Lymphnode Lymph node, mandibular Lymph node, mesenteric Spleen Thymus
Integumentary System Mammary gland
Fibroadenoma Skin
Subcutaneous tissue, fibroma
Musculoskeletal System Bone Skeletal muscle
Nervous System Brain Peripheral nerve Spinal cord
Respiratory System Lung Nose Trachea
Special Senses System EyeZymbal's gland
Carcinoma
Urinary System Kidney Urinary bladder
Systemic Lesions Multiple organs
Leukemia mononuclear
7 7 7 7 7 7 7 7 7 7 7 7 7 7 7 7 7 7 7 7 7 7 7 7 7 3 3 3 3 3 3 3 3 3 3 3 3 3 3 3 3 3 3 3 3 3 3 3 3 3 1 1 1 1 1 1 1 1 1 1 1 1 1 1 1 1 1 1 1 1 1 1 1 1 1
5 5 5 5 5 5 5 5 5 5 5 5 5 5 5 5 5 5 5 5 5 5 5 5 5 Total 4 4 4 4 4 4 5 5 5 5 5 5 5 6 6 6 6 6 7 7 7 7 7 7 8 Tissues/ 3 4 5 6 7 9 0 1 2 3 1 8 9 0 2 3 5 8 3 4 5 6 7 8 0 Tumors
. . . . . . . . . . . . . . . . . . . . . . . . . 50 + 6
. . . . . . . . . . . . . . . . . . . . . . . . . 50 + + + + + + + + + + + + + + + + + + + + + + + M + 49 . . . . . . . . . . . . . . . . . . . . . . . . . 50 . . . . . . . . . . . . . . . . . . . . . . . . 47
M + + + + + + + + + + + + + + + + + + + + + + + + 48 3
. . . . . . . . . . . . . . . . . . . . . . . . . 50 1
. . . . . . . . . . . . . . . . . . . . . . . . . 50 1
. . . . . . . . . . . . . . . . . . . . . . . . . 50
. . . . . . . . . . . . . . . . . . . . . . . . . 50
. . . . . . . . . . . . . . . . . . . . . . . . . 50
. . . . . . . . . . . . . . . . . . . . . . . . . 50
. . . . . . . . . . . . . . . . . . . . . . . . . 50
. . . . . . . . . . . . . . . . . . . . . . . . . 49
+ 3 + 1 X 1
~ ~
. . . . . . . . . . . . . . . . . . . . . . . . . 50
. . . . . . . . . . . . . . . . . . . . . . . . . 50
. . . . . . . . . . . . . . . . . . . . . . . . . 50 x x X X 18

94 Tricresyl Phosphate, NTP TR 433
TABLEA2 Individual Animal Tumor Pathology of Male Rats in the 2-Year Feed Study of Tricresyl Phosphate: 150 ppm
Number of Days on Study
Carcass ID Number
Alimentary System Esophagus Intestine large, colon Intestine large, rectum Intestine large, cecum Intestine small, duodenum Intestine small, jejunum Intestine small, ileum Liver
Hepatocellular adenoma Mesentery Pancreas Salivary glands Stomach, forestomach Stomach, glandular Tongue
Cardiovascular System .
Heart
Endocrine System Adrenal cortex
Adenoma Adrenal medulla
Pheochromocytoma benign Bilateral, pheochromocytoma benign
Islets, pancreatic Adenoma
Parathyroid gland Pituitary gland
Pars distalis, adenoma Pars intermedia, adenoma
Thyroid gland Cel l , adenoma
General Body System None
Genital System Epididymis Preputial gland
Adenoma Prostate Seminal vesicle T e s t e s
Bilateral, interstitial cell, adenoma Interstitial cell, adenoma
2 4 4 4 5 5 6 6 6 6 6 1 1 1 1 1 1 1 1 1 1 1 1 1 1 6 5 8 9 2 5 1 1 2 3 8 0 1 2 2 2 2 2 2 2 3 3 3 3 3 9 4 8 1 9 3 4 8 4 8 2 1 1 2 2 9 9 9 9 9 0 0 0 0 0
6 5 5 6 6 5 6 6 5 6 6 5 6 6 6 5 5 5 5 5 5 5 5 5 5 1 9 9 1 0 8 0 3 8 0 1 8 2 0 0 8 8 8 8 8 8 9 9 9 9 8 1 5 1 2 2 8 0 4 6 9 1 2 1 9 3 5 6 1 8 9 0 1 2 3
. . . . . . . . . . . . . . . . . . . . . . . . . + + + A + + + + + + + + + + + + + + + + + + + + + + + + A + + + + + + + M + + + + + + + + + + + + + + + + A + + + + + + + M + + + + + + + + + + + + + + + + A + + + + + + + + + + + + + + + + + + + + + + M + A + + + + + + + + + + + + + + + + + + + + + + A + A + + + + + + + + + + + + + + + + + + + + + . . . . . . . . . . . . . . . . . . . . + + + +
X + + + +
+ + + A + + + + + + + + + + + + + + + + + + + + + . . . . . . . . . . . . . . . . . . . . . . . . . . . . . . . . . . . . . . . . . . . . . . . . . . . . . . . . . . . . . . . . . . . . . . . . . . .
+
. . . . . . . . . . . . . . . . . . . . . . . . .
. . . . . . . . . . . . . . . . . . . . . . . . . X
. . . . . . . . . . . . . . . . . . . . . . . . . X
x x x X + + + A + + + + + + + + + + + + + + + + + + + + +
x x X + + + + + + + + + + + + + M + M + + + + + + + + + . . . . . . . . . . . . . . . . . . . . . . . . .
X X x x X X X
. . . . . . . . . . . . . . . . . . . . . . . . . X X
. . . . . . . . . . . . . . . . . . . . . . . . . + + + + + + + + + + + M + + + + + + + + + + + + +
X . . . . . . . . . . . . . . . . . . . . . . . . . . . . . . . . . . . . . . . . . . . . . . . . . . . . . . . . . . . . . . . . . . . . . . . . . . .
x x xx x x xx x x x x x x x x x x x X X
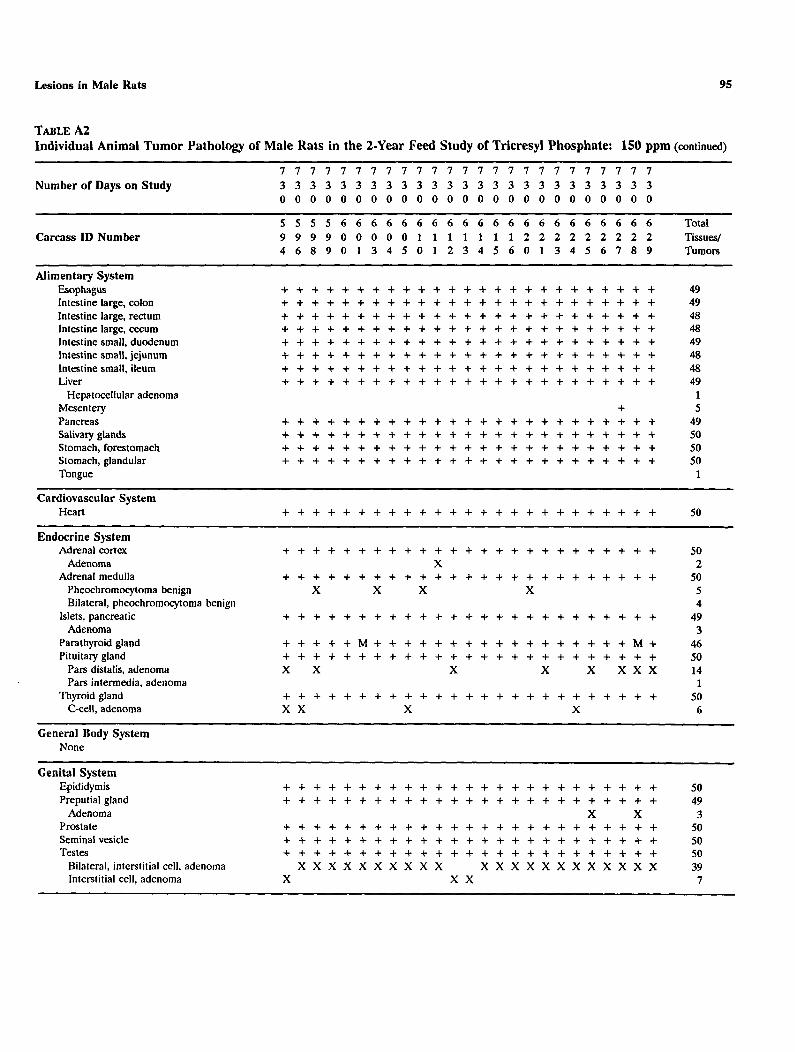
95 Lesions in Male Rats
TABLEA2 Individual Animal Tumor Pathology of Male Rats in the 2-Year Feed Study of Tricresyl Phosphate: 150 ppm (continued)
Number of Days on Study
Carcass I D Number
Alimentary System Esophagus Intestine large, colon Intestine large, rectum Intestine large, cecum Intestine small, duodenum Intestine small, jejunum Intestine small, ileum Liver
Hepatocellular adenoma Mesentery Pancreas Salivary glands Stomach, forestomach Stomach, glandular Tongue
Cardiovascular System Heart
Endocrine System Adrenal cortex
Adenoma Adrenal medulla
Pheochromocytoma benign Bilateral, pheochromocytoma benign
Islets, pancreatic Adenoma
Parathyroid gland Pituitary gland
Pars distalis, adenoma Pars intermedia, adenoma
Thyroid gland C-cell, adenoma
General Body System None
Genital System Epididymis Preputial gland
Adenoma Prostate Seminal vesicle Testes
Bilateral, interstitial cell, adenoma Interstitial cell, adenoma
7 7 7 7 7 7 7 7 7 7 7 7 7 7 7 7 7 7 7 7 7 7 7 7 7 3 3 3 3 3 3 3 3 3 3 3 3 3 3 3 3 3 3 3 3 3 3 3 3 3 0 0 0 0 0 0 0 0 0 0 0 0 0 0 0 0 0 0 0 0 0 0 0 0 0
5 5 5 5 6 6 6 6 6 6 6 6 6 6 6 6 6 6 6 6 6 6 6 6 6 Total 9 9 9 9 0 0 0 0 0 1 1 1 1 1 1 1 2 2 2 2 2 2 2 2 2 Tissues/ 4 6 8 9 0 1 3 4 5 0 1 2 3 4 5 6 0 1 3 4 5 6 7 8 9 Tumors
. . . . . . . . . . . . . . . . . . . . . . . . . 49
. . . . . . . . . . . . . . . . . . . . . . . . . 49
. . . . . . . . . . . . . . . . . . . . . . . . . 48
. . . . . . . . . . . . . . . . . . . . . . . . . 48
. . . . . . . . . . . . . . . . . . . . . . . . . 49
. . . . . . . . . . . . . . . . . . . . . . . . . 48
. . . . . . . . . . . . . . . . . . . . . . . . . 48
. . . . . . . . . . . . . . . . . . . . . . . . . 49 1
+ 5 . . . . . . . . . . . . . . . . . . . . . . . . . 49 . . . . . . . . . . . . . . . . . . . . . . . . . 50 . . . . . . . . . . . . . . . . . . . . . . . . . 50 . . . . . . . . . . . . . . . . . . . . . . . . . 50
1
. . . . . . . . . . . . . . . . . . . . . . . . . 50 ~ ~~~
. . . . . . . . . . . . . . . . . . . . . . . . . 50 X 2
. . . . . . . . . . . . . . . . . . . . . . . . . 50 X X X X 5
4 . . . . . . . . . . . . . . . . . . . . . . . . . 49
3 + + + + + M + + + + + + + + + + + + + + + + + M + 46 . . . . . . . . . . . . . . . . . . . . . . . . . 50 x x X X x x x x 14
1 . . . . . . . . . . . . . . . . . . . . . . . . . 50 x x X X 6
. . . . . . . . . . . . . . . . . . . . . . . . . 50
. . . . . . . . . . . . . . . . . . . . . . . . . 49 X X 3
. . . . . . . . . . . . . . . . . . . . . . . . . 50
. . . . . . . . . . . . . . . . . . . . . . . . . 50
. . . . . . . . . . . . . . . . . . . . . . . . . 50 x x x x x x x x x x 39x x x x x x x x x x x x
X x x 7

96 Tricresyl Phosphate, NTP TR 433
TABLEA2 Individual Animal Tumor Pathology of Male Rats in the 2-Year Feed Study of Tricresyl Phosphate: 150 ppm (continued)
Number of Days on Study
Carcass ID Number
~ ~ ~~ ~~~~
Hematopoietic System Bone marrow Lymph node Lymph node, mandibular Lymph node, mesenteric Spleen Thymus
Integumentary System Mammary gland
Fibroadenoma Skin
Subcutaneous tissue, sarcoma
Musculoskeletal System Bone Skeletal muscle
Nervous System Brain
Oligodendroglioma benign Peripheral nerve Spinal cord
Respiratory System Lung Nose Trachea
Special Senses System Ear EyeZymbal's gland
Carcinoma
Urinary System Kidney Urinary bladder
Systemic Lesions Multiple organs
Leukemia mononuclear Mesothelioma malignant
2 4 4 4 5 5 6 6 6 6 6 7 7 7 7 7 7 7 7 7 7 7 7 7 7 6 5 8 9 2 5 1 1 2 3 8 0 1 2 2 2 2 2 2 2 3 3 3 3 3 9 4 8 1 9 3 4 8 4 8 2 1 1 2 2 9 9 9 9 9 0 0 0 0 0
6 5 5 6 6 5 6 6 5 6 6 5 6 6 6 5 5 5 5 5 5 5 5 5 5 1 9 9 1 0 8 0 3 8 0 1 8 2 0 0 8 8 8 8 8 8 9 9 9 9 8 7 5 7 2 2 8 0 4 6 9 1 2 7 9 3 5 6 7 8 9 0 1 2 3
. . . . . . . . . . . . . . . . . . . . . . . . . + + + +
. . . . . . . . . . . . . . . . . . . . . . . . .
. . . . . . . . . . . . . . . . . . . . . . . . .
. . . . . . . . . . . . . . . . . . . . . . . . . + + + + M + + + + M + + + + + + + M + + + + + + +
. . . . . . . . . . . . . . . . . . . . . . . .
. . . . . . . . . . . . . . . . . . . . . . . . . X
. . . . . . . . . . . . . . . . . . . . . . . . . +
. . . . . . . . . . . . . . . . . . . . . . . . . X
. . . . . . . . . . . . . . . . . . . . . . . . .
. . . . . . . . . . . . . . . . . . . . . . . . .
. . . . . . . . . . . . . . . . . . . . . . . . .
. . . . . . . . . . . . . . . . . . . . . . . . . + + + + + M + + + + + + + + + + + + + + + + + + +
+ + X
. . . . . . . . . . . . . . . . . . . . . . . . .
. . . . . . . . . . . . . . . . . . . . . . . . .
. . . . . . . . . . . . . . . . . . . . . . . . . x x x x x x x X
X

97 Lesions in Male Rats
TABLEA2 Individual Animal Tumor Pathology of Male Rats in the 2-Year Feed Study of Tricresyl Phosphate: 150 ppm (continued)
Number of Days on Study
Carcass ID Number
Hematopoietic System Bone marrow Lymph node Lymph node, mandibular Lymph node, mesenteric Spleen Thymus
Integumentary System Mammary gland
Fibroadenoma Skin
Subcutaneous tissue, sarcoma
Musculoskeletal System Bone Skeletal muscle
Nervous System Brain
Oligodendroglioma benign Peripheral nerve Spinal cord
Respiratory System Lung Nose Trachea
Special Senses System Ear EyeZymbal’s gland
Carcinoma
Urinary System Kidney Urinary bladder
Systemic Lesions Multiple organs
Leukemia mononuclear Mesothelioma malignant
7 1 7 1 1 1 7 7 1 1 7 1 1 1 1 7 7 1 1 1 1 1 7 1 1 3 3 3 3 3 3 3 3 3 3 3 3 3 3 3 3 3 3 3 3 3 3 3 3 3 0 0 0 0 0 0 0 0 0 0 0 0 0 0 0 0 0 0 0 0 0 0 0 0 0
5 5 5 5 6 6 6 6 6 6 6 6 6 6 6 6 6 6 6 6 6 6 6 6 6 Total 9 9 9 9 0 0 0 0 0 1 1 1 1 1 1 1 2 2 2 2 2 2 2 2 2 Tissues/ 4 6 8 9 0 1 3 4 5 0 1 2 3 4 5 6 0 1 3 4 5 6 1 8 9 Tumors
. . . . . . . . . . . . . . . . . . . . . . . . . 50 + 5
. . . . . . . . . . . . . . . . . . . . . . . . . 50
. . . . . . . . . . . . . . . . . . . . . . . . . 50
. . . . . . . . . . . . . . . . . . . . . . . . . 50
. . . . . . . . . . . . . . . . . . . . . . . . . 41
+ + + M + + + + + + + + + + + M + + + M + + + + + 45 x x 2
. . . . . . . . . . . . . . . . . . . . . . . . . 50 1
. . . . . . . . . . . . . . . . . . . . . . . . . 50 1
. . . . . . . . . . . . . . . . . . . . . . . . . 50 1
. . . . . . . . . . . . . . . . . . . . . . . . . 50
. . . . . . . . . . . . . . . . . . . . . . . . . 50
. . . . . . . . . . . . . . . . . . . . . . . . . 50
. . . . . . . . . . . . . . . . . . . . . . . . . 50
. . . . . . . . . . . . . . . . . . . . . . . . . 49
+
. . . . . . . . . . . . . . . . . . . . . . . . . 50
. . . . . . . . . . . . . . . . . . . . . . . . . 50
. . . . . . . . . . . . . . . . . . . . . . . . . 50 x x X X X X x x 16
1

98 Tricresyl Phosphate, NTP TR 433
TABLEA2 Individual Animal Tumor Pathology of Male Rats in the 2-Year Feed Study of Tricresyl Phosphate: 300 ppm
Number of Days on Study
Carcass ID Number
Alimentary System Esophagus Intestine large, colon Intestine large, rectum Intestine large, cecum Intestine small, duodenum Intestine small, jejunum
Mast c e l l tumor benign Intestine small, ileum Liver
Hepatocellular adenoma Mesentery
Liposarcoma Pancreas Salivary glands Stomach, forestomach Stomach, glandular Tongue
Cardiovascular System Heart
Endocrine System Adrenal cortex
Adenoma Adrenal medulla
Pheochromocytoma benign Bilateral, pheochromocytoma benign
Islets, pancreatic Adenoma
Parathyroid gland Pituitary gland
Pars distalis, adenoma Pars distalis, adenoma, multiple
Thyroid gland Bilateral, C-cell, adenoma C-cell, adenoma
General Body System None
Genital System Epididymis Preputial gland
Adenoma Prostate Seminal vesicle Testes
Bilateral, interstitial cell, adenoma Interstitial cell, adenoma
4 5 5 5 6 6 6 6 6 6 6 6 6 6 6 6 6 6 7 7 7 7 7 7 7 9 4 7 8 0 1 1 1 2 3 3 4 5 6 7 7 9 9 0 0 1 1 2 2 2 8 2 8 9 5 4 4 8 8 1 8 0 6 2 0 0 1 7 2 5 1 2 9 9 9
6 6 6 6 6 6 6 6 6 6 6 6 6 6 6 6 6 6 6 6 6 6 6 6 6 6 4 5 3 6 4 7 4 6 5 4 8 6 5 5 6 5 3 7 3 6 7 3 3 3 3 0 4 1 5 5 8 6 6 2 8 0 7 7 6 4 9 5 9 7 9 5 2 3 4
. . . . . . . . . . . . . . . . . . . . . . . . . + + + + A + + + + + + + + + + + + + + + + + + + + + + + + A + + + + + + + + + + + + + + + + + + + + + + + + A + + + + + + + + + + + + + + + + + + + + + + + + A + + + + + + + + + + + + + + + + + + + + + + + + A + + + + + + + + + + + + + + + + + + + +
+ + + + A + + + + + + + + + + + + + + + + + + + + . . . . . . . . . . . . . . . . . . . . . . . . .
+ + . . . . . . . . . . . . . . . . . . . . . . . . . + + + + M + + + + + + + + + + + + + + + + + + + + . . . . . . . . . . . . . . . . . . . . . . . . . . . . . . . . . . . . . . . . . . . . . . . . . .
. . . . . . . . . . . . . . . . . . . . . . . . .
. . . . . . . . . . . . . . . . . . . . . . . . .
. . . . . . . . . . . . . . . . . . . . . . . . . X X
. . . . . . . . . . . . . . . . . . . . . . . . . X
+ + + + M + + + + + M + + + + + + M + + + + + + + . . . . . . . . . . . . . . . . . . . . . . . . . X X
+ + + + M + + + + + + + + + + + + + + + + + + + + X
X X
. . . . . . . . . . . . . . . . . . . . . . . . .
. . . . . . . . . . . . . . . . . . . . . . . . . x x
. . . . . . . . . . . . . . . . . . . . . . . . .
. . . . . . . . . . . . . . . . . . . . . . . . .
. . . . . . . . . . . . . . . . . . . . . . . . . x x x x xx x x x x x x xx x xx xx x
X X X X

pheochromocytoma benign
adenoma
99 Lesions in Male Rats
TABLE A2 Individual Animal Tumor Pathology of Male Rats in the 2-Year Feed Study of Tricresyl Phosphate: '300 ppm (continued)
Number of Days on Study
Carcass ID Number
Alimentary System Esophagus Intestine large, colon Intestine large, rectum Intestine large, cecum Intestine small, duodenum Intestine small, jejunum
Mast cell tumor benign Intestine small, ileum Liver
Hepatocellular adenoma Mesentery
Liposarcoma Pancreas Salivary glands Stomach, forestomach Stomach, glandular Tongue
Cardiovascular System Heart
Endocrine System cortex Adrenal
Adenoma medulla Adrenal
Pheochromocytoma benign Bilateral,
Islets, pancreatic Adenoma
Parathyroid gland Pituitary gland
Pars distalis, adenoma Pars distalis, adenoma, multiple
Thyroid gland Bilateral, C-cell, adenoma C-cell, adenoma
General Body System None
Genital System Epididymis Preputial gland
Adenoma Prostate Seminal vesicle Testes
Bilateral,interstitialcell,adenoma Intelstitial
7 7 7 7 7 7 7 7 7 7 7 7 7 7 7 7 7 7 7 7 7 7 7 7 7 2 2 2 2 2 2 2 2 2 2 2 2 2 2 2 2 2 2 2 2 2 2 2 2 2 9 9 9 9 9 9 9 9 9 9 9 9 9 9 9 9 9 9 9 9 9 9 9 9 9
6 6 6 6 6 6 6 6 6 6 6 6 6 6 6 6 6 6 6 6 6 6 6 6 6 Total 3 3 3 4 4 4 4 4 4 5 5 5 5 5 6 6 6 6 7 7 7 7 7 7 7 Tissues/ 6 8 9 1 2 3 4 7 9 0 1 3 5 8 0 1 2 8 0 1 2 3 4 6 7 Tumors
. . . . . . . . . . . . . . . . . . . . . . . . . 50
. . . . . . . . . . . . . . . . . . . . . . . . . 49
. . . . . . . . . . . . . . . . . . . . . . . . . 49
. . . . . . . . . . . . . . . . . . . . . . . . . 49
. . . . . . . . . . . . . . . . . . . . . . . . . 49
. . . . . . . . . . . . . . . . . . . . . . . . . 49 X 1
. . . . . . . . . . . . . . . . . . . . . . . . . 49
. . . . . . . . . . . . . . . . . . . . . . . . . 50 X 1
+ + + + 6 X 1
. . . . . . . . . . . . . . . . . . . . . . . . . . 50
. . . . . . . . . . . . . . . . . . . . . . . . . 49
. . . . . . . . . . . . . . . . . . . . . . . . . 50
. . . . . . . . . . . . . . . . . . . . . . . . . 50 + + 2
. . . . . . . . . . . . . . . . . . . . . . . . . 50
+ + + . . . . . . . . . . . . . . . . . . . . . 49 X X X 3
. . . . . . . . . . . . . . . . . . . . . . . . . 50 X X 4
X 1 . . . . . . . . . . . . . . . . . . . . . . . . . 50
1 + + + M + + + + + + + + + + + + + + + + + + + + + 46 . . . . . . . . . . . . . . . . . . . . . . . . . 50
X 3 X 1
. . . . . . . . . . . . . . . . . . . . . . . . . 49 X 2
X x x x 6
. . . . . . . . . . . . . . . . . . . . . . . . . 50
. . . . . . . . . . . . . . . . . . . . . . . . . 50 2
. . . . . . . . . . . . . . . . . . . . . . . . . 50
. . . . . . . . . . . . . . . . . . . . . . . . . 50
. . . . . . . . . . . . . . . . . . . . . . . . . 50 x x xx xx x x x x x x x x x x x xx x x 41
X X cell, x x 8

100 Tricresyl Phosphate, NTPTR 433
TABLEA2 Individual Animal Tumor Pathology of Male Rats in the 2-Year Feed Study of Trieresyl Phosphate: 300 ppm (continued)
Number of Days on Study
Carcass ID Number
IIematopoietic System Bone marrow Lymph node Lymph node, mandibular Lymph node, mesenteric Spleen
Sarcoma Thymus
Integumentary System Mammary gland
Fibroadenoma Skin
Subcutaneous tissue, fibrosarcoma Subcutaneous tissue, lipoma
Musculoskeletal System Bone
NervousSystem Brain Peripheral nerve Spinal cord
Respiratory System Lung Nose
Squamous ce l l carcinoma Trachea
Special Senses System Ear
Pinna, fibrosarcoma EyeZymbal’s gland
Carcinoma
Urinary System Kidney Urinary bladder
~~~ ~~ ~
Systemic Lesions Multiple organs
Leukemia mononuclear
4 5 5 5 6 6 6 6 6 6 6 6 6 6 6 6 6 6 7 7 7 7 7 7 7 9 4 7 8 0 1 1 1 2 3 3 4 5 6 7 7 9 9 0 0 1 1 2 2 2 8 2 8 9 5 4 4 8 8 1 8 0 6 2 0 0 1 7 2 5 1 2 9 9 9
6 6 6 6 6 6 6 6 6 6 6 6 6 6 6 6 6 6 6 6 6 6 6 6 6 6 4 5 3 6 4 7 4 6 5 4 8 6 5 5 6 5 3 7 3 6 7 3 3 3 3 0 4 1 5 5 8 6 6 2 8 0 7 7 6 4 9 5 9 7 9 5 2 3 4
. . . . . . . . . . . . . . . . . . . . . . . . . + + + + +
. . . . . . . . . . . . . . . . . . . . . . . . .
. . . . . . . . . . . . . . . . . . . . . . . . .
. . . . . . . . . . . . . . . . . . . . . . . . . X
. . . . . . . . . . . . . . . . . . . . . . . . .
+ + + M + + + M + + M + + + + + + + + + + + M + + X X
. . . . . . . . . . . . . . . . . . . . . . . . . X
. . . . . . . . . . . . . . . . . . . . . . . . .
. . . . . . . . . . . . . . . . . . . . . . . . .
. . . . . . . . . . . . . . . . . . . . . . . . . + + + + + + + + + + + + + + M + + + + + + + + + +
. . . . . . . . . . . . . . . . . . . . . . . . .
. . . . . . . . . . . . . . . . . . . . . . . . . X
. . . . . . . . . . . . . . . . . . . . . . . . .
+ X
+ + X
. . . . . . . . . . . . . . . . . . . . . . . . .
. . . . . . . . . . . . . . . . . . . . . . . . .
. . . . . . . . . . . . . . . . . . . . . . . . . x x x x xx xx x x x x x x x

101 Lesions in Male Rats
TABLE A2 Individual Animal Tumor Pathology of Male Rats in the 2-Year Feed Study of Tricresyl Phosphate: 300 ppm (continued)
Number of Days on Study
Carcass ID Number
IIematopoietic System Bone marrow Lymphnode Lymph node, mandibular Lymph node, mesenteric Spleen
Sarcoma Thymus
Integumentary System Mammary gland
Fibroadenoma Skin
Subcutaneous tissue, fibrosarcoma Subcutaneous tissue, lipoma
Musculoskeletal System Bone
Nervous System Brain Peripheral newe Spinal cord
Respiratory System Lung Nose
Squamous cell carcinoma Trachea
Special Senses System Ear
Pinna, fibrosarcoma EyeZymbal’sgland
Carcinoma
Urinary System Kidney Urinary bladder
Systemic Lesions Multiple organs
Leukemia mononuclear
7 7 7 7 7 7 7 7 7 7 7 7 7 7 7 7 7 7 7 7 7 7 7 7 7 2 2 2 2 2 2 2 2 2 2 2 2 2 2 2 2 2 2 2 2 2 2 2 2 2 9 9 9 9 9 9 9 9 9 9 9 9 9 9 9 9 9 9 9 9 9 9 9 9 9
6 6 6 6 6 6 6 6 6 6 6 6 6 6 6 6 6 6 6 6 6 6 6 6 6 Total 3 3 3 4 4 4 4 4 4 5 5 5 5 5 6 6 6 6 7 7 7 7 7 7 7 Tissues/ 6 8 9 1 2 3 4 7 9 0 1 3 5 8 0 1 2 8 0 1 2 3 4 6 7 Tumors
. . . . . . . . . . . . . . . . . . . . . . . . . 50 5
. . . . . . . . . . . . . . . . . . . . . . . . . 49
. . . . . . . . . . . . . . . . . . . . . . . . . 50
. . . . . . . . . . . . . . . . . . . . . . . . . 50 1
. . . . . . . . . . . . . . . . . . . . . . . . . 49 ~~ ~~ ~~~ ~ ~~ ~~ ~ ~~
+ + + + M + + + + + + + + + + + + + + + + + + + + 45 2
. . . . . . . . . . . . . . . . . . . . . . . . . 50 1
X 1 ~
. . . . . . . . . . . . . . . . . . . . . . . . . 50
. . . . . . . . . . . . . . . . . . . . . . . . . 50
. . . . . . . . . . . . . . . . . . . . . . . . . 50
. . . . . . . . . . . . . . . . . . . . . . . . . 49
. . . . . . . . . . . . . . . . . . . . . . . . . 50
. . . . . . . . . . . . . . . . . . . . . . . . . 50 1
. . . . . . . . . . . . . . . . . . . . . . . . . 50
1
. . . . . . . . . . . . . . . . . . . . . . . . . 50
. . . . . . . . . . . . . . . . . . . . . . . . . 50
. . . . . . . . . . . . . . . . . . . . . . . . . 50 x x x x X 20

102 Tricresyl Phosphate, NTP TR 433
TABLEA3 Statistical Analysis of Primary Neoplasms in Male Rats. in the 2-Year Feed Study of Tricresyl Phosphate
Adrenal Cortex: Adenoma Overall ratea Adjusted rateb Terminal rate' First incidence (days) Life table testd Logistic regression testd Cochran-Armita e testd Fisher exact test 5 Adrenal Medulla: Benign Pheochromocytoma Overall rate Adjusted rate Terminal rate First incidence (days) Life table test Logistic regression test Cochran-Armitage test Fisher exact test
Mammary Gland: Fibroadenoma Overall rate Adjusted rate Terminal rate First incidence (days) Life table test Logistic regression test Cochran-Armitage test Fisher exact t es t
Pancreatic Islets. Adenoma Overall rate Adjusted rate Terminal rate First incidence (days) Life table test Logistic regression test Cochran-Armitage test Fisher exact test
Pancreatic Islets: Adenoma or Carcinoma Overall rate Adjusted rate Terminal rate First incidence (days) Life table test Logistic regression test Cochran-Armitage test Fisher exact test
0 PPm
1/51 (2%) 3.1% 1/32 (3%) 729 (T )P=O.197 P=O.208 P=O.227
5/51 (10%) 15.6% 5/32 (16%) 729 (T )P=O.510 P=O.547 P=0.541N
O b 1 (0%) 0.0% OB2 (0%) -e
P=O.312 P=O.301 P=O.319
2/51 (4%) 6.0% 1/32 (3%) 722 P =0.6OON P=0.595N P=0.562N
2/51 (4%) 6.0% 1/32 (3%) 722 P=0.519N P=0.516N P=0.481N
75 PPm
2/50 (4%) 6.0% 1/30(3%) 690 P=O.479 P=O.480
P=O.492
7/50 (14%) 20.6% 5/30 (17%) 586 P =0.339 P=O.347
P=O.366
3/50 (6%) 7.5% 1/30 (3%) 498 P=O.119 P=O.106
P=O.118
0/50 (0%) 0.0% 0/30(0%) -P=0.257N P=0.255N
P=0.252N
1/50 (2%) 3.3% I n 0 (3%) 729 ( T )P=0.526N P=0.529N
P=0.508N
150 ppm
2/50 (4%) 5.3% 1/35 (3%) 701 P=O.527 P=O.503
P =0.492
9/50 (18%) 24.3% 7/35 (20%) 722 P=O.246 P =0.229
P=O.183
2/50 (4%) 5.7% 2l35 (6%) 729 (T>P=O.258 P=O.258
P=O.243
3/49 (6%) 8.3% 2/35 (6%) 722 P=O.539 P=O.521
P=O.481
3/49 (6%) 8.3% 2/35 (6%) 722 P=O.539 P=O.521
P=O.481
300 ppm
3/50 (6%) 10.7% 3/28 (11%) 729 (TIP=O.257 P=O.257
P=O.301
5/50 (10%) 16.5% 4/28 (14%) 656 P=O.549 P=O.564
P=O.617
2/50 (4%) 5.4% 0/28 (0%) 614 P=0.232 P=O.220
P = O . 2 4 3
1/50 (2%) 3.6% 1/28 (4%) 729 ( T )P=0.553N P=0.550N
P=0.508N
1/50 (2%) 3.6% 1/28 (4%) 729 (T) P=0.553N P=0.550N
P=0.508N

103 Lesions i n Male Rats
TABLEA3 Statistical Analysis of Primary Neoplasms in Male Rats in the 2-Year Feed Study of Tricresyl Phosphate (continued)
Pituitary Gland (Pars Distalis): Overall rate Adjusted rate Terminal rate First incidence (days) Life table test Logistic regression test Cochran-Armitage test Fisher exact test
PreputialGland Adenoma Overall rate Adjusted rate Terminal rate
Adenoma
P-0.178
0 PPm
8/51 (16%) 22.8% 6t32 (19%) 647 P=0.168N P=0.129N P=0.132N
4/50 (8%) 11.6% 3/31 (10%)
75 PPm
12/50 (24%) 38.1% 11/30 (37%) 614 P=O.176
P=O.213
3/49 (6%) 9.1% 2/29 (7%)
150 ppm
14/50 (28%) 34.9% lot35 (29%) 454 P=O.156 P=O.l06
P=O.104
3/49 (6%) 8.6% 3/35 (9%)
300 PPm
4/50 (8%) 12.5% 3/28 (11%) 498 P=0.243N P=0.187N
P=0.188N
2/50 (4%) 6.9% I n s (4%)
First incidence (days) 558 614 Life table test P=0.294N P=0.529N
729 (T) 712 P=0.448N P=0.381N
Logistic regression test P =0.270N P=0.512N P=0.506N P=0.335N Cochran-Annitage test P=0.272N Fisher exact test P=0.511N P=0.511N P =0.339N
Preputial Gland: Adenoma or Carcinoma Overall rate 4/50 (8%) 4/49 (8%) 3/49 (6%) 2/50 (4%) Adjusted rate 12.4% 11.6% 8.6% 6.9% Terminal rate 3/31 (10%) 3/29 (10%) 3/35 (9%) 1/28(4%)First incidence (days) 558 614 712729 (T)Life table test P=0.253N P=O.612 P=0.448N P-0.381N Logistic regression test P=0.231N P=O.631 P=0.506N P=0.335N Cochran-Armitage test P=0.232N Fisher exact test P=O.631 P=0.511N P=0.339N
Skin: Keratoacanthoma, Basal Cell Adenoma, or Squamous Cell Carcinoma Overall rate 4/51 (8%) 0/50 (0%) 0/50 (0%) 0/50 (0%)Adjusted rate 11.8% 0.0% 0.0% 0.0% Terminal rate 3/32 (9%) on0 (0%) 0/35 (0%) o m (0%)First incidence (days) 701 - -
Life table test P=0.022N P=0.075N P=0.055N P=0.083N Logistic regression test P=0.021N P=0.071N P =0.060N P=0.076N Cochran-Armitage test P=0.021N Fisher exact test P=0.061N P=0.061N P=0.061N
Testes: Adenoma Overall r a t e 48/51 (94%) 45/50 (90%) 46/50 (92%) 49/50 (98%) Adjusted rate 100.0% 93.7% 100.0% 100.0% Terminal rate 32/32 (100%) 27/30 (90%) 35/35 (100%) 2am (100%)First incidence (days) 455 478 491 542 Life table tes t P=O.177 P=0.561N P=0.216N P=O.189 Logistic regression test P =0.346 P=0.314N P=0.602N P=0.781N Cochran-Armitage test P=O.185 Fisher exact test P =0.346N P=0.489N P=0.316
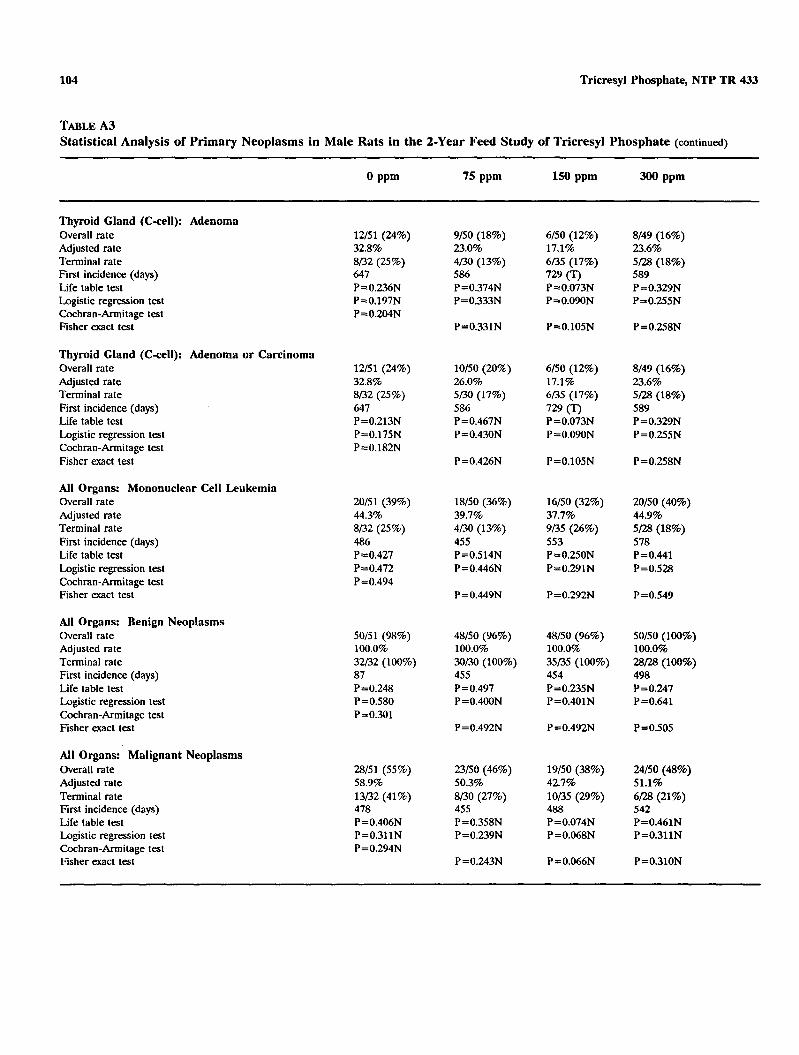
104 Tricresyl Phosphate, NTP TR 433
TABLEA3 Statistical Analysis of Primary Neoplasms in Male Rats in the 2-Year Feed Study of Tricresyl Phosphate (continued)
Thyroid Gland (C-cell): Adenoma Overall rate Adjusted rate Terminal rate First incidence (days) Life table test Logistic regression test Cochran-Armitage test Fisher exact test
Thyroid Gland (Ccell): Adenoma or Carcinoma Overall rate Adjusted rate Terminal rate First incidence (days) Life table test Logistic regression test Cochran-Armitage test Fisher exact test
All Organs: Mononuclear Cell Leukemia Overall rate Adjusted rate Terminal rate First incidence (days) Life table test Logistic regression test Cochran-Armitage test Fisher exact test
All Organs: Benign Neoplasms Overall rate Adjusted rate Terminal rate First incidence (days) Life table test Logistic regression test Cochran-Armitage test Fisher exact test
All Organs: Malignant Neoplasms Overall rate Adjusted rate Terminal rate First incidence (days) Life table test Logistic regression test Cochran-Armitage test Fisher exact test
0 PPm
12/51 (24%) 32.8% 8/32 (25%) 647 P=0.236N P=0.197N P=0.204N
12/51 (24%) 32.8% 8/32 (25%) 647 P=0.213N P=0.175N P=0.182N
20/51 (39%) 44.3% 8/32 (25%) 486 P=O.427 P=O.472 P=0.494
50/51 (98%) 100.0% 32/32 (100%) 87 P=O.248 P=O.580 P=O.301
28/51 (55%) 58.970 13/32 (41%) 478 P=0.406N P=0.311N P=0.294N
75 PPm
9/50 (18%) 23.0% 4/30 (13%) 586 P=0.374N P=0.333N
P=0.331N
10/50 (20%) 26.0% 5/30 (17%) 586 P=0.467N P=0.430N
P=0.426N
18/50 (36%) 39.7% 4/30 (13%) 455 P=0.514N P=0.446N
P=0.449N
48/50 (96%) 100.0% 30/30(100%) 455 P=0.497 P=0.400N
P =0.492N
23/50 (46%) 50.3% 8/30 (27%) 455 P=0.358N P=0.239N
P=0.243N
150 PPm
6/50 (12%) 17.1% 6/35 (17%) 729 ( T )P=0.073N P=0.090N
P=0.105N
6/50 (12%) 17.1% 6i35 (17%) 729 ( T )P=0.073N P=0.090N
P=O.lOSN
16/50 (32%) 37.7% 9/35 (26%) 553 P=0.250N P=0.291N
P=0.292N
48/50 (96%) 100.0% 35/35 (100%) 454 P=0.235N P=0.401N
P =0.492N
19/50 (38%) 42.7% 10/35 (29%) 488 P=0.074N P =0.068N
P =0.066N
300 ppm
8/49 (16%) 23.6% 5/28 (18%) 589 P=0.329N P=0.255N
P=0.258N
8/49 (16%) 23.6% 5/28 (18%) 589 P=0.329N P=0.255N
P=0.258N
20/50 (40%) 44.9% 5/28 (18%) 578 P=O.441 P=O.528
P=O.549
sob0 (100%) 100.0% 28/28 (100%) 498 P=O.247 P = O . 6 4 1
P=O.505
24/50 (48%) 51.1% 6/28 (21%) 542 P=0.461N P=0.311N
P=0.310N

105 Lesions in Male Rats
TABLEA3 Statistical Analysis of Primary Neoplasms in Male Rats inthe 2-Year Feed Study of Tricresyl Phosphate (continued)
All Organs: Benign or Malignant Neoplasms Overall rate 51/5149/5049/50(100%)(98%)(98%) 50/50 (100%) Adjusted rate 100.0% 100.0% 100.0% 100.0% Terminal rate 32/32 (100%) 30m (100%) 35/35(100%) 28/28 (100%) First incidence (days) 455 87 454 498 Life table test P=O.497 P=O.315 P=0.243N P=O.302
fLogistic regression test P=0.420N P=0.301N P=0.305N Cochran-Armitage test P=O.598 Fisher exact tes t P=0.495N P=0.495N P=1.000N
(T)Terminal sacrifice a Number of neoplasm-bearing animals/number of animals examined. Denominator is number of animals examined microscopically for adrenal gland,
pancreas, pi tu i ta ry gland, preputial gland, testes,and thyroid gland; for other tissues, denominator is number of animals necropsied. Kaplan-Meier estimated neoplasm incidencea t the end of the study after adjustment for intercurrent mortality Observed incidence at terminal kill Beneath the control incidence are the P values associated wi th the trend test. Beneath the dosed group incidence are the P values corresponding to painvise comparisons between the controls a n d t h a t dosed group. The life table analysis regards neoplasms in animals dying prior to terminal kill as being (directly or indirectly) the cause of death. The logistic regression test regards these lesions as nonfatal. The Cochran-hitage and Fisher exact tests compare directly the overall incidence rates. For a l l tests, a negative trend or a lower incidence i n a dose group is indicated by N.
e Not applicable;noneoplasms i n a n i m a l group Value of statisticcannot be computed

106 Tricresyl Phosphate, NTP TR 433
TABLEA4 Summary of the Incidence of Nonneoplastic Ixsions in Male Rats in the 2-Year Feed Study of Tricresyl Phosphatea
Disposition Summary Animals initially in study 95 95 95 95 3 M d inrcrim e w h & m b 15 15 15 15 P M d intaim e w h & m b 14 15 15 15 I S ” intaim e w h & m b 15 15 15 15 Early deaths
Moribund 14 16 11 16 Natural deaths 5 4 4 6
SuMvors Died last week o f study 1 Terminal sacrifice 31 30 35 28
Animals examined microscopically 95 95 95 95
3-Month Interim Evaluation Cardiovascular System Heart (10) (10) (10) (10)
Myocardium, degeneration 3 (30%) 3 (30%) 5 (50%) 3 (30%)
Genital System Epididymis
Hypospermia Preputial gland
Inflammation, chronic Testes
Hypospermia Seminiferous tubule, atrophy
Systems Examined With No Lesions Observed Alimentary System Endocrine System General Body System Hematopoietic System Integumentary System Musculoskeletal System Nervous System Respiratory System Special Senses System Urinary System
~~~~ ~ ~~ ~ ~~ ~~ ~~ ~ ~~ ~ ~~ ~ _ _
a Number o f animals examined microscopically at site and number o f animals with lesion Includes up t o five animals per dose group subjectedt o total body perfusion for special neuropathology

107 Lesions i n Male Rats
TABLEA4 Summary of the Incidence of Nonneoplastic Lesions in Male Rats in the 2-Year Feed Studyof Tricresyl Phosphate (continued)
9-Month Interim Evalualion Nervous System Spinal cord ( 5 ) ( 5 )
cyst 2 (40%)
Systems Examined Wirh No Lesions Oblserved Alimentary System Cardiovascular System Endocrine System General Body System Genital System Hematopoietic System Integumentary System Musculoskeletal System Respiratory System Special Senses System Urinary System
IS-Month Interim Evaluation Nervous System Spinal cord ( 5 )
cyst 1 (20%)
Sysmns Examined With No Lesiotrr Observed Alimentary System Cardiovascular System Endocrine System General Body System Genital System IIernntopoietic System Integumentary System Musculoskeletal System Respiratory System Special Senses System Urinary System
&Year Study Alimentary System Intestine large. colon (50 ) (49) (49) (49)
Parasite metazoan 1 (2%) 1 (2%) 2 (4%) 1 (2%)Intestine large, rectum (51) (49) (48) (491
Parasite metazoan 6 (12%) 1 (2%) 8 (17%) 8 (16%)Intestine small, jejunum (49) (49) (48) (49)
Ulcer 1 (?o/o) 1 (2%)

108 Tricresyl Phosphate, NTP TR 433
TABLEA4 Summary of the Incidence of Nonneoplastic Lesions in Male Rats in the 2-Year Feed Study of Tricresyl Phosphate (continued)
o ppm 75 ppm 150 ppm 300 ppm
2-Year Study (continued) Alimentary System (continued) Intestine small, ileum
Ulcer Venule, parasite metazoan
Liver Angiectasis Basophilic focus Clear cell focus Degeneration, cystic Eosinophilic focus Fatty change Hepatodiaphragmatic nodule Hyperplasia Mixed cell focus Necrosis
Mesentery Inflammation, chronic Artery. inflammation. chronic Fat. necrosis
Pancreas Acinus, atrophy Acinus. hyperplasia
Stomach. forestomach Ulcer
Stomach, glandular Ulcer
Tongue Epithelium, hyperplasia Mucosa. epithelium, hyperplasia
(49)
1 (2%) (50)
2 (4%) 1 (2%) 6 (12%) 7 (14%) 1 (2%) 5 (10%)
1 (2%) 1 (2%)
(4)
3 (75%) (51)
20 (39%)
(51) 2 (4%)
(51) 2 (4%)
(49)
(50)
7 (14%) 1 (2%) 1 (2%) 4 (8%) 1 (2%) 4 (8%) 2 (4%) 1 (2%)
(8) 1 (13%)
7 (88%) (50)
23 (46%) 2 (4%)
(50)
(50) 2 (4%)
(48) 1 (2%)
(49)
6 (12%) 2 (4%) 7 (14%) 7 (14%) 1 (2%) 5 (10%) 2 (4%) 1 (2%) 2 (4%)
(5)
4 (80%) (49)
22 (45%)
(50) 1 (2%)
(50) 3 (6%)
(1) 1 (100%)
(49)
(50) 1 (2%) 7 (14%) 1 (2%) 5 (10%) 6 (12%)
5 (10%)
1 (2%) 2 (4%)
(6)
1 (17%) 4 (67%)
(50) 19 (38%)
(50)
(50) 3 (6%)
(2)
2 (100%)
Cardiovascular System Heart
Artery. inflammation. chronic Atrium, dilatation Atrium. thrombosis Intima. hyperplasia Myocardium, degeneration
(51)
1 (2%) 2 (4%) 1 (2%)
38 (75%)
(50) 1 (2%)
1 (2%)
42 (84%)
(50)
2 (4%)
40 (80%)
(50)
1 (2%)
38 (76%)
Endocrine System Adrenal cortex
Hyperplasia Adrenal medulla
Hyperplasia Islets. pancreatic
Hyperplasia Pituitary gland
Cyst Pars distalis, degeneration. focal Pars distalis. hyperplasia Pars distalis, inflammation, chronic
(50) 7 (14%)
(50) 10 (20%)
(51) 1 (2%)
(51) 1 (2%)
2 (4%)
(49) 15(31%)
(50) 4 (8%)
(50) 2 (4%)
(50) 2 (4%) 1 (2%) 5 (10%) 1 (2%)
(50) 8 (16%)
(50) 6 (12%)
(49)
(50)
8 (16%)
(49) 11 (22%)
(50) 10 (20%)
(50) 3 (6%)
(50) 1 (2%)
10 (20%)

109 Lesions in Male Rats
TABLEA4 Summary of the Incidence of Nonneoplastic Lesions in Male Rats in the 2-Year Feed Study of Tricresyl Phosphate (continued)
150 ppm0 PPm 75 PPm 300 PPm
2-Year Stlldy (continued) Endocrine System (continued) Thyroid gland (51) (50) (50) (49)
C-cell, hyperplasia 25 (49%) 34 (68%) 39 (78%) 33 (67%) Follicle, dilatation 3 (6%)
General Body System None
Genital System Preputial gland
Hyperplasia Inflammation. chronic
Prostate Abscess Inflammation, chronic
Seminal vesicle Inflammation, chronic
Testes Interstitial cell, hyperplasia Seminiferous tubule, atrophy
Hematopoietic System Lymph node, mandibular (49) (50 )
Hyperplasia, lymphoid Lymph node, mesenteric (51) (49)
CystInflammation, granulomatous 1 (2%)
Spleen (50) (50 )Congestion 1 (2%) Fibrosis 3 (6%) 2 (4%) 2 (4%) 6 (12%) Hematopoietic cell proliferation 1 (2%) 2 (4%) Hyperplasia, lymphoid 1 (2%) Infarct 2 (4%) Capsule, inflammation, chronic 1 (2%)
Integumentary System Mammary gland
Hyperplasia, cystic Skin
Abscess Acanthosis Cyst epithelial inclusion Hyperkeratosis Inflammation, chronic Ulcer 1 (2%) 1 (2%) 1 (2%)Dermis, mineralization I (2%)
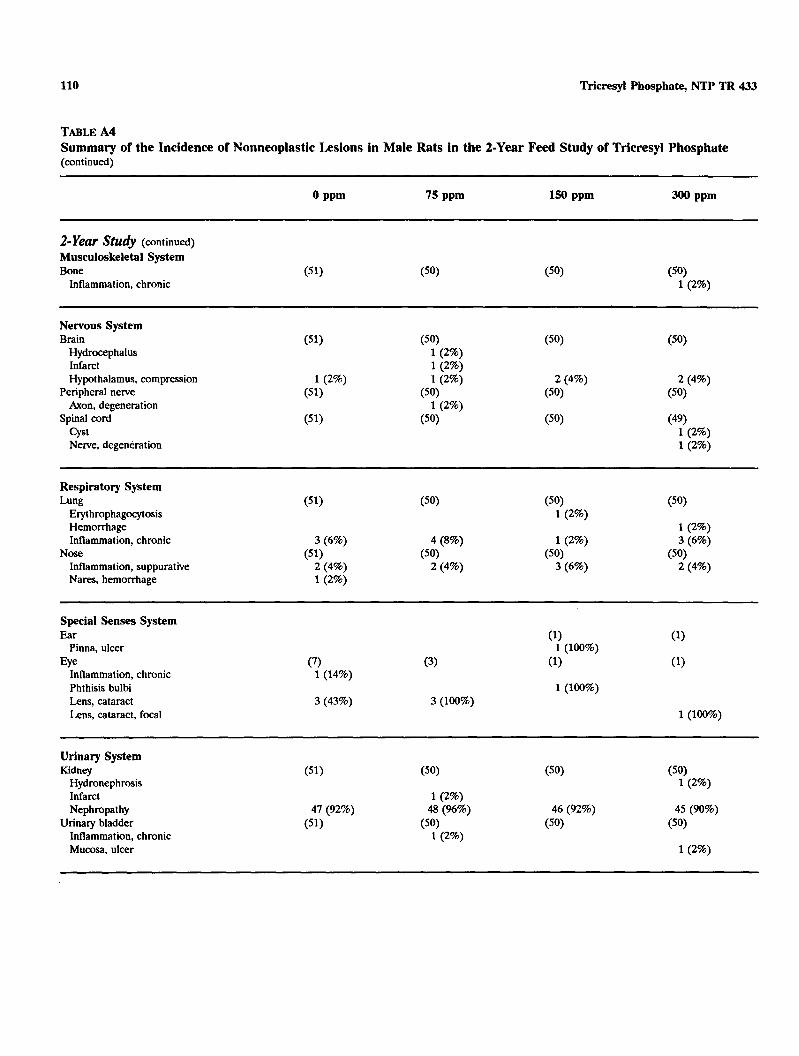
110 Tricresyl Phosphate, NTP TR 433
TABLEA4 Summary of the Incidence of Nonneoplastic Lesions in Male Rats in the 2-Year Feed Studyof Tricresyl Phosphate (continued)
2-Year Study (continued) Musculoskeletal System Bone
Inflammation, chronic
Nervous System Brain
Hydrocephalus Infarct Hypothalamus, compression
Peripheral nerve Axon, degeneration
Spinal cord CystNerve, degeneration
Respiratory System Lung
Erythrophagocytosis Hemorrhage Inflammation, chronic
NO% Inflammation, suppurative Nares, hemorrhage
Special Senses System Ear (1) (1)
Pinna, ulcer 1 (100%) Eye (7) (3) (1) (1)
Inflammation, chronic 1 (14%) Phthisis bulbi 1 (100%) Lens, cataract 3 (43%) 3 (100%) Lens, cataract, focal 1 (100%)
Urinary System Kidney
Hydronephrosis Infarct Nephropathy
Urinary bladder Inflammation, chronic Mucosa, ulcer

111
APPENDIX B SUMMARY OF LESIONS IN FEMALE RATS
IN THE 2-YEAR FEED STUDY OF TRICRESYL PHOSPHATE
TABLEB l Summary of the Incidence of Neoplasms in Female Rats in the 2-Year Feed Study of Tricresyl Phosphate ............................. 113
TABLE B2 Individual Animal Tumor Pathology of Female Rats in the 2-Year Feed Study of Tricresyl Phosphate ............................. 118
TABLEB3 Statistical Analysis of Primary Neoplasms in Female Rats in the 2-Year Feed Study of Tricresyl Phosphate ............................. 134
TABLE B4 Historical Incidence of Leukemias in Untreated Female F344/N Rats .............. 137 TABLEB5 Summary of the Incidence of Nonneoplastic Lesions in Female Rats
in the 2-Year Feed Study of Tricresyl Phosphate ............................. 138

Lesions in Female Rats 113
Summary of the Incidence of Neoplasms in Female Rats in the 2-Year Feed Study TABLEB1
of Tricresyl Phosphatea
0 PPm 75 PPm 150 ppm 300PPm
I 5 M o n t h buezim cvoluotianb PJuonthinleJimcvoluotianb 3-JuonthinleJimcvolirolionb Animals initially in study Disposition Summary
Natural deaths Moribund Accidental deaths
Early deaths
Terminal sacrifice Died last week of study
Survivors
Missing
14 15 15 95
3 14
34
13 14 15 95
3 12
37 1
15 15 15 95
5 15
15 15 14 95
5 18
1
1 26
Animals examined microscopically 95 95 95 94
3-Month Interim Evaluation
Mammary gland Integumentary System
Adenoma
Urinary System Special Senses System Respiratory System Nervous System Musculoskeletal System Hematopoietic System Genital System General Body System Endocrine System Cardiovascular System Alimentary System Systems Examined Wirh No Neoplasms Observed
%Month Znterim Evaluation
Mammary gland Integumentary System
Adenocarcinoma
Brain Nervous System
Astrocytoma malignant

114 Tricresyl Phosphate, NTP TR 433
TABLEn l Summary of the Incidence of Neoplasms in Female Rats in the 2-Year Feed Study of Tricresyl Phosphate (continued)
75 PPm 150 ppm
9-Month Interim Evaluation (continued) Systems Examined Wirh No Neoplasms Observed Alimentary System Cardiovascular System Endocrine System General Body System Genital System IIematopoietic System Musculoskeletal System Respiratory System Special Senses System Urinary System
15-Month Interim Evaluation Endocrine System P i t u i t a r y gland
Pars distalis, adenoma Thyroid gland
C-cell, adenoma Follicle, adenoma
Genital System Uterus
Polyp stromal
Integumentary System Skin
Fibrosarcoma Trichoepithelioma
Systems Examined With No Neoplasms Observed Alimentary System Cardiovascular System General Body System Hematopoietic System Musculoskeletal System Nervous System Respiratory System Special Senses System Urinary System

0 PPm 75 PPm 150 ppm 300 ppm
2-Year Study Alimentary System Liver Mesentery
Histiocytic sarcoma
(51) (3)
(53) (7)
1 (14%)
(50) (4)
Tooth Gingiva, squamous cell carcinoma
(1)1 (100%)
(1)
Cardiovascular System Heart
Histiocytic sarcoma Rhabdomyoma
Endocrine System Adrenal cortex
Adenoma (53)
1 (2%) Adrenal medulla
Pheochromocytoma malignant (53)
Pheochromocytomabenign 1 (2%) 2 (4%) Bilateral, pheochromocytoma benign
Islets, pancreatic Adenoma
(51) (53)
Carcinoma 1 (2%) P i t u i t a r y gland
Pars distalis, adenoma (51)
30 (59%) (53)
25 (47%) (50)
23 (46%) Thyroid gland
Bilateral, C-cell, adenoma (51)
1 (2%) (53) (50)
C-cell, adenocarcinoma C-cell, adenoma 8 (16%) 7 (13%) 2 (4%)
1 (2%) 11 (22%)
Follicle, adenoma 1 (2%) 1 (2%)
General Body System None
Genital System Clitoral gland
Adenoma Carcinoma Bilateral, adenoma
(51) 1 (2%) 1 (2%)
(53)2 (4%) 1 (2%) 2 (4%)
Ovary Adenoma Granulosa cell tumor benign Granulosa-theca tumor malignant Granulosa-theca tumor benign
Uterus Adenocarcinoma
(51)1 (2%) 1 (2%)
(51)1 (2%)
(53)
1 (2%) 1 (2%)
(50) (50)
Leiomyosarcoma Polyp stromal 6 (12%) 1 (2%)
1 (2%) 8 (16%) 9 (18%)
115 Lesions in Female Rats
TABLEB1 Summary of the Incidence of Neoplasms in Female Rats in the 2-Year Feed Study of Tricresyl Phosphate (continued)

2-Year Study (continued) Hematopoietic System Lymph node Lymph node, mandibular
Squamous cell carcinoma, metastatic, skin
(2) (51)
Lymph node, mesenteric Spleen
(51) (51)
Integumentary System Mammary gland
Adenoma (49)
2 (4%) (53)
Adenoma, multiple 1 (2%) Fibroadenoma 13 (27%) 13 (25%) 18 (36%) 14 (29%) Fibroadenoma, multiple 2 (4%) 3 (6%) 3 (6%) 1 (2%)
Skin Fibrosarcoma
(51) (53) (50)1 (2%)
(50)
Squamous cell carcinoma 1 (2%) 1 (2%) Subcutaneous tissue, fibroma 1 (2%) Subcutaneous tissue, fibrous histiocytoma 1 (2%)
Musculoskeletal System Bone
Osteosarcoma Skeletal muscle
Hemangioma
Nervous System Brain Spinal cord
Hemangiosarcoma
Respiratory System Lung
Alveolar/bronchiolar adenoma (51)
1 (2%) (53) (50 ) (50)
1 (2%) Alveolar/bronchiolar carcinoma 1 (2%) 1 (2%) Histiocytic'sarcoma 1 (2%) Pheochromocytoma malignant, metastatic,
adrenal medulla 1 (2%) Nose
Chondrosarcoma (51)
1 (2%) (53) (50) (50)
Special Senses System Ear
Pinna, fibrosarcoma (1)1 (100%)
Zymbal's gland Carcinoma
(2)2 (100%)
116 Tricresyl Phosphate, NTP TR 433
TABLEB1 Summary of the Incidence of Neoplasms in Female Rats in the 2-Year Feed Study of Tricresyl Phosphate (continued)

study (continued) Urinary System Kidney Urinary bladder
Systemic Lesions Multiple organs'
Histiocytic sarcoma (51) (53)
1 (2%) (50) (50 )
Leukemia mononuclear 8 (16%) 8 (15%) 13 (26%) 15 (30%)
Neoplasm Summary Total animalsw i t h primary neoplasmsd
3-Month interim evaluation 1 9-Month interim evaluation 1 1 15-Month interim evaluation 2 3 5 2 2-Year study 47 39 43 46
Total primary neoplasms 3-Month interim evaluation 1 9-Month interim evaluation 1 1 15-Month interim evaluation 2 3 5 2 2-Year study 82 74 84 87
Total animals with benign neoplasms 3-Month interim evaluation 1 15-Month interim evaluation 2 3 4 2 2-Year study 45 32 38 42
Total benign neoplasms 3-Month interim evaluation 1 15-Month interim evaluation 2 3 4 2 2-Year study 69 59 67 66
Total animals wi th malignant neoplasms 9-Month interim evaluation 1 1 15-Month interim evaluafion 1 2-Year study 13 15 17 20
Total malignant neoplasms 944011th interim evaluation 1 1 15-Month interim evaluation 1 2-Year study 13 15 17 21
Total animals with metastatic neoplasms 2-Year study 2
Total metastatic neoplasms 2-Year study 2
a Number o f animals examined microscopically at site a n d number o f animalswi th neoplasm Includes up to five animals per dose group subjected to total body perfusion for special neuropathology Number of animals wi th any tissue examined microscopically Primaryneoplasms: a l l neoplasms except metastatic neoplasms
117 Lesions in Female Rats
TABLEB1 Summary of the Incidence of Neoplasms in Female Rats in the 2-Year Feed Study of Tricresyl Phosphate(continued)

118 Tricresyl Phosphate, NTP TR 433
TABLE B2 Individual Animal Tumor Pathology of Female Rats i n the 2-Year Feed Study of Tricresyl Phosphate: 0 ppm
Number of Days on Study
Carcass ID Number
Alimentary System Esophagus Intestine large, colon Intestine large, rectum Intestine large, cecum Intestine small, duodenum Intestine small, jejunum Intestine small, ileum Liver Mesentery Pancreas Salivary glands Stomach, forestomach Stomach, glandular Tooth
Gingiva, squamous cell carcinoma
Cardiovascular System Heart
Endocrine System Adrenal cortex
Adenoma Adrenal medulla
Pheochromocytoma benign Islets, pancreatic Parathyroid gland Pituitary gland
Pars distalis, adenoma Thyroid gland
Bilateral, Ce l l , adenoma C-cell, adenoma
General Body System None
Genital System Clitoral gland
Adenoma Carcinoma
ovaryAdenoma Granulosa cell tumor benign
Uterus Adenocarcinoma Polyp stromal
+: Tissueexaminedmicroscopically A: Autolysisprecludesexamination
1 4 4 5 5 5 5 5 5 5 6 6 6 6 6 7 7 7 7 7 7 7 7 7 7 3 1 8 0 3 5 5 6 7 9 1 3 5 6 7 1 2 3 3 3 3 3 3 3 3 4 2 8 2 7 3 1 4 8 2 9 8 2 7 5 2 2 1 2 2 2 2 2 2 2
1 2 7 7 7 7 7 7 7 1 7 1 1 1 7 1 1 7 7 1 7 7 1 1 7 7 4 5 1 3 3 7 6 6 6 4 7 7 3 5 5 3 3 3 3 3 3 4 4 4 2 0 2 7 2 9 5 4 3 0 2 1 0 8 5 1 3 1 4 5 6 7 0 1 3
. . . . . . . . . . . . . . . . . . . . . . . . .
. . . . . . . . . . . . . . . . . . . . . . . . .
. . . . . . . . . . . . . . . . . . . . . . . . .
. . . . . . . . . . . . . . . . . . . . . . . . .
. . . . . . . . . . . . . . . . . . . . . . . . . + + + + + A + + + + + + + + + + + + + + + + + + + . . . . . . . . . . . . . . . . . . . . . . . . . . . . . . . . . . . . . . . . . . . . . . . . . .
+ . . . . . . . . . . . . . . . . . . . . . . . . . . . . . . . . . . . . . . . . . . . . . . . . . . . . . . . . . . . . . . . . . . . . . . . . . . . . . . . . . . . . . . . . . . . . . . . . . . . .
. . . . . . . . . . . . . . . . . . . . . . . . .
. . . . . . . . . . . . . . . . . . . . . . . . .
. . . . . . . . . . . . . . . . . . . . . . . . .
. . . . . . . . . . . . . . . . . . . . . . . . . + + + + M + + + + + + + + + M + + + + M + + + + + . . . . . . . . . . . . . . . . . . . . . . . . .
x x x x x x x x x x x x x xx x x . . . . . . . . . . . . . . . . . . . . . . . . .
x x X X X
. . . . . . . . . . . . . . . . . . . . . . . . . X
. . . . . . . . . . . . . . . . . . . . . . . . .
X . . . . . . . . . . . . . . . . . . . . . . . . .
X X X
M: Missingtissue X. Lesionpresent I: Insufficienttissue Blank Not examined

119 Lesions in Female Rats
TABLEB2 Individual Animal Tumor Pathology of Female Rats in the 2-Year Feed Study of Tricresyl Phosphate: 0 ppm (continued)
Number of Days on Study
Carcass ID Number
Alimentary System Esophagus Intestine large, colon Intestine large, rectum Intestine large, cecum Intestine small, duodenum Intestine small, jejunum Intestine small, ileum Liver Mesentely Pancreas Salivaty glands Stomach, forestomach Stomach, glandular Tooth
Gingiva, squamous cell carcinoma
Cardiovascular System Heart
Endocrine System Adrenal cortex
Adenoma Adrenal medulla
Pheochromocytoma benign Islets, pancreatic Parathyroid gland Pituitaly gland
Pars distalis, adenoma Thyroid gland
Bilateral, C-cell, adenoma C-cell, adenoma
General Body System None
Genital System Clitoral gland
Adenoma Carcinoma
Ovary Adenoma Granulosa cell tumor benign
Uterus Adenocarcinoma Polyp stromal
1 1 1 1 1 1 1 1 1 1 1 7 1 1 1 1 1 1 1 1 1 1 1 1 1 1 3 3 3 3 3 3 3 3 3 3 3 3 3 3 3 3 3 3 3 3 3 3 3 3 3 3 2 2 2 2 2 2 2 2 2 2 2 2 2 2 2 2 2 2 2 2 2 2 2 2 2 2
I 1 7 7 7 7 7 7 7 7 7 7 7 7 7 7 7 7 7 7 7 7 7 7 1 1 Total 4 4 4 4 4 4 5 5 5 5 5 5 5 6 6 6 6 6 6 6 7 7 7 1 7 8 Tissues1 4 5 6 7 8 9 0 3 4 6 7 8 9 1 2 5 6 1 8 9 3 4 6 8 9 0 Tumors
. . . . . . . . . . . . . . . . . . . . . . . . . . 51
. . . . . . . . . . . . . . . . . . . . . . . . . . 51
. . . . . . . . . . . . . . . . . . . . . . . . . . 51
. . . . . . . . . . . . . . . . . . . . . . . . . . 51
. . . . . . . . . . . . . . . . . . . . . . . . . . 51
. . . . . . . . . . . . . . . . . . . . . . . . . . 50
. . . . . . . . . . . . . . . . . . . . . . . . . . 51
. . . . . . . . . . . . . . . . . . . . . . . . . . 51 + + 3
. . . . . . . . . . . . . . . . . . . . . . . . . . 51
. . . . . . . . . . . . . . . . . . . . . . . . . . 51
. . . . . . . . . . . . . . . . . . . . . . . . . . 51
. . . . . . . . . . . . . . . . . . . . . . . . . . 51 + 1 X 1
. . . . . . . . . . . . . . . . . . . . . . . . . . 51
. . . . . . . . . . . . . . . . . . . . . . . . . . 51 X 1
. . . . . . . . . . . . . . . . . . . . . . . . . . 51 X 1
. . . . . . . . . . . . . . . . . . . . . . . . . . 51 + + + + + M + + + + + + + + + + + + + + M + + + + + 46 . . . . . . . . . . . . . . . . . . . . . . . . . . 51
x x x x x X x 30x x x x x x . . . . . . . . . . . . . . . . . . . . . . . . . . 51
X 1 X x X 8
. . . . . . . . . . . . . . . . . . . . . . . . . . 51 1
X 1 . . . . . . . . . . . . . . . . . . . . . . . . . . 51
X 1 1
. . . . . . . . . . . . . . . . . . . . . . . . . . 51 1
X x x X 6

120 Tricresyl Phosphate, NTP TR 433
TABLEB2 Individual Animal Tumor Pathology of Female Rats i n the 2-Year Feed Study of Tricresyl Phosphate: 0 ppm (continued) ~ ~ ~~
Number of Days on Study
Carcass ID Number
Hematopoietic System Blood Bone marrow Lymph node Lymph node, mandibular Lymph node, mesenteric Spleen Thymus
Integumentary System Mammary gland
Adenoma Adenoma, multiple Fibroadenoma Fibroadenoma, multiple
Skin Squamous cell carcinoma
Musculoskeletal System Bone
Nervous System Brain Peripheral nerve Spinal cord
Respiratory System Lung
Alveolarbronchiolar adenoma Nose
Chondrosarcoma Trachea
Special Senses System Eye
Urinary System Kidney Urinary bladder
Systemic Lesions Multiple organs
Leukemia mononuclear
1 4 4 5 5 5 5 5 5 5 6 6 6 6 6 7 7 7 1 7 7 1 1 7 1 3 1 8 0 3 5 5 6 1 9 1 3 5 6 7 1 2 3 3 3 3 3 3 3 3 4 2 8 2 7 3 7 4 8 2 9 8 2 7 5 2 2 1 2 2 2 2 2 2 2
1 2 7 7 1 7 7 7 1 1 1 7 1 1 1 7 7 1 7 7 7 1 7 7 1 7 4 5 7 3 3 7 6 6 6 4 7 7 3 5 5 3 3 3 3 3 3 4 4 4 2 0 2 7 2 9 5 4 3 0 2 1 0 8 5 1 3 1 4 5 6 7 0 1 3
. . . . . . . . . . . . . . . . . . . . . . . . . +
. . . . . . . . . . . . . . . . . . . . . . . . .
. . . . . . . . . . . . . . . . . . . . . . . . .
. . . . . . . . . . . . . . . . . . . . . . . . . + + + + + + + + + + + + + + + + + + + + M + + + +
. . . . . . . . . . . . . . . . . . . . . . . . .
x x x x x x X X X
. . . . . . . . . . . . . . . . . . . . . . . . .
. . . . . . . . . . . . . . . . . . . . . . . . .
. . . . . . . . . . . . . . . . . . . . . . . . .
. . . . . . . . . . . . . . . . . . . . . . . . .
. . . . . . . . . . . . . . . . . . . . . . . . .
. . . . . . . . . . . . . . . . . . . . . . . . .
. . . . . . . . . . . . . . . . . . . . . . . . . . . X
. . . . . . . . . . . . . . . . . . . . . . . . .
+
. . . . . . . . . . . . . . . . . . . . . . . . .
. . . . . . . . . . . . . . . . . . . . . . . . .
. . . . . . . . . . . . . . . . . . . . . . . . . X x x

121 Lesions in Female Rats
TABLEB2 Individual Animal Tumor Pathology of Female Rats in the 2-Year Feed Study of Tricresyl Phosphate: 0 ppm (continued)
Number of Days on Study
Carcass I D Number
Hematopoietic System Blood Bone marrow Lymph node Lymph node, mandibular Lymph node, mesenteric Spleen Thymus
Integumentary System Mammary gland
Adenoma Adenoma, multiple Fibroadenoma Fibroadenoma, multiple
Skin Squamous c e l l carcinoma
Musculoskeletal System Bone
Nervous System Brain Peripheralnerve Spinal cord
Respiratory System Lung
Alveolar/bronchiolar adenoma NOX
Chondrosarcoma Trachea
Special Senses System Eye
Kidney Urinary bladder
Systemic Lesions Multiple organs
Leukemiamononuclear
1 1 1 1 1 1 1 1 1 1 1 1 1 1 1 1 1 1 1 1 1 1 1 1 1 1 3 3 3 3 3 3 3 3 3 3 3 3 3 3 3 3 3 3 3 3 3 3 3 3 3 3 2 2 2 2 2 2 2 2 2 2 2 2 2 2 2 2 2 2 2 2 2 2 2 2 2 2
1 1 1 1 1 1 1 1 1 1 1 1 1 1 7 1 1 1 7 1 1 1 1 1 1 1 Total 4 4 4 4 4 4 5 5 5 5 5 5 5 6 6 6 6 6 6 6 1 7 1 1 1 8 Tissues/ 4 5 6 1 8 9 0 3 4 6 7 8 9 1 2 5 6 1 8 9 3 4 6 8 9 0 Tumors
+ 1 . . . . . . . . . . . . . . . . . . . . . . . . . . 51
+ 2 . . . . . . . . . . . . . . . . . . . . . . . . . . 51 . . . . . . . . . . . . . . . . . . . . . . . . . . 51 . . . . . . . . . . . . . . . . . . . . . . . . . . 51 + + + + + + + + M + + + + + + + + + + + + + M + + + 48
+ + + + + + + + + + + + + M + + + + + M + + + + + + 49 X X 2
X 1 X X X X X 13
X 2 . . . . . . . . . . . . . . . . . . . . . . . . . . 51
X 1
. . . . . . . . . . . . . . . . . . . . . . . . . . 51
. . . . . . . . . . . . . . . . . . . . . . . . . . 51
. . . . . . . . . . . . . . . . . . . . . . . . . . 51
. . . . . . . . . . . . . . . . . . . . . . . . . . 51 ~ ~~
. . . . . . . . . . . . . . . . . . . . . . . . . . 51 X 1
. . . . . . . . . . . . . . . . . . . . . . . . . . 51 1
. . . . . . . . . . . . . . . . . . . . . . . . . . 51
1
. . . . . . . . . . . . . . . . . . . . . . . . . . 51
. . . . . . . . . . . . . . . . . . . . . . . . . . 51
. . . . . . . . . . . . . . . . . . . . . . . . . . 51 X X X x x 8

122 Tricresyl Phosphate, NTP TR 433
TABLEB2 Individual Animal Tumor Pathology of Female Rats in the 2-Year Feed Study of Tricresyl Phosphate: 75 ppm
Number of Days on Study
~~
Carcass ID Number
Alimentary System EFophagus Intestine large, colon Intestine large, rectum Intestine large, cecum Intestine small, duodenum Intestine small, jejunum Intestine small, ileum Liver Mesentery
Histiocytic sarcoma Pancreas Salivary glands Stomach, forestomach Stomach, glandular Tongue Tooth
Cardiovascular System Heart
Histiocytic sarcoma
Endocrine System Adrenal cortex
Adenoma Adrenal medulla
Pheochromocytoma benign Islets, pancreatic
Carcinoma Parathyroid gland Pituitary gland
Pars distalis, adenoma Thyroid gland
C-cell, adenoma Follicle, adenoma
General Body System None
Genital System Clitoral gland
Adenoma Carcinoma Bilateral, adenoma
ovaryGranulosa-theca tumor malignant
Uterus Polyp stromal
2 2 2 3 4 5 6 6 6 6 1 1 1 1 1 1 1 1 1 1 1 1 1 1 1 0 2 8 9 6 5 2 2 5 8 0 0 0 0 1 2 3 3 3 3 3 3 3 3 3 4 2 5 1 4 8 0 4 3 7 1 5 5 7 2 9 0 0 0 0 1 1 1 1 1
2 3 2 8 8 8 8 8 8 1 8 8 8 1 8 1 1 7 1 1 1 1 1 1 1 8 0 9 0 0 2 1 0 0 8 2 1 2 9 2 9 8 8 8 8 8 8 8 8 9 9 9 7 7 5 5 3 8 6 6 6 6 3 5 9 2 1 2 3 4 5 1 8 9 0
. . . . . . . . . . . . . . . . . . . . . . . . .
. . . . . . . . . . . . . . . . . . . . . . . . .
. . . . . . . . . . . . . . . . . . . . . . . . .
. . . . . . . . . . . . . . . . . . . . . . . . . + + + + + + + + + + + + + M + + + + + + + + + + + . . . . . . . . . . . . . . . . . . . . . . . . . . . . . . . . . . . . . . . . . . . . . . . . . . . . . . . . . . . . . . . . . . . . . . . . . . .
+ + + + X
. . . . . . . . . . . . . . . . . . . . . . . . .
. . . . . . . . . . . . . . . . . . . . . . . . .
. . . . . . . . . . . . . . . . . . . . . . . . .
. . . . . . . . . . . . . . . . . . . . . . . . .
+
. . . . . . . . . . . . . . . . . . . . . . . . . X
. . . . . . . . . . . . . . . . . . . . . . . . . X
. . . . . . . . . . . . . . . . . . . . . . . . . X
. . . . . . . . . . . . . . . . . . . . . . . . . X
. . . . . . . . . . . . . . . . . . . . . . . . .
. . . . . . . . . . . . . . . . . . . . . . . . . x x x x x x x x x x x x x
. . . . . . . . . . . . . . . . . . . . . . . . . x x
. . . . . . . . . . . . . . . . . . . . . . . . .
. . . . . . . . . . . . . . . . . . . . . . . . .
. . . . . . . . . . . . . . . . . . . . . . . . . X

123 Lesions i n Female Rats
TABLEB2 Individual Animal Tumor Pathology (continued)
Number of Days on Study
Carcass ID Number
Alimentary System Esophagus Intestine large, colon Intestine large, rectum Intestine large, cecum Intestine small, duodenum Intestine small, jejunum Intestine small, ileum Liver Mesentery
Histiocytic sarcoma Pancreas Salivary glands Stomach, forestomach Stomach, glandular Tongue Tooth
Cardiovascular System Heart
Histiocytic sarcoma
Endocrine System Adrenal cortex
Adenoma Adrenal medulla
Pheochromocytoma benign Islets, pancreatic
Carcinoma Parathyroid gland Pituitary gland
Pars distalis, adenoma Thyroid gland
C-cell, adenoma Follicle, adenoma
General Body System None
Genital System Clitoral gland
Adenoma Carcinoma Bilateral, adenoma
Ovary Granulosa-theca tumor malignant
Uterus Polyp stromal
of Female Rats in the 2-Year Feed Study of Tricresyl Phosphate: 75 ppm
7 7 7 7 7 7 7 7 7 7 7 7 7 7 7 7 7 7 7 7 7 7 7 7 7 7 7 7 3 3 3 3 3 3 3 3 3 3 3 3 3 3 3 3 3 3 3 3 3 3 3 3 3 3 3 3 1 1 1 1 1 1 1 1 1 1 1 1 1 1 1 1 1 1 1 1 1 1 1 1 1 1 1 1
7 7 7 7 7 7 7 8 8 8 8 8 8 8 8 8 8 8 8 8 8 8 8 8 8 8 8 8 T o t a l 9 9 9 9 9 9 9 0 0 0 0 0 0 1 1 1 1 1 1 1 1 2 2 2 2 2 2 3 T i s s u e s / 1 3 4 6 7 8 9 0 1 2 3 4 9 0 1 2 4 5 7 8 9 0 1 2 4 7 8 O T u m o r s
. . . . . . . . . . . . . . . . . . . . . . . . . . . . 53
. . . . . . . . . . . . . . . . . . . . . . . . . . . . 53
. . . . . . . . . . . . . . . . . . . . . . . . . . . . 53
. . . . . . . . . . . . . . . . . . . . . . . . . . . . 53
. . . . . . . . . . . . . . . . . . . . . . . . . . . . 52 + + + + + + + + + + + + + + + + + + + + M + + + + + + +52 . . . . . . . . . . . . . . . . . . . . . . . . . . . . 53 . . . . . . . . . . . . . . . . . . . . . . . . . . . . 53 + + + 7
1 . . . . . . . . . . . . . . . . . . . . . . . . . . . . 53 . . . . . . . . . . . . . . . . . . . . . . . . . . . . 53 . . . . . . . . . . . . . . . . . . . . . . . . . . . . 53 . . . . . . . . . . . . . . . . . . . . . . . . . . . . 53
+ 1 1
. . . . . . . . . . . . . . . . . . . . . . . . . . . . 53 1
. . . . . . . . . . . . . . . . . . . . . . . . . . . . 53 1
. . . . . . . . . . . . . . . . . . . . . . . . . . . . 53 X 2
. . . . . . . . . . . . . . . . . . . . . . . . . . . . 53 1
+ + + + + + + + + + + + + + + + + + + + M + + M + + M M49 . . . . . . . . . . . . . . . . . . . . . . . . . . . . 53 x x x x X X x x x x x x 25
. . . . . . . . . . . . . . . . . . . . . . . . . . . . 53 x x X X X 7
X 1
. . . . . . . . . . . . . . . . . . . . . . . . . . . . 53 X X 2
X 1 x x 2
. . . . . . . . . . . . . . . . . . . . . . . . . . . . 53 X 1 . . . . . . . . . . . . . . . . . . . . . . . . . . . . 53
1

124 Tricresyl Phosphate, NTP TR 433
TABLEB2 Individual Animal Tumor Pathology of Female Rats in the 2-Year Feed Study of Tricresyl Phosphate: 75 ppm (continued)
Number of Days on Study
Carcass ID Number
Hematopoietic System Blood Bone marrow Lymph node Lymph node, mandibular Lymph node, mesenteric Spleen Thymus
Integumentary System Mammary gland
Fibroadenoma Fibroadenoma, multiple
Skin
Musculoskeletal System Bone Skeletal muscle
Hemangioma
Nervous System Brain Peripheral nerve Spinal cord
Hemangiosarcoma
Respiratory System Lung
Histiocytic sarcoma Nose Trachea
Special Senses System EyeHarderian gland Zymbal's gland
Carcinoma
Urinary System Kidney Urinary bladder
Systemic Lesions Multiple organs
Histiocytic sarcoma Leukemia mononuclear
2 2 2 3 4 5 6 6 6 6 7 7 7 1 7 7 7 7 7 7 7 7 7 7 7 0 2 8 9 6 5 2 2 5 8 0 0 0 0 1 2 3 3 3 3 3 3 3 3 3 4 2 5 7 4 8 0 4 3 7 1 5 5 7 2 9 O O O O l l l l l
2 3 2 8 8 8 8 8 8 7 8 8 8 7 8 7 7 1 7 7 1 1 7 7 1 8 0 9 0 0 2 1 0 0 8 2 1 2 9 2 9 8 8 8 8 8 8 8 8 9 9 9 7 7 5 5 3 8 6 6 6 6 3 5 9 2 1 2 3 4 5 7 8 9 0
+ . . . . . . . . . . . . . . . . . . . . . . . . . .
+ . . . . . . . . . . . . . . . . . . . . . . . . . . . . . . . . . . . . . . . . . . . . . . . . . . . . . . . . . . . . . . . . . . . . . . . . . . . + + + + + + + + + + + + + + M + + + + + + + + + +
. . . . . . . . . . . . . . . . . . . . . . . . . X X X x x x x
X . . . . . . . . . . . . . . . . . . . . . . . . .
. . . . . . . . . . . . . . . . . . . . . . . . . . + X
. . . . . . . . . . . . . . . . . . . . . . . . .
. . . . . . . . . . . . . . . . . . . . . . . . . + + + + + + + + + + + + M + + + + + + + + + + + +
X
. . . . . . . . . . . . . . . . . . . . . . . . . X
. . . . . . . . . . . . . . . . . . . . . . . . .
. . . . . . . . . . . . . . . . . . . . . . . . .
+ + + + + X X
. . . . . . . . . . . . . . . . . . . . . . . . .
. . . . . . . . . . . . . . . . . . . . . . . . .
. . . . . . . . . . . . . . . . . . . . . . . . . X
X X x x X

125 Lesions in Female Rats
TABLEB2 Individual Animal Tumor Pathology of Female Rats in the 2-Year Feed Study of Tricresyl Phosphate: 75 ppm (continued)
Number of Days on Study
Carcass ID Number
Hematopoietic System Blood Bone marrow Lymph node Lymph node, mandibular Lymph node, mesenteric Spleen Thymus
~~~~~
Integumentary System Mammary gland
Fibroadenoma Fibroadenoma, multiple
Skin
Musculoskeletal System Bone Skeletal muscle
Hemangioma
Nervous System Brain Peripheral nerve Spinal cord
Hemangiosarcoma
Respiratory System Lung
Histiocytic sarcoma Nose Trachea
Special Senses System EyeHarderian gland Zymbal’s gland
Carcinoma
Urinary System Kidney Urinary bladder
Systemic Lesions Multiple organs
Histiocytic sarcoma Leukemia mononuclear
7 7 7 1 7 7 1 7 7 1 7 7 7 7 1 1 7 7 7 7 7 7 7 1 7 7 7 7 3 3 3 3 3 3 3 3 3 3 3 3 3 3 3 3 3 3 3 3 3 3 3 3 3 3 3 3 1 1 1 1 1 1 1 1 1 1 1 1 1 1 1 1 1 1 1 1 1 1 1 1 1 1 1 1
7 1 7 7 7 1 7 8 8 8 8 8 8 8 8 8 8 8 8 8 8 8 8 8 8 8 8 8 T o t a l 9 9 9 9 9 9 9 0 0 0 0 0 0 1 1 1 1 1 1 1 1 2 2 2 2 2 2 3 T i s u e s / 1 3 4 6 7 8 9 0 1 2 3 4 9 0 1 2 4 5 7 8 9 0 1 2 4 7 8 0 T u m o n
1 . . . . . . . . . . . . . . . . . . . . . . . . . . . . 53
+ 2 . . . . . . . . . . . . . . . . . . . . . . . . . . . . 53 + + + + + + + + + + + M + + + + + + + + + + + + + + + +52 . . . . . . . . . . . . . . . . . . . . . . . . . . . . 53 + + + + + M + + M + + + + M + + + M + + + + + + + M + + 47
. . . . . . . . . . . . . . . . . . . . . . . . . . . . 53 x x x x x X 13
x x 3 . . . . . . . . . . . . . . . . . . . . . . . . . . . . 53
. . . . . . . . . . . . . . . . . . . . . . . . . . . . 53 1 1
. . . . . . . . . . . . . . . . . . . . . . . . . . . . 53
. . . . . . . . . . . . . . . . . . . . . . . . . . . . 53
. . . . . . . . . . . . . . . . . . . . . . . . . . . . 52 1
. . . . . . . . . . . . . . . . . . . . . . . . . . . . 53 1
. . . . . . . . . . . . . . . . . . . . . . . . . . . . 53
. . . . . . . . . . . . . . . . . . . . . . . . . . . . 53
+ + +
. . . . . . . . . . . . . . . . . . . . . . . . . . . . 53
. . . . . . . . . . . . . . . . . . . . . . . . . . . . 53
. . . . . . . . . . . . . . . . . . . . . . . . . . . . 53 1
X X X 8

126
TABLEB2 Individual Animal Tumor Pathology
Number of Days on Study
Carcass I D Number
Alimentary System Esophagus Intestine large, colon Intestine large, rectum Intestine large, cecum Intestine small, duodenum Intestine small, jejunum Intestine small, ileum Liver Mesentery Pancreas Salivary glands Stomach, forestomach Stomach, glandular
Cardiovascular System Heart
Rhabdomyoma
Endocrine System Adrenal cortex Adrenal medulla
Pheochromocytoma benign Bilateral, pheochromocytoma benign
Islets, pancreatic Adenoma
Parathyroid gland Pituitary gland
Pars distalis, adenoma Thyroid gland
C-cell, adenoma Follicle, adenoma
~ ~~
General Body System None
Genital System Clitoral gland
Adenoma Bilateral, adenoma
Ovaly Granulosa-theca tumor benign
Uterus Leiomyosarcoma Polyp stromal
Tricresyl Phosphate, NTP TR 433
of Female Rats in the 2-Year Feed Study of Tricresyl Phosphate: 150 ppm
3 5 6 6 6 6 6 6 6 6 6 6 7 7 1 7 7 1 1 1 7 7 1 1 7 7 9 1 1 2 3 4 5 6 1 7 9 0 0 0 0 0 1 2 2 2 2 2 2 2 2 2 1 9 4 7 2 3 6 0 0 7 4 5 5 5 5 2 2 4 9 9 9 9 9
8 8 8 8 8 8 8 8 8 8 8 8 8 8 8 8 8 8 8 8 8 8 8 8 8 7 7 4 4 7 5 3 5 4 3 4 7 7 4 5 5 6 3 6 6 3 3 3 3 3 1 4 7 6 0 4 8 7 4 4 0 3 9 5 0 1 7 9 2 3 1 2 3 5 6
. . . . . . . . . . . . . . . . . . . . . . . . . + + + A + + + + + + + + + + + + + + + + + + + + + + + + + + + + + + + + + + + + + + + + M + + + + + . . . . . . . . . . . . . . . . . . . . . . . . . . . . . . . . . . . . . . . . . . . . . . . . . . + + + A + + + + M + + + + + + + + + + + + + + + + + + + A + + + + M + + + + + + + + + + + + + + + + . . . . . . . . . . . . . . . . . . . . . . . . .
+ + . . . . . . . . . . . . . . . . . . . . . . . . . . . . . . . . . . . . . . . . . . . . . . . . . . + + + + + + + + M + + + + + + + + + + + + + + + + . . . . . . . . . . . . . . . . . . . . . . . . .
. . . . . . . . . . . . . . . . . . . . . . . . .
. . . . . . . . . . . . . . . . . . . . . . . . .
. . . . . . . . . . . . . . . . . . . . . . . . .
. . . . . . . . . . . . . . . . . . . . . . . . . X
+ + + + + + + + + + + + M + + + + + + + + + M + + . . . . . . . . . . . . . . . . . . . . . . . . .
X x xx xx x x xx x x x . . . . . . . . . . . . . . . . . . . . . . . . .
X
. . . . . . . . . . . . . . . . . . . . . . . . . X
. . . . . . . . . . . . . . . . . . . . . . . . .
. . . . . . . . . . . . . . . . . . . . . . . . .
X X X

127 Lesions in Female Rats
TABLEB2 IndividualAnimalTumorPathology (continued)
Number of Days on Study
Carcass ID Number
Alimentary System Esophagus Intestine large, colon Intestine large, rectum Intestine large, cecum Intestine small, duodenum Intestine small, jejunum Intestine small, ileum Liver Mesentery Pancreas Salivary glands Stomach, forestomach Stomach, glandular
Cardiovascular System Heart
Rhabdomyoma
Endocrine System Adrenal conex Adrenal medulla
Pheochron~ocytoma benign Bilateral, pheochromocytoma benign
Islets, pancreatic Adenoma
Parathyroid gland P i t u i t a r y gland
Pars distalis, adenoma Thyroid gland
C-cell, adenoma Follicle, adenoma
General Body System None
Genital System Clitoral gland
Adenoma Bilateral, adenoma
Ovary Granulosa-theca tumor b e n i g n
Uterus Leiomyosarcoma Polyp stromal
of Female Rats in the2-YearFeedStudy of Tricresyl Phosphate: 150 ppm
7 7 7 7 7 7 7 7 7 7 7 1 7 7 7 1 7 7 7 7 7 7 7 7 7 3 3 3 3 3 3 3 3 3 3 3 3 3 3 3 3 3 3 3 3 3 3 3 3 3 0 0 0 0 0 0 0 0 0 0 0 0 0 0 0 0 0 0 0 0 0 0 0 0 0
8 8 8 8 8 8 8 8 8 8 8 8 8 8 8 8 8 8 8 8 8 8 8 8 8 Total 3 4 4 4 4 4 5 5 5 5 5 5 6 6 6 6 6 6 6 7 7 7 7 7 8 Tissues/ 7 1 2 3 8 9 2 3 5 6 8 9 0 1 4 5 6 8 9 2 5 6 7 8 0 Tumors
. . . . . . . . . . . . . . . . . . . . . . . . . 50
. . . . . . . . . . . . . . . . . . . . . . . . . 49 + + + + + + + + + + + + + + + + + + + + + + + M + 48 . . . . . . . . . . . . . . . . . . . . . . . . . 50 . . . . . . . . . . . . . . . . . . . . . . . . . 50 . . . . . . . . . . . . . . . . . . . . . . . . . 48 . . . . . . . . . . . . . . . . . . . . . . . . . 48 . . . . . . . . . . . . . . . . . . . . . . . . . 50
+ + 4 . . . . . . . . . . . . . . . . . . . . . . . . . 50 + + + + + + + + + + + + + + M + + + + + + + + + + 49 . . . . . . . . . . . . . . . . . . . . . . . . . 49 . . . . . . . . . . . . . . . . . . . . . . . . . 50
. . . . . . . . . . . . . . . . . . . . . . . . . 50 X 1
. . . . . . . . . . . . . . . . . . . . . . . . . 50
. . . . . . . . . . . . . . . . . . . . . . . . . 50 X X 2
X 1 . . . . . . . . . . . . . . . . . . . . . . . . . 50
1 . . . . . . . . . . . . . . . . . . . . . . . . . 48 . . . . . . . . . . . . . . . . . . . . . . . . . 50 Xx x x x x 25x x x x x x . . . . . . . . . . . . . . . . . . . . . . . . . 50
X 2 X 1
+ + + + + + + + + + + + + + + + + + M + + + + + + 49 X X 3
X 1 . . . . . . . . . . . . . . . . . . . . . . . . . 50
X 1 . . . . . . . . . . . . . . . . . . . . . . . . . 50
X 1 x x x x x 8

128 Tricresyl Phosphate, NTP TR433
TABLEB2 Individual Animal Tumor Pathology of Female Rats in the 2-Year Feed Study of Tricresyl Phosphate: 150 ppm (continued)
3 5 6 6 6 6 6 6 6 6 6 6 1 1 1 1 1 1 1 1 1 1 1 1 1 Number of Days on Study 7 9 1 1 2 3 4 5 6 1 1 9 0 0 0 0 0 1 2 2 2 2 2 2 2
2 2 1 9 4 1 2 3 6 0 0 1 4 5 5 5 5 2 2 4 9 9 9 9 9
8 8 8 8 8 8 8 8 8 8 8 8 8 8 8 8 8 8 8 8 8 8 8 8 8 Carcass ID Number 1 1 4 4 1 5 3 5 4 3 4 1 1 4 5 5 6 3 6 6 3 3 3 3 3
1 4 1 6 0 4 8 1 4 4 0 3 9 5 0 1 1 9 2 3 1 2 3 5 6
Hematopoietic System Blood + Bone marrow . . . . . . . . . . . . . . . . . . . . . . . . . Lymph node + + Lymph node, mandibular . . . . . . . . . . . . . . . . . . . . . . . . . Lymph node, mesenteric . . . . . . . . . . . . . . . . . . . . . . . . . Spleen . . . . . . . . . . . . . . . . . . . . . . . . . Thymus . . . . . . . . . . . . . . . . . . . . . . . . .
Integumentary System Mammary gland . . . . . . . . . . . . . . . . . . . . . . . . .
Fibroadenoma X X x x x x x x x Fibroadenoma, multiple X X
Skin . . . . . . . . . . . . . . . . . . . . . . . . . Fibrosarcoma X Subcutaneous tissue, fibrous histiocytoma X
Musculoskeletal System Bone . . . . . . . . . . . . . . . . . . . . . . . . .
Nervous System Brain . . . . . . . . . . . . . . . . . . . . . . . . . Peripheral nerve . . . . . . . . . . . . . . . . . . . . . . . . . Spinal cord . . . . . . . . . . . . . . . . . . . . . . . . .
Respiratory System Lung . . . . . . . . . . . . . . . . . . . . . . . . .
Alveolarlbronchiolar carcinoma X Nose . . . . . . . . . . . . . . . . . . . . . . . . . Trachea . . . . . . . . . . . . . . . . . . . . . . . . .
Special Senses System None
Urinary System Kidney . . . . . . . . . . . . . . . . . . . . . . . . . Urinary bladder . . . . . . . . . . . . . . . . . . . . . . . . .
Systemic Lesions Multiple organs . . . . . . . . . . . . . . . . . . . . . . . . .
Leukemia mononuclear x x x xx x x x x X

129 Lesions in Female Rats
TABLEB2 Individual Animal Tumor Pathology of Female Rats in the 2-Year Feed Study of Tricresyl Phosphate: 150 ppm (continued)
Number of Days on Study
Carcass ID Number
Hematopoietic System Blood Bone marrow Lymphnode Lymph node, mandibular Lymph node, mesenteric Spleen Thymus
Integumentary System Mammary gland
Fibroadenoma Fibroadenoma, multiple
Skin Fibrosarcoma Subcutaneous tissue, fibrous histiocytoma
Musculoskeletal System Bone
Nervous System Brain Peripheral nerve Spinal cord
Respiratory System Lung
Alveolar/bronchiolar carcinoma Nose Trachea
Special Senses System None
Urinary System Kidney Urinary bladder
Systemic Lesions M u l t i p l e organs
Leukemia mononuclear
7 7 7 7 7 7 7 7 7 7 7 7 7 7 7 7 7 7 7 7 7 7 7 7 7 3 3 3 3 3 3 3 3 3 3 3 3 3 3 3 3 3 3 3 3 3 3 3 3 3 0 0 0 0 0 0 0 0 0 0 0 0 0 0 0 0 0 0 0 0 0 0 0 0 0
8 8 8 8 8 8 8 8 8 8 8 8 8 8 8 8 8 8 8 8 8 8 8 8 8 Total 3 4 4 4 4 4 5 5 5 5 5 5 6 6 6 6 6 6 6 7 7 7 7 7 8 Tissues/ 7 1 2 3 8 9 2 3 5 6 8 9 0 1 4 5 6 8 9 2 5 6 7 8 0 Tumors
1 . . . . . . . . . . . . . . . . . . . . . . . . . 50
2 + + + + + + + + + + + + + + M + + + + + + + + + + 49 . . . . . . . . . . . . . . . . . . . . . . . . . 50 . . . . . . . . . . . . . . . . . . . . . . . . . 50 + + M + + + + + + + + + + + + M + + + + + M + + + 47
. . . . . . . . . . . . . . . . . . . . . . . . . 50 x x x x x x X x x 18
X 3 . . . . . . . . . . . . . . . . . . . . . . . . . 50
1
1
. . . . . . . . . . . . . . . . . . . . . . . . . 50
. . . . . . . . . . . . . . . . . . . . . . . . . 50
. . . . . . . . . . . . . . . . . . . . . . . . . 50
. . . . . . . . . . . . . . . . . . . . . . . . . 50
. . . . . . . . . . . . . . . . . . . . . . . . . 50 1
. . . . . . . . . . . . . . . . . . . . . . . . . 50
. . . . . . . . . . . . . . . . . . . . . . . . . 50
. . . . . . . . . . . . . . . . . . . . . . . . . 50
. . . . . . . . . . . . . . . . . . . . . . . . . 50
. . . . . . . . . . . . . . . . . . . . . . . . . 50 X x x 13

130 Tricresyl Phosphate, NTP TR 433
TABLEB2 Individual Animal Tumor Pathology of Female Rats in the 2-Year Feed Study of Tricresyl Phosphate: 300 ppm
Number of Days on Study
Carcass ID Number
~~~~~~ ~
Alimentary System Esophagus Intestine large, colon Intestine large, rectum Intestine large, cecum Intestine small, duodenum Intestine small, jejunum Intestine small, ileum Liver Mesentery Pancreas Salivaly glands Stomach, forestomach Stomach, glandular
Cardiovascular System Heart
Endocrine System Adrenal cortex
Adenoma Adrenal medulla
Pheochromocytoma malignant Islets, pancreatic Parathyroid gland Pi tu i ta ry gland
Pars distalis, adenoma Thyroid gland
C-cell, adenocarcinoma C-cell, adenoma
Genital System Clitoral gland
Adenoma Ovary
Granulosa cell tumor benign Uterus
Polyp stromal
Hematopoietic System Bone marrow Lymphnode Lymph node, mandibular
Squamous cell carcinoma, metastatic, skin
Lymph node, mesenteric Spleen Thymus
0 0 3 5 5 5 5 5 6 6 6 6 6 6 6 6 6 6 6 7 7 7 7 7 2 9 5 4 5 5 6 9 2 2 5 5 6 7 8 8 9 9 9 0 0 1 2 2 4 2 3 6 0 8 4 2 0 5 3 9 7 0 7 7 1 8 9 3 4 2 2 2
9 9 9 9 9 8 8 9 8 9 8 9 8 8 8 8 9 9 8 8 8 9 9 9 0 0 2 1 1 8 9 0 8 0 8 1 8 8 8 9 1 1 8 9 8 1 2 3 7 2 5 9 2 7 5 9 6 3 3 4 1 2 9 4 3 6 8 0 4 7 9 0
. . . . . . . . . . . . . . . . . . . . . . . .
. . . . . . . . . . . . . . . . . . . . . . . .
. . . . . . . . . . . . . . . . . . . . . . . .
. . . . . . . . . . . . . . . . . . . . . . . . + + + + + + + + + + + + + + + + + + M + + + + + + + + + + + + + + + + + + + + + + A " + + + + + + + + + + + + + + + + + + + + + + M A + + + + . . . . . . . . . . . . . . . . . . . . . . . .
+ + + + . . . . . . . . . . . . . . . . . . . . . . . . . . . . . . . . . . . . . . . . . . . . . . . . . . . . . . . . . . . . . . . . . . . . . . . . . . . . . . . . . . . . . . . . . . . . . . . .
. . . . . . . . . . . . . . . . . . . . . . . .
. . . . . . . . . . . . . . . . . . . . . . . .
. . . . . . . . . . . . . . . . . . . . . . . . X
. . . . . . . . . . . . . . . . . . . . . . . . . . + + + + M + + + + + + + + + + + + + + + + + + + . . . . . . . . . . . . . . . . . . . . . . . .
X x x x x x x x x x x x . . . . . . . . . . . . . . . . . . . . . . . .
X X x x x
+ + + + + + + + + + + + + + M + + + + + + + + +
. . . . . . . . . . . . . . . . . . . . . . . .
. . . . . . . . . . . . . . . . . . . . . . . . X X
. . . . . . . . . . . . . . . . . . . . . . . .
. . . . . . . . . . . . . . . . . . . . . . . .
X + + + + + + + + + + + + + + + + M + + + + + + + . . . . . . . . . . . . . . . . . . . . . . . . + + + + + + + + + + + M + + + + + + + + + + + +

131 Lesions in Female Rats
TABLEB2 Individual Animal Tumor Pathology of Female Rats in the 2-Year Feed Study of Tricresyl Phosphate: 300 ppm (continued)
~~
Number of Days on Study
Carcass ID Number
Alimentary System Esophagus Intestine large, colon Intestine large, rectum Intestine large, cecum Intestine small, duodenum Intestine small, jejunum Intestine small, ileum Liver Mesentery Pancreas Salivary glands Stomach, forestomach Stomach, glandular
Cardiovascular System Heart
Endocrine System Adrenal cortex
Adenoma Adrenal medulla
Pheochromocytoma malignant Islets, pancreatic Parathyroid gland Pi tu i t a ry gland
Pars distalis, adenoma Thyroid gland
C-cell, adenocarcinoma Ccell, adenoma
General Body System None
Genital System Clitoral gland
Adenoma Ovary
Granulosa cell tumor benign Uterus
Polyp stromal
Hematopoietic System Bone marrow Lymph node Lymph node, mandibular
Squamous cell carcinoma, metastatic, skin
Lymph node, mesenteric Spleen Thymus
7 7 7 7 7 7 7 7 7 7 7 7 7 7 7 7 7 7 7 7 7 7 7 7 7 7 2 2 2 2 2 2 2 2 2 2 2 2 2 2 2 2 2 2 2 2 2 2 2 2 2 2 9 9 9 9 9 9 9 9 9 9 9 9 9 9 9 9 9 9 9 9 9 9 9 9 9 9
8 8 8 8 8 8 8 8 9 9 9 9 9 9 9 9 9 9 9 9 9 9 9 9 9 9 Total 8 9 9 9 9 9 9 9 0 0 0 0 0 0 1 1 1 1 2 2 2 2 2 2 2 2 Tissues/ 5 1 2 3 6 7 8 9 0 1 4 5 6 8 0 1 5 8 0 1 2 3 4 6 7 8 Tumors
. . . . . . . . . . . . . . . . . . . . . . . . . . 50
. . . . . . . . . . . . . . . . . . . . . . . . . . 50
. . . . . . . . . . . . . . . . . . . . . . . . . . 50
. . . . . . . . . . . . . . . . . . . . . . . . . . 50
. . . . . . . . . . . . . . . . . . . . . . . . . . 49
. . . . . . . . . . . . . . . . . . . . . . . . . . 47
. . . . . . . . . . . . . . . . . . . . . . . . . . 48
. . . . . . . . . . . . . . . . . . . . . . . . . . 50 4
. . . . . . . . . . . . . . . . . . . . . . . . . . 50
. . . . . . . . . . . . . . . . . . . . . . . . . . 50
. . . . . . . . . . . . . . . . . . . . . . . . . . 50
. . . . . . . . . . . . . . . . . . . . . . . . . . 5 0
. . . . . . . . . . . . . . . . . . . . . . . . . . 50
. . . . . . . . . . . . . . . . . . . . . . . . . . 50 X 1
. . . . . . . . . . . . . . . . . . . . . . . . . . 50 1
. . . . . . . . . . . . . . . . . . . . . . . . . . 50 M M + + + + + M + + + + + + + + + + + + + + M + + M 44 . . . . . . . . . . . . . . . . . . . . . . . . . . 50 x x x x x X x x X x x 23 . . . . . . . . . . . . . . . . . . . . . . . . . . 50
X 1 X X X X x x 11
. . . . . . . . . . . . . . . . . . . . . . . . . . 49 X X X 3
. . . . . . . . . . . . . . . . . . . . . . . . . . 50 X 1
. . . . . . . . . . . . . . . . . . . . . . . . . . 50 x x x x X X X 9
. . . . . . . . . . . . . . . . . . . . . . . . . . 50 + + 2
. . . . . . . . . . . . . . . . . . . . . . . . . . 50
1 . . . . . . . . . . . . . . . . . . . . . . . . . . 49 . . . . . . . . . . . . . . . . . . . . . . . . . . 50 + + + + + + M + + + + + + + + + + + + + + + + + + + 48

132 Tricresyl Phosphate, NTP TR 433
TABLEB2 Individual Animal Tumor Pathology of Female Rats in the 2-Year Feed Study of Tricresyl Phosphate: 300 ppm (continued)
0 0 3 5 5 . 5 5 5 6 6 6 6 6 6 6 6 6 6 6 7 7 7 7 7 Number of Days on Study 2 9 5 4 5 5 6 9 2 2 5 5 6 7 8 8 9 9 9 0 0 1 2 2
4 2 3 6 0 8 4 2 0 5 3 9 7 0 7 7 1 8 9 3 4 2 2 2
9 9 9 9 9 8 8 9 8 9 8 9 8 8 8 8 9 9 8 8 8 9 9 9 Carcass I D Number 0 0 2 1 1 8 9 0 8 0 8 1 8 8 8 9 1 1 8 9 8 1 2 3
7 2 5 9 2 7 5 9 6 3 3 4 1 2 9 4 3 6 8 0 4 7 9 0
Integumentary System Mammary gland . . . . . . . . . . . . . . . . . . . . . . . .
Adenoma Fibroadenoma x x X x x x X Fibroadenoma, multiple
Skin . . . . . . . . . . . . . . . . . . . . . . . . Squamous c e l l carcinoma X Subcutaneous tissue, fibroma X
Musculoskeletal System Bone . . . . . . . . . . . . . . . . . . . . . . . .
Osteosarcoma X
Nervous System Brain . . . . . . . . . . . . . . . . . . . . . . . . Peripheral newe . . . . . . . . . . . . . . . . . . . . . . . . Spinal cord . . . . . . . . . . . . . . . . . . . . . . . .
Respiratory System Lung . . . . . . . . . . . . . . . . . . . . . . . .
Alveolar/bronchiolar adenoma Alveolar/bronchiolar carcinoma Pheochromocytoma malignant,
metastatic, adrenal medulla X Nose . . . . . . . . . . . . . . . . . . . . . . . . Trachea . . . . . . . . . . . . . . . . . . . . . . . .
Special Senses System Ear
Pinna, fibrosarcoma Eye +
Urinary System Kidney . . . . . . . . . . . . . . . . . . . . . . . . Urinary bladder . . . . . . . . . . . . . . . . . . . . . . . .
Systemic Lesions Multiple organs . . . . . . . . . . . . . . . . . . . . . . . .
Leukemia mononuclear x x x x x Xx x x x

133 Lesions in Female Rats
TABLEB2 Individual Animal Tumor Pathology of Female Rats in the 2-Year Feed Study of Trjcresyl Phosphate: 300 ppm (continued)
Number of Days on Study
Carcass ID Number
Integumentary System Mammary gland
Adenoma Fibroadenoma Fibroadenoma, multiple
Skin Squamous cell carcinoma Subcutaneous tissue, fibroma
Musculoskeletal System Bone
Osteosarcoma
Nervous System Brain Peripheral nerve Spinal cord
Respiratory System Lung
Alveolar/bronchiolar adenoma Alveolar/bronchiolar carcinoma Pheochromocytoma malignant,
metastatic, adrenal medulla NOW Trachea
Special Senses System Ear
Pinna, fibrosarcoma Eye
Urinary System Kidney Urinary bladder
Systemic Lesions Multiple organs
Leukemia mononuclear
1 1 1 1 1 1 1 1 1 1 1 1 1 1 1 1 1 1 1 1 1 1 1 1 1 1
2 2 2 2 2 2 2 2 2 2 2 2 2 2 2 2 2 2 2 2 2 2 2 2 2 2 9 9 9 9 9 9 9 9 9 9 9 9 9 9 9 9 9 9 9 9 9 9 9 9 9 9
8 8 8 8 8 8 8 8 9 9 9 9 9 9 9 9 9 9 9 9 9 9 9 9 9 9 Total 8 9 9 9 9 9 9 9 0 0 0 0 0 0 1 1 1 1 2 2 2 2 2 2 2 2 Tissues/ 5 1 2 3 6 1 8 9 0 1 4 5 6 8 0 1 5 8 0 1 2 3 4 6 1 8 Tumors
+ + + + + + + + + + + + M + + + + + + + + + + + + + 49 X 1
X x x X x x x 14 X 1 . . . . . . . . . . . . . . . . . . . . . . . . . . 50
1 1
. . . . . . . . . . . . . . . . . . . . . . . . . . 50 1
. . . . . . . . . . . . . . . . . . . . . . . . . . 50
. . . . . . . . . . . . . . . . . . . . . . . . . . . 50
. . . . . . . . . . . . . . . . . . . . . . . . . . 50
. . . . . . . . . . . . . . . . . . . . . . . . . . 50 X 1
X 1
1 . . . . . . . . . . . . . . . . . . . . . . . . . . 50 . . . . . . . . . . . . . . . . . . . . . . . . . . 50
+ 1 X 1
+ 2
. . . . . . . . . . . . . . . . . . . . . . . . . . 50
. . . . . . . . . . . . . . . . . . . . . . . . . . 50
. . . . . . . . . . . . . . . . . . . . . . . . . . 50 X X x x X 15

134 Tricresyl Phosphate, NTP TR 433
TABLEB3 Statistical Analysis of Primary Neoplasms in Female Rats in the 2-Year Feed Study of Tricresyl Phosphate
Adrenal Medulla: Benign Pheochromocytoma Overall ratea Adjusted rateb Terminal rate' First incidence (days) Life table testd Logistic regression testd
Fisher exact test Cochran-ArmitaIe testd
Clitoral Gland: Adenoma Overall rate Adjusted rate Terminal rate First incidence (days) Life table tes t Logistic regression test Cochran-Armitage test Fisher exact test
Clitoral Gland: Adenoma or Carcinoma Overall rate Adjusted rate Terminal rate First incidence (days) Life table test Logistic regression test Cochran-Armitage test Fisher exact test
Mammary Gland: Adenoma Overall rate Adjusted rate Terminal rate First incidence (days) L i f e table test Logistic regression test Cochran-Armitage test Fisher exact t e s t
Mammary Gland: Fibroadenoma Overall rate Adjusted rate Terminal rate First incidence (days) Life table test Logistic regression t e s t Cachran-Armitage test Fisher exact test
1/51 (2%) 2.9% 1/34 (3%) 729 (T )P=0.425N P=0.355N P=0.349N
1/51 (2%) 2.9% 1134 (3%) 729 ( T )P=O.195 P=O.234 P=O.315
2/51 (4%) 5.9% 2/34 (6%) 729 (T )P=O.352 P =0.404 P=O.504
3/51 (6%) 8.8% 3/34 (9%) 729 (T)P=0.319N P=0.31 9N P=0.255N
15/51 (29%) 36.0% 8/34 (24%) 557 P=O.210 P=O.436 P=O.457
75 PPm
2/53 (4%) 4.7% 1/38 (3%) 620 P=O.544 P=O.517
P=O.515
4/53 (8%) 10.5% 4/38 (11%) 729 (T) P=O.214 P=O.214
P=O.194
5/53 (9%) 13.2% 5/38 (13%) 729 (T)P=O.262 P=O.262
P=O.235
0/53 (0%) 0.0% om (0%) -P=0.102N P=0.102N
P=0.114N
16/53 (30%) 37.9% 1u38(32%) 653 P=0.522N P=O.577
P=O.551
150 ppm
3/50 (6%) 10.0% 3/30 (10%) 729 P=O.261 P=O.261
P=O.301
4/49 (8%) 12.8% 3/29 (10%) 705 P=O.146 P=O.175
P=O.169
4/49 (8%) 12.8% 3/29 (10%) 705 P=O.280 P =0.328
P=O.320
0/50 (0%) 0.0% on0 (0%) -P=0.143N P=0.143N
P=0.125N
21/50 (42%) 52.1% 11/30 (37%) 592 P=O.141 P=O.167
P=O.133
300 ppm
0/50 (0%) 0.0% 0/26(0%) -e
P=0.554N P=0.554N
P=0.505N
3/49 (6%) 11.5% 3/26 (12%) 729 (T) P=O.214 P=O.214
P=O.294
3/49 (6%) 11.5% 3/26 (12%) 729 (T)P=O.378 P=O.378
P=O.481
1/50 (2%) 3.8% 1/26 (4%) 729 ( T )P=0.405N P=0.405N
P=0.316N
15/50 (30%) 42.9% 8/26 (31%) 5 6 4 P=O.391 P=O.547
P=O.561

135 Lesions in Female Rats
TABLEB3 Statistical Analysisof Primary Neoplasms in Female Rats in the 2-Year Feed Study of Tricresyl Phosphate (continued)
Mammary Gland Adenoma or Fibroadenoma Overall rate Adjusted rate Terminal rate First incidence (days) Life table test Logistic regression test Cochran-Armitage test Fisher exact test
Pituitary Gland (Pars Distalis): Adenoma Overall rate Adjusted rate Terminal rate First incidence (days) Life table test Logistic regression test Cochran-Armitage test Fisher exact test
Thyroid Gland (C-cell): Adenoma Overall rate Adjusted rate Terminal rate First incidence (days) Life table test Logistic regression test Cochran-Anitage test Fisher exact test
Thyroid Gland (C-cell): Adenoma or Carcinoma Overall rate Adjusted rate Terminal rate First incidence (days) Life table test Logistic regression test Cochran-Armitage test Fisher exact test
Uterus: Stromal Polyp Overall rate Adjusted rate Terminal rate First incidence (days) Life table test Logistic regression test Cochran-Armitage test Fisher exact test
0 PPm
18/51 (35%) 43.4% 11/34 (32%) 557 P=O.281 P=0.528N P=0.506N
30/51 (59%) 66.7% 19/34 (56%) 553 P=0.524N P=0.175N P=0.165N
9/51 (18%) 22.4% 5/34 (15%) 502 P=O.163 P=0.288 P=O.302
9/51 (18%) 22.4% 5/34 (15%) 502 P=0.098 P=O.194 P =0.207
6/51 (12%) 17.0% 5/34 (15%) 667 P=O.O20 P=O.O52 P=O.O61
75 PPm
16/53 (30%) 37.9% 12/38 (32%) 653 P=0.288N P=0.332N
P=0.365N
25/53 (47%) 55.4% 18/38 (47%) 558 P=0.118N P=0.135N
P=0.160N
7/53 (13%) 18.4% 7/38 (18%) 729 (T)P=0.314N P=0.354N
P=0.361N
7/53 (13%) 18.4% 7/38 (18%) 729 ( T ) P=0.314N P=0.354N
P=0.361N
1/53 (2%) 2.6% 1/38 (3%) 729 (??P=0.043N P=0.041N
P=0.050N
150 ppm
21/50 (42%) 52.1% llrn (37%) 592 P=O.290 P=O.384
P=O.313
25/50 (50%) 61.7% 15/30 (50%) 592 P=0.344N P=0.166N
P=0.245N
2/50 (4%) 5.9% 1/30 (3%) 704 P=0.037N P=0.033N
P=0.028N
2/50 (4%) 5.9% 1/30 (3%) 704 P=0.037N P=0.033N
P =0.028N
8/50 (16%) 23.8% 6/30 (20%) 619 P=O.327 P=O.429
P=0.372
300 ppm
16/50 (32%) 46.1% 9/26 (35%) 5 6 4 P=O.505 P=0.462N
P=0.445N
23/50 (46%) 58.2% 11/26 (42%) 353 P=0.394N P=0.148N
P=0.138N
11/50 (22%) 34.5% 6/26 (23%) 670 P=O.255 P=O.370
P =0.383
12/50 (24%) 37.8% 7/26 (27%) 670 P=O.181 P=O.282
P =0.294
9/50 (18%) 30.4% 7/26 (27%) 550 P=O.155 P=O.259
P=O.274

136 Tricresyl Phosphate, NTP TR 433
TABLEB3 Statistical Analysis of Primary Neoplasms in Female Rats in the 2-Year Feed Study of Tricresyl Phosphate (continued)
All Organs:Mononuclear Cell Leukemia Overall rate 8/51 (16%) 8/53 (15%) 13/50 (26%) 15/50 (30%) Adjusted rate 22.7% 18.9% 29.6% 39.2% Terminal rate 7/34 (21%) 5138 (13%) 3/30 (10%) 5/26 (19%) First incidence (days) 675 464 592 546 Life table test P=O.O12 P=0.512N P=O.174 P-0,041 Logistic regression tes t P=O.O24 P =0.557N P=O.162 P=O.o64 Cochran-Annitage test Pe0.026 Fisher exact test P=0.574N P=O.151 P=O.O69
All Organs:Benign Neoplasms Overall rate 46/51 (90%) 34/53 (64%) 38/50 (76%) 42/50 (84%) Adjusted rate 93.9% 70.6% 84.4% 93.1% Terminal rate 31M (91%) 24/38 (63%) 23/30 (77%) 23/26 (88%) First incidence (days) 412 204 592 353 Life table test P=0.086 P=0.007N P=0.238N P=O.328 Logistic regression test P=O.456 P =0.002N P=0.016N P=O.316N Cochran-Armitage test P=O.494 Fisher exact test P=0.001N P=0.050N P=0.264N
All Organs: Malignant Neoplasms Overall rate 13/51 (25%) 15/53 (28%) 17/50 (34%) 20/50 (40%) Adjusted rate 34.1% 31.9% 37.0% 49.7% Terminal rate 1 O M (29%) 7/38 (18%) 4/30 (13%) 7/26 (27%) First incidence (days) 412 222 372 546 Life table test P=O.O28 P-0.533 P =0.258 P=O.O50 Logistic regression test P=O.o60 P=O.456 P=O.181 P=O.O84 Cochran-Armitage test P=O.O57 Fisher exact test P=O.460 P=O.237 P=O.o90
All Organs: Benign or Malignant Neoplasms Overall rate 47/51 (92%) 40153 (75%) 43/50 (86%) 46/50 (92%) Adjusted rate 95.9% 78.4% 87.7% 95.8% Terminal rate 3 2 M (94%) 27/38 (71%) 24/30 (so%) 24m (92%) First incidence (days) 412 204 372 353 Life table test P=O.o42 P-0.044N P=0.471N P-0.163 Logistic regression test P-0.238 P=0.020N P=0.166N P=O.550 Cochran-Annitage test P=O.269 Fisher exact test P=0.020N P=0.251N P=0.631N
OTerminal sacrifice a Number of neoplasm-bearing animals/number of animals examined. Denominator is number of animals examined microscopically for adrenal gland,
clitoral gland, pituitary gland,and thyroid gland for other tissues, denominator is number of animals necropsied. Kaplan-Meier estimated neoplasm incidencea t the end of the study after adjustment for intercurrent mortality
. Observed incidence at terminal kill Beneath the control incidence are the P values associated with the trend test. Beneath the dosed group incidence are the P values corresponding to pairwise comparisons between the controls and tha t dosed group. The life table analysis regards neoplasms in animals dying prior to terminalkill as being (directly or indirectly) the cause of death. The logistic regression test regards these lesions as nonfatal. The Cochran-Armitage and Fisher exact tests compare directly the overall incidence rates. For all tests, a negative trend or a lower incidence in a dose group is indicated by N.
e Not applicable;noneoplasms in animal group
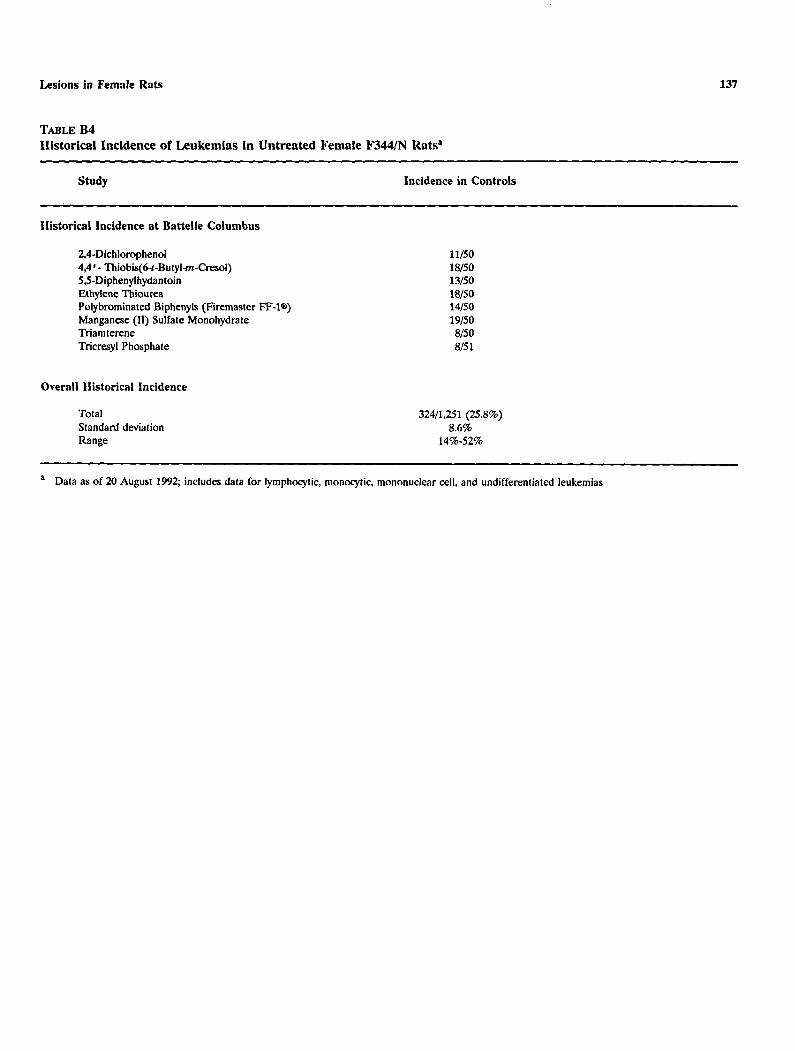
137 Lesions in Female Rats
TABLEB4 Historical Incidence of Leukemias in Untreated Female F344/N Ratsa
~~ ~
Study Incidence in Controls
llistorical Incidence at Battelle Columbus
2,4-Dichlorophenol 11/50 4,4'- Thiobis(6-t-Butyl-m-Cresol) 18/50 5,5-Diphenylhydantoin 13/50 Ethylene Thiourea 18/50 Polybrominated Biphenyls (Firemaster FF-P) 14/50 Manganese (11) Sulfate Monohydrate 19\50 Triamterene 8/50 Tricresyl Phosphate 8/51
Overall IIistoricnl Incidence
Total 324D.251(25.8%) Standard deviation 8.6% Range 14%-52%
a Data as o f 20 August 1992; includes data for lymphocytic, monocytic, mononuclear cell, and undifferentiated leukemias

138 Tricresyl Phosphate, NTP TR 433
TABLEB5 Summary of the Incidence of Nonneoplastic Lesions in Female Rats in the 2-Year Feed Study of Tricresyl Phosphatea
Disposition Summary Animals initially in study H U d i n t m i m N a l L n p i o n b 9"brtaim NalLnpionb 1 5 - " r brtaim evolLrrtionb Early deaths
Accidental deaths Moribund Natural deaths
Survivors Died last week of study Terminal sacrifice
Missing
95 15 15 14
14 3
34
95 15 14 13
12 3
1 31
95 15 15 15
15 5
30
95 14 15 15
1 18 5
26 1
Animals examined microscopically 95 95 95 94
3-Month Interim Evaluation Alimentary System Intestine large, rectum
Parasite metazoan Intestine small, jejunum
Peyer's patch, mineralization Liver
Hepatodiaphragmatic nodule
Cardiovascular System Heart
Myocardium, degeneration
Endocrine System Adrenal cortex
Vacuolization cytoplasmic
Genital System Clitoral gland
Inflammation, chronic Ovary
CystInterstitium, hyperplasia
Uterus Dilatation
Hematopoeitic System Lymph node, mandibular
Hyperplasia, lymphoid
* Number of animals examined microscopically at site and number o f animals with lesion Includes up to five animals per dose group subjectedt o total body perfusion for special neuropathology

139 Lesions in Female Rats
TABLEB5 Summary of the Incidence of Nonneoplastic Lesions in Female Rats in the 2-Year Feed Study of Tricresyl Phosphate (continued)
0 PPm 75 PPrn 150 pprn 300 ppm
Special Senses System Harderian gland (1)
1 (100%) Inflammation, chronic active ( 4
2 (100%)
Systems Emmined With No Lesions Observed General Body System Integumentary System Musculoskeletal System Respiratory System Urinary System
%Month Interim Evaluation Alimentary System Intestine large, colon
Parasite metazoan Intestine large, rectum
Parasite metazoan Liver (10)
Basophilic focus (10)
1 (10%) Cyst Hepatodiaphragmatic nodule Inflammation, granulomatous
Mesentery Fat, necrosis
1 (10%) 1 (10%) 1 (10%)
(1) 1 (100%)
1 (10%) 4 (40%)
1 (10%) 1 (10%)
1 (10%) 2 (20%)
Pancreas Inflammation, chronic
(10) 3 (30%)
Cardiovascular System Heart
Degeneration
Endocrine System Adrenal cortex
Hyperplasia (10)
1 (10%) (10)
Mineralization Vacuolization cytoplasmic
1 (10%) 3 (30%) 10 (100%)
Pi tu i t a ry gland Pars distalis, hyperplasia
(10)1 (10%)
(10)

140 Tricresyl Phosphate, NTP TR 433
TABLEB5 Summary of the Incidence of Nonneoplastic Lesions in Female Rats in the 2-Year Feed Study of Tricresyl Phosphate (continued)
9-Month Interim Evaluation (continued) Genital System Ovary
CystInterstitium, hyperplasia
(10)1(10%)
(10)1(10%)
(10)
1 (10%)
(10) 1(10%) 10 (100%)
Urinary System Kidney
Nephropathy
Systems Examined With No Lesions Observed General Body System Hematopoietic System Integumentary System Musculoskeletal System Nervous System Respiratory System Special Senses System
15-Month Interim Evaluation Alimentary System Liver
Basophilic focus Hepatodiaphragmatic nodule Mixed cell focus
Pancreas Acinus, atrophy
Salivary glands Inflammation, chronic
Cardiovascular System Heart
Myocardium, degeneration
Endocrine System Adrenal cortex (9)
Hyperplasia 1 (11%) (8)
1(13%) Vacuolization cytoplasmic
Adrenal medulla (9) Hyperplasia 1 (11%)
Pituitary gland (9) Pigmentation, hemosiderin
(8)
(8) (10) 1(10%)
(10)
Pars distalis, cyst Pars distalis, hyperplasia
Thyroid gland (9) C-cell, hyperplasia 8 (89%)
1 (13%)
(8) 7 (88%)
2 (20%)
(10) 7 (70%)
1 (10%) 1 (10%)
(10)8 (80%)

141 Lesions in Female Rats
TABLEB5 Summary of the Incidence of Nonneoplastic Lesions in Female Rats in the 2-Year Feed Study of Tricresyl Phosphate (continued)
0 PPm 75 PPm 150 ppm 300 PPm
Z5-Month Interim Evaluation (continued) Genital System Clitoral gland
Inflammation, chronic active w a r y
CystFollicle, cyst Interstitium, hyperplasia
Uterus Dilatation ce lv ix , cyst
Nervous System Spinal cord (15)
Cyst 2 (13%)
Respiratory System Nose
Inflammation, suppurative
Urinary System Kidney (9) (8)
Nephropathy 3 (33%) 4 (50%)
Systems Examined With No Lesions Observed General Body System Hematopoietic System Integumentary System Musculoskeletal System Special Senses System
2-Year Study Alimentary System Intestine large, colon (53)
Parasitemetazoan Ulcer
Intestine large, rectum (53) (50)Fibrosis 1 (2%)Inflammation,necrotizing 1 (2%) Parasitemetazoan 1 (2%) 1 (2%) 4 (8%)
Intestine large, cecum (51) (53) (50)Ulcer 1 (2%)
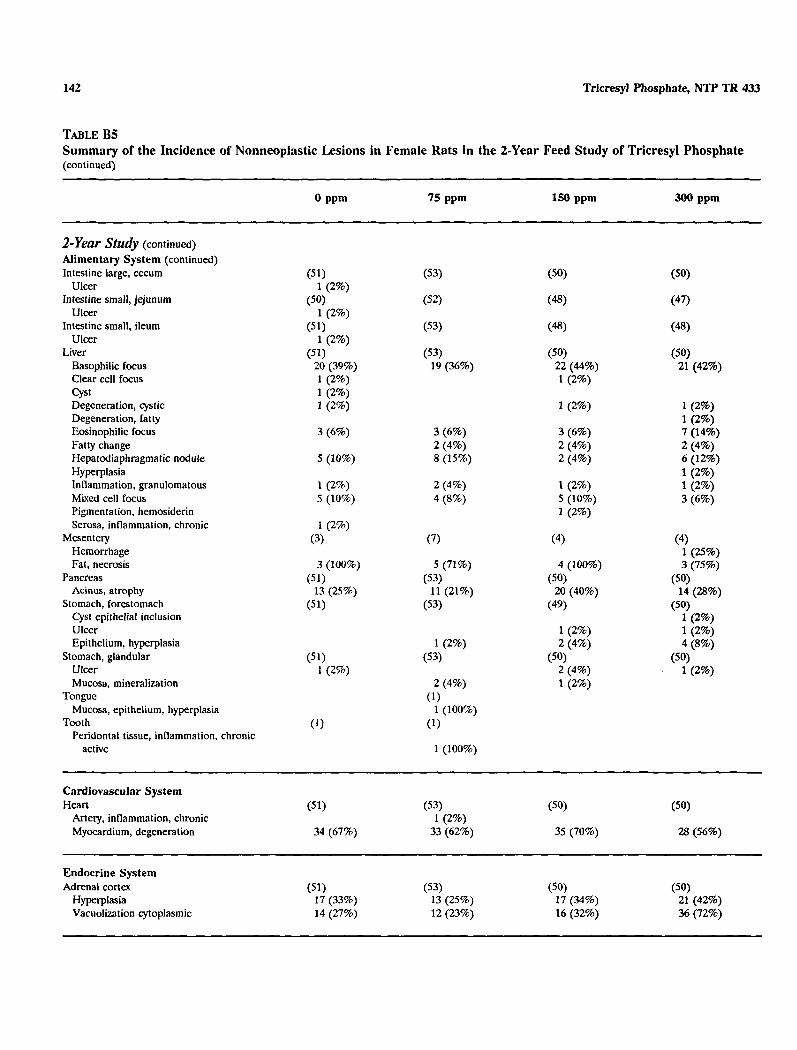
Alimentary System (continued) Intestine large, cecum
Ulcer Intestine small, jejunum
Ulcer Intestine small, ileum
Ulcer Liver
Basophilic focus Clear cell focus CystDegeneration, cystic Degeneration, fa t ty Eosinophilic focus Fatty change Hepatodiaphragmatic nodule Hyperplasia Inflammation, granulomatous Mixed cell focus Pigmentation, hemosiderin Serosa, inflammation, chronic
Mesentery Hemorrhage Fat, necrosis
Pancreas Acinus, atrophy
Stomach, forestomach Cyst epithelial inclusion Ulcer Epithelium, hyperplasia
Stomach, glandular Ulcer Mucosa, mineralization
Tongue Mucosa, epithelium, hyperplasia
Tooth Peridontal tissue, inflammation, chronic
active
Cardiovascular System Hean
Artery, inflammation, chronic Myocardium, degeneration
Endocrine System Adrenal cortex
Hyperplasia Vacuolization cytoplasmic
0 PPm
(51)1 (2%)
(50)1 (2%)
(51)1 (2%)
(51)20 (39%) 1 (2%) 1 (2%) 1 (2%)
3 (6%)
5 (10%)
1 (2%) 5 (10%)
1 (2%) (3)
3 (100%) (51)
13 (25%) (51)
(51)1 (2%)
(51)
34 (67%)
(51)17 (33%) 14 (27%)
75 PPm
(53)
(53)19 (36%)
3 (6%) 2 (4%) 8 (15%)
2 (4%) 4 (8%)
(7)
5 (71%) (53)
11 (21%) (53)
1 (2%) (53)
2 (4%) (1)
1 (100%) (1)
1 (100%)
(53)1 (2%)
33 (62%)
(53)13(25%) 1 2 (23%)
150 ppm
(48)
(50)22 (44%) 1 (2%)
1 (2%)
3 (6%) 2 (4%) 2 (4%)
1 (2%) 5 (10%) 1 (2%)
(4)
4 (100%) (50)
20 (40%) (49)
1 (2%) 2 (4%)
(50)2 (4%) 1 (2%)
(50)
35 (70%)
(50)17 (34%) 16 (32%)
300 PPm
1 (2%) 1 (2%) 7 (14%) 2 (4%) 6 (12%) 1 (2%) 1 (2%) 3 (6%)
(4)1 (25%) 3 (75%)
(50)14 (28%)
( 5 0 )1 (2%) 1 (2%) 4 (8%)
(50)1 (2%)
(50)
28 (56%)
(50)21 (42%) 36 (72%)
142 Tricresyl Phosphate, NTP TR 433
TABLEB5 Summary of the Incidence of Nonneoplastic Lesions in Female Rats in the 2-Year Feed Study of Tricresyl Phosphate (continued)

2-YeUr study (continued) Endocrine System (continued) Adrenal medulla
Hyperplasia (51)
5 (10%) (53) (50)
1 (2%) (50)
2 (4%) Infarct 1 (2%)
Pituitary gland CystInflammation, chronic
(51)1 (2%)
(53)5 (9%)
(50)5 (10%)
(50)5 (10%) 1 (2%)
Pars distalis, hyperplasia 3 (6%) 6 (11%) 6 (12%) 3 (6%) Thyroid gland
C-cell, hyperplasia (51)
29 (57%) (53)
37 (7070) (50)
45 (90%) (50)
31 (62%)
General Body System None
Genital System Clitoral gland
Abscess (51)
1 (2%) (53) (49) (49)
Hyperplasia 5 (10%) 2 (4%) Inflammation, chronic 5 (10%) 4 (8%) 3 (6%) 3 (6%)
m a l yCystInterstitium, hyperplasia
Uterus Dilatation
(51)
(51) 1 (270)
(53)4 (8%)
(53)
(50) 1 (2%)
(50)1 (2%)
(50)3 (6%)
15 (30%) (50 )
2 (4%) Prolapse 2 (4%) Cervix, cyst Endometrium, hyperplasia I (14%)
2 (4%) 6 (11%) 1 (2%) 1 (2%)
Wall, hyperplasia 1 (2%) 1 (2%)
Hematopoietic System B l o o d
Anisocytosis Polychromasia
Bone marrow Atrophy
Spleen Congestion Depletion lymphoid Erythrophagocytosis 1 (2%)
1 (2%)
Fibrosis 1 (2%) 2 (4%) Inflammation, granul omrItOUS
Pigmentation, hemosiderin 1 (2%) 3 (6%)
1 (2%) 1 (2%)
Integumentary System Mammary gland
Hyperplasia, cystic (49)
1 (2%) (53)
3 (6%) ( 5 0 )
1 (2%) (49)
1 (2%)
143 Lesions in Female Rats
TABLEB5 Summary of the Incidence of Nonneoplastic Lesions in Female Rats in the 2-Year Feed Study of Tricresyl Phosphate (continued)

2-Year Study (continued) Integumentary Sys tem (continued) Skin
Abscess (53) (50 )
1 (2%) (50 )
1 (2%) Inflammation, chronic 1 (2%) 2 (4%) Subcutaneous tissue, edema 1 (2%)
Musculoskeletal System Bone
Osteopetrosis (51)
1 (2%)
Nervous System Brain
Gliosis Hypothalamus, compression
Spinal cord Axon, degeneration
Respiratory System Lung
Inflammation, chronic Fat, mediastinum, necrosis
NOSe Hemorrhage Inflammation, necrotizing Inflammation, suppurative
Special Senses System Eye
Hemorrhage ( 5 )
1 (20%) (2)
Synechia 1 (50%) Cornea, inflammation, chronic 1 (20%) Lens, cataract 1 (100%) 3 (60%) 1 (50%)
Urinary System Kidney
Infarct (51)
1 (2%) (53) (50) (50)
1 (2%) Nephropathy 38 (75%) 34 (64%) 29 (58%) 22 (44%)
144 Tricresyl Phosphate, NTP TR 433
TABLEB5 Summary of the Incidence of Nonneoplastic Lesions in Female Rats in the 2-YearFeed Study of Tricresyl Phosphate (continued)

145
APPENDIX C SUMMARY OF LESIONS IN MALE MICE
IN THE 2-YEAR FEED STUDY OF TRICRESYL PHOSPHATE
TABLE C1 Summary of the Incidence of Neoplasms in Male Mice in the 2-Year Feed Study of Tricresyl Phosphate ............................. 146
TABLEC2 Individual Animal Tumor Pathology of Male Mice in the 2-Year Feed Study of Tricresyl Phosphate ............................. 152
TABLE C3 Statistical Analysis of Primary Neoplasms in Male Mice in the 2-Year Feed Study of Tricresyl Phosphate ............................. 172
TABLEC4n Historical Incidence of IIepatocellular Neoplasms in Untreated Male B6C3Fl Mice ......................................... 176
TABLEC4b Historical Incidence of IIarderian Gland Neoplasms in Untreated Male B6C3Fl Mice ......................................... 177
TABLE C5 Summary of the Incidence of Nonneoplastic Lesions in Male Mice in the 2-Year Feed Study of Tricresyl Phosphate ............................. 178

146 Tricresyl Phosphate, NTP TR 433
TABLEC l Summary o f the Incidence o f Neoplasms in Male Mice in the 2-Year Feed Study o f Tricresyl Phosphatea
0 ppm 60 ppm 125 ppm 250 ppm
Disposition Summary Animals initially i n s t u d y 3-Month intaime v m n b
95 13
95 1 s
95 1 5
95 15
PMonth intaim evaluaabnb 1 5 15 1 5 1s IS-MO,U~intaim e v m n b 15 1s 1s 15 Early deaths
Accidental deaths 1 Moribund 4 1 1 2 Natural deaths 4 5 4 6
Survivors Terminal sacrifice 43 43 41 42
Missing 1 1
Animals examined microscopically 95 94 94 95
Systems Examined at 3 Months With No Neoplusms Observed Alimentary System Cardiovascular System Endocrine System General Body System Genital System Hematopoietic System Integumentary System Musculoskeletal System Nervous System Respiratory System Special Senses System Urinary System
%Month Interim Evaluation Alimentary System Liver
Hepatocellular adenoma ('10)
1 (10%) ( 1 0 )
I (1070) Hepatocellular adenoma, multiple 1 ( 1 0 % )
Systems Examined Wilh No Neoplusms Observed Cardiovascular System Endocrine System General Body System Genital System IIematopoietic System Integumentary System Musculoskeletal System Nervous System Respiratory System Special Senses System Urinary System

Lesions in Male Mice 147
TABLEC1 Summary of the Incidence of Neoplasms in Male Mice in the 2-Year Feed Study of Tricresyl Phosphate(continued)
0 PPm 60 PPm 125 ppm 250 ppm
Liver Alimentary System 15-Month Interim Evaluation
Hepatocellular adenoma, multiple Hepatocellular adenoma Hepatocellular carcinoma Hemangiosarcoma, multiple
(10)
1 (10%) 2 (20%)
(10)
1 (10%)
(10)
2 (20%)
1 (10%)
Endocrine System
Subcapsular, adenoma Adenoma
Adrenal cortex
Lung Respiratory System
Hepatocellular carcinoma, metastatic, liver Alveolar/bronchiolar adenoma
(10)1 (10%)
Harderian gland Special Senses System
Adenoma ( 5 )1 (20%)
Urinary System Nervous System Musculoskeletal System Integumentary System IIematopoietic System Genital System General Body System Cardiovascular System Systems Examined at With No Neoplasms Observed
Gallbladder Alimentary System 2-Year Study
Intestine small, jejunum Intestine large, colon
Adenoma
Adenocarcinoma

148 Tricresyl Phosphate, NTP TR 433
TABLEC l Summary of the Incidence of Neoplasms in Male Mice in the 2-Year Feed Study of Tricresyl Phosphate (continued)
2-Year Study (continued) Alimentary System (continued) Liver
Hemangioma (52)
1(2%) (49) (49)
Hemangiosarcoma 2 (4%) Hemangiosarcoma, metastatic, spleen 1(2%) Hepatocellular carcinoma 12 (23%) 10 (20%) 8 (16%) 12 (24%) Hepatocellular carcinoma, multiple 3 (6%) 2 (4%) 2 (4%) 3 (6%) Hepatocellular adenoma 12 (23%) 12 (24%) 9 (18%) 11(22%) Hepatocellular adenoma, multiple 6 (12%) 6 (12%) 8 (16%) 7 (14%) Histiocytic sarcoma 2 (4%) 2 (4%) It0 c e l l tumor benign 1(2%) Schwannoma malignant, metastatic, nose 1 (2%)
Stomach, forestomach Squamous ce l l carcinoma
(52)1 (2%)
(49) (49)
Squamous cell papilloma 2 (4%) Tooth
Odontoma (3)
2 (67%) (3)2 (67%)
(2)2 (100%)
(1)1(100%)
Cardiovascular System Heart
Hemangiosarcoma (49)
1(2%) (49)
Hemangiosarcoma, metastatic, bone marrow 1 (2%) Histiocytic sarcoma 1(2%) 1(2%)
Endocrine System Adrenal cortex
Adenoma Bilateral, subcapsular, adenoma Subcapsular, adenoma
Adrenal medulla Pheochromocytoma benign
Islets, pancreatic Adenoma
(49)3 (6%)
Pi tu i ta ry gland Schwannoma malignant, metastatic, nose
(45) 1 (2%)
Thyroid gland Follicular cell, adenoma
(49)2 (4%)
General Body System Peritoneum
Histiocytic sarcoma (1)1(100%)
Genital System Epididymis
Histiocytic sarcoma Testes
Interstitial cell, adenoma

2-Year Study (continued) Hematopoietic System Bone marrow
Hemangiosarcoma (49) (50)
1 (2%) Histiocytic sarcoma 1 (2%) Mast c e l l tumor malignant 1 (2%) Sarcoma, metastatic, bone
Lymphnode Lymph node, mandibular
Adenocarcinoma, metastatic, harderian gland
1 (2%)
(46)
Histiocytic sarcoma Lymph node, mesenteric
Histiocytic sarcoma Spleen
Hemangiosarcoma
(46)
(49)1 (2%)
(47) 1 (2%)
(49)1 (2%)
Histiocytic sarcoma 2 (4%) Mast cell tumor malignant, metastatic, bone
marrow Thymus
Histiocytic sarcoma (42)
1 (2%) (45)
1 (2%) (45)
Integumentary System Skin
Fibrosarcoma (52) (49)
1 (2%) (49)
Hemangiosarcoma 1 (2%)
Musculoskeletal System Bone
Hemangiosarcoma, metastatic, bone marrow Femur, sarcoma
Skeletal muscle Hemangiosarcoma, metastatic, bone marrow
(52)
(1)
(50)1 (2%) 1 (2%) (1)
1 (100%)
Nervous System Brain
Schwannoma malignant, metastatic, nose (52)
Meninges, histiocytic sarcoma
Respiratory System Lung
Adenocarcinoma, metastatic, harderian gland Alveolar/bronchiolar adenoma Alveolaribronchiolar adenoma, multiple Alveolar/bronchiolar carcinoma Hepatocellular carcinoma, metastatic, liver Histiocytic sarcoma
Nose Mast cell tumor malignant, metastatic, bone
(52)1 (2%) 6 (12%) 1 (2%) 1 (2%) 6 (12%)
(52)
(49)1 (2%) 7 (14%)
4 (8%) 5 (10%) 1 (2%)
(49)
(49)
9 (18%) 2 (4%) 2 (4%)4 (8%)
(49)
(50 )
9 (18%) 2 (4%) 2 (4%) 2 (4%) 1 (2%)
(50)
marrow 1 (2%) Schwannoma malignant 1 (2%)
149 Lesions i n Male Mice
TABLEC1 Summary of the Incidence of Neoplasms in Male Mice i n the 2-Year Feed Study of Tricresyl Phosphate(continued)
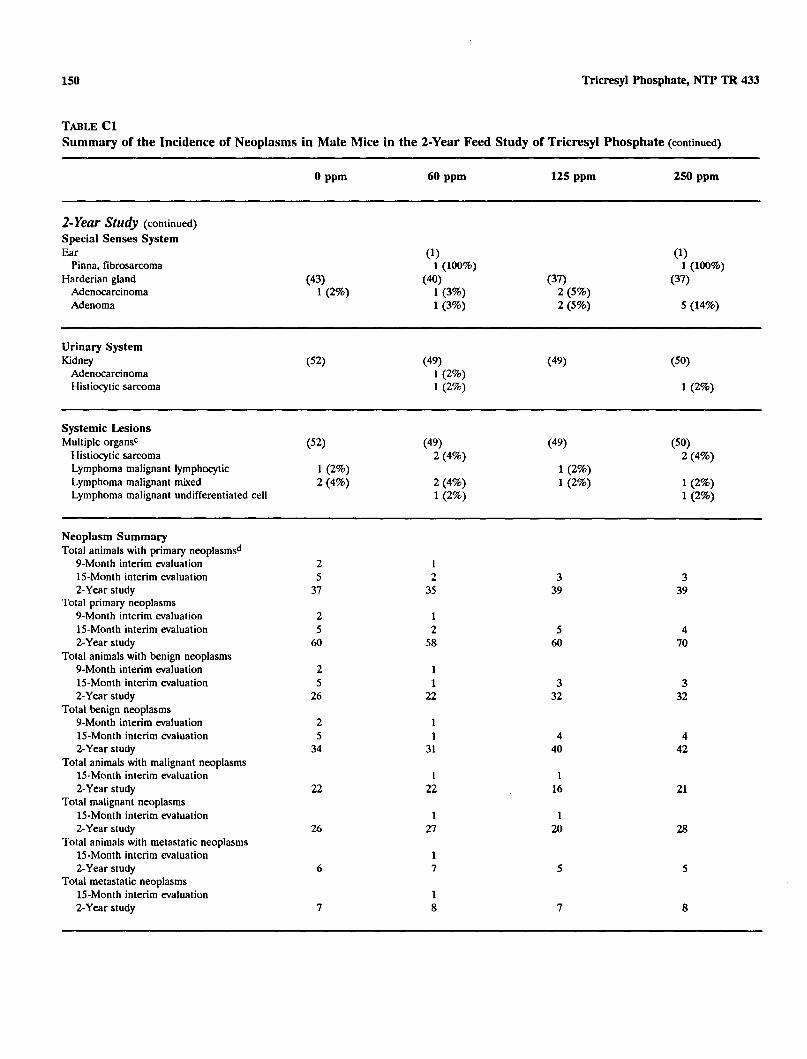
150 Tricresyl Phosphate, NTP TR 433
TABLEC1 Summary of the Incidence of Neoplasms in Male Mice in the 2-Year Feed Studyof Tricresyl Phosphate(continued)
2-YeUr study (continued) Special Senses System Ear
Pinna, fibrosarcoma Harderian gland
Adenocarcinoma Adenoma
Urinary System Kidney
Adenocarcinoma Histiocytic sarcoma
Systemic Lesions Multiple organsc
Histiocytic sarcoma Lymphoma malignant lymphocytic Lymphoma malignant mixed Lymphoma malignant undifferentiated cell
Neoplasm Summary Total animals wi th primary neoplasmsd
9-Month interim evaluation 15-Month interim evaluation 2-Year study
Total primary neoplasms 9-Month interim evaluation 15-Month interim evaluation 2-Year study
Total animals w i t h benign neoplasms 9-Month interim evaluation 15-Month interim evaluation 2-Year study
Total benign neoplasms 9-Month interim evaluation 15-Month interim evaluation 2-Year study
Total animals wi th malignant neoplasms 15-Month interim evaluation 2-Year study
Total malignant neoplasms 15-Month interim evaluation 2-Year study
Total animals wi th metastatic neoplasms 15-Month interim evaluation 2-Year study
Total metastatic neoplasms 15-Month interim evaluation 2-Year study
(43)1 (2%)
(52)
1 (2%) 2 (4%)
2 5
37
2 5 60
2 5
26
2 5
34
22
26
6
7
(1)1(100%)
(40)1 (3%) 1(3%)
(49)1 (2%) 1 (2%)
(49)2 (4%)
2 (4%) 1 (2%)
1 2
35
1 2
5 8
1 1
22
1 1
31
1 22
1 27
1 7
1 8
(37)2 (5%) 2 (5%)
(49)
(49)
1 (2%) 1 (2%)
3 39
5 60
3 32
4 40
1 16
1 20
5
7
(1)1(100%)
(37)
5 (14%)
(50)
1 (2%)
(50)2 (4%)
1(2%) 1 (2%)
3 39
4 70
3 32
4 42
21
28
5
8

151 Lesions in Mnle Mice
TABLECL Summary of the Incidence of Neoplasms in Male Mice in the 2-Year Feed Study of Tricresyl Phosphate (continued)
a Number of animals examined microscopically a t site a n d number of animals w i t h neoplasm Includes up to five animals per dose group subjected to total body perfusion for special neuropathology Number o f animals wi th any tissue examined microscopically Primary neoplasms: a l l neoplasms except metastatic neoplasms

152 Tricresyl Phosphate, NTP TR 433
TABLEC2 Individual Animal Tumor Pathology of Male Mice in the 2-Year Feed Study of Tricresyl Phosphate: 0 ppm
Number of Days on Study
Carcass ID Number
Alimentary System Esophagus Gallbladder
Adenoma Intestine large, colon Intestine large, rectum Intestine large, cecum Intestine small, duodenum Intestine small, jejunum Intestine small, ileum Liver
Hemangioma Hepatocellular carcinoma Hepatocellular carcinoma, multiple Hepatocellular adenoma Hepatocellular adenoma, multiple
Pancreas Salivary glands Stomach, forestomach
Squamous c e l l carcinoma Stomach, glandular Tooth
Odontoma
Cardiovascular System Blood vessel Hart
Endocrine System Adrenal cortex
Adenoma Bilateral, subcapsular, adenoma
Adrenal medulla Pheochromocytoma benign
Islets, pancreatic Adenoma
Parathyroid gland Pituitary gland Thyroid gland
General Body System None
Genital System Epididymis Penis Preputial gland Prostate Seminal vesicle Testes
+: Tissueexaminedmicroscopically A: Autolysisprecludesexamination
0 0 0 5 5 6 6 6 6 7 7 7 7 7 7 7 7 7 7 7 7 7 7 7 7 4 6 9 5 8 0 2 2 9 3 3 3 3 3 3 3 3 4 4 4 4 4 4 4 4 0 8 1 3 1 3 5 7 9 9 9 9 9 9 9 9 9 0 0 0 0 0 0 0 0
0 4 0 4 4 3 4 4 4 3 3 3 3 3 3 3 3 4 4 4 4 4 4 4 4 3 0 3 2 1 9 0 1 3 9 9 9 9 9 9 9 9 0 0 0 0 0 0 0 0 1 7 2 2 6 9 8 9 8 1 2 3 4 5 6 1 8 0 1 2 3 4 5 6 9
. . . . . . . . . . . . . . . . . . . . . . . . .
. . . . . . . . . . . . . . . . . . . . . . . . .
. . . . . . . . . . . . . . . . . . . . . . . . .
. . . . . . . . . . . . . . . . . . . . . . . . . + + + M + + + + + + + + + + + + + + + + + + + + + . . . . . . . . . . . . . . . . . . . . . . . . . . . . . . . . . . . . . . . . . . . . . . . . . . . . . . . . . . . . . . . . . . . . . . . . . . . . . . . . . . . . . . . . . . . . . . . . . . . .
x x x x x x X
X x x x x x . . . . . . . . . . . . . . . . . . . . . . . . . . . . . . . . . . . . . . . . . . . . . . . . . . . . . . . . . . . . . . . . . . . . . . . . . . .
X . . . . . . . . . . . . . . . . . . . . . . . . .
. . . . . . . . . . . . . . . . . . . . . . . . .
. . . . . . . . . . . . . . . . . . . . . . . . .
. . . . . . . . . . . . . . . . . . . . . . . . .
. . . . . . . . . . . . . . . . . . . . . . . . .
. . . . . . . . . . . . . . . . . . . . . . . . . + + + + + + + + + + + + + + M + + + + + + + + + + . . . . . . . . . . . . . . . . . . . . . . . . .
. . . . . . . . . . . . . . . . . . . . . . . . . +
+ + + + + + + + + + + + + + + + + + . . . . . . . . . . . . . . . . . . . . . . . . . . . . . . . . . . . . . . . . . . . . . . . . . . . . . . . . . . . . . . . . . . . . . . . . . . .
M Missingtissue X Lesionpresent I: Insufficienttissue Blank:Notexamined

153 Lesions in Male Mice
TABLEC2 Individual Animal Tumor Pathology of Male Mice in the 2-Year Feed Study of Tricresyl Phosphate: 0 ppm (continued)
Number of Days on Study
Carcass ID Number
Alimentary System Esophagus Gallbladder
Adenoma Intestine large, colon Intestine large, rectum Intestine large, cecum Intestine small, duodenum Intestine small, jejunum Intestine small, ileum Liver
Hemangioma Hepatocellular carcinoma Hepatocellular carcinoma, multiple Hepatocellular adenoma Hepatocellular adenoma, multiple
Pancreas Salivary glands Stomach, forestomach
Squamous cell carcinoma Stomach, glandular Tooth
Odontoma
Cardiovascular System B l o o d vessel Heart
Endocrine System Adrenal cortex
Adenoma Bilateral, subcapsular, adenoma
Adrenal medulla Pheochromocytoma benign
Islets, pancreatic Adenoma
Parathyroid gland Pi tu i ta ly gland Thyroid gland
General Body System None
Genital System Epididymis Penis Preputial gland Prostate Seminal vesicle Testes
1 1 1 1 1 1 1 1 1 1 1 1 1 1 1 1 1 1 1 1 1 1 1 1 1 1 1 4 4 4 4 4 4 4 4 4 4 4 4 4 4 4 4 4 4 4 4 4 4 4 4 4 4 4 0 0 0 0 0 0 0 0 0 0 0 0 0 0 0 0 0 0 0 0 0 0 0 0 0 0 0
4 4 4 4 4 4 4 4 4 4 4 4 4 4 4 4 4 4 4 4 4 4 4 4 4 4 4 Total 1 1 1 1 1 1 1 1 2 2 2 2 2 2 2 2 2 3 3 3 3 3 3 3 3 3 4 Tissues/ 0 1 2 3 4 5 1 8 0 1 3 4 5 6 1 8 9 0 1 2 3 4 5 6 7 9 0 Tumors
. . . . . . . . . . . . . . . . . . . . . . . . . . . 52 + + + M + + + + + + + + + + + + + + + + + + + + + + + 51 X 1 . . . . . . . . . . . . . . . . . . . . . . . . . . . 52 . . . . . . . . . . . . . . . . . . . . . . . . . . . 52 . . . . . . . . . . . . . . . . . . . . . . . . . . . 51 . . . . . . . . . . . . . . . . . . . . . . . . . . . 52 + M + + + + + + + + + + + + + + + + + + + + + + + + + 51 + + + + + + + + + + + + + + + + + + M + + + + + + + + 51 . . . . . . . . . . . . . . . . . . . . . . . . . . . 52
X 1 X x x x X X 12
X X 3 X X x x x x 12
X X x x x X 6 . . . . . . . . . . . . . . . . . . . . . . . . . . . 52 . . . . . . . . . . . . . . . . . . . . . . . . . . . 52 . . . . . . . . . . . . . . . . . . . . . . . . . . . 52
1 . . . . . . . . . . . . . . . . . . . . . . . . . . . 52
+ + + 3 X X 2
+ 1 . . . . . . . . . . . . . . . . . . . . . . . . . . . 52
. . . . . . . . . . . . . . . . . . . . . . . . . . . 52 X 1
X 1 . . . . . . . . . . . . . . . . . . . . . . . . . . . 52
X X 2 . . . . . . . . . . . . . . . . . . . . . . . . . . . 52
X 1 . . . . . . . . . . . . . . . . . . . . . . . . . . . 52 + + + + + + + + + + + M + + + + + + + + + + + + + + + 50 . . . . . . . . . . . . . . . . . . . . . . . . . . . 52
. . . . . . . . . . . . . . . . . . . . . . . . . . . 52 1
+ + + + + + + + + + + + + + + + + + + + + + 40 . . . . . . . . . . . . . . . . . . . . . . . . . . . 52 . . . . . . . . . . . . . . . . . . . . . . . . . . . 52 . . . . . . . . . . . . . . . . . . . . . . . . . . . 52

154 Tricresyl Phosphate, NTP TR 433
TABLEC2 Individual Animal Tumor Pathology of Mule Mice in the 2-Year Feed Study of Tricresyl Phosphate: 0 ppm (continued)
Number of Days on Study
Carcass ID Number
IIematopoietic System B l o o d Bone marrow Lymph node Lymph node, mandibular Lymph node, mesenteric Spleen
Hemangiosarcoma Thymus
Integumentary System Mammary gland Skin
Hemangiosarcoma
Musculoskeletal System Bone Skeletal muscle
Nervous System Brain Peripheral nerve Spinal cord
Respiratory System Lung
Adenocarcinoma, metastatic, harderian gland
Alveolarbronchiolar adenoma Alveolarbronchiolar adenoma, multiple
Alveolarbronchiolar carcinoma Hepatocellular carcinoma, metastatic, liver
Nose Trachea
Special Senses System EyeHarderian gland
Adenocarcinoma
Urinary System Kidney Urinary bladder
Systemic Lesions Multiple organs
Lymphoma m a l i g n a n t lymphocytic Lymphoma malignantmixed
0 0 0 5 5 6 6 6 6 7 7 7 7 7 7 7 7 7 7 7 7 7 7 7 7 4 6 9 5 8 0 2 2 9 3 3 3 3 3 3 3 3 4 4 4 4 4 4 4 4 0 8 1 3 1 3 5 7 9 9 9 9 9 9 9 9 9 0 0 0 0 0 0 0 0
0 4 0 4 4 3 4 4 4 3 3 3 3 3 3 3 3 4 4 4 4 4 4 4 4 3 0 3 2 1 9 0 1 3 9 9 9 9 9 9 9 9 0 0 0 0 0 0 0 0 1 7 2 2 6 9 8 9 8 1 2 3 4 5 6 7 8 0 1 2 3 4 5 6 9
+ . . . . . . . . . . . . . . . . . . . . . . . . . .
+ + + + + + + + + M + + + + + + + + + + + + + + + + + + + + + + + + + M + + M + + + + + + + + + + + . . . . . . . . . . . . . . . . . . . . . . . . .
X X X+ + + + + + M M M + + + M + + M + + + + + + + + +
M M M M + M M M M + M M M M M M M M M M M M M M M . . . . . . . . . . . . . . . . . . . . . . . . .
. . . . . . . . . . . . . . . . . . . . . . . . . +
. . . . . . . . . . . . . . . . . . . . . . . . .
. . . . . . . . . . . . . . . . . . . . . . . . .
. . . . . . . . . . . . . . . . . . . . . . . . .
. . . . . . . . . . . . . . . . . . . . . . . . .
X X X
X
X . . . . . . . . . . . . . . . . . . . . . . . . . . . . . . . . . . . . . . . . . . . . . . . . . .
+ + + + + M M M + + + + + + + M + + M + + + + M +
. . . . . . . . . . . . . . . . . . . . . . . . .
. . . . . . . . . . . . . . . . . . . . . . . . .
. . . . . . . . . . . . . . . . . . . . . . . . .
X

155 Lesions in Male Mice
TABLEC2 Individual Animal Tumor Pathology of Male Mice i n the 2-Year Feed Study of Tricresyl Phosphate: 0 ppm (continued)
Number of Days on Study
Carcass ID Number
Hematopoietic System Blood Bone marrow Lymph node Lymph node, mandibular Lymph node, mesenteric Spleen
Hemangiosarcoma Thymus
Integumentary System Mammary gland Skin
Hemangiosarcoma
Musculoskeletal System Bone Skeletal muscle
Nervous System Brain Peripheral nerve Spinal cord
Respiratory System Lung
Adenocarcinoma, metastatic, harderian gland
Alveolar/bronchiolar adenoma Alveolarbronchiolar adenoma, multiple
Alveolarbronchiolar carcinoma Hepatocellular carcinoma, metastatic, liver
Nose Trachea
Special Senses System EyeHarderian gland
Adenocarcinoma
Urinary System Kidney Urinary bladder
Systemic Lesions Multiple organs
Lymphoma m a l i g n a n t lymphocytic Lymphoma mal ignant mixed
7 7 7 7 7 7 7 7 7 7 7 7 7 7 7 7 7 7 7 7 7 7 7 7 7 7 7 4 4 4 4 4 4 4 4 4 4 4 4 4 4 4 4 4 4 4 4 4 4 4 4 4 4 4 0 0 0 0 0 0 0 0 0 0 0 0 0 0 0 0 0 0 0 0 0 0 0 0 0 0 0
4 4 4 4 4 4 4 4 4 4 4 4 4 4 4 4 4 4 4 4 4 4 4 4 4 4 4 Total 1 1 1 1 1 1 1 1 2 2 2 2 2 2 2 2 2 3 3 3 3 3 3 3 3 3 4 Tissues/ 0 1 2 3 4 5 7 8 0 1 3 4 5 6 7 8 9 0 1 2 3 4 5 6 7 9 0 Tumors
1 . . . . . . . . . . . . . . . . . . . . . . . . . . . 52
+ 1 . . . . . . . . . . . . . . . . . . . . . . . . . . . 51 . . . . . . . . . . . . . . . . . . . . . . . . . . . 50 . . . . . . . . . . . . . . . . . . . . . . . . . . . 52
X 4 + + + + + + M + + + + + + + + + + + + + + + M + + + + 45
M M M M M M M M M M M M M + M M M M M M M M M M M M M 3 . . . . . . . . . . . . . . . . . . . . . . . . . . . 52
X 1
. . . . . . . . . . . . . . . . . . . . . . . . . . . 52 1
. . . . . . . . . . . . . . . . . . . . . . . . . . . 52
. . . . . . . . . . . . . . . . . . . . . . . . . . . 52
. . . . . . . . . . . . . . . . . . . . . . . . . . . 52
. . . . . . . . . . . . . . . . . . . . . . . . . . . 52
X 1 X x x 6
1 X 1
X X X x x 6 . . . . . . . . . . . . . . . . . . . . . . . . . . . 52 . . . . . . . . . . . . . . . . . . . . . . . . . . . 52
+ 1 t + + + + + + + + + + + + + + + + M M + + + + + + M + 43
X 1
. . . . . . . . . . . . . . . . . . . . . . . . . . . 52
. . . . . . . . . . . . . . . . . . . . . . . . . . . 52
. . . . . . . . . . . . . . . . . . . . . . . . . . . 52 X 1
X 2

156 Tricresyl Phosphate, NTP TR 433
TABLEC2 Individual Animal Tumor Pathology of Male Mice in the 2-Year Feed Study of Tricresyl Phosphate: 60 ppm
Number of Days on Study
Carcass ID Number
Alimentary System Esophagus Gallbladder Intestine large, colon Intestine large, rectum Intestine large, cecum Intestine small, duodenum Intestine small, jejunum Intestine small, ileum Liver
Hemangiosarcoma, metastatic, spleen Hepatocellular carcinoma Hepatocellular carcinoma, multiple Hepatocellular adenoma Hepatocellular adenoma, multiple Histiocytic sarcoma
Pancreas Salivary glands Stomach, forestomach Stomach, glandular Tooth
Odontoma
Cardiovascular System Heart
Hemangiosarcoma Histiocytic sarcoma
Endocrine System Adrenal cortex
Bilateral, subcapsular, adenoma Subcapsular, adenoma
Adrenal medulla Islets, pancreatic Parathyroid gland Pi tu i ta ry gland Thyroid gland
General Body System Peritoneum
Histiocytic sarcoma
Genital System Epididymis
Histiocytic sarcoma Preputial gland Prostate Seminal vesicle Testes
3 4 6 7 7 7 7 7 7 7 7 7 7 7 7 7 7 7 7 7 7 7 7 7 9 8 8 0 0 0 3 3 3 3 3 3 3 3 3 3 3 3 3 3 3 3 3 3 7 1 7 3 3 8 8 8 8 8 8 8 8 8 8 8 8 8 8 8 8 9 9 9
4 4 4 4 4 4 4 4 4 4 4 4 4 4 4 4 4 4 4 4 4 4 4 4 5 7 7 4 7 8 4 4 4 4 4 4 4 4 5 5 5 5 5 5 5 5 5 6 8 3 2 7 8 6 1 2 3 4 5 6 8 9 0 1 2 3 4 5 6 7 9 0
. . . . . . . . . . . . . . . . . . . . . . . . + + M + + + + + + + + + + + + + + + + + + + + + . . . . . . . . . . . . . . . . . . . . . . . . . . . . . . . . . . . . . . . . . . . . . . . . . . . . . . . . . . . . . . . . . . . . . . . . . . . . . . . . . . . . . . . . . . . . . . . . . . . . . . . . . . . . . . . . . . . . . . . + + + + + + + + M + + + + + + + + + + + + + + + . . . . . . . . . . . . . . . . . . . . . . . .
x x x X X X
X x x x x x X x x X
X X . . . . . . . . . . . . . . . . . . . . . . . . . . . . . . . . . . . . . . . . . . . . . . . . . . . . . . . . . . . . . . . . . . . . . . . . . . . . . . . . . . . . . . . . . . . . . . . .
+ + X
. . . . . . . . . . . . . . . . . . . . . . . .
X
. . . . . . . . . . . . . . . . . . . . . . . . X
. . . . . . . . . . . . . . . . . . . . . . . .
. . . . . . . . . . . . . . . . . . . . . . . . + + + + + + + + + + M + + + + + + + + + + M + M . . . . . . . . . . . . . . . . . . . . . . . . . . . . . . . . . . . . . . . . . . . . . . . .
+ X
. . . . . . . . . . . . . . . . . . . . . . . . X
+ + + + + + + + + + ++ + . . . . . . . . . . . . . . . . . . . . . . . . . . . . . . . . . . . . . . . . . . . . . . . . . . . . . . . . . . . . . . . . . . . . . . . .
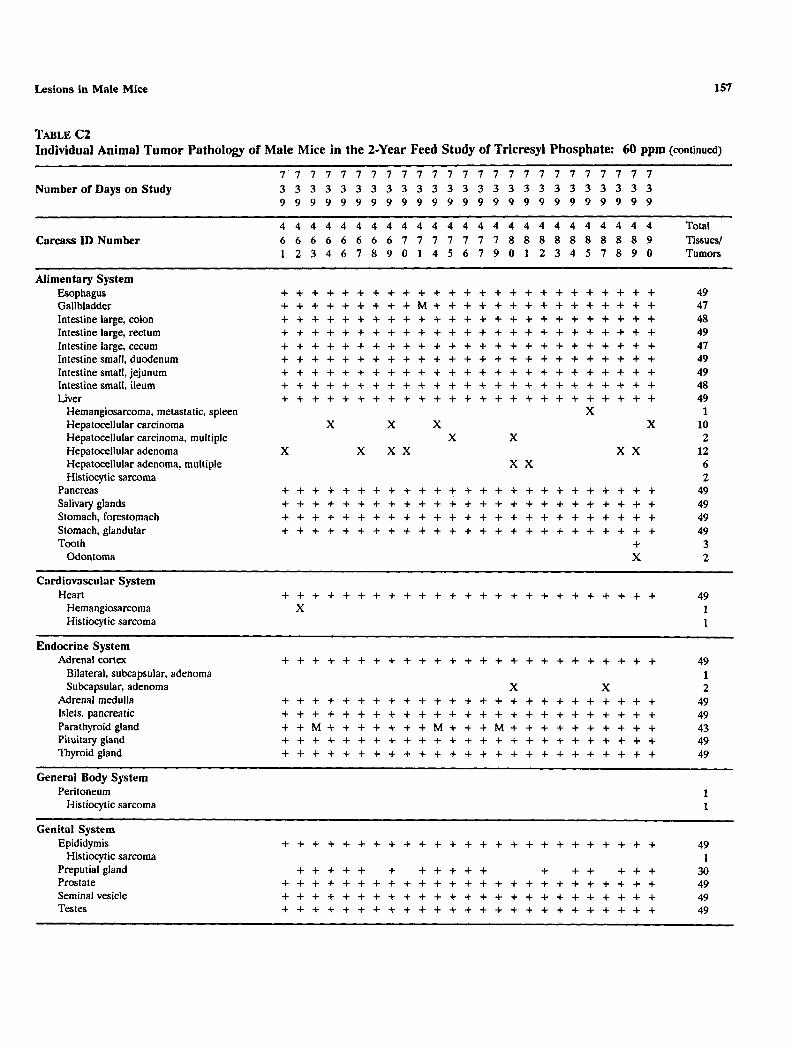
157 Lesions in Male Mice
TABLEC2 Individual Animal Tumor Pathology of Male Mice in the 2-Year Feed Study of Tricresyl Phosphate: 60 ppm (continued)
Number of Days on Study
Carcass ID Number
Alimentary System Esophagus Gallbladder Intestine large, colon Intestine large, rectum Intestine large, cecum Intestine small, duodenum Intestine small, jejunum Intestine small, ileum Liver
Hemangiosarcoma, metastatic, spleen Hepatocellular carcinoma Hepatocellular carcinoma, multiple Hepatocellular adenoma Hepatocellular adenoma, multiple Histiocytic sarcoma
Pancreas Salivary glands Stomach, forestomach Stomach, glandular Tooth
Odontoma
Cardiovascular System Heart
Hemangiosarcoma Histiocytic sarcoma
Adrenal cortex Bilateral, subcapsular, adenoma Subcapsular, adenoma
Adrenal medulla Islets, pancreatic Parathyroid gland Pituitary gland Thyroid gland
General Body System Peritoneum
Histiocytic sarcoma
Genital System Epididymis
Histiocytic sarcoma Preputial gland Prostate Seminal vesicle Testes
7 7 7 7 7 7 7 7 7 7 7 7 7 7 7 7 7 7 7 7 7 7 7 7 7 3 3 3 3 3 3 3 3 3 3 3 3 3 3 3 3 3 3 3 3 3 3 3 3 3 9 9 9 9 9 9 9 9 9 9 9 9 9 9 9 9 9 9 9 9 9 9 9 9 9
4 4 4 4 4 4 4 4 4 4 4 4 4 4 4 4 4 4 4 4 4 4 4 4 4 Total 6 6 6 6 6 6 6 6 1 7 7 7 7 7 7 8 8 8 8 8 8 8 8 8 9 Tissues] 1 2 3 4 6 7 8 9 0 1 4 5 6 7 9 0 1 2 3 4 5 7 8 9 0 Tumors
. . . . . . . . . . . . . . . . . . . . . . . . . 49 + + + + + + + + + M + + + + + + + + + + + + + + + 47 . . . . . . . . . . . . . . . . . . . . . . . . . 48 . . . . . . . . . . . . . . . . . . . . . . . . . 49 . . . . . . . . . . . . . . . . . . . . . . . . . 47 . . . . . . . . . . . . . . . . . . . . . . . . . 49 . . . . . . . . . . . . . . . . . . . . . . . . . 49 . . . . . . . . . . . . . . . . . . . . . . . . . 48 . . . . . . . . . . . . . . . . . . . . . . . . . 49
X 1 X X X X 10
X X 2 X x x x x x 12
x x 6 2
. . . . . . . . . . . . . . . . . . . . . . . . . 49
. . . . . . . . . . . . . . . . . . . . . . . . . 49
. . . . . . . . . . . . . . . . . . . . . . . . . 49
. . . . . . . . . . . . . . . . . . . . . . . . . 49 + 3 X 2
. . . . . . . . . . . . . . . . . . . . . . . . . 49 X 1
1
. . . . . . . . . . . . . . . . . . . . . . . . . 49 1
X X 2 . . . . . . . . . . . . . . . . . . . . . . . . . 49 . . . . . . . . . . . . . . . . . . . . . . . . . 49 + + M + + + + + + + M + + + M + + + + + + + + + + 43 . . . . . . . . . . . . . . . . . . . . . . . . . 49 . . . . . . . . . . . . . . . . . . . . . . . . . 49
1 1
~ ~ ~~
. . . . . . . . . . . . . . . . . . . . . . . . . 49 1
+ + + + + + + + + + + + + ++ + + 30 . . . . . . . . . . . . . . . . . . . . . . . . . 49 . . . . . . . . . . . . . . . . . . . . . . . . . 49 . . . . . . . . . . . . . . . . . . . . . . . . . 49

158 Tricresyl Phosphate, NTP TR 433
TABLEC2 Individual Animal Tumor Pathology of Male Mice in the 2-Year Feed Study of Tricresyl Phosphate: 60 ppm (continued)
Number of Days on Study
Carcass ID Number
Hematopoietic System Bone marrow
Histiocytic sarcoma Lymph node Lymph node, mandibular
Adenocarcinoma, metastatic, harderian gland
Histiocytic sarcoma Lymph node, mesenteric
Histiocytic sarcoma Spleen
Hemangiosarcoma Histiocytic sarcoma
Thymus Histiocytic sarcoma
Integumentary System Mammary gland Skin
Fibrosarcoma
Musculoskeletal System Bone
Nervous System Brain
Meninges, histiocytic sarcoma Peripheral nerve Spinal cord
Respiratory System Lung
Adenocarcinoma, metastatic, harderian gland
Alveolarbronchiolar adenoma Alveolarbronchiolar carcinoma Hepatocellular carcinoma, metastatic, liver
Histiocytic sarcoma Nose Trachea
~~~~~~~~
Special Senses System Ear
Pinna, fibrosarcoma EyeHarderian gland
Adenocarcinoma Adenoma
3 4 6 1 1 1 1 1 1 1 1 1 1 1 1 1 1 1 1 1 1 1 1 1 9 8 8 0 0 0 3 3 3 3 3 3 3 3 3 3 3 3 3 3 3 3 3 3 I 1 1 3 3 8 8 8 8 8 8 8 8 8 8 8 8 8 8 8 8 9 9 9
4 4 4 4 4 4 4 4 4 4 4 4 4 4 4 4 4 4 4 4 4 4 4 4 5 1 1 4 1 8 4 4 4 4 4 4 4 4 5 5 5 5 5 5 5 5 5 6 8 3 2 7 8 6 1 2 3 4 5 6 8 9 0 1 2 3 4 5 6 7 9 0
. . . . . . . . . . . . . . . . . . . . . . . . .,A +
+ + M + + + + + + + + + + + + + + + + + + + + +
X X + + + + + M + + + + + + + + + + + + + + + + + + X . . . . . . . . . . . . . . . . . . . . . . . .
X + M + + + M + + + + + + + + + + + M + + + M + M X
M M M M M M M M M + M M M M M M M M M M + M + + . . . . . . . . . . . . . . . . . . . . . . . .
X
. . . . . . . . . . . . . . . . . . . . . . . .
. . . . . . . . . . . . . . . . . . . . . . . . X . . . . . . . . . . . . . . . . . . . . . . . . . . . . . . . . . . . . . . . . . . . . . . . .
. . . . . . . . . . . . . . . . . . . . . . . .
X X X
X X x x X X X
X . . . . . . . . . . . . . . . . . . . . . . . . . . . . . . . . . . . . . . . . . . . . . . . .
+ + + + + + + + + M + + + + + M + + + + + + + + +
X X

Lesions in Male Mice
TABLEC2 Individual Animal Tumor Pathology of
Number of Days on Study
Carcass ID Number
Hematopoietic System Bone marrow
Histiocytic sarcoma Lymph node Lymph node, mandibular
Adenocarcinoma, metastatic, harderian gland
Histiocytic sarcoma Lymph node, mesenteric
Histiocytic sarcoma Spleen
Hemangiosarcoma Histiocytic sarcoma
Thymus Histiocytic sarcoma
Integumentary System Mammary gland Skin
Fibrosarcoma
Musculoskeletal System Bone
Nervous System Brain
Meninges, histiocytic sarcoma Peripheral newe Spinal cord
Respiratory System Lung
Adenocarcinoma, metastatic, harderian gland
Alveolarbronchiolar adenoma Alveolarbronchiolar carcinoma Hepatocellular carcinoma, metastatic, liver
Histiocytic sarcoma Nose Trachea
Special Senses System Ear
Pinna, fibrosarcoma EyeHarderian gland
Adenocarcinoma Adenoma
Male Mice in the 2-Year Feed Study of Tricresyl Phosphate: 60 ppm
7 7 7 7 7 7 7 7 7 7 7 7 7 7 7 7 7 7 7 7 7 7 7 7 7 3 3 3 3 3 3 3 3 3 3 3 3 3 3 3 3 3 3 3 3 3 3 3 3 3 9 9 9 9 9 9 9 9 9 9 9 9 9 9 9 9 9 9 9 9 9 9 9 9 9
4 4 4 4 4 4 4 4 4 4 4 4 4 4 4 4 4 4 4 4 4 4 4 4 4 6 6 6 6 6 6 6 6 7 7 7 7 7 7 7 8 8 8 8 8 8 8 8 8 9 1 2 3 4 6 7 8 9 0 1 4 5 6 7 9 0 1 2 3 4 5 7 8 9 0
. . . . . . . . . . . . . . . . . . . . . . . . . +
+ + + + + + + M + + + + + + + + + + + + M + + + +
+ + + + + + + + + + + + + + M + + + + + + + + + +
. . . . . . . . . . . . . . . . . . . . . . . . . X
+ + + + + + + M + + M + + + + + + + + + + + + + +
+ M M M M M M M M M M M M M M + M M M M M M + M M . . . . . . . . . . . . . . . . . . . . . . . . .
. . . . . . . . . . . . . . . . . . . . . . . . .
. . . . . . . . . . . . . . . . . . . . . . . . .
. . . . . . . . . . . . . . . . . . . . . . . . .
. . . . . . . . . . . . . . . . . . . . . . . . .
. . . . . . . . . . . . . . . . . . . . . . . . .
X x x x x
X X
. . . . . . . . . . . . . . . . . . . . . . . . .
. . . . . . . . . . . . . . . . . . . . . . . . .
+ X
+ + + + + + M + + M + M + + M + M + + + M + + M +
159
(continued)
Total Tissues/ Tumors
49 1 2 46
1 1
47 1
49 1 1
42 1
7 49 1
49
49 1
49 49
49
1 7 4
5 1
49 49
1 1 1
40 1 1

160 Tricresyl Phosphate, NTP TR 433
TABLEC2 Individual Animal Tumor Pathology of Male Mice in the 2-Year Feed Study of Tricresyl Phosphate: 60 ppm (continued)
Number of Days on Study
Carcass ID Number
Urinary System Kidney
Adenocarcinoma Histiocytic sarcoma
Urinary bladder
Systemic Lesions Multiple organs
Histiocytic sarcoma Lymphoma malignant mixed Lymphoma malignant undifferentiated
cell type
3 4 6 1 1 1 1 1 1 1 1 1 1 1 1 1 1 1 1 1 1 1 1 1 9 8 8 0 0 0 3 3 3 3 3 3 3 3 3 3 3 3 3 3 3 3 3 3 7 1 1 3 3 8 8 8 8 8 8 8 8 8 8 8 8 8 8 8 8 9 9 9
4 4 4 4 4 4 4 4 4 4 4 4 4 4 4 4 4 4 4 4 4 4 4 4 5 1 1 4 1 8 4 4 4 4 4 4 4 4 5 5 5 5 5 5 5 5 5 6 8 3 2 7 8 6 1 2 3 4 5 6 8 9 0 1 2 3 4 5 6 1 9 0
. . . . . . . . . . . . . . . . . . . . . . . . X
X . . . . . . . . . . . . . . . . . . . . . . . .
. . . . . . . . . . . . . . . . . . . . . . . . X X
X

161 Lesions in Male Mice
TABLE C2 Individual Animal Tumor Pathology of Male Mice in the 2-Year Feed Study of Tricresyl Phosphate: 60 ppm (continued)
Number of Days on Study
Carcass ID Number
Urinary System Kidney
Adenocarcinoma Histiocytic sarcoma
Urinary bladder
Systemic Lesions Multiple organs
Histiocytic sarcoma Lymphoma malignant mixed Lymphoma malignant undifferentiated
c e l l type
7 7 7 7 7 7 7 7 7 7 7 7 7 7 7 7 7 7 7 7 7 7 7 7 7 ~ ~~
3 3 3 3 3 3 3 3 3 3 3 3 3 3 3 3 3 3 3 3 3 3 3 3 3 9 9 9 9 9 9 9 9 9 9 9 9 9 9 9 9 9 9 9 9 9 9 9 9 9
4 4 4 4 4 4 4 4 4 4 4 4 4 4 4 4 4 4 4 4 4 4 4 4 4 Total 6 6 6 6 6 6 6 6 7 7 7 7 7 7 7 8 8 8 8 8 8 8 8 8 9 Tissues/ 1 2 3 4 6 7 8 9 0 1 4 5 6 7 9 0 1 2 3 4 5 7 8 9 0 Tumors
. . . . . . . . . . . . . . . . . . . . . . . . . 49 1 1
. . . . . . . . . . . . . . . . . . . . . . . . . 49
. . . . . . . . . . . . . . . . . . . . . . . . . 49 2
x x 2
1

162
TABLEC2 Individual Animal Tumor Pathology
Number of Days on Study
Carcass ID Number
Alimentary System Esophagus Gallbladder Intestine large, colon Intestine large, rectum Intestine large, cecum Intestine small, duodenum Intestine small, jejunum Intestine small, ileum Liver
Hemangiosarcoma Hepatocellular carcinoma Hepatocellular carcinoma, multiple Hepatocellular adenoma Hepatocellular adenoma, multiple Schwannoma malignant, metastatic,
nose Mesentery Pancreas Salivary glands Stomach, forestomach
Squamous cell papilloma Stomach, glandular Tooth
Odontoma
Cardiovascular System Heart
Endocrine System Adrenal cortex
Subcapsular, adenoma Adrenal medulla Islets, pancreatic
Adenoma Parathyroid gland Pituitary gland
Schwannoma malignant, metastatic, nose
Thyroid gland Follicular cell, adenoma
General Body System None
Genital System Epididymis Preputial gland Prostate Seminal vesicle Testes
Tricresyl Phosphate, NTP TR 433
of Male Mice in the 2-Year Feed Study of Tricresyl Phosphate: 125 ppm
5 5 6 6 7 7 7 7 7 7 7 7 7 1 7 1 7 1 1 7 1 1 7 1 7 8 6 9 1 3 3 3 3 3 3 3 3 3 3 3 3 3 3 3 3 3 3 3 2 3 7 8 8 1 1 7 7 7 7 1 7 1 7 7 1 7 7 7 7 7 7 7
5 5 4 4 4 4 4 4 4 4 4 5 5 5 5 5 5 5 5 5 5 5 5 5 2 1 9 9 9 9 9 9 9 9 9 0 0 0 0 0 0 0 0 0 0 1 1 1 8 1 5 6 8 1 2 3 4 1 9 0 1 2 3 4 5 6 1 8 9 0 2 3
. . . . . . . . . . . . . . . . . . . . . . . .
. . . . . . . . . . . . . . . . . . . . . . . .
. . . . . . . . . . . . . . . . . . . . . . . .
. . . . . . . . . . . . . . . . . . . . . . . .
. . . . . . . . . . . . . . . . . . . . . . . .
. . . . . . . . . . . . . . . . . . . . . . . .
. . . . . . . . . . . . . . . . . . . . . . . .
. . . . . . . . . . . . . . . . . . . . . . . .
. . . . . . . . . . . . . . . . . . . . . . . . X
x x x x X X
x x x x x x x
X
. . . . . . . . . . . . . . . . . . . . . . . .
. . . . . . . . . . . . . . . . . . . . . . . .
. . . . . . . . . . . . . . . . . . . . . . . .
. . . . . . . . . . . . . . . . . . . . . . . . + X
. . . . . . . . . . . . . . . . . . . . . . . .
. . . . . . . . . . . . . . . . . . . . . . . .
. . . . . . . . . . . . . . . . . . . . . . . .
. . . . . . . . . . . . . . . . . . . . . . . . X X
+ + + + + + M + + M M + + + + + M + + + + + + + + + + M + + + + + + + + + + + M + + + + + + + M
X . . . . . . . . . . . . . . . . . . . . . . . .
X
. . . . . . . . . . . . . . . . . . . . . . . . + + + + + + + + + + + + + + + + + + + + + . . . . . . . . . . . . . . . . . . . . . . . . . . . . . . . . . . . . . . . . . . . . . . . . . . . . . . . . . . . . . . . . . . . . . . . .

163 Lesions in Male Mice
TABLEC2 Individual Animal Tumor Pathology of Male Mice in the 2-Year Feed Study of Tricresyl Phosphate: 125 ppm (continued)
Number of Days on Study
Carcass ID Number
Alimentary System Esophagus Gallbladder Intestine large, colon Intestine large, rectum Intestine large, cecum Intestine small, duodenum Intestine small, jejunum Intestine small, ileum Liver
Hemangiosarcoma Hepatocellular carcinoma Hepatocellular carcinoma, multiple Hepatocellular adenoma Hepatocellular adenoma, multiple Schwannoma malignant, metastatic, nose
Mesentery Pancreas Salivary glands Stomach, forestomach
Squamous cell papilloma Stomach, glandular Tmth
Odontoma
Cardiovascular System Heart
Endocrine System Adrenal cortex
Subcapsular, adenoma Adrenal medulla Islets, pancreatic
Adenoma Parathyroid gland Pituitaly gland
Schwannoma malignant, metastatic, nose
Thyroid gland Follicular cell, adenoma
General Body System None
Genital System Epididymis Preputial gland Prostate Seminal vesicle Testes
1 1 1 1 1 1 1 1 1 1 1 1 1 7 1 1 1 1 7 1 1 1 7 1 1 3 3 3 3 3 3 3 3 3 3 3 3 3 3 3 3 3 3 3 3 3 3 3 3 3 7 7 1 7 7 8 8 8 8 8 8 8 8 8 8 8 8 8 8 8 8 8 8 8 8
5 5 5 5 5 5 5 5 5 5 5 5 5 5 5 5 5 5 5 5 5 5 5 5 5 Total 1 1 1 1 1 1 2 2 2 2 2 2 2 2 3 3 3 3 3 3 3 3 3 3 4 Tissues/ 4 5 6 1 8 9 0 1 2 3 4 6 7 9 0 1 2 3 4 5 6 7 8 9 0 Tumors
. . . . . . . . . . . . . . . . . . . . . . . . . 49
. . . . . . . . . . . . . . . . . . . . . . . . . 41
. . . . . . . . . . . . . . . . . . . . . . . . . 49 + + M + + + + + + + + + + + + + + + + + + + + + + 48 . . . . . . . . . . . . . . . . . . . . . . . . . 49 . . . . . . . . . . . . . . . . . . . . . . . . . 49 . . . . . . . . . . . . . . . . . . . . . . . . . 49 . . . . . . . . . . . . . . . . . . . . . . . . . 49 . . . . . . . . . . . . . . . . . . . . . . . . . 49
A.. 2 X x x X 8
2 X x x x x x x 9
x x X 8
1 + + 2
. . . . . . . . . . . . . . . . . . . . . . . . . 49
. . . . . . . . . . . . . . . . . . . . . . . . . 49
. . . . . . . . . . . . . . . . . . . . . . . . . 49 X X 2
. . . . . . . . . . . . . . . . . . . . . . . . . 49 + 2 X 2
. . . . . . . . . . . . . . . . . . . . . . . . . 49
. . . . . . . . . . . . . . . . . . . . . . . . . 49 X 1
. . . . . . . . . . . . . . . . . . . . . . . . . 49
. . . . . . . . . . . . . . . . . . . . . . . . . 49 X 3
M + + + + + + + + + + + + + + + + + M + + M + + + 42 + + + + + + + + M + + + + + + + + + + + + + + + + 45
1 . . . . . . . . . . . . . . . . . . . . . . . . . 49
X 2
. . . . . . . . . . . . . . . . . . . . . . . . . 49 + + + + + + + + + + + + + + + + + + + + 41
. . . . . . . . . . . . . . . . . . . . . . . . . 49
. . . . . . . . . . . . . . . . . . . . . . . . . 49
. . . . . . . . . . . . . . . . . . . . . . . . . 49

164 Tricresyl Phosphate, NTP TR 433
TABLEC2 Individual Animal Tumor Pathology of Male Mice in the 2-Year Feed Study of Tricresyl Phosphate: 125 ppm (continued)
Number of Days on Study
Carcass ID Number
Hematopoietic System Bone marrow Lymph node Lymph node, mandibular Lymph node, mesenteric Spleen
Hemangiosarcoma Thymus
Integumentary System Mammary gland Skin
Musculoskeletal System Bone
Nervous System Brain
Schwannoma malignant, metastatic, nose
Peripheral newe Spinal cord
~~~~
Respiratory System Lung
Alveolarbronchiolar adenoma Alveolarbronchiolar adenoma,
multiple Alveolarbronchiolar carcinoma Hepatocellular carcinoma, metastatic, liver
Nose Schwannoma malignant
Trachea
Special Senses System Harderian gland
Adenocarcinoma Adenoma
Urinary System Kidney Urinary bladder
Systemic Lesions Multiple organs
Lymphoma malignant lymphocytic Lymphoma malignant mixed
5 5 6 6 7 7 7 7 7 7 7 7 7 7 7 7 7 7 7 7 7 7 7 7 I 8 6 9 1 3 3 3 3 3 3 3 3 3 3 3 3 3 3 3 3 3 3 3 2 3 7 8 8 7 7 1 1 1 1 1 7 1 7 7 1 1 1 7 1 7 7 1
5 5 4 4 4 4 4 4 4 4 4 5 5 5 5 5 5 5 5 5 5 5 5 5 2 1 9 9 9 9 9 9 9 9 9 0 0 0 0 0 0 0 0 0 0 1 1 1 8 1 5 6 8 1 2 3 4 7 9 0 1 2 3 4 5 6 7 8 9 0 2 3
. . . . . . . . . . . . . . . . . . . . . . . . +
M + + + + M + + + + + + + M + + + + + + + + + + + + M + + + + + + + + + + + + + + + + + + + M + . . . . . . . . . . . . . . . . . . . . . . . .
X M + + + M + + + + + + + + M + + + + + + + M + +
M + M M M M M M M M M M M M M M + M M M M M M M . . . . . . . . . . . . . . . . . . . . . . . .
. . . . . . . . . . . . . . . . . . . . . . . .
. . . . . . . . . . . . . . . . . . . . . . . .
X . . . . . . . . . . . . . . . . . . . . . . . . . . . . . . . . . . . . . . . . . . . . . . . .
. . . . . . . . . . . . . . . . . . . . . . . . X X x x x
X X
x x X . . . . . . . . . . . . . . . . . . . . . . . .
X . . . . . . . . . . . . . . . . . . . . . . . .
+ M + + M M + + M M + M + M + + + M M + + + + + X X
. . . . . . . . . . . . . . . . . . . . . . . .
. . . . . . . . . . . . . . . . . . . . . . . .
. . . . . . . . . . . . . . . . . . . . . . . . X

165 Lesions in Male Mice
TABLEC2 Individual Animal Tumor Pathology of Male Mice in the 2-Year Feed Study of Tricresyl Phosphate: 125 ppm (continued)
Number of Days on Study
Carcass ID Number
Hematopoietic System Bone marrow Lymph node Lymph node, mandibular Lymph node, mesenteric Spleen
Hemangiosarcoma Thymus
Integumentary System Mammary gland Skin
Musculoskeletal System Bone
Nervous System Brain
Schwannoma malignant, metastatic, nose
Peripheral nerve Spinal cord
Respiratory System Lung
Alveolarbronchiolar adenoma Alveolarbronchiolar adenoma,
multiple Alveolarbronchiolar carcinoma Hepatocellular carcinoma, metastatic,
liver Nose
Schwannoma malignant Trachea
Special Senses System Harderian gland
Adenocarcinoma Adenoma
Urinary System Kidney Urinary bladder
Systemic Lesions Multiple organs
Lymphoma malignant lymphocytic Lymphoma malignant mixed
7 7 7 7 7 7 7 7 7 7 7 7 7 1 7 7 7 7 7 7 7 7 7 7 7 3 3 3 3 3 3 3 3 3 3 3 3 3 3 3 3 3 3 3 3 3 3 3 3 3 7 7 7 7 7 8 8 8 8 8 8 8 8 8 8 8 8 8 8 8 8 8 8 8 8
5 5 5 5 5 5 5 5 5 5 5 5 5 5 5 5 5 5 5 5 5 5 5 5 5 Total 1 1 1 1 1 1 2 2 2 2 2 2 2 2 3 3 3 3 3 3 3 3 3 3 4 Tissues/4 5 6 7 8 9 0 1 2 3 4 6 7 9 0 1 2 3 4 5 6 7 8 9 0 Tumors
. . . . . . . . . . . . . . . . . . . . . . . . . 49 1
+ + M + + + + + + + + + M + + + M + + + + + + + + 43 + M + + + + + + + + + + + + + + + + + + + + + + + 46 . . . . . . . . . . . . . . . . . . . . . . . . . 49
1 . . . . . . . . . . . . . . . . . . . . . . . . . 45
+ M M M M M M M M M M M M + M M M M + M M M M M M 5 . . . . . . . . . . . . . . . . . . . . . . . . . 49
. . . . . . . . . . . . . . . . . . . . . . . . . 49
. . . . . . . . . . . . . . . . . . . . . . . . . 49
1 . . . . . . . . . . . . . . . . . . . . . . . . . 49 . . . . . . . . . . . . . . . . . . . . . . . . . 49
. . . . . . . . . . . . . . . . . . . . . . . . . 49 X X X X 9
X X 2 2
X 4 . . . . . . . . . . . . . . . . . . . . . . . . . 49
1 . . . . . . . . . . . . . . . . . . . . . . . . . 49
+ + + + + + + M + + M + + + + + + M + + + + + + + 37 X 2
X 2
. . . . . . . . . . . . . . . . . . . . . . . . . 49
. . . . . . . . . . . . . . . . . . . . . . . . . 49
. . . . . . . . . . . . . . . . . . . . . . . . . 49 1
X 1
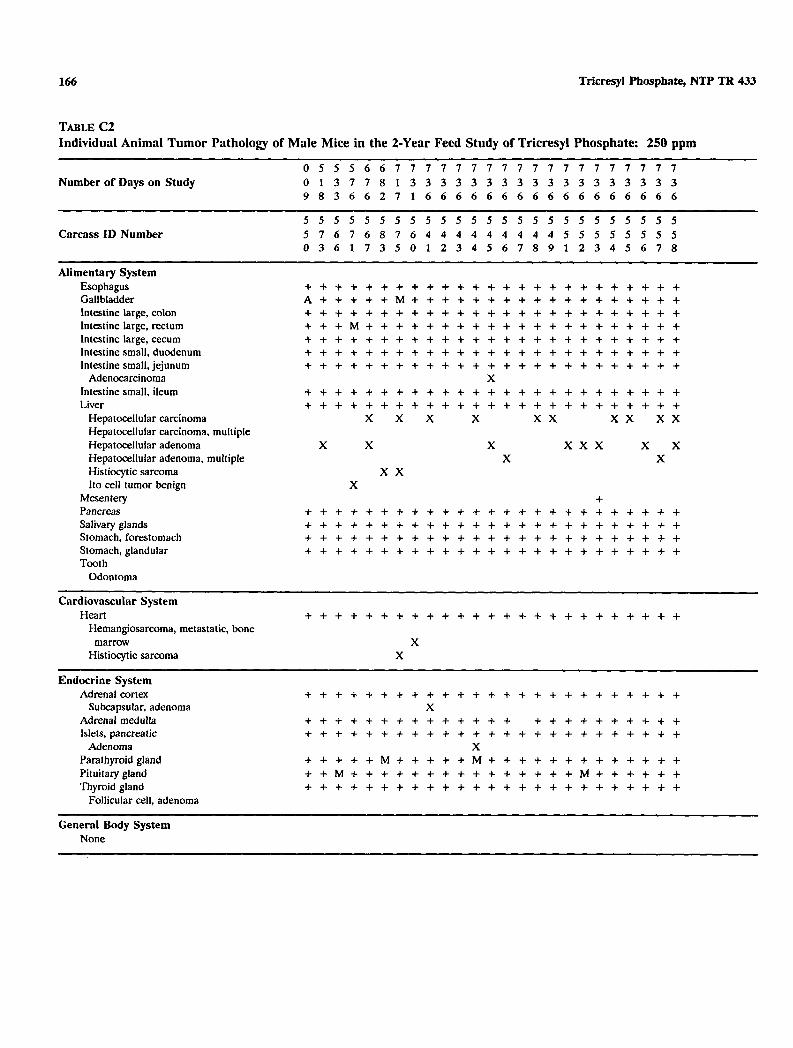
166 Tricresyl Phosphate, NTP TR 433
TABLEC2 Individual Animal Tumor Pathology of Male Mice in the 2-Year Feed Study of Tricresyl Phosphate: 250 ppm
Number of Days on Study
Carcass I D Number
Alimentary System Esophagus Gallbladder Intestine large, colon Intestine large, rectum Intestine large, cecum Intestine small, duodenum Intestine small, jejunum
Adenocarcinoma Intestine small, ileum Liver
Hepatocellular carcinoma Hepatocellular carcinoma, multiple Hepatocellular adenoma Hepatocellular adenoma, multiple Histiocytic sarcoma I t 0 c e l l tumor benign
Mesentery Pancreas Salivary glands Stomach, forestomach Stomach, glandular Tooth
Odontoma
Cardiovascular System Heart
Hemangiosarcoma, metastatic, bone marrow
Histiocytic sarcoma
Endocrine System Adrenal cortex
Subcapsular, adenoma Adrenal medulla Islets, pancreatic
Adenoma Parathyroid gland Pituitaly gland Thyroid gland
Follicular cell, adenoma
General Body System None
O S 5 5 6 6 7 7 7 7 7 7 7 7 7 7 7 7 7 7 7 7 7 7 7 0 1 3 7 7 8 1 3 3 3 3 3 3 3 3 3 3 3 3 3 3 3 3 3 3 9 8 3 6 6 2 7 1 6 6 6 6 6 6 6 6 6 6 6 6 6 6 6 6 6
5 5 5 5 5 5 5 5 5 5 5 5 5 5 5 5 5 5 5 5 5 5 5 5 5 5 7 6 7 6 8 7 6 4 4 4 4 4 4 4 4 4 5 5 5 5 5 5 5 5 0 3 6 1 7 3 5 0 1 2 3 4 5 6 7 8 9 1 2 3 4 5 6 7 8
. . . . . . . . . . . . . . . . . . . . . . . . . A + + + + + M + + + + + + + + + + + + + + + + + + . . . . . . . . . . . . . . . . . . . . . . . . . + + + M + + + + + + + + + + + + + + + + + + + + + . . . . . . . . . . . . . . . . . . . . . . . . . . . . . . . . . . . . . . . . . . . . . . . . . . . . . . . . . . . . . . . . . . . . . . . . . . .
X . . . . . . . . . . . . . . . . . . . . . . . . . . . . . . . . . . . . . . . . . . . . . . . . . .
x x x X x xx xx x X X X x x x x x
X X x x
X +
. . . . . . . . . . . . . . . . . . . . . . . . .
. . . . . . . . . . . . . . . . . . . . . . . . .
. . . . . . . . . . . . . . . . . . . . . . . . .
. . . . . . . . . . . . . . . . . . . . . . . . .
. . . . . . . . . . . . . . . . . . . . . . . . .
X X
. . . . . . . . . . . . . . . . . . . . . . . . . X
+ + + + + + + + + + + + + + + + + + + + + + + + . . . . . . . . . . . . . . . . . . . . . . . . .
X + + + + + M + + + + + M + + + + + + + + + + + + + + + M + + + + + + + + + + + + + + + M + + + + + + . . . . . . . . . . . . . . . . . . . . . . . . .

167 Lesions in Male Mice
TABLEC2 Individual Animal Tumor Pathology of Male Mice in the 2-Year Feed Study of Tricresyl Phosphate: 250 ppm (continued)
Number of Days on Study
Carcass ID Number
Alimentary System Esophagus Gallbladder Intestine large, colon Intestine large, rectum Intestine large, cecum Intestine small, duodenum Intestine small, jejunum
Adenocarcinoma Intestine small, ileum Liver
Hepatocellular carcinoma Hepatocellular carcinoma, multiple Hepatocellular adenoma Hepatocellular adenoma, multiple Histiocytic sarcoma I t 0 ce l l tumor benign
Mesentely Pancreas Salivary glands Stomach, forestomach Stomach, glandular Tooth
Odontoma
Cardiovascular System Heart
Hemangiosarcoma, metastatic, bone marrow
Histiocytic sarcoma
Endocrine System Adrenal cortex
Subcapsular, adenoma Adrenal medulla Islets, pancreatic
Adenoma Parathyroid gland Pituitary gland Thyroid gland
Follicular cell, adenoma
General Body System None
1 1 1 1 1 1 1 1 1 1 1 1 1 1 1 1 1 1 1 1 1 1 1 1 1 3 3 3 3 3 3 3 3 3 3 3 3 3 3 3 3 3 3 3 3 3 3 3 3 3 6 6 6 6 6 6 6 6 6 6 6 6 6 6 6 6 6 1 1 1 1 1 7 1 1
5 5 5 5 5 5 5 5 5 5 5 5 5 5 5 5 5 5 5 5 5 5 5 5 5 Total 5 6 6 6 6 6 6 6 1 1 1 7 1 ? 1 8 8 8 8 8 8 8 8 8 9 Tissues/ 9 1 2 3 4 5 8 9 0 2 4 6 1 8 9 0 1 2 4 5 6 7 8 9 0 Tumors
. . . . . . . . . . . . . . . . . . . . . . . . . 50
. . . . . . . . . . . . . . . . . . . . . . . . . 48
. . . . . . . . . . . . . . . . . . . . . . . . . 50
. . . . . . . . . . . . . . . . . . . . . . . . . 49
. . . . . . . . . . . . . . . . . . . . . . . . . 50
. . . . . . . . . . . . . . . . . . . . . . . . . 50
. . . . . . . . . . . . . . . . . . . . . . . . . 50 X 2
. . . . . . . . . . . . . . . . . . . . . . . . . 50
. . . . . . . . . . . . . . . . . . . . . . . . . 50 X X 1 2
X X X 3 X X X 11
X X X x x I 2 1
+ 2 . . . . . . . . . . . . . . . . . . . . . . . . . 50 . . . . . . . . . . . . . . . . . . . . . . . . . 50 . . . . . . . . . . . . . . . . . . . . . . . . . 50 . . . . . . . . . . . . . . . . . . . . . . . . . 50
+ 1 X 1
. . . . . . . . . . . . . . . . . . . . . . . . . 50
1 1
. . . . . . . . . . . . . . . . . . . . . . . . . 50 x 2
. . . . . . . . . . . . . . . . . . . . . . . . . 49
. . . . . . . . . . . . . . . . . . . . . . . . . 50 X 2
+ + + + + + + M + + + M + + + + M + + + M + + + + 44 + + + + M + + + + + + + + + + + M + + + + + + + + 46 . . . . . . . . . . . . . . . . . . . . . . . . . 50
X 1

168 Tricresyl Phosphate, NTP TR 433
TABLEC2 Individual Animal Tumor Pathology of Male Mice in the 2-Year Feed Study of Tricresyl Phosphate: 250 ppm (continued)
Number of Days on Study
Carcass ID Number
Genital System Epididymis
Histiocytic sarcoma Preputial gland Prostate Seminal vesicle Testes
Interstitial cell, adenoma
IIematopoietic System Bone marrow
Hemangiosarcoma Mast cell tumor malignant Sarcoma, metastatic, bone
Lymph node, mandibular Lymph node, mesenteric
Histiocytic sarcoma Spleen
Hemangiosarcoma Histiocytic sarcoma Mast cell tumor malignant, metastatic, bone marrow
Thymus
Integumentary System Mammary gland Skin
Musculoskeletal System Bone
Hemangiosarcoma, metastatic, bone marrow
Femur, sarcoma Skeletal muscle
Hemangiosarcoma, metastatic, bone marrow
Nervous System Brain Peripheral nerve Spinal cord
Respiratory System Lung
Alveolarbronchiolar adenoma Alveolarbronchiolar adenoma, multiple
Alveolarlbronchiolar carcinoma Hepatocellular carcinoma, metastatic, liver
Histiocytic sarcoma
0 5 5 5 6 6 7 7 1 1 1 1 1 1 1 1 7 1 1 1 1 1 1 1 1 0 1 3 7 7 8 1 3 3 3 3 3 3 3 3 3 3 3 3 3 3 3 3 3 3 9 8 3 6 6 2 7 1 6 6 6 6 6 6 6 6 6 6 6 6 6 6 6 6 6
5 5 5 5 5 5 5 5 5 5 5 5 5 5 5 5 5 5 5 5 5 5 5 5 5 5 1 6 1 6 8 1 6 4 4 4 4 4 4 4 4 4 5 5 5 5 5 5 5 5 0 3 6 1 1 3 5 0 1 2 3 4 5 6 7 8 9 1 2 3 4 5 6 1 8
. . . . . . . . . . . . . . . . . . . . . . . . . X
+ + + + + + + + + + + + + + + + + + + + + . . . . . . . . . . . . . . . . . . . . . . . . . . . . . . . . . . . . . . . . . . . . . . . . . . . . . . . . . . . . . . . . . . . . . . . . . . .
X
. . . . . . . . . . . . . . . . . . . . . . . . . X
X X
+ + M + + + + M + + + + + + + + + + + + + + + + + M + M + + + + + + + + + + M + + + + + + + + + + +
X + + M + + + + + + + + + + + + + + + + + + + + + +
X x x
X . . . . . . . . . . . . . . . . . . . . . . . .
M + M M + M M M M M M M M M M M M M M M M M M M M . . . . . . . . . . . . . . . . . . . . . . . . .
. . . . . . . . . . . . . . . . . . . . . . . . .
X X
+ X
. . . . . . . . . . . . . . . . . . . . . . . . .
. . . . . . . . . . . . . . . . . . . . . . . . .
. . . . . . . . . . . . . . . . . . . . . . . . .
. . . . . . . . . . . . . . . . . . . . . . . . . X x x x x
X X
X

169 Lesions in Male Mice
TABLEC2 Individual Animal Tumor Pathology of Male Mice in the 2-Year Feed Study of Tricresyl Phosphate: 250 ppm (continued)
Number of Days on Study
Carcass ID Number
~~~~
Genital System Epididymis
Histiocytic sarcoma Preputial gland Prostate Seminal vesicle Testes
Interstitial cell, adenoma
IIematopoietic System Bone marrow
Hemangiosarcoma Mast cell tumor mal ignant Sarcoma, metastatic, bone
Lymph node, mandibular Lymph node, mesenteric
Histiocytic sarcoma Spleen
Hemangiosarcoma Histiocytic sarcoma Mast cell tumor malignant, metastatic, bone marrow
Thymus
Integumentary System Mammary gland Skin
Musculoskeletal System Bone
Hemangiosarcoma, metastatic, bone marrow
Femur, sarcoma Skeletal muscle
Hemangiosarcoma, metastatic, bone marrow
Nervous System Brain Peripheral nerve Spinal cord
Respiratory System Lung
Alveolaribronchiolar adenoma Alveolaribronchiolar adenoma, multiple
Alveolaribronchiolar carcinoma Hepatocellular carcinoma, metastatic, liver
Histiocytic sarcoma
1 1 1 1 1 1 1 1 1 1 1 7 1 1 1 1 1 1 1 1 1 1 1 1 1 3 3 3 3 3 3 3 3 3 3 3 3 3 3 3 3 3 3 3 3 3 3 3 3 3 6 6 6 6 6 6 6 6 6 6 6 6 6 6 6 6 6 1 1 7 1 1 1 1 1
5 5 5 5 5 5 5 5 5 5 5 5 5 5 5 5 5 5 5 5 5 5 5 5 5 Total 5 6 6 6 6 6 6 6 7 1 1 7 7 1 1 8 8 8 8 8 8 8 8 8 9 Tissues/ 9 1 2 3 4 5 8 9 0 2 4 6 1 8 9 0 1 2 4 5 6 1 8 9 0 Tumols
. . . . . . . . . . . . . . . . . . . . . . . . . 50 1
+ + + + + + + + + + + + + + + + + + + + 41 . . . . . . . . . . . . . . . . . . . . . . . . . 50 . . . . . . . . . . . . . . . . . . . . . . . . . 5 0 . . . . . . . . . . . . . . . . . . . . . . . . . 50
1
. . . . . . . . . . . . . . . . . . . . . . . . . 50 1 1 1
+ M + + + + + + + + + + + + + + + + + + M + + + + 46 t + + + t + + + + + + + + + + + t + + + + + + + + 41
1 . . . . . . . . . . . . . . . . . . . . . . . . . 49
1 1
1 + + + + + + M + + + + + + + M + + + + + + M + + + 45
M M M M M M M M + M M M M + M M M M M M M M M M M 4 . . . . . . . . . . . . . . . . . . . . . . . . . 50
. . . . . . . . . . . . . . . . . . . . . . . . . 50
1 1 1
1
. . . . . . . . . . . . . . . . . . . . . . . . . 50
. . . . . . . . . . . . . . . . . . . . . . . . . 50
. . . . . . . . . . . . . . . . . . . . . . . . . 5 0
. . . . . . . . . . . . . . . . . . . . . . . . . 50 x x x X 9
x x 2 2
x x 2 1

170 Tricresyl Phosphate, NTP TR 433
TABLEC2 Individual Animal Tumor Pathology of Male Mice in the 2-Year Feed Study of Tricresyl Phosphate: 250 ppm (continued)
Number of Days on Study
Carcass ID Number
Respiratory System (continued) Nose
Mast cell tumor malignant, metastatic, bone marrow
Trachea
Special Senses System Ear
Pinna, fibrosarcoma EyeHarderian gland
Adenoma
Urinary System Kidney
Histiocytic sarcoma Urinaly bladder
Systemic Lesions Multiple organs
Histiocytic sarcoma Lymphoma malignant mixed Lymphoma malignant undifferentiated
c e l l type
0 5 5 5 6 6 1 1 1 1 1 1 1 1 1 1 1 7 1 1 1 1 1 1 1 0 1 3 1 7 8 1 3 3 3 3 3 3 3 3 3 3 3 3 3 3 3 3 3 3 9 8 3 6 6 2 7 1 6 6 6 6 6 6 6 6 6 6 6 6 6 6 6 6 6
5 5 5 5 5 5 5 5 5 5 5 5 5 5 5 5 5 5 5 5 5 5 5 5 5 5 7 6 1 6 8 1 6 4 4 4 4 4 4 4 4 4 5 5 5 5 5 5 5 5 0 3 6 1 1 3 5 0 1 2 3 4 5 6 1 8 9 1 2 3 4 5 6 1 8
. . . . . . . . . . . . . . . . . . . . . . . . .
X . . . . . . . . . . . . . . . . . . . . . . . . . .
+ + + + M M + M + + + + + + + + + M + + + + + + + X X
. . . . . . . . . . . . . . . . . . . . . . . . . X
. . . . . . . . . . . . . . . . . . . . . . . . .
. . . . . . . . . . . . . . . . . . . . . . . . . x x
X

Lesions in Male Mice
TABLEC2 Individual Animal Tumor Pathology of
Number of Days on Study
Carcass I D Number
Respiratory System (continued) Nose
Mast cell tumor malignant, metastatic, bone marrow
Trachea
Special Senses System Ear
Pinna, fibrosarcoma EyeHarderian gland
Adenoma
Urinary System Kidney
Histiocytic sarcoma Urinary bladder
Systemic Lesions Multiple organs
Histiocytic sarcoma Lymphoma malignant mixed Lymphoma malignant undifferentiated
cell type
Male Mice in the 2-Year Feed Study of Tricresyl Phosphate: 250 ppm
7 7 7 7 7 7 7 7 7 7 7 7 7 7 7 7 7 7 7 7 7 7 7 7 7 3 3 3 3 3 3 3 3 3 3 3 3 3 3 3 3 3 3 3 3 3 3 3 3 3 6 6 6 6 6 6 6 6 6 6 6 6 6 6 6 6 6 7 7 7 7 7 7 7 7
5 5 5 5 5 5 5 5 5 5 5 5 5 5 5 5 5 5 5 5 5 5 5 5 5 5 6 6 6 6 6 6 6 7 7 7 7 7 7 7 8 8 8 8 8 8 8 8 8 9 9 1 2 3 4 5 8 9 0 2 4 6 7 8 9 0 1 2 4 5 6 7 8 9 0
. . . . . . . . . . . . . . . . . . . . . . . . .
. . . . . . . . . . . . . . . . . . . . . . . . .
+ X
+ + + + + + M + M + M + + + + M + + M + + M M + M M
X X X
. . . . . . . . . . . . . . . . . . . . . . . . .
+ + + + + + + + + + + + + + + + + + M + + + + + +
. . . . . . . . . . . . . . . . . . . . . . . . .
X
171
(continued)
Total Tissues1 Tumors
50
1 50
1 1 1
37 5
50 1
49
50 2 1
1

172 Tricresyl Phosphate, NTP TR 433
TABLEC3 Statistical Analysisof Primary Neoplasms in Male Mice i n the 2-Year Feed Study of Tricresyl Phosphate
Adrenal Cortex: Adenoma Overall ratea Adjusted rateb Terminal rate' First incidence (days) Life table testd Logistic regression testd Cochran-Armita e testd Fisher exact test 0 Harderinn Gland: Adenoma Overall rate Adjusted rate Terminal rate First incidence (days) Life table test Logistic regression test Cochran-Armitage test Fisher exact test
Harderian Gland: Adenoma or Carcinoma Overall rate Adjusted rate Terminal rate First incidence (days) Life table test Logistic regression test Cochran-Armitagetes t Fisher exact test
Liver: Hepatocellular Adenoma Overall rate Adjusted rate Terminal rate First incidence (days) Life table test Logistic regression test Cochran-Armitage test Fisher exact test
Liver: IIepatocellular Carcinoma Overall rate Adjusted rate Terminal rate First incidence (days) Life table test Logistic regression test Cochran-Armitage test Fisher exact test
0 PPm
2/52 (4%) 4.7% 2/43 (5%) 736 (T)P=0.505N P=0.505N P=O.SOSN
0/52 (0%) 0.0% 0/43 (0%) -e
P=O.O07 P=O.O07 P=O.O07
1/52 (2%) 2.3% 1/43 (2%) 736 (T)P=O.O48 P=O.O48 P=O.O49
18/52 (35%) 39.9% 16/43 (37%) 553 P=O.520 P=0.529N P=O.508
15/52 (29%) 32.5% 12/43 (28%) 553 P-0.479 P=O.483 P=O.465
60 PPm
3/49 (6%) 7.0% 3/43 (7%) 736 ( T )P=O.500 P=O.500
P=O.472
1/49 (2%) 2.3% 1/43 (2%) 736 (T)P=O.500 P=O.500
P=O.485
2/49 (4%) 4.7% 2/43 (5%) 736 (TIP=O.SOO P=O.500
P=O.478
18/49 (37%) 41.9% 18/43 (42%) 736 (T )P=0.583N P=0.577N
P=O.494
12/49 (24%) 25.9% 9/43 (21%) 481 P=0.331N P=0.367N
P=0.394N
125 ppm
1/49 (2%) 2.3% 1/44 (2%) 736 ( T )P=0.492N P=0.492N
P=0.522N
2/49 (4%) 4.5% 2/44 (5%) 736 (T)P=O.244 P=O.244
P=0.233
3/49 (6%) 6.8% 3/44 (7%) 736 (TIP=O.314 P=O.314
P = O . 2 8 7
17/49 (35%) 38.6% 17/44 (39%) 736 (T)P =0.466N P=0.478N
P=O.579
10/49 (20%) 21.3% 7/44 (16%) 667 P=0.174N P=0.191N
P=0.227N
250 ppm
2/50 (4%) 4.8% 2/42 (5%) 736 (T)P=O.686 P=O.686
P=O.676
5/50 (10%) 11.9% 5/42 (12%) 736 0 P=O.O31 P=O.O31
P=0.025
5/50 (10%) 11.9% 5/42 (12%) 736 (TIP =0.098 P=om8
P=O.O94
18/50 (36%) 40.7% 16/42 (38%) 518 P=O.551 P=O.572
P=O.524
15/50 (30%) 34.0% 13/42 (31%) 676 P=O.559 P=O.580
P=O.535

173 Lesions in Male Mice
TABLEC3 Statistical Analysis of Primary Neoplasms i n Male Mice in the 2-Year Feed Study of Tricresyl Phosphate (continued)
Liver: Hepatocellular Adenoma or Carcinoma
Adjusted rate Overall rate
59.5% 28/52 (54%)
56.4% 26/49 (53%)
51.1% 24/49 (49%)
62.1% 28/50 (56%)
Life table test First incidence (days) Terminal rate
P=O.479 553 24/43 (56%)
P =0.42ON 481 23/43 (53%)
P =0.250N 667 21/44 (48%)
P= O S 3 3 518 25/42 (60%)
Logistic regression test P=O.511 P=0.145N P=0.262N P=O.571 Cochran-Armitage test P=O.459 Fisher exact test P=0.548N P-0.386N P=O.492
Lung: Alveolar/bronchiolar Adenoma Overall rate 7/52 (13%) 7/49 (14%) 11/49 (22%) 11/50 (22%) Adjusted rate 15.3% 16.3% 24.4% 26.2%
Life table test First incidence (days) Terminal rate
P=O.119 553 5/43 (1270) 7/43 (16%)
P=O.610 736 (9
P=0.239 698 10/44 (23%)
P=0.205
11/42 (26%) 7360
Logistic regression test P=O.129 P=O.594 P =0.203 P=O.211 Cochran-Armitage test P=O.118 Fisher exact test P=O.566 P=O.179 P=O.192
Lung: Alveolar/bronchiolar Carcinoma Overall rate 1/52 (2%) 4/49 (8%) 2/49 (4%) 2/50 (4%) Adjusted rate 2.3% 9.3% 4.4% 4.8%
Life table test First incidence (days) Terminal rate 1/43 (2%)
P~O.567 736 (T> 736 (T>
4/43 (9%)
P=O.180 P=O.511 718 1/44 (2%)
P=O.492
2/42 (5%) 736 (T)
Logistic regression test P=O.578 P=O.180 P-0.508 P=O.492 Cochran-Armitage test P=O.562 Fisher exact test P=O.163 P=O.478 P=O.485
Lung: Alveolar/bronchiolarAdenoma or Carcinoma
Adjusted rate Overall rate
17.5% 8/52 (15%)
25.6% 11/49 (22%)
28.3% 13/49 (27%)
28.6% 12/50 (24%)
Life table test First incidence (days) Terminal rate
P=O.195 553 6/43 (14%) 11/13 (26%)
P=O.307 736 (9
P=O.l87 698 11/44 (25%) 12/42 (29%)
P=O.212 736 (T)
Logistic regression test P-0.209 P=0.293 P=O.153 P=O.222 Cochran-Armitage test P=O.191 Fisher exact test P=O.257 P=O.128 P=O.199
Pancreatic Islets: Adenoma
Adjusted rate Overall rate
2.3% 1/52 (2%)
0.0% 0/49 (0%)
6.5% 3/49 (6%) 2/50 (4%)
4.8%
Life table test First incidence (days) Terminal rate 1/43 (2%)
P=O.231 736 (9
0/43 (0%)
P=0.500N -
P=O.315 583 2/44 (5%)
P=0.492
2/42 (5%) 736 (9
Logistic regression test P=O.231 P=O.SOON P=O.272 P=0.492 Cochran-Armitage tes t P=O.231 Fisher exact test P=0.515N P=O.287 P=O.485

174 Tricresyl Phosphate, NTP TR 433
TABLEC3 Statistical Analysis of Primary Neoplasms in Male Mice in the 2-Year Feed Study of Tricresyl Phosphate (continued)
0 PPm 60 PPm 125 ppm 250 ppm
Spleen: Hemangiosarcoma Overall rate Adjusted rate
4/52 (8%)9.3%
1/49 (2%) 2.3%
1/49 (2%) 2.3%
1/49 (2%) 2.4%
Terminal rate First incidence (days) Life table test
4/43 (9%) 736 ( T ) P=0.140N
1/43 (2%) 736 (T ) P=0.180N
1/44 (2%) 736 (9 P=0.173N
1/42 (2%) 736 0 P=O.l87N
Logistic regression test P=0.140N P=0.180N P=0.173N P=0.187N Cochran-Armitage test P=0.148N Fisher exact test P=0.200N P=0.200N P =0.2QON
All Organs: Hemangiosarcoma Overall rate Adjusted rate
5/52 (10%)11.6%
2/49 (4%) 4.7%
3/49 (6%) 6.8%
2/50 (4%) 4.7%
Terminal rate First incidence (days) Life table test
5/43 (12%) 736 ( T ) P=0.220N
2/43 (5%) 736 (T ) P=0.216N
3/44 (7%) 736 ( T ) P=0.344N
1/42 (2%) 731 P=0.227N
Logistic regression test P=0.210N P=0.216N P=0.344N P=0.212N Cochran-Armitage test P=0.225N Fisher exact test P=0.243N P=0.392N P=0.23SN
A l l Organs: IIemangioma or IIemangiosarcoma Overall rate Adjusted rate
6/S2 (12%) 14.0%
2/49 (4%) 4.7%
3/49 (6%) 6.8%
2/50 (4%) 4.7%
Terminal rate First incidence (days) Life table test
6/43 (14%) 736 (T ) P=0.140N
2/43 (5%) 736 ( T ) P=0.134N
3/44 (7%) 736 ( T ) P=0.231N
1/42 (2%) 731 P=0.143N
Logistic regression test P=0.132N P=0.134N P=0.231N P=0.130N Cochran-Armitage test P=0.145N Fisher exact test P=0.155N P=0.274N P=0.148N
All Organs: Malignant Lymphoma (Lymphocytic, Mixed, or Undifferentiated Cell Type) Overall rate (670) 3/493/52 (6%) 2/49 (4%) 2/50 (4%) Adjusted rate 7.0% 6.7% 4.57O 4.8% Terminal rate 2/43 (570) 3/43 (7%) 2/44 (5%) 2/42 (5%) First incidence (days) Life table test
603 P=0.379N
736 (T>P=O.661
736 (T)P=0.492N
736 (??P=0.510N
Logistic regression test P=0.373N P=O.651 P=0.521N P=O.SlON Cochran-Armitage test P=0.383N Fisher exact test P=O.632 P=0.528N P=0.519N
A l l Organs: Malignant Lymphoma or Ilistiocytic Sarcoma Overall rate 3/52 (6%) 5/49 (10%) 2/49 (4%) 4/50 (8%) Adjusted rate 6.7% 10.9% 4.5% 9.0% Terminal rate 2/43 (S%) 3/43 (7%) 2/44 (5%) 2/42 (5%) First incidence (days) 603 Life table test P=O.361 P=O.535
397 736 (T )P =0.492N
682 P=O.495
Logistic regression test P=O.282 P=O.514 P=0.521N P=O.487 Cochran-Armitage test P=O.526 Fisher exact test P =0.325 P=0.528N P=O.478

All Organs:Benign Neoplasms Overall rate 27/52 (52%) 22/49 (45%) 32/49 (65%) 32/50 (64%) Adjusted rate Terminal rate
57.3% 23/43 (53%)
51.2% 22/43 (51%)
69.5% 30/44 (68%)
71.0% 29/42 (69%)
First incidence (days) 40 736 0 583 518 Life table test P=O.O55 P=0.216N P=O.259 P=O.188 Logistic regression test P=O.o61 P=0.254N P=O.158 P=O.175 Cochran-Armitage test P=O.O50 Fisher exact test P=0.306N P=O.123 P=O.151
All Organs:Malignant Neoplasms Overall rate 22/52 (42%) 22/49 (45%) 16/49 (33%) 21/50 (42%) Adjusted rate 47.7% 45.7% 34.0% 45.7% Terminal rate 19/43 (44%) 17/43 (40%) 13/44 (30%) 17/42 (40%) First incidence (days) 553 397 667 676 Life table test P=0.425N P=0.568N P=0.144N P=0.531N Logistic regression test P=0.410N P=O.521 P=0.148N P=0.503N Cochran-Armitage test P=0.438N Fisher exact test P=O.475 P=0.213N P=0.567N
AI! Organs:Benign or Malignant Neoplasms Overall rate 38/52 (73%) 35/49 (71%) 39/49 (80%) 39/50 (78%) Adjusted rate 77.5% 72.9% 81.3% 81.2% Terminal rate 32/43 (74%) 30143 (70%) 35/44 ( S O Y O ) 33/42 (79%) First incidence (days) 40 397 583 518 Life table test P=O.308 P=0.349N F=0.568 P=O.441 Logistic regression test P=O.290 P=0.454N P=O.412 P=O.440 Cochran-Armitage test P=O.251 Fisher exact test P=O.515N P =0.297 P=O.365
(T)Terminal sacrifice a Number of neoplasm-bearing animals/number of animals examined. Denominator is number of animals examined microscopically for adrenal gland,
liver, lung, pancreas, and spleen; for other tissues, denominator is number of animals necropsied. Kaplan-Meier estimated neoplasm incidence a t the end of the study after adjustment for intercurrent mortality Observed incidence at terminal ki l l Beneath the control incidence are the P values associated w i t h the trend test. Beneath the dosed group incidence are the P values corresponding to painvise comparisons between the controls and t h a t dosed group. The life table analysis regards tumors i n animals dying prior to terminal kill as being (directly or indirectly) the cause of death. The logistic regression test regards these lesions as nonfatal. The Cochran-Armitage and Fisher exact tests compare directly the overall incidence rates. For all tests, a negative trend or a lower incidence in a dose group is indicated by N.
e Notapplicable; no neoplasms in animal group
175 Lesions in Male Mice
TABLEC3 Statistical Analysis of Primary Neoplasms in Male Mice in the 2-Year Feed Study of Tricresyl Phosphate (continued)

176 Tricresyl Phosphate, NTP TR 433
TABLEC4a Historical Incidence of Hepatocellular Neoplasms in Untreated Male B6C3F, Micea
Study
Historical Incidence a t Battelle Columbus
2,4-Dichlorophenol 4,4'-Thiobis(6-r-Butylm-Cresol) 5,5-Diphenylhydantoin Dowicide EC-7 Pentachlorophenol Ethylene Thiourea Polybrominated Biphenyls (Firemaster FF-le) Manganese (11) Sulfate Monohydrate Technical Grade Pentachlorophenol Triamterene Triarnterene Tricresyl Phosphate
Overall IIistoricsl Incidence
Total Standard deviation Range
a Data as of 20 August 1992
Incidence in Controls Adenoma Carcinoma Adenoma or
Carcinoma
4/50 7/50 lobo 17/50 11/50 25/50 19/50 13/50 29/50 5/35 1/35 6/35
11/49 13/49 20149 9/50 8/50 16/50
30150 9/50 3/50 5/32 m 2 7/32
17\50 5/50 20/50 21/50 9/50 25/50 18/52 15/52 28/52
312/1,366(22.8%)22311,366(16.3%)485/1,366(35.5%) 13.8% 7.2% 14.3%
4%-60% 3%-29% lo%-@%
Hepatoblastoma
0150 0150 0/50 0n5 0149 0/50 0/50 0n2 0150 0150 0152
0/1,366(0.0%)

177 Lesions in Male Mice
TABLEC4b Historical Incidence of Barderian Gland Neoplasms in Untreated Male B6C3F, Mice’
Study
Historical Incidence at Battelle Columbus
2,4-Dichlorophenol 4,4I-Thiobis(6-r-Butyl-m-Cresol) 5,s-Diphenylhydantoin Dowicide EC-7Pentachlorophenol Ethylene Thiourea Polybrominated Biphenyls (Firemaster FF-la) Manganese (11) Sulfate Monohydrate Technical Grade Pentachlorophenol Triamterene Triamterene Tricresyl Phosphate
Overall llistorical Incidence
Total Standard deviation Range
a Data as of 20 August 1992
Adenoma
2/50 1/50 5/50 2/35 1/50 2/50 4/50 1/35 0/50 1/50 0/52
66/1,374 (4.8%) 4.3%
0%-18%
Incidence i n Controls CarcinomaAdenoma
1/50 2/50 1/50 OD5 0/50 0/50 1/50 OB5 1/50 0/50 1/52
8/1,374 (0.6%) 1.1%
0%-4%
or Carcinoma
3/50 3/50 6/50 2/35 1/50 2/50 5/50 1/35 1/50 1/50 1/52
74/1,374 (5.4%) 4.5%
0%-20%

Disposition Summary Animals initially in study 95 95 95 95 3- iUdinta imevohapionb 13 15 15 15 P M d &&PIevohapionb 15 15 15 15 IS" &&PI c l " u n b 15 15 15 15 Early deaths
Accidental deaths 1 Moribund 4 1 1 2 Natural deaths 4 5 4 6
Survivors Terminal sacrifice 43 43 44 42
Missing 1 1
Animals examined microscopically 95 94 94 95
3-Monih Interim Evaluation Endocrine System Adrenal cortex
Accas~lyadrenal cortical nodule Pigmentation, ceroid Subcapsular, hyperplasia
Adrenal medulla Hyperplasia
Pituitary gland Pars distalis, hyperplasia
Hematopoietic System Thymus
Necrosis
Nervous System Brain
Infiltration cellular, lipocyte
Respiratory System Lung
Inflammation, chronic active
Urinary System Kidney
Nephropathy
a Number o f animals examined microscopically at site and number o f animals with lesion Includes up to five animals per dose group subjectedt o total body perfusion for special neuropathology
178 Tricresyl Phosphate, NTP TR 433
TABLEC5 Summary of the Incidence of Nonneoplastic Lesions in Male Mice in the 2-Year Feed Studyof Tricresyl Phosphatea
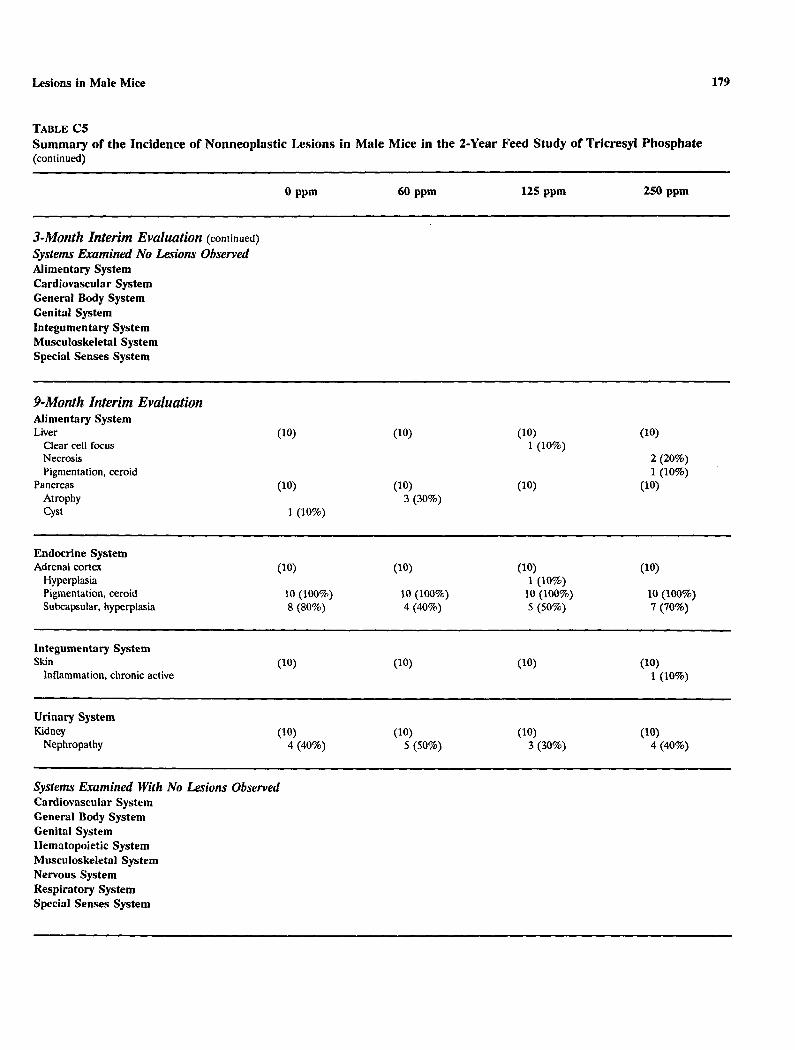
179 Lesions in Male Mice
TABLEC5 S u m m a r y of the Incidence of Nonneoplast ic Lesions in Male Mice inthe 2-Year Feed S t u d y of Tricresyl Phosphate (continued)
3-Month Interim Evaluation (continued) Systems ExaminedNo Lesions Observed Alimentary System Cardiovascular System General Body System Genital System Integumentary System Musculoskeletal System Special Senses System
9-Month Inlerim Evaluation Alimentary System Liver (10)
Clear cell focus (10) (10)
1 (10%) (10)
Necrosis 2 (20%) Pigmentation, ceroid 1 (10%)
Pancreas (10) Atrophy
(10)3 (30%)
(10) (10)
Cyst 1 (10%)
Endocrine System Adrenal cortex
Hyperplasia Pigmentation, ceroid Subcapsular, hyperplasia
Integumentary System Skin
Inflammation, chronic active
Urinary System Kidney
Nephropathy
Systems Examined With No Lesions Observed Cardiovascular System General Body System Genital System IIematopoietic System Musculoskeletsl System Nervous System Respiratory System Special Senses System

15-Month Interim Evaluation Alimentary System Liver
Basophilic focus (10)
1 (10%) (10)
1 (10%) (10)
Clear cell focus 1 (10%) Eosinophilic focus 1(10%) 1 (10%) 1 (10%) Fatty change 1 (10%) 3 (30%) 5 (50%) 5 (50%) Necrosis 1 (10%) Pigmentation, ceroid 4 (40%) 2 (20%)
Pancreas Atrophy
(10)1 (10%)
(10)1 (10%)
(10)
Endocrine System Adrenal cortex
Accessory adrenal cortical nodule (10)
1 (10%) (10)
1 (10%) Hyperplasia 1 (10%) Pigmentation, ceroid 10 (100%) 1 0 (100%) 10 (100%) Subcapsular, hyperplasia 8 (80%) 10 (100%) 7 (70%)
Islets, pancreatic Hyperplasia
(10)1 (10%)
(10)1 (10%)
(10)3 (30%)
Parathyroid gland (8) (8) (9) CLst
Pituitary gland c y s t
(10)1 (10%)
(10) (9)
Genital System Preputial gland
Duct, dilatation (5)
5 (100%) (9)
9 (100%) (5)
5 (100%) (4)
4 (100%)
Hematopoietic System Thymus
cyst
Respiratory System Lung
Inflammation, chronic active (10)
1 (10%) (10)
Bronchiole, hyperplasia 1 (10%) 1 (10%)
Urinary System Kidney
Nephropathy
180 Tricresyl Phosphate, NTP TR 433
TABLEC5 Summary o f the Incidence o f Nonneoplastic Lesions in Male Mice in the 2-Year Feed Studyo f Tricresyl Phosphate (continued)

181 Lesions in Male Mice
TABLEC5 Summary of the Incidence of Nonneoplastic Lesions in Male Micein the 2-Year Feed Study of Tricresyl Phosphate (continued)
0 PPm
15-Month Interim Evaluation (continued) Systems Examined With No Lesions Observed Cardiovascular System General Body System Integumentary System Musculoskeletal System Nervous System Special Senses System
2-Year Study Alimentary System Esophagus
Inflammation Gallbladder
Hyperplasia Intestine small, duodenum
Thrombosis Intestine small, jejunum
Serosa, fibrosis Liver
Angiectasis Basophilic focus Clear cell focus Eosinophilic focus Erythrophagocytosis Fatty change Hematopoietic cell proliferation Mked cell focus Necrosis Pigmentation, ceroid Vacuolization cytoplasmic, f o c a l Bile duct, cyst Bile duct, hyperplasia Serosa, inflammation
Mesentery Inflammation, chronic active Fat, necrosis
Pancreas Atrophy Duct, cyst
Salivary glands Duct, hyperplasia
Stomach, forestomach Hyperplasia
Stomach, glandular Erosion Hyperplasia
Tooth Inflammation, chronic active
(51)
(52)1 (2%) 1 (2%) 5 (10%) 6 (12%)
6 (12%)
1 (2%) 2 (4%)
1 (2%)
1 (2%) 1 (2%)
(52)3 (6%) 1 (2%)
(52)1 (2%)
(52)2 (4%)
(52)1 (2%) 1 (2%)
(3)1 (33%)
60 PPm
(49)
(47)
(49)1 (2%)
(49)
(49)
2 (4%) 8 (16%) 3 (6%)
10 (20%) 1 (2%)
2 (470)
1 (2%)
(49)1 (2%)
1 (2%) (3)
1 (337@)
125 ppm
(49)
(49)
4 (8%) 17 (35%) 9 (18%)
23 (47%)
2 (4%) 2 (4%) 30 (61%)
( 2 )1 (50%) 1 (50%)
(49)2 (4%) 1 (2%)
(49)
(49)
(49)
250 ppm
1 2 (24%) 5 (10%) 1 (2%)
22 (44%)
2 (4%) 28 (56%)

182 Tricresyl Phosphate, NTP TR 433
TABLEC5 Summary of the Incidence of Nonneoplastic Lesions in Male Mice in the 2-Year Feed Study of Tricresyl Phosphate (continued)
2-Year Study (continued) Cardiovascular System Blood vessel
Polyarteritis Heart
Inflammation, chronic active Mineralization Artery, inflammation, chronic active Atrium, thrombosis
Endocrine System Adrenal cortex
Accessory adrenal cortical nodule Hyperplasia Pigmentation, ceroid Subcapsular, hyperplasia
Adrenal medulla Hyperplasia
Islets, pancreatic Hyperplasia
Pituitary gland CystPars distalis, hyperplasia
Thyroid gland Follicle, cyst Follicular cell, hyperplasia
General Body System None
Genital System Epididymis
Atrophy Granuloma sperm Inflammation, chronic active Inflammation, granulomatous
Preputial gland Atrophy Inflammation, granulomatous Inflammation, suppurative Duct, dilatation
Prostate Inflammation, suppurative
Seminal vesicle Dilatation Hemorrhage, acute Inflammation, chronic active
Testes Atrophy
0 PPm
(1)1(100%)
(52)
1 (2%)
(52 )2 (4%)
26 (50%) 48 (92%) 44 (85%)
(52)3 (6%)
(52)8 (15%)
(50 )3 (6%) 1 (2%)
(52)
(52)1 (2%)
2 (4%)
6 (15%) 39 (98%)
(52) 1 (2%)
(52)
1 (2%) (52)
1 (2%)
60 PPm
(49)
1 (2%)
(49)1 (2%)
23 (47%) 47 (96%) 46 (94%)
(49)1 (2%)
(49)10 (20%)
(49)2 (4%) 1(2%)
(49)1 (2%)
(49)
(30)
4 (13%) 29 (97%)
(49)
(49)
(49)
125 ppm
(49)3 (6%) 2 (4%)
(49)2 (4%)
29 (59%) 49 (100%) 45 (92%)
(49)
(49)10 (20%)
(45)
2 (4%) (49)
1 (2%) 1 (2%)
(49)
4 (8%)
(41)
1 (2%) 3 (7%)
40 (98%) (49)
(49) 1 (2%) 1 (2%) 2 (4%)
(49)2 (470)
250 ppm
(50 )1 (2%) 2 (4%)
(50)2 (4%) 25 (50%) 49 (98%) 44 (88%)
(49)1 (2%)
(50)12 (24%)
(46)4 (9%) 2 (4%)
(50)1 (2%) 1 (2%)
2 (4%) (41)
1 (2%)
3 (7%) 40 (98%)
(50 )
(50)
(50)3 (6%)

2-Year Study (continued) Hematopoietic System Bone marrow
Granuloma (52)
1 (2%) (49) (50 )
1 (2%) Hyperplasia Myelofibrosis
7 (13%) 9 (18%) 1 (2%)
8 (16%)
Lymph node (1) Inguinal, hyperplasia, lymphoid
Lymph node, mandibular (43) Depletion lymphoid Hematopoietic cell proliferation Hyperplasia, lymphoid 1 (2%)
2 (4%) 1 (270)
Lymph node, mesenteric cystHematopoietic cell proliferation
(50 )1 (2%) 1 (2%) 1 (2%)
(47)
2 (4%) Hyperplasia, lymphoid 1 (2%)
Spleen Angiectasis
(52) (49) (49)2 (4%)
(49)1 (2%)
Depletionlymphoid 5 (10%) 4 (8%) 2 (4%) Hematocyst 1 (2%) Hematopoietic c e l l proliferation 15 (2970) 19 (39%) 15 (31%) 18 (37%) Hyperplasia, lymphoid 1 (2%) 1 (2%) 2 (4%)
Thymus Atrophy Depletion lymphoid
(45)
4 (9%)
(42)
3 (7%)
(45)
3 (7%)
(45) 2 (4%)9 (20%)
Hyperplasia, lymphoid 1 (2%) Epithelial cell, hyperplasia 1 (2%)
Integumentary System Skin
Abscess (52 )
1 (2%) (49) (49) (501
Cyst epithelial inclusion 1 (2%) 1 (2%) Granuloma 1 (2%) Hemorrhage 1 (2%) Inflammation, chronic active 1 (2%) Ulcer 1 (270) 1 (270)
Musculoskeletal System None
Nervous System Brain
Necrosis Peripheral nelve
Axon, degeneration Spinal cord
Cyst
183 Lesions in Male Mice
TABLEC5 Summary of the Incidence of Nonneoplastic Lesions in Male Mice in the 2-Year Feed Study of Tricresyl Phosphate (continued)

184 Tricresyl Phosphate, N T P TR 433
TABLECS Summary of the Incidence of Nonneoplastic Lesions in Male Mice in the 2-YearFeed Study of Tricresyl Phosphate (continued)
2-Year Study (continued) Respiratory System Lung
Inflammation, chronic active Thrombosis Alveolar epithelium, hyperplasia Alveolus, pigmentation, hemosiderin
N e Developmental malformation Proliferation connective tissue Nasolacrimal duct, inflammation Respiratory epithelium, inflammation
Special Senses System Eye
Atrophy Cornea, inflammation
Harderian gland Hyperplasia Inflammation, chronic active
Urinary System Kidney
cLst Hydronephrosis Infarct Inflammation, suppurative Nephropathy Artery, inflammation, chronic active Renal tubule, necrosis
Urinary bladder Inflammation, suppurative
(52)1 (2%)
3 (6%) 1 (2%)
(52)
1 (2%)
1 (2%)
(1)
1 (100%) (43)
2 (5%)
(52)2 (4%)
2 (4%) 2 (4%)
47 (90%) 1 (2%)
(49)
5 (10%)
(49)
(1)
1 (100%) (40)
1 (3%)
(49)5 (10%)
47 (%%)
(49)3 (6%) 1 (2%) 2 (4%)
(49)
1 (2%) 1 (2%)
(37)
1 (3%)
(49)3 (6%) 1 (2%) 1 (2%)
49 (100%)
(49)
(50)
2 (4%)
(50)1 (2%)
2 (4%)
(1)1 (100%)
(37)
1 (3%)
(50) 1 (2%)1(2%) 1(2%)
45 (90%)
1 (2%) (49)
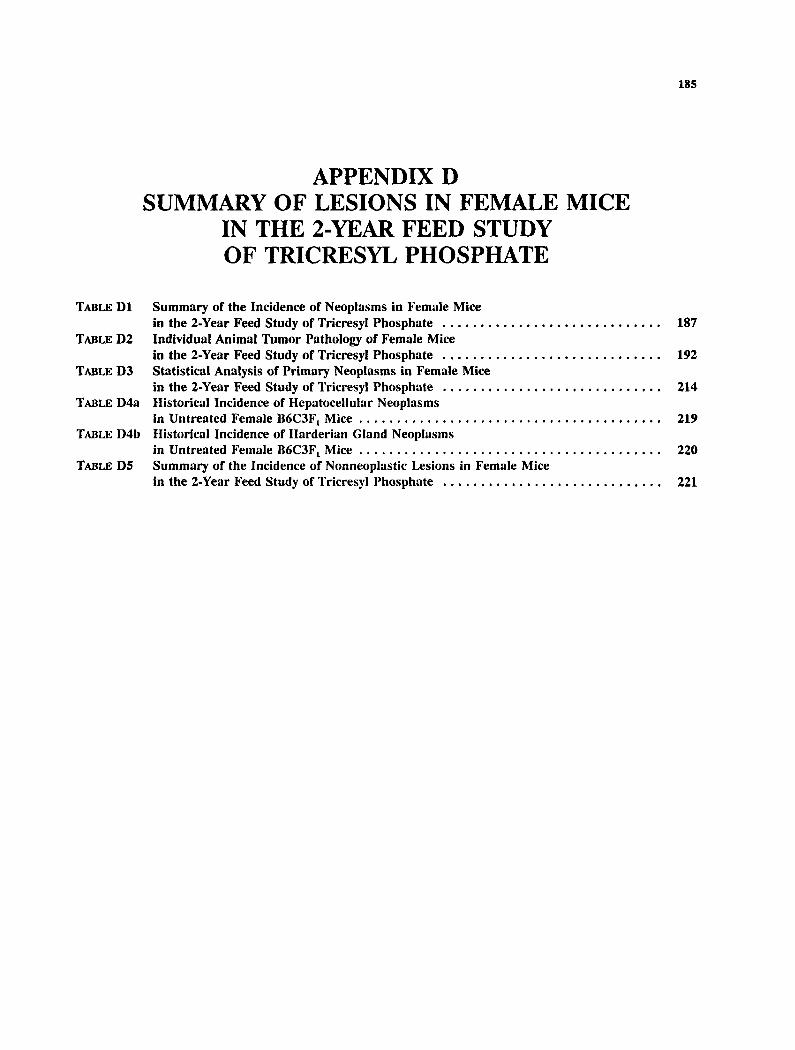
185
APPENDIX D SUMMARY OF LESIONS IN FEMALE MICE
IN THE 2-YEAR FEED STUDY OF TRICRESYL PHOSPHATE
TABLED l Summary of the Incidence of Neoplasms in Female Mice in the 2-Year Feed Study of Tricresyl Phosphate ............................. 187
TABLED2 Individual Animal Tumor Pathology of Female Mice in the 2-Year Feed Study of Tricresyl Phosphate ............................. 192
TABLED3 Statistical Analysis of Primary Neoplasms in Female Mice in the 2-Year Feed Study of Tricresyl Phosphate ............................. 214
TABLED4a Historical Incidence of EIepatocellular Neoplasms in Untreated Female B6C3FL Mice ........................................ 219
TABLED4b Historical Incidence of IIarderian Gland Neoplasms in Untreated Female 116C3F, Mice ........................................ 220
TABLED5 Summary of the Incidence of Nonneoplastic Lesions in Female Mice in the 2-Year Feed Study of Tricresyl Phosphate ............................. 221

Disposition Summary Animals initially in study 95 95 95 95 $Month irtreim eva&donb 15 15 15 15 P M d buerim eva&donb 15 15 15 15 l I M d interim 15 15 15 14 Early deaths
Moribund 4 5 4 3 Natural deaths 5 7 2 3
Survivors Died last week of study 1 1 Terminal sacrifice 40 37 42 45
Missing 2
Animals examined microscopically 95 95 93 9s
Systems Examined at 3 and 9 Months With No Neopiusms Observed Alimentary System Cardiovascular System Endocrine System General Body System Genital System IIemotopoietic System Integumentary System Musculoskeletal System Nervous System Respiratory System Special Senses System Urinary System
IS-Month Interim Evaluation Alimentary System Liver (10)
Hepatocellular adenoma 1 (10%) ( '0)
2 (2076) (10) (9)
1(11%)
Endocrine System Adrenal cortex
Subcapsular, adenoma
Respiratory System Lung (10)
Alveolarbronchiolar adenoma (10)
187 Lesions in Female Mice
TABLE DL Summary of the Incidence of Neoplasms in Female Mice in the 2-Year Feed Study of Tricresyl Phosphatea
0 Pl'm 60 ppm 125 ppm 250 ppm

188 Tricresyl Phosphate, NTP TR 433
TABLED l Summary of the Incidence of Neoplasms i n Female Mice in the 2-Year Feed Study of Tricresyl Phosphate(continued)
15-Month Interim Evaluation (continued) Systems Examined With No Neoplusms Observed Cardiovascular System General Body System Genital System Hematopoietic System Integumentary System Musculoskeletal System Nervous System Special Senses System Urinary System
2-Year Study Alimentary System Gallbladder Hepatocholangiocarcinoma,metastatic, liver
(51)
Intestine lar, , rectum*e Osteosarcoma, metastatic, bone
(51)1 (2%)
Liver Intestine small, jejunum
Hepatocellular carcinoma Hemangiosarcoma, metastatic, spleen
(48) (48)
1 (2%)
(51) (51)
5 (10%) Hepatocellular carcinoma, multiple 1 (2%) Hepatocellular adenoma 10 (21%) 7 (14%) Hepatocellular adenoma, multiple 3 (6%) 8 (16%) Hepatocholangiocarcinoma Histiocytic sarcoma
Mesentery Fibrosarcoma, metastatic, skin
Pancreas Salivary glands Stomach, forestomach
Squamous cell papilloma
Cardiovascular System Heart
Hemangiosarcoma Histiocytic sarcoma
Endocrine System
Adenoma Adrenal cortex (51)
1 (2%) Subcapsular, adenoma
Adrenal medulla Pheochromocytoma benign
Islets, pancreatic Carcinoma
Parathyroid gland (43) (44)

0 PPm 60 PPm 125 ppm 250 PPm
2-Year Study (continued) Endocrine System (continued) Pituitary gland
Pars distalis, adenoma (46)
6 (13%) (46)
8 (17%) (46)
6 (13%) (50)
9 (18%) Pars intennedia, adenoma 1 (2%) 2 (4%)
Thyroid gland Follicular cell, adenoma
(49) 1 (2%)
(50) (48) 1 (2%)
(51)
General Body System Tissue NOS
Leiomyoma (1)
1 (100%)
Genital System Ovaty
Cystadenoma (47)
1 (2%) (50 )
2 (4%) Fibrous histiocytoma Granulosa c e l l tumor mal ignant 1 (2%)
1 (2%)
Hemangioma Histiocytic sarcoma 1 (2%)
1 (2%)
Luteoma 1 (2%) Teratoma NOS 1 (2%)
Uterus Hemangioma
(50 ) (50 ) (48)1(2%)
Histiocytic sarcoma Polyp stromal
1 (270) 1(270)
2 (4%) 1 (2%)
1 (2%) 3 (670)
Polyp stromal, multiple 1 (25%) Serosa, fibrosarcoma, metastatic, skin 1 (2%)
Hematopoietic System Blood Bone marrow
Osteosarcoma, metastatic, bone Sarcoma
Lymphnode Lumbar, renal, thoracic, iliac, bronchial,
(50 )
(3) (4)
i (2%) 1 (2%)
mediastinal, lymphoma malignant mixed Mediastinal, alveolarbronchiolar carcinoma.
1 (33%)
metastatic, lung 1 (33%) Mediastinal, histiocytic sarcoma Pancreatic, hepatocholangiocarcinoma,
1 (25%)
metastatic, liver Renal, histiocytic sarcoma
1 (25%)
Lymphnode, mandibular Histiocytic sarcoma
(46)
Lymphnode,mesenteric Alveolarbronchiolar carcinoma, metastatic,
(49)
l u n g Hepatocholangiocarcinoma,metastatic, liver Histiocytic sarcoma
1 (2%) 1 (2%) 2 (4%) 1 (2%)
189 Lesions in Female Mice
TABLED l Summary of the Incidence of Neoplasms in Female Mice i n the 2-Year Feed Study of Tricresyl Phosphate (continued)

&Year study (continued) Hematopoietic System (continued) Spleen
Hemangioma (50) (50 ) (48)
1 (2%) (51)
Hemangiosarcoma 3 (6%) 1 (2%) 1 (2%) 1 (2%) Histiocytic sarcoma 2 (4%) 2 (4%)
Thymus Histiocytic sarcoma
(45) (44) (47)1 (2%)
(46)
Thymoma malignant 1 (2%)
Integumentary System Mammary gland
Adenocarcinoma Skin
Fibrosarcoma Hemangioma Sarcoma Subcutaneous tissue, myxosarcoma
Musculoskeletal System Bone
Vertebra, osteosarcoma Skeletal muscle
(51)1 (2%)
Fibrosarcoma, multiple, metastatic, skin 1 (50%) Sarcoma 1 (50%)
Nervous System Brain
Meninges, myxosarcoma, metastatic, skin (50) (50 )
1 (2%) (48) (51)
Respiratory System Lung
Adenocarcinoma, metastatic, harderian gland (50)
1 (2%) Alveolar/bronchiolar adenoma 2 (4%) 4 (870) 2 (4%) 5 (10%) Alveolarbronchiolar adenoma, multiple 1 (2%) Alveolarbronchiolar carcinoma 3 (6%) 1 (2%) 2 (4%) 1 (2%) Alveolarbronchiolar carcinoma, multiple 1 (2%) Fibrosarcoma, metastatic, skin 2 (4%) Hepatocellular carcinoma, metastatic, liver 5 (10%) 1 (2%) 1 (2%) 2 (4%) Hepatocholangiocarcinoma, metastatic, liver 1 (2%) Histiocytic sarcoma 2 (4%) 1 (2%) Osteosarcoma, multiple, metastatic, bone 1 (2%)
Special Senses System Ear
Pinna, fibrosarcoma Harderian gland
Adenocarcinoma Adenoma
190 Tricresyl Phosphate, NTP TR 433
TABLED l Summary of the Incidence of Neoplasms in Female Mice in the 2-Year Feed Study of Tricresyl Phosphate (continued)

191 Lesions in Female Mice
TABLED l Summary of the Incidence of Neoplasms in Female Mice in the 2-Year Feed Study of Tricresyl Phosphate (continued)
0 PPm 60 PPm 125 ppm 250 ppm
&Year study (continued) Urinary System Kidney
Renal tubule, adenoma Urinary bladder
Systemic Lesions Multiple organsc (50) (50) (48) (51)
Histiocytic sarcoma 1 (2%) 3 (6%) 2 (4%) 1 (2%) Leukemia lymphocytic 1 (2%) Lymphoma malignant lymphocytic 3 (6%) 3 (6%) 3 (6%) Lymphoma malignantmixed 3 (670) 2 (4%) 3 (6%) Lymphoma malignant undifferentiated cell 1 (2%) 3 (6%) 1(2%)
Neoplasm Summary Total animals w i t h primary neoplasmsd
15-Month interim evaluation 1 2 1 1 2-Year study 40 39 32 41
Total primary neoplasms 15-Month interim evaluation 2 2 1 1 2-Year study 64 47 48 55
Total animals w i t h benign neoplasms 15-Month interim evaluation 1 2 1 1 2-Year study 21 29 24 31
Total benign neoplasms 15-Month interim evaluation 2 2 1 1 2-Year study 35 30 32 34
Total animals w i t h malignant neoplasms 2-Year study 22 16 15 19
Total mal ignan t neoplasms 2-Year study 28 17 16 21
Total animals w i t h metastatic neoplasms 2-Year study 9 5 1 3
Total metastatic neoplasm 2-Year study 13 8 1 5
Total animals w i t h neoplasms uncertain-benign or malignant
2-Year study 1 Total uncertain neoplasms
2-Year study 1
a Number o f animals examined microscopically a t site and number o f animals w i t h neoplam Includes up to five animals per dose group subjected to total body perfusion for special neuropathology Number o f animals with any tissue examined microscopically Primalyneoplasms: a l l neoplasmsexceptmetastaticneoplasms

192 Tricresyl Phosphate, NTP TR 433
TABLED2 Individual Animal Tumor Pathology of Female Mice in the 2-Year Feed Study of Tricresyl Phosphate: 0 ppm
Number of Days on Study
Carcass ID Number
Alimentary System Esophagus Gallbladder Intestine large, colon Intestine large, rectum Intestine large, cecum Intestine small, duodenum Intestine small, jejunum Intestine small, ileum Liver
Hepatocellular carcinoma Hepatocellular carcinoma, multiple Hepatocellular adenoma Hepatocellular adenoma, multiple
Mesentery Fibrosarcoma, metastatic, skin
Pancreas Salivary glands Stomach, forestomach Stomach, glandular
Cardiovascular System Blood vessel Heart
Hemangiosarcoma
Endocrine System Adrenal cortex
Adenoma Subcapsular, adenoma
Adrenal medulla Pheochromocytoma benign
Islets, pancreatic Carcinoma
Parathyroid gland P i t u i t a r y gland
Pars distalis, adenoma Thyroid gland
Follicular cell, adenoma
General Body System Tissue NOS
Leiomyoma
+: Tissueexaminedmicroscopically A: Autolysisprecludesexamination
4 5 5 5 6 6 6 6 7 7 7 7 7 7 7 7 7 7 1 7 7 7 7 7 7 2 2 3 6 4 7 9 9 1 3 3 3 3 3 3 3 3 4 4 4 4 4 4 4 4 5 3 8 0 5 7 4 8 2 9 9 9 9 9 9 9 9 0 0 0 0 0 0 0 0
6 6 6 6 6 6 6 5 5 5 5 5 5 5 5 5 6 6 6 6 6 6 6 6 6 1 3 3 2 3 0 1 9 9 9 9 9 9 9 9 9 0 0 0 0 0 0 0 0 0 7 7 6 2 3 1 0 4 3 1 2 5 6 7 8 9 0 2 3 4 5 6 7 8 9
. . . . . . . . . . . . . . . . . . . . . . . . .
. . . . . . . . . . . . . . . . . . . . . . . . .
. . . . . . . . . . . . . . . . . . . . . . . . .
. . . . . . . . . . . . . . . . . . . . . . . . .
. . . . . . . . . . . . . . . . . . . . . . . . .
. . . . . . . . . . . . . . . . . . . . . . . . . + + + + + + + + A + + + + + + + + + + + + + + + + + + + + + + + + A + + + + + + + + + + + + + + + + . . . . . . . . . . . . . . . . . . . . . . . . .
X X X
X x x X X x x
+ + + X
. . . . . . . . . . . . . . . . . . . . . . . . . + + + + + + + + M + + + + + + + + + + + + + + + + . . . . . . . . . . . . . . . . . . . . . . . . . . . . . . . . . . . . . . . . . . . . . . . . . .
+ . . . . . . . . . . . . . . . . . . . . . . . . .
X
. . . . . . . . . . . . . . . . . . . . . . . . .
X . . . . . . . . . . . . . . . . . . . . . . . . .
X . . . . . . . . . . . . . . . . . . . . . . . . .
+ + M + + M + + + + + + + + + + + + + M + + M + + + + + + + + + + + + + M + M + + + + + + + + + + +
X X X . . . . . . . . . . . . . . . . . . . . . . . . .
X
M: Missingtissue X Lesionpresent I: Insufficienttissue Blank N o t e x a m i n e d

193 Lesions in Female Mice
TABLE D2 Individual Animal Tumor Pathology of Female Mice in the 2-Year Feed Study of Tricresyl Phosphate: 0 ppm (continued)
Number of Days on Study
Carcass ID Number
Alimentary System Esophagus Gallbladder Intestine large, colon Intestine large, rectum Intestine large, cecum Intestine small, duodenum Intestine small, jejunum Intestine small, ileum Liver
Hepatocellular carcinoma Hepatocellular carcinoma, multiple Hepatocellular adenoma Hepatocellular adenoma, multiple
Mesentery Fibrosarcoma, metastatic, skin
Pancreas Salivary glands Stomach, forestomach Stomach, glandular
Cardiovascular System Blood vessel Heart
Hemangiosarcoma
Endocrine System Adrenal cortex
Adenoma Subcapsular, adenoma
Adrenal medulla Pheochromocytoma benign
Islets, pancreatic Carcinoma
Parathyroid gland P i t u i t a r y gland
Pars distalis, adenoma Thyroid gland
Follicular cell, adenoma
General Body System Tissue NOS
Leiomyoma
7 7 7 7 7 7 7 7 7 7 7 7 7 7 7 7 7 7 7 7 7 7 7 7 7 4 4 4 4 4 4 4 4 4 4 4 4 4 4 4 4 4 4 4 4 4 4 4 4 4 0 0 0 0 0 0 0 0 0 0 0 0 0 0 0 0 0 0 0 0 0 0 0 0 0
6 6 6 6 6 6 6 6 6 6 6 6 6 6 6 6 6 6 6 6 6 6 6 6 6 Total 1 1 1 1 1 1 1 1 2 2 2 2 2 2 2 2 2 3 3 3 3 3 3 3 4 T i s s U e s l 1 2 3 4 5 6 8 9 0 1 3 4 5 6 7 8 9 0 1 2 4 5 8 9 0 Tumors
. . . . . . . . . . . . . . . . . . . . . . . . . 50 + + + M + + + + + + + + + + + + + + + + + + + + + 49 . . . . . . . . . . . . . . . . . . . . . . . . . 50 . . . . . . . . . . . . . . . . . . . . . . . . . 50 . . . . . . . . . . . . . . . . . . . . . . . . . 50 . . . . . . . . . . . . . . . . . . . . . . . . . 50 . . . . . . . . . . . . . . . . . . . . . . . . . 49 . . . . . . . . . . . . . . . . . . . . . . . . . 49 . . . . . . . . . . . . . . . . . . . . . . . . . 50
X X x x x x X 9 1
x x x 7 X X 5 + + 5
1 . . . . . . . . . . . . . . . . . . . . . . . . . 50 . . . . . . . . . . . . . . . . . . . . . . . . . 49 . . . . . . . . . . . . . . . . . . . . . . . . . 50 . . . . . . . . . . . . . . . . . . . . . . . . . 50
1 . . . . . . . . . . . . . . . . . . . . . . . . . 50
1
. . . . . . . . . . . . . . . . . . . . . . . . . 50 X 1
X 2 . . . . . . . . . . . . . . . . . . . . . . . . . 50
X 2 . . . . . . . . . . . . . . . . . . . . . . . . . 50
X 1 . . . . . . . . . . . . . . . . . . . . . . . . . 46 M + M + + + + + + + + + + + + + + + + + + + + + + 46
X x x 6 . . . . . . . . . . . . . . . . . . . . . . . . . 49
1
+ 1 X 1
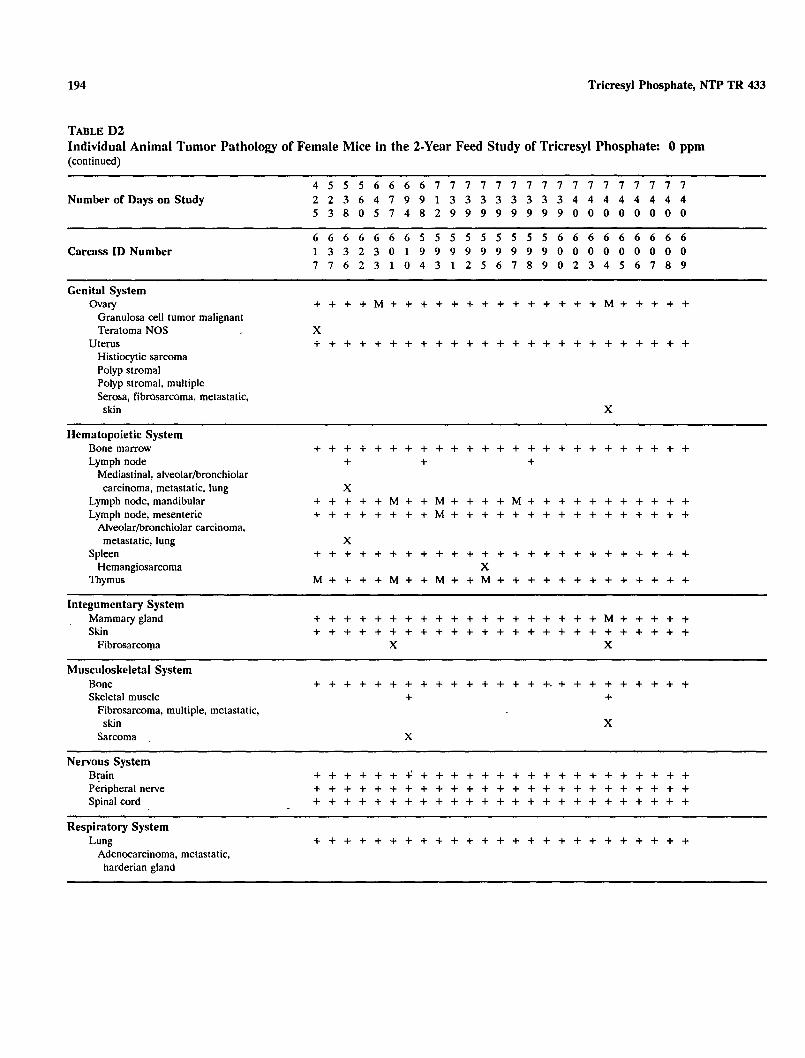
194 Tricresyl Phosphate, NTP TR 433
TABLED2 Individual Animal Tumor Pathology of Female Mice in the 2-Year Feed Study of Tricresyl Phosphate: 0 ppm (continued)
Number of Days on Study
Carcass I D Number
Genital System Ovary
Granulosa c e l l tumor mal ignant Teratoma NOS
Uterus Histiocytic sarcoma Polyp stromal Polyp stromal, multiple Serosa, fibrosarcoma, metastatic, skin
Hematopoietic System Bone marrow Lymph node
Mediastinal, alveolar/bronchiolar carcinoma, metastatic, l u n g
Lymph node, mandibular Lymph node, mesenteric
Alveolarbronchiolar carcinoma, metastatic, lung
Spleen Hemangiosarcoma
Thymus
Integumentary System Mammary gland Skin
Fibrosarcoma
Musculoskeletal System Bone Skeletal muscle
Fibrosarcoma, multiple, metastatic, skin
Sarcoma .
Nervous System Brain Peripheral nerve Spinal cord
Respiratory System Lung
Adenocarcinoma, metastatic, harderian gland
4 5 5 5 6 6 6 6 7 7 7 7 7 7 7 7 7 7 7 7 7 7 7 7 7 2 2 3 6 4 7 9 9 1 3 3 3 3 3 3 3 3 4 4 4 4 4 4 4 4 5 3 8 0 5 7 4 8 2 9 9 9 9 9 9 9 9 0 0 0 0 0 0 0 0
6 6 6 6 6 6 6 5 5 5 5 5 5 5 5 5 6 6 6 6 6 6 6 6 6 1 3 3 2 3 0 1 9 9 9 9 9 9 9 9 9 0 0 0 0 0 0 0 0 0 7 1 6 2 3 1 0 4 3 1 2 5 6 7 8 9 0 2 3 4 5 6 7 8 9
+ + + + M + + + + + + + + + + + + + + M + + + + +
X . . . . . . . . . . . . . . . . . . . . . . . . .
X
. . . . . . . . . . . . . . . . . . . . . . . . . + + + X
+ + + + + M + + M + + + + M + + + + + + + + + + + . . . . . . . . . . . . . . . . . . . . . . . . .
X . . . . . . . . . . . . . . . . . . . . . . . . .
X M + + + + M + + M + + M + + + + + + + + + + + + +
+ + + + + + + + + + + + + + + + + + + M + + + + + . . . . . . . . . . . . . . . . . . . . . . . . .
X X
. . . . . . . . . . . . . . . . . . . . . . . . . . + +
X X
. . . . . . . . . . . . . . . . . . . . . . . . .
. . . . . . . . . . . . . . . . . . . . . . . . .
. . . . . . . . . . . . . . . . . . . . . . . . .
. . . . . . . . . . . . . . . . . . . . . . . . .

195 Lesions i n Female Mice
TABLED2 Individual Animal Tumor Pathology of Female Mice in the 2-Year Feed Study of Tricresyl Phosphate: 0 ppm (continued)
Number of Days on Study
Carcass ID Number
Genital System Ovary
Granulosa cell tumor malignant Teratoma NOS
Uterus Histiocytic sarcoma Polyp stromal Polyp stromal, multiple Serosa, fibrosarcoma, metastatic, skin
IIematopoietic System Bone marrow Lymphnode
Mediastinal, alveolar/bronchiolar carcinoma, metastatic, lung
Lymph node, mandibular Lymph node, mesenteric
Alveolarbronchiolar carcinoma, metastatic, lung
Spleen Hemangiosarcoma
Thymus
Integumentary System Mammary gland Skin
Fibrosarcoma
Musculoskeletal System Bone Skeletal muscle
Fibrosarcoma, multiple, metastatic, skin
Sarcoma
Nervous System Brain Peripheral nerve Spinal cord
Respiratory System Lung
Adenocarcinoma, metastatic, harderian gland
7 7 1 7 1 7 7 7 7 7 7 7 7 7 1 7 7 7 7 7 7 7 7 7 7 4 4 4 4 4 4 4 4 4 4 4 4 4 4 4 4 4 4 4 4 4 4 4 4 4 0 0 0 0 0 0 0 0 0 0 0 0 0 0 0 0 0 0 0 0 0 0 0 0 0
6 6 6 6 6 6 6 6 6 6 6 6 6 6 6 6 6 6 6 6 6 6 6 6 6 Total 1 1 1 1 1 1 1 1 2 2 2 2 2 2 2 2 2 3 3 3 3 3 3 3 4 Tissuesf 1 2 3 4 5 6 8 9 0 1 3 4 5 6 7 8 9 0 1 2 4 5 8 9 0 Tumors
. . . . . . . . . . . . . . . . . . . . . . . . . 48 x 1
1 . . . . . . . . . . . . . . . . . . . . . . . . . 50
X 1 X 1
X 1
1
. . . . . . . . . . . . . . . . . . . . . . . . . 50 3
1 + + + + + + + + + + + M + + + + + + + + + + + + + 46 . . . . . . . . . . . . . . . . . . . . . . . . . 49
1 . . . . . . . . . . . . . . . . . . . . . . . . . 50
X X 3 + + + + + + + + + + + + + + M + + + + + + + + + + 45'
. . . . . . . . . . . . . . . . . . . . . . . . . 49
. . . . . . . . . . . . . . . . . . . . . . . . . 50 1
. . . . . . . . . . . . . . . . . . . . . . . . . 50 2
1 1
. . . . . . . . . . . . . . . . . . . . . . . . . 50
. . . . . . . . . . . . . . . . . . . . . . . . . 50
. . . . . . . . . . . . . . . . . . . . . . . . . 50
. . . . . . . . . . . . . . . . . . . . . . . . . 50
X 1

1% Tricresyl Phosphate, NTP TR 433
TABLED2 Individual Animal Tumor Pathology of Female Mice in the 2-Year Feed Study of Tricresyl Phosphate: 0 ppm (continued)
Number of Days on Study
Carcass ID Number
Respiratory System (continued) Lung (continued)
Alveolar/bronchiolar adenoma Alveolar/bronchiolar carcinoma Alveolar/bronchiolar carcinoma,
multiple Fibrosarcoma, metastatic, skin Hepatocellular carcinoma, metastatic,
liver Nose Trachea
Special Senses System EyeHarderian gland
Adenoma
Urinary System Kidney
Renal tubule, adenoma Urinary bladder
Systemic Lesions Multiple organs
Histiocytic sarcoma Lymphoma malignant mixed Lymphoma malignant undifferentiated cell type
4 5 5 5 6 6 6 6 1 1 1 7 7 1 1 1 1 1 1 7 7 1 1 7 1 2 2 3 6 4 7 9 9 1 3 3 3 3 3 3 3 3 4 4 4 4 4 4 4 4 5 3 8 0 5 1 4 8 2 9 9 9 9 9 9 9 9 0 0 0 0 0 0 0 0
6 6 6 6 6 6 6 5 5 5 5 5 5 5 5 5 6 6 6 6 6 6 6 6 6 1 3 3 2 3 0 1 9 9 9 9 9 9 9 9 9 0 0 0 0 0 0 0 0 0 1 7 6 2 3 1 0 4 3 1 2 5 6 7 8 9 0 2 3 4 5 6 7 8 9
. . . . . . . . . . . . . . . . . . . . . . . . .
X X X
X . . . . . . . . . . . . . . . . . . . . . . . . . + + + + + M + + + + + + + + + + + + + + + + + + +
+ + M + + + + + + + + + + + + + + + + + + + + + + +
X X
. . . . . . . . . . . . . . . . . . . . . . . . .
. . . . . . . . . . . . . . . . . . . . . . . . .
. . . . . . . . . . . . . . . . . . . . . . . . .
X x x
X

Lesions in Female Mice
TABLED t Individual Animal Tumor Pathology of (continued)
Number o f Days on Study
Carcass ID Number
Respiratory System (continued) Lung (continued)
Ahreolarbronchiolar adenoma Alveolar/bronchiolar carcinoma Alveolar/bronchiolar carcinoma,
multiple Fibrosarcoma, metastatic, skin Hepatocellular carcinoma, metastatic,
liver Nose Trachea
Special Senses System EyeHarderian gland
Adenoma
Urinary System Kidney
Renal tubule, adenoma Urinary bladder
Systemic Lesions Multiple organs
Histiocytic Sarcoma Lymphoma malignant mixed Lymphoma m a l i g n a n t undifferentiated cell type
197
Female Mice in the 2-Year Feed Study of Tricresyl Phosphate: 0 ppm
7 7 7 7 7 7 7 7 7 7 7 7 7 7 7 7 7 7 7 7 7 7 7 7 7 4 4 4 4 4 4 4 4 4 4 4 4 4 4 4 4 4 4 4 4 4 4 4 4 4 0 0 0 0 0 0 0 0 0 0 0 0 0 0 0 0 0 0 0 0 0 0 0 0 0
6 6 6 6 6 6 6 6 6 6 6 6 6 6 6 6 6 6 6 6 6 6 6 6 6 Total 1 1 1 1 1 1 1 1 2 2 2 2 2 2 2 2 2 3 3 3 3 3 3 3 4 Tissues/ 1 2 3 4 5 6 8 9 0 1 3 4 5 6 7 8 9 0 1 2 4 5 8 9 0 Tumors
. . . . . . . . . . . . . . . . . . . . . . . . . 50 X X 2 X X X 3
1 2
X X X X 5 . . . . . . . . . . . . . . . . . . . . . . . . . 50 . . . . . . . . . . . . . . . . . . . . . . . . . 49
1 + + + + + M + + + + + + + + + + + + + + + M + + + 47
x x x . 5
. . . . . . . . . . . . . . . . . . . . . . . . . 50 X 1
+ + + + + + + + + + + + + + + + + + + M + + + + + 49
. . . . . . . . . . . . . . . . . . . . . . . . . 50 X 1
3
1

198 Tricresyl Phosphate, NTP TR 433
TABLED2 Individual Animal Tumor Pathology of Female Mice in the 2-Year Feed Study of Tricresyl Phosphate: 60 ppm
Number of Days on Study
Carcass ID Number
Alimentary System Esophagus Gallbladder Hepatocholangiocarcinoma, metastatic,
liver Intestine large, colon Intestine large, rectum Intestine large, cecum Intestine small, duodenum Intestine small, jejunum Intestine small, ileum Liver
Hemangiosarcoma, metastatic, spleen Hepatocellular carcinoma Hepatocellular carcinoma, multiple Hepatocellular adenoma Hepatocellular adenoma, multiple Hepatocholangiocarcinoma Histiocytic sarcoma
Mesentery Fibrosarcoma, metastatic, skin
Pancreas Salivary glands Stomach, forestomach
Squamous cell papilloma Stomach, glandular Tooth
Cardiovascular System Heart
Histiocytic sarcoma
Endocrine System Adrenal cortex Adrenal medulla Islets, pancreatic Parathyroid gland Pituitary gland
Pars distalis, adenoma Pars intennedia, adenoma
Thyroid gland
General Body System None
4 4 5 5 6 6 6 6 6 6 6 1 1 1 1 1 1 1 1 1 1 1 1 1 1 1 5 6 1 0 4 5 1 1 8 9 0 3 3 3 3 3 3 3 3 3 3 3 3 3 3 4 1 1 3 5 2 4 1 9 6 0 8 8 8 8 8 8 8 8 8 8 8 8 8
6 6 6 6 6 6 6 6 6 6 6 6 6 6 6 6 6 6 6 6 6 6 6 6 6 I 4 5 8 9 8 8 4 4 6 8 1 4 4 4 4 4 4 5 5 5 5 5 5 5 9 1 9 1 0 6 4 8 1 5 3 1 2 3 4 5 6 9 0 1 2 3 4 5 6
. . . . . . . . . . . . . . . . . . . . . . . . . + + + + + + + + + + + M + + + + + + + + + + + + +
. . . . . . . . . . . . . . . . . . . . . . . . . + + + + + + M + + + + + + + + + + + + + + + + + + . . . . . . . . . . . . . . . . . . . . . . . . . . . . . . . . . . . . . . . . . . . . . . . . . . . . . . . . . . . . . . . . . . . . . . . . . . . . . . . . . . . . . . . . . . . . . . . . . . . . . . . . . . . . . . . . . . . . . . . . . . . . .
X X X
X X X X
X X + + +
X . . . . . . . . . . . . . . . . . . . . . . . . . . . . . . . . . . . . . . . . . . . . . . . . . . . . . . . . . . . . . . . . . . . . . . . . . . .
X . . . . . . . . . . . . . . . . . . . . . . . . .
+
. . . . . . . . . . . . . . . . . . . . . . . . . X
+ + + + + + M + + + + + + + + + + + + + + + + + + . . . . . . . . . . . . . . . . . . . . . . . . . . . . . . . . . . . . . . . . . . . . . . . . . . + + M + + + + + + + + + + + + + + + + + + M + M M . . . . . . . . . . . . . . . . . . . . . . . . .
X X X X X
. . . . . . . . . . . . . . . . . . . . . . . . .

199 Lesions i n Female Mice
TABLED2 Individual Animal Tumor Pathology (continued)
Number of Days on Study
Carcass ID Number
Alimentary System Esophagus Gallbladder Hepatocholangiocarcinoma,metastatic, liver
Intestine large, colon Intestine large, rectum Intestine large, cecum Intestine small, duodenum Intestine small, jejunum Intestine small, ileum Liver
Hemangiosarcoma, metastatic, spleen Hepatocellular carcinoma Hepatocellular carcinoma, multiple Hepatocellular adenoma Hepatocellular adenoma, multiple Hepatocholangiocarcinoma Histiocytic sarcoma
Mesentery Fibrosarcoma, metas ta t ic , skin
Pancreas Salivary glands Stomach, forestomach
Squamous cell papilloma Stomach, glandular Tooth
Cardiovascular System Heart
Histiocytic sarcoma
Endocrine System Adrenal cortex Adrenal medulla Islets, pancreatic Parathyroid gland Pituitary gland
Pars distalis, adenoma Pars intermedia, adenoma
Thyroid gland
General Body System None
of Female Mice i n the 2-Year Feed Study of Tricresyl Phosphate: 60 ppm
7 7 7 7 7 7 1 1 7 1 7 1 7 1 7 1 7 1 7 1 7 1 7 7 7 3 3 3 3 3 3 3 3 3 3 3 3 3 3 3 3 3 3 3 3 3 3 3 3 3 8 8 8 9 9 9 9 9 9 9 9 9 9 9 9 9 9 9 9 9 9 9 9 9 9
6 6 6 6 6 6 6 6 6 6 6 6 6 6 6 6 6 6 6 6 6 6 6 6 6 5 5 6 6 6 6 6 6 6 6 6 7 7 7 7 7 7 7 7 8 8 8 8 8 8 7 8 2 0 1 3 4 6 7 8 9 0 2 3 4 5 6 7 8 0 2 5 7 8 9
. . . . . . . . . . . . . . . . . . . . . . . . . + + + + + + + + + + M + + + + + + + + + + + + + +
X . . . . . . . . . . . . . . . . . . . . . . . . . + + M + + + + + + + + + + + + + + + + + + + + + + . . . . . . . . . . . . . . . . . . . . . . . . . . . . . . . . . . . . . . . . . . . . . . . . . . . . . . . . . . . . . . . . . . . . . . . . . . . . . . . . . . . . . . . . . . . . . . . . . . . . . . . . . . . . . . . . . . . . . . . . . . . . .
X x x x X X X
X X
+ + . . . . . . . . . . . . . . . . . . . . . . . . . . . . . . . . . . . . . . . . . . . . . . . . . . . . . . . . . . . . . . . . . . . . . . . . . . .
. . . . . . . . . . . . . . . . . . . . . . . . .
. . . . . . . . . . . . . . . . . . . . . . . . .
. . . . . . . . . . . . . . . . . . . . . . . . .
. . . . . . . . . . . . . . . . . . . . . . . . .
. . . . . . . . . . . . . . . . . . . . . . . . . + M + + M + + + + M M + + + + + + + + + + + + + + + + + + + + + + + + + + + + + M M M + + + M + + + x x X X
. . . . . . . . . . . . . . . . . . . . . . . . .
Total Tissues1 Tumors
50 48
1 50 48 50 50 50 50 50 1 2 1 10 1 1 2 5 1
50 50 5 0 1
50 1
50 1
49 49 50 42 46 8 1
50 '

200 Tricresyl Phosphate, NTP TR 433
TABLED2 Individual Animal Tumor Pathology of Female Mice in the 2-YearFeed Study of Tricresyl Phosphate: 60 ppm (continued)
Number of Days on Study
Carcass ID Number
Genital System Ovary
Histiocytic sarcoma Luteoma
Uterus Histiocytic sarcoma Polyp stromal
Ifematopoietic System Bone marrow Lymph node
Mediastinal, histiocytic sarcoma Pancreatic, hepatocholangiocarcinoma, metastatic, liver
Lymph node, mandibular Histiocytic sarcoma
Lymph node, mesenteric Hepatocholangiocarcinoma,metastatic, liver
Histiocytic sarcoma Spleen
Hemangiosarcoma Histiocytic sarcoma
Thymus
Integumentary System Mammary gland Skin
Fibrosarcoma Subcutaneous tissue, myxosarcoma
Musculoskeletal System Bone
Nervous System Brain
Meninges, myxosarcoma, metastatic, skin
Peripheral nelve Spinal cord
Respiratory System Lung
Alveolarbronchiolar adenoma Ahreolar/bronchiolar carcinoma Hepatocellular carcinoma, metastatic, liver
Hepatocholangiocarcinoma, metastatic, liver
Histiocytic sarcoma
4 4 5 5 6 6 6 6 6 6 6 7 7 7 7 7 7 7 7 7 7 7 7 7 7 I 5 6 7 0 4 5 7 7 8 9 0 3 3 3 3 3 3 3 3 3 3 3 3 3 3 4 1 1 3 5 2 4 7 9 6 0 8 8 8 8 8 8 8 8 8 8 8 8 8
6 6 6 6 6 6 6 6 6 6 6 6 6 6 6 6 6 6 6 6 6 6 6 6 6 7 4 5 8 9 8 8 4 4 6 8 7 4 4 4 4 4 4 5 5 5 5 5 5 5 9 1 9 1 0 6 4 8 7 5 3 1 2 3 4 5 6 9 0 1 2 3 4 5 6
. . . . . . . . . . . . . . . . . . . . . . . . . X
. . . . . . . . . . . . . . . . . . . . . . . . . x x
X
. . . . . . . . . . . . . . . . . . . . . . . . . + + X
+ + + + + + + + M + + + + + + M + M + + + + + + + X
+ + + + + + + + + + + + + + + + + + + + + M + + +
X X . . . . . . . . . . . . . . . . . . . . . . . . .
X X X
+ + M + + + + + M + + M + + + + + + + + + M + + + ~ ~~
. . . . . . . . . . . . . . . . . . . . . . . . .
. . . . . . . . . . . . . . . . . . . . . . . . . X
. . . . . . . . . . . . . . . . . . . . . . . . .
. . . . . . . . . . . . . . . . . . . . . . . . .
. . . . . . . . . . . . . . . . . . . . . . . . .
. . . . . . . . . . . . . . . . . . . . . . . . .
. . . . . . . . . . . . . . . . . . . . . . . . . X
X
X X

201 Lesions in Female Mice
TABLED2 Individual Animal Tumor Pathology of (continued)
Number of Days on Study
Carcass ID Number
Genital System Ovary
Histiocytic sarcoma Luteoma
Uterus Histiocytic sarcoma Polyp stromal
Ilematopoietic System Bone marrow Lymph node
Mediastinal, histiocytic sarcoma Pancreatic, hepatocholangiocarcinoma, metastatic, liver
Lymph node, mandibular Histiocytic sarcoma
Lymph node, mesenteric Hepatocholangiocarcinoma, metastatic, liver
Histiocytic sarcoma Spleen
Hemangiosarcoma Histiocytic sarcoma
Thymus
Integumentary System Mammary gland Skin
Fibrosarcoma Subcutaneous tissue, myxosarcoma
Musculoskeletal System Bone
Nervous System Brain
Meninges, myxosarcoma, metastatic, skin
Peripheral newe Spinal cord
Respiratory System Lung
Alveolarbronchiolar adenoma Alveolarbronchiolar carcinoma Hepatocellular carcinoma, metastatic, liver
Hepatocholangiocarcinoma,metastatic, liver
Histiocytic sarcoma
Female Mice in the 2-Year Feed Study of Tricresyl Phosphate: 60 ppm
1 1 1 1 1 1 1 1 1 1 1 1 1 1 1 1 1 1 1 1 1 1 1 1 1 3 3 3 3 3 3 3 3 3 3 3 3 3 3 3 3 3 3 3 3 3 3 3 3 3 8 8 8 9 9 9 9 9 9 9 9 9 9 9 9 9 9 9 9 9 9 9 9 9 9
6 6 6 6 6 6 6 6 6 6 6 6 6 6 6 6 6 6 6 6 6 6 6 6 6 5 5 6 6 6 6 6 6 6 6 6 1 1 1 1 1 1 1 1 8 8 8 8 8 8 1 8 2 0 1 3 4 6 1 8 9 0 2 3 4 5 6 7 8 0 2 5 1 8 9
. . . . . . . . . . . . . . . . . . . . . . . . .
X . . . . . . . . . . . . . . . . . . . . . . . . .
. . . . . . . . . . . . . . . . . . . . . . . . . + +
X . . . . . . . . . . . . . . . . . . . . . . . . .
+ + + + + + + + + + M + + M + + + + M + + + + + +
X
. . . . . . . . . . . . . . . . . . . . . . . . .
. . . . . . . . . . . . . . . . . . . . . . . . .
. . . . . . . . . . . . . . . . . . . . . . . . .
. . . . . . . . . . . . . . . . . . . . . . . . .
X
. . . . . . . . . . . . . . . . . . . . . . . . .
. . . . . . . . . . . . . . . . . . . . . . . . .
X . . . . . . . . . . . . . . . . . . . . . . . . . . . . . . . . . . . . . . . . . . . . . . . . . .
. . . . . . . . . . . . . . . . . . . . . . . . . x x X
X
X
Total Tissues/ Tumors
50 1 1
50 z 1
50 4 1
1 41
1 46
1 2
50 1 2
44
50 50 1 1
50
50
1 5 0 5 0
50 4 1
1
1 2

202 Tricresyl Phosphate, NTP TR 433
TABLE D2 Individual Animal Tumor Pathology of Female Mice in the 2-Year Feed Study of Tricresyl Phosphate: 60 ppm (continued)
Number of Days on Study
Carcass ID Number
~~ ~
Respiratory System (continued) Nose Trachea
Special Senses System Harderian gland
Adenoma
Urinary System Kidney Urinary bladder
Systemic Lesions Multiple organs
Histiocytic sarcoma Lymphoma malignant lymphocytic Lymphoma malignant undifferentiated cell type
4 4 5 5 6 6 6 6 6 6 6 7 7 7 1 1 1 1 1 1 1 1 1 1 1 1 5 6 1 0 4 5 1 1 8 9 0 3 3 3 3 3 3 3 3 3 3 3 3 3 3 4 1 1 3 5 2 4 1 9 6 0 8 8 8 8 8 8 8 8 8 8 8 8 8
6 6 6 6 6 6 6 6 6 6 6 6 6 6 6 6 6 6 6 6 6 6 6 6 6 1 4 5 8 9 8 8 4 4 6 8 1 4 4 4 4 4 4 5 5 5 5 5 5 5 9 1 9 1 0 6 4 8 1 5 3 1 2 3 4 5 6 9 0 1 2 3 4 5 6
. . . . . . . . . . . . . . . . . . . . . . . . .
. . . . . . . . . . . . . . . . . . . . . . . . .
M + M + + M M + + + + + M + + + + + + M M + + M M X X
. . . . . . . . . . . . . . . . . . . . . . . . .
. . . . . . . . . . . . . . . . . . . . . . . . .
. . . . . . . . . . . . . . . . . . . . . . . . . x x X
X X
X X

203 Lesions in Female Mice
TABLED2 Individual Animal Tumor Pathology of Female Mice in the 2-Year Feed Study of Tricresyl Phosphate: 60 ppm (continued)
Number of Days on Study
Carcass ID Number
Respiratory System (continued) Nose Trachea
Special Senses System Harderian gland
Adenoma
Urinary System Kidney Urinary bladder
Systemic Lesions Multiple organs
Histiocytic sarcoma Lymphoma malignant lymphocytic Lymphoma malignant undifferentiated cell t y p e
7 7 7 7 7 7 7 7 7 7 7 7 7 7 7 7 7 7 7 7 7 7 7 7 7 3 3 3 3 3 3 3 3 3 3 3 3 3 3 3 3 3 3 3 3 3 3 3 3 3 8 8 8 9 9 9 9 9 9 9 9 9 9 9 9 9 9 9 9 9 9 9 9 9 9
6 6 6 6 6 6 6 6 6 6 6 6 6 6 6 6 6 6 6 6 6 6 6 6 6 Total 5 5 6 6 6 6 6 6 6 6 6 7 7 7 7 7 7 7 7 8 8 8 8 8 8 Tissues/ 7 8 2 0 1 3 4 6 7 8 9 0 2 3 4 5 6 7 8 0 2 5 7 8 9 Tumors
. . . . . . . . . . . . . . . . . . . . . . . . . 50 + + + + M + + + + + + + + + + + + + + + + + + + + 49
+ M M + + + + + + + + + + + + + + + + + + + M + + 38 X 3
. . . . . . . . . . . . . . . . . . . . . . . . . 50
. . . . . . . . . . . . . . . . . . . . . . . . . 50
. . . . . . . . . . . . . . . . . . . . . . . . . 50 3
X 3
X 3

204 Tricresyl Phosphate, NTP TR 433
TULE D2 Individual Animal Tumor Pathology of Female Mice in the 2-Year Feed Study of Tricresyl Phosphate: 125 ppm
Number of Days on Study
Carcass ID Number
Alimentary System Esophagus Gallbladder Intestine large, colon Intestine large, rectum Intestine large, cecum Intestine small, duodenum Intestine small, jejunum Intestine small, ileum Liver
Hepatocellular carcinoma Hepatocellular adenoma Hepatocellular adenoma, multiple Histiocytic sarcoma
Mesentery Pancreas Salivary glands Stomach, forestomach Stomach, glandular
Cardiovascular System B l o o d vessel Heart
Endocrine System Adrenal cortex Adrenal medulla
Pheochromocytoma benign Islets, pancreatic Parathyroid gland Pituitary gland
Pats distalis, adenoma Thyroid gland
Follicular cell, adenoma
General Body System None
Genital System Ovaly
Cystadenoma Hemangioma
Uterus Hemangioma Histiocytic sarcoma Polyp stromal
2 6 6 6 7 7 7 7 7 7 7 7 7 7 7 7 7 7 7 7 7 7 7 8 0 2 . 5 2 3 3 3 3 3 3 3 3 3 3 3 3 3 3 3 3 3 3 3 7 1 3 3 0 7 7 7 7 7 7 7 7 7 7 7 7 7 7 7 7 7
7 7 7 7 7 6 6 6 6 6 6 6 6 6 7 7 7 7 7 7 7 7 7 0 1 3 3 2 9 9 9 9 9 9 9 9 9 0 0 0 0 0 0 0 0 0 8 4 1 2 8 5 1 2 3 4 6 7 8 9 0 1 2 3 4 5 6 7 9
. . . . . . . . . . . . . . . . . . . . . . . + + + + + + + + + + + + + + + + + + + M + + + . . . . . . . . . . . . . . . . . . . . . . . . . . . . . . . . . . . . . . . . . . . . . . . . . . . . . . . . . . . . . . . . . . . . . . . . . . . . . . . . . . . . . . . . . . . . . . . . . . . . . . . . . . . . . . . . . . . . . . . . . . . . . . . . . . . . . . . . . . . . . . . . . . . . . . . . . . . . . . . . .
X X X x x x x
X X X
+ + + + + . . . . . . . . . . . . . . . . . . . . . . . . . . . . . . . . . . . . . . . . . . . . . . . . . . . . . . . . . . . . . . . . . . . . . . . . . . . . . . . . . . . . . . . . . . . .
+ . . . . . . . . . . . . . . . . . . . . . . .
. . . . . . . . . . . . . . . . . . . . . . .
. . . . . . . . . . . . . . . . . . . . . . . X
. . . . . . . . . . . . . . . . . . . . . . . + + + + + + M + M + + + M + + + + + M + + + + . . . . . . . . . . . . . . . . . . . . . . .
X . . . . . . . . . . . . . . . . . . . . . . .
. . . . . . . . . . . . . . . . . . . . . . . X
X . . . . . . . . . . . . . . . . . . . . . . .

Lesions in Female Mice
TABLED2 Individual Animal Tumor Pathology (continued)
Number of Days on Study
Carcass ID Number
Alimentary System Esophagus Gallbladder Intestine large, colon Intestine large, rectum Intestine large, cecum Intestine small, duodenum Intestine small, jejunum Intestine small, ileum Liver
Hepatocellular carcinoma Hepatocellular adenoma Hepatocellular adenoma, multiple Histiocytic sarcoma
Mesentery Pancreas Salivary glands Stomach, forestomach Stomach, glandular
Cardiovascular System B l o o d vessel Heart
Endocrine System Adrenal cortex Adrenal medulla
Pheochromocytoma benign Islets, pancreatic Parathyroid gland Pituitary gland
Pars distalis, adenoma Thyroid gland
Follicular cell, adenoma
General Body System None
Genital System Ovary
Cystadenoma Hemangioma
Uterus Hemangioma Histiocytic sarcoma Polyp stromal
205
of Female Mice in the 2-Year Feed Study of Tricresyl Phosphate: 125 ppm
7 7 7 7 7 7 7 7 7 7 7 7 7 7 7 7 7 7 7 7 7 7 7 7 7 3 3 3 3 3 3 3 3 3 3 3 3 3 3 3 3 3 3 3 3 3 3 3 3 3 7 7 7 7 7 7 7 8 8 8 8 8 8 8 8 8 8 8 8 8 8 8 8 8 8
7 7 7 7 1 7 7 7 7 7 7 7 7 7 7 7 1 7 7 7 7 7 7 7 7 Total 1 1 1 1 1 1 1 1 2 2 2 2 2 2 2 2 2 3 3 3 3 3 3 3 4 Tissues/ 1 2 3 5 6 7 8 9 0 1 2 3 4 5 6 7 9 0 3 4 5 6 7 8 0 Tumors
. . . . . . . . . . . . . . . . . . . . . . . . . 48
. . . . . . . . . . . . . . . . . . . . . . . . . 47
. . . . . . . . . . . . . . . . . . . . . . . . . 48
. . . . . . . . . . . . . . . . . . . . . . . . . 48
. . . . . . . . . . . . . . . . . . . . . . . . . 48
. . . . . . . . . . . . . . . . . . . . . . . . . 48
. . . . . . . . . . . . . . . . . . . . . . . . . 48
. . . . . . . . . . . . . . . . . . . . . . . . . 48
. . . . . . . . . . . . . . . . . . . . . . . . . 48 1
X X X X 10 X 3
1 + 6 . . . . . . . . . . . . . . . . . . . . . . . . . . 48 . . . . . . . . . . . . . . . . . . . . . . . . . 48 . . . . . . . . . . . . . . . . . . . . . . . . . 48 . . . . . . . . . . . . . . . . . . . . . . . . . 48
1 48
. . . . . . . . . . . . . . . . . . . . . . . . . 48
. . . . . . . . . . . . . . . . . . . . . . . . . 48 1
. . . . . . . . . . . . . . . . . . . . . . . . . 48 + + M + + + + + + + + + + + + + + + + + + + + + + 43 + + + + + + + + + + + + M + + + + + + M + + + + + 46
X X x x x 6 . . . . . . . . . . . . . . . . . . . . . . . . . 48
X 1
. . . . . . . . . . . . . . . . . . . . . . . . . 47 1 1
. . . . . . . . . . . . . . . . . . . . . . . . . 48 X 1
X 1 X X X 3

206 Tricresyl Phosphate, NTP TR 433
TABLED2 Individual Animal Tumor Pathology of Female Mice in the 2-Year Feed Study of Tricresyl Phosphate: 125 ppm (continued)
Number of Days on Study
Carcass I D Number
Ilematopoietic System Bone marrow Lymph node
Lumbar, renal, thoracic, iliac, Renal, histiocytic sarcoma
Lymph node, mandibular Histiocytic sarcoma
Lymph node, mesenteric Histiocytic sarcoma
Spleen Hemangioma Heman,' atosarcoma Histiocytic sarcoma
Thymus Histiocytic sarcoma Thymoma m a l i g n a n t
Integumentary System Mammary gland Skin
Fibrosarcoma Hemangioma
Musculoskeletal System Bone Skeletal muscle
~~~~~~ ~~
Nervous System Brain Peripheral nerve Spinal cord
Respiratory System Lung
Alveolarbronchiolar adenoma Alveolarbronchiolar adenoma, multiple
Alveolarbronchiolar carcinoma Hepatocellular carcinoma, metastatic, liver
Histiocytic sarcoma Nose Trachea
2 6 6 6 7 7 7 7 7 7 7 7 7 7 7 7 7 7 7 7 7 7 7 g o 2 5 2 3 3 3 3 3 3 3 3 3 3 3 3 3 3 3 3 3 3 3 7 1 3 3 0 7 7 7 7 7 7 7 7 7 7 7 7 7 7 7 7 7
7 7 7 7 7 6 6 6 6 6 6 6 6 6 7 7 7 7 7 7 7 7 7 0 1 3 3 2 9 9 9 9 9 9 9 9 9 0 0 0 0 0 0 0 0 0 8 4 1 2 8 5 1 2 3 4 6 7 8 9 0 1 2 3 4 5 6 7 9
. . . . . . . . . . . . . . . . . . . . . . . + + +
X . . . . . . . . . . . . . . . . . . . . . . .
X . . . . . . . . . . . . . . . . . . . . . . .
X . . . . . . . . . . . . . . . . . . . . . . .
.,A
+ + + + M + + + + + + + + + + + + + + + + + + X
X
+ + + M + + + + + + + + + + + + + + + + + + + . . . . . . . . . . . . . . . . . . . . . . .
X
. . . . . . . . . . . . . . . . . . . . . . .
. . . . . . . . . . . . . . . . . . . . . . .
. . . . . . . . . . . . . . . . . . . . . . .
. . . . . . . . . . . . . . . . . . . . . . .
. . . . . . . . . . . . . . . . . . . . . . .
X X
X X
. . . . . . . . . . . . . . . . . . . . . . .
. . . . . . . . . . . . . . . . . . . . . . .

207 Lesions in Female Mice
TABLED2 Individual Animal Tumor Pathology of Female Mice in the 2-Year Feed Study of Tricresyl Phosphate: 125 ppm (continued)
Number of Days on Study
Carcass ID Number
Hematopoietic System Bone marrow Lymph node
Lumbar, renal, thoracic, iliac, Renal, histiocytic sarcoma
Lymphnode,mandibular Histiocytic sarcoma
Lymph node, mesenteric Histiocytic sarcoma
Spleen Hemangioma Hemangiosarcoma Histiocytic sarcoma
Thymus Histiocytic sarcoma Thymoma m a l i g n a n t
Integumentary System Mammary gland Skin
Fibrosarcoma Hemangioma
Musculoskeletal System Bone Skeletal muscle
Nervous System Brain Peripheral newe Spinal cord
Respiratory System Lung
Alveolarlbronchiolar adenoma Alveolarbronchiolar adenoma, multiple
Alveolarbronchiolar carcinoma Hepatocellular carcinoma, metastatic, liver
Histiocytic sarcoma Nose Trachea
7 7 7 7 7 7 7 7 7 7 7 7 7 7 7 7 7 7 7 7 7 7 7 7 7 3 3 3 3 3 3 3 3 3 3 3 3 3 3 3 3 3 3 3 3 3 3 3 3 3 7 7 7 7 7 7 7 8 8 8 8 8 8 8 8 8 8 8 8 8 8 8 8 8 8
7 7 7 7 7 7 7 7 7 7 7 7 7 7 7 7 7 7 7 7 7 7 7 7 7 Total 1 1 1 1 1 1 1 1 2 2 2 2 2 2 2 2 2 3 3 3 3 3 3 3 4 Tissues/ 1 2 3 5 6 7 8 9 0 1 2 3 4 5 6 7 9 0 3 4 5 6 7 8 0 Tumors
. . . . . . . . . . . . . . . . . . . . . . . . . 48 3
1 . . . . . . . . . . . . . . . . . . . . . . . . . 48
1 + + + + + + M + + + + + + + + + M + + + + + + M + 45
1 . . . . . . . . . . . . . . . . . . . . . . . . . 48
X 1 X 1
X 2 . . . . . . . . . . . . . . . . . . . . . . . . . 47
1 1
. . . . . . . . . . . . . . . . . . . . . . . . . 47
. . . . . . . . . . . . . . . . . . . . . . . . . 48 1
X 1
. . . . . . . . . . . . . . . . . . . . . . . . . 48 + 1
. . . . . . . . . . . . . . . . . . . . . . . . . 48
. . . . . . . . . . . . . . . . . . . . . . . . . 48
. . . . . . . . . . . . . . . . . . . . . . . . . 48
. . . . . . . . . . . . . . . . . . . . . . . . . 48 X X 2
1 X 2
1 1
. . . . . . . . . . . . . . . . . . . . . . . . . 48
. . . . . . . . . . . . . . . . . . . . . . . . . 48

208 Tricresyl Phosphate, NTP TR 433
TABLED2 Individual Animal Tumor Pathology of Female Mice in the 2-Year Feed Study of Tricresyl Phosphate: 125 ppm (continued)
Number of Days on Study
Carcass I D Number
Special Senses System Ear
Pinna, fibrosarcoma Harderian gland
Adenocarcinoma
Urinary System Kidney Urinary bladder
Systemic Lesions Multiple organs
Histiocytic sarcoma Lymphoma malignant lymphocytic Lymphoma malignant mixed Lymphoma malignant undifferentiated cell type
2 6 6 6 7 7 7 7 7 7 7 7 7 7 7 7 7 7 7 7 7 7 7 8 0 2 5 2 3 3 3 3 3 3 3 3 3 3 3 3 3 3 3 3 3 3 3 7 1 3 3 0 7 7 7 7 7 7 7 7 7 7 7 7 7 7 7 7 7
7 7 7 7 7 6 6 6 6 6 6 6 6 6 7 7 7 7 7 7 7 7 7 0 1 3 3 2 9 9 9 9 9 9 9 9 9 0 0 0 0 0 0 0 0 0 8 4 1 2 8 5 1 2 3 4 6 7 8 9 0 1 2 3 4 5 6 7 9
+ + X
+ + M + + + M + + + M + + + + + + M M M M M M X
. . . . . . . . . . . . . . . . . . . . . . .
. . . . . . . . . . . . . . . . . . . . . . .
. . . . . . . . . . . . . . . . . . . . . . . X
X X X
X

209 Lesions in Female Mice
TABLED2 Individual Animal Tumor Pathology of Female Mice in the 2-Year Feed Study of Tricresyl Phosphate: 125 ppm (continued)
Number of Days on Study
Carcass ID Number
Special Senses System Ear
Pinna, fibrosarcoma Harderian gland
Adenocarcinoma
Urinary System Kidney Urinary bladder
Systemic Lesions Multiple organs
Histiocytic sarcoma Lymphoma malignant lymphocytic Lymphoma malignant mixed Lymphoma malignant undifferentiated
c e l l type
7 7 7 7 7 7 7 7 7 7 7 7 7 7 7 7 7 7 7 7 7 7 7 7 7 3 3 3 3 3 3 3 3 3 3 3 3 3 3 3 3 3 3 3 3 3 3 3 3 3 7 7 7 7 7 7 7 8 8 8 8 8 8 8 8 8 8 8 8 8 8 8 8 8 8
7 7 1 7 7 7 7 7 7 7 7 7 7 7 7 1 7 7 7 7 7 7 7 1 7 Total 1 1 1 1 1 1 1 1 2 2 2 2 2 2 2 2 2 3 3 3 3 3 3 3 4 Tissues/ 1 2 3 5 6 7 8 9 0 1 2 3 4 5 6 7 9 0 3 4 5 6 7 8 0 Tumors
2 1
+ + M + M M M M + + + M M + + + M + + + M + + + M 29 1
. . . . . . . . . . . . . . . . . . . . . . . . . 48 M + + + + + + + + + + + + + + + + + + + + + + + + 47
. . . . . . . . . . . . . . . . . . . . . . . . . 48 X 2
X 3 X 2
1

210 Tricresyl Phosphate, NTP TR 433
TABLED2 Individual Animal Tumor Pathology of Female Mice in the 2-Year Feed Study of Tricresyl Phosphate: 250 ppm
Number of Days on Study
Carcass ID Number
Alimentary System Esophagus Gallbladder Intestine large, colon Intestine large, rectum
Osteosarcoma, metastatic, bone Intestine large, cecum Intestinesmall,duodenum .
Intestine small, jejunum Intestine small, ileum Liver
Hepatocellular carcinoma Hepatocellular carcinoma, multiple Hepatocellular adenoma Hepatocellular adenoma, multiple
Mesentery Pancreas Salivary glands Stomach, forestomach Stomach, glandular
Cardiovascular System Heart
Endocrine System Adrenal cortex
Adenoma Adrenal medulla Islets, pancreatic Parathyroid gland Pituitaly gland
Pars distalis, adenoma Pars intermedia, adenoma
Thyroid gland
General Body System None
Genital System Clitoral gland Ovary
Cystadenoma Fibrous histiocytoma
Uterus Histiocytic sarcoma
0 4 5 5 5 7 7 1 7 7 7 7 7 7 7 7 7 7 7 7 7 1 1 7 1 7 7 5 5 9 0 3 3 3 3 3 3 3 3 3 3 3 3 3 3 3 3 3 3 3 9 1 1 5 3 7 6 6 6 6 6 6 6 6 6 6 6 6 6 6 6 6 6 6 6
3 7 1 7 7 7 7 7 7 7 7 7 7 1 7 7 1 7 7 7 1 1 7 7 1 3 4 8 7 5 5 4 4 4 4 4 4 4 4 5 5 5 5 5 5 5 5 6 6 6 1 2 1 1 1 9 1 3 4 5 6 7 8 9 0 2 3 4 5 6 7 8 0 1 2
. . . . . . . . . . . . . . . . . . . . . . . . .
. . . . . . . . . . . . . . . . . . . . . . . . .
. . . . . . . . . . . . . . . . . . . . . . . . .
. . . . . . . . . . . . . . . . . . . . . . . . . X
. . . . . . . . . . . . . . . . . . . . . . . . . + + + + + A + + + + + + + + + + + + + + + + + + + . . . . . . . . . . . . . . . . . . . . . . . . . . . . . . . . . . . . . . . . . . . . . . . . . . . . . . . . . . . . . . . . . . . . . . . . . . .
x x - x X
x x X X X
+ + . . . . . . . . . . . . . . . . . . . . . . . . . . . . . . . . . . . . . . . . . . . . . . . . . . . . . . . . . . . . . . . . . . . . . . . . . . . . . . . . . . . . . . . . . . . . . . . . . . . .
. . . . . . . . . . . . . . . . . . . . . . . . .
. . . . . . . . . . . . . . . . . . . . . . . . . X
. . . . . . . . . . . . . . . . . . . . . . . . .
. . . . . . . . . . . . . . . . . . . . . . . . . + + + + + + + + M + + M + + + + + M + + M M + + M + + + + + + + + + + + M + + + + + + + + + + + + +
X X x x x
. . . . . . . . . . . . . . . . . . . . . . . . .
+ . . . . . . . . . . . . . . . . . . . . . . . . .
X ..+ . . . . . . . . . . . . . . . . . . . . . . . . .

211 Lesions in Female Mice
TABLED2 Individual Animal Tumor Pathology of Female Mice in the 2-Year Feed Study of Tricresyl Phosphate: 250 ppm (continued)
Number of Days on Study
Carcass ID Number
Alimentary System Esophagus Gallbladder Intestine large, colon Intestine large, rectum
Osteosarcoma, metastatic, bone Intestine large, cecum Intestine small, duodenum Intestine small, jejunum Intestine small, ileum Liver
Hepatocellular carcinoma Hepatocellular carcinoma, multiple Hepatocellular adenoma Hepatocellular adenoma, multiple
Mesentery Pancreas Salivary glands Stomach, forestomach Stomach, glandular
Cardiovascular System Heart
Endocrine System Adrenal cortex
Adenoma Adrenal medulla Islets, pancreatic Parathyroid gland P i t u i t a r y gland
Pars distalis, adenoma Pars intermedia, adenoma
Thyroid gland
General Body System None
Genital System Clitoral g land Ovary
Cystadenoma Fibrous histiocytoma
Uterus Histiocytic sarcoma
7 7 7 7 7 7 1 7 7 7 7 1 7 7 7 7 7 7 7 7 7 7 7 7 7 7 3 3 3 3 3 3 3 3 3 3 3 3 3 3 3 3 3 3 3 3 3 3 3 3 3 3 6 6 6 6 6 6 6 6 6 6 6 6 6 6 6 7 7 7 7 7 7 7 7 7 7 7
7 7 7 7 7 7 7 7 7 7 7 7 7 7 7 7 7 7 7 7 7 7 7 7 7 7 Total 6 6 6 6 6 6 6 7 7 7 7 7 7 7 7 7 8 8 8 8 8 8 8 8 8 9 Tissuesf 3 4 5 6 5 ’ 8 9 0 2 3 4 5 6 7 8 9 0 2 3 4 5 6 7 8 9 0 Tumors
. . . . . . . . . . . . . . . . . . . . . . . . . . 51
. . . . . . . . . . . . . . . . . . . . . . . . . . 51
. . . . . . . . . . . . . . . . . . . . . . . . . . 51
. . . . . . . . . . . . . . . . . . . . . . . . . . 51 1
. . . . . . . . . . . . . . . . . . . . . . . . . . 51
. . . . . . . . . . . . . . . . . . . . . . . . . . 50
. . . . . . . . . . . . . . . . . . . . . . . . . . 51
. . . . . . . . . . . . . . . . . . . . . . . . . . 51
. . . . . . . . . . . . . . . . . . . . . . . . . . 51 X X 5
1 X X X X 7
x x x x x x 8 + 3
. . . . . . . . . . . . . . . . . . . . . . . . . . 51
. . . . . . . . . . . . . . . . . . . . . . . . . . 51
. . . . . . . . . . . . . . . . . . . . . . . . . . 51
. . . . . . . . . . . . . . . . . . . . . . . . . . 51
. . . . . . . . . . . . . . . . . . . . . . . . . . 51
. . . . . . . . . . . . . . . . . . . . . . . . . . 51
. . . . . . . . . . . . . . . . . . . . . . . . . . 51
. . . . . . . . . . . . . . . . . . . . . . . . . . 51
. . . . . . . . . . . . . . . . . . . . . . . . . . 44
. . . . . . . . . . . . . . . . . . . . . . . . . . 50 x x x x 9
X X 2 . . . . . . . . . . . . . . . . . . . . . . . . . . 51
1 . . . . . . . . . . . . . . . . . . . . . . . . . . 50
X 2 1
. . . . . . . . . . . . . . . . . . . . . . . . . . 51 X 1

212 Tricresyl Phosphate, NTP TR 433
TABLED2 Individual Animal Tumor Pathology of Female Mice in the 2-Year Feed Study of Tricresyl Phosphate: 250 ppm (continued)
Number of Days on Study
Carcass ID Number
~~~~~~~~~~~~~~~~
Ilematopoietic System Blood Bone marrow
Osteosarcoma, metastatic, bone Sarcoma
Lymph node, mandibular Lymph node, mesenteric Spleen
Hemangiosarcoma Thymus
Integumentary System Mammary gland
Adenocarcinoma Skin
Sarcoma
Musculoskeletal System Bone
Vertebra, osteosarcoma
Nervous System Brain Peripheral nerve Spinal cord
Respiratory System Lung
Alveolarbronchiolar adenoma Alveolarbronchiolar carcinoma Hepatocellular carcinoma, metastatic, liver
Osteosarcoma, multiple, metastatic, bone
Nose Trachea
Special Senses System Harderian gland
Urinary System Kidney Urinary bladder
Systemic Lesions Multiple organs
Histiocytic sarcoma Leukemia lymphocytic Lymphomamalignant lymphocytic Lymphomamalignant mixed
0 4 5 5 5 7 7 7 7 7 7 7 7 7 7 7 7 7 7 7 7 7 1 7 7 7 7 5 5 9 0 3 3 3 3 3 3 3 3 3 3 3 3 3 3 3 3 3 3 3 9 1 1 5 3 1 6 6 6 6 6 6 6 6 6 6 6 6 6 6 6 6 6 6 6
3 1 1 1 1 7 7 1 1 1 1 1 1 1 7 1 1 1 7 1 1 7 7 1 7 3 4 8 1 5 5 4 4 4 4 4 4 4 4 5 5 5 5 5 5 5 5 6 6 6 1 2 1 1 1 9 1 3 4 5 6 7 8 9 0 2 3 4 5 6 7 8 0 1 2
. . . . . . . . . . . . . . . . . . . . . . . . . X
. . . . . . . . . . . . . . . . . . . . . . . . .
. . . . . . . . . . . . . . . . . . . . . . . . .
. . . . . . . . . . . . . . . . . . . . . . . . . X
+ + + M + + M + + + + + + + + + M + + + + + + + M
. . . . . . . . . . . . . . . . . . . . . . . . .
. . . . . . . . . . . . . . . . . . . . . . . . . X
. . . . . . . . . . . . . . . . . . . . . . . . . X
. . . . . . . . . . . . . . . . . . . . . . . . .
. . . . . . . . . . . . . . . . . . . . . . . . .
. . . . . . . . . . . . . . . . . . . . . . . . .
. . . . . . . . . . . . . . . . . . . . . . . . . X X X
X
X X
X . . . . . . . . . . . . . . . . . . . . . . . . . . . . . . . . . . . . . . . . . . . . . . . . . .
+ + + + M + M + + + M + + + + + M + M + + + M M M
. . . . . . . . . . . . . . . . . . . . . . . . .
. . . . . . . . . . . . . . . . . . . . . . . . .
. . . . . . . . . . . . . . . . . . . . . . . . .
X X X

213 Lesions in Female Mice
TABLE D2 Individual Animal Tumor Pathology of Female Mice in the 2-Year Feed Study of Tricresyl Phosphate: 250 ppm (continued)
Numlrer of Days on Study
Carcass I D Number
llematopoietic System Blood Bone marrow
Osteosarcoma, metastatic, bone Sarcoma
Lymphnode,mandibular Lymph node, mesenteric Spleen
Hemangiosarcoma Thymus
Integumentary System Mammary gland
Adenocarcinoma Skin
Sarcoma
Musculoskeletal System Bone
Vertebra, osteosarcoma
Nervous System Brain Peripheral nerve Spinal cord
Respiratory System Lung
Alveolarbronchiolar adenoma Alveolarbronchiolar carcinoma Hepatocellular carcinoma, metastatic, liver
Osteosarcoma, multiple, metastatic, bone
Nose Trachea
Special Senses System Harderian gland
Urinary System Kidney Urinary bladder
Systemic Lesions Multiple organs
Histiocytic sarcoma Leukemia lymphocytic Lymphoma malignant lymphocytic Lymphoma malignant mixed
7 7 7 7 7 7 7 7 7 7 7 7 7 7 7 7 7 7 7 7 7 7 7 7 7 7 3 3 3 3 3 3 3 3 3 3 3 3 3 3 3 3 3 3 3 3 3 3 3 3 3 3 4 4 4 6 4 6 4 4 4 6 6 4 6 4 4 7 7 7 7 7 7 7 7 7 7 7
7 7 7 7 7 7 7 7 7 7 7 7 7 7 7 7 7 7 7 7 7 7 7 7 7 7 Total 4 6 4 6 4 6 4 7 7 7 7 7 7 7 7 7 8 8 8 8 8 8 8 8 8 9 Tissues1 3 4 5 4 7 8 9 0 2 3 4 5 4 7 8 9 0 2 3 4 5 6 7 8 9 0 Tumors
+ 1 . . . . . . . . . . . . . . . . . . . . . . . . . . 51
1 X 1
M + + + M + + + + + + + + + + + + + + + + + + + + + 47 + + + + + + + + + + + + + + + + + + + M + + + + + + 50 . . . . . . . . . . . . . . . . . . . . . . . . . . 51
1 + + + + + + + + + + + + + + + + + M + + + + + + + + 44
. . . . . . . . . . . . . . . . . . . . . . . . . . 51 X 1
. . . . . . . . . . . . . . . . . . . . . . . . . . 51 1
. . . . . . . . . . . . . . . . . . . . . . . . . . 51 1
. . . . . . . . . . . . . . . . . . . . . . . . . . 51
. . . . . . . . . . . . . . . . . . . . . . . . . . 51
. . . . . . . . . . . . . . . . . . . . . . . . . . 51
. . . . . . . . . . . . . . . . . . . . . . . . . . 51 X X 5
1
2
1 . . . . . . . . . . . . . . . . . . . . . . . . . . 5 1 . . . . . . . . . . . . . . . . . . . . . . . . . . 51
+ + + M + + + M + + + + M + + M M M + + + + + M + + 36
. . . . . . . . . . . . . . . . . . . . . . . . . . 51
. . . . . . . . . . . . . . . . . . . . . . . . . . 51
. . . . . . . . . . . . . . . . . . . . . . . . . . 51 X 1
X 1 X X 3
X 3

214 Tricresyl Phosphate, NTP TR 433
TABLED3 Statistical Analysis of Primary Neoplasms in Female Mice i n the 2-Year Feed Study of Tricresyl Phosphate
AdrenalCortex:Adenoma Overall ratea Adjusted rateb Terminal rate' First incidence (days) Life table testd Logistic regression testd Cochran-Armita e testd Fisher exact test 9
Ilarderian Gland: Adenoma Overall rate Adjusted rate Terminal rate First incidence (days) Life table test Logistic regression test Cochran-Annitage test Fisher exact test
Ilarderian Gland: Adenoma or Carcinoma Overall rate Adjusted rate Terminal rate First incidence (days) Life table test Logistic regression test Cochran-Armitage test Fisher exact test
Liver: Hepatocellular Adenoma Overall rate Adjusted rate Terminal rate First incidence (days) Life table test Logistic regression test Cochran-Annitage test Fisher exact test
Liver: Hepatocellular Carcinoma Overall rate Adjusted rate Terminal rate First incidence (days) Life table test Logistic regression test Cochran-Armitage test Fisher exact test
3/50 (6%) 7.3% 3/41 (7%) 736 (T)P=0.234N P=0.243N P=0.250N
5/50 (10%) 12.2% 5/41 (12%) 736 (T)P=O.OOGN P=0.007N P=0.007N
5/50 (10%) 12.2% 5/41 (12%) 736 (T)P=O.OION P=0.012N P=0.012N
12/50 (24%) 28.470 11/41 (27%) 560 P=O.358 P=O.277 P=O.245
10/50 (20%) 22.9% 8/41 (20%) 538 P-0.179N P =0.202N P=0.211N
0/50 (0%) 0.0% 0/38 (0%) -e
P=0.135N P=0.135N
P=0.121N
3/50 (6%) 7.3% 2/38 (5%) 603 P=0.394N P=0.365N
P=0.357N
3/50 (6%) 7.3% 2/38 (5%) 603 P =0.394N P=0.365N
P=0.357N
11/50 (22%) 28.0% 10/38 (26%) 674 P=0.577N P=0.534N
P=0.500N
3/50 (6%) 7.2% 2/38 (5%) 561 P=0.051N P=0.035N
P=0.036N
125 ppm
0/48 (0%) 0.0% 0/42 (0%) -P=0.117N P=0.117N
P=0.129N
0/48 (0%) 0.0% 0/42 (0%) -P=0.031N P=0.031N
P=0.031N
1/48 (2%) 2.3% 0/42 (0%) 723 P=0.098N P=0.098N
P=0.112N
13/48 (27%) 31.0% 13/42 (31%) 736 (T)P=O.527 P=O.491
P=O.453
1/48 (2%) 2.2% 0/42 (0%) 621 P=0.006N P=0.007N
P=O.OOSN
250 ppm
1/51 (2%) 2.1% 0/45 (0%) 555 P=0.28lN P=0.288N
P=0.301N
o m (0%) 0.0% 0/45 (0%) -P=0.026N P-0.026N
P=O.OUN
0/51 (0%) 0.0% 0/45 (0%) -P=0.026N P=0.026N
P=O.OUN
15/51 (29%) 32.6% 14/45 (31%) 707 P=O.430 P=O.355
P-0.349
6/51 (12%) 12.7% 4/45 (9%) 555 P=0.170N P=0.192N
P=0.195N
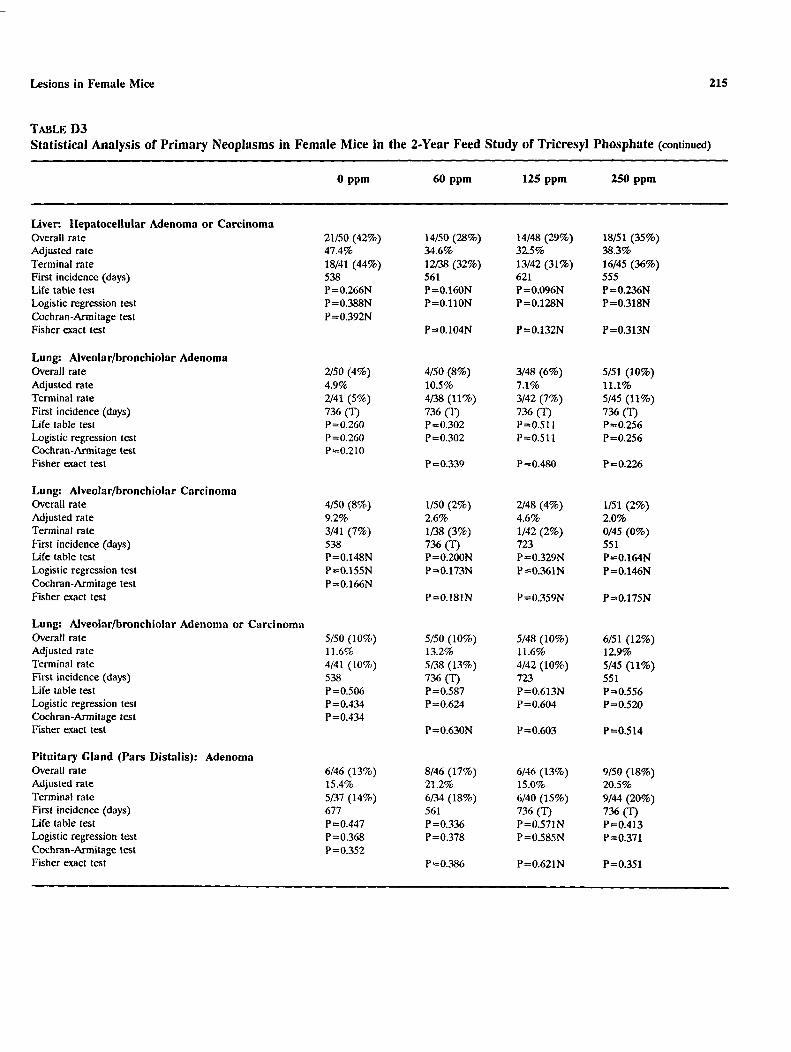
215 Lesions i n Female Mice
TABLED3 Statistical Analysisof Primary Neoplasms in Female Mice in the 2-Year Feed Study of Tricresyl Phosphate (continued)
Liver: Ilepatocellular Adenoma or Carcinoma Overall rate 21/50 (42%) 14/50 (28%) 14/48 (29%) 18/51 (35%) Adjusted rate 47.4% 34.6% 32.5% 38.3% Terminal rate 18/41 (44%) 12/38 (32%) 13/42 (31%) 16/45 (36%) First incidence (days) 538 561 621 555 Life table test P=0.266N P=0.160N P=0.096N P=O.W6N Logistic regression test P =0.388N P=O.llON P=0.128N P=0.318N Cochran-Armitage test P=0.392N Fisher exact test P=0,104N P=0.132N P=0.313N
Lung: Alveolor/bronchiolnrAdenoma Overall rate 2/50 (4%) 4/50 (8%) 3/48 (6%) 5/51 (10%) Adjusted rate 4.9% 10.5% 7.1% 11.1%
Life table test First incidence (days) Terminal rate 2/41 (5%)
P=O.260 736 (9 736 (?*,
4/38 (11%)
P=0.302
3/42 (7%)
P=O.511 736 (9 736 ( T I
5/45 (11%)
P=O.256 Logistic regression test P=O.260 P=0.302 P=O.511 P=O.256 Cochran-Arrnitage test P=O.210 Fisher exact test P=0.339 P=0.480 P=0.226
Lung: Alveolar/bronchiolar Carcinoma
Adjusted rate Overall rate
9.2% 1/50 (8%) 1/50 (2%)
2.6% 4.6% 2/48 (4%)
2.0% 1/51 (2%)
Life table test First incidence (days) Terminal rate
P=O.l48N 538 3/41 (7%)
P=0.200N
1/38(3%) 736 (T>
P=0.329N 723 1/42 (2%)
P=0.164N 551 0/45 (0%)
Logistic regression test P=0.155N P=0.173N P=0.361N P=0.146N Cochran-Armitage test P=0.166N Fisher exact test P=0.181N P=0.359N P-0.175N
Lung: Alveolar/bronchiolarAdenomaorCarcinoma
Adjusted rate Overall rate
11.6% 5/50 (10%)
13.2% 5/50 (10%)
11.6% 5/48 (1 0%)
12.9% 6/51 (12%)
Life table test First incidence (days) Terminal rate
P=O.506 538 4/41 (10%) 5 /38 (13%)
P=O.587 736 (T>
P=0.613N 723 4/42 (10%)
P=O.556 551 5/45 (11%)
Logistic regression test P=O.434 P=O.624 P =0.604 P=O.520 Cochran-Armitage test P=O.434 Fisher exact test P=0.630N P=O.603 P=O.514
Pituitary Gland (Pars Distalis): Adenoma
Adjusted rate Overall rate
15.470 6/46 (13%)
21.2% 8/46 (17%)
15.O% 6/46 (13%)
20.5% 9/50 (18%)
Life table test First incidence (days) Terminal rate
P=O.447 677 5/37 (1 4%)
P=0.336 561 6/34 (18%) 6/40 (15%)
P=0.571N 736 (T> 736 (T>
9/44 (20%)
PtO.413 Logistic regression tes t P=0.368 P=O.378 P=0.585N P=O.371 Cochran-Arrnita, ae test P =0.352 Fisher exact test P=O.386 P=0.621N P=O.351

216 Tricresyl Phosphate, NTP TR 433
TABLED3 Statistical Analysis of Primary Neoplasms in Female Mice in the 2-Year Feed Study of Tricresyl Phosphate (continued)
Spleen: Zlemangiosarcoma Overall rate Adjusted rate Terminal rate First incidence (days) Life table test Logistic regression test Cochran-Armitage test Fisher exact test
Uterus: Stromal Polyp Overall rate Adjusted rate Terminal rate First incidence (days) Life table test Logistic regression test Cochran-Armitage test Fisher exact test
All Organs: I-Iemangioma Overall rate Adjusted rate Terminal rate First incidence (days) Life table test Logistic regression test Cochran-Armitagetest Fisher exact test
All Organs: Hemangiosarcoma Overall rate Adjusted rate Terminal rate First incidence (days) Life table test Logistic regression test Cochran-Armitage test Fisher exact test
All Organs: Hemangioma or llemangiosarcoma Overall rate Adjusted rate Terminal rate First incidence (days) Life table test Logistic regression test Cochran-Armitage test Fisher exact test
3/50 (6%) 7.3% 3/41 (7%) 736 (9P=0.218N P=0.239N P=0.241N
2/50 (4%) 4.9% 2/41 (5%) 736 (9P=0.213N P=0.213N P=0.241N
0/50 (0%) 0.070 0/41 (0%)-P=O.532 P=O.532 P=O.499
4/50 (8%) 9.8% 4/41 (10%) 736 (r)P=0.119N P=0.133N P=0.135N
4/50 (8%) 9.8% 4/41 (10%) 736 (r)P=0.212N P=0.238N P-0.248N
1/50 (2%) 2.3% 0/38 (0%) 652 P=0.329N P=0.308N
P=0.309N
1/50 (2%) 2.6% 1/38(3%) 736 (??P=O.527N P=0.527N
P=0.500N
0/50 (0%) 0.0% oris (0%) ---
-
1/50 (2%) 2.3% Of38 (0%) 652 P=0.202N P=0.184N
P=0.181N
1/50 (2%) 2.3% Of38 (0%) 652 P=0.202N P=0.184N
P=0.181N
125 ppm
1/48 (2%) 2.4% 1/42 (2%) 736 (??P=0.297N P=0.297N
P=0.324N
3/48 (6%) 7.1% 3/42 (7%) 736 ( T )P=O.511 P=O.511
P=O.480
4/48 (8%) 9.5% 4/42 (10%) 736 0 P=O.o66 P=O.o66
P=O.O54
1/48 (2%) 2.4% 1/42 (2%) 736 (r)P=0.172N P=0.172N
P=0.194N
5/48 (10%) 11.9% 5/42 (12%) 736 0 P=O.515 P=O.515
P=O.474
250 ppm
1/51 (2%) 2.2% 1/45 (2%) 736 0 P=O.273N P=0.273N
P=0.301N
0/51 (0%) 0.0% 0/45 (0%) -P=0.218N P=0.218N
P=0.243N
0/51 (0%) 0.0% 0/45 (0%) ---
-
1/51 (2%) 2.2% 1/45 (2%) 736 ( T )P=0.153N P=0.153N
P=0.175N
1/51 (2%) 2.2% 1/45 (2%) 736 0 P=0.153N P=0.153N
P=0,175N

217 Lesions in Female Mice
TABLED3 Statistical Analysis of Primary Neoplasms in Female Mice in the 2-Year Feed Study of Tricresyl Phosphate (continued)
A I 1 Organs: Histiocytic Sarcoma Overall rate 1/50 (2%) 3/50 (6%) 2/48 (4%) 1/51 (2%) Adjusted rate 2.4% 6.6% 4.6% 2.2% Terminal rate 1/41 (2%) o m (0%) 1/42 (2%) 1/45 (2%) First incidence (days) 736 (T) 571 653 736 (T)Life table t a t P=0.441N P=O.296 P=O.506 P=0.741N Logistic regression test P=0.441N P=O.326 P=O.483 P=0.741N Cochran-Armitage test P =0.463N Fisher exact test P=O.309 P=O.485 P=O.748N
All Organs: Malignant Lymphoma (Lymphocytic, Mixed, or Undifferentiated Cell Type) Overall rate 4/50 (8%) 6/50 (12%) 6/48 (13%) 6/51 (12%) Adjusted rate 9.5% 15.4% 13.8% 13.3% Terminal rate 3/41 (7%) 5/38 (13%) 5/42 (12%) 6/45 (13%) First incidence (days) 698 700 607 736 Life table test P =0.440 P=O.324 P=O.386 P =0.428 Logistic regression test P=O.377 P= O M 3 P tO.347 P =0.395 Cochran-Armitage test P =0.365 Fisher exact test P=O.370 P=O.344 Pr0.383
All Organs: Malignant Lymphoma or Ilistiocytic Sarcoma Overall rate 5/50 (10%) 9/50 (18%) 8/48 (17%) 6/51 (12%) Adjusted rate 21.0% 11.9% 18.0% 13.3% Terminal rate 4/41 (10%) 5/38 (13%) 6/42 (14%) 6/45 (13%) First incidence (days) 698 571 607 736 QLife table test P=0.460N P=O.169 P=O.295 P=O.563 Logistic regression test P=O.194 P=O.537N P=0.250 P-0.530 Cochran-Armitage test P=0.537N Fisher exact test P=O.194 P=O.250 P=O.514
A l l Organs: Benign Neoplasms Overall rate 27/50 (54%) 29/50 (58%) 24/48 (50%) 32/51 (63%) Adjusted rate 61.1% 67.1% 55.7% 66.6% Terminal rate 24/41 (59%) 24/38 (63%) 23/42 (55%) 29/45 (64%)First incidence (days) 523 561 621 79 Life table test P=O.471 P=0.288 P=O.305N P=O.389 Logistic regression t a t P=O.249 P -0.387 P=0.387N P=O.240 Cochran-Armitage test P=O.252 Fisher exact tes t P-0.420 P=0.423N P=O.245
All Organs: Malignant Neoplasms Overall rate 22/50 (44%) 16/50 (32%) 15/48 (31%) 20/51 (39%) Adjusted rate 35.1% 47.7% 32.5% 39.9% Terminal rate 17/41 (41%) 9/38 (24%) 11/42 (26%) 15/45 (33%) First incidence (days) 538 561 607 79 Life table test P=0.335N P =0.244N P=0.114N P=0.314N Logistic regression test P=0.443N P=0.148N P=0.138N P=0.375N Cochran-Armitagetes t P=0.449N Fisher exact test P=0.151N P=0.137N P=0.388N

218 Tricresyl Phosphate, NTP TR 433
TABLED3 Statistical Analysis of Primary Neoplasms in Female Mice in the 2-Year Feed Study of Tricresyl Phosphate (continued)
A I 1 Organs: Benign or Malignant Neoplasms Overall rate 40/50 (80%) 39/50(67%)42/51(78%)(82%)32/48
81.6%69.5% Adjusted rate
First incidence (days) 607
84.0% 82.9% (67%) 28/4237/45
Life table test P=0.321N P=O.455 P=0.076N P=0.470N Logistic regression test P=O.459 P=0.508N P=0.104N P=O.476 Cochran-Annitage test P=O.461 Fisher exact test P=O.SOON P=0.103N P=O.481
OTenina l sacrifice a Number of neoplasm-hearing animals/number o f animals examined. Denominator is number of animals examined microscopically for adrenal gland,
liver, lung, pituitary gland,and spleen: for other tissues, denominator is number o f animals necropsied. Kaplan-Meier estimated neoplasm incidence a t the end of the study after adjustment for intercurrent mortality Observed incidence a t terminal ki l l Beneath the control incidence are the P values associated wi th the trend test. Beneath the dosed group incidence are the P values corresponding to painvise comparisons between the controls and tha t dosed group. The life table analysis regards neoplasms in animals dying prior to terminal kill as b e i n g (directly or indirectly) the cause o f death. The logistic regression test regards these lesions as nonfatal. The Cochran-Annitage and Fisher exact tests compare directly the overall incidence rates. For a l l tests, a negative trend or a lower incidence in a dose groupis indicated by N.
e Not applicable; no neoplasms in animal group
Terminal rate 32/41 (78%) 3oM (79%) (82%) 561 425 79

219 Lesions in Female Mice
TABLED4a IIistorical Incidence of IIepatocellular Neoplasms in Untreated Female B6C3F, Micea
Incidence i n Controls CarcinomaAdenomaAdenoma or IIepatoblastoma
Carcinoma
Historical Incidence at Battelle Columbus
2,4-Dichlorophenol 0/50 2/50 2/50 0/50 4,41 -Thiobis(6-r-Butyl-m-Cresol) 17/5 1 4/S1 20151 0151 5,5-Diphenylhydantoin 5/48 0148 5/48 0148 Dowicide EC-7Pentachlorophenol 1/34 0/34 1i34 0/34
Polybrominated Biphenyls (Firemaster FF-le) Ethylene Thiourea
4/50 2/50
1/50 2/50
5/50 4/50
0150 0150
Manganese (11) Sulfate Monohydrate 12151 3/5 1 13151 0151 Technical Grade Pentachlorophenol 3133 Of33 3133 OB3 Triamterene 10/50 4/50 13/50 0150 Triamterene 7/50 5/50 10150 0150 Tricresyl Phosphate 12/50 10/50 21150 0150
Qvernll IIistorical Incidence
Total 159D.363 (11.7%) 80/1,363 (5.9%) 223/1,363 (16.4%) 1/1,363 (0.1%) Standard deviation 8.3% 5.570 10.7% 0.4% Range O70-33% 0%-20% 370-4270 090-2%
a Data as o f 20 August 1992

220 Tricresyl Phosphate, NTP TR 433
TABLED4b Historical Incidence of Harderian Gland Neoplasms in Untreated Female B6C3F, Micea
Incidence in Controls Study Adenoma Carcinoma Adenoma or
Carcinoma
IIistorical Incidence a t Battelle Columbus
2,4-Dichlorophenol 1/50 0/50 1/50 4,4 -Thiobis(6-t-Butyl-m-Cresol) 0/51 1/51 1/51 5,5-Diphenylhydantoin 3/50 1/50 4/50 Dowicide EC-7 Pentachlorophenol 2/35 OB5 2/35 Ethylene Thiourea 2/50 0/50 2/50 Polybrorninated Biphenyls (Firernaster FF-1Q) 3/50 0/50 3/50 Manganese (11) Sulfate Monohydrate 2/51 1/51 3/51 Technical Grade Pentachlorophenol 2/35 0/3S u 3 5 Triarnterene 1 /50 0150 1/50 Triarnterene o/so 0/50 0/50 Tricresyl Phosphate 5/50 0/50 5/50
Overall Ilistorical Incidence
Total 4711.371(3.4%) 8/1,371 (0.6%) 55/l,371 (4.0%) Standard deviation 3.1% 0.95 3.2% Range 0%-10% 0%-2% 0%-10%
a Dataas o f 20August1992

221 Lesions in Female Mice
TABLED5 Summary of the Incidence of Nonneoplastic Lesions in Female Mice in the 2-Year Feed Study of Tricresyl Phosphatea
Disposition Summary Animals initially in study 95 95 95 3” intaim e v a b d o n b 15 15 15 9-”, inraim e v a b d o n b 15 15 15 1 S M d inraim m a h d u n b 15 15 15 Early deaths
Moribund 4 5 4 Natural deaths 5 7 2
Survivors Died last week of study 1 1 Terminal sacrifice 40 37 42
Missing 2
Animals examined microscopically 95 95 93
3-Month Interim Evaluation Alimentary System Stomach, glandular (10) (10)
cyst
Endocrine System Adrenal cortex (10) (10) (10)
Accessory adrenal cortical nodule 1 (10%) Pigmentation, ceroid Subcapsular, hyperplasia 10 (100%) (100%)10 7 (70%)
Parathyroid gland (7) (8) (8) Cyst 1 (13%)
Urinary System Kidney
Hydronephrosis
Systems Examined Wuh No L a w n s Observed Cardiovascular System General Body System Genital System Hematopoietic System Integumentary System Musculoskeletal System Nervous System Respiratory System Special Senses System
95 15 15 14
3 3
45
95
(10)
1 (10%) 10 (100%)
(6)
a Number of animals examined microscopically at site and number o f animals with lesion Includes up to five animals per dose group subjected t o total body perfusion for special neuropathology

222 Tricresyl Phosphate, NTP TR 433
TABLED5 Summary of the Incidence of Nonneoplastic Lesions in Female Mice in the 2-Year Feed Study of Tricresyl Phosphate (continued)
0 PPm 60 PPm 125 ppm 250 ppm
9-Month Interim Evaluation Alimentary System Liver
Basophilic focus Inflammation, chronic active Necrosis
Mesentery Fat, necrosis
Pancreas Atrophy
Endocrine System Adrenal cortex (10) (10) (10) (10)
Accessory adrenal cortical nodule 2 (20%) 1 (10%) 1 (10%)Pigmentation, ceroid Subcapsular, hyperplasia
9 (90%) 10 (100%) 10 10(100%) (100%) 10 (100%) 10 (100%) 10 10 (100%)(100%)
Genital System Ovary
CystUterus
Hyperplasia, cystic
Hematopoietic System Thymus
Cyst
Respiratory System Lung
Inflammation, chronic active
Urinary System Kidney
Nephropathy
Systems Examined With No Lesions Observed Cardiovascular System General Body System Integumentary System Musculoskeletal System Nervous System Special Senses System

223 Lesions in Female Mice
TABLED5 Summary of the Incidence of Nonneoplastic Lesions in Female Mice in the 2-Year Feed Study of Tricresyl Phosphate (continued)
125 ppm 250 ppm
15-Month Interim Evaluation Alimentary System Liver
Basophilic focus Clear cell focus Eosinophilic focus Inflammation, chronic active Necrosis
Pancreas Atrophy
Salivary glands Inflammation, chronic active Duct, hyperplasia
Endocrine System Adrenal cortex
Pigmentation, ceroid (10)
(100%) 10 (100%) (10)
(100%)1 010 (10) (9)
9 (100%)(100%) 1010 Subcapsular,(100%)hyperplasia (100%) 10 9 (100%)
Pi tu i t a ry gland Pars distalis, hyperplasia
(10) (10) 1 (10%)
(10) (9) 1(11%)
Genital System Clitoral gland
Duct, dilatation (2)
2 (100%) (1)
1 (100%) (1)
1 (100%) Ovary
cyst Uterus
Hyperplasia, cystic
(10) 3 (30%)
(10) 10 (100%)
(10)
(10) 10 (100%)
(10) 1 (10%)
(10) 10 (100%)
(9) 2 (22%)
(9) 9 (100%)
Integumentary System Skin
Inflammation, chronic active (9)
1 (11%)
Nervous System Peripheral nerve
Axon, degeneration (14)
1 (7%)
Respiratory System Lung
Artery, inflammation, chronic active (10) (10)
Special Senses System Harderian gland
Hyperplasia

224 Tricresyl Phosphate, NTP TR 433
TABLED5 Summary of the Incidence of Nonneoplastic Lesions in Female Mice in the 2-Year Feed Study of Tricresyl Phosphate (continued)
0 PPm 60 PPm 125 ppm 250 ppm
15-Month Interim Evaluation (continued) Urinary System Kidney (10) (10) (10) (9)
Nephropathy 2 (20%) 2 (20%) 3 (30%) 2 (22%)
Systems Examined With No Lesions Observed Cardiovascular System General Body System Hematopoietic System Musculoskeletal System
2-Year Study Alimentary System Esophagus (51)
Inflammation Intestine small, duodenum (50)
Ulcer, chronic active 1 (2%)Intestine small, jejunum (51)
Lymphoid tissue, hyperplasia 1(2%) Lymphoid tissue, ulcer, chronic active 1 (2%)
Intestine small, ileum (51)Amyloid deposition 1(2%) Lymphoid tissue, hyperplasia 1(2%)
Liver (50) (50) (51)Angiectasis 1 (2%) 1(2%)Basophilic focus 4 (8%) 1 (2%) 1 (2%) Clear cell focus 3 (6%) Eosinophilic focus 8 (16%) 4 (8%) 5 (10%) 6 (12%) Fatty change 3 (6%) 1 (2%) 1 (2%)Hematopoietic cell proliferation 1 (2%) 1 (2%) Infarct 1 (2%) Inflammation, chronic active 1 (2%) Mixedcell focus 1 (2%) 2 (4%) 2 (4%) Necrosis 1 (2%) 1 (216) 1 (2%) 1(2%) Pigmentation, ceroid 1 (2%) 2 (4%) Pigmentation, hemosiderin 1 (2%) Bile duct, cyst 1 (2%) Centrilobular, degeneration 1 (2%) Serosa, inflammation 1(2%)
Mesentery (5) (3)Hemorrhage 1 (20%) Inflammation, chronic active 1 (20%) 1 (17%) 1 (33%) Inflammation, suppurative 1 (20%) Fat, necrosis 3 (60%) 1 (20%) 5 (83%) 2 (67%)
Pancreas (50) (50 ) (48) (51)Atrophy 4 (8%) 6 (12%) 1 (2%) 1(2%) Hyperplasia 1 (2%) Duct, cyst 1 (2%) 2 (4%)
Stomach, forestomach ( 5 0 ) (50) (48)Hyperplasia 2 (4%) 1 (2%)
Stomach, glandular (50) (50) (48)Erosion 1 (2%) 1 (2%)

Lesions in Female Mice
TABLEDS Summary of the Incidence of Nonneoplastic Lesions in Female Mice in the 2-Year Feed Study of Tricresyl Phosphate (continued)
125 ppm
2-Yeat. study (continued) Cardiovascular System Blood vessel
Mineralization (1)1 (100%)
(1)
Polyarteritis 1 (100%)
Har t (50) (50) (48)Degeneration 1 (2%) Infarct 1 (270) Inflammation, chronic active 1 (270) 1 (2%) Mineralization 1 (2%) Artery, inflammation, chronic active 1 (2%) Atrium, thrombosis 1 (2%) Pericardium, inflammation, chronic active 2 (4%)
Endocrine System Adrenal cortex (50) (49) (48)
Accessoly adrenal cortical nodule 3 (6%) 4 (8%) 3 (6%) Hematopoietic cell proliferation 1 (2%)Hyperplasia 4 (8%) 1 (2%) 7 (15%) Pigmentation, ceroid 49 (98%) 49 (10070) 47 (98%) Subcapsular, hyperplasia 50 (100%) 49 (100%) 47 (98%)
Adrenal medulla (50) (49) (48)Hyperplasia 1 (2%) 3 (6%) 1 (2%)
Islets, pancreatic (50) (50 ) (48)Hyperplasia 2 (4%) 5 (10%) 2 (4%)
Parathyroid gland (46) (42) (43) CystHyperplasia 1 (2%)
Pituitary gland (46) (46)Angiectasis Cyst 2 (4%) 1 (2%) Pars distalis, hyperplasia 21 (46%) 22 (48%) 21 (46%) Pars intermedia, hyperplasia 1 (2%)
Thyroid gland (49) (48)Inflammation 1 ( 2 4 ) 1 (2%) Follicle, cyst 3 (67u) 2 (4%) Follicular cell, hyperplasia 7 (14%) 9 (18%) 1 3 (27%)
General Body System None
Genital System Clitoral gland
Duct, dilatation
22s
~ ~
250 ppm
(51)
1 (2%)
(51)1 (2%)
2 (4%) 51 (100%) 51 (100%)
(51)4 (8%)
(51)
(44)1 (2%)
(50)2 (4%)
18 (36%) 1 (2%)
(51)3 (6%) 4 (8%)
15 (29%)
(1)1 (100%)

226 Tricresyl Phosphate, NTP TR 433
TABLED5 Summary of the Incidence of Nonneoplastic Lesions in Female Mice in the 2-Year Feed Study of Tricresyl Phosphate(continued)
0 PPm 60 PPm 125 ppm 250 ppm
&Year Study (continued) Genital System (continued) Ovary (48) (50) (47) (50)
Angiectasis 1 (270) 1 (2%) 1(2%) Atrophy 5 (10%) 1 (2%) 2 (4%) 1(2%) cyst 11(23%) 12 (24%) 15 (32%) 19 (38%) Hyperplasia, cystic 1 (2%) Inflammation, suppurative 1 (2%) Thrombosis 1 (2%) Corpus luteum, hyperplasia 1 (2%) 1 (2%) Periovarian tissue, inflammation.
granulomatous 1(2%) Rete ovarii, hyperplasia 2 (4%)
Uterus (50) (48) (51)Angiectasis 1 (2%) 2 (4%) 2 (4%) Hemorrhage 1 (2%) Hyperplasia, cystic 41 (82%) 36 (72%) 35 (73%) 41 (80%) Inflammation, suppurative 1 (2%) Thrombosis 2 (4%) Lymphatic, angiectasis 1 (2%)
IIematopoietic System Bone marrow (50) (50) (48) (51)
Hyperplasia 10 (20%) 6 (12%) 5 (10%) 6 (12%) Infarct 1 (2%) Myelofibrosis 18 (36%) 23 (46%) 27 (56%) 26 (51%)
Lymph node (3) (4) (3)Mediastinal, pigmentation, hemosiderin 1 (33%)
Lymph node, mandibular (46) (47) (48) (47)Hyperplasia, lymphoid 1 (2%) 3 (6%) 2 (4%) Hyperplasia, plasma cell 1 (2%)
Lymph node,mesenteric (49) (50) Cyst 1 (2%) Hematopoieticcell proliferation 1 (2%) Hyperplasia, lymphoid 1 (2%) 3 (7%) 6 (12%)
Spleen (50) (50) (48) (51)Depletion lymphoid 2 (4%) 1 (2%) 1 (2%) 1 (2%)Fibrosis 1 (2%) Hematopoietic cell proliferation 23 (46%) 20 (40%) 18 (38%) 26 (51%) Hyperplasia, lymphoid 5 (10%) 7 (14%) 4 (8%) 8 (16%)
Thymus (45) (44) (47) (46)Depletion lymphoid 3 (7%) 9 (20%) 1 (2%) 4 (9%) Hyperplasia, lymphoid 2 (4%) 2 (5%) 1 (2%) 3 (7%) Artery, inflammation, chronic active 1 (2%) Capsule, inflammation, chronic 1 (2%) Epithelial cell, hyperplasia 1 (2%)

0 Pl'm 60 PPm 125 ppm 250 ppm
%Year study (continued) Integumentary System Mammary gland
Hyperplasia, cystic (49)
1 (2%) Skin
Ulcer (50)
1 (2%) Subcutaneous tissue, inflammation, chronic
active 1 (2%)
Musculoskeletal System Bone
Joint, inflammation, chronic active (50)
2 (4%)
Nervous System Brain
Necrosis Peripheral nerve
Axon, degeneration Spinal cord
Degeneration
Respiratory System Lung
Hyperplasia, lymphoid (50)
1 (2%) (50) (48) (51)
Inflammation, chronic active 2 (4%) 1 (2%) Thrombosis 1 (276) Alveolar epithelium, hyperplasia 3 (6%) 1 (2%) 2 (4%) 1 (2%) Artery, inflammation, chronic active Pleura, inflammation, chronic 1 (2%)
1 (2%)
Nose Nasolacrimal duct, inflammation
(50)1 (2%)
(50) (48) (51)
Respiratory epithelium, inflammation 2 (4%) 3 (6%)
Special Senses System Eye
Cornea, inflammation ('1
1 (100%) Harderian gland
Hemorrhage (47) (38)
1 (3%) (29)
Hyperplasia 2 (4%) 1 (3%) 1 (3%)
227 Lesions in Female Mice
TABLED5 Summary of the Incidence of Nonneoplastic Lesions in Female Mice in the 2-Year Feed Study of Tricresyl Phosphate (continued)

228
\
Tricresyl Phosphate, NTP TR 433
TABLED5 Summary of the Incidence of Nonneoplastic Lesions in Female Mice in the 2-Year Feed Study of Tricresyl Phosphate (continued)
2-Year Study (continued) Urinary System Kidney
Hydronephrosis (50 )
1 (2%) (50 )
1 (2%) (48) (51)
1 (2%) Infarct 2 (4%) 1 (2%) 1 (2%) 1 (2%) Mineralization 1 (2%) Nephropathy 29 (58%) 28 (56%) 36 (75%) 34 (67%) Pigmentation, hemosiderin 1 (2%) Artery, inflammation, chronic active 1 (2%) Renal tubule, dilatation 1 (2%)
Urinary bladder Artery, inflammation, chronic active
(49)1 (2%)
( 5 0 ) (47) (51)2 (4%)
Serosa, inflammation, chronic 1 (2%)

229
APPENDIX E GENETIC TOXICOLOGY
SALMONELLATWHIMURIUM MUTAGENICITYTEST PROTOCOL , . . . . . . . . . . . . . . . .. . . . . . . . . . . . . . 230 CHINESEHAMSTEROVARYCELLCYTOGENETICS TEST PROTOCOLS. . . . . . . . . . . . . . . . . . . . . . . . . . 230 RESULTS..................................................................... 231 TABLE E l Mutagenicity of Tricresyl Phosphate in Salmonella fyphimurium . . . . . . . . ... . . . . . .. 232 TABLEE2 Induction of Sister Chromatid Exchangesin Chinese Hamster Ovary Cells
by Tricresyl Phosphate ... . . . . . .. . . . ... . . . . . . . . . . . . . . . . . . . . . . . . . . . . . . . . . 234 TABLEE3 Induction of ChromosomalAberrationsin Chinese Hamster Ovary Cells
by Tricresyl Phosphate .. . . . . . . , . . . . . .. . . . . . .. . . . . . . . . . . . . .. . . . . . . . . . . . . 235

230 Tricresyl Phosphate, NTP TR 433
GENETIC TOXICOLOGY
SALMolvELLA TYPHIMURZUM MUTAGENICITYTESTPROTOCOL Testing was performed as reported by Haworth et ol. (1983). Tricresyl phosphate was sent to the laboratory as a coded aliquot from Radian Corporation (Austin, TX). It was incubated with the Solnzonello ryphinturiunt tester strains (TA98, TA100, TA1535, and TA1537) either in buffer or S9 mix (metabolic activation enzymes and cofactors from Aroclor 1254-induced male Sprague-Dawley rat o r Syrian hamster liver) for 20 minutes at 37" C. Top agar supplemented with I-histidine and d-biotin was added, and the contents of the tubes were mded and poured onto the surfaces of minimal glucose agar plates. Histidine-independent mutant colonies arising on these plates were counted following incubation for 2 days at 37" C.
Each trial consisted of triplicate plates of concurrent positive and negative controls and at least five doses of tricresyl phosphate. The high dose was limited to 10,000 puglplate. All trials were repeated.
In this test, a positive response is defined as a reproducible, dose-related increase in histidine-independent (revertant) colonies in any one strain/activation combination. An equivocal response is defined as an increase in revertants that is not dose related, not reproducible, or is not of sufficient magnitude to support a determination of mutagenicity. A negative response is obtained when no increase in revertant colonies is observed following chemical treatment. No minimum percentage or fold increase is required for a chemical to be judged positive o r weakly positive.
CHINESEHAMSTER OVARYCELLCYTOGENETICSTESTPROTOCOLS Testing was performed as reported by Galloway et ol. (1987). Tricresyl phosphate was sent to the laboratory as a coded aliquot by Radian Corporation. It was tested in cultured Chinese hamster ovary (CHO) cells for induction of sister chromatid exchanges (SCEs) and chromosomal aberrations (Abs), both in the presence and absence of Aroclor 1254-induced male Sprague-Dawley rat liver S9 and cofactor mix. Cultures were handled under gold lights to prevent photolysis of bromodeoxyuridine-substituted DNA. Each test consisted of concurrent solvent and positive controls and of at least four doses of tricresyl phosphate; the high dose was 5,000 pglmL. A single flask per dose was used.
Skfer Chromafid Exchange Tesf: In the SCE test without S9, CHO cells were incubated for 26 hours with tricresyl phosphate in McCoy's 5A medium supplemented with fetal bovine serum, 1-glutamine, and antibiotics. Bromodeoxyuridine (BrdU) was added 2 hours after culture initiation. After 26 hours, the medium containing tricresyl phosphate was removed and replaced with fresh medium plus BrdU and Colcemid, and incubation was continued for 2 hours. Cells were harvested by mitotic shake-off, fmed, and stained with Hoechst 33258 and Giemsa. In the SCE test with S9, cells were incubated with tricresyl phosphate, serum-free medium, and S9 for 2 hours. The medium was then removed and replaced with medium containing serum and BrdU and no tricresyl phosphate, and incubation proceeded for an additional 26 hours, with Colcemid present for the final 2 hours. Harvesting and staining were the same as for cells treated without S9. A l l slides were scored bl ind and those from a single test were read by the same person. F i f ty second-division metaphase cells were scored for frequency of SCEs/cell from each dose level.
Statistical analyses were conducted on the slopes of thc dose-response curves and the individual dose points (Galloway e r ol., 1987). An SCE frequency 20% above the concurrent solvent control value was chosen as a statistically conservative positive response. The probability of this level of difference occurring by chance at one dose point is less than 0.01; the probability for such a chance occurrence at two dose points is less than 0.001. An increase of 20% o r greater at any single dose was considered weak evidence

231 Genetic Toxicology
of activity; increases at two or more doses resulted in a determination that the trial was positive. A statistically significant trend (PSO.05) in the absence of any responses reaching 20% above background led to a call of equivocal.
Chromosomal Aberrufions Tesf: In the Abs test without S9, cells were incubated in McCoy's 5A medium with tricresyl phosphate for 12 hours; Colcemid was added and incubation continued for 2 hours. The cells were then harvested by mitotic shake-off, fixed, and stained with Giemsa. For the Abs test with S9, cells were treated with tricresyl phosphate and S9 for 2 hours, after which the treatment medium was removed and the cells were incubated for 12 hours in fresh medium, with Colcemid present for the final 2 hours. Harvesting and staining were the same as for cells treated without S9.
Cells were selected for scoring on the basis of good morphology and completeness of karyotype (21 2 2 chromosomes). A l l slides were scored blind and those from a single test were read by the same person. One hundred first-division metaphase cells were scored at each dose level. Classes of aberrations included simple (breaks and terminal deletions), complex (rearrangements and translocations), and other (pulverized cells, despiralized chromosomes, and cells containing 10 or more aberrations).
Chromosomal aberration data are presented as percentage of cells with aberrations. To arrive at a statistical call for a trial, analyses were conducted on both the dose response curve and individual dose points. For a single trial, a statistically significant (P50.05) difference for one dose point and a significant trend (P10.015) are considered weak evidence for a positive response; significant differences for two or more doses indicate t h e trial is positive. A positive trend test in the absence of a statistically significant increase at any one dose results in an equivocal call (Galloway e r of., 1987). Ultimately, the trial calls were based on consideration of the statistical analyses as well as the biological information available to the reviewers.
RESULTS Tricresyl phosphate (100 to 10,000 pdplate) was tested in two laboratories for induction of gene mutations in Salntonella t yph in tur i z ln t strains TA98, TA100, TA1535, and TA1537 (Table El; Haworth et al., 1983). No induction of gene mutations was observed in either laboratory in any of the four tester strains. Precipitation o f tricresyl phosphate was noted at concentrations of 3,333 /.@plate and above in the study conducted at SRI, International. I n cytogenetic tests with cultured Chinese hamster ovary cells, tricresyl phosphate did not induce sister chromatid exchanges (Table E2) or chromosomal aberrations (Table E3), w i t h or without Aroclor 1254-induced male Sprague-Dawley rat liver S9. No tricresyl phosphate-induced cell cycle delay was observed in either of these two assays.

232 Tricresyl Phosphate, NTP TR 433
TABLE El Mutagenicityof Tricresyl Phosphate i n Sulmonelh typhimuriuma
Revertants/plateb
Strain Dose -s9 +lo%hamster S9 +lo% rat S9 (kglplate) Trial 1 Trial 2 Trial 1 Trial 2 Trial 1 Trial 2
Study conducted at Case Western Reserve University
TAlOO 0 129 f 12.5 178 f 17.5 167 2 13.8 192 f 12.7 194 f 5.0 197 f 2.8 100 175 f 42.0 180 f 5.4 135 2 7.3 183 f 14.5 165 f 3.8 209 2 21.1 333 148 f 8.8 210 f 16.1 147 2 5.3 192 f 13.9 184 f 4.9 208 f 11.6
1,Ooo 121 f 8.4 223 f 10.1 148 -C 1.0 190 f 10.2 267 f 48.0 227 2 22.3 3,333 107 f 5.5 181 f 16.7 150 rf: 14.9 210 f 24.2 285 f 51.5 209 f 9.5
10,Ooo 129 f 7.4 198 f 10.3 155 rt 12.5 215 f 19.1 228 f 11.2 213 f 11.0
Tr ia l summary Negative Equivocal Negative Negative Negative Negative Positive control' 591 f 84.5 519 f 61.2 621 2 29.1 622 f 60.0 633 f 128.5 510 f 45.5
TA1535 0 7 f 0.3 9 f 2.0 10 2 0.7 8 f 1.2 13 f 3.5 12 f 2.6 100 8 f 0.9 11 rf: 1.0 13 2 4.1 5 f 2.8 14 f 2.3 9 f 1.9 333 6 f 1.3 8 rf: 0.6 14 2 1.7 11 f 0.9 11 f 2.0 8 f 1.2
1,Ooo 10 f 1.2 9 2 1.3 14 f 0.7 6 f 2.6 13 f 0.9 9 f 1.8 3,333 9 f 1.8 11 2 0.6 12 f 1.5 8 f 1.3 11 f 1.8 8 f 2.2
10,Ooo 11 f 0.3 12 f 1.2 19 f 2.1 8 f 3.5 11 f 0.7 8 f 1.2
Trial summary Negative Negative Negative Negative Negative Negative Positive control 199 f 40.5 270 iz 30.1 72 f 7.2 79 f 13.9 69 f 8.6 62 f 10.1
TA1537 0 7 f 0.9 5 2 1 . 0 8 f 0.6 5 f 1.5 6 f 2.0 4 f 1.2 100 7 f 1.7 4 2 0.7 14 f. 0.7 10 f 2.1 10 f 3.8 6 f 1.0 333 6 f 0.9 6 2 1.0 16 f 0.0 10 f 0.3 12 f 1.0 7 f 1.0
1,Ooo 7 f 0.3 5 2 0.3 14 f 2.3 9 f 1.7 14 2 0.9 9 f 2.1 3,333 8 f 1.2 4 rt 1.0 16 f 0.9 10 f 2.3 10 f 1.5 9 2 2.7
10,000 5 f 0.9 6 rt 2.3 11 f 2.2 6 f 0.7 12 f 1.2 7 f 0.7
Trial summary Negative Negative Negative Negative Negative Negative Positive control 155 f 14.2 150 f 14.8 87 f 15.0 45 f 11.2 199 f 17.6 154 f 32.0
TA98 0 19 f 2.9 11 f 4.4 22 f 3.4 19 f 1.8 24 f 1.2 15 f 2.3 100 18 f 2.1 9 rf: 0.6 31 f 3.8 21 f 2.8 23 f 1.3 21 f 1.9 333 16 f 0.7 8 f 0.9 28 f 0.9 18 f 3.0 23 f 1.3 18 f 5.0
1,Ooo 11 f 1.5 12 f 1.3 22 f 4.9 17 f 2.8 26 f 5.2 19 f 3.4 3,333 18 f 1.9 15 f. 1.7 26 f 3.5 19 f 1.8 19 f 2.5 18 f 0.7
10,000 22 f 1.5 12 f 1.2 28 f 2.5 14 f 3.0 18 f 4.7 10 ? 0.7
Trial summary Negative Negative Negative Negative Negative Negative Positive control 296 f 15.5 356 f 28.4 594 f 56.9 651 f 53.1 586 f 42.4 560 f 34.8

233 Genetic Toxicology
TABLEEl Mutagenicity of Tricresyl Phosphate in Salmonella typhimurium (continued)
Revertnntdplnte
Strain Dose -s9 + 1 W hamster S9 +lo%Mt s9 (pglplate) Trial 1 Trial 2 Trial 1 Trial 2 Trial 1 Trial 2
Study conducted at SRI, International
TAlOO 0.0 95 f 4.2 112 f 5.9 110 -c 9.9 112 f 12.9 120 f 5.0 124 * 4.3 100.0 127 f 2.0 108 2 7.9 129 f 3.2 115 f 4.2 129 f 6.2 120 f 3.6 333.3 140 f 2.0 102 f 6.3 131f 4.1 126 f 11.1 105 f 3.5 126 f 8.7
l,Ooo.o 126 f 12.1 116 f 9.0 12a f 7.8 135 f 4.1 119 f 7.8 118 2 3.8 3,333.3 112 f 4.4 107 f 3.gd 123 f 4.1d 132 f 2.3d 128 f 3.4d 127 f 7Sd
10,oO0.0 121 f 9.6d 126 f 2.1d 130 f 8.3d 123 f 7Sd 125 f 1l . ld 127 f 4.qd
Trial summary Equivocal Negative Negative Negative Negative Negative Positive control 286 k 9.0 190 f 7.4 203 f 9.0 1,646 f 98.9 195 f 11.0 904 f 24.8
TA1535 0.0 20 f 2.8 26 f 4.2 10 f 0.7 13 f 0.3 12 f 1.5 12 +. 0.9 100.0 21 f 2.0 19 f 1.0 16 2 1.2 12 f 1.9 16 2 1.9 7 2 0.6 333.3 24 f 3.5 21 f 5.5 16 f 0.9 9 f 0.3 10 t 1.5 9 f 1.9
l,Ooo.o 25 f 0.7 14 f 2.0 13 f 2.3 11 f 1.2 14 t 0.3 12 f 1.5 3,333.3 28 f 2.1 11 f 1.8d 18 f 1.3d 11 2 1.9d 8 2 1.9d 13 f 3Sd
10,Ooo.o 17 f 1.7d 20 f 0.3d 14 f 3.2d 10 f 0.9d 12 f 1.7d 11 f 2.2d
Trial summary Negative Negative Negative Negative Negative NegativePositive control 287 f 11.6 191 f 9.0 127 t 1.0 538 f 8.4 94 f 11.4 490 2 12.3
TA1537 0.0 9 f 3.4 7 f 1.0 12 f 2.0 17 t 0.7 18 f 0.7 16 2.0 100.0 16 f 1.8 10 f 2.5 31 t 3.5 16 t 0.3 18 2 3.5 17 f 2.3 333.3 12 f 2.0 8 f 3.0 15 f 2.0 13 f 3.0 20 2 4.0 18 f 3.4
1,Ooo.o 14 f 1.2 6 f 1.8 23 f 1.9 17 f 2.1 24 f 0.9 16 k 1.8 3,333.3 15 .t 3.2 8 2 O.9d 24 f 2.3d 14 f 2.1d 12 f 5 9 15 k 2.7d
10,000.0 16 f. 2.Zd 9 2 ISd 21 f lad 16 f 2.Zd 16 f 1.7d 14 k 1.7d
Trial summary Negative Negative Equivocal Negative Negative NegativePositive control 413 2 39.1 248 f. 75.8 50 -t 0.9 554 -t 29.2 39 +- 7.4 532 2 21.7
TA98 0.0 33 2 1.5 23 f 2.2 49 2 2.1 38 f 3.8 35 f 2.8 24 f 3.2 100.0 30 2 0.3 34 2 7.9 43 2 2.7 35 2 5.0 43 f 3.8 32 f 5.8 333.3 20 ~t 3.0 29 f 3.7 31 2 4.7 34 2 2.5 36 f 3.5 28 f 2.4
l,Ooo.o 28 2 7.0 34 It 4.8 40 f 6.6 33 f 4.3 37 f 1.9 28 f 0.6 3,333.3 35 2 2.5 23 f 2.8d 37 f 4.4 38 f 3.6d 41 f 2.7d 30 f S.2d
10,Ooo.o 28 2 lSd 27 f 6.4* 40 f 1.5 42 f 2.6d 41 f 2.2d 28 f 2.2d
Trial summary Negative Negative Negative Negative Negative NegativePositive control 626 f 11.2 883 f 13.5 158 f 7.3 1,361 f 21.7 114 f 6.5 666 f 158.7
a The detailed protocol is presented i n Haworth et a/. (1983). Revertants are presented as mean f standard error from three plates. 2-Aminoanthracene was used on a l l strains in the presence o f S9. In the absence o f metabolic activation, 4-nitro+phenylenediamine was tested on TA98. sodium azide was tested on TAl00 a n d TA1535, and 9-aminoacridine was tested on TA1537.
d Precipitateonplate

234 Tricresyl Phosphate, NTP TR 433
TABLE E2 Induction of Sister Chromatid Exchanges in Chinese Hamster Ovary Cells by Tricresyl Phosphatea
No. of SCESI Relative SCEs/ Dose Total Chromo- No. of SCEs/ Hrs ChromosomeChromo-
Compound (BglmL) Cells somes some in BrdU ( W bCellSCEs
-s9
Trial 1 Summary:Negative
Dimethylsulfoxide 0.41 50434
501.79
1,038 8.7 26.0
Mitomycin-C .01 1.039 1,865 37.3 26.0 329.31
Tricresyl phosphate 0.45 50415.05 1,038 9.5 26.0 9.45 .16 50 1,032 444 0.43 8.9 26.0 2.90
0.41 50S O 435 1.60.370 50 394
1,048 1,043
8.7 26.0 -0.73 7.9 26.0 -9.65
5.00 16.00
50 0
1,018 428 0.42 8.6 26.0 0.55
P=0.9Uc
+s 9
Trial 2 Summary:Negative
Dimethylsulfoxide 50 1,043 0.46 488 9.8 26.0
Cyclophosphamide 50 1.5 1,036 2.341 2.25 46.8 26.0 382.96
Tricresyl phosphate 16 50 1,041 447 0.42 8.9 26.0 50 50 1,045 446 0.42 8.9 26.0
160 50 1,041 468 0.44 9.4 26.0 500 50 1,046 458 0.43 9.2 26.0
1,600 50 1,045 418 0.40 8.4 26.0 5 , m 50 1.036 501 0.48 10.0 29.0
a Studyperformed a t EnvironmentalHealthResearch Rr Testing.SCE = sisterchromatidexchange;BrdU detailed description of the SCE protocol is presented by Galloway e t al. (1987). SCEs/chromosome of culture exposed to tricresyl phosphate relative to those of culture exposed to solvent Significanceo f relative SCEWhromosome tested by the linear regression trend test vs.log of the dose.
-8.23 -8.78 -3.92 -6.42
-14.51 3.36
P=O.507
= bromodeoxyuridine. A

235 Genetic Toxicology
TABLEE3 Induction of Chromosomal Aberrations in Chinese Hamster Ovary Cells by Tricresyl Phosphatea
-s9 +s9 Dose Total No. of Abs/ Percent Dose Total No. of Abs/ Percent
(pglmL) Cells Abs Cell Cells (pglmL) Cells Abs Cell Cells wlAbs w/Abs
Trial 1 - Harvest time: 14.0 hours Trial 1 - Harvest time: 14.0 hours Summary: Negative Summary: Negative
Dimethylsulfoxide Dimethylsulfoxide
1000.01 100 0 0.00 0.0 1 1.0
Cyclophosphamide Cyclophosphamide
1000.74 25 100 21 0.21 18.0 25 74 51.0
Tricresyl phosphate Tricresyl phosphate
50 100 0 0.00 0.0 160 100 0 0.00 0.0 160 100 1 0.00 0.0 500 100 0 0.00 0.0 500 100 1 0.01 1.o 1 , 6 0 0 100 1 0.01 1.o
1,600 100 0 0.00 0.0 5,000 100 0 0.00 0.0 5,000 100 1 0.01 1.o
l P=0.199b P=O.690
a Study performed at Environmental Health Research Rr Testing. Abs = aberrations. A detailed presentation of theprotocol is found in Galloway er ol. (1987). Significance o f percent cells with aberrations tested by t h e linear regression trend test vs. log of the dose.

237
APPENDIX F ORGAN WEIGHTS
AND ORGAN-WEIGHT-TO-BODY-WIGHT RATIOS
TABLEFl Organ Weights and Organ-Weight-to-Body-Weight Ratios for Rats in the 16-Day Gavage Study of Tricresyl Phosphate ........................... 238
TABLEF2 Organ Weights and Organ-Weight-to-Body-Weight Ratios for Rats in the 13-Week Gavage Study of Tricresyl Phosphate .......................... 240
TABLEF3 Organ Weights and Organ-Weight-to-Body-Weight Ratios for Rats in the 13-Week Feed Study of Tricresyl Phosphate ............................ 242
TABLE F4 Organ Weights and Organ-Weight-to-Body-Weight Ratios for Rats at the 3-Month Interim Evaluation in the 2-Year Feed Study of Tricresyl Phosphate ................................................. 244
TABLE F5 Organ Weights and Organ-Weight-to-Body-Weight Ratios for Rats at the 9-Month Interim Evaluation in the 2-Year Feed Study of Tricresyl Phosphate ................................................. 246
TABLE F6 Organ Weights and Organ-Weight-to-Body-Weight Ratios for Rats at the 15-Month Interim Evaluation in the 2-Year Feed Study of Tricresyl Phosphate ................................................. 248
TABLEF7 Organ Weights and Organ-Weight-to-Body-Weight Ratios for Mice in the 16-Day Gavage Study of Tricresyl Phosphate ........................... 250
TABLE FS Organ Weights and Organ-Weight-to-Body-Weight Ratios for Mice in the 13-Week Gavage Study of Tricresyl Phosphate .......................... 252
TABLE F9 Organ Weights and Organ-Weight-to-Body-Weight Ratios for Mice in the 13-Week Feed Study of Tricresyl Phosphate ............................ 254
TABLE F10 Organ Weights and Organ-Weight-to-Body-Weight Ratios for Mice at the 3-Month Interim Evaluation in the 2-Year Feed Study of Tricresyl Phosphate ................................................. 256
TABLEF11 Organ Weights and Organ-Weight-to-Body-Weight Ratios for Mice at the 9-Month Interim Evaluation in the 2-Year Feed Study of Tricresyl Phosphate ................................................. 258
TABLE F12 Organ Weights and Organ-Weight-to-Body-Weight Ratios for Mice at the 15-Month Interim Evaluation in the 2-Year Feed Study of Tricresyl Phosphate ................................................. 260
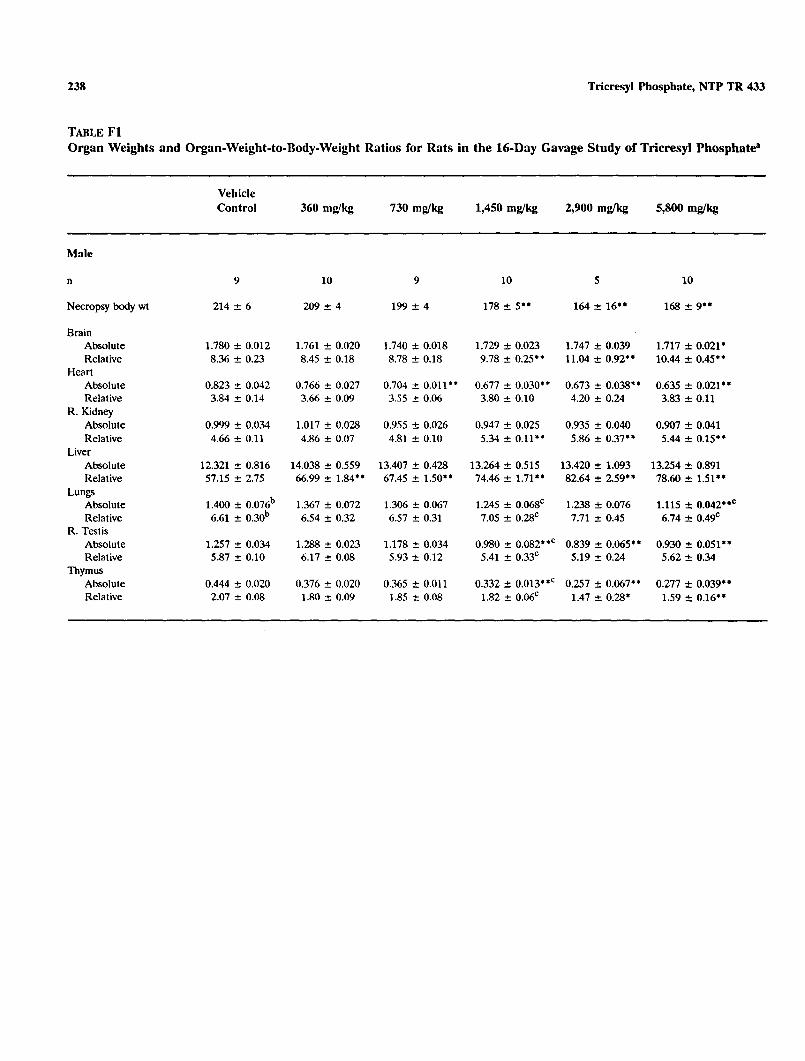
238 Tricresyl Phosphate, NTP TR 433
TABLEF l Organ Weights and Organ-Weight-to-Body-WeightRatios for Rats in the 1CDay Gavage Study of Tricresyl Phosphatea
Vehicle Control 360 mdkg 730 mdkg 1,450 mdkg 2,900 mdkg 5,800 mgntg
Male
n 9 10 9 10 5 10
Necropsy body wt 214 f 6 209 f 4 199 f 4
Brain Absolute 1.780 f 0.012 1.761 f 0.020 1.740 f 0.018 1.729 f 0.023 1.747 k 0.039 1.717 f 0.021. Relative 8.36 f 0.23 8.45 f 0.18 8.78 f 0.18 9.78 2 0.25'. 11.04 2 0.92'; 10.44 f 0.45''
Heart Absolute 0.823 f 0.042 0.766 f 0.027 0.704 f 0.011*' 0.677 f 0.030'' 0.673 f 0.038*' 0.635 f 0.021.' Relative 3.84 f 0.14 3.66 f 0.09 3.55 f 0.06 3.80 f 0.104.20 f 0.24 3.83 k 0.11
R. Kidney Absolute 0.999 f 0.034 1.017 f 0.028 0.955 f 0.026 0.947 f 0.0250.935 f 0.0400.907 f 0.041 Relative 4.66 f 0.11 4.86 f 0.07 4.81 f 0.10 5.34 f 0.11'; 5.86 f 0.37..5.44 f 0.15..
Liver Absolute 12.321 f 0.816 14.038 f 0.559 13.407 f 0.428 13.264 f 0.51513.420 f 1.09313.254 f 0.891 Relative 57.15 k 2.75 66.99 f 1.84'. 67.45 f 1.50'. 74.46 f 1.71;.82.64 f 2.59.'78.60 +. 1.51';
Lungs Absolute 1.400 f 0.076b 1.367 f 0.072 1.306 f 0.067 1.245 f 0.068' 1.238 f 0.0761.115 -e 0.042;;' Relative 6.61 f 0.30b 6.54 f 0.32 6.57 f 0.31 7.05 f 0.28' 7.71 & 0.45 6.74 2 0.49'
R. Testis Absolute 1.257 f 0.034 1.288 f 0.023 1.178 2 0.034 0.980 f 0.082"'0.839 f 0.065'' 0.930 2 0.051.' Relative 5.87 f 0.10 6.17 f 0.08 5.93 f 0.12 5.41 f 0.33' 5.19 f 0.245.62 & 0.34
Thymus Absolute 0.444 f 0.020 0.376 f 0.020 0.365 k 0.011 0.332 2 0.013*.'0.257 f 0.067.'0.277 k 0.039.' Relative 2.07 f 0.08 1.80 f 0.09 1.85 f 0.08 1.82 f 0.06'1.47 f 0.28. 1.59 +- 0.16;.

239 Orgnn Weight Annlyses
TABLEF l Organ Weights and Organ-Weight-to-Body-Weight Ratios for Rats in the 16-Day Gavage Study of Tricresyl Phosphate (continued)
Vehicle Control 360 m d k 730 mg/kg 1,450 mdkg 2,900 mgkg 5,800 mgkg
Female
n 9 1 0 10 9 2 10
Necropsy body wt 148 f 2 154 & 2 153 f 4 136 f 4' 122 f 7.. 125 f 5..
Brain Absolute 1.699 & 0.023 1.654 f 0.015 1.687 f 0.0161.649 f 0.014 1.602 f 0.019 1.641 f 0.019. Relative 11.49 f 0.18 10.76 f 0.13 11.07 f 0.21 13.14 f 0.85. 13.30 f 0.46..12.18 f 0.32
Heart Absolute 0.560 f 0.014 0.575 2 0.012 0.581 f 0.0170.531 f 0.017 0.488 f 0.054 0.508 f 0.013. Relative 3.78 f 0.06 3.74 f 0.07 3.79 f 0.05 3.90 -t 0.07 3.97 2 0.22 4.10 f 0.12*'
R. Kidney Absolute 0.689 f 0.022 0.733 c 0.010 0.727 f 0.0190.743 2 0.020 0.702 f 0.043 0.671 f 0.014 Relative 4.65 f 0.10 4.77 f 0.09 4.75 f 0.08 5.51 f 0.29.. 5.73 f 0.04. 5.41 f 0.13**
Liver Absolute 6.840 f 0.201 8.994 f 0.215'. 9.648 f 0.208'* 10.149 f 0.351'' 8.697 f 0.263'' 9.520 f 0.313.' Relative 46.14 f 0.82 58.42 d 0.99.. 63.19 -e 1.18.' 74.45 f 0.87" 71.17 & 1.66'' 76.53 f 1.41"
Lungs Absolute 1.132 f 0.075 1.230 -t 0.043' 1 . 1 3 8 f 0.0571.020 f 0.032 0.851 f 0.076 0.935 f 0.029.. Relative 7.63 f 0.45 8.04 -t 0.32' 7.45 f 0.367.52 f 0.26 6.94 -t 0.25 7.55 f 0.26
Thymus Absolute 0.363 & 0.014 0.377 f 0.012 0.329 f 0.008 0.219 & 0.028.. 0.192 2 0.044.' 0.181 f 0.028'. Relative 2.45 f 0.09 2.45 f 0.07 2.16 & 0.06 1.57 & 0.17.. 1.55 2 0.27.. 1.40 f 0.18'.
I Significantly different (PCO.05) from the control group by Williams' or Dunnett's test "PSO.01 a Organ weights and body weights are given in grams; organ-weight-to-body-weight ratios are given as mg organ weight/g body weight
(mean f standard error) n = 8 n = 9

240 Tricresyl Phosphate, NTP TR 433
TABLEF2 Organ Weights and Organ-Weight-to-Body-Weight Ratios for Rats in the 13-Week Gavage Study of Tricresyl Phosphatea
Male
n 10 10 10 10 10 10
Necropsy body w t 373 & 8 361 f 4 360&7 348 f 7.. 338 f 5.. 321 2 6..
Brain Absolute 1.941 & 0.023 1.918 2 0.0101.934 f 0.023 1.919 f 0.015 1.909 2 0.0221.890 f 0.023 Relative 5.22 & 0.09 5.32 2 0.075.39 5 0.11 5.53 2 0.09'. 5.64 f0.06.. 5.90 f0.06'.
Heart Absolute 0.999 f 0.015 0.955 & 0.0141.024 ? 0.031 0.992 2 0.032 0.963 -t 0.013 0.950 k 0.027 Relative 2.69 f 0.05 2.65 f 0.042.84 f 0.05 2.85 2 0.07. 2.85 f 0.04. 2.96 -C 0.07..
R. Kidney Absolute 1.195 & 0.039 1.123 A 0.0231.165 & 0.039 1.132 f 0.033 1.136 f 0.015 1.095 & 0.022 Relative 3.20 f 0.05 3.11 f 0.06 3.23 2 0.05 .... 0.06f :;; 3.36 f 0.06 3.42 f 0.07.
Liver Absolute 14.416 f 0.686 13.866 f 0.370 14.331 2 0.551 ')'IS f 0.52215.556 2 0.39215.939 f 0.344. Relative 38.53 2 1.16 38.45 f 1.08 39.76 f 1.06 4 : *Xi k 1.06 46.04 f 1.27..49.71 -C 0.94'.
Lungs
Relative Absolute
5.19 f 0.12 1.938 2 0.068 2.025 f 0.056
5.62 2 0.17. 1.839 f 0.036 5.12 f 0.10
1.800 & 0.027'1.754 5.18 f 0.05
5 0.034.' 5.19 f 0.085.33
1.710 2 0.047..* 0.09 L. T e s t i s
Absolute 1.564 f 0.026 1.724 2 0.147 1.528 f 0.042b 1.542 f 0.0291.405 f 0.0270.857 f 0.095.' Relative 4.20 f 0.06 4.77 f 0.404.17 2 O . l l b 4.44 5 0.04 4.15 2 0.072.66 2 0.29..
Thymus Absolute 0.286 f 0.011 0.277 f 0.012 0.237 f 0.010'. 0.234 2 0.013..b 0.196 5 0.012.. 0.169 0.009.. Relative 0.77 f 0.03 0.77 2 0.030.66 f 0.03. 0.67 f 0.03+b 0.58 f 0.03'. 0.53 f 0.03'.

241 Organ Weight Analyses
TABLEF2 Organ Weights and Organ-Weight-to-Body-WeightRatios for Ruts in the 13-Week Gavage Study of Tricresyl Phosphate(continued)
Vehicle Control 50 mdkg 100mdkg 200 mdkg 400 mdkg 800 mgnts
Female
n 10 10 10 10 10 10
Necropsy body wt 206 2 5 207 f 3 210 f 3 211 2 3 205 f3 212 f 3
Brain Absolute 1.791 f 0.023 1.779 k 0.016 1.770 f 0.014 1.792 f 0.016 1.793 2 0.016 1.801 f 0.016 Relative 8.72 k 0.18 8.58 k 0.08 8.46 f 0.12 8.53 c 0.12 8.77 f 0.148.51 f 0.09
Heart Absolute 0.626 f 0.013 0.637 k 0.017 0.636 2 0,013 0.633 f 0.018 0.632 f 0.0260.650 f 0.017 Relative 3.04 f 0.03 3.07 f 0.07 3.03 2 0.03 3.00 5 0.07 3.08 * 0.10 3.06 fi 0.06
R. Kidney Absolute 0.691 f 0.015 0.677 t 0.020 0.662 r 0.014 0.708 f 0.009 0.727 f 0.015 0.761 f 0.016'' Relative 3.36 2 0.04 3.26 +- 0.07 3.16 2 0.07 3.37 2 0.06 3.55 f0.06. 3.59 f 0.04.'
Liver Absolute 7.382 k 0.172 7.593 r 0.210 7.649 f 0.145 7.909 2 0.136 8.644 f 0.295'. 9.552 k 0.248** Relative 35.87 f 0.62 36.60 2 0.80 36.52 2 0.63 37.57 f 0.39 42.12 2 1.01" 45.07 f 0.86..
Lungs Absolute 1.426 f 0.039 1.268 2 0.040 1.378 f 0.038 1.426 f 0.056 1.366 2 0.062 1.338 f 0.051 Relative 6.95 i: 0.24 6.11 f 0.16. 6.58 f 0.18 6.78 f 0.27 6.65 2 0.23 6.31 f 0.21
Thymus Absolute 0.226 f 0.011 0.225 f 0.011 0.225 f 0.008 0.218 f 0.012 0.192 2 0.007. 0.199 fi 0.007. Relative 1.10 f 0.05 1.08 f 0.05 1.07 f 0.04 1.03 2 0.06 0.93 2 0.02, 0.94 f 0.03'
* Significantly different (P40.05) from the control group by Williams' or Dunnett 's test * * PsO.01 a Organ weights and body weights are given in grams: organ-weight-to-body-weightratios are given as mg organ weight/g body weight
(mean f standard error) n=9
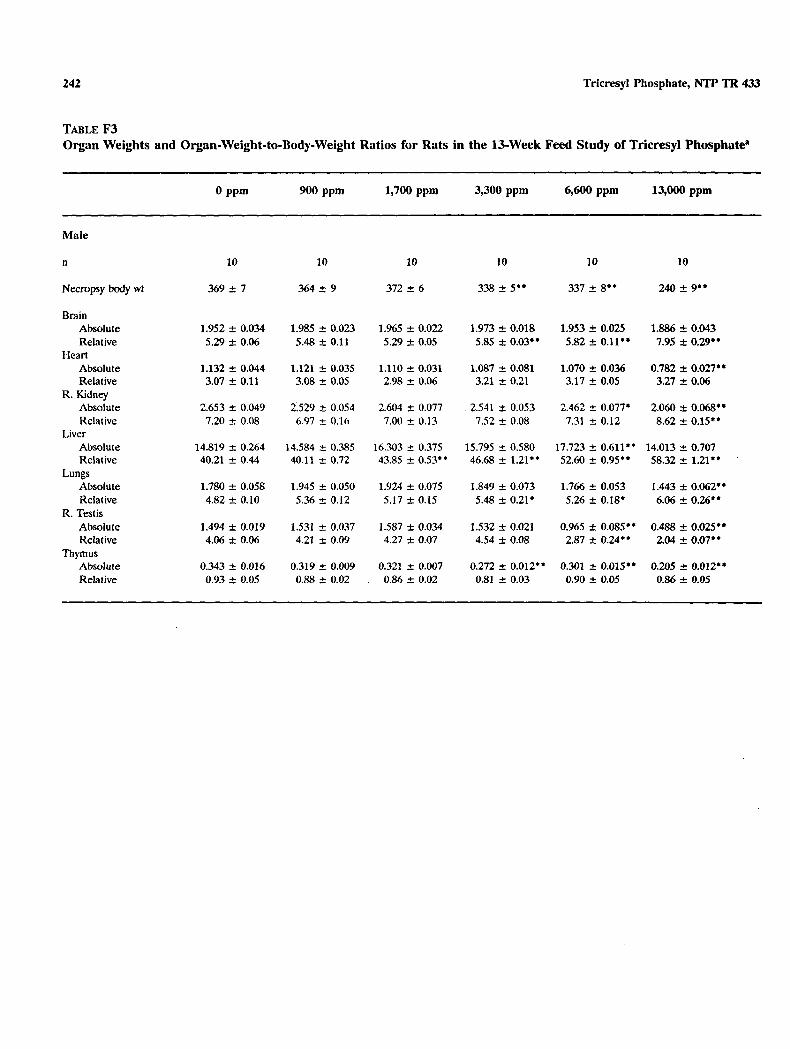
242 Tricresyl Phosphate, NTP TR 433
TABLEF3 Organ Weights and Organ-Weight-to-Body-WeightRatios for Rats in the 13-Week Feed Study of Tricresyl Phosphate"
0 PPm 900 ppm 1,700 ppm 3,300 ppm 6,600 ppm 13,000ppm
Male
n 1 0 10 10 1 0 1 0 10
Necropsy body wt 3 6 9 f 7 3 6 4 2 9 372 2 6
Brain Absolute 1.952 f 0.034 1.985 f 0.023 1.965 f 0.022 1.973 f 0.018 1.953 f 0.025 1.886 f 0.043 Relative 5.29 f 0.06 5.48 -C 0.11 5.29 f 0.05 5.85 f 0.03..5.82 2 0.11.. 7.95 f 0.29'.
Heart Absolute 1.132 f 0.044 1.121 -C 0.035 1.110 f 0.031 1.087 $ 0.0811.070 2 0.036 0.782 f 0.027.. Relative 3.07 f 0.11 3.08 -C 0.05 2.98 f 0.06 3.21 f 0.213.17 2 0.053.27 2 0.06
R. Kidney
Relative Absolute
7.20 f 0.08 2.653 f 0.049
6.97 * 0.16 2.529 k 0.054
7.00 f 0.13 2.604 f 0.077 2.541 z 0.0532.462
7.52 k 0.087.31 f 0.077.2.060 f 0.128.62
-t 0.068.. 2 0.15.'
Liver Absolute 14.819 2 0.264 14.584 2 0.385 16.303 f 0.375 15.795 f 0.58017.723 f 0.611..14.013 -C 0.707 Relative 40.21 f 0.44 40.11 f 0.72 43.85 f 0.53.. 46.68 f 1.21..52.60 f 0.95..58.32 f 1.21..
Absolute Lungs
1.780 f 0.058 1.945 f 0.050 1.924 f 0.075 1.849 f 0.073 1.766 f 0.053 1.443 f 0.062.' Relative 4.82 -c 0.10 5.36 f 0.12 5.17 f 0.15 5.48 2 0.21' 5.26 f 0.18' 6.06 f 0.26'.
R. Testis Absolute 1.494 t 0.019 1.531 2 0.037 1.587 f 0.034 1.532 2 0.0210.965 t 0.085+.0.488 f0.025** Relative 4.06 t 0.06 4.21 2 0.09 4.27 f 0.07 4.54 2 0.082.87 -C 0.24** 2.04 f 0.07..
Thymus Absolute 0.343 2 0.016 0.319 -t 0.009 0.321 2 0.007 0.272 f 0.012.. 0.301 -c 0.015.. 0.205 f0.012*. Relative 0.93 5 0.05 0.88 2 0.02 0.86 f 0.02 0.81 f 0.03 0.90 -c 0.05 0.86 & 0.05

243 Organ Weight Annlyses
TABLEF3 Organ Weights and Organ-Weight-to-Bodyweight Ratios€or Rats in the 13-Week Feed Study of Tricresyl Phosphate (continued)
0 PPm 900 ppm 1,700 ppm 3,300 PPm 6,600ppm 13,000ppm
Female
n 10 10 10 10 10 10
Necropsy body w t 202 f 3 195 2 4 195 2 3 188 f 3.. 180 2 3.' 176 2 2"
Brain Absolute 1.821 f 0.013 1.773 f 0.015 1.788 f 0.021 1.796 & 0.014 1.807 f 0.025 1.833 f 0.019 Relative 9.05 f 0.12 9.14 f 0.19 9.17 f 0.08 9.56 f 0.13' 10.08 f 0.20.' 10.44 & 0.18''
Heart Absolute 0.694 f 0.014 0.676 f 0.018 0.657 f 0.016 0.676 f 0.022 0.605 f 0.013'. 0.611 & 0.017.. Relative 3.45 f 0.07 3.48 f 0.09 3.37 f 0.07 3.59 f 0.10 3.37 2 0.05 3.47 f 0.07
R.Kidney Absolute 1.492 f 0.027 1.523 f 0.033 1.480 f 0.030 1.478 f 0.041 1.440 f 0.031 1.537 f 0.023 Relative 7.40 k 0.09 7.83 f 0.08 7.59 f 0.10 7.86 f 0.18.; 8.01 f 0.09'. 8.74 f 0.07..
Liver Absolute 6.631 f 0.131b 6.794 f 0.231 6.903 & 0.175 6.920 f 0.1 14 7.576 f 0.176.. 9.399 * 0.1851' Relative 33.15 2 0.57b 34.82 f 0.57 35.37 f 0.67' 36.81 f 0.43.. 42.17 f 0.82.. 53.45 k 0.91'.
Lungs Absolute 1.291 a 0.028 1.319 f 0.038 1.286 k 0.048 1.283 f 0.045 1.248 2 0.040 1.255 2 0.059 Relative 6.41 2 0.11 6.81 2 0.27 6.59 f 0.23 6.83 2 0.26 6.96 2 0.24 7.13 2 0.31
Thymus Absolute 0.257 f 0.012 0.246 f 0.007 0.243 2 0.013 0.237 f 0.010 0.238 k 0.008 0.214 +- 0.009*. Relative 1.28 k 0.06 1.27 f 0.03 1.24 f 0.05 1.26 f 0.05 1.32 k 0.05 1.22 f 0.05
* Significantly different (PsO.05) from the control group by Williams' or Dunnett's test * * PsO.01 a Organ weights and body weights are given i n grams; organ-weight-to-body-weight ratios are given as mg organ weight/g body weight
(mean -t standard error) n=9

244 Tricresyl Phosphate, NTP TR 433
TABLEF4 Organ Weights and Organ-Weight-to-Body-Weight Ratios For Rats at the 3-Month Interim Evaluation in the 2-Year Feed Study of Tricresyl Phosphate"
Male
n 10 10 10 10 10
Necropsy body w t 342 f 11 337 -t 5 349 f 6 332 f 4 340 2 11
Relative Absolute
L. Adrenal Gland
Relative Absolute
R. Adrenal Gland
Relative Absolute
Relative Absolute
Relative Absolute
Relative Absolute
Relative Absolute
Relative Absolute
Brain
L. Kidney
R. Kidney
Liver
L. Testis
R. Testis
0.07 f 0.00 0.024 f 0.002
0.06 f 0.00 0.021 f 0.001
5.69 f 0.12 1.939 f 0.042
3.71 rt 0.06 1.269 & 0.047
3.69 f 0.05 1.267 rt 0.048
14.055 ? 0.670 40.91 rt 1.09
4.16 * 0.05 1.423 rt 0.043
3.94 2 0.11 1.345 2 0.049
0.07 f 0.00 0.024 f 0.001
0.06 f 0.00 0.022 f 0.001
5.77 f 0.07 1.943 2 0.021
3.62 f 0.08 1.219 f 0.031
3.50 f 0.07 1.179 f 0.026
40.36 f 0.85 13.611 f 0.375
4.14 2 0.06 1.395 f 0.033
1.354 f 0.028 4.02 f 0.06
0.06 f 0.00 0.021 f 0.001
0.06 * 0.00 0.023 f 0.001
5.66 f 0.11 1.968 f 0.013
3.53 f 0.05 1.231 f 0.028
3.46 f 0.06; 1.207 f 0.026
1.429 f 0.027b
41.72 f 1.52 14.530 f 0.514
4.08 f 0.06b
3.90 f 0.11 1.360 f 0.043
0.07 f 0.00 0.023 f 0.001
0.07 f 0.00 0.024 ? 0.001
5.99 f 0.06 1.986 f 0.017
3.59 f 0.04 1.192 f 0.022
3.58 f 0.05 1.188 f 0.018
41.30 2 0.95 13.714 k 0.339
4.12 f 0.04 1.368 * 0.016
4.14 rt 0.05 1.374 f 0.011
0.025 f 0.001b 0.07 fO.Wb
0.07 f 0.00 0.023 f0.001
5.76 f 0.13 1.945 f 0.019
3.65 rt 0.04 1.239 f 0.039
3.59 f 0.05 1.219 rt 0.041
44.61 2 1.01* 15.149 -+ 0.522
4.24 rt 0.07 1.436 rt 0.027
4.12 -t 0.06 1.3% f 0.034

245 Organ Weight Analyses
TABLE F4 Organ Weights and Organ-Weight-to-Body-Weight Ratios for Rats at the 3-Month Interim Evaluation in the 2-Year Feed Study of Tricresyl Phosphate (continued)
o ppm 75 ppm 150 ppm 300 ppm 600 ppm
Female
n 10 10 10 10 10
Necropsy body wt 189 ± 1 194 ± 3 191 ± 2 188 ± 3 186 ± 4
L. Adrenal Gland Absolute 0.024 ± 0.001 0.026 ± 0.001 0.027 ± 0.001 0.030 ± 0.002· 0.033 ± 0.001 ** Relative 0.13 ± 0.01 0.13 ± 0.01 0.14 ± 0.Ql 0.16 ± 0.01" 0.18 ± 0.00"
R. Adrenal Gland Absolute 0.024 ± 0.002 0.023 ± 0.002 0.025 ± 0.002 0.029 ± 0.001 0.033 ± 0.002*" Relative 0.13 ± 0.01 0.12 ± 0.01 0.13 ± 0.01 0.16 ± 0.Ql 0.18 ± 0.01"
Brain Absolute 1.795 ± 0.021 1.800 ± 0.020 1.807 ± 0.019 1.789 ± 0.020 1.763 ± 0.025 Relative 9.51 ± 0.11 9.29 ± 0.13 9.46 ± 0.10 9.56 ± 0.16 9.51 ± 0.11
L. Kidney Absolute 0.705 ± 0.Ql5 0.722 ± 0.027 0.721 ± 0.017 0.686 ± 0.017 0.682 ± 0.022 Relative 3.74 ± 0.Q7 3.71 ± 0.10 3.78 ± 0.08 3.66 ± 0.06 3.67 ± 0.05
R. Kidney Absolute 0.698 ± 0.016 0.701 ± 0.025 0.719 ± 0.015 0.692 ± 0.019 0.688 ± 0.022 Relative 3.70 ± 0.08 3.61 ± 0.10 3.77 ± 0.07 3.69 ± 0.07 3.70 ± 0.05
Liver Absolute 6.650 ± 0.138 6.968 ± 0.242 6.907 ± 0.146 6.559 ± 0.191 6.716 ± 0.146 Relative 35.23 ± 0.69 35.87 ± 0.97 36.17 ± 0.68 35.01 ± 0.96 36.18 ± 0.34
• Significantly different (P~0.05) from the control group by Williams' or Dunnell's test •• P::O.Ol a Organ weights and body weights are given in grams; organ-weight-to-body-weight ratios are given as mg organ weight/g body weight
(mean ± standard error). b n=9

246 Tricresyl Phosphate, NTP TR 433
TABLE F5 Organ Weights and Organ-Weight-to-Body-Weight Ratios for Rats at the 9-Month Interim Evaluation in the 2-Year Feed Study of Tricresyl Phosphate3
o ppm 75 ppm 150 ppm 300 ppm 600 ppm
Male
n 9 9 10 10 10
Necropsy body wt 441 :t 12 420:t 8 443 :t 10 419 :t 10 432:t 11
L. Adrenal Gland Absolute 0.028 :t 0.002 0.027 :t 0.002 0.026 :t 0.001 0.032 :t 0.002 0.027 :t 0.001 Relative 0.06 :t 0.00 0.06 :t 0.00 0.06 :t 0.00 0.08 :t 0.01 0.06 :t 0.00
R. Adrenal Gland Absolute 0.027 :t 0.002 0.024 :t 0.001 0.026 :t 0.001 0.028 :t 0.001 0.027 :t 0.001 Relative 0.06 :t 0.00 0.06 :t 0.00 0.06 :t 0.00 0.07 :t 0.00 0.06 :t 0.00
Brain Absolute 2.040 :t 0.022 2.008 :t 0.025 2.013 :t 0.029 2.070 :t 0.024 2.063 :t 0.024 Relative 4.65 :t 0.13 4.78 :t 0.07 4.56 :t 0.10 4.97 :t 0.15 4.80:t 0.09
L. Kidney Absolute 1.622 :t 0.059 1.477 :t 0.032 1.512 :t 0.044 1.542 :t 0.037 1.597 :t 0.044 Relative 3.68 :t 0.08 3.51 :t 0.05 3.41 :t 0.06 3.71 :t 0.14 3.70 :t 0.06
R. Kidney Absolute 1.580 :t 0.050 1.433 :t 0.017' 1.508 :t 0.042 1.483 :t 0.027 1.540 :t 0.045 Relative 3.58 :t 0.07 3.41 ± 0.06 3.40 ± 0.07 3.56 ± 0.09 3.57 ± 0.06
Liver Absolute 17.200 :t 0.580 14.900 :t 0.351' 16.362 ± 0.523 16.083 ± 0.522 15.703 ± 0.562 Relative 39.08 ± 1.08 35.51 ± 0.93 36.90 ± 0.80 38.52 ± 1.38 36.37 ± 0.85
L. Testis Absolute 1.573 ± 0.027 1.500 ± 0.023 1.557 ± 0.024 1.579 :t 0.037b 1.587 ± O.026b
Relative 3.58:t 0.07 3.57 ± 0.07 3.52 ± 0.06 3.73 ± O.12b 3.63 ± 0.07b
R. Testis Absolute 1.495 ± 0.034 1.471 ± 0.016 1.569 ± 0.030 1.538 ± 0.032b 1.594 ± 0.033·b
Relative 3.40 ± 0.08 3.51 ± 0.08 3.55 :t 0.05 3.64 ± O.12b 3.64 ± 0.07·b

247 Organ Weight Analyses
TABLE F5 Organ Weights and Organ-Weight-to-Body-Weight Ratios for Rats at the 9-Month Interim Evaluation in the 2-Year Feed Study of Tricresyl Phosphate (continued)
Female
n 10 10 10 10 10
Necropsy body wt 236 2 4 239 f 6 235 f 6 229 f 4 243 f 4
L. Adrenal Gland Absolute 0.032 f 0.002 0.030 f 0.001 0.034 f 0.002 0.033 2 0.001 0.032 f 0.001 Relative 0.14 f 0.01 0.13 f 0.00 0.14 f 0.01 0.14 2 0.00 0.13 f 0.00
R. Adrenal Gland Absolute 0.031 f 0.002 0.031 f 0.001 0.030 f 0.001 0.030 k 0.001 0.029 f 0.002 Relative 0.13 f 0.01 0.13 f 0.00 0.13 f 0.01 0.13 k 0.01 0.12 f 0.01
Brain Absolute 1.895 f 0.019 1.846 f 0.023 1.858 f 0.027 1.840 2 0.023 1.852 ? 0.013 Relative 8.06 f 0.16 7.78 f 0.19 7.95 f 0.15 8.04 f 0.14 7.64 f 0.13
L. Kidney Absolute 0.937 f 0.027 0.891 2 0.026 0.898 2 0.034 0.905 f 0.024 0.914 f 0.018 Relative 3.98 f 0.10 3.74 f 0.06 0.083.82 3.95 f 0.08 3.76 f 0.07
R. Kidney Absolute 0.904 f 0.025 0.871 f 0.029 0.861 f 0.034 0.893 f 0.028 0.898 0.026 Relative 3.84 f 0.09 3.65 f 0.06 3.66 2 0.08 3.89 2 0.07 3.69 f 0.08
Liver Absolute 8.373 f 0.232 8.249 f 0.249 8.653 2 0.319 8.119 ? 0.258 8.385 k 0.262 Relative 35.60 2 1.05 34.60 2 0.61 36.90 f 0.98 35.39 f 0.82 34.43 f 0.65
* Significantly different (PsO.05) from the control group by Williams' or Dunnett's test a Organ weights and body weights are given i n grams; organ-weight- to- ly-weig l~tratios are given as mg organ weight/g body weight
(mean f standard error). n=9

248 Tricresyl Phosphate, NTP TR 433
TABLEF6 Organ Weights and Organ-Weight-to-Body-WeightRatios for Rats at the 15-Month Interim Evaluation in the 2-Year Feed Study of Tricresyl Phosphatea
0 P P m 75 PPm 150 ppm 300 ppm 600 ppm
Male
n 10 10 10 10 10
Necropsy body wt 472 f 8 470 f 15 464 f 9 466 f 11 467 k 10
L. Adrenal Gland Absolute 0.026 f 0.001 0.028 f 0.001 0.026 f 0.001 0.025 k 0.002 0.026 f 0.001 Relative 0.06 f0.00 0.06 f 0.00 0.06 f 0.00 0.05 2 0.00 0.06 f 0.00
R. Adrenal Gland Absolute 0.027 f 0.001 0.027 f 0.001 0.024 f o.Oo0 0.025 f 0.001 0.026 f 0.001 Relative 0.06f 0.00 0.06 f 0.00 0.05 f 0.00 0.05 f 0.00 0.06 f 0.00
Brain Absolute 2.142 f 0.024 2.113 f 0.027 2.087 f 0.015 2.122 f 0.028 2.126 f 0.018 Relative 4.55 f 0.10 4.53f 0.14 4.51 f 0.07 4.57 f 0.09 4.57 f 0.08
L. Kidney Absolute 1.882 f 0.032 1.848 f 0.062 1.745 k 0.047 1.771 f 0.069 1.778 k 0.045 Relative 4.00 f 0.10 3.94 f 0.10 3.76 f0.06 3.80 f 0.12 3.82 k 0.10
R. Kidney Absolute 1.839 f0.034 1.790 f 0.052 1.736 f 0.053 1.754 2 0.061 1.795 2 0.034 Relative 3.91 f 0.11 3.82 f 0.10 3.74 f 0.06 3.77 f 0.10 3.85 f0.07
Liver Absolute 19.466f0.355 18.654 f 0.516 18.019 f 0.814 18.564 2 0.619 18.963 f 0.916 Relative 41.28 2 0.64 39.82 2 1.05 38.76f 1.37 39.95 2 1.31 40.74 f2.07
L. Testis Absolute 1.647f 0.056 1.761 f 0.146 1.688 f 0.090 1.835 2 0.114 1.717 k 0.092 Relative 3.51 f 0.16 3.76 f 0.30 3.63f 0.17 3.97 2 0.29 3.67 f0.17
R. Testis Absolute 1.583 f 0.033b 1.547f 0.039b 1.512 f 0.051 1.568 2 0.067 1.547 f 0.040 Relative 3.36 f 0.08b 3.32 f 0.12b 3.26 f 0.08 3.36 f 0.10 3.32 -C 0.09

Female
n 9 8 10 10 9
Necropsy body WI 274 2 8 314 2 9* 295 f 11 304 k 8 292 2 I
L. Adrenal Gland Absolute 0.0302 0.002 0.035 & 0.002 0.0302 0.003 0.034f 0.002 0.030 2 0.001 Relative 0.11 -c 0.01 0.11 2 0.00 0.10 * 0.01 0.11 f 0.01 0.10 f 0.00
R. Adrenal Gland Absolute 0.029 2 0.002 0.032 f 0.002 0.033 2 0.001. 0.032 f 0.001 0.029 2 0.001 Relative 0.10 f 0.01 0.10 -c 0.00 0.11 f 0.01 0.11 f 0.00 0.10 f0.00
Brain Absolute 1.892 f 0.030 1.924 2 0.014 1.873 f 0.015 1.910 f 0.017 1.932 f 0.029 Relative 6.96 f 0.22 6.16 2 0.W 6.42 2 0.24 6.31 f 0.14 6.64 f 0.13
L. Kidney Absolute 1.016 f 0.025 1.132 2 0.023* 1.040 2 0.031 1.098 +- 0.031 1.040 2 0.025 Relative 3.72 f 0.07 3.63 f 0.15 3.54 f 0.09 3.61 f 0.05 3.57 f 0.08
R. Kidney Absolute 1.010 f 0.024 1.104 f 0.021 1.022 2 0.035 1.073 f 0.032 1.056 5 0.024 Relative 3.70 f 0.04 3.53 2 0.11 3.48 2 0.11 3.53 2 0.05 3.62 -r- 0.06
Liver Absolute 9.024 f 0.465 11.022 f 0.445* 11.084 ? 0.568* 10.741 2 0.483’ 10.426 f 0.304 Relative 32.88 +- 1.12 35.27 -c 1.65 37.40 2 O S * 35.28 2 1.01 35.85 2 1.12
* Significantly different (PSO.05) from the control group by Williams’or Dunnett’s test a Organ weights and body weights are given i n grams; organ-weight-to-body-weightratios are given as mg organ weight/g body weight
(mean -r- standard error). n=9
249 Organ Weight Analyses
TABLEF6 Organ Weights and Organ-Weight-to-Body-WeightRatios for Rats at the 15-Month Interim Evaluation in the 2-Year Feed Study of Tricresyl Phosphate (continued)

250 Tricresyl Phosphate, NTP TR 433
TABLEF7 Organ Weights and Organ-Weight-to-Body-Weight Ratiosfor Mice in the 1CDay Gavage Study of Tricresyl Phosphatea
Vehicle Control 360 mdkg 730 mdkg 1,450 m d k 5,800 mgkg
Male
n 10 10 10 5 6
Necropsy body w t 27.4 f 0.3 27.9 f 0.3 27.8 f 0.6 24.5 f 0.6. 26.3 f 1.0.
Brain Absolute 0.4-36 f. 0.005 0.448 rt 0.017 0.457 f 0.008 0.447 f 0.006 0.451 f 0.015 Relative 15.93 f 0.22 16.08 rt 0.62 16.49 f 0.30 18.32 2 0.60. 17.28 f 0.92.
Heart Absolute 0.139 f 0.009 0.156 k 0.007 0.165 f 0.010 0.126 -c 0.007 0.132 f 0.014 Relative 5.07 f 0.29 5.60 2 0.25 5.89 f 0.24 5.17 2 0.27 4.98 f 0.41
R. Kidney Absolute 0.258 f. 0.010 0.265 f. 0.008 0.274 f 0.013 0.230 rt 0.008 0.241 f 0.014 Relative 9.40 f 0.31 9.48 ? 0.26 9.81 f 0.29 9.42 f 0.27 9.14 f 0.31
Liver Absolute 1.703 f 0.069 2.030 f 0.033'' 2.266 f 0.088'' 1.696 2 0.100 1.758 f 0.120 Relative 62.06 f 2.02 72.87 .c 1.25'' 81.42 f. 2.06'. 69.253.38'' 66.72 f 3.16'.
Lungs Absolute 0.221 f 0.008 0.259 f 0.011' 0.244 -C 0.010 0.217 2 0.014b 0.218 2 0.016 Relative 8.08 f 0.28 9.30 f 0.38 8.77 f 0.31 8.94 2 0.57b 8.36 f 0.73
R. Testis Absolute 0.090 f 0.006 0.103 f 0.006 0.102 f 0.004 0.094 f 0.004 0.098 f 0.009 Relative 3.29 f. 0.21 3.70 f. 0.21 3.65 f 0.13 3.86 f 0.20 3.76 f 0.35
Thymus Absolute 0.044 f 0.003 0.043 f 0.004 0.046 f 0.003 0.030 f 0.003' 0.032 f 0.002' Relative 1.60 f 0.08 1.52 k 0.16 1.68 k 0.11 1.22 k 0.14 1.20 f 0.04'

251 Organ Weight Analyses
TABLEF7 Organ Weights and Organ-Weight-to-Bodyweight Ratios for Mice in the 16-Day Gavage Study of Tricresyl Phosphate (continued)
Vehi :e Control 360 mdkg 730 mg/kg 5,800 mg/kg
Female
n 10 10 10 9
Necropsy body wt 20.8 2 0.3 22.6 2 0.3.. 24.3 2 0.4.. 23.3 2 0.4.'
Brain Absolute 0.452 f 0.008 0.466 f 0.009 0.450 2 0.006 0.465 f 0.011 Relative 21.81 f 0.41 20.66 2 0.23. 18.59 f 0.31.. 20.03 f 0.57..
Heart Absolute 0.130 f 0.009 0.129 f 0.008 0.119 f 0.005 0.117 2 0.005 Relative 6.23 f 0.38 5.72 f 0.32 4.90 f 0.19.' 5.00 f 0.20..
R. Kidney Absolute 0.186 f0.008 0.187 f 0.007 0.183 f 0.006 0.190 2 0.009 Relative 8.96 f 0.29 8.30 f 0.28 7.56 f 0.23" 8.16 f 0.28..
Liver Absolute 1.297 f 0.055 1.580 f 0.041" 1.936 f 0.054.. 1.926 k 0.069.. Relative 62.30 2 1.88 70.02 f 1.26'. 79.78 rt 1.89.' 82.64 rt 1.89..
Lungs Absolute 0.202 f 0.009 0.228 f 0.010 0.220 f 0.007 0.211 f 0.009 Relative 9.73 2 0.41 10.09 f 0.42 9.06 -c 0.26 9.10 -c 0.47
Thymus Absolute 0.061 f 0.003 0.060 0.049 rt 0.005.0.003 0.057 rt 0.004 Relative 2.94 2 0.15 2.66 f 0.11 2.36 2 0.16. 2.12 f 0.21..
* Significantly different (PSO.05) from the control group by Williams' or Dunnett's test *. PSO.01 a Organ weights and body weights are given i n grams: organ-weight-to-body-weight ratios are given as mg organ weight/g body weight
(mean 2 standard error). No measurements taken for females receiving 1.450 m g k g and males a n d females receiving 2,900 m@g due to 100% mortality. n=4

252 Tricresyl Phosphate, NTP TR 433
TABLEFS Organ Weights and Organ-Weight-to-Body-WeightRatios for Mice in the 13-Week Gavage Study of Tricresyl Phosphatea
Vehicle Control 50 mdkg 100 mg/kg 200 mdkg 400 mg/kg 800 mgkg
Male
n 10 10 10 10 10 10
Necropsy body wt 35.8 f 0.5 36.7 k 0.7 36.8 f 1.1 32.1 f LO** 32.4 rtr 0.4** 28.0 f OS**
Brain Absolute 0.457 f 0.003 0.457 f 0.006 0.4590.006 0.447 f 0.005 0.452 f 0.005 0.449 f0.007 Relative 12.77 f 0.18 12.50 f 0.25 12.56 f 0.32 14.03 2 0.41.. 13.99 f 0.19*. 16.04 f 0.21**
Heart Absolute 0.196 k 0.006 0.185 rt 0.006 0.180 f 0.005 0.167 r 0.006;' 0.163 k 0.004** 0.148 f 0.010'. Relative 5.50 f 0.20 5.05 k 0.19 5.03 f 0.124.93 f 0.21 5.23 f 0.24 5.25 +. 0.27
R. Kidney Absolute 0.305 f 0.005 0.312 k 0.009 0.318 k 0.005 0.278 f 0.006'. 0.275 f 0.007**0.262 f 0.008** Relative 8.51 f 0.16 8.71 rt 0.24 8.70 f 0.258.51 9.35 k 0.20..8.51 k 0.22 f 0.22
Liver Absolute 1.929 f 0.056 1.826 rt 0.051 2.105 k 0.067 1.666 f 0.046.. 2.013 f 0.034 1.752 f 0.046 Relative 53.92 f 1.62 49.78 & 1.10 57.68 rt 2.36 52.09 f 1.50 62.27 f 0.96** 62.49 f 0.76+*
Lungs Absolute 0.242 f 0.005 0.234 & 0.009 0.232 0.198 f 0.006..0.258 rt 0.011 0.223 f 0.008 f 0.009 Relative 6.77 rt 0.16 6.39 rtr 0.22 7.04 rt 0.30 7.18 7.09 f 0.246.98 k 0.29 f 0.34
L. Testis Absolute 0.1 19 k 0.002 0.123 2 0.002 0.120 * 0.002 0.115 f 0.002 0 . 1 1 1 k 0.002. 0.104 k 0.003** Relative 3.33 rt 0.07 3.36 f 0.06 3.30 & 0.12 3.45 f 0.083.62 f 0.11 3.72 f 0.09**
Thymus Absolute 0.029 f 0.003 0.037 -c 0.002 0.010 2 0.002* 0.030 2 0.003 0.035 f 0.002 0.030 2 0.002 Relative 0.81 rt 0.08 1.00 k 0.06 1.10 ? 0.06 0.95 f 0.11 1.09 f 0.06. 1.06 f 0.07.

253 Organ Weight Analyses
TABLEFS Organ Weights and Organ-Weight-to-Body-Weight Ratios for Mice in the 13-Week Gavage Study of Tricresyl Phosphate (continued)
Vehicle Control 50 m d k 100 mdkg 200 mdkg 400 m& 800 m&
Female
n 10 9 10 10 10 10
Necropsy body wt 26.7 & 0.7 26.4 -C 1.0 23.8 ? 0.4** 22.4 2 0.3.'27.5 f 0.7 25.6 2 0.4
Brain Absolute 0.478 t 0.006 0.464 & 0.005 0.465 f 0.006 0.471 2 0.004 0.469 f 0.006 0.468f0.006 Relative 17.97 t 0.48 17.03 t 0.30 16.94 2 0.35 18.40 2 0.25 19.73 2 0.33** 20.95 f 0.26**
Heart Absolute 0.124 t 0.003 0.128 5 0.001 0.127 f 0.005 0.123 f 0.003 0.115 2 0.004 0.120 f 0.006 Relative 4.66 t 0.10 4.68 ? 0.08 4.65 k 0.21 4.80 ? 0.13 4.81 f 0.10 5.36 2 0.24**
R.Kidney Absolute 0.189 2 0.006 0.192 t 0.003 0.182 2 0.004 0.177 f 0.006 0.174 2 0.006 0.183 2 0.005 Relative 7.08 f 0.15 7.03 2 0.11 6.63 f 0.13 6.89 f 0.17 7.28 rt 0.20 8.19 f 0.16**
Liver Absolute 1.376 i: 0.035 1.491 f 0.036 1.465 f 0.039 1.565 f 0.057" 1.583 f 0.034+* 1.531 2 0.049** Relative 51.58 i: 0.91 54.61 f 1.24 53.24 f 0.95 61.00 f 1.48** 66.43 -C 0.68** 68.39 f 1.46**
Lungs Absolute 0.215 f 0.007 0.216 f 0.012 0.209 & O . W b 0.206 f 0.007b 0.208 f 0.006 0.194 f 0.008 Relative 8.07 f 0.23 7.94 f 0.46 7.64 2 0.25b 8.05 f 0.24b8.74 2 0.26 8.67 2 0.30
Thymus Absolute 0.046 f 0.003 0.044 i: 0.003 0.042 i: 0.001 0.039 f 0.004 f 0.002 0.034f0.002**0.043 Relative 1.71 f 0.10 1.62 rt 0.10 1.53 rt 0.07 1.52 f 0.15 f 0.10 1.52 f0.091.83
* Significantly different (PSO.05) from the control group by Williams' or Dunnett's test * * PSO.01 a Organ weights and body weights are given i n grams; organ-weight-to-body-weight ratios are given as mg organ weight% body weight
(mean 2 standard error) n=9

254 Tricresyl Phosphate, NTP TR 433
TABLEF9 Organ Weights and Organ-Weight-to-fiody-WeightRatios for Mice in the 13-Week Feed Study of Tricresyl Phosphatea
Male
n 10 10 10 10 10 10
Necropsy body wt 31.2 f 1.0 32.3 f 0.9 31.2 f 0.8 31.6 It 1.0 29.7 It 0.6 25.6 f 0.3+*
Brain Absolute 0.463 f 0.006 0.467 f 0.007 0.471 -t 0.009 0.462 -c 0.007 0.459 f 0.006 0.474 f 0.007 Relative 15.00 rf: 0.51 14.57 f 0.48 15.15 f 0.33 14.74 k 0.40 15.50 k 0.34 18.52 f 0.29;'
Heart Absolute 0.170 2 0.005 0.165 k 0.008 0.170 2 0.011 0.165 rt 0.006 0.150 2 0.005 0.134 2 0.006** Relative 5.50 f 0.24 5.13 f 0.27 5.43 f 0.30 5.23 f 0.18 5.04 f 0.15 5.22 f 0.21
R. Kidney Absolute 0.529 f 0.017 0.529 f 0.011 0.523 f 0.018 0.518 f. 0.015 0.518 f. 0.013 0.454 k 0.012** Relative 17.03 2 0.45 16.47 f 0.52 16.77 k 0.41 16.44 f 0.34 17.47 2 0.49 17.72 +. 0.40
Liver Absolute 1.389 f 0.037 1.453 5 0.046 1.423 +- 0.045 1.474 f 0.056 1.447 k 0.056 1.306 f 0.026 Relative 44.68 2 0.61 44.99 f 0.89 45.63 f 0.92 46.76 f. 1.26 48.68 f 1.67; 51.04 f 0.80'.
Lungs Absolute 0.231 f 0.010 0.239 rt 0.010 0.226 f 0.008 0.223 f 0.008 0.218 f 0.010 0.216 f 0.013 Relative 7.47 f 0.42 7.42 f 0.33 7.25 f 0.16 7.08 f 0.26 7.33 f 0.23 8.41 f 0.45
R. Testis Absolute 0.119 f 0.002 0.123 rt 0.004 0.114 f 0.002 0.114 2 0.003 0.110 k 0.002 0.105 -t 0.004** Relative 3.83 f 0.09 3.81 f 0.12 3.66 f 0.08 3.62 f 0.09 3.72 rf: 0.05 4.09 f 0.15
Thymus Absolute 0.042 f 0.003 0.041 f 0.004 0.044 f 0.003 0.042 f 0.002 0.039 rf: 0.003 0.037 f 0.002 Relative 1.34 rt 0.08 1.28 2 0.10 1.40 2 0.10 1.35 f 0.07 1.33 2 0.12 1.43 2 0.06

255 Organ Weight Analyses
TABLEF9 Organ Weights and Organ-Weight-to-Body-Weight Ratios for Mice in the 13-Week Feed Study of Tricresyl Phosphate (continued)
Female
n 10 10 10 10 10 10
Necropsy body wt 28.3 f 0.1 21.5 f 0.7 27.4 2 0.7 26.9 f 0.8 24.2 2 0.5.' 22.6 -c 0.3..
Brain Absolute 0.483 f 0.006 0.463 & 0.006 0.473 f 0.008 0.469 f 0.005 0.484 f 0.010 0.498 k 0.014 Relative 17.24 f 0.59 16.94 & 0.52 17.40 f 0.57 17.53 & 0.42 20.07 f 0.49.. 22.07 k 0.78..
Heart Absolute 0.169 k 0.005 0.141 f 0.007 0.165 f 0.009 0.145 f 0.005'0.145 f 0.006' 0.133 2 0.008'* Relative 6.06 & 0.28 0.33 5.41 f 0.186.03 0.295.16 f 6.04 & 0.36 f 5.87 f 0.35
R.Kidney Absolute 0.358 5 0.006 0.355 f 0.006 0.353 f 0.006 0.365 f 0.010 0.342 f 0.007 0.330 f 0.008. Relative 12.75 2 0.38 12.95 5 0.26 12.96 f 0.31 13.56 2 0.25 14.17 5 0.25" 14.61 2 0.33..
Liver Absolute 1.334 f 0.041 1.328 f 0.034 1.3M f 0.039 1.338 f 0.042 1.351 & 0.037 1.309 f 0.028 Relative 47.34 f 1.07 48.48 f 1.44 50.07 & 1.47 49.73 f 0.89 55.91 f 1.34.. 57.90 f 0.98**
Lungs Absolute 0.269 f 0.012 0.228 f 0.013 0.267 f 0.021 0.250 -c 0.013 0.265 f 0.015 0.238 & O.OISb Relative 9.53 f 0.36 8.34 f 0.57 9.75 f 0.47 10.45 f O S b0.70 9.32 f 11.00 f 0.66
Thymus Absolute 0.054 f 0.003 0.051 f 0.002 0.052 5 0.0020.052 0.0510.050 & 0.003 f. 0.003 e 0.004 Relative 1.90 a 0.08 1.86 a 0.12 2.16 2 0.141.86 2 0.15 1.94 2 0.07 2.25 2 0.16
* Significantly different (PaO.05) from the control group by Williams' or Dunnett's test ** PS0.01 a Organ weights and body weights are given i n grams: organ-weight-to-body-weight ratios are given as m g organ weight/g body weight
(mean f standard error). n = 9

256 Tricresyl Phosphate, NTP TR 433
TABLEF10 Organ Weights and Organ-Weight-to-Body-Weight Ratios for Mice at the 3-Month Interim Evaluation in the 2-Year Feed Study of Tricresyl Phosphatea
Male
n 8 10 10 10
Necropsy body wt 31.9 f 0.7 30.5 f 0.5 30.7 f 0.9 31.5 f 1.5
Relative Absolute
L. Adrenal Gland
Relative Absolute
R. Adrenal Gland
Relative Absolute
Relative Absolute
Relative Absolute
Relative Absolute
Relative Absolute
Relative Absolute
B r a i n
L. Kidney
R. Kidney
Liver
L. Testis
R. Testis
0.12.f 0.01 0.004 f 0.000
0.10 f 0.02 0.003 ? 0.001
14.53 f 0.27 0.462 f 0.004
8.61 f 0.32 0.274 -t 0.009
0.290 f 0.010 9.13 2 0.38
42.73 f 1.22 1.360 f 0.042
3.54 f 0.11 0.112 f 0.003
0.114 r?: 0.002 3.60 f 0.10
0.003 f O.OOOb 0.11 f O.Olb
0.10 f 0.01 0.003 f O.OO0
14.76 f 0.32 0.448 f 0.004
8.82 f 0.14 0.268 -t 0.004
0.279 f 0.005 9.18 f 0.21
46.50 r?: O S * 1.417 f 0.033
3.61 r?: 0.09 0.109 f 0.001
3.73 k 0.10 0.113 k 0.003
0.16 f 0.02 0.005 f 0.001
0.13 f 0.01 0.0042 o.OO0
14.57 f 0.36 0.444 +. 0.004
8.68 r?: 0.24 0.266 f 0.010
9.19 +. 0.18 0.282 2 0.010
46.50 2 0.91* 1.427 ? 0.057
3.51 f 0.06 0.108 2 0.003
3.55 f 0.09 0 . 1 0 8 k 0.003
0.14 k 0.01 0.004 f O.OO0
0.14 2 0.02 0.004 2 0.001
14.61 k 0.61 0.452 f 0.007
8.49 f 0.27 0.264 2 0.007
9.11 f 0.25 0.284 2 0.010
45.35 f 0.99 1.431 f 0.080
3.47 +- 0.15 0.108 f0.004
3.50 f 0.16 0.109 f 0.004

257 Organ Weight Analyses
TABLEF10 Organ Weights and Organ-Weight-to-Body-WeightRatios for Mice at the 3-Month Interim Evaluation in the 2-Year Feed Study of Tricresyl Phosphate (continued)
Female
n 10 10 10- 10
Necropsy body wt 29.1 rt 1.1 29.8 f 1.0 29.7 f 0.8 28.0 f 0.9
L. Adrenal Gland Absolute 0.007 f 0.001 0.007 f O.OO0 0.006 2 o.Oo0 0.007 * o.Oo0 Relative 0.24 f 0.02 0.22 2 0.02 0.22 2 0.02 0.24 -c 0.02
R. Adrenal Gland Absolute 0.005 rt o.Oo0 0.006 f 0.001 0.006rt o.oO0 0.006* o.oO0 Relative 0.18 f 0.01 0.21 f 0.02 0.22 rt 0.02 0.21 2 0.01
Brain Absolute 0.470 f 0.006 0.472 f 0.005 0.469 rt 0.004 0.462 f 0.005 Relative 16.36 f 0.62 15.94 2 0.40 15.90 & 0.48 16.65 f 0.50
L. Kidney Absolute 0.189 2 0.005 0.184 f 0.003 0.199 rt 0.007 0.184 f 0.004 Relative 6.56 f 0.20 6.21 2 0.17 6.75 f 0.31 6.59 f 0.17
R. Kidney Absolute 0.200 f 0.006 0.201 f 0.003 0.203 rt 0.004 0.199 f0.006 Relative 6.93 f 0.19 0.22 6.88 2 0.236.79 7.12 rt 0.17
Liver Absolute 1.313 f 0.037 1.380 4 0.029 1.396 tt 0.047 1.307 -e 0,047 Relative 45.49 f 1.35 46.58 f 1.30 47.04 f 1.24 46.83 f 1.39
* Significantly different (PsO.05) from the control group by Williams’ or Dunnett’s test a Organ weights and body weights are given in grams; organ-weight-to-body-weight ratios are given as mg organ weight/g body weight
(mean r standard error). n=9

258 Tricresyl Phosphate, NTP TR 433
TABLEFl1 Organ Weights and Organ-Weight-to-Body-Weight Ratios for Mice at the 9-Month Interim Evaluation in the 2-Year Feed Study of Tricresyl Phosphatea
60 PP" 125 ppm 250 ppm
Male
n 10 10 10 10
Necropsy body wt 41.4 f 1.2 38.2 f 1.3 41.3 f 1.2 42.0 f 1.3
L. Adrenal Gland Absolute 0.003 ? O.OO0 0.003 f O.OO0 0.003 f O.OO0 0.003 ? O.OO0 Relative 0.06 2 0.01 0.08 ? 0.01 0.06 f 0.01 0.06 f 0.01
R. Adrenal Gland Absolute 0.002 f 0.000 0.002 f 0.000 0.002 f o.oO0 0.003 f O.OO0 Relative 0.05 & 0.00 0.07 f 0.01 0.05 f 0.01 0.07 f 0.01
Brain Absolute 0.445 & 0.005 0.454 f 0.008 0.461 f 0.009 0.466 f0.009 Relative 10.84 k 0.29 12.00 f 0.42 11.25 f 0.41 11.22 f 0.49
L. Kidney Absolute 0.313 & 0.010 0.308.5 0.012 0.331 f 0.011 0.326 f 0.010 Relative 7.60 k 0.23 8.08 f 0.25 8.06 f 0.31 7.80 f 0.25
R. Kidney Absolute 0.331 k 0.007 0.324 f 0.012 0.352 f 0.011 0.340 f 0.009 Relative 8.03 2 0.20 8.51 f 0.25 8.55 & 0.28 8.14 ? 0.27
Liver Absolute 1.712 f 0.091 1.160 f 0.098 1.793 rt 0.040 1.779 f 0.085 Relative 41.24 rf: 1.25 43.25 rf: 1.51 43.60 & 1.10 42.24 f 1.03
L. Testis Absolute 0.108 f 0.003 0.106 rf: 0.007 0.115 & 0.005 0.113 2 0.004 Relative 2.63 rf: 0.06 2.76 f 0.16 2.79 k 0.11 2.72 f 0.12
R. Testis Absolute 0.111 f 0.003 0.107 f 0.007 0.119 rt 0.004 0.118 f 0.004 Relative 2.69 f 0.07 2.81 f 0.17 2.88 rt 0.10 2.83 f 0.15
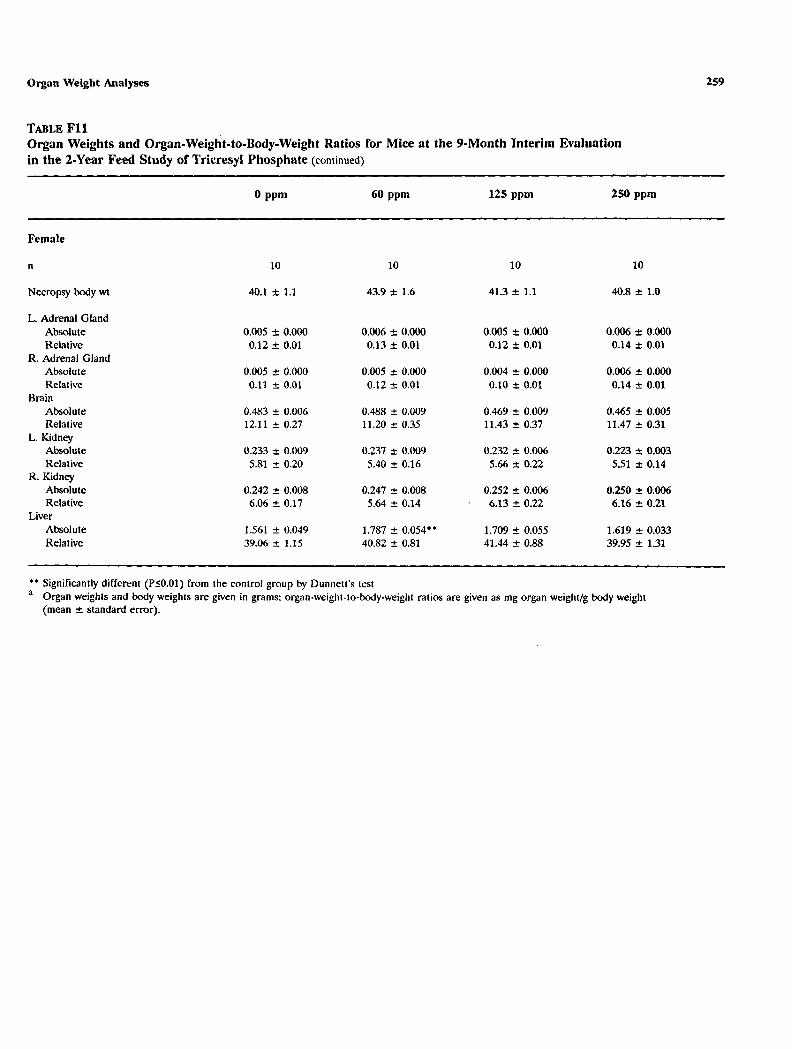
259 Organ Weight Analyses
TABLEFl1 Organ Weights and Organ-Weight-to-Body-Weight Ratios for Mice at the 9-Month Interim Evaluation in the 2-Year Feed Study of Tricresyl Phosphate (continued)
0 PPm 60 PPm 125 ppm 250 ppm
Female
n 10 10 10 10
Necropsy body wt 40.1 -+ 1.1 43.9 2 1.6 41.3 f 1.1 40.8 * 1.0
L. Adrenal Gland Absolute 0.005 f o.Oo0 0.006 5 o.Oo0 0.005 f o.Oo0 0.006 -c o.Oo0 Relative 0.12 f 0.01 0.13 f 0.01 0.12 f 0.01 0.14 f 0.01
R. Adrenal Gland Absolute 0.005 f 0.000 0.005 f 0.000 0.004 f 0.000 0.006 f o.oO0 Relative 0.11 2 0.01 0.12 f 0.01 0.10 f 0.01 0.14 f 0.01
Brain Absolute 0.483 f 0.006 0.488 f 0.009 0.469 f 0.009 0.465 2 0.005 Relative 12.11 f 0.27 11.20 & 0.35 11.43 f 0.37 11.47 2 0.31
L. Kidney Absolute 0.233 rc_ 0.009 0.237 f 0.009 0.232 t 0.006 0.223 -c 0.003 Relative 5.81 f 0.20 5.40 f 0.16 5.66 f 0.22 5.51 f 0.14
R.Kidney Absolute 0.242 f 0.008 0.247 f 0.008 0.252 -+ 0.006 0.250 f 0.006 Relative 6.06 f 0.17 5.64 f 0.14 6.13 5 0.22 6.160.21
Liver Absolute 1.561 f 0.049 1.787 2 0.054.' 1.709 2 0.055 1.619 f 0.033 Relative 39.06 f 1.15 40.82 f 0.81 41.44 f 0.88 39.95 f 1.31
* * Significantly different (PSO.01) from the control group by Dunnett's t e s t a Organ weights and body weights are given i n grams; organ-weight-to-by-weight ratios are given as mg organ weight/g body weight
(mean f standard error).

260 Tricresyl Phosphate, NTP TR 4JJ
TABLE F12 Organ Weights and Organ-Weight-to-Body-Weight Ratios for Mice at the 1S-Month Interim Evaluation in the 2-Year Feed Study of Tricresyl Phosphatea
o ppm 60 ppm 125 ppm 250 ppm
Male
n
Necropsy body wt
L. Adrenal Gland Absolute Relative
R. Adrenal Gland Absolute Relative
Brain Absolute Relative
L. Kidney Absolute Relative
R. Kidney Absolute Relative
Liver Absolute Relative
L. Testis Absolute Relative
R. Testis Absolute Relative
10
46.7 ± 0.9
0.003 ± 0.000 0.07 ± 0.01
0.003 ± 0.000 0.06 ± 0.01
0.436 ± 0.006 9.37 ± 0.17
0.356 ± 0.013 7.61 ± 0.16
0.384 ± 0.014 8.20 ± 0.17
2.029 ± 0.085 43.44 ± 1.44
0.102 ± 0.004 2.18 ± 0.08
0.106 ± 0.004 2.26 ± 0.07
10
46.6 ± 1.3
0.003 ± 0.000 0.06 ± 0.01
0.003 ± 0.000 0.06 ± om
0.453 ± 0.004 9.78 ± 0.31
0.365 ± 0.011 7.86 ± 0.25
0.379 ± 0.010 8.15 ± 0.17
2.085 ± 0.179 44.32 ± 2.84
0.112 ± 0.003 2.41 ± 0.09
0.110 ± 0.003 2.36 ± 0.09
10
45.7 ± 1.4
0.003 ± 0.000 0.07 ± 0.01
0.003 ± 0.000 0.07 ± 0.00
0.443 ± 0.005 9.76 ± 0.24
0.359 ± 0.010 7.87 ± 0.14
0.382 ± 0.011 8.37 ± 0.12
2.179 ± 0.193 47.40 ± 3.55
0.109 ± 0.003 2.39 ± 0.06
0.108 ± 0.003 2.37 ± 0.08
10
49.2 ± 1.2
0.002 ± 0.000· 0.05 ± 0.00·
0.002 ± 0.000 0.05 ± 0.01
0.466 ± 0.003" 9.51 ± 0.24
0.353 ± 0.011 7.18 ± 0.14
0.379 ± 0.013 7.69 ± 0.14·
2.141 ± 0.118 43.25 ± 1.59
0.112 ± 0.002 2.28 ± 0.03
0.113 ± 0.002 2.30 ± 0.04

261 Organ Weight Analyses
TABLEF12 Organ Weights and Organ-Weight-to-Bodyweight Ratios for Mice at the 15-Month Interim Evaluation in the &Year Feed Study of Tricresyl Phosphate (continued)
0 PPm 60 PPm 125 ppm 250 ppm
Female
n 10 10 10 9
Necropsy body wt 48.7 f 1.9 49.2 f 1.8 49.3 f 1.9 49.6 2 2.4
L. Adrenal Gland Absolute 0.005 f O.OO0 0.005 1 0.000 0.005 f O.OO0 0.007 f O.OOO.* Relative 0.10 f 0.01 0.11 1 0.01 0.11 f 0.01 0.14 * 0.01.
R. Adrenal Gland Absolute 0.004 2 0.000 0.006 jr. 0.000 0.005 f 0.000 0.006 f 0.001** Relative 0.09 2 0.01 0.12f 0.01 0.11 f 0.01 0.13 f 0.02.
Brain Absolute 0.465 f 0.006 0.459 2 0.005 0.4762 0.008 0.4692 0.00s Relative 9.67 f 0.34 9.43 2 0.33 9.77 ? 0.34 9.62 2 0.40
L.Kidney Absolute 0.275 f 0.006 0.252 rt 0.006. 0.263 f 0.004 0.257 k 0.009 Relative 5.72 f 0.24 5.16 5.41 f 0.23 5.23 f 0.160.16
R.Kidney Absolute 0.282 f 0.008 0.265 +: 0.006 0.279 f 0.005 0.279 f0.009 Relative 5.86 f 0.25 5.43 2 0.17 5.73 k 0.26 5.70 f 0.24
Liver Absolute 1.743 ? 0.038 1.794 f 0.054 1.7750.048 1.801 & 0.077 Relative 36.27 2 1.62 36.64 k 0.98 36.21 2 1.14 36.80 k 2.01
l Significantly different (PSO.05) from the control group by Williams‘ or Dunnett’s test * * PSO.01 a Organ weights and body weights are given in grams; organ-weight-to-body-weight ratios are given as mg organ weight/g body weight
(mean f standard error).

263
APPENDIX G HEMATOLOGY AND CLINICAL CHEMISTRY RESULTS
TABLE G1
TABLE G2
TABLEG3
TABLE G4
TABLEG5
TABLE G6
TABLE G7
TABLEG 8
TABLE G9
TABLE G10
Hematology and Clinical Chemistry Data for Rats in the 13-Week Gavage Study of Tricresyl Phosphate .......................... 264 I-Iematology and Clinical Chemistry Data for Rats in the 13-Week Feed Study of Tricresyl Phosphate ............................ 265 Hematology and Clinical Chemistry Data for Rats at the 3-Month Interim Evaluation in the 2-Year Feed Study of Tricresyl Phosphate ................................................. 266 Ilematology and Clinical Chemistry Data for Rats at the 9-Month Interim Evaluation in the 2-Year Feed Study of Tricresyl Phosphate ................................................. 267 IIematology and Clinical Chemistry Data for Rats at the 15-Month Interim Evaluation in the 2-Year Feed Study of Tricresyl Phosphate ................................................. 268 Hematology and Clinical Chemistry Data for Mice in the 13-Week Gavage Study of l'ricresyl Phosphate .......................... 269 IIematolog and Clinical Chemistry Data for Mice in the 13-Week Feed Study of Tricresyl Phosphate ............................ 270 Hematology and Clinical Chemistry Data for Mice at the 3-Month Interim Evaluation in the 2-Year Feed Study of Tricresyl Phosphate ................................................. 271 Hematology and Clinical Chemistry Data for Mice at the 9-Month Interim Evaluation in the 2-Year Feed Study of Tricresyl Phosphate . . . . . . . . . . . . . . . . . . . . . . . . . . . . . . . . . . . . . . . . . . . . . . . . . 272 IIematology and Clinical Chemistry Data for Mice at the 15-Month Interim Evaluation in the 2-Year Feed Study of Tricresyl Phosphate ................................................. 273

264 Tricresyl Phosphate, NTP TR 433
TABLEG l Hematology and Clinical Chemistry Data for Rats in the 1IWeek Gavage Study of Tricresyl Phosphatea
Vehicle Control 100 mdkg 200 mdkg 400 msntg 800 mgkg
Male n 10 1 0 10 10 10 10
Hematology
Hematocrit (%) 46.7 f 0.6 47.9 f 0.5 46.3 f 0.9 46.3 f 0.3 44.8 f O S * 44.1 f 0.7. Hemoglobin (g/dL) 16.1 2 0.2 16.2 f 0.2 15.7 f 0.3 16.1 f 0.1 15.2 f 0.2.. 15.0 f 0.3.. Erythrocytes (106/pL) 9.84 f 0.09 9.95 f 0.09 9.64 f 0.19 9.74 f 0.05 9.32 f O M + . 9.25 f 0.20.. Mean cell volume (a) 47.3 f 0.3 47.8 f 0.3 48.2 f 0.2 47.5 f 0.3 48.1 f 0.2 48.0 f 0.4 Mean cell hemoglobin (pg) 16.3 f 0.1 16.3 f 0.1 16.3 f 0.1 16.5 f 0.1 16.3 2 0.1 16.2 f 0.1 Mean cell hemoglobin
concentration ("L) 34.4 f 0.3 33.8 f 0.3 33.9 f 0.2 34.7 f 0.3 33.9 f 0.3 34.0 f 0.2 platelets ( 1 0 ~ 1 ~ ~ ) 468.3 f 37.1 468.1 f 32.5 473.4 f 14.2 500.8 f 21.1 529.8 f 10.7 542.6 f 40.9 Leukocytes ( ~ o ~ / ~ L ) 9.12 f 0.28 9.16 f 0.81 8.04 f 0.36 10.01 f 0.35 8.12 f 0.24 8.36 2 0.32 Segmented neutrophils
(103/p~) 1.13 f 0.16 1.26 f 0.27 1.05 f 0.08 1.36 f 0.15 1.14 f 0.09 1.37 2 0.13 Lymphocytes (103/pL) 7.62 f 0.21 7.M f 0.58 6.72 f 0.30. 8.38 f 0.34 6.76 f 0.20. 6.71 +. 0.28. Monocytes (103/bL) 0.21 f 0.04 0.11 f 0.03 0.15 f 0.03 0.10 f 0.03 0.16 2 0.04 0.18 0.06 Eosinophils (103/bL) 0.14 f 0.04 0.13 f 0.04 0.12 2 0.03 0.16 2 0.06 0.06 2 0.02 0.09 f 0.03 Nucleated erythrocytes
( 1 0 ~ 1 ~ ~ ) 0.05 f 0.02 0.02 f 0.01 0.07 f 0.04 0.07 f 0.02 k 0.030.06 f 0.02 0.09
Clinical Chemistry
Cholinesterase (IU/L) 593.5 f 21.0 349.0 f 8.2'. 304.3 f 5.5** 261.6 f 6.9" 237.0 f 10.4..188.9 rt 7.2**
Female n 10 10 10 10 10 10 Hematology
Hematocrit (%) 46.2 f 0.8 46.3 f 0.6 46.7 f 0.7 44.5 f 0.6 45.7 f 0.6 44.6 2 0.5 Hemoglobin (g/dL) 15.5 f 0.2 15.4 f 0.2 15.4 f 0.1 14.8 f 0.2** 15.0 f 0.2. 14.7 2 0.2*' Erythrocytes (106/pL) 8.71 f 0.10 8.79 f 0.10 8.82 f 0.07 8.43 -+ 0.07. 8.61 f 0.07 8.58 f 0.06 Mean cell volume ( I L ) 53.1 2 0.5 52.9 f 0.6 53.0 2 0.5 53.0 f 0.5 53.1 & 0.4 52.1 f 0.5 Mean cell hemoglobin (pg) 17.8 f 0.1 17.5 f 0.1 17.5 f 0.1 17.6 f 0.1 17.4 k O.l* 17.2 f 0.1.. Mean cell hemoglobin
concentration (g/dL) 33.6 f 0.4 33.2 f 0.4 33.1 f 0.4 33.3 f 0.4 32.8 k 0.3 33.0 f 0.3 platelets (103/p~) 486.1 f 13.3 438.6 f 20.6 447.8 f 24.4 370.8 & 21.5.' 432.8 & 35.5 425.6 f 36.0 Leukocytes ( ~ o ~ / ~ L ) 9.01 f 0.44 8.09 f 0.43 8.74 f 0.34 8.58 & 0.33 8.83 k 0.66 9.46 f 0.28 Segmented' neutrophils
(~o~ /KL) 1.65 f 0.20 1.19 f 0.17 1.37 f 0.18 1.22 2 0.19 1.37 2 0.14 1.55 f 0.23 Lymphocytes (103/bL) 7.02 f 0.31 6.76 f 0.41 7.22 f 0.19 7.09 & 0.37 7.13 f 0.49 7.63 2 0.25 Monocytes (103/bL) 0.16 f 0.03 0.07 f 0.03 0.09 f 0.04 0.10 rt 0.04 0.13 f 0.03 0.14 f 0.02 Eosinophils (103/bL) 0.17 f 0.04 0.07 f 0.03 0.07 f 0.02 0.09 f 0.03 0.07 f 0.02 0.13 f 0.03 Nucleated elythrocytes
( 1 0 ~ 1 ~ ~ ) 0.16 f 0.04 0.05 f 0.02 0.10 f 0.04 0 . 1 0 0.03 0.08 f 0.04 0.06 f 0.02
Clinical Chemistry
Cholinesterase (IU/L) 2,785 f 128 882 f 45** 594 f 18*. 287 f 7** 243 f 11.. 166 f 6..
. Significantly different (PsO.05) f r o m the control group by Dunn's or Shirley's test ..PSO.01 a Mean f standard error
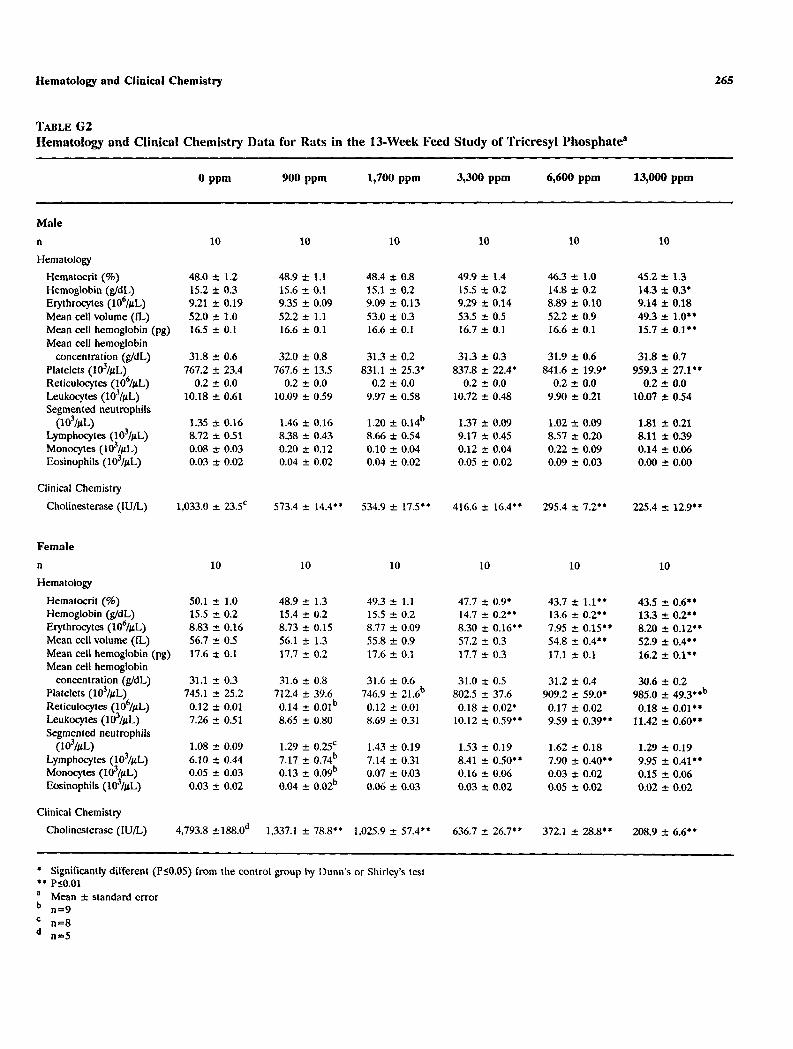
265 €Iematoiogy and Clinicnl Chemistry
TABLEG2 1.Iematology and Clinical Chemistry Data for Rats in the 13-Week Feed Study of Tricresyl Phosphatea
0 PPm 900 ppm 1,700 ppm 3,300 ppm 6,600 ppm 13,000 ppm
Male n 10 10 10 10 10 10
Hematology Hematocrit (%) 48.0 f 1.2 48.9 f 1.1 48.4 f 0.8 49.9 f 1.4 46.3 f 1.0 45.2 f 1.3 Hemoglobin (g/dL) 15.2 f 0.3 15.6 f 0.1 15.1 f 0.2 15.5 f 0.2 14.8 f 0.2 14.3 f 0.3'
Mean cell volume (E)Erythrocytes (106/pL)
52.0 f 1.0 9.21 f 0.19
52.2 f 1.1 9.35 f 0.09
53.0 f 0.3 9.09 f 0.13 9.29 f 0.14
53.5 f 0.5 8.89 2 0.10 52.2 f 0.9 49.3 f 1.0..
9.14 f 0.18
Mean c e l l hemoglobin (pg) 16.5 f 0.1 16.6 f 0.1 16.6 f 0.1 16.7 k 0.1 16.6 f 0.1 15.7 k 0.1.' Mean c e l l hemoglobin
concentration ("L) 31.8 f 0.6 32.0 f 0.8 31.3 f 0.2 31.3 f 0.3 31.9 f 0.6 31.8 ? 0.7 Platelets ( ~ o ~ / ~ L ) 767.2 f 23.4 767.6 f 13.5 831.1 f 25.3' 837.8 k 22.4. 841.6 f 19.9' 959.3 f 27.1" Reticulocytes (106/pL) 0.2 f 0.0 0.2 f 0.0 0.2 f 0.0 0.2 f 0.0 0.2 f 0.0 0.2 2 0.0 Leukocytes (103/pL) 10.18 f 0.61 10.09 f 0.59 9.97 f 0.58 10.72 f 0.48 9.90 f 0.21 10.07 f 0.54 Segmented neutrophils
Lymphocytes (103/pL) (103/p~)
8.72 f 0.51 1.35 f 0.16
8.38 f 0.43 1.460.16
8.66 f 0.54 1.20 f 0.14b 1.37 2 0.09
9.17 f 0.45 1.02 f 0.09 8.57 f 0.20 8.11 f 0.39
1.81 & 0.21
Monocytes (l$/pL) 0.08 f 0.03 0.20 f 0.12 0.10 f 0.04 0.12 f 0.04 0.22 f 0.09 0.14 2 0.06 Eosinophils (103/pL) 0.03 f 0.02 0.04 f 0.02 0.04 f 0.02 0.05 f 0.02 0.09 f 0.03 0.00 +. 0.00
Clinical Chemistry
Cholinesterase ( I U L ) 1,033.0 f 23.5'573.4 f 14.4;.534.9 f 17.5"' 416.6 f 16.4.;295.4 f 7.2.. 225.4 f 12.9..
Female n 10 10 10 10 10 10 Hematology
Hematocrit (%) 50.1 f 1.0 48.9 f 1.3 49.3 f 1.1 47.7 f 0.9; 43.7 f 1.1'. 43.5 f 0.6" Hemoglobin (g/dL) 15.5 f 0.2 15.4 f 0.2 15.5 f 0.2 14.7 f 0.2.; 13.6 f 0.2.. 13.3 f 0.2.; Erythrocytes (106/pL) 8.83 f 0.16 8.73 f 0.15 8.71 f 0.09 8.30 f 0.16" 7.95 f 0.15.' 8.20 f 0.12" Mean cell volume (fL) 56.7 f 0.5 56.1 f 1.3 55.8 f 0.9 57.2 f 0.3 54.8 f 0.4.. 52.9 f 0.4" Mean cell hemoglobin (pg) 17.6 f 0.1 17.7 f 0.2 17.6 f 0.1 17.7 f 0.3 17.1 f 0.1 16.2 f 0.1'+ Mean cell hemoglobin
concentration (g/dL) 31.1 f 0.3 31.6 2 0.8 31.6 2 0.6 31.0 2 0.5 31.2 2 0.4 30.6 f 0.2 Platelets (103/rct) 745.1 f 25.2 712.4 f 39.6 746.9 f 21.Gb 802.5 f 37.6 909.2 f 59.0* 985.0 f 49.3;*b Reticulocytes (106/pL) 0.12 f 0.01 0.14 f O.Olb 0.12 f 0.01 0.18 f 0.02' 0.17 & 0.02 0.18 f 0.01.. Leukocytes ( 1 0 ~ 1 ~ ~ ) 7.26 f 0.51 8.65 f 0.80 8.69 f 0.31 10.12 f 0.59.; 9.59 f 0.39" 11.42 k 0.60** Segmented neutrophils
(103/p~) 1.08 f 0.09 1.29 f 0.25' 1.43 2 0.19 1.53 f 0.19 1.62 f 0.18 1.29 f 0.19 Lymphocytes (103/pL) 6.10 f 0.44 7.17 2 0.74b 7.14 f 0.31 8.41 f 0.50.' 7.90 f 0.40" 9.95 f 0.41.' Monocytes ( 1 0 ~ 1 ~ ~ ) 0.05 -c 0.03 0.13 f 0.09b 0.07 f 0.03 0.16 f 0.06 0.03 2 0.02 0.15 IC_ 0.06 Eosinophils (103/pL) 0.03 f 0.02 0.04 f 0.02b 0.06 f 0.03 0.03 f 0.02 0.05 2 0.02 0.02 f 0.02
Clinical Chemistry
Cholinesterase ( I U L ) 4,793.8 f188.0d 1,337.1 f 78.8'.1,025.9 f 57.4"' 636.7 -c 26.7*'372.1 f 28.8'. 208.9 f 6.6.'
. Significantly different (PSO.05) from the control group by Dunn's or Shirley's test ' 4 PSO.01 a Mean k standard error
n=9 n = 8 n=5

266 Tricresyl Phosphate, NTP TR 433
TABLEC3 IIematology and Clinical Chemistry Data for Rats at the 3-Month Interim Evaluation in the 2-Year Feed Study of Tricresyl Phosphatea
0 PPrn 75 PPrn 150 pprn 300 pprn 600 pprn
Male n 10 9 10 9 10
Hematology Hematocrit (%) 50.6 f 0.5 49.9 f 0.8 47.5 f 1.4 49.2 f 0.3 48.4 f 0.8. Hemoglobin (g/dL) 15.5 f 0.2 15.3 f 0.2 14.9 f 0.4 15.4 f 0.2 15.1 f 0.3
Mean cell hemoglobin (pg) Mean cell volume (a)Erythrocytes (106/pL)
16.3 f 0.1 53.2 f 0.1 9.51 f 0.11
16.3 & 0.1 53.2 f 0.2 9.40 f 0.15
16.5 2 0.1 52.6 2 0.3 9.01 f 0.26
16.4 f 0.1 52.3 f 0.2** 9.40 f 0.05
16.3 f 0.2 52.3 f 0.3. 9.23 f 0.11
Mean cell hemoglobin concentration (g/dL) 30.7 f 0.2 30.7 f 0.1 31.4 * 0.3 31.3 f 0.2 31.1 * 0.4
Reticulocytes (106/pL) Platelets ( 1 0 ~ 1 ~ ~ )
0.2 f 0.0 500.8 2 34.7
0.2 f 0.0 533.9 f 9.0
0.2 f 0.0 477.4 f 60.1
0.2 f 0.0 543.8 f 11.8
0.2 * 0.0 467.7 f 39.2
Leukocytes ( ~ o ~ / ~ L ) 7.94 f 0.51 9.44 f 0.37 8.95 f 0.86 9.27 f 0.50 8.37 f 0.74 Segmented neutrophils (103/pL) 1.08 f 0.17 1.58 & 0.14 1.63 f 0.46 1.57 f 0.20 1.26 f 0.22 Lymphocytes (103/pL) 6.76 f 0.44 7.78 f 0.40 7.25 f 0.70 7.59 f 0.35 7.02 5 0.54 Monocytes (103/pL) 0.02 f 0.01 0.01 f 0.01 0.00 f 0.00 0.01 f 0.01 0.00 f 0.00 Eosinophils (103/~L) 0.07 f 0.02 0.07 2 0.02 0.07 f 0.04 0.10 f 0.03 0.09 f 0.03 Nucleated erythrocytes(I03/pL) 0.00 f 0.00 0.03 2 0.02 0.01 f 0.01 0.01 '' 0.01 0.00 f 0.00
Clinical Chemistry
Cholinesterase ( IUL) 814.4 f 29.1 773.2 f 35.4b 748.6 f 47.3 664.4 f 16.2**b 592.3 f 14.8.'
Female n 10 1 0 9 8 10
Hematology
Hematocrit (%) 49.6 f 0.7 50.3 f 0.7 48.7 f 0.4 49.9 f 0.7 49.3 f 0.8 Hemoglobin (g/dL) 15.3 f 0.2 15.7 f 0.2 15.0 f 0.1 15.6 f 0.2 15.6 f 0.2 Erythrocytes (106/pL) 8.71 & 0.14 8.87 f 0.13 8.52 f 0.08 8.79 2 0.10 8.76 f 0.11 Mean cell volume (L) 57.1 f 0.3 56.6 f 0.3 57.0 f 0.2 57.0 f 0.3 56.3 f 0.3 Mean cell hemoglobin (pg) 17.6 f. 0.1 17.7 f 0.1 17.6 f 0.1 17.8 f 0.1 17.8 f 0.1 Mean cell hemoglobin
concentration (g/dL) 30.9 f 0.2 31.2 f 0.2 30.9 f 0.2 31.2 f 0.3 31.6 2 0.2' Platelets ( 1 0 ~ 1 ~ ~ ) 517.1 5 23.8 491.6 f 3 8 . 1 526.8 f 15.2 554.1 f 14.2' 537.8 f 19Sd Reticulocytes (106/pL) 0.1 2 0.0 0.1 f 0.0 0.1 f 0.0 0.2 f 0.0 0.2 f 0.0 Leukocytes ( 1 0 ~ 1 ~ ~ ) 7.73 f 0.52 6.90 f 0.50 7.39 f 0.70 7.99 f 0.77 6.41 f 0.49 Segmented neutrophils (ld/pL) 1.14 f 0.11 1.03 f 0.10 1.18 f 0.20 1.48 f 0.23 1.16 f 0.18 Lymphocytes (103/pL) 6.50 2 0.48 5.80 f 0.43 6.13 f 0.58 6.46 f 0.66 5.21 2 0.34 Monocytes (103/pL) 0.01 2 0.01 0.01 f 0.01 0 .01 f 0.01 0.00 f 0.00 0.00 f 0.00 Eosinophils (103/pL) 0.08 f 0.03 0.06 f 0.02 0.07 f 0.02 0.05 f 0.01 0.04 2 0.02 Nucleated erythrocytes(103/pL) 0.01 2 0.01 0.01 '' 0.01 0.01 f 0.01 0.01 f 0.01 0.01 2 0.01
Clinical Chemistry Cholinesterase ( IUL) 3,860 2 222 4.059 f 122 2.970 f 157**b 2,521 f 140*"b 1.983 & 118**
* * PSO.01 l Significantly different (P10.05) from the control group by Dunn's or Shirley's test
a Mean f standard error
' n=10 n=7 n=9

Hematology and Clinical Chemistry 267
Hematology and Clinical Chemistry Data for Rats at the 9-Month Interim Evaluation TABLEG4
in the 2-Year Feed Study of Tricresyl Phosphatea
0 PPm 75 ppm 150 ppm 300 ppm 600 ppm
Male n 9 9 10 10 10
Hematology
Mean cell hemoglobin Mean cell hemoglobin (pg) Mean cell volume (a)Erythrocytes (106/pL) Hemoglobin ("L) Hematocrit (%)
Reticulocytes (106/pL) Platelets ( ~ o ~ / ~ L )
concentration (g/dL)
Nucleated erythrocytes (103/pL) Eosinophils (103/pL) Monocytes (lO'/pL) Lymphocytes (103/pL) Segmented neutrophils (103/pL) Leukocyte( 1 0 ~ 1 ~ ~ )
16.0 f 0.1 53.2 f 0.4 9.21 f 0.11 14.8 f 0.2 49.0 r+- 0.6
0.06 rc- 0.03 0.11 f 0.05 0.01 f 0.01 5.96 f 0.40 2.54 f 0.11 8.61 f 0.42 0.2 rc- 0.0
542.2 f 19.6 30.2 f 0.2
16.3 f 0.1 53.7 t 0.5 8.98 f 0.11 14.7 2 0.2 48.3 2 0.5
0.2 t 0.0 525.2 f 7.9 30.3 f 0.3
0.01 f 0.01 0.13 f 0.03 0.04 f 0.03 5.97 t 0.34 1.99 2 0.20 8.12 2 0.44
16.2 f 0.1 53.4 f 0.3 9.29 f 0.15 15.1 f 0.2 49.7 f 1.0
0.03 % 0.02 0.13 t 0.02 0.03 t 0.02 5.60 f 0.35 2.03 f 0.20 7.79 f 0.52 0.1 f 0.0
509.1 f 11.5 30.4 f 0.2
16.3 f 0.1 53.5 -c 0.3 9.24 f 0.13 15.0 f 0.2 49.4 r+- 0.9
0.01 f 0.01 0.16 It 0.03 0.06 rc- 0.04 5.53 f 0.29 2.33 f 0.33 8.08 f 0.35 0.2 f 0.0
535.9 f 13.6 30.5 f 0.3
16.2 k 0.1 53.6 f 0.4 9.20 f 0.09 14.9 2 0.1 49.4 2 0.6
0.2 f 0.0 516.5 f 6.2 30.3 f 0.2
0.01 f 0.01 0.14 f0.03 0.02 f 0.01 5.39 f 0.41 1.71 f0.18** 7.25 f 0.53
Clinical Chemistry
Cholinesterase (IU/L) 899.3 f 45.5 875.3 & 40.3 910.4 f 32.0 728.9 2 36.4' 915.5 f 35.8
Female n 10 10 10 10 10 Hematology
Mean cell hemoglobin Mean c e l l hemoglobin (pg) Mean cell volume (a)Erythrocytes (106/pL) Hemoglobin (g/dL) Hematocrit (%)
Nucleated erythrocytes (ld/pL) Eosinophils (103/pL) Monocytes (ld/pL) Lymphocytes (103/bL) Segmented neutrophils (lO'/pL) Leukocytes ( 1 0 3 / p ~ ) Reticulocytes (106/pL) Platelets (103/p~)
concentration (g/dL)
18.0 f 0.1 58.9 rt 0.2 8.11 f 0.09 14.6 f 0.1 47.7 t 0.6
0.02 f 0.01 0.07 f 0.02 0.00 f 0.00 3.70 f 0.26 1.33 f 0.12 5.10 f 0.30 0.1 f 0.0
511.9 f 16.8 30.6 2 0.1
18.0 f 0.1 58.8 f 0.1 8.29 f 0.06 15.0 f 0.1 48.7 2 0.4
0.2 & 0.0 500.2 f 9.9 30.7 f 0.1
0.00 2 0.00 0.06 2 0.02 0.00 rt 0.00 4.32 f 0.37 1.16 t 0.14 5.54 f 0.38
17.8 f 0.2 57.9 f 0.4' 8.32 f 0.06 14.8 f 0.2 48.2 '. 0.4
0.06 f 0.02 0.06 f 0.02 0.01 f 0.01 4.64 f 0.32 1.38 f 0.11 6.09 f 0.39 0.2 rc- 0.0.
515.7 f 12.3 30.8 2 0.2
17.9 rt 0.1 58.4 2 0.2* 8.32 rc- 0.10 14.9 f 0.1 48.6 f 0.5
0.02 f 0.02 0.07 f 0.02 0.00 rc- 0.00 4.11 f 0.24 0.96 rc- 0.09 5.13 f 0.30 0.2 f 0.0
487.3 f 12.7 30.6 2 0.2
18.0 f 0.1 58.3 f 0.3 8.31 f 0.09 14.9 & 0.2 48.3 2 0.5
0.00 f 0.00 0.07 f 0.04 0.01 2 0.01 4.13 f 0.29 1.30 f 0.21 5.51 rf: 0.37 0.1 -I- 0.0
526.0 k 14.3 30.9 t 0.2
Clinical Chemistry Cholinesterase ( I U L ) 4,348 rc- 196 3,890 f 159 2.803 t 249.*2,661 k 129** 4,376 rc- 269
* * PsO.01 * Significantly different (PsO.05) from the control group by Dunn's or Shirley's t e s t
a Mean f standard error. Animals in the 600 ppm group received dosed feed for 13weeks, after which theyreceivedcontroldiet.

268 Tricresyl Phosphate, NTP TR 433
TABLEG5 Hematology and Clinical Chemistry Data for Rats at the 15-Month Interim Evaluation in the 2-Year Feed Study of Tricresyl Phosphatea
0 PPm 75 PPm 150 ppm 300 PP* 600 ppm
Male n 10 10 10 10 10
Hematology
Hematocrit (%) 47.7 2 1.0 48.5 f 0.9 48.5 & 0.7 49.4 f 0.6 47.3 f 0.7 Hemoglobin (g/dL) 14.5 rt 0.3 14.7 f 0.3 14.6 f 0.2 15.0 k 0.2 14.3 f 0.3 Erythrocytes (106/~L) 8.76 rt 0.11 8.84 r?: 0.16 8.80 f 0.13 8.87 f 0.11 8.57 f 0.18 Mean cell volume (L) 54.2 2 0.6 54.9 f 0.6 54.9 f 0.5 55.8 f 0.4 55.3 f 0.8 Mean cell hemoglobin (pg) 16.5 k 0.2 16.6 f 0.2 16.6 f 0.1 16.9 k 0.1 16.7 +. 0.3 Mean cell hemoglobin
concentration (g/dL) 30.3 k 0.2 30.3 f 0.3 30.2 f 0.3 30.3 f 0.3 30.2 z t 0.3 Platelets ( 1 0 ~ 1 ~ ~ ) 656.2 f 53.2 653.6 f 31.2 641.6 f 19.5 594.6 f 24.7 584.3 rt 27.9 Reticulocytes (106/pL) 0.2 k 0.0 0.2 f 0.0 0.2 f 0.0 0.2 f 0.0 0.2 & 0.ob Leukocytes( 1 0 ~ 1 ~ ~ ) 7.02 f 0.31 7.00 f 0.62 6.85 f 0.42 7.11 f 0.63 7.33 -t 0.55 Segmented neutrophils (103/pL) 2.59 f 0.29 2.69 f 0.32 2.19 f 0.24 2.64 f 0.34 2.26 2 0.27 Lymphocytes (1dlpL) Monocytes (103/pL)
4.35 f 0.28 0.01 f 0.01
4.20 r?: 0.40 0.00 f 0.00
4.59 f 0.32 0.00 f 0.00
4.35 f 0.38 0.00 f 0.00
5.01 2 0.46 0.00 2 0.00
Eosinophils (103/pL) 0.08 f 0.02 0.10 f 0.03 0.07 f 0.02 0.12 f 0.04 0.062 0.02 Nucleated erythrocytes(103/pL) 0.01 f 0.01 0.02 & 0.01 0.01 f 0.01 0.02 f 0.01 0.02 2 0.01
Clinical Chemistry
Cholinesterase (IU/L) 1.038.7 f 59.6 1.036.2 2 71.7 1.004.8 2 27.0 847.2 f 32.0.. 1,083.2 f 84.6
Female n 9 8 10 10 9
Hematology Hematocrit (%) 49.5 f 0.7 47.4 2 0.6. 46.9 f 0.3" 47.0 f 0.5'. 47.6 f 0.6. Hemoglobin (g/dL) 15.6 f 0.2 14.9 f 0.1 14.9 2 O.l* 14.9 f 0.2 15.0 f 0.1 Erythrocytes (106/pL) Mean cell volume (a) Mean cell hemoglobin (pg)
8.48 f 0.11 58.4 f 0.4 18.3 f 0.1
8.04 f 0.08.. 58.9 f 0.4 18.5 f 0.1
8.22 & 0.04 57.0 rt 0.5 18.1 k 0.1
8.24 f 0.07 57.0 f 0.6 18.1 f 0.2
8.13 f 0.08 58.7 f 0.3 18.5 f 0.1
Mean cell hemoglobin concentration ("L) 31.4 f 0.2 31.5 f 0.3 31.7 k 0.2 31.7 f 0.2 31.5 f 0.3
platelets ( 1 0 ~ 1 ~ ~ ) 505.7 k 12.6 531.6 k 14.6 516.4 2 9.7 489.1 k 22.0 519.1 & 23.6 Reticulocytes (106/pL) 0.2 & 0.0 0.2 f 0.0 0.2 rt 0.0 0.2 f 0.0 0.2 f 0.0 hulrocytes (103jp~) 4.31 k 0.38 3.84 f 0.26 5.29 f 0.56 4.31 f 0.47 4.31 f 0.53 Segmented neutrophils 1.23 f 0.17 0.99 f 0.08 1.28 f 0.12 1.14 2 0.16 1.00 f 0.12 Lymphocytes (103/pL) 2.99 f 0.36 2.81 f 0.19 3.96 f 0.47 3.13 2 0.36 3.25 f 0.50 Monocytes (103/~L) 0.00 f 0.00 0.00 f 0.00 0.00 f 0.00 0.00 2 0.00 0.00 f 0.00 Eosinophils (103/pL) 0.09 f 0.02 0.04 r?: 0.01 0.05 f 0.02 0.05 2 0.01 0.06f 0.02 Nucleated erythrocytes 0.00 f 0.00 0.00 f 0.00 0.01 f 0.01 0.00 -c 0.00 0.00 f 0.00
Clinical Chemistry
Cholinesterase ( I U L ) 4,176 f 144 3,245 f 16P* 2,365 f 260**b 2,150 k 124** 3,716 f 236*.
l Significantly different (PsO.05) from the control group by Dunn's or Shirley's test * * PsO.01 a Mean f standard error. Animals i n the 600 ppm group received dosed feed for 13weeks, after which they received control diet.
n = 9
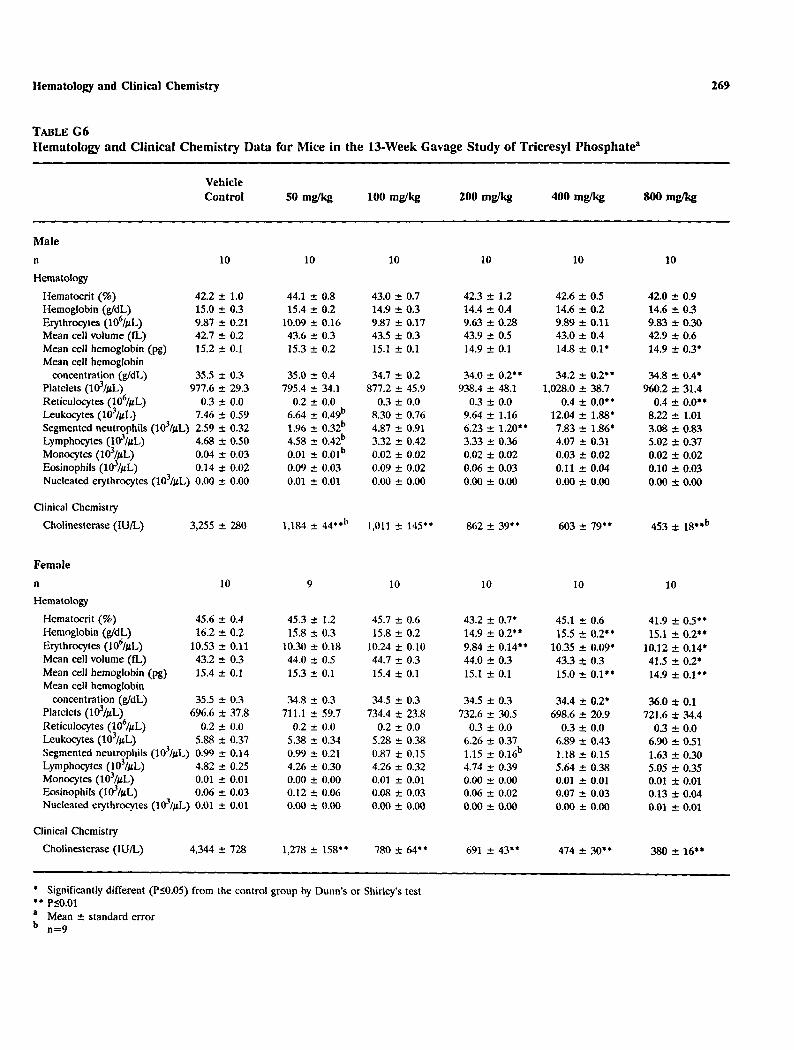
269 Hematology and Clinical Chemistry
TABLEG6 IIematology and Clinical Chemistry Data for Mice i n the 13-Week Gavage Study of Tricresyl Phosphatea
Vehicle Control 50 w l k g 100 mg/kg 200 mdkg 400 m& 800 mdkg
Male n 10 10 10 10 10 10
Hematology
Hematocrit (%) 42.2 f 1.0 44.1 f 0.8 43.0 f 0.7 42.3 f 1.2 42.6 f 0.5 42.0 f 0.9 Hemoglobin (g/dL) 15.0 f 0.3 15.4 2 0.2 14.9 f 0.3 14.4 2 0.4 14.6 f 0.2 14.6 f 0.3
Meancellvolume (L) Erythrocytes (106/pL)
42.7 f 0.2 9.87 f 0.21
43.6 f 0.3 10.09 f 0.16
43.5 2 0.3 9.87 f0.17
43.9 2 0.5 9.63 f 0.28
43.0 f 0.4 9.89 f 0.11
42.9 f 0.6 9.83 f 0.30
Meancellhemoglobin(pg) 15.2 f 0.1 15.3 f 0.2 15.1 f 0.1 14.9 2 0.1 14.8 f 0.1' 14.9 f 0.3* Mean cell hemoglobin
concentration (g/dL) 35.5 2 0.3 35.0 t 0.4 34.7 f 0.2 34.0 rtr 0.2.' 34.2 f 0.2'' 34.8 -C 0.4' Platelets ( l d / p ~ > 977.6 f 29.3 795.4 f 34.1 877.2 f 45.9 938.4 5 48.1 1,028.0 f 38.7 960.2 f 31.4 Reticulocytes (106/pL)0.3 f 0.0 0.2 f 0.0 0.3 2 0.0 0.3 2 0.0 0.4 f 0.0'. 0.4 f 0.0'. Leukocytes ( lof /b~) 7.46 k 0.59 6.64 f 0.49b 8.30 f 0.76 9.64 2 1.16 12.04 f 1.88' 8.22 f 1.01 Segmented neutrophils (103/pL) 2.59 & 0.32 1.96 & 0.32b 4.87 f 0.91 6.23 2 1.20" 7.83 f 1 . w 3.08 2 0.83 Lymphocytes (103/pL)4.68 f 0.50 4.58 f 0.42b 3.32 k 0.42 3.33 f 0.36 4.07 f 0.31 5.02 2 0.37 Monocytes (103/pL)0.04 2 0.03 0.01 f 0.0P 0.02 f 0.02 0.02 f 0.02 0.03 f 0.02 0.02 rt 0.02 Eosinophils (103/pL) 0.14 2 0.02 0.09 f 0.03 0.09 f 0.02 0.06 f 0.03 0.11 f 0.04 0.10 f 0.03 Nucleated erythrocytes (103/pL) 0.00 f 0.00 0.01 f 0.01 0.00 t 0.00 0.00 f 0.00 0.00 f 0.00 0.00 2 0.00
Clinical Chemistry
Cholinesterase (IU/L) 3,255 k 280 1,184 f 44**b 1,011 f 145.' 862 f 39'. 603 rt 79'' 453 k 18''b
Female n 10 9 10 10 10 10 Hematology
Hematocrit (%) 45.6 f 0.4 45.3 2 1.2 45.7 f 0.6 43.2 k 0.7' 45.1 k 0.6 41.9 f 0.5'' Hemoglobin (g/dL) 16.2 k 0.2 15.8 rtr 0.3 15.8 & 0.2 14.9 k 0.2'' 15.5 t 0.2'* 15.1 2 0.2'' Erythrocytes (106/pL) 10.53 f 0.11 10.30 f 0.18 10.24 f 0.10 9.84 k 0.14** 10.35 f 0.09. 10.12 f 0.14* Mean cell volume (L) 43.2 f 0.3 44.0 2 0.5 44.7 f 0.3 44.0 2 0.3 43.3 f 0.3 41.5 f 0.2' Mean cell hemoglobin (pg) 15.4 f 0.1 15.3 2 0.1 15.4 f 0.1 15.1 f 0.1 15.0 f 0.1,' 14.9 f 0.1'' Mean cell hemoglobin
concentration (g/dL) 35.5 k 0.3 34.8 f 0.3 34.5 f 0.3 34.5 f 0.3 34.4 2 0.2' 36.0 f 0.1 Platelets (103ip~) 696.6 f 37.8 711.1 rt 59.7 734.4 f 23.8 732.6 2 30.5 698.6 f 20.9 721.6 f 34.4 Reticulocytes (106/bL) 0.2 f 0.0 0.2 f 0.0 0.2 f 0.0 0.3 2 0.0 0.3 f 0.0 0.3 f 0.0 Leukocytes (103/#~)- . 5.88 f 0.37 5.38 f 0.34 5.28 -e 0.38 6.26 rtr 0.37 6.89 f 0.43 6.90 f 0.51 Segmented neutrophils (103/pL) 0.99 f 0.14 0.9%)f 0.21 0.87 k 0.15 1.15 5 O.lGb 1.18 f 0.15 1.63 2 0.30 Lymphocytes (103/pL)4.82 f 0.25 4.26 f 0.30 4.26 f 0.32 4.74 2 0.39 5.64 2 0.38 5.05 f 0.35 Monocytes (103/pL) 0.01 & 0.01 0.00 f 0.00 0.01 f 0.01 0.00 2 0.00 0.01 f 0.01 0.01 f 0.01 Eosinophils (103/pL) 0.06 & 0.03 0.12 f 0.06 0.08 f 0.03 0.06 f 0.02 0.07 f 0.03 0.13 & 0.04 Nucleated erythrocytes (103/pL) 0.01 rtr 0.01 0.00 5 0.00 0.00 f 0.00 0.00 k 0.00 0.00 f 0.00 0.01 f 0.01
Clinical Chemistry Cholinesterase (IU/L) 4,344 f 728 1,278 f 158" 780 f 64'* 691 f 43** 474 f 30" 380 rt 16"
' Significantly different (PSO.05) from the control group by Dunn's o r Shirley's test *' P50.01 a Mean f standard error
n=9

270 Tricresyl Phosphate, NTP TR 433
TABLE6 7 Hematology and Clinical Chemistry Data for Mice in the 13-Week Feed Study of Tricresyl Phosphatea
250 ppm 500 ppm 1,000 ppm 2,100 ppm 4,200 ppm
Male n 10 10 10 10 9 10
Hematology Hematocrit (%) 1.246.847.1 2 f 0.5 47.0 f 0.4 47.3 2 0.4 47.7 f 0.7 46.5 f 0.6 Hemoglobin (g/dL) 0.316.1 f15.9 f 0.215.7 IT 0.2 15.7 f 0.2 15.9 2 0.1 15.4 f 0.2. Erythrocytes (106/pL)10.31 f 0.1710.15 f 0.0810.18 IT 0.11 10.05 f 0.09 10.08 2 0.09 10.28 f 0.17 Meancellvolume (fL) 45.5 f 0.746.2 f 0.346.1 2 0.4 47.1 f 0.2 47.3 k 0.3. 45.2 f 0.5 Meancellhemoglobin(pg) 15.6 f 0.115.7 k 0.115.5 2 0.1 15.7 f 0.1 15.8 2 0.1 15.0 f O.l** Mean cell hemoglobin
concentration (g/dL) 34.4 f 0.5 34.0 f 0.2 33.5 2 0.3 33.3 f 0.2. 33.4 f 0.3 33.2 & 0.3* Platelets ( I O ~ / ~ L ) 964.2 f 31.1 963.8 5 33.9 952.2 2 35.0 970.8 f 45.2 1,014.0 f 24.4 951.8 f 27.8 Reticulocytes (106/pL) 0.1 f 0.0 0.1 2 0.0 0.1 2 0.0 0.2 f 0.0 0.1 f 0.0 0.2 f 0.0 Leukocytes (103/~L) 3.44 f 0.41 4.74 2 0.40 3.46 2 0.48 3.94 f 0.53 4.91 t 0.71 4.24 f 0.40 Segmented neutrophils
( ~ o ? ~ L ) 0.50 f 0.09 0.69 f 0.18 0.65 5 0.13 0.86 f 0.16 1.61 f 0.48; 1.11 f 0.12'' Lymphocytes (103/pL) 2.94 f 0.34 4.00 f 0.25 2.81 f 0.41 3.05 f 0.42 3.28 f 0.62 3.07 f 0.32 Monocytes (103/bL) 0.02 f 0.01 0.01 f 0.01 0.00 f 0.00 0.01 f 0.01 0.04 5 0.02 0.03 2 0.02 Eosinophils (103/pL) 0.01 f 0.01 0.02 f 0.02 0.00 f 0.00 0.01 2 0.01 0.04 f 0.02 0.03 2 0.02
Clinical Chemistry
Cholinesterase (IU/L) 6,988.4 k 249.01,691.2 f 76.7"1,143.8 f 36.4.. 931.8 f 41.3*; 843.0 f 34.1*;b 634.7 IT 22.7;;
Female n 10 1 0 10 1 0 10 10 Hematology
Hematocrit (%) 50.0 2 0.9 47.9 2 0.8 48.0 f 1.1 48.4 f 0.8 47.9 f 1.2 48.0 -c 1.0 Hemoglobin (g/dL) 16.9 k 0.3 16.1 f 0.2 16.4 f 0.2 16.1 -t 0.2 16.3 f 0.3 16.0 f 0.3*
Mean cell volume (a)Erythrocytes (106/bL)
Mean cell hemoglobin (pg)
10.79 2 0.21 46.5 f 0.5 15.7 f 0.2
10.21 & 0.11 47.0 f 0.5 15.8 f 0.116.0
10.28 t 0.17 46.8 f 1.0
f 0.2 15.8 f 0.1 47.4 f 0.3
10.19 f 0.17
15.9 f 0.1 47.0 f 0.3
10.20 f 0.21
15.3 k 0.2 45.8 f 0.5
10.51 5 0.19
Mean cell hemoglobin concentration (g/dL) 33.7 f 0.2 33.7 f 0.3 34.3 2 0.6 33.2 f 0.3' 34.0 f 0.4 33.3 f 0.3
Platelets ( 1 0 ~ 1 ~ ~ ) 761.2 f 58.8 817.0 f 46.5 753.0 f 24.8 883.4 f 37.8 837.6 f 42.6 784.8 f 43.3 Reticulocytes (106/pL) 0.1 f 0.0 0.2 f 0.0 0.2 -c 0.0 0.2 f 0.0 0.1 f 0.0 0.2 f 0.0 Leukocytes(103/p~) 3.66 f 0.33 4.36 f 0.44 4.91 2 0.48 4.02 2 0.23 3.76 2 0.27 3.58 & 0.39 Segmented neutrophils
( I O ~ I ~ L ) 0.36 f 0.06 0.50 2 0.12 0.58 f 0.09 0.48 2 0.09 0.41 f 0.07 0.62 -t 0.07 Lymphocytes(103/pL) 3.28 f 0.29 3.81 f 0.33 4.28 f 0.41 3.51 f 0.19 3.33 2 0.23 2.92 5 0.33 Monocytes (103/pL) 0.00 f 0.00 0.03 f 0.02 0.03 f 0.02 0.00 & 0.00 0.01 k 0.01 0.02 f 0.01 Eosinophils (103/pL) 0.02 f 0.01 0.00 k 0.00 0.03 f 0.02 0.01 f 0.01 0.00 f 0.00 0.00 f 0.00
Clinical Chemistry Cholinesterase (IU/L) 10,443.0 f 347.0 1.963.7 r 109.0*' 1,052.4 t 78.0; *' 812.0 f 44.5.; 661.6 f 27.5** 536.6 2 27.4'.
l Significantly different (P<O.OS) from the control group by Dunn's or Shirley's test * * PSO.01 a Mean f standard error
n=9 n-10
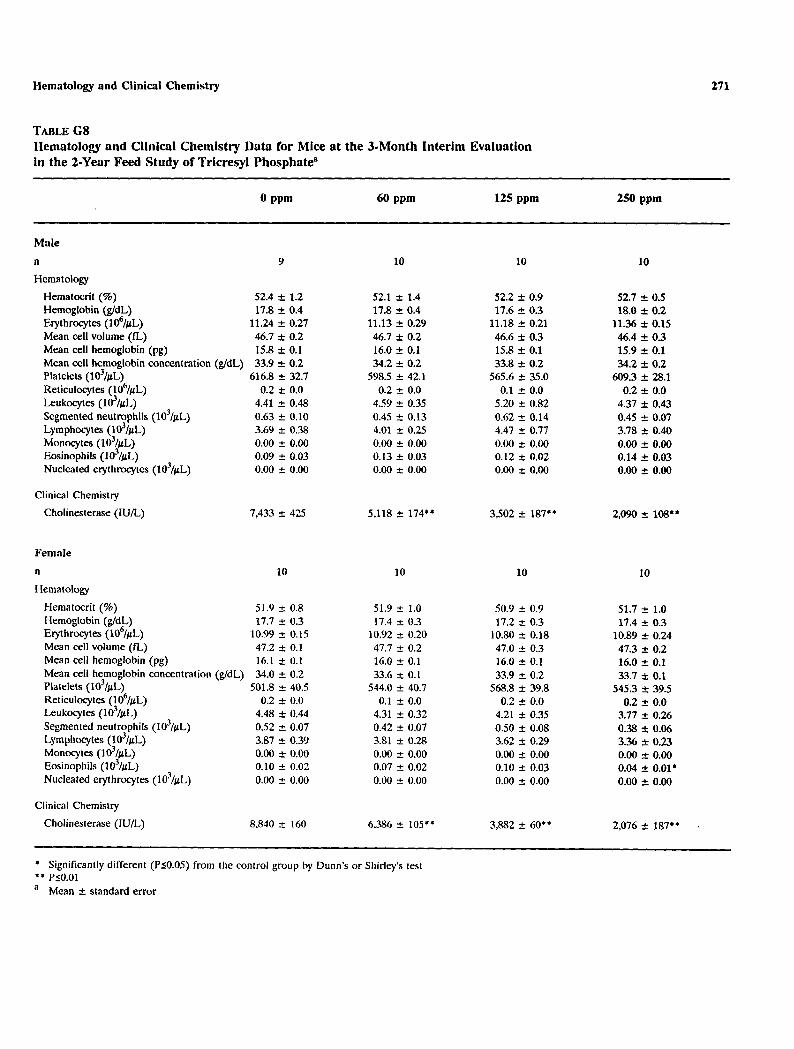
271 Hematology and Clinical Chemistry
TABLEG S Hematology and Clinical Chemistry Data for Mice at the 3-Month Interim Evaluation in the 2-Yeor Feed Study of Tricresyl Phosphatea
0 PPm 60 PP"
Male n 9 10
Hematology Hematocrit (%) 52.4 f 1.2 52.1 2 1.4 Hemoglobin(g/dL) 17.8 f 0.4 17.8 2 0.4 Erythrocytes11.24(106/pL) f 0.27 11.13 f 0.29 Mean cell volume (L) 46.7 f 0.2 46.7 f 0.2 cellMean(pg) 15.8 f 0.1hemoglobin 16.0 f 0.1 Mean cell hemoglobinconcentration(g/dL) 33.9 f 0.2 34.2 -c_ 0.2 Platelets ( l o Z / p ~ ) 616.8 2 32.7 598.5 f 42.1 Reticulocytes (106/pL) 0.2 f 0.0 0.2 f 0.0 Leukocytes f 0.48 4.59 f 0.354.41(103/pL) Segmentedneutrophils (103/pL) f 0.100.63 0.45 f 0.13 Lymphocytes (103/pL) 3.69 r 0.38 4.01 2 0.25 Monocytes (lO'/pL) 0.00 f 0.00 0.00 f 0.00 (103/pL)Eosinophils 0.09 f 0.03 0.13 f 0.03 Nucleated (103/pL) 0.00 2 0.00erythrocytes 0.00 f 0.00
Clinical Chemistry Cholinesterase ( I U L ) 7,433 2 425 5,118 f 174"
Female n 10 10 Hematology
Hematocrit (%) 51.9 -t 0.8 51.9 f 1.0 Hemoglobin 17.7 k 0.3 17.4 z(g/dL) 0.3 Erythrocytes 10.99 f 0.I 5 10.92 rt 0.20(106/pL)
volumecellMean (tL) 47.2 f 0.1 47.7 rt 0.2 hernoglobincell(pg) 16.1 f 0.1 16.0 f 0.1Mean
Meancellhemoglobinconcentration (g/dL)34.0 f 0.2 33.6 f 0.1 Platelets ( ~ o ~ / ~ L ) 501.8 f 40.5 544.0 f 40.7 Reticulocytes (106/pL) 0.2 f 0.0 0.1 2 0.0 ~ e ~ k o c y t e ~( 1 0 ~ 1 ~ ~ ) 4.48 f 0.44 4.31 f 0.32 Segmented (103/pL)0.52 0.42 rt 0.07neutrophils 2 0.07 Lymphocytes(103/pL) 3.87 f 0.39 3.81 f 0.28 Monocytes (103/pL) 0.00 f 0.00 0.00 f 0.00 Eosinophils (103/pL) 0.10 f 0.02 0.07 f 0.02 Nucleated (lo?/pL) 0.00 f 0.00erythrocytes 0.00 f 0.00
Clinical Chemistry
Cholinesterase ( I U / L ) 8.840 f I 6 0 6.386 f 105**
. Significantlydifferent(PSO.05)fromthecontrolgroup by Dum's or Shirley's lest * * PSO.01 a Mean f standard error
125 ppm
10
52.2 2 0.9 17.6 2 0.3
11.18 2 0.21 46.6 2 0.3 15.8 ? 0.1 33.8 f 0.2
565.6 f 35.0 0.1 f 0.0
5.20 -t 0.82 0.62 % 0.14 4.47 2 0.77 0.00 f 0.00 0.12 f 0.02 0.00 f 0.00
3,502 f 187'.
10
50.9 f 0.9 17.2 f 0.3
10.80 f 0.18 47.0 f 0.3 16.0 f 0.1 33.9 f 0.2
568.8 f 39.8 0.2 2 0.0
4.21 f 0.35 0.50 2 0.08 3.62 f 0.29 0.00 -t 0.00 0.10 f 0.03 0.00 f 0.00
3.882 f 60"
250 ppm
10
52.7 2 0.5 18.0 f 0.2
11.36 f 0.15 46.4 f 0.3 15.9 f 0.1 34.2 f 0.2
609.3 -c 28.1 0.2 f 0.0
4.37 2 0.43 0.45 f 0.07 3.78 f 0.40 0.00 2 0.00 0.14 2 0.03 0.00 f 0.00
2,090 * 108..
10
51.7 f 1.0 17.4 rt 0.3
10.89 f 0.24 47.3 f 0.2 16.0 f 0.1 33.7 f 0.1
545.3 f 39.5 0.2 f 0.0
3.77 f 0.26 0.38 f 0.06 3.36 t 0.23 0.00 1 0.00 0.04 ? 0.01. 0.00 f 0.00
2,076 f 187"

272 Tricresyl Phosphate, NTP TR 433
TABLEG 9 Hematology and Clinical Chemistry Data for Mice at the 9-Month Interim Evaluation i n the 2-Year Feed Study of Tricresyl Phosphate3
125 ppm
Male
n 10 10 10 10
Hematology Hematocrit (%) 56.2 t 1.2 55.6 2 0.9 55.4 2 0.7 56.1 2 1.0 (g/dL)Hemoglobin 16.2 t 0.3 16.0 2 0.3 16.0 2 0.2 16.2 2 0.3 Erythrocytes (106/pL) 10.77 2 0.22 10.49 & 0.19 10.51 * 0.14 10.71 f 0.17 Mean ce l l volume (fL) 52.2 f 0.3 53.2 t 0.3 52.7 t 0.2 52.3 f 0.3
hemoglobinMeancell (pg) 15.0 -t 0.1 15.2 -t 0.1 15.2 2 0.1 15.1 f 0.1 Mean cell hemoglobinconcentration(g/dL) 28.9 f 0.2 28.7 f 0.2 28.8 2 0.1 28.8 f 0.1 platelets ( I O ~ / ~ L ) 794.4 f 34.9 769.5 f 37.5 779.9 f 49.4 724.8 f 33.6 Reticulocytes (106/pL) 0.2 f 0.0 0.1 f 0.0 0.2 2 0.0 0.2 f 0.0 Leukocytes ( ~ o ~ / ~ L ) 4.99 f 0.43 4.93 f 0.21 4.97 f 0.31 5.04 2 0.40 Segmented (103/pL) neutrophils 1.07 2 0.22 0.88 2 0.10 1.04 f 0.24 0.962 0.12 Lymphocytes (103/pL) f 0.36 3.87 i: 0.21 3.77 f 0.17 3.91 f 0.343.77Monocytes (103/pL) 0.00 f 0.00 0.00 2 0.00 0.01 i: 0.01 0.00 2 0.00 Eosinophils0.15(103/pL) f 0.02 0.18 t 0.03 0.16 f 0.03 0.17 f 0.04 Nucleated (103/pL) 0.00 f 0.00 0.00 i: 0.00 0.00 f 0.00 0.00 f 0.00erythrocytes
Clinical Chemistry
Cholinesterase (IU/L) 8.457 f 244 6,278 f 191* * 4,338 f 222**b 2,210 & 66**
Female
n 10 10 10 10 Hematology
Hematocrit (%) 54.4 f 0.7 56.8 i: 0.7* 56.1 f 0.6’ 56.9 0.7. (g/dL)Hemoglobin 15.5 i: 0.2 15.9 f 0.2 15.8 t 0.2 15.9 e 0.2 Erythrocytes10.17 2 0.12 10.66 2 0.12. 10.62 +. 0.12*(106/pL) 10.61 f 0.14*
volumecellMean (L) 53.4 i: 0.4 53.3 t 0.3 52.8 2 0.4 53.5 f 0.2 Mean c e l l hemoglobin (pg) 15.2 f 0.1 15.0 f 0.1 14.9 f 0.1 15.0 2 0.1 Meancellhemoglobinconcentration(g/dL) 28.5 f 0.2 28.1 f 0.1 28.2 f 0.1 28.0 t 0.1 platelets ( ~ o ~ / ~ L ) 692.4 2 32.0 627.1 f 40.0 649.2 f 39.8 640.6 2 28.0 Reticulocytes(106/pL) 0.2 k 0.0 0.2 +. 0.0 0.2 f 0.0 0.2 2 0.0 Leukocytes ( 1 0 ~ 1 ~ ~ ) 4.08 2 0.22 4.24 2 0.42 3.40 -C 0.19 4.72 f 0.27 Segmented (103/pL) 0.79 f 0.12 0.79 +. 0.10 0.64 +. 0.06neutrophils 0.83 f 0.12 Lymphocytes(103/pL) 3.22 & 0.20 3.39 2 0.32 2.71 f 0.21 3.81 f 0.22
(103/pL)Monocytes 0.00 2 0.00 0.00 f 0.00 0.00 f 0.00 0.00 f 0.00 Eosinophils (103/wL) 0.07 f 0.02 0.06 k 0.02 0.05 2 0.01 0.07 f 0.03 Nucleated (lo”/pL) 0.00 t 0.00 0.00 f 0.00 0.00 -c 0.00 0.00 f0.00erythrocytes
Clinical Chemistry Cholinesterase ( I U / L ) 10,568 f 261b 7,199 2 104** 3,877 k 205** 2,223 k 151**
* Significantly different (PsO.05) from the control group by Dum’s o r Shirley‘s test * * PsO.01 a Mean f standard error b n=9

894.0
792.3
IIemntology and Clinical Chemistry 273
TABLEG10 Hematology and Clinical Chemistry Data for Mice at the 15-Month Interim Evaluation in the 2-Year Feed Study of Tricresyl Phosphatea
Male n Hematology
Hematocrit ( W )
10
54.2 f 0.7
10
56.9 f 1.4
10
55.6 f 0.9
10
55.4 f 0.6 15.2 (g/dL)
ErythrocytesHemoglobin It 0.2 15.7 f 0.4 15.5 f 0.3 15.6 f 0.2
(106/pL)9.79 2 0.13 10.32 f 0.31 10.16 f 0.26 9.97 f0.11 volumecellMean (&)
Meancell(pg)hemoglobin15.5 Meancellhemoglobinconcentration Platelets Reticulocytes (106/pL) Leukocytes ( 1 0 ~ 1 ~ ~ ) Segmented (1dlpL)neutrophils Lymphocytes2.39(lO’/pL) Monocytes(lO’/pL)
0.08Eosinophils(103/pL) Nucleated (103/pL)erythrocytes
Clinical Chemistry
Cholinesterase ( IU/L)
Female n Hematology
Hematocrit (%)
(g/dL)
55.4 2 0.4 2 0.2
28.0 -C 0.3 2 25.3
0.2 2 0.0 3.40 f 0.20 0.93 f 0.08
f 0.14 0.00 f 0.00
f 0.02 0.00 f 0.00
8,777 f 181
10
52.6 f 1.1
55.3 f 0.5 15.3f 0.1 27.6 f 0.2
908.7 2 49.3 0.2 f 0.0
3.21 f 0.31 0.67 f 0.12. 2.46 f 0.22 0.00 f 0.00 0.08 f 0.02 0.00 f 0.00
6,965 f 371**
10
53.9 f 0.8
54.8 f 0.6 15.3 f 0.2 27.8 f0.1
898.3 f 36.8 0.2 t 0.0
3.80 & 0.23 0.91 0.09 2.76 f 0.16 0.00 2 0.00 0.13 f 0.02 0.00 f 0.00
5,026 f 402.’
10
54.6 f 0.7
55.6 f 0.3 15.6 f 0.1 28.1 f 0.2
819.9 f30.0 0.2 f 0.0
3.08 f 0.26 0.59 f 0.06** 2.44 k 0.24 0.00 f 0.00 0.05 f 0.01 0.00 f 0.00
2,134 & 198**
9
54.3 f 0.9 Hemoglobin f 0.3 14.9 f 0.2 15.3 f 0.2 15.2 t 0.2(g/dL) Erythrocytes (106/pL) 9.39 f 0.17 9.72 f 0.15 9.87 f 0.12 9.70 f 0.16
cellMean 56.1 f 0.3volume (E) hemoglobinMean (pg)cell 15.5 f 0.1
Meancellhemoglobinconcentration (g/dL) 27.8 2 0.3 Platelets f 42.2 Reticulocytes 2 0.00.2(106/pL) Leultocytes ( 1 0 ~ 1 ~ ~ ) 2.52 2 0.24 Segmented (103/pL)0.77 f 0.16neutrophilsLymphocytes(103/pL)1.70
55.6 f 0.6 15.3 f 0.1 27.7 f 0.3
739.8 f 30.0 0.3 ? 0.0
2.52 f 0.19 0.59 f 0.05
55.3 f 0.5 15.5 f 0.1 28.0 f 0.2
721.0 f 35.4 0.3 f 0.0
2.07 f 0.17 0.53 f 0.05
56.1 f 0.3 15.6 f 0.1 27.9 f 0.1
703.3 f 27.2 0.3 f 0.0
2.43 f 0.29 0.64 f 0.11
f 0.13 1.87 f 0.16 1.48 f 0.15 1.74 f 0.19 Monocytes (l#/pL) 0.00 f 0.00 0.00 f 0.00 0.00 f 0.00 0.00 f 0.00 Eosinophils f 0.01 0.06 f 0.02 0.06 f 0.01 0.06 2 0.010.06(103/pL) Nucleated (103/pL) 0.00 f 0.00 0.00 f 0.00 0.00f 0.00erythrocytes 0.00 f 0.00
Clinical Chemistry
Cholinesterase (IU/L) 10.775 f 454 6,479 f 114** 3,497 f 133**b 1,525 It 77**
* Significantly different (PjO.05) from the control group by Dunn’s or Shirley’s test * * P10.01 a Mean f standard error
n=9
14.6

275
APPENDIX H NEUROBEHAVIORAL STUDIES
METHODS..................................................................... 276 TABLEH l Neurobehavioral Data forRats in the 16-Day Gavage Study
of Tricresyl Phosphate ................................................. 278 TABLE I12 Neurobehavioral Data forRats in the 13-Week Gavage Study
of Tricresyl Phosphate ................................................. 280 TABLE H3 Neurobeheviorel Data for Rats in the 13-Week Feed Study
of Tricresyl Phosphate ................................................. 282 TABLE€14 Neurobehavioral Data €or Rats at the 3-Month Interim Evaluation
in the 2-Year Feed Study of Tricresyl Phosphate ............................. 283 TABLE1-15 Neurobehavioral Data for Rats at the 9-Month Interim Evaluation
in the 2-Year Feed Study of Tricresyl Phosphate ............................. 283 TABLE €16 Neurobehrrvioral Data forRats at the 15-Month Interim Evaluation
in the 2-Year Feed Study of Tricresyl Phosphate ............................. 284 TABLE H7 Neurobehavioral Data for Mice in the 16-Day Gavage Study
of Tricresyl Phosphate ................................................. 285 TABLEI18 Neurobehavioral Data for Mice in the 13-Week Gavage Study
of Tricresyl Phosphate ................................................. 287 TABLE €19 Neurobehavioral Data for Mice in the 13-Week Feed Study
of Tricresyl Phosphate ................................................. 289 TABLEH10 Neurobehavioral Data for Mice at the 3-Month Interim Evaluation
in the 2-Year Feed Study of Tricresyl Phosphate ............................. 290 TABLE1111 Neurobehsvioral Data for Mice at the 9-Month Interim Evaluation
in the 2-Year Feed Study of Tricresyl Phosphate ............................. 290 TABLEI112 Neurobehavioral Data for Mice at the 15-Month Interim Evaluation
in the 2-Year Feed Study of Tricresyl Phosphate . . . . . . . . . . . . . . . . . . . . . . . . . . . . . 291

276 Tricresyl Phosphate, NTP TR 433
NEUROBEHAVIORAL STUDIES METHODS 16-Day Studies Approximately one week before dosing began and again on the day before necropsy, all rats and mice were tested for spontaneous motor activity, forelimband hindlimb grip strength, startle response,and paw-lick latency.
Spontaneous motor activity was measuredusing a photocell movement detection procedure. Darkened sound-insulating chambers were used to house individual plexiglass test cages. Each cubicle had a ventilation fan with a baffled intake and exhaust system and a 4-inch speaker for the delivery of 75 dB white noise. Photo beam detector units were inserted so that infrared photo beams 6 cm apart passed through the test cages just above the cage floors. Animal movement inside the cages was translated into activity counts by means of Coulbourn Instruments modular signal processing equipment. Measurements were recorded for three consecutive 5 minute periods. Test groups consisted of one male from each dose group or one female from each dose group to eliminate bias among groups due to order, timeof day, or other environmental variables.
Grip strength was measured using a device and procedure similar to that described by Meyer ef nf . (1979). Each animal was allowed to grip a triangular ring with its forepaws and was pulled back along a platform until its grip was broken. As the backward motion continued, its hindpaws reached a T-shaped rear-limbgrip bar which it was allowed to grasp and then was forced to release by continued pulling. Push-pull strain gauges (Chatillon, Kew Gardens, NY)were used to record the maximum strain required to break the animal's grip in each case. The average of three valid measurements was taken as the animal's score for either forelimb o r hindlimb grip strength.
Startle responses were measured usinga Responder IV Startle Response Monitor (Columbus Instruments, Columbus, OH) within an Industrial Acoustics sound-isolation cubicle equippedwith light, ventilation fan, and one-way viewing window. The cubicle contained four independent startle platforms (transducers) equipped for the delivery of a 4.5 kHz, 200 msec, 120 dB acoustic stimulus a t pre-programmed intervals. The startle monitor measures and prints the amplitude and latency of startle responses for each platform separately. A 4.5 kHz, 50 msec, 102 dB pre-pulse was delivered 1.8 seconds prior to each startle stimulus. The effect of the pre-pulse was to produce a brief hesitation in the spontaneous movement of the animal, during which the main stimulus was presented. In the absence of these signals, the speakers presented SO dB white noise. The amplitude data were transformed to equivalent load values using conversion factors obtained during calibration. Startle measurement sessions consisted of ten startle stimuli presented 60 seconds apart. The sensitivity settings used were pre-adjusted to detect both increases and decreases in startle reactivity.
Paw-lick latency was measured by placing four animals on individual, heated (55" C) plates (Technilab Instruments Model 475 Analgesia Meter) for a period of up to 60 seconds. This test procedure allowed the animals to move about freely and did not require any restraint devices. In general, each animal in the test came from a different dose group and individuals from one dose group were not always placed on the same plate.
13-Week Studies During the 13-week studies, eachrat and mouse was tested for forelimb and hindlimb grip strength the day before the beginning of the studies, and again on the day prior to scheduled necropsy. Measurements were made following the same procedure described in the 16-day studiesand a t the end of the testing, the body weight of each animal was recorded. Grip strengths and body weight data were analyzed for overall treatment responses using one-way analysiso f variance followed by Bonferroni's test (Miller, 1981) for pairwise comparisons between groups. Analysis of covariance, with body weight as a covariate, was also conducted on post-exposure grip strength data.

277 Neurobehavioml Studies
2-Year Studies During the 2-year studies, each rat and mouse was tested for forelimb and hindlimb grip strength during the week before the beginningo f the studies, and again priorto scheduled necropsy at the 3-, 9-, and 15-month interim evaluations. Measurements were made following the same procedure described in the 16-day studies, except that five trials were conducted with less than 1minute between trials so that the degree o f habituation or fatigue could be measured. The body weight o f each animal was also recorded at the end o f the grip strength evaluations.

278 Tricresyl Phosphate, NTP TR 433
TABLE Hi Neurobehavioral Data for Rats in the i6-Day Gavage Study of Tricresyl PhoSI)hate3
Vehicle Parameter/Day Control 360 mg/kg 730 mg/kg 1,450 mg/kg 2,900 mg/kg 5,800 mglkg
Male
n 9 10 9 10 6 10
Body weight (g) 14 208 ± 5 204 ± 3 190 ± 4·· 170 ± 5·· 146 ± 16·· 156 ± 9··
Body temperature (" C) 14 35.16 ± 0.19 35.41 ± 0.38 35.51 :t 0.34 35.79 ± 0.32 35.25 ± 0.56 35.27 ± 0.36
Total activity (15 min) 0 309.6 ± 45.8b 288.7 ± 23.8 274.5 ± 25.0b 294.3 ± 25.5c 259.3 ± 34.0b 281.4 ± 39.4
14 332.4 ± 74.0 216.4 ± 27.3 240.1 ± 40.1 226.8 ± 24.4 162.3 ± 43.9 171.0 ± 36.8 Startle response latency (ms)
0 21.60 ± 0.85b 20.30 ± 0.60 25.20 ± 3.57b 19.50 ± 0.40 22.30 ± 1.39b 20.20 ± 0.65 14 19.56 ± 0.90 18.20 ± 0.39 19.00 ± 0.76 18.00 ± 0.47 17.67 ± 0.61 16.60 ± 0.43··
Startle response amplitude 0 460.8 ± 42.0b 617.7 ± 61.4 594.6 ± 95.4b 685.4 ± 64.0 556.2 ± SO.2b 537.9 ± 45.4
14 804.1 ± 133 778.3 ± 83.8 841.2 ± 87.8 1,034.3 ± 121 1,224 ± 123· 1,218.5 ± 125· Forelimb grip strength (g)
0 537.0 ± 14.3b 520.0 ± 25.3 506.0 ± 17.3b 506.0 ± 16.4 513.0 ± 15.1 b 495.0 ± 18.9 14 547.8 ± 24.4 486.0 ± 21.9 537.8 ± 18.2 490.0 ± 18.6 400.0 ± 36.7··d 406.0 ± 15.2· 0
Hindlimb grip strength (g) 0 142.0 ± 9.3b 163.0 ± 8.6 145.0 ± 8.6b 147.0 ± 10.4 158.0 ± 4.9b 157.0 ± 7.3
14 223.3 ± 11.4 227.0 ± 9.2 197.8 ± 10.4 187.0 ± 17.8 168.0 ± 12.4ud 172.0 ± 12.30 •
Paw-lick latency (s) 0 16.84 ± 1.86b 17.88 ± 2.01 14.54 ± 1.28b 16.31 ± 0.85 16.19 ± 1.83b 17.50 ± 0.76
14 23.38 ± 2.59 19.16 ± 2.30 25.97 ± 2.76 30.12 ± 3.54 30.65 ± 4.79 26.44 ± 2.60 Change in total activity (15 min)
14 20.111 ± 29.858 -72.30 :t: 36.371 -32.22 :t: 27.088 -59.89 :t: 19.675c -75.00 :t: 42.611 -110.4 ± 15.527" Change in startle response latency (ms)
14 -1.778 ± 1.128 -2.100 ± 0.690 -6.667 ± 3.536 -1.500 :t: 0.401 -3.833 :t: 1.579 -3.600 ± 0.792 Change in startle response amplitude
14 341.0 ± 109 160.6 ± 110 307.2 :t: 94.8 348.9:t: 130 690.8 ± 160 680.6 ± 135 Change in forelimb grip strength (g)
14 18.89 ± 31.11 -34.00 ± 27.41 31.11 ± 28.45 -16.00 ± 23.81 -102.0 ± 42.36od -89.00 ± 24.740
Change in hindlimb grip strength (g) 14 80.0 ± 13.8 64.0 ± 11.5 55.6 ± 8.7 40.0 ± 19.6 14.0 ± 13.6ud 15.0 ± 12.3··
Change in paw-lick latency (8) 14 6.57 ± 3.96 1.28 ± 3.23 11.71 ± 2.29 13.81 ± 3.56 15.77 ± 6.27 8.94 ± 2.43

Neurobehavioral Studies 279
TABLE III Neurobehavioral Data for Rats in the 16-Day Gavage Study of Tricresyl Phosphate (continued)
Vehicle Parameter/Day Control 360 mg/kg 730 mg/kg 1,450 mg/kg 2,900 mg/kg 5,800 mg/kg
Female
n 9 10 10 9 2 10
Body weight (g) 14 144 ± 2 149 ± 1 147 ± 3 128 ± 4' 118 ± S' 119±4**
Body temperature C C) 14 36.74 ± 0.24 36.23 ± 0.34 36.32 ± 0.25 36.83 ± 0.19 36.90 ± 0.20 36.32 ± 0.18
Total activity (15 min) 0 318.7 ± 28.8b 283.3 ± 28.0 355.3 ± 45.0 236.1 ± 20.0b 320.9 ± 36.3b 331.8 ± 38.9
14 375.67 ± 45.12 343.40 ± 34.45 300.40 ± 42.46 e 146.25 ± 3S.37 .. 77.50 ± 10.50' 199.80 ± 45.37*· Startle response latency (ms)
0 26.67 ± 2.73 22.22 ± 1.92c 21.40 ± 0.87 21.33 ± 0.75 25.80 ± 3.18b 24.90 ± 3.14 14 19.56 ± 0.69 20.20 ± 0.63 18.80 ± 0.59 16.67 ± 0.47" 16.50 ± 0.50 17.10 ± 0.48"
Startle response amplitude 0 468.9 ± 84.5b 485.6 ± 82.1 461.5 ± 29.9 461.6 ± 68.1b 370.1 ± 35.4b 431.0 ± 47.8
14 674.0 ± 81.0 668.0 ± 69.7 927.3 ± 121 1,373.2 ± 141-- 1653.0 ± 87.0- 1,366.8 ± 97.2·-Forelimb grip strength (g)
0 433.0 ± 12.8b 429.0 ± 20.9 479.0 ± 17.3 437.0 ± 13.2b 443.0 ± 11.8b 452.0 ± 13.9 14 537.8 ± 31.2 458.0 ± 8.4- 494.0 ± 22.5 442.2 ± 21.4- 375.0 ± 25.0'· 357.0 ± 14.9"
Hindlimb grip strength (g) 0 129.0 ± 7.2b 128.0 ± 8.3 136.0 ± 8.3 132.0 ± 9.4b 141.0 ± 6.9b 131.0 ± 6.0
14 192.2 ± 14.2 192.0 ± 6.8 182.0 ± 14.2 156.7 ± 11.4 140.0 ± 10.0 144.0 ± 9.3" Paw-lick latency (s)
0 30.08 ± 1.85b 34.38 ± 1.20 26.62 ± 2.89 29.32 ± 2.52b 34.92 ± 2.18b 28.65 ± 1.53 14 28.26 ± 2.26 32.54 ± 2.78 24.85 ± 2.71 48.59 ± 5.45- 60.00 ± 0.00- 42.63 ± 4.78·
Change in total activity (15 min) 14 59.333 ± 56.631 60.100 ± 29.747 -54.90 ± 38.262 -77.25 ± 36.626-e -209.5 ± 117.50- -132.0 ± 31.803"
Change in startle response latency (ms) 14 -7.875 ± 3.165e -2.111 ± 1.982c -2.600 ± 0.897 -4.667 ± 0.726 -21.00 ± 14.000 -7.800 ± 2.820
Change in startle response amplitude 14 198.4 ± 115 182.4 ± 70.5 465.8 ± 112 891.8 ± 122** 1,315.0 ± 21.0" 935.8 ± 87.1*'
Change in forelimb grip strength (g) 14 103.33 ± 38.80 29.00 ± 21.88 15.00 ± 26.04 ILl 1 ± 30.07 -10.00 ± 40.00 -95.00 ± 23.58"
Change in hindlimb grip strength (g) 14 63.3 ± 19.1 64.0 ± 8.5 46.0 ± 11.9 30.0 ± 14.1 30.0 ± 10.0 13.0 ± 12.0*
Change in paw-lick latency (s) 14 -1.778 ± 2.794 -1.840 ± 2.780 -1.770 ± 4.386 20.044 ± 6.157* 31.350 ± 2.650' 13.980 ± 4.546*
• Significantly different (P:S0.05) from the control group by Dunn's or Shirley's test •• P:s0.01 a Mean ± standard error b n=10 c n=9 d n=5 e n=8

280 Tricresyl Phosphate, NTP TR 433
TABLE H2 Neurobehavioral Data for Rats in the 13-Week Gavage Study of Tricresyl Phosphate3
Vehicle Parameter/Week Control 50 mg/kg 100 mg/kg 200 mg/kg 400 mglkg 800 mglkg
Male
n 10 10 10 10 10 10
Body weight (g) 0 185 ± 5 177 ± 4 182 ± 5 181 ± 4 177 ± 5 181 ± 5
13 368 ± 6 359 ± 4 357 ± 7 345 ± 7·· 336 ± 5·· 315 ± 5*-Total activity (1 hour)
0 249.1 ± 35.7 274.3 ± 37.4 256.4 ± 31.9 262.7 ± 31.2 199.1 ± 23.2 261.4 ± 20.6 13 154.8 ± 16.7 163.1 ± 14.8 177.2 ± 35.3 156.0 ± 29.0 150.5 ± 28.0 175.7 ± 15.5
Startle response latency (ms) 0 21.00 ± 0.49 26.60 ± 4.24 24.10 ± 2.46 22.80 ± 1.11 23.40 ± 1.76 22.00 ± 1.61
13 18.20 ± 0.59 18.60 ± 0.52 19.50 ± 1.10 35.50 ± 16.62 20.10 ± 0.69 20.00 ± 0.80 Startle response amplitude
0 204.3 ± 33.0 157.6 ± 27.3 217.4 ± 21.1 168.9 ± 24.6 169.6 ± 22.4 203.2 ± 23.4 13 335.3 ± 33.2 307.6 ± 27.5 306.6 ± 31.4 250.0 ± 24.9 269.8 ± 31.0 298.8 ± 32.9
Forelimb grip strength (g) 0 70.10 ± 0.92 71.30 ± 1.65 70.40 ± 1.71 70.90 ± 1.82 71.50 ± 2.07 71.90 ± 1.93
13 90.20 ± 1.19 88.00 ± 1.75 89.10 ± 1.82 87.80 ± 1.24 86.40 ± 2.15 85.90 ± 1.67 Hindlimb grip strength (g)
0 23.00 ± 0.52 23.00 ± 0.75 22.50 ± 0.64 20.90 ± 1.04 22.20 ± 0.80 21.70 ± 0.68 13 43.70 ± 1.61 41.90 ± 1.39 43.10 ± 1.61 43.20 ± 1.57 39.80 ± 1.49 40.00 ± 1.45
Paw-lick latency (s) 0 32.69 ± 3.89 38.01 ± 3.67 35.22 ± 3.43 38.15 ± 2.52 40.27 ± 3.10 37.44 ± 1.89
13 17.71 ± 2.05 23.34 ± 2.33 18.12 ± 3.01 14.86 ± 1.63 14.74 ± 1.47 18.48 ± 2.28 Change in total activity (1 hour)
13 -94.30 ± 29.77 -111.2 ± 32.06 -79.20 ± 40.25 -106.7 ± 10.51 -48.60 ± 23.84 -85.70 ± 28.00 Change in startle response latency (ms)
13 -2.800 ± 0.593 -8.000 ± 4.271 -4.600 ± 2.868 12.70 ± 15.95 -3.300 ± 1.856 -2.000 ± 1.926 Change in startle response amplitude
13 130.96 ± 40.99 150.00 ± 34.52 89.21 ± 33.54 81.17 ± 27.09 100.19 ± 38.28 95.59 ± 38.89 Change in forelimb grip strength (g)
13 20.10 ± 1.29 16.70 ± 2.68 18.70 ± 2.80 16.90 ± 1.73 14.90 ± 2.62 14.00 ± 1.88· Change in hindlimb grip strength (g)
13 20.70 ± 1.69 18.90 ± 1.39 20.60 ± 1.72 22.30 ± 1.59 17.60 ± 1.36 18.30 ± 1.48 Change in paw-lick latency (s)
13 -14.98 ± 4.184 -14.67 ± 4.073 -17.10 ± 4.229 -23.29 ± 2.981 -25.53 ± 2.721· -18.96 ± 2.769

281 Neurobehavioml Studies
TABLEH2 Neurobehavioral Data for Rats in the 13-Week Gavage Study of Tricresyl Phosphate (continued)
Vehicle Parameter/Week Control 50 m g l k 100 mglkg 200 mglkg 400 mglkg SO0 mgntg
Female
n 10 10 10 10 10 10
Body weight (g) 0 140 2 2 141 f 2 140 f 2 141 f 2 137 f 3 139 f 2
13 204 f 5 206 f 2 207 f 2 208 f 3 201 f 3 208 f3 Total activity (1 hour)
13 0
214.8 f 24.3 320.2 f 47.2
198.7 2 20.2 287.4 f 42.4
221.5 f 24.1 322.5 f 42.5
220.2 f 33.9 333.9 f 59.3
201.2 * 21.1 241.7 f 26.9 301.6 2 30.2
251.2 f 21.6 Startle response latency (ms)
0 21.20 f 0.51 23.90 f 2.74 23.10 2 0.66 21.90 r+- 0.66 45.00 2 19.41 81.50 f 60.50 I3 20.50 f 1.19 22.30 & 1.26 21.40 2 0.93 18.40 2 0.52 21.60 2 0.64 21.40 k 0.91
Startle response amplitude 0 177.5 f 14.3 184.4 2 27.2 163.2 f 13.7 169.1 f 20.3 137.6 f 23.8 163.1 f 22.1
13 230.1 f 28.0 201.3 f 22.7 201.8 f 22.6 276.1 f 22.4 196.2 f 13.5 259.8 f 33.2 Forelimb grip strength (9)
0 70.70 f 1.56 69.10 2 0.97 73.00 f 2.35 70.10 f 1.89 66.50 f 2.05 69.00 f 1.25 13 74.60 f 2.05 76.40 2 1.73 84.20 2 2.30* 78.30 2 1.17 76.80 f 1.32 75.40 2 2.04
Hindlimb grip strength (g) 0 22.90 2 0.72 21.20 f 0.33 22.40 f 1.03 21.50 f 0.93 20.60 2 0.88 20.60 f 0.65*
13 33.90 2 1.33 31.90 f 1.00 32.10 f 0.97 33.00 2 0.83 30.00 2 0.65" 29.00 f 0.91*+ Paw-lick latency (s)
0 26.94 2 2.29 30.95 2 2.79 33.44 2 2.75 33.72 2 2.66 30.18 f 3.08 25.62 f 2.22 13 22.81 2 2.19 18.17 2 2.78 20.32 f 2.22 26.89 f 3.02 25.07 f 3.76 21.53 f 2.74
Change i n total activity (1 hour) 13 -105.4 f 32.33 -88.70 2 27.00 -101.0 r+- 33.95 -113.7 f 54.44 -40.50 f 33.33 -50.40 1 26.65
Change i n startle response latency (111s) 13 -0.700 f 1.212 -1.600 2 2.334 -1.700 f 1.001 -3.500 k 0.872 -23.40 f 19.02 4 . 1 0 f 60.44
Change i n startle response amplitude 13 52.55 f 31.84 16.96 f 38.07 38.53 f 18.88 106.99 f 34.09 58.60 f 32.88 96.67 -+- 22.12
Change i n forelimb grip strength (g) 13 3.90 f 2.07 7.30 f 2.10 11.20 f 2.12 8.20 f 2.22 10.30 f 2.54 6.40 f 2.00
Change i n h i n d l i m b grip strength (g) 13 11.00 f 1.37 10.70 2 1.04 9.70 f 0.79 11.50 f 0.90 9.40 f 1.08 8.40 f 1.02
Change i n paw-lick latency (s) 13 -4.130 f 3.187 -12.78 f 3.63 -13.12 f 2.333 -6.830 f 4.633 -5.110 f 4.713 -4.090f 2.720
* * PSO.01 l Significantly different (PjO.05) from the control group by Dunn's or Shirley's test
a Mean 2 standard error

282 Tricresyl Phosphate, NTP TR 433
TABLEH3 Neurobehavioral Data for Rats in the 13-Week Feed Study of Tricresyl Phosphatea
0 PPm !") PPm 1,700 ppm 3,300 PPm 6,600 ppm 13,OOO ppm
Male
n 10 10 10 10 10 10
Body weight (g) 3 6 4 2 7 361 f 8 3 6 6 2 6 336 f 4** 329 f 8.' 241 f 8**
Forelimb grip strength (kg) 0.769 f 0.046 0.811 f 0.038 0.850 f 0.019 0.7% f 0.039 0.7% 2 0.034 0.688 f 0.043
Hindlimb grip strength (kg) 0.805 f 0.029 0.824 f 0.029 0.790 f 0.031 0.737 -t 0.015 0.721 2 0.029 0.655 f0.042..
Change i n forelimb grip strength (kg) 0.120 +. 0.036 0.123 2 0.038 0.144 f 0.019 0.107 f 0.040 0.144 2 0.036 0.055 f 0.043
Change i n h indl imb grip strength (kg) 0.457 rf: 0.027 0.473 2 0.030 0.453 f 0.030 0.415 f 0,019 0.385 2 0.025 0.342 f 0.038.
Female
n 10 10 10 10 10 10
Body weight (g) 198 2 3 194 f 3 194 f 3 3 180187 -t ;r 4*+ 174 f 3..
Forelimb grip strength (kg) 0.642 ;r 0.029 0.667 2 0.031 0.626 rf: 0.037 0.650 & 0.031 0.661 f 0.033 0.708 f 0.025
Hindlimb grip strength (kg) 0.692 f 0.018 0.668f 0.032 0.675 rf: 0.014 0.714 f 0.016 0.687 f 0.019 0.648 f 0.015
Change i n forelimb grip strength (kg) 0.018 +- 0.037 0.049 2 0.030 -0.010 2 0.040 0.006 f 0.029 -0.002 f 0.032 0.075 2 0.033
Change i n h i n d l i m b grip strength (kg) 0.396 2 0.020 0.377 f 0.0310.387 f 0.0200.423 f 0.018 0.387 f 0.0200.351 2 0.012
' Significantly different (PSO.05) from the control group by Dunn's or Shirley*s test * * P50.01 a Mean -t standard error

283 Neurobehavionl Studies
TABLE€14 Neurobehavioral Data for Rats at the 3-Month Interim Evaluation in the 2-Year Feed Study of Tricresyl Phosphatea
0 P P 75 PPm 150 ppm 300 ppm 600 ppm
n 15 15 15 15 15
Forelimb grip strength (kg) 0.950 rt 0.004 0.954 f 0.005 0.957 f 0.006 0.947 2 0.003 0.949 2 0.003 Hindlimb grip strength (kg) 0.802 & 0.008 0.770 f 0.020 0.759 f 0.017 0.715 f 0.013;. 0.712 f 0.013.; Change i n forelimb grip strength (kg) 0.571 f 0.021 0.593 f 0.021 0.576 f 0.020 0.588 f 0.017 0.591 f 0.019 Change in hindlimb grip strength (kg) 0.518 t 0.017 0.513 f 0.022 0.481 f 0.022 0.446 f 0.018; 0.447 2 0.021
Female
n 15 15 15 14 15
Forelimb grip strength (kg) 0.921 f 0.016 0.907 f 0.011 0.925 f 0.009 0.932 f 0.008 0.917 f 0.011 Hindlimb grip strength (kg) 0.709 f 0.019 0.678 f 0.018 0.687 f 0.013 0.676 2 0.011 0.658 f 0.015; Change in forelimb grip strength (kg) 0.565 f 0.023 0.552 f 0.017 0.570 f 0.012 0.574 f 0.016 0.569 f 0.015 Change in h i n d l i m b grip strength (kg) 0.445 f 0.019 0.410 f 0.022 0.413 rC_ 0.014 0.408 f 0,018 0.394 f 0.016
* Significantly different (PSO.05) from the control group by Dunn's or Shirley's test * * PCO.01 a Mean f standard error
TABLEI15 Neurobehavioral Data for Rats at the 9-Month Interim Evaluation in the 2-Year Feed Study of Tricresyl Phosphatea
0 PPm 75 ppm 150 ppm 300 ppm 600 ppm
Male
n 14 15 15 15 15
Forelimb grip strength (kg) 1.58 f 0.04 1.54 & 0.03 1.57 f 0.03 1.56 f 0.03 1.55 & 0.04 Hindlimb grip strength (kg) 1.15 2 0.02 1.13 & 0.02 1.17 f 0.02 1.12 f 0.02 1.15 -C 0.03 Change i n forelimb grip strength (kg) 1.22 f 0.05 1.18 f 0.03 1.21 f 0.04 1.21 2 0.04 1.19 f 0.05 Change in h indl imb grip strength (kg) 0.889 f 0.032 0.870 f 0.019 0.908 f 0.028 0.870 f 0.025 0.887 f 0.029
Female
n 15 14 15 15 15
Forelimb grip strength (kg) 1.21 f 0.02 1.21 f 0.03 1.21 f 0.02 1.25 f 0.02 1.25 -c 0.02 Hindlimb grip strength (kg) 0.899 2 0.017 0.908 2 0.022 0.905 f 0.017 0.919 f 0.017 0.929 f 0.024 Change i n forelimb grip strength (kg) 0.857 2 0.023 0.863 f 0.025 0.850 f 0.024 0.905 f 0.029 0.883 f 0.016 Change i n h i n d l i m b grip strength (kg) 0.637 2 0.016 0.654 f 0.020 0.631 f 0.026 0.663 f 0.024 0.655 f 0.024
a Mean -t standard error

284 Tricresyl Phosphate, NTP TR 433
TABLEJ16 NeurobehavioralData forRats at theIS-MonthInterimEvuluation inthe2-YearFeedStudy of Tricresyl Phosphatea
0 PPm 75 PPm 150 ppm 300 ppm 600 ppm
Male
n 15 15 15 15 15
Forelimb grip strength (kg) Hindlimb grip strength (kg)Change in forelimb grip strength (kg)
1.58 2 0.04 1.06 2 0.02 1.22 & 0.03
1.63 f 0.04 1.11 f 0.02 1.27 f 0.05
1.60 f 0.04 1.08 f 0.03 1.26 f. 0.03
1.62 f 0.02 1.07 5 0.02 1.24 f 0.03
1.64 f 0.03 1.09 +. 0.02 1.27 +. 0.04
Change in hindlimb grip strength (kg) 0.793 k 0.019 0.840 f 0.022 0.827 f 0.027 0.787 2 0.017 0.819 & 0.020
Female
n 14 13 15 15 14
Forelimb grip strength (kg) Hindlimb grip strength (kg)Change in forelimb grip strength (kg)
1.35 k 0.02 0.881 2 0.021 0.986 f 0.022
1.38 2 0.02 0.875 2 0.019 1.018 +. 0.032
1.35 f 0.03 0.883 f 0.021 1.009 f. 0.026
1.36 f 0.02 0.905 f 0.022 0.970 f 0.027
1.34 2 0.03 0.8% f 0.021 0.974 & 0.028
Change in hindlimb grip strength (kg) 0.612 f 0.021 0.609 +. 0.021 0.629 f. 0.021 0.625 2 0.017 0.630 k 0.016
a Mean rt standarderror

285 Neurobehavioral Studies
TABLE€X7 Neurobehavioral Data for Mice in the 16-Day Gavage Study of Tricresyl Phosphatea
Vehicle Pnmmeter/Doy Control 363 mdkg 726 mdkg 1,452 mdkg 2,905 mg& 5,810 mdkg
Male
n 10 10 10 6 Ob 6
Body weight (g) 14 26.0 2 0.3 25.8 f 0.2 25.1 f 0.5 22.2 f 0.7" - 23.7 f0.8'''
Body temperature (" C) 14 37.41 +- 0.35 37.65 f 0.22 37.78 f 0.32 35.35 f 1.04' - 35.66 ? 1.37'
Total activity (15 min) 0 302.2 f 26.5 303.5 f 18.3 279.3 f 20.9 254.8 f 17Sd 293.9 f 16Se 331.6 f 17.Be
14 282.80 f 16.36 284.80 f 14.18 246.40 f 16.3487.86 & 24.89"' - 212.83 f 5.05** Startle response latency (ms)
0 16.40 f 0.43 16.40 f 0.48 16.80 f 0.42 15.40 & 0.3Jd 16.00 f 0.42d 16.10 f 0.50d 14 15.20 f 0.39 16.13 f 0.35' 21.78 f 2.87':e 18.33 f 1.41.. - 17.50 f 1.12'
Startle response amplitude 0 490.1 f 44.3 550.8 f 63.5 515.5 f 30.0 f 49.9d 2 48.6d 583.6 & 80.8d536.5 489.4
14 628.3 f 57.5 532.8 i S5.3e 378.4 i 32.8"570.0 f 117 - 532.0 f 67.4 Forelimb grip strength (g)
0 130.8 f 5.7 123.6 f 4.3 130.5 f 6.0 127.4 f 4.1d 125.9 f 4.1d128.3 f 4.8d14 142.30 f 2.81 133.40 ? 5.25 140.80 rt 4.93 f 14.98:'' 82.43 f 19.14**'55.71 -
Hindlimb grip strength (g) 0 37.80 f 2.33 35.70 & 2.02 35.80 & 2.41 f 1.94d f l M d 35.70 f 2.03d36.70 34.30
14 52.50 f 2.28 43.90 f 2.60' 42.50 f 2.26,.21.71 f 6.26''' - 26.71 f 5.%*" Paw-lick latency (s)
0 25.25 f 2.31 21.51 f 2.40 25.29 f 2.26 f 3.03d 1 1.37d 20.59 f l.62d25.00 21.87 14 23.83 f 2.01 23.59 f 2.59 24.34 f 3.14 33.00 f 7.66 - 21.53 f 1.82
Change i n total activity (15 min) 14 -19.40 f 25.359 -18.70 f 17.915-32.90 f 13.321-165.7 f 35.290"' - -130.8 rt 27.942**g
Change i n startle response latency (rns) 14 -1.200 f 0.467 0.125 f 0.398'4.889 f 2.685**e3.167 f 1.327'' - 1.333 f 0.615**
Change i n startle response amplitude 14 138.20 f 45.092 -37.22 f 67.329*e -124.8 f 42.532''e-9.667 f 134.12' - -103.0 rt 112.08*
Change i n forelimb grip strength (g) 14 11.500 f 5.596 9.800 f 3.255 10.300 f 6.043 -71.86 rt 17.678"' - 19.638"'-43.57
Change i n h i n d l i m b grip strength (g) 14 14.700 f 2.390 8.200 f 3.144 6.700 +- 2.608* -16.71 2 6.693'*' - -8.857 2 6.544**'
Change i n paw-lick latency (s) 14 -1.420 1 2.175 2.080 1 2.976-0.950 f 3.57610.167 f 9.619 - 0.533 f 2.420

- -
286 Tricresyl Phosphate, NTP TR 433
TABLEH7 Neurobehavioral Data for Mice i n the 16-Day Gavage Study of Tricresyl Phosphate (continued)
Vehicle Parameter/Day Control 363 mdkg 726 mdkg 1,452 mdkg 2,905 mdkg 5,810 mgntg
Female
n 10 10 10 Ob Ob 9
Bodyweight (g) 14 20.0 f 0.3 21.8 f 0.3'' 22.4 f 0.3'. 21.7 2 0.4..
Body temperatureC) 14 38.38 * 0.12 37.86 f 38.32 f 37.98 2 0.180.22 0.06
Total activity (15 min) 0 324.1 f 15.7 311.4 f. 24.9 272.8 f 18.5 297.2 2 19.2d 283.4 2 19.0d 313.5 & lSSd
14 291.3 f. 16.8 273.4 '. 14.5 272.2 f 14.2 - 240.0 2 17.2-Startle response latency (ms)
0 17.90 2 0.55 15.10 2 0.18.' 17.30 & 0.79 16.50 f 0.54d 18.40 & 1.71d 15.80 2 0.39.d 14 15.78 f 0.15e 17.00 f 1.89e17.90 f 1.72 - - 16.56 rt 0.75
Startle response amplitude 0 386.7 ? 26.5 553.4 It 45.0.508.4 5 48.3 435.7 2 45Bd 443.2 & 45.2d 478.6 2 25.2d
14 478.4 f 32.4e 474.9 rt 59.3 538.1 rt 40.0 552.2 2 60.2 Forelimb grip strength (g)
0 107.6 rt 3.5 102.3 2 2.1 105.3 rt 4.1 107.4 rt 3.0d 103.9 rt 3.7d 109.1 & 3.7d 14 126.00 & 3.92 123.20 +. 2.58121.70 +. 4.07 - - 86.22 * 6.78**
Hindlimb grip strength (g) 0 27.20 & 2.82 26.60 & 1.73 25.70 & 1.07 25.90 2 l.12d 26.30 & 2 X d 25.40 k 1.87d
14 39.90 & 2.11 38.30 f 2.70 33.90 rt 1.83' - - 23.67 f 2.40** Paw-lick latency (s)
0 17.88 k 1.53 22.29 r 2.24 18.721.80 16.32 & 1.21d 21.64 & 1.51d 17.63 * 1.41d 14 18.65 f 1.76 20.95 f 2.37 21.25 rt 3.11 - - 25.58 2 2.53
Change in total activity (15 min) 14 -32.80 f 25.800 -38.00 -t 26.484-0.600 k 18.343 -77.56 f 19.395
Change i n startle response latency (rns) 14 -1.667 & 0.333e 2.000 f 1.900"e0.600 2 1.536' 0.778 f 0.909'
Change in startle response amplitude 14 81.667 f 38.804e -78.50 ? 68.653 29.700 ? 47.529 71.333 f 51.762
Change i n forelimb grip strength (g) 14 18.400 f 2.945 20.900 f 2.85016.400 f 4.626 -23.67 f 7.906'.
Change i n hindlimb grip strength (g) 14 12.700 f 2.879 11.700 f 3.2538.200 f 1.323 -1.778 f 2.344**
Change i n paw-lick latency (s) 14 0.770 f 1.543 -1 .340 f 3.2802.530 f 2.781 7.456 f 2.694
' Significantly different (PSO.05) from the control group by Dunn's or Shirley's test *' PSO.01 a Mean f standard error
n=O; no data calculated for groups wi th 100% mortality n=7 n=10
e n = 9 n=8
g n=5

287 Neurobehavioral Studies
TABLE€18 Neurobehavioral Data for Mice in the 13-Week Gavage Study of Tricresyl Phosphatea
Vehicle Parameter/Week Control 50 m d k 100 mg/kg 200 mdkg 400 mgkg 800 mgkg
Male
n 10 10 10 10 10 10
Body weight (g) 0 24.3 5 0.5 24.4 2 0.6 24.6 2 0.4 24.6 f 0.4 23.8 2 0.5 24.1 f 0.5
13 35.0 2 0.7 37.2 f 0.8 38.0 2 0.8 32.7 2 0.9 31.7 f O S * 28.1 2 os**
0 Total activity (1 hour)
259.0 2 21.3 271.4 f 16.5 262.2 f 15.2 251.9 f 15.0 248.6 f 14.0 245.6 f 24.2 13 183.80 & 30.76 232.90 & 18.57 207.80 f 20.59 172.00 f 18.55 139.50 f 13.20 90.70 f 13.53"
Startle response latency (ms) 0 15.90 f 0.41 19.60 f 2.38 17.40 f 2.08 15.80 f 0.49 15.78 f 0.32b 16.50 f 0.48
13 17.80 f 2.06 16.80 2 1.63 18.70 f 1.62 21.44 f 2.87*b 35.63 2 9.41**' 26.57 f 2.26**' Startle response amplitude
0 157.4 f 11.9 171.222.1 190.0 f 17.8 192.0 2 14.5 197.5 f 17.3b 176.1 & 18.5 13 152.09 f 22.58 188.81 & 19.46 141.26 2 17.43 131.50 f 15.2Jb 88.84 f 6.54"'121.67 f 12.85'
Forelimb grip strength (g) 0 147.0 f 3.7 147.9 f 3.4 145.8 f 3.7 143.6 f 5.3 146.1 f 5.0 143.4 & 3.2
13 184.8 & 4.1 184.3 f 4.2 188.0 f 3.5 174.1 f 3.7 158.2 f 4.2"143.5 f 3.2.' Hindlimb grip strength (9)
0 50.50 & 1.24 52.30 t 1.78 46.60 t 1.78 52.60 .c 2.51 50.80 f 2.9743.70 & 1.60" 13 82.10 f 1.792 83.80 f 3.711 81.20 f 3.952 73.40 f 4.053* 35.10 2 6.095'' O.OO0 2 0.000**
Paw-lick latency (s) 0 24.42 f 2.74 24.38 2 1.95 22.41 t 1.44 19.71 ? 2.06 19.60 2 1.49 18.01 +- 1.14'
13 12.69 f 0.67 14.24 f 0.82 13.83 f 1.32 12.20 f 0.77 13.56 f 1.21 18.63 2 1.36** Change i n total activity (1 hour)
13 -75.20 2 23.84 -38.50 2 23.32 -54.40 f 14.74 -79.90 2 19.89 -109.122.80-154.9 * 30.58 Change in startle response latency (ms)
13 1.900 f 2.025 -2.800 2 2.590 1.300 2 2.883 5.778 f 3.031b 22.143 f 10.439**d10.571 f 2.318." Change i n startle response amplitude
13 -5.334 2 21.01 17.627 f 23.93 -48.74 f 22.27 -62.56 2 20.97b -106.8 f 17.99**'-70.30 2 23.52'' Change in forelimb grip strength (g)
13 37.80 f 6.026 36.40 f 3.936 42.20 2 4.044 30.50 f 4.225 12.10 f 5.322'.0.100 f 5.104'. Change in hindlimb grip strength (g)
13 31.60 f 2.146 31.50 f 3.933 34.60 f 3.792 20.80 f 3.586* -15.70 -t 5.976".-43.70 f 1.599** Change i n paw-lick latency (s)
13 -11.73 f 2.524 -10.14 f 1.718 -8.580 k 1.252 -7.510 f 2.106 -6.040 f 1.7930.620 f 1.851**

288 Tricresyl Phosphate, NTP TR 433
TABLE 1I8 Neurobehavioral Data for Mice in the 13-Week Gavage Study of Tricresyl Phosphate (continued)
Vehicle Parameter/Week Control 50 mg/kg 100 mg/kg 200 mg/kg 400 mg/kg 800 mg/kg
Female
n 10 9 10 10 10 10
Body weight (g) 0 19.0 ± 0.4 18.6 ± O.5e 19.1 ± 0.3 18.4 ± 0.3 18.9 ± 0.5 19.5 ± 0.3
13 26.8 ± 0.8 27.2 ± 0.7 27.4 ::!: 0.8 24.3 ± 0.3· 23.6 ± 0.4" 22.4 ± 0.3·· Total activity (1 hour)
0 260.0 ± 11.9 284.7 ± 24.0e 277.3 ± 22.5 274.6 ± 28.5 272.8 ± 22.8 293.9 ± 19.4 13 226.0 ± 18.4 268.0 ± 40.7 224.2 ± 23.9 202.8 ± 18.4 173.1 ± 18.5 130.1 ± 9.1··
Startle response latency (ms) 0 20.88 ± 2.70c 22.71 ± 2.52d 22.14 ::!: 2.42d 20.43 ± 3.08d 20.33 ± 3.19f 29.75 ± 9.25c
13 20.88 ± 2.84c 24.33 ± 2.96 21.70 ± 2.24 26.50 ± 1.79 38.00 ± 6.40~·c 36.25 ± 3.22"c
Startle response amplitude 0 132.21 ± 14.49c 115.62 ± 1O.46d 119.22 ± 15.87d 136.70 ± 17.21d 120.15 ± 20.Uf 99.26 ± 6.22c
13 l31.50 ± 20.46c 143.62 ± 18.87 103.05 ± 9.40 74.76 ± 14.21· 76.49 ± 7.75·c 86.58 ± 5.16c
Forelimb grip strength (g) 0 120.4 ± 3.1 112.2 ± 4.0" 119.7 ± 4.3 126.0 ± 3.6 112.4 ± 3.2 124.2 ± 4.0
13 161.10 ± 3.21 150.67 ± 3.80 158.40 ± 5.14 142.60 ± 2.51" l33.30 ± 4.91" 99.50 ± 3.95·· Hindlimb grip strength (g)
0 36.00 ± 1.96 36.90 ± 2.54<' 35.20 ± 0.70 36.80 ± 2.13 33.70 ± 1.72 35.00 ± 2.30 l3 67.30 ± 2.642 61.44 ± 2.804 63.30 ± 3.044 51.40 ± 2.192·· 0.200 ± 0.200" O.ZOO ± O.ZOO"*
Paw-lick latency (s) 0 19.43 ± 1.66 18.41 ± 1.32<' 22.67 ± 2.41 24.81 ± 2.23 17.74 ± 1.54 15.04 ± 1.94·
13 15.26 ± 1.75 15.82 ± 0.74 15.44 ± 1.17 17.70 ± 1.36 22.53 ± 3.18· 27.41 ± 3.23·· Change in total activity (1 hour)
13 -34.00 ± 19.39 -24.67 ± 21.76 -53.10 ± 22.82 -71.80 ± 27.80 -99.70 ± 29.65 -163.8 ± 17.78·· Change in startle response latency (ms)
13 5.833 ± 3.371 f -1.167 ± 4.102f 1.429 ± 2.034d 6.571 ± 3.046d 22.00 ± 12.087g 17.00 ± 3.615d
Change in startle response amplitude 13 -38.86 ± 25.374f 31.94 ± 21.963f -8.95 ± 13.477d -60.72 ± 24.895d -44.89 ± 18.531g -16.88 ± 6.215d
Change in forelimb grip strength (g) 13 40.70 ± 4.719 36.78 ± 6.346 38.70 ± 6.384 16.60 ± 5.679· 20.90 ± 5.063· -24.70 ± 5.300··
Change in hindlimb grip strength (g) 13 31.30 ± 3.030 23.22 ± 2.639 28.10 ± 3.485 14.60 ± 2.774·· -33.50 ± 1.621·· -34.80 ± 2.289··
Change in paw-lick latency (s) 13 -4.170 ± 2.617 -2.400 ± 1.816 -7.230 ± 1.949 -7.110 ± 2.646 4.790 ± 2.882 2.370 ± 4.194
• Significantly different (PSO.05) from the control group by Dunn's or Shirley's test •• PSO.Ol a Mean ± standard error b n=9 c n=8 d n=7 e n=1O
n=6 g n=5

289 Neurobehavionl Studies
TABLE€19 Neurobehavioral Data for Mice in the 13-Week Feed Study of Tricresyl Phosphatea
0 PPm 250 ppm 500 ppm
Male
n 10 10 10
Body weight (g) 31.5 f 1.0 32.2 -C 0.9 31.5 f 0.8
Forelimb grip strength (g) 137.00 +. 4.36 136.30 2 3.59 133.30 f 2.91
Hindlimb grip strength (g) 123.80 2 4.40 124.60 f 4.25 127.20 rt 2.16
Change i n forelimb grip strength (g) 23.76 k 5.49 21.15 2 4.06 13.99 rt 5.97
Change in h i n d l i m b grip strength (g) 48.4757.39 * 4.05 55.71 rt 4.25 59.63 f 2.98
Female
n 10 10 10
Body weight (g) 27.9 rt 1.1 27.6 f26.90.6 k 0.825.7
Forelimb grip strength (g) 116.20 rt 3.22116.00 rt 2.61124.10 ~f:2.70103.20
Hindlimb grip strength (g) 110.67 f 3.09 f 3.40 3.11 110.30117.90 107.80
Change in forelimb grip strength (g) 22.07 2 3.6822.01 2 3.8036.92 -+ 3.0216.50
Change in hindlimb grip strength (g) 56.58 2 3.4563.23 f 3.6052.47 f 3.5454.44
' Significantly different (PsO.05) from the control group by Dunn's or Shirley's t e s t'.PSO.01 Mean 2 standard error
1,000 ppm
10
30.7 f 0.928.9
131.30 f 6.45
114.60 f 3.04
13.44 rt 7.64
2 1.904.1148.73
10
2 0.8
f 4.2689.80
-+ 3.5376.10
rc_ 5.49
f 3.84
2,100 ppm 4,200 pprn
10 10
rt 0.6' 25.0 2 0.4';
114.90 rt 3.54'' 95.50 2 2.40''
116.30 k 2.43 58.60 k 6.98''
0.25 +. 6.64'-15.66 2 4.79''
-5.61 fi 7.54';
10 10
21.0 -c 0.2*;23.0 2 0.4.'
f 2.84.' fi 2.78''75.80
f 6.66'' 2 2.86''13.50
0.64 2 5.29; -10.11 -C 3.28,'
17.80 f 7.37''-44.03 fi 2.93''

290 Tricresyl Phosphate, NTP TR 433
TABLEH10 Neurobehavioral Data for Mice at the 3-Month Interim Evaluation in the 2-Year Feed Study of Tricresyl Phosphatea
0 PPm 60 PPrn 125 ppm 250 ppm
Male
n 14 15 15 15
Forelimb grip strength (g) 127.4 f 3.6 127.3 f 2.0 130.2 f 2.4 123.7 f 2.3 Hindlimb grip strength (g) 105.14 f 2.97 101.60 -c 1.68 100.67 f 1.90 99.60 f 1.66 Change i n forelimb grip strength (g) 54.71 f 267 53.53 f 2.37 57.73 f 2.66 49.87 5 295 Change i n h i n d l i m b grip strength (g) 51.21 f 1.99 42.73 f 1.78' 45.00 2 1.93 42.13 f 1.99**
Female
n 15 15 15 15
Forelimb grip strength (g) 126.0 r?:124.52.6 r?: 1.9 123.1 f 2.4 122.7 f 2.7 Hindlimb grip strength (g) 104.67 f 2.19 104.40 & 1.29 98.33 f 1.95 97.13 2 1.76. Change i n forelimbgripstrength(g) 51.47 2 2.92 50.00 r?: 2.54 50.273.19 51.47 & 3.05 Change i n hindlimbgripstrength(g) 49.40 f 3.20 46.53 k 2.05 41.40 1.71 40.87 2 2.81
* Significantly different (PsO.05) from the control group by Dunn's or Shirlcy's test * * PSO.01 a Mean f standard error
TABLE1-111 Neurobehavioral Data for Mice at the 9-Month Interim Evaluation in the 2-Year Feed Study of Tricresyl Phosphatea
0 PPrn 60 ppm 125 ppm 250 pprn
Male
n 15 15 15 15
Forelimb grip strength (g) 125.2 f 3.3 122.5 f 3.3 127.1 2 4.0 121.5 f 4.4 Hindlimb grip strength (g) 98.13 f 2.74 98.73 t 2.18 97.00 2 2.24 91.87 f 3.38 Change in forelimb grip strength (g) 52.21 f 4.14 50.07 f 3.41 52.47 f 4.40 48.40 2 4.40 Change i n h i n d l i m b grip strength (g) 41.53 f 2.87 43.93 k 2.89 39.93 r?: 3.68 35.13 f3.88
Fernele
n 15 15 15 15
Forelimb grip strength (g) 117.7 & 3.4 121.8 f 3.2 117.5 f 3.1 123.6 f 2.9 Hindlimb grip strength (g) 92.80 f 2.54 98.67 f 2.81 88.93 f 2.34 96.87 f 2.35 Change in forelimb grip strength (g) 46.20 f 3.97 49.60 f 3.74 42.67 f 3.23 51.60 f 2.84 Change i n h i n d l i m b grip strength (g) 39.80 '. 3.52 42.67 r?: 3.51 31.00 r?: 3.36 42.93 f 2.57
a Mean r?: standard error
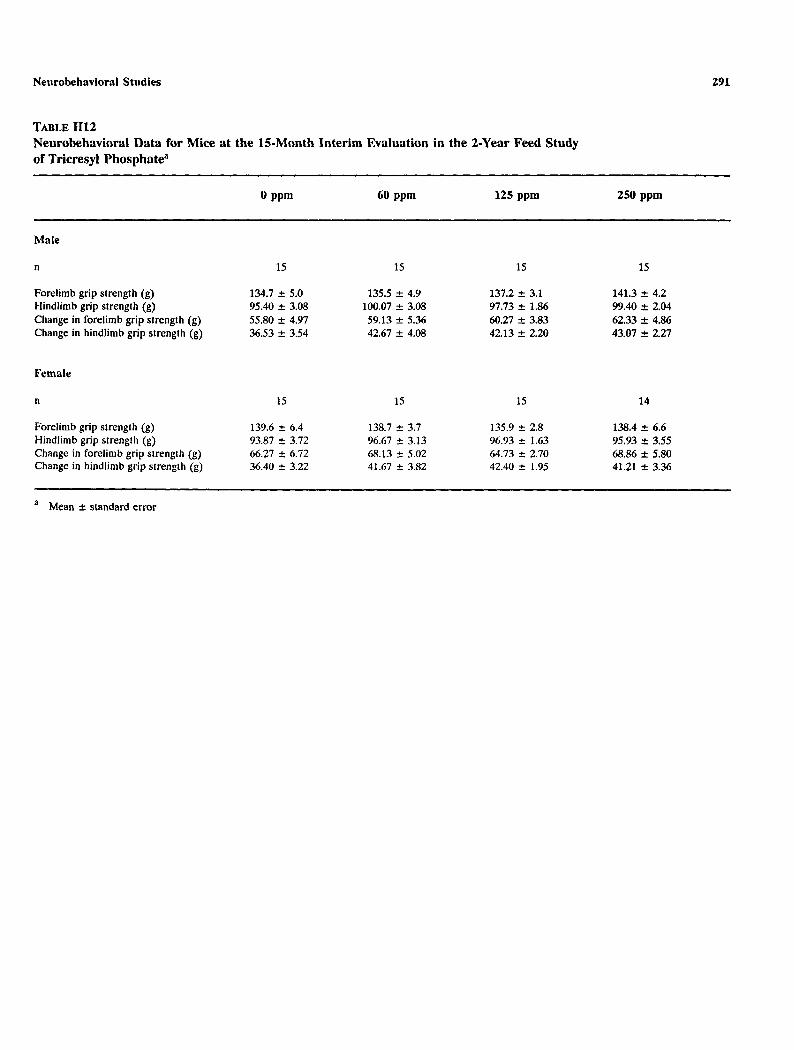
291 Neurobehavioral Studies
TABLE€112 Neurobehavioral Data for Mice at the 15-Month Interim Evaluation in the 2-Year Feed Study of Tricresyl Phosphatea
Male
n
Forelimb grip strength (g) Hindlimb grip strength (g) Change i n forelimb grip strength (g) Change i n hindlimb grip strength (g)
Female
n
Forelimb grip strength (g) Hindlimb grip strength (g) Change i n forelimb grip strength (g) Change i n h indl imb grip strength (g)
a Mean 2 standard error
0 PPrn
15
134.7 f 5.0 95.40 f 3.08 55.80 f 4.97 36.53 f 3.54
15
139.6 f 6.4 93.87 f 3.72 66.27 f 6.72 36.40 f 3.22
60 PPrn
15
135.5 -t 4.9 100.07 f 3.08 59.13 % 5.36 42.67 f 4.08
15
138.7 f 3.7 96.67 f 3.13 68.13 f 5.02 41.67 2 3.82
125 pprn
15
137.2 f 3.1 97.73 f 1.86 60.27 f3.83 42.13 & 2.20
15
135.9 -C 2.8 96.93 f 1.63 64.73 2 2.70 42.40 f 1.95
250 ppm
15
141.3 f 4.2 99.40 f 2.04 62.33 f 4.86 43.07 f 2.27
14
138.4 f 6.6 95.93 f 3.55 68.86 f 5.80 41.21 f 3.36

293
APPENDIX I CHEMICAL CHARACTERIZATION AND
DOSE FORMULATION STUDIES
PROCUREMENT AND CHARACTERIZATION OF TRICRESYL 294PIIOSPIIATE . . . . . , . . . . . . . . . . , ., . . . . . . , PREPARATION AND ANALYSISOF DOSE FORMULATIONS 295. . . , . . . . . . . . . , . , . . . . . . . . . . . .. . . .... . FIGUREI1 Infrared Absorption Spectrum of Tricresyl Phosphate . . . . . . .. .. . .. .. .. . . . . . . . . 297 FIGUREI2 Nuclear Magnetic Resonance Spectrum of Tricresyl Phosphate . . . . . . . . . . . . . .. . . . 298 TABLE11 Preparation and Storage of Dose Formulations in the Gavage and Feed Studies
of Tricresyl Phosphate . . . . . . . . . . . . . . . . . . . . . . . . . . . . . . .. . . . . . . . . . . . . . . . . . 299 TABLEIt Results of Analysis of Dose Formulations Administered to Rats and Mice
in the 16-Day Gavage Studies of Tricresyl Phosphate . . .. . . . . . . . . . . . . . . . . . . . . . . 300 TABLEI3 Results of Analysis of Dose Formulations Administered to Rats and Mice
in the 13-Week Gavage Studies of Tricresyl Phosphate . . . ... . . . .. . . l ...... l ... . 301 TABLE I4 Results of Analysis of Dose Formulations Administered to Rats and Mice
in the 13-Week Feed Studies of Tricresyl Phosphate . . . . . . . . , . . . . . . . .. . . . . . . . . . 303 TABLEI5 Results of Analysis of Dose Formulations Administered to Rats and Mice
in the 2-Year Feed Studies of Tricresyl Phosphate . . . . . . . . . . . . . . . . . . . . . . . . . . . . 304 TABLE I6 Results of Referee Analysis of Dose Formulations Administered to Rats and Mice
in the 13-Week Gavage Studies of Tricresyl Phosphate . . . , . . . . . . . . . . l . . . . . . . . . . 307 TABLE I7 Results of Referee Analysis of Dose Formulatiom Administered to Rats and Mice
in the 13-Week and 2-Year Feed Studies of Tricresyl Phosphate . . . . . . . . . . . . . . . . . . 307
294 Tricresyl Phosphate, NTP TR 433
CHEMICAL CHARACTERIZATION AND DOSE FORMULATION STUDIES PROCUREMENT AND CHARACTERIZATION OF TRICRESYLPIIOSPfIATE Tricresyl phosphate was obtained as a clear, colorless liquid from Stauffer Chemical Company (Westport, CT) in one lot (1202A-2-7), which was used throughout the 16-day, 13-week, and 2-year studies in rats and mice. Identity, purity, and stability analyses were conducted by the analytical chemistry laboratory, Midwest Research Institute (Kansas City, MO). Confirmatory analyses were conducted by Radian Corporation (Austin, TX). The reports o n analyses performed in support of the tricresyl phosphate studies are on file at the National Institute of Environmental Health Sciences.
The chemical was characterized by infrared, ultraviolet/visible, and nuclear magnetic resonance spectros- copy. The ultravioletfiisible spectrum was consistent with the literature spectrum of tricresyl phosphate (Sndrler Srandard Specfrn). The infrared and nuclear magnetic resonance spectra were consistent with those of a mixture o f isomers o f tricresyl phosphate (Figures I1 and 12).
The purity of tricresyl phosphate was determined by elemental analyses, Karl Fischer water analysis, thin-layer chromatography (TLC), and gas chromatography. Thin-layer chromatography was performed on Silica Gel 60 F-254 plates using two solvent systems: 1) diethyl ether:hexanes (80:20) and 2) ethyl acetate: iso-octane (30:70). Plates were examined under ultraviolet light (254 nm) and a spray of diazotized (acid) 4-nitroaniline. Gas chromatography was performed using a chromatograph with a flame ionization detector. Two systemswereused:
A) 3% Dexsil 400 on 100/120 Supelcoport column and a nitrogen carrier gas at a flow rate of 70 mL/minute, with an oven temperature program o f 50" C for 5 minutes, then 50" to 270" C at 10"C per minute
B) SP-2100 coated capillary column and a helium carrier gas at a linear velocity of 20 cmhecond, with an isothermal oven temperature o f 250" C.
Elemental analyses for carbon, hydrogen, and phosphorus were in agreement with the theoretical values for tricresyl phosphate. Karl Fischer water analysis indicated 0.072% k 0.003%water. Thin-layer chromatography indicated only one major spot in each system. Gas chromatography using system A indicated 13 components. Gas chromatography using system B indicated 28 components, with\ nine of these components having peak areas greater than 2% of the total chromatographic peak area. From the second gas chromatography system, the concentrations of tri-nt-cresyl phosphate and tri-p-cresyl phosphate were estimated at 21% and 4% of the total. The concentration of tri-o-cresyl phosphate was estimated at less than 0.1%.
Special analyses were performed t o identify the other seven components o f tricresyl phosphate which represent greater than 2% of the chromatographic peak area using a mass spectrometer and a gas chromatograph equipped with a helium gas carrier at a linear velocity o f 20 cm/second and an oven temperature program of 40" C for 2 minutes, then 40" t o 250" C at 10" C per minute.
Two peaks representing 24% and 30% of t h e total chromatographic peak area were identified as tricresyl phosphate esters whose isomeric composition could not be confirmed. The remaining five peaks (2%, 3%, 3%, 4%, and 5%) were identified as dicresyl phosphate esters, but again the isomeric composition could not be confirmed.

295 Chemical Characterization and Dose Formulation
To summarize, the test chemical is a complex mixture consisting o f 18%dicresyl phosphate esters and 79% tricresyl phosphate esters. Two o f the tricresyl phosphate esters were identified as tri-nz-cresyl phosphate (21%) and tri-p-cresyl phosphate (4%), with no detectable tri-o-cresyl phosphate (~0.1%).
Stability studies were performed by the analytical chemistry laboratory. Gas chromatography was performed using system A described above, except with a flow rate of 15 mL/minute; an oven temperature program o f 230" C for 5 minutes, then 230" to 270" C at 2" C per minute; and n-hexacosane added as an internal standard. These studies were based on the four major peaks and indicated that tricresyl phosphate was stable as a bulk chemical for at least 2 weeks when stored protected from light at temperatures upt o 60" C. The stability o f the bulk chemical was monitored periodically a t the study laboratory with ultraviolet spectroscopy and gas chromatography methods similar to those described above. No degradation of the bulk chemical was observed.
PREPARATIONAND ANALYSISOF DOSE FORMULATIONS In the 16-day gavage studies, the 5,800 m@g dose consisted of undiluted bulk chemical. The remaining gavage formulations for the 16-day and 13-week studies were derived by serial dilution of the bulk chemical with USP grade corn oil. Dose formulations for the 13-week and 2-year feed studies were prepared by mixing tricresyl phosphate with feed in a blender (Patterson-Kelley Twin Shell with intensifier bar) for 15 minutes (Table 11). Dose formulations were prepared once (mice) or twice (rats) for the 16-day studies and weekly for the 13-week and 2-year studies.
For the gavage studies, dose formulation stability analyses at t h e 40 mg/mL concentration were performed by the analytical chemistry laboratory. Aliquots were extracted with methanol, then 1,3,5-triphenylbenzene (1.0 mg/mL in acetone) was added as an internal standard. Gas chromatography was performed using system A described above, except with a carrier gas rate o f 15 mWminute and an oven temperature program o f 230" C for 5 minutes, then 230" t o 270" C at 2" C per minute. The stability o f the dose formulations based on the four largest peaks was confirmed for at least 2 weeks at room temperature when stored in the dark, and for 3 hours when exposed to air and light.
Studies to determinethe homogeneity and stability o f t h e dosed feed preparations were conducted by the analytical chemistry laboratory. For homogeneity and stability analyses, tricresyl phosphate at a concentration o f 60 ppm in feed was extracted with 100 mL isooctane; tricresyl phosphate at a concentration o f 500 ppm in feed was extracted with 100 mL hexane. The samples were then evaporated under a stream o f nitrogen and 4 mL o f water:methanol (10:90) was added. Aliquots from the 60 ppm sample were mixed with 2 mL di(2-ethyl-hexy1)phthalate (75 pg/mL in methanol) as an internal standard, while aliquots o f supernatant from the 500 ppm sample were mixed with 2 m L squalane (0.5 kL/mL in methanol) as an internal standard. Gas chromatography was performed as described earlier for system A, except with a carrier gas flow rate o f 20 mL/minute and an oven temperature program o f 230" C, then 230" with a 10 minute delay t o 2SO" C at 2" C per minute. Homogeneity was confirmed and the stability of the dose formulations was established based on the major tricresyl phosphate peak for at least 2 weeks when stored in the dark at room temperature.
Periodic analyses o f the dose formulations o f tricresyl phosphate were conducted at the study laboratory using ultraviolet spectroscopy (&day and 13-week gavage studies), high performance liquid chromatography (13-week feed studies), and gas chromatography (13-week and 2-year feed studies). For ultraviolet spectroscopy, samples were extracted with methanol; then after centrifugation the extracts were diluted with methanol and the absorbance determined at 265 nm. For high performance liquid chromatography, samples were extracted with acetonitrile; then after centrifugationthe extracts were diluted with acetonitrile or deionized water and injected onto a Waters pBondapak C,, column with the detector wavelength set at 254 nm. For gas chromatography, t h e system described above for the determination o f homogeneity and stability o f dose formulations was used (except with a 100/120 Chromosorb W-HP column). During

296 Tricresyl Phosphate, NTP TR 433
the 16-day studies,a l l formulations were analyzed (Table 12). During the 13-week studies, the dose formulations were analyzeda t the beginning, midpoint, and end of the studies (Tables I3 and 14). During the 2-year studies, the dose formulations were analyzed every6 to 10 weeks (Table 15). In the 2-year studies all dose formulations (S9B9) were within 10% of the target concentrations. Results of the periodic referee analyses performed by the analytical chemistry laboratory werein agreement with the results obtained by the study laboratory (Tables I 6 and 17).

8 ""
§ <')
~ ..
<? It ~
~ :l! z .... 9
l!~ fi ~U ~
II> illi t; <:> ill,! N 8 <:> 8 ~~.'! <> 0 0 .. " ... co ... '" ..,.
Chemical Characterization and Dose Formulation 297
FIGURE Il Infrared Absorlltion Spectrum of Tricresyl Phosphate

\ '------
... " ,..., M c:. .... .... Q -..: C ..., ~ . I .-: ..... C"f '"
... ri r Q
""" ...." ,...
,
I .... ....
.... . • ......
..:! .< ... ...
0
..
.. J wt
•
-1"
~ :l Jo ~-~ :L
!2 E A ...
~ • ~ ~ ... ~ 0 ... Er: .. .. ... u ... .. t' lI;; ...
'" .... • .I -- ,.. i,;._
-'" ...: ~o v ..... 0.; Q - ,.. . " :-:-...... v
91 t : .. ..: '-.-t-. II: i:.,-:m w :I,... ~ .. a ...
-~ ..
·1 i v.~ 1{ 'f: 1 ..:
:1 w
'" ..; .. w ;:) II; ~ ... ... 0
\J .. ::t i ... ...
N .. C e E 'e ... ... ... .. , I \,)
I - ~ ... ;: ... :2 Q ,. ;:. i '" ... ~ ~ ... ... ' ... .. '* lr< II: .... .... ... I : '')
~ (: , "I c <::,:
is '::1 :r Ie
il ... '" .. .. 0
~ ... J ...
91 ... "- 0:
E t E ~ .. "- ,; .. I .. I I
II: ... , )It
i ... ~ II: f 'I:t ... ;r: ... f
... 6.l 0 ~ ... :>
lit ". Q 0 v S ... v 9 ... ...
lit co
298 Tricresy) Phosphate, NTP TR 433
FIGURE 12 Nuclear Magnetic Resonance Spectrum of Tricresyl Phosphate

299 Chemical Characterization and Dose Formulation
TABLE11 Preparation and Storageof Dose Formulations in the Gavage and Feed Studies of Tricresyl Phosphate
16-Day Gavage Studies
Preparation Except dose, Tricresylhigh tricresyl phosphate was mixedwithmixedwith USP grade corn oil in amberoilin glass containers. High dose (5,800 mg/kg) neat.given
Chemical Lot Number 12m.A-2-1
Maximum Storage Time 2 weeks
Storage Conditions Stored in amber glass bottles at mom temperature.
Study Laboratory Battelle Columbus Laboratories, Columbus, OH
Referee Laboratory Midwest Research Institute, Kansas City, MO
13-Week Gavage Studies
phosphate was USP grade corn
a beaker. Contents o f the beaker were transferred to a graduated cylinder which was stoppered and manually inverted 21 times for mixing.
120%-2-1
2 weeks
Stored in 4-ounce (rats) or l-ounce (mice) amber glass bottles at room temperature.
Same as 16day gavage studies
Same as 16day gavage studies
1 3 - W ~ kFeed Studies
Premix prepared bywas mixing tricresyl phosphate and f e e d with a spatula; premix and remainingf e e d were layered in a blender with an intensifier bar and mixed for 15 minutes. The intensifier bar was turned on for 5 minutes and turned off for the next 10 minutes.
120%-2-1
3weeks
Stored in plastic containers at 4' C in the dark.
Same as 16day gavage studies
Same as 16day gavage studies
2-Year Studies
Same as 13-week feed studies
120%-2-1
2 weeks
Stored in plastic buckets at 4" C in the dark.
Same as 16day gavage studies
Same as 16day gavage studies

300 Tricresyl Phosphate, NTP TR 433
TABLE12 Results of Analysis of Dose Formulations Administered to Rats and Mice in the &Day Gavage Studies of Tricresyl Phosphate
Target Determined % Difference Date Prepared Date Analyzed Concentration Concentrationb from Target
( m g l W a (mglmL)
Rats' 8 April 1982 15 April 1982 73 72 -1
145 152 +5 290 315 +9 581 615 +6
1,162 1,240 +7
Rats and Mice 15 April 1982 26 April 1982 73 78 +7
145 148 +2 290 304 +5 581 578 -1
1,162 1,200 +3
Mice' 15 April 1982 26 April 1982 73 76 +4
145 158 +9 290 294 +1 581 580 0
1,162 1,150 -1
a Target concentrations expressed as mgkg body weight: 73 rng/nlL = 360 m@g, 145 m", = 730 mg/kg, 290 mg/mL = 1,450 m$g, 581 m g h L = 2,900 m@g, Dose volume = 5 m m g ; 1,162 mg/n~L= 5,800 m@g (neat). Results o f duplicate analyses
' Animal room samples

301 Chemical Characterization and Dose Formulation
TABLEI3 Results of Analysis of Dose Formulations Administered to Rats and Mice in the 13-Week Gavage Studies of Tricresyl I'bosphate
Date Prepared Date Analyzed Target
Concentration" (mdml. )
Rats 17 December 1982 21 December 1982 10.0
20.0 40.0 80.0
160
14 January 1983 17 Janualy 1983 10.0 20.0 40.0 80.0
I60
14 January 1983 24 January 1983' 10.0 20.0 10.0 80.0
I60
4 March 1983 7 March 1983 10.0 20.0 40.0 80.0
1 6 0
Mice 12 October 1982 14 October 1982 10.0
20.0 40.0 80.0
1 6 0
12 October 1982 25 October 1982' 10.0 20.0 40.0 80.0
160
24 November 1982 29 November 1982
24 November 1982 10 December 1382' 10.0 20.0 40.0 80.0
I60
Determined Concentrationhfrom
(mdml,)
10.0 19.7 40.4 85.0
159
9.59 21.0 42.5 83.9
I62
9.72 20.9 39.8 85.2
169
9.81 20.4 40.7 80.1
1 5 8
9.00 18.4 38.6 76.3
168
9.00 18.1 37.7 72.1
154
10.6 21.5 38.0 79.9
157
9.72 19.6 41.8 86.0
163
% Difference Target
0 -2 +1 +6 -1
-4 +5 +6 +5 f l
-3 + 5 -1 +7 +6
-2 +2 +2
0 -1
-10 -8 -4 -5 +5
-10 -10 -6
-10 -4
+6 +8 -4 0
-2
-3 -2 f 4 +8 +2

302 Tricresyl Phosphate, NTP TR 433
TABLEI3 Results of Analysis of Dose Formulations Administered to Rats and Mice in the 13-Week Gavage Studies of Tricresyl Phosphate (continued)
Date Prepared
Mice (continued) 17 December 198221
14 January 1983
14 January 1983
Date Analyzed
December 1982
17 January 1983
24 January 1983'
a Target concentrations expressed as m f l g hody weight:
TargetConcentration
(mdmL)
10.0 20.0 40.0 80.0
160
10.0 20.0 40.0 80.0
160
10.0 20.0 40.0 80.0
160
Determined Concentration
(mg/mL)
10.0 19.7 40.4 85.0
159
9.59 21.0 42.5 83.9
162
10.1 19.7 40.4 79.5
162
% Difference from Target
0 -2 +1 +6 -1
-4 +5 +6 +5 +1
+1 -2 +1 -1 +1
1 0 m g m L = 1 0 0 mflg; 20 m g m L = 200 mgflrg; 40 mg/mL = 400 mg&; 80 mg/mL = 800mflg; 160 m d m L = 1,600mg/k/kg. Dose volume = 1 0 mL,kg. Results of duplicate analyses Animal room samples

303 Chemical Characterization and Dose Formulation
TABLE14 Results of Analysis of Dose Formulations Administered to Rats and Mice in the 13-WeekFeed Studies of Tricresyl Phosphate
Target % DifferenceDetermined Date Prepared
Rats 16 November 1984
3 January 1985
13February 1985
Mice 28 November 1984
5 December 1984
6 January 1985
17 January 1985
20 February 1985
Date AnalyzedConcentrationConcentrationaTargetfrom
23 November 1984
4January1985
16 February 1985
11 December 1984
11 December 1984
17 January 1985
17 January 1985
22 February 1985
(PPW
900 1,700 3,300 6,600
13,000
900 1,700 3,300 6,600
13,000
900 1,700 3.300 6.600
13,000
250 500
1, o o o
2.100 4,200
250 500
1,000
2,100 4,200
250 500
1,000 2,100 4.200
( P P )
713 1,620 3,510 4,640
1 2,600b
881 1.690 3,260 6,400
12,500
927 1,730 3,350 6,630
13,200
282c 491c
1,020"
2,OlOC 4.280'
229 465 967
2,060 4,100
253 509 985
2,040 4,270
-21 -5 +6 +1 -3
-2 -1 -1 -3 -4
+3 +2 +2
0 +2
+I3 -2 +2
-4 +2
-8 -7 -3
-2 -2
+1 +2 -2 -3 +2
a Results o f duplicateanalyses Result pooled from duplicate analyses from top left. top right, a n d b t t o m ofblender
' Results of triplicateanalyses

TargetDetermined % Difference trationzedPreparedDatetfrom Datecentrationa
( P P W (PPm)
Rats 9 September 1986 12 September 1986 150 152 f l
300 307 +2
1 3 September 1986 75 70Sb9' -6 75 72.9c*d -3 75 70.8'*e -6
600 649b.C +8 600 659c*d +10 600 61 2e +2
13 November 1986 14 November 1986 75 74.2 -1 150 150 0 300 308 +3
18 November 1986 18 November 1986 600 603 +1
8 January 1987 9 January 1987 75 71.4 -5 150 149 -1 300 297 -1 600 594 -1
5 March 1987 6 March 1987 75 74.6 -1 150 154 +3 300 301 0
30 April 1987 1 May 1987 75 77.1 +3 150 156 +4 300 310 +3
25 June1987 28 June 1987 75 67.7 -10 300 289 -4
28-29 June 1987 150 148f -1
20 August 1987 22 August ,1987 75 81.8 +9 150 155 +3 300 326 +9
23 October 1987 27 October 1987 75 80.1 +7 150 159 +6 300 326 +9
17 December 1987 23 December 1987 75 81.6 +9 150 148 -1 300 308 +3
25 Februaly 1988 3 March 1988 75 78.7 +S 150 151 +1 300 289 -4
304 Tricresyl Phosphate, NTP TR 433
TABLE15 Results of Analysis of Dose Formulations Administered to Rats and Mice in the 2-Year Feed Studies of Tricresyl Phosphate
ConcenAnalyConTarge

305 Chemical CharacterizationandDoseFormulation
TABLEI5 Results of Analysis of Dose Formulations Administered to Rats and Mice in the 2-Year Feed Studies of Tricresyl Phosphate(continued)
Date Prepared Date Analyzed
Rats (continued) 7 April 1988 12 April 1988
2 June 1988 7-8 J u n e 1988
28 July 1988 29 July 1988
Mice 9 September 1986 13September 1986
30 September 1986 2 October 1986
2-6 October 1986
13November 1986 14 November 1986
8 January 1987 9 January 1987
1 3 January 1987 13January 1987
5 March 1987 6 March 1987
30April 1987 1 May 1987
25 June 1987 28-29 June 1987
20 August 1987 22 August 1987
TargetDetermined ConcentrationConcentration
(PPW
75 150 300
75 150 300
75 150 300
75 75 I 5
600 600 600
125 250
60
60 125 250
125 250
60
60 125 250
60 125 250
60 125 250
60 125 250
% Difference from Target
( P P W
72.7 -3 143 -5 286 -5
73.7 -2 153 +2 299 0
75.1 0 147 -2 292 -3
-6 -3 -6 +8
+10 +2
122 -2 249 0
59.7c -1
58.4 -3 129 +3 249 0
117 -6 249 0
59.4 -1
59.1 -2 124 -1 249 0
61.5 +3 129 +3 251 0
57.2' -5 130 +4 245f -2
63.0 +5 125 0 245 -2

306 Tricresyl Phosphate, NTP TR 433
TABLEI5 Results of Analysis of Dose Formulations Administered to Rats and Mice i n the 2-Year Feed Studies of Tricresyl Phosphate (continued)
Target Determined % Difference Date Prepared Date AnalyzedConcentrationConcentration from Target
( P P I ( P P W
Mice (continued) 23 October 1987 27 October 1987 60 59.0 -2
125 133 +6 250 259 +4
17 December 1987 23 December 1987 250 233 -7
23-28 December 1987 125 127' +2
23 December 1987 60 64.6 +8
25 February 1988 3 March 1988 60 61.7 +3 125 128 +2 250 226 -10
3 March 1988 4 March 1988 250 225 -10
7 April 1988 1 2 April 1988 60 60.2 0 125 128 +2 250 247 -1
2 June 1988 7-8 June 1988 60 55.5 -8 125 124 -1 250 248 -1
28 July 1988 29 J u l y 1988 60 59.5 -1 125 122 -2 250 245 -2
21 September 1988 23 September 1988 60 63.7 +6 125 120 -4 250 260 +4
a Results o f duplicaleanalyses Sample taken from top left of blender Results of tripticare analyses Sample taken from top right of blender
e Sampletakenfrombottom o f blender Results of quadruplicate analyses

307 Chemical Characterization and Dose Formulation
TABLEI 6 Results of Referee Analysis of Dose Formulations Administered toRats and Mice in the 13-Week Gavage Studies of Tricresyl Phosphate
Date Prepared
Rats
17 December 1982
Mice
12 October 1982
a Results of duplicateanalyses Results o f triplicate analyses
TABLEI7
Target Concentration (mdmL)
~~
80.0
80.0
DeterminedConcentration (mdrnL) Study Referee
Laboratorya Laboratoryb
~~
85.0 81.7 & 0.9
76.3 80.1 * 3.0
Results of Referee Analysis of Dose Formulations Administered t o Rats and Mice in the 13-Week and 2-Year Feed Studies of Tricresyl Phosphate
Date Prepared
13-Weeks
Rats
16 November 1984
2-Years
9 September 1986 25 February 1988
Mice
5 March 1987 20 August 1987 28 J u l y 1988
a Results o f duplicateanalyses Results o f triplicateanalyses
DeterminedConcentration (ppml Target Concentration Study Referee
( P P ) Llboratorya Laboratoryb
900 731 901 & 8
150 152 147 2 3 300 289 289 & 3
250 249 231 +- 4 60 63.0 60.0 It- 6.9
125 122 126 2 2

309
APPENDIX J FEED AND COMPOUND CONSUMPTION
IN THE 2-YEAR FEED STUDIES OF TRICRESYL PHOSPHATE
TABLEJl Feed and Compound Consumption by Male Rats in the 2-Year Feed Study of Tricresyl Phosphate ................................................. 310
TABLE J2 Feed and Compound Consumption by Female Rats in the 2-Year Feed Study of Tricresyl Phosphate ................................................. 311
TABLE 53 Feed and Compound Consumption by Male Mice in the 2-Year Feed Study of Tricresyl Phosphate . . . . . . . . . . . . . . . . . . . . . . . . . . . . . . . . . . . . . . . . . . . . . . . . . 312
TABLE54 Feed and Compound Consumption by Female Mice in the 2-Year Feed Study of Tricresyl Phosphate ................................................. 313

Dose/ Feed
310 Tricresyl Phosphate, NTP TR 433
TABLEJl Feed and Compound Consumption by Male Rats in the 2-Year Feed Study of Tricresyl Phosphate
0 pprn 75 ppm 150 pprn 300 pprn Body Feed Dose/ Body Feed Body Feed Body Dosel
WeighlDay(glday)Weighl(glday)aWeightWeighl(glday) (glday) Dayb Day Week (g) ts) (n1glWday) (9) (nWk&" (8) m"aY)
3 15.3 175 15.7 170 7 16.5 174 14 16.4 173 29 4 16.6 205 16.4 202 6 16.4 204 12 16.9 203 25 7 16.6 264 16.3 264 5 17.1 266 10 17.3 263 20 8 15.9 274 17.1 278 5 16.3 279 9 15.9 276 17 10 16.3 299 17.7 302 4 17.3 301 9 17.4 299 18 11 16.6 309 16.6 311 4 16.9 31 4 8 16.9 310 16 12 15.6 315 15.5 318 4 15.5 320 7 15.7 315 15 17 17.0 354 16.2 352 3 16.6 353 7 16.5 352 14 20 16.6 377 16.6 378 3 16.9 380 7 16.9 374 14 21 17.6 373 16.1 373 3 17.3 366 7 17.5 365 14 24 16.0 394 16.5 399 3 16.2 401 6 16.2 392 12 25 17.6 385 17.3 393 3 17.9 381 7 18.2 380 14 28 16.6 411 16.1 411 3 16.5 412 6 17.1 403 13 29 17.5 404 17.7 400 3 17.7 398 7 18.1 3% 14 32 15.2 423 15.5 420 3 15.7 429 6 15.2 418 11 33 16.7 408 17.1 410 3 16.6 404 6 17.2 401 13 36 15.5 429 15.7 426 3 15.1 434 5 14.6 420 11 37 16.8 415 16.1 417 3 17.1 408 6 17.6 406 13 40 16.7 431 16.2 442 3 16.8 436 6 16.5 432 11 41 17.2 423 17.3 427 3 17.7 415 6 17.3 414 13 44 15.3 441 16.2 440 3 15.9 449 5 16.2 446 11 45 19.6 429 19.1 430 3 18.1 418 7 19.0 419 14 48 17.1 455 16.7 452 3 17.2 454 6 16.8 455 11 49 18.2 438 18.6 441 3 19.1 429 7 19.8 426 14 52 14.1 455 15.4 453 3 15.6 458 5 15.0 456 10 53 18.0 429 19.0 446 3 16.8 428 6 17.9 422 13 56 14.8 453 14.7 456 2 14.9 455 5 14.6 454 10 57 14.4 438 18.6 443 3 18.1 432 6 17.2 426 12 60 16.1 457 16.9 460 3 16.8 458 6 16.4 460 11 61 18.5 442 17.9 444 3 18.4 435 6 18.1 429 13 64 15.3 467 15.8 464 3 15.2 462 5 14.4 466 9 65 18.5 441 17.9 450 3 18.4 436 6 18.1 431 13 69 16.0 442 16.7 450 3 15.6 434 5 16.5 433 11 73 14.2 445 15.1 453 3 15.2 441 5 16.0 437 11 77 15.7 445 15.8 450 3 16.8 444 6 16.1 436 11 81 15.7 443 15.6 450 3 15.6 441 5 15.7 436 11 85 15.1 444 14.8 444 3 14.9 439 5 13.8 427 10 89 14.0 445 14.4 443 2 14.0 436 5 13.5 421 10 93 15.0 432 15.7 435 3 16.3 434 6 15.4 428 11 97 12.9 437 16.0 440 3 15.6 433 5 14.7 430 1 0 101 12.7 421 14.6 426 3 14.1 428 5 14.6 417 11 104 12.7 412 14.6 421 3 14.1 424 5 14.6 419 11
Mean lor weeks 1-13 16.1 263 15.5 264 4.9 16.6 265 9.8 16.6 263 19.9 14-5216.7 414 16.7 415 3.0 16.9 413 6.2 17.0 409 12.5 53-10415.3 441 16.1 446 2.7 15.9 439 5.4 15.7 434 10.9
a Grams of feed consumed per anin~alper day Milligrams o f tricresyl phosphate consunled per day per kilogram body weight

311 Feed and CompoundConsumption
TABLE52 Feed and Compound Consumption by Female Rats i n the 2-Year Feed Study of Tricresyl Phosphate
0 ppm 75 ppm 150 ppm 300 ppm Feed Body Feed Body Dose/ Feed Body Dose/ Feed Body Dose/
Weight (&day) Weight Dayb (&day) Weight Day (&day) Weight Day Week (g) (S) (nl&k"aY) (g) (n1&k"aY) (€9 (m&k"ay)
3 11.4 126 11.6 125 7 11.6 128 14 11.7 126 28 4 11.9 140 11.8 139 6 12.2 141 13 11.9 140 26 7 11.8 164 11.8 168 5 11.7 168 11 11.5 166 21 8 11.2 170 11.1 173 5 11.6 173 10 11.9 171 21
11 11.2 182 11.4 181 5 10.8 183 9 11.6 183 19 12 10.5 182 10.0 184 4 10.3 186 8 9.9 183 16 13 10.7 185 10.9 186 4 10.7 188 9 10.9 186 18 17 12.0 1% 11.4 195 4 10.8 199 8 11.2 197 17 20 11.0 208 11.4 211 4 11.5 204 9 10.7 206 16 21 11.7 204 11.6 203 4 11.3 207 8 11.6 201 17 24 10.5 215 10.3 21 9 4 10.6 210 8 10.9 213 15 25 11.4 210 11.7 209 4 11.5 214 8 11.4 210 16 28 10.6 220 10.4 226 3 11.0 218 8 10.5 218 15 29 11.4 216 11.3 213 4 11.3 222 8 11,3 214 16 32 10.4 225 10.0 230 3 10.4 226 7 10.2 226 14 33 11.2 220 10.9 219 4 10.8 224 7 11.2 221 15 36 10.4 231 10.2 229 3 10.2 228 7 10.3 229 14 37 11.0 228 11.4 224 4 11.4 232 7 11.7 226 16 40 11.7 236 11.4 241 4 11.9 235 8 11.5 237 15 41 11.8 234 12.1 232 4 11.8 239 7 11.8 234 15 44 11.3 241 11.1 246 3 11.4 244 7 11.8 242 15 45 13.1 242 13.7 237 4 13.6 248 8 13.6 241 17 48 12.2 256 11.9 262 3 12.1 260 7 12.0 255 14 49 13.7 252 14.9 249 5 14.1 259 8 14.8 249 18 52 10.8 261 10.9 274 3 11.1 270 6 10.6 264 12 53 12.0 262 14.2 256 4 13.2 258 8 13.1 251 15 56 10.9 264 10.7 281 3 11.5 275 6 10.8 268 12 57 12.1 268 14.8 263 4 12.7 274 7 14.0 264 16 60 12.9 275 12.3 288 3 13.0 283 I 12.8 282 14 61 14.1 279 14.9 273 4 13.9 285 7 15.2 270 17 64 12.0 286 11.6 301 3 11.9 297 6 11.5 298 12 65 14.1 289 14.9 285 4 13.9 297 7 15.2 286 16 69 12.5 299 12.8 294 3 12.0 303 6 12.8 292 13 73 11.1 310 12.1 304 3 12.1 312 6 12.3 304 12 77 12.3 312 12.5 308 3 12.8 317 6 12.2 307 12 81 12.7 319 12.7 315 3 12.3 324 6 12.3 312 12 85 12.3 325 12.5 322 3 12.5 332 6 12.7 318 12 89 11.3 323 11.2 323 3 11.1 328 5 11.3 317 11 93 13.2 326 12.9 330 3 13.0 335 6 12.4 324 12 97 11.3 328 12.6 331 3 12.4 336 6 12.0 319 11
101 10.4 319 11.6 327 3 10.6 332 5 10.5 312 10 104 10.4 315 11.6 320 3 10.6 332 5 10.5 313 10
Mean for weeks 1-13 11.2 164 11.2 165 5.2 11.3 167 10.4 11.3 165 21.1 14-52 11.4 228 11.5 229 3.8 11.5 230 7.5 11.5 227 15.3 53-104 12.1 300 12.7 301 3.2 12.3 307 6.1 12.4 297 12.7
a Grams o f feed consumed per animal per day Milligrams o f tricresyl phosphate consumed per day per kilogram h l y weight

312 Tricresyl Phosphate, NTP TR 433
TALSLE53 Feed and Compound Consumption by Male Mice in the 2-Year Feed Study of Tricresyl Phosphate
0 pprn 60 ppm 125 ppm 250 ppm Feed Body Feed Uody Dose/ Feed Body Dose/ Feed Body Do&
(glday)a Weight (g/day) Weight Dayb (gldny) Weight Day (g/day) Weight Day Week (9) (6) (rng/k"ay) (€9 (n1glki"ay) (g) ( W k w Y )
4 4.2 25.6 4.2 25.5 1 0 4.0 25.4 20 4.4 25.5 44 5 4.8 26.3 4.8 26.1 11 5.0 26.4 24 4.7 26.3 45 8 4.7 28.6 4.4 28.5 9 4.4 28.6 19 4.5 28.8 39 9 4.8 29.4 5.0 29.4 10 5.1 29.3 22 5.2 29.4 44
12 4.6 31.8 4.9 31.7 9 4.9 31.4 20 5.o 31.8 39 13 5.7 32.0 5.5 32.0 10 5.2 31.9 21 5.6 32.3 43 17 4.6 34.6 4.9 34.6 8 4.7 35.0 17 4.8 35.5 34 21 4.7 36.5 4.5 36.4 8 4.4 36.8 15 4.7 37.2 31 25 4.5 38.3 4.9 38.5 8 4.4 38.9 14 4.5 39.7 28 29 4.7 39.6 4.7 39.5 7 4.5 39.8 14 4.6 40.8 28 33 4.6 41.0 4.4 40.9 7 4.2 41.4 13 4.3 41.9 26 37 4.4 42.9 4.4 43.1 6 4.2 43.5 12 4.4 44.1 25 41 4.3 42.9 4.0 42.4 6 4.0 42.8 12 4.1 44.1 23 45 4.2 43.6 4.2 43.9 6 4.0 44.3 11 4.4 45.7 24 49 4.9 45.3 4.9 45.5 7 4.7 45.7 13 5.0 47.3 27 53 4.0 45.2 4.3 45.8 6 4.2 46.3 11 4.3 47.4 23 57 3.9 46.2 4.5 46.4 6 4.3 46.3 12 4.4 47.9 23 61 4.2 46.4 4.6 47.0 6 4.3 47.7 11 4.5 48.3 24 65 4.4 41.2 4.7 47.8 6 4.4 48.4 11 4.7 48.6 24 69 4.3 48.0 4.2 47.7 5 4.2 49.1 11 4.5 48.7 23 73 3.9 46.5 4.0 47.6 5 4.1 49.0 11 4.1 48.1 21 77 4.2 48.0 4.2 48.8 5 4.2 50.2 10 4.1 49.6 21 81 4.2 47.3 4.1 48.5 5 4.3 50.1 11 4.3 49.2 22 85 4.9 46.3 4.2 47.7 5 4.2 49.0 11 4.3 47.7 22 89 4.5 47.3 4.3 48.7 5 4.5 50.1 11 4.6 49.2 23 93 4.4 46.6 4.2 46.9 5 4.3 49.1 11 4.4 48.3 23 97 4.4 47.2 4.2 47.4 5 4.1 48.7 11 4.5 48.5 23
101 3.7 46.1 3.7 45.8 5 3.9 48.6 10 4.1 46.9 22 105 4.0 44.7 3.9 43.7 5 3.9 47.0 10 4.0 44.3 23
Mean lor weeks 1-13 4.8 29.0 4.8 28.9 10 4.8 28.8 2 1 4.9 29.0 42 14-52 4.5 40.5 4.6 40.5 7 4.4 40.9 13 4.5 41.8 27 53-1054.2 46.6 4.2 47.1 5 4.2 48.5 11 4.3 48.1 23
a Grams o f feed consumed per animal per day Milligrams o f tricresyl phosphate consumed per day per kilogram body weight

313 Feed and Compound Consumption
TABLE54 Feed and Compound Consumption by Female Mice in the 2-Year Feed Study of Tricresyl Phosphate
0 ppm 60 ppn1 125 ppm 250 ppm Feed Body Feed Body Dose/ Feed Body Dose/ Feed Body Dose/
(&day)’ Weighl (%day) Weight Dayb (glday) Weighl Day (glday) Weight Day Week (9) (s) ( n 1 d W W ) 19) (n1glk”ay) (9) (mgncglaay)
4 4.7 22.2 4.7 22.2 13 4.6 22.1 26 4.7 21.8 54 5 5.7 22.8 5.2 23.1 14 5.8 23.1 31 5.8 23.0 64 8 5.7 25.5 5.5 26.1 13 5.5 25.9 27 5.6 25.9 54 9 6.6 26.3 6.5 26.7 15 6.3 26.9 29 6.7 26.3 64
12 6.6 28.4 7.1 29.3 15 6.4 29.1 27 7.3 28.6 64 13 7.9 29.1 7.9 29.7 16 7.1 29.9 30 8.0 29.2 69 17 5.5 31.9 5.9 33.3 11 5.7 33.2 21 5.9 32.9 45 21 5.7 34.8 6.0 35.7 10 6.3 35.5 22 6.3 35.2 45 25 6.5 37.1 6.5 38.3 10 6.1 38.3 20 6.5 31.5 44 29 7.1 38.6 6.8 39.3 1 0 6.4 39.2 20 7.2 39.0 46 33 6.5 40.0 6.3 41.0 9 6.3 40.9 19 6.9 40.5 42 37 6.2 41.6 6.2 42.9 9 6.2 42.4 18 6.6 42.3 39 41 6.1 42.1 6.0 41.7 9 6.8 41.7 21 6.6 41.6 40 45 6.6 43.0 6.2 43.9 9 6.7 43.8 19 6.9 43.8 39 49 7.2 44.9 6.1 45.0 9 6.3 45.1 17 6.5 45.5 36 53 6.3 45.2 5.8 45.8 8 5.7 45.5 16 6.4 46.3 35 57 6.4 45.6 5.9 46.4 8 5.6 45.9 15 6.1 46.5 33 61 6.3 47.0 5.8 47.9 7 5.6 41.8 15 5.6 47.9 29 65 5.7 41.8 5.6 49.1 7 5.5 49.1 14 5.9 49.0 30 69 5.1 49.0 5.1 50.3 6 5.1 50.2 13 5.8 49.7 29 73 4.7 48.8 4.9 50.0 6 5 .O 50.1 12 5.2 49.6 26 77 5.0 50.9 5.1 51.6 6 5.1 51.1 13 5.1 50.9 25 81 4.9 50.8 4.8 51.6 6 5.0 51.3 12 5.0 51.6 24 85 5.5 49.1 4.9 50.9 6 4.9 50.4 12 5.0 50.1 25 89 5.2 50.8 4.9 51.7 6 5.2 51.1 13 5.5 51.3 27 93 4.6 50.3 4.6 51.1 5 4.7 50.6 12 5.O 50.5 25 97 4.9 50.2 4.8 50.6 6 4.9 49.7 12 5.1 50.8 25
101 4.4 49.1 4.3 50.4 5 4.5 49.0 11 4.8 48.9 24 105 4.8 46.7 4.7 47.0 6 4.5 47.1 12 4.8 46.0 26
Mean for weeks 1-13 6.2 25.7 6.2 26.2 14 5.9 26.2 28 6.4 25.8 61 14-52 6.4 38.4 6.3 40.1 9 6.3 40.1 20 6.6 39.8 42 51105 5.3 48.7 5.1 49.6 6 5.1 49.2 13 5.4 49.2 27
a Grams o f feed consumed p e r animal per day Milligrams o f tricresyl phosphate consumed per day per kilogram hody weight

315
APPENDIX K INGREDIENTS, NUTRIENT COMPOSITION,
AND CONTAMINANT LEVELS IN NIH-07 RAT AND MOUSE RATION
TABLEK1 Ingredients of NIII-07 Rat and Mouse Ration ............................... 316 TABLEK2 Vitamins and Minerals in NIB-07 Rat and Mouse Ration ...................... 316 TABLEK3 Nutrient Composition of NIII-07 Rat and Mouse Ration ....................... 317 TABLEK4 Contaminant Levels in NIII-07 Rat and Mouse Ration ........................ 318

316
TABLEK 1 Ingredients of NIII-07 Rat and Mouse Ration’
Ingredientsb
Ground #2 yellow shelled corn Ground hard winterwheat Soybean meal (49% protein) Fishmeal (60% protein) Wheat middlings Dried skim m i l k Alfalfa meal (dehydrated, 17% protein) Corn gluten m e a l (60% protein) Soy oil Dried brewer’s yeast Dry molasses Dicalcium phosphate Ground limestone Salt Premixes (vitamin and mineral)
a NCI, 1976; NIH,1978
Tricresyl Phosphate, NTP TR 433
Percent by Weight
24.50 23.00 12.00 10.00 10.00 5.00 4.00 3.00 2.50 2.00 1.50 1.w 0.50 0.50 0.25
Ingredients were ground to pass through a U.S. Standard Screen No. 16 before b e i n g mixed.
TABLEK2 Vitamins and Minerals in NIH-07 Rat and Mouse Ration’
Vitamins A
D3 K3 d-a-Twopheryl acetate Choline Folic acid Niacin &Pantothenic acid Riboflavin Thiamine B12 Pyridoxine Biotin
Minerals Iron Manganese Zinc CopperIodine Cobalt
a Perton (2,OOO Ib) o f finishedproduct
Amount
5,500,000 IU 4,600,000 I U
2.8 g 20,000 I U
560.0 g 2.2 g
30.0 g 18.0 g 3.4 g
10.0 g 4w-3 lrg
1.7 g 140.0 mg
120.0 g 60.0g 16.0 g 4.0 g 1.4 g 0.4 g
Source
Stabilized vitamin A palmitate or acetate D-activated animal sterol Menadione
Choline chloride
d-Calcium pantothenate
Thiamine mononitrate
Pyridoxine hydrochloride d-Biotin
Iron sulfate Manganous oxide Zinc oxide Copper sulfate Calcium iodate Cobalt carbonate

Feed Analyses 317
TABLEK3 Nutrient Composition of NIII-07 Rat and Mouse Ration
Nutrient
Protein (% by weight) Crude Fat (% by weight) Crude Fiber (% by weight) Ash (% by weight)
Amino Acids (% of total diet) Arginine Cystine Glycine Histidine Isoleucine Leucine Lysine Methionine Phenylalanine Threonine Tryptophan Qrosine Valine
Essential Fatty Acids (% of total diet) Linoleic Linolenic
Vitamins Vi tamin A (lU/lig) Vitamin D (IUkg) a-Tocopherol (ppm) Thiamine (ppm) Riboflavin (ppm) Niacin (ppm) Pantothenic Acid (ppm) Pyridoxine (pprn) Folic Acid (ppm) Biotin (ppm) Vitamin BIZ(ppb) Choline (ppm)
Minerals Calcium (%) Phosphorus (a)Potassium (%) Chloride (%) Sodium (76) Magnesium (%) Sulfur (%) Imn(PPrn)Manganese (ppm) Zinc (ppm) Copper (PPm)Iodine (pprn) Chromium (ppm) Cobalt (ppm)
Mean 2 Standard Deviation
22.48 2 0.84 5.45 2 0.32 3.49 2 0.31 6.82 2 0.33
1.287 f 0.084 0.306 2 0.075 1.160 f 0.050 0.580 f 0.024 0.917 2 0.034 1.972 f 0.052 1.273 f 0.051 0.437 k 0.115 0.994 f 0.125 0.896 f 0.055 0.223 2 0.160 0.677 f 0.105 1.089 f 0.057
2.389 k 0.233 0.277 f 0.036
6,316 f 1,143 4,450 f 1,382 36.92 & 9.32 19.89 f 2.76 7.92 f 0.93
100.95 & 25.92 30.30 k 3.60 9.25 5 2.62 2.51 2 0.64
0.267 f 0.049 40.14 2 20.04 3,608 2 314
1.25 2 0.12 0.97 f 0.06
0.887 2 0.067 0.526 f 0.092 0.315 f 0.344 0.168 f 0.008 0.274 f 0.063 356.2 2 90.0 92.24 f 5.35 58.14 f 9.91 11.50 f 2.40 3.70 f 1.14 1.71 f 0.45
0.797 t 0.23
Range
21.30 4.80 3.00 6.01
1.100 0.181 1.060 0.531 0.867 1.8501.200 0.306 0.665 0.824 0.107 0.564 0.962
1.830 0.210
4,500 3,000 22.5 15.0 6.10 65.0 23.0 5.60 1.80 0.19 10.6
2,400
0.96 0.85
0.772 0.380 0.258 0.151 0.208 255.0 81.70 46.10 8.090 1.52 0.85
0,490
24.00 5.90 4.10 7.27
1.390 0.400 1.220 0.608 0.965 2.040 1.370 0.699 1.110 0.985 0.671 0.794 1.170
2.570 0.320
8,240 6,300 48.9 25.0 9.00 150.0 34.6 14.0 3.70 0.35 65.0 3,430
1.45 1.10 0.971 0.635 0.370 0.180 0.420 523.0 99.40 81.60 15.39 5.83 2.09 1.150
Number of Samples
18 18 18 18
10 10 10 10 10 10 10 10 10 10 10 10 10
9 9
18 4 9
18 10 9
10 1 0 10 10 10 9
18 18 8 8
10 10 10 10 10 10 10 10 9 6

318 Tricresyl Phosphate, NTP TR 433
TABLEK4 Contaminant Levels in NIII-07 Rat and Mouse Ration
Contaminants Arsenic (ppm) Cadmium (ppm) Lead (PPm)Mercury (ppm)b Selenium (ppm) Aflatoxins (ppb) Nitrate nitrogen (ppm)" Nitrite nitro en (ppm)"5BHA (PPm), BHT (PPm)Aerobic plate count (CFU/g)e C o l i f o r m ( M P N / ~ ) ~ E. coli (MPN/g)g Total Nitrosoamines (ppb)h N-Nitrosodimethylamine (p b)h N-Nitrosopyrrolidine (ppb) R
Pesticides (ppm) U-BHC'
8-BHC v-BHC 6-BHC Heptachlor Aldrin Heptachlor epoxide DDE DDD DDT HCB Mirex Methoxychlor Dieldrin Endrin Telodrin Chlordane Toxaphene Estimated PCBs Ronnel Ethion Trithion Diazinon Methyl parathion Ethyl parathion Malathion Endosulfan I Endosulfan I1 Endosulfan sulfate
Mean & Standard Deviationa
0.32f 0.21 co.10 0.26f 0.15 0.05 f 0.01 0.35f 0.10
<5.0 21.79f 9.46 0.13f 0.06 4.44f 6.45 1.oo
302.4442 326,586 200.12 268.9 3.11 20.32 10.10& 3.91 7.86 2 3.38 2.24& 1.26
<0.01 <0.02 CO.01 <0.01 <0.01 co.01 <0.01 co.01 <0.01 co.01 co.01 CO.01
co.05 co.01 co.01 co.01 <0.05 <0.1 c0.2 c0.01 <0.02 <0.05 <0.1
<0.02 <0.02 0.172 0.20 <0.01 <0.01 ~0.03
Range
0.05 -0.17
0.05-0.60 0.05 -0.80 0.20- 0.55
0.30- 34.0 <0.10-0.30 C2.00-3.00
38,Ooo - 1,200,Ooo c3.00- 1,100 <3.00 -4.00
5.00 - 19.40 3.20- 14.00 1.00-5.40
0.05 -0.85
Number of Samples
18 18 18 18 18 18 18 18 18 18 18 18 18 18 18 18
1 8 1 8 18 18 18 18 18 18 18 18 18 18 18 18 18 18 18 18 18 18 18 18 18 18 18 18 18 18 18

Feed Analyses 319
TABLEK4 Contaminant Levels i n NIII-07 Rat and Mouse Ration (continued)
a For values less than the l imi t of detection. the detection limit is given as the mean. One lot milled 3 September 1986 contained 0.08 ppm, a l l other lots were less t h a n or equal to the detection limit . Sources o f contamination: alfalfa, grains, and fishmeal Sources of contamination: soy oil and fish meal
e CFU - colonyformingunits MPN - most probable numkr
g Two lots milled 6 May 1987 and 4 April 1988 contained 4 MPN; all other lots contained 3 MPN o r less. h A J I values were corrected for % recovely' BHC is hexachlorocyclohexaneor knzene hexachloride

321
APPENDIX L SENTINEL ANIMAL PROGRAM
M E T ~ ~ O D S . . . . . . . . . . . . . . . . . . . . . . . . . . . . . . . . . . . . . . . . . . . . . . . . . . . . . . . . . . . . . . . . . . . . . 322 TABLELl MurineVirus Antibody Determinations forRatsandMice
in the 13-Week and2-Year Studies of Tricresyl Phosphate . . . . . . . . . . . . . . . . . ... .. 325

322 Tricresyl Phosphate, NTP TR 433
SENTINEL ANIMAL PROGRAM METIIODS Rodents used in the Carcinogenesis Programof the National Toxicology Program are produced in optimally clean facilities t o eliminate potential pathogens that may affect study results. The Sentinel Animal Program is part o f the periodic monitoringo f animal health that occurs during the toxicologic evaluation o f chemical compounds. Under this program, the disease state of the rodents is monitored via serology on sera from extra (sentinel) animals in the study rooms. These animals and the study animals are subject to identical environmental conditions. The sentinel animals come from the same production source and weanling groups as the animals used for the studies o f chemical compounds.
Rats During the 13-week gavage study, samples for viral screening were collected from five male and five female control animals. These samples were processed appropriately and were submitted to Microbiological Associates, Inc. (Bethesda, MD), for determination o f antibody titers. The following tests were performed:
Method o f Analvsis Time o f Analvsis Complement Fixation
RCV (rat coronavirus) Study termination
Hemagglutination Inhibition H-1 (Toolan’s H-1 virus) Study termination KRV (Kilham rat virus) Study termination PVM (pneumonia virus of mice) Study termination Sendai Study termination
During the 13-week feed study, samples for viral screening were collected from five male and five female control animals. These samples were processed appropriately and were submitted to Microbiological Associates, Inc., for determination o f antibody titers. The following tests were performed:
Method o f Analvsis Time o f Analvsis ELISA
Mycopl~sntopulntonis Study termination PVM Study termination RCV/SDA (rat coronavirus/sialodacryoadenitisvirus) Study termination Sendai S tudy termination
Hemagglutination Inhibition H-1 Study termination KRV Study termination

323 Sentinel Animal Program
During the 2-year feed study, 15 male and 15 female F344/N rats were maintained with the study animals to serve as sentinel animals. Blood samples were taken from five males and five females at 6, 12, and 18 months. Samples for viral screening at 24 months were collected from high-dose male and female rats. In addition, at 6, 12, and 15 months, blood samples were taken from five male and female rats designated for interim evaluations. Blood collected from each animal was allowed t o clot and the sera were separated, cooled on ice, and shipped t o Microbiological Associates, Inc., for determination o f antibody titers. The following tests were performed:
Method o f Analvsis Time o f Analysis ELISA
CARB (cilia-associated respiratory virus) 12 months Mycoplasntn artht-itidis 24 months M. pulntonis 24 months PVM 6, 12, 15, 18, and 24 months RCVISDA 6, 12, 15, 18, and 24 months Sendai 6, 12, 15, 18, and 24 months
Hemagglutination Inhibition H-1 6, 12, 15, lS,and 24 months KRV 6, 12, 15, 18, and 24 months
Immunofluorescence Assay CARB 12 months (core group only) LCM (lymphocytic choriomeningitis virus) 24 months
Mice During the 13-week feed study, samples for viral screening were collected from five male and five female control animals. These samples were processed appropriately and were submitted t o Microbiological Associates, Inc., for determination o f antibody titers. The following tests were performed:
Method o f Analysis Time o f Analvsis Complement Fixation
LCM Study termination
ELISA Ectromelia virus Study termination GDVII(mouseencephalomyelitis virus) Study termination M. at-rhriridis Study termination M. pulntonis Study termination MHV (mouse hepatitis virus) Study termination Mouse adenoma virus Study termination PVM Study termination Reovirus 3 Study termination Sendai Study termination
Hemagglutination Inhibition K (papovavirus) Study termination MVM (minute virus o f mice) Study termination Polyoma virus Study termination
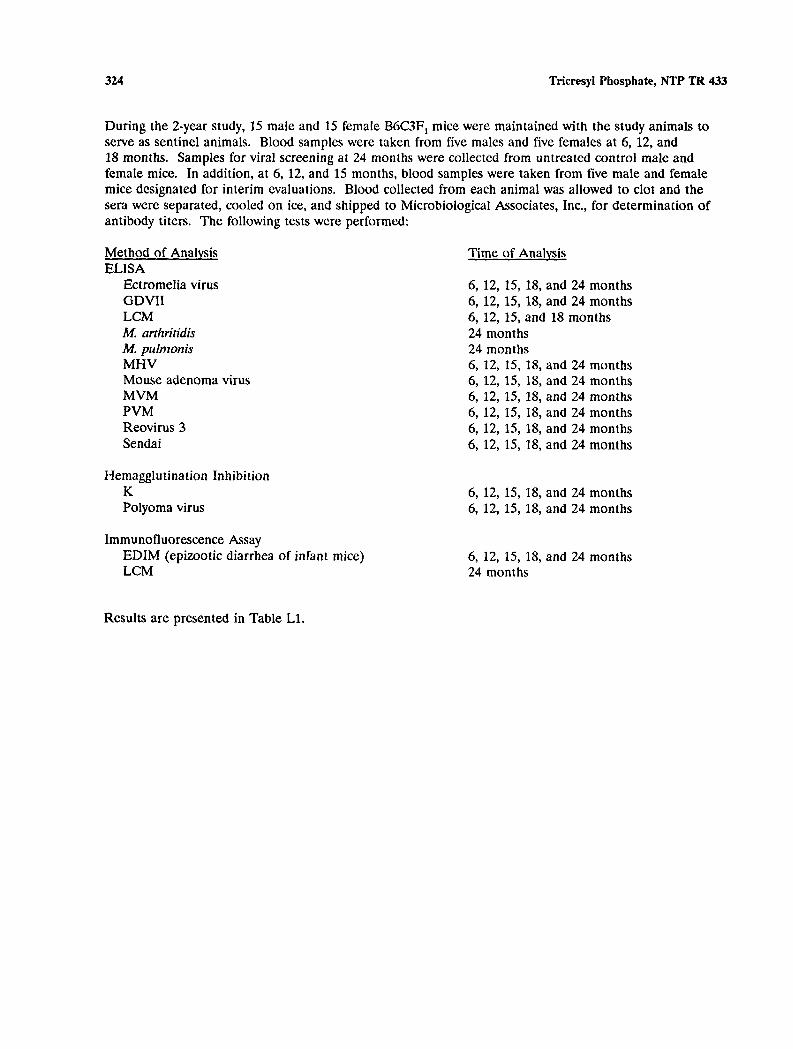
324 Tricresyl Phosphate, NTP TR 433
During the 2-year study, 15 male and 15 female B6C3Fl mice were maintained with the study animals to serve as sentinel animals. Blood samples were taken from five males and five females at 6, 12, and 18 months. Samples for viral screening at 24 months were collected from untreated control male and female mice. In addition, at 6, 12, and 15 months, blood samples were taken from five male and female mice designated for interim evaluations. Blood collected from each animal was allowed to clot and the sera were separated, cooled on ice, and shipped to Microbiological Associates, Inc., for determination o f antibody titers. The following tests were performed:
Method o f Analysis Time of Analysis ELISA
Ectromelia virus 6, 12, 15, 18, and 24 months G D V I I 6, 12, 15, 18, and 24 months LCM 6, 12, 15, and 18 months M.arthritidis 24 months M. pulntonis 24 months MHV 6, 12, 15, 18, and 24 months Mouse adenoma virus 6, 12, 15, 18, and 24 months MVM 6, 12, 15, 18, and 24 months PVM 6, 12, 15, 18, and 24 months Reovirus 3 6, 12, 15, 18, and 24 months Sendai 6, 12, 15, 18, and 24 months
Hemagglutination Inhibition K 6, 12, 15, 18, and 24 months Polyoma virus 6, 12, 15, 18, and 24 months
Immunofluorescence Assay EDIM (epizootic diarrhea o f infant mice) 6, 12, 15, 18, and 24 months LCM 24 months
Results are presented in Table L1.

325 SentinelAnimal Program
TABLEL1 Murine Virus Antibody Determinations for Rats and Mice in the 13-Week and 2-Year Studies of Tricresyl Phosphate
Interval
13-Week Gavage Study Rllk 13weeks
13-Week Feed Studies Rllk
Mice
2-Year Studies Rllis
Mice
13 weeks
13 weeks
6 months (core) 6 months (interim)
12 months (core) 12 months (interim)
15 m o n t h s
18 m o n t h s
24 m o n t h s
6 months (core) 6 months (interim)
12 months (core) 12 months (interim)
15 months
1 8 months
24 months
Incidences of Antibody Positive Serologic in Sentinel Animals Reaction for
1/10 Sendai 4110 RCV
0110 None positive
Oi9 None positive
0110 None positive 0/10 None positive
l/l@ CARB on0 None positive
0110 None positive
0110 None positive
0110 None positive
0110 None positive 0110 None positive
011 0 None positive 0110 None positive
011 0 None positive
0110 None positive
0110 None positive
a Serum from this animal was positive for CARB using ELISA and IFA.

NATIONAL TOXICOLOGY PROGRAM TECHNICAL REPORTS PRINTED AS OF SEPTEMBER 1994
TR No. CHEMICAL
201 2,3,7,8-Tetrachlorodibenzo-pdioxin(Dermal) 206 1,2-Dibromo-3-chloropropane 207 Cytembena 208FD & C Yellow No. 6 209 2,3,7,8-Tetrachlorodibenzo-pdioxin(Gavage) 2101,2-Dibromoethane 211 C.I. Acid Orange10 212 Di(2-ethylhexy1)adipate 213ButylBenzylPhthalate 2 14 Caprolactam 215Bisphenol A 21611-AminoundecanoicAcid 217 Di(2-ethylhexy1)phthalate 219 2,6-Dichloro-p-phenylenediamine 220 C.I. Acid Red 14 221LocustBeanGum 222 C.I. Disperse Yellow 3 223Eugenol 224 Tara Gum 225 D & C Red No. 9 226 C.I. Solvent Yellow14 227GumArabic 228VinylideneChloride 229Guar Gum 230Agar 231 Stannous Chloride 232Pentachloroethane 2332-BiphenylatnineHydrochloride 234AllylIsothiocyanate 235Zearalenone 236D-Mannitol 237 1,1,1,2-Tetrachloroethane 238Ziram 239 Bis(2-chloro-I-methy1ethyl)ether 240PropylGallate 242DiallylPhthalate(Mice) 243Trichlorethylene(RatsandMice) 244PolybrominatedBiphenylMixture 245Melamine 246ChrysotileAsbestos(Hamsters) 247L-AscorbicAcid 2484,4'-MethylenedianilineDihydrochloride 249 AmositeAsbestos(Hamsters) 250BenzylAcetate 251 2,4- & 2,6-TolueneDiisocyanate 252GeranylAcetate 253 AllylIsovalerate 254Dichloromethane(MethyleneChloride) 2551,2-Dichlorobenzene 257DiglycidylResorcinolEther 259EthylAcrylate 261Chlorobenzene 2631,2-Dichloropropane 266Monuron 2671,2-Propylene Oxide 269 Telone 11" (1,3-Dichloropropene) 271 HCBlueNo. 1 272 Propylene
TR No. CHEMICAL
273Trichloroethylene(FourRatStrains) 274 Tris(2-ethylhexy1)phosphate 2752-Chloroethanol 2768-Hydroxyquinoline 277Tremolite 2782.6-Xylidine 279AmositeAsbestos 280CrocidoliteAsbestos 281HCRed No. 3 282Chlorodibromomethane 284Diallylphthalate(Rats) 285 C.I. Basic Red 9 Monohydrochloride 287DimethylHydrogenPhosphite 2881.3-Butadiene 289Benzene 291Isophorone 293HCBlue No. 2 294ChlorinatedTrisodiumPhosphate 295ChrysotileAsbestos(Rats) 296 Tetrakis(hydroxymethyl)phosphonium Sulfate &
Tetrakis(hydroxymethyl)phosphonium Chloride 298Dimethyl Morpholinophosphoramidate 299 C.I. Disperse Blue 1 300 3-Chloro-2-methylpropene 301o-Phenylphenol 303 4-Vinylcyclohexene 304ChlorendicAcid 305ChlorinatedParaffins (Cn, 43% chlorine) 306Dichloromethane(MethyleneChloride) 307EphedrineSulfate 308ChlorinatedParaffins (C,,, 6 0 % chlorine) 309DecabromodiphenylOxide 310MarineDieselFueland JP-5 NavyFuel 3 1 1 Tetrachloroethylene (Inhalation) 312n-ButylChloride 313Mirex 3 14 MethylMethacrylate 315OxytetracyclineHydrochloride 316 1-Chloro-2-methylpropene 317ChlorpheniramineMaleate 3 18 AmpicillinTrihydrate 3191,4-Dichlorobenzene 320Rotenone 321Bromodichloromethane 322PhenylephrineHydrochloride 323DimethylMethylphosphonate 324BoricAcid 325Pentachloronitrobenzene 326EthyleneOxide 327Xylenes(Mixed) 328MethylCarbamate 3291,2-Epoxybutane 3304-Hexylresorcinol 331Malonaldehyde,Sodium Salt 3322-Mercaptobenzothiazole 333 N-Phenyl-2-naphthylamine 3342-Amino-5-nitrophenol 335 C.I. Acid Orange 3

NATIONAL TOXICOLOGY PROGRAM TECHNICAL REPORTS PRINTED AS OF SEPTEMBER 1994 (CONT.)
TR No.
336 337 338 339 340 341 342 343 344 345 346 347 348 349 350 351 352 353 354 355 356 357 358 359 360 361 362 363 364 365 366 367 368 369 370 37 1 372 373 374 375 376 377 378 379 380 381 382 384 385
CHEMICAL
Penicillin VK Nitrofurazone Erythromycin Stearate 2-Amino-4-nitrophenol Iodinated Glycerol Nitrofurantoin Dichlorvos Benzyl Alcohol Tetracycline Hydrochloride Roxarsone Chloroethane D-Limonene or-Methyldopa Sesquihydrate Pentachlorophenol Tribromomethane p-Chloroaniline Hydrochloride N-Methylolacrylamide 2.4-Dichlorophenol Dimethoxane Diphenhydramine Hydrochloride Furosemide Hydrochlorothiazide Ochratoxin A 8-Methoxypsoralen N.N-Dimethylaniline Hexachloroethane 4-Vinyl-1-cyclohexene Diepoxide Bromoethane (Ethyl Bromide) Rhodamine 6G (C.I. Basic Red 1) Pentaerythritol Tetranitrate Hydroquinone Phenylbutazone Nalidixic Acid a-Methylbenzyl Alcohol Benzofuran Toluene 3.3-Dimethoxybenzidine Dihydrochloride Succinic Anhydride Gtycidol Vinyl Toluene Allyl Glycidyl Ether o-Chlorobenzalmalononitrile Benzaldehyde 2-Chloroacetophenone Epinephrine Hydrochloride d-Carvone Furfural 1,2,3-Trichloropropane Methyl Bromide
TR No. CHEMICAL
386 Tetranitromethane 387AmphetamineSulfate 388 Ethylene Thiourea 389 SodiumAzide 390 3,3’-Dimethylbenzidine Dihydrochloride 391 Tris(2-chloroethyl) Phosphate 392ChlorinatedWaterand Chloraminated Water 393 Sodium Fluoride 394Acetaminophen 395 Probenecid 396 Monochloroacetic Acid 397 C.I. Direct Blue 15 398PolybrominatedBiphenyls 399 Titanocene Dichloride 400 2,3-Dibromo-l-propanol 401 2,4-Diaminophenol Dhydrochloride 402 Furan 403 Resorcinol 404 5.5-Diphenylhydantoin 405 C.I. Acid Red 114 406 y-Butyrolactone 407 C.I. Pigment Red 3 408 Mercuric Chloride 409Quercetin 410 Naphthalene 411 C.I. Pigment Red 23 412 4,4-Diamino-2,2-stilbenedisulfonicAcid 413 EthyleneGlycol 414 Pentachloroanisole 415Polysorbate 80 416o-Nitroanisole 417 p-Nitrophenol 418 p-Nitroaniline 419 HCYellow 4 420 Triamterene 421 Talc 422Coumarin 423 Dihydrocoumarin 424 o-Benzyl-p-chlorophenol 425 Promethazine Hydrochloride 426 Corn Oil, Safflower Oil, and Tricaprylin 427 Turmeric Oleoresin 428 Manganese (11) Sulfate Monohydrate 430 C.I . Direct Blue 218 43 1 BenzylAcetate 432 Barium Chloride Dihydrate 434 1,3-Butadiene 437 Hexachlorocyclopentadiene 443 Oxazepam
These NTP Technical Reports are available for sale from the National Technical Information Service, U.S. Department of Commerce, 5285 Port Royal Road, Springfield, VA 22161 (7034874650). Single copies of this Technical Report are available without charge (and while supplies last) from the NTP Central Data Management, NIEHS, P.O. Box 12233, MD AO-01, Research Triangle Park, NC 27709.

DEPARTMENT OF ~ ~~HEALTH & HUMAN SERVICES SPECIAL FOURTH-CLASS RATE
POSTAGE AND FEES PAIDPublic Health Service DHHS/NIHNational T o x i ~ l o g yProgram
Central Data Management Permit No. G-763 P.O. Box 12233, MD A 0 4 1 Research Triangle Park, NC 27709
N I I I Publication No. 94-3164 September 1994


![Emerging Paradigms in Biosolids Management › wp-content › uploads › roadshow...1940 1960 1980 2000 2020] Super-phosphate 20% phosphate Super-phosphate 44-46% phosphate Diammonium](https://img.pdfslide.us/doc/110x75/5f0eaf737e708231d4406f3e/emerging-paradigms-in-biosolids-management-a-wp-content-a-uploads-a-roadshow.jpg)


![Observation of Cu deposition on glassy carbon …...are chemical pollutants of the atmosphere, water systems, and many food products [1]. Tricresyl phosphate (TCP), a potential contaminate](https://img.pdfslide.us/doc/110x75/5f0797d37e708231d41dc1e9/-observation-of-cu-deposition-on-glassy-carbon-are-chemical-pollutants-of-the.jpg)


![[Toxicology] toxicology introduction](https://img.pdfslide.us/doc/110x75/55c46616bb61ebb3478b4643/toxicology-toxicology-introduction.jpg)