Embed Size (px)
Citation preview

P1.335 STUDIES OF THE EFFECTIVENESS OF THE WATER VAPOR SENSING SYSTEM, WVSS-II, IN SUPPORTING AIRLINE OPERATIONS AND IMPROVED AIR TRAFFIC CAPACITY
Mr. Randy Baker * Senior Meteorologist, United Parcel Service, Louisville, KY
Mr. Rick Curtis Chief Meteorologist, Southwest Airlines, Dallas, TX
Mr. David Helms Observation Focal Point, U.S. National Weather Service, Silver Spring, MD
Mr. Al Homans Sr. Program Manager, ARINC GLOBALink Services, Annapolis, MD
Mr. Bryce L. Ford Vice President of Atmospheric Programs, SpectraSensors, Inc., Bethesda, MD
Abstract: The Water Vapor Sensing System (WVSS-II) has been in operational use at United Parcel Service (UPS) and Southwest Airlines (SWA) beginning in early October of 2009. The WVSS-II is designed for in-situ measurement of atmospheric water vapor from commercial aircraft, in conjunction with the U.S. NWS MDCRS program and the global AMDAR program. The WVSS-II uses Tunable Diode Laser Absorption Spectroscopy technologies to measure water vapor concentrations along the aircraft flight path, with data communications to the ground by commercial carriers using ACARS. At present, UPS operates WVSS-II sensors on 25 aircraft, while SWA is in the process of equipping 31 aircraft with WVSS-II sensors, with plans for up to an additional 36 installations by the end of 2011. This paper will provide an overview of the end-to-end processing of WVSS-II observation data, summarize the intercomparisons of the WVSS-II data with other in-situ platforms, and evaluate the effectiveness of the WVSS-II in supporting operational decision making for airline operations. Various operational case studies will be provided to highlight and estimate the benefits these new observations provide to airline operations and improved air traffic capacity.
1.0 INTRODUCTION The Water Vapor Sensing System, WVSS-II, is a new
technology designed to enable the measurement of water vapor from commercial aircraft to provide data to the WMO Aircraft Meteorological Data Relay (AMDAR) program and aviation operations worldwide. While AMDAR has made great contributions to the increase in atmospheric observations, it has long been recognized that with only the parameters of wind and temperature, the AMDAR contribution cannot be considered complete. High quality water vapor measurements have been the missing element of AMDAR and the U.S. contribution, the Meteorological Data Collection and Reporting System (MDCRS) program. The WVSS-II, produced by SpectraSensors Inc (SSI), fills that gap and allows the aviation community to contribute more significantly to the improvement in meteorological
* Corresponding author address: Randy Baker,
United Parcel Service, 825 Lotus Ave, Louisville, KY 40213-3101; e-mail: [email protected]
observations and forecast services. With improved meteorological information the aviation community can expect increased safety, efficiency and capacity.
The WVSS-II uses Tunable Diode Laser Absorption Spectroscopy (TDLAS) technologies to provide a robust, low maintenance, low weight sensor with the high data quality necessary for operational measurement of atmospheric water vapor. TDLAS technology uses a small laser with a wavelength selected to match the absorption band of water vapor to directly measure the water vapor content in a continuous sample of air drawn from outside the aircraft. The response time of the TDLAS technology makes it particularly well suited for the rapidly changing conditions of samples collected by aircraft at all speeds. The implementation used in WVSS-II provides stability over long periods of time and is insensitive to the contaminants that can often degrade performance in other implementations.
Early implementations of WVSS in the late 1990’s utilized a sensor similar to those used in radiosondes. This proved to be ineffective in the long term, requiring much more frequent calibration, maintenance or replacement than is suitable for the commercial aviation industry. The use of TDLAS technologies was introduced in 2003 as WVSS-II, and the current version 3 design has proven to meet the operational requirements for stable, reliable, and high quality observations. Independent test results are documented in climate chamber tests conducted at the U.S. National Weather Service (NWS) and the German Deutscher Wetterdienst (DWD), (Hoff, 2009 and Helms, et al, 2010) and field intercomparisons conducted by the University of Wisconsin Cooperative Institute for Meteorological Satellite Studies (CIMSS) and United Parcel Service (UPS), (Petersen, et al, 2010). With the positive results of the technical evaluations, the NWS has focused on a strategy of rapidly transitioning the current WVSS-II into operations. This will provide immediate benefits to aviation meteorology, while related research is conducted into future alternatives for greater operational benefits in climate services.
2.0 OVERVIEW OF THE END-TO-END PROCESSING OF WVSS-II OBSERVATIONS
The full process for delivery of real-time water vapor data from WVSS-II to operations has multiple steps. It begins with the collection of raw data from the WVSS-II
1

sensor. Data are then communicated in real-time over the aircraft data link to the ground network of the appropriate aviation communications provider along with other meteorological data. The AMDAR data are encoded into standard formats and routed to the NWS for quality control and operational use.
While the technology behind WVSS-II is complex, it has a simple concept of operations. The Air Sampler is mounted to the aircraft skin to draw a small amount of air into the analyzer. The very low profile UCAR
patented Air Sampler, licensed to SpectraSensors, is designed to minimize drag while collecting a valid air sample. The air flows through a short aircraft-quality hose to the System Electronics Box (SEB) containing the TDLAS analyzer and all electronics. The laser uses two passes to measure the water vapor at approximately 4 times per second. Figure 1 provides a simple depiction of the overall air flow through the WVSS-II.
Figure 1 – Air Sample Flow through the WVSS-II
While the WVSS-II sensor is the origin of the water vapor data, the MDCRS is a complex system requiring multiple steps in the process. The WVSS-II SEB data output is connected to the aircraft ARINC 429 bus for processing by the aircraft computers with other on-board AMDAR/MDCRS data. The water vapor measurements, expressed as mixing ratio, are formatted into downlink messages in accordance with ARINC standards for the Aircraft Communication Addressing and Reporting System (ACARS), along with other meteorological data and flight condition information. ACARS messages are then transmitted by
VHF datalink to ground stations and to the ARINC processing center in Annapolis, MD. The meteorological data, including water vapor data, are converted from the ACARS format to WMO standard BUFR format and routed to the NWS for use in forecast operations, including model assimilation. A second MDCRS data stream in ACARS format is routed to NOAA/ESRL/GSD for further processing. Participating airlines and other authorized users have access to these processed data. Figure 2 depicts the end-to-end processing for the WVSS-II and other MDCRS data.
Figure 2 – End-to-End Processing Flow of WVSS-II Data within MDCRS
2

Figure 3 provides an example of one visualization available from the NOAA GSD website, which is accessible by authorized users from around the world. This shows the data sampling from 32 aircraft from UPS and SWA in a 24 hour period, December 20, 2010. This demonstrates the improved spatial and temporal coverage that can be obtained with aircraft observations. Operational forecasters also have access to WVSS-II sounding data in the form of Skew-T visualizations, as shown in Figure 4. This shows five soundings at Louisville (SDF), four “Dn” collected during descent, and one “Up” collected during ascent. With each ascent or descent of an aircraft, a full sounding is
available for operational use. Depending on the airline route structure and flight schedules, many soundings per day can be obtained from a single aircraft. One aircraft recently reported nearly 900 water vapor observations in one day, including ascent and descent soundings from 11 airports, comparable to 22 traditional soundings. With the current installations, approximately 213 soundings covering about 60 cities are collected daily from the WVSS-II equipped aircraft. While there are many holes in spatial and temporal coverage that still must be filled, clear progress has been made in improving the amount of available observations from WVSS-II through AMDAR.
Figure 3 – 24 Hours of WVSS-II Observations from 25 UPS and 7 SWA Aircraft, courtesy of NOAA/ESRL/GSD
3.0 SUMMARY OF TECHNICAL EVALUATIONS AND INTERCOMPARISONS
The global AMDAR community has pursued a variety of independent methods to verify the performance of the WVSS-II, understanding that no single assessment provides a full picture of performance. These assessments have included climate chamber tests, field intercomparisons with radiosondes, comparisons to operational models, and comparisons to GPS-Met IPW. The results of these evaluations have been well documented (NOAA Sterling Test Facility 2009; Hoff, 2009; Helms et al., 2010; and Petersen, et al, 2010) and support the use of WVSS-II data for full operations through an expanded global network. 3.1 CIMSS Intercomparison Study of WVSS-II and
Radiosondes Of the various types of evaluations, the most
applicable to forecast operations is the intercomparison with currently accepted radiosondes. The Cooperative Institute for Meteorological Satellite Studies (CIMSS) University of Wisconsin-Madison (UW) and UPS cooperated to perform an intercomparison study of WVSS-II and radiosonde data collected during UPS
nighttime operations at Rockford, IL (RFD) during the fall 2009, spring 2010 and summer 2010. The objective was to assess the performance of the WVSS-II, version 3, as compared to radiosonde observations, and to provide statistical evidence of that performance. The evaluation used Vaisala model RS-92 radiosonde instruments with new humidity sensors. Radiosonde observations were made immediately prior to multiple WVSS-II equipped UPS aircraft landings, immediately after aircraft departures, and midway between these two times. Even though some of the WVSS-II units had been installed as early as July 2009, the units in operation were not provided any calibration or servicing to support the evaluation. The WVSS-II data were accessed from the NOAA/ESRL/GSD database. Details of the study process and results are published in the reference (Petersen, et al, 2010).
An example comparison of a WVSS-II sounding to a radiosonde sounding taken at the same time and place is found in Figure 5, with RFD(R) being the radiosonde and RFD(Up) being the WVSS-II observation from ascending aircraft GSD #1370. The agreement in the observations between the two sensors is very clear.
3
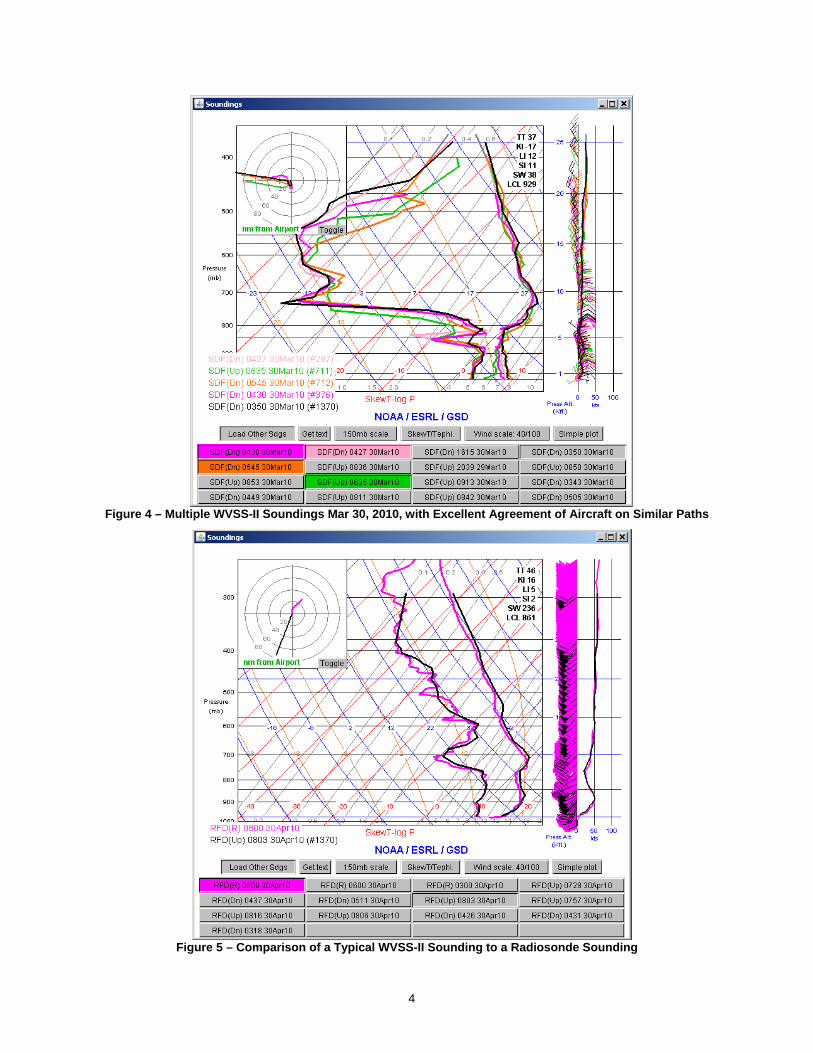
Figure 4 – Multiple WVSS-II Soundings Mar 30, 2010, with Excellent Agreement of Aircraft on Similar Paths
Figure 5 – Comparison of a Typical WVSS-II Sounding to a Radiosonde Sounding
4

One example of the CIMSS study results is found in Figure 6, showing the consistency of WVSS-II observations over small difference in time and space. The RMS errors are plotted for time ranges of 0-15 minutes, 0-30 minutes, and 0-60 minutes, with colored bars representing distance ranges of 0-60 Km, 0-40 Km, and 0-20 Km. The RMS differences, including dry and moist environments, show WVSS-II observations agree extremely well with one another. The atmospheric variability increases significantly from 0-15 minutes to the 30 and 60 minute time intervals. Therefore we
would expect the differences to increase accordingly. There are smaller increases with increased distance, but those differences are larger for the short time spacing. From these results, WVSS-II instruments that are exactly co-located would be expected to produce errors of about 0.1 g/kg. The detailed analysis resulting from this study concludes that the current WVSS-II systems compare well to radiosonde data and meet WMO observing requirements during both ascent and descent of the aircraft.
Figure 6 – WVSS-II Temporal and Spatial Consistency
3.2 SpectraSensors Internal Tests of Long Term Calibration Stability
The TDLAS technology used by SpectraSensors Inc. in the WVSS-II maintains calibration very well over long periods of time. This is important to commercial aviation operations which cannot easily take an aircraft out of service for sensor servicing. To evaluate the long term stability, SSI is conducting a two year internal evaluation of WVSS-II calibration stability. SSI has maintained two units in continuous operation since July 30, 2009, with periodic checks of calibration, to gather information on
long term stability and performance. The units are being maintained in outdoor environmental conditions, rather than ideal laboratory conditions. The interim results indicate that through the first 16 months of the evaluation period both units have maintained calibration to within the specified limits, as seen in Figure 7, and do not show signs of trending out of limits. While not necessarily representative of operation in real flight conditions, this does provide another data point in evaluating long term stability of the WVSS-II in the unattended operations required by commercial aviation.
Figure 7 – Interim Results of 24 Month Stability Evaluation
5

4.0 EXAMPLES OF COMPARISON METHODS FOR WVSS-II
The use of AMDAR/MDCRS data by operational NWS forecasters is continuously growing, and has demonstrated value to improved decision making by the aviation community. With the technical performance of WVSS-II now established and well documented, operational use of the data is becoming more and more common. NOAA maintains a record of all mentions of AMDAR related data in free-text forecasts, and the trend of use clearly shows greater acceptance of these in-situ measurements. The most notable direct benefit of WVSS-II water vapor data is in the forecast of fog onset and duration for airport operations.
WVSS-II is one of many new capabilities that will support the NWS in meeting the challenging goals established for NextGen Weather. With increasing use of WVSS-II, the 4D Weather Cube will increasingly begin to include densely populated in-situ water vapor observations from aircraft, in addition to the current wind and temperature data. With in-situ water vapor observations and the resulting improved forecast model performance, the benefit to the aviation community will continue to accelerate. This improvement is expected to yield significant benefits to aviation capacity through better planning and preparedness.
With the WVSS-II now in routine operation on two U.S. air carriers, the use of this water vapor data is beginning to show its value to aviation operations. This value includes general use by NWS forecast operations, as well as direct use by airline meteorological operations staff. A few examples of the use of WVSS-II in
supporting airline operational decision making are summarized here, along with an overview of various anticipated future operational benefits. 4.1 Examples from March 30, 2010
Intercomparison at Rockford, IL During the spring of 2010 an intercomparison study
was made between the WVSS-II data and operational radiosonde data (Petersen, et al, 2010). This test was conducted at the Rockford, IL airport, RFD, a hub for UPS Airlines just west of Chicago. During this intercomparison several interesting events were captured, providing insights into the potential benefits of the WVSS-II information. Figure 8 depicts the Skew-T visualization of data from four aircraft, arriving into RFD within a period of approximately 90 minutes. There is good consistency between most soundings. The last aircraft to arrive, GSD #362, depicted in green, arrives at 0523Z and looks as if it is an outlier with more moist air between 800mb and 600mb, approximately 5,000 ft to 14,000 ft. However, upon closer inspection and comparison with other data sources, it was evident this aircraft’s sensor accurately detected moist air that had recently moved into the observation area. The soundings from the subsequent departures of these aircraft approximately 180 minutes later, shown in Figure 9, reveal that all aircraft observed similar moist conditions at those levels. Again there is excellent consistency between the departing observations. Aircraft GSD #714, in green, tracked a different direction on departure, encountering more moist air near 25,000 ft, along with differing wind directions.
Figure 8 - Rockford Comparison 30 MAR 2010 – 0349Z to 0523Z Arrivals
6

Figure 9 - Rockford Comparison 30 MAR 2010 – 0800Z to 0830Z Departures
4.2 Examples from July 14, 2010 at Rockford, IL Figure 10 shows arrivals into RFD on July 14th 2010
between 0354Z and 0555Z, with very good correlation between observations of similar humidity profiles. At altitudes of 11,000 - 15,000 ft, there was an interesting difference between aircraft arriving from the west and those arriving from the east. Aircraft at those altitudes were approximately 40nm from RFD where the skies were clear of clouds at the time. Aircraft #727, #675, and #711 show a significant band of moisture at those levels, compared to aircraft #1370, #381 and #285. The 0400Z image from the GOES satellite water vapor channel, shown in Figure 11, indicates drier air to the southeast, depicted in salmon and yellow colors. The
higher moisture to the southwest and northwest of RFD is indicated by the lighter grayscale colors. This corresponds well with the WVSS-II observations over those areas during descent into RFD.
By approximately 0730Z more moist air had moved south into the RFD area at those altitudes. Figure 12 provides the aircraft observation profiles, with good correlation between departures from RFD between 0726Z and 0815Z. Note that all aircraft have very similar moisture profiles during ascent, regardless of direction. These correspond well to the 0800Z Water Vapor image, shown in Figure 13, which reveals moist air throughout the region 40nm from RFD.
7

Figure 10 – July 14, 2010 Arrivals into RFD between 0354Z and 0555Z
Figure 11 – 0400Z Water Vapor Satellite Imagery showing Drier Air to the SE of RFD
8

9
Figure 12 - July 14, 2010 Departures from RFD between 0726Z and 0815Z
Figure 13 - 0800Z Water Vapor Satellite Imagery showing Moist Air in the RFD Area

4.3 Examples from August 25, 2010 at Rockford, IL On August 25, 2010 an interesting example was noted
between observations aloft from two aircraft arriving into RFD: GSD #287 from the east and GSD #285 from the west. The sounding data depicted in Figure 14 clearly show that GSD #285 encountered dry conditions in the band between 20,000 ft and 30,000 ft, while GSD #287 encountered very moist conditions. These observations were consistent with the location of cloud bands observed on the composite satellite IR/Radar imagery and moisture from satellite water vapor imagery. Figure 15 shows the approximate flight paths of GSD #285 arriving from the west and GSD #287 arriving from the east, overlaid on satellite water vapor imagery. This figure confirms that GSD #285, arriving from the west, descended through very dry air, while GSD #287 descended through very moist air. Comparison of surface dewpoint temperature readings from the local METAR with the surface observations from WVSS-II also showed good correlation, as seen in Table 1.
Upon closer examination, data from aircraft GSD #287 also suggest two cloud layers observed to the east of RFD that are not clearly distinguished by satellite. One layer at 25,600 ft is observed at 0353z, bearing 087 degrees and 93nm from RFD, at a temperature of -21.5C. The second layer at 21,080 ft is observed at 0357z bearing 087 degrees and 70nm from RFD, at a temperature of -13.3C. The 0345z satellite image in Figure 16 is consistent with those observations, showing multiple cloud top temperature bands in the -12.4C to -23.5C range, near the first cloud layer encounter by GSD #287 at 93nm and west toward RFD.
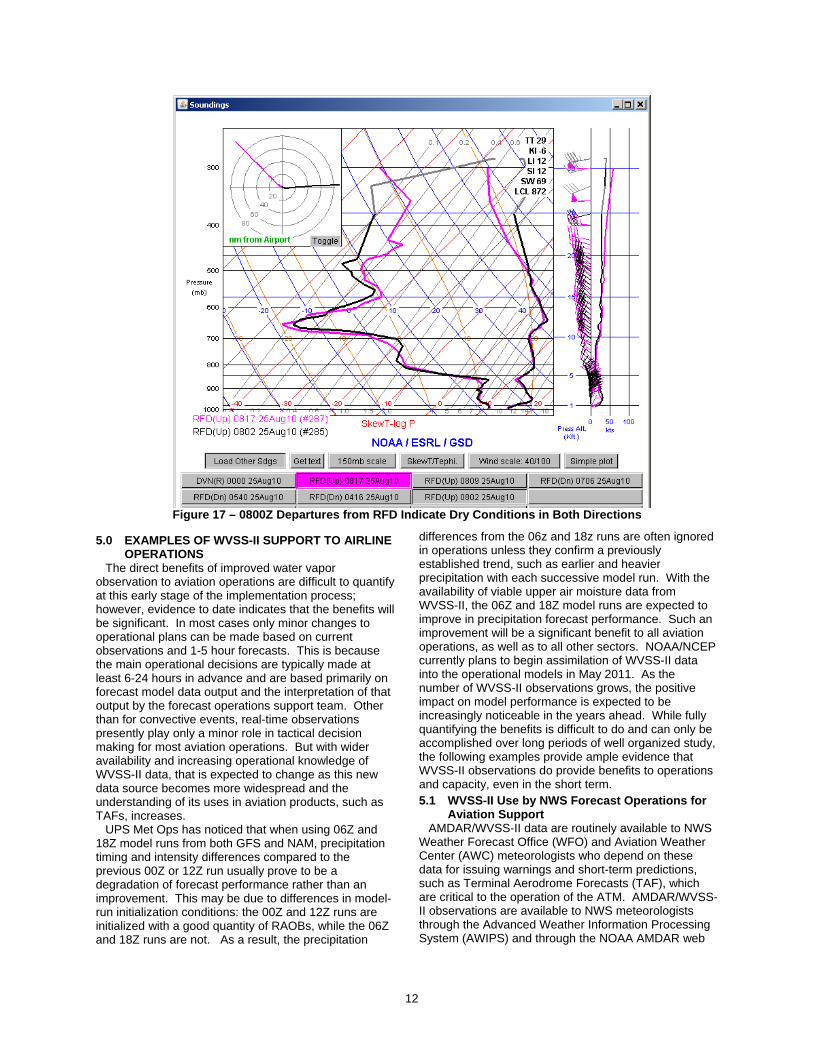
By the time of their departure from RFD shortly after 0800Z, conditions aloft had become dry through the full sounding of both aircraft departing in nearly opposite directions, as shown in Figure 17. Comparison of surface dewpoint temperature readings from the local METAR with the surface observations from WVSS-II also showed good correlation, as seen in Table 2.
Table 1 – Comparison of Arrival Td with Local METARs Aircraft ID WVSS Td METAR Td Bias (WVSS-METAR) GSD #285 12.1 11.1 +1.0 GSD #287 13.9 13.3 (interpolated) +0.6
Table 2 - Comparison of Departure Td with Local METARs Aircraft ID WVSS Td METAR Td Bias (WVSS-METAR GSD #285 11.0 10.6 +0.4 GSD #287 11.3 10.6 +0.7
Figure 14 – Profiles from GSD #285 and GSD #297 Arrivals into RFD Aug 25, 2010
10

Figure 15 – Approx Flight Paths of #285 and #287 overlaid on GOES Water Vapor imagery
Figure 16 – Cloud Layers Encountered by #287 at 93nm Range
11
12
Figure 17 – 0800Z Departures from RFD Indicate Dry Conditions in Both Directions
5.0 EXAMPLES OF WVSS-II SUPPORT TO AIRLINE OPERATIONS
The direct benefits of improved water vapor observation to aviation operations are difficult to quantify at this early stage of the implementation process; however, evidence to date indicates that the benefits will be significant. In most cases only minor changes to operational plans can be made based on current observations and 1-5 hour forecasts. This is because the main operational decisions are typically made at least 6-24 hours in advance and are based primarily on forecast model data output and the interpretation of that output by the forecast operations support team. Other than for convective events, real-time observations presently play only a minor role in tactical decision making for most aviation operations. But with wider availability and increasing operational knowledge of WVSS-II data, that is expected to change as this new data source becomes more widespread and the understanding of its uses in aviation products, such as TAFs, increases.
UPS Met Ops has noticed that when using 06Z and 18Z model runs from both GFS and NAM, precipitation timing and intensity differences compared to the previous 00Z or 12Z run usually prove to be a degradation of forecast performance rather than an improvement. This may be due to differences in model-run initialization conditions: the 00Z and 12Z runs are initialized with a good quantity of RAOBs, while the 06Z and 18Z runs are not. As a result, the precipitation
differences from the 06z and 18z runs are often ignored in operations unless they confirm a previously established trend, such as earlier and heavier precipitation with each successive model run. With the availability of viable upper air moisture data from WVSS-II, the 06Z and 18Z model runs are expected to improve in precipitation forecast performance. Such an improvement will be a significant benefit to all aviation operations, as well as to all other sectors. NOAA/NCEP currently plans to begin assimilation of WVSS-II data into the operational models in May 2011. As the number of WVSS-II observations grows, the positive impact on model performance is expected to be increasingly noticeable in the years ahead. While fully quantifying the benefits is difficult to do and can only be accomplished over long periods of well organized study, the following examples provide ample evidence that WVSS-II observations do provide benefits to operations and capacity, even in the short term. 5.1 WVSS-II Use by NWS Forecast Operations for
Aviation Support AMDAR/WVSS-II data are routinely available to NWS
Weather Forecast Office (WFO) and Aviation Weather Center (AWC) meteorologists who depend on these data for issuing warnings and short-term predictions, such as Terminal Aerodrome Forecasts (TAF), which are critical to the operation of the ATM. AMDAR/WVSS-II observations are available to NWS meteorologists through the Advanced Weather Information Processing System (AWIPS) and through the NOAA AMDAR web

page. Since WVSS-II observations have been introduced into NWS operations, NWS Area Forecast Discussions (AFD) have documented several examples of how AMDAR/WVSS-II data are improving NWS warnings and forecasts. With the introduction of WVSS-II, meteorologists can now get a complete picture of the atmosphere, with all state variables available including wind, temperature, and moisture information. NWS plans to use WVSS-II data in the operational weather models starting in May 2011 when WVSS-II data will be assimilated into the NCEP North American Model (NAM) and Rapid Update Cycle (RUC).
A few examples are extracted here from the full forecast text to demonstrate how AMDAR data are used in NWS Forecasts, as discussed in Area Forecast Discussions (AFD): These data are use to predict precipitation type and intensity, severe thunderstorms, low level wind shear (LLWS)/cross winds, clouds (base/top amount), including IFR and MVFR conditions, turbulence, icing, frost, fog. These and other examples of AMDAR data in operational use may be found on the NOAA website: http://amdar.noaa.gov/docs/fcst-disc/?O=D
AREA FORECAST DISCUSSION, NWS COLUMBIA
SC, 904 AM EST FRI DEC 31 2010 NAM FORECAST SOUNDING GAVE IFR CIGS THIS
MORNING BUT BOTH MET AND MAV GUIDANCE WENT VFR THIS MORNING. ALSO LOCAL *AMDAR* SOUNDING INDICATED JUST SCATTERED LOW LEVEL CLOUDS. SO WILL GO VFR ACROSS FORECAST AREA TODAY.
AREA FORECAST DISCUSSION, NWS CHICAGO/ROMEOVILLE IL, 1017 AM CST WED DEC 29 2010
WE CAN SEE THAT THE FOG IS WATER DROPLETS WHEN WE ARE OUTDOORS. THE *AMDAR* SOUNDING AT RFD SHOWS VERY HIGH WATER VAPOR CONTENT UP TO 1000 FT. THE DROPLET COULD FREEZE ON SURFACES...SO WE WILL ISSUE A FREEZING FOG ADVISORY THIS MORNING
AREA FORECAST DISCUSSION, NWS
CHICAGO/ROMEOVILLE IL, 153 PM CST TUE DEC 28 2010
TODAY...THE HIGH OVER TENNESSEE WILL GIVE A SOUTH WIND TODAY. THE SOUNDINGS FROM *AMDAR* AT ROCKFORD SHOW AN INVERSION UP TO 5540 FEET. THE AIR IS ALSO VERY MOIST AS THE DEWPOINT IS VERY CLOSE TO THE TEMPERATURE UP TO 1600 FT. THE FOG WILL BE PATCHY THROUGH THE FORECAST AREA OF NORTH CENTRAL ILLINOIS.
AREA FORECAST DISCUSSION, NWS
NORTHERN INDIANA, 632 AM EST MON DEC 27 2010
UPSTREAM *AMDAR* DATA CONFIRMS CLOUD BEARING PROFILES ARE WARMER THAN -10C WHICH COULD SUPPORT A FZDZ THREAT IN THE
CLOUD BAND. OPTED TO LEAVE OUT ANY FZDZ MENTION AT SBN GIVEN INCREASINGLY UNFAVORABLE SUPPORT FOR LAKE EFFECT PRECIP PER WARMING/DRYING LL PROFILES/FALLING INVERSION BASES/AND AN INCREASINGLY WESTERLY FETCH FAVORING MID-LAKE BAND BREAKDOWN.
AREA FORECAST DISCUSSION, NWS MOUNT
HOLLY NJ, 929 PM EST WED DEC 22 2010 1800 UTC NAM MODEL SOUNDINGS SHOW THIS
MOISTURE AT JUST ABOUT ALL TERMINALS THROUGH THE OVERNIGHT. THIS MOISTURE IS SHOWING UP IN THE FORM OF VFR CEILINGS (NEAR 3500 FEET) AT KABE...AND SHOULD AFFECT KRDG AND KTTN IN THE NEXT TWO HOURS. MOST 0000 UTC SOUNDINGS AND *AMDAR* SOUNDINGS FROM KPHL SHOW THE MOISTURE ABOUT 3000 FEET. FOR NOW MVFR CEILINGS WERE NOT ADDED TO THE FORECAST. HOWEVER... MVFR CEILINGS ARE NOT THAT FAR AWAY...AND MAY HAVE TO BE ADDED TO KABE AND KRDG IN THE NEXT COUPLE OF HOURS.
AREA FORECAST DISCUSSION, NWS
SACRAMENTO CA, 420 AM PST THU DEC 23 2010 QUITE A BIT OF IFR CONDITIONS HAVE
DEVELOPED ACROSS THE SAC AND NORTHERN SAN JOAQUIN VALLEYS IN FOG THIS MORNING. *AMDAR* SOUNDINGS SHOW AN INVERSION NEAR FL035-040. WHERE CLOUDS HAVE FORMED AT THIS LEVEL...SURFACE GROUND FOG IS LESS DENSE. WHERE THIS LAYER HAS CLEARED...DENSE FOG IS DEVELOPING. IFR 1/2SM FG OVC005 MAY IMPACT SAC INTERNATIONAL AIRPORT THRU 18Z THIS MORNING.
AREA FORECAST DISCUSSION, NWS
LOUISVILLE KY, 953 AM EST WED NOV 24 2010 *AMDAR* SOUNDINGS SHOW DECENT
WETBULBING OCCURRING AS THE PRECIPITATION FALLS...AND WITH LOW LEVEL ATMOSPHERIC TEMPS NEAR FREEZING...WE HAVE RECEIVED NUMEROUS REPORTS OF SLEET MIXING IN. THIS TREND WILL CONTINUE FOR THE NEXT 1-2 HOURS UNTIL TEMPERATURES WARM INTO THE UPPER 30S.
AREA FORECAST DISCUSSION, NWS ST LOUIS
MO, 153 PM CST THU NOV 25 2010 AS DRIER AIR ENTRAINS AT THE
SURFACE...VSBYS AND CIGS SHOULD LIFT TO MVFR...BUT A BIG QUESTION PRESENTS ITSELF IF WHETHER THIS WILL RESULT IN COOLING OF LOW-LVLS AND FZRA/PL DEVELOPMENT FOR THE 19-21Z TIMEFRAME. LATEST *AMDAR* SOUNDINGS OUT OF KSTL PRESENT SUCH A POSSIBLE SITUATION
AREA FORECAST DISCUSSION...UPDATED
AVIATION NWS ST LOUIS MO, 1133 AM CST THU NOV 25 2010
13

THIS LEADS TO SEVERAL PERPLEXING QUESTIONS...WHETHER DRIER AIR WILL LIMIT PRECIP FROM REACHING THE SFC...OR PRESENT AN EVAPORATIVE COOLING SITUATION WHICH WILL ENHANCE THE POTENTIAL OF SLEET AS A +5C WARM LAYER EXISTS AT H8 FROM *AMDAR* SOUNDINGS OUT OF KSTL AND LOW-LVLS POTENTIALLY COOL BELOW FREEZING. THE SITUATION BEARS WATCHING
AREA FORECAST DISCUSSION...UPDATED, NWS
FORT WORTH TX, 608 AM CST WED NOV 10 2010 THE 12Z KFWD RAOB ALONG WITH *AMDAR*
DATA INDICATE SOUTH SOUTHWEST WINDS AT 35-40 KNOTS BETWEEN 1000 AND 2000 FEET...WHEREAS SURFACE WINDS ARE SOUTH AT LESS THAN 10 KNOTS. THUS HAVE PLACED LOW LEVEL WIND SHEAR...WS015/21037KTS IN THE TAFS THROUGH 15Z.
AREA FORECAST DISCUSSION, NWS
CHICAGO/ROMEOVILLE IL, 519 PM CDT MON SEP 20 2010
THERE IS A LOW PROBABILITY THAT ISOLATED THUNDERSTORM DEVELOPMENT MAY OCCUR ALONG THE WARM FRONT ITSELF IN THE NEXT COUPLE OF HOURS...GIVEN LOW LEVEL CONVERGENCE ALONG THE BOUNDARY...MID LEVEL SPEED MAX LIFTING ACROSS UPPER MIDWEST...AND OBJECTIVE ANALYSIS AND MODIFIED ORD *AMDAR* ASCENT SOUNDINGS INDICATING 2000-2500 J/KG MLCAPE PRESENT.
5.2 WVSS-II Use in Support of Airport Fog
Forecasting The forecasting of localized airport fog conditions is an
example of the use of MDCRS/WVSS –II information that can be of tremendous short and near term value to airline operations. Due to latency within the standardized upper air reports from the rawinsonde network, airline operators are commonly forced to make decisions without current information regarding the thermal, wind and moisture profiles of the lower atmosphere. A near real-time update of temperature, wind and moisture information provided by MDCRS can provide airline meteorologists, and dispatchers with both a localized and broad-scale view of increases or decreases in low level winds, temperature inversions, and increases or decreases of low to mid-level atmospheric moisture. Much of this capability has been previously available through MDCRS reports; however moisture information had always been the missing data element from these reports until it became available through WVSS-II.
For example, WVSS-II information can be combined to greatly assist the enhanced satellite imagery used in fog detection to help forecast marine layer fog events especially prevalent along the west coast. These events often occur late at night, or during the early morning hours, when the usefulness of satellite imagery in helping to determine marine layer thickness can be
limited. In addition, higher clouds often mask the marine layer on satellite imagery.
Most importantly, satellite imagery can only observe the onset of fog after it develops, whereas WVSS-II reports into and out of the marine layer can easily detect the moisture content and thickness of the layer, providing an early warning of fog potential before it forms. This early warning assists airlines in making better planning decisions around these types of fog events. Marine layer fog is a common occurrence at San Diego’s Lindberg Airport where high landing minimums are required. Marine layer fog can be advected quite rapidly over the airport causing significant operational impacts. With the early warning of fog onset enabled by WVSS-II, significant improvements in operational decision making can lead to reduced fuel consumption and reduced emissions. 5.3 Confirmation of UPS Forecast Supports
Continuation of Maximum Inbound Flow On one occasion the UPS Meteorological Operations
team forecast conditions at SDF to stay above minimums, in spite of various indicators that there was a reasonable risk of fog. This was based on a forecast of moisture decreasing with height in the boundary layer, which reduces the risk of dense fog. That forecast resulted in a decision to plan flight operations for arrivals into SDF using both runways. At that time, one runway was undergoing construction and had higher visibility minimums required for operations. Thus if fog were to occur and minimums were reduced for that runway, the planned arrival rate into SDF would not be possible. During the course of early arrivals, observed real-time data from WVSS-II verified that moisture was decreasing with height, validating the forecast made 12 hours earlier by UPS Met Ops. In spite of an otherwise apparent risk of fog, the observations supported the forecast and enabled flight operations to continue at the desired capacity. While flights had already begun to arrive, it would have been too late to change operational plans significantly at that point. If fog had developed, the second runway would be required to cease operation and inbound flow would have been decreased accordingly. Such a late change in plan would cause many aircraft already in the air to be slowed or go into a hold, awaiting clearance for arrival on the one available runway. This event provided a definite boost of confidence in the forecast made by the UPS meteorological staff, and enabled arrivals to continue at the planned flow rate without compromising safety concerns, rather than slowing the arrival flow. 5.4 Data Shared with CCFP on Strong Mid-Level
Cap Inhibiting Thunderstorm Development On one occasion, morning arrivals of WVSS-II
equipped aircraft into SDF provided data to UPS Met Ops that indicated a stronger than forecast mid-level cap, which would inhibit thunderstorm development later in the afternoon. This information was used to reduce the expected thunderstorm risk for SDF and the storm coverage in the area. That data and the change in expectations were shared by UPS with the daily Collaborative Convective Forecast Product process, CCFP, with the NWS and others in the aviation weather
14

15
community. Since the storms were not expected to affect SDF for that night's UPS inbound flights, having moved off to the east by then, there was no direct economic impact one way or the other. But the use of this data in the CCFP process demonstrated the benefit to the entire aviation community. This use of AMDAR/MDCRS data to determine convective inhibition due to mid-level capping inversions not forecast by numerical models is now well recognized by the NWS. It has been integrated into the 2nd Distance Learning Aviation Course (DLAC2), “Producing Customer-Focused TAFs,” released in the summer of 2010, as part of module two "Writing TAFs for Convective Weather." 5.5 Warm Moist Air Observed Aloft Improves UPS
Forecast of Rain to Snow Transition at SDF On one occasion MDCRS data, including WVSS-II,
observed by UPS Met Ops during evening arrivals into SDF indicated warmer and moister air aloft than the models had previously forecast. Based on that information, UPS Met Ops was able to move back their estimated time for the transition of rain to snow by one hour, impacting fewer departing aircraft that night. This improved information helped to increase preparedness and efficiency of the UPS aircraft deicing operations and UPS pilots. 5.6 UPS Benefits to De-Icing Operations at SDF on
Nov 18th, 2010 While many of the current benefits from WVSS-II are
indirect, one small example of how data from WVSS-II was able to directly benefit UPS deice operations at SDF was recorded on Nov 18th, 2010. All the models and even the satellite imagery showed clearing conditions approaching SDF from the northwest, therefore the official forecast at SDF was for the low clouds to clear. This clearing led to a forecast of frost, which would require pre-treating all 80+ UPS aircraft with Type IV deice fluid. The clearing was expected to reach SDF during the end of the UPS arrivals, and therefore every departure would be expected to have frost, and require deicing.
During the arrivals, UPS Meteorological Operations noticed that the AMDAR reported winds at 3,000 ft were turning more to the west and then southwest, and the WVSS-II data showed moisture saturation at that layer. The meteorological model output had indicated this southwesterly turning of the wind would occur later in the night with dry conditions and clear skies prevailing during operations. The WVSS-II observations revealed the reality that the cloud layer was trapped below an inversion and surging in a few hours earlier than forecast, preventing the cloud clearing over SDF. The line of cloud clearing stalled about 30 nm north of SDF, rather than making it through SDF and stalling 30 miles south.
UPS Meteorological Operations noticed this difference from forecasted conditions and made the call to the deicing operations that they could suspend pre-treating the aircraft because it was not going to clear after all, and frost was therefore not expected. This avoided about 30 aircraft from being treated, even though much of the fleet had already been sprayed. This action
directly saved UPS operations approximately $4500 in cost of deice fluid, and allowed UPS staff to return to other critical functions, speeding up the UPS operation at SDF that night. While this event was only a very minor savings, UPS Meteorological Operations will now be on the lookout for similar situations in order to maximize future benefits to operational efficiency at locations within the UPS network.
6.0 SUMMARY The implementation of a dense network of WVSS-II
sensors on AMDAR/MDCRS equipped aircraft will certainly provide increased benefits to the aviation community. Currently, the measurable data needed to quantify these benefits are limited and further study is necessary. However, there is more and more evidence to indicate that the largest direct operational and overall economic benefit will be provided through more accurate initial conditions for the numerical weather prediction models. That can only be proven once there is sufficient observation coverage in time and space, the models begin assimilating WVSS-II data, and controlled model sensitivity studies are conducted comparing results with and without the WVSS-II data. As the operational use of WVSS-II data becomes more prevalent within the NWS and participating airlines, these benefits will continue to grow. There is a long way to go for WVSS-II to achieve its fullest benefit for the aviation community. But the potential for benefits to aviation operations, air traffic capacity, and safety are now very clear.
REFERENCES: Helms, D., Hoff, A., Smit, H., Taylor, S. and Carlberg,
S., 2010: Advancements in the AMDAR Humidity Sensing, WMO TECHNICAL CONFERENCE ON METEOROLOGICAL AND ENVIRONMENTAL INSTRUMENTS AND METHODS OF OBSERVATION, TECO-2010 Session 2, August 2010, Helsinki, Finland.
Hoff, A., 2009: WVSS-II Assessment at the DWD,
Deutscher Wetterdienst, September 2009. Hoff, A., 2009: The E-AMDAR Humidity Trial,
Deutscher Wetterdienst, October 2009. NOAA Sterling Test Facility: Retest and Evaluation
for the SpectraSensors Water Vapor Sensing System II (WVSS-II) Report, October 2009.
Petersen, R., Cronce, L., Feltz, W., Olson, E., and
Helms, D., 2010; WVSS-II MOISTURE OBSERVATIONS: A tool for validating and monitoring satellite moisture data, 2010 EUMETSAT Meteorological Satellite Conference, 22 September 2010, Cordoba, Spain