Embed Size (px)
Citation preview

SUPPLEMENTARY NOTE
Association studies involving over 90,000 people demonstrate that common variants near to MC4R influence fat mass, weight and risk of obesity. Ruth J.F. Loos1,2*, Cecilia M. Lindgren3,4*, Shengxu Li1,2*, Eleanor Wheeler5, Jing Hua Zhao1,2, Inga Prokopenko3,4, Michael Inouye5, Rachel M. Freathy6,7,Antony P Attwood5,8, Jacques S. Beckmann9,10, Sonja I. Berndt11, The Prostate, Lung, Colorectal, and Ovarian (PLCO) Cancer Screening Trial71, Sven Bergmann9,12, Amanda J. Bennett3,4, Sheila A. Bingham13, Murielle Bochud14, Morris Brown15, Stéphane Cauchi16, John M. Connell17, Cyrus Cooper 18, George Davey Smith19, Ian Day18, Christian Dina16, Subhajyoti De20, Emmanouil T. Dermitzakis5, Alex S. F. Doney21, Katherine S. Elliott3, Paul Elliott22,23, David M. Evans3,19, I. Sadaf Farooqi2,24, Philippe Froguel16,25, Jilur Ghori5, Christopher J. Groves3,4, Rhian Gwilliam5, David Hadley26, Alistair S. Hall27, Andrew T. Hattersley6,7, Johannes Hebebrand28, Iris M. Heid29,30, KORA72, Blanca Herrera3,4, Anke Hinney28, Sarah E. Hunt5, Marjo‐Riitta Jarvelin22,23,31, Toby Johnson9,12,14, Jennifer D.M. Jolley8, Fredrik Karpe4, Andrew Keniry5, Kay‐Tee Khaw32, Robert N. Luben32, Massimo Mangino33, Jonathan Marchini34, Wendy L. McArdle35, Ralph McGinnis5, David Meyre16, Patricia B. Munroe36, Andrew D Morris21, Andrew R. Ness37, Matthew J. Neville4, Alexandra C. Nica5, Ken K. Ong1,2, Stephen O’Rahilly2,24, Katharine R. Owen4, Colin N.A. Palmer38, Konstantinos Papadakis26, Simon Potter5, Anneli Pouta31,39, Lu Qi40, Nurses' Health Study73, Joshua C. Randall3,4, Nigel W. Rayner3,4, Susan M. Ring35, Manjinder S. Sandhu1,32, André Scherag41, Matthew A. Sims1,2, Kijoung Song42, Nicole Soranzo5, Elizabeth K. Speliotes43,44, Diabetes Genetics Initiative74, Holly E. Syddall18, Sarah A. Teichmann20, Nicholas J. Timpson3,19, Jonathan H Tobias45, Manuela Uda46, The SardiNIA Study74, Carla I. Ganz Vogel28, Chris Wallace36, Dawn M. Waterworth42, Michael N. Weedon6,7, The Wellcome Trust Case Control Consortium76, Cristen J. Willer47, FUSION77, Vicki L. Wraight2,24, Xin Yuan42, Eleftheria Zeggini3, Joel N. Hirschhorn44,48,49,50,51, David P. Strachan26, Willem H. Ouwehand8, Mark J. Caulfield36, Nilesh J. Samani33, Timothy M. Frayling6,7, Peter Vollenweider52, Gerard Waeber52, Vincent Mooser42, Panos Deloukas5, Mark I. McCarthy3,4*, Nicholas J. Wareham1,2*, Inês Barroso5* * These authors contributed equally
For affiliations, see main text.
Corresponding authors
Inês Barroso The Wellcome Trust Sanger Institute Metabolic Disease Group The Wellcome Trust Genome Campus Hinxton Cambridge CB10 1SA, UK Tel: +44 (0) 1223 495341 Fax: +44 (0) 1223 494919 Email: [email protected]
Page 1 of 51
Nicholas J Wareham Medical Research Council – Epidemiology Unit Institute of Metabolic Science Addenbrooke’s hospital – Box 285 Hills Road Cambridge CB2 0QQ, UK Tel: +44 (0)1223 330315 Fax: +44 (0)1223 330316 Email: nick.wareham@mrc‐epid.cam.ac.uk Mark I. McCarthy Oxford Centre for Diabetes, Endocrinology and Metabolism University of Oxford, Churchill Hospital Old Road, Headington, Oxford OX3 7LJ, UK Tel: +44 (0) 1865 857321 Fax: +44 (0) 1865 857299 Email: [email protected]
Page 2 of 51

Table of Contents
1. GENOME‐WIDE ASSOCIATION STUDIES.................................................................................... 4 1.1. POPULATIONS ........................................................................................................................................... 4
1.1.1. Population‐based studies............................................................................................................. 4 1.1.2. Case series .................................................................................................................................... 7
1.2. QUALITY CONTROL & ANALYSIS FOR POPULATION SUBSTRUCTURE ...................................................................... 9 1.3. IMPUTATIONS OF GENOTYPES AT CHROMOSOME 18Q21 ................................................................................ 11 1.4. META‐ANALYSIS OF GWA STUDIES ............................................................................................................. 11 1.5. POWER AND DETECTABLE EFFECT SIZES ......................................................................................................... 12
2. REPLICATION STUDIES ...................................................................................................... 13
2.1. REPLICATION SAMPLES WITH INDIVIDUALLY GENOTYPED VARIANTS ................................................................... 13 2.1.1. Population‐based studies........................................................................................................... 13 2.1.2. UK Type 2 diabetes case‐control collection ............................................................................... 17
2.2. REPLICATION STUDIES WITH GENOTYPES RECOVERED FROM GENOME WIDE ASSOCIATION DATA ............................ 18 2.2.1. Population‐based studies........................................................................................................... 18 2.2.2. Additional control and diabetes‐case series.............................................................................. 20
2.3. STATISTICAL ANALYSIS FOR THE REPLICATION SAMPLES.................................................................................... 22 2.3.1. Outcome measures .................................................................................................................... 22 2.3.2. Association analyses in replication sets .................................................................................... 22 2.3.3. Meta‐analyses of replication data............................................................................................. 22
3. FOLLOW‐UP STUDIES ....................................................................................................... 22
3.1. FRENCH ADULT OBESITY CASE‐CONTROL STUDY.............................................................................................. 22 3.2. FOLLOW UP STUDIES IN CHILDREN ............................................................................................................... 23
3.2.1. Population‐based sample – The ALSPAC Population Children’s cohort.................................... 23 3.2.2. Childhood and adolescence obesity case‐control studies ......................................................... 24 3.2.3. The Essen Obesity Family Study ................................................................................................. 25
4. SUPPLEMENTARY OBSERVATIONS ........................................................................................ 26
4.1. REPLICATION RESULTS FOR ADDITIONAL HITS ................................................................................................. 26 4.2. ASSOCIATION WITH TYPE 2 DIABETES ........................................................................................................... 26 4.3. CONDITIONAL ANALYSES............................................................................................................................ 28 4.4. RELATIONSHIP BETWEEN RS17782313‐RS17700633 AND 2 NON‐SYNONYMOUS MC4R SNPS (V103I & I251L). 28
4.4.1. Relationship between rs17782313‐rs17700633 and rs2229616 [MC4R V103I]........................ 28 4.4.2. Relationship between rs17782313‐rs17700633 and rs52820871 [MC4R I251L] ...................... 31
4.5. FINE‐MAPPING OF THE CHROMOSOME 18Q21 REGION ................................................................................... 34 4.5.1. Haplotype analysis for rs17782313 and rs17700633 in EPIC‐Norfolk....................................... 34 4.5.2. Meta‐analysis of imputed genotypes ........................................................................................ 35 4.5.3. Conditional analyses in EPIC‐Norfolk......................................................................................... 36
5. COMPUTATIONAL GENOMICS ON THE CHROMOSOME 18 REGION ................................................ 39
5.1. TRANSCRIPTION FACTOR BINDING SITES........................................................................................................ 39 5.2. NON‐CODING RNA .................................................................................................................................. 39 5.3. POSITIVE SELECTION ................................................................................................................................. 40 5.4. EXPRESSION QUANTITATIVE TRAIT LOCI (EQTL) ANALYSIS .............................................................................. 41
6. ADDITIONAL ACKNOWLEDGEMENTS ..................................................................................... 42
6.1. DETAILED ACKNOWLEDGEMENTS................................................................................................................. 42 6.2. MEMBERS OF THE WELLCOME TRUST CASE CONTROL CONSORTIUM................................................................. 44
7. REFERENCES .................................................................................................................. 49
Page 3 of 51

1. GENOME‐WIDE ASSOCIATION STUDIES
1.1. Populations Genome‐wide association (GWA) data was available for four population‐based studies (EPIC‐Obesity
Study, CoLaus, British 1958 BC, WTCCC/UKBS) and three case series (WTCCC/T2D, WTCCC/CAD,
WTCCC/HT). Five of the seven GWA studies (British 1958 BC, WTCCC/UKBS, WTCCC/T2D,
WTCCC/CAD, WTCCC/HT) have been described in detail previously in the context of reports on the
Wellcome Trust Case Control Consortium (WTCCC)1‐4 and are presented in brief, whereas more detail
is provided for two GWA studies (EPIC‐Obesity Study, CoLaus) that have not been described before.
Basic descriptive characteristics for the seven GWA populations are presented in Supplementary
Table 1.1.
1.1.1. Population‐based studies
1.1.1.1. EPIC‐Obesity study
Sample ‐ The EPIC Obesity cohort includes 2,566 participants randomly selected from the EPIC‐
Norfolk Study, a population‐based cohort study of 25,663 men and women of European descent
aged 39‐79 years recruited in Norfolk, UK between 1993 and 19975. Height and weight were
measured using standard anthropometric techniques5. BMI was log‐transformed and z‐scores were
calculated, standardising BMI by gender and age decades (<50, 50<60, 60<70, ≥70). The Norwich
Local Research Ethics Committee granted ethical approval for the study. All participants gave written
informed consent.
Genotyping & Quality Control ‐ All samples were genotyped using the Affymetrix GeneChip Human
Mapping 500K Array Set. Data for this investigation was based on the genome‐wide association
analyses of BMI in the cohort sample (n = 2,566) of whom 140 individuals were excluded as their
genotyping data did not meet the quality control criteria applied (sample call rate <94%: n= 90,
heterozygosity <23% or >30%: n= 20, >5.0% discordance in SNP pairs with r2= 1 in HapMap: n= 12,
ethnic outlier: n= 13, related individuals (concordance with another DNA >70.0% and <99.0%,
selected based on sample call rate): n=4, duplicate (concordance with another DNA is >99.0% n= 1),
and for 11 individuals no genotype or phenotype data was available, such that 2,415 individuals were
included in the genome‐wide association analyses (Supplementary table 1). SNPs included in the
analyses have passed the following quality control criteria: 1) they were polymorphic (7,532
excluded), 2) have a call rate ≥90% (31,067 excluded), 3) show Hardy‐Weinberg Equilibrium with a
p>10‐6 (25,907 excluded), and 4) have a minor allele frequency (MAF) of ≥1%. The total number of
SNPs analysed in this genome wide association scan was 397,438.
Population stratification was examined with EIGENSTRAT6 as available from
Page 4 of 51
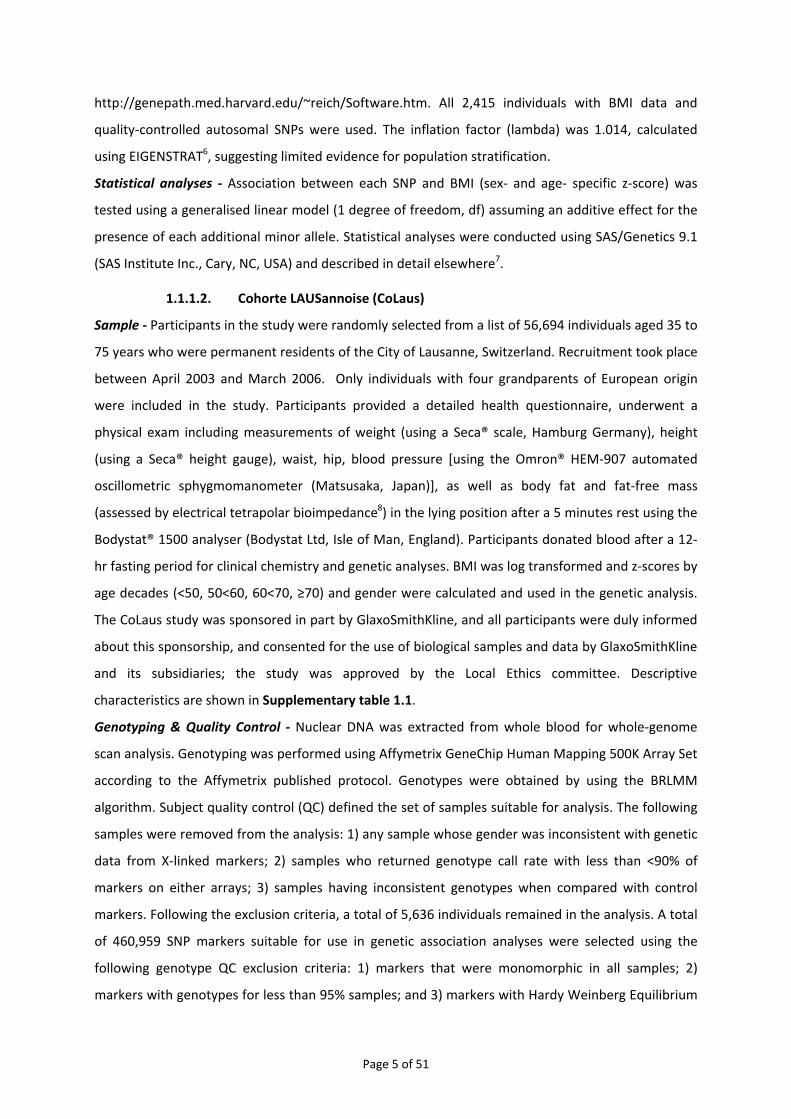
http://genepath.med.harvard.edu/~reich/Software.htm. All 2,415 individuals with BMI data and
quality‐controlled autosomal SNPs were used. The inflation factor (lambda) was 1.014, calculated
using EIGENSTRAT6, suggesting limited evidence for population stratification.
Statistical analyses ‐ Association between each SNP and BMI (sex‐ and age‐ specific z‐score) was
tested using a generalised linear model (1 degree of freedom, df) assuming an additive effect for the
presence of each additional minor allele. Statistical analyses were conducted using SAS/Genetics 9.1
(SAS Institute Inc., Cary, NC, USA) and described in detail elsewhere7.
1.1.1.2. Cohorte LAUSannoise (CoLaus)
Sample ‐ Participants in the study were randomly selected from a list of 56,694 individuals aged 35 to
75 years who were permanent residents of the City of Lausanne, Switzerland. Recruitment took place
between April 2003 and March 2006. Only individuals with four grandparents of European origin
were included in the study. Participants provided a detailed health questionnaire, underwent a
physical exam including measurements of weight (using a Seca® scale, Hamburg Germany), height
(using a Seca® height gauge), waist, hip, blood pressure [using the Omron® HEM‐907 automated
oscillometric sphygmomanometer (Matsusaka, Japan)], as well as body fat and fat‐free mass
(assessed by electrical tetrapolar bioimpedance8) in the lying position after a 5 minutes rest using the
Bodystat® 1500 analyser (Bodystat Ltd, Isle of Man, England). Participants donated blood after a 12‐
hr fasting period for clinical chemistry and genetic analyses. BMI was log transformed and z‐scores by
age decades (<50, 50<60, 60<70, ≥70) and gender were calculated and used in the genetic analysis.
The CoLaus study was sponsored in part by GlaxoSmithKline, and all participants were duly informed
about this sponsorship, and consented for the use of biological samples and data by GlaxoSmithKline
and its subsidiaries; the study was approved by the Local Ethics committee. Descriptive
characteristics are shown in Supplementary table 1.1.
Genotyping & Quality Control ‐ Nuclear DNA was extracted from whole blood for whole‐genome
scan analysis. Genotyping was performed using Affymetrix GeneChip Human Mapping 500K Array Set
according to the Affymetrix published protocol. Genotypes were obtained by using the BRLMM
algorithm. Subject quality control (QC) defined the set of samples suitable for analysis. The following
samples were removed from the analysis: 1) any sample whose gender was inconsistent with genetic
data from X‐linked markers; 2) samples who returned genotype call rate with less than <90% of
markers on either arrays; 3) samples having inconsistent genotypes when compared with control
markers. Following the exclusion criteria, a total of 5,636 individuals remained in the analysis. A total
of 460,959 SNP markers suitable for use in genetic association analyses were selected using the
following genotype QC exclusion criteria: 1) markers that were monomorphic in all samples; 2)
markers with genotypes for less than 95% samples; and 3) markers with Hardy Weinberg Equilibrium
Page 5 of 51

(HWE) p>10‐7. For SNPs among the top associations, additional genotype QC was examined with
visual inspection of intensity data.
Statistical analyses ‐ Association between each SNP and BMI (sex‐ and age‐ specific z‐score) was
tested using multivariable linear regression under an additive model with the selected principal
components as implemented in the software package PLINK
(http://pngu.mgh.harvard.edu/purcell/plink/)9. Principal components were computed to adjust for
population stratification using EIGENSOFT (http://genepath.med.harvard.edu/~reich/Software.htm).
We used the first ten principal components in all analyses. After the Akaike Information Criterion
(AIC) based stepwise model selection, the significant principal components were selected for
correcting a phenotype.
1.1.1.3. British 1958 Birth Cohort (British 1958BC)
Population – The British 1958 Birth Cohort is a national population sample followed periodically from
birth to age 44‐45 years, when a DNA bank was established as a national reference series for case‐
control studies. Standing height and weight were measured in the home, and adjusted throughout
for instrument and survey nurse (which also adjusts for any geographical variations). A total of 1502
cohort members were included as population controls in the Wellcome Trust Case‐Control
Consortium 2. After quality control checks for contamination, non‐European identity, relatedness and
low call rate (<93%), 1480 individuals were available with whole‐genome data
(http://www.b58cgene.sgul.ac.uk/). One of these with invalid weight measurement was excluded,
leaving 1479 individuals for this analysis. BMI was log‐transformed and z‐scores were calculated,
standardizing BMI by gender. Field protocols, informed consent and this within‐cohort genetic
association analysis were approved by the South East NHS Multi‐Centre Research Ethics Committee.
Genotyping & Quality Control – SNP genotyping was performed with the Affymetrix GeneChip
Human Mapping 500K Array Set as a part of the WTCCC2 and genotypes were called out using the
genotyping algorithm, CHIAMO (http://www.stats.ox.ac.uk/~marchini/software/gwas/chiamo.html).
Quality control was carried out as described previously2 and included sample call rate, overall
heterozygosity and evidence of non‐European ancestry. SNPs were excluded from analysis because
of missing data rates, departures from Hardy–Weinberg equilibrium and other metrics, as described
previously2.
Statistical analyses ‐ Association between each SNP and BMI (sex‐specific z‐score) was tested using a
generalised linear model (1df) assuming an additive effect for the presence of each additional minor
allele. Statistical analyses were conducted using Stata v.8.1. (College Station, TX, USA).
Page 6 of 51

1.1.1.4. UK Blood Services (UKBS panel 1)
Population – A cohort composed by 1,500 (UK Blood Services [UKBS]) controls were selected from a
sample of healthy blood donors ages 18 to 69 (with the majority of the individuals with ages 40‐59),
recruited as part of the WTCCC project as described in detail elsewhere2. Briefly, the participants
were about equally divided into males and females and the vast majority of individuals were self‐
reported as of European ancestry. The small number found, using the genome wide SNP data to have
significant non‐European ancestry were removed prior to analysis2. Height and weight was obtained
through self‐report. BMI was log‐transformed and z‐scores were calculated, standardizing BMI by
gender. All participants gave written informed consent and the relevant research ethics committees
in the UK approved the project protocols.
Genotyping & Quality Control – As described above under 1.1.1.3.
Statistical analyses ‐ Association between each SNP and BMI (sex‐specific z‐score) was tested using
linear regression assuming an additive model adjusting for age. Analyses were performed with the
software package PLINK (http://pngu.mgh.harvard.edu/purcell/plink/)9.
1.1.2. Case series
Case series originated from previously established sample collections with nationally representative
recruitment: 2,000 samples were genotyped for each within the WTCCC2.
1.1.2.1. WTCCC/T2DM Cases
Population – Details of the cases with type 2 diabetes (T2DM) have been described previously1, 3.
Briefly, a total of 1,999 individuals of British/Irish descent were selected from the Diabetes UK
Warren 2 repository. Diagnosis of diabetes was made between ages of 25 and 75 and was based on
either current prescribed treatment with diabetes‐specific medication or, in the case of those treated
with diet alone, historical or contemporary laboratory evidence of hyperglycemia. Other forms of
diabetes were excluded by standard clinical criteria based on personal and family history.
Approximately 30% of cases were explicitly recruited as part of multiplex sibships, and ~25%
represented the T2D offspring within parent‐offspring “triads” or “duos”. The remainder of the
participants were recruited as isolated cases ascertained for early age at diagnosis compared to the
population distribution and a high proportion of diabetic relatives. After applying quality control
criteria, a total of 1924 remained available for analysis. Height and weight were taken according to a
standardized protocol1. BMI was log‐transformed and z‐scores were calculated, standardizing BMI by
gender. All participants gave written informed consent and the project protocols were approved by
the local research ethics committees in the UK.
Genotyping & Quality Control – As described above under 1.1.1.3 .
Statistical analyses ‐ As described above under 1.1.1.4.
Page 7 of 51
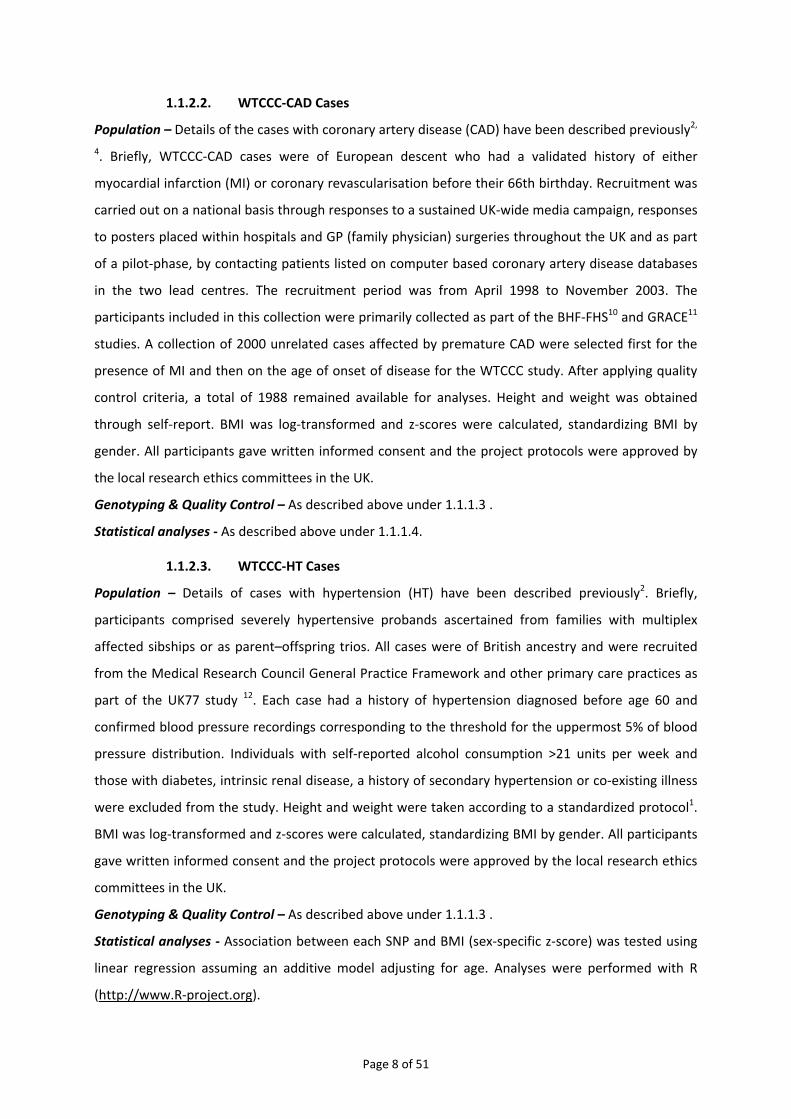
1.1.2.2. WTCCC‐CAD Cases
Population – Details of the cases with coronary artery disease (CAD) have been described previously2,
4. Briefly, WTCCC‐CAD cases were of European descent who had a validated history of either
myocardial infarction (MI) or coronary revascularisation before their 66th birthday. Recruitment was
carried out on a national basis through responses to a sustained UK‐wide media campaign, responses
to posters placed within hospitals and GP (family physician) surgeries throughout the UK and as part
of a pilot‐phase, by contacting patients listed on computer based coronary artery disease databases
in the two lead centres. The recruitment period was from April 1998 to November 2003. The
participants included in this collection were primarily collected as part of the BHF‐FHS10 and GRACE11
studies. A collection of 2000 unrelated cases affected by premature CAD were selected first for the
presence of MI and then on the age of onset of disease for the WTCCC study. After applying quality
control criteria, a total of 1988 remained available for analyses. Height and weight was obtained
through self‐report. BMI was log‐transformed and z‐scores were calculated, standardizing BMI by
gender. All participants gave written informed consent and the project protocols were approved by
the local research ethics committees in the UK.
Genotyping & Quality Control – As described above under 1.1.1.3 .
Statistical analyses ‐ As described above under 1.1.1.4.
1.1.2.3. WTCCC‐HT Cases
Population – Details of cases with hypertension (HT) have been described previously2. Briefly,
participants comprised severely hypertensive probands ascertained from families with multiplex
affected sibships or as parent–offspring trios. All cases were of British ancestry and were recruited
from the Medical Research Council General Practice Framework and other primary care practices as
part of the UK77 study 12. Each case had a history of hypertension diagnosed before age 60 and
confirmed blood pressure recordings corresponding to the threshold for the uppermost 5% of blood
pressure distribution. Individuals with self‐reported alcohol consumption >21 units per week and
those with diabetes, intrinsic renal disease, a history of secondary hypertension or co‐existing illness
were excluded from the study. Height and weight were taken according to a standardized protocol1.
BMI was log‐transformed and z‐scores were calculated, standardizing BMI by gender. All participants
gave written informed consent and the project protocols were approved by the local research ethics
committees in the UK.
Genotyping & Quality Control – As described above under 1.1.1.3 .
Statistical analyses ‐ Association between each SNP and BMI (sex‐specific z‐score) was tested using
linear regression assuming an additive model adjusting for age. Analyses were performed with R
(http://www.R‐project.org).
Page 8 of 51
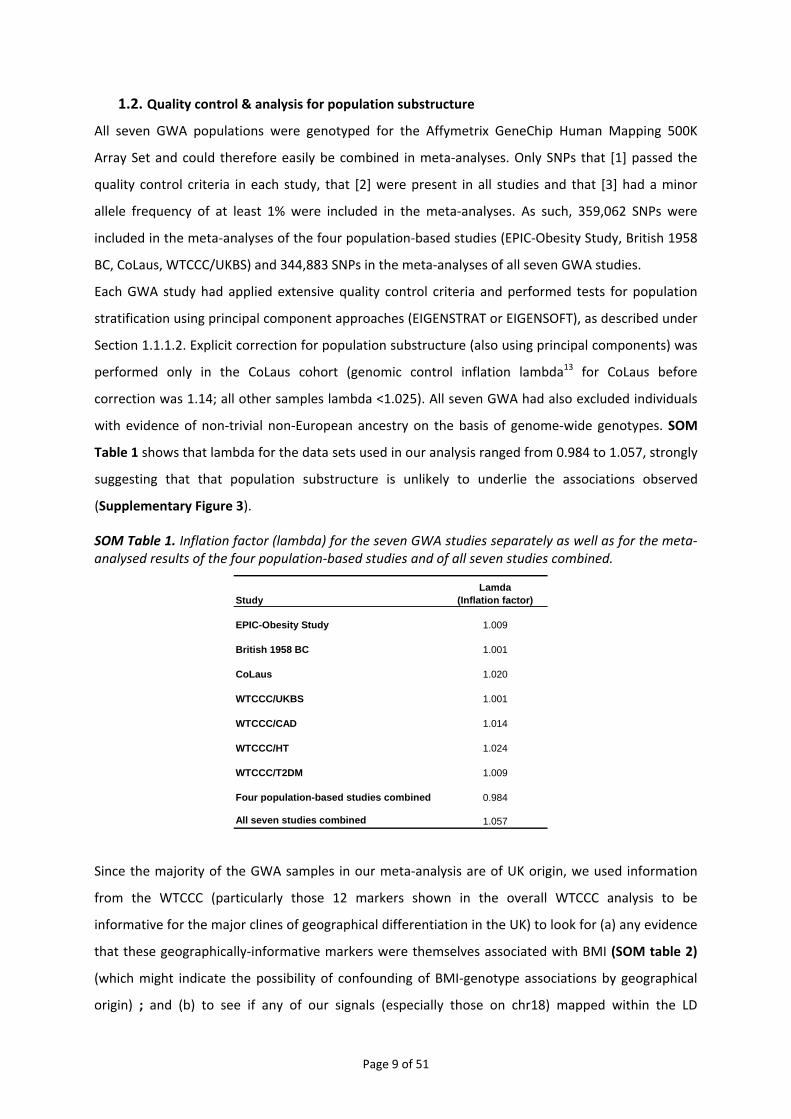
1.2. Quality control & analysis for population substructure All seven GWA populations were genotyped for the Affymetrix GeneChip Human Mapping 500K
Array Set and could therefore easily be combined in meta‐analyses. Only SNPs that [1] passed the
quality control criteria in each study, that [2] were present in all studies and that [3] had a minor
allele frequency of at least 1% were included in the meta‐analyses. As such, 359,062 SNPs were
included in the meta‐analyses of the four population‐based studies (EPIC‐Obesity Study, British 1958
BC, CoLaus, WTCCC/UKBS) and 344,883 SNPs in the meta‐analyses of all seven GWA studies.
Each GWA study had applied extensive quality control criteria and performed tests for population
stratification using principal component approaches (EIGENSTRAT or EIGENSOFT), as described under
Section 1.1.1.2. Explicit correction for population substructure (also using principal components) was
performed only in the CoLaus cohort (genomic control inflation lambda13 for CoLaus before
correction was 1.14; all other samples lambda <1.025). All seven GWA had also excluded individuals
with evidence of non‐trivial non‐European ancestry on the basis of genome‐wide genotypes. SOM
Table 1 shows that lambda for the data sets used in our analysis ranged from 0.984 to 1.057, strongly
suggesting that that population substructure is unlikely to underlie the associations observed
(Supplementary Figure 3).
SOM Table 1. Inflation factor (lambda) for the seven GWA studies separately as well as for the meta‐analysed results of the four population‐based studies and of all seven studies combined.
StudyLamda
(Inflation factor)
EPIC-Obesity Study 1.009
British 1958 BC 1.001
CoLaus 1.020
WTCCC/UKBS 1.001
WTCCC/CAD 1.014
WTCCC/HT 1.024
WTCCC/T2DM 1.009
Four population-based studies combined 0.984
All seven studies combined 1.057
Since the majority of the GWA samples in our meta‐analysis are of UK origin, we used information
from the WTCCC (particularly those 12 markers shown in the overall WTCCC analysis to be
informative for the major clines of geographical differentiation in the UK) to look for (a) any evidence
that these geographically‐informative markers were themselves associated with BMI (SOM table 2)
(which might indicate the possibility of confounding of BMI‐genotype associations by geographical
origin) ; and (b) to see if any of our signals (especially those on chr18) mapped within the LD
Page 9 of 51
“shadow” of any of these geographically‐informative markers. We found no evidence that the
geographically‐informative markers described by the WTCCC2 were associated with BMI (all P>0.01;
SOM Table 2) and none of our signals mapped anywhere near these markers (Supplementary Table
2). In the one scan for which these markers may not be relevant (CoLaus), correction for substructure
had been performed using the principal component approach: furthermore, there is no suggestion
that the BMI‐association signals seen in the CoLaus sample (Supplementary Table 2) were out of line
with those seen in the UK‐based GWA scans.
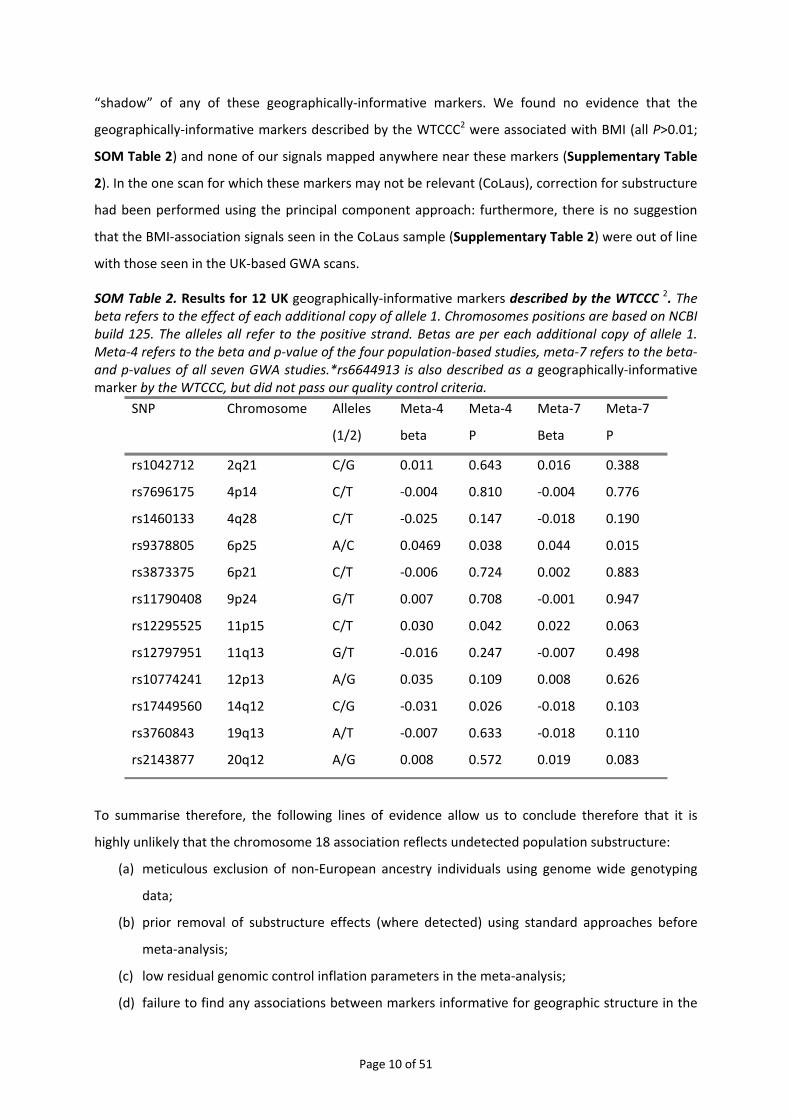
SOM Table 2. Results for 12 UK geographically‐informative markers described by the WTCCC 2. The beta refers to the effect of each additional copy of allele 1. Chromosomes positions are based on NCBI build 125. The alleles all refer to the positive strand. Betas are per each additional copy of allele 1. Meta‐4 refers to the beta and p‐value of the four population‐based studies, meta‐7 refers to the beta‐and p‐values of all seven GWA studies.*rs6644913 is also described as a geographically‐informative marker by the WTCCC, but did not pass our quality control criteria.
SNP Chromosome Alleles
(1/2)
Meta‐4
beta
Meta‐4
P
Meta‐7
Beta
Meta‐7
P
rs1042712 2q21 C/G 0.011 0.643 0.016 0.388
rs7696175 4p14 C/T ‐0.004 0.810 ‐0.004 0.776
rs1460133 4q28 C/T ‐0.025 0.147 ‐0.018 0.190
rs9378805 6p25 A/C 0.0469 0.038 0.044 0.015
rs3873375 6p21 C/T ‐0.006 0.724 0.002 0.883
rs11790408 9p24 G/T 0.007 0.708 ‐0.001 0.947
rs12295525 11p15 C/T 0.030 0.042 0.022 0.063
rs12797951 11q13 G/T ‐0.016 0.247 ‐0.007 0.498
rs10774241 12p13 A/G 0.035 0.109 0.008 0.626
rs17449560 14q12 C/G ‐0.031 0.026 ‐0.018 0.103
rs3760843 19q13 A/T ‐0.007 0.633 ‐0.018 0.110
rs2143877 20q12 A/G 0.008 0.572 0.019 0.083
To summarise therefore, the following lines of evidence allow us to conclude therefore that it is
highly unlikely that the chromosome 18 association reflects undetected population substructure:
(a) meticulous exclusion of non‐European ancestry individuals using genome wide genotyping
data;
(b) prior removal of substructure effects (where detected) using standard approaches before
meta‐analysis;
(c) low residual genomic control inflation parameters in the meta‐analysis;
(d) failure to find any associations between markers informative for geographic structure in the
Page 10 of 51

UK;
(e) lack of co‐localisation between the chr18 markers and any variants known to be ancestry‐
informative.
1.3. Imputations of genotypes at chromosome 18q21
We imputed genotypes in the chromosome 18q21 region (position 55.7Mb–56.4Mb NCBI Build 35) to
test whether we could identify more significant associations than those we had observed for
rs17782313 and rs17700633. Genotypes were imputed for each GWA study separately based on the
HapMap Phase II haplotypes using the software IMPUTE14. Subsequently, association tests between
the imputed genotypes and BMI (z‐score), adjusted for age, were performed with the software
SNPtest14 (using the full posterior probability genotype distribution), for each GWA separately,
before combining the summary statistics in the meta‐analyses. Only SNPs with a MAF of at least 1%
and with a posterior‐probability score >0.90 were considered for association analyses. Both the
IMPUTE and SNPtest software are freely available
(http://www.stats.ox.ac.uk/~marchini/software/gwas/gwas.html). The results of the association
analyses (meta‐analyses) with imputed data are presented in Figure 1 and Supplementary Figure 5.2
& 5.3.
1.4. Meta‐analysis of GWA studies
The summary statistics of the SNP‐BMI associations of each study were combined in meta‐analyses
for the SNPs that passed the quality control criteria and that were available in all studies as described
above. First, we meta‐analysed the summary statistics of population‐based studies only (EPIC‐
Obesity, CoLaus, British 1958 BC, and WTCCC/UKBS). Next, all 7 GWA studies were combined in one
overall meta‐analysis. The inverse variance‐weighted method was applied, which uses the effect size
(beta) and standard errors of the linear regression (additive) model of each study and weights the
effect size directly proportional to its precision15. The I2‐statistic16 and the Cochran's heterogeneity
statistic15 were used to estimate between‐study heterogeneity. Here, we report the summary
statistics for the fixed‐effect model, which assumes no heterogeneity across the studies. Therefore,
SNPs for which the meta‐analyses suggested significant heterogeneity (p < 0.10) were not
considered. Meta‐analyses were performed with SAS 9.1 (SAS Institute Inc., Cary, NC, USA) and, for
selected SNPs, forest‐plots were made with Stata 9.2 (StataCorp LP, College Station, TX, USA).
The results of the meta‐analyses are presented in Supplementary Figure 2 A&B. Our meta‐analyses
show an enrichment of associations compared to what would be expected by chance
(Supplementary Figure 3). For example, we observed 12 SNPs (4 independent signals) for the
population‐based meta‐analyses and 16 SNPs (8 independent signals) for the overall analysis that
Page 11 of 51
reached a P<1x10‐5, together representing 10 independent signals (r2 > 0.80) (Supplementary Table
2), where we would expect only 2 or 3 per GWA meta‐analysis.
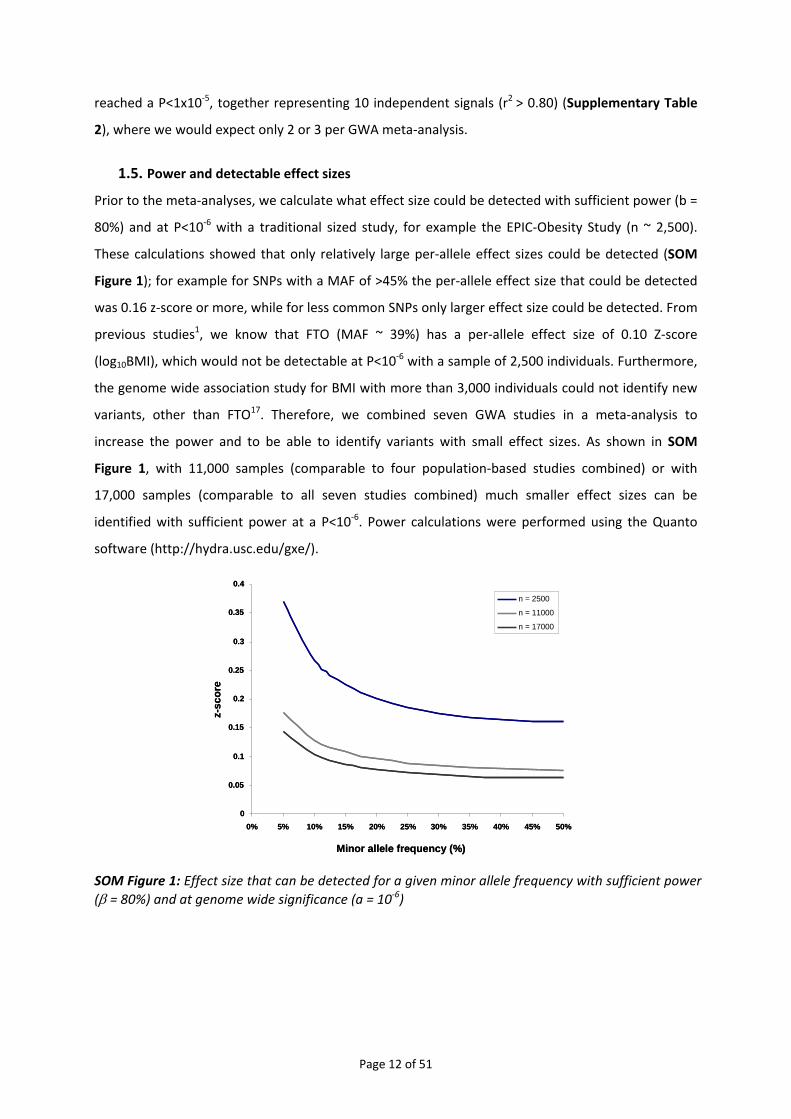
1.5. Power and detectable effect sizes Prior to the meta‐analyses, we calculate what effect size could be detected with sufficient power (b =
80%) and at P<10‐6 with a traditional sized study, for example the EPIC‐Obesity Study (n ~ 2,500).
These calculations showed that only relatively large per‐allele effect sizes could be detected (SOM
Figure 1); for example for SNPs with a MAF of >45% the per‐allele effect size that could be detected
was 0.16 z‐score or more, while for less common SNPs only larger effect size could be detected. From
previous studies1, we know that FTO (MAF ~ 39%) has a per‐allele effect size of 0.10 Z‐score
(log10BMI), which would not be detectable at P<10‐6 with a sample of 2,500 individuals. Furthermore,
the genome wide association study for BMI with more than 3,000 individuals could not identify new
variants, other than FTO17. Therefore, we combined seven GWA studies in a meta‐analysis to
increase the power and to be able to identify variants with small effect sizes. As shown in SOM
Figure 1, with 11,000 samples (comparable to four population‐based studies combined) or with
17,000 samples (comparable to all seven studies combined) much smaller effect sizes can be
identified with sufficient power at a P<10‐6. Power calculations were performed using the Quanto
software (http://hydra.usc.edu/gxe/).
0
0.05
0.1
0.15
0.2
0.25
0.3
0.35
0.4
0% 5% 10% 15% 20% 25% 30% 35% 40% 45% 50%
Minor allele frequency (%)
z-sc
ore
n = 2500
n = 11000
n = 17000
0
0.05
0.1
0.15
0.2
0.25
0.3
0.35
0.4
0% 5% 10% 15% 20% 25% 30% 35% 40% 45% 50%
Minor allele frequency (%)
z-sc
ore
n = 2500
n = 11000
n = 17000
SOM Figure 1: Effect size that can be detected for a given minor allele frequency with sufficient power (β = 80%) and at genome wide significance (a = 10‐6)
Page 12 of 51
2. REPLICATION STUDIES
We performed two types of replications. First, we genotyped rs17782313 in ten adult population‐
based studies (combined n=40,717), and three disease‐case series (n=3,757), all of European descent.
These are described under Section 2.1. Second, we obtained additional genotypes from six
population‐based studies (n=13,240) and two disease‐case series (n=2,638), all of European origin,
undergoing genome‐wide association analysis within the Genetic Investigation of Anthropometric
Traits (GIANT) consortium. These are described under Section 2.3.1.
2.1. Replication samples with individually genotyped variants
Basic descriptive characteristics for the population‐based studies are presented in Supplementary
Table 1.2. and of the case‐series in Supplementary Table 1.3. Allele frequencies, genotype
distributions and test for HWE are presented in Supplementary Table 3.1.
2.1.1. Population‐based studies
2.1.1.1. EPIC‐Norfolk
Sample ‐ EPIC‐Norfolk is an ongoing prospective cohort study of chronic diseases comprising 25,663
Norfolk residents, an ethnically homogenous Europid population aged 39‐79 who were recruited
from general practice registers between 1993 and 1997 for a first health examination. Trained nurses
collected blood sample, spot urine sample, data on respiratory function, anthropometry (data on
height, weight etc.), and blood pressure, at the health examination. A Health and Lifestyle
questionnaire was completed before the health check. More details on the study design of EPIC‐
Norfolk studies have been reported elsewhere5, 18. A total of 19,377 samples were immediately
available for genotyping. Individuals that had been analysed in the context of the GWA‐meta‐
analyses (see above Section 1.1.1.1) were excluded for replication analyses. Eventually, genotypes for
16,615 individuals with height and weight data were available for analyses. Volunteers provided
informed consent, and ethical approval was granted by the local research ethics committee.
Genotyping & Quality Control – Genotyping was performed using TaqMan® SNP genotyping assay
(Applied Biosystems, Warrington, UK) according to the manufacturer’s protocol. Genotype
frequencies were in HWE (p>0.01), call rates were >95% and concordances were >99%.
Statistical analyses – Association between quantitative traits (see below Section 2.3.1) and SNPs was
tested using a generalised linear model assuming an additive effect for the presence of each
additional minor allele, while adjusting for age and sex. For case–control analyses, each SNP was
tested for association with overweight or obesity in a logistic regression analysis, adjusted for age
and sex. All analyses were performed with SAS 9.1 (SAS Institute Inc., Cary, NC, USA).
Page 13 of 51

2.1.1.2. MRC‐Ely Study
Sample ‐ The MRC Ely Study is a population‐based cohort study of the aetiology of type 2 diabetes.
Study participants were randomly selected from people living in Ely and surrounding villages (East
Anglia, UK), an ethnically homogenous Europid population. The current analyses included 1697 men
and women, aged 35‐79 years, for whom genotypic and phenotypic data were available from phase 3
as previously described 19. None of the participants had diagnosed type 2 diabetes, although 139
individuals met the WHO criteria for T2D on oral glucose tolerance testing performed as part of the
study. The study design, methods and measurements of the three phases of this cohort study have
been described in detail elsewhere19‐22. In brief, all participants attended a clinical examination that
included standard anthropometric measurements, medical questionnaires and a 75‐g OGTT. Height
and weight were measured with participants dressed in light‐weight clothing without shoes. Ethical
permission was granted by the Cambridgeshire Research Ethics Committee, and study participants
provided written informed consent.
Genotyping & Quality Control – Genotyping of rs17782313 and rs17700633 was performed as
described above under Section 2.1.1.1. Genotype frequencies were in HWE (p>0.01), call rates >98%,
with >99% concordances of duplicates (n = 30).
Statistical analyses – As described above under 2.1.1.1.
2.1.1.3. The Northern Finland Birth Cohort of 1966
Sample ‐ The Northern Finland Birth Cohort of 1966 (NFBC1966) was originally designed to study
factors affecting pre‐term birth, low birth weight and subsequent morbidity and mortality. Mothers
living in the two northern‐most provinces of Finland were invited to participate if they had expected
delivery dates during 1966. A total of 12058 live‐births were in the study. At age 31 all individuals still
living in the Helsinki area or Northern Finland were asked to participate in a detailed biological and
medical examination (n=6,007) as well as a questionnaire. Anthropometric measures, including
height, weight and waist circumference were taken. Genotype and measured BMI data were
available on 4435 individuals in this study with multiple births being excluded. The University of Oulu
ethics committee approved the study.
Genotyping & Quality Control – Genotyping was performed using TaqMan® SNP genotyping assay
(Applied Biosystems, Warrington, UK) according to the manufacturer’s protocol. Genotype
frequencies were in HWE (p>0.01), call rates >95%, with >99.7% concordances of duplicates (n =
351).
Statistical analyses – Association between the quantitative traits (see below Section 2.3.1) and SNPs
was tested using a generalised linear model assuming an additive effect for the presence of each
additional minor allele, while adjusting for age and sex. For case–control analyses, each SNP was
Page 14 of 51
tested for association with overweight or obesity in a logistic regression analysis, adjusted for age
and sex. All analyses were done using Stata/SE 9.1 for Windows (StataCorp LP, Texas, USA).
2.1.1.4. Oxford Biobank (OBB)
Sample ‐ The Oxford Biobank is an age‐stratified random sample of men and women (aged 30 to 50
years) from Oxfordshire, UK, which was drawn from the UK National Health Service population
register. All participants are of white European origin. Data collection occurred between March 2000
and April 2002 and has been described in detail previously23. As well as DNA, basic anthropometric
data was measured and made available including; weight, height, waist circumference and skinfold
thickness (bicep, triceps, subscapular and suprailiac). The study was approved by the Oxfordshire
Research Ethics Committee and all participants gave their written informed consent.
Genotyping & Quality Control – Genotyping was performed as described under Section 2.1.1.3.
Genotype frequencies were in HWE (p>0.01), call rates >87%, with 100% concordances of duplicates
(n = 81).
Statistical analyses – As described above under Section 2.1.1.3.
2.1.1.5. UK Blood Services collection – panel 2 (UKBS2)
Sample ‐ The UKBS 2 is in essence similar to the UKBS panel 1 collection, which was included as
collection of Common Controls in the WTCCC study (WTCCC‐UKBS, as described above in Section
1.1.1.4). Samples were collected in the same time period and at the same locations at the UKBS‐
panel 1 samples.
Genotyping & Quality Control – Genotyping was performed as described under Section 2.1.1.3.
Genotype frequencies were in HWE (p>0.01), call rates >94%, with 100% concordances of duplicates.
Statistical analyses – As described above under Section 2.1.1.3.
2.1.1.6. The ALSPAC Study ‐ Mothers
Sample ‐ The Avon Longitudinal Study of Parents and Children (ALSPAC) is a prospective study, which
recruited pregnant women with expected delivery dates between April 1991 and December 1992
from Bristol, UK24. Individuals of known non‐white ethnic origin were excluded from all analyses. DNA
was collected from mothers and children as described previously25. Genotypes for SNPs and BMI data
were available for 6,264 mothers. Mother’s BMI was calculated from self‐reported pre‐pregnancy
weight and height, obtained from questionnaires. All aspects of the study were reviewed and
approved by the ALSPAC Law and Ethics Committee, which is registered as an Institutional Review
Board. Approval was also obtained from the Local Research Ethics Committees, which are governed
by the Department of Health. More detailed information on the ALSPAC study is available on the web
site: http://www.alspac.bris.ac.uk.
Genotyping & Quality Control – Genotyping of rs17782313 and rs17700633 were performed by
Page 15 of 51

KBiosciences (Hoddesdon, UK) using their own novel system of fluorescence‐based competitive
allele‐specific PCR (KASPar). Details of assay design are available from the KBiosciences website
(http://www.kbioscience.co.uk). Genotype frequencies were in HWE (p>0.01), call rates were 97%,
with 100% concordances of duplicates.
Statistical analyses – Association between the quantitative traits (see below Section 2.3.1) and SNPs
was tested using linear regression assuming an additive effect for the presence of each additional
minor allele, while adjusting for age. For case–control analyses, each SNP was tested for association
with overweight or obesity in a logistic regression analysis, adjusted for age. All analyses were done
using Stata/SE 9.2 for Windows (StataCorp LP, Texas, USA).
2.1.1.7. The Hertfordshire Cohort Study
Sample ‐ The Hertfordshire Cohort Study comprises 2,997 men and women born in the English
county of Hertfordshire during the period 1931‐1939 and still resident there today. Information
available on these individuals includes birth weight (recorded by the attending midwife), weight at
age one year (recorded by a health visitor), the method of infant feeding, and details of childhood
illnesses up to age five years. At follow‐up (age 60‐75 years), all participants attended a clinic for
detailed physiological investigations. Medical and social histories were ascertained, as well as
detailed anthropometry, blood pressure, glucose tolerance and fasting serum cholesterol and
triglycerides. DNA on all participants has been collected and is stored in the MRC Epidemiology
Resource Centre (Southampton, UK). Genotypes and data on height and weight were available for
2,881 individuals. The study has ethical approval from the Hertfordshire and Bedfordshire Local
Research Ethics Committee and all participants have given written informed consent. More details on
this study have been published before26.
Genotyping & Quality Control – Genotyping of rs17782313 and rs17700633 was performed as
described above under Section 2.1.1.1. Genotype frequencies were in HWE (p>0.01), call rates were
>98%, with 100% concordances of duplicates (n = 300).
As described above under 2.1.1.1.
Statistical analyses – As described above under 2.1.1.1.
2.1.1.8. EFSOCH controls
Population – This replication set includes 1,750 population controls from the Exeter Family Study of
Child Health (EFSOCH)27 and have been described in detail previously3. The controls were made up of
parents from a consecutive birth cohort (EFSOCH: the Exeter Family Study of Child Health). The North
and East Devon Local Research Ethics Committee gave ethical approval and informed consent was
obtained from the parents of the newborns.
Genotyping & Quality Control – Genotyping of rs17782313 and rs17700633 was performed as
Page 16 of 51

described under Section 2.1.1.6. Genotype frequencies were in HWE (p>0.01), call rates were >92%,
with 100% concordance of duplicates.
Statistical analyses – As described above under Section 2.1.1.3. Analyses were performed in
individuals with diabetes and in controls separately.
2.1.2. UK Type 2 diabetes case‐control collection
We included samples that are part of the UKT2D Genetics Consortium replication samples and that
have been described in detail before3. Association analyses between the two SNPs (rs17782313 &
rs17700633) and BMI were carried out in normoglyceamic controls and T2DM cases separately.
2.1.2.1. Dundee study (T2D cases and controls)
Sample ‐ All samples (Dundee T2D cases 1, Dundee T2D cases 2, Dundee controls 1, Dundee controls
2) were of European White descent, living in the Tayside region of Dundee when recruited. T2D cases
had T2D diagnosed between the ages of 35‐70 years (inclusive) and have been described in detail
previously3. In the present study, these samples were represented as two separate case, and two
separate control collections (as previously reported) though each represents part of a consecutive
series of cases and controls collected using same criteria. The first of these comprised 2,022 cases
and 2,037 controls and the second a further tranche of 1,103 cases and 1,559 controls. This study
was approved by the Tayside Medical Ethics Committee and informed consent was obtained from all
participants.
Genotyping & Quality Control – Genotyping of rs17782313 and rs17700633 was performed as
described under Section 2.1.1.6. Genotype frequencies were in HWE (p>0.01), call rates were >93%,
with 100% concordance of duplicates.
Statistical analyses – As described above under Section 2.1.1.3. Analyses were performed in
individuals with diabetes and in controls separately.
2.1.2.2. YT2DM‐OXGN (T2D cases)
Population – This sample set included 632 additional T2D cases that have been described in detail
previously3. They were UK Whites derived from two sources: 202 were taken from a collection of
young‐onset T2D patients (diagnosed before age 45y) who had been subjected to extensive analysis
to exclude other causes of diabetes. The remaining 430 were isolated T2D cases (age of diagnosis
below 65y)28. Both subsets met the same criteria for diagnosing T2D described for the WTCCC cases.
All participants gave written informed consent and the relevant research ethics committees in the UK
approved the project protocols.
Genotyping & Quality Control – Genotyping of rs17782313 and rs17700633 was performed as
described under Section 2.1.1.6. Genotype frequencies were in HWE (p>0.01), call rates were >92%,
Page 17 of 51

with 100% concordance of duplicates.
Statistical analyses – As described above under Section 2.1.1.3. Analyses were performed in
individuals with diabetes and in controls separately.
2.2. Replication Studies with genotypes recovered from genome wide association data
Basic descriptive characteristics are presented in Supplementary Table 1.4. Allele frequencies,
genotype distributions and test for HWE are presented in Supplementary Table 3.1.
2.2.1. Population‐based studies
2.2.1.1. The SardiNIA study
Sample ‐ The SardiNIA examined a total of 4,305 related individuals participating in a longitudinal
study of aging‐related quantitative traits in the Ogliastra region of Sardinia, Italy. During physical
examination of each individual, a blood sample was collected (for DNA extraction) and
anthropometric traits were recorded. Here, we report analyses of height, weight, and the derived
quantity BMI (which is calculated from a combination of height and weight. This has been described
in detail previously29.
Genotyping & Quality Control – Genotyped individuals had four Sardinian grandparents and were
selected for genotyping without regard to their phenotypes. Among the individuals examined, 1,412
were genotyped with the Affymetrix Mapping 500K Array Set. The rest of the individuals were
genotyped with the Affymetrix Mapping 10K Array. These marker data were then used to impute
genotypes at SNPs in the "500K" set for the remaining 2,893 individuals who were not typed with this
technology17, 30, 31. Imputed genotype dosages for rs17700633 and rs17782313 were extracted from
our genome‐wide imputed SNP data for these 2,893 individuals. Genotype frequencies for the
actually genotyped SNPs were in HWE (p>0.01) and call rates were >99%.
Statistical analysis – Association between the quantitative traits (see below Section 2.3.1) were
regressed against SNP reference allele counts with appropriate covariates (age and sex) using a score
test that accounts for relatedness among samples17, 30. Also, to adjust for the effects of population
structure and any residual relatedness among sampled individuals, the genomic control method was
used to adjust the test statistics for each trait separately13, 17.
2.2.1.2. KORA
Sample ‐ From the KORA survey of the years 1994/95 (KORA S3, n=3,996) based on the general
population of the South‐German city of Augsburg and surrounding counties, a subsample of 1644
individuals was genotyped by the Affymetrix Mapping 500K Array Set. Two pregnant women were
excluded from this sample. Trained personnel measured height and weight for each participant,
Page 18 of 51

more detailed information about the study is published elsewhere32. Descriptive characteristics for
these final participants are shown in Supplementary table 1.
Genotyping & Quality Control – Genotypes were extracted from the data available for the Affymetrix
Mapping 500K Array Set. Genotype frequencies were in HWE (p>0.01) and call rates were >95%.
Statistical analysis Association between quantitative traits (see below Section 2.3.1) and SNPs was
tested using a generalised linear model assuming an additive effect for the presence of each
additional minor allele, while adjusting for age and sex. For case–control analyses, each SNP was
tested for association with overweight or obesity in a logistic regression analysis, adjusted for age
and sex. All analyses were performed with SAS 9.1 (SAS Institute Inc., Cary, NC, USA).
2.2.1.3. Nurses Health Study (NHS)
Sample ‐ The Nurses’ Health Study (NHS) began in 1976 with the recruitment of 121,700 female
registered nurses between the ages of 30 and 55 years. The Cancer Genetic Markers of Susceptibility
(CGEMS) nested case‐control study is derived from 32,826 participants who provided a blood sample
between 1989 and 1990 and were free of diagnosed breast cancer at blood collection and followed
for incident disease until June 1, 2004. The study design has been described in detail elsewhere33. A
total of 1,183 DNA samples from affected individuals and 1,185 DNA samples from controls were
genotyped. Current weight was assessed on each follow‐up questionnaire. Self‐reported weight was
first validated in a sub‐sample of the NHS in 1980 and were highly correlated (r=0.97) with measured
weight34. Measures from 1986 were used as the primary outcome in analysis. We use the data from
two questionnaires most close to 1986 (1984 and 1982) as proxies when BMI of 1986 was missing. In
total, 2,265 women (1,132 cases of breast cancer and 1,133 controls) had height and weight data
available for the final analysis. Informed consent was obtained from all participants. The Institutional
Review Board of the Brigham and Women’s Hospital, Boston, MA, USA approved the study.
Genotyping & Quality Control – Genotyping was performed at the NCI Core Genotyping Facility using
the Sentrix HumanHap550 genotyping assay according to the manufacturer's protocol. Details on
quality control criteria were described in detail elsewhere33. Approximately 2.5 million common SNPs
from HapMap were imputed using the program MACH31 and imputed genotypes for rs17782313 and
rs17700633 were extracted for association analyses. The predicted r2 between imputed allele counts
and true genotypes for rs17782313 was 0.998 and for rs17700633 was 0.995, which suggests these
SNPs were accurately imputed. Genotype frequencies were in HWE (p>0.01).
Statistical analysis Associations between quantitative traits (see below Section 2.3.1) and SNPs were
tested using a generalized linear model assuming an additive effect for the presence of each
additional minor allele, adjusting for age. For case–control analyses, each SNP was tested for
association with overweight or obesity using logistic regression model, adjusting for age. The SAS
Page 19 of 51

statistical package was used for all analyses (Version 9.1 for UNIX; SAS Institute Inc., Cary, NC, USA).
2.2.1.4. Prostate, Lung, Colorectal and Ovarian Cancer Screening Trial (PLCO)
Sample ‐ PLCO is a population‐based, randomized trial to evaluate early detection methods for
prostate, lung, colorectal and ovarian cancer35. Between 1993 and 2001, over 150,000 men and
women ages 55‐74 years were enrolled in the trial from ten centers in the United States
(Birmingham, AL; Denver, CO; Detroit, MI; Honolulu, HI; Marshfield, WI; Minneapolis, MN;
Pittsburgh, PA; Salt Lake City, UT; St. Louis, MO; and Washington, D.C.). To discover genetic variants
associated with prostate cancer, 1,172 non‐Hispanic white prostate cancer cases and 1,105 matched,
non‐Hispanic white controls (by single sampling) were selected for genotyping as described
elsewhere36. Information on height and weight was ascertained by self‐report on the baseline
questionnaire and available for 2253 men. After applying quality control criteria for genotyping and
excluding 4 individuals with a BMI greater than four standard deviations from the mean, data of
2,235 men was available for analyses. All participants provided written informed consent for the trial
and the study protocol was approved by institutional review boards at the screening centers and the
National Cancer Institute.
Genotyping & Quality Control ‐ Genotyping was performed using the Illumina HumanHap300 and
HumanHap240 platforms according to the manufacturer's protocol. Details on quality control have
been described in detail elsewhere36. Approximately 2.5 million common SNPs from HapMap were
imputed using the program MACH31 and imputed genotypes for rs17782313 and rs17700633 were
extracted for association analyses. The predicted r2 between imputed allele counts and true
genotypes for rs17782313 was 0.998 and for rs17700633 was 0.997, which suggests these SNPs were
accurately imputed.
Statistical analyses ‐ Association between quantitative traits (see below Section 2.3.1) and SNPs was
tested using a linear regression model assuming an additive effect for the presence of each
additional minor allele, while adjusting for age, case status and center. For case–control analyses,
each SNP was tested for association with overweight or obesity in a logistic regression analysis,
adjusted for age, case status and center. All analyses were performed with SAS 9.1 (SAS Institute Inc.,
Cary, NC, USA).
2.2.2. Additional control and diabetes‐case series
2.2.2.1. The Finland‐US investigation of NIDDM Genetics (FUSION)
Sample ‐ The FUSION study is described previously in detail37. For analysis with BMI, the sample was
comprised of 1,094 T2D and 1,291 NGT individuals from Finland, all with BMI measured during
clinical exams.
Page 20 of 51
Genotyping & Quality Control ‐ The samples were genotyped using the Illumina Infinium II
HumanHap300 BeadChip (version 1.0) and quality control was described in detail elsewhere37.
Genotypes for >2.1 million additional SNPs were imputed using MACH31, 37 and the HapMap CEU
sample. Imputed genotype dosages, which incorporate the imputed probabilities of all three
genotype classes per individual, for rs17700633 and rs17782313 were extracted from genome‐wide
imputed SNP data. The predicted r2 between imputed allele counts and true genotypes for
rs17782313 was 0.89 and for rs17700633 was 1.00, which suggests these SNPs were accurately
imputed. Quality of imputed genotypes was evaluated on a larger scale by comparing imputed
genotypes for 521 markers with those obtained by genotyping 1,190 individuals and observed an
error rate of 1.40% per allele supporting the good performance of the imputation software.
Statistical analysis ‐ SNP‐BMI association was carried out separately in T2DM and NGT individuals.
Raw trait values, or z‐scores standardized by sex were regressed against SNP reference allele counts
with appropriate covariates (age and sex) using a score test that accounts for relatedness among
samples30.
2.2.2.2. The Diabetes Genetics Initiative (DGI) (type 2 diabetes)
Population – The descriptive characteristics of individuals used for analysis from the Diabetes
Genetics Initiative have been described previously38. All participants were from Sweden and Finland
and height and weight were collected and were used to calculate their BMI.
Genotyping & Quality Control ‐ Samples were genotyped on the Affymetrix GeneChip Human
Mapping 500K array set and genotyping calls were made using the BRLMM algorithm as previously
described38. The genotyping quality control measures used for this study have been described
previously38. Of 3,193 samples with >95% genotype call rate, 111 samples with cryptic relatedness
(parent‐offspring) or discrepancy between reported and genotyped gender were excluded. BMI data
and high quality genotypes were available for 3048 individuals. The final sample used for analyses
reported here included 1,544 cases and 1,504 controls.
Statistical analyses ‐ Association between quantitative traits (see below Section 2.3.1) and SNPs was
tested using a linear regression model assuming an additive effect for the presence of each
additional minor allele, while adjusting for age, sex and center. Sex‐specific Z‐scores were created
within age decades (<50, 50‐60, 60‐70, >70) in population samples and log(10)BMI, SD of the
log(10)BMI and beta coefficient from the regression were then used to create population corrected z
scores of individuals in the DGI study which were corrected for center of origin. For case–control
analyses, each SNP was tested for association with overweight or obesity in a logistic regression
analysis, adjusted for age, case status and center. Analyses were performed in individuals with
diabetes and in controls separately. All analyses were performed with SAS 9.1 (SAS Institute Inc.,
Page 21 of 51
Cary, NC, USA).
2.3. Statistical analysis for the replication samples
2.3.1. Outcome measures
For tests of statistical significance, BMI, as the main outcome measure was log10‐transformed and
standardized to sex‐specific Z‐score before analyses. However, for presentation, geometric means
and 95% analyses were also performed with BMI log10‐transformed (but not standardized) (Table 1
and Supplementary Table 4). For relevant analyses, height was standardized to sex‐specific Z‐scores,
whilst weight was log10‐transformed before standardizing. Case‐control analyses (i.e. for obesity and
overweight) within population‐based samples were performed by comparing overweight
(BMI≥25kg.m‐2) and obesity (BMI≥30kg.m‐2) to normal‐weight (BMI<25kg.m‐2) individuals.
2.3.2. Association analyses in replication sets
Association between SNPs and continuous outcome measures was tested using linear regression
assuming an additive model, adjusted for age and other appropriate covariates. Logistic regression
was used to test for association between genotype and overweight/obesity, adjusted for age and sex.
All analyses were also performed for men and women separately. More details are provided in the
individual descriptions of studies above.
2.3.3. Meta‐analyses of replication data
The summary statistics (beta/OR and SE) for each of the separate studies were combined in meta‐
analyses using the inverse‐variance weighted method assuming a fixed‐effects model, conducted in
Stata 9.2 (StataCorp LP, College Station, TX, USA). The results were visualised in forest‐plots made
with Stata 9.2 (StataCorp LP, College Station, TX, USA).
To provide approximate effect‐size estimates expressed in BMI units (kg.m‐2), we translated from the
Z‐score unit differences using the standard deviation of raw BMI (a mean SD of 4.5 kg/m2 in the
population‐based cohorts). This method was also applied to provide approximate effect size
estimates for reporting height (mean SD of 7cm) and weight (mean SD of 13.4 kg) data.
3. FOLLOW‐UP STUDIES
3.1. French adult obesity case‐control study Population – This obesity case‐control studies comprises 2,363 controls, defined by a BMI < 25 kg.m‐
2, and 896 cases with a BMI ≥ 40 kg.m‐² (Class III obesity) (Supplementary Table 1.5. & 3.1.). The
control sample includes 493 young lean adults from the Haguenau study and 1,870 middle‐aged lean
Page 22 of 51
adults from the D.E.S.I.R. cohort, a population of volunteers recruited from 10 health examination
centers in the western‐central part of France. Cases were recruited through a multimedia campaign
run by the CNRS UMR8090 and the Department of Nutrition of the Paris Hotel Dieu Hospital. All
participants were French, unrelated and of European descent.
Genotyping & Quality Control ‐ Genotyping was performed using TaqMan® SNP genotyping assay
(Applied Biosystems, Warrington, UK) according to the manufacturer’s protocol. Genotype
frequencies were in HWE (p>0.01), call rates >98%, with 100% concordances of duplicates.
Statistical analyses ‐ The association between rs17782313 and obesity case‐control status was
performed using logistic regression, adjusted for age and sex with SPSS 14.1 software (SPSS, Chicago,
IL, USA).
3.2. Follow up studies in children
Basic descriptive characteristics are presented in Supplementary Table 1.6. Allele frequencies,
genotype distributions and test for HWE are presented in Supplementary Table 3.2.
3.2.1. Population‐based sample – The ALSPAC Population Children’s cohort
Sample ‐ The Avon Longitudinal Study of Parents and Children (ALSPAC) is a prospective study, which
recruited pregnant women with expected delivery dates between April 1991 and December 1992
from Bristol, UK24. Individuals of known non‐white ethnic origin were excluded from all analyses. DNA
was collected from mothers and children as described previously25. Genotypes were available for
7,477 children this study. Where the dataset included multiple singleton siblings born to the same
mother, only the first‐born was included in the analyses of children. All multiple births and
individuals born before 36 full weeks’ gestation were excluded from analyses of birth weight and
ponderal index. For the analyses of BMI, height and weight in children aged 7‐11, only the first‐born
of each twin‐pair was included. Birth weight and length were measured by trained ALSPAC study staff
or obtained from hospital records, whilst sex and gestation were extracted from hospital records.
This has been described in detail previously28. At the ages of 7 to 11, children were invited annually
to attend a specially‐designed clinic, at which anthropometric measures, including height and weight,
were taken27. The numbers of children with BMI and genotype data aged 7‐11 years ranged from
4,871 to 5,969. In addition, 7,470 children, at age 9, agreed to undergo a whole‐body dual energy X‐
ray absorptiometry (DEXA) scan to assess fat and lean mass, described in detail previously28. DEXA
scan data and genotype were available for 5,243 children included in this study. All aspects of the
study are reviewed and approved by the ALSPAC Law and Ethics Committee, which is registered as an
Institutional Review Board. Approval was also obtained from the Local Research Ethics Committees,
which are governed by the Department of Health.
Genotyping & Quality Control – Genotyping was performed as described under Section 2.1.1.3.
Page 23 of 51
Genotype frequencies were in HWE (p>0.01), call rates >97%, with 100% concordances of duplicates.
Statistical analyses ‐ BMI and weight between age 7 and 11, as well as DXA body fat percentage, DXA
fat mass, DXA lean mass and DXA bone mass at age 9 were log10‐transformed whereas height
remained untransformed before calculating sex‐specific Z‐scores. Weight and height during the first
42 months of life were expressed as SDS relative to British 1990 scales39. Association between these
anthropometric measures and SNPs was tested using linear regression assuming an additive effect
for the presence of each additional minor allele. Analyses of birth weight were adjusted for sex and
gestational age. All analyses were performed with Stata/SE 9.2 for Windows (StataCorp LP, College
Station, Texas, USA).
3.2.2. Childhood and adolescence obesity case‐control studies
3.2.2.1. SCOOP‐UK
Sample ‐ The Severe Childhood Onset Obesity Project UK (SCOOP‐UK) comprises 1,028 UK
participants of European descent with severe early onset obesity of unknown aetiology. This cohort
has emerged out of the Genetics of Obesity Study (GOOS) (n=2,800). The entry criteria for the GOOS
cohort comprise a BMI > 3 SDS and an onset of obesity before the age of 10 years39. Several
monogenic obesity syndromes have previously been identified from this cohort. SCOOP‐UK
represents a subgroup of GOOS patients of UK European ancestry in whom all the known monogenic
obesity syndromes (including MC4R mutation carriers) have been excluded by direct nucleotide
sequencing. The ALSPAC children (as described above in 3.2.1.) were used as controls in this analysis.
Genotyping & Quality Control – Genotyping was performed using TaqMan® SNP genotyping assay
(Applied Biosystems, Warrington, UK) according to the manufacturer’s protocol. Genotype
frequencies were in HWE (p>0.01) and call rates >96%.
Statistical analyses – For the case‐control analysis, all SCOOP‐UK children were considered cases,
while ALSPAC children, irrespective of their BMI were used as controls. Association between SNP and
case‐control status was performed using Fisher’s exact test.
3.2.2.2. The Essen Obesity Study
Population – A total of 487 extremely obese children and adolescents ('cases', >95th percentile of a
German reference population) were recruited in hospitals specialized for the inpatient treatment of
extreme obesity while 442 healthy lean individuals ('controls') were ascertained at the University of
Marburg. Based on self‐reported questionnaire data on body‐weight course, 78% of the lean controls
reported having had a below average body weight at age 15, which is similar to the mean age of the
obese cases. More details have been reported previously40. Written informed consent was given by
all participants and in case of minors their parents. The study was approved by the Ethics
Committees of the Universities of Marburg and Essen and conducted in accordance with the
Page 24 of 51

guidelines of The Declaration of Helsinki.
Genotyping & Quality Control – Genotypes were extracted from the data available for the Affymetrix
Mapping 500K Array Set. Genotype frequencies were in HWE (p>0.01) and call rates were >99%.
Statistical analyses – The association between rs17782313 and obesity case‐control status was
performed using logistic regression, adjusted for age and sex with SPSS 14.0 software (SPSS, Chicago,
IL, USA).
3.2.2.3. French Childhood Obesity Case‐Control Study
Population – Children with a BMI ≥ 97th percentile for gender and age in the tables of a French
reference population41 were defined as obese according to the European Childhood Obesity Group
recommendations42, and children with a BMI below the 90th percentile threshold were considered as
non‐obese controls. Obese children were collected through a multimedia campaign run by the CNRS
UMR8090 (n = 616) as well as in the Saint Vincent de Paul hospital (N=497), in the Toulouse
Children’s Hospital (N = 92) and in the Paris Trousseau Hospital (n=86). Controls were recruited in the
“Centre de Medecine Preventive” of Nancy (n=670), through the Fleurbaix‐Laventie Ville Santé II
study (n=184) and supplemented with 493 lean young adults from the Haguenau study (Section 3.1).
Genotyping & Quality Control ‐ Genotyping was performed using TaqMan® SNP genotyping assay
(Applied Biosystems, Warrington, UK) according to the manufacturer’s protocol. Genotype
frequencies were in HWE (p>0.01), call rates >95%, with 100% concordances of duplicates.
Statistical analyses ‐ The association between rs17782313 and obesity case‐control status was
performed using logistic regression, adjusted for age and sex with SPSS 14.1 software (SPSS, Chicago,
IL, USA).
3.2.2.4. Meta‐analyses of childhood‐adolescence case‐control studies
The summary statistics (OR and SE) for each of the separate studies were combined in meta‐analyses
using the inverse‐variance weighted method assuming a fixed‐effects model, conducted in Stata 9.2
(StataCorp LP, College Station, TX, USA). The results were visualised in forest‐plots made with Stata
9.2 (StataCorp LP, College Station, TX, USA).
3.2.3. The Essen Obesity Family Study
Population – A total of 660 families that comprised at least one extremely obese child or adolescent
(>95th percentile of a German reference population) and both biological parents were recruited in
hospitals specialized for the inpatient treatment of extreme obesity (Supplementary Table 1.7. &
Table 3.1.&3.2.). There was no overlap in participants of the Essen Obesity Family Study and the
Essen Obesity Study (see 3.2.2.2). More details have been reported previously40. Written informed
consent was given by all participants and in case of minors their parents. The study was approved by
the Ethics Committees of the Universities of Marburg and Essen and conducted in accordance with
Page 25 of 51
the guidelines of The Declaration of Helsinki.
Genotyping & Quality Control – Genotyping was performed using TaqMan® SNP genotyping assay
(Applied Biosystems) according to the manufacturer’s protocol. Genotype frequencies of parents
were in HWE (p>0.01) and call rates were 100%.
Statistical analyses and results – A pedigree transmission disequilibrium test (PDT average) showed
significant over‐transmission of the rs17782313 C‐allele to the obese offspring (p = 2.42x10‐4). The
exact two‐sided Hardy‐Weinberg test in the founders showed evidence of excess heterozygosity (p =
0.015) which might be due to the association. Therefore, we also determined genotype relative risks
(GRRs) which are robust against deviations from Hardy‐Weinberg equilibrium43. The GRRs confirmed
the increased risk associated with the C‐allele (GRR‐C/T = 1.22, 95%CI[1.03‐1.46]; GRR‐C/C 1.95 [1.49‐
2.56]; p = 6.14x10‐5).
4. SUPPLEMENTARY OBSERVATIONS
4.1. Replication results for additional hits We tested for association between the remaining hits described in Supplementary Table 2 and BMI
in nine population‐based and 2 case series studies (Supplementary Table 7). These results show that
only the SNP in FTO is robustly replicated in these samples (p=5.95x10‐28). The rs10498767 and
rs748912 are the only other signals that have consistent direction of effect and significant association
with BMI in the replication samples (p=0.009, p=0.05 respectively). However, given the smaller effect
sizes and modest replication p‐values for these additional association results, further extensive
replication testing will be required to definitively confirm or refute association with BMI for all these
variants (Supplementary Table 7).
4.2. Association with type 2 diabetes We tested for association between rs17782313 and the risk of T2D. Data on diabetes status were
available for four case‐control comparisons (Dundee T2D cases 1 vs Dundee controls 1, Dundee T2D
cases 2 vs Dundee controls 2, YT2D‐OXGN vs EFSOCH, WTCCC‐T2D vs WTCCC‐controls) and five
population‐based studies (EPIC‐Obesity, EPIC‐Norfolk, MRC‐Ely Study, British 1958 BC, CoLaus). For
the population‐based studies, individuals that met the WHO criteria for T2D where classified as
cases, whereas the remaining individuals were considered as controls.
In a first logistics regression analyses, we tested for association between rs17782313 and the risk of
T2D, adjusted for age and sex (SOM Figure 2). To test whether this association was mediated through
an effect of rs17782313 on BMI, we also adjusted for BMI in the analysis (SOM Figure 2). Summary
statistics (OR, SE) were combined in meta‐analyses using the inverse variance‐weighted method with
Page 26 of 51
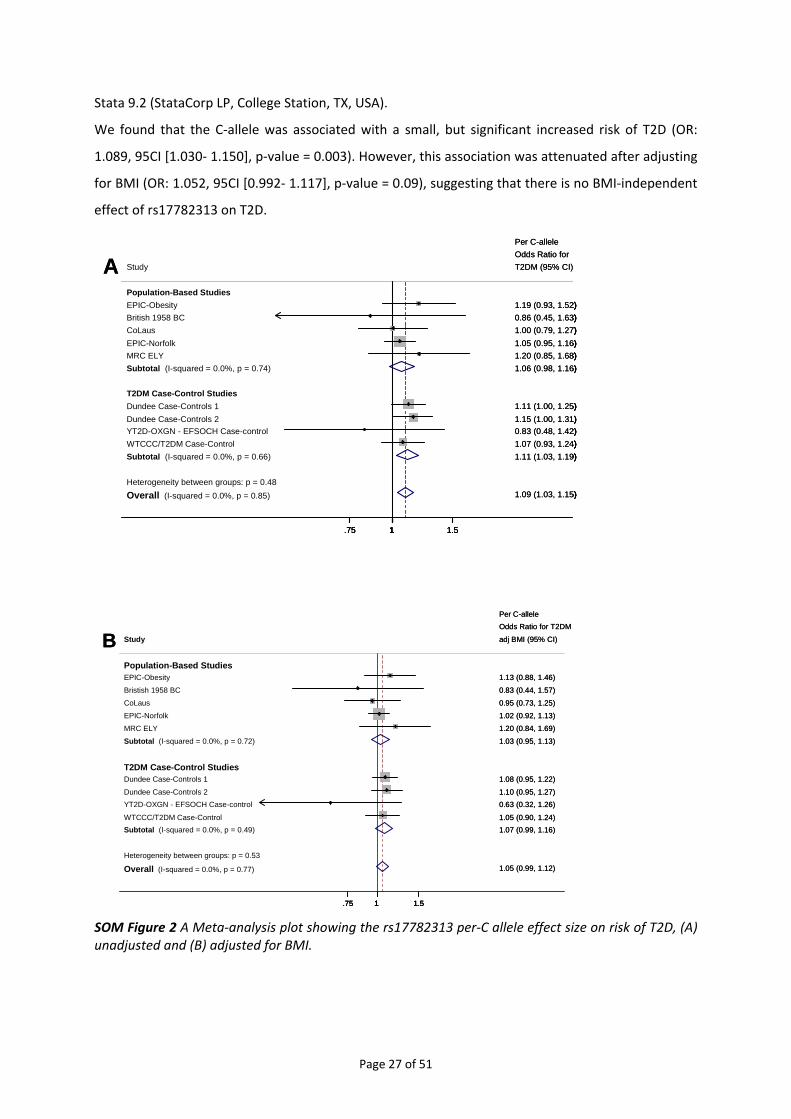
Stata 9.2 (StataCorp LP, College Station, TX, USA).
We found that the C‐allele was associated with a small, but significant increased risk of T2D (OR:
1.089, 95CI [1.030‐ 1.150], p‐value = 0.003). However, this association was attenuated after adjusting
for BMI (OR: 1.052, 95CI [0.992‐ 1.117], p‐value = 0.09), suggesting that there is no BMI‐independent
effect of rs17782313 on T2D.
Heterogeneity between groups: p = 0.48Overall (I-squared = 0.0%, p = 0.85)
YT2D-OXGN - EFSOCH Case-control
T2DM Case-Control Studies
Study
British 1958 BC
Subtotal (I-squared = 0.0%, p = 0.74)
Population-Based Studies
Dundee Case-Controls 2
WTCCC/T2DM Case-Control
CoLaus
MRC ELYEPIC-Norfolk
Dundee Case-Controls 1
EPIC-Obesity
Subtotal (I-squared = 0.0%, p = 0.66)
1.09 (1.03, 1.15)
0.83 (0.48, 1.42)
T2DM (95% CI)
0.86 (0.45, 1.63)
Odds Ratio for
1.06 (0.98, 1.16)
1.15 (1.00, 1.31)
1.07 (0.93, 1.24)
1.00 (0.79, 1.27)
1.20 (0.85, 1.68)1.05 (0.95, 1.16)
1.11 (1.00, 1.25)
1.19 (0.93, 1.52)
1.11 (1.03, 1.19)
Per C-allele
1.09 (1.03, 1.15)
0.83 (0.48, 1.42)
T2DM (95% CI)
0.86 (0.45, 1.63)
Odds Ratio for
1.06 (0.98, 1.16)
1.15 (1.00, 1.31)
1.07 (0.93, 1.24)
1.00 (0.79, 1.27)
1.20 (0.85, 1.68)1.05 (0.95, 1.16)
1.11 (1.00, 1.25)
1.19 (0.93, 1.52)
1.11 (1.03, 1.19)
Per C-allele
1.75 1 1.5
A
Heterogeneity between groups: p = 0.48Overall (I-squared = 0.0%, p = 0.85)
YT2D-OXGN - EFSOCH Case-control
T2DM Case-Control Studies
Study
British 1958 BC
Subtotal (I-squared = 0.0%, p = 0.74)
Population-Based Studies
Dundee Case-Controls 2
WTCCC/T2DM Case-Control
CoLaus
MRC ELYEPIC-Norfolk
Dundee Case-Controls 1
EPIC-Obesity
Subtotal (I-squared = 0.0%, p = 0.66)
1.09 (1.03, 1.15)
0.83 (0.48, 1.42)
T2DM (95% CI)
0.86 (0.45, 1.63)
Odds Ratio for
1.06 (0.98, 1.16)
1.15 (1.00, 1.31)
1.07 (0.93, 1.24)
1.00 (0.79, 1.27)
1.20 (0.85, 1.68)1.05 (0.95, 1.16)
1.11 (1.00, 1.25)
1.19 (0.93, 1.52)
1.11 (1.03, 1.19)
Per C-allele
1.09 (1.03, 1.15)
0.83 (0.48, 1.42)
T2DM (95% CI)
0.86 (0.45, 1.63)
Odds Ratio for
1.06 (0.98, 1.16)
1.15 (1.00, 1.31)
1.07 (0.93, 1.24)
1.00 (0.79, 1.27)
1.20 (0.85, 1.68)1.05 (0.95, 1.16)
1.11 (1.00, 1.25)
1.19 (0.93, 1.52)
1.11 (1.03, 1.19)
Per C-allele
1.75 1 1.5
A
Heterogeneity between groups: p = 0.53
Overall (I-squared = 0.0%, p = 0.77)
Subtotal (I-squared = 0.0%, p = 0.49)
MRC ELY
Dundee Case-Controls 2YT2D-OXGN - EFSOCH Case-control
T2DM Case-Control Studies
Bristish 1958 BC
Study
Dundee Case-Controls 1
EPIC-Norfolk
CoLaus
WTCCC/T2DM Case-Control
Subtotal (I-squared = 0.0%, p = 0.72)
Population-Based StudiesEPIC-Obesity
1.05 (0.99, 1.12)
Odds Ratio for T2DM
1.07 (0.99, 1.16)
1.20 (0.84, 1.69)
1.10 (0.95, 1.27)0.63 (0.32, 1.26)
Per C-allele
0.83 (0.44, 1.57)
adj BMI (95% CI)
1.08 (0.95, 1.22)
1.02 (0.92, 1.13)
0.95 (0.73, 1.25)
1.05 (0.90, 1.24)
1.03 (0.95, 1.13)
1.13 (0.88, 1.46)
1.05 (0.99, 1.12)
Odds Ratio for T2DM
1.07 (0.99, 1.16)
1.20 (0.84, 1.69)
1.10 (0.95, 1.27)0.63 (0.32, 1.26)
Per C-allele
0.83 (0.44, 1.57)
adj BMI (95% CI)
1.08 (0.95, 1.22)
1.02 (0.92, 1.13)
0.95 (0.73, 1.25)
1.05 (0.90, 1.24)
1.03 (0.95, 1.13)
1.13 (0.88, 1.46)
1.75 1 1.5
B
Heterogeneity between groups: p = 0.53
Overall (I-squared = 0.0%, p = 0.77)
Subtotal (I-squared = 0.0%, p = 0.49)
MRC ELY
Dundee Case-Controls 2YT2D-OXGN - EFSOCH Case-control
T2DM Case-Control Studies
Bristish 1958 BC
Study
Dundee Case-Controls 1
EPIC-Norfolk
CoLaus
WTCCC/T2DM Case-Control
Subtotal (I-squared = 0.0%, p = 0.72)
Population-Based StudiesEPIC-Obesity
1.05 (0.99, 1.12)
Odds Ratio for T2DM
1.07 (0.99, 1.16)
1.20 (0.84, 1.69)
1.10 (0.95, 1.27)0.63 (0.32, 1.26)
Per C-allele
0.83 (0.44, 1.57)
adj BMI (95% CI)
1.08 (0.95, 1.22)
1.02 (0.92, 1.13)
0.95 (0.73, 1.25)
1.05 (0.90, 1.24)
1.03 (0.95, 1.13)
1.13 (0.88, 1.46)
1.05 (0.99, 1.12)
Odds Ratio for T2DM
1.07 (0.99, 1.16)
1.20 (0.84, 1.69)
1.10 (0.95, 1.27)0.63 (0.32, 1.26)
Per C-allele
0.83 (0.44, 1.57)
adj BMI (95% CI)
1.08 (0.95, 1.22)
1.02 (0.92, 1.13)
0.95 (0.73, 1.25)
1.05 (0.90, 1.24)
1.03 (0.95, 1.13)
1.13 (0.88, 1.46)
1.75 1 1.5
B
SOM Figure 2 A Meta‐analysis plot showing the rs17782313 per‐C allele effect size on risk of T2D, (A) unadjusted and (B) adjusted for BMI.
Page 27 of 51
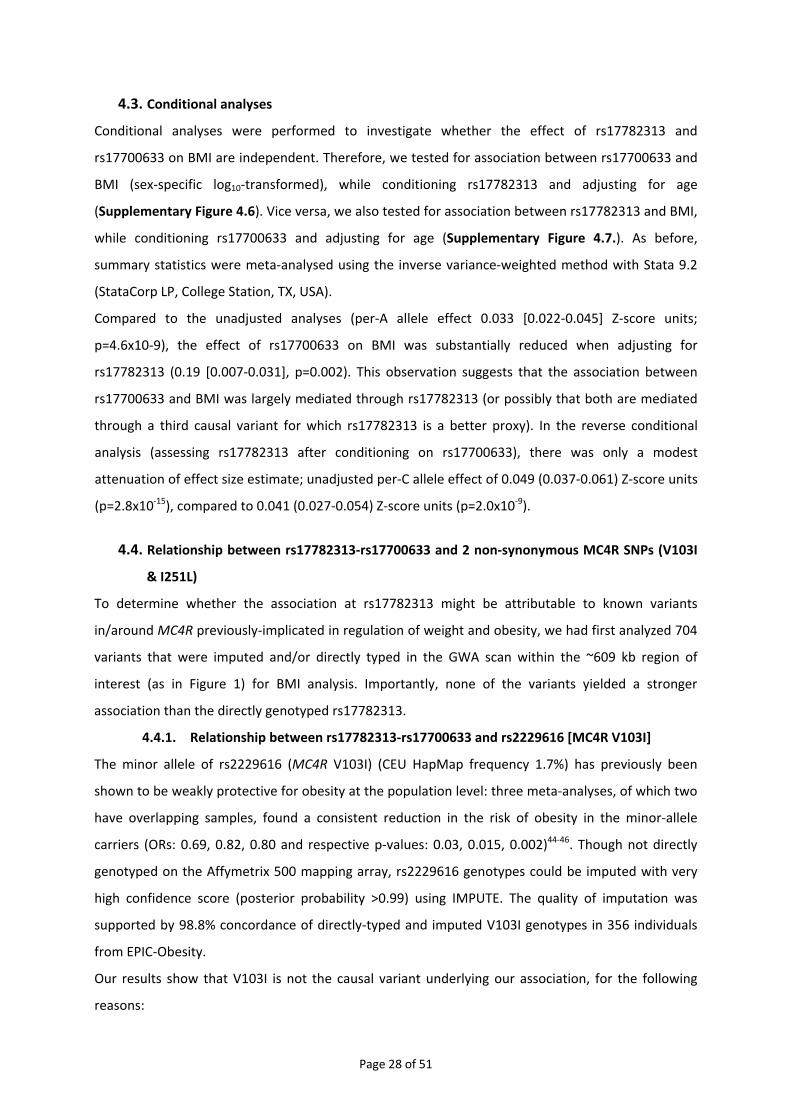
4.3. Conditional analyses Conditional analyses were performed to investigate whether the effect of rs17782313 and
rs17700633 on BMI are independent. Therefore, we tested for association between rs17700633 and
BMI (sex‐specific log10‐transformed), while conditioning rs17782313 and adjusting for age
(Supplementary Figure 4.6). Vice versa, we also tested for association between rs17782313 and BMI,
while conditioning rs17700633 and adjusting for age (Supplementary Figure 4.7.). As before,
summary statistics were meta‐analysed using the inverse variance‐weighted method with Stata 9.2
(StataCorp LP, College Station, TX, USA).
Compared to the unadjusted analyses (per‐A allele effect 0.033 [0.022‐0.045] Z‐score units;
p=4.6x10‐9), the effect of rs17700633 on BMI was substantially reduced when adjusting for
rs17782313 (0.19 [0.007‐0.031], p=0.002). This observation suggests that the association between
rs17700633 and BMI was largely mediated through rs17782313 (or possibly that both are mediated
through a third causal variant for which rs17782313 is a better proxy). In the reverse conditional
analysis (assessing rs17782313 after conditioning on rs17700633), there was only a modest
attenuation of effect size estimate; unadjusted per‐C allele effect of 0.049 (0.037‐0.061) Z‐score units
(p=2.8x10‐15), compared to 0.041 (0.027‐0.054) Z‐score units (p=2.0x10‐9).
4.4. Relationship between rs17782313‐rs17700633 and 2 non‐synonymous MC4R SNPs (V103I
& I251L)
To determine whether the association at rs17782313 might be attributable to known variants
in/around MC4R previously‐implicated in regulation of weight and obesity, we had first analyzed 704
variants that were imputed and/or directly typed in the GWA scan within the ~609 kb region of
interest (as in Figure 1) for BMI analysis. Importantly, none of the variants yielded a stronger
association than the directly genotyped rs17782313.
4.4.1. Relationship between rs17782313‐rs17700633 and rs2229616 [MC4R V103I]
The minor allele of rs2229616 (MC4R V103I) (CEU HapMap frequency 1.7%) has previously been
shown to be weakly protective for obesity at the population level: three meta‐analyses, of which two
have overlapping samples, found a consistent reduction in the risk of obesity in the minor‐allele
carriers (ORs: 0.69, 0.82, 0.80 and respective p‐values: 0.03, 0.015, 0.002)44‐46. Though not directly
genotyped on the Affymetrix 500 mapping array, rs2229616 genotypes could be imputed with very
high confidence score (posterior probability >0.99) using IMPUTE. The quality of imputation was
supported by 98.8% concordance of directly‐typed and imputed V103I genotypes in 356 individuals
from EPIC‐Obesity.
Our results show that V103I is not the causal variant underlying our association, for the following
reasons:
Page 28 of 51

• V103I has only weak correlation with our two associated SNPs in the HapMap CEU samples
(rs17782313‐rs2229616; r2=0.001, rs17700633‐rs2229616; r2=0.009), though non trivial D’
values in HapMap CEU indicate relatively low long‐range recombination rates between them
(rs17782313‐rs2229616 D'=0.408, rs17700633‐rs2229616; D'=1.00) (Supplementary Figure
5.1.). In larger sample sizes (e.g. n=5,516 from EPIC‐Norfolk directly typed for V103I),
recombinant haplotypes are observed (D’ for 17700633 and rs2229616 = 0.89; rs17782313‐
rs2229616 D'=0.69).
• We note that the stronger pairwise associations between our SNPs and V103I are seen for
rs17700633, rather than rs17782313. The fact that the conditional analysis diminishes the
effect of rs17700633 on the BMI association further suggests that our association of BMI to
rs17782313 is distinct from that for V103I;
• The V103I variant is not significantly associated with obesity in either the four‐way
population‐based sample meta‐analysis or the full seven sample meta‐analysis (four‐way:
beta ‐0.07925, SE 0.05540, p=0.153; seven‐way: beta ‐0.08490, SE 0.04439, p=0.056);
• Directly‐typed genotypes were available for all three variants (rs17782313, rs17700633, and
rs2229616) in 5,516 individuals of the EPIC‐Norfolk population (described above) (SOM Table
3). In this sample, the associations of rs17782313 and rs17700633 with BMI are consistent
with those in the full sample; i.e. a per‐minor allele increase in BMI of ~0.40 Z‐score for
rs17782313 (SOM Table 4). In this sample rs2229616 does not show association with BMI.
• Conditioning on rs2229616 has no impact on effect size or significance observed in the
unconditional analyses, suggesting that rs17782313 and rs17700633 influence BMI
independently from rs2229616‐V103 (SOM Table 5).
SOM Table 3 Allele and genotype frequencies for rs17782313, rs17700633, and rs2229616 in 5,516 individuals of EPIC‐Norfolk
1 2 0 1 2
3257 1958 329(59%) (35%) (6%)
2605 2368 502(48%) (43%) (9%)
5313 199 4(96%) (4%) (0%)
GenotypesPosition (Build 35)
rs17782313
rs17700633
rs2229616 - V103I
Allele
98% 2%
56002077
56080412
56190256
76% 24%
69% 31%
Page 29 of 51

SOM Table 4 Association between rs17782313, rs17700633, and rs2229616 and BMI in 5,516 individuals of EPIC‐Norfolk. BMI is expressed as sex‐specific Z‐scores of log10‐transformed BMI.
p
rs17782313 0.045 (0.02) 0.045
rs17700633 0.040 (0.02) 0.057
rs2229616 - V103I 0.043 (0.07) 0.54
Per-minor allele effectBeta (SE)
SOM Table 5 Conditional association between rs17782313, rs17700633, and rs2229616 and BMI in 5,516 individuals of EPIC‐Norfolk. BMI is expressed as sex‐specific Z‐scores of log10‐transformed BMI.
p
rs17782313, adjusted for rs2229616 (V103I) 0.046 (0.02) 0.043
rs17700633, adjusted for rs2229616 (V103I) 0.040 (0.02) 0.057
rs2229616 (V103I), adjusted for rs17782313 0.045 (0.07) 0.52
rs2229616 (V103I), adjusted for rs17700633 0.046 (0.07) 0.51
Per-minor allele effect
Beta (SE)
• Finally, to explore further the relationships between rs17782313‐rs17700633 and
rs2229616 (V103I), we performed pairwise haplotype analyses in the same set of 5,516
EPIC‐Norfolk individuals directly typed for all three SNPs. As described above, the r2
between rs17782313‐rs17700633 and rs2229616 was <0.01, and D’ was 0.69 and 0.89,
respectively (SOM Figure 3). For the rs17782313‐rs2229616 pairing, two of the four
possible haplotypes (those carrying the minor allele of V103I which is weakly‐associated
with protection from obesity45) are of low frequency (SOM Table 6). Of the two
common haplotypes, both carry the V103‐allele putatively associated with increased
weight, but they have divergent effects on BMI (hap‐score ‐2.247 for haplotype 1,
+2.110 for haplotype 2). This shows clearly that rs17782313 is driving the BMI signal
rather than V103I. The haplotype analyses for the rs17700633‐rs2229616 pairing shows
similar results (SOM Table 7).
Page 30 of 51
SOM Figure 3 LD plot for rs17782313, rs17700633, and rs2229616 in 5,516 individuals of EPIC‐Norfolk (left hand‐ side shows r2, right hand side shows D’).
SOM Table 6 Haplotype analyses for rs17782313 and rs2229616 with BMI (sex‐specific Z‐score of log10‐transformed BMI). The Hap‐score gives the relative effect of each haplotype on BMI, ‘1’ refers to the major allele, ‘2’ refers to the minor allele. Analyses were performed with SAS/Genetics 9.1 (SAS Institute Inc., Cary, NC, USA).
rs17782313 rs2229616 Frequency (%) Hap-Score P-Value
Haplotype 1 1 1 74.6% -2.247 0.036
Haplotype 2 2 1 23.5% 2.110 0.048
Haplotype 3 1 2 1.8% 0.988 0.307
Haplotype 4 2 2 0.1% -2.009 0.075
SOM Table 7 Haplotype analyses for rs17700633 and rs2229616 with BMI (sex‐specific Z‐score of log10‐transformed BMI). The Hap‐score gives the relative effect of each haplotype on BMI, ‘1’ refers to the major allele, ‘2’ refers to the minor allele. Analyses were performed with SAS/Genetics 9.1 (SAS Institute Inc., Cary, NC, USA).
rs17700633 rs2229616 Frequency (%) Hap-Score P-Value
Haplotype 1 1 1 67.4% -2.123 0.034
Haplotype 2 2 1 30.7% 1.968 0.051
Haplotype 3 1 2 1.8% 0.754 0.435
Haplotype 4 2 2 0.1% -0.914 0.377
4.4.2. Relationship between rs17782313‐rs17700633 and rs52820871 [MC4R I251L]
The minor allele of rs52820871 (MC4R I251L) (MAF in Europeans: 0.4 ‐ 1.21%)46 has previously been
shown to be protective for obesity (OR 0.52, p=3.6x10‐5) in a meta‐analysis including 11,435
individuals46. The SNP is not available in the HapMap and could therefore not be imputed. However,
directly‐typed genotypes were available in 5,039 individuals of the EPIC‐Norfolk population
(described under 2.1.1.1) for whom genotypes were also available for rs17782313 and rs17700633
(SOM Table 8).
Page 31 of 51
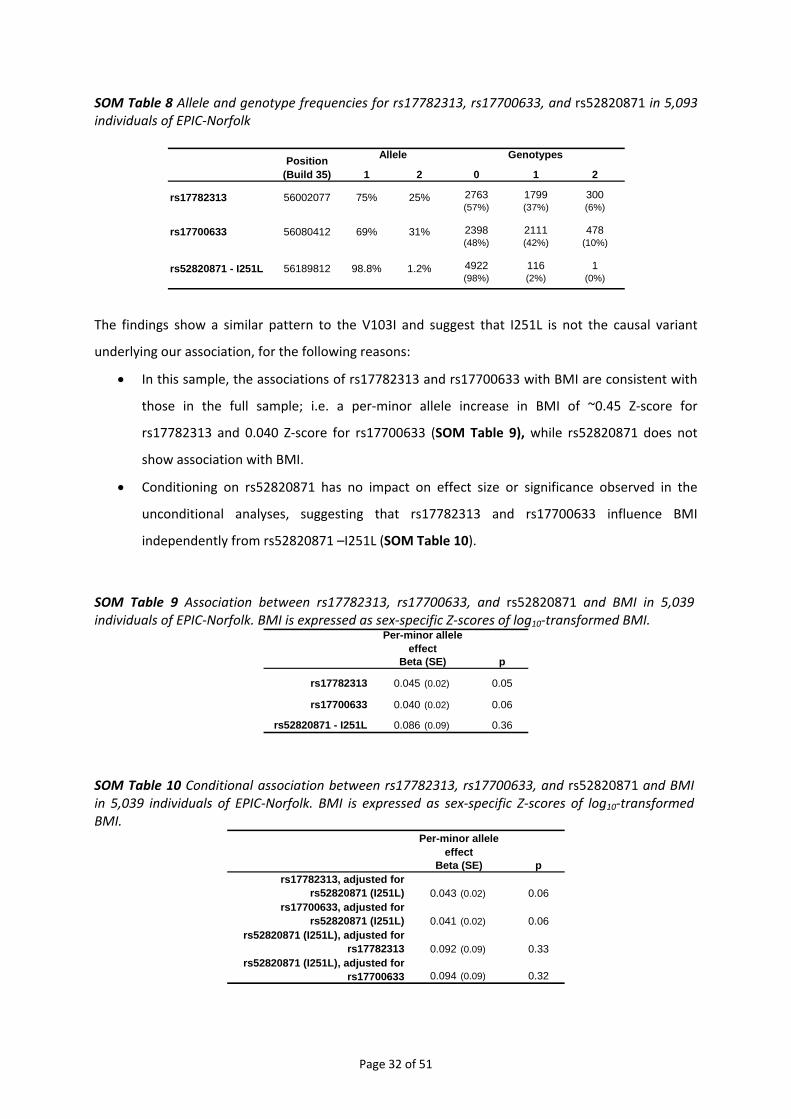
SOM Table 8 Allele and genotype frequencies for rs17782313, rs17700633, and rs52820871 in 5,093 individuals of EPIC‐Norfolk
1 2 0 1 2
2763 1799 300(57%) (37%) (6%)
2398 2111 478(48%) (42%) (10%)
4922 116 1(98%) (2%) (0%)
rs17782313
rs17700633
rs52820871 - I251L
Allele
98.8% 1.2%
56002077
56080412
56189812
75%
GenotypesPosition (Build 35)
25%
69% 31%
The findings show a similar pattern to the V103I and suggest that I251L is not the causal variant
underlying our association, for the following reasons:
• In this sample, the associations of rs17782313 and rs17700633 with BMI are consistent with
those in the full sample; i.e. a per‐minor allele increase in BMI of ~0.45 Z‐score for
rs17782313 and 0.040 Z‐score for rs17700633 (SOM Table 9), while rs52820871 does not
show association with BMI.
• Conditioning on rs52820871 has no impact on effect size or significance observed in the
unconditional analyses, suggesting that rs17782313 and rs17700633 influence BMI
independently from rs52820871 –I251L (SOM Table 10).
SOM Table 9 Association between rs17782313, rs17700633, and rs52820871 and BMI in 5,039 individuals of EPIC‐Norfolk. BMI is expressed as sex‐specific Z‐scores of log10‐transformed BMI.
p
rs17782313 0.045 (0.02) 0.05
rs17700633 0.040 (0.02) 0.06
rs52820871 - I251L 0.086 (0.09) 0.36
Per-minor allele effect
Beta (SE)
SOM Table 10 Conditional association between rs17782313, rs17700633, and rs52820871 and BMI in 5,039 individuals of EPIC‐Norfolk. BMI is expressed as sex‐specific Z‐scores of log10‐transformed BMI.
prs17782313, adjusted for
rs52820871 (I251L) 0.043 (0.02) 0.06rs17700633, adjusted for
rs52820871 (I251L) 0.041 (0.02) 0.06rs52820871 (I251L), adjusted for
rs17782313 0.092 (0.09) 0.33rs52820871 (I251L), adjusted for
rs17700633 0.094 (0.09) 0.32
Per-minor allele effect
Beta (SE)
Page 32 of 51
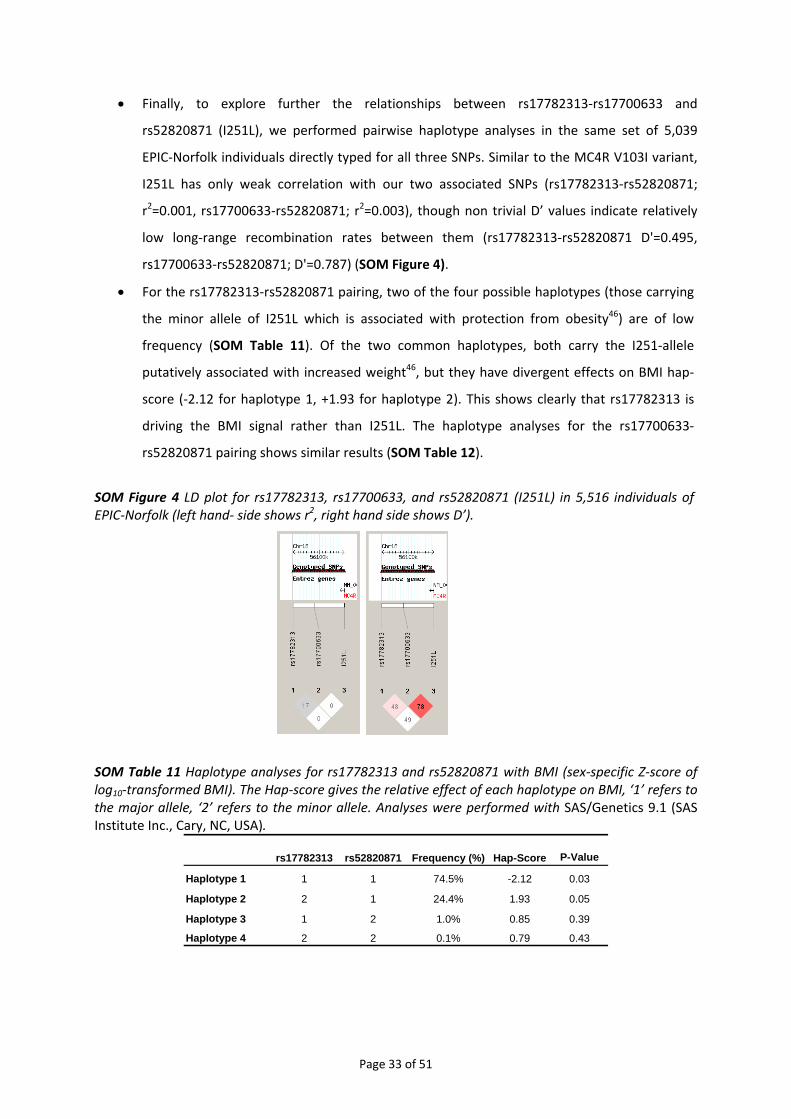
• Finally, to explore further the relationships between rs17782313‐rs17700633 and
rs52820871 (I251L), we performed pairwise haplotype analyses in the same set of 5,039
EPIC‐Norfolk individuals directly typed for all three SNPs. Similar to the MC4R V103I variant,
I251L has only weak correlation with our two associated SNPs (rs17782313‐rs52820871;
r2=0.001, rs17700633‐rs52820871; r2=0.003), though non trivial D’ values indicate relatively
low long‐range recombination rates between them (rs17782313‐rs52820871 D'=0.495,
rs17700633‐rs52820871; D'=0.787) (SOM Figure 4).
• For the rs17782313‐rs52820871 pairing, two of the four possible haplotypes (those carrying
the minor allele of I251L which is associated with protection from obesity46) are of low
frequency (SOM Table 11). Of the two common haplotypes, both carry the I251‐allele
putatively associated with increased weight46, but they have divergent effects on BMI hap‐
score (‐2.12 for haplotype 1, +1.93 for haplotype 2). This shows clearly that rs17782313 is
driving the BMI signal rather than I251L. The haplotype analyses for the rs17700633‐
rs52820871 pairing shows similar results (SOM Table 12).
SOM Figure 4 LD plot for rs17782313, rs17700633, and rs52820871 (I251L) in 5,516 individuals of EPIC‐Norfolk (left hand‐ side shows r2, right hand side shows D’).
SOM Table 11 Haplotype analyses for rs17782313 and rs52820871 with BMI (sex‐specific Z‐score of log10‐transformed BMI). The Hap‐score gives the relative effect of each haplotype on BMI, ‘1’ refers to the major allele, ‘2’ refers to the minor allele. Analyses were performed with SAS/Genetics 9.1 (SAS Institute Inc., Cary, NC, USA).
rs17782313 rs52820871 Frequency (%) Hap-Score P-Value
Haplotype 1 1 1 74.5% -2.12 0.03
Haplotype 2 2 1 24.4% 1.93 0.05
Haplotype 3 1 2 1.0% 0.85 0.39
Haplotype 4 2 2 0.1% 0.79 0.43
Page 33 of 51

SOM Table 12 Haplotype analyses for rs17700633 and rs52820871 with BMI (sex‐specific Z‐score of log10‐transformed BMI). The Hap‐score gives the relative effect of each haplotype on BMI, ‘1’ refers to the major allele, ‘2’ refers to the minor allele. Analyses were performed with SAS/Genetics 9.1 (SAS Institute Inc., Cary, NC, USA).
rs17700633 rs52820871 Frequency (%) Hap-Score P-Value
Haplotype 1 1 1 68.3% -2.07 0.04
Haplotype 2 2 1 30.6% 1.88 0.06
Haplotype 3 1 2 1.1% 1.05 0.29
Haplotype 4 1 2 0.1% -1.69 0.09
4.5. Fine‐mapping of the chromosome 18q21 region
To further fine‐map the chromosome 18q21 region, we applied the following four strategies.
4.5.1. Haplotype analysis for rs17782313 and rs17700633 in EPIC‐Norfolk
Genotypes for both rs17782313 and rs17700633 were available in 18,824 individuals of the EPIC‐
Norfolk study (SOM Table 13, see also 2.1.1.1).
SOM Table 13 Allele and genotype frequencies for rs17782313 and rs17700633 in 18,824 individuals of EPIC‐Norfolk
1 2 0 1 2
10783 6478 1023(59%) (35%) (6%)
8893 7718 1673(49%) (42%) (9%)
GenotypesPosition (Build 35)
23%
70% 30%
rs17782313
rs17700633
Allele
56002077
56080412
77%
Each SNP was significantly associated with BMI, but the association was stronger for rs17782313
than for rs17700633 (SOM Table 14). Conditional analyses, including both SNPs in one model, clearly
suggest that rs17782313 drives the association as its effect size remained unchanged while the effect
sizes of rs17700633 decreased to 0.006 (SOM Table 15).
SOM Table 14 Association between rs17782313 and rs17700633, and BMI in 18,824 individuals of EPIC‐Norfolk. BMI is expressed as sex‐specific Z‐scores of log10‐transformed BMI.
p
rs17782313 0.047 (0.01) 0.0002
rs17700633 0.023 (0.01) 0.04
Per-minor allele effectBeta (SE)
Page 34 of 51

SOM Table 15 Conditional association between rs17782313 and rs17700633 and BMI in 18,824 individuals of EPIC‐Norfolk. BMI is expressed as sex‐specific Z‐scores of log10‐transformed BMI.
prs17782313 adjusted
for rs17700633 0.046 (0.01) 0.0008rs17700633 adjusted
for rs17782313 0.006 (0.01) 0.65
Per-minor allele effectBeta (SE)
The haplotype analyses further confirms that rs17782313 drives the association (SOM Table 16). All
four haplotypes were present and were fairly frequent ranging from 8.7% to 61%. As expected,
haplotype 1, carrying both major alleles, showed a significant negative effect on BMI, whereas
haplotype 4, carrying both minor alleles showed a significant positive effect on BMI. Of interest is
that haplotypes carrying the major allele for rs17782313 (haplotypes 1 & 3) had a consistent negative
effect on BMI and those carrying the rs17782313 minor allele (haplotypes 2 and 4) had a positive
effect on BMI. This consistency was not observed for rs17700633 as for example the haplotypes
carrying the rs17700633 common allele (haplotype 1 & 2) had divergent effects. This again suggests
that it is rs17782313 that is driving the association.
SOM Table 16 Haplotype analyses forrs17782313 and rs17700633 with BMI (sex‐specific Z‐score of log10‐transformed BMI). The Hap‐score gives the relative effect of each haplotype on BMI, ‘1’ refers to the major allele, ‘2’ refers to the minor allele. Analyses were performed with SAS/Genetics 9.1 (SAS Institute Inc., Cary, NC, USA).
rs17782313 rs17700633 Frequency (%) Hap-Score P-Value
Haplotype 1 1 1 61.0% -2.84 0.0045
Haplotype 2 2 1 8.7% 1.71 0.0871
Haplotype 3 1 2 15.8% -0.71 0.4761
Haplotype 4 2 2 14.5% 3.51 0.0005
4.5.2. Meta‐analysis of all genotypes (directly typed and imputed)
We imputed genotypes in the chromosome 18q21 region (position 55.7Mb–56.4Mb NCBI Build 35)
and meta‐analysed the data from all studies (Figure 1) and from population‐based studies only
(Supplementary Figure 5.2.) to test whether we could detect more significant associations than
those we had observed for rs17782313 and rs17700633 (see also 1.3).
When all studies were combined (Figure 1), none of the imputed SNPs showed stronger association
with BMI than rs17782313. However, we identified three SNPs (rs12955983, rs718475, rs9956279)
showing stronger association than rs17782313 or rs17700633 when only population‐based studies
were considered (Supplementary Figure 5.2.). Thus, these three SNPs were taken forward for
Page 35 of 51
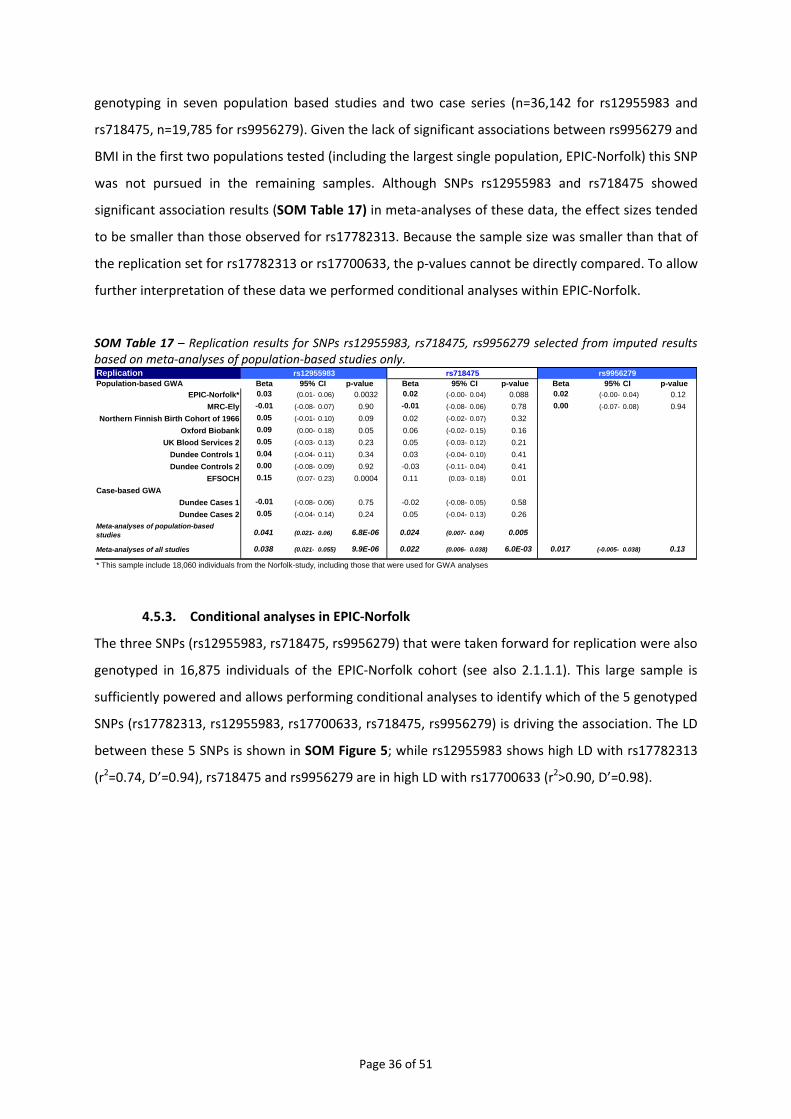
genotyping in seven population based studies and two case series (n=36,142 for rs12955983 and
rs718475, n=19,785 for rs9956279). Given the lack of significant associations between rs9956279 and
BMI in the first two populations tested (including the largest single population, EPIC‐Norfolk) this SNP
was not pursued in the remaining samples. Although SNPs rs12955983 and rs718475 showed
significant association results (SOM Table 17) in meta‐analyses of these data, the effect sizes tended
to be smaller than those observed for rs17782313. Because the sample size was smaller than that of
the replication set for rs17782313 or rs17700633, the p‐values cannot be directly compared. To allow
further interpretation of these data we performed conditional analyses within EPIC‐Norfolk.
SOM Table 17 – Replication results for SNPs rs12955983, rs718475, rs9956279 selected from imputed results based on meta‐analyses of population‐based studies only. ReplicationPopulation-based GWA Beta 95% CI p-value Beta 95% CI p-value Beta 95% CI p-value
EPIC-Norfolk* 0.03 (0.01- 0.06) 0.0032 0.02 (-0.00- 0.04) 0.088 0.02 (-0.00- 0.04) 0.12MRC-Ely -0.01 (-0.08- 0.07) 0.90 -0.01 (-0.08- 0.06) 0.78 0.00 (-0.07- 0.08) 0.94
Northern Finnish Birth Cohort of 1966 0.05 (-0.01- 0.10) 0.09 0.02 (-0.02- 0.07) 0.32Oxford Biobank 0.09 (0.00- 0.18) 0.05 0.06 (-0.02- 0.15) 0.16
UK Blood Services 2 0.05 (-0.03- 0.13) 0.23 0.05 (-0.03- 0.12) 0.21Dundee Controls 1 0.04 (-0.04- 0.11) 0.34 0.03 (-0.04- 0.10) 0.41Dundee Controls 2 0.00 (-0.08- 0.09) 0.92 -0.03 (-0.11- 0.04) 0.41
EFSOCH 0.15 (0.07- 0.23) 0.0004 0.11 (0.03- 0.18) 0.01Case-based GWA
Dundee Cases 1 -0.01 (-0.08- 0.06) 0.75 -0.02 (-0.08- 0.05) 0.58Dundee Cases 2 0.05 (-0.04- 0.14) 0.24 0.05 (-0.04- 0.13) 0.26
0.041 (0.021- 0.06) 6.8E-06 0.024 (0.007- 0.04) 0.005
0.038 (0.021- 0.055) 9.9E-06 0.022 (0.006- 0.038) 6.0E-03 0.017 (-0.005- 0.038) 0.13
* This sample include 18,060 individuals from the Norfolk-study, including those that were used for GWA analyses
rs9956279rs12955983
Meta-analyses of population-based studies
Meta-analyses of all studies
rs718475
4.5.3. Conditional analyses in EPIC‐Norfolk
The three SNPs (rs12955983, rs718475, rs9956279) that were taken forward for replication were also
genotyped in 16,875 individuals of the EPIC‐Norfolk cohort (see also 2.1.1.1). This large sample is
sufficiently powered and allows performing conditional analyses to identify which of the 5 genotyped
SNPs (rs17782313, rs12955983, rs17700633, rs718475, rs9956279) is driving the association. The LD
between these 5 SNPs is shown in SOM Figure 5; while rs12955983 shows high LD with rs17782313
(r2=0.74, D’=0.94), rs718475 and rs9956279 are in high LD with rs17700633 (r2>0.90, D’=0.98).
Page 36 of 51
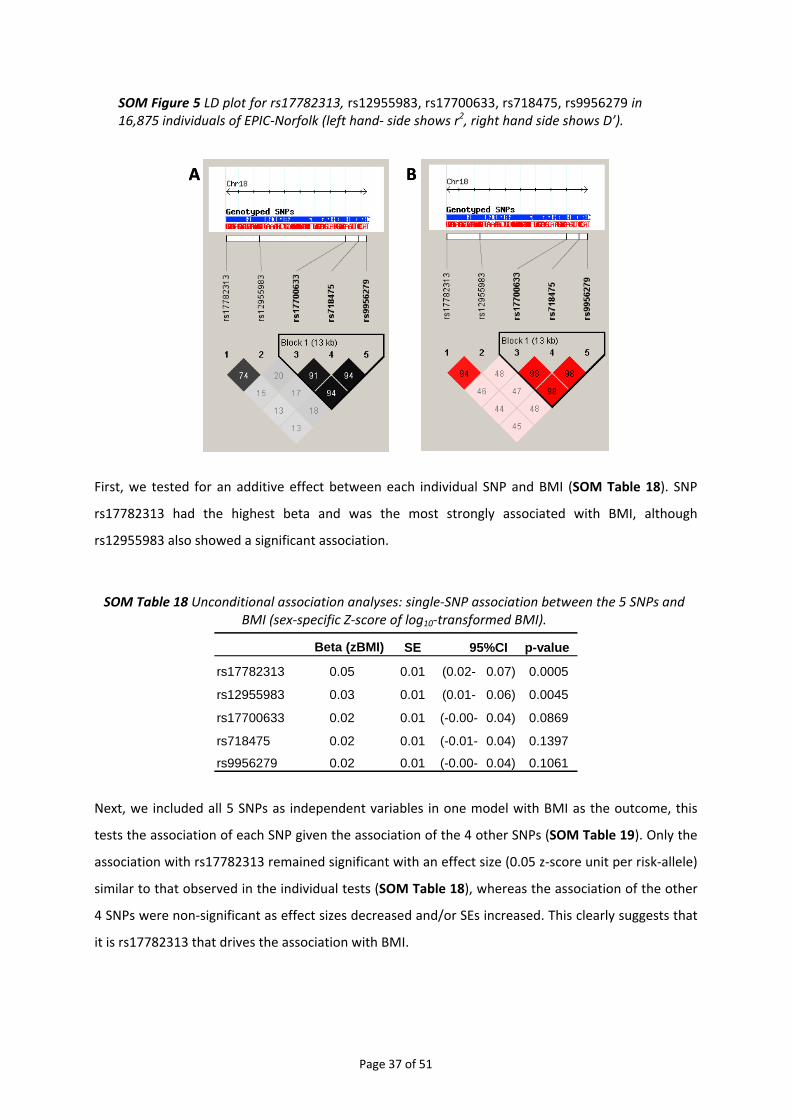
SOM Figure 5 LD plot for rs17782313, rs12955983, rs17700633, rs718475, rs9956279 in 16,875 individuals of EPIC‐Norfolk (left hand‐ side shows r2, right hand side shows D’).
A BA B
First, we tested for an additive effect between each individual SNP and BMI (SOM Table 18). SNP
rs17782313 had the highest beta and was the most strongly associated with BMI, although
rs12955983 also showed a significant association.
SOM Table 18 Unconditional association analyses: single‐SNP association between the 5 SNPs and BMI (sex‐specific Z‐score of log10‐transformed BMI).
Beta (zBMI) SE p-value
rs17782313 0.05 0.01 (0.02- 0.07) 0.0005
rs12955983 0.03 0.01 (0.01- 0.06) 0.0045
rs17700633 0.02 0.01 (-0.00- 0.04) 0.0869
rs718475 0.02 0.01 (-0.01- 0.04) 0.1397
rs9956279 0.02 0.01 (-0.00- 0.04) 0.1061
95%CI
Next, we included all 5 SNPs as independent variables in one model with BMI as the outcome, this
tests the association of each SNP given the association of the 4 other SNPs (SOM Table 19). Only the
association with rs17782313 remained significant with an effect size (0.05 z‐score unit per risk‐allele)
similar to that observed in the individual tests (SOM Table 18), whereas the association of the other
4 SNPs were non‐significant as effect sizes decreased and/or SEs increased. This clearly suggests that
it is rs17782313 that drives the association with BMI.
Page 37 of 51

SOM Table 19 Conditional association analyses: Association between the 5 SNPs and BMI (sex‐specific Z‐score of log10‐transformed BMI) in one model.
Beta (zBMI) SE p-value
rs17782313 0.05 0.03 (0.00- 0.10) 0.039
rs12955983 -0.01 0.03 (-0.06- 0.04) 0.631
rs17700633 0.02 0.05 (-0.08- 0.12) 0.731
rs718475 -0.02 0.05 (-0.12- 0.08) 0.665
rs9956279 0.01 0.06 (-0.11- 0.14) 0.859
95%CI
4.5.4. GIANT‐wide meta‐analyses
We meta‐analysed imputed and observed genotypes for SNPs in the 18q21 region that were
available for the 7 populations of the current GWA study and also for 8 additional populations
including the SardiNIA Study (see also 2.2.1.1), KORA (see also 2.2.1.2), the NHS (2.2.1.3), the PLCO
Study (see also 2.2.1.4), FUSION (controls and T2DM‐cases) (see also 2.2.2.1) and DGI (controls and
T2DM‐cases) (see also 2.2.2.2). Data was available for up to 32,301 individuals.
Each study performed association analyses between the imputed SNPs and BMI, but whenever
observed genotyped data was available, the latter was used for association. Meta‐analyses were
performed including all 15 studies. The meta‐analysis was performed using the ‘sum of z’s method’
which calculates the overall z‐statistic by summing the study‐specific z‐statistic divided by square
root of the number of studies47, with the association direction taken into account based on a
standard effect allele for the variant. The overall p‐value is calculated using the z‐statistic of standard
normal distribution.
These results show that the imputed SNPs rs9956279 (p=8.4x10‐7) and rs718475 (p=3.2x10‐7) show
better association than directly‐genotyped rs17782313 (p=4.4x10‐7) or rs17700633 (p=2.0x10‐6
Supplementary Figure 5.3.). However, as shown before (see 4.5.2) results for directly genotyped
rs9956279 and rs178475 in additional replication samples were less significant than previously
reported association with rs17782313.
In summary, based on the results we have obtained thus far (including data from meta‐analyses of
the chr18q21 region, replication of imputed SNPs and conditional analyses) it is clear that SNP
rs17782313 is the strongest signal that we can detect, no other known SNP (based on direct typing,
imputation from HapMap SNPs or previous literature) provides a stronger association result.
However, this is not proof of causality, or even that this SNP tags the underlying causal variant
particularly well, very extensive re‐sequencing and fine‐mapping will be required to unambiguously
identify the causal variants.
Page 38 of 51

5. COMPUTATIONAL GENOMICS ON THE CHROMOSOME 18 REGION
The SNP of interest, rs17782313, maps ~188kb from the coding sequence of MC4R (with no other
annotated genes within a 400kb window centred on the SNP, Supplementary Figure 5.1.) making it
likely that it exerts its effect (most likely on MC4R given the prior evidence) via remote effects on
transcription (or possibly via microRNA, on translation). To assess this possibility, we examined
available genomic annotations for the region around rs17782313. First, we looked for the presence
of copy number variants (CNVs) in the region, indeed one CNV, predicted on the basis of analysis of
Mendelian inconsistencies from HapMap trios48, 49, maps within our interval of interest. The
boundaries for the CNV are predicted to map between 56,072,413 and 56,074,460, it is therefore
possible that the association results we observe here could be mediated via this CNV.
5.1. Transcription factor binding sites In order to evaluate the possibility of transcription factor binding sites mapping to the region
surrounding our association (given the absence of obvious functionality of the associated variant), we
obtained information on predicted transcription factor binding sites, which are also evolutionarily
conserved between human, mouse and rat, from ‘TFBS Conserved’ track at the UCSC Genome
Browser (http://genome.ucsc.edu/). We found that the two LD‐blocks that contain rs17782313 and
rs177800633 respectively harbour several predicted transcription factor‐binding sites (pTFBS) (SOM
Figure 6). Besides isolated pTFBSs scattered across the region, we observed a cluster of pTFBSs
corresponding to Pax6, IRF7 and Oct‐1 in the region that is in high LD (r2=0.82) with rs17782313. All
three of the transcription factors have several additional putative binding sites in the vicinity. The
fact that functional transcription factor binding sites are often clustered in genomes forming cis‐
regulatory modules50 raises the speculation that these predicted regulatory SNPs may have
functional effects. These transcription factors that have clustered pTFBS serve as master regulators
associated with development, cell‐lineage differentiation and immunity51‐53. In addition, a variant
(rs9966951) in the lone binding site for COUP, which is known to interact with glucocorticoid
receptor54, is in weak LD (r2 = 0.55) with rs17782313.
5.2. Non‐coding RNA We further scanned for non‐coding RNAs using Evofold55 track at the UCSC Genome Browser. The LD‐
block that contains rs17782313 harbours one putative non‐coding RNA with unknown function.
Interestingly the non‐coding RNA was located near Cluster‐I of pTFBSs. In addition, a second cluster
of pTFBSs and a second predicted non‐coding RNA map between rs17700633 and MC4R coding
sequence. This cluster corresponds to several transcription factors associated with development,
cell‐lineage differentiation, immunity and neuroendocrine function and harbors a pTFBS for muscle‐
Page 39 of 51

specific transcription factor myogenin implicated in body mass56, 57. We did not find any evidence for
other regulatory features like microRNA or H3K4me3 epigenetic markers that overlap with the
regions of interest.
SOM Figure 6: Putative transcription factor binding sites and noncoding RNAs relative to rs17782313. The blue and red bars indicate transcription factor binding sites and SNPs respectively.
5.3. Positive Selection We retrieved phased haplotype data for the 1 MB region centered on the midpoint between the two
SNPs rs17782313 (ancestral allele T, risk allele C) and rs17700633 (ancestral allele and risk allele A)
(HapMap Release 21a/Phase II, Chromomosome 18, Pos 55,541,240‐56,541,240 bp) from HapMap in
the three HapMap reference populations (CEU, YRI, CHB+JPT). Ancestral status for 1278 of the 1302
SNPs in the region was ascertained from Chimp sequence available in Ensembl. We applied the
method as implemented in the software Sweep58. Long‐distance matching was carried out by
matching core‐haplotype heterozygosities (H=0.4, corresponding to a genetic distance of
Page 40 of 51
approximately 0.25 cM). Three consecutive cores (rs2156229‐rs9807647, rs9954275‐rs17066546 and
rs768455‐rs8083071) had high frequency, evolutionarily‐derived haplotypes in CEU (66‐68%
frequency) and elevated REHH (relative extended haplotype homozygosity). However, there was no
evidence of long‐range haplotype homozygosity for these core haplotypes (all P‐values > 0.05). The
data overall do not support a recent positive selection event in this region. Analysis of iHS (integrated
haploytype score) statistics for SNPs within the 1 Mb region 59 did not show the clustering of extreme
iHS statistics characteristic of a region under positive selection.
5.4. Expression Quantitative Trait Loci (eQTL) analysis Humans with rare functional mutations in MC4R sequence are known to develop severe early‐onset
obesity60, and analogous phenotypes are seen in murine models of Mc4r disruption61. This strong
biological candidacy points to disruption of the transcriptional control of MC4R as the likely
functional mechanism through which rs17882313 (or a causal proxy) operates, even though the
associated variants lie 109‐188kb downstream of MC4R‐coding sequence. To assess the functional
significance and relevance of the associated SNPs (and the causal variants they tag) in the region on
chromosome 18q21, we sought evidence that rs17882313 (or other nearby SNPs) were responsible
for cis‐regulatory effects on MC4R expression through interrogation of public and proprietary eQTL
datasets (refs62‐65 and E. Dermitzakis, unpublished). However, the low/absent levels of MC4R
expression in lymphocytes and cortex precluded efforts to obtain evidence for cis‐transcriptional
phenotypes associated with rs17782313 or nearby SNPs. The other gene flanking these variants is
PMAIP1 (mapping 279Kb from rs17782313). This gene encodes the protein Noxa, a putative HIF1A
(hypoxia‐inducible factor‐alpha)‐regulated proapoptotic gene and a relatively‐unlikely candidate for a
role in weight regulation. Again, interrogation of public and proprietary eQTL datasets (refs62‐64 and
E. Dermitzakis, unpublished) did not find any evidence for association between these variants and
expression levels of PMAIP1.
Page 41 of 51

6. ADDITIONAL ACKNOWLEDGEMENTS
6.1. Detailed acknowledgements
We acknowledge the many research nurses, research fellows and physicians who contributed to the
various data collections. Most importantly, we acknowledge the study participants for their
contributions to making these studies possible.
The EPIC‐Obesity Study & MRC Ely study: The EPIC Norfolk Study is funded by Cancer Research
United Kingdom and the Medical Research Council. The MRC Ely Study was funded by the Medical
Research Council and the Wellcome Trust. IB, SOR and JH acknowledge support from EU FP6 funding
(contract no LSHM‐CT‐2003‐503041). SL is supported by a grant from Unilever Corporate Research.
We thank Sarah Dawson, Farzana Shah, Sofie Ashford, Larissa Richardson, Steven Knighton, and Chris
Gillson for their rapid and accurate large‐scale sample preparation and genotyping, and Jian’an Luan
and Stephen Sharp for their statistical support.
CoLaus: The CoLaus study was supported by research grants from GlaxoSmithKline and from the
Faculty of Biology and Medicine of Lausanne, Switzerland. The authors would like to express their
gratitude to the participants in the Lausanne CoLaus study, to the investigators who have contributed
to the recruitment, in particular Yolande Barreau, Anne‐Lise Bastian, Binasa Ramic, Martine
Moranville, Martine Baumer, Marcy Sagette, Jeanne Ecoffey and Sylvie Mermoud for data collection
and to Allen Roses, and Lefkos T. Middleton for their support. Some computation was carried out on
the Vital‐IT system at the Swiss Institute of Bioinformatics. We thank Paul Matthews, Lefkos
Middleton, Dan Burns, Eric Lai and Allen Roses for their support.
The British 1958 BC: We acknowledge use of genotype data from the British 1958 Birth Cohort DNA
collection, funded by the Medical Research Council grant G0000934 and the Wellcome Trust grant
068545/Z/02.
WTCCC‐T2D, WTCCC‐UKBS, UKBS2, ALSPAC, UKT2D Genetics Consortium: Collection of the type 2
diabetes cases was supported by Diabetes UK, BDA Research and the UK Medical Research Council
(MRC) (Biomedical Collections Strategic Grant G0000649). The UK Type 2 Diabetes Genetics
Consortium collection was supported by the Wellcome Trust (Biomedical Collections Grant
GR072960). Collection of the coronary artery disease cases (WTCCC‐CAD) was carried out by the
British Heart Foundation (BHF) Family Heart Study Research Group and supported by the BHF
and the UK Medical Research Council. Members of the BHF Family Heart Study Group are listed in
reference (Samani et al AJHG 2005). NJS holds a British Heart Foundation personal chair. The BRIGHT
study (WTCCC‐HT) was supported by UK Medical Research Council (grants G9521010 and G000666)
and the British Heart Foundation (grant PG/02/ 128). Chris Wallace is a British Heart Foundation
fellow (Grant no. FS/05/061/19501). The ALSPAC study was supported by The UK MRC, the Wellcome
Page 42 of 51
Trust and the University of Bristol. The Exeter Family Study of Childhood Health was supported by UK
National Health Service Research and Development and the Wellcome Trust and the Exeter
University Foundation for funding. Oxford Biobank was supported by the British Heart Foundation.
The UK GWA genotyping was supported by the Wellcome Trust (076113), and replication genotyping
was supported by the Wellcome Trust (076113), MRC (G0601261), Diabetes UK, European
Commission (EURODIA LSHG‐CT‐2004‐518153) and the Peninsula Medical School. Personal funding
comes from the Wellcome Trust (A.T.H.; Research Leave Fellow; Research Career Development
Fellow); Diabetes UK (R.M.F.) and the Throne‐Holst Foundation (C.M.L.). M.N.W. is Vandervell
Foundation Research Fellow at the Peninsula Medical School. C.M.L. is a University of Oxford Nuffield
Department of Medicine Scientific Leader Fellow. E.Z. is a Wellcome Trust Career Development
Fellow. We acknowledge the assistance of many colleagues involved in sample collection,
phenotyping and DNA extraction in all the different studies. We thank K. Parnell, C. Kimber, A.
Murray and K. Northstone for technical assistance. We thank S. Howell, M. Murphy and A. Wilson
(Diabetes UK) for their long‐term support for these studies. We also acknowledge the efforts of J.
Collier, P. Robinson, S. Asquith and others at KBiosciences for their rapid and accurate large‐scale
genotyping. Finally, we acknowledge all participants in the various studies. CNAP and AM are
supported by the Scottish Executive Chief Scientist’s Office as part of the Generation Scotland
initiative.
Northern Finland Birth Cohort 1966 ‐ The work on the Northern Finland Birth Cohort 1966 study was
supported by the Academy of Finland (104781), MRC (G0500539), and the Wellcome Trust (Project
Grant GR069224). The DNA extractions, sample quality controls, biobank up‐keeping and aliquotting
was performed in the national Public Health Institute, Biomedicum Helsinki, Finland and supported
by the grants to Dr. Leena Peltonen from the Academy of Finland and Biocentrum Helsinki. We
appreciate the help of Outi Tornwall and Minttu Jussila in DNA biobanking.
The Hertfordshire Study: This study was supported by the Medical Research Council UK and the
University of Southampton UK.
KORA, Essen Obesity study and Essen Obesity Family study: KORA and the Essen Obesity Study
received a funding from the German National Genome Research Net and the Munich Center of
Health Sciences. The Essen Obesity Family study was supported by grants from the
Bundesministerium für Bildung und Forschung (NGFN2 01GS0482, 01GS0483), and the European
Union (FP6 LSHMCT‐2003‐503041).
SCOOP‐UK: The Severe Childhood Onset Obesity Project UK (SCOOP‐UK) was supported by the
Medical Research Council and the Wellcome Trust.
French adult and childhood obesity case‐control studies: We thank Emmanuelle Durand and Jérôme
Delplanque for the technical support. We acknowledge Stefan Gaget and Cecile Lecoeur for their
Page 43 of 51
help on phenotype databases. The recruitment of obese cases was supported by both Assistance‐
Publique Hôpitaux de Paris and Centre National de la Recherche Scientifique.
Diabetes Genetics Initiative: This work was supported by NIH awards to E.K.S. (NIDDK‐
1F32DK079466) H.N.L. (NIDDK ‐5K23DK067288) and to J.N.H. (NIDDK‐1R01DK075787) and funding
from the Novartis Institutes for BioMedical Research. We would like to thank Richa Saxena, Valeriya
Lyssenko, and Peter Almgren for helping to compile the phenotype data and Sam Tischfield and
Guillaume Lettre for bioinformatics support.
Nurses' Health Study: We acknowledge Connie Chen of Bioinformed Consulting Services Inc. for
expert programming (NHS). The NHS is supported by CA087969 from the National Institutes of
Health.
The Prostate, Lung, Colorectal, and Ovarian (PLCO) Cancer Screening Trial: This research was
supported by the Intramural Research Program of the NIH, Division of Cancer Epidemiology and
Genetics and by contracts from the Division of Cancer Prevention, National Cancer Institute, DHHS.
The authors thank Drs. Christine Berg and Philip Prorok, Division of Cancer Prevention, National
Cancer Institute, the Screening Center investigators and staff of the Prostate, Lung, Colorectal, and
Ovarian (PLCO) Cancer Screening Trial, Mr. Tom Riley and staff, Information Management Services,
Inc., Ms. Barbara O'Brien and staff, Westat, Inc.
SardiNIA: The SardiNIA project is supported by the Intramural Research Program of the NIH, National
Institute on Aging. The efforts of GRA, SS and PAS were also supported in part by research grants
from the National Human Genome Research Institute and the National Heart Lung and Blood
Institute. We would like to thank SardiNIA study participants for their volunteerism and the local civil
and religious authorities in SardiNIA for their support.
The Finland‐US investigation of NIDDM Genetics (FUSION): The FUSION study is supported by NIH
(NIDDK) grants DK62370 (M.B.) and DK72193 (K.L.M.), NIH (NHGRI) intramural funds 1 Z01 HG000024
(F.S.C.), and a postdoctoral fellowship from the American Diabetes Association (C.J.W.).
6.2. Members of the Wellcome Trust Case Control Consortium
Management Committee: Paul R Burton1, David G Clayton2, Lon R Cardon3, Nick Craddock4, Panos
Deloukas5, Audrey Duncanson6, Dominic P Kwiatkowski3,5, Mark I McCarthy3,7, Willem H Ouwehand8,9,
Nilesh J Samani10, John A Todd2, Peter Donnelly (Chair)11
Data and Analysis Committee: Jeffrey C Barrett3, Paul R Burton1, Dan Davison11, Peter Donnelly11,
Doug Easton12, David M. Evans3, Hin‐Tak Leung2, Jonathan L Marchini11, Andrew P Morris3, Chris CA
Spencer11, Martin D Tobin1, Lon R Cardon (Co‐chair)3, David G Clayton (Co‐chair)2
UK Blood Services & University of Cambridge Controls: Antony P Attwood5,8, James P Boorman8,9,
Barbara Cant8, Ursula Everson13, Judith M Hussey14, Jennifer D Jolley8, Alexandra S Knight8, Kerstin
Page 44 of 51

Koch8, Elizabeth Meech15, Sarah Nutland2, Christopher V Prowse16, Helen E Stevens2, Niall C Taylor8,
Graham R Walters17, Neil M Walker2, Nicholas A Watkins8,9, Thilo Winzer8, John A Todd2, Willem H
Ouwehand8,9
1958 Birth Cohort Controls: Richard W Jones18, Wendy L McArdle18, Susan M Ring18, David P
Strachan19, Marcus Pembrey18,20
Bipolar Disorder (Aberdeen): Gerome Breen21, David St Clair21; (Birmingham): Sian Caesar22,
Katherine Gordon‐Smith22,23, Lisa Jones22; (Cardiff): Christine Fraser23, Elaine K Green23, Detelina
Grozeva23, Marian L Hamshere23, Peter A Holmans23, Ian R Jones23, George Kirov23, Valentina
Moskvina23, Ivan Nikolov23, Michael C O’Donovan23, Michael J Owen23, Nick Craddock23; (London):
David A Collier24, Amanda Elkin24, Anne Farmer24, Richard Williamson24, Peter McGuffin24;
(Newcastle): Allan H Young25, I Nicol Ferrier25
Coronary Artery Disease (Leeds): Stephen G Ball26, Anthony J Balmforth26, Jennifer H Barrett26, D
Timothy Bishop26, Mark M Iles26, Azhar Maqbool26, Nadira Yuldasheva26, Alistair S Hall26; (Leicester):
Peter S Braund10, Paul R Burton1, Richard J Dixon10, Massimo Mangino10, Suzanne Stevens10, Martin D
Tobin1, John R Thompson1, Nilesh J Samani10
Crohn’s Disease (Cambridge): Francesca Bredin27, Mark Tremelling27, Miles Parkes27; (Edinburgh):
Hazel Drummond28, Charles W Lees28, Elaine R Nimmo28, Jack Satsangi28; (London): Sheila A Fisher29,
Alastair Forbes30, Cathryn M Lewis29, Clive M Onnie29, Natalie J Prescott29, Jeremy Sanderson31,
Christopher G Mathew29; (Newcastle): Jamie Barbour32, M Khalid Mohiuddin32, Catherine E
Todhunter32, John C Mansfield32; (Oxford): Tariq Ahmad33, Fraser R Cummings33, Derek P Jewell33
Hypertension (Aberdeen): John Webster34; (Cambridge): Morris J Brown35, David G Clayton2; (Evry,
France): G Mark Lathrop36; (Glasgow): John Connell37, Anna Dominiczak37; (Leicester): Nilesh J
Samani10; (London): Carolina A Braga Marcano38, Beverley Burke38, Richard Dobson38, Johannie
Gungadoo38, Kate L Lee38, Patricia B Munroe38, Stephen J Newhouse38, Abiodun Onipinla38, Chris
Wallace38, Mingzhan Xue38, Mark Caulfield38; (Oxford): Martin Farrall39
Rheumatoid Arthritis: Anne Barton40, Ian N Bruce40, Hannah Donovan40, Steve Eyre40, Paul D
Gilbert40, Samantha L Hider40, Anne M Hinks40, Sally L John40, Catherine Potter40, Alan J Silman40,
Deborah PM Symmons40, Wendy Thomson40, Jane Worthington40
Type 1 Diabetes: David G Clayton2, David B Dunger2,41, Sarah Nutland2, Helen E Stevens2, Neil M
Walker2, Barry Widmer2,41, John A Todd2
Type 2 Diabetes (Exeter): Timothy M Frayling42,43, Rachel M Freathy42,43, Hana Lango42,43, John R B
Perry42,43, Beverley M Shields43, Michael N Weedon42,43, Andrew T Hattersley42,43; (London): Graham A
Hitman44; (Newcastle): Mark Walker45; (Oxford): Kate S Elliott3,7, Christopher J Groves7, Cecilia M
Lindgren3,7, Nigel W Rayner3,7, Nicholas J Timpson3,46, Eleftheria Zeggini3,7, Mark I McCarthy3,7
Tuberculosis (Gambia): Melanie Newport47, Giorgio Sirugo47; (Oxford): Emily Lyons3, Fredrik
Page 45 of 51
Vannberg3, Adrian VS Hill3
Ankylosing Spondylitis: Linda A Bradbury48, Claire Farrar49, Jennifer J Pointon48, Paul Wordsworth49,
Matthew A Brown48,49
AutoImmune Thyroid Disease: Jayne A Franklyn50, Joanne M Heward50, Matthew J Simmonds50,
Stephen CL Gough50
Breast Cancer: Sheila Seal51, Michael R Stratton51,52, Nazneen Rahman51
Multiple Sclerosis: Maria Ban53, An Goris53, Stephen J Sawcer53, Alastair Compston53
Gambian Controls (Gambia): David Conway47, Muminatou Jallow47, Melanie Newport47, Giorgio
Sirugo47; (Oxford): Kirk A Rockett3, Dominic P Kwiatkowski3,5
DNA, Genotyping, Data QC and Informatics (Wellcome Trust Sanger Institute, Hinxton): Suzannah J
Bumpstead5, Amy Chaney5, Kate Downes2,5, Mohammed JR Ghori5, Rhian Gwilliam5, Sarah E Hunt5,
Michael Inouye5, Andrew Keniry5, Emma King5, Ralph McGinnis5, Simon Potter5, Rathi Ravindrarajah5,
Pamela Whittaker5, Claire Widden5, David Withers5, Panos Deloukas5; (Cambridge): Hin‐Tak Leung2,
Sarah Nutland2, Helen E Stevens2, Neil M Walker2, John A Todd2
Statistics (Cambridge): Doug Easton12, David G Clayton2; (Leicester): Paul R Burton1, Martin D Tobin1;
(Oxford): Jeffrey C Barrett3, David M Evans3, Andrew P Morris3, Lon R Cardon3; (Oxford): Niall J
Cardin11, Dan Davison11, Teresa Ferreira11, Joanne Pereira‐Gale11, Ingeleif B Hallgrimsdóttir11, Bryan N
Howie11, Jonathan L Marchini11, Chris CA Spencer11, Zhan Su11, Yik Ying Teo3,11, Damjan Vukcevic11,
Peter Donnelly11
PIs: David Bentley5,54, Matthew A Brown48,49, Lon R Cardon3, Mark Caulfield38, David G Clayton2,
Alistair Compston53, Nick Craddock23, Panos Deloukas5, Peter Donnelly11, Martin Farrall39, Stephen CL
Gough50, Alistair S Hall26, Andrew T Hattersley42,43, Adrian VS Hill3, Dominic P Kwiatkowski3,5,
Christopher G Mathew29, Mark I McCarthy3,7, Willem H Ouwehand8,9, Miles Parkes27, Marcus
Pembrey18,20, Nazneen Rahman51, Nilesh J Samani10, Michael R Stratton51,52, John A Todd2, Jane
Worthington40
1 Genetic Epidemiology Group, Department of Health Sciences, University of Leicester, Adrian
Building, University Road, Leicester, LE1 7RH, UK; 2 Juvenile Diabetes Research Foundation/Wellcome
Trust Diabetes and Inflammation Laboratory, Department of Medical Genetics, Cambridge Institute
for Medical Research, University of Cambridge, Wellcome Trust/MRC Building, Cambridge, CB2 0XY,
UK; 3 Wellcome Trust Centre for Human Genetics, University of Oxford, Roosevelt Drive, Oxford OX3
7BN, UK; 4 Department of Psychological Medicine, Henry Wellcome Building, School of Medicine,
Cardiff University, Heath Park, Cardiff CF14 4XN, UK; 5 The Wellcome Trust Sanger Institute, Wellcome
Trust Genome Campus, Hinxton, Cambridge CB10 1SA, UK; 6 The Wellcome Trust, Gibbs Building, 215
Euston Road, London NW1 2BE, UK; 7 Oxford Centre for Diabetes, Endocrinology and Medicine,
Page 46 of 51
University of Oxford, Churchill Hospital, Oxford, OX3 7LJ, UK; 8 Department of Haematology,
University of Cambridge, Long Road, Cambridge, CB2 2PT, UK; 9 National Health Service Blood and
Transplant, Cambridge Centre, Long Road, Cambridge, CB2 2PT, UK; 10 Department of Cardiovascular
Sciences, University of Leicester, Glenfield Hospital, Groby Road, Leicester, LE3 9QP, UK; 11
Department of Statistics, University of Oxford, 1 South Parks Road, Oxford OX1 3TG, UK; 12 Cancer
Research UK Genetic Epidemiology Unit, Strangeways Research Laboratory, Worts Causeway,
Cambridge CB1 8RN, UK; 13 National Health Service Blood and Transplant, Sheffield Centre, Longley
Lane, Sheffield S5 7JN, UK; 14 National Health Service Blood and Transplant, Brentwood Centre,
Crescent Drive, Brentwood, CM15 8DP, UK; 15 The Welsh Blood Service, Ely Valley Road, Talbot Green,
Pontyclun, CF72 9WB, UK; 16 The Scottish National Blood Transfusion Service, Ellen’s Glen Road,
Edinburgh, EH17 7QT, UK; 17 National Health Service Blood and Transplant, Southampton Centre,
Coxford Road, Southampton, SO16 5AF, UK; 18 Avon Longitudinal Study of Parents and Children,
University of Bristol, 24 Tyndall Avenue, Bristol, BS8 1TQ, UK; 19 Division of Community Health
Services, St George’s University of London, Cranmer Terrace, London SW17 0RE, UK; 20 Institute of
Child Health, University College London, 30 Guilford St, London WC1N 1EH, UK; 21 University of
Aberdeen, Institute of Medical Sciences, Foresterhill, Aberdeen, AB25 2ZD, UK; 22 Department of
Psychiatry, Division of Neuroscience, Birmingham University, Birmingham, B15 2QZ, UK; 23
Department of Psychological Medicine, Henry Wellcome Building, School of Medicine, Cardiff
University, Heath Park, Cardiff CF14 4XN, UK; 24 SGDP, The Institute of Psychiatry, King's College
London, De Crespigny Park Denmark Hill London SE5 8AF, UK; 25 School of Neurology, Neurobiology
and Psychiatry, Royal Victoria Infirmary, Queen Victoria Road, Newcastle upon Tyne, NE1 4LP, UK; 26
LIGHT and LIMM Research Institutes, Faculty of Medicine and Health, University of Leeds, Leeds, LS1
3EX, UK; 27 IBD Research Group, Addenbrooke's Hospital, University of Cambridge, Cambridge, CB2
2QQ, UK; 28 Gastrointestinal Unit, School of Molecular and Clinical Medicine, University of Edinburgh,
Western General Hospital, Edinburgh EH4 2XU UK; 29 Department of Medical & Molecular Genetics,
King's College London School of Medicine, 8th Floor Guy's Tower, Guy's Hospital, London, SE1 9RT,
UK; 30 Institute for Digestive Diseases, University College London Hospitals Trust, London, NW1 2BU,
UK; 31 Department of Gastroenterology, Guy's and St Thomas' NHS Foundation Trust, London, SE1
7EH, UK; 32 Department of Gastroenterology & Hepatology, University of Newcastle upon Tyne, Royal
Victoria Infirmary, Newcastle upon Tyne, NE1 4LP, UK; 33 Gastroenterology Unit, Radcliffe Infirmary,
University of Oxford, Oxford, OX2 6HE, UK; 34 Medicine and Therapeutics, Aberdeen Royal Infirmary,
Foresterhill, Aberdeen, Grampian AB9 2ZB, UK; 35 Clinical Pharmacology Unit and the Diabetes and
Inflammation Laboratory, University of Cambridge, Addenbrookes Hospital, Hills Road, Cambridge
CB2 2QQ, UK; 36 Centre National de Genotypage, 2, Rue Gaston Cremieux, Evry, Paris 91057.; 37 BHF
Glasgow Cardiovascular Research Centre, University of Glasgow, 126 University Place, Glasgow, G12
Page 47 of 51

8TA, UK; 38 Clinical Pharmacology and Barts and The London Genome Centre, William Harvey
Research Institute, Barts and The London, Queen Mary’s School of Medicine, Charterhouse Square,
London EC1M 6BQ, UK; 39 Cardiovascular Medicine, University of Oxford, Wellcome Trust Centre for
Human Genetics, Roosevelt Drive, Oxford OX3 7BN, UK; 40arc Epidemiology Research Unit, University
of Manchester, Stopford Building, Oxford Rd, Manchester, M13 9PT, UK; 41 Department of Paediatrics,
University of Cambridge, Addenbrooke’s Hospital, Cambridge, CB2 2QQ, UK; 42 Genetics of Complex
Traits, Institute of Biomedical and Clinical Science, Peninsula Medical School, Magdalen Road, Exeter
EX1 2LU UK; 43 Diabetes Genetics, Institute of Biomedical and Clinical Science, Peninsula Medical
School, Barrack Road, Exeter EX2 5DU UK; 44 Centre for Diabetes and Metabolic Medicine, Barts and
The London, Royal London Hospital, Whitechapel, London, E1 1BB UK; 45 Diabetes Research Group,
School of Clinical Medical Sciences, Newcastle University, Framlington Place, Newcastle upon Tyne
NE2 4HH, UK; 46 The MRC Centre for Causal Analyses in Translational Epidemiology, Bristol University,
Canynge Hall, Whiteladies Rd, Bristol BS2 8PR, UK; 47 MRC Laboratories, Fajara, The Gambia; 48
Diamantina Institute for Cancer, Immunology and Metabolic Medicine, Princess Alexandra Hospital,
University of Queensland, Woolloongabba, Qld 4102, Australia; 49 Botnar Research Centre, University
of Oxford, Headington, Oxford OX3 7BN, UK; 50 Department of Medicine, Division of Medical Sciences,
Institute of Biomedical Research, University of Birmingham, Edgbaston, Birmingham B15 2TT, UK; 51
Section of Cancer Genetics, Institute of Cancer Research, 15 Cotswold Road, Sutton, SM2 5NG, UK; 52
Cancer Genome Project, The Wellcome Trust Sanger Institute, Wellcome Trust Genome Campus,
Hinxton, Cambridge CB10 1SA, UK; 53 Department of Clinical Neurosciences, University of Cambridge,
Addenbrooke’s Hospital, Hills Road, Cambridge CB2 2QQ, UK; 54 PRESENT ADDRESS: Illumina
Cambridge, Chesterford Research Park, Little Chesterford, Nr Saffron Walden, Essex, CB10 1XL, UK.
Page 48 of 51
REFERENCES
1. Frayling,T.M. et al. A Common Variant in the FTO Gene Is Associated with Body Mass Index and Predisposes to Childhood and Adult Obesity. Science 316, 889‐894 (2007).
2. The Wellcome Trust Case Control Consortium Genome‐wide association study of 14,000 cases of seven common diseases and 3,000 shared controls. Nature 447, 661‐678 (2007).
3. Zeggini,E. et al. Replication of Genome‐Wide Association Signals in UK Samples Reveals Risk oci for Type 2 Diabetes. Science 316, 1336‐1341 (2007). L
4. Samani,N.J. et al. Genomewide Association Analysis of Coronary Artery Disease. N Engl J ed 357, 443‐453 (2007). M
5. Day,N.E. et al. EPIC‐Norfolk: study design and characteristics of the cohort. European rospective Investigation of Cancer. British Journal of Cancer 80, 95‐103 (1999). P
6. Price,A.L. et al. Principal components analysis corrects for stratification in genome‐wide ssociation studies. Nat Genet 38, 904‐909 (2006). a
7. Zhao,J.H., Luan,J., Tan,Q., Loos,R., & Wareham,N. Analysis of Large Genomic Data in Silico : The EPIC‐Norfolk Study of Obesity, Huang,D.‐S., Heutte,L., and Loog,M. (Eds.): ICIC 2007, CIS 2, 781‐790 2007. C
8. Kyle,U.G., Schutz,Y., Dupertuis,Y.M., & Pichard,C. Body composition interpretation. Contributions of the fat‐free mass index and the body fat mass index. Nutrition 19, 597‐604 (2003).
9. Purcell,S. et al. PLINK: A Tool Set for Whole‐Genome Association and Population‐Based inkage Analyses. Am J Hum Genet 81, 559‐575 (2007). L
10. Samani,N.J. et al. A Genomewide Linkage Study of 1,933 Families Affected by Premature Coronary Artery Disease: The British Heart Foundation (BHF) Family Heart Study. Am J Hum Genet 77, 1011‐1020 (2005).
11. Alfakih,K. et al. Effect of a common X‐linked angiotensin II type 2‐receptor gene polymorphism (‐1332 G/A) on the occurrence of premature myocardial infarction and stenotic atherosclerosis requiring revascularization. Atherosclerosis In Press, Corrected roof, (2007). P
12. Caulfield,M. et al. Genome‐wide mapping of human loci for essential hypertension. Lancet 61, 2118‐2123 (2003). 3
13. Devlin,B. & Roeder,K. Genomic control for association studies. Biometrics 55, 997‐1004 999). (1
14. Marchini,J., Howie,B., Myers,S., McVean,G., & Donnelly,P. A new multipoint method for genome‐wide association studies by imputation of genotypes. Nat Genet 39, 906‐913 007). (2
15. Sutton,A., Abrams,K.R., Jones,D.R., Sheldon,T.A., & Song,F. Methods for meta‐analysis in edical research(John Wiley & Sons, Chichester, 2000). m
16. Higgins,J.P.T., Thompson,S.G., Deeks,J.J., & Altman,D.G. Measuring inconsistency in meta‐nalyses. BMJ 327, 557‐560 (2003). a
17. Scuteri,A. et al. Genome‐Wide Association Scan Shows Genetic Variants in the FTO Gene Are Associated with Obesity‐Related Traits. PLos Genetics 3, e115 (2007).
18. Harding,A.H. et al. Dietary Fat and the Risk of Clinical Type 2 Diabetes: The European Prospective Investigation of Cancer‐Norfolk Study. Am. J. Epidemiol. 159, 73‐82 (2004).
19. Mesa,J.L. et al. Lamin A/C polymorphisms, type 2 diabetes and the metabolic syndrome: case‐control and quantitative trait studies. Diabetes 56, 884‐889 (2007).
20. Williams,D.R. et al. Undiagnosed glucose intolerance in the community: the Isle of Ely Diabetes Project. Diabet. Med. 12, 30‐35 (1995).
21. Wareham,N.J., Byrne,C.D., Williams,R., Day,N.E., & Hales,C.N. Fasting proinsulin concentrations predict the development of type 2 diabetes. Diabetes Care 22, 262‐270 (1999).
Page 49 of 51

22. Forouhi,N.G., Luan,J., Hennings,S., & Wareham,N.J. Incidence of type 2 diabetes in England and its association with baseline impaired fasting glucose: The Ely study 1990‐2000. Diabet. ed.in press (2007). M
23. Tan,G. et al. The in vivo effects of the Pro12Ala PPAR+¦2 polymorphism on adipose tissue NEFA metabolism: the first use of the Oxford Biobank. Diabetologia 49, 158‐168 (2006).
24. Golding, Pembrey, Jones, & The Alspac Study Team ALSPAC‐The Avon Longitudinal Study of Parents and Children. Paediatr. Perinat. Epidemiol. 15, 74‐87 (2001).
25. Jones,R.W. et al. A new human genetic resource: a DNA bank established as part of the Avon longitudinal study of pregnancy and childhood (ALSPAC). Eur J Hum Genet 8, 653‐660 000). (2
26. Syddall,H.E. et al. Cohort Profile: The Hertfordshire Cohort Study. Int. J. Epidemiol. 34, 1234‐1242 (2005).
27. Leary,S.D. et al. Smoking during Pregnancy and Offspring Fat and Lean Mass in Childhood. Obesity Res 14, 2284‐2293 (2006).
28. Rogers,I.S. et al. Associations of size at birth and dual‐energy X‐ray absorptiometry measures of lean and fat mass at 9 to 10 y of age. Am. J. Clin. Nutr. 84, 739‐747 (2006).
29. Pilia,G. et al. Heritability of Cardiovascular and Personality Traits in 6,148 Sardinians. PLos enetics 2, e132 (2006). G
30. Chen,W.M. & Abecasis,G. Family‐Based Association Tests for Genomewide Association cans. Am J Hum Genet 81, 913‐926 (2007). S
31. Li,Y., Willer,C.J., Ding,J., Sheet,P., & Abecasis,G.R. Rapid Markov Chain Haplotyping and enotype Inference. Submitted(2007). G
32. Heid,I.M. et al. Association of the 103I MC4R allele with decreased body mass in 7937 articipants of two population based surveys. J. Med. Genet. 42, e21 (2005). p
33. Hunter,D.J. et al. A genome‐wide association study identifies alleles in FGFR2 associated with risk of sporadic postmenopausal breast cancer. Nat Genet 39, 870‐874 (2007).
34. Willett,W.C. et al. Cigarette smoking, relative weight, and menopause. Am. J. Epidemiol. 117, 658 (1983).
35. Prorok,P.C. et al. Design of the Prostate, Lung, Colorectal and Ovarian (PLCO) Cancer Screening Trial. Control Clin Trials 21, 273S‐309S (2000).
36. Yeager,M. et al. Genome‐wide association study of prostate cancer identifies a second risk cus at 8q24. Nat Genet 39, 645‐649 (2007). lo
37. Scott,L.J. et al. A Genome‐Wide Association Study of Type 2 Diabetes in Finns Detects ultiple Susceptibility Variants. Science 316, 1341‐1345 (2007). M
38. Diabetes Genetics Initiative of Broad Institute of Harvard and MIT Lund University and Novartis Institutes of BioMedical Research et al. Genome‐Wide Association Analysis Identifies Loci for Type 2 Diabetes and Triglyceride Levels. Science 316, 1331‐1336 (2007).
39. Cole,T.J., Freeman,J.V., & Preece,M.A. Body mass index reference curves for the UK, 1990. rch. Dis. Child. 73, 25‐29 (1995). A
40. Hinney,A. et al. Genome Wide Association (GWA) Study for Early Onset Extreme Obesity Supports the Role of Fat Mass and Obesity Associated Gene (FTO) Variants. PLoS ONE 2, e1361 (2007).
41. Rolland‐Cachera,M.F. et al. Body Mass Index variations: centiles from birth to 87 years. Eur. J. Clin. Nutr. 45, 13‐21 (1991).
42. Poskitt,E.M. Defining childhood obesity: the relative body mass index (BMI). European hildhood Obesity group. Acta Paediatr. 84, 961‐963 (1995). C
43. Cordell,H.J., Barratt,B.J., & Clayton,D.G. Case/pseudocontrol analysis in genetic association studies: A unified framework for detection of genotype and haplotype associations, gene‐gene and gene‐environment interactions, and parent‐of‐origin effects. Genetic pidemiology 26, 167‐185 (2004). E
44. Geller,F. et al. Melanocortin 4 Receptor Gene Variant I103 Is Negatively Associated with Obesity. Am J Hum Genet 74, 572‐581 (2004).
Page 50 of 51
45. Young,E.H. et al. The V103I polymorphism of the MC4R gene and obesity: population based studies and meta‐analysis of 29[thinsp]563 individuals. Int J Obes 31, 1437‐1441 (2007).
46. Stutzmann,F. et al. Non‐synonymous polymorphisms in melanocortin‐4 receptor protect against obesity: the two facets of a Janus obesity gene. Hum. Mol. Genet. 16, 1837‐1844 (2007).
47. Sutton,B.S. et al. Genetic analysis of adiponectin and obesity in Hispanic families: the IRAS Family Study. Human Genet. 117, 107‐118 (2005).
48. Conrad,D.F., Andrews,T.D., Carter,N.P., Hurles,M.E., & Pritchard,J.K. A high‐resolution survey of deletion polymorphism in the human genome. Nat Genet 38, 75‐81 (2006).
49. McCarroll,S.A. et al. Common deletion polymorphisms in the human genome. Nature enet. 38, 86‐92 (2006). G
50. de‐Leon,S.B.‐T. & Davidson,E.H. Gene Regulation: Gene Control Network in Development. nnual Review of Biophysics and Biomolecular Structure 36, 191‐212 (2007). A
51. Hevner,R.F., Hodge,R.D., Daza,R.A.M., & Englund,C. Transcription factors in glutamatergic neurogenesis: Conserved programs in neocortex, cerebellum, and adult hippocampus. Neuroscience Research 55, 223‐233 (2006).
52. Zhang,L. & Pagano,J.S. Review: Structure and Function of IRF‐7. Journal of Interferon & ytokine Research 22, 95‐101 (2002). C
53. Remenyi,A., Scholer,H.R., & Wilmanns,M. Combinatorial control of gene expression. Nat truct Mol Biol 11, 812‐815 (2004). S
54. Kino,T., De Martino,M.U., Charmandari,E., Mirani,M., & Chrousos,G.P. Tissue glucocorticoid resistance/hypersensitivity syndromes. The Journal of Steroid Biochemistry and Molecular Biology 85, 457‐467 (2003).
55. Pedersen,J.S. et al. Identification and Classification of Conserved RNA Secondary Structures the Human Genome. PLoS Computational Biology 2, e33 (2006). in
56. Knapp,J.R. et al. Loss of myogenin in postnatal life leads to normal skeletal muscle but duced body size. Development 133, 601‐610 (2006). re
57. te Pas,M.F. et al. Influences of myogenin genotypes on birth weight, growth rate, carcass eight, backfat thickness, and lean weight of pigs. J. Anim Sci. 77, 2352‐2356 (1999). w
58. Sabeti,P.C. et al. Detecting recent positive selection in the human genome from haplotype tructure. Nature 419, 832‐837 (2002). s
59. Voight,B.F., Kudaravalli,S., Wen,X., & Pritchard,J.K. A Map of Recent Positive Selection in the Human Genome. PLoS Biology 4, e72 (2006).
60. Farooqi,I.S. et al. Clinical Spectrum of Obesity and Mutations in the Melanocortin 4 Receptor Gene. N Engl J Med 348, 1085‐1095 (2003).
61. Huszar,D. et al. Targeted disruption of the melanocortin‐4 receptor results in obesity in mice. Cell 88, 131‐141 (1997).
62. Dixon,A.L. et al. A genome‐wide association study of global gene expression. Nat Genet 39, 202‐1207 (2007). 1
63. Stranger,B.E. et al. Population genomics of human gene expression. Nat Genet 39, 1217‐224 (2007). 1
64. Goring,H.H.H. et al. Discovery of expression QTLs using large‐scale transcriptional profiling human lymphocytes. Nat Genet 39, 1208‐1216 (2007). in
65. Myers,A.J. et al. A survey of genetic human cortical gene expression. Nat Genet 39, 1494‐1499 (2007).
Page 51 of 51

SUPPLEMENTARY TABLES
Association studies involving over 90,000 people demonstrate that common variants near to MC4R influence fat mass, weight and risk of obesity.
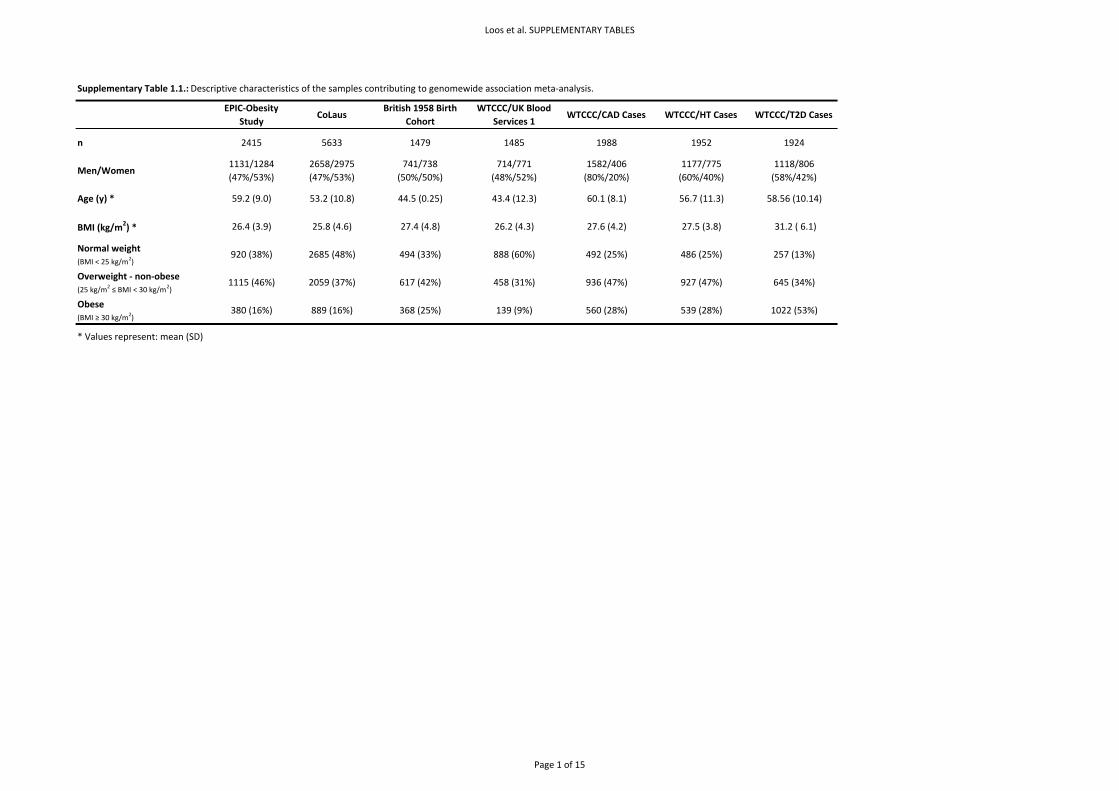
Loos et al. SUPPLEMENTARY TABLES
Supplementary Table 1.1.: Descriptive characteristics of the samples contributing to genomewide association meta‐analysis.
EPIC‐Obesity Study
CoLausBritish 1958 Birth
CohortWTCCC/UK Blood
Services 1WTCCC/CAD Cases WTCCC/HT Cases WTCCC/T2D Cases
n 2415 5633 1479 1485 1988 1952 1924
Men/Women1131/1284(47%/53%)
2658/2975(47%/53%)
741/738(50%/50%)
714/771(48%/52%)
1582/406(80%/20%)
1177/775 (60%/40%)
1118/806(58%/42%)
Age (y) * 59.2 (9.0) 53.2 (10.8) 44.5 (0.25) 43.4 (12.3) 60.1 (8.1) 56.7 (11.3) 58.56 (10.14)
BMI (kg/m2) * 26.4 (3.9) 25.8 (4.6) 27.4 (4.8) 26.2 (4.3) 27.6 (4.2) 27.5 (3.8) 31.2 ( 6.1)
Normal weight (BMI < 25 kg/m2)
920 (38%) 2685 (48%) 494 (33%) 888 (60%) 492 (25%) 486 (25%) 257 (13%)
Overweight ‐ non‐obese(25 kg/m2 ≤ BMI < 30 kg/m2)
1115 (46%) 2059 (37%) 617 (42%) 458 (31%) 936 (47%) 927 (47%) 645 (34%)
Obese (BMI ≥ 30 kg/m2)
380 (16%) 889 (16%) 368 (25%) 139 (9%) 560 (28%) 539 (28%) 1022 (53%)
* Values represent: mean (SD)
Page 1 of 15
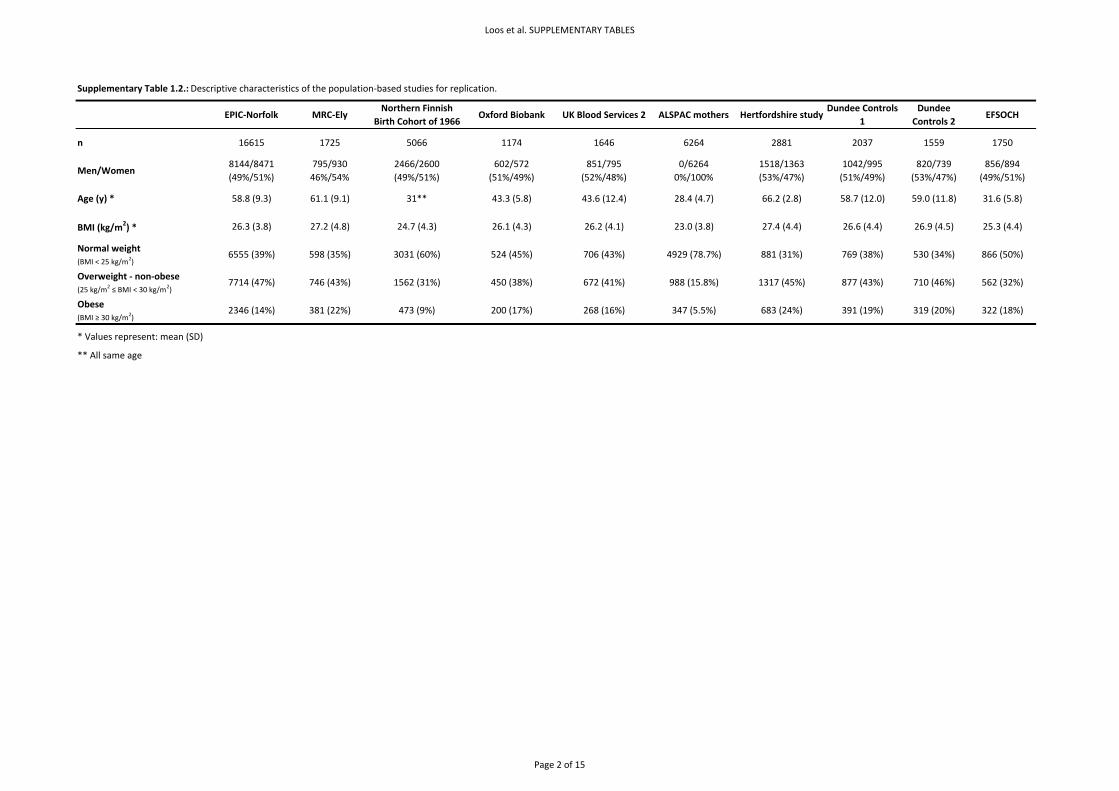
Loos et al. SUPPLEMENTARY TABLES
Supplementary Table 1.2.: Descriptive characteristics of the population‐based studies for replication.
EPIC‐Norfolk MRC‐ElyNorthern Finnish
Birth Cohort of 1966Oxford Biobank UK Blood Services 2 ALSPAC mothers Hertfordshire study
Dundee Controls 1
Dundee Controls 2
EFSOCH
n 16615 1725 5066 1174 1646 6264 2881 2037 1559 1750
Men/Women8144/8471(49%/51%)
795/93046%/54%
2466/2600(49%/51%)
602/572(51%/49%)
851/795(52%/48%)
0/6264 0%/100%
1518/1363(53%/47%)
1042/995(51%/49%)
820/739(53%/47%)
856/894(49%/51%)
Age (y) * 58.8 (9.3) 61.1 (9.1) 31** 43.3 (5.8) 43.6 (12.4) 28.4 (4.7) 66.2 (2.8) 58.7 (12.0) 59.0 (11.8) 31.6 (5.8)
BMI (kg/m2) * 26.3 (3.8) 27.2 (4.8) 24.7 (4.3) 26.1 (4.3) 26.2 (4.1) 23.0 (3.8) 27.4 (4.4) 26.6 (4.4) 26.9 (4.5) 25.3 (4.4)
Normal weight (BMI < 25 kg/m2)
6555 (39%) 598 (35%) 3031 (60%) 524 (45%) 706 (43%) 4929 (78.7%) 881 (31%) 769 (38%) 530 (34%) 866 (50%)
Overweight ‐ non‐obese(25 kg/m2 ≤ BMI < 30 kg/m2)
7714 (47%) 746 (43%) 1562 (31%) 450 (38%) 672 (41%) 988 (15.8%) 1317 (45%) 877 (43%) 710 (46%) 562 (32%)
Obese (BMI ≥ 30 kg/m2)
2346 (14%) 381 (22%) 473 (9%) 200 (17%) 268 (16%) 347 (5.5%) 683 (24%) 391 (19%) 319 (20%) 322 (18%)
* Values represent: mean (SD)
** All same age
Page 2 of 15
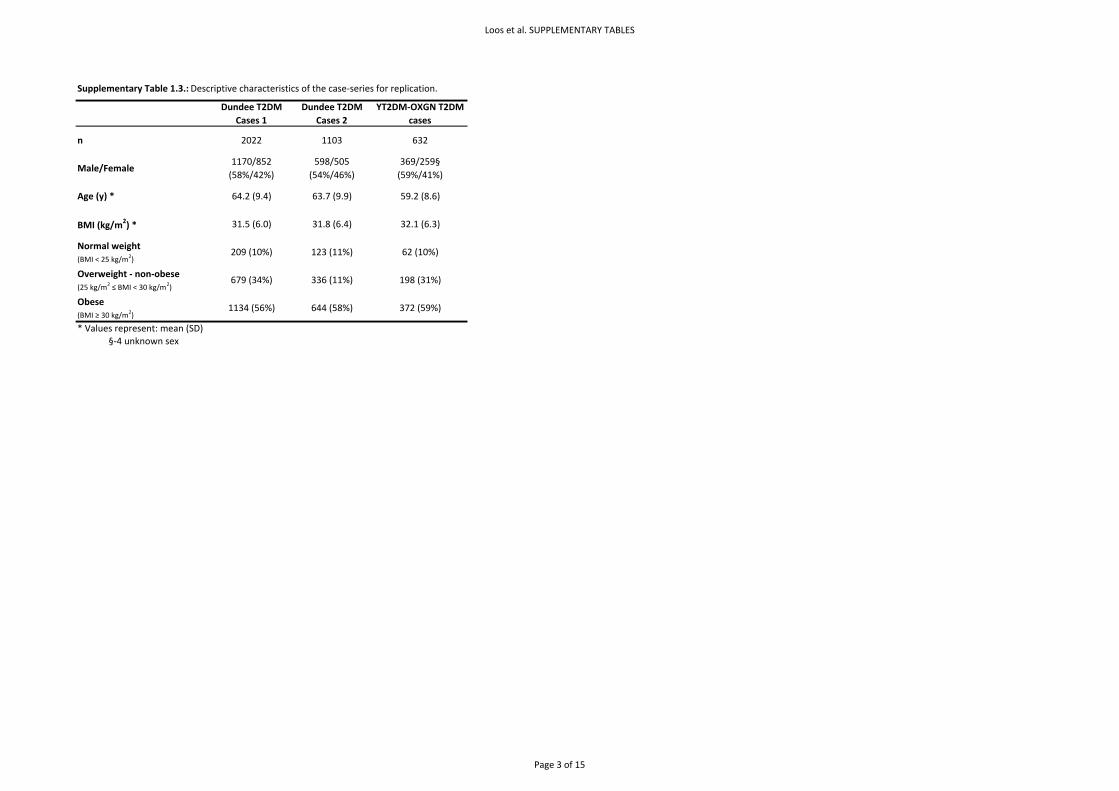
Loos et al. SUPPLEMENTARY TABLES
Supplementary Table 1.3.: Descriptive characteristics of the case‐series for replication.
Dundee T2DM Cases 1
Dundee T2DM Cases 2
YT2DM‐OXGN T2DM cases
n 2022 1103 632
Male/Female1170/852(58%/42%)
598/505(54%/46%)
369/259§(59%/41%)
Age (y) * 64.2 (9.4) 63.7 (9.9) 59.2 (8.6)
BMI (kg/m2) * 31.5 (6.0) 31.8 (6.4) 32.1 (6.3)
Normal weight (BMI < 25 kg/m2)
209 (10%) 123 (11%) 62 (10%)
Overweight ‐ non‐obese(25 kg/m2 ≤ BMI < 30 kg/m2)
679 (34%) 336 (11%) 198 (31%)
Obese (BMI ≥ 30 kg/m2)
1134 (56%) 644 (58%) 372 (59%)
* Values represent: mean (SD)§‐4 unknown sex
Page 3 of 15
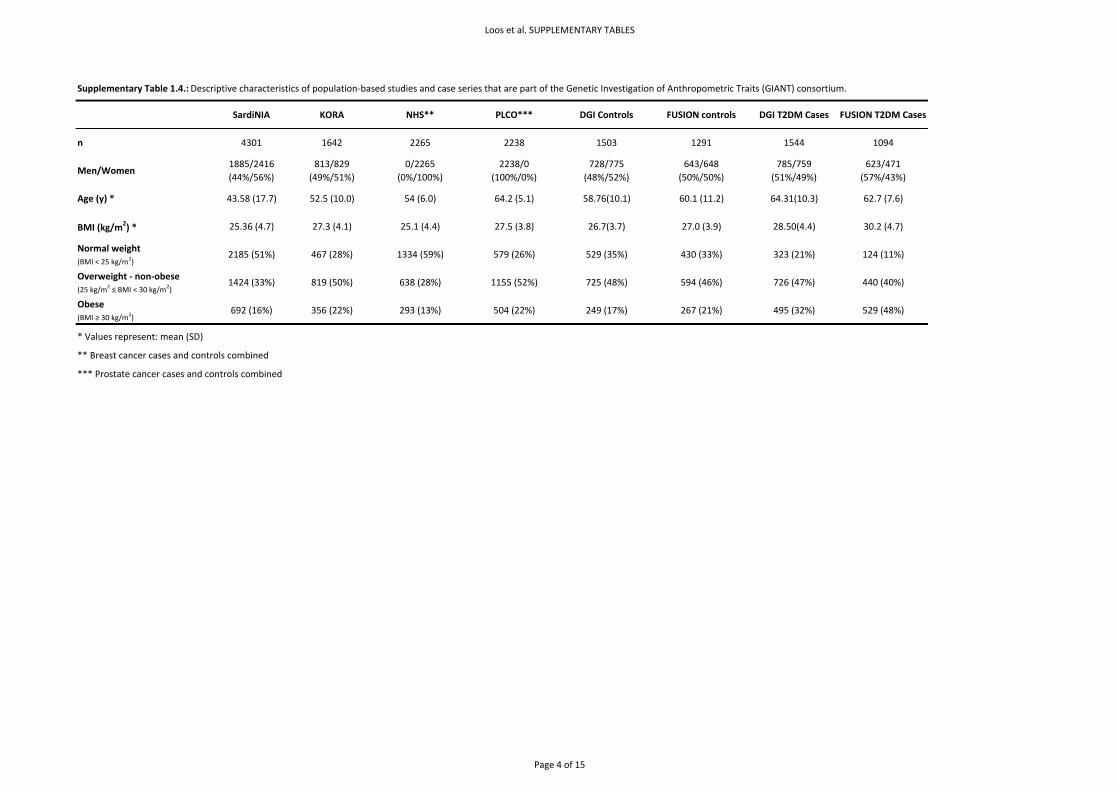
Loos et al. SUPPLEMENTARY TABLES
Supplementary Table 1.4.: Descriptive characteristics of population‐based studies and case series that are part of the Genetic Investigation of Anthropometric Traits (GIANT) consortium.
SardiNIA KORA NHS** PLCO*** DGI Controls FUSION controls DGI T2DM Cases FUSION T2DM Cases
n 4301 1642 2265 2238 1503 1291 1544 1094
Men/Women1885/2416(44%/56%)
813/829(49%/51%)
0/2265(0%/100%)
2238/0(100%/0%)
728/775(48%/52%)
643/648(50%/50%)
785/759(51%/49%)
623/471(57%/43%)
Age (y) * 43.58 (17.7) 52.5 (10.0) 54 (6.0) 64.2 (5.1) 58.76(10.1) 60.1 (11.2) 64.31(10.3) 62.7 (7.6)
BMI (kg/m2) * 25.36 (4.7) 27.3 (4.1) 25.1 (4.4) 27.5 (3.8) 26.7(3.7) 27.0 (3.9) 28.50(4.4) 30.2 (4.7)
Normal weight (BMI < 25 kg/m2)
2185 (51%) 467 (28%) 1334 (59%) 579 (26%) 529 (35%) 430 (33%) 323 (21%) 124 (11%)
Overweight ‐ non‐obese(25 kg/m2 ≤ BMI < 30 kg/m2)
1424 (33%) 819 (50%) 638 (28%) 1155 (52%) 725 (48%) 594 (46%) 726 (47%) 440 (40%)
Obese (BMI ≥ 30 kg/m2)
692 (16%) 356 (22%) 293 (13%) 504 (22%) 249 (17%) 267 (21%) 495 (32%) 529 (48%)
* Values represent: mean (SD)
** Breast cancer cases and controls combined
*** Prostate cancer cases and controls combined
Page 4 of 15
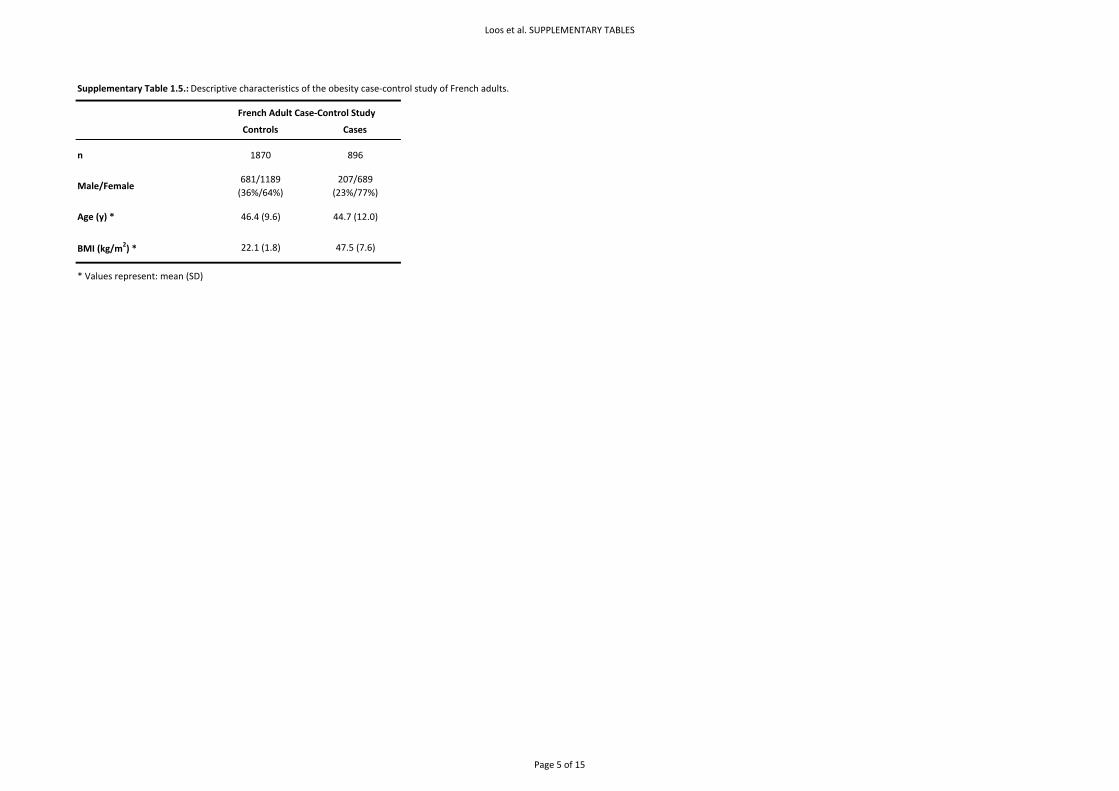
Loos et al. SUPPLEMENTARY TABLES
Supplementary Table 1.5.: Descriptive characteristics of the obesity case‐control study of French adults.
Controls Cases
n 1870 896
Male/Female681/1189(36%/64%)
207/689(23%/77%)
Age (y) * 46.4 (9.6) 44.7 (12.0)
BMI (kg/m2) * 22.1 (1.8) 47.5 (7.6)
* Values represent: mean (SD)
French Adult Case‐Control Study
Page 5 of 15

Loos et al. SUPPLEMENTARY TABLES
Supplementary Table 1.6.: Descriptive characteristics of childhood and adolescent cohorts.
Controls Cases# Controls Cases##
n 5988 1028 442 487 1347 1291
Male/Female3073/2915(51%/49%)
438/590(43%57%)
171/271(39%/61%)
209/278(43%/57%)
641/706(48%/52%)
551/740(43%/57%)
Age (y) * 7** 10.7 (2.7) 26.1 (5.8) 14.4 (3.7) 16.3 (5.7) 10.9 (3.4)
BMI (kg/m2) * 16.2 (2.0) 33.0 (3.8) 18.3 (1.1) 33.4 (6.8) 19.1 (2.7) 29.5 (6.3)
* Values represent: mean (SD)
** All same age
*** The entry criteria for the SCOOP cohort comprise a BMI > 3 SDS and an onset of obesity before the age of 10 years
## BMI ≥95th age‐ and sex‐specific percentile in a German reference population
## BMI ≥97th age‐ and sex‐specific percentile in a French reference population
French Childhood Obesity StudyALSPAC SCOOP‐UK*** Essen Obesity study
Page 6 of 15
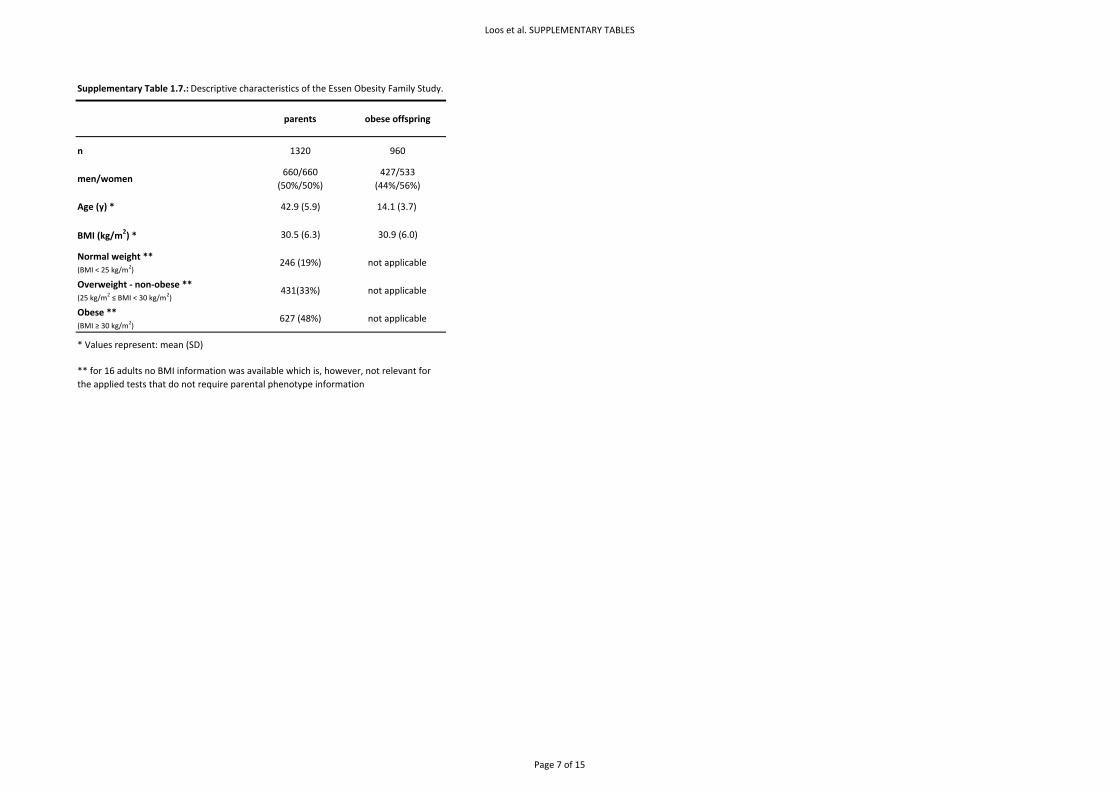
Loos et al. SUPPLEMENTARY TABLES
Supplementary Table 1.7.: Descriptive characteristics of the Essen Obesity Family Study.
parents obese offspring
n 1320 960
men/women660/660
(50%/50%)427/533
(44%/56%)
Age (y) * 42.9 (5.9) 14.1 (3.7)
BMI (kg/m2) * 30.5 (6.3) 30.9 (6.0)
Normal weight **(BMI < 25 kg/m2)
246 (19%) not applicable
Overweight ‐ non‐obese **(25 kg/m2 ≤ BMI < 30 kg/m2)
431(33%) not applicable
Obese **(BMI ≥ 30 kg/m2)
627 (48%) not applicable
* Values represent: mean (SD)
** for 16 adults no BMI information was available which is, however, not relevant for the applied tests that do not require parental phenotype information
Page 7 of 15
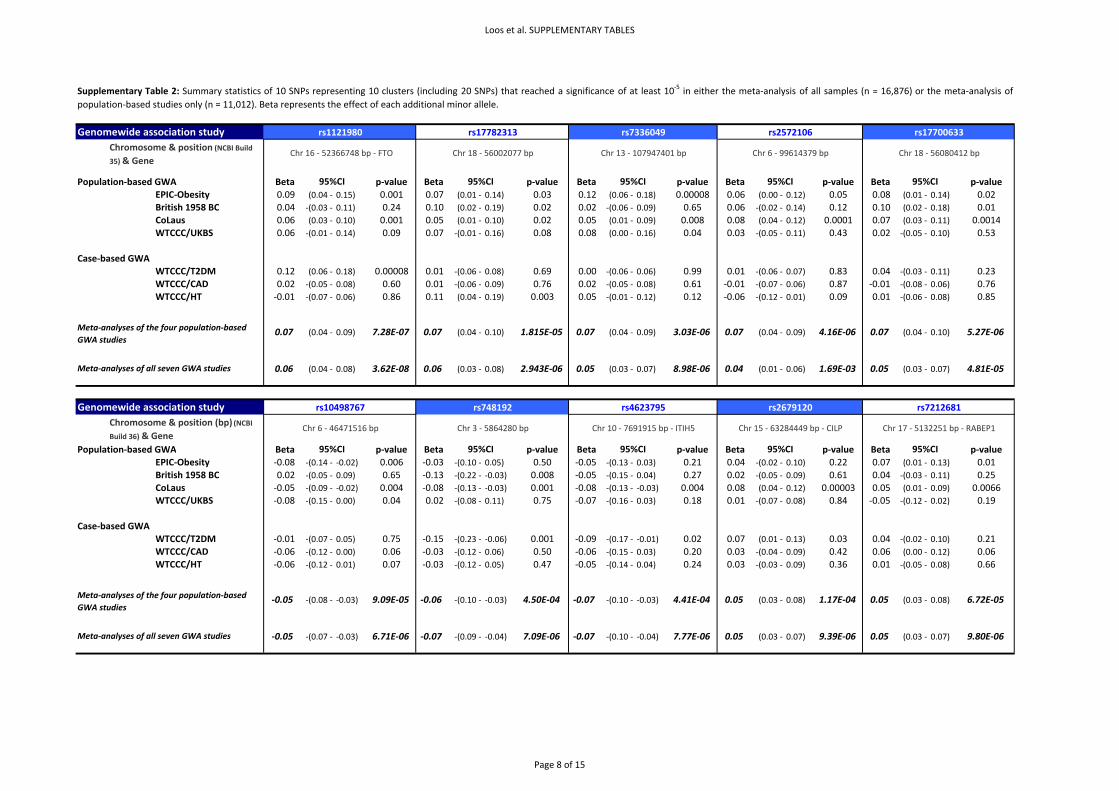
Loos et al. SUPPLEMENTARY TABLES
Genomewide association study
Population‐based GWA Beta p‐value Beta p‐value Beta p‐value Beta p‐value Beta p‐valueEPIC‐Obesity 0.09 (0.04 ‐ 0.15) 0.001 0.07 (0.01 ‐ 0.14) 0.03 0.12 (0.06 ‐ 0.18) 0.00008 0.06 (0.00 ‐ 0.12) 0.05 0.08 (0.01 ‐ 0.14) 0.02British 1958 BC 0.04 ‐(0.03 ‐ 0.11) 0.24 0.10 (0.02 ‐ 0.19) 0.02 0.02 ‐(0.06 ‐ 0.09) 0.65 0.06 ‐(0.02 ‐ 0.14) 0.12 0.10 (0.02 ‐ 0.18) 0.01CoLaus 0.06 (0.03 ‐ 0.10) 0.001 0.05 (0.01 ‐ 0.10) 0.02 0.05 (0.01 ‐ 0.09) 0.008 0.08 (0.04 ‐ 0.12) 0.0001 0.07 (0.03 ‐ 0.11) 0.0014WTCCC/UKBS 0.06 ‐(0.01 ‐ 0.14) 0.09 0.07 ‐(0.01 ‐ 0.16) 0.08 0.08 (0.00 ‐ 0.16) 0.04 0.03 ‐(0.05 ‐ 0.11) 0.43 0.02 ‐(0.05 ‐ 0.10) 0.53
Case‐based GWAWTCCC/T2DM 0.12 (0.06 ‐ 0.18) 0.00008 0.01 ‐(0.06 ‐ 0.08) 0.69 0.00 ‐(0.06 ‐ 0.06) 0.99 0.01 ‐(0.06 ‐ 0.07) 0.83 0.04 ‐(0.03 ‐ 0.11) 0.23WTCCC/CAD 0.02 ‐(0.05 ‐ 0.08) 0.60 0.01 ‐(0.06 ‐ 0.09) 0.76 0.02 ‐(0.05 ‐ 0.08) 0.61 ‐0.01 ‐(0.07 ‐ 0.06) 0.87 ‐0.01 ‐(0.08 ‐ 0.06) 0.76WTCCC/HT ‐0.01 ‐(0.07 ‐ 0.06) 0.86 0.11 (0.04 ‐ 0.19) 0.003 0.05 ‐(0.01 ‐ 0.12) 0.12 ‐0.06 ‐(0.12 ‐ 0.01) 0.09 0.01 ‐(0.06 ‐ 0.08) 0.85
0.07 (0.04 ‐ 0.09) 7.28E‐07 0.07 (0.04 ‐ 0.10) 1.815E‐05 0.07 (0.04 ‐ 0.09) 3.03E‐06 0.07 (0.04 ‐ 0.09) 4.16E‐06 0.07 (0.04 ‐ 0.10) 5.27E‐06
0.06 (0.04 ‐ 0.08) 3.62E‐08 0.06 (0.03 ‐ 0.08) 2.943E‐06 0.05 (0.03 ‐ 0.07) 8.98E‐06 0.04 (0.01 ‐ 0.06) 1.69E‐03 0.05 (0.03 ‐ 0.07) 4.81E‐05
Genomewide association study
Population‐based GWA Beta p‐value Beta p‐value Beta p‐value Beta p‐value Beta p‐valueEPIC‐Obesity ‐0.08 ‐(0.14 ‐ ‐0.02) 0.006 ‐0.03 ‐(0.10 ‐ 0.05) 0.50 ‐0.05 ‐(0.13 ‐ 0.03) 0.21 0.04 ‐(0.02 ‐ 0.10) 0.22 0.07 (0.01 ‐ 0.13) 0.01British 1958 BC 0.02 ‐(0.05 ‐ 0.09) 0.65 ‐0.13 ‐(0.22 ‐ ‐0.03) 0.008 ‐0.05 ‐(0.15 ‐ 0.04) 0.27 0.02 ‐(0.05 ‐ 0.09) 0.61 0.04 ‐(0.03 ‐ 0.11) 0.25CoLaus ‐0.05 ‐(0.09 ‐ ‐0.02) 0.004 ‐0.08 ‐(0.13 ‐ ‐0.03) 0.001 ‐0.08 ‐(0.13 ‐ ‐0.03) 0.004 0.08 (0.04 ‐ 0.12) 0.00003 0.05 (0.01 ‐ 0.09) 0.0066WTCCC/UKBS ‐0.08 ‐(0.15 ‐ 0.00) 0.04 0.02 ‐(0.08 ‐ 0.11) 0.75 ‐0.07 ‐(0.16 ‐ 0.03) 0.18 0.01 ‐(0.07 ‐ 0.08) 0.84 ‐0.05 ‐(0.12 ‐ 0.02) 0.19
Case‐based GWAWTCCC/T2DM ‐0.01 ‐(0.07 ‐ 0.05) 0.75 ‐0.15 ‐(0.23 ‐ ‐0.06) 0.001 ‐0.09 ‐(0.17 ‐ ‐0.01) 0.02 0.07 (0.01 ‐ 0.13) 0.03 0.04 ‐(0.02 ‐ 0.10) 0.21WTCCC/CAD ‐0.06 ‐(0.12 ‐ 0.00) 0.06 ‐0.03 ‐(0.12 ‐ 0.06) 0.50 ‐0.06 ‐(0.15 ‐ 0.03) 0.20 0.03 ‐(0.04 ‐ 0.09) 0.42 0.06 (0.00 ‐ 0.12) 0.06WTCCC/HT ‐0.06 ‐(0.12 ‐ 0.01) 0.07 ‐0.03 ‐(0.12 ‐ 0.05) 0.47 ‐0.05 ‐(0.14 ‐ 0.04) 0.24 0.03 ‐(0.03 ‐ 0.09) 0.36 0.01 ‐(0.05 ‐ 0.08) 0.66
‐0.05 ‐(0.08 ‐ ‐0.03) 9.09E‐05 ‐0.06 ‐(0.10 ‐ ‐0.03) 4.50E‐04 ‐0.07 ‐(0.10 ‐ ‐0.03) 4.41E‐04 0.05 (0.03 ‐ 0.08) 1.17E‐04 0.05 (0.03 ‐ 0.08) 6.72E‐05
‐0.05 ‐(0.07 ‐ ‐0.03) 6.71E‐06 ‐0.07 ‐(0.09 ‐ ‐0.04) 7.09E‐06 ‐0.07 ‐(0.10 ‐ ‐0.04) 7.77E‐06 0.05 (0.03 ‐ 0.07) 9.39E‐06 0.05 (0.03 ‐ 0.07) 9.80E‐06
Supplementary Table 2: Summary statistics of 10 SNPs representing 10 clusters (including 20 SNPs) that reached a significance of at least 10‐5 in either the meta‐analysis of all samples (n = 16,876) or the meta‐analysis ofpopulation‐based studies only (n = 11,012). Beta represents the effect of each additional minor allele.
Chromosome & position (NCBI Build 35) & Gene
Chr 16 ‐ 52366748 bp ‐ FTO Chr 18 ‐ 56002077 bp
rs1121980
95%CI
rs17782313 rs17700633rs7336049 rs2572106
Chr 13 ‐ 107947401 bp Chr 6 ‐ 99614379 bp Chr 18 ‐ 56080412 bp
Chr 17 ‐ 5132251 bp ‐ RABEP1Chr 6 ‐ 46471516 bp
95%CI 95%CI
Chromosome & position (bp) (NCBI Build 36) & Gene
Chr 3 ‐ 5864280 bp Chr 10 ‐ 7691915 bp ‐ ITIH5 Chr 15 ‐ 63284449 bp ‐ CILP
95%CI 95%CI
95%CI
rs7212681
95%CI 95%CI 95%CI
rs748192 rs4623795 rs2679120rs10498767
95%CI
Meta‐analyses of the four population‐based GWA studies
Meta‐analyses of all seven GWA studies
Meta‐analyses of the four population‐based GWA studies
Meta‐analyses of all seven GWA studies
Page 8 of 15
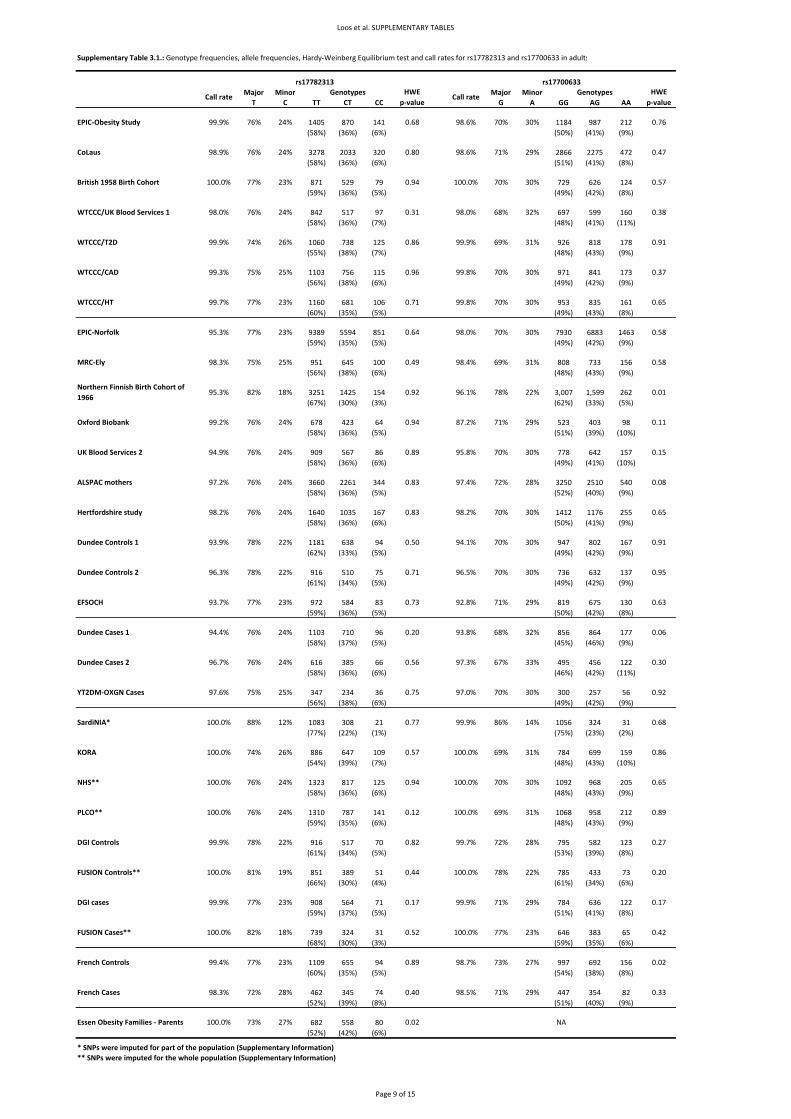
Loos et al. SUPPLEMENTARY TABLES
Supplementary Table 3.1.: Genotype frequencies, allele frequencies, Hardy‐Weinberg Equilibrium test and call rates for rs17782313 and rs17700633 in adults
Major Minor Major MinorT C TT CT CC G A GG AG AA
1405 870 141 1184 987 212(58%) (36%) (6%) (50%) (41%) (9%)
3278 2033 320 2866 2275 472(58%) (36%) (6%) (51%) (41%) (8%)
871 529 79 729 626 124(59%) (36%) (5%) (49%) (42%) (8%)
842 517 97 697 599 160(58%) (36%) (7%) (48%) (41%) (11%)
1060 738 125 926 818 178(55%) (38%) (7%) (48%) (43%) (9%)
1103 756 115 971 841 173(56%) (38%) (6%) (49%) (42%) (9%)
1160 681 106 953 835 161(60%) (35%) (5%) (49%) (43%) (8%)
9389 5594 851 7930 6883 1463(59%) (35%) (5%) (49%) (42%) (9%)
951 645 100 808 733 156(56%) (38%) (6%) (48%) (43%) (9%)
3251 1425 154 3,007 1,599 262(67%) (30%) (3%) (62%) (33%) (5%)
678 423 64 523 403 98(58%) (36%) (5%) (51%) (39%) (10%)
909 567 86 778 642 157(58%) (36%) (6%) (49%) (41%) (10%)
3660 2261 344 3250 2510 540(58%) (36%) (5%) (52%) (40%) (9%)
1640 1035 167 1412 1176 255(58%) (36%) (6%) (50%) (41%) (9%)
1181 638 94 947 802 167(62%) (33%) (5%) (49%) (42%) (9%)
916 510 75 736 632 137(61%) (34%) (5%) (49%) (42%) (9%)
972 584 83 819 675 130(59%) (36%) (5%) (50%) (42%) (8%)
1103 710 96 856 864 177(58%) (37%) (5%) (45%) (46%) (9%)
616 385 66 495 456 122(58%) (36%) (6%) (46%) (42%) (11%)
347 234 36 300 257 56(56%) (38%) (6%) (49%) (42%) (9%)
1083 308 21 1056 324 31(77%) (22%) (1%) (75%) (23%) (2%)
886 647 109 784 699 159(54%) (39%) (7%) (48%) (43%) (10%)
1323 817 125 1092 968 205(58%) (36%) (6%) (48%) (43%) (9%)
1310 787 141 1068 958 212(59%) (35%) (6%) (48%) (43%) (9%)
916 517 70 795 582 123(61%) (34%) (5%) (53%) (39%) (8%)
851 389 51 785 433 73(66%) (30%) (4%) (61%) (34%) (6%)
908 564 71 784 636 122(59%) (37%) (5%) (51%) (41%) (8%)
739 324 31 646 383 65(68%) (30%) (3%) (59%) (35%) (6%)
1109 655 94 997 692 156(60%) (35%) (5%) (54%) (38%) (8%)
462 345 74 447 354 82(52%) (39%) (8%) (51%) (40%) (9%)
682 558 80(52%) (42%) (6%)
* SNPs were imputed for part of the population (Supplementary Information)** SNPs were imputed for the whole population (Supplementary Information)
0.02
Essen Obesity Families ‐ Parents 100.0% 73% 27% 0.02
0.89 98.7% 73% 27%French Controls 99.4% 77% 23%
0.95
0.92
33% 0.30
0.63
0.82
70% 30%
67%97.3%
28%
93.8%
99.7% 72%
70%
0.27
96.3% 78% 22%
97.0%
23%
0.75
71%0.73 92.8%
0.170.17 99.9% 71% 29%
Dundee Cases 1 94.4%
24%Dundee Cases 2 96.7% 76%
Genotypes Genotypes
0.91
0.06
30%
32%
0.71
87.2%
0.58
0.58
0.50 94.1%
YT2DM‐OXGN Cases 97.6% 75%
76% 24%
77%
96.5%
25%
Dundee Controls 2
0.08
0.01
0.15
ALSPAC mothers 97.2% 0.83 97.4%
Dundee Controls 1 93.9%
76% 24%
UK Blood Services 2
EFSOCH 93.7%
94.9%
Hertfordshire study 98.2% 76% 24%
0.89 95.8%76% 24%
Northern Finnish Birth Cohort of 1966
95.3% 0.92 96.1%18%82%
Oxford Biobank 99.2% 0.94 0.1176% 24% 71% 29%
70%
31%
77% 23% 0.64
0.49 98.4% 69%
98.0%
25%
99.8%77% 23%
WTCCC/CAD 99.3% 25%
WTCCC/HT 99.7%
30% 0.76
WTCCC/UK Blood Services 1 98.0% 0.31 98.0% 0.38
0.94 100.0% 0.57
98.6% 70%
78% 22%
76% 0.68
72%
70%
70%
70%
EPIC‐Obesity Study 99.9% 24%
0.77
0.71
23%
24%
26%
MRC‐Ely 98.3%
99.9% 86%
0.56
0.20
28%
30%
68%
30%
70%
29%
70% 30%
78% 22%
99.9%
0.96 99.8%
0.86
68%
69%
30%
30%
0.91
0.37
0.65
29% 0.47
30%
32%
31%
75%
77%
75%
WTCCC/T2D 99.9%
76%
74%
EPIC‐Norfolk 95.3%
98.9% 76%
British 1958 Birth Cohort 100.0%
CoLaus 24% 0.80
rs17782313 rs17700633
Call rate Call rateHWE
p‐valueHWE
p‐value
98.6% 71%
SardiNIA* 100.0% 88% 12% 14% 0.68
KORA 100.0% 74% 26% 0.57 100.0% 69% 31% 0.86
PLCO** 100.0% 76% 24% 0.12 100.0% 69% 31% 0.89
99.9% 77% 23%
DGI Controls 99.9% 78% 22%
DGI cases
FUSION Cases** 100.0% 82% 18% 0.52 100.0% 77% 23% 0.42
FUSION Controls** 100.0% 81% 19% 0.44 100.0% 78% 22% 0.20
NHS** 100.0% 76% 24% 0.650.94 100.0%
0.650.83 98.2% 70% 30%
30%70%
French Cases 98.3% 72% 28% 0.33
NA
0.40 98.5% 71% 29%
Page 9 of 15

Loos et al. SUPPLEMENTARY TABLES
Supplementary Table 3.2.: Genotype frequencies, allele frequencies, Hardy‐Weinberg Equilibrium test and call rates for rs17782313 and rs17700633 in children and adolescents.
Major Minor Major MinorT C TT CT CC G A GG AG AA
3455 2225 308 2941 2532 484(58%) (37%) (5%) (49%) (43%) (8%)
524 391 80 465 440 114(53%) (39%) (8%) (46%) (43%) (11%)
235 203 48 223 177 42(48%) (42%) (10%) (50%) (40%) (10%)
255 163 24 239 200 47(58%) (37%) (5%) (49%) (41%) (10%)
477 369 114(50%) (38%) (12%)
762 442 93 682 500 115(59%) (34%) (7%) (53%) (39%) (9%)
634 513 109 572 536 132(50%) (41%) (9%) (46%) (43%) (11%)
71% 29%76% 24%ALSPAC children (age 7y) 98.0% 0.04 97.7%
0.52
0.06
SCOOP‐UK 96.8% 72% 28% 0.56 99.1% 67% 33%
Essen Obesity Study ‐ Cases 99.8% 69% 31% 0.67 99.8% 70% 30% 0.59
Essen Obesity Study ‐ Controls 100.0% 76% 24% 0.90 100.0% 70% 30% 0.42
rs17782313 rs17700633
Call rateGenotypes HWE
p‐valueCall rate
Genotypes HWE p‐value
French Controls 96.3% 76% 24% 0.01 96.3% 72% 28% 0.10
French Cases 96.5% 71% 29% 0.73 95.3% 68% 32% 0.70
NANAEssen Obesity Families ‐ Offspring* 100.0% 69% 31%
Page 10 of 15
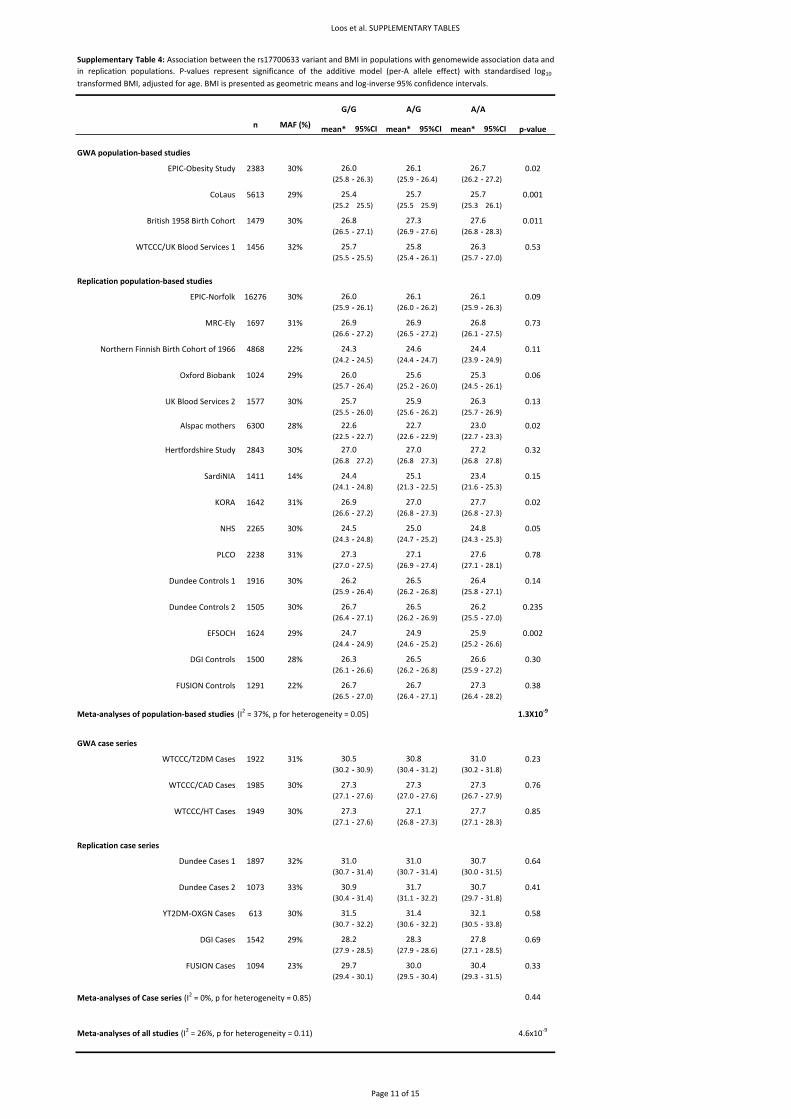
Loos et al. SUPPLEMENTARY TABLES
n MAF (%) mean* mean* mean* p‐value
GWA population‐based studies
EPIC‐Obesity Study 2383 30% 0.02(25.8 ‐ 26.3) (25.9 ‐ 26.4) (26.2 ‐ 27.2)
CoLaus 5613 29% 0.001(25.2 25.5) (25.5 25.9) (25.3 26.1)
British 1958 Birth Cohort 1479 30% 0.011(26.5 ‐ 27.1) (26.9 ‐ 27.6) (26.8 ‐ 28.3)
WTCCC/UK Blood Services 1 1456 32% 0.53(25.5 ‐ 25.5) (25.4 ‐ 26.1) (25.7 ‐ 27.0)
Replication population‐based studies
EPIC‐Norfolk 16276 30% 0.09(25.9 ‐ 26.1) (26.0 ‐ 26.2) (25.9 ‐ 26.3)
MRC‐Ely 1697 31% 0.73(26.6 ‐ 27.2) (26.5 ‐ 27.2) (26.1 ‐ 27.5)
Northern Finnish Birth Cohort of 1966 4868 22% 0.11(24.2 ‐ 24.5) (24.4 ‐ 24.7) (23.9 ‐ 24.9)
Oxford Biobank 1024 29% 0.06(25.7 ‐ 26.4) (25.2 ‐ 26.0) (24.5 ‐ 26.1)
UK Blood Services 2 1577 30% 0.13(25.5 ‐ 26.0) (25.6 ‐ 26.2) (25.7 ‐ 26.9)
Alspac mothers 6300 28% 0.02(22.5 ‐ 22.7) (22.6 ‐ 22.9) (22.7 ‐ 23.3)
Hertfordshire Study 2843 30% 0.32(26.8 27.2) (26.8 27.3) (26.8 27.8)
SardiNIA 1411 14% 0.15(24.1 ‐ 24.8) (21.3 ‐ 22.5) (21.6 ‐ 25.3)
KORA 1642 31% 0.02(26.6 ‐ 27.2) (26.8 ‐ 27.3) (26.8 ‐ 27.3)
NHS 2265 30% 0.05(24.3 ‐ 24.8) (24.7 ‐ 25.2) (24.3 ‐ 25.3)
PLCO 2238 31% 0.78(27.0 ‐ 27.5) (26.9 ‐ 27.4) (27.1 ‐ 28.1)
Dundee Controls 1 1916 30% 0.14(25.9 ‐ 26.4) (26.2 ‐ 26.8) (25.8 ‐ 27.1)
Dundee Controls 2 1505 30% 0.235(26.4 ‐ 27.1) (26.2 ‐ 26.9) (25.5 ‐ 27.0)
EFSOCH 1624 29% 0.002(24.4 ‐ 24.9) (24.6 ‐ 25.2) (25.2 ‐ 26.6)
DGI Controls 1500 28% 0.30(26.1 ‐ 26.6) (26.2 ‐ 26.8) (25.9 ‐ 27.2)
FUSION Controls 1291 22% 0.38(26.5 ‐ 27.0) (26.4 ‐ 27.1) (26.4 ‐ 28.2)
Meta‐analyses of population‐based studies (I2 = 37%, p for heterogeneity = 0.05) 1.3X10‐9
GWA case series
WTCCC/T2DM Cases 1922 31% 0.23(30.2 ‐ 30.9) (30.4 ‐ 31.2) (30.2 ‐ 31.8)
WTCCC/CAD Cases 1985 30% 0.76(27.1 ‐ 27.6) (27.0 ‐ 27.6) (26.7 ‐ 27.9)
WTCCC/HT Cases 1949 30% 0.85(27.1 ‐ 27.6) (26.8 ‐ 27.3) (27.1 ‐ 28.3)
Replication case series
Dundee Cases 1 1897 32% 0.64(30.7 ‐ 31.4) (30.7 ‐ 31.4) (30.0 ‐ 31.5)
Dundee Cases 2 1073 33% 0.41(30.4 ‐ 31.4) (31.1 ‐ 32.2) (29.7 ‐ 31.8)
YT2DM‐OXGN Cases 613 30% 0.58(30.7 ‐ 32.2) (30.6 ‐ 32.2) (30.5 ‐ 33.8)
DGI Cases 1542 29% 0.69(27.9 ‐ 28.5) (27.9 ‐ 28.6) (27.1 ‐ 28.5)
FUSION Cases 1094 23% 0.33(29.4 ‐ 30.1) (29.5 ‐ 30.4) (29.3 ‐ 31.5)
Meta‐analyses of Case series (I2 = 0%, p for heterogeneity = 0.85) 0.44
Meta‐analyses of all studies (I2 = 26%, p for heterogeneity = 0.11) 4.6x10‐9
Supplementary Table 4: Association between the rs17700633 variant and BMI in populations with genomewide association data andin replication populations. P‐values represent significance of the additive model (per‐A allele effect) with standardised log10transformed BMI, adjusted for age. BMI is presented as geometric means and log‐inverse 95% confidence intervals.
G/G A/G A/A
26.8
95%CI 95%CI 95%CI
26.0 26.1 26.7
25.4 25.7 25.7
25.7 25.8 26.3
26.0 26.1 26.1
26.9 26.8
25.7 25.9
26.5 26.4
27.3 27.6
24.6 24.4
25.6 25.3
27.6
26.9
27.0 27.0 27.2
24.3
22.6 22.7 23.0
26.3
26.0
26.2
24.7 24.9 25.9
26.7
30.7
31.0
26.7 26.7 27.3
27.3
31.0
30.9 31.7
30.7
24.4 25.1 23.4
27.3 27.1 27.7
27.7
24.5 25.0 24.8
26.9 27.0
27.3
30.5 30.8
26.3 26.5
26.5
27.1
26.2
31.0
27.3 27.3
26.6
31.5
29.7 30.0 30.4
28.2 28.3 27.8
31.4 32.1
Page 11 of 15
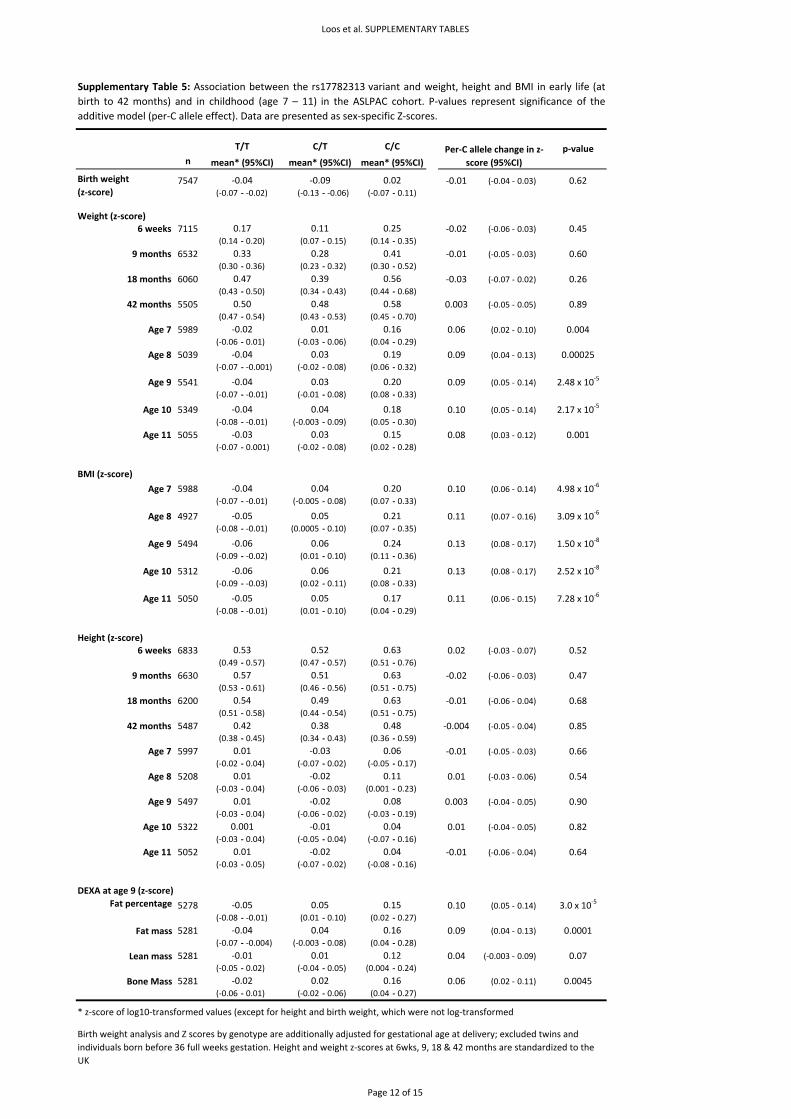
Loos et al. SUPPLEMENTARY TABLES
n
7547 ‐0.01 (‐0.04 ‐ 0.03) 0.62(‐0.07 ‐ ‐0.02) (‐0.13 ‐ ‐0.06) (‐0.07 ‐ 0.11)
Weight (z‐score)6 weeks 7115 ‐0.02 (‐0.06 ‐ 0.03) 0.45
(0.14 ‐ 0.20) (0.07 ‐ 0.15) (0.14 ‐ 0.35)
9 months 6532 ‐0.01 (‐0.05 ‐ 0.03) 0.60(0.30 ‐ 0.36) (0.23 ‐ 0.32) (0.30 ‐ 0.52)
18 months 6060 ‐0.03 (‐0.07 ‐ 0.02) 0.26(0.43 ‐ 0.50) (0.34 ‐ 0.43) (0.44 ‐ 0.68)
42 months 5505 0.003 (‐0.05 ‐ 0.05) 0.89(0.47 ‐ 0.54) (0.43 ‐ 0.53) (0.45 ‐ 0.70)
Age 7 5989 0.06 (0.02 ‐ 0.10) 0.004(‐0.06 ‐ 0.01) (‐0.03 ‐ 0.06) (0.04 ‐ 0.29)
Age 8 5039 0.09 (0.04 ‐ 0.13) 0.00025(‐0.07 ‐ ‐0.001) (‐0.02 ‐ 0.08) (0.06 ‐ 0.32)
Age 9 5541 0.09 (0.05 ‐ 0.14) 2.48 x 10‐5
(‐0.07 ‐ ‐0.01) (‐0.01 ‐ 0.08) (0.08 ‐ 0.33)
Age 10 5349 0.10 (0.05 ‐ 0.14) 2.17 x 10‐5
(‐0.08 ‐ ‐0.01) (‐0.003 ‐ 0.09) (0.05 ‐ 0.30)
Age 11 5055 0.08 (0.03 ‐ 0.12) 0.001(‐0.07 ‐ 0.001) (‐0.02 ‐ 0.08) (0.02 ‐ 0.28)
BMI (z‐score)
Age 7 5988 0.10 (0.06 ‐ 0.14) 4.98 x 10‐6
(‐0.07 ‐ ‐0.01) (‐0.005 ‐ 0.08) (0.07 ‐ 0.33)
Age 8 4927 0.11 (0.07 ‐ 0.16) 3.09 x 10‐6
(‐0.08 ‐ ‐0.01) (0.0005 ‐ 0.10) (0.07 ‐ 0.35)
Age 9 5494 0.13 (0.08 ‐ 0.17) 1.50 x 10‐8
(‐0.09 ‐ ‐0.02) (0.01 ‐ 0.10) (0.11 ‐ 0.36)
Age 10 5312 0.13 (0.08 ‐ 0.17) 2.52 x 10‐8
(‐0.09 ‐ ‐0.03) (0.02 ‐ 0.11) (0.08 ‐ 0.33)
Age 11 5050 0.11 (0.06 ‐ 0.15) 7.28 x 10‐6
(‐0.08 ‐ ‐0.01) (0.01 ‐ 0.10) (0.04 ‐ 0.29)
Height (z‐score)6 weeks 6833 0.02 (‐0.03 ‐ 0.07) 0.52
(0.49 ‐ 0.57) (0.47 ‐ 0.57) (0.51 ‐ 0.76)
9 months 6630 ‐0.02 (‐0.06 ‐ 0.03) 0.47(0.53 ‐ 0.61) (0.46 ‐ 0.56) (0.51 ‐ 0.75)
18 months 6200 ‐0.01 (‐0.06 ‐ 0.04) 0.68(0.51 ‐ 0.58) (0.44 ‐ 0.54) (0.51 ‐ 0.75)
42 months 5487 ‐0.004 (‐0.05 ‐ 0.04) 0.85(0.38 ‐ 0.45) (0.34 ‐ 0.43) (0.36 ‐ 0.59)
Age 7 5997 ‐0.01 (‐0.05 ‐ 0.03) 0.66(‐0.02 ‐ 0.04) (‐0.07 ‐ 0.02) (‐0.05 ‐ 0.17)
Age 8 5208 0.01 (‐0.03 ‐ 0.06) 0.54(‐0.03 ‐ 0.04) (‐0.06 ‐ 0.03) (0.001 ‐ 0.23)
Age 9 5497 0.003 (‐0.04 ‐ 0.05) 0.90(‐0.03 ‐ 0.04) (‐0.06 ‐ 0.02) (‐0.03 ‐ 0.19)
Age 10 5322 0.01 (‐0.04 ‐ 0.05) 0.82(‐0.03 ‐ 0.04) (‐0.05 ‐ 0.04) (‐0.07 ‐ 0.16)
Age 11 5052 ‐0.01 (‐0.06 ‐ 0.04) 0.64(‐0.03 ‐ 0.05) (‐0.07 ‐ 0.02) (‐0.08 ‐ 0.16)
DEXA at age 9 (z‐score)
5278 0.10 (0.05 ‐ 0.14) 3.0 x 10‐5
(‐0.08 ‐ ‐0.01) (0.01 ‐ 0.10) (0.02 ‐ 0.27)
5281 0.09 (0.04 ‐ 0.13) 0.0001(‐0.07 ‐ ‐0.004) (‐0.003 ‐ 0.08) (0.04 ‐ 0.28)
5281 0.04 (‐0.003 ‐ 0.09) 0.07(‐0.05 ‐ 0.02) (‐0.04 ‐ 0.05) (0.004 ‐ 0.24)
5281 0.06 (0.02 ‐ 0.11) 0.0045(‐0.06 ‐ 0.01) (‐0.02 ‐ 0.06) (0.04 ‐ 0.27)
* z‐score of log10‐transformed values (except for height and birth weight, which were not log‐transformed)
0.08
0.001
‐0.03 0.06
0.01 ‐0.02 0.11
0.01
0.01
Supplementary Table 5: Association between the rs17782313 variant and weight, height and BMI in early life (atbirth to 42 months) and in childhood (age 7 – 11) in the ASLPAC cohort. P‐values represent significance of theadditive model (per‐C allele effect). Data are presented as sex‐specific Z‐scores.
0.01 ‐0.02 0.04
0.42 0.38 0.48
‐0.02
0.57 0.51 0.63
0.54 0.49 0.63
0.03 0.15
0.53 0.52 0.63
0.24
‐0.06 0.06 0.21
0.20
‐0.04 0.04 0.18
‐0.04 0.03
0.01 0.12
0.160.04‐0.04
‐0.01 0.04
Bone Mass ‐0.02 0.02 0.16
Fat mass
Lean mass ‐0.01
mean* (95%CI)
Birth weight(z‐score)
‐0.04
0.47
‐0.02
‐0.04
‐0.03
mean* (95%CI) mean* (95%CI)
‐0.05 0.05 0.17
‐0.06 0.06
0.04 0.20
‐0.05
0.11 0.25
0.05 0.21
0.39 0.56
0.01 0.16
0.03 0.19
‐0.09 0.02
Birth weight analysis and Z scores by genotype are additionally adjusted for gestational age at delivery; excluded twins and individuals born before 36 full weeks gestation. Height and weight z‐scores at 6wks, 9, 18 & 42 months are standardized to the UK
Fat percentage ‐0.05 0.05 0.15
0.50 0.48 0.58
p‐value
0.33 0.28 0.41
0.17
Per‐C allele change in z‐score (95%CI)
T/T C/T C/C
‐0.04
Page 12 of 15
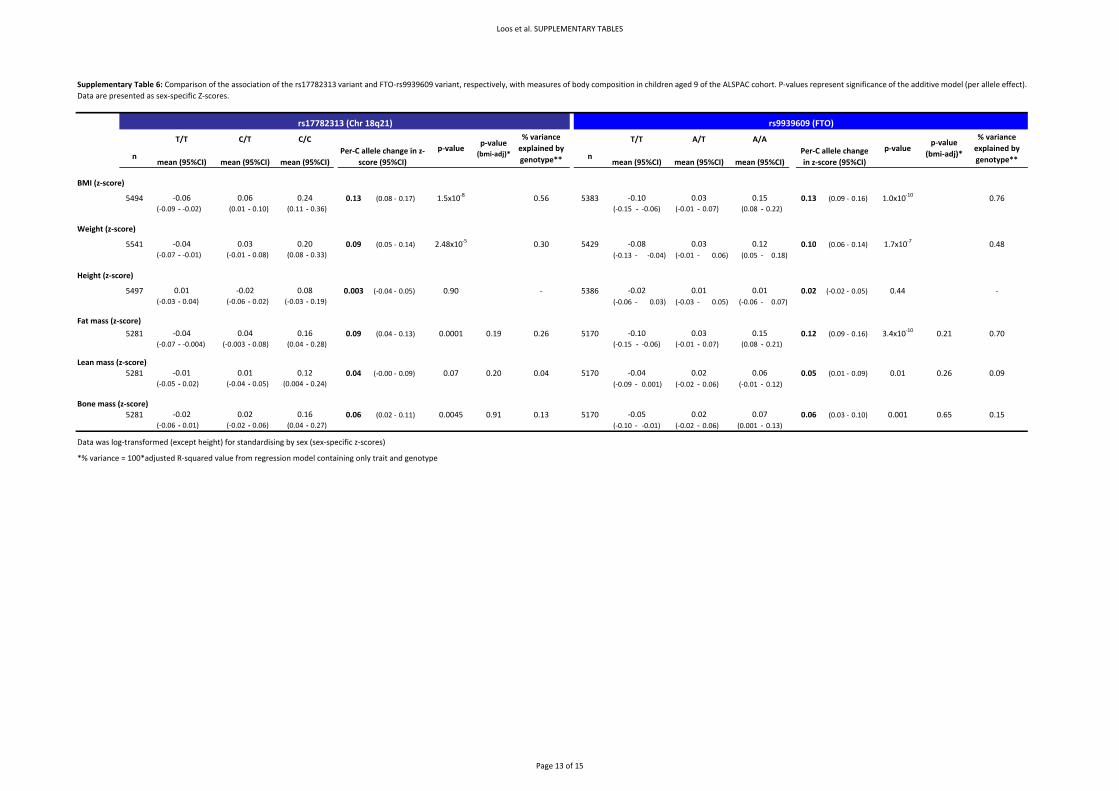
Loos et al. SUPPLEMENTARY TABLES
n n
BMI (z‐score)
5494 0.13 (0.08 ‐ 0.17) 1.5x10‐8 0.56 5383 0.13 (0.09 ‐ 0.16) 1.0x10‐10 0.76(‐0.09 ‐ ‐0.02) (0.01 ‐ 0.10) (0.11 ‐ 0.36) (‐0.15 ‐ ‐0.06) (‐0.01 ‐ 0.07) (0.08 ‐ 0.22)
Weight (z‐score)
5541 0.09 (0.05 ‐ 0.14) 2.48x10‐5 0.30 5429 0.10 (0.06 ‐ 0.14) 1.7x10‐7 0.48(‐0.07 ‐ ‐0.01) (‐0.01 ‐ 0.08) (0.08 ‐ 0.33) (‐0.13 ‐ ‐0.04) (‐0.01 ‐ 0.06) (0.05 ‐ 0.18)
Height (z‐score)
5497 0.003 (‐0.04 ‐ 0.05) 0.90 ‐ 5386 0.02 (‐0.02 ‐ 0.05) 0.44 ‐(‐0.03 ‐ 0.04) (‐0.06 ‐ 0.02) (‐0.03 ‐ 0.19) (‐0.06 ‐ 0.03) (‐0.03 ‐ 0.05) (‐0.06 ‐ 0.07)
Fat mass (z‐score)
5281 0.09 (0.04 ‐ 0.13) 0.0001 0.19 0.26 5170 0.12 (0.09 ‐ 0.16) 3.4x10‐10 0.21 0.70(‐0.07 ‐ ‐0.004) (‐0.003 ‐ 0.08) (0.04 ‐ 0.28) (‐0.15 ‐ ‐0.06) (‐0.01 ‐ 0.07) (0.08 ‐ 0.21)
Lean mass (z‐score)5281 0.04 (‐0.00 ‐ 0.09) 0.07 0.20 0.04 5170 0.05 (0.01 ‐ 0.09) 0.01 0.26 0.09
(‐0.05 ‐ 0.02) (‐0.04 ‐ 0.05) (0.004 ‐ 0.24) (‐0.09 ‐ 0.001) (‐0.02 ‐ 0.06) (‐0.01 ‐ 0.12)
Bone mass (z‐score)5281 0.06 (0.02 ‐ 0.11) 0.0045 0.91 0.13 5170 0.06 (0.03 ‐ 0.10) 0.001 0.65 0.15
(‐0.06 ‐ 0.01) (‐0.02 ‐ 0.06) (0.04 ‐ 0.27) (‐0.10 ‐ ‐0.01) (‐0.02 ‐ 0.06) (0.001 ‐ 0.13)
Data was log‐transformed (except height) for standardising by sex (sex‐specific z‐scores)
*% variance = 100*adjusted R‐squared value from regression model containing only trait and genotype
Supplementary Table 6: Comparison of the association of the rs17782313 variant and FTO‐rs9939609 variant, respectively, with measures of body composition in children aged 9 of the ALSPAC cohort. P‐values represent significance of the additive model (per allele effect).Data are presented as sex‐specific Z‐scores.
0.02 0.07
p‐value (bmi‐adj)*
p‐value
0.02 0.06
0.03 0.15
‐0.02 0.02 0.16 ‐0.05
‐0.01 0.01 0.12 ‐0.04
‐0.04 0.04 0.16 ‐0.10
‐0.06 0.06
‐0.04 0.03
0.24
mean (95%CI) mean (95%CI)
p‐value (bmi‐adj)*Per‐C allele change
in z‐score (95%CI)
p‐value% variance explained by genotype**
T/T A/T A/A % variance explained by genotype**mean (95%CI) mean (95%CI) mean (95%CI)
rs17782313 (Chr 18q21)
‐0.10 0.03 0.15
rs9939609 (FTO)
mean (95%CI)Per‐C allele change in z‐
score (95%CI)
T/T C/T C/C
0.20 ‐0.08
0.01 0.01
0.03 0.12
0.01 ‐0.02 0.08 ‐0.02
Page 13 of 15
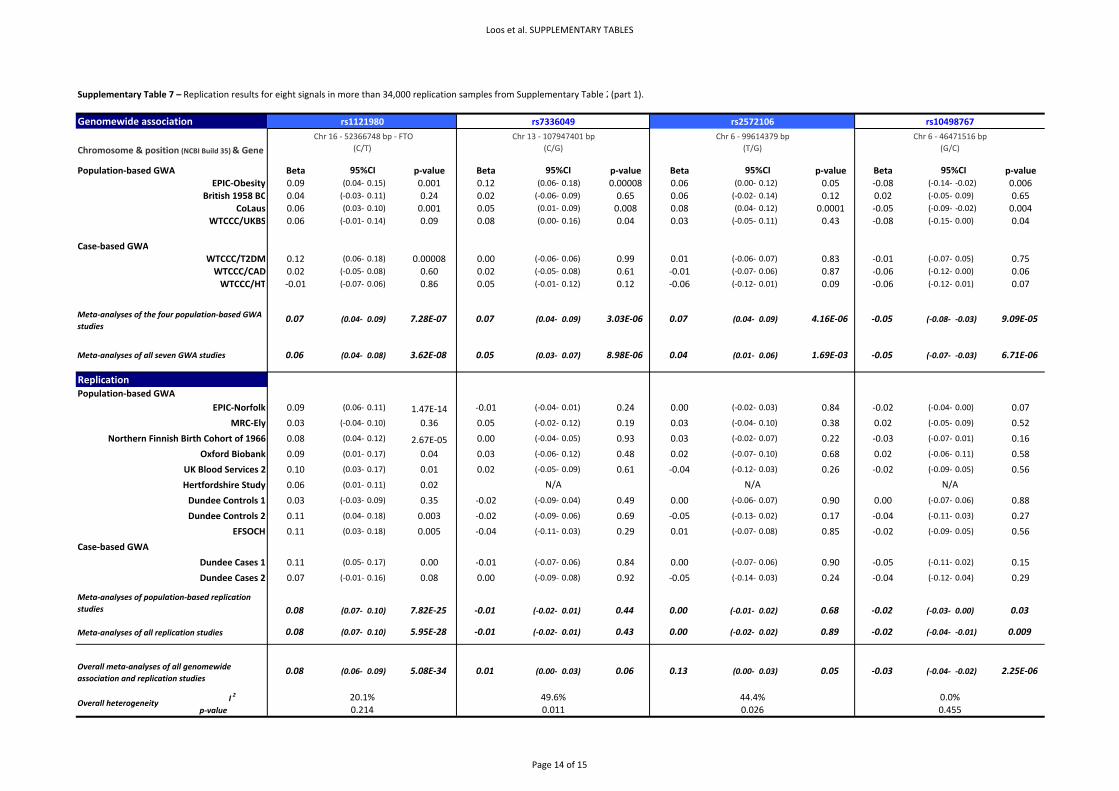
Loos et al. SUPPLEMENTARY TABLES
Supplementary Table 7 – Replication results for eight signals in more than 34,000 replication samples from Supplementary Table 2(part 1).
Genomewide association
Population‐based GWA Beta p‐value Beta p‐value Beta p‐value Beta p‐valueEPIC‐Obesity 0.09 (0.04‐ 0.15) 0.001 0.12 (0.06‐ 0.18) 0.00008 0.06 (0.00‐ 0.12) 0.05 ‐0.08 (‐0.14‐ ‐0.02) 0.006
British 1958 BC 0.04 (‐0.03‐ 0.11) 0.24 0.02 (‐0.06‐ 0.09) 0.65 0.06 (‐0.02‐ 0.14) 0.12 0.02 (‐0.05‐ 0.09) 0.65CoLaus 0.06 (0.03‐ 0.10) 0.001 0.05 (0.01‐ 0.09) 0.008 0.08 (0.04‐ 0.12) 0.0001 ‐0.05 (‐0.09‐ ‐0.02) 0.004
WTCCC/UKBS 0.06 (‐0.01‐ 0.14) 0.09 0.08 (0.00‐ 0.16) 0.04 0.03 (‐0.05‐ 0.11) 0.43 ‐0.08 (‐0.15‐ 0.00) 0.04
Case‐based GWAWTCCC/T2DM 0.12 (0.06‐ 0.18) 0.00008 0.00 (‐0.06‐ 0.06) 0.99 0.01 (‐0.06‐ 0.07) 0.83 ‐0.01 (‐0.07‐ 0.05) 0.75WTCCC/CAD 0.02 (‐0.05‐ 0.08) 0.60 0.02 (‐0.05‐ 0.08) 0.61 ‐0.01 (‐0.07‐ 0.06) 0.87 ‐0.06 (‐0.12‐ 0.00) 0.06WTCCC/HT ‐0.01 (‐0.07‐ 0.06) 0.86 0.05 (‐0.01‐ 0.12) 0.12 ‐0.06 (‐0.12‐ 0.01) 0.09 ‐0.06 (‐0.12‐ 0.01) 0.07
0.07 (0.04‐ 0.09) 7.28E‐07 0.07 (0.04‐ 0.09) 3.03E‐06 0.07 (0.04‐ 0.09) 4.16E‐06 ‐0.05 (‐0.08‐ ‐0.03) 9.09E‐05
0.06 (0.04‐ 0.08) 3.62E‐08 0.05 (0.03‐ 0.07) 8.98E‐06 0.04 (0.01‐ 0.06) 1.69E‐03 ‐0.05 (‐0.07‐ ‐0.03) 6.71E‐06
ReplicationPopulation‐based GWA
EPIC‐Norfolk 0.09 (0.06‐ 0.11) 1.47E‐14 ‐0.01 (‐0.04‐ 0.01) 0.24 0.00 (‐0.02‐ 0.03) 0.84 ‐0.02 (‐0.04‐ 0.00) 0.07
MRC‐Ely 0.03 (‐0.04‐ 0.10) 0.36 0.05 (‐0.02‐ 0.12) 0.19 0.03 (‐0.04‐ 0.10) 0.38 0.02 (‐0.05‐ 0.09) 0.52
Northern Finnish Birth Cohort of 1966 0.08 (0.04‐ 0.12) 2.67E‐05 0.00 (‐0.04‐ 0.05) 0.93 0.03 (‐0.02‐ 0.07) 0.22 ‐0.03 (‐0.07‐ 0.01) 0.16
Oxford Biobank 0.09 (0.01‐ 0.17) 0.04 0.03 (‐0.06‐ 0.12) 0.48 0.02 (‐0.07‐ 0.10) 0.68 0.02 (‐0.06‐ 0.11) 0.58
UK Blood Services 2 0.10 (0.03‐ 0.17) 0.01 0.02 (‐0.05‐ 0.09) 0.61 ‐0.04 (‐0.12‐ 0.03) 0.26 ‐0.02 (‐0.09‐ 0.05) 0.56
Hertfordshire Study 0.06 (0.01‐ 0.11) 0.02
Dundee Controls 1 0.03 (‐0.03‐ 0.09) 0.35 ‐0.02 (‐0.09‐ 0.04) 0.49 0.00 (‐0.06‐ 0.07) 0.90 0.00 (‐0.07‐ 0.06) 0.88
Dundee Controls 2 0.11 (0.04‐ 0.18) 0.003 ‐0.02 (‐0.09‐ 0.06) 0.69 ‐0.05 (‐0.13‐ 0.02) 0.17 ‐0.04 (‐0.11‐ 0.03) 0.27
EFSOCH 0.11 (0.03‐ 0.18) 0.005 ‐0.04 (‐0.11‐ 0.03) 0.29 0.01 (‐0.07‐ 0.08) 0.85 ‐0.02 (‐0.09‐ 0.05) 0.56
Case‐based GWA
Dundee Cases 1 0.11 (0.05‐ 0.17) 0.00 ‐0.01 (‐0.07‐ 0.06) 0.84 0.00 (‐0.07‐ 0.06) 0.90 ‐0.05 (‐0.11‐ 0.02) 0.15
Dundee Cases 2 0.07 (‐0.01‐ 0.16) 0.08 0.00 (‐0.09‐ 0.08) 0.92 ‐0.05 (‐0.14‐ 0.03) 0.24 ‐0.04 (‐0.12‐ 0.04) 0.29
0.08 (0.07‐ 0.10) 7.82E‐25 ‐0.01 (‐0.02‐ 0.01) 0.44 0.00 (‐0.01‐ 0.02) 0.68 ‐0.02 (‐0.03‐ 0.00) 0.03
0.08 (0.07‐ 0.10) 5.95E‐28 ‐0.01 (‐0.02‐ 0.01) 0.43 0.00 (‐0.02‐ 0.02) 0.89 ‐0.02 (‐0.04‐ ‐0.01) 0.009
0.08 (0.06‐ 0.09) 5.08E‐34 0.01 (0.00‐ 0.03) 0.06 0.13 (0.00‐ 0.03) 0.05 ‐0.03 (‐0.04‐ ‐0.02) 2.25E‐06
I 2
p‐value
Meta‐analyses of all replication studies
N/A N/AN/A
Meta‐analyses of the four population‐based GWA studies
Meta‐analyses of all seven GWA studies
Chromosome & position (NCBI Build 35) & Gene
Meta‐analyses of population‐based replication studies
rs1121980 rs7336049 rs2572106Chr 13 ‐ 107947401 bp
(C/G)Chr 6 ‐ 99614379 bp
(T/G) Chr 16 ‐ 52366748 bp ‐ FTO
(C/T)
0.0%
95%CI
Chr 6 ‐ 46471516 bp(G/C)
95%CI 95%CI 95%CI
0.455
rs10498767
Overall heterogeneity0.214 0.011
Overall meta‐analyses of all genomewide association and replication studies
49.6% 44.4%20.1%0.026
Page 14 of 15

Loos et al. SUPPLEMENTARY TABLES
Supplementary Table 7 – Replication results for eight signals in more than 34,000 replication samples from Supplementary Table 2(part 2).
Genomewide association
Population‐based GWA Beta p‐value Beta p‐value Beta p‐value Beta p‐valueEPIC‐Obesity ‐0.03 (‐0.10‐ 0.05) 0.50 ‐0.05 (‐0.13‐ 0.03) 0.21 0.04 (‐0.02‐ 0.10) 0.22 0.07 (0.01‐ 0.13) 0.01
British 1958 BC ‐0.13 (‐0.22‐ ‐0.03) 0.008 ‐0.05 (‐0.15‐ 0.04) 0.27 0.02 (‐0.05‐ 0.09) 0.61 0.04 (‐0.03‐ 0.11) 0.25CoLaus ‐0.08 (‐0.13‐ ‐0.03) 0.001 ‐0.08 (‐0.13‐ ‐0.03) 0.004 0.08 (0.04‐ 0.12) 0.00003 0.05 (0.01‐ 0.09) 0.0066
WTCCC/UKBS 0.02 (‐0.08‐ 0.11) 0.75 ‐0.07 (‐0.16‐ 0.03) 0.18 0.01 (‐0.07‐ 0.08) 0.84 ‐0.05 (‐0.12‐ 0.02) 0.19
Case‐based GWAWTCCC/T2DM ‐0.15 (‐0.23‐ ‐0.06) 0.001 ‐0.09 (‐0.17‐ ‐0.01) 0.02 0.07 (0.01‐ 0.13) 0.03 0.04 (‐0.02‐ 0.10) 0.21WTCCC/CAD ‐0.03 (‐0.12‐ 0.06) 0.50 ‐0.06 (‐0.15‐ 0.03) 0.20 0.03 (‐0.04‐ 0.09) 0.42 0.06 (‐0.00‐ 0.12) 0.06WTCCC/HT ‐0.03 (‐0.12‐ 0.05) 0.47 ‐0.05 (‐0.14‐ 0.04) 0.24 0.03 (‐0.03‐ 0.09) 0.36 0.01 (‐0.05‐ 0.08) 0.66
‐0.06 (‐0.10‐ ‐0.03) 4.50E‐04 ‐0.07 (‐0.10‐ ‐0.03) 4.41E‐04 0.05 (0.03‐ 0.08) 1.17E‐04 0.05 (0.03 ‐ 0.08) 6.72E‐05
‐0.07 (‐0.09‐ ‐0.04) 7.09E‐06 ‐0.07 (‐0.10‐ ‐0.04) 7.77E‐06 0.05 (0.03‐ 0.07) 9.39E‐06 0.05 (0.03 ‐ 0.07) 9.80E‐06
ReplicationPopulation‐based GWA
EPIC‐Norfolk ‐0.03 (‐0.06‐ 0.00) 0.05 ‐0.01 (‐0.04‐ 0.02) 0.68 ‐0.01 (‐0.03‐ 0.01) 0.32 ‐0.01 (‐0.03‐ 0.01) 0.41
MRC‐Ely ‐0.04 (‐0.13‐ 0.05) 0.42 ‐0.05 (‐0.14‐ 0.05) 0.31 0.02 (‐0.05‐ 0.09) 0.65 ‐0.02 (‐0.08‐ 0.05) 0.65
Northern Finnish Birth Cohort of 1966 ‐0.04 (‐0.09‐ 0.02) 0.19 0.04 (‐0.01‐ 0.09) 0.10 ‐0.05 (‐0.09‐ ‐0.01) 0.008 0.02 (‐0.02‐ 0.06) 0.32
Oxford Biobank 0.07 (‐0.05‐ 0.20) 0.25 ‐0.04 (‐0.15‐ 0.07) 0.50 0.01 (‐0.08‐ 0.09) 0.90 0.07 (‐0.02‐ 0.15) 0.12
UK Blood Services 2 ‐0.04 (‐0.13‐ 0.06) 0.46 0.05 (‐0.05‐ 0.14) 0.34 ‐0.03 (‐0.10‐ 0.05) 0.49 0.05 (‐0.02‐ 0.12) 0.19
Hertfordshire Study
Dundee Controls 1 ‐0.06 (‐0.15‐ 0.02) 0.14 0.02 (‐0.06‐ 0.11) 0.61 ‐0.08 (‐0.15‐ ‐0.02) 0.01 0.06 (‐0.01‐ 0.12) 0.09
Dundee Controls 2 0.06 (‐0.04‐ 0.16) 0.24 ‐0.02 (‐0.12‐ 0.08) 0.69 0.03 (‐0.05‐ 0.10) 0.46 0.03 (‐0.04‐ 0.10) 0.42
EFSOCH 0.03 (‐0.06‐ 0.13) 0.51 0.07 (‐0.03‐ 0.16) 0.17 0.03 (‐0.04‐ 0.11) 0.34
Case‐based GWA
Dundee Cases 1 ‐0.01 (‐0.09‐ 0.08) 0.87 ‐0.01 (‐0.10‐ 0.07) 0.73 ‐0.06 (‐0.12‐ 0.00) 0.06 0.00 (‐0.06‐ 0.06) 0.96
Dundee Cases 2 0.02 (‐0.10‐ 0.13) 0.77 0.00 (‐0.11‐ 0.11) 1.00 ‐0.02 (‐0.11‐ 0.06) 0.56 0.05 (‐0.03‐ 0.13) 0.22
‐0.02 (‐0.04‐ 0.00) 0.04 0.01 (‐0.02‐ 0.03) 0.54 ‐0.02 (‐0.04‐ 0.00) 0.02 0.01 (‐0.01‐ 0.03) 0.28
‐0.02 (‐0.04‐ 0.00) 0.05 0.01 (‐0.02‐ 0.03) 0.61 ‐0.02 (‐0.04‐ ‐0.01) 0.005 0.01 (0.01‐ 0.03) 0.21
‐0.04 (‐0.05‐ ‐0.02) 2.92E‐05 ‐0.02 (‐0.04‐ 0.00) 0.036 0.00 (‐0.01‐ 0.02) 0.75 0.02 (0.01‐ 0.03) 0.002
I 2
p‐value
* In EPIC‐Norfolk and MRC‐Ely, rs8039796 was genotyped instead, because the rs2679120 failed design (rs8039796‐rs2679120 r2=1)
** In EPIC‐Norfolk and MRC‐Ely, rs2251155 was genotyped instead, because the rs7212681 failed design rs2251155‐rs7212681 r2=1)
32.7%0.095
34.1%0.084
66.5%<0.001
36.9%0.064
Overall heterogeneity
N/A
Overall meta‐analyses of all genomewide association and replication studies
rs7212681**rs748192 rs4623795 rs2679120*Chr 3 ‐ 5864280 bp
(A/T)Chromosome & position (NCBI Build 35) & Gene
95%CI95%CI 95%CI
Chr 17 ‐ 5132251 bp ‐ RABEP1(T/G)
Chr 10 ‐ 7691915 bp ‐ ITIH5 (G/C)
Chr 15 ‐ 63284449 bp ‐ CILP(G/C)
Meta‐analyses of the four population‐based GWA studies
Meta‐analyses of all seven GWA studies
N/A
95%CI
N/A
Meta‐analyses of population‐based replication studies
Meta‐analyses of all replication studies
N/A N/A
Page 15 of 15

SUPPLEMENTARY FIGURES
Association studies involving over 90,000 people demonstrate that common variants near to MC4R influence fat mass, weight and risk of obesity.

Case‐series collections• WTCCC/T2D (type 2 diabets) (n=1,924)• WTCCC/CAD (coronary artery disease)
(n=1,988)• WTCCC/HT (hypertension) (n=1,952)
Case‐series collections• WTCCC/T2D (type 2 diabets) (n=1,924)• WTCCC/CAD (coronary artery disease)
(n=1,988)• WTCCC/HT (hypertension) (n=1,952)
n= 5,864344,883 SNPs
Replication Population‐based Cohorts from GIANT consortium
• SardiNIA (n=4,301)• KORA (n=1,642)• PLCO (n=2,238)• NHS (Nurses Health Study) (n=2,265)• DGI controls (n=1,503)• FUSION controls (n=1,291)
Replication Population‐based Cohorts from GIANT consortium
• SardiNIA (n=4,301)• KORA (n=1,642)• PLCO (n=2,238)• NHS (Nurses Health Study) (n=2,265)• DGI controls (n=1,503)• FUSION controls (n=1,291)
n=13,240
Replication Population‐based Cohorts• EPIC‐Norfolk (n=16,615)• MRC–Ely (n=1,725)• Northern Finland Birth Cohort NFBC1966 (n=5,066)• Oxford Biobank (n=1,174)• UK Blood Services 2 (n=1,646)• ALSPAC mothers (n=6,264)• Hertfordshire study (n=2,881)• Dundee controls 1 (n=2,037)• Dundee controls 2 (n=1,559)• EFSOCH parents (n=1,750)
Replication Population‐based Cohorts• EPIC‐Norfolk (n=16,615)• MRC–Ely (n=1,725)• Northern Finland Birth Cohort NFBC1966 (n=5,066)• Oxford Biobank (n=1,174)• UK Blood Services 2 (n=1,646)• ALSPAC mothers (n=6,264)• Hertfordshire study (n=2,881)• Dundee controls 1 (n=2,037)• Dundee controls 2 (n=1,559)• EFSOCH parents (n=1,750)
n=40,717
Replication Case‐series• Dundee T2D cases 1 (n=2,022)• Dundee T2D cases 2 (n=1,103)• YT2D‐OXGN cases (n=632)
Replication Case‐series• Dundee T2D cases 1 (n=2,022)• Dundee T2D cases 2 (n=1,103)• YT2D‐OXGN cases (n=632)
n=3,757
Replication Case‐series from GIANT consortium• DGI T2D cases (n=1,544)• FUSION T2D cases (n=1,094)
Replication Case‐series from GIANT consortium• DGI T2D cases (n=1,544)• FUSION T2D cases (n=1,094)
n=2,638
Population‐based Cohorts• EPIC‐Obesity Study (n=2,415)• CoLaus (n=5,633) • British 1958 Birth Cohort (n=1,479)• WTCCC/UK Blood Services 1 (n=1,485)
Population‐based Cohorts• EPIC‐Obesity Study (n=2,415)• CoLaus (n=5,633) • British 1958 Birth Cohort (n=1,479)• WTCCC/UK Blood Services 1 (n=1,485)
n= 11,012359,062 SNPs
Population based childhood cohort• ALSPAC Population based childhood cohort• ALSPAC
Childhood/Adolescent obesity case/control samples• SCOOP‐UK (n=1,028) vs ALSPAC (as controls)• Essen Obesity Study: young adult controls (n=442)
vs severely‐obese cases (n=487) • French normal‐weight adolescents (n=1,347)
vs severely obese children (n=1,291)• Essen Obesity Family Study: 660 families with at
least one extremely obese child/adolescent and their parents (n=2,280)
n=12,863
Initial genome wide association studies
Replication of adult BMI in population‐basedor case‐series data sets
Other samples studied
Adult obesity Case‐control study• French controls (n=1,870) vs
Morbidly obese cases (n=896)
Adult obesity Case‐control study• French controls (n=1,870) vs
Morbidly obese cases (n=896)
n=2,766
n=5,988
Supplementary Figure 1: Flow‐chart of study design

A.
B.
rs1121980
rs733
6049
rs17782313rs10498767rs748192 rs4
6237
95
rs267
9120
rs7212681
rs2572106 rs17700633
rs1121980
rs7336049
Supplementary Figure 2: Plots showing the association of single‐nucleotide polymorphisms (SNPs) with BMI in the genomewide association analyses of (A) all studies (n = 16,876) and of (B) population‐based studies only (n = 11,012). The −log P values represent the significance of the association of each SNP with BMI Z‐score under an additive model using the inverse‐variance weighted method to meta‐analyse the data. Only SNPs of sufficient quality (see the Supplementary Information) are shown.
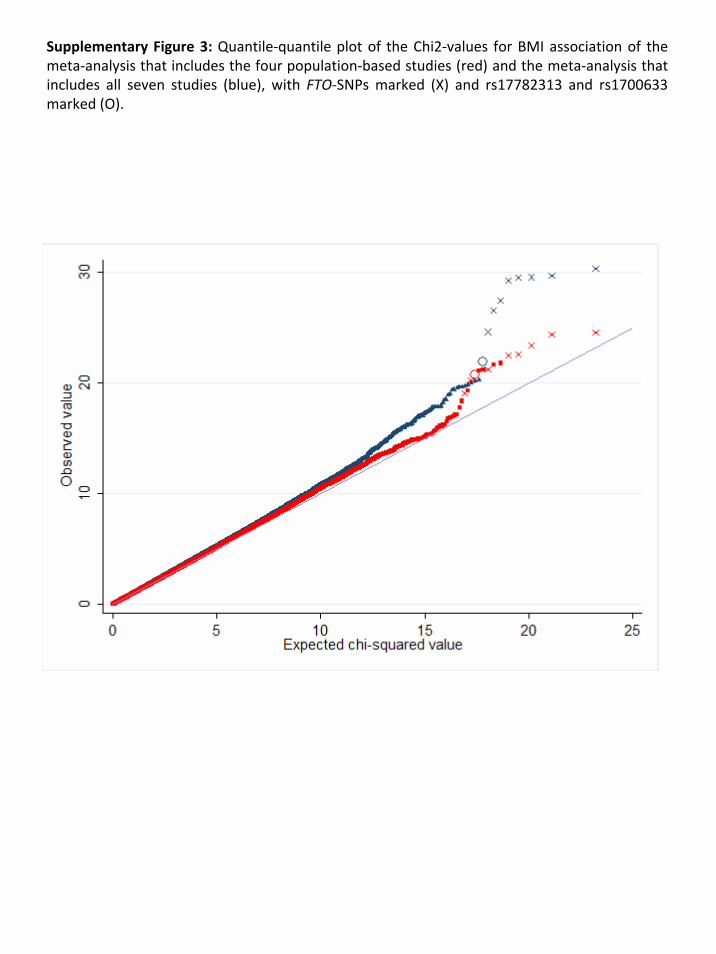
Supplementary Figure 3: Quantile‐quantile plot of the Chi2‐values for BMI association of the meta‐analysis that includes the four population‐based studies (red) and the meta‐analysis that includes all seven studies (blue), with FTO‐SNPs marked (X) and rs17782313 and rs1700633 marked (O).
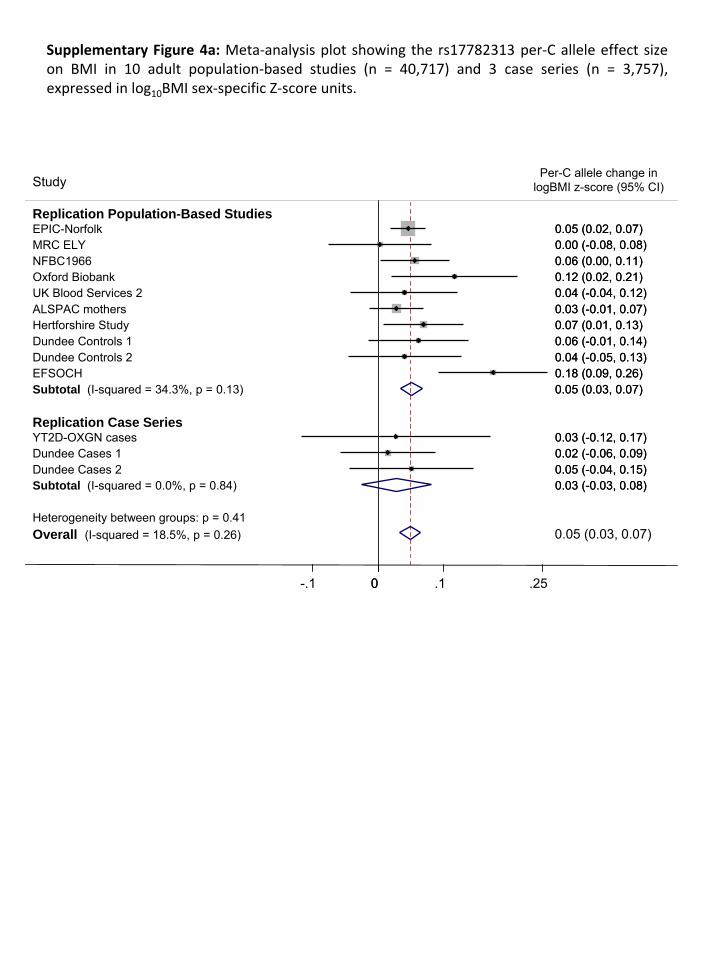
Heterogeneity between groups: p = 0.41Overall (I-squared = 18.5%, p = 0.26)
Dundee Cases 1
Study
Dundee Cases 2Subtotal (I-squared = 0.0%, p = 0.84)
Hertforshire Study
YT2D-OXGN casesReplication Case Series
EPIC-Norfolk
Dundee Controls 1
EFSOCHDundee Controls 2
UK Blood Services 2ALSPAC mothers
NFBC1966Oxford Biobank
MRC ELY
Subtotal (I-squared = 34.3%, p = 0.13)
Replication Population-Based Studies
0.02 (-0.06, 0.09)0.05 (-0.04, 0.15)0.03 (-0.03, 0.08)
0.07 (0.01, 0.13)
0.03 (-0.12, 0.17)
0.05 (0.02, 0.07)
0.06 (-0.01, 0.14)
0.18 (0.09, 0.26)0.04 (-0.05, 0.13)
0.04 (-0.04, 0.12)0.03 (-0.01, 0.07)
0.06 (0.00, 0.11)0.12 (0.02, 0.21)
0.00 (-0.08, 0.08)
0.05 (0.03, 0.07)
0.05 (0.03, 0.07)
0.02 (-0.06, 0.09)
Per-C allele change in logBMI z-score (95% CI)
0.05 (-0.04, 0.15)0.03 (-0.03, 0.08)
0.07 (0.01, 0.13)
0.03 (-0.12, 0.17)
0.05 (0.02, 0.07)
0.06 (-0.01, 0.14)
0.18 (0.09, 0.26)0.04 (-0.05, 0.13)
0.04 (-0.04, 0.12)0.03 (-0.01, 0.07)
0.06 (0.00, 0.11)0.12 (0.02, 0.21)
0.00 (-0.08, 0.08)
0.05 (0.03, 0.07)
0-.1 0 .1 .25
Supplementary Figure 4a: Meta‐analysis plot showing the rs17782313 per‐C allele effect size on BMI in 10 adult population‐based studies (n = 40,717) and 3 case series (n = 3,757), expressed in log10BMI sex‐specific Z‐score units.

Heterogeneity between groups: p = 0.46Overall (I-squared = 41%, p = 0.06)
EFSOCH
Study ID
Hertfordshire Study
Dundee Controls 2
Replication Case Series
Dundee Controls 1
YT2D-OXGN Cases
Oxford Biobank
Dundee Cases 1
MRC-ELY
Subtotal (I-squared = 52%, p = 0.03)
Dundee Cases 2
Subtotal (I-squared = 0.0%, p = 0.58)
UK Blood Services 2ALSPAC mothers
NFBC1966
Replication population-based StudiesEPIC-Norfolk
0.03 (0.01, 0.04)
0.12 (0.04, 0.20)
Per-A allele change in logBMI z-score (95% CI)
0.03 (-0.03, 0.09)
-0.05 (-0.12, 0.03)0.05 (-0.02, 0.12)
0.04 (-0.09, 0.17)
-0.09 (-0.18, 0.01)
-0.02 (-0.08, 0.05)
-0.01 (-0.09, 0.06)
0.03 (0.01, 0.04)
0.04 (-0.05, 0.12)
0.01 (-0.04, 0.06)
0.06 (-0.02, 0.13)0.05 (0.01, 0.08)
0.04 (-0.01, 0.09)
0.02 (-0.00, 0.04)
0.03 (0.01, 0.04)
0.12 (0.04, 0.20)
0.03 (-0.03, 0.09)
-0.05 (-0.12, 0.03)0.05 (-0.02, 0.12)
0.04 (-0.09, 0.17)
-0.09 (-0.18, 0.01)
-0.02 (-0.08, 0.05)
-0.01 (-0.09, 0.06)
0.03 (0.01, 0.04)
0.04 (-0.05, 0.12)
0.01 (-0.04, 0.06)
0.06 (-0.02, 0.13)0.05 (0.01, 0.08)
0.04 (-0.01, 0.09)
0.02 (-0.00, 0.04)
0-.1 0 .1 .25
Supplementary Figure 4b: Meta‐analysis plot showing the rs17700633 per‐A allele effect size on BMI in 10 adult population‐based studies (n = 40,717) and 3 case series (n = 3,757), expressed in log10BMI sex‐specific Z‐score units.
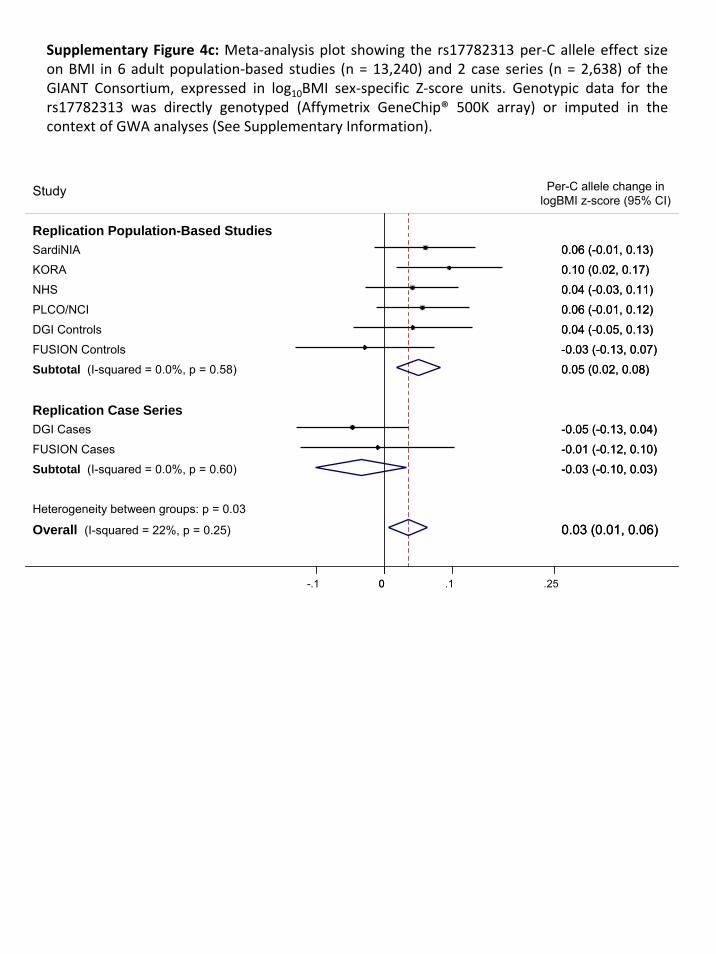
Supplementary Figure 4c: Meta‐analysis plot showing the rs17782313 per‐C allele effect size on BMI in 6 adult population‐based studies (n = 13,240) and 2 case series (n = 2,638) of the GIANT Consortium, expressed in log10BMI sex‐specific Z‐score units. Genotypic data for the rs17782313 was directly genotyped (Affymetrix GeneChip® 500K array) or imputed in the context of GWA analyses (See Supplementary Information).
Heterogeneity between groups: p = 0.03
Overall (I-squared = 22%, p = 0.25)
Replication Population-Based Studies
FUSION Cases
Replication Case Series
Subtotal (I-squared = 0.0%, p = 0.60)
Study
KORA
SardiNIA
NHS
FUSION Controls
DGI Cases
PLCO/NCI
DGI Controls
Subtotal (I-squared = 0.0%, p = 0.58)
0.03 (0.01, 0.06)
-0.01 (-0.12, 0.10)
-0.03 (-0.10, 0.03)
0.10 (0.02, 0.17)
0.06 (-0.01, 0.13)
0.04 (-0.03, 0.11)
-0.03 (-0.13, 0.07)
-0.05 (-0.13, 0.04)
0.06 (-0.01, 0.12)
0.04 (-0.05, 0.13)
0.05 (0.02, 0.08)
0.03 (0.01, 0.06)
-0.01 (-0.12, 0.10)
-0.03 (-0.10, 0.03)
Per-C allele change in logBMI z-score (95% CI)
0.10 (0.02, 0.17)
0.06 (-0.01, 0.13)
0.04 (-0.03, 0.11)
-0.03 (-0.13, 0.07)
-0.05 (-0.13, 0.04)
0.06 (-0.01, 0.12)
0.04 (-0.05, 0.13)
0.05 (0.02, 0.08)
0-.1 0 .1 .25

Heterogeneity between groups: p = 0.25
Overall (I-squared = 0.0%, p = 0.63)
Subtotal (I-squared = 2.9%, p = 0.31)
SardiNIA
FUSION Cases
Study
Subtotal (I-squared = 0.0%, p = 0.72)
FUSION Controls
DGI Controls
KORA
PLCO/NCI
Replication Case Series
NHSReplication Population-Based Studies
DGI Cases
0.01 (-0.05, 0.07)
0.05 (-0.02, 0.12)
0.05 (-0.05, 0.14)
0.05 (0.02, 0.08)
0.04 (-0.05, 0.13)
0.04 (-0.04, 0.12)
0.09 (0.01, 0.16)
0.01 (-0.05, 0.07)
0.06 (0.00, 0.13)
-0.02 (-0.09, 0.06)
0.04 (0.01, 0.07)
0.01 (-0.05, 0.07)
0.05 (-0.02, 0.12)
0.05 (-0.05, 0.14)
Per-A allele change in logBMI z-score (95% CI)
0.05 (0.02, 0.08)
0.04 (-0.05, 0.13)
0.04 (-0.04, 0.12)
0.09 (0.01, 0.16)
0.01 (-0.05, 0.07)
0.06 (0.00, 0.13)
-0.02 (-0.09, 0.06)
0-.1 0 .1 .25
Supplementary Figure 4d: Meta‐analysis plot showing the rs17700633 per‐A allele effect size on BMI in 10 adult population‐based studies (n = 13,240) and 3 case series (n = 2,638) of the GIANT Consortium, expressed in log10BMI sex‐specific Z‐score units. Genotypic data for the rs17782313 was directly genotyped (Affymetrix GeneChip® 500K array) or imputed in the context of GWA analyses (See Supplementary Information).

Supplementary Figure 4e: Meta‐analysis plot showing the rs17700633 per‐A allele effect size on BMI in 77,228 adults, expressed in sex‐specific Z‐score units for log10BMI.
Heterogeneity between groups: p = 0.05Overall (I-squared = 25.9%, p = 0.11)
British 1958 BC
Subtotal (I-squared = 0.0%, p = 0.71)
Dundee Cases 2
Replication - Population based & Controls
EFSOCH
FUSION Cases
ALSPAC mothers
Dundee Cases 1
UK Blood Services 1
WTCCC/CADWTCCC/HT
Dundee Controls 1
SardiNIA
Subtotal (I-squared = 35.2%, p = 0.08)FUSION Controls
YT2D-OXGN Cases
PLCO/NCI
DGI Cases
KORA
EPIC-Norfolk
Subtotal (I-squared = 0.0%, p = 0.56)
EPIC-Obesity
Study
Hertfordshire Study
UK Blood Services 2
Replication Case studies
CoLaus
MRC-ELY
GWA - Case studies
WTCCC/T2DM
Subtotal (I-squared = 0.0%, p = 0.58)
Oxford Biobank
GWA - Population based
NFBC1966
DGI Controls
Dundee Controls 2
NHS
0.03 (0.02, 0.04)
0.10 (0.02, 0.18)
0.01 (-0.03, 0.05)
0.04 (-0.05, 0.12)
0.12 (0.04, 0.20)
0.05 (-0.05, 0.14)
0.05 (0.01, 0.08)
-0.02 (-0.08, 0.05)
0.02 (-0.05, 0.10)
change in logBMI
-0.01 (-0.08, 0.06)0.01 (-0.06, 0.08)
0.05 (-0.02, 0.12)
0.05 (-0.02, 0.12)
0.03 (0.02, 0.05)0.04 (-0.05, 0.13)
0.04 (-0.09, 0.17)
0.01 (-0.05, 0.07)
-0.02 (-0.09, 0.06)
0.09 (0.01, 0.16)
0.02 (-0.00, 0.04)
0.01 (-0.03, 0.05)
0.08 (0.01, 0.14)
z-score (95% CI)
0.03 (-0.03, 0.09)
0.06 (-0.02, 0.13)
0.07 (0.03, 0.11)
-0.01 (-0.09, 0.06)
0.04 (-0.03, 0.11)
0.07 (0.04, 0.10)
-0.09 (-0.18, 0.01)0.04 (-0.01, 0.09)
0.04 (-0.04, 0.12)
-0.05 (-0.12, 0.03)
0.06 (0.00, 0.13)
0.03 (0.02, 0.04)
Per-A allele
0.10 (0.02, 0.18)
0.01 (-0.03, 0.05)
0.04 (-0.05, 0.12)
0.12 (0.04, 0.20)
0.05 (-0.05, 0.14)
0.05 (0.01, 0.08)
-0.02 (-0.08, 0.05)
0.02 (-0.05, 0.10)
-0.01 (-0.08, 0.06)0.01 (-0.06, 0.08)
0.05 (-0.02, 0.12)
0.05 (-0.02, 0.12)
0.03 (0.02, 0.05)0.04 (-0.05, 0.13)
0.04 (-0.09, 0.17)
0.01 (-0.05, 0.07)
-0.02 (-0.09, 0.06)
0.09 (0.01, 0.16)
0.02 (-0.00, 0.04)
0.01 (-0.03, 0.05)
0.08 (0.01, 0.14)
0.03 (-0.03, 0.09)
0.06 (-0.02, 0.13)
0.07 (0.03, 0.11)
-0.01 (-0.09, 0.06)
0.04 (-0.03, 0.11)
0.07 (0.04, 0.10)
-0.09 (-0.18, 0.01)0.04 (-0.01, 0.09)
0.04 (-0.04, 0.12)
-0.05 (-0.12, 0.03)
0.06 (0.00, 0.13)
0-.25 -.1 0 .1 .25

Supplementary Figure 4f: Meta‐analysis plot showing the rs17700633 per‐A allele effect size (per‐A allele effect: 0.019 Z‐score [0.007‐0.031], p=0.002) on BMI in 77,228 adults, expressed in sex‐specific Z‐score units for log10BMI, adjusted for rs17782313.
Heterogeneity between groups: p = 0.18
Overall (I-squared = 21%, p = 0.17)
FUSION Controls
Oxford Biobank
Replication Case Series
KORA
DGI Cases
Study
Subtotal (I-squared = 0.0%, p = 0.47)
NHS
WTCCC/HT
MRC ELYEPIC-Norfolk
YT2D-OXGN
Subtotal (I-squared = 31%, p = 0.12)
Subtotal (I-squared = 31%, p = 0.24)
EPIC-Obesity
PLCO
WTCCC/CAD
DGI Controls
GWA Case Series
FUSION Cases
NFBC1966
British 1958 BC
Dundee Controls 1
UK Blood Services 1
WTCCC/T2DM
Subtotal (I-squared = 0.0%, p = 0.73)
UK Blood Ser 2
Hertfordshire Study
Dundee Cases 2
ALSPAC mothers
Dundee Cases 1
Replication Population-Based Studies
SardiNIA
CoLaus
Dundee Controls 2
EFSOCH
GWA Population-Based Studies
0.02 (0.01, 0.03)
0.05 (-0.04, 0.14)
-0.09 (-0.18, 0.00)
0.06 (-0.02, 0.14)
-0.00 (-0.09, 0.08)
Z-score (95% CI)
0.05 (0.02, 0.08)
0.06 (-0.01, 0.13)
-0.05 (-0.12, 0.03)
-0.02 (-0.10, 0.06)0.00 (-0.02, 0.03)
0.04 (-0.10, 0.18)
change in log10BMI
0.02 (0.00, 0.03)
-0.00 (-0.05, 0.04)
0.06 (-0.01, 0.13)
-0.01 (-0.08, 0.05)
-0.01 (-0.09, 0.06)
0.03 (-0.05, 0.11)
0.05 (-0.05, 0.15)
0.01 (-0.05, 0.06)
0.07 (-0.01, 0.16)
0.05 (-0.03, 0.12)
-0.02 (-0.10, 0.07)
0.04 (-0.03, 0.12)
0.00 (-0.04, 0.04)
0.06 (-0.03, 0.14)
0.01 (-0.05, 0.07)
0.02 (-0.08, 0.11)
0.05 (0.01, 0.09)
-0.03 (-0.10, 0.04)
0.05 (-0.02, 0.12)
0.05 (0.01, 0.10)
-0.07 (-0.16, 0.01)
0.06 (-0.02, 0.15)
0.02 (0.01, 0.03)
0.05 (-0.04, 0.14)
-0.09 (-0.18, 0.00)
0.06 (-0.02, 0.14)
-0.00 (-0.09, 0.08)
0.05 (0.02, 0.08)
0.06 (-0.01, 0.13)
-0.05 (-0.12, 0.03)
-0.02 (-0.10, 0.06)0.00 (-0.02, 0.03)
0.04 (-0.10, 0.18)
0.02 (0.00, 0.03)
-0.00 (-0.05, 0.04)
0.06 (-0.01, 0.13)
-0.01 (-0.08, 0.05)
-0.01 (-0.09, 0.06)
0.03 (-0.05, 0.11)
0.05 (-0.05, 0.15)
0.01 (-0.05, 0.06)
0.07 (-0.01, 0.16)
0.05 (-0.03, 0.12)
-0.02 (-0.10, 0.07)
0.04 (-0.03, 0.12)
0.00 (-0.04, 0.04)
0.06 (-0.03, 0.14)
0.01 (-0.05, 0.07)
0.02 (-0.08, 0.11)
0.05 (0.01, 0.09)
-0.03 (-0.10, 0.04)
0.05 (-0.02, 0.12)
0.05 (0.01, 0.10)
-0.07 (-0.16, 0.01)
0.06 (-0.02, 0.15)
Per-A allele
0-.1 0 .1 .25
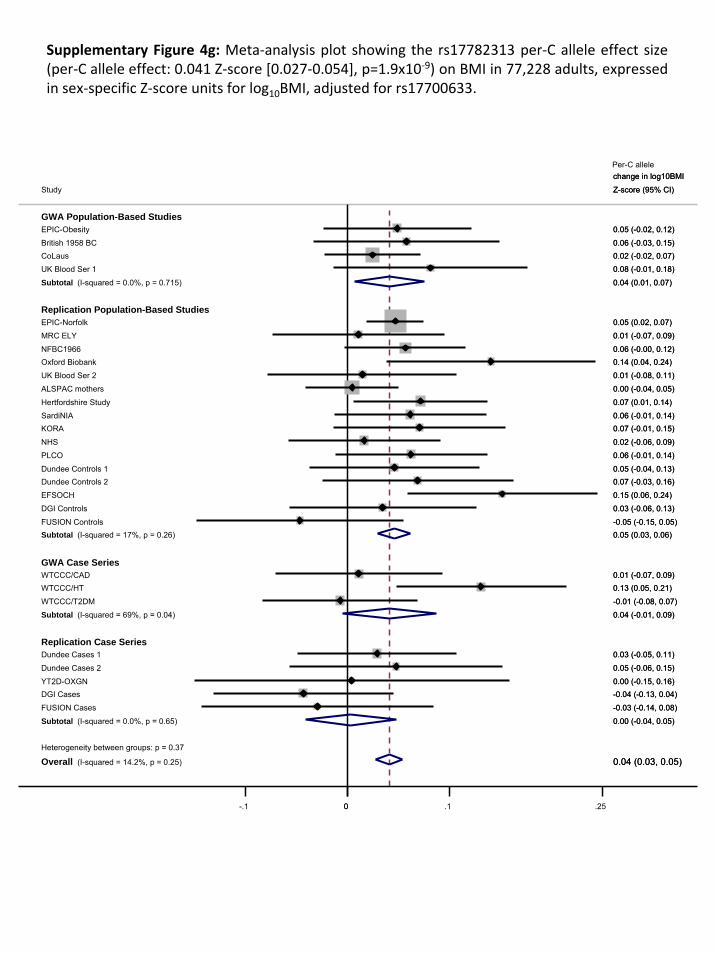
Supplementary Figure 4g: Meta‐analysis plot showing the rs17782313 per‐C allele effect size (per‐C allele effect: 0.041 Z‐score [0.027‐0.054], p=1.9x10‐9) on BMI in 77,228 adults, expressed in sex‐specific Z‐score units for log10BMI, adjusted for rs17700633.
Heterogeneity between groups: p = 0.37
Overall (I-squared = 14.2%, p = 0.25)
NHS
Subtotal (I-squared = 0.0%, p = 0.65)
YT2D-OXGN
Hertfordshire Study
Subtotal (I-squared = 69%, p = 0.04)
Replication Case Series
Replication Population-Based Studies
SardiNIA
ALSPAC mothers
Dundee Controls 2
UK Blood Ser 2
CoLaus
MRC ELY
EPIC-Norfolk
EPIC-Obesity
Oxford Biobank
WTCCC/HT
Study
DGI Controls
EFSOCH
UK Blood Ser 1
DGI Cases
PLCO
Dundee Controls 1
Subtotal (I-squared = 0.0%, p = 0.715)
FUSION Controls
WTCCC/CAD
Dundee Cases 2
Subtotal (I-squared = 17%, p = 0.26)
NFBC1966
KORA
Dundee Cases 1
FUSION Cases
GWA Case Series
British 1958 BC
WTCCC/T2DM
GWA Population-Based Studies
0.04 (0.03, 0.05)
0.02 (-0.06, 0.09)
0.00 (-0.04, 0.05)
0.00 (-0.15, 0.16)
change in log10BMI
0.07 (0.01, 0.14)
0.04 (-0.01, 0.09)
0.06 (-0.01, 0.14)
0.00 (-0.04, 0.05)
0.07 (-0.03, 0.16)
0.01 (-0.08, 0.11)
0.02 (-0.02, 0.07)
0.01 (-0.07, 0.09)
0.05 (0.02, 0.07)
0.05 (-0.02, 0.12)
0.14 (0.04, 0.24)
0.13 (0.05, 0.21)
Z-score (95% CI)
0.03 (-0.06, 0.13)
0.15 (0.06, 0.24)
0.08 (-0.01, 0.18)
-0.04 (-0.13, 0.04)
0.06 (-0.01, 0.14)
0.05 (-0.04, 0.13)
0.04 (0.01, 0.07)
-0.05 (-0.15, 0.05)
0.01 (-0.07, 0.09)
0.05 (-0.06, 0.15)
0.05 (0.03, 0.06)
0.06 (-0.00, 0.12)
0.07 (-0.01, 0.15)
0.03 (-0.05, 0.11)
-0.03 (-0.14, 0.08)
0.06 (-0.03, 0.15)
-0.01 (-0.08, 0.07)
Per-C allele
0-.1 0 .1 .25

Heterogeneity between groups: p = 0.045
Overall (I-squared = 14.9%, p = 0.25)
FUSION Cases
Study
Hertfordshire Study
KORA
WTCCC/T2DM Cases
EPIC-Obesity
EFSOCH
Dundee Controls 2
Subtotal (I-squared = 0.0%, p = 0.46)
Subtotal (I-squared = 0.0%, p = 0.59)
Subtotal (I-squared = 51%, p = 0.13)
Dundee Cases 1
EPIC-Norfolk
FUSION Controls
DGI Cases
DGI Controls
UK Blood Services 1
MRC ELY
Dundee Controls 1
GWA Population based
GWA Case studies
NFBC1966
Subtotal (I-squared = 0.0%, p = 0.68)
WTCCC/HT Cases
UK Blood Services 2
Dundee Cases 2
Oxford Biobank
Replication Case studies
PLCO/NCI
WTCCC/CAD Cases
YT2D-OXGN Cases
British 1958 BC
CoLaus
SardiNIA
Replication population-based & control
-0.01 (-0.17, 0.14)
0.06 (-0.03, 0.14)
0.11 (-0.00, 0.21)
-0.01 (-0.10, 0.09)
0.11 (0.01, 0.21)
0.22 (0.10, 0.34)
0.06 (-0.07, 0.18)
0.07 (0.05, 0.09)
-0.00 (-0.06, 0.06)
0.02 (-0.04, 0.07)
-0.04 (-0.13, 0.05)
0.08 (0.04, 0.11)
-0.08 (-0.21, 0.06)
-0.02 (-0.14, 0.10)
0.10 (-0.02, 0.22)
0.05 (-0.07, 0.18)
0.05 (-0.06, 0.17)
0.05 (-0.06, 0.16)
0.04 (-0.03, 0.12)
0.08 (0.03, 0.12)
0.13 (0.01, 0.24)
0.06 (-0.06, 0.17)
0.09 (-0.04, 0.22)
0.13 (0.00, 0.27)
0.06 (-0.01, 0.12)
-0.02 (-0.10, 0.07)
0.04 (-0.16, 0.24)
0.11 (0.00, 0.22)
0.05 (-0.01, 0.12)
0.07 (-0.04, 0.17)
0.06 (0.04, 0.08)
-0.01 (-0.17, 0.14)
0.06 (-0.03, 0.14)
0.11 (-0.00, 0.21)
-0.01 (-0.10, 0.09)
0.11 (0.01, 0.21)
0.22 (0.10, 0.34)
0.06 (-0.07, 0.18)
0.07 (0.05, 0.09)
-0.00 (-0.06, 0.06)
0.02 (-0.04, 0.07)
-0.04 (-0.13, 0.05)
0.08 (0.04, 0.11)
-0.08 (-0.21, 0.06)
-0.02 (-0.14, 0.10)
0.10 (-0.02, 0.22)
0.05 (-0.07, 0.18)
0.05 (-0.06, 0.17)
0.05 (-0.06, 0.16)
0.04 (-0.03, 0.12)
0.08 (0.03, 0.12)
0.13 (0.01, 0.24)
0.06 (-0.06, 0.17)
0.09 (-0.04, 0.22)
0.13 (0.00, 0.27)
0.06 (-0.01, 0.12)
-0.02 (-0.10, 0.07)
0.04 (-0.16, 0.24)
0.11 (0.00, 0.22)
0.05 (-0.01, 0.12)
0.07 (-0.04, 0.17)
0-.25 -.1 0 .1 .25
change in log10BMI
Z-score (95% CI)
Per-C allele
Supplementary Figure 4h: Meta‐analysis plot showing the rs17782313 per‐C allele effect size (per‐C allele effect: 0.058 Z‐score [0.041‐0.076], p=1.4x10‐10) on BMI in men, expressed in sex‐specific Z‐score units for log10BMI.
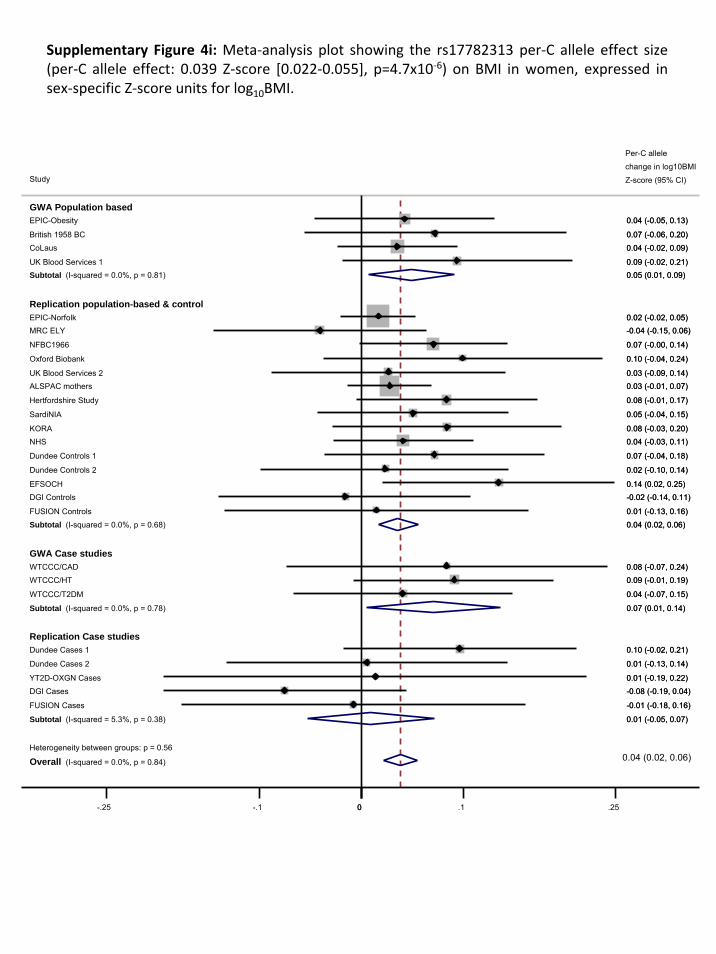
Supplementary Figure 4i: Meta‐analysis plot showing the rs17782313 per‐C allele effect size (per‐C allele effect: 0.039 Z‐score [0.022‐0.055], p=4.7x10‐6) on BMI in women, expressed in sex‐specific Z‐score units for log10BMI.
Per C-allele
Heterogeneity between groups: p = 0.56
Overall (I-squared = 0.0%, p = 0.84)
UK Blood Services 2
KORA
Replication population-based & control
FUSION Cases
Subtotal (I-squared = 5.3%, p = 0.38)
EPIC-Obesity
Oxford Biobank
DGI Controls
WTCCC/T2DM
Replication Case studies
GWA Population based
SardiNIA
Dundee Controls 2
Dundee Cases 1
GWA Case studies
WTCCC/HT
FUSION Controls
Study
NFBC1966
Subtotal (I-squared = 0.0%, p = 0.78)
NHS
CoLaus
YT2D-OXGN Cases
EFSOCH
Subtotal (I-squared = 0.0%, p = 0.68)
DGI Cases
Dundee Controls 1
Dundee Cases 2
EPIC-Norfolk
British 1958 BC
MRC ELY
WTCCC/CAD
Subtotal (I-squared = 0.0%, p = 0.81)
Hertfordshire Study
ALSPAC mothers
UK Blood Services 1
0.03 (-0.09, 0.14)
0.08 (-0.03, 0.20)
-0.01 (-0.18, 0.16)
0.01 (-0.05, 0.07)
0.04 (-0.05, 0.13)
0.10 (-0.04, 0.24)
-0.02 (-0.14, 0.11)
0.04 (-0.07, 0.15)
0.05 (-0.04, 0.15)
0.02 (-0.10, 0.14)
0.10 (-0.02, 0.21)
0.09 (-0.01, 0.19)
0.01 (-0.13, 0.16)
0.07 (-0.00, 0.14)
0.07 (0.01, 0.14)
0.04 (-0.03, 0.11)
0.04 (-0.02, 0.09)
0.01 (-0.19, 0.22)
0.14 (0.02, 0.25)
0.04 (0.02, 0.06)
-0.08 (-0.19, 0.04)
0.07 (-0.04, 0.18)
0.01 (-0.13, 0.14)
0.02 (-0.02, 0.05)
0.07 (-0.06, 0.20)
-0.04 (-0.15, 0.06)
0.08 (-0.07, 0.24)
0.05 (0.01, 0.09)
0.08 (-0.01, 0.17)
0.03 (-0.01, 0.07)
0.09 (-0.02, 0.21)
0.04 (0.02, 0.06)
0.03 (-0.09, 0.14)
0.08 (-0.03, 0.20)
-0.01 (-0.18, 0.16)
0.01 (-0.05, 0.07)
0.04 (-0.05, 0.13)
0.10 (-0.04, 0.24)
-0.02 (-0.14, 0.11)
0.04 (-0.07, 0.15)
0.05 (-0.04, 0.15)
0.02 (-0.10, 0.14)
0.10 (-0.02, 0.21)
0.09 (-0.01, 0.19)
0.01 (-0.13, 0.16)
0.07 (-0.00, 0.14)
0.07 (0.01, 0.14)
0.04 (-0.03, 0.11)
0.04 (-0.02, 0.09)
0.01 (-0.19, 0.22)
0.14 (0.02, 0.25)
0.04 (0.02, 0.06)
-0.08 (-0.19, 0.04)
0.07 (-0.04, 0.18)
0.01 (-0.13, 0.14)
0.02 (-0.02, 0.05)
0.07 (-0.06, 0.20)
-0.04 (-0.15, 0.06)
0.08 (-0.07, 0.24)
0.05 (0.01, 0.09)
0.08 (-0.01, 0.17)
0.03 (-0.01, 0.07)
0.09 (-0.02, 0.21)
0-.25 -.1 0 .1 .25
change in log10BMI
Z-score (95% CI)
Per-C allele

Heterogeneity between groups: p = 0.57
Overall (I-squared = 5.3%, p = 0.39)
CoLaus
UK Blood Ser 2
WTCCC/CAD
GWA Case Series
MRC ELY
KORA
Dundee Cases 1
Dundee Cases 2
EPIC-Obesity
PLCO
Dundee Controls 1
YT2D-OXGN cases
EFSOCH
Subtotal (I-squared = 0.0%, p = 0.65)
Subtotal (I-squared = 10.7%, p = 0.33)
FUSION Controls
Hertfordshire
Study
NFBC1966
DGI Controls
FUSION Cases
Replication Population-Based Studies
GWA Population-Based Studies
SardiNIA
Subtotal (I-squared = 0.0%, p = 0.44)
British 1958 BC
WTCCC/HT
ALSPAC mothers
Subtotal (I-squared = 46.3%, p = 0.13)
EPIC-Norfolk
Dundee Controls 2
DGI Cases
UK Blood Ser 1
Replication Case Series
WTCCC/T2DM
Oxford Biobank
NHS
0.04 (0.00, 0.08)
0.08 (0.00, 0.17)
-0.01 (-0.09, 0.06)
-0.00 (-0.08, 0.08)
Per-C allele change in
0.05 (-0.02, 0.13)
0.01 (-0.07, 0.08)
0.05 (-0.04, 0.15)
-0.01 (-0.08, 0.05)
0.01 (-0.06, 0.08)
0.08 (0.01, 0.15)
-0.00 (-0.15, 0.14)
0.02 (-0.06, 0.11)
0.04 (0.00, 0.09)
0.03 (0.02, 0.05)
0.11 (0.01, 0.21)
-0.00 (-0.06, 0.06)
height Z-score (95% CI)
-0.02 (-0.07, 0.03)
0.04 (-0.04, 0.13)
0.07 (-0.04, 0.18)
0.02 (-0.06, 0.10)
0.03 (-0.01, 0.07)
0.00 (-0.09, 0.09)
0.05 (-0.03, 0.12)
0.03 (-0.01, 0.07)
0.01 (-0.02, 0.04)
0.04 (0.01, 0.07)
0.11 (0.03, 0.20)
0.08 (-0.00, 0.17)
-0.06 (-0.14, 0.02)
0.05 (-0.02, 0.12)
0.01 (-0.08, 0.11)
0.01 (-0.06, 0.08)
0.03 (0.02, 0.04)
0.04 (0.00, 0.08)
0.08 (0.00, 0.17)
-0.01 (-0.09, 0.06)
-0.00 (-0.08, 0.08)
0.05 (-0.02, 0.13)
0.01 (-0.07, 0.08)
0.05 (-0.04, 0.15)
-0.01 (-0.08, 0.05)
0.01 (-0.06, 0.08)
0.08 (0.01, 0.15)
-0.00 (-0.15, 0.14)
0.02 (-0.06, 0.11)
0.04 (0.00, 0.09)
0.03 (0.02, 0.05)
0.11 (0.01, 0.21)
-0.00 (-0.06, 0.06)
-0.02 (-0.07, 0.03)
0.04 (-0.04, 0.13)
0.07 (-0.04, 0.18)
0.02 (-0.06, 0.10)
0.03 (-0.01, 0.07)
0.00 (-0.09, 0.09)
0.05 (-0.03, 0.12)
0.03 (-0.01, 0.07)
0.01 (-0.02, 0.04)
0.04 (0.01, 0.07)
0.11 (0.03, 0.20)
0.08 (-0.00, 0.17)
-0.06 (-0.14, 0.02)
0.05 (-0.02, 0.12)
0.01 (-0.08, 0.11)
0.01 (-0.06, 0.08)
0-.1 0 .1
Supplementary Figure 4j: Meta‐analysis plot showing the rs17782313 per‐C allele effect size on height in 77,228 adults, expressed in sex‐specific Z‐score units for height.
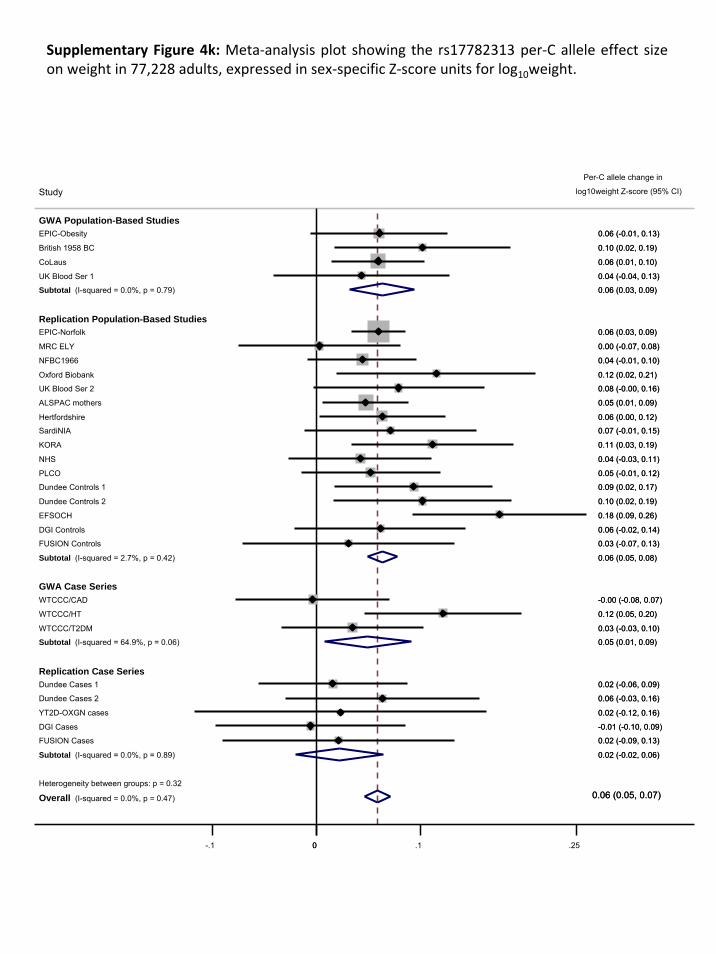
Heterogeneity between groups: p = 0.32
Overall (I-squared = 0.0%, p = 0.47)
EPIC-Obesity
YT2D-OXGN cases
Dundee Controls 1
WTCCC/CAD
FUSION Cases
DGI Cases
ALSPAC mothers
FUSION Controls
NHS
Replication Case Series
Study
EPIC-Norfolk
CoLaus
Dundee Cases 2
Dundee Cases 1
Subtotal (I-squared = 64.9%, p = 0.06)
GWA Case Series
UK Blood Ser 2
DGI Controls
UK Blood Ser 1
MRC ELY
Oxford Biobank
KORA
SardiNIA
Subtotal (I-squared = 2.7%, p = 0.42)
NFBC1966
Replication Population-Based Studies
Hertfordshire
WTCCC/T2DM
WTCCC/HT
Subtotal (I-squared = 0.0%, p = 0.79)
British 1958 BC
Subtotal (I-squared = 0.0%, p = 0.89)
PLCO
Dundee Controls 2
EFSOCH
GWA Population-Based Studies
0.06 (0.05, 0.07)
0.06 (-0.01, 0.13)
0.02 (-0.12, 0.16)
Per-C allele change in
0.09 (0.02, 0.17)
-0.00 (-0.08, 0.07)
0.02 (-0.09, 0.13)
-0.01 (-0.10, 0.09)
0.05 (0.01, 0.09)
0.03 (-0.07, 0.13)
0.04 (-0.03, 0.11)
log10weight Z-score (95% CI)
0.06 (0.03, 0.09)
0.06 (0.01, 0.10)
0.06 (-0.03, 0.16)
0.02 (-0.06, 0.09)
0.05 (0.01, 0.09)
0.08 (-0.00, 0.16)
0.06 (-0.02, 0.14)
0.04 (-0.04, 0.13)
0.00 (-0.07, 0.08)
0.12 (0.02, 0.21)
0.11 (0.03, 0.19)
0.07 (-0.01, 0.15)
0.06 (0.05, 0.08)
0.04 (-0.01, 0.10)
0.06 (0.00, 0.12)
0.03 (-0.03, 0.10)
0.12 (0.05, 0.20)
0.06 (0.03, 0.09)
0.10 (0.02, 0.19)
0.02 (-0.02, 0.06)
0.05 (-0.01, 0.12)
0.10 (0.02, 0.19)
0.18 (0.09, 0.26)
0.06 (0.05, 0.07)
0.06 (-0.01, 0.13)
0.02 (-0.12, 0.16)
0.09 (0.02, 0.17)
-0.00 (-0.08, 0.07)
0.02 (-0.09, 0.13)
-0.01 (-0.10, 0.09)
0.05 (0.01, 0.09)
0.03 (-0.07, 0.13)
0.04 (-0.03, 0.11)
0.06 (0.03, 0.09)
0.06 (0.01, 0.10)
0.06 (-0.03, 0.16)
0.02 (-0.06, 0.09)
0.05 (0.01, 0.09)
0.08 (-0.00, 0.16)
0.06 (-0.02, 0.14)
0.04 (-0.04, 0.13)
0.00 (-0.07, 0.08)
0.12 (0.02, 0.21)
0.11 (0.03, 0.19)
0.07 (-0.01, 0.15)
0.06 (0.05, 0.08)
0.04 (-0.01, 0.10)
0.06 (0.00, 0.12)
0.03 (-0.03, 0.10)
0.12 (0.05, 0.20)
0.06 (0.03, 0.09)
0.10 (0.02, 0.19)
0.02 (-0.02, 0.06)
0.05 (-0.01, 0.12)
0.10 (0.02, 0.19)
0.18 (0.09, 0.26)
0-.1 0 .1 .25
Supplementary Figure 4k: Meta‐analysis plot showing the rs17782313 per‐C allele effect size on weight in 77,228 adults, expressed in sex‐specific Z‐score units for log10weight.

Supplementary Figure 4l: Meta‐analysis plot showing the rs17782313 per‐C allele odds ratio for overweight (BMI ≥ 25 kg.m‐2).
Heterogeneity between groups: p = 0.09
Overall (I-squared = 0.0%, p = 0.72)
Study
EPIC-Obesity
EPIC-Norfolk
Subtotal (I-squared = 47%, p = 0.15)
WTCCC/T2DM Cases
Subtotal (I-squared = 0.0%, p = 0.83)
UK Blood Services 1
MRC ELY
ALSPAC mothers
YT2D-OXGN Cases
NFBC1966
FUSION Controls
Dundee Controls 1
Subtotal (I-squared = 0.0%, p = 0.81)
GWA Case Series
DGI Controls
Dundee Cases 2
KORA
CoLaus
Hertfordshire Study
DGI Cases
GWA Population-Bases Studies
PLCO
NHS
Oxford Biobank
FUSION Cases
Replication Case Series
Replication Population-Based Studies
UK Blood Services 2
WTCCC/CAD Cases
Dundee Cases 1
Subtotal (I-squared = 0.0%, p = 0.85)
WTCCC/HT Cases
EFSOCH
Dundee Controls 2
British 1958 BC
1.10 (0.96, 1.27)
1.07 (1.01, 1.13)
1.01 (0.91, 1.12)
0.88 (0.71, 1.08)
0.99 (0.87, 1.13)
1.20 (1.01, 1.43)
1.03 (0.87, 1.21)
1.02 (0.93, 1.13)
1.24 (0.74, 2.06)
1.14 (1.03, 1.27)
1.03 (0.82, 1.30)
1.02 (0.87, 1.19)
1.15 (1.07, 1.22)
1.10 (0.91, 1.32)
1.09 (0.79, 1.49)
1.03 (0.85, 1.24)
1.16 (1.06, 1.28)
1.00 (0.88, 1.14)
0.94 (0.76, 1.16)
1.12 (0.96, 1.32)
1.10 (0.95, 1.26)
1.16 (0.95, 1.42)
0.91 (0.62, 1.34)
1.03 (0.87, 1.22)
0.98 (0.83, 1.16)
1.01 (0.78, 1.29)
1.07 (1.04, 1.11)
1.15 (0.96, 1.37)
1.25 (1.05, 1.49)
1.02 (0.85, 1.23)
1.09 (0.91, 1.31)
1.08 (1.05, 1.11)
1.10 (0.96, 1.27)
1.07 (1.01, 1.13)
1.01 (0.91, 1.12)
0.88 (0.71, 1.08)
0.99 (0.87, 1.13)
1.20 (1.01, 1.43)
1.03 (0.87, 1.21)
1.02 (0.93, 1.13)
1.24 (0.74, 2.06)
1.14 (1.03, 1.27)
1.03 (0.82, 1.30)
1.02 (0.87, 1.19)
1.15 (1.07, 1.22)
1.10 (0.91, 1.32)
1.09 (0.79, 1.49)
1.03 (0.85, 1.24)
1.16 (1.06, 1.28)
1.00 (0.88, 1.14)
0.94 (0.76, 1.16)
1.12 (0.96, 1.32)
1.10 (0.95, 1.26)
1.16 (0.95, 1.42)
0.91 (0.62, 1.34)
1.03 (0.87, 1.22)
0.98 (0.83, 1.16)
1.01 (0.78, 1.29)
1.07 (1.04, 1.11)
1.15 (0.96, 1.37)
1.25 (1.05, 1.49)
Per-C allele Odds Ratio for overweight vs
normal (95% CI)
1.02 (0.85, 1.23)
1.09 (0.91, 1.31)
1.75 1 1.5
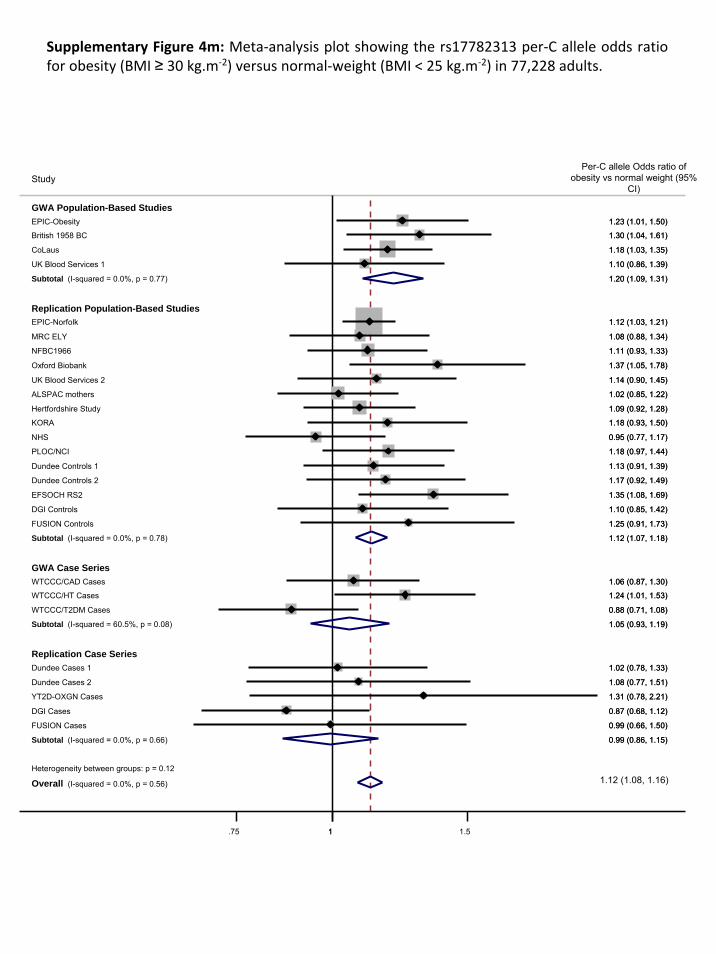
Supplementary Figure 4m: Meta‐analysis plot showing the rs17782313 per‐C allele odds ratio for obesity (BMI ≥ 30 kg.m‐2) versus normal‐weight (BMI < 25 kg.m‐2) in 77,228 adults.
Heterogeneity between groups: p = 0.12
Overall (I-squared = 0.0%, p = 0.56)
WTCCC/CAD Cases
GWA Population-Based Studies
Subtotal (I-squared = 60.5%, p = 0.08)
UK Blood Services 1
DGI Controls
Study
KORA
Dundee Cases 2
Dundee Controls 2
Dundee Cases 1
WTCCC/HT Cases
EFSOCH RS2
Subtotal (I-squared = 0.0%, p = 0.78)
NHS
CoLaus
Subtotal (I-squared = 0.0%, p = 0.66)
GWA Case Series
FUSION Cases
Hertfordshire Study
EPIC-Norfolk
Replication Case Series
EPIC-Obesity
DGI Cases
Oxford Biobank
UK Blood Services 2
FUSION Controls
MRC ELY
NFBC1966
Subtotal (I-squared = 0.0%, p = 0.77)
Replication Population-Based Studies
YT2D-OXGN Cases
PLOC/NCI
ALSPAC mothers
Dundee Controls 1
British 1958 BC
WTCCC/T2DM Cases
1.06 (0.87, 1.30)
1.05 (0.93, 1.19)
1.10 (0.86, 1.39)
1.10 (0.85, 1.42)
1.18 (0.93, 1.50)
1.08 (0.77, 1.51)
1.17 (0.92, 1.49)
1.02 (0.78, 1.33)
1.24 (1.01, 1.53)
1.35 (1.08, 1.69)
1.12 (1.07, 1.18)
0.95 (0.77, 1.17)
1.18 (1.03, 1.35)
0.99 (0.86, 1.15)
0.99 (0.66, 1.50)
1.09 (0.92, 1.28)
1.12 (1.03, 1.21)
1.23 (1.01, 1.50)
0.87 (0.68, 1.12)
1.37 (1.05, 1.78)
1.14 (0.90, 1.45)
1.25 (0.91, 1.73)
1.08 (0.88, 1.34)
1.11 (0.93, 1.33)
1.20 (1.09, 1.31)
1.31 (0.78, 2.21)
1.18 (0.97, 1.44)
1.02 (0.85, 1.22)
1.13 (0.91, 1.39)
1.30 (1.04, 1.61)
0.88 (0.71, 1.08)
Per-C allele Odds ratio of obesity vs normal weight (95%
CI)
1.12 (1.08, 1.16)
1.06 (0.87, 1.30)
1.05 (0.93, 1.19)
1.10 (0.86, 1.39)
1.10 (0.85, 1.42)
1.18 (0.93, 1.50)
1.08 (0.77, 1.51)
1.17 (0.92, 1.49)
1.02 (0.78, 1.33)
1.24 (1.01, 1.53)
1.35 (1.08, 1.69)
1.12 (1.07, 1.18)
0.95 (0.77, 1.17)
1.18 (1.03, 1.35)
0.99 (0.86, 1.15)
0.99 (0.66, 1.50)
1.09 (0.92, 1.28)
1.12 (1.03, 1.21)
1.23 (1.01, 1.50)
0.87 (0.68, 1.12)
1.37 (1.05, 1.78)
1.14 (0.90, 1.45)
1.25 (0.91, 1.73)
1.08 (0.88, 1.34)
1.11 (0.93, 1.33)
1.20 (1.09, 1.31)
1.31 (0.78, 2.21)
1.18 (0.97, 1.44)
1.02 (0.85, 1.22)
1.13 (0.91, 1.39)
1.30 (1.04, 1.61)
0.88 (0.71, 1.08)
1.75 1 1.5
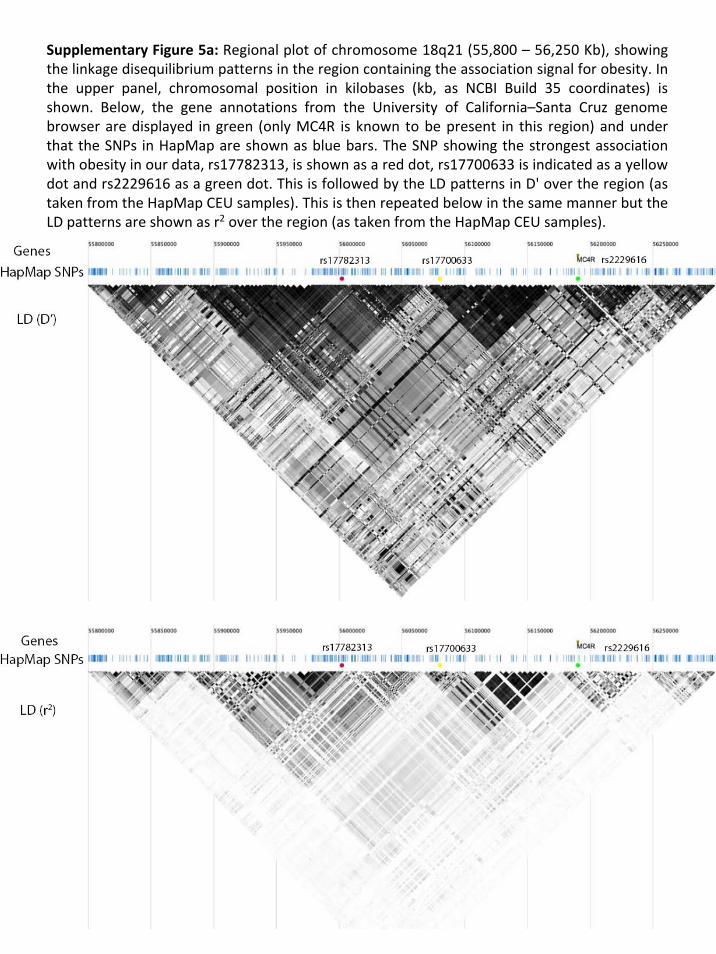
Supplementary Figure 5a: Regional plot of chromosome 18q21 (55,800 – 56,250 Kb), showing the linkage disequilibrium patterns in the region containing the association signal for obesity. In the upper panel, chromosomal position in kilobases (kb, as NCBI Build 35 coordinates) is shown. Below, the gene annotations from the University of California–Santa Cruz genome browser are displayed in green (only MC4R is known to be present in this region) and under that the SNPs in HapMap are shown as blue bars. The SNP showing the strongest association with obesity in our data, rs17782313, is shown as a red dot, rs17700633 is indicated as a yellow dot and rs2229616 as a green dot. This is followed by the LD patterns in D' over the region (as taken from the HapMap CEU samples). This is then repeated below in the same manner but the LD patterns are shown as r2 over the region (as taken from the HapMap CEU samples).

Supplementary Figure 5b: Regional plot of chromosome 18q21 (55,700–56,400 Kb), showing the association signals for obesity for the meta‐analysis of all 11,012 population‐based samples with genome‐wide association scans, in contrast to Figure 1 which shows similar data for all seven genome‐wide association scans. On the X‐axis is chromosomal position in kilobases (kb, as NCBI Build 35 coordinates) and on the Y‐axis is the P‐value for association (expressed as ‐log10 P‐value). The imputed data signals are shown in grey diamonds and the directly genotyped signals in white. Estimated recombinationrates (taken from HapMap) are plotted (light blue) to reflect the local LD structure around the associated SNP. Gene annotations were taken from the University of California–Santa Cruz genome browser. The blue diamond corresponds to the directly genotyped SNP in this region, which shows the strongest association with obesity (rs17700633, p=5.3x10‐6) the lower yellow diamond represents the result from rs17782313, (p=1.82x10‐5 directly genotyped), the red diamond represents rs718475 (p=5.78x10‐6, imputed data), the purple diamond represents rs9956279 (p=4.60x10‐6, imputed data) and the orange diamond represents rs12955983 (p=2.7x10‐5, imputed data) and the green diamond represents the result from rs2229616 (or V103I, p=0.153, imputed data). The LD structure across the interval, as calculated by D’ and r2 measures is shown in Supplementary Figure 5.1.
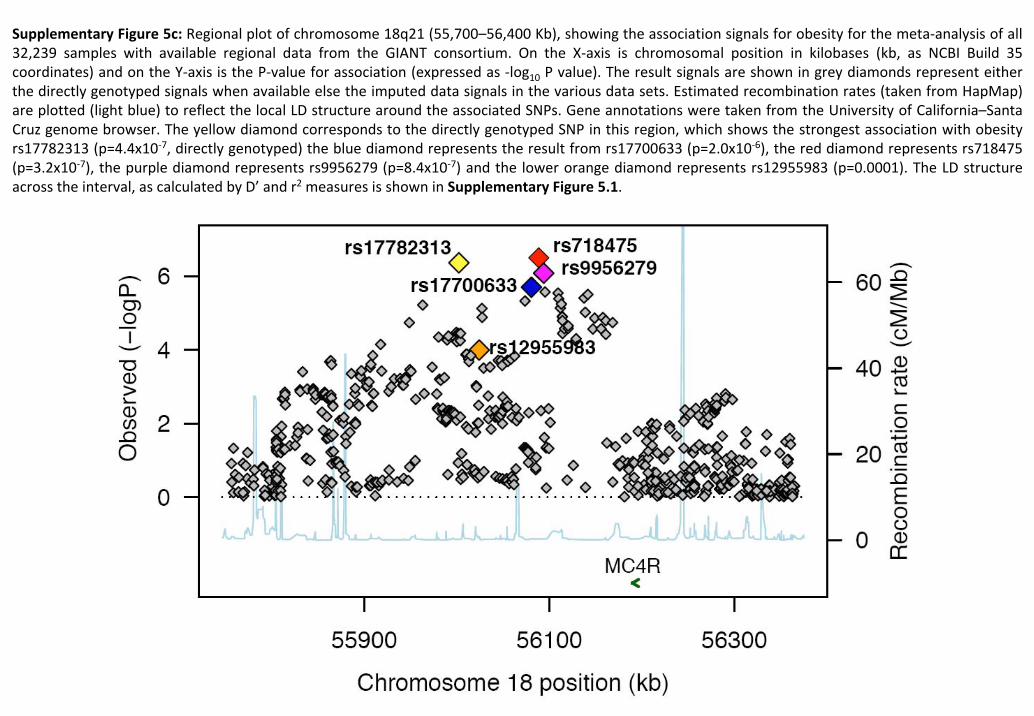
Supplementary Figure 5c: Regional plot of chromosome 18q21 (55,700–56,400 Kb), showing the association signals for obesity for the meta‐analysis of all 32,239 samples with available regional data from the GIANT consortium. On the X‐axis is chromosomal position in kilobases (kb, as NCBI Build 35 coordinates) and on the Y‐axis is the P‐value for association (expressed as ‐log10 P value). The result signals are shown in grey diamonds represent either the directly genotyped signals when available else the imputed data signals in the various data sets. Estimated recombination rates (taken from HapMap) are plotted (light blue) to reflect the local LD structure around the associated SNPs. Gene annotations were taken from the University of California–Santa Cruz genome browser. The yellow diamond corresponds to the directly genotyped SNP in this region, which shows the strongest association with obesity rs17782313 (p=4.4x10‐7, directly genotyped) the blue diamond represents the result from rs17700633 (p=2.0x10‐6), the red diamond represents rs718475 (p=3.2x10‐7), the purple diamond represents rs9956279 (p=8.4x10‐7) and the lower orange diamond represents rs12955983 (p=0.0001). The LD structure across the interval, as calculated by D’ and r2 measures is shown in Supplementary Figure 5.1.

![Original Article Motor cortex-lateral hypothalamus circuit ...responses to leptin were dependent on the MC4R [14, 19]. These findings thus revealed a major role for MC4R action in](https://img.pdfslide.us/doc/110x75/60fdf7c77ae0ae79e8011901/original-article-motor-cortex-lateral-hypothalamus-circuit-responses-to-leptin.jpg)


![Exemplars - Math 30-1 - Home Outcome 6 Demonstrate an understanding of inverses of relations. [C, CN, R, V] Notes: ... • Formulas will be given for any problems involving logarithmic](https://img.pdfslide.us/doc/110x75/5b1d28ac7f8b9a06758beb9e/exemplars-math-30-1-home-outcome-6-demonstrate-an-understanding-of-inverses.jpg)