Embed Size (px)
Citation preview
Studies in Population, Labour Force and Migration
Project Report No 8
SOCIO-ECONOMIC AND DEMOGRAPHIC CHARACTERISTICSOF THE POPULATION IN PAKISTAN: FINDINGS OF THE
POPULATION, LABOUR FORCE AND MIGRATIONSURVEY 1979-80
ZEBA A. SATHARSYED MUBASHIR ALlG. MUSTAFA ZAHID
December 1984
PAKISTAN INSTITUTE OF DEVELOPMENT ECONOMICS
POST BOX 1091, ISLAMABAD
(PAKISTAN)
Project Director
Professor Syed Nawab Raider NaqviDirector, PIDE
Project Manager
Dr. Mohammad IrfanChief of Research (Economics)
Project Team Members
1. Dr. Iqbal Alam, Chief of Research (Demography)
2, Mr. M. Naseem Iqbal Farooqui, Research Demographer
3. Mrs. Naushin Mahmood Qureshi, Research Demographer
4. Miss Nasreen Abbasi Research Demographer
5, Mr. Ghulam Yasin Soomro Research Demographer
6. Miss Zubeda Khan, Research Demographer
7. Miss Talat K. Alauddin, Research Economist
8. Mr. S. Mubashir All, Staff Demographer
9. Mr. H. B. Siyal, Staff Demographer
10. Mr. Khalid Hameed Sheikh, Staff Demographer
11. Mr. Ghulam Mohammad Arif, Associate Staff Economist
12. Mr. M. Javed Tariq, Associate Staff Economist
13. Mr. Ghulam Mustafa Zahid, Associate Staff Demographer
14. Miss Rashida 1-Iaq, Associate Staff Economist
15. Mr. Zafar Mucen Nasir, Associate Staff Economist
16. Mr. Sharlf-ul-Haq Grewal, Research Assistant
17. Mr. Mohammad Rafiq , Senior Computer Programmer
18. Mr. Mohammad Khalid, Senior Computer Programmer
19. Mr. Furqan Ahmed Farooqui, Computer Programmer
20. Syed Tariq Ahmed, Computer Programmer
21. Mr. Masood Ashfaque 7 Computer Programmer
22. Mr. Javed Akbar Gil, Computer Programmer
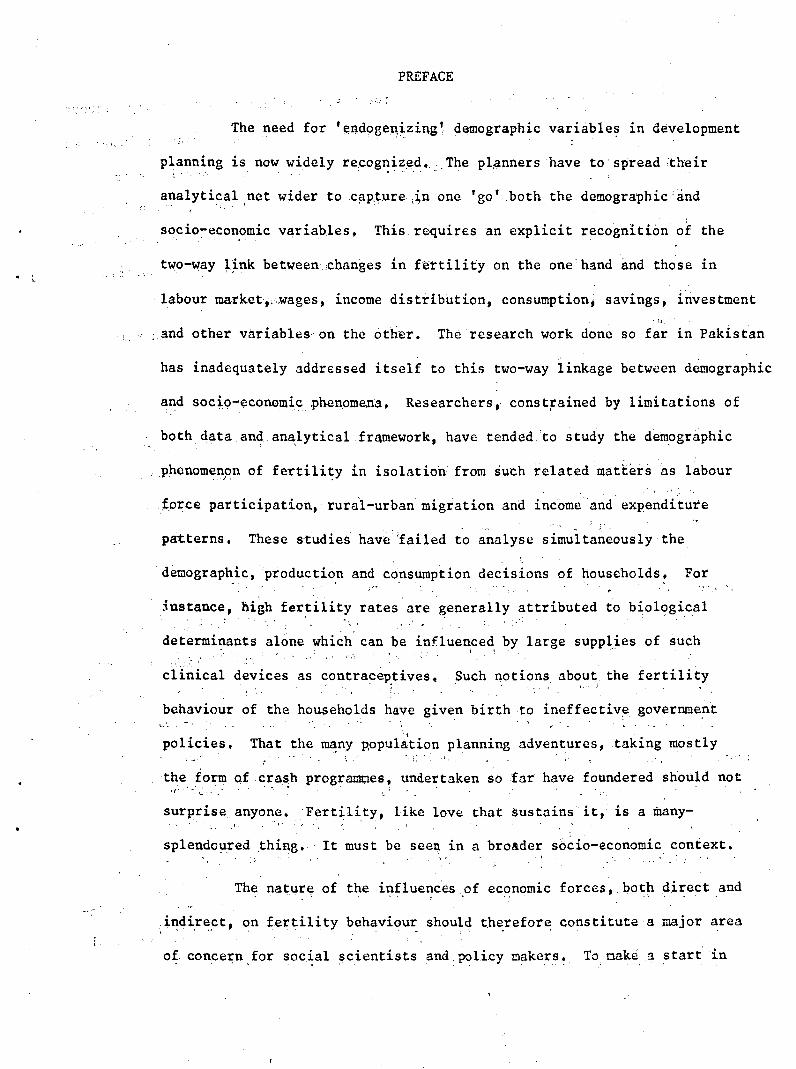
PREFACE
The need for 'endogen.izing'. demographic variables in development
planning is now widely recognized..The planners have to-spread-their
analytical net wider to capture ,in one 'go' both the demographic and
socio-economic variables, This requires an explicit recognition of the
two-way .ink between changes in fertility on the one hand and those in
labour markct,.wages, income distribution, consumption j savings, investment
and other vhriablcson the other. The research work done so far in Pakistan
has inadequately addressed itself to this two-way linkage between demographic
and socio-economic phenomena, Researchers, constrained by limitations of
both data and analytical framework, have tendd.to study the demographic
phenomenon of fertility in isolation from such related maters as labour
force participation, rural-urban migration and income and expendituie
patterns. These studies have failed to analyse simultaneously the
demographic, production and consumption decisions of households, For
tnatance, high fertility rates are generally attributed to biological
determinants alone which can be influenced by large supplies of such
clinical devices as contraceptives, Such notions about the fertility
behaviour of the households have given birth to ineffective government
policies. That the many population planning adventures, taking mostly
the form of crash programmes, undertaken so far have foundered should not
surprise anyone Fertility, like love that sustains it, is a many-
splendoured thing. It must be seen in a broader socio-economic context.
• The nature of the influences of economic forccs,both direct and
indirect, on fertility behaviour should therefore Constitute a major area
of. concern for social scientists and policy makers. To make a start in
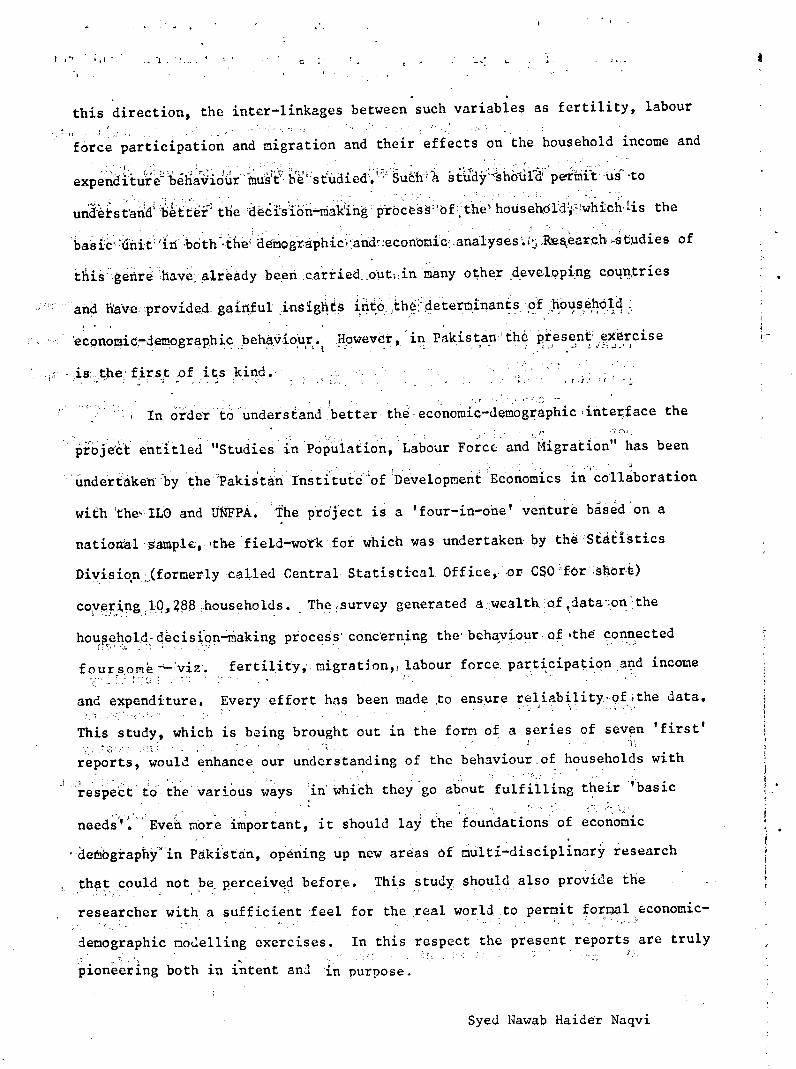
.1this direction, the inter-linkages between such variables as fertility, labour
force participation and migration and their effects on the household income and
expenditureT bh lid ir .i hs üdicdYSuchà 1rhbiil'd pe'rnft iii toundständ better the tide sthn-mak'ih prbcsbf , the htLs .ehldiwhiChLis the
basiènit 'in: -both ^-t d ogph.ic -studies of
this genre have already been carried out in many other developing countries
and have provided gainful insights into th determinants of household
economic-demographic behaviour.. rlowever, in Pakistan th present exercise
is the first of its kind.. I
In 6iderunders tand .better the economic-demographic interace the
öje.t entitled "Studies in Population, Labour Force and Migration" has been
undertakeri :by thePakitànInstitutcof Development Economics in collaboration
with the'ILO and UNFPA. The prdect is a 'four-in-one' venture bsed on a
ziinatioul sampl the field-wofk .f or which was undertaken by the Sttstics
Division , (forrnerly called Central Statistical Office, or C$Ofr shor)
coveri,nglQ,88 households. The ,survey generated a:;wealth of .dataon:the
houehold- dècision-inaking process concerning the- behayiour of 'the connected
four!omv1Z. fertility,'.migraton,labour force. participation and income
and expenditure. Every effort has been made to ensure reli ability . q,frthe data.
This study, which is being brought out in the form of a series of seven 'first'
reports, would enhance our understanding of the behaviour.of households with
.1
respeèt to the' various ways in which they go about fulfilling their 'basic
needs EvenEven more important, it should lay the foundations of economic
aethbgraph) in Pakistan, opning up new areas of multi-disciplinary' research
that could not be perceived before. This study should also provide the
researcher with a sufficient-feel for the real world to permit formal economic-
demographic modelling exercises. In this respect the present reports are truly
pioneering both in intent and in purpose.
Syed Nawab Haider Naqvi
I..-
SOCIO-ECONOMIC AND DEMOGRAPHIC CHARACTERISTICS OF THEPOPULATION IN PAKISTAN: FINDINGS OF THE POPULATION,
LABOUR FORCE AND MIGRATION SURVEY 1979-80
Introduction:
A profile, of the socio-economic and demographic characteristics
of the population is undisputably a necessity for planning, accounting,
housing, education and other innumerable purposes. So far Pakistan's
stock of such data is based on four Population Censuses (1951, 1961, 1972
and 1981) and several national surveys (PGE 1963-65, PGS 1968-71 &
1976-78, NIS 1968, PFS 1975, HED 1973, HIES 1971_72, LFS 1974-75 & 1978-79).
Ofcourse supplementary information is also available for some cities
such as Rawalpindi (Babar 1977) and Karachi (Hashmi 1963) but its value
is limited in terms of describing national characteristics. In theory
the censuses have complete coverage of the population but due to the limited
number of questions included in census schedules they suffer from lack
of detail. On the-other hand the surveys cited above, cover only a sample,
supposedly representative on a national basis, but because of their sma-
ller size are able to include many more questions than census schedules.
Together the two sets of sources provide us with information on population
size, density, breakdown by provinces and urban-rural residence, age and
sex structure, housing, labour force and educational characteristics. The
Population, Labour Force and Migration Survey 1979-80, (PLM) is another
such most recent exercise, conducted by PIDE/ILO in 1979-80 with funds
from the UNFPA. It is however, uniquely rich due to tfle information
collected through detailed questionnaires comprised by the tour modules
-2-
on Labour Force, Income and Expenditure, Migration and Fertility. The
interlinkages between the modules lead to extensive information at the
household level. It must be highlighted that the PLM is a pioneering
venture in the history of data collection in Pakistan because the un-
kage between the standard Labour Force Survey and Household Income and
Expenditure Schedule with a Fertility and a Migration survey ?rovide a very
comprehensive picture of household social, economic and demographic be-
haviour. Previuosly, data were available for individuals (censuses) or
for women (PFS 1975, NIS 1968) and the Labour Force and Income and Ex-
penditure Surveys by themselves were rather scanty in their household
level.information about areas other than labour force or income and ex-
penditure. This attempt at linking four modules fits in well with the
established consensus in recent years that an inter-disciplinary app-
roach was necessary to analyze household behaviour more meaningfully.
Sample Description:
The distribution of households sampled is given below in Table
1 however, out of the 11288 households in the sample only 10244 were act-
ually enumerated, the remainder consisted of households whore there was
no . response. The sampling was done on the basis of the 1972 census samp-
ling frame, adjusted for the estimated population in 1979-80. Howavor,
the rural-urban distribution did not match with t one found in the
sus. The urban population was infact oversampled and consequently "rai-
sing factors" need to be used when national estimates are derived from
the sample. The 10244 households actually enumerated, were administered,
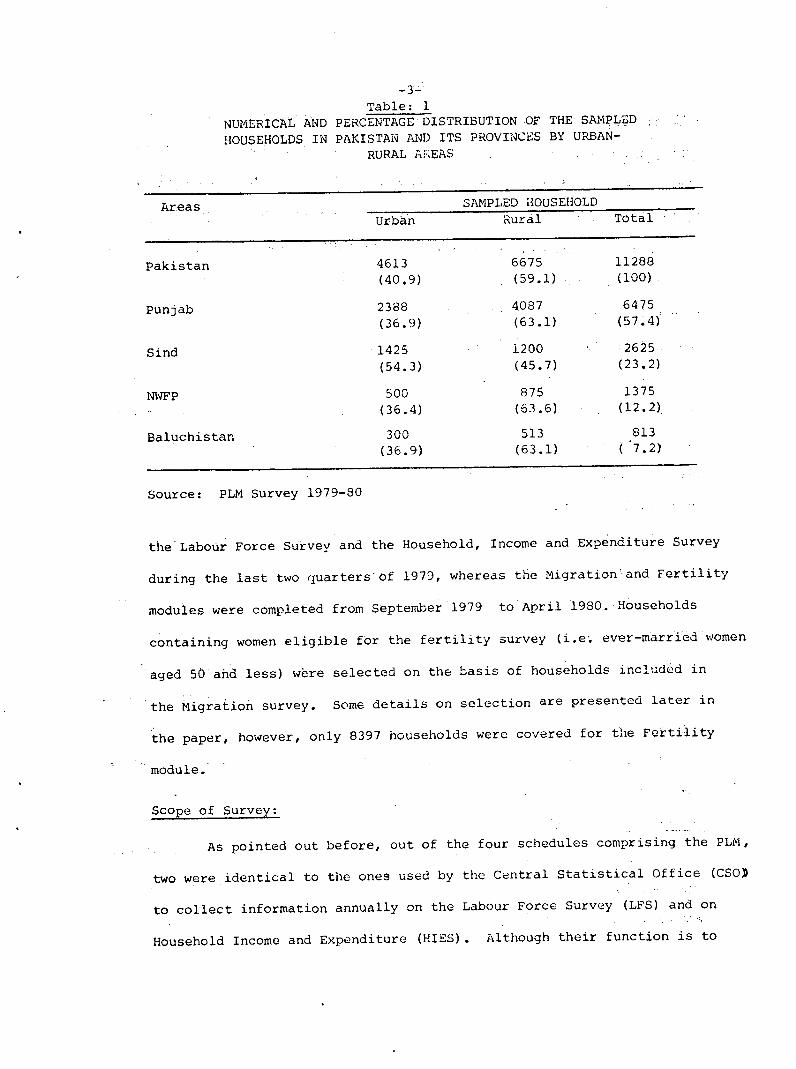
-3-Table: 1
NUMERICAL AND PERCENTAGE DISTRIBUTION :OF THE SAMPLED
HOUSEHOLDS IN PAKISTAN AND ITS PROVINCES BY URBAN-RURAL A!EAS
Areas SAMPLED HOUSEHOLD
Urban Rural Total
Pakistan 4613 6675 11288
(40.9) (59.1) (100)
2388 4087
(36.9) (63.1)
1425 1200
(54.3) (45.7)
6475(57.4)
2625(23.2)
Punjab
Sind
NWFP 500 875 1375
(36.4) (63.6) (12.2)
Baluchistan 300 513 813
(36.9) (63.1) ( 7.2)
Source: PLM Survey 1979-80
the Labour Force Survey and the Household, Income and Expenditure Survey
during the last two quarters of 1979, whereas the Miqrationafld Fertility
modules were completed from September 1979 to April 1980.-Households
containing women eligible for the fertility survey (i.e ever-married women
aged 50 and less) were selected on the basis of households included in
the Migration survey. Some details on selection are presented later in
the paper, however, only 8397 households were covered for the Fertility
- module.
Scope of Survey: - -
As pointed out before, out of the four schedules comprising the PLM,
two were identical to the ones used by the Central Statistical Office (CSO
to collect information annually on the Labour Force Survey (LFS) and on
Household Income and Expenditure (HIES). Although their function is to
-4-
collect time series data, which is annually comparable, the last Labour
Force Survey had been conducted in 1974-75and the last Income and Expen-
diture Survey in 1971-72. Despite the lamentable gap in the time sexies,
it is still qiit&fothnate that thetwoschedules-ara comparable with
data from past periods. Similarly, the Fertility Schedule was identical to
the one administered under the Pakistan Fertility Survey of 1975 and thus
trends in fertility and related characteristics are directly comparable
from 1975 to five years latar. The miaration questionnaire is not compa-
rable with any other survey. The schedule was especially dosignd for the
PLM with separate components for non-migrants, potential migrants, in-mig-
rants, out-migrants and return-migrants. The data thus collected are
unique as such detailed national level information on migrants has been
unavailable so far. Particularly th possibility of matching all four
schedules allows us mor information on fertility of migrants, of incoxmu
and expenditure behaviour of migrants etc.
It is our intention to provide an overview of tho findings from the
four schedules. No multivariate analysis has been carried out, and th
report is by and large a descriptive piece of work. However, in places
figures from the PLM have been supplemented by data from comparable sources.
This report is organized into eight sections, dealing with age and sex
structure, household structure, marital structure, education, labour force,
income and expenditure, migration and finally, fertility behaviour.
Age and Sex Structure:
The age and sex composition of a survey population is the first item
examined in this report. If the sample is, as in this case, thought to be
nationally representative, then it gives us an idea of the structure of
-5-
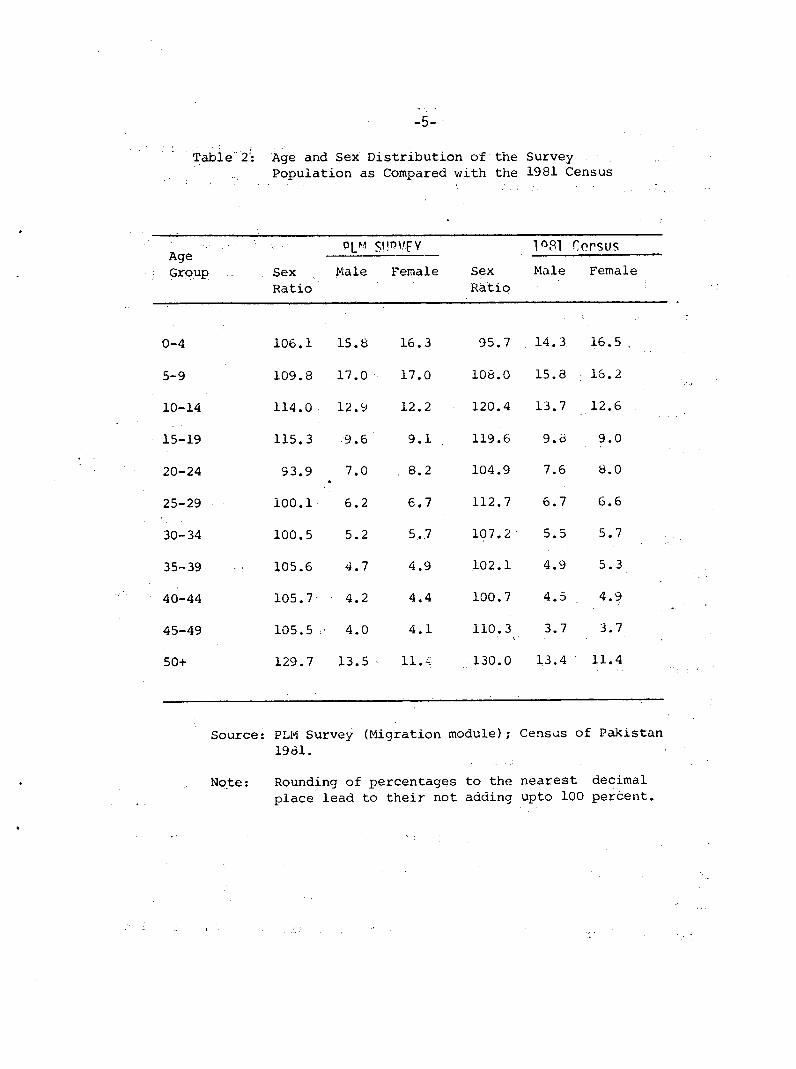
Table 2: Age and Sex Distribution of the Survey
• SPopulation as Compared with the 1981 Census
AgePL" SI!"FV 1°S1 Cersus
Group Sex Male Female Sex Male FemaleRatio Ratio
0-4 106.1 15.8 16.3 95.7 14.3, 16.5
5-9 109.8 17.0 17.0 108.0 15.8 . 16.2
10-14 114.0. 12.9 12.2 120.4 13.7 12.6..
15-19 115.3 9.6 9.1 119.6 9.3 9.0
20-24 93.9 7.0 8.2 104.9 7.6 8.0
25-29 100.1 6.2 6.7 112.7 6.7 6.6
30-34 100.5 5.2 5.7 107.2 5.5 5.7
35-39 - . 105.6 4.7 4.9 102.1 4.9 5.3
40-44 105.7 4.2 4.4 100.7 4.5 4.9
45-49 105.5 4.0 4.1 110.3 3.7 3.7
50+ 129.7 13.5 . 11.4 130.0 13.4 11.4
Source: PLM Survey (Migration module); Census of Pakistan1981.
Note: Rounding of percentages to the nearest decimalplace lead to their not adding upto 100 percent.
the Pakistan population, Age-sex data from the PLr1 ought also to be fairly
comparable to population data colicctd in the 1981 Census Table 2 pre-
sents the results for both sources.
The .ae . ,n sex distribution from the sample survey and th Census
is s1ight1ydice"nt:in the PLM a higher - proportion of the population is
under 15 as compared to the Census. The differences appear more so in
the sex distribution of the two populations. Whereas the Census finds a
deficit of males in the 0-4 category, this is not the case for the PLM
figures. The findings of the 1981 Census are puzzling since it is only
at ages less than one year that male mortality is higher than female more-
tality and after age 1 the pattern by sex is reversed Lln and Cleland, 19847..So a relative deficit of male children may be due to distortions--' in age
reporting. On the other hand, the PLM contains an excess of women in the
20-24 age group, which may be due to excessive mole migratiox in that
group. However, the Census shows no such irregularity. Generally, apart
from these two exceptions, there are more men than women in all the brood
5 year age groups because of lower male mortality. However, this excess
is greatest in the 50+ age where both in the Census and the PLM there is
an almost' 30 erànt'ee' of males. W sx Tti'o's also quite high
for the 10-14 and 15-19 groups.
' table 3 conthins the age-sex distribUtions for urban-rural areas. It
is interesting to note that the deficit of males in the 20-24 group, noted
in the aggregate table for all Pakistan, is quite sharp in rural areas
and is accompanied by a fairly high sex ratio in urban areas. This may
reflect rural-urban and rural to out-migration. A slight deficit of males
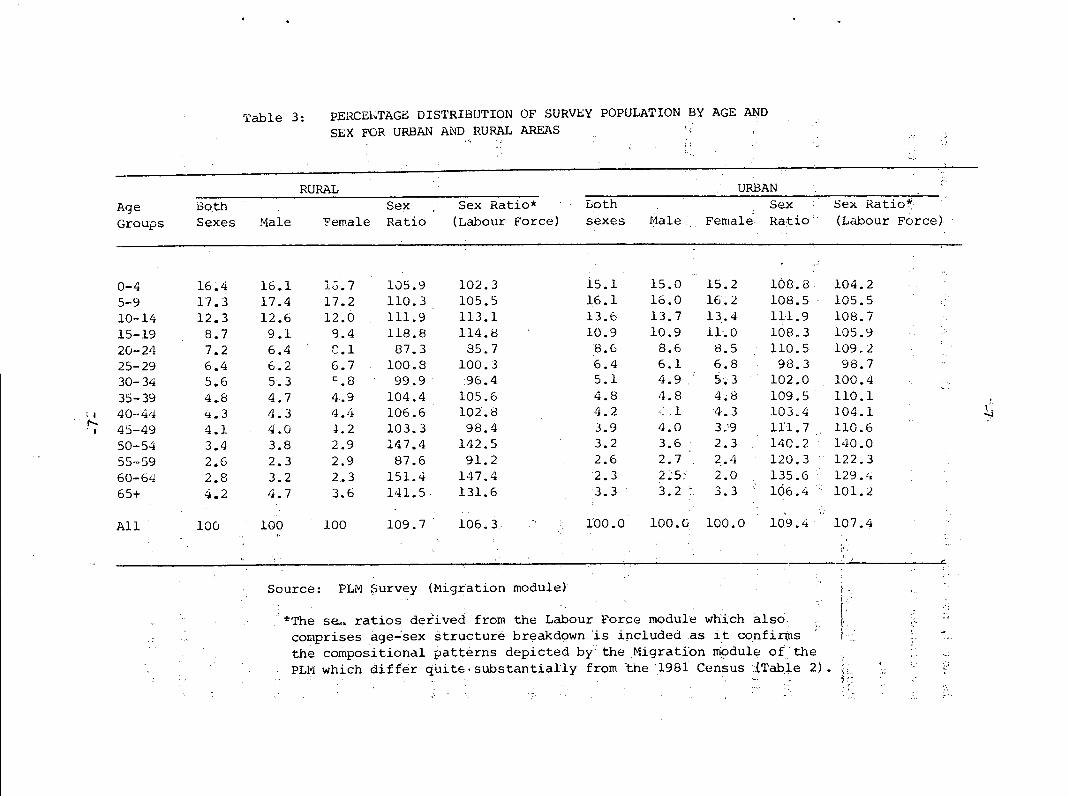
Table 3: PERCE1TAGE DISTRIBUTION OF SURVEY POPULATION B y AGE ANDSEX FOR URBAN AND RURAL AREAS
RURAL SURBAN
Age Both Sex Sex Ratio* Both Sex Sex Ratio
Groups Sexes Male Female Ratio (Labour Force) sexes Male. Female Ratio (Labour Force)
16.1 13.7 105.9 102.3 15.1 15.0 15.2 108.8 104.2
17.4 17.2 110.3 105.5 16.1 16.0 16.2 108.5 ' 105.5
12.6 12.0 111.9 113.1 13.6 13.7 13.4 111.9 108.7
9.1 9.4 118.8 114.8 10.9 10.9 11.0 108.3 105.9
6.4 0.1 87.3 85.7 8.6 8.6 8.5 110.5 109.2
6.2 6.7 100.8 100.3 6.4 6.1 6.8 98.3 98.7
5.3 C.8 99.9 :96.4 5.1 4.9 5.3 102.0 100.4
4.7 4.9 104.4 105.6 4.8 4.8 4.8 109.5 110.1
4.3 4.4 106.6 102.8 4.2 1 4.3 1034 104.1
4.0 3.2 103.3 98.4 3.9 4.0 3.9 111.7 110.6
3.8 2.9 147.4 142.5 3.2 3.6 2.3 140.2 140.0
2.3 2.9 87.6 91.2 2.6 2.7 2.4 120.3 122.3
3.2 2..3 151.4 147.4 2.3 25: 2.0 - 135.6 129.4
4.7 3.6 141.5 131.6 3.3 3.2 3.3 106.4 101.2
100 100 109.7 106.3. -. 100.0 100.6 100.0 109.4 107.4
Source: PLM Survey (Migration module)
*The see. ratios deived from the Labour Force module which alsocomprises Age- sex structure breakdown 'is included as it confirnsthe compositional patterns depicted by the Migration module of thePLM which differ quite substantially from the 1981 Census (Table 2)
0-4
16.45-,9
17.310-14
12.315-19
8.720-24
7.2
25-29
6.4
30-34
5.635-39
4.840-4/445-49
4.150-54
3.455-59
2.660-64
2.865+
All
100
-8-
is noted, however, in the urban artas thcnselves in the 25-29 group and
may congruously r;eflect substantial external migration of nvilcs at these
ages.
Household Structure:
As pointed out in the introduction, the unit on the basis of which
information was collected in the PLM was the household. Usually the defi-
nition' of household is "a single person living alone or group of persons
who normally live and eat together" /HUES 19797. 'However the living
situation varies enourmously accross cultures and it is at time difficult
to discern betwen those persons sharing a roof but who do not ven eat
together (a boarding house) with an extended family living on street
pavement.. The examples are rather extreme but are included to highlight
the problems of defining a household and accordingly to be aware of -
differences in household size which may result. -
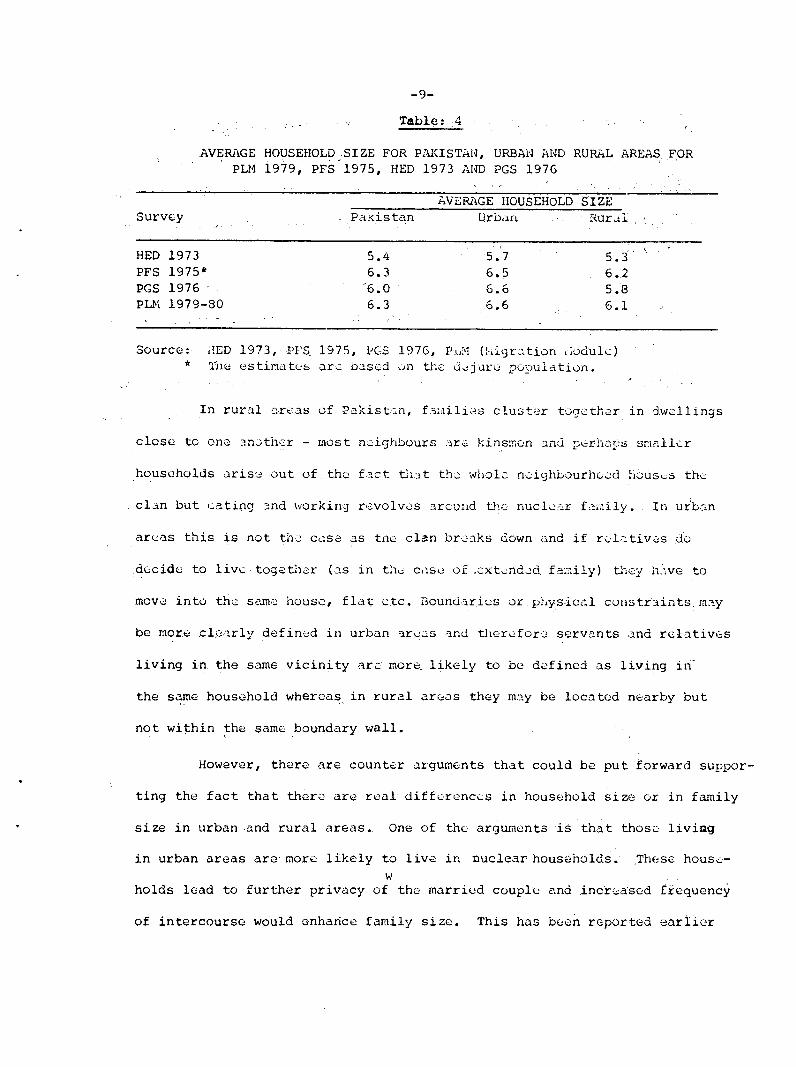
Table ,4 contains average household size as calculated by previous
surveys, alongwitl- the PLM, for all Pakistan and for urban and rural areas
separately. The PLM has the same average household size of 6.3: as the
PFS 1975. Also dverage households are larger in. urban areas than in rural
areas This differential is also found in all the three sources cited in
-.the table. It has been 'found that other Asian countries also record this
pattern of higher average household size in urban areas and in 'a cross-
national study this finding was attributed to the larger presence of non-
family members, i.e., relative and domestic servants and thb shortage of
housing in urban areas LKbir, 1980/. As alrcidy pointed.out, the cultural
set up in urban and rural areas may differ also leading to a large discre-
pancy in the app]Iicability of definition of what contitutes a household.
-9-
Table: 4
AVERAGE HOUSEHOLD SIZE FOR PAKISTAN, URBAN AND RURAL AREAS FORPLM 1979, PFS 1975, NED 1973 AND PGS 1976
AVERAGE HOUSEHOLD SIZESurvey - Pakistan Urban Rural
HED 1973 5.4 5.7 5.3PFS 1975* 6.3 6.5 6.2PGS 1976 6.0 6.6 5.8PLM 1979-80 6.3 6.6 6.1
Source: ED 1973,.PFS 1975, PCS 1976, Pi! (higration 1iodula)* The estimatQb era based an the cijura pcouiatiun.
In rural nras of Pakistan, fa:tilies cluster together in dwellings
close to one nthor - most neighbours are kinsmen and porhes smallor
households arise out of the fact that th wh1e neighbourhood hous the
clan but eating and working revolves around the nuclear faaiily. In uban
areas this is not the case as tno clan breaks down and if relatives do
decide to live together ( .as in th case of axtnded. faaiily) they have to
move into the same house, flat etc. Boundaries or physical constraints, may
be mor, c1ar1y defined in urban areas and therefore servants and relatives
living, in the same vicinity are more, likely to be defined as living in
the same household whereas in rural areas they may be located nearby but
not within the same boundary wall.
However, there are counter arguments that could be put forward suppor-
ting the fact that there are real' differences in household size or in family
size in urban and rural areas. One of the arguments is that those living
in urban areas are- more likely to live in nuclear households. These house-w
holds lead to further privacy of the married couple and increased frequency
of intercourse would enhance family size. This has been reported earlier
-10-.
in a study based on the National Impa Svey LKerim 1974/. Marital
fertility has also been noted to be higher in urban areas in Pakistan
/Sathar 19797 4 lso mortality-in urban areas is substantially lower than
in rural areas and would lead to greater survivorship of household mem-
bers LAlam and Cleland 19847..
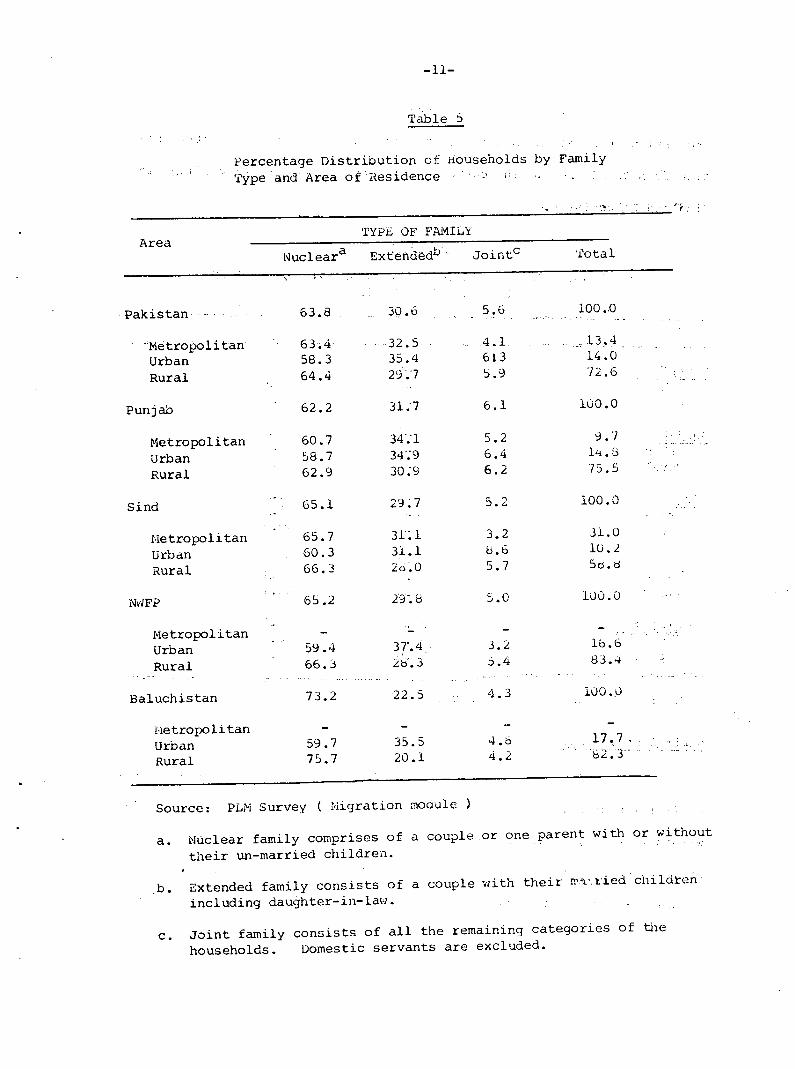
The PLM finds that most (64%) households are classified as
nuci-e-ar- in Pakistan. The PLi1 also found that a greater proportion of nu-
clear households were located in rural areas (64.4%) than in urban areas
(58.3%). This seems anamolous with regard to the modernization argument.
Also if shifts were taking place towards nuclearization of families should
this not be happening more in urban areas? However, with respect to our
own argument that to live together families need to share the same house-
hold or boundaries of a house more so in urban than in rural areas - the
evidence confirms that there is a greater proportion of joint and extended
families in urban areas (41.7%) whereas in rural areas the corresponding
proportion is (35.6). The metropolitan areas lie in between with a
larger share than urban areas of nuclear households but lower than the
proportion observed in rural areas. This pattern of differentials in
nuclear versus extended and joint households, as seen in Table 5, occurs
across provinces of Sind and Punjab (in NWFP and BalucFtan, there are no
metropolitan areas).
Another aspect of households which is of interest is the gender of
the head particularly as house headship in Pakistan is likely to be a male
responsibility and only exceptional circumstances would lead to a woman
taking it over. Table 6 shows a slightly higher proportion of female
heads exist in rural areas; amongst the provinces, rWFP has the highest
-11-
Table 5
Percentage Distribution of nouseholds by FamilyType and Area of Residence S
TYPE OF FAMILYArea
Nuclear Extendedb - JointcTotal
Pakistan 63.8 30.6 5.6 100.0
Metropolitan '- 63.4 32.5 4.1.13.4
Urban 58.3 35.4 613 14.0
Rural 64.4 29..7 5.9 72.6
Punjab 62.2 31.7 6.1 i00.0
Metropolitan 60.7 34.1 5.2 9.7
Urban 58.7 349 6.4 l'i
Rural 62.9 30:9 6.2 75.5
Sind 65.1 29.7 5.2 100.0
Metropolitan 65.7 311 3.2 31.0
Urban 60.3 31.1 8.6 10.2
Rural 66.3 200 5.7 So.d
29.8 5.0 100.0flflA
MetropolitanUrbanRural
Baluchistan
i.ietropolitanUrbanRural
59.4 37•.4 3.2
663 4bJ 54
73.2 22.5 4.3
59.7 35.575.7 20.1 4.2
lo.683.4
100.0
17.7..
Source: PLM Survey ( Migration module )
a. Nuclear family comprises of a couple or one parent with or without
their un-married children.
b. Extended family consists of a couple with their ir'.ied ciii1den
including daughter-in-law. -
c. Joint family consists of all the remaining categories of the
households. Domestic servants are excluded.
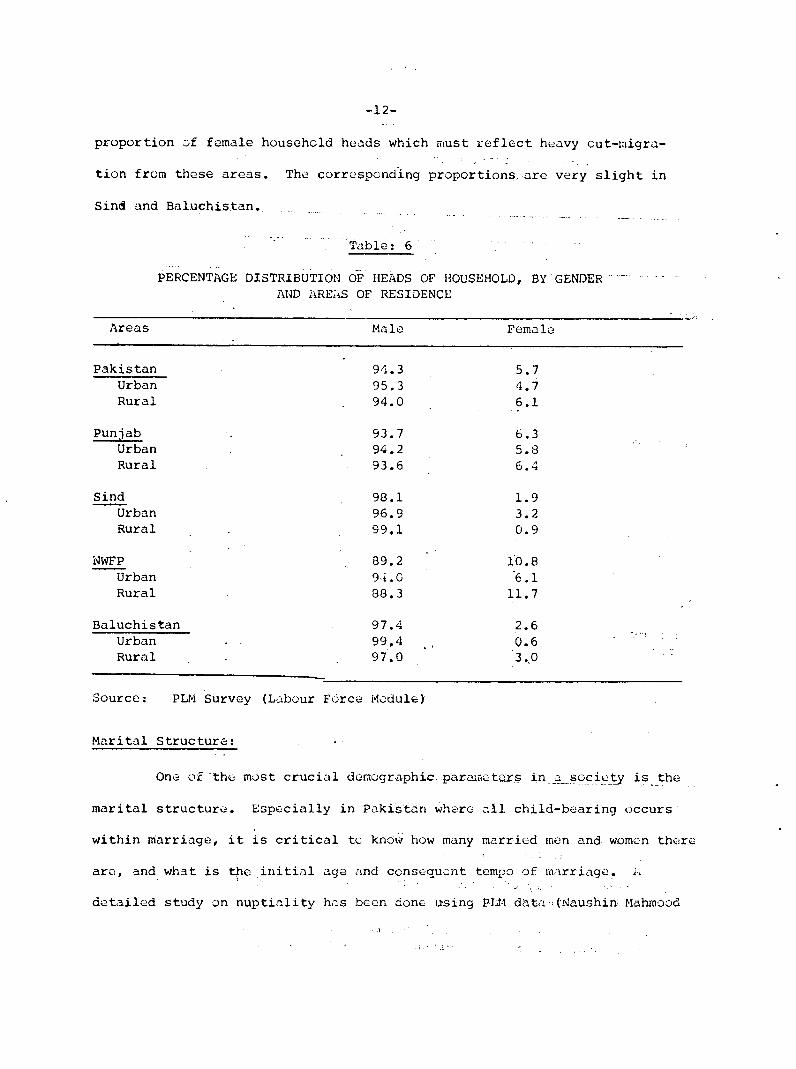
-12-
proportion of female household heads which must reflect heavy out-migra-
tion from these areas. The corresponding proportions are very slight in
Sins and Baluchistan.
Table: 6
PERCENTAGE DISTRIBUTION OF HEADS OF HOUSEHOLD, BY GENDERAND AREAS OF RESIDENCE
Areas Male Female
PakistanUrbanRural
PunjabUrbanRural
SindUrbanRural
NWFPUrbanRural
BaluchistanUrbanRural
94.3
5.7
95.3
4.7
94.0
6.1
93. 7
94.2
5.8
93.6
6.4
98.1
1.9
96.9
3.2
99.1
0.9
89.2
10.8
94.0
6.1
88.3
11.7
97.4
2.6
99.4
0.6
97.0
3.0
Source: PLM Survey (Labour Force Module)
Marital Structura:
One of the most crucial demographic paraieters inasocity is the
marital structure. Especially in Pakistan where all child-bearing occurs
within marriage, it is critical tc kn04 how many married men and women there
are, and what is the initial age and consequont tempo of marriage.
detailed study on nuptiality has been done using PLt1 data (Naushin. Mahrnood
-13-
and Mubashjr 1983), however, it relied mainly on data from the fertility
questionnaire dealing only with ever-married women of re productive ages
for most of the analysis Here we utilize the data from the Migration
survey on marital status' of àllhousehbid members. Also we present
figures for men and women whereas the abOve mentioned report relied mostly
onnuptiality data. for females.'
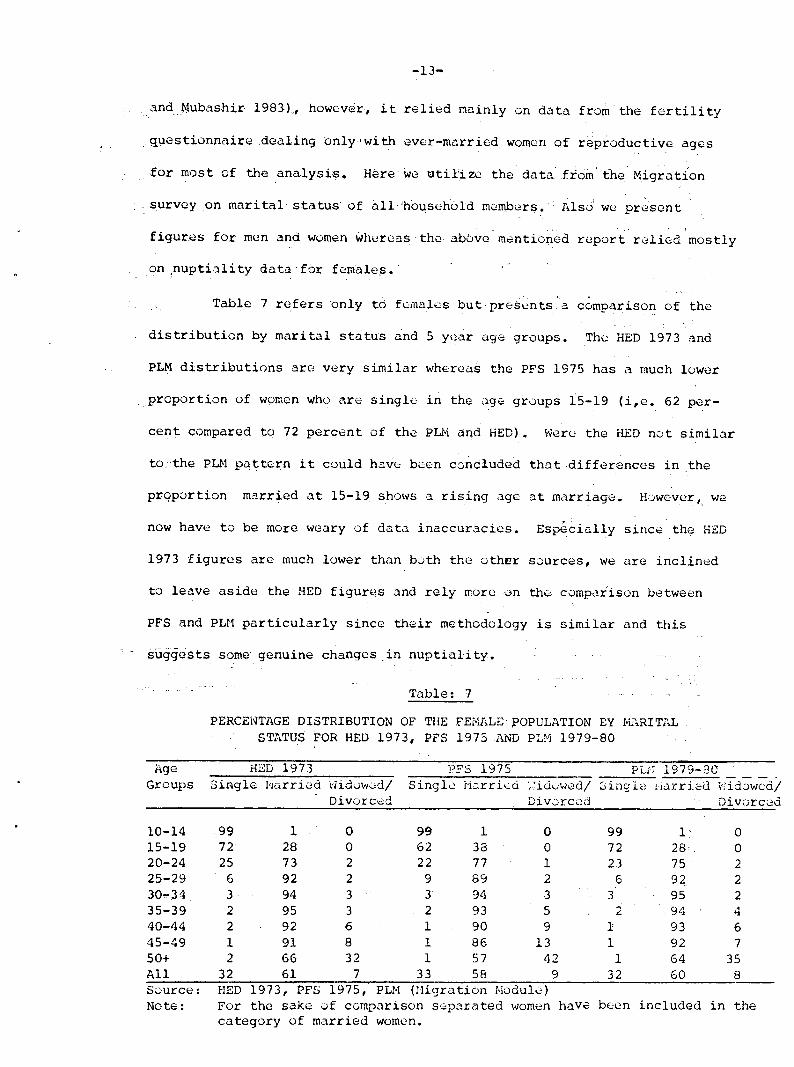
Table 7 refers only to females but presents a comparison of the
distribution by marital status and 5 yothr age groups. The lIED 1973 and
PLM distributions are very similar whereas the PFS 1975 has a much lower
proportion of women who are single in the age groups 15-19 (i,e. 62 per-
cent compared to 72 percent of the PLM and lIED). Were the lIED not similar
to;the PLM pattern it could have been concluded that differences in the
prQportion married at 15-19 shows a rising age at marriage. However, we
now have to be more weary of data inaccuracies. Especially since the MED
1973 figures are much lower than both the other sources, we are inclined
to leave aside the MED figures and rely more on. the comparison between
PFS and PLM particularly since their methodology is similar and this
- sügests some genuine changes in nuptiality.
Table: 7
PERCENTAGE DISTRIBUTION OF THE FEMALE' POPULATION El MARITALSTATUS FOR HED 1973, PFS 1975 AND PLM 1979-80
Age lIED 1973 PFS 1975 PL' 1979-90 - -Groups Single Married Widowod/ Single harried idied/ 3inqi L .ia)-ric2d !idowcd/
Divorced Divorced Divorced
1014 99 1 0 99 1 0 99 1 015-19 72 28 0 62 38 0 72 28. 020-24 25 73 2 22 77 1 23 75 225-29 ' 6 92 2 9 89 2 6 92 230-34 3 94 3 ' 3 94 3 3 95 235-39 2 95 3 2 93 5 2 94 440-44 2 92 6 1 90 9 I 93 645-49 1 91 8 1 86 13 1 92 750+ 2 66 32 1 57 42 1 64 35All 32 61 7 33 58 9 32 60 8Source: HIED 1973, PFS 1975, PLM (Migration Module)Note: For the sake of comparison separated women have been included in the
category of married women.
- -14-
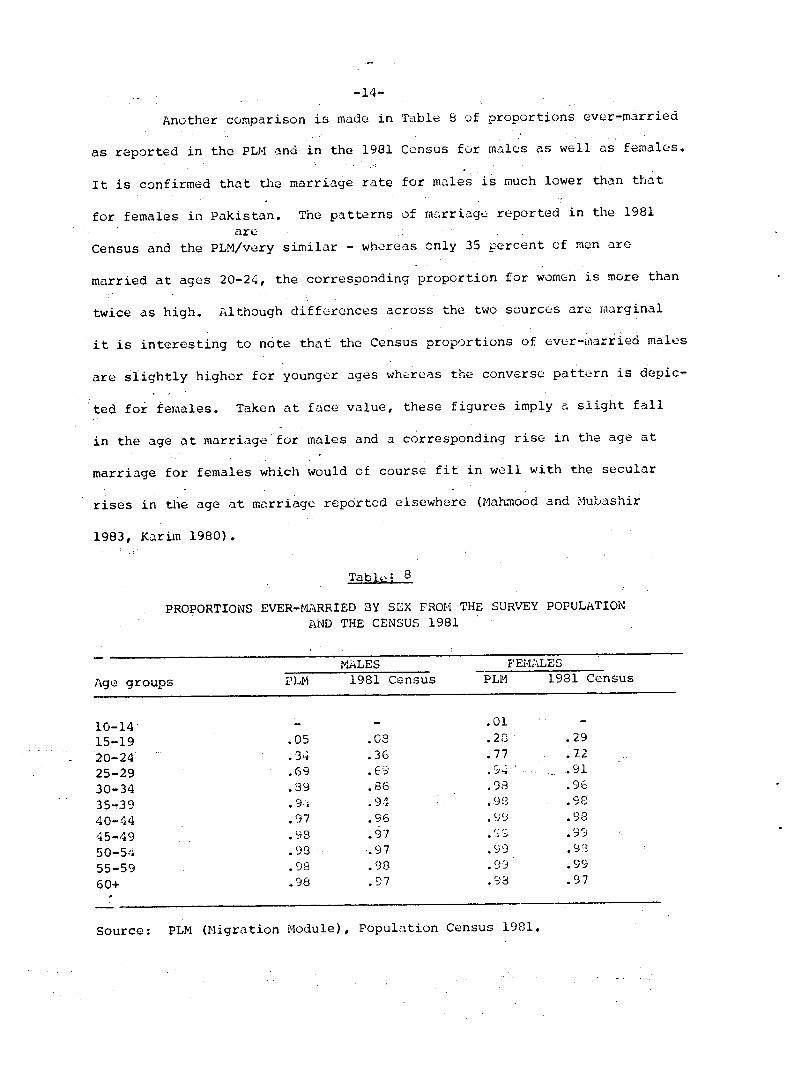
Another comparison is made in Table 9 of proportions ever-married
as reported in the PLM and in the 1981 Census for males as well as females.
It is confirmed that the marriage rate for males is much lower than that
for females in Pakistan. The patterns of marriage reported in the 1981are
Census and the PLM/very similar - whereas Only 35 percent of men are
married at ages 20-24, the corresponding proportion for women is more than
twice as high. Although differences across the two sources are marginal
it is interesting to note that the Census proportions of ever-married males
are slightly higher for younger ages whereas the converse pattern is depic-
ted for females. Taken at face value, these figures imply a slight fall
in the age at marriage for males and a corresponding rise in the age at
marriage for females which would of course fit in well with the secular
rises in the age at marriage reported elsewhere (Mahinood and Nubashir
1983, Karim 1980).
Tab1 8
PROPORTIONS EVER-MARRIED BY SEX FROM THE SURVEY POPULATIONAND THE CENSUS 1981
- MALES - FEMALES
Age groups PLM 1981 Census PLM 1981 Census
10-14' - - .01 -
15-19 .05 .03 .20 .2920-24 .34 .36 .77 .12
25-29 .69 .E' .4 .91
30-34 .39 .36 .98 .96
35-39 .9.. .94 .99 .98
40-44 .97 .6 .99 .98
45-69 .98 .97
50-54 .99 ..97 .99 .9?
55-59 .98 .98 .99 .99
60+ .98 .97 .93 .97
Source: PLM (Migration Module), Population Census 1981.
-13-
Educational -Structure---:
- Eduati 1aimed to be one of the poorest pdrformance ectors
in Pak•istan. Th? meagre expenditure allocated to it by the Government,
alonqwith the massive expansion of the school going populationhas lcd
to no marked improvements in the proportion of persons literate over the
years. However, literacy levels can vary according to definitions used
(Mahmood 1978). In this section we will describe the population classi-
fied by age and sex according to their , lovels of educational attainment.
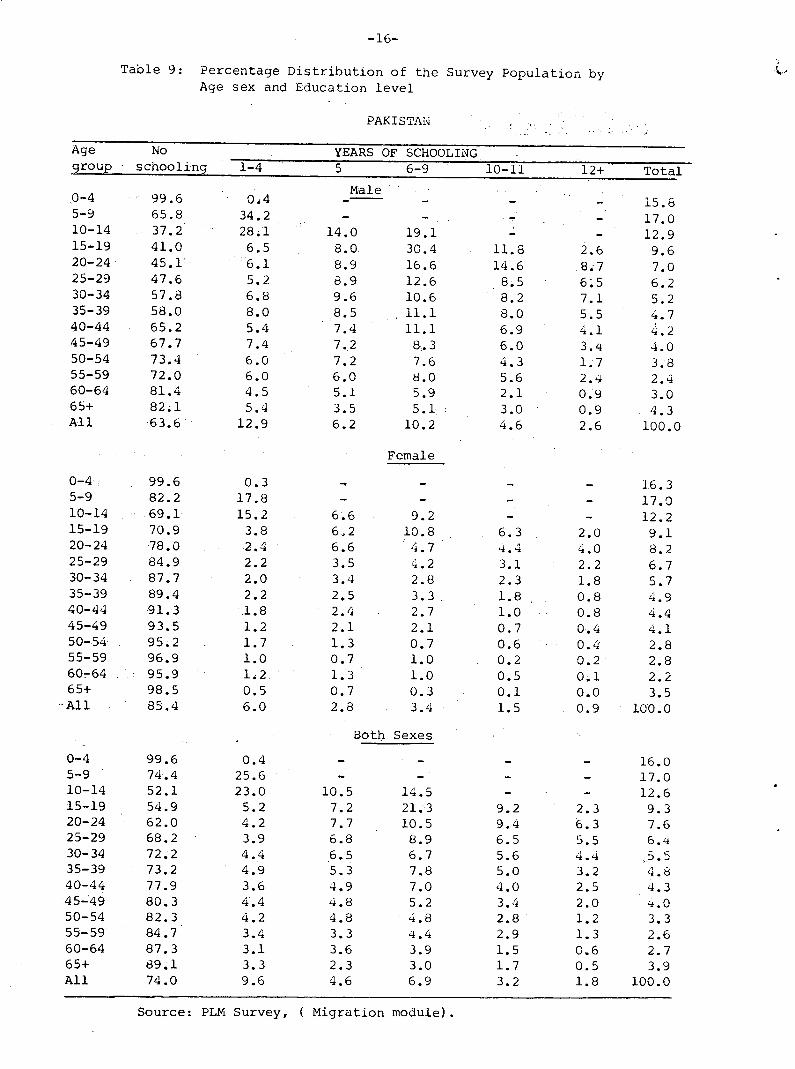
The figures shown in Table 9 are distressing: by ages 5-9, 35%. of boys
and only 18 percent of girls had attended school. The disparities in edu-
cational attainment become more accute with a ge. For instance, for the
-age group 15-19, 59 percent boys had some schooling and about- 1 -1 percent
had more than primary schooling - the corrspondiñg figures for girls were
-29 percent and 24 percent. However, at age 30-33-, 42 percent males had had
some schooling whereas only .12 percent of females had attended school in
that age-group. Looking at overall totals, 64 percent of males had no edu-
-cation while 2.6 percent had-more than 12 years schooling. Correspondingly
.for females the proportions were 85 percent and O-. percent resectively.-
-Thus not only are overall educational achievements level low in Pakistan but
females suffer exceedingly lower levels of attainment; There is evidence
that inequalities in educational attainment across the sexes are impro-
ving some.what. Also evidence exists that higher percentages of both sexes
are receiving education over the years as can be seen by the lesser pro-
.porticns of uneducated younger persons. Apart from the glaring sex
differentials in education, which are based mainly on demand considerations
such as lower emphasis on educating girls due to the unlikelihood of their
-16-
Table 9: Percentage Distribution of the Survey Population byAge sex and Education level
PAKISTAN
Age No YEARS OF SCHOOLINGgroup - schooling 1-4 5 6-9 10-11 12+ - Total
0-4 99.6 04- Male - - - 15.6
5-9 65.8 34.2 - - - - 17.010-14 37.2 28.1 14.0 19.1 - - 12.915-19 41.0 6.5 8.0 30.4 11.8 2.6 9.620-24 45.1 6.1 8.9 16.6 14.6 8.7 7.025-29 47.6 5,2 8.9 12.6 8.5 6;5 6.230-34 57.8 6.8 9.6 10.6 8.2 7.1 5.235-39 58.0 8.0 8.5 11.1 8.0 5.5 4.740-44 65.2 5.4 . 7.4 11.1 6.9 4.1 4.245-49 67.7 7.4 7.2 8.3 6.0 3.4 4.050-54 73.4 6.0 7.2 7.6 4.3 1.7 3.855-59 72.0 6.0 6.0 8.0 5.6 2.4 2.460-64 81.4 4.5 5.1 5.9 2.1 0.9 3.06+ 82.1 5.4 3.5 5.1 3.0 0.9 4.3All 63.6 12.9 6.2 10.2 4.6 2.6 100.0
Female
0-4. 99.6
0.3
J6. 35-9
82.2
17.8 17.010-14
69.1
15.2
6.6
9.2
12.215-19
70.9
3.8
62
10.8
6.3
2.0
9.120-24
78.0 .2.4
6.6
4.7 '-1. 4
4.0
8.225-29
84.9
2.2
3.5 ,. 2 3.1
2.2
6.730-34
87.7
2.0
3.4
2.8
2.3
1.8
5.735-39
89.4
2.2
2.5
3.3
1.8
0.8
4.940-44
91.3
1.8
2.4
2.7
1.0
0.8
4.445-49
93.5
1.2
2.1
2.1
0.7
0.4
4.150-54
95.2
1.7
1.3
0.7
0.6
0.' 2.855-59
96.9
1.0
0.7
1.0
0.2
0.2
2.860-64
95.9
1.2
1.3
1.0
0.5
0.1
2.265+
98.5
0.5
0.7
0.3
0.1
0.0
3.5All
85.4
6.0
2.8
3.4
1.5
0.9
100.0
Both Sexes
0-4
99.6
0.4
16.05-9
74.4
25.6
17.010-14
52.1
23.0
10.5
14.5
12.615-19
54.9
5.2
7.2
21.3
9.2
2.3
9.320-24
62.0
4.2
7.7
10.5
9.4
6.3
7.625-29
68.2
3.9
6.8
8.9
6.5
5.5
6.30-34
72.2
4.4
6.5
6.7
5.635-39
73.2
4.9
5.3
7.8
5.0
3.2
4.840-44
77.9
3.6
4.9
7.0 11.0
2.5
4.345-,49
80.3
4.4 4.8
5.2 3.4
2.0 4.050-54
82.3
4.2
4.8
4.8
2.8
1.2
3.355-59
84.7
3.4
3.3 '4.4
2.9
1.3
2.660-64
87.3
3.1
3.6
3.9
1.5
0.6
2.765+
89.1
3.3
2.3
3.0
1.7
0.5
3.9All
74.0
9.6
4.6
6.9
3.2
1.8
100.0
Source: PLM Survey, ( Migration module).
—'17-
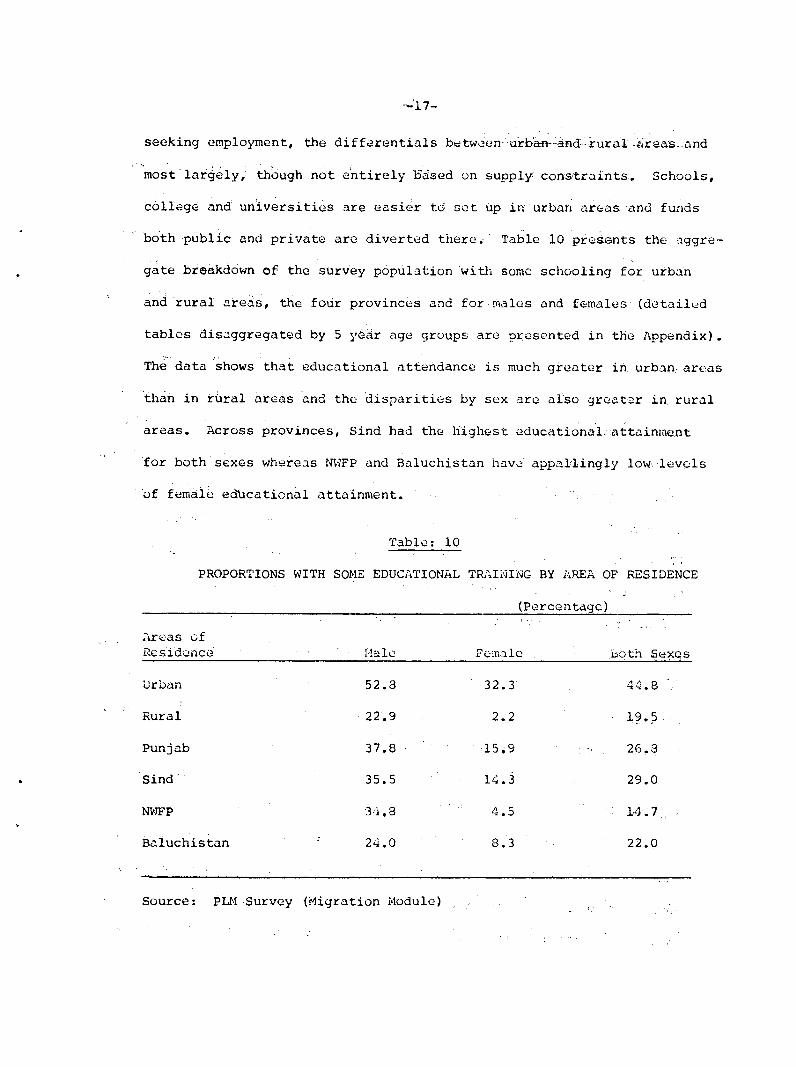
seeking employment, the differentials
most'larely, though riot eitire'ly 1sed on supply constraints. Schools,
college and universities are easier td sot up in urban areas and funds
both public and private are diverted there. Table 10 presents the aggre-
gate bekdown of the survey population with some schooling for urban
and rural areas, the four provinces and for males and females (detailed
tables disaggregated by 5 ydar age groups are presented in the Appendix).
The data shows that educational attendance is much greater in urban. areas
than in rural areas and the disparities by sex are also greatar in, rural
areas. Across provinces, Sind had the highest educational, attainment
for both sexes whereas NWFP and Baluchistan havo appallingly low 'levels
of female edcatjonal attainment. -
Table: 10
PROPORTIONS WITH SOME EDUCATIONAL TRAINING BY AREA OF RESIDENCE
(Percentagc)
Aras offlesidorice ' ' Halo Female Ioth Sxos
Urban 52.8 32.3 44.9
Rural 22.9 2.2 19.57
Punjab
37..8
15.9
26.3
Sind''
35.5
14.3
29.0
NWFP
34,8
4.5
14.7
Baluchistan
2.0
8.3
22.0
Source: PLM-Survey (Migration Module) , '
-18-
Labour Force Participation:
The Labour Force Surveys standard schedule provides data on par-
ticipation in the work force for all persons aged 10 and above. The
questionnability of the definition of work used has been discussed else-
where /Shah and Sathar 19787. But it is essential to point out that this
may be a consideration when interpreting labour force participation rates,
particularly in the case of females as their work rates appear to be
exceedingly low in Pakistan. Table 11 gives the detailed breakdown of
labour force participation rates by sex and urban-rural residence. Most
men partiiptte in the labour force after the age of 25 and rates begin
to taper offonly after the official retirement ago between 55 and 60.
Even at ages 65 and above more than half of all men work. This is not
the case for females where labour force participation rates do not exceed
17 percent for any age group and are generally around 12 percent. The
female labour force participation rates are even lower in urban areas
(at around 6 percent) and slightly higher than the national average in
rural areas at about 16 percent. Labour force participation rates for males
are about the same in rural and urban areas except more boys aged 10-19
work in the rural areas. Also the attrition rate is faster in urban areas
whereas in rural areas, men continue working longer.
Apart from aggregated data on participation in the labour force,
the module on labour force provides details of employment of heads of
households and other members of the household. Characteristics of workers
such as their employment status (whether they are employees, employers,
unpaid workers etc.), their occupation and industry and numbr of hours
worked were asked in the Labour Force Schedule. This information allows
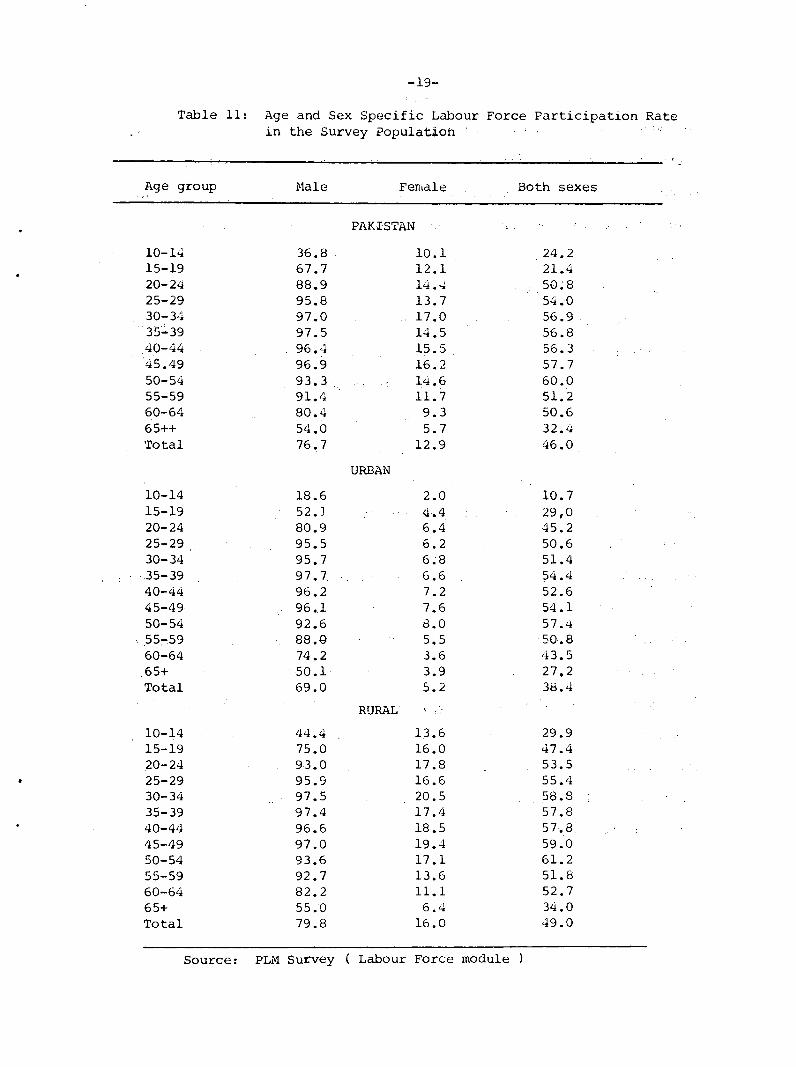
Table 11: Age and Sex Specific Labour Force Participation Ratein the Survey Popü1atori
Age group Male Female Both sexes
PAKISTAN
10-14 36.8 10.1 24.215-19 67.7 12.1 21.420-24 88.9 14.4 50825-29 95.8 13.7 54.030-34 97.0 .. 17.0 56.935-39 97.5 14.5 56.840-44 96.4 15.5 56.345.49 96.9 16.2 57.750-54 93.3 . 1.6 60.055-59 91.4 11.7 51.260-64 ., 80.4 9.3 50.665++ 54.0 5.7 32.4Total 76.7 12.9 46.0
10-1415-1920-2425-2930-3435-3940-4445-4950-54.55-5960-64.65+Total
10-1415-1920-2425-2930-3435-3940-4445-4950-5455-5960-6465+Total
URBAN
2.0: 44
6.46.26;86.67.27.68.05.53.63.95.2
RURAL
13.616.017.816.620.517.418.519.417.113.611.16.416.0
10.729,045.250.651.454.452.654.157.50.843.527,238.4
29.947.453.555.458.857.857.8.59.061.251.852.734.049.0
18.652.180.995.595.797.7
96..192.688.74.250.169.0
44.475.093.095.997.597.496.697.093.692.782.255.079.8
Source: PLM Survey ( Labour Force module
- -20-
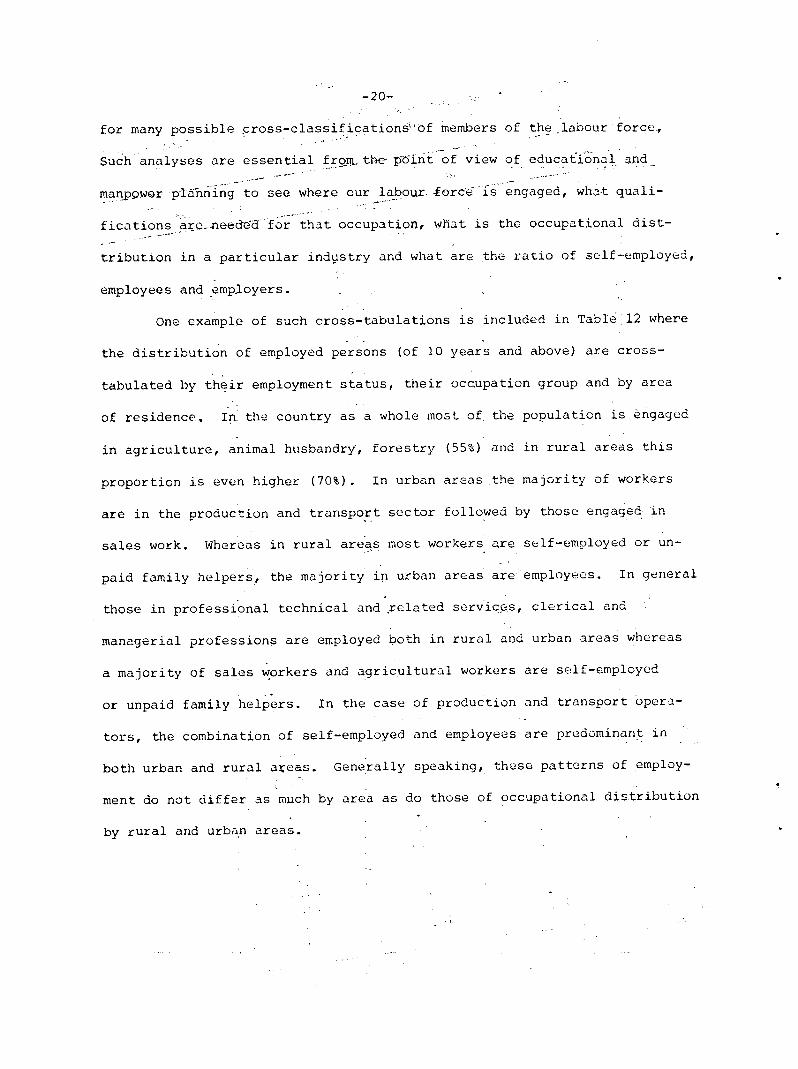
for many possible ross-classificationsof members of the labour force,
Such analyses are essential frgrn the- piDint of view of educational and
manpwr pla-nning to see where our labour -force is engaged, what quali-
fications are -needed for that occupation, what is the occupational dist-
tribution in a particular industry and what are the ratio of self-employed,
employees and .employers. -
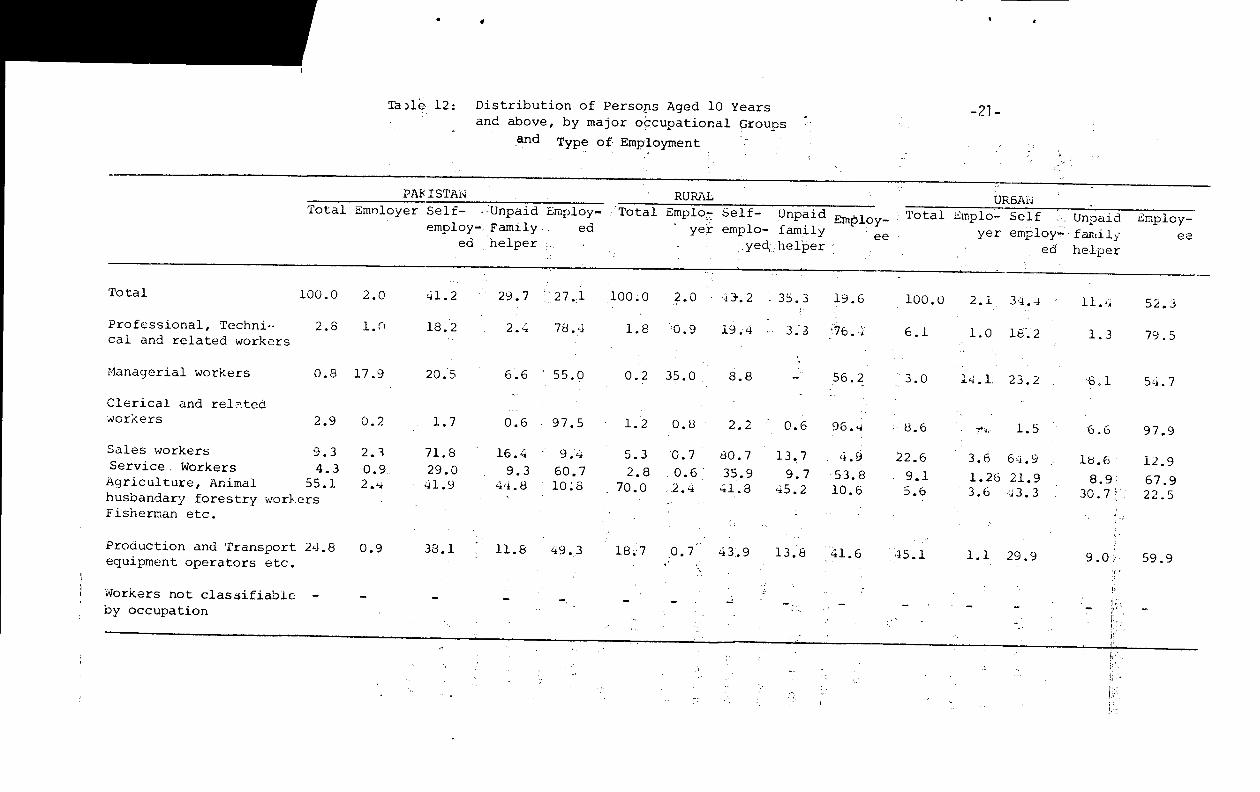
One example of such cross-tabulations is included in Table 12 where
the distribution of employed persons (of 10 years and above) are cross-
tabulated by their employment status, their occupation group and by area
of residence. In. the country as a whole most of the population is engaged
in agriculture, animal husbandry, forestry (55%.) and in rural areas this
proportion is even higher (70%). In urban areas the majority of workers
are in the production and transport sector followed by those engaged , in
sales work. Whereas in rural areas most workers are self-employed or un-
paid family helpers, the majority in urban areas are employees. In general
those in professional technical and related services, clerical and -
managerial professions are employed both in rural and urban areas whereas
a majority of sales workers and agricultural workers are self-employed
or unpaid family helpers. In the case of production and transport opera-
tors, the combination of self-employed and employees are predominant in
both urban and rural areas. Generally speaking, those patterns of employ-
ment do not differ as much by area as do those of occupational distribution
by rural and urban areas.
1.
V
I I
Ma )16 12: Distribution of Persons Aged 10 Years -and above,above, by major occupational Groups
And Type of Employment
PAISTAN RURAL URBANTotal Emnloyer Self- Unpaid Employ- Total Emplo- Self- Unpaid Employ- Total mplo Self Unpaid mploy-
employ- Family ed yer emplo- family ee yer emloy .. fani11ee
ed helper .. .. yehe1er . ed helper
Total 100.0 2.0 41.2 29.7 27.1 100.0 2.0 a. 2 35.3
19.6 100.0 2.1 3 .4.-4 11
Professional, Techni-- 2.6 1.fl 18.2 2.4 78.4 1.8 0.9 19.4 33 76. 6.1 1.0 15.2 1.3 79.5cal and related workers
Managerial workers 0.8 17.9 20.5 6.6 55.0 0.2 35.0 8.8 - 56.2 3.0 1,4.1. 23 'B .l 5 7
Clerical and relatedworkers 2.9 0.2 1.7 0.6 97.5 1.2 0.8 2.2 0.6 96.' 8.6 . , 1.5 6.6 97.9
Sales workers 93 2.3 71.8 16.4 94 53 0.7 80.7 13.7 4.9 22.6 3.6 61.9 18.6 12.9Service. Workers 4.3 0.9. 29.0 . 9.3 60.7 2.8 .0.6 35.9 9.7 53.8 . 9.1 1.26 21.9 8.9 67.9Agriculture, Animal 55.1 2.4 41.9 44.8 108 70.0 41.8 45.2 10.6 5.6 3.6 3.3 30.7 22.5husbandary forestry wor].ersFisherman etc.
Production and Transport 24.8 0.9 33.'l 11.8 49.3 18.-7 0 7 43.9 13.'8 . '41.6 45.1 1.1 29.9 9.0 59.9equipment operators etc. .
Workers not clas4ifjabieDy Occupation
-22-
Household Income and Expenditure:
The Household Income and Expenditure module of the PLM was identical
to that, for which the report has been published by the CSO /HIES 1979/.
The difference is that the PLM income and expenditure component contains
data from two quarters whereas the rain HIES was done over all four quar-
ters. However, it is thought that data from two quarters is as repesen-
tative of annual estimates.
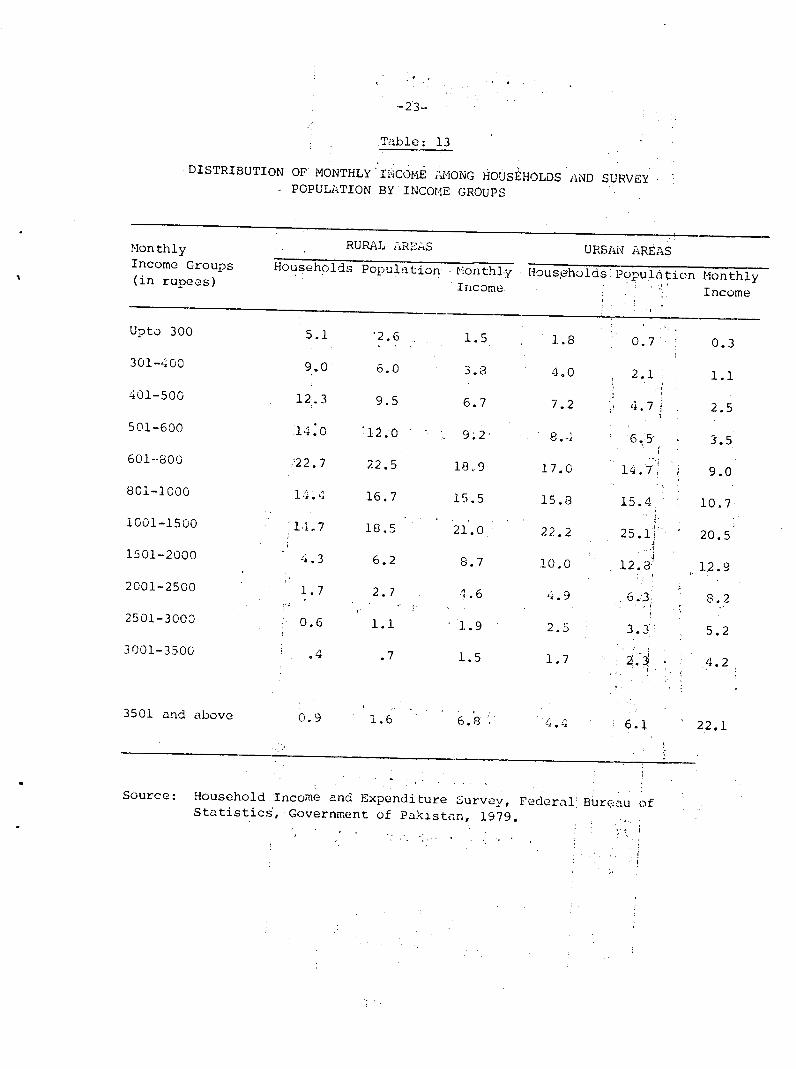
We include here in Table 13 the monthly houshold income, distribution
by rural and urban areas. The proportion of huusGholds in the lower
income groups is higher in rural areas than in urban areas; this also
applies to the proportion of the- population. Of the various income groups,
most monthly incomes fall otween 600 and 1500 ru in rural arc-,as anu
between 80d and 2000 rupees in urban areas. Only 6.8 percurit of the total
monthly incomes reported in rural areas werL above 3501 rups
in urban aras 22.1 percent of households fall in that rangc.
Table 14 presents the beakdown of the average of number of carriers,
the percentae of earners that are not household heads and average income
controlled b4 income groups. There scorns to be a larger number of ear- -, -
ners overall in rural than in urban areas. Also this number 's increases
with income i4 both areas. Thus additional earning members lead to an
enhancement oi monthly household income and congruously with .increase- ifl -
income, the proportion of- earners cQmprising household heads diminishes.
However, the head of household contributes a very large share of the monthly
income in all income groups but pa.rticulaly among the poorer households.,
Table; 13
DISTRIBUTION OF MONTHLY INCOME AMONG HOUSEWLDS AND SURVEYPOPULATION BY INCOME GROUPS
Monthly RURAL AREAS URBAN AREASIncome Groups Households PopulationMonthi.y Housho1ds Population Monthly(in rupees) Income Income
Upto 300 5.1 '2.6 1.5 1.8 0.7 0.3
301-400 9.0 6.0 3.8 4.0 2.1 1.1
401-500 12.3 9.5 6.7 7.2 4.7 2.5
501-600 14:0 12.0 9;2' 6.5 3.5
601-800 Q2.7 22.5 189 17.0 14.7 9.0
801-1000 14. 16.7 15.5 15.8 15.4 10.7
1301-1500 11.7 18.5 21.0 22.2 25.1 20.5
1501-2000 4.3 6.2 8.7 10.0 l2.8 12.9
2001-2500 17 2.7 4.6 4.9 6. -3: 8.2
2501-3003 0.6 1.1 1.9 2.5 3.3 5.2
3001-3500 .4 .7 1.5 1.7 4.2
3501 and above 0.9 1.6 6.8 4.4 6.1 22.1
Source: Household Income and Expenditure Survey, Federal Bureau ofStatistic, Government of Pakistan, 1979. -
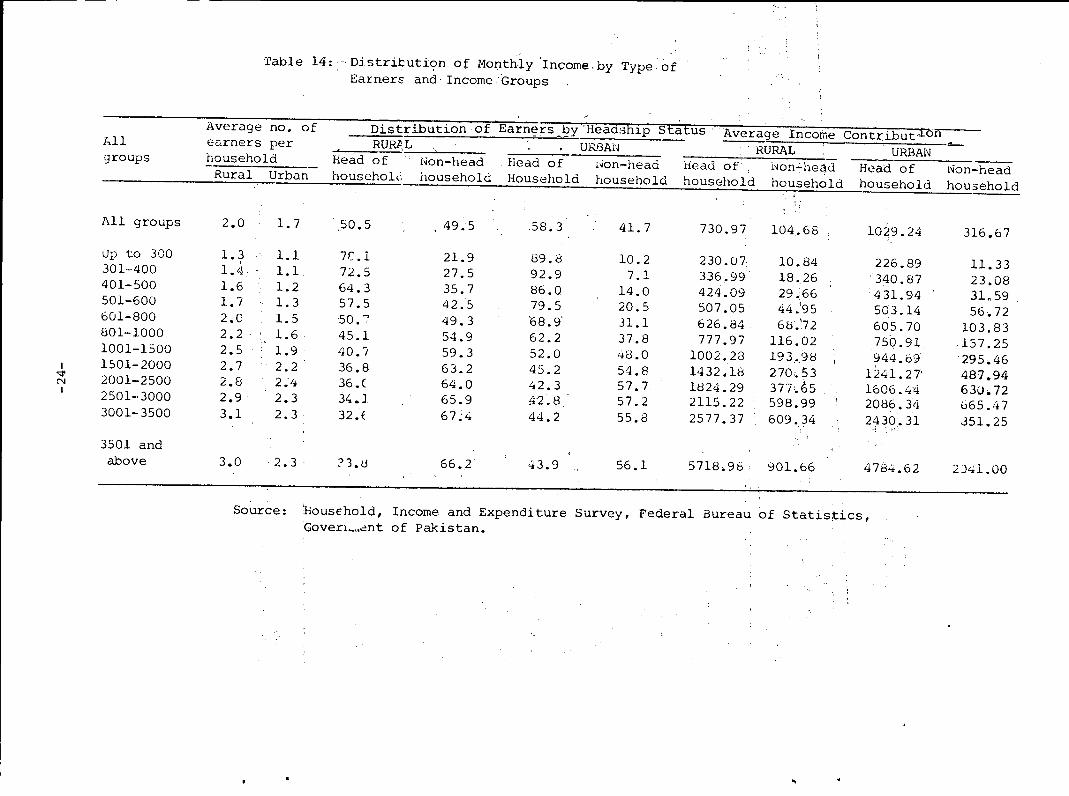
Table 14: -•Distriution of Moth .ly Incomeby Type ofEarners and Income Groups
Average no. of Distribution of Earners by 'Headhjp Status Average Income ContribtdiiAll Garners per RUR,L . URBAN RURAL URBANgroups household Head of Non-head Head of ion-head Head of Nonhed Head of Non-head
Rural Urban househol( household Household household household household household household
All groups 2.0 1.7 '.50.5 49.5 .58.3 41.7 730.97 104.68
109.24 316.67
Up to 300 1.3 1.1 7.1 21.9 89.8 10.2 230.07: 10.84 226.89 11.33301400 1.4 - 1.1 72.5 27.5 92.9 7.1 336.99 18.26 '340.87 23.08401-500 1.6 1.2 64.3 35.7 86.0 , 14.0 424.09 -29.66 ' '431.94 ' 3159501-600 1.7 1.3 57.5 42.5 79.5 20.5 507.05 44.95 '503.14 5672601-800 2.0 1.5 50.7 49.3 '68.9 31.1 626.84. 68'.72 605.70 103.838011000 2.2 - 1.6 45.1 54.9 62.2 37.8 777.97 116.02 750.91 137.251001-1500 2.5 1.9 40. 59.3 52.0 48.0 1002.28 193.98 944.89 295.461501-2000 2.7 2.2 36.8 63.2 45.2 54.8 143218 270.53 1241.27 487.942001-2500 2.8 2.4 36.( 64.0 42.3 57.7. 1824.29 3775 1606.44 630.722501-3000 2.9- 2.3 34.1 , 65.9 42.8' 57.2 2115.22 598.99 2086.34 065.473001-3500 3.1 , 2.3 32.€ 674 44.2 55.8 2577.37 609.34 2430.31 351.25
3501 and . .above 3.0 -2.3- ?3..8 66.2 43.9 -- 56.1 5718.98 901.66 4784.62 2341.00
Source: 'Hous€hold, Income and Expenditure Survey, Federal Bureau of Statistics,Goveri..nt of Pakistan.
-25-
Thus it seems monthly income must be largely dependent on the supple-
mentation made by additional earners other than heads of households.
Migration:
The PLM survey collocted unique information about the migration
status of all household members. Therefore all household members can be
classified as in-migrants, out-migrants, return-migrants and potential-
migrants. Individual characteristics of migrants and non-migrants can
be thus assessed and cross--classifications can be made by age, income,
education, maritdl status. etc. In addition, migration flows between
rural and urban areas, between districts, provinces and out of the country
can also be estimated using the PU-I data. Most of these exercises have been
or are being dealt with in other publications /Trfan, et.al, 1983, Tbbasi
and Irfari 19837.re we present a table to help the readers savour
some of the possible cross--classifications about migrants that are avail-
able from the PLM data,
Table 15 depicts the demograrhic characteristics of the population
by migration status for all
Pakistan and also for rural and urban areas.
The mean age of non-migrants is the owest and more than 60 percent are
single rf1octing that th is category contains niotlydhildren and that
it is mostly adults who comprise migrants. Puite a large proportion of
in and out migrants (excluding those who migrate for marria ge), particular-
ly in the latter category, falls into age group 20-34. This pro-
portion is especially high in urban areas (84%). Return 'Migrants were the
oldest on average and also écnpric very few single persons.
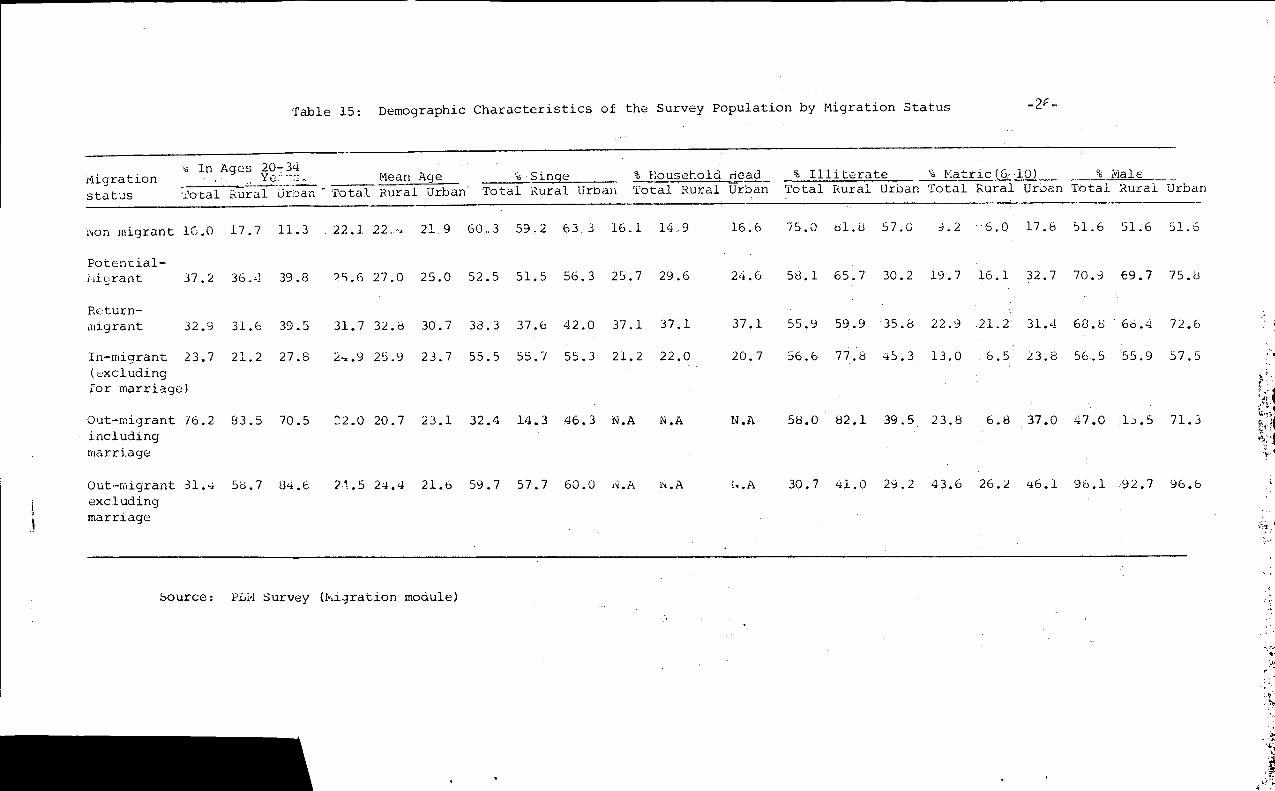
Table 15: Demographic Characteristics of the Survey Population by Migration Status -2-
In Ages 20 7 34 . household
S . 5
Mean Age...Migration Ye:.. Singe % household i-iead % Illiterate MatricJQ) % viale -
status 'fobal Rural Ur!Jafl Total Rural Urban Total Rural Urban Total Rural Urban Total Rural Urban Total Rural Urban Thtal Rural Urban
on migrant lC.0 17.7 11.3 .22.1 22.4 21.9 60,,3 59.2 63,3 161 149 16.6 75.0 61.0 57.0 9.2 5.0 17.6 51.6 51.6 51.5
Potencial-i .iicj rant 37.2 364 39.8 75.6 27.0 25.0 52.5 51.5 56.3 25.7 29.6 24.6 58.1 65.7 30.2 19.7 16.1 32.7 70.5 69.7 75.8
Return-nigrant 32.9 31.6 39.5 31.7 32.8 30.7 38.3 37.6 42.0 37.1 37.1 37.1 55.9 59.9 35.8 22.9 21.2 31.4 68.8 65.4 72.6
In-migrant 23.7 21.2 27.8 2.9 25.9 23.7 55.5 55.7 55.3 21.2 22.0 20.7 56.6 77.8 45.3 13.0 6.5 23.8 56.5 55.9 57.5(excludingfor marriage)
Out-migrant 76.2 83.5 70.5 22.0 20.7 23.1 32.4 14.3 46.3 N.A N.A N.A 58.0 82.1 39.5 23.8 6.8 37.0 47.0 1.5 71.3includingmarriage
Out.-migrant 5•7 0.6 2.5 24.4 21.6 59.7 57.7 60.0 A.A i'.A 1.A 30.7 41.0 29.2 43.6 26.2 46.1 96.1 92.7 96.6excludingmarriage
Source: PLM Survey (Migration module)
*'
-27-
There is a predominance of males amongst those who migrate, par-
ticularly out-migrants, 'excluding thuse who migrate for marriage Whereas
the expected even sex ratio prevails amongst non-migrants (i.e. 52 percent
are males) this proportion is highest anongst out-migrants (cxcluding
those who migrat. for marriage) and also quite high amongst potential-
migrants and return-migrants. In-migrants and out-migrants including those
migrating for marriage naturally includes geter proportions of females.
Literacy is highest amongst-out-migrants who are not migrating foi marriage
purposes (69.3%). The corresponding figure for other categories apart
from non-migrants is roughly similar at 42-45 percent. Thus it seems that
out-migrants (excepting those who migrate to marry) are most likely to
be single males, between the age of 20 and 34, largely from urban areas
and quite probably literate.
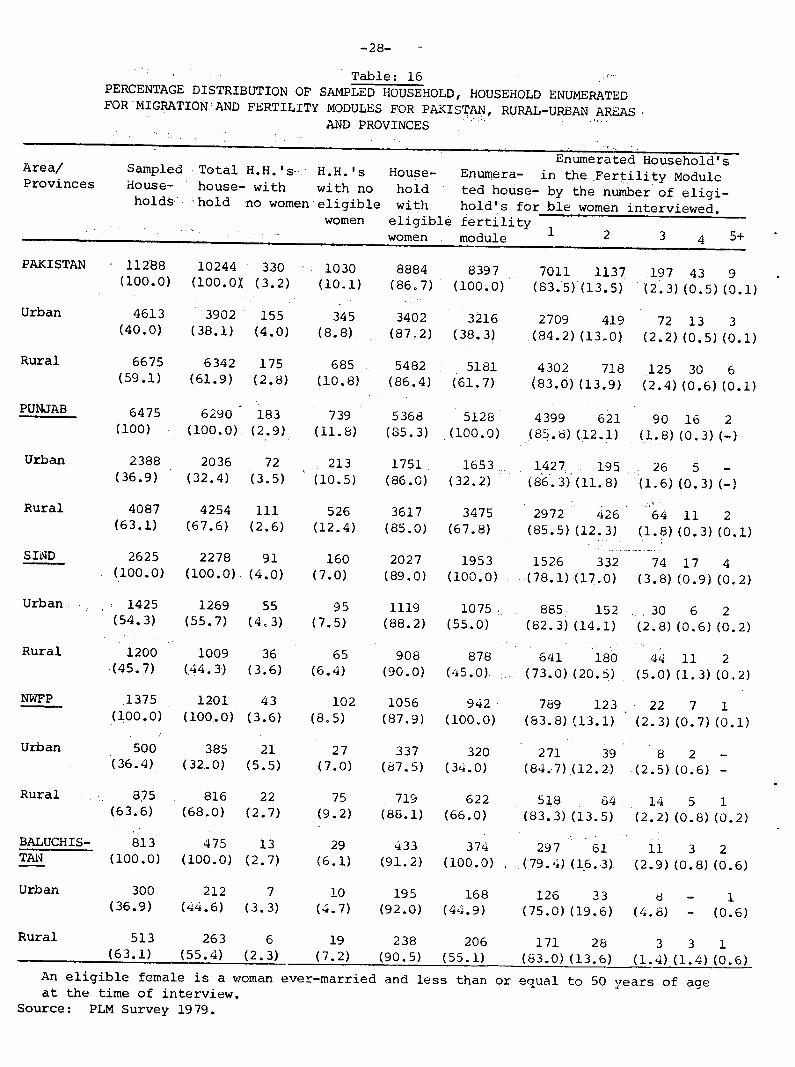
Fertility:
The fertility module was administered to ever-married women aged
between 10-and 50 years of age. To select eligible women for the fertility
sirvey, the migration survey was taken as a base and 10244 households were
enumerated. The households finally covered by the-fertility module were
8397. These were the households where at least one eligible female was
found and enumerated. hs shown in Table 16, the difference between the
- householdscovêred by the.migration survey and the fertility survey was not
• totally accounted for by -non-response because a substantial number of house-
holds enumerated by the migration survey were those where no eligible female
• was found. The distribution of the house ,holds covered by the fertility
-28- -
Table: 16PERCENTAGE DISTRIBUTION OF SAMPLED HOUSEHOLD, HOUSEHOLD ENUMERATEDFOR MIGRATION AND FERTILITY MODULES FOR PAKISTAN, RURAL-URBAN AREAS
AND PROVINCES
Enumerated Household'sArea/ Sampled Total H.H.'s- H.H.'s House- Enumera- in the Fertility ModuleProvinces House- house- with with no hold ted house- by the number of eligi-
holds hold no women eligible with hold's for ble women interviewed.women eligible fertility
- women module 1 2 3 5+
PAKISTAN 11288 10244 330 1030 8884 8397 7011 1137 197 43 9
(100.0) (lOO.OX (3.2) (10.1) (86,7) (100.0) (S3.5)(13.5) (2.3) (0.5) (0.1)
Urban 4613 3902 155 345 3402 3216 2709 419 72 13 3
(40.0) (38.1) (4.0) (8.8) (872) (38.3) (84.2) (13,0) (2.2) (0.5) (0.1)
Rural 6675 6342 175 685 5482 5181 4302 718 125 30 6
(59.1) (61.9) (2.8) (10.8) (86.4) (61.7) (83.b)(13.9) (2.4) (0.6) (0.1)
PUNJAB 6475 6290 183 739 5368 5128 4399 621 90 16 2(100) (100.0) (2.9) (11.8) (85.3) (100.0) (85.8) (12.1) (1.8) (0.3) (-)
Urban 2,388 2036 72 213 1751. 1653 1427, 195 26 5 -
(36.9) (32.4) (3.5) (10.5) (86.0) (32.2) (86,3)(11.8) (1.6)(0.3)(-)
Rural 4087 4254 ill 526 3617 3475 2972 426• 64 11 2
(63.1) (67.6) (2.6) (12.4) (85.0) (67.8) (85.5) (12.3) (1.8) (0.3) (0.1)
SIND 2625 2278 91 160 2027 1953 1526 332 74 17 4
(100.0) (100.0). (4.0) (7.0) (89.0) (100.0) (78.1) (17.0) (3.8) (0.9) (0.2)
Urban ... 1425 1269 55 95 1119 1075 . 885 152 30 6 2
(54.3) (55.7) (4.3) (7.5) (88.2) (55.0) (82.3) (14.1) (2.8) (0.6) (0.2)
Rural 1200 1009 36 65 908 878 641 180 44 11 2
(45.7) (44.3) (3.6) (6.4) (90.0) (45.0). (73.0) ( .20.5) (5.0) (1.3) (0.2)
NWFP .1375 1201 43 102 1056 942 789 123 . 22 7 1
(100.0) (100.0) (3.6) (8,5) (87.9) (100.0)(83.8) (13.1) (2.3)(0.7)(0.1)
Urban 500 385 21 27 337 320 271 39 8 2 -
(36.4) (32.0) (5.5) (7.0) (87.5) (34.0) (84.7)(12.2.) (2.5)(O.6) -
Rural 875 816 22 75 719 622 518 64 14 5 1
(63.6) (68.0) (2.7) (9.2) (88.1) (66.0) (83.'3)(13.5) (2.2) (0.8) (0.2)
BALUCHIS- 813 475 13 29 433 374 297 61 ii 3 2TAN (100.0) (100.0) (2.7) (6.1) (91.2) (100.0) .(79.4) (16.3) (2.9) (0.8) (0.6)
Urban 300 212 7 10 195 168 126 33 8 - 1
(36.9) (44.6) (3.3) (4.7) (92.0) (44.9) (75.0) (19.6) (4.8) - (0.6)
Rural 513 263 6 19 238 206 171 28 3 3 1
(63.1) (55.4) (2.3) (7.2) (90.5) (55.1) (83.0) (13.6) (1.4) (1.4) (06)An eligible female is a woman ever-married and less than or equal to 50 years of ageat the time of interview.
Source: PLM Survey 1979.
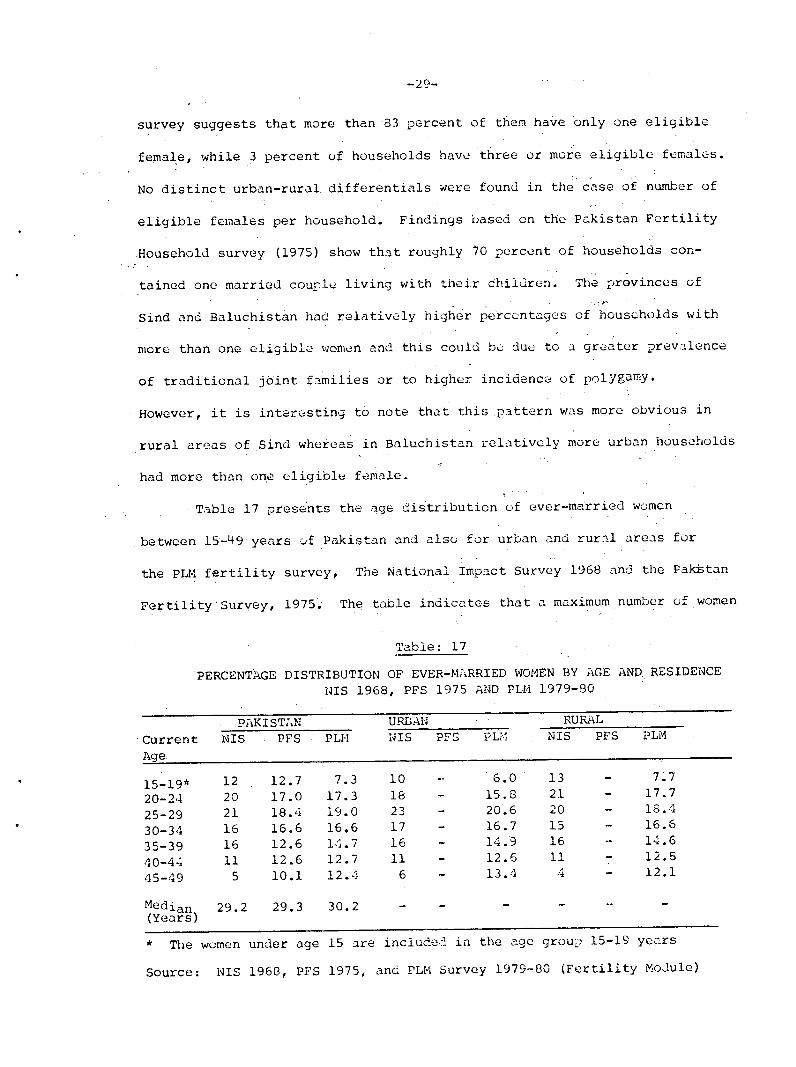
survey suggests that more than 33 percent of them have only one eligible
female, while.3 percent of households have three or more eligible females.
No distinct urban-rural differentials were found in the case of number of
eligible females per household. Findings based on the Pakistan Fertility
Household survey (1975) show that roughly 70 percent of households con-
tained one married couple living with their children. The provinces of
Sind and Baluchistan had relatively higher percentages of households with
more than one eligible women and this could be due to i greater prevalence
of traditional joint families or to higher incidence of polygamy.
However, it is interesting to note that this pattern was more obvious in
rural areas of Sind whereas in Baluchistan relatively more urban households
had more than one eligible female.
Table 17 presents the age distribution of ever-married women
between 15-49 years of Pakistan and also for urban and rural areas for
the PLM fertility survey, The National Impact Survey 1968 and the Pa1ctan
FertilitySurvey, 1975. The table indicates that a maximum number of women
Table: 17
PERCENTAGE DISTRIBUTION OF EVER-MARRIED WOMEN BY AGE AND RESIDENCEillS 1968, PFS 1975 AND PLM 1979-80
PAKISTAN URBAN RURAL
Current NIS PFS PU! illS PFS PLM NIS PFS PLM
Age
15_19* 12 12.7 7.3 10 -. 6.0 13 - 7.7
20-24 20 17.0 17.3 18 - 15.8 21 - 17.7
25-29 21 18.4 19.0 23 - 20.6 20
30-34 16 16.6 16.6 17 - 16.7 15 - 16.6
35-39 16 12.6 14.7 16 - 14.9 16 -. 14.6
40-44 11 12.6 12.7 11 - 12.6 11 - 12.6
45-49 5 10.1 12.4 6 - 13.4 4 - 12.1
Median29.2 29.3 30.2 - - - - - -(Years)
* The women under age 15 are included in the age group 15-19 years
Source: NIS 1968, PFS 1975, and PLM Survey 1979-80 (Fertility Module)
in each survey are in the ago group of 25-29. However, 24.6 percent are
reported as under 25 years of age in the PLM whereas the same age group
accounted for 32 percent in NIS (1968) and 29.7 percent PFS (1975). Thus
the PLM contains a relatively older sarnolo, most probably a reflection of
the rising age at marriage in the country. The table also reveals that the
current survey hs a relatively higher number of older females in the
• survey population. These observations are supported by the rise over time
in the vaedian age (Table 17). -
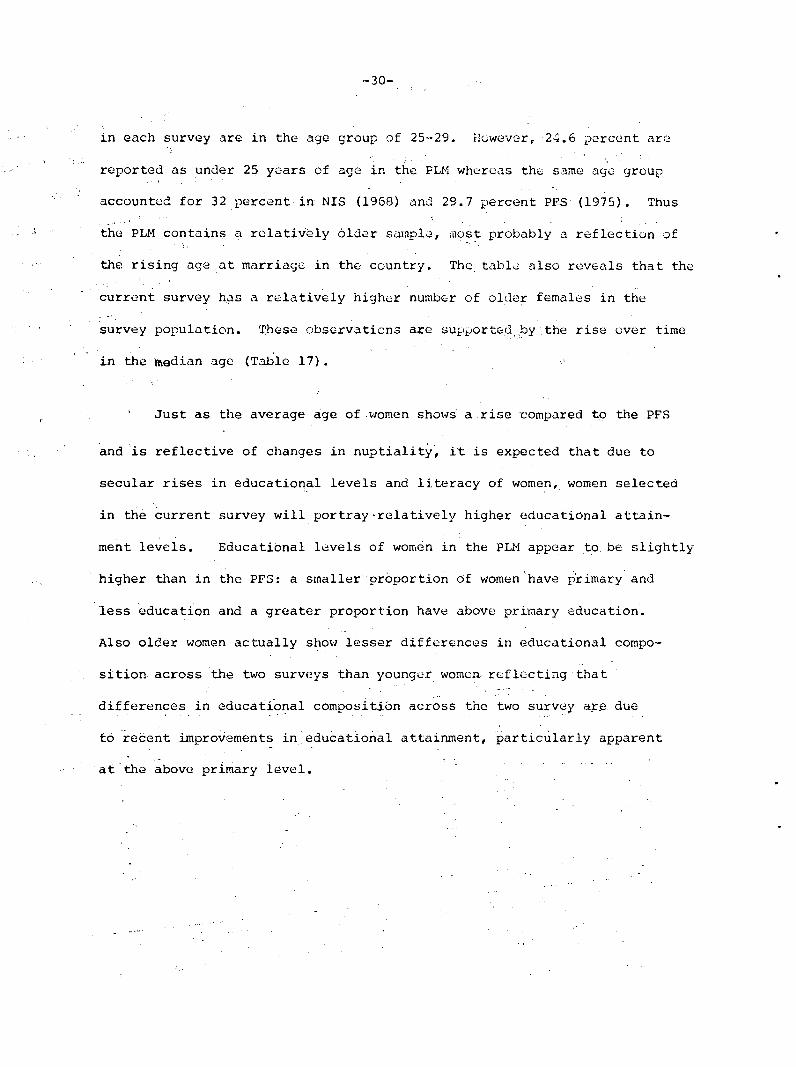
Just as the average age of women shows a rise -compared to the PFS
and is reflective of changes in nuptiality, it is expected that due to
secular rises in educational levels and literacy of women, women selected
in the current survey will portray relatively higher educational attain-
ment levels. Educational levels of woman in the PLN appear to be slightly
• higher than in the PFS: a smaller prportion of women have primary and
less education and a greater proportion have above primary education.
Also older women actually show lesser differences in educational compo-
sition across the two surveys than younger women reflecting that
differences in educational composition across the two survey are due
to recent improvements ineducatiorial attainment, particularly apparent
- • at the above primary level. -
-31-Table: 18
DISTRIBUTION OF EVER-MARRIED WOMEN (15-49) BY THEIR LEVELSOF EDUCATION AND CURRENT AGE, PFS 1975 AND PLI4 1979-80
15-1920-2425-2930-3435-.3940-4445-49All
L'.L or Li,Uc\aIO4.
IJo Schoolirr'j Pri.tiary and Less.-_Abovc Primary -PF
PLi,iFF5 Pt rFS
88 88.6 9 6.0 3 5,486 84.6 8 - 7.0 6 8.487 86.5 •7 6.2 ' 6 7.389 88.3 - 7 4.6 4 - 6.591 90.5 '5 4.6 494 - 93.1 S 3.4 2 3.5'94 94.6 3 3.1 3 2.3
89.3 89.0 6.7 5.1 4.0 5.8
CurrentAge
• Source: PLM Survey (Fertility Module), PFS 1975.
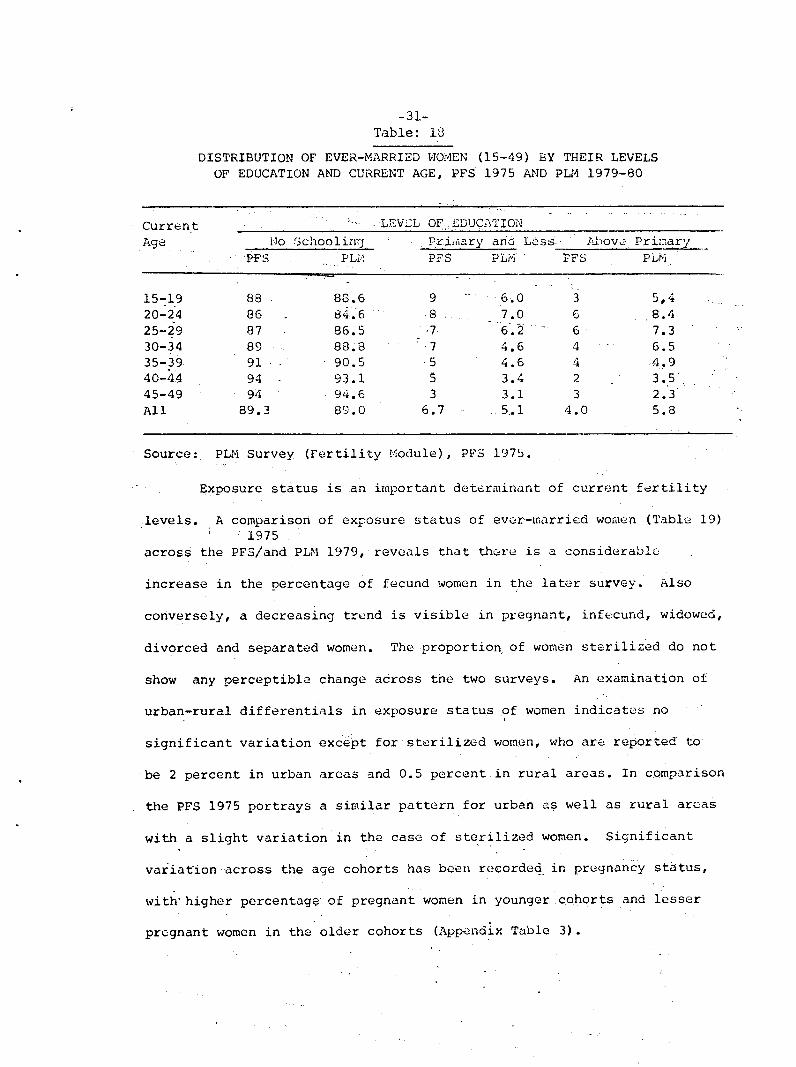
• Exposure status is an important determinant of current fertility
levels. A comparison of exposure status of ever-married women (Table 19)1975
across the PFS/and PLM 1979, reveals that there is a considerable
increase in the oercentage of fecund women in the later survey. Also
conversely, a decreasing trend is visible in pregnant, infecund, widowed,
divorced and separated women. The proportion , of women sterilized do not
show any perceptible change across the two surveys. An examination of
urban-rural differentials in exposure status of women indicates no
significant variation except for sterilized women, who are reported to
be 2 percent in urban areas and 0.5 percent in rural areas. In comparison
the PFS 1975 portrays a similar pattern for urban as well as rural areas
with a slight variation in the case of sterilized women. Significant
vaxiation across the age cohorts has been recorded in pregnancy status,
with higher percentage of pregnant women in younger cohorts and lesser
pregnant women in the older cohorts (Appendix Table 3).
-32-
rdwe: 1
PERCENTAGE DISTRIBUTION OF . EVER-MARRIED WOMEN BY THEIR EXPOSURE
STATUS AND BY AREA OF RESIDNCE:PFS 1975, AND PLM 1979-80
PAiSTA UR3A RURAL
Exposure Status PrC T'FS L'L
Pregnant 16 13.1 17 13.4 16 13.0
Widowed/Divorced/Seperated6 . 3;3• 6 3.4 6 3.2
Sterilized - 1 0.9 2 2.0 0 0.5
• Not fecund 11 7.0 11 7.8 11 6.8
Fecund 66 75.7 64 73.4 67 76.5
Source: PLN Survey (Fertility tiodule) PFS 1975..
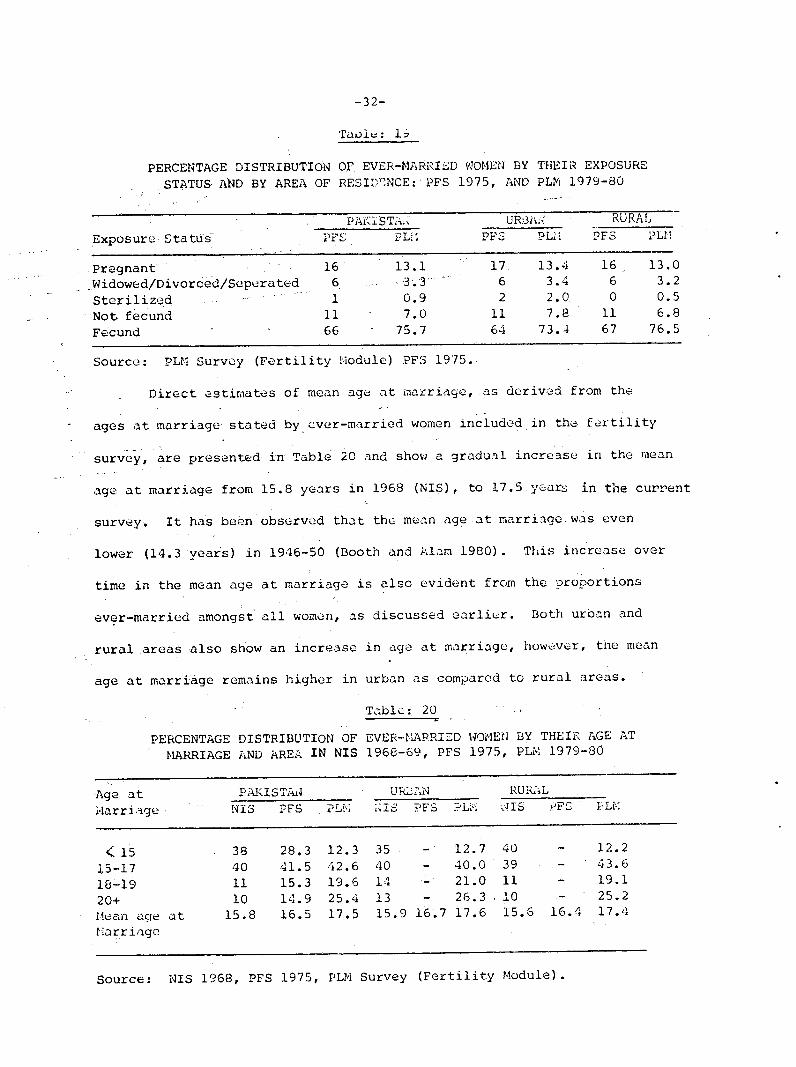
Direct estimates of mean age at marriage, as derived from the
ages at marriage stated by ever-married women included in the fdrtility
survey, are presented in Table 20 and show a gradual increase in the mean
age at marriage from 15.8 years in 1968 (NIS), to 17.5 years in the current
survey. It has been observed that the mean age at marriage was even
lower (14.3 years) in 1946-50 (Booth and Alarn 1980). This increase over
time in the mean age at marriage is also evident from the proportions
ever-married amongst all women, as discussed earlier. Both urban and
rural areas also show an increase in age at marriage, however, the mean
age at marriage remains higher in urban as compared to rural areas.
Tabl: 20
PERCENTAGE DISTRIBUTION OF EVER-MARRIED WOMEN BY THEIR AGE AT
MARRIAGE AND AREA IN NIS 1968-69, PFS 1975, PLM 1979-80
Age at PAKISTid URiAN RURAL
Marri.tge • NIS PFS PLU i15 PFS ?L JI6 ?FS i'Li'
<1515-1718-1920+ileari ecie attiarriago
38 28.3 12.3 35 • -. 12.7 40 - 12.2
40 41.5 42.6 40 - 40.0 39 . - 43.6
11 15.3 19.6 14 - 21.0 11 - 19.1
10 14.9 25.4 13 - 26.3 10 - • 25.2
15.8 16.5 17.5 15.9 16.7 17.6 15.6 16.4 17.4
Source: HIS 1968, PFS 1975, PLM Survey (Fertility Module).
-33--
The fertility module findings show that about half of all ever-
married women of ages 15-49 have over three children and at ages 45-49,
over--5O -pe-rcemt of- women--have -more , than si'children. Table 21 shows
the distributjon of women by their current ages and parity. The expected
positive age patterns of cumulative fertility emerges with only 1.8 per-
cent of Pakistani ending up as childless by age 45-49. Overall urban
cumulative fertility seems to be higher than, rural fertility, . 'a finding
in confirmity with earlier studies done using PFS data (Sathar 1979,
Casterljne 1980).
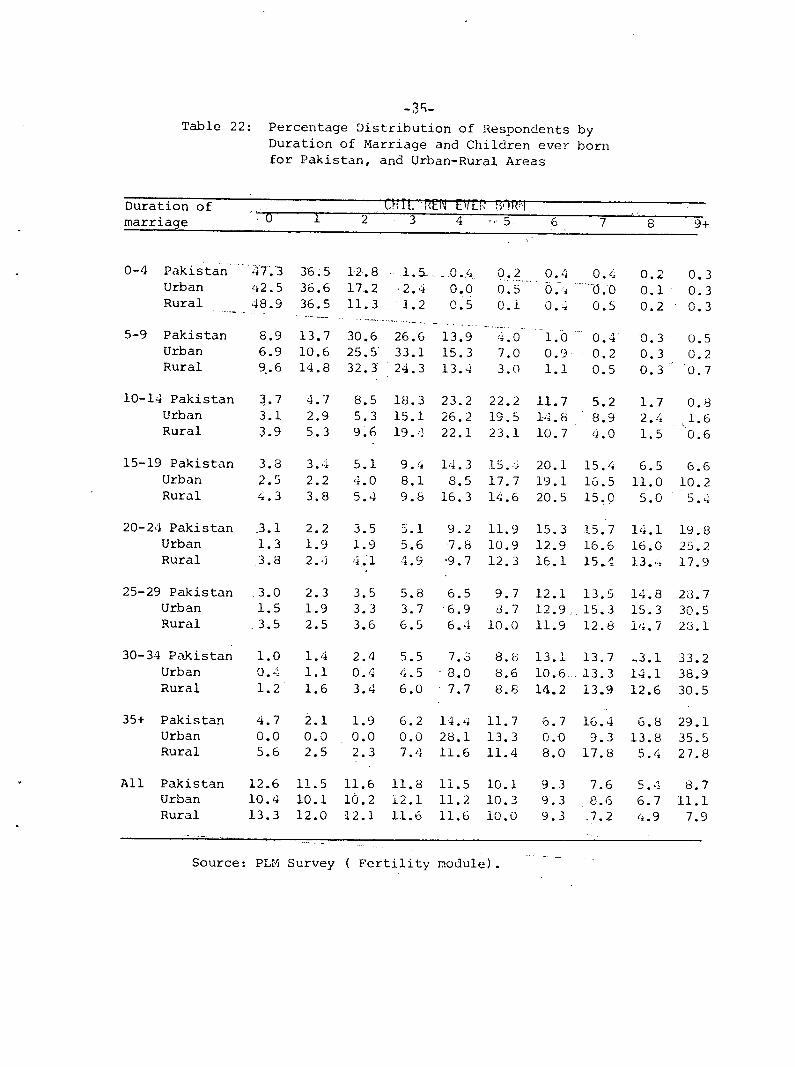
Table 22 shows the distribution of respondents by children ever-
born but classified by duration of marriage groups; The difference in
the two tables is mainly reflective of altering patterns of age at
marriage.. Age at marriage is higher amongst youngr women, excepting the
very youngest (as they are included only because they married very early).
Given this rising trend in age at marriage, the exposure period to child-
bearing is shorter for those who married later and may confound fertility
patterns. However, the pattern of child-bearing by duration of marriage
is much the same as that with age: at marriage durations of 20-24 years,
half of ever-married women have borne more than 6 children and the urban
rural differential persists..
- Appendix Table 4 and 5 contain the distr1butior of number of sur-
viving children and child deaths by age of mother and urban-rural resi-
dence. Table 23 contains summary measures of the mean number of children
ever-born, and a further breakdown of how many are still living and
those who are deceased. All three measures have a clear positive association
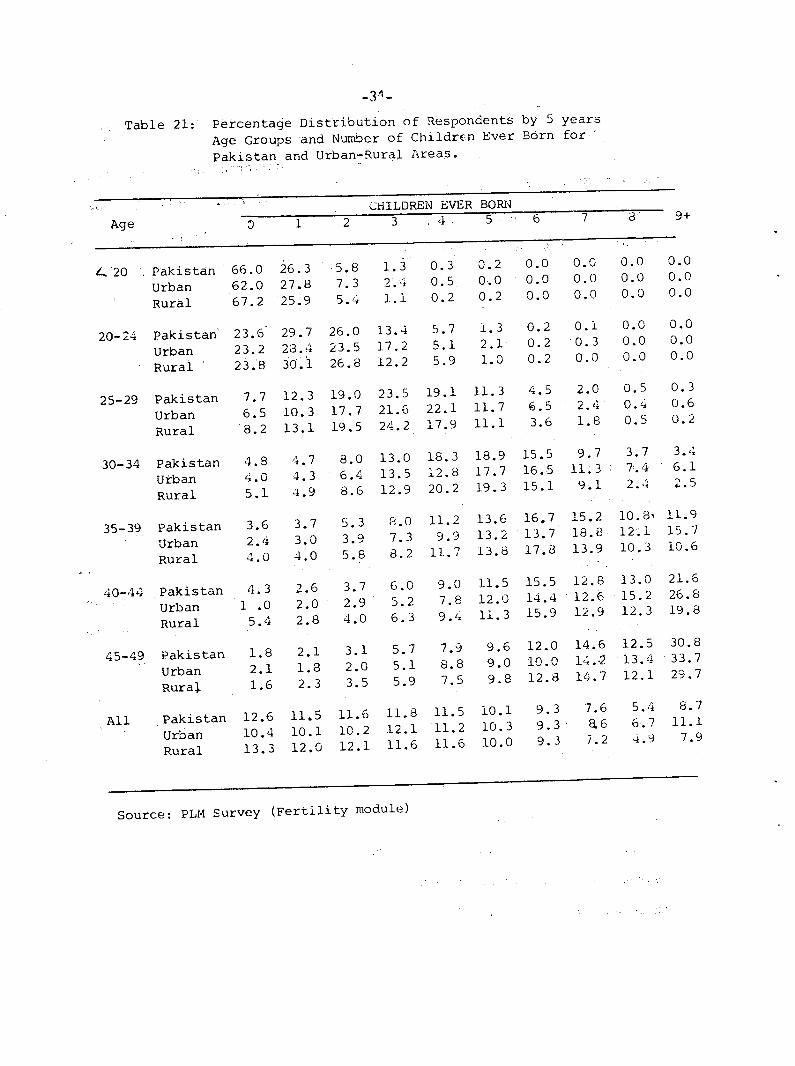
Table 21: Pei'centage Distribution of Respondents by 5 yearsAge Groups and Number of Childr€n Ever Born forPakistan and Urban-Rural Areas.
LHILDREN EVER BORNAge 3 1 2 3,4: 56 7
81 9+
& 20 Pakistan 66.0 26.3 5.8 1.3 0.30.2 0.0 0.0 0.0 0.0
Urban 62.0 27.8 7.3 2.4 0.5 0.00.0 0.0 0.0 0.0
Rural 67.2 25.9 5.4 1.1 0.2 0.20.0 0.0 0.0 0.0
20-24 Pakistan 23.6 ' 29.7 26.0 13.4 5.7 1.3 0.20.1 0.0 0.0
Urban 23.2 28.4 23.5 17.2 5.1 2.10.2 0.3 0.0 0.0
Rural 238 30.1 26.8 12.2 5.9 1.00.2 0.0 0.0 0.0
25-29 Pakistan 7.7 12.3 19.0 23.5 19.1 11.3 4.5 2.0 0.5 0.3
Urban 6.5 10.3 17.7 21.6 22.1 11.7 6.5 2.4 0.4 0.6
Rural 8.2 13.1 19.5 24.2 17.9 11.1 3.6 1.8 0.5 0.2
30-34 Pakistan 4.8 4.7 8.0 13.0 18.3 18.9 15.5 9.7 3.7 3.4
Urban 4.0 3.3 6.4 13.5 12.8 17.7 16.5 1L3 7.4 6.1
Rural 5.1 4.9 8.6 12.9 20.2 19.3 15.1 9.1 2.4 2.5
35-39 Pakistan 3.6 3.7 5.38.0 11.2 13.6 16.7 15.2 10.8' 11.9
Urban 2.4 3.0 3.9 7.39.9 13.2 13.7 18.8 121 15.7
Rural 1•Q 4.0 5.8 8.2 11.7 13.8 17.8 13.9 10.3 10.6
40-44 Pakistan 4.3 2.6 3.7 6.09.0 11.5 15.5 12.8 13.0 21.6
Urban 1 .0 2.0 2.9 5.27.8 12.0 14.4 12.6 15.2 26.8
Rural 5.4 2.8 4.0 6.39•4 11.3 15.9 12.9 12.3 19.8
45-49 Pakistan 1.8 2.1 3.1 5.7 7.99.6 12.0 14.6 12.5 30.8
Urban 2.1 1.8 2.0 5.1 8.89.0 10.0 14..2 13.4 33.7
Rural 1.6 2.3 3.5 5.9 7.59.8 12.8 14.7 12.1 29.7
All Pakistan 12.6 11.5 11.6 11.8 11.5 10.1 9.3 7.6 5.4 8.7
Urban 10.4 10.1 10.2 12.1 11.2 10.3 9.3 a6 6.7 11.1
Rural 13.3 12.0 12.1 11.6 11.6 10.0 9.3 7.2 4.9 7.9
Source: PLM Survey (Fertility module)
-3 ..Table 22: Percentage Distribution of Respondents by
Duration of Marriage and Children ever bornfor Pakistan, and Urban-Rural Areas
Duration of CHILTREW MT-,' B!marriage 2 3 4 5 6 7 8 9+
0-4 Pakistan k7 3 36.5 12.8 1 5 0 t 0.2 0. 0Urban 42.5 36.6 17.2 2.4 00 0.5 O. ..Rural 48.9 36.5 11.3 1.2 0.5 0.1 0 0.5
59 Pakistan 8.9 13.7 30.6 26.6 13.9 4.0 1.0 - 0.4Urban 6.9 10.6 25.5 33.1 15.3 7.0 0.9 0.2Rural 9.6 14.8 32.3 24.3 13.4 3.0 1.1 0.5
0.2 0.3
0.1 0.3
0.2 0.3
0.3 0.5
0.3 0.20.3 •0.7
10-14 Pakistan 3.7 4.7 8.5 18.3 23.2 22.2 11.7 5.2 1.7 0.8Urban 3.1 2.9 5.3 15.1 26.2 19.5 14.8 8.9 2.4 .1.6Rural 3.9 5.3 9.6 19.4 22.1 23.1 10.7 4.0 1.5 0.6
15-19 Pakistan 3.8 3.1 5.1 9.4 14.3 15.4 20.1 15.4 6.5 6.6Urban 2.5 2.2 4.0 8.1 8.5 17.7 19.1 1.5 11.0 10.2Rural 4.3 3.8 5.4 9.8 16.3 14.6 20.5 15.0 5.0 5•4
20-24 Pakistan .3.1 2.2 3.5 5.1 9.2 11.9 15.3 15.7 14.1 19.8Urban 1.3 1.9 1.9 5.6 7.8 10.9 12.9. 16.5 16.0 25.2Rural 3.8 2.4 4.1 1.9 9.7 12.3 16.1 15..4 13...x 17.9
25-29 Pakistan .3.0 2.3 3.5 5.8 6.5 9.7 12.1 13.5 14.8 23.7Urban 1.5 1.9 3.3 3.7 6.9 8.7 12.9, 15.3 15.3 30.5Rural .3.5 2.5 3.6 6.5 6.4 10.0 11.9 12.8 11.7 23.1
30-34 Pakistan 1.0 1.4 2.4 5.5 7.3 8.8 13.1 13.7 ..3.1 33.2Urban 0.4 1.1 0.4 '.5 3.0 8.6 10.6 . 13.3 14.1 38.9Rural 1.2 1.6 3.4 6.0 7.7 8.8 14.2 13.9 12.6 30.5
35+ Pakistan 4.7 2.1 1.9 6.2 14.4 11.7 6.7 16.4 6.8 29.1Urban 0.0 0.0 0.0 0.0 28.1 13.3 0.0 9.3 13.8 35.5Rural 5.6 2.5 2.3 7.4 11.6 11.4 8.0 17.8 5.4 27.8
All Pakistan 12.6 11.5 11.6 11.8 11.5 10.1 9.3 7.6 5.4 8.7Urban 10.4 10.1 10.2 12.1 11.2 10.3 9.3 , 8.6 6.7 11.1Rural 13.3 12.0 12.1 11.6 11.6 10.0 9.3 .7.2 4.9 7.9
Source: PLM Survey ( Fertility module). - -
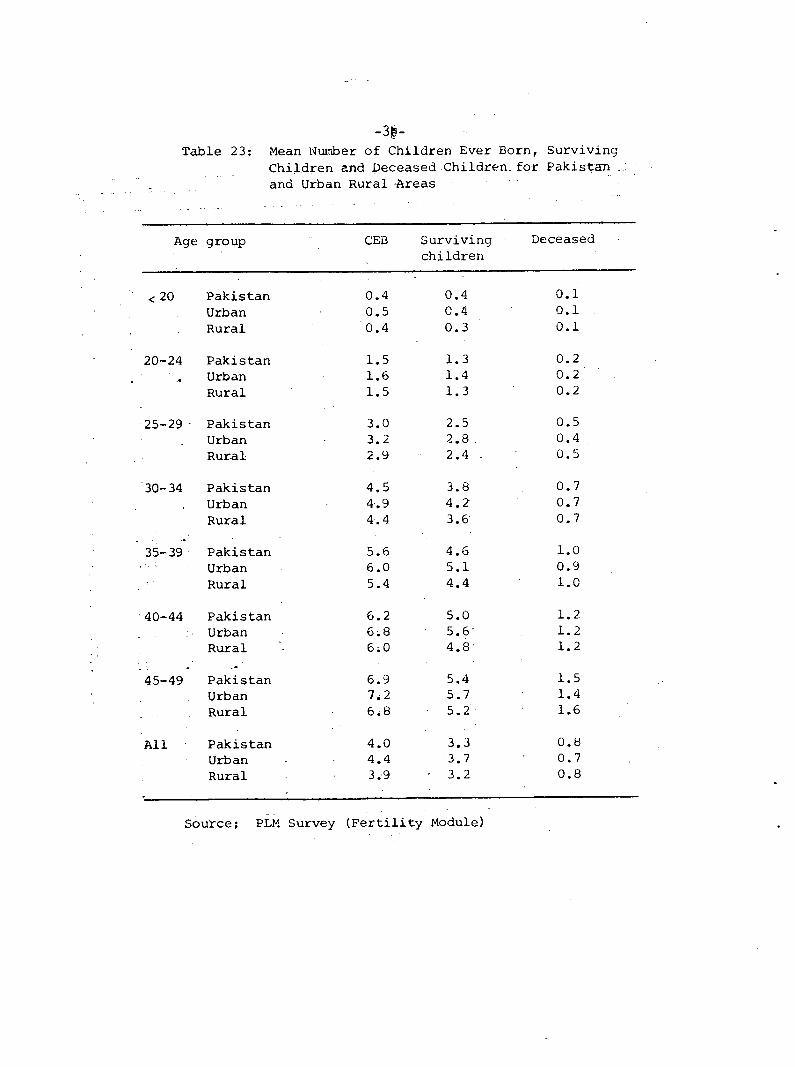
Table 23: Mean Nuxrber of Children Ever Born, Surviving- Children and Deceased Children for Pakistan-.:
and Urban Rural-Areas
Age group CEB Surviving Deceased• children
• <20 Pakistan 0.4 0.4 0.1• Urban 0.5 0.4 0.1
Rural 0.4 0.3 0.1
• 20-24 Pakistan 1.5 1.3 0.2•. Urban 1.6 1.4 0.2
Rural 1.5 1.3 - 0.2
25-29 - Pakistan 3.0 2.5 0.5• Urban 3.2 2.8 0.4
Rural 2.9 - 2.4 0.5
30-34 Pakistan 4,5 3.8 0.7Urban 4.9 4.,2 0.7Rural 4.4 3.6 0.7
35-39 Pakistan 5.6 4.6 1.0• Urban 6.0 5.1 0.9
Rural 5.4 4.4 • 1.0
-40-44 Pakistan 6.2 5.0 1.2- : Urban • 6.8 5.6- 1.2
Rural -. 6.0 4.8- 1.2
45-49 Pakistan 6.9 5.4 1.5- Urban 7.2 5.7 1.4- Rural 6.8 - 5.2 - 1.6
All • Pakistan 4.0 3.3 0.8Urban 4.4 3.7 0.7Rural - 3.9 3.2 0.8
Source; PLM Survey (Fertility Module)
__
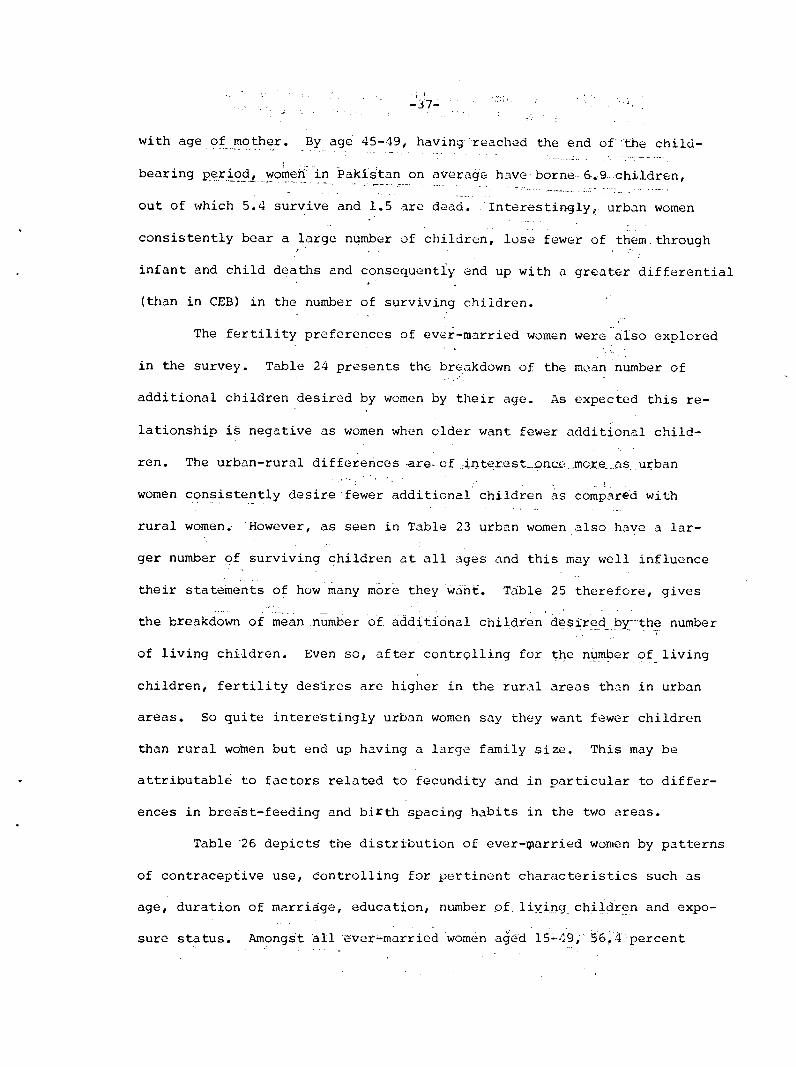
with age of mother. By age 45-49, having reached the end of the child-
bearing period, women in Pakistan on average hive borne 6_9 children,
out of which 5.4 survive and 1.5 are dead. Interestingly,.- urban women
consistently bear a large number of children, lose fewer of them through
infant and child deaths and consequently end up with a greater differential
(than in CEB) in the number of surviving children.
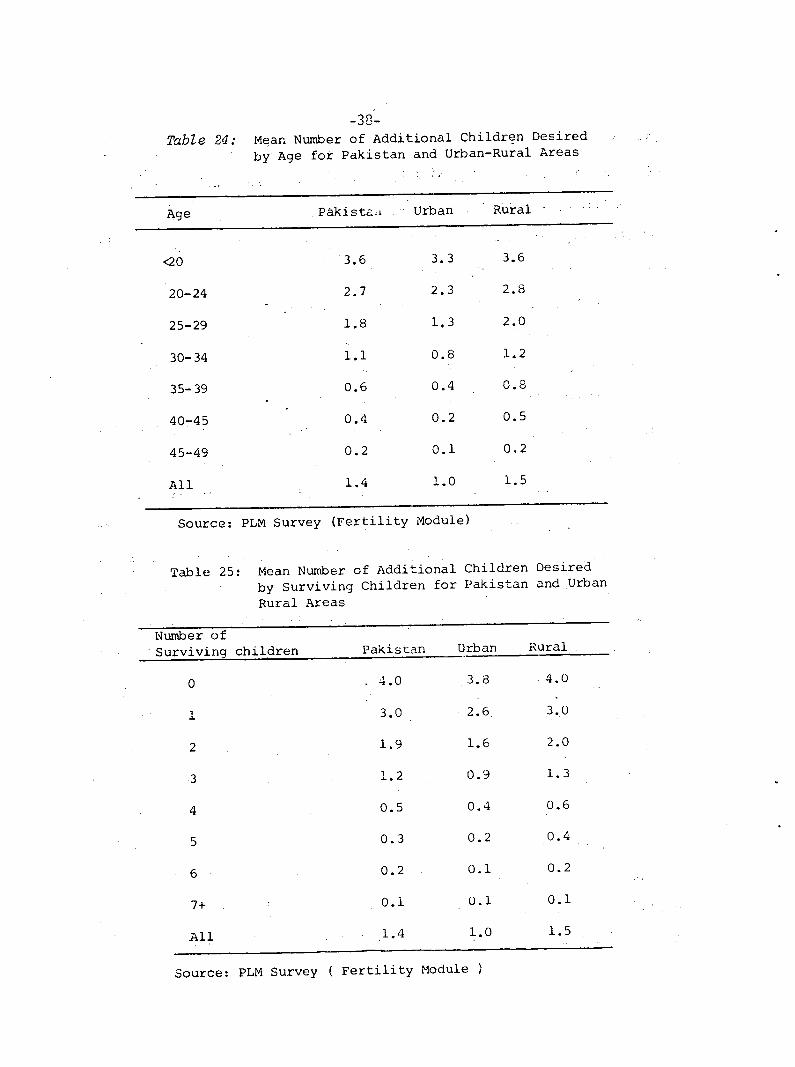
The fertility preferences of ever-married women were also explored
in the survey. Table 24 presents the breakdown of the moan number of
additional children desired by women by their age. As expected this re-
lationship is negative as women when older want fewer additional child-
ren. The urban-rural differences are- of-inter estonemore as urban
women consistently desire fewer additional children as compared with
rural women. However, as seen in Table 23 urban women also have a lar-
ger number of surviving children at all ages and this may well influence
their statements of how many more they wañ. Table 25 therefore, gives
the breakdown of mean number of additional children desired by the number
of living children. Even so, after controlling for the number of living
children, fertility desires are higher in the rural areas than in urban
areas. So quite interestingly urban women say they want fewer children
than rural women but end up having a large family size. This may be
attributable to factors related to fecundity and in particular to differ-
ences in brest-feeding and birth spacing habits in the two areas.
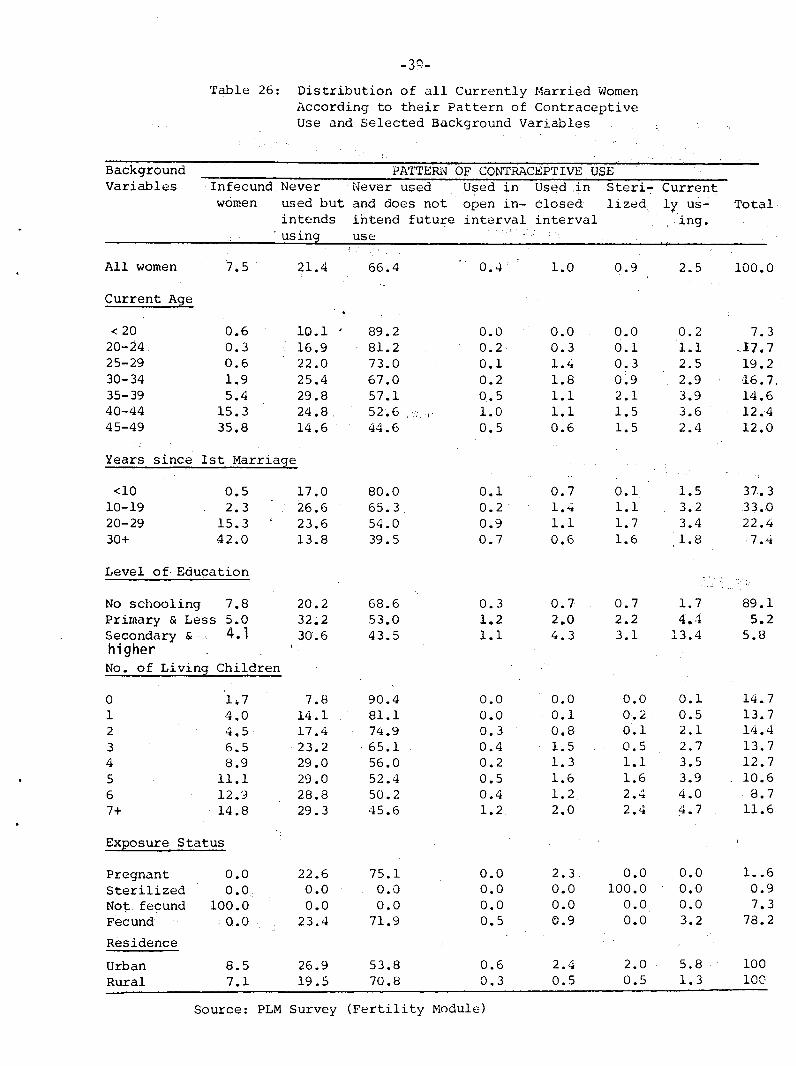
Table -26 depicts the distribution of ever-arried women by patterns
of contraceptive use, controlling for pertinent characteristics such as
age, duration of marriage, education, number pf . living children and expo-
sure status Amongst all ever-married women aged 15- 1 9 11 56 4 percent
-38-
Table 24: Mean Number of Additional Children Desiredby Age for Pakistan and Urban-Rural Areas
Age Pakistai Urban Rural
20 3.6 3.3 3.6
20-24 - 2.7 2.3 2.8
25-29 - 1.8 1.3 2.0
30-34 1.1 0.8 1.2
35-39 0.6 0.4 0.8
40-45 0.4 0.2 0.5
45-49 0.2 0.1 0.2
All 1.4 1.0 1.5
Source: PLM Survey (Fertility Module)
Table 25: Mean Number of Additional Children Desiredby Surviving Children for Pakistan and Urban
Rural Areas
Number ofSurviving children Pakistan Urban Rural
0 4.0 3.8 4.0
1 3.0 2.6. 3.0
2 1.9 1.6 2.0
3 1.2 0.9 1.3
4 0.5 0.4 0.6
5 0.3 0.2 0.4
6 0.2 0.1 0.2
7+ 0.1 0.1 0.1
All . 1.4 1.0 1.5
Source: PLM Survey ( Fertility Module
_3c_
Table 26: Distribution of all Currently Married WomenAccording to their Pattern of ContraceptiveUse and Selected Background Variables
Background PATTERN OF CONTRACEPTIVE USEVariables Infecund Never Never used Used in Used in Steri- Current
women used but and does not open in- closed lized ly us- Totalintends thtend future interval interval ing.using use
All women 7.5 21.4 66.4 0.4 1.0 0.9 2.5 100.0
Current Age
<20 0.6 10.1 89.2 0.0 0.0 0.0 0.2 7.320-24 0.3 16.9 81.2 0.2 0.3 0.1 1.1 .17.725-29 0.6 22.0 73.0 0.1 1.4 0.3 2.5 19.230-34 1.9 25.4 67.0 0.2 1.8 0.9 2.9 16.7,35-39 5.4 29.8 57.1 0.5 1.1 2.1 3.9 14.640-44 15.3 24.8. 52.6 1.0 1.1 1.5 3.6 12.445-49 35.8 14.6 44.6 0.5 0.6 1.5 2.4 12.0
Years since 1st Marriage0
<10 0.5 17.0 80.0 0.1 0.7 0.1 1.5 37.310-19 2.3 26.6 65.3 0.2 1.4 1.1 3.2 33.020-29 15.3 . 23.6 54.0 0.9 1.1 1.7 3.4 22.430+ 42.0 13.8 39.5 0.7 0.6 1.6 1.8 7•4
Level of Education
No schooling 7.8 20.2 68.6 0.3 0.7 0.7 1.7 89.1Primary & Less 5.0 32.2 53.0 1.2 2.0 2.2 4.4 5.2Secondary & 4.1 30.6 43.5 1.1 4.3 3.1 13.4 5.8higher
No. of Living Children
0 17 7.8 90.4 0.0 0.0 0.0 0.1 14.71 4.0 14.1 81.1 0.0 0.1 0.2 0.5 13.72 4,5 17.4 74.9 0.3 0.8 0.1 2.1 14.43 6.5 23.2 65.1 0.4 1.5 0.5 2.7 13.74 8.9 29.0 56.0 0.2 1.3 1.1 3.5 12.75 11.1 29.0 52.4 0.5 1.6 1.6 3.9 10.66 12.9 28,8 50.2 0.4 1.2 2.4 14.0 8.77+ 14.8 29.3 45.6 1.2 2.0 2.4 4.7 11.6
Exposure Status
Pregnant 0.0 22.6 75.1 0.0 2.3 0.0 0.0 1_6Sterilized 0.0 0.0 0.0 0.0 0.0 100.0 0.0 0.9Not fecund 100.0 0.0 0.0 0.0 0.0 0.0 0.0 7.3Fecund 0.0 23.4 71.9 0.5 0.9 0.0 3.2 78.2
Residence
Urban 8.5 26.9 53.8 0.6 2.4 2.0 5.8 100Rural 7.1 19.5 70.8 0.3 0.5 0.5 1.3 1010
Source: PLM Survey (Fertility Module)
-40-
(an astoundingly high figure) have never used and do not intend to use
çQepv1n the future; 21.4 percent liav never used but intend to
-Use; 7.5percent are infecund and 3.4 percent are currently using or te
ri1ized. Current use and sterilization levels are higher with age of
women, and with number of living children. Also education, particularly
of secondary and higher level and urban residence lead to higher levels
of contraceptive use. Of those women who are fecund, 71.9 percent do not
intend using and 23.4 percent intend using but are never users. It is
inte resting to note that the proportion of womenwho report themselves
as-infecund are also related positively to age, duration of marriage and
number of living children. This must be reflective of the actual decline
in fecundity by these factors plus the perception of infecund status
which may-occur out of the-fact that intercourse is infrequent.
Summary: - -
This profile of the various social, economic and demographic aspects
of households in Pakistan,-ought to help the reader savourthe..expensive.:
data yielded by the four-in-one exercise of the Population, Labour Force
and Migration Survey of 1979. The major contribution of the survey is -.
in providing details about-fertility, migration, labour force and income
and expenditure behaviour at the household level. The profile presented
here confirms that the PLM.survey is comparable to the 1981 Census in
terms of-aggregated data. This is reassuring as . we can then assume en
more sound grounds that the results of the sample survey are also likely
to be nationally representative. It must be pointed Out that from the
onset this paper was not intended to provide a summary of possible fin-
dings from the PLM but only to act as a background paper for further analysis.
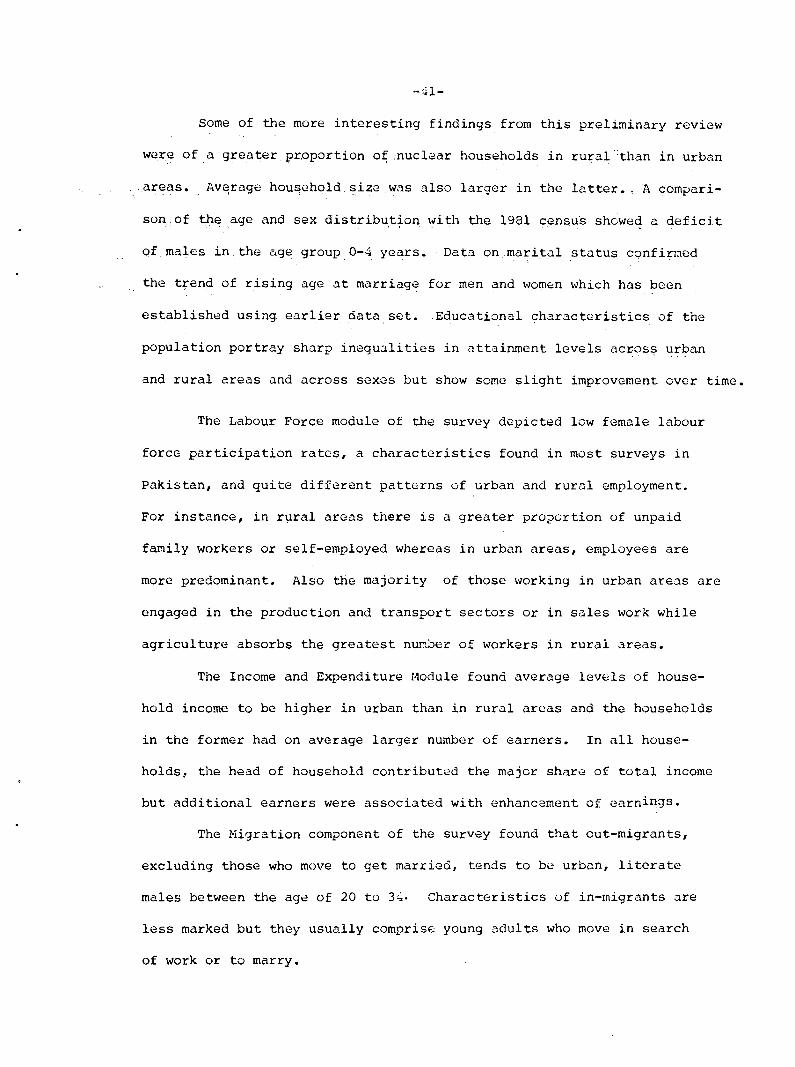
Some of the more interesting findings from this preliminary review
were of a greater proportion of nuclear households in rural than in urban
areas. Average household size was also larger in the latter.. A compari-
son of the age and sex distribution with the 1981 census showed a deficit
of males in the age group 0-4 years. Data on marital status confirmed
the trend of rising age at marriage for men and women which has been
established using earlier data set. Educational characteristics of the
population portray sharp inequalities in attainment levels across urban
and rural areas and across sexes but show some slight improvement over time.
The Labour Force module of the survey depicted low female labour
force participation rates, a characteristics found in most surveys in
Pakistan, and quite different patterns of urban and rural employment.
For instance, in rural areas there is a greater proportion of unpaid
family workers or self-employed whereas in urban areas, employees are
more predominant. Also the majority of those working in urban areas are
engaged in the production and transport sectors or in sales work while
agriculture absorbs the greatest number of workers in rural areas.
The Income and Expenditure Module found average levels of house-
hold income to be higher in urban than in rural areas and the households
in the former had on average larger number of earners. In all house-
holds, the head of household contributed the major share of total income
but additional earners were associated with enhancement of earnings.
The Migration component of the survey found that out-migrants,
excluding those who move to get married, tends to be urban, literate
males between the age of 20 to 3. Characteristics of in-migrants are
less marked but they usually comprise young adults who move in search
of work or to marry.
REFERENCES
1. Abbasi, Nasreen and Mohammad Ix±an, Socio .-Economic_Effects of
International Migration on the Families Left Behind. Studiesin Population, Labour Force and Higration Project Report No..7, Pakistan Institute of Development Economics: 1983.
2. -Alam, Iqbal and John G. Cleland, If:mt and Child Mortality: 7-12'endsand Deterninants. Fertility in Pakistan: A Review of Findingsfrom the Pakistan Fertility Survey. International Statistical
Institute, Voorburg, Netherland, 1984.
3. Booth4 Heather and Iqbal Alam, Fertility in Pakistan, LevelsTrends and Differentials World Fertility Survey Conference
Paper, London, July 1980.
4. Casterline, John, Fertility Differentials in Pakistan, WorldFertility Survey Conference Paper, London, July 1960.
5. Farooqui, M. Naseem Iqbal and Ohazi Mumtaz Farooq, Final Report ofPopulation Growth Estimation Experiment: 1962-65, PakistanInstitute of Development Economics, Dacca, July 1971.
6. Federal Bureau of Statistics, Household Income and Expenditure Survey
.1979. Karachi, 1983.
7. Federal Bureau of Statistics, Statistics Division, Population Growth
Srvey, Karachi,e1968--71,
8. Federal Bureau of Statistics, Sta:istics Division, Population Growth
Survey, Karachi, 1976-78.
9. Federal Bureau of Etatistics, Statistics Division, Labour Force Survey
1974-75, Karachi.
10 Federal Bureau of Statistics, Statistics Division, Labour Force Survey
1978-79, KSrahi. . ....
11. Hashmi, S.S., Masihur Rehman Khar! and K.L. iKrotki,. The People ofKarachi: Data from a Survey, Pakistan Institute of Developnint
Economics, Karachi, 1964. .
12 Irfan, Mohammad, Lionel Demery, Ghuiam Mohammed Arif. MigrationPatterns in Pakistan: Preliminary Results from the PLM Survey1979. Studies in Population, Labour Force and Migration
ect Report No. 6, Pakistan Institute of Development Economics,
Islamabad, 1983.
13. Kabir, Mohammed, The Demographic Characteristics of Household Popula-tion, WFS ComparativeStudies No. 6, International Statistical
Institute, Voorburg, Netherlands, 1985.
_L4I._
14. Karim, M. Fertility.Differentials by Family Type, PakistanDevelopment Review, 13(2). Pakistan Institute of DevelopmentEconomics, Islamabad, 1974.
15. MahmoodNaushin. Literacy and-Educational Attainment in Pakistan1951-73, The Pakistan Developient Review, XVII(3) PakistanInstitute of Development Economics, Islamabad, 1978.
16. Mahmood Naushin, and Syad Mubashir. Au, Nuptiality Patterns inPakistan, Studies in Population, Labour Force and MigrationProject Report No., -2, Pakistan I'nstiite of DevelopmentEconomics, Islamabad. 1983. -
17. Pakistan Census OrganizQtion, Population Census of Pakistan: 1951,(West Pakistan) Karachi.
18. Pakistan Census Organization, Population Census of Pakistan: 1961,(West Pakistan) Karachi.
19. Pakistan Census Organization, Population Census of Pakistan: 1972,Islamabad, 1973.
20. Pakistan Census Organization, Population Census oP Pakistan: 1981,Islamabad, 1983.
21. Pakistan Census Organization, housing Economic and DemographicSurvey, 1973, Islamabad.
22. Popu1atiu Planning Council of Pakistan, Pakistan Fertility Surve1975, Islamabad, 1976.
23. Sathar, Z.A. Rural-Urban Fertility Differentials 1975, The PakistanDevelopment Review, Vol. XVII (3), Pakistan Instit ofDevelopment Economics, Islamabad, 1979.
24. Shah, Nakhdoom and Sathar, Z. Quantification of Un-employment andUnderemployment in Pakistan: Problems of Conceptualization__Measurement, Proceedings of the ILO Conference on EmploymentPlanning and Basic Needs, Islamabad, May 1978.
25. Training, Research and Evaluation Centre (TREC) national ImpactSurvey, Lahore, n .d.
000
19.517.421.911.624.911.69.4
10.47.37.94.48.8
00
24.229.416.211.814.010.912.39.3
11.88. 68.35.1
12.8
0.545.226.35.74•4
4.114.914.814.66.95.614.26.4147
12.9
99.554.'835.532.536.943.047.646.359.160. 1456.670.568.880.655 2
00
14.07.29.15.76.85.45.77.79.25.06.13.35.8
15.116.113.610. 98.66.45.14.8
.4.2.3.93. 22.6
- 2.33.3
1'6 C)
0•00'5. 6.15.913.49.27'.7
76.36.414', 52.51-.94.5'-
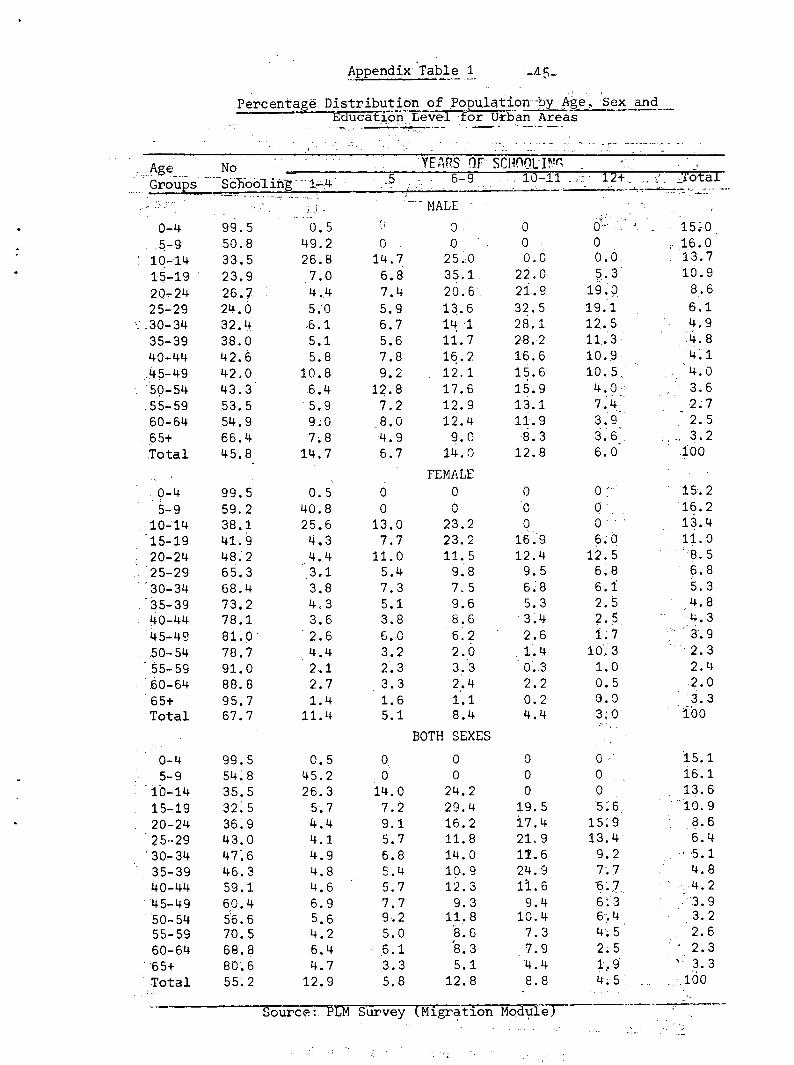
Appendix Table 1
Percentage Distribution of Po lat±on--by' A' -SexEducation Level for Urban Areas
Age No YEARS IF SCW)OLI'
Groups scooiinj 5 6-9 10-11 12+1ota1- I
- MALE
0_I4 99.5 0.5 0 0 .'..' 15;0:5-9 50.8 49.2 0 0 '. 0 0 p16.010-14 33.5 26.8 14.7 25.0 0.0 0.0 13.7
15-19 23.9 .7.0 6.8 35.1, 22.0 5.3 10.9
20-24 26.7 4.4 7.4 20.6L 21.9 194 8.6
25-29 24.0 5.'0 5.9 13.6 32.5 19.1 6.1.30-34 32.4 .6.1 6.7 141 28.1 12.5 4.935-39 38.0 5.1 5.6 11.7 28.2 11.3 .4.840-44 42.6 5.8 7.8 16.2 16.6 10.9r 4.1.14-49 42.0 10.8 9.2 . 12.1 15.6 10.5:50-54 43.3 6.4 12.8 17.6 15.9 4.0 , 3.65559 535 '59 7.2 12.9 13.1 7.460-64 54.9 90 8.0 12.4 11.9 3.9 . 2.565+ 6.4 7.8 4.9 9.0 8.3 3.6, .. 3.2Total 45.8 14,7 6.7 14.0 12.8 6.0 100
FEMALE
99.5
0.5
0
0
0
0
15-.2
5-9
59.2
140.8
0
0
0
0
16.210-14
38.1
25.6
13.0
23.2
0
13.415-19
41.9
4.3
7.7
23.2
16.9
60
11.020-24
48.2
4.4
11..0
11.5
12.4
12.5
8.5
- 25-29
65.3
3.1
5.4
9.8
9.5
6.8
6.8•30-34
68.4
3.8
7.3
7.5
6.8
6.1
5.335-39
73.2
4,3
5.1
9.6
5.3
2.5
14.84044
78.1
3.6
3.8
8.6
3.4
2.545-49
81.0
2.6
610
6.2
2.6
1.'
.3.9.50-54
78.7
4.4 3.2
2.0
1.4
10. 3
2.3.55-59
91.0
2.1
2.3
3. 3
0..3
1.0
2.4.60-64
88.8
2.7
3.3
2. 4
2.2
0.5 .2.065+
95.7
1.1+
1.6
1.1
0.2
0.0
3.3Total
67.7
11.14
5.1
8.4 4,14 3:0
oo
BOTH SEXES
0-45-9
10-1415-1920-2425--2930-3435-3940-4445-4950-5455-5960-6465+Total
Source: PLM Survey (Migration
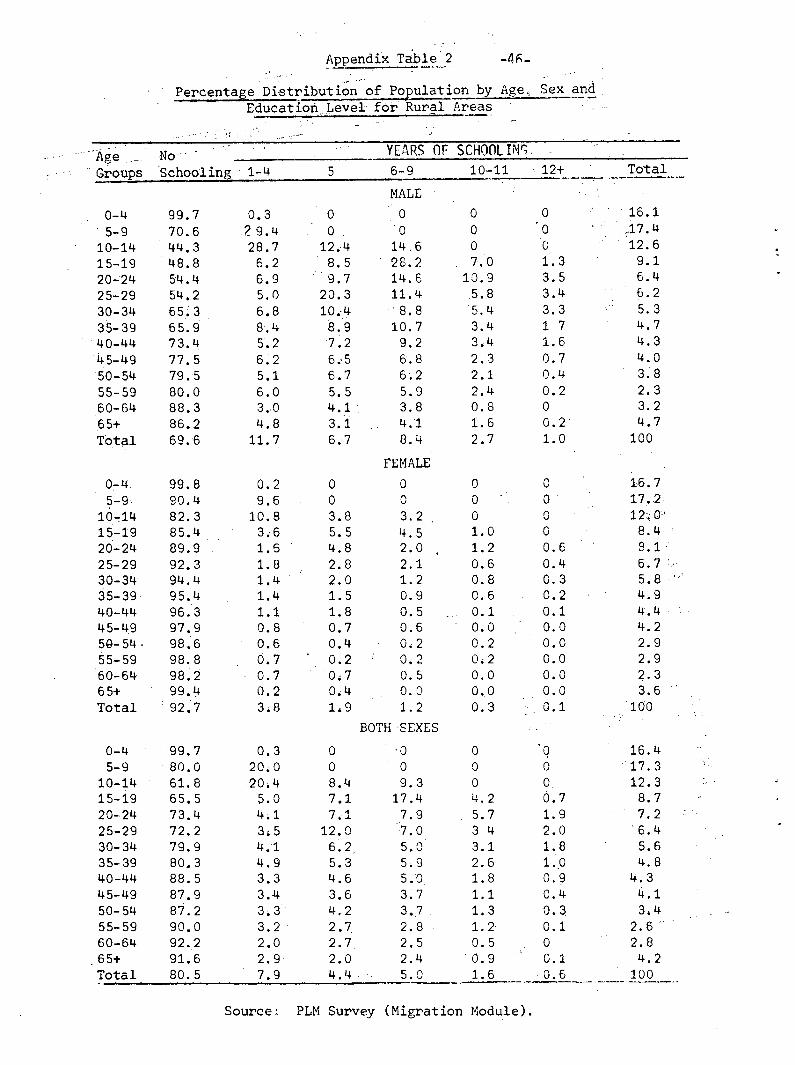
Appendix_Table 2
Percentage Distribution of Population by Age. Sex andEducation Level for Rural Areas
Age No YEARS or SCHOOL IV'
Groups 'Schooling 14 5 69 10:11 12+ Total
MALE
0-4 99.7 0.3 0 0 0 0 16.1
5-9 70.6 29.4 0 0 0 0
• 10-14 414.3 28.7 12.4 14,6 0 0 12.6
15-19 48.8 6.2 8.5 28.2 7.0 1.3 9.1
20-24 54.4 6.9 9.7 14.6 10.9 3.5 6.4
25-29 54.2 5.0 20.3 11.4 5.8 3.4 6.2
30-34 65.3 6.8 10.4 8.8 5.14 3.3 5.3
35-39 65.9 8.14 8.9 10.7 3.4 1.7 14.7
40-44 73•14 5.2 7.2 9.2 34 1.6 4.314 549 77.5 6.2 6.•5 6.8 2.3 0.7 4.0
50-54 79.5 5.1 6.7 6.2 2.1 0.4 3.8
55-59 80.0 6.0 5.5 5.9 2.4 0.2 2.3
60-64 88.3 3.0 4.1 3.8 0.8 0 3.2
65+ 86.2 4.8 3.1 4.1 1.6 0.2' 4.7
Total 69.6 11.7 6.7 8.4 2.7 1.0 100
FEMALE
014
99.8
0.2
0
0
0
0
16.7
90.4
9.6
0
0
0
0
17-2
10-14
82.3
10.8
3.8
3.2
0
0
12. 0-
15-19
85.4
3.6
5.5
4.5
1.0
0
8.1+
20-24
89.9
1.6
4.8
2.0
1.2
0.6
9.1
25-29
92.3
1.8
2.8
2.1
0.6
0.14
6.730-3'
94.4
1.4
2.0
1.2
0.8
0.3
5.835-39
95.4
1.4
1.5
0.9
0.6
0.2
4.9
140-44
96.3
1.1
1.8
0.5
0.1
0.1 414
45-49
97.9
0.8
0.7
0.6
0.0
0.0
4.250-54
98.6
0.6
0.4
0.2
0.2
0.0
2.955-59
98.8
0.7
0.2
0.2
0 2
0.0
2.960-64
98.2
0.7
0.7
0.5
0.0
0.0
2.365+ 9914 0.2
0.4
0.0
0.0
0.0
3.6Total
92.7
3.8
lag
1.2
0.3
0.1
100
BOTH SEXES
0-4 99.7 0.3 0 '0 0
5-9 80.0 20.0 0 0 0
10-114 61.8 20.4 8.4 9.3 0
15-19 65.5 5.0 7.1 17.4 4.2
20-24 73.4 461 71 7.9 5.7
25-29 72.2 35 12.0 7.0 3 4
30-34 79.9 4.1 6.2 5.0 3.1
35-39 80.3 4.9 5.3 5.9 2.6
40-44 88.5 3.3 4.6 5.0 1.8
45-49 87.9 3.4 3.6 3.7 1.1
50-54 87.2 3.3 4.2 37. 1.3
55-59 90.0 3.2 2.7 2.8 1.2
60-64 92.2 2.0 2.7 2.5 0.565+ 91.6 2.9 2.0 2.14 0.9Total 80.5 7.9 4.14 5.0 1.6 --
Q 16.4o 17.30 .12.30.7 8.71.9 7.22.0 6.41.8 5.61.0 4.80.9 4.30.'4 '4.10.3 340.1 2.6'0 2.80.1 4.20.6 100
Source: PLM Survey (Migration Module).
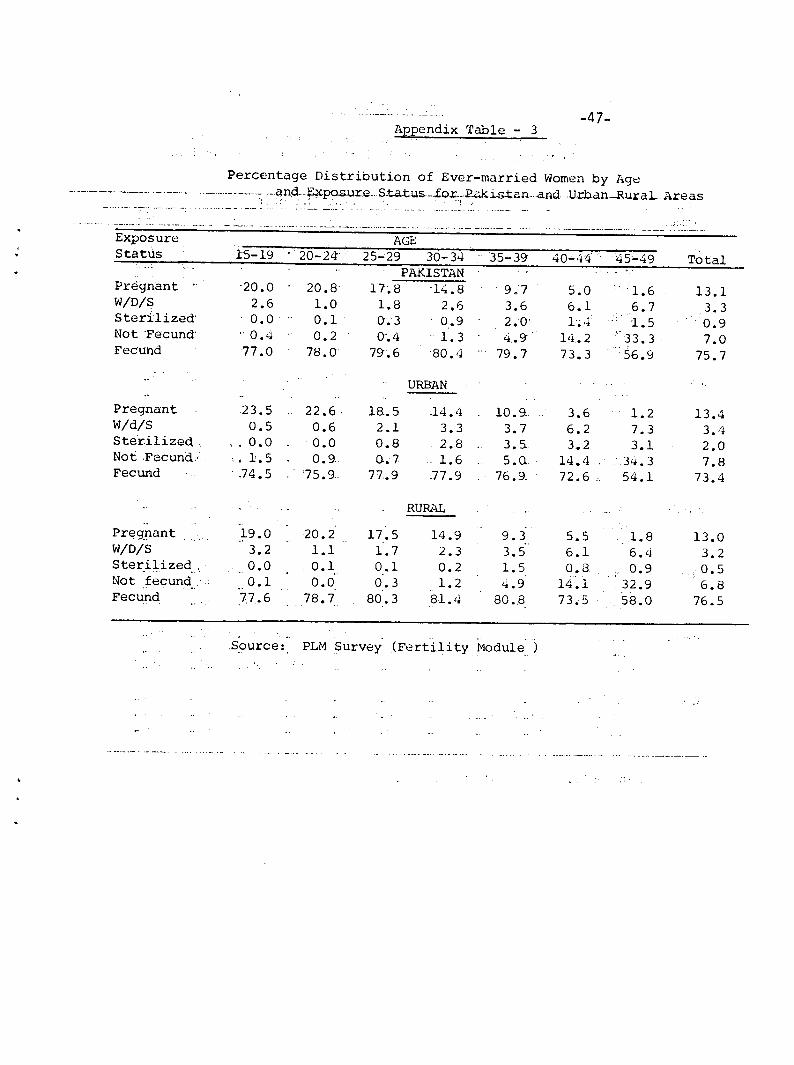
I-- .-..-' -47-Appendix Table - 3
Percentage Distribution of Ever-married Women by AgeEx Q -Uijaan-Rural_ Areas
Exposure AGEStatus 15-19 20-2 2529 30-34 - 35-39 40-44' 5'-49 Total
• . . -'' PAKISTAN ' ..•
Pregnant ' -20.0 20.8' 17.8 '14.8 97 ' 5.0 1.6 13.1W/D/S 2.6 1.0 1.8 2.6 3.6 6.1 6.7 3.3
1.Sterilized- 0.0 ' 0.1 03 0.9 ' 2.0 1.4 ' 1.5 "0.9Not Fecund -'0.4 ' 0.2 0.4 1.3 4.9 14.2 1 33.3 7.0Fecund ' '77.0 78.0 79.6 80.4 " 79.7 73.3 ' 569 75.7
PregnantW/d/SSterilized.Not .Fecund,Fecund
.23.5 . 22.6 .18.50.5 0.6 2.10.0 . 0.0 0.81.5 . 0.9. 0.7
.74.5 -, '75.9.. 77.9
URBAN
-14.4 - 10.9.3.3 3.7
.2.8 • 3.5
.1.6 - 5.0..
.77.9 . 76.9.
3.6 ' 1.2
6.2 7.3
3.2 3.114.4 . .34.372.6 .,. 54.1
13.43.42.07.8
73.4
RURAL . ..
Pregnant 19.0 20.2 17.5 14.9 9.
3 5.5 1.8 13.0W/D/S 3.2 1.1 1.7 2.3 3.5 6.1 6.4 3.2Sterilized . 0.0 0.1 0.1 0.2 1.5, 0.3 ,,. 0.9 p0.5Not fecund . 0.1 , 0.0 0.3 1.2 4.9 14.1 32.9 6.8Fecund 77.6 - 78.7 80.3 81.4 80.8 73.5 . 58.0 76.5
.s:ource: PLM Survey (Fertility Module )
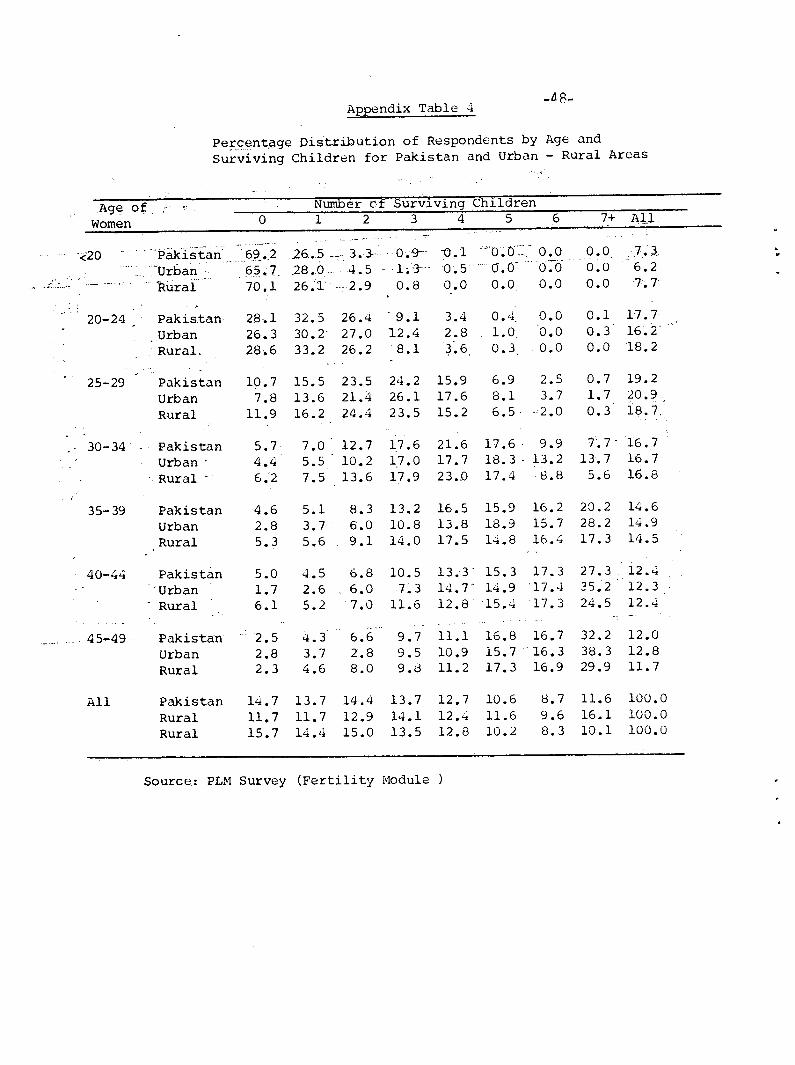
_L1 R-Appendix Table 4
Percentage Distribution of Respondents by Age andSurviving Children for Pakistan and Urban - Rural Areas
Age of Number cf Surviving Children
Women 0 1 2 3 4 5 6 7+ All
<20 Pakistan 692 2.6-5 - 3.-3-- 0 "(Y 1 0 O '0 0 0 0 ,7.3-
Urban 657.28..0,-45 13 05 00 00 00 62
Rural 70.1 26'1 .... 2.9 0.8 0.0 0.0 0.0 0.0 '7.7'
20-24 Pakistan 28-.1 32.5 26.4 9.1 3.4 0 o.0 0.1 1-7.7
Urban. 26.3 30.2' 27.0 12.4 2.8 . 1.0 0.0 0.3 16.2
Rural. 28.6 33.2 26.2 8.1 3.6 0.30.0 0.0 •18.2
25-29 - Pakistan 10.7 15.5 23.5 24.2 15.9 6.9 2.5 0.7 19.2
Urban 7.8 13.6 21.4 26.1 17.6 8.1 3.7 1.7 20.9.
Rural 11.9 16.2 24.4 23.5 15.2 6.5-2.00.3 18.7.
30-34 - Pakistan 5.7 7.0 ' 12.7 17.6 21..6 17.6 9.9 16.7
- Urban 4.4 5.5 10.2 17.0 17.7 18.3 13.2 13.7 16.7
'Rural 6.2 7.5 - 13.6 17.9 23.0 17.4 8.8 5.6 16.8
35-39 Pakistan 4.6
Urban 2.8
Rural
5.3
40-44
Pakistan 5.0Urban 1.7Rural 6.1
- ...45-49
Pakistan "2.5Urban 2.8Rural 2.3
5.1 8.3 13.2 16.5 15.9 16.2 20.2 14.63.7 6.0 10.8 13.8 18.9 15.7 28.2 14.95.6 . 9.1 14.0 17.5 14.8 16.4 17.3 14.5
4.5 6.8 10.5 13.3' 15.3 17.3 27.3 12.42.6 , 6.0 7.3 14.7 14.9 '17.4 35.2 12.35.2 7.0 11.6 12.8 15.4 17.3 24.5 12.4
4.3 ' 6.6 9.7 11.1 16.8 16.7 32.2 12.03.7 2.8 9.5 10.9 15.7 '16.3 38.3 12.84.6 8.0 9.8 11.2 17.3 16.9 29.9 11.7
All Pakistan 14.7 13.7 14.4 13.7 12.7 10.6 8.7 11.6 100.0
Rural 11.7 11.7 12.9 14.1 12.4 11.6 9.6 16.1 100.0Rural 15.7 14.4 15.0 13.5 12.8 10.2 8.3 10.1 100.0
Source: PLM Survey (Fertility Module )
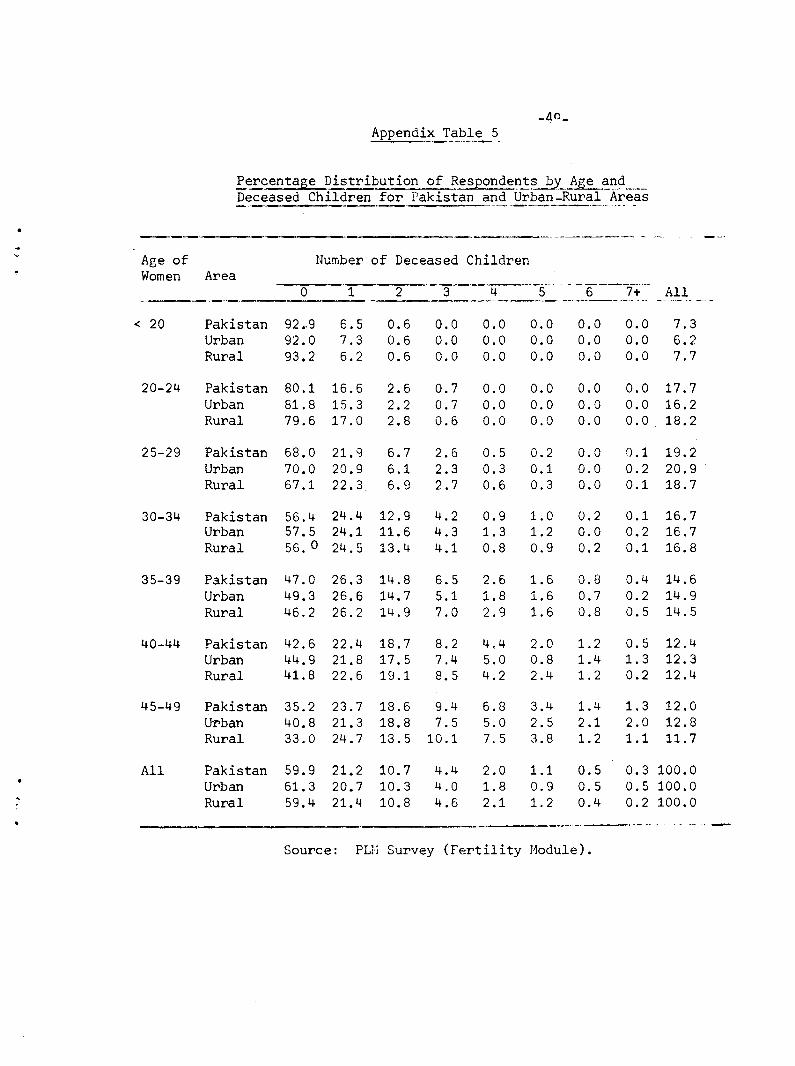
_40_
Appendix Table 5
Percentag e Distribut ion of R espondents by AandDeceased Children for Pakistan and Urban-Rural Areas
Age of Number of Deceased ChildrenWomen Area
0 1 2 3 4 5 6 7+ All
< 20 Pakistan 949 6.5 0.6 0.0 0.0 0.0 0.0 0.0 7.3Urban 92.0 7.3 0.6 0.0 0.0 0.0 0.0 0.0 6.2Rural 93.2 6.2 0.6 0.0 0.0 0.0 0.0 0.0 7.7
20-24 Pakistan 80.1 16.6 2.6 0.7 0.0 0.0 0.0 0.0 17.7Urban 81.8 15.3 2.2 0.7 0.0 0.0 0.0 0.0 16.2Rural 79.6 17.0 2.8 0.6 0.0 0.0 0.0 0.0 18.2
25-29 Pakistan 68.0 21.9 6.7 2.6 0.5 0.2 0.0 0.1 19.2Urban 70.0 20.9 6.1 2.3 0.3 0.1 0.0 0.2 20.9Rural 67.1 22.3 6.9 2.7 0.6 0.3 0.0 0.1 18.7
30-34 Pakistan 56.4 24.4 12.9 14.2 0.9 1.0 0.2 0.1 16.7Urban 57.5 24.1 11.6 4.3 1.3 1.2 0.0 0.2 16.7Rural 56.0 24.5 13.4 4.1 0.8 0.9 0.2 0.1 16.8
35-39 Pakistan 47,0 26.3 14.8 6.5 2.6 1.6 0.8 0.4 14.6Urban 49.3 26.6 14.7 5.1 1.8 1.6 0.7 0.2 14.9Rural 46.2 26.2 114.9 7.0 2.9 1.6 0.8 0.5 14.5
40-44 Pakistan 42.6 22.4 18.7 8.2 4,4 2.0 1.2 0.5 12.4Urban 44.9 21.8 17.5 7.4 5.0 0.8 1.4 1.3 12.3Rural 41.8 22.6 19.1 3,5 4.2 2.4 1.2 0.2 12.4
45-49 Pakistan 35.2 23.7 18.6 9.4 6.8 3.4 1.4 1.3 12.0Urban 40.8 21.3 18.8 7.5 5.0 2.5 2.1 2.0 12.8Rural 33.0 24.7 13.5 10.1 7.5 3.8 1.2 1.1 11.7
All Pakistan 59.9 21.2 10.7 4.4 2.0 1.1 0.5 0.3 100.0Urban 61.3 20.7 10.3 4.0 1.8 0.9 0.5 0.5 100.0Rural 59.4 21.4 10.8 4.6 2.1 1.2 0.4 0.2 100.0
Source: PLN Survey (Fertility Module).