Embed Size (px)
Citation preview

STUDIES ©F ©ELL DISRUPTION IN HIGH PRESSURE H0M0GENI8ERS
by
ELArlEH &ESHAYABZ
A thesis submitted fo r the degree o f Doctor o f Philosophy at The
U n ive rs ity o f London
SERC Centre fo r Biochemical Engineering Department of Chemical and Biochemical Engineering
U n ive rs ity College London 1990

ProQuest Number: 10609867
All rights reserved
INFORMATION TO ALL USERS The quality of this reproduction is dependent upon the quality of the copy submitted.
In the unlikely event that the author did not send a com plete manuscript and there are missing pages, these will be noted. Also, if material had to be removed,
a note will indicate the deletion.
uestProQuest 10609867
Published by ProQuest LLC(2017). Copyright of the Dissertation is held by the Author.
All rights reserved.This work is protected against unauthorized copying under Title 17, United States Code
Microform Edition © ProQuest LLC.
ProQuest LLC.789 East Eisenhower Parkway
P.O. Box 1346 Ann Arbor, Ml 48106- 1346
I would lik e to express my special thanks
to my supervisor, Professor Peter Dunnill fo r his invaluable advice and continuous
encouragement of new thoughts and Ideas
in the course of th is study. I also wish
to thank Dr. Mike Hoare fo r his
constructive and helpful comments, and
the members of the research and technical team for th e ir support. I would lik e to
extend my thanks to the SERC fo r th e ir
financia l support, and to the members of APV-Gaulin and APV-Baker specially
Messrs. Dick Kinney and Peter Davies fo r
th e ir cooperation.

"E pur s i muove/"
(But i t does move!)
A ttributed to G alileo G a lile i; a fte r he
recanted his assertion that the earth
moved round the sun.
ABSTRACT
In th is study several aspects of ce ll disruption in high pressure
homogenisers were investigated. F irs t ly , the kinetics of disruption
of Rhizoous nigricans, a filamentous fungus, was shown to exh ib it major differences from those of u n ice llu la r microorganisms. The
release of soluble protein was a weak function of pressure and
number of passes. The maximum level of soluble protein release (RB) which appeared to vary with pressure was shown to be associated with
micronisation of ce ll debris. A more specific assay fo r a soluble
enzyme (ADH) showed no such apparent va ria tio n . The major e ffe c t of ce ll concentration was not on disruption kinetics but on structural characteristics of the suspension which resulted in homogeniser blockage at re la tiv e ly low ce ll concentrations (20-22 g/L dry
weight) and also influenced the harvesting and resuspension
processes.
Another aspect of c e ll disruption examined was the e ffe c t o f valve
assembly configuration on the disruption of both u n ice llu la r and
filamentous microorganisms. Six valve units were characterised and
several parameters were shown to be c r i t ic a l . Impact distance was an
important factor in the disruption of filamentous R. nigricans
c e lls , whilst valve geometry did not appear to have any notable
e ffe c t. Valve unit configuration had a s ig n ific an t e ffe c t on the
disruption of the u n ice llu la r microorganism, bakers’ yeast. Maximum
performance was observed with a ’ knife-edge’ valve seat configuration and valve geometries consisting of a f l a t valve seat and f la t valve rod gave lowest y ie lds. A reduction 1n the "land"
width gave improved performance. Changing the valve rod to a cone
shape also resulted 1n higher protein release. As with filamentous
microorganisms, variation in the impact distance had a major e ffec t
on the performance of the homogeniser.

The e ffe c t of homogenisation on the size d is trib u tio n of yeast ce ll debris and microsomal fractions obtained from R. nigricans c e lls was
also investigated. A reduction of a t least 10% was observed in the
size of the microsomes from one to 2 passes with no fu rther decrease
up to 4 passes. For a l l valve units tested, as the number of passes
was Increased, a reduction in the proportion of larger yeast debris
partic les was noted. In general, higher protein release was
associated with a higher percentage of smaller p artic les except fo r
a marginal trend observed fo r the ’ f la t valve’ unit giving larger
p artic les fo r equivalent protein release compared to other valves.
Based on the findings fo r bakers’ yeast an explanation of the
mechanism of ce ll disruption was sought. A modified Bernoulli equation was used to define the flow v e lo c ities through the valve
rod and valve seat fo r d iffe re n t valve unit configurations. The main
disruption mechanism was shown to be impingement, the rate of ce ll breakage being related to the stagnation pressure or the maximum
wall stress of the f lu id je t . Decreased valve gap width and
decreased impact distance both contributed to an increased ce ll disruption rate , the performance of the homogeniser being related to
the product of these two dimensions fo r the range of valve seats and
impact distances studied. Further experimental work to tes t the
proposals has been defined.
The design of an integrated homogenisation system consisting of a
new commercial homogeniser and various an c illa ry Items of equipment was undertaken to provide a suitable process un it fo r fu rther
research, taking into account the additional elements needed fo r
containment.

TABLE OF CONTENTS PAGE
TITLE PAGE 1ACKNOWLEDGMENTS 2ABSTRACT 4TABLE OF CONTENTS 6
1. INTRODUCTION 12
1.1 Methods of c e ll disruption 121.1.1 Small scale disruption 13
1.1 .1 .1 Non-mechanical methods 131 .1 .1 .2 Mechanical methods 14
1 .1 .1 .2 .1 Sonicatlon 151 .1 .1 .2 .2 Explosive decompression 161 .1 .1 .2 .3 Extrusion 161 .1 .1 .2 .4 Agitation 19
1.1.2 Large scale disruption 191.1 .2 .1 High speed bead m ill 201 .1 .2 .2 High pressure homogenisers 23
1.1 .3 Recent developments 1n mechanical devices 25fo r ce ll disruption1.1 .3 .1 New concepts in the design of high 25
pressure homogenisers1 .1 .3 .2 M icroflu id lsers 26
1.2 Kinetics of c e ll disruption 271.2.1 Development of a k ine tic model 271.2.2 E ffect o f Rb on the k inetics model 301.2 .3 Disruption k inetics of filamentous 32
microorganisms1.2 .4 Effect of operating parameters 33
1.2 .4 .1 Valve design 341 .2 .4 .2 Cell characteristics 36
6

1 .2 .4 .2 .1 Conditions of c e ll growth 361 .2 .4 .2 .2 Effect of c e ll wall 36
structure1 .2 .4 .2 .3 Cell concentration 46
1 .2 .4 .3 Pressure and number of passes 471 .2 .4 .4 Temperature 481 .2 .4 .5 Flow rate 49
1.3 Disruption mechanism 1n high pressure homogenisers 501.3.1 Stress 50
1 .3 .1 .1 Normal stress 521 .3 .1 .2 Impingement 531 .3 .1 .3 Shear 54
1.3 .2 Magnitude and rate of pressure drop 551.3 .3 Turbulence and ve loc ity changes 551.3 .4 Cavitation 561.3 .5 Explosive decompression 57
1.4 Cell p a rtic le and c e ll debris formation 581.4.1 Cell debris 591.4 .2 Inclusion bodies 601.4 .3 Microsomal fractions 60
1.5 Scope of the study 63
2. MATERIALS AND METHODS 642.1 M aterials 642.2 Microorganisms 642.3 Growth medium fo r Rhizopus nigricans 652.4 Growth of Rhizopus nigricans in shake flasks 652.5 Growth of R. nigricans in fermenters 66
2.5.1 Equipment 66
2 .5 .1 .1 Fermenters 662 .5 .1 .2 Instrumentation and s te r ilis a t io n 66
2 .5 .2 Conditions of growth 672 .5 .2 .1 Filamentous growth 672 .5 .2 .2 Pelleted growth 68
7
2.6 Harvesting 682.6.1 Nylon Mesh 682 .6 .2 Basket centrifuge 68
2.7 Preparation of microorganisms fo r disruption 692.7.1 Bakers*yeast 69
2 .7 .2 Rhizopus nigricans 692.8 High pressure homogenisation 69
2.8.1 Equipment 692 .8 .2 Changing of valve assembly 702 .8 .3 Disruption procedure 73
2.9 Microsomal preparation 742.9 .1 Homogenate 7 4
2 .9 .2 Gel f i l t r a t io n 742 .9 .3 ’Sugar cushioning’ 76
2.10 P artic le size measurement 752.10.1 Sample types 752.10.2 Photon correlation spectroscopy 75
2.10 .2 .1 Equipment 752 .10 .2 .2 Sample preparation 772 .10 .2 .3 Instrument settings 78
2.10.3 E lec trica l sensing zone 782.11 Gel electrophoresis 782.12 Protein assay 79
2.12.1 Bakers’ yeast 792.12.2 R.n1gr1cans 80
2.13 Alcohol dehydrogenase a c tiv ity assay 802.14 Dry weight measurements 802.15 Microscopy 81
3. DISRUPTION CHARACTERISTICS OF RHIZOPUS NIGRICANS 82
3.1 E ffect of pressure and number of passes 823.1 .1 Shake flask culture 823 .1 .2 Fermenter cultures 84
8

3 .1 .3 Maximum protein release 843.2 E ffect o f c e ll concentration 903.3 E ffect of up-stream processing conditions 90
3.3 .1 Cell growth 903 .3 .2 Harvesting and storage 92
3.4 Discussion 933.4 .1 M1cron1sat1on 933 .4 .2 Cell related conditions 983 .4 .3 Disruption k in e tic 98
4. SIGNIFICANCE OF MECHANICAL PARAMETERS IN CELL DISRUPTION 100
4.1 Valve un it characterisation 100
4.2 E ffect o f valve unit geometry on disruption 102of R.nigricans
4.3 E ffect of impact distance on disruption of 107R.nigricans
4.4 Discussion 1074.5 E ffect of valve unit geometry on disruption of 110
bakers’ yeast4 .5 .1 E ffect o f geometry of valve seat central 110
o r if ic e4.6 E ffect of Impact distance on disruption o f bakers’ 114
yeast4.7 E ffect of scoring of the valve seat 114
5. PARTICLE AND CELL DEBRIS FORMATION 121
5.1 Microsomal fractions from R. nigricans 1215.1 .1 Microsomal preparation 1215 .1 .2 E ffect o f c e ll disruption on mlcrosomes 1245 .1 .3 Sugar cushioning fo r microsomal separation 127
5.2 E ffect of homogenisation on yeast debris formation 129
9

5.2.1 E ffect of m ultip le passes 1295 .2 .2 Effect of valve unit geometry 1295 .2 .3 Comparison between CD and CR valve units 1425 .2 .4 Effect of impact distance 148
6. MECHANISM OF CELL DISRUPTION 153
6.1 Theoretical considerations 1536.2 Discussion 158
6.2.1 Effect o f impact ring 1606 .2 .2 E ffect o f valve geometry 161
6.3 Concluding remarks on the mechanism of disruption 162
7. BIOCHEMICAL ENGINEERING DESIGN OF AN INTEGRATED 165
HOMOGENISATION SYSTEM
7.1 Background 1657.2 Design philosophy 1667.3 The homogeniser 167
7.3.1 Main features 167
7 .3 .2 Additional features fo r the integrated system 1697.4 Plan of the a u x ilia ry equipment 1707.5 Design of hoppers 172
7.5.1 Level control 172
7 .5 .2 Instrumentation 1737.6 Pipework, f it t in g s and valves 1757.7 Heat exchanger unit 1767.8 Control panel 1807.9 Steam s te r ilis a tio n and CIP 180
7.10 Conclusion - future containment 184
10

8. CONCLUSION - FUTURE WORK 1868.1 Mechanism of ce ll disruption 1868.2 P artic le sizing and valve design 187
APPENDIX A Growth of Rhizopus nigricans in fermenters 188APPENDIX B Application of photon correlation spectroscopy 195
NOMENCLATURE 213REFERENCES 215
11

1. INTRODUCTION
The recovery of In tra c e llu la r m aterials, such as enzymes, from
microorganisms has gained a fresh momentum over the past decade as
a resu lt o f new commercial applications in the food and
pharmaceutical Industries and the prospects of fu rther product development by genetic engineering.
The design and operation of large scale extraction and Iso lation
systems for In tra c e llu la r proteins and enzymes have been constrained
by the denaturation and loss of a c t iv ity of products during
processing. Better understanding of each step from product formation
1n fermenters to ce ll breakage, separation and p u rifica tio n has been
shown to improve the development of Industria l techniques (Dunnill 1983). Cell disruption constitutes the f i r s t stage in the iso lation
of in tra c e llu la r m aterials. I t 1s a crucial step 1n downstream
processing because any damage to the product a t th is in i t ia l phase
w ill Invalidate subsequent design and make operational refinement to
other plant equipment irre le v an t. On the other hand high disruption
yie ld w ill allow more f le x ib i l i t y in the follow up treatment of the
product.
1.1 Methods o f c e ll disruption
Over the past twenty years several reviews have been published on
the methods availab le fo r c e ll disruption (Wlmpenny 1967; Edebo
1969; Wiseman 1969; Hughes et a l . 1971; Edebo and Magnusson 1973; Coaklev et a l . 1977; Engler 1986; Chistl and Moo-Young 1986). These
methods can be divided into two categories, small scale techniques
fo r laboratory applications and large scale techniques fo r
industria l uses.
12

1.1.1 Small scale disruption
Techniques 1n laboratory work are numerous and en ta il both
mechanical and non-mechanical approaches. A wide range of nonmechanical methods are available including enzymic lys is , chemical ly s is , phage lys is , heat treatment, osmotic shock, freezing and
thawing and u t ilis a t io n of temperature sensitive or wall d e fic ien t
microbial mutations.
1 .1 .1 .1 Non-mechanical methods
Enzymic lysis 1s one of the most widely studied laboratory methods. I t constitutes the most gentle way to release the c e ll membrane
In tac t (Hughes e t a l. 1971; Kitamura and Tanabe 1982; Asen.io e t a l . 1985). The enzyme attacks only specific bonds in the c e ll wall structure of microorganisms leaving the rest of the c e ll undamaged. I t can also be used to weaken the ce ll wall p rio r to mechanical disruption 1n order to reduce the resulting mechanical shear applied
on the in tra c e llu la r constituents of the microorganism (Liu e t a l. 1988).
The method 1s at present lim ited fo r several reasons. A prerequisite
in the application of enzymic lys is is the selection of appropriate
enzyme system and determination of appropriate reaction conditions
fo r e f f ic ie n t lys is (Engler 1985; Zomer e t a l . 1987). The use of previously untested ly t ic enzymes would therefore e n ta il considerable input of time and e ffo r t . Commercially availab le ly t ic
enzymes may be a mixture of reagents containing degradatlve enzymes
to which In tra c e llu la r contents of In teres t may be susceptible. The
costs of ly t ic enzymes 1s a fu rther re s tr ic t iv e element 1n th e ir
usage. The immobilisation of ly t ic enzymes on Insoluble supports to
extend th e ir use, although highly desirable, 1s lim ited by s te ric
hindrance of th e ir a c tiv ity (Asenjo and Dunnill 1981). The use of a
soluble support has been shown to be feasib le (Dunnill 1972) but may
13

prove d i f f ic u l t fo r processing filamentous fungi due to fouling of the f i l t r a t io n membrane at the separation stage.
Autolysis 1s a ttra c tiv e because 1t 1s volume Independent (Ch1st1 and
Moo-Young 1986), however i t is affected by many parameters Including
temperature, pH, buffer m olarity and 1s therefore d i f f ic u l t to
control (Hughes et a l. 1971). Phage Infection 1s also a d i f f ic u l t
process to control and may resu lt 1n altered c e llu la r constituents
(Engler 1985).
Chemical lys is by treatment with acids, a lk a lis , surfactants or
solvents may be expensive and results 1n contamination of the
product with the chemical (C histi and Moo-Young 1986). I t is also
generally accompanied by considerable protein denaturation (Dunnill and L i l ly 1975).
Osmotic shock 1s another gentle method fo r c e ll disruption although
most microorganisms cannot be disrupted by i t alone. The method is
therefore often used 1n conjunction with other techniques (Wlmpenny
1967).
Physical methods such as repeated freezing and thawing, heating and
drying although reported successful (Hughes e t a l. 1971), usually
have low yields (Dunnill and L i l ly 1975) and are susceptible to
denaturation (Engler 1985). In the case of temperature sensitive
mutants or microorganisms containing inducible phages, the time lag
involved in temperature changes 1n fermenters require careful engineering to avoid premature lys is (Dunnill 1983).
1 .1 .1 .2 Mechanical methods
Mechanical methods employed 1n c e ll disruption are based on shearing
action which may Involve solids with or without abrasives, such as
in the Hughes Press and in the X Press, or a grinding action as with
14

a pestle and mortar or 1n a ball m ill . Otherwise the French Press, ultrasonication or v ib ra tion with beads may be employed.
1 .1 .1 .2 .1 Son1 cation
One of the most frequently used mechanical methods fo r c e ll disruption on laboratory scale is sonicatlon (Wiseman 1969; Engler1985). As the Input sonic energy Increases, microbubbles form at various nucleation s ites during the rarefaction phase of the sound
wave and then in the compression phase, the bubbles collapse
releasing shock waves which propagate in the medium. The phenomenon
is called cavitation . Mechanical forces that can cause ce ll disintegration could arise p rio r to the collapse of bubbles. Microstreaming near the bubble surface generates stresses caused by
velocity gradients strong enough to disrupt c e lls (Hughes and
Cunningham 1963). In the collapse phase of cavita tion , a large
quantity of sonic energy is released as e la s tic waves. Doulah (1977) proposed that shear stresses responsible fo r c e ll disruption arise
from e la s tic waves. The principal determinant of su sc ep tib ility to
ultrasonic ce ll disruption was reported to be the mean volume of the
ce ll irrespective of culture conditions (Wase and Patel 1985). However th is observation may be the resu lt o f changes 1n wall strength brought about by varying fermentation conditions (e .g . im peller speed) which were implemented to obtain d iffe re n t c e ll volumes, and not the c e ll volume I t s e l f .
The technique 1s lim ited to small scale operation fo r several reasons. There are d if f ic u lt ie s of transm itting s u ffic ie n t power to
large volumes of liqu id (Scawen et a l . 1980) and providing adequate
cooling (L i l ly and Dunnill 1969); the process may cause s ig n ific an t
degradation of enzymes (Engler 1985) and also may produce very fin e
debris which may lead to subsequent processing problems (C histi and
Moo-Young 1986). Furthermore, sonicatlon has proved to be an
in e ff ic ie n t method of disruption of fungi (Edebo 1983).
15

1.1 .1 .2 .2 Explosive decompression
In th is technique, an in ert gas (e .g . nitrogen) 1s dissolved Into
c e lls under high pressure u n til equilibrium 1s reached. The pressure
1s then suddenly released causing rupture of c e ll wall and membranes
due to high Internal and external c e llu la r pressure difference
(Fraser 1951). The technique is gentle, no oxidation occurs since an
In e rt gas is used and, rapid adiabatic decompression results 1n
minimal overall temperature increase. However, 1t 1s only applicable
to fra g ile c e lls and 1s d i f f ic u l t to scale up (N1ss1nen and
Markkanen 1986).
1 .1 .1 .2 .3 Extrusion
Extrusion of microorganisms through an o r if ic e by pressure is the
basis of operation fo r Hughes Press, X Press and the French Press. The former two devices extrude m aterial that has been frozen, and do
not require a valve to adjust pressure. The French Press handles
unfrozen c e lls and consists of a steel cylinder having a small o r if ic e , with a needle valve at its base. A hydrau lically driven gas
piston pressurises the content of the piston up to 210 MPa (Hughes
et a l . 1971). The press 1s precooled to 0-5° C. At the chosen
pressure the valve 1s opened and pressure is maintained by pumping. Sim ilar devices with precise o r if ic e size control were la te r
designed.
In 1951, Hughes developed a method for breaking microorganisms by
forcing a frozen suspension or paste of c e lls through a narrow s l i t
at very high pressures (200 MPa). Later on Edebo modified the
apparatus such that the ce ll suspension would undergo several passes. This device, referred to as an X Press, consisted of two
iden tica l cy lin d rica l axial chambers separated by a disk with a
central c irc u la r o r if ic e of about 1-2 mm diameter. D ifferent theories have been put forward fo r the mechanism of c e ll disruption
16

by th is technique, with l i t t l e agreement amongst researchers.
Hughes et a l. (1971) a ttribu ted the d is in teg ra tive e ffe c t to the
abrasive action of ice crystals during compression and the regelation brought about by the pressure drop at discharge, with a
resultant decrease in volume. Early work by Edebo 1n the 1960’ s
however had suggested that a major contribution facto r was the
conformational change when 1ce crystals changed phases under pressure; the pressure required fo r In it ia t io n of flow being related
to the phase boundaries o f water. The flow through the o r if ic e was
in discontinuous short pulses accompanied by sharp bangs. Further
experimentation by Hughes et a l . (1971) Indicated th a t when the
plunger of a Hughes press was given s u ffic ie n t pressure (the value
of which was not disclosed) to produce the cracking sound associated
with the phase change and to force about 2 mm of a 3 cm plug of frozen ce lls through the s l i t into a reservoir, over 95%
disintegration was noted in the c e lls 1n the reservoir, 80% at both
ends of the plug and almost none at the centre of the plug. Hughes
took th is as evidence fo r the abrasive action of 1ce when 1ce and
c e lls moved across the gap from cylinder to reservoir. No mention
was made of mechanisms which may be related to the size or shape of the gap or to the k inetics of the process. Further detailed studies
were carried out using an X Press (Magnusson and Edebo 1976a, 1976b). Although much data was obtained on the e ffec ts of sa lts and
ge la tin , on ce ll concentration, on d iffe r in g freezing temperatures
and on changes in the hydraulic press design (manual versus motor driven), no conclusive results to explain the mechanism of disruption emerged. The main resu lt was th a t more concentrated
samples tended to flow more smoothly and that d is integration was
enhanced by a lower temperature and a higher ve loc ity of flow
through the o r if ic e .
Scully and Wimpenny (1974) carried out a set o f experiments with
yeast suspension (50% w/w) a t -27° C in which Hughes Press was f i l le d
with a lternating layers of d iffe re n t colours before compression.
17

A fter an in i t ia l compression during which the mixture became compact due to the release of In tra -c rys ta l line a ir , the solid moved down
inside the cylinder 1n plug flow u n til the gap was reached. By
examining the layers deposited in the reservoir and the last layers
remaining in the press, i t was shown that only the lowest zone had
extruded ra d ia lly . The conclusion was therefore that the flow regime
was plug flow followed by radial flow. Comparative experiments at ambient temperature using gelatine, p las tic ine and sand each
coloured 1n layers resulted 1n the flow properties s im ilar to that pertaining in the Hughes Press. Disruption was therefore modelled on
the basis of p las tic flow of th in layers under compression through
an o r if ic e . This theoretica l treatment was to be followed by
experimental work with various microorganisms and varying gap width
and temperature, however no published data 1s availab le on these
studies.
The scale up of the X Press based on a semi-continuous operation of the equipment was developed by Magnusson and Edebo (1976c). However no industria l sized freeze press 1s known to be commercially
availab le (C histi and Moo-Young 1986).
The major advantage of freeze pressing 1s its effectiveness 1n
disrupting c e lls . At a sample temperature of -35° C and a press
temperature of -20° C, about 90S disruption was achieved in a single
passage of bakers’ yeast paste through the o r if ic e (Magnusson and
Edebo 1976c). Furthermore ce ll wall membrane preparations by th is
method are re la tiv e ly in tac t (Wimpenny 1967). Although Edebo (1983) stated that minimal enzyme inactivation occurs during th is process
re la tiv e to other procedures, Hughes e t a l. (1971) had commented
that the technique was not suitable fo r enzymes sensitive to
freezing and thawing.
18

1.1 .1 .2 .4 Agitation
Rapid agitation of a c e ll suspension with glass beads as a means of c e ll disruption has been extensively applied to both laboratory and
industria l scale operations. For laboratory applications, blenders
(e .g . Waring blender) have been used although the shear forces
produced are not large enough to break many stra ins of bacteria
(Wimpenny 1967). Better results were obtained by introducing
b a llo tin l beads into the suspension. The rapid increase in sample
temperature during disruption has to be o ffse t by means of a cooling
system.
Recently, i t has been reported that a mixer m ill ( tra d it io n a lly used
fo r dry m illing of minerals, te x tile s e tc .) may be modified fo r c e ll disruption on microscale level (Schutte and Kula 1988). The m ill 1s
equipped with two horizonta lly positioned grinding chambers of 12.5
mL capacity each, in which beads (less than 1 mm) are accelerated to
a three dimensional movement. The most s ig n ifica n t parameters
affecting disruption are s im ilar to those id en tifie d fo r the large
scale bead m ills (Section 1 .1 .2 .1 ) . One advantage of th is technique
is the low temperature increase (0.12° C/m1n at a v ibration frequency
of 1800 min“1) , which elim inates the need fo r an external cooling
system.
1.1 .2 Large scale disruption
Attempts at scaling up laboratory disruption methods fo r large scale
operations have been mainly concentrated on mechanical techniques, s p e c ific a lly high speed bead m ills and high pressure homogenisers. With the advent of modern recombinant DNA technology fo r the
manufacture of mammalian proteins in microorganisms, i t 1s necessary
to operate c e ll disruption equipment 1n a contained fashion and with
the p o s s ib ility of 1n-place cleaning and s te r ilis a t io n . These two
disruption techniques are well geared to meet such requirements.
19

High speed bead m ills are p a rtic u la rly e ffe c tive against those
microbial c e lls which are resistant to other methods. The smaller
models can be read ily mounted and operated in safety cabinets and
therefore used fo r the disruption of p o ten tia lly pathogenicmicroorganisms (Scawen et a l. 1980). However, according toDarbyshire (1981), the technique has rare ly been used fo r large
scale enzyme preparation. Scawen e t a l . (1980) carried out a survey
of large scale enzyme p u rifica tio n techniques undertaken 1n the
1970’ s. Data on twenty seven enzymes, seventeen of which were from
bacteria l or fungal sources were collected. I t was found that out of the twenty one large scale p u rific a tio n procedures reported, eleven
u tilis e d an APV-Gaulin homogeniser, two a French Press and only one
a bead m ill. This could be a ttrib u ted to two possible factors. F irs t ly , bead m ills may be lim ited by the minimum size of beads thatcan be used in commercial scale units (Schutte e t a l. 1983).Homogenisers, on the other hand, are very f le x ib le . Their only
lim ita tio n is that blockage may occur with concentrated mycelial suspensions. However research has been carried out to investigate
and overcome th is problem (Thomas 1988). Secondly, with
homogenisers, there are fewer operating parameters to consider than
with high speed b a ll m ills (Engler 1985).
1 .1 .2 .1 High speed bead m ill
O rig in a lly bead m ills were used 1n industry fo r fin e grinding and
dispersion of dyestuffs and pigments. Zetelaki (1969) b r ie f ly
described the use of a bead m ill fo r the disruption of Aspergillus
and Currie e t a l . (1972) examined the disruption o f yeast c e lls
using a s im ilar m ill . No machine was constructed at the time
s p e c ific a lly with a view to ce ll d isruption. The development of bead
m ill equipment and research carried out 1n th e ir design are reviewed
by Dunnill and L i l ly (1975), Engler( 1985), and Chisti and Moo-Young
(1986).
20

The design of bead m ills depends on the size of the unit and the
manufacturer. They consist of e ith e r a v e rtica l or a horizontal grinding chamber containing rotating disks mounted on a motor driven
shaft. The grinding action is provided by beads ty p ic a lly occupying
80-85% of the free working volume of the chamber. The disks may be
mounted concentrically or off-centred . The units must be equipped
with high capacity cooling systems fo r processing temperature
sensitive m aterials. Horizontal units are generally preferred for
c e ll d isruption. The grinding action in v e rtic a l m ills 1s reduced
due to flu id is in g e ffec ts of the upward f lu id flow on the beads. Furthermore horizontal m ills are fed from above so that there is no
need fo r a screen at the feed end to re ta in the beads inside th9
chamber as is the case in a v e rtica l m ill .
A large number of factors a ffec t the operation of the bead m ill . These include the ag ita to r speed and the number of disks, the design
of disks, bead m ateria l, diameter and loading of beads, residence
time, temperature, c e ll concentration and c e ll type. The k inetics of the ce ll disruption process was f i r s t studied by Currie e t a l . 1n
(1972) and was fu rther investigated 1n d e ta il by Limon-Lason e t a l . (1979). F irs t order k inetics were noted fo r yeast c e lls , where the
rate of disruption as measured by the soluble protein release was
d ire c tly proportional to the amount of unreleased protein. The data
f i t te d the model for 0.6 and 5 l i t r e s horizontal m ills and covered
a range of im peller speeds. In the larger m il l , at higher im peller
t ip speed (above 10 m/s) disruption did not follow f i r s t order
kinetics . D if f ic u lt ie s with temperature control 1n batch experiments
led to inconclusive resu lts . The continuous disruption 1n the 5 L
m ill was adequately modelled as a CSTR in series with the number of tanks corresponding to the number of im pellers. For the smaller m ill (0 .6 L ), the model was modified to Include backflow 1n order to
obtain good agreement with experimental data. Currie e t a l . (1972)
reported that fo r a range of bead diameter studied (0 .6 -2 .8 mm), the
smaller beads were more e ffe c tiv e . However the e ffe c t 1s dependent on the c e ll concentration. For a 30% yeast s lu rry small beads were
21

favoured while above a concentration of 60% th e ir advantage was
reduced. The varia tion o f disruption e ffic ien cy with yeast concentration for the d iffe re n t size beads was sim ilar and no
special e ffe c t of large beads on th ick yeast suspensions wasobserved. Schutte e t a l . (1983) indicated that fo r yeast c e lls , the
location of an enzyme within a c e ll influenced the optimum bead
size . Larger beads could be used to recover enzymes located in the
perlplasmic space and smaller ones to release the cytoplasmic
m ateria l. These findings suggest that smaller beads are more
e ffe c tive in achieving complete c e ll d is in tegration . The
disintegration of other microorganisms has been reported in the
l ite ra tu re , such as a varie ty of bacteria (Woodrow and Quirk 1982;Schutte et al.. 1983), algae (Hedenskog and Mogren 1973), andfilamentous fungi (Zete laki 1969). The disintegration of bacteria in
a glass bead m ill was hampered by the small dimensions of the ce lls
(approximately 1/10 the size of a yeast c e ll) (Schutte e t a l . 1983). Although the use of smaller beads would seem appropriate, itsapplication is lim ited by the tendency o f small beads to f lo a t at high ce ll concentrations as noticed by Currie e t a l . (1972).
Increased disruption with increased bead loading was reported
(Currie et a l . 1972). However greater cooling is required as greater
temperature rise was recorded (Schutte et a l . 1983).
Limon -Lason et a l . (1979) showed that the disruption rate constant was independent of c e ll concentration at higher concentrations of yeast (greater than 30% w/v) fo r stainless steel impellers; but fo r
polyurethane im pellers, 1t continuously decreased with increasing
yeast concentration. The results were a ttribu ted to , f i r s t ly , the
variations 1n the rheologlcal behaviour of the suspension and
secondly to the differences in the design of the two im pellers.Schutte et a l . (1983) reported an optimum concentration fo r lowimpeller speeds but noticed l i t t l e e ffe c t o f concentration on
disruption at higher speeds (8 m/s). In a review by Engler (1985) i t
was stated th a t E .coli was more d i f f ic u l t to disrupt than A .niger or
22

Basidomyces species. Candida u t i l is was noted to be harder to
disin tegrate than bakers’ yeast. The e ffec ts of c e ll type and
conditions of growth are not lim ited to disruption in a bead m ill . The importance of c e ll characteris tics and growth history is
discussed in Section 1 .2 .4 .2 .
1 .1 .2 .2 High pressure homogenisers
High pressure homogenisation is the most widely used method fo r
large scale c e ll disruption (Scawen et a l . 1980). The equipment consists of a high pressure reciprocating positive displacement pump
with one or more adjustable, restric ted o r if ic e valves. A ll commercial models operate on the same princip le and are
distinguished by th e ir capacity, the type o f homogeniser valve, pressure range, drive mechanism and number of pistons. A diagram of a discharge valve assembly is shown in Figure 1.1. Cell suspensions
is drawn through a check valve into the pump cylinder and on the
return of the piston, is forced through the discharge valve
assembly. The discharge pressure is controlled by a handwheel assembly, which through a spring-loaded shaft positions the valve
rod in re la tio n to the valve seat. During discharge the suspension
passes between the valve rod and I ts seat and impinges on an impact ring. The pressure is shown on a gauge mounted on top of the
cylinder. In the case of a single piston homogeniser, fluctuations
1n pressure measurements are reduced by a dampener assembly. In the
subsequent sections, d iffe re n t aspects of c e ll disruption 1n th is
type of equipment are described in d e ta il.
23

A. Handwheel fo r pressure controlB. Spring-loaded shaftC. Valve rodD. Valve seatE. Impact ring
Figure 1.1 Schematic diagram of a homogeniser valve assembly
24

1.1.3 Recent developments 1n mechanical devices fo r ce lldisruption
1 .1 .3 .1 New concepts 1n the design of high pressure homogenisers
The f i r s t high pressure homogenisers appeared before the turn of the
century fo r the processing of high fa t products such as a r t i f ic ia l butter. Since then, many changes and modifications have been made 1n
the equipment, with the main emphasis on the design of the valve
u n it. This includes f la t valves, tapered valves, grooved valves, tapered and grooved valves, and highly chamfered or knife-edged
valves. The reason fo r a l l these changes is to increase the
e ffic ien cy of homogenisation. In the context of milk product homogenisation, th is has meant the generation of the smallest average fa t globule size with the least expenditure of energy. In
terms of ce ll disruption e ffic ien cy , w hilst the aim is to maximise
the release of the desired product from the c e lls with minimum
energy expenditure, other factors need to be considered such as c e ll debris size (see Section 1 .4 ).
In the homogenisation of milk products, the e ffic ien cy at flow rates
less than 760 L/h was not maintained when a design was scaled up to
handle flow rates in excess of 11000 L/h, which are common in the
milk industry. This 1s because at high flow rates, the cross
sectional area between the valve rod and the valve seat must increase in order to maintain pressure and accommodate flow. This
may be accomplished by e ith e r Increasing the gap between the valve
rod and the valve seat or by increasing the diameter of the valve
rod and seat. In the former Instance, e ffic ien cy is decreased; 1n
the la t te r , actuation o f the assembly is d i f f ic u l t . Furthermore
close tolerance machining of large diameter valves is d i f f ic u lt
(Pandolfe 1982). The problem was resolved with the design of the
Gaulln Micro-Gap™ valve. The main feature of th is design 1s that the
flow is divided into equal parts by stacking the homogenising valves
in p a ra lle l. The valve assembly has a knife-edge on one side, which
25
1s the seat, and a f la t surface on the other side, which acts as the
valve plate; thus each valve disc 1s a valve seat and a valve. The
gap distance between the valve and seat is fixed . The size and the
number of the valves are selected to achieve the best homogenizing
conditions at the required flow rate .
The importance of valve geometry in c e ll disruption is now well known even though the amount of research reported in the open
lite ra tu re is lim ited and the mechanism not well understood. This 1s
discussed 1n greater length in Section 1 .2 .4 .1 .
Another important design feature in high pressure homogenisers is
the strength of m aterial used in the manufacture of the valve u n it. Continuous operation specially at high pressures results in rapid
wear of the valve un it; in p articu lar the knife-edge types. This has
led to extensive research with the result that the tungsten-carbide
units are now superseded by valves made of a ceramic composite
m aterial capable of withstanding much wear (APV-Gaulin 1985).
More attention is now being paid to the specific application of c e ll disruption and its related requirements such as equipment s te r ilis a t io n and containment. Features of new equipment dealing
with such issues are detailed in Chapter 7 as part of a design study
fo r an integrated homogenisation system.
1 .1 .3 .2 H icro flu id isers
The m icroflu id iser is a re la tiv e ly new development 1n the disruption
and em ulsification technology,based on the submerged je t p rin c ip a l. A hydrau llcally operated high pressure pump forces the f lu id through
an "Interaction chamber" at pressures up to 160 MPa. The in teraction
chamber is the core of the instrument and consists of a system of channels 1n a ceramic block, which s p lits the f lu id In to two
streams. These are then forced through narrow rectangular s l i t s and
26

are recombined to Impinge against one another at high velocity
(Figure 1 .2 ). Several sizes of the instrument are availab le . The
manufacturers claim that a major advantage of the technology 1s the
ease of scale up; a l l that is required is to make the s l i ts in the
In teraction chamber wider in order to increase the throughput without a lte rin g the disruption process (Washington 1987; Washington
and Davis 1988).
A prelim inary comparison of the extent of disruption of yeast and
bacteria by th is technique and by other mechanical methods has
indicated that m icrofluidlsers are not suitable fo r yeast disruption. At least 30 passes were required at 60 MPa to achieve
90% c e ll breakage (as measured by viable ce ll count). With
s u b t i l is . percentage breakage 1n the m icroflu id iser and in an APV- Gaulin single piston homogeniser were s im ilar at the same pressure, however the levels of protein release were d iffe re n t (Seva e t a l .1986). More recent studies based on a s im ilar p rin c ip le have
indicated that s im ilar disruption levels as those obtained with
conventional mechanical techniques may be obtained but at lower pressures and fewer passes i f the design parameters such as the
distance between the je t nozzles are optimised (Kramer and Bomberg
1988a, 1988b). Further research is required to fu l ly assess the
merits of th is equipment.
1.2 Kinetics of c e ll disruption
1.2.1 Development of a k inetics model
Several operating parameters have been Id en tified to a ffe c t the
performance of high pressure homogenisers. Hetherington e t a l . (1971) elucidated the effects of some of these factors such as
pressure, number o f passes, temperature, c e ll concentration and put forward a k ine tic model fo r the disruption of yeast c e lls .
27

FEEDSTOCK
GAUGE
PUMP
INTERACTION CHAMBER
€OUTLET
Figure 1 .2(a) Schematic diagram of the M icro flu id iser
Figure 1.2(b) M icro flu id iser in teraction chamber
28
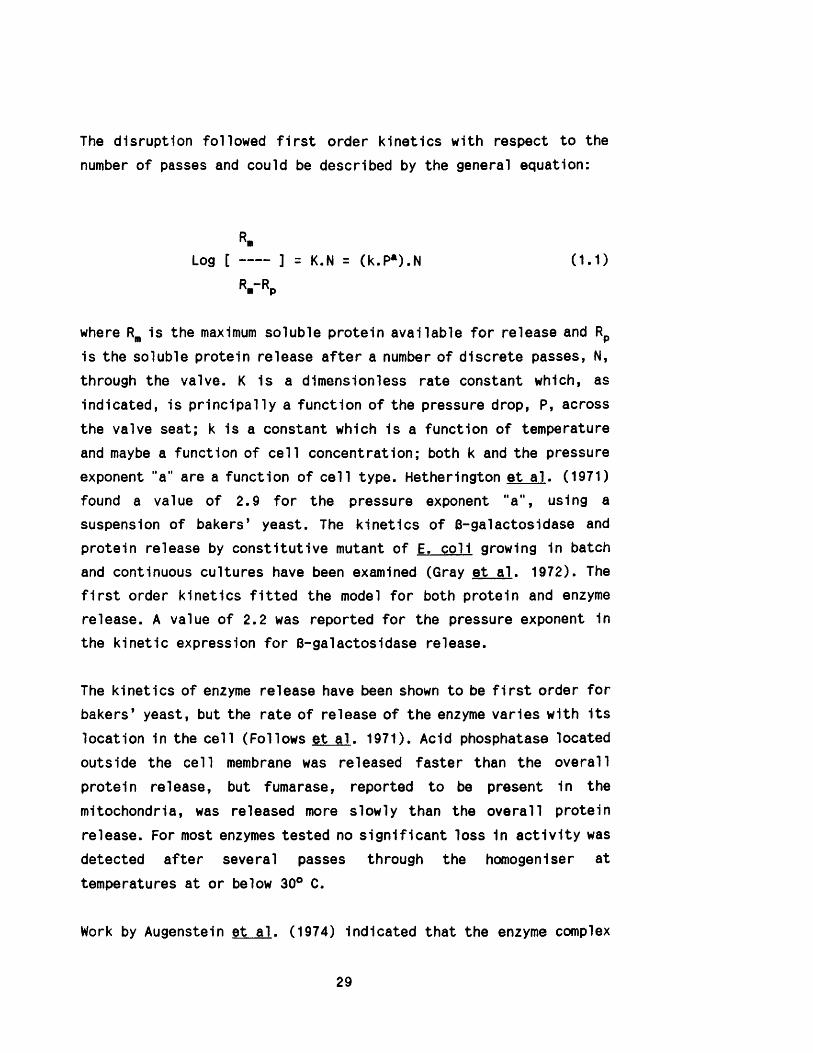
The disruption followed f i r s t order k inetics with respect to the
number of passes and could be described by the general equation:
Log [ ------- ] = K.N = (k.Pa).N (1 .1 )
R.-RP
where Rm is the maximum soluble protein available fo r release and Rp is the soluble protein release a fte r a number of discrete passes, N, through the valve. K 1s a dimensionless rate constant which, as
indicated, is p rin c ip a lly a function of the pressure drop, P, across
the valve seat; k is a constant which is a function of temperature
and maybe a function of c e ll concentration; both k and the pressure
exponent "a" are a function of c e ll type. Hetherington e t a l . (1971) found a value of 2.9 fo r the pressure exponent "a", using a
suspension of bakers’ yeast. The k inetics of B-galactosidase and
protein release by constitu tive mutant of E. co li growing 1n batch
and continuous cultures have been examined (Gray e t a l . 1972). The
f i r s t order kinetics f i t te d the model fo r both protein and enzyme
release. A value of 2.2 was reported fo r the pressure exponent in
the k inetic expression fo r B-galactosidase release.
The k inetics of enzyme release have been shown to be f i r s t order fo r
bakers’ yeast, but the rate of release of the enzyme varies with its
location 1n the ce ll (Follows e t a l . 1971). Acid phosphatase located
outside the ce ll membrane was released fas ter than the overall protein release, but fumarase, reported to be present 1n the
mitochondria, was released more slowly than the overall protein
release. For most enzymes tested no s ig n ifican t loss 1n a c t iv ity was
detected a fte r several passes through the homogenlser at
temperatures at or below 30° C.
Work by Augenstein et a l . (1974) indicated that the enzyme complex
29
which forms the cyclic decapeptide a n tib io tic , gramicidin S, degraded rapidly when c e lls of B. brevis were subjected to
homogenisation. They therefore put forward a k ine tic equation which
included an enzyme degradation exponent fo r the pressure. Their
results were contrary to the findings that water soluble
in tra c e llu la r enzymes and other globular proteins were stable with
respect to shear (V lrkar e t a l . 1981). I t now seems lik e ly that gramicidin synthetase may be a membrane associated enzyme and the
discrepancy is explained by the work of Talboys and Dunnill (1985) who reported that membrane associated enzymes were highly shear sensitive.
1 .2 .2 E ffect of R_ on the k inetics model■W ■■ — ■ . ■ 1 ■ - 1 -
The application of the k inetics equation 1s dependent on the value
of Rb, the maximum amount of protein availab le fo r release. The R,,, value determined by Hetherington fo r Bakers* yeast (96 mg protein /g
packed yeast) obtained by t r ia l and error was in close agreement with published data (the to ta l protein content of packed c e lls was
given as 120 mg/g yeast, 85% of which was released into solution
(Harrison 1967; Hughes 1961)).
Work carried out by Whitworth (1974b) on Candida liD o lv tic a . a
mixture o f filamentous and elongated ovoid c e lls , showed that protein release (Rp) was a function of the number of passes in the
pressure range 30-56 MPa. I t was not c lear from the data provided
whether the same Rm value fo r each given pressure was reached or not. I t appeared that the maximum R value achieved varied with d iffe re n t
operating pressures. The highest value obtained at 56 MPa a fte r 6
passes was only 30.5% of the to ta l protein content of the yeast, given as 91 mg protein /g yeast cake. The authors were therefore
unable to describe the release o f protein in terms o f a f i r s t order
rate expression of the type derived fo r bakers* yeast where R, 1s
independent of pressure. A previous study by the same author
30

(Whitworth 1974a) on the k inetics of disruption of spent brewery
yeast had confirmed the Hetherington model although a d iffe re n t
pressure exponent was calculated. No a lte rn a tiv e model for
1jp o ly tlca was put forward.
Engler (1979) studied the disruption k inetics of Candida u t i l is 1n
a specially designed high pressure impingement device. Although the
results did not show a maximal soluble protein value a fte r 4 passes
at pressures up to 88 MP, the author obtained an R,, value fo r each
set of data based on the to ta l nitrogen content of the c e lls fo r
that particu la r experiment. This treatment of the data resulted 1n
a f i r s t order k inetics expression fo r the disruption of C. u t i l i s . I t may be argued that f i r s t ly , the to ta l soluble protein available
fo r release is not equal to the to ta l protein content o f the c e lls ,
and secondly the results are based on d iffe re n t experiments with
varying values of Rm. I t must however be noted that the highest protein value obtained experimentally was 77% of the estimated
maximum protein release.The value is therefore high enough to make
the estimated Rm value a reasonable approximation.
Engler replotted the data of Whitworth using only the protein
released a fte r one pass a t each given pressure. He deduced a f i r s t
order k inetics expression. The methodology is not c lear as he in fers
that i t is possible to obtain the R,, values by knowing the protein
released a fte r the f i r s t pass. To incorporate the dependence of R. on the operating pressure, i t would have been more reasonable to
assess the protein released as a function of pressure fo r each pass.
The dependence of R,, value on pressure in the study of C. llp o lv tic a
may be a ttrib u ted to two factors. F irs t ly , i t 1s lik e ly that at
higher pressures in tra c e llu la r m aterial such as insoluble complex
protein , peptide, glycopeptide and amino acids are released bymlcronisation of the c e ll debris (Limon-lason et a l. 1979).Secondly, 1t has been reported that C. liD o lv tic a grown in a
hydrocarbon culture medium accumulates hydrocarbons around and
31

Inside the ce ll wall structure and that the cytoplasmic membrane
becomes th icker and more deeply Invaginated (Tsang et a l . 1979). This could in te rfe re with the complete rupture of the ce ll wall and
membrane and thus with the release of protein at lower pressures. Other ce ll characteris tics such as age of cu ltu re, morphology, and
conditions of growth may also contribute to the e ffects observed. One piece of evidence 1s that d iffe re n t batches of C. u t i l is c e lls
showed inconsistent to ta l nitrogen c e ll content (Engler 1979).
1 .2 .3 Disruption k inetics of filamentous microorganisms
L it t le data is availab le in the lite ra tu re on the disruption
kinetics of filamentous microorganisms. The study by Zetelaki (1969) compared the extent o f disruption of Aspergillus niger achieved by
d iffe re n t methods. I t was concluded that bead m ills and the X Press
resulted in highest y ields with few c e llu la r fragments remaining in
the suspension. High pressure homogenisation was not found to be a
suitable technique as a resu lt of poor disruption (a t over 50 MPa, 2 passes) and blockage o f the equipment even at low concentrations
(50 g/L wet weight). However, fu rther investigation indicated that i t was possible to disrupt A. niger at 35 MPa at much higher
concentrations of 700 g/L wet weight (L i l ly and Dunnlll 1969). Data
obtained only gave a prelim inary indication that f i r s t order
kinetics may be applicable.
Hanisch (1978) reported on the disruption of Rhizoous nigricans 1n
a high pressure homogenlser and a bead m ill . According to his
resu lts , the homogeniser released only 13% soluble protein at 50 MPa
a fte r 4 passes, 1n comparison with 26% a fte r 30 seconds in the bead
m ill operating under optimised conditions. No study of the kinetics
was carried out.
Only recently has there been an in terest 1n investigating the
disruption of filamentous microorganisms. Thomas (1988) studied the
32
release of soluble protein from R. n igricans. Preliminary work
Indicated that fo r th is microorganism,contrary to previously
reported resu lts , high pressure homogenisation was a more e ffec tive
method of disruption than bead m illin g . Subsequent data on high
pressure homogenisation indicated that f i r s t ly the soluble protein
release was very rapid even at low pressures. Secondly, the R,, value
varied with the pressure as i t was previously observed fo r
lip o lv tic a by Whitworth (1974b) (Section 1 .2 .2 ) . By using a weighted
lin ear least square technique, the protein release was described by
a f i r s t order relationship . The pressure exponent (0 .57) was however much lower than that quoted fo r u n ice llu la r microorganisms (Section
1 .2 .1 ). The maximum protein available fo r release, R,,, was given to
be proportional to P0,14.
As part of the work the release of the membrane bound enzyme
progesterone 11a-hydroxylase was characterised. A c tiv ity release
followed f i r s t order k inetics , but was less rapid than the soluble
protein release. Furthermore, the maximal enzyme release was not found to be a function of pressure. This led to a review o f the
model for the protein release,1n which cytoplasmic, wall and
membrane release were taken Into account. The use of th is model fo r
other filamentous microorganisms may prove d i f f ic u l t since i t is
based on the premise that R,, 1s inevitab ly pressure dependent and
also that i t requires a knowledge about compartmentalised release of
proteins from the c e lls .
1 .2 .4 Effect of operating parameters
Operating parameters which may a ffec t the k inetics o f disruption 1n
high pressure homogenisers are a) machine re la ted , e .g . the valve
design; b) product re la ted , e .g . c e ll characteris tics and
concentration; and c) conditions re lated , e .g . pressure,number of
passes, flow rate and temperature.
33

1.2.4 .1 Valve design
L i t t le research has been reported 1n the open lite ra tu re on the
e ffe c t of valve unit design. Two studies (Hetherlngton et a l . 1971; Gray et a l . 1972) compared the performance of the fla t-edge and
knife-edge valve units (Figure 1 .3 ). Both valves and Impact rings
were dimensionally id e n tic a l, but the valve seat of the knife-edge
model had a substantia lly reduced seating area. The protein release
was improved by 38% a fte r 4 passes using the knife-edge unit (Hetherlngton e t a l. 1971). This model suffers from rapid wear; however as mentioned in Section 1 .1 .3 .1 , recently introduced ceramic
m aterials are much more resistant to wear. APV-Gaul1n Inc. have
investigated the e ffects of homogenising valve geometry on the ce ll disruption e ffic iency (APV-Gaulin 1985). Results were monitored by
measuring the percentage of the to ta l available protein released
a fte r disrupting a 10% dry weight s lurry of bakers’ yeast. Five
valve designs were tested with pressures up to 138 MPa (Figure 1 .3 ). Results Indicated that a knife-edge ’ Cell D isruption’ un it was
superior to other valve designs. The design of the unit is not the
same as that used by Hetherington et a l. (1971), but e n ta ils a valve
seat giving a narrow gap nearer the periphery. No correlation was
reported to re la te the rate of c e ll disruption with the geometry of valve designs.
Research carried out in recent years on the e ffe c t o f valve geometry
on milk homogenisation have also indicated better e ffic ien cy with
knife-edge valves (Kurzhals 1977; Mohr 1987a, 1987b). However, the
correlation between c e ll disruption and em ulsiflcation, i f any, is
not c lear.
34

<■
C«11 D isruption typs
Figure 1.3 Homogenlser valve designs (APV-Gaulin 1985)Hetherington et a l. (1971) used valve units (1) and (2 ) , except that 1n th e ir case (2 ) had a f la t
valve rod.
35
1.2 .4 .2 Cell Characteristics
1 .2 .4 .2 .1 Conditions of c e ll growth
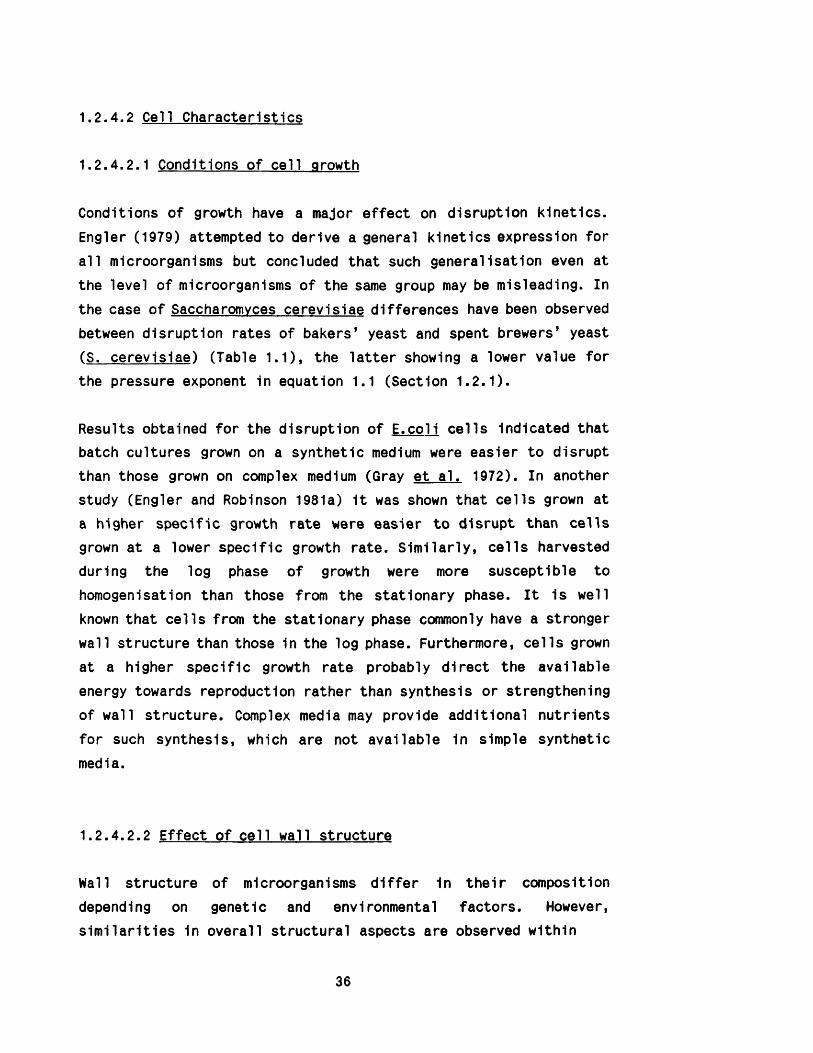
Conditions of growth have a major e ffe c t on disruption k inetics .
Engler (1979) attempted to derive a general k inetics expression for
a ll microorganisms but concluded that such generalisation even at the level of microorganisms of the same group may be misleading. In
the case of Saccharomyces cerevisiae differences have been observed
between disruption rates of bakers’ yeast and spent brewers’ yeast ( S. cerevis iae) (Table 1 .1 ), the la t te r showing a lower value for
the pressure exponent 1n equation 1.1 (Section 1 .2 .1 ) .
Results obtained fo r the disruption of E .co li c e lls indicated that batch cultures grown on a synthetic medium were easier to disrupt than those grown on complex medium (Gray et a l. 1972). In another
study (Engler and Robinson 1981a) 1t was shown that c e lls grown at a higher spec ific growth rate were easier to disrupt than ce lls
grown at a lower specific growth ra te . S im ila rly , c e lls harvested
during the log phase of growth were more susceptible to
homogenisation than those from the stationary phase. I t is well known that c e lls from the stationary phase commonly have a stronger
wall structure than those in the log phase. Furthermore, c e lls grown
at a higher specific growth rate probably d ire c t the availab le
energy towards reproduction rather than synthesis or strengthening
of wall structure. Complex media may provide additional nutrients
fo r such synthesis, which are not availab le 1n simple synthetic
media.
1 .2 .4 .2 .2 E ffect of c e ll wall structure
Wall structure of microorganisms d if fe r 1n th e ir composition
depending on genetic and environmental facto rs . However, s im ila r it ie s 1n overall structural aspects are observed w ithin
36

Table 1.1 Cell characteristics and conditions of growth versus pressure exponent
Microorganism
Bakers’ yeast
Hetherington e t a l . 1971
Doulah et a l .1975
Dunnill and L i l ly 1975
Spent Brewers’ veast
Whitworth 1974a
Engler 1979
Source/conditions of growth
commercial yeast. Probably batch or fed batch. Complex medium
as above
as above
from brewery. Complex medium
from brewery. Complex medium
Saccharomvces cerevisiae
Engler 1979
Candida u t i l is
Engler and Robinson 1981a
Candida lip o lv tic a
Whitworth 1974b
Bacillus brevis
Augensteln et a l. 1974
Bacillus subtil is
Engler and Robinson 1981b
aerobic, continuous culture specific growth rate 0.1 h“1 Synthetic medium
cyclic batch max. growth rate 0.5 h“1. Synthetic medium
continuous culture specific growth rate 0.1 h"1.Synthetic medium
batch. Harvest a fte r 55 h Complex medium
batch. Late lag phase then frozen at -20° C. Complex medium
continuous culture spec ific growth rate 0.2 h-1.Complex
exponent
2.9
.72-1.79
2.9
1. 2- 1.3
1.87
0.86
1.17
1.77
n.a.
1.8
1.07
37

groups of microorganisms which may explain some of the trends
observed 1n ce ll d isruption. Table 1.2 shows the degree of suscep tib ility of microorganisms to disruption in a high pressure
homogeniser. I t Indicates that Gram - negative bacteria are easier
to disrupt than Gram - positive bacteria which 1n turn are easier to
break than yeasts. Fungal walls are c las s ified as more resistant to
disruption but th e ir rupture depends greatly on the mechanism
employed. To help understand the basic differences 1n wall structures, a b r ie f review is given below.
Bacterial ce ll wall
The r ig id matrix of the walls of nearly a l l bacteria (except halophllic bacteria and Mycoplasma species) is composed of a network
of glycan chains cross-1 Inked by short peptides called
peptidoglycan. I t provides both c e llu la r shape and strength. There
are however s ig n ifican t differences 1n the wall structure formed by
Gram - positive and Gram - negative bacteria.
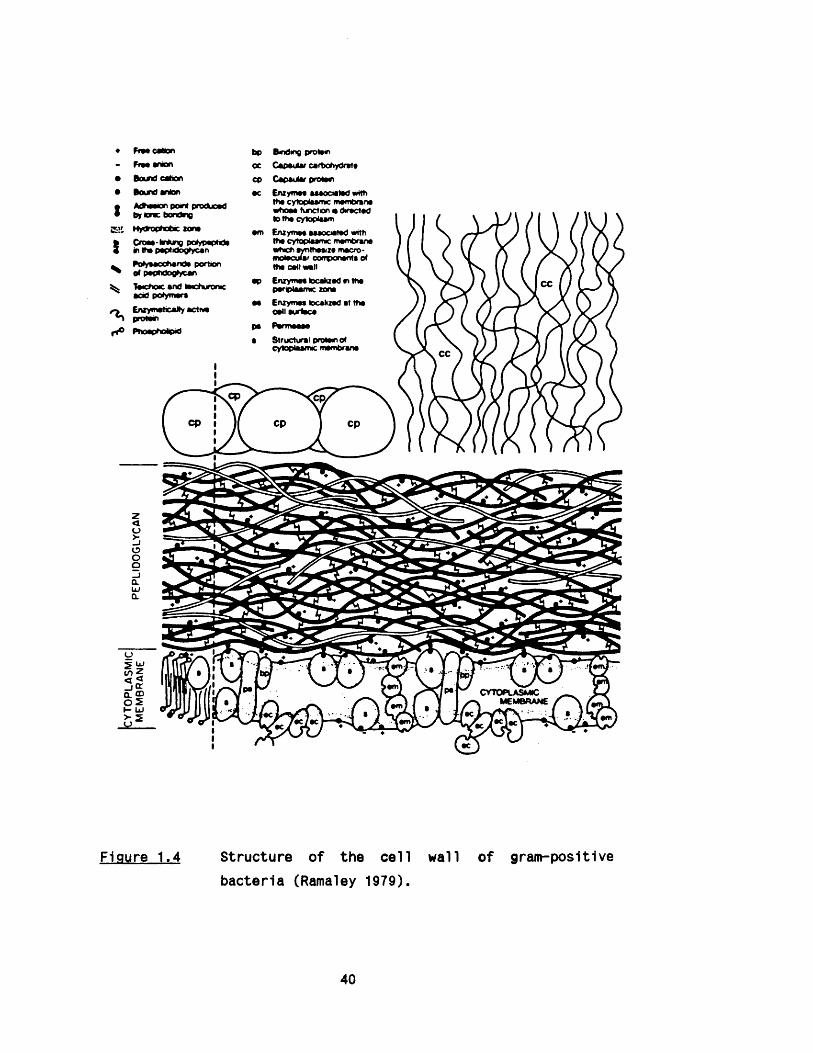
The walls of Gram - positive bacteria are re la tiv e ly th ick (15-50
nm) and contain 40 to 90% peptidoglycan with the remainder being
prim arily polysaccharides and te lchoic acids (Figure 1 .4 ). The
degree of cross-1 Inking can be very high. The peptidoglycan has been
considered to form a single macromolecule encompassing the whole
cel 1.
The wall of Gram - negative bacteria consists of a much thinner
peptidoglycan layer (1 .5 -2 .0 nm) which contains lipo-proteins
covalently attached to 1 t, and an outer membrane s im ilar in
appearance 1n electron micrographs to the cytoplasmic membrane
(Figure 1 .5 ). The outer membrane is rich in lipopolysaccharide.
38

Table 1.2 Protein release from microorganisms in a high pressure
homogeniser.
Microorganism Rate constant K
Pseudomonas putida 0.41
Escherichia co li 0.39
Bacillus brevis 0.28
Saccharomyces cerevisiae 0.23
Norcadia rhodochrous 0.0085
In a l l cases the microorganisms were harvested near or at the end
of growth. Homogenisation was at 50 MPa, 5° C 1n a model 15M APV- Gaulin homogeniser.
39
• B o n ) cationa h x n ) anion
t A rfaacn point prodUoad by Ionic bondng
Hytbophobic zonab Croaa-tofung pofypaptida 4 in tha paphdogtycan- Potyaaochanda portion ^ of paphdogtycan
s . Tacboic and tacfwrontc
bp B<ndmg protoncc Capaular carbohydratacp Capaular proton
ac Enxymaa aaaoaatad withtha cytopiaanac mambrana whoaa tuncton a dractad to tha cytopiaam
am Enzymaa aaaocaatad withtha cytopiaamc mambrana whch avnthaaiza macro- moiacuiar corrponanta of tha oall wallEnzymaa locakzad in tha pariplaanac zonaEnzymaa tocahzad at tha call aurfccaEnzymaticaJty actwa
^loaphoaprdStructural proton of cytoptaarrac mambrana
Figure 1.4 Structure of the c e ll wall of gram-pos1t1ve
bacteria (Ramaley 1979).
40

5x
r*°V
Free cafon
Free anonI a n ) caion
Bound anonrmheeeri finirn producedby o n e bondmg
Hydrophobe tona C ro u -M in g D<yyp«0*«*»m the peo'Oogiycan
Potysaccnande porter o< peptdogfycan
Enzymatcaity active proteeiPhosonofcotd
I lOOpotysac c her da
Bmdmg prolem
Capaular carbohydrate
Capsular orotem
Enzymes associated mth the cytoptawnc membrane whoaa timcbon « drected to tha cytoplasm
Enzymes associated mth tha cyiooiasmc membrane attach synthesize macro - molecular components ot me ceil wail
Enzymes localized n me oer«iasm< lone
Enzymes localized at me cell surface
Braun s 'ipooroteei
Structural and enzymatc protems ot me outer
Structural protem ol Cytoplasmic memprane
OUT ERMEMBRANE
® sPERIPLASMIC
ZONE
PEPTIDOGLYCAN
CYTOPLASMICMEMBRANE . . 'c y t o p l a s m ic ••
MEMBRANE
Figure 1.5 Structure of the ce ll wall o f gram-negative
bacteria (Ramaley 1979).
41
Yeast ce ll wall
Cell wall structures of yeasts have been much more d i f f ic u l t to
elucidate than those of bacteria. The basic structural components
are glucans, mannans and proteins, but the way 1n which these are
combined to form the structure is not known. The overall structure
is th icker than that of Gram - positive bacteria. The ce ll wall of bakers1yeast was reported to be approximately 70 nm thick and the
thickness 1s known to Increase with age (Engler 1985). Although the
structure of glucan varies from species to species, 1t is believed
that glucans are moderately branched molecules. Mannans from bakers’ yeast ce ll wall have been extensively studied and consist of mannose
residues in a(1— 6) linkage with short oligosaccharide side chains
composed of mannose residues 1n a(1— 2) and some a(1— 3) linkages. Phosphodiester links also occur 1n the mannan. The m ajority of protein found in yeast c e ll wall have formed complex structures with
mannans and many are enzymes rather than structural components
(Figure 1 .6 ). The position of mannan-enzyme complexes has been
disputed 1n the lite ra tu re (Engler 1985). I t has been hypothesised
that they may be between cytoplasmic membrane and the glucan-mannan
layer rather than 1n the wall I t s e l f .
Cell walls of other fungi
The fungal c e ll wall composition and structure are very diverse and
no generalisation from one species to another can be made. The most widely studied are the walls of the hyphal growth form (Engler
1985).
In most fungi the c e ll wall 1s composed prim arily o f polysaccharides
with lesser amounts of proteins and H p id s. The polysaccharides
occur in pairs and can be d ire c tly related to the taxonomic
c la s s ific a tio n of fungi. The most commonly occurring p a ir 1s c h itin
and glucan. Neurospora crassa wall has been studied in d e ta il
42

Figure 1.6
Figure 1.7
>MANNANNZTME
P-s-. S -S fPROTElN I— S-S-
CYTOPLASM
Schematic structure of yeast ce ll wall(M), mannans; (P ), phosphodlesters; (G), Glucans(Engler 1985).
Schematic structure of the c e ll wall of Neurospora
crassa. (a ) , outer mixed a- and 8-glucans; (b ), glycoprotein reticulum; (c ) , protelnaceous
m aterial; (d ), Inner chitlnous region (Engler
1985).
43

(Figure 1 .7 ). In the mature w a ll, glucan, c h itln and glycoprotein
predominate in concentric layers. The wall 1s thinner at the hyphal apex and the glycoproteins do not form a recognisable network 1n
th is region (Engler 1985). The strength of fungal c e ll wall appears
to be related to polymer networks as in bacteria l and yeast ce ll w alls. In addition, the fungal walls which contain fibrous
structures of e ith e r c h itln or cellu lose may contribute added
strength (Coakley et a l. 1977).
The wall structure and composition of Rhizopus species well i l lu s tra te the d ive rs ity 1n fungal systems. The study of enzymic
lys is of Rh. delemar suggested that the wall structure might be
composed of c h ltin fib res held together by chitosan and protein or peptides scattered in mosaic layers (Tominaga and Tsujisaka 1981). D iff ic u lty 1n protoplast formation 1n Rh. nigricans using commercial polysaccharases fu rther suggested th a t chitosan may have replaced
glucan 1n th is fungal wall structure (Broad unpublished).
Although, as mentioned e a r lie r fungal walls are c lass ified as more
resistant to disruption than bacteria l c e ll w alls , fungal breakage
does not always follow such a pattern . Edebo (1983) reported that mycella are less resistant to breakage than other microorganisms
(Table 1 .3 ). This may be a ttribu ted to the morphology of filamentous
fungi. These c e lls are much longer 1n one dimension. Furthermore, fo r non-septate fungi i t may prove less d i f f ic u l t to release th e ir
in tra c e llu la r material than fo r septate species, as only a few
breaks or tears in the hyphal walls would be required.
44

Table 1.3 S usceptib ility of various kinds of c e lls 1n suspensionto d isintegration by various methods.
Liauidpressing
Freezeoressinq
Agitation Son1 cat1<
Animal ce ll 7 7 7 7Gram - ve b a c ill i & cocci
6 6 5 6
Gram + ve b a c ill i 5 4 (4) 5
Yeast 4 2.5 3 3.5
Gram+ve cocci 3 2.5 (2) 3.5
Spores 2 1 (1) 2Mycelium CD* 5 6 1
The numbers show the ranking w ithin the group. A high number indicates that the c e lls are sensitive. Parentheses Indicate that the number 1s very uncertain.* clogging of o r if ic e may occur
Source: Edebo (1983)
45

Doulah et a l. (1975) have examined the relationship between protein
releases and c e ll size and have considered 1t lik e ly that 1t 1s the
larger c e lls which w ill be easier to d isrupt. For example, they
predict fo r a high pressure homogeniser the minimum size, dB, of c e ll which w ill be disrupted, w ill be given by:
5dB a (1 .2 )
a P
where 6 is the c e ll wall strength, o 1s the ce ll density and P is
the homogenising pressure. However, the c e ll wall strength is poorly
defined and is u n like ly to be Independent of the ce ll age and size. This model does go some way to indicate why d iffe re n t maximum levels
of protein release may be experienced (e .g . as observed by Whitworth
et a l . 1974b), the value of d,, decreasing with Increased homogenising
pressure.
1 .2 .4 .2 .3 Cell concentration
The c e ll disruption rate fo r bakers’ yeast has been reported to be
independent of concentration 1n the range 28-224 kg m“3 ce ll dry
weight (Brookman 1974). Hetherlngton et a l . (1971) had reached a
sim ilar conclusion fo r bakers’ yeast in the range 35-168 kg m“3. However, above th is range, at pressures greater than 30 MPa, a
reduction 1n the disruption rate and deviation from f i r s t order was
reported. This was a ttribu ted te n ta tiv e ly to inadequate power being
provided by the single piston homogeniser. Only one study (Doulah e t a l . 1975) reported th a t the release of protein is dependent on
concentration at lower pressures. Their model predicts that the
power exponent 1s a function of the ce ll concentration. No rigorous
data covering a wide range of concentrations are availab le fo r other
un ice llu la r microorganisms.
On the e ffe c t of v iscosity on ce ll disruption, Hetherington et a l.
46
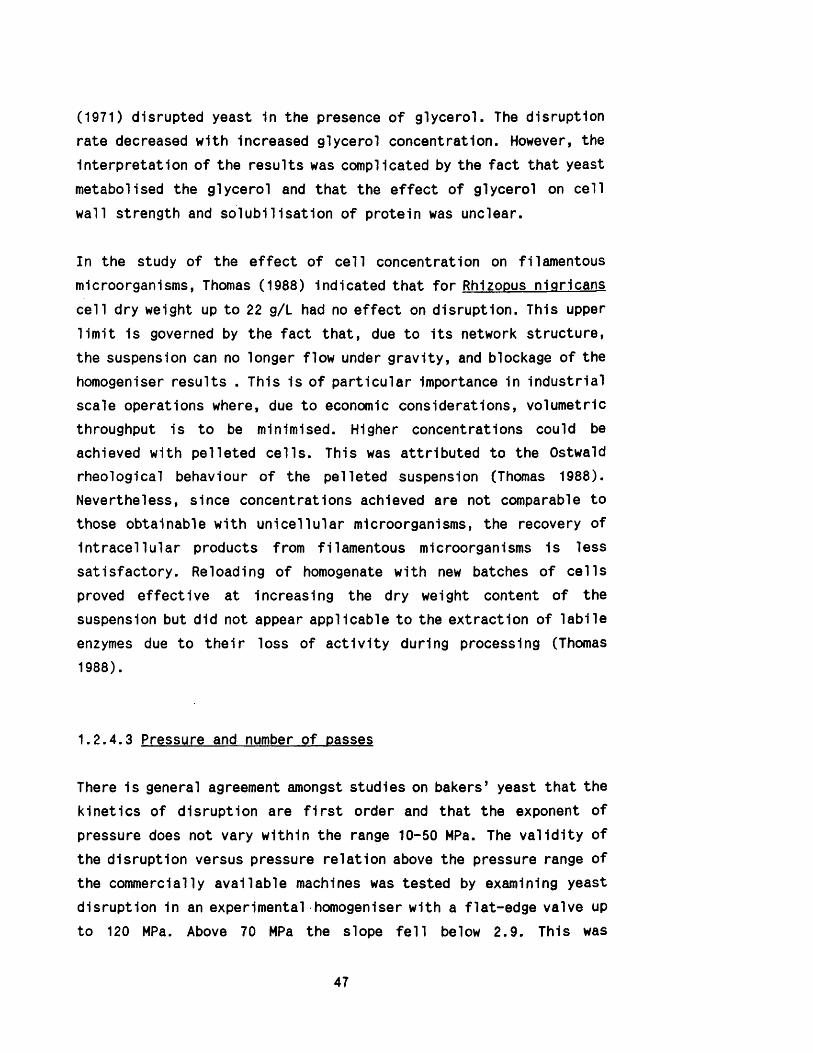
(1971) disrupted yeast 1n the presence o f glycerol. The disruption
rate decreased with increased glycerol concentration. However, the
In terpreta tion of the results was complicated by the fac t that yeast
metabolised the glycerol and that the e ffe c t of glycerol on ce ll
wall strength and so lu b ilisa tio n of protein was unclear.
In the study of the e ffe c t o f ce ll concentration on filamentous
microorganisms, Thomas (1988) indicated that fo r Rhizopus nigricans
ce ll dry weight up to 22 g/L had no e ffe c t on disruption. This upper lim it 1s governed by the fact th a t, due to its network structure, the suspension can no longer flow under g rav ity , and blockage of the
homogeniser results . This 1s of p articu la r importance in industria l scale operations where, due to economic considerations, volumetric
throughput is to be minimised. Higher concentrations could be
achieved with pelleted c e lls . This was a ttribu ted to the Ostwald
rheological behaviour of the pelleted suspension (Thomas 1988). Nevertheless, since concentrations achieved are not comparable to
those obtainable with u n ice llu la r microorganisms, the recovery of in tra c e llu la r products from filamentous microorganisms 1s less
satis factory . Reloading of homogenate with new batches of c e lls
proved e ffec tive at increasing the dry weight content of the
suspension but did not appear applicable to the extraction of la b ile
enzymes due to th e ir loss of a c t iv ity during processing (Thomas
1988).
1 .2 .4 .3 Pressure and number of passes
There is general agreement amongst studies on bakers’ yeast that the
kinetics of disruption are f i r s t order and that the exponent of pressure does not vary w ithin the range 10-50 MPa. The v a lid ity of the disruption versus pressure re la tion above the pressure range of the commercially availab le machines was tested by examining yeast disruption 1n an experimental homogeniser with a fla t-edge valve up
to 120 MPa. Above 70 MPa the slope f e l l below 2 .9 . This was
47
a ttribu ted to the non-optima1 design of the valve fo r the high
pressure used (Dunni11 and L i l ly 1975). Engler and Robinson (1981a) also postulated the p o ss ib ility that the pressure exponent in
Equation 1.1 may depend on the range of operating pressures studied.
With the design of new homogenisers capable of producing pressures
well above 100 MPa, i t remains to be seen whether the f i r s t order
kinetics are s t i l l applicable at very high pressures. I t is worth
noting that at such pressures, the suspension may become
compressible thus a ffecting the disruption.
The data however c lea rly indicate the d e s ira b ility of operating at the maximum allowable pressure to achieve maximum disruption, possibly minimising the number of passes through the homogeniser. Multi-pass operation 1s generally undesirable due to the comminution
of c e ll debris, which reduces the e ffic ien cy of downstream
separation process. I t also accelerates the rate of wear on the
valve u n it, and Increases the temperature of the suspension
requiring extra cooling. Furthermore the production rate reduces
with each additional pass. In the absence of available data, fu rther
research is required to compare the e ffec ts of size reduction and
temperature generation between high pressure, single pass and low
pressure, multi-pass operations.
The differences observed between the e ffe c t of pressure and number of passes on the disruption k inetics of u n ice llu la r and filamentous
microorganisms are already outlined in Section 1.2 .3 .
1 .2 .4 .4 Temperature
The disruption rates obtained fo r bakers* yeast were reported to be1.5 times higher when the temperature of the suspension at the in le t
to the homogeniser was increased from 5° C to 30° C ( Hetherington
et a l . 1971). Attempts were made to correlate th is e ffe c t to the
change in the suspension v iscosity. Experimental d if f ic u lt ie s led to
48

inconclusive results (Section 1 .2 .4 .2 .3 ) . High temperature operation
are not generally desirable in view of resultant protein
denaturation and loss o f enzymic a c tiv ity .
Temperature increase generated by heat dissipation during disruption
was shown to be a function of the homogenisation pressure
(Hetherlngton e t a l. 1971; Whitworth 1974b; Brookman 1974; Dunnill and L i l ly 1975). A 4° C rise in the temperature of the process stream
was detected fo r a single passage through a single piston machine, at a pressure of 46 MPa; in a three piston model, approximately 8° C rise was observed under the same conditions (Hetherington et a l . 1971). Such temperature rises necessitate precooling and in te rpassage cooling of the process m aterial.
1 .2 .4 .5 Flow rate
High pressure homogenisers are designed to operate at constant flow
rate fo r a given range of pressures. The e ffec t of flow rate on
disruption has therefore not been widely studied. Brookman (1975) found that the flow rate was constant over the recommended pressure
range but f e l l sharply with increased pressures. The e ffec t was
attribu ted to the s ta llin g of the pump. In order to vary the flow
ra te , an extreme hydraulic pressure pump was connected to a needle
valve. Constant pressure peak was obtained by varying both the In le t
a ir pressure and the needle valve aperture. A range of flow rates
were thus obtained. I t was reported that the soluble protein release
was re la tiv e ly Independent of the ve locity of the yeast suspension
passing through the needle valve. I t must be added that the author Indicated that i t was d i f f ic u lt to measure the needle valve gap with
accuracy so that the results may not be highly re lia b le .
49
1.3 Disruption mechanism 1n high pressure homogenlsers
Over the years many researchers have attempted to analyse the
homogenisation process. The close association of th is process with
the dairy industries has resulted in most investigations being
carried out on milk with the view to homogenising the fa t content. The approach to the problem has been to make approximations and
models of how the flow might proceed through a valve unit and to
analyse these conditions with respect to the end product of em ulsificatlon. In spite of the volume of work carried out, no
consensus exists on the mechanism of homogenisation. Many d iffe re n t
theories have been proposed some of which have attracted greater
support. Mulder and Walstra (1974) have reviewed these theories
based on experimental work carried out on milk emulsions (Figure
1 .8 ). In la te r years, the application of the technique to c e ll disruption resulted 1n some empirical investigations, however the
extent of research in th is area remains lim ited . Theories pertaining
to m ilk homogenisation have also been applied to c e ll disruption. In
th is section work on the mechanism of ce ll disruption is reviewed.
1.3.1 Stress
Engler (1979) argued that the hydrodynamic phenomena occurring in
high pressure homogenlsers were too complex to allow an analysis of the mechanism of disruption, and therefore a well defined,
controlled experimental apparatus was required to elucidate the
mechanisms of c e ll disruption. For th is purpose, a high pressure
in te n s ifie r capable of generating pressures up to 350 MPa was
designed. Various nozzles could be f it te d to the discharge of the
pressure In te n s if ie r to allow the study of the e ffec ts of three
types of stress; normal, Impact and shear on c e ll disruption. For impact studies, a f la t surface was positioned near the o r if ic e
discharge. The o r if ic e created a high ve loc ity je t which then
impinged on the f l a t surface. For the shear stress studies, nozzles
50

TheorySequence of events
Essential prerequisites Does it happen?
1 Crush (~ ) ooooooo ^ Y//M
valve opening <g lobule s ize no
2 Explosiona fte r
compression
f —N. O O O
O o o oglobule compressible no
3 A c c e leration o o w various no
4 Erosion 0 ° c9 globules hard and b r it t le no
5 Im pact O C | : O'o0 ©-(globules )£>©-( p lasm a) no
6 Shear (~̂ ) ___oooooo T )(fo t)/T K p lasm o ) < A ; shear ra te > 1 0 7 s e c '1
probablynot
7 W ittig Ohigh shear in convergen t
f lo w ,th e n turbu lenceprobably
not
8 Vibration
oO I
Oi
oo suffic ien t tim e for several
oscillations no
9 Turbulence 0 0 0 = - 0o ° °eddy s iz e ^ *
globule s izeyes
10 C av ita tion O O q O > o 0 , 0% p v 7 > hom ogenizing
pressureprobably
Figure 1.8 Theories explaining globule disruption 1n a
homogeniser (Mulder and Walstra 1974).
51

made of c ap illa ry tubing were used.
Although the study was well conceived, i t makes a p rio ri assumption
that the system recreates the conditions and thus the relevant forces within the homogeniser. The author in fac t recognises th is
fac t during the course of his study and does indicate in conclusion
that the system may not be very s im ilar to that of a high pressure
homogeniser. Nevertheless the findings are of In terest as they may
at least p a r t ia lly re la te to the mechanism of c e ll disruption in a
high pressure homogeniser.
1 .3 .1 .1 Normal stress
Normal stress manifests i t s e lf in high ve locity je t flow of viscoelastic flu id s through an o r if ic e . Engler (1979) derived the
equation
P = K0.O.U2 + (P „ - P22) (1 .3 )
where P 1s the operating pressure; KoJ the parameter including
k inetic energy and viscous losses; o, f lu id density; Pn - P22>
normal stress d ifference; and U the mean velocity at the o r if ic e .
At low v e lo c itie s , or with Newtonian flu id s , the term Pn - P22 becomes neg lig ib le .
Considerable d if f ic u lty was encountered in co llecting re lia b le
samples. The lim ited data obtained showed that normal stress was one
f i f t h the Impingement stress, I . e . , very small. I t must be noted
that the v iscoelastic nature of the suspension of c e lls (100 mg dry
weight/mL of Candida u t i l i s ) was never established. Furthermore 1t is not easy to separate the e ffec t of viscous forces from that of normal stresses. Due to experimental d i f f ic u lt ie s , normal stress
computation fo r other c e ll suspensions (yeast, E. co li and IL
52
subti1 is ) was abandoned 1n the study.
1 .3 .1 .2 Impingement
The e ffe c t of impingement was studied by Engler (1979) and also veryb r ie fly by McKillop et a].. (1955). Engler showed that stressesarising from impingement of a high ve loc ity je t of c e ll suspension
on a f la t p late caused disruption. Furthermore, he demonstrated that Impingement was the major cause of disruption, shear and normal stresses not being of large enough magnitude to resu lt 1n
s ig n ifican t ce ll breakage. For laminar flow, the maximum stress to
which ce lls are subjected during impingement was given by
P8 = i o.U2 (1 .4 )
where P8 is the stagnation pressure and U the velocity at the
o r if ic e .The rapid deceleration and change 1n d irection of flow during
impingement may produce deformations of the ce lls so that actual stresses may be considerably larger than the stress shown by the
equation.McKillop et a l . (1955) investigated the e ffe c t of impingement on
milk homogenisation in a three piston homogeniser with a flow rate
of around 1500 L/h, over a pressure range of 6 to 20 MPa. Two tests
compared the e ffec t of removal of impact ring. The results indicated
that the elim ination of the impact ring did not reduce the
effectiveness of homogenisation even though the liq u id stream
emerging from the space between the valve rod and the valve seat had
about ten times fa rth er to travel before s trik in g a surface. Mulder and Walstra (1974) commented that liqu id ve lo c ities of around 250
m/s are needed to disrupt milk fa t globules by impingement. Since
the e x it ve lo c ities from the homogenisation zone were 1n the region
of 50 m/s, no d irec t disruption was observed. However, the presence
or absence of the impact ring may a lte r flow conditions upstream.
53

1.3 .1 .3 Shear
Shear stress is caused by fr ic t io n a l forces generated during flow. Brookman (1975) and Engler (1979) disrupted c e lls by high pressure
extrusion of the c e ll suspensions through cap illa ry tubes. Brookman’ s experiments were carried out with a range of c ap illa ry
tube lengths from less than 10 mm to around 90 mm, with a bore
diameter of 0.152 mm. I t was reported that the soluble protein
release decreased with increasing c a p illa ry length. This was taken
as an indication that shear is not responsible fo r c e ll breakage. This however overlooks the fact th a t, as the pressure drop was held
constant, following the general equation
P rt = -------- (1 .5 )
2 L
where t is the shear stress; P, the pressure drop across the
c ap illa ry due to viscous e ffects ; r , the radia l position; and L, the
length of the c a p illa ry , the decrease 1n c ap illa ry length would
increase the shear stress which 1n fact argues fo r and not against the importance of shear in ce ll disruption.
Further experiments with a French Press type of equipment consisting
of a high pressure pump and a needle valve (which was considered as
a variation of the high pressure homogeniser theme) indicated that at constant pressure, disruption was independent of flow rate
(Brookman 1977). This was taken as fu rther evidence against the
shear theory. Changes in the needle valve aperture necessary to
maintain a constant pressure peak were not considered relevant in
the development of a disruption theory. Shear results reported by
Engler (1979) were inconclusive.
54
1.3 .2 Magnitude and rate of pressure drop
The above observations made by Brookman (Section 1 .3 .3 ) were
in terpreted as support fo r the mechanism re la tin g disruption to the
magnitude of pressure drop and the rate at which th is occurs. This
was taken to be 1n agreement with previous work on milk
homogenisation (Walstra 1969) indicating that the most Important determinants of homogenisation are pressure and the time scale of the process. I t has been suggested that the more rapid pressure drop
may also explain the observed better performance of the knife-edge
valve unit re la tiv e to the f la t type (C histi and Moo-Young 1986).
1 .3 .3 Turbulence and velocity changes
Experiments related to the e ffec t o f turbulence on c e ll breakage are
few. Doulah et a l . (1975) (Section 1 .2 .4 .2 .2 ) suggested thatturbulent eddies of dimensions smaller than a ce ll cause the c e ll f lu id to o s c illa te with enough k ine tic energy to disrupt the c e ll w all. This necessitates an assumption about a minimum c e ll diameter
which would be disrupted, which was discussed in Section 1 .2 .4 .2 .2 .
Work carried by Engler (1979) using two d iffe re n t nozzle designs to
allow greater turbulence in the high ve locity je t , suggested that the turbulence was not a primary cause of disruption but may enhance
the process near the point where the je t impinges on the impact surface.
Phipps (1971) experimented on milk homogenisation by varying the
dimensions of the valve unit so that the e ffe c t of both laminar and
turbulent flow regimes could be studied. I t was reported that turbulent condition did not a ffec t the homogenisation process in any
way. I t was however suggested that a t the s l i t entrance, the
globules are drawn into threads before they d is in tegrate . There 1s
a steep velocity gradient as the flow converges inside the valve
55

region where the rupture occurs. However, the length of the
disrupting zone may not favour the greatest break up e ffe c t possible
and thus a single passage of the emulsion through the valve may not produce the maximum dispersive e ffe c t.
According to Mohr (1987a), under the conditions of high pressure
homogenisation, the energy input into the system is converted in to
turbulence energy 1n the dissipating chamber. A spectrum of eddies
are formed in the turbulent flow which consists of large and small eddies. P artic le dispersion - in an o il in water or milk
homogenisation system - takes place 1n two stages. Primary
dispersion is affected by large eddies of high energy content. Secondary dispersion takes place as a result of pressure
fluctuations of the smallest energy-dissipating eddies 1f the
p a rtic le diameter is much larger than the dimensions of the eddies. In the case of very high energy densities, secondary dispersion
takes place by viscous shearing between two convergent small energy
dissipating eddies i f the p a rtic le diameter is roughly equal to the
dimensions of these eddies. This treatment presupposes the existence
of turbulence 1n the homogeniser and bases some of the findings on
a dispersing system consisting of a nozzle with a subsequent turbulent chamber.
1 .3 .4 Cavitation
Cavitation is the formation and subsequent collapse of small cavities (vapour bubbles) in a liq u id . Cavities form as soon as the
local pressure fa l ls below the vapour pressure of the liq u id . This
may happen when a high velocity produces a negative pressure which
cannot persist for long. I t is also possible fo r energy from sound
waves or ultrasonic waves of not too high a frequency to set up
local negative pressures. A dissolved gas or v o la t ile liq u id also
favours cavity formation. Cavities may be f i l le d with vapour or with
gas. The collapse of these cavities causes high pressure gradients
56
which may cause ce ll d is in tegration .
In the case of milk homogenisation, cavitation 1s one of the most discussed theories (Loo and Carlton 1953; McKillop 1955; Phipps
1974; Kurzhals 1977; Mohr 1987b). In c e ll disruption however 1t is
not believed to be a major mechanism. Brookman (1974) could not detect any o sc illa to ry phenomena other than the cyclic operation of the valve due to pressure pulses generated by the pump.
1 .3 .5 Explosive decompression
Brookman (1975) reported on the suggestion made two decades e a r l ie r
that the most important factor in disrupting c e lls of E .co l1 was
explosive decompression- i . e . , c e ll wall expansion during rapid
decompression due to sudden application and then release of external hydrostatic pressure- and not the flow characteristics of the c e ll suspension through a narrow o r if ic e . The theoretical treatment of th is idea was taken up fu rther (Scully 1975). During rapid
decompression, compressive stra in is transformed into te n s ile
s tra in . The compressive energy of the in tra c e llu la r water transforms
into k inetic energy since water cannot sustain a ten s ile s tra in .T h is
energy impacts upon the c e ll w a ll, increasing the te n s ile s tra in 1n
the w all. Scully (1975) derived an equation in which the te n s ile
s tra in increased lin e a rly with the applied hydrostatic pressure. The
experimental evidence that ce ll breakage increases more rapidly with
the pressure was explained 1n terms of the additional k in e tic energy
released by in tra c e llu la r water. However 1t is unclear whether th is
extra energy is adequate to account fo r the em pirically deduced
power relationship between disruption and pressure.
57

1.4 Cell part ic le and ce ll debris formation
The separation of c e llu la r fragments from soluble proteins a fte r
c e ll disruption is a major challenge to the biochemical engineer. The desired product is 1n a crude, d ilu te state and must be
concentrated and pu rified before use. This requires the removal of
ce ll debris. S o lid -liq u id separation methods such as centrifugation
and f i l t r a t io n are based on density difference and p a rtic le size
c r ite r ia . The size and density of the c e llu la r fragments and the
homogenate viscosity, which are dependent on the homogenisation
conditions, are therefore crucial to the performance o f the
separation process. However, the ce ll debris size is much smaller
than the whole microorganism and its d is trib u tio n much wider; the
density difference is also small. The selection, operational conditions and success of a separation process are therefore
dependent on the disruption stage.
The desired protein is not however, always water soluble, nor is 1t always stable enough, as 1n the case of globular proteins (V lrkar et a l . 1981), to withstand shear forces in separation processes. Many
reactions of industria l in te res t, such as highly selective
hydroxyl ations, are catalysed by enzyme complexes embedded in
c e llu la r lip id membranes. These membrane bound enzymes are insoluble
and shear sensitive (Talboys and Dunnill 1985). Their p u rific a tio n
necessitates the development of low-energy c e ll disruption
techniques and new processing methods (Hoare and Dunnill 1986; Thomas 1988).
With the advent of genetic engineering, numerous genes which encode
prokaryotic, v ira l or eukaryotic proteins have been cloned into a
varie ty of plasmids and expressed 1n various microorganisms or tissue culture ce lls ; the most commercially s ig n ific an t proteins
being from eukaryotic sources (Kane and Hartley 1988). In many
cases, however, the proteins produced are not soluble in the ce ll
but form Insoluble, denatured aggregates known as inclusion bodies.
58
The recovery of these partic les free of ce ll debris and other
contaminants and th e ir reso lub ilisation has led to new research and
development in separation processes (Hoare and Dunnill 1986).
1.4.1 Cell debris
The characterisation of ce ll debris 1s a new area of research
prompted by f i r s t ly , the need fo r the design of separation
procedures to recover novel products such as recombinant proteins; and secondly, the attempt to fu rther improve the e ffic ien c y of existing p u rifica tio n processes.
In a major study of the unit operations Involved 1n the continuous
flow iso lation of 0-galactosidase from E. co li (Higgins e t a l . 1978), 1t was shown that irrespective of the type of In dustria l centrifuge used, the throughput has to be lowered considerably 1n
order to reduce the percentage of unsedimented solids in the
recovered product stream (e .g . a 10 fo ld reduction 1n the flow rate
in order to decrease the percentage unsedimented solids by a facto r
of 20). This longer residence time leads to s ig n ifican t temperature
rise of the process stream which may adversely a ffec t the q u a lity of the product. This problem is even more acute with yeast c e ll debris
where a 10 fo ld reduction in the throughput would reduce the
percentage unsedimented solids by only a facto r of 10 (Mosquelra et a l . 1981). C learly fu rther information on c e ll debris formation at the disruption stage could help optimise the separation process.
The removal of yeast ce ll debris by f i l t r a t io n resulted in a rapid
increase in f i l t e r cake resistance due to blinding o f the precoat (Gray et a l . 1973). A study of the e ffe c t of homogenisationconditions on f i l t r a t io n indicated that the cake resistance
increased with the number of disruption passes and was accompanied
by a reduction in the amount of soluble protein transmitted o f up to
30% (Su et a l. 1987). This is probably due to the fac t that the
59
smaller the ce ll debris, the smaller are the in te r s t i t ia l spaces, resulting in an increased resistance to the process flu x . Furthermore, the f i l t e r cake has poor mechanical s ta b il i ty and is
easily compressed by moderate pressures, which leads to a fu rther
reduction 1n the porosity of the cake. The need fo r a better
understanding of homogenisation process in order to optimise
downstream operations is , once again, apparent.
1 .4 .2 . Inclusion bodies
Protein inclusion bodies have been commonly described as dense, insoluble bodies which may be recovered by centrifugation (Marston
et a l . 1984). However the obvious Inadequacy of such a description
in process design has led to s ig n ifican t research to characterise
these p a rtic les . I t is now evident that d iffe re n t types of Inclusion
bodies have d iffe re n t size and density characteris tics . For example, the d -in terferon and the prochymosin-based inclusion bodies have an
average diameter of 0.81 and 1.28 pm respectively (Taylor e t a l . 1986). Furthermore, a decrease in the density of prochymosin
inclusion bodies with increasing p a rtic le size is observed, w hilst th is trend is not detected in the case of ^ -In terferon inclusion
bodies (Gardiner et a l . 1987). A fu rther facto r to consider in
separating inclusion bodies a fte r c e ll disruption is the presence of c e ll debris. Whilst c e ll debris 1s shown to s e ttle at a slower rate
than the inclusion bodies, the degree of overlap and the re la tiv e
closeness of the s e ttlin g rates indicates the d if f ic u lt ie s which may
be encountered when th is recovery is implemented on an industria l
scale (Gardiner e t a l. 1987).
1 .4 .3 Microsomal fractions
For the u t ilis a t io n of membrane bound enzymes 1t is necessary to
iso la te the en tire subcellular structures in which the enzymes are
60

located (Smeds and Enfors 1985). These may be photophosphorelating
membrane vesicles called chromatophores, or endoplasmic reticulum
bound enzymes. Endoplasmic reticulum is extensively disrupted even
by gentle homogenisation, resulting in closed vesicles ( Depierre et a l . 1980) named microsomes by Claude (1940).
The la b ile nature of membrane bound enzymes necessitate a rapid, gentle separation process. The PEG p rec ip ita tion and two phase
aqueous extraction systems are believed to be both quicker and more
amenable to scale up than other methods (Thomas 1988). Even though
there has been some evidence that microsomes resulting from
d iffe re n t homogenisation conditions p rec ip ita te d iffe re n tly (Sadler
et a l. 1985; Broad unpublished data), and that 1n aqueous two phase
systems, the adsorption of p artic les to the In terface is dependent on p a rtic le size (Smeds and Enfors 1985), l i t t l e Information is
availab le on the e ffe c t of homogenisation on microsomal characteris tics . Data presented in lite ra tu re on the size of subcellular p artic les obtained following laboratory scale separation
procedures are summarised 1n Table 1.4. They may serve as a general guide!ine.
61
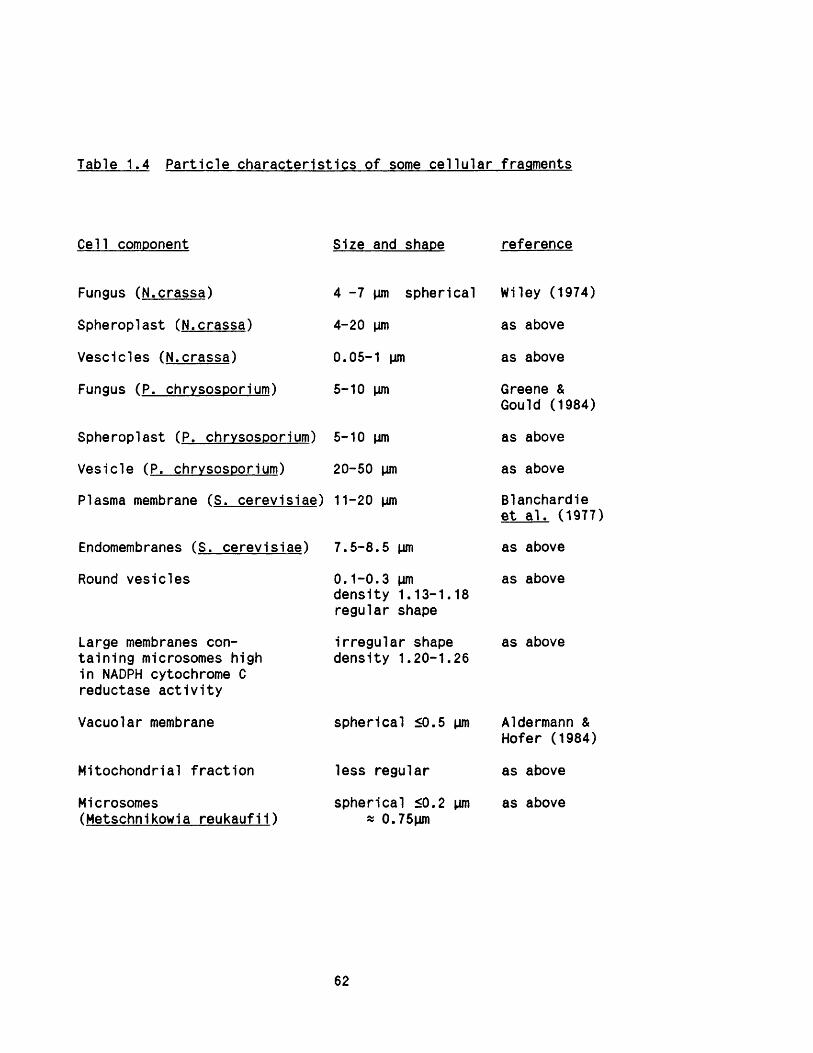
Table 1.4 Partic le characteristics of some c e llu la r fragments
Cell component Size and shaDe reference
Funqus (N.crassa) 4 -7 pun spherical Wiley (1974)
Soheroolast (N.crassa) 4-20 pm as above
Vesclcles (N.crassa) 0.05-1 pm as above
Funqus (P. chrvsosDorium) 5-10 pm Greene & Gould (1984)
SDheroDlast (P. chrvsosDorium) 5-10 pm as above
Vesicle (P. chrysosDorium) 20-50 pm as above
Plasma membrane (S. cerevisiae) 11-20 pm Blanchardie e t a l. (1977)
Endomembranes (S. cerevisiae) 7 .5 -8 .5 pm as above
Round vesicles 0 .1 -0 .3 pm density 1.13-1.18 regular shape
as above
Large membranes conta in ing microsomes high in NADPH cytochrome C reductase a c tiv ity
irreg u lar shape density 1.20-1.26
as above
Vacuolar membrane spherical <0.5 pm Aldermann & Hofer (1984)
Mitochondrial fraction less regular as above
Microsomes spherical <0.2 pm as above
62
1.5 Scope of the study
The central aim of th is study was to broaden the understanding of the high pressure homogenisation process. In view of the fac t that most availab le research on th is topic had been carried out 1n the
early 1970’ s, there was a need to readdress some of the unresolved
problems and also investigate the e ffe c t of some of the new
developments which had since occurred in the disruption technology.
The disruption study of filamentous microorganisms had been largely
neglected u n til very recently when Thomas (1988) Investigated the
release of soluble protein and the membrane bound enzyme
progesterone 11a-hydroxylase from Rhizopus nigricans. In the present study, fu rther work was carried out to characterise the disruption
kinetics of th is microorganism with the view to investigate some of the d if f ic u lt ie s previously reported by other workers (Section
1 .2 .3 ) , and compare the findings with a reference u n ice llu la r
microorganism namely bakers’ yeast.
Against a background of wide ranging theories available to explain
c e ll disruption, the mechanism of c e ll disruption has been
investigated using the above mentioned microorganisms. New evidence
1s presented to explain some aspects of the complex disruption
process. A theoretical approach is thus put forward.
In order to gain a more complete picture of the c e ll disruption
process, c e llu la r p artic les obtained under d iffe re n t homogenisation
conditions, and homogeniser configuration were characterised.
F in a lly , a new integrated, hygienic homogenisation system comprising
a recently developed homogeniser and a n c illa ry equipment (e .g . hoppers, heat exchanger) was designed with the view to future work
and possible r e t r o f i t ta b i l i t y fo r containment.
63
2. MATERIALS AND METHODS
2.1 M aterials
Dextrose monohydrate was obtained from Tunnel Refineries (Greenwich, London, UK) and yeast extract from Bovril Ltd. (Burton on Trent, S ta ffs , UK). Potato dextrose agar and Sabourauds dextrose agar were
purchased from Oxoid Ltd. (Basingstoke, Hants., UK). Progesterone
was a g i f t from Glaxo Research Ltd (Greenford, Middlesex, UK). Bovine serum albumin, glutathione and NAD (grade I I I ) were from
Sigma Ltd. (Poole, Dorset, UK). Polypropylene glycol (PPG 2025), ethanol and semicarbazide hydrochloride (Alanar) were supplied by
BDH Ltd. (Poole, Dorset, UK). Folin and C iocalteu’ s phenol reagent, sodium dihydrogen phosphate, disodium and dipotassium hydrogen
phosphates and a ll other chemicals used were obtained from Fisons
pic (Crawley, West Sussex, UK).
2.2 Microorganisms
Rhizopus nigricans 6227b ( lis te d as R. s to lo n ife r in the ATCC
catalogue) was a g i f t of Glaxo Research Ltd. (Greenford, Middx., UK). Blocks of Bakers’ yeast were obtained from the D is t il le rs Co.
Ltd. (Sutton, Surrey, UK).
Spores of R. nigricans were kept freeze dried in 20% (w/v) skimmed
milk at a concentration of 7 x 10⁷ spores/mL. Agar slopes consisting
of 2.78 g potato dextrose agar and 1.16 g Sabourauds dextrose agar dissolved in 100 mL deionised water were prepared in 500 mL medical f l a t bottles f i t te d with foam bungs. The use of high q u ality
deionised water was found to be important in the dissolution of the
agar constituents and subsequent healthy growth of the spores. Approximately 1 x 10⁸ spores were suspended in 5 mL of deionised
water and then transferred onto the agar slopes. These were
64

incubated at 28° C u n til heavy sporulation was achieved (up to 14
days). Spores were then harvested into 50 mL deionised water and
counted using a haemocytometer. They were stored at 4° C and used
within a week. In the above procedure a ll m aterials and Instruments
were s te rilis e d (a t 121° C fo r 15 minutes) and handled under aseptic
conditions. One exception was the skimmed milk which could not be
autoclaved due to protein denaturation. This problem was overcome by
using a fresh unopened container of skimmed milk in each freeze
drying operation.
2.3 Growth medium for Rhizopus nigricans
The spores of R. nigricans were grown in a medium containing 2.5%
dextrose monohydrate, 2.0% yeast extract and trace minerals. The
trace mineral solution prescribed by Elsworth e t a l . (1968) was
used. However i t was found that the recommended 0.1% solids content did not readily dissolve. The proportion of solids was therefore
reduced by a facto r of ten as recommended by Thomas (1988). Fermentation medium was supplemented with 0.01% PPG 2025 to control foam formation. The pH of a ll media was adjusted to 4.5 with 5H
orthophosphoric acid. Media s te r ilis a tio n was carried out at 121° C
fo r 15 minutes.
2.4 Growth of Rhizopus nigricans in shake flasks
Twelve 2 L Erlenmeyer flasks, each containing 250 mL of s te r i le
medium, were inoculated with a spore suspension of 5 x 10⁸ per fla s k , giving a fin a l concentration of 2 x 10® spores/ml. The shake flasks
were si 1 iconised beforehand 1n order to elim inate wall growth. Cultures were grown in a reciprocating shaker Incubator (New
Brunswick, N .J ., USA) with a 50 mm throw set a t 100 strokes/min held
at 29° C for 24 h. In the case where progesterone 11a-hydroxylase had
to be induced in the c e lls , progesterone was added at 2 g/L a fte r 21
h.
65

2.5 Growth of Rhizopus nigricans in fermenters
2.5 .1 Equipment
2 .5 .1 .1 Fermenters
Fermentations were carried out in 4 d iffe re n t size vessels as
described below. However the m ajority of the work was done 1n the 42
L fermenter.
Vessel Total capacity (L) Working volime(L)14 L 14 10(A lfa Laval, Middx., UK)20 L 20 15(LH Eng., Bucks, UK)42 L 42 30(LH Eng., Bucks, UK)150 L 150 100(LH Eng., Bucks, UK)
The baffles in these fermenters were positioned in such a way as to
avoid splashing which may resu lt in wall growth. Furthermore the
liq u id level was well below the top p late . This prevented the
blockage of the a ir e x it due to c e ll growth.
2 .5 .1 .2 Instrumentation and s te r ilis a tio n
A ll vessels were equipped with Ingold steam s te r ilis a b le pH and DOT
electrodes (L ife Science Labs., Beds., UK). Exit gases were recorded
and analysed using a microprocessor controlled VG MM-80 mass
spectrometer (VG Gas Analysis, Cheshire, UK). Via a lin k up to a PDP
minicomputer i t was possible to monitor the physical parameters and
66

compute the OUR, CER and RQ values throughout the fermentation
period.
Except fo r the 150 L fermenter, a l l components of the media were
s te rilis e d together in s itu at 121° C fo r 15 minutes. In the case of the large fermenter, dextrose monohydrate was separately dissolved
1n 10 L deionised water and the pH of the solution adjusted to 3
using 5 M orthophosphoric acid. I t was then s te rilis e d in the same
manner and asep tica lly added to the remaining medium which had
already been s te rilis e d in the fermenter.
2 .5 .2 Conditions of growth
The physical parameters fo r fermentations carried out in the 20 L
and 42 L vessels were as follows. The temperature was held at 29° C, aeration rate was at 0.1 VVM, the pH was set at 4.5 and the t ip
speed at 2.0 m/s. In the 14 L fermenter, the aeration rate was
maintained at 0.12 VVM. The aeration rate in the 150 L vessel was
increased to 0.2 VVM.
2 .5 .2 .1 Filamentous growth
Fermentations below 100 L were inoculated from shake flask cultures
grown fo r 10 hours at which time v is ib le filamentous growth could be
noted. Conditions were as specified in Section 2 .4 . For the 100 L
fermentations, the 14 L vessel was used as seed fermenter to grow
the inoculum. The size of inoculum, depending on the fermenter
varied between 7 to 10% (v /v ) . The fermentations lasted fo r 15 to 18
h u n til the stationary phase was reached.
67

2 .5 .2 .2 Pelleted growth
Pelleted growth was achieved by reducing the inoculum size fo r the
shake flasks to one th ird , from 2 x 10⁶ to 6.7 x 10⁵ spores/mL. I t
was also possible to obtain pelleted c e lls i f the inoculum was
transferred at an e a r lie r stage i .e . less than 10 h growth in the
shake flask when the mycelia were not fu l ly v is ib le .
2.6 Harvesting
2.6.1 Nvlon mesh
A ll shake flask grown ce lls were harvested by transferring them into
a funnel lined with coarse nylon mesh. The c e lls were washed 3 times
in a to ta l of 3 volumes of 50 mM sodium phosphate (Na2HP04/NaH2P04) buffer (pH 7 .4 ) at 4° C and pressed dry.
One 100 L fermentation was harvested using the same procedure as
above. I t was found to be more time consuming than harvesting using
a basket centrifuge.
2 .6 .2 Basket centrifuge
Fermentation cultures generally were harvested in a basket centrifuge (HSE model 10.65 -now obsolete- MSE L td ., West Sussex, UK) running at 1000 to 1500 rpm, and washed 3 times 1n a to ta l of
three fermenter working volumes of the above buffer (Section 2 .6 .1 ) .
68

2.7 Preparation of microorganisms for disruption
2.7 .1 Bakers* veast
Fresh blocks of yeast (about 1 kg/block) were stored in a cold room
and used within 3 days of purchase. The packed yeast was crumbled
and suspended In 4 mH K2HP04 at 4° C to give a concentration of 45%
w/v of packed c e lls . The concentration of phosphate buffer was
chosen to maintain constant pH of the disrupted suspension of 5.6
over a wide range of protein concentrations (Hetherington e t a l. 1971).
2 .7 .2 Rhizopus nigricans
R. nigricans c e lls from e ith er shake flask or fermentation cultures
were resuspended immediately a fte r harvesting in 50 mH phosphate
buffer a t 4° C to the required concentration. I t was important to
carry out th is step as quickly as possible as the storage time of harvested c e lls affected the ease of resuspension.
2.8 High pressure homogenisation
2.8 .1 Equipment
The equipment was an APV-Gaulin 15 H single piston positive
displacement pump, incorporating a single adjustable, restric ted
o r if ic e discharge valve assembly, the design and operation of which
is already described 1n Section 1 .1 .2 .2 . The homogeniser had a
capacity of 57 L/h and operated w ithin a nominal pressure range of up to 56 MPa. The equipment was coupled to an APV Junior plate heat exchanger (APV Baker, Crawley, West Sussex, UK). A 70% aqueous
solution of ethylene glycol at -5 ° C was used as coolant. The flow
was controlled by means of a manual valve. In le t and o u tle t
69
temperatures were monitored using platinum resistance probes (model
3745 PT 100, Digitron Instrumentations Ltd, Hertford, H erts ., UK) connected to a Digitron multi selector u n it.
The stainless steel container attached to the homogeniser to hold
the process batch had a 5 L working volume. The pressure was
indicated by a gauge mounted on top of the cylinder block. The
fluctuations in measurement caused by the operation of the single
plunger were reduced by means of a manually adjusted dampener. An
ammeter was insta lled to Id en tify pressure gauge malfunction. Figure2.1 gives a schematic outline of the experimental arrangement.
2 .8 .2 Changing of valve assembly
Depending on the nature of the experiment, f iv e d iffe re n t valve unit configurations were examined, the d e ta ils of which are given in
Table 2 .1 . This included three types of knife-edge units (CRF, CD, KE), and a f la t valve un it (FV). As the dimensional characteristics
of these units are essential in the analysis of the results
obtained, th e ir d e ta ils are described in fu l l 1n Chapter 4 (Section
4 .1 ) . Furthermore the impact distance was also varied by using four
Impact rings of varying bore sizes 1n the valve geometry CD (Cell Disruption). Details of these dimensions are discussed in Chapter 4
(Section 4 .1 ).
As the homogeniser is not s p e c ific a lly designed fo r frequent disassembly of the valve unit other than routine Inspection, the
changing of the components of the valve unit proved to be an
involved operation necessitating careful handling. I t was essential
to ensure that the o-rings and the components of the valve unit were
correctly f i t te d . Failure to do so could resu lt in damage to the
unit and leakage, which would impair the disruption process. Furthermore, even though the ceramic composite material of the CD
unit was resistant to wear i t was nevertheless b r i t t le .
70
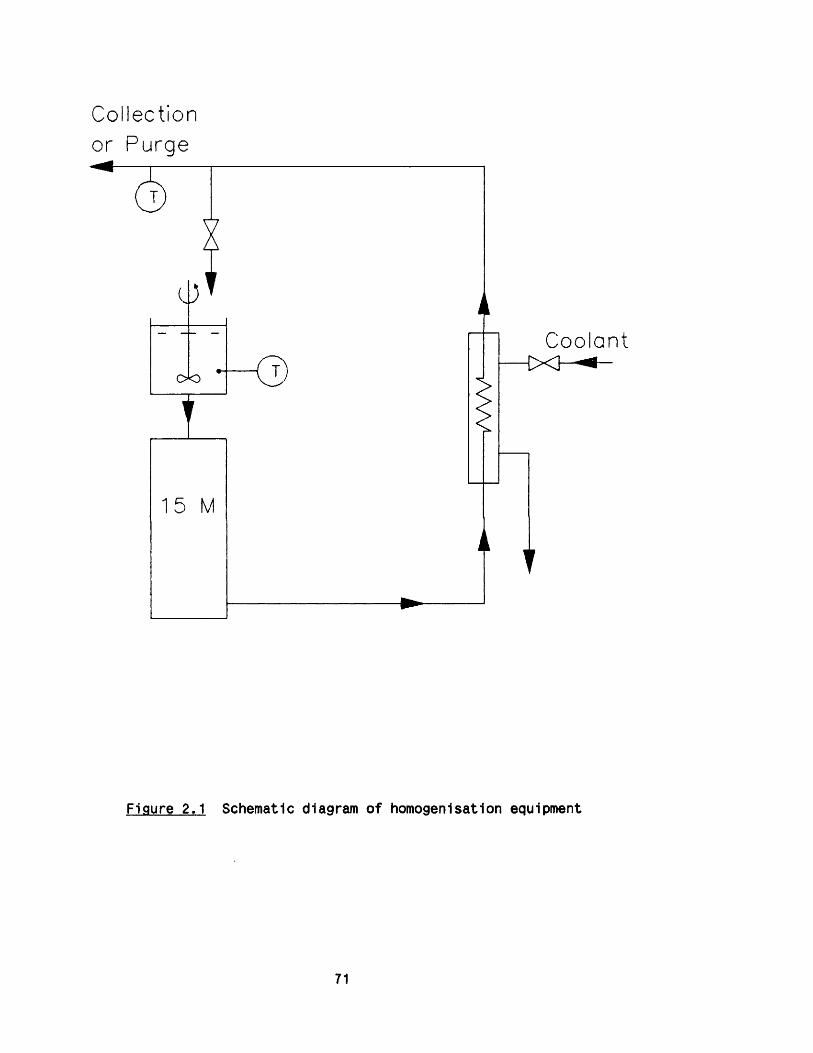
Collection or Purge
Coolant0*0
Figure 2.1 Schematic diagram of homogenisation equipment
71

Table 2.1 Valve unit configuration
Type of unit Symbol
F lat valve seat &
f la t valve rod
Knife-edge valve
seat & f la t valve
rod
Knife-edge valve
seat & coned valve
rod
Knife-edge valve
seat & f la t valve
rod
Knife-edge valve
seat & f la t valve
rod
F lat valve
(FV)
Cell Disruption
(CD)
Cell Rupture
(CR)
Cell Rupture
type (CRF)
(KE)
Material
tungsten carbide
ceramic composite
tungsten carbide
tungsten carbide
s te l l i t e
72

2.8 .3 Disruption procedure
The homogenisation was performed on a d iscrete pass basis, fo r up to
5 passes. The ce lls were continuously s tirre d in the hopper
throughout the procedure. This was p a rtic u la rly Important 1n the
case of filamentous R.nigricans c e lls which s e ttle easily under grav ity . In order to minimise the amount of mixing between two
consecutive passes, i t was necessary to purge a suspension volume
equivalent to the hold up volume in the system. However, 1t was also
desirable to minimise the amount of suspension loss. The following
procedure was therefore adopted.Step 1- The hold up volume was obtained using a colour tracer. This
was found to be equivalent to 30 seconds of flow.Step 2- A fter pass 1, the system was purged fo r 30 seconds before
collection began.Step 3- A fter pass 2, the output from the homogeniser was returned
to the hopper fo r 15 seconds, and purged fo r the following 15
seconds, before co llection started . The logic of th is procedure was
that fo r the in i t ia l 15 seconds, the hold up volume was the remnant of the pass 1 homogenate and could therefore be returned to the
hopper. The following 15 seconds were to be purged due to mixing of the passes in the pipework.Step 4- Step 3 was repeated for the next passes.
Although i t was possible to purge the to ta l hold up volume a fte r
each pass fo r microorganisms availab le in large quantities , such as
Bakers’ yeast, 1t would have been impractical to do so fo r smaller
volumes of c e ll suspension such as fermenter grown R. nigricans
c e lls . In the case of shake flask cultures where the amount of availab le ce lls was even more lim ited , each pass was followed by
buffer to avoid dry running of the homogeniser under pressure which
damages the valve un it. The d ilu tio n e ffe c t was then taken Into
account by measuring the dry weight of the c e lls a fte r each pass. The temperature of the process stream was maintained at 4° C ± 1 by
contro lling the aqueous ethylene glycol supply. I t is possible to
73

cool down the in i t ia l suspension p rio r to homogenisation by
recircu lating i t in the homogeniser without applying any pressure. However th is was avoided when dealing with R. nigricans suspensions
to prevent possible damage to the c e lls . As mentioned in Section
2 .7 , c e lls were suspended 1n buffer already cooled to 4° C. Care was
taken to achieve reproducible pressures fo r d iffe re n t experiments
carried out at the same pressure. Samples of 30 mL were taken a fte r
each pass fo r fu rther analysis.
2.9 Microsomal preparation
2.9 .1 Homogenate
Shake flask grown c e lls of R. nigricans were disrupted at 15 MPa and
samples were collected a fte r 1, 2, or 4 passes depending on the
nature of the experiment.
2 .9 .2 Gel f i l t r a t io n
Samples of disrupted c e lls were spun at 2000 g in a centrifuge (MSE
Ltd, Crawley, West Sussex, UK) fo r 10 minutes. The supernatant was
then spun at 50000 g In a Pegasus 65 u ltracentrifuge (MSE Ltd, Crawley, West Sussex, UK) fo r 45 minutes. The top surface of the
supernatant was covered with a lip id layer. Care was taken not to
resuspend th is layer when removing the supernatant which was then
loaded onto a high performance gel f i l t r a t io n column using Superose
12 (Pharmacia Ltd, Uppsala, Sweden) as the Separation medium (range
103 - 3 x 10⁵ MW). The f i r s t peak was collected fo r p a rtic le s izing .
74
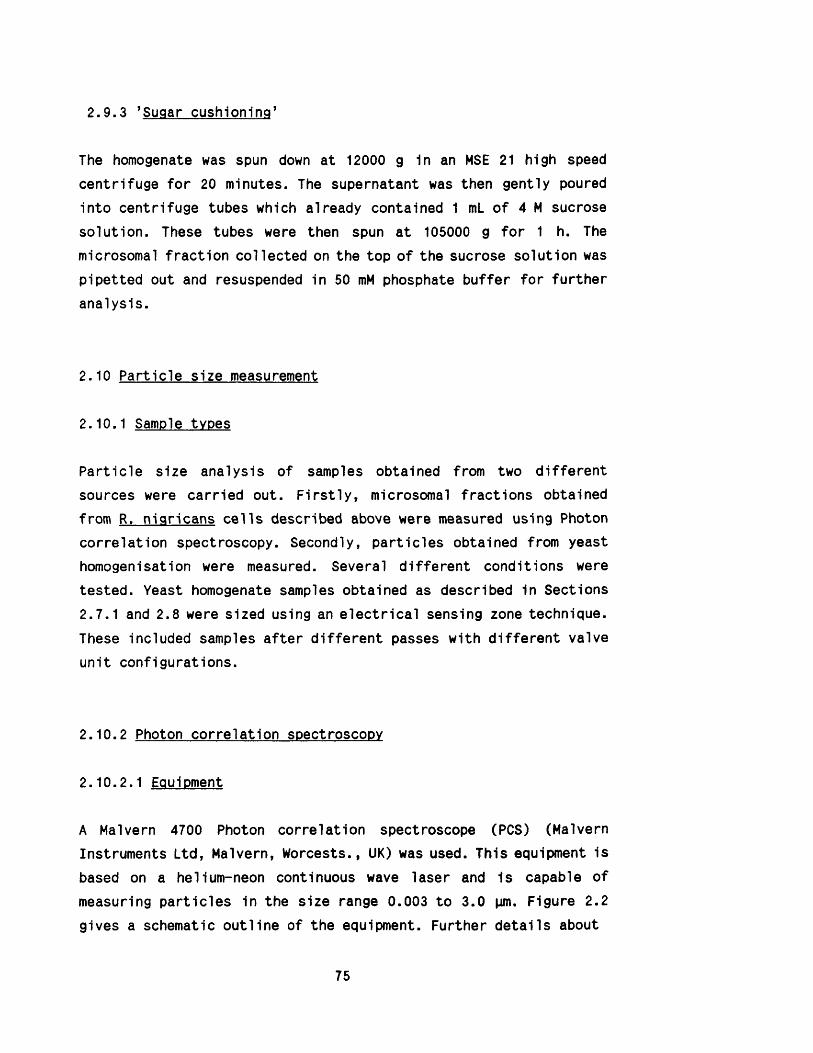
2.9 .3 ’Sugar cushioning’
The homogenate was spun down at 12000 g 1n an MSE 21 high speed
centrifuge fo r 20 minutes. The supernatant was then gently poured
into centrifuge tubes which already contained 1 mL of 4 M sucrose
solution. These tubes were then spun a t 105000 g fo r 1 h. The
microsomal frac tion collected on the top of the sucrose solution was
pipetted out and resuspended in 50 mM phosphate buffer fo r further
analysis.
2.10 P artic le size measurement
2.10.1 Sample types
P artic le size analysis of samples obtained from two d iffe re n t
sources were carried out. F irs t ly , microsomal fractions obtained
from R. nigricans c e lls described above were measured using Photon
correlation spectroscopy. Secondly, p artic les obtained from yeast homogenisation were measured. Several d iffe re n t conditions were
tested. Yeast homogenate samples obtained as described in Sections2.7.1 and 2.8 were sized using an e le c tr ic a l sensing zone technique. These included samples a fte r d iffe re n t passes with d iffe re n t valve
unit configurations.
2 .10.2 Photon correlation spectroscopy
2.10.2 .1 Equipment
A Malvern 4700 Photon correlation spectroscope (PCS) (Malvern
Instruments Ltd, Malvern, Worcests., UK) was used. This equipment is
based on a helium-neon continuous wave laser and is capable of measuring p artic les in the size range 0.003 to 3.0 pm. Figure 2.2
gives a schematic outline of the equipment. Further d e ta ils about
75
LOC
KA
BLE
A
DJU
STA
BLE
LA
SER
MO
UN
T
<0 DC
IU ill
U l COUi UJ
Figure 2.2 Schematic outline of photon correlation
spectroscope(corre lato r and computer not shown)
76
the equipment are given in Appendix B.
2 .10 .2 .2 Sample preparation
Sample preparation is a very important step in operating the Malvern
4700. Prior to measuring a sample, the index matching f lu id ( i .e . water in these experiments) in which sample cuvettes were immersed
was f i l te re d and recirculated using the f i l t e r pump availab le fo r
th is purpose. The f lu id served to reduce the re frac tive index change
at the surface of cuvette and also acted as a constant temperature
bath. The cuvettes and th e ir stoppers were rinsed several times with
f i l te r e d water to clean them of dust p a rtic le s . I t was possible to
overcome the problem of a typ ica lly large p artic les by allowing them
to s e ttle , although th is was not found necessary when measuring
microsomes.
The presence of high concentration leading to m ultiscatter was
detected by visual inspection through the viewing s l i t . A clean
bright lig h t lin e from the laser passing through the sample
indicated an acceptable concentration le ve l. I f the beam was
shrouded in a halo of lig h t, the concentration was evidently too
high and more d ilu tio n was required. The temperature difference
between the sample and the instrument was elim inated by e ith e r
preparing the sample a t the same temperature as the ambient temperature or allowing i t to s e ttle 1n the instrument fo r at least 2 minutes. The problem of temperature rise during prolonged
experimentation was eliminated by passing aqueous ethylene glycol at 0° C around the walls of the water bath. A heating element in sta lled
in the walls was connected to a control un it which adjusted the
temperature of the water to a selected set point.
77

2.10 .2 .3 Instrument settings
The settings were controlled by changing the photom ultiplier
aperture, the sampling time. These parameters were altered to
achieve an acceptable count rate (80000 to 350000 counts/s), “signal to noise" ra tio (20-80%) and "within range" value ( >80-90%).
2.10.3 E lec trica l sensing zone method
The ce ll debris from yeast homogenisation were sized using an
e le c tric a l sensing method (Elzone model 80 XY, P artic le Data Ltd, Cheltenham, Gloucs, UK) with 128 channels and a s ta tis tic s computing
accessory. The analyser was f i t te d with a 30 pm o r if ic e tube and
calibrated using latex standards (P a rtic le Data Ltd) of sizes 2.02
pm and 10.18 pm. The current was set at 4.5 A and the gain at 1.5.
The debris suspensions ( in i t ia l whole yeast concentration of 45% w/v
packed c e lls ) were d ilu ted in 1%, 5% and 10% (w/v) sodium chloride
to give a coincidence count of less than 1% during size analysis. The sodium chloride had been f i l te re d through 0.1 pm f i l t e r and
vacuum degassed to avoid bubble formation. Good dispersion was
maintained during the d ilu tio n process and care was taken to use
clean dust free glassware. P artic le size data was corrected fo r an
e lec tro ly te background count.
2.11 Gel electrophoresis
Sodium dodecyl sulphate-polyacrylamide gel electrophoresis (SDS- PAGE) was performed on samples of filamentous, fermenter grown R. nigricans ce lls which were disrupted at d iffe re n t pressures fo r 5
passes. The electrophoresis equipment was a Pharmacia model GE 2/4
LS ( Pharmacia Fine Chemicals AB, Uppsala, Sweden). A modified
Laemmli technique (1961) was adopted.
78

Homogenate samples were spun down at 14000 g fo r 30 minutes. The
supernatant, 0.6 mL, was added to 0.2 ml sample buffer (4 x
concentration). The sample buffer was prepared by adding 5 mL
glycerol to 2.5 mL 2-mercaptoethanol, 1.5 g SDS, 0.38 g T ris and12.5 mg bromophenol blue and made up to 12 mL with deionised water. A fter thorough mixing the pH of the buffer was adjusted to 6.8 with
HC1. The samples were then boiled fo r several minutes, and 35 pL
aliquots were placed in the sample wells of the gel slabs. A protein
marker in the MW range 12300-78000 was used. A fter electrophoresis, the gel slabs were scanned in an ultrascan laser densitometer ( LKB
Bromma, Uppsala, Sweden).
2.12 Protein assay
2.12.1 Bakers’ yeast
Samples of disrupted c e lls were spun at 14000 g in an MSE 21 High
Speed centrifuge (MSE Ltd, Crawley, West Sussex, UK) fo r 30 minutes. The supernatant layer was then d ilu ted in the range 0 -1 .0 mg/mL
protein with deionised water. The d ilu ted samples were analysed for
th e ir soluble protein content by the Folin-Lowry method (Lowry et a l . 1951) using a Technicon Auto-Analyser (Technicon Instruments, Basingstoke, Hants, UK).
For a given suspension the solids content decreased with the degree
of disruption. To bring the analytica l results to the common basis
of protein released per gramme of yeast, i t was necessary to
compensate fo r the change in the solids content of samples. The
fraction of aqueous phase in a suspension was obtained using the
method described by Hetherington et a l. (1971).
79

2.12.2 Rhizopus nigricans
Samples were d iluted with 50 mM phosphate buffer to the range 0-0.7
mg/mL protein. Care was taken to ensure that the homogenates were
well mixed as the debris settles very quickly. The d ilu ted samples
were then spun down in an MSE High Speed centrifuge (Europa 24M, MSE
Ltd, Crawley, West Sussex, Uk) at 14000 g fo r 30 minutes. Cut-off auto-pipette tip s were used to obtain representative samples at low
disruption levels . The soluble protein content of the supernatant was then analysed as described in Section 2.11.1 above.
2.13 Alcohol dehydrogenase a c tiv ity assay
The assay was according to Bergmeyer e t a l . (1983). The assay
mixture (3 .0 mL) consisted of 6.2 mM semicarbazide hydrochloride,1.0 mM glutathione, 1.8 mM NAD and 700 mM ethanol in Tris-HCl buffer
(0.05 M, pH 8 .8 ) . The sample consisted of 0.05 mL of the supernatant solution of disrupted c e lls previously prepared fo r soluble protein
assay. A fter addition of the sample mixture the reaction was
monitored at 340 nm in a spectrophotometer (model SP 8400, Pye
Unicam, Cambridge, England).
In the assays stated in the above sections where appropriate each
result was the mean of at least f iv e independent determinations from
separate experiments and each determination was the mean of at least
two rep licate samples.
2.14 Dry weight measurements
Homogenised samples (4 .5 mL) from each pass together with in i t ia l undisrupted samples (approximately 2 g) were transferred to
porcelain crucibles and dried at 90° C to constant weight. In the
case of R. nigricans c e lls , samples o f the buffer were also measured
80

fo r dry weight to account fo r the contribution to the dry weight of
the disrupted ce ll samples. Yeast data were expressed in terms of wet weight of packed c e lls , however, dry weight measurements were
also taken to monitor the consistency of d iffe re n t batches.
2.15 Microscopy
Micrographs of disrupted and whole ce lls were taken with an Olympus
camera (Olympus Optical Co., London, UK) connected to an Olympus BH2
stereoscopic lig h t microscope. Samples were stained with lactophenol blue prio r to slide preparation.
81
3. DISRUPTION CHARACTERISTICS OF RHIZOPUS NIGRICANS
The disruption characteristics of the filamentous fungus Rhizopus
nigricans 1n a high pressure homogeniser was studied. The e ffec t of operating conditions, namely, pressure and the number of passes, c e ll related conditions, i .e . c e ll concentration and c e ll growth, and equipment parameters, i .e . valve unit design were investigated.
3.1 E ffect of pressure and number of passes
Within the lim ited framework of data availab le on disruption of filamentous microorganisms, high pressure homogenisation has been
considered by some researchers as an unfavourable method of ce ll disruption (Zete lak i 1969, Hanisch 1978), w hilst i t has been
reported by others to be a more e ffec tiv e technique than bead
m illin g (Thomas 1988). Further work was therefore required to
substantiate the effectiveness of high pressure homogenisation in
disrupting filamentous microorganisms such as R. nigricans.
3.1.1 Shake flask culture
Multi-pass experiments were carried out with filamentous shake flask
cultures of R. nigricans, at a low pressure of 10 MPa, and a high
pressure of 50 MPa which is close to the lim it of op erab ility o f the
single piston homogeniser used. The release of soluble protein
obtained at these pressures is shown 1n Figure 3 .1 . The results
indicate that there is a sharp and almost complete release of soluble protein a fte r the f i r s t pass. No increase in the amount of
82

(mg/
mg
Cel
l Dr
y W
eigh
t)
0.4
0.3
0.2
0.00 2 4
Number o f Passes
+ 10 MPa
V 50 MPa
Figure 3.1 E ffect of pressure on release of soluble
protein from shake flask-grown filamentous
c e lls .
83

protein released was observed at the higher pressure of 50 MPa
versus 10 MPa.
3 .1 .2 Fermenter cultures
Filamentous c e lls grown in a fermenter were disrupted over a range
of pressures from 5 MPa to 50 MPa. The soluble protein released up
to 5 passes was measured (Figure 3 .2 ). The maximum amount of protein
released (Rm) was reached a fte r 3 passes fo r pressures above 10 MPa. However, Rm was observed to be dependent on pressure. This resu lt was
contrary to the observations made fo r high pressure homogenisation
of u n ice llu la r microorganisms, where Rm was independent of pressure (Hetherington e t a l. 1971; Gray et a l. 1973).
Fermenter grown pelleted cultures o f the c e lls were also disrupted
at pressures in the range 5 MPa and 20 MPa. S im ilar results to those
fo r filamentous cultures were obtained as shown in Figure 3 .3 .
3 .1 .3 Maximum protein release
The dependency of RB on pressure had been previously observed fo r
Candida lip o ly tic a and was attribu ted to the mixed morphology of the
culture consisting of filamentous and elongated ovoid c e lls
(Whitworth 1974b), but no further work was carried out to c la r ify
these findings (Section 1 .2 .2 ). However, th is explanation could not be applied to the observations made 1n th is study as cultures, whether filamentous or pelleted , were of uniform morphology.
Previous work by Limon-Lason e t a l. (1979) on disruption o f Bakers’ yeast in a bead m ill showed variable values of R .̂ This was explained
by the possible release of Insoluble complex proteins and other
Fol1n-pos1tive m aterials such as peptide, glycopeptide and amino- acids by micronisation of the ce ll debris. As th is could be a
84
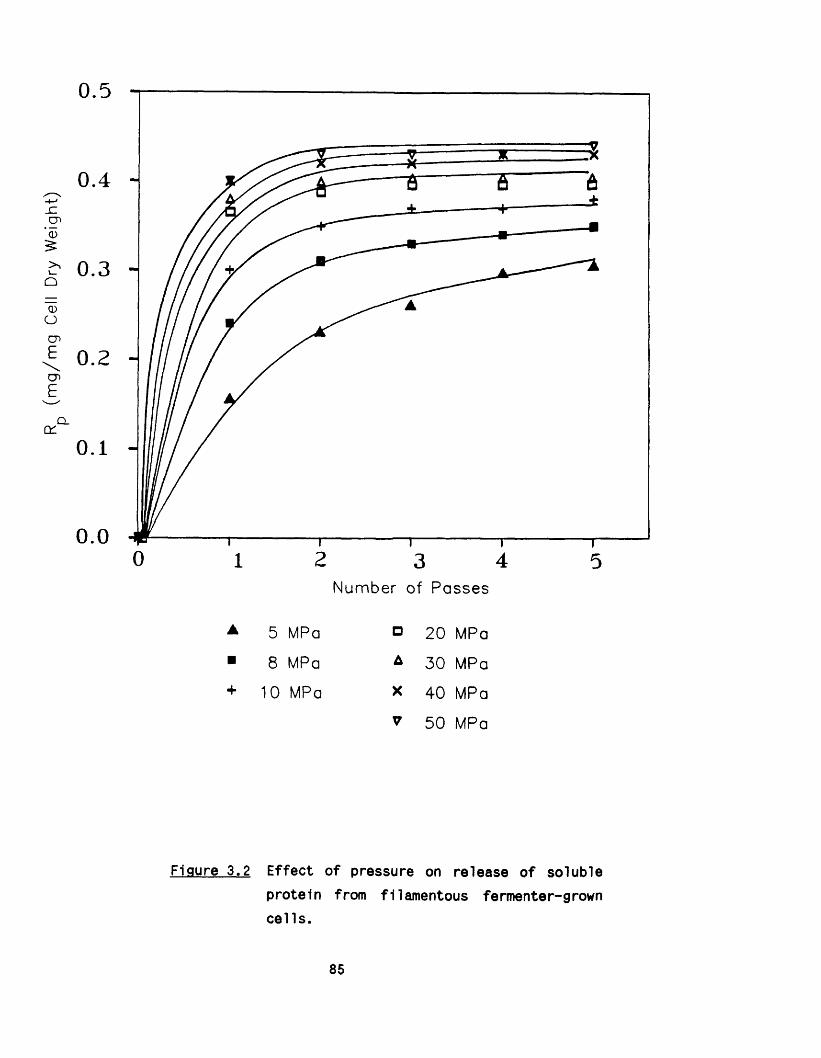
mg/
mg
Cell
Dry
Wei
ght)
Clcr
0.0 ' W --------- 1---------- 1---------- 1---------- 1---------- r0 1 2 3 4 5
Number of Passes
▲ 5 MPa □ 2 0 MPa■ 8 MPa A 30 MPa+ 1 0 MPa X 40 MPa
V 50 MPa
Figure 3.2 Effect of pressure on release of solubleprotein from filamentous ferment©r-grownce lls .
85
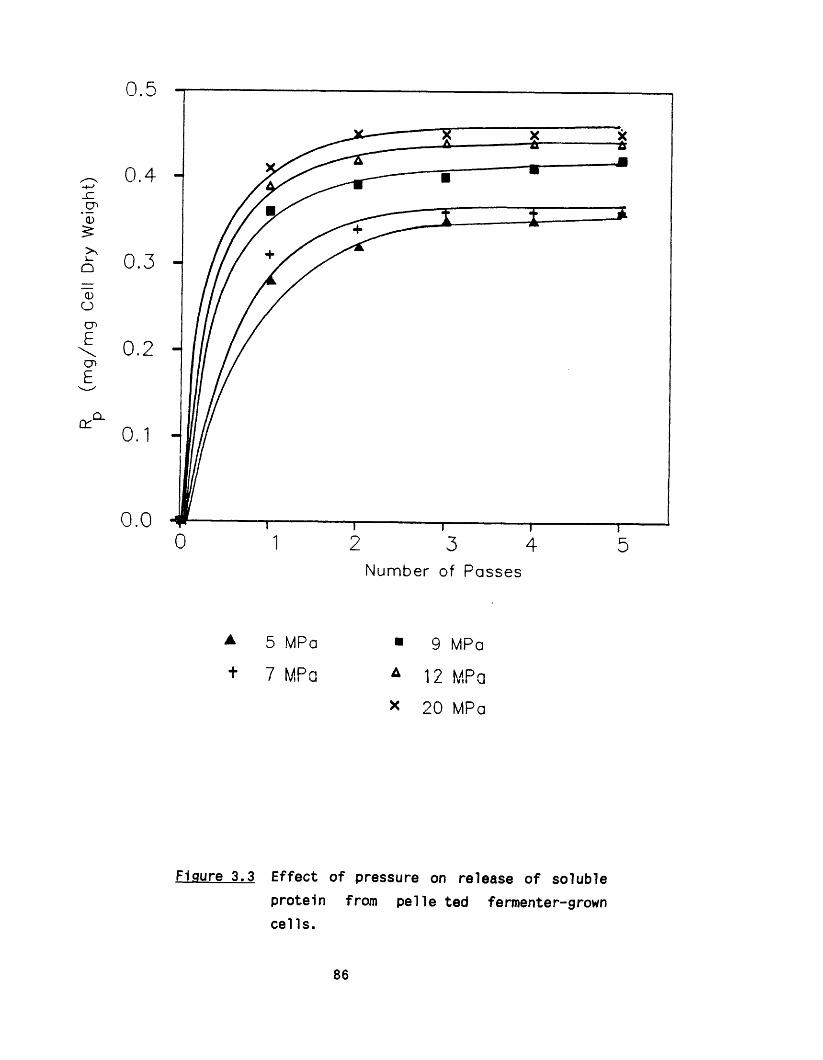
(mg/
mg
Cell
Dry
Wei
ght)
,Q _
0.0
Number of Passes
A 5 MPa
+ 7 MPa
9 MPa
12 MPa
x 20 MPa
Figure 3.3 E ffect o f pressure on release o f solubleprotein from p e lle ted fermenter-grownc e lls .
86
rtx*
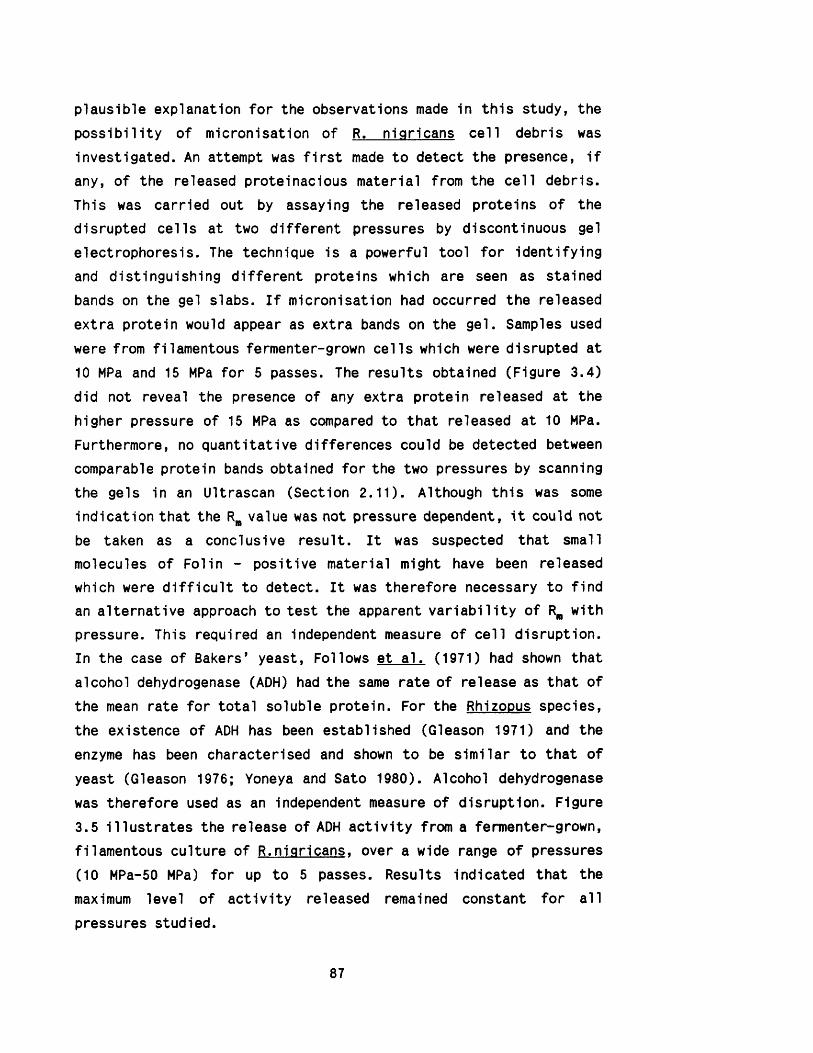
plausible explanation fo r the observations made in th is study, the
p o s s ib ility of micronisation of R. nigricans c e ll debris was
investigated. An attempt was f i r s t made to detect the presence, i f
any, of the released proteinacious material from the c e ll debris. This was carried out by assaying the released proteins of the
disrupted ce lls at two d iffe re n t pressures by discontinuous gel electrophoresis. The technique is a powerful tool fo r identify ing
and distinguishing d iffe re n t proteins which are seen as stained
bands on the gel slabs. I f micronisation had occurred the released
extra protein would appear as extra bands on the gel. Samples used
were from filamentous fermenter-grown c e lls which were disrupted at 10 MPa and 15 MPa for 5 passes. The results obtained (Figure 3 .4 ) did not reveal the presence of any extra protein released at the
higher pressure of 15 MPa as compared to that released at 10 MPa. Furthermore, no quantitative differences could be detected between
comparable protein bands obtained fo r the two pressures by scanning
the gels in an Ultrascan (Section 2 .11 ). Although th is was some
indication that the Rm value was not pressure dependent, i t could not be taken as a conclusive resu lt. I t was suspected that small molecules of Folin - positive material might have been released
which were d i f f ic u lt to detect. I t was therefore necessary to find
an a lte rn a tive approach to test the apparent v a r ia b ili ty of R,,, with
pressure. This required an independent measure of c e ll disruption. In the case of Bakers’ yeast, Follows et a l . (1971) had shown that alcohol dehydrogenase (ADH) had the same rate of release as that of the mean rate fo r to ta l soluble protein. For the Rhizopus species, the existence of ADH has been established (Gleason 1971) and the
enzyme has been characterised and shown to be s im ilar to that of yeast (Gleason 1976; Yoneya and Sato 1980). Alcohol dehydrogenase
was therefore used as an independent measure of disruption. Figure
3.5 Il lu s tra te s the release of ADH a c tiv ity from a fermenter-grown, filamentous culture of R.nigricans, over a wide range of pressures
(10 MPa-50 MPa) fo r up to 5 passes. Results indicated that the
maximum level of a c t iv ity released remained constant fo r a ll
pressures studied.
87

m a b c m
Source of cells
a 8 g/L dry wt, (15 MPa)b 13 g/L dry wt, (15 MPa)c 13 g/L dry wt, (10 MPa)m marker protein
Release of protein for up to 50 MPa was also examined but similarinconclusive results were obtained.
Figure 3.4 Gel electrophoresis of proteins releasedfrom R.nigricans at 15 MPa and 10 MPa a f ter
5 passes.
88

Enzy
me
Act
ivity
(Uni
ts
/ mg
C
ell
Dry
Wei
ght)
4.0
2.0
0
0.00 9 4
Number of Passes
+ 10 MPa
□ 20 MPa
A
X
7
30 MPa
40 MPa
50 MPa
Figure 3.5 E ffect of pressure on release of ADHa c tiv ity from filamentous fermenter-grownc e lls .
89

3.2 E ffect of ce ll concentration
Cell concentration was reported to have no e ffec t on the kinetics of disruption of u n ice llu la r microorganisms (Hetherington e t a l. 1971;
Brookman 1974). The disruption of filamentous microorganisms, on the
other hand, may be affected, in the case of high ce ll concentration, by the network structure of the c e lls resulting in the blockage of the equipment (Edebo 1983, Thomas 1988). I t was therefore necessary
to investigate the e ffe c t of c e ll concentration in the system under study. Figure 3.6 shows that filamentous fermenter-grown ce ll concentrations in the range 7.7 g/L to 20 g/L (dry weight of c e lls )
did not influence the disruption k inetics observed. The ce ll concentration, however, could not be Increased beyond the upper l im it of 22 g/L due to homogeniser blockage. The experiment was
repeated with pelleted c e lls in an attempt to increase th is lim it . A maximum of 30 g/L (dry weight of c e lls ) was achieved p rio r to
blockage.
3.3 E ffect of up-stream processing conditions
Although i t was not the aim of th is study to investigate and
optimise fermentation and harvesting conditions, several aspects of these processes were found to be of importance in the disruption of R.nigricans.
3.3.1 Cell growth
Cells were grown in d iffe re n t size vessels (Section 2 .5 .1 .1 ) ranging from 10 L to 100 L (working volume). Appendix A describes
the fermentations carried out in d e ta il. I t was found that w hilst
the disruption characteristics of c e ll biomass obtained from 15 L and 30 L fermentations were consistent, the filamentous c e lls grown
in the p ilo t scale 100 L vessel demonstrated d iffe re n t properties.
90

mg/
mg
Cel
l Dr
y W
eigh
t)0.5
0.4
3
nz .
0.00 2 4
NUMBER OF PASSES
x 7.7 g / L o 15.9 g / L
a 11.7 g / L + 17.9 g / L
■ 20.0 g /L
Figure 3.6 E ffect of c e ll concentration on release of soluble protein from fermenter-grown c e lls
at 20 MPa.
91
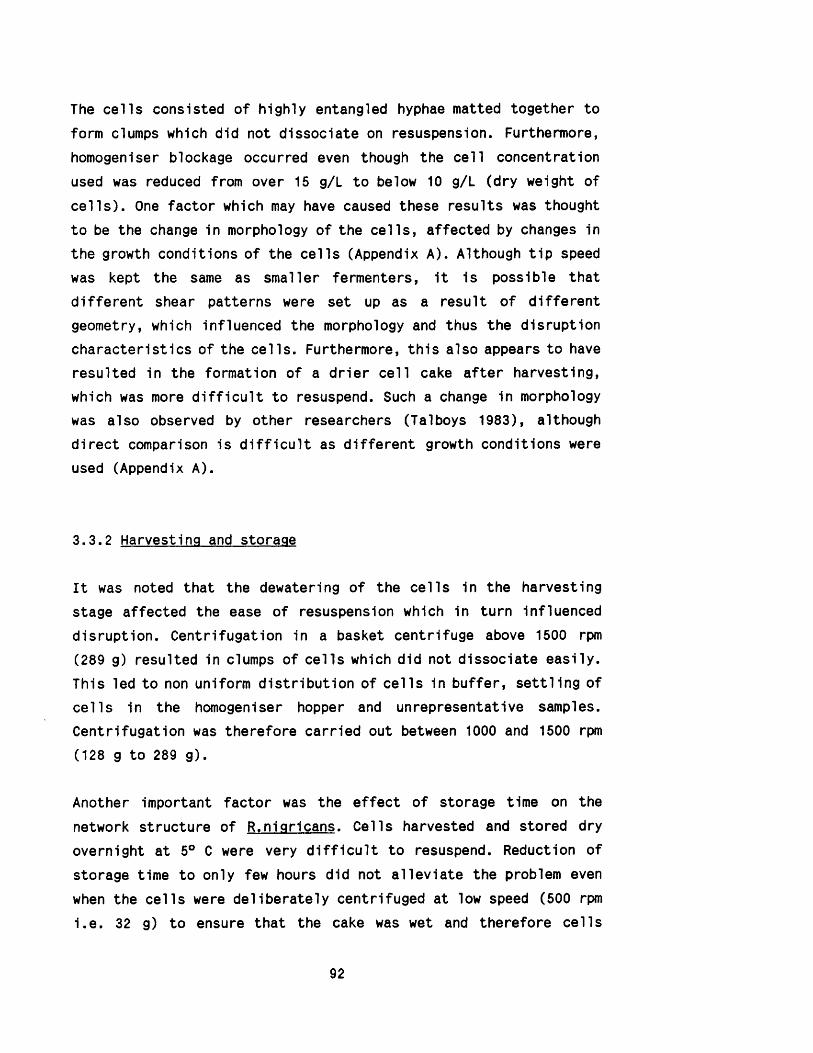
The c e lls consisted of highly entangled hyphae matted together to
form clumps which did not dissociate on resuspension. Furthermore, homogeniser blockage occurred even though the c e ll concentration
used was reduced from over 15 g/L to below 10 g/L (dry weight of c e lls ) . One factor which may have caused these results was thought to be the change in morphology of the c e lls , affected by changes in
the growth conditions of the c e lls (Appendix A). Although t ip speed
was kept the same as smaller fermenters, i t is possible that d iffe re n t shear patterns were set up as a resu lt o f d iffe re n t
geometry, which influenced the morphology and thus the disruption
characteris tics of the c e lls . Furthermore, th is also appears to have
resulted in the formation of a d r ie r ce ll cake a fte r harvesting, which was more d i f f ic u l t to resuspend. Such a change in morphology
was also observed by other researchers (Talboys 1983), although
d ire c t comparison is d i f f ic u l t as d iffe re n t growth conditions were
used (Appendix A).
3 .3 .2 Harvesting and storage
I t was noted that the dewatering of the c e lls in the harvesting
stage affected the ease of resuspension which in turn Influenced
disruption. Centrifugation in a basket centrifuge above 1500 rpm
(289 g) resulted in clumps of c e lls which did not dissociate eas ily . This led to non uniform d is trib u tio n of c e lls 1n buffer, s e ttlin g of c e lls in the homogeniser hopper and unrepresentative samples. Centrifugation was therefore carried out between 1000 and 1500 rpm
(128 g to 289 g).
Another important facto r was the e ffec t of storage time on the
network structure of R .nigricans. Cells harvested and stored dry
overnight at 5° C were very d i f f ic u lt to resuspend. Reduction of storage time to only few hours did not a lle v ia te the problem even
when the c e lls were de liberate ly centrifuged at low speed (500 rpm
i .e . 32 g) to ensure that the cake was wet and therefore ce lls
92
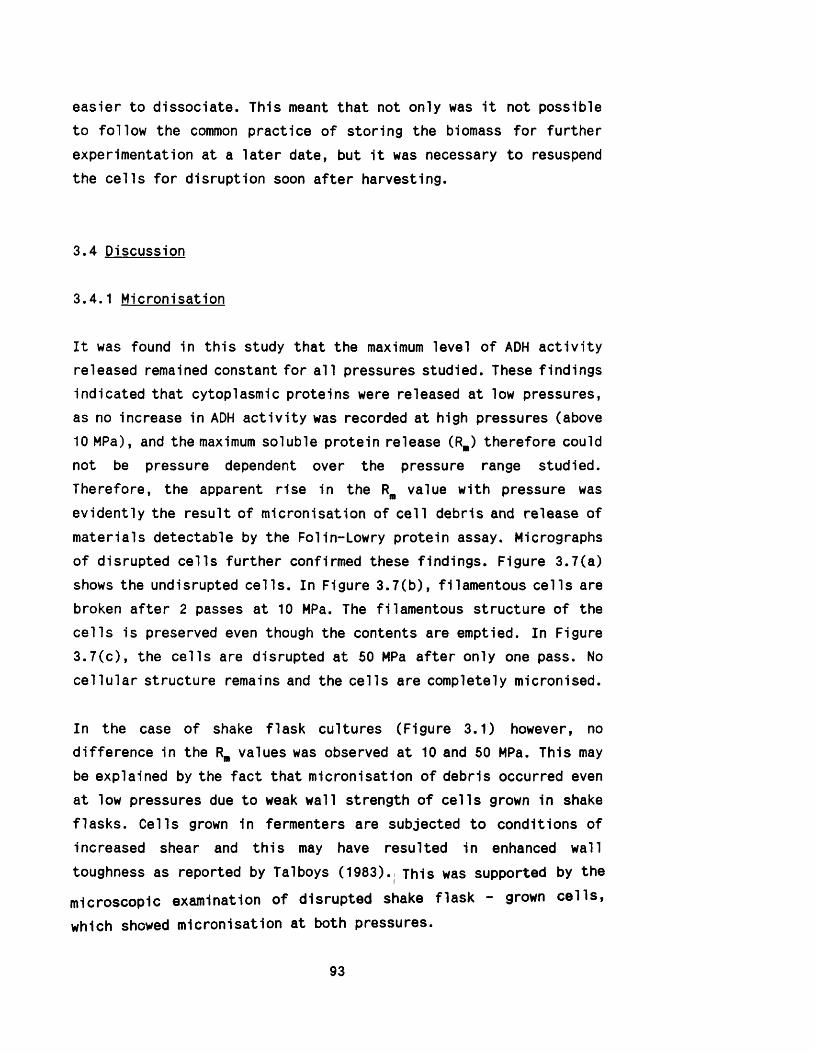
easier to dissociate. This meant that not only was i t not possible
to follow the common practice of storing the biomass fo r further
experimentation at a la te r date, but i t was necessary to resuspend
the c e lls fo r disruption soon a fte r harvesting.
3 .4 Discussion
3.4 .1 Micronisation
I t was found in th is study that the maximum level of ADH a c tiv ity
released remained constant fo r a l l pressures studied. These findings
indicated that cytoplasmic proteins were released at low pressures, as no increase in ADH a c tiv ity was recorded at high pressures (above
10 MPa), and the maximum soluble protein release (RB) therefore could
not be pressure dependent over the pressure range studied. Therefore, the apparent rise in the Rm value with pressure was
evidently the resu lt of micronisation of c e ll debris and release of m aterials detectable by the Folin-Lowry protein assay. Micrographs
of disrupted c e lls fu rther confirmed these findings. Figure 3 .7 (a ) shows the undisrupted c e lls . In Figure 3 .7 (b ), filamentous c e lls are
broken a fte r 2 passes at 10 MPa. The filamentous structure of the
c e lls is preserved even though the contents are emptied. In Figure
3 .7 (c ) , the c e lls are disrupted at 50 MPa a fte r only one pass. No
c e llu la r structure remains and the ce lls are completely micronised.
In the case of shake flask cultures (Figure 3 .1 ) however, no
difference in the Rm values was observed at 10 and 50 MPa. This may
be explained by the fa c t that micronisation of debris occurred even
at low pressures due to weak wall strength of ce lls grown in shake
flasks. Cells grown 1n fermenters are subjected to conditions of increased shear and th is may have resulted in enhanced wall
toughness as reported by Talboys (1983)., This was supported by the
microscopic examination of disrupted shake flask - grown c e lls ,
which showed micronisation at both pressures.
93
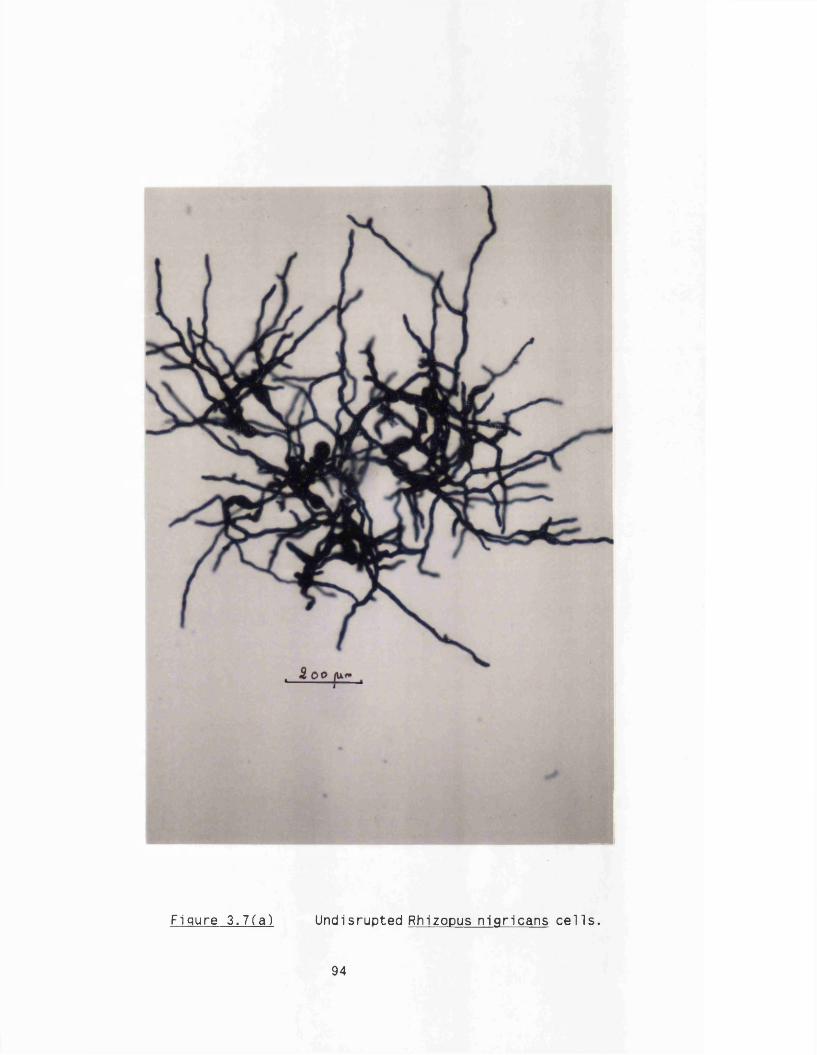
Figure 3.7(a) Undisrupted Rhizopus nigricans cells .
94

Figure 3 .7(b) Disrupted Rhizopus nigricans c e l ls at
10 MPa, 2 passes,
x 100 magnif ication
95
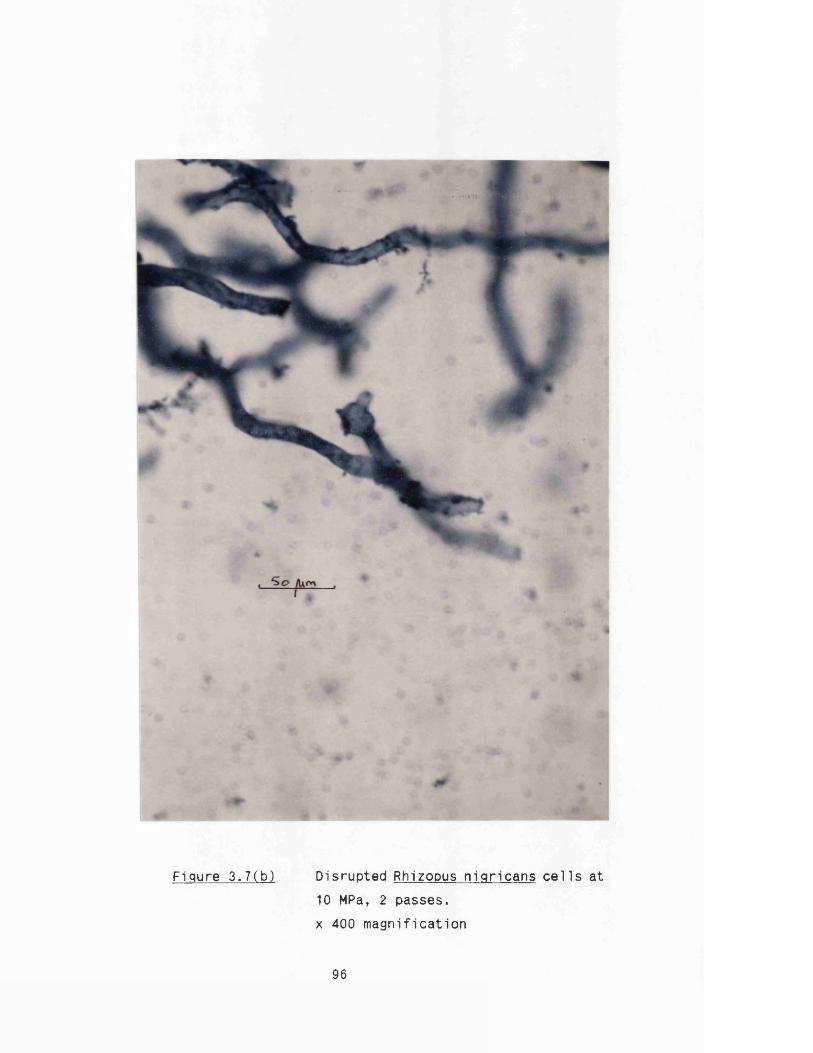
Figure 3 .7(b) Disrupted Rhizopus nigricans c e l ls at
10 MPa, 2 passes,
x 400 magnif ication
96
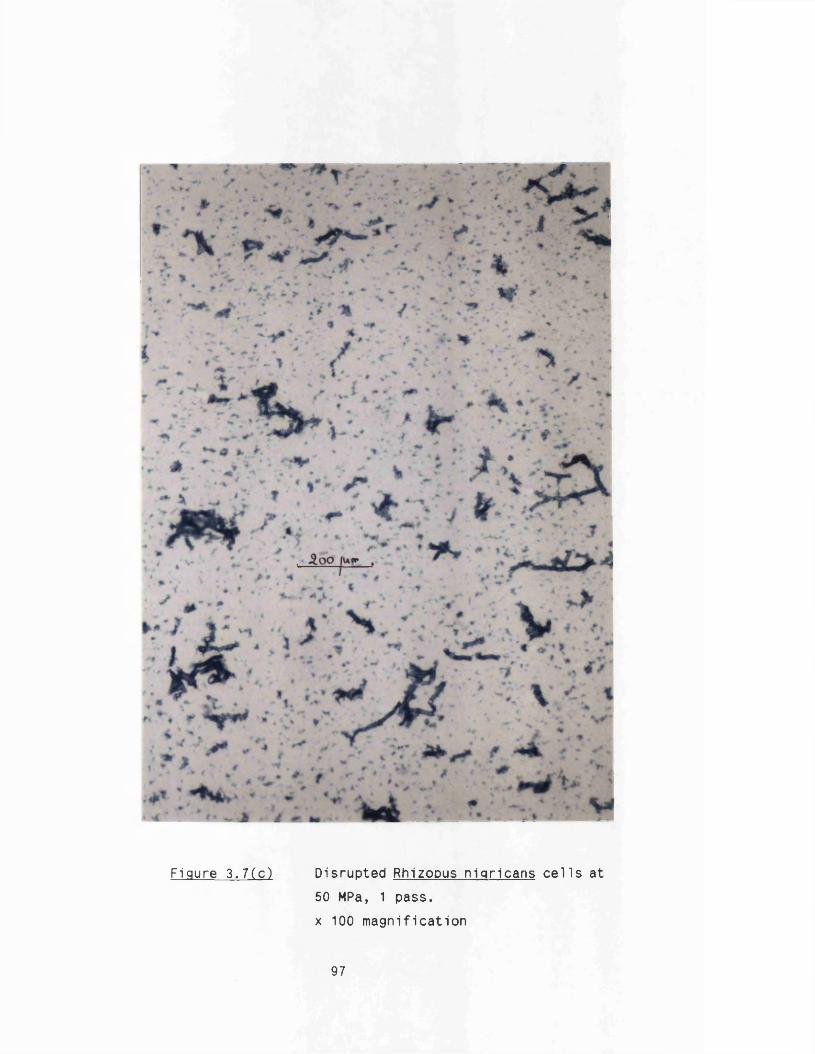
Figure 3 .7 (c ) Disrupted Rhizopus nigricans c e l ls at
50 MPa, 1 pass,
x 100 magnif ication
97
3 .4 .2 Cell related conditions
The major e ffe c t of c e ll concentration was not on disruption
kinetics observed but on structural characteristics of the
suspension. Above 20-22 g/L (c e ll dry weight), c e lls formed closely
intertwined structures which easily settled into c e llu la r mats
blocking the homogeniser. For pelleted c e lls i t was possible to
disrupt the c e lls at up to a maximum of 30 g/L (c e ll dry weight) prio r to blockage. P e lle ts form homogeneous suspensions s im ilar to
those of u n ice llu la r microorganisms. L i t t le in teraction exists
between these c e lls , which may avoid blockage u n til re la tiv e ly high
concentrations are reached. The morphology and the structural characteris tics of Rhizopus nigricans were affected by growth
conditions in the fermenter and by harvesting parameters. Further
study of these effects was beyond the scope of th is study, but may
be required to fu rther increase the understanding of the behaviour of filamentous microorganisms in downstream processes.
3 .4 .3 Disruption k inetics
The study of homogenisation of Rhizopus nigricans showed that the
kinetics of disruption of th is filamentous fungus d if fe r
s ig n ific a n tly from those of u n ic e llu la r microorganism as examined by
previous researchers (Hetherington e t a l. 1971; gray e t a l . 1973) 1n
that the soluble protein release was a weak function of pressure. Other features of the kinetics which were shared with such
u n ice llu la r microorganisms as bakers’ yeast s t i l l showed
characteristics specific to filamentous c e lls . Cell concentration
was one such feature. I t did not a ffec t the disruption k inetics . However, homogeniser blockage occurred at re la tiv e ly low
concentrations. With bakers’ yeast, concentrations as high as 224
g/L (c e ll dry weight) have been reported (Brookman 1974) without equipment blockage.
98

One aspect of c e ll disruption largely neglected in the open
lite ra tu re is the e ffe c t of mechanical parameters, namely valve
assembly configuration, on the disruption of both u n ice llu la r and
filamentous microorganisms (Section 1 .2 .4 .1 ) . In th is study attempts
were made to redress the balance by examining the consequence for
disruption of both types of c e lls of changes in homogeniser valve
unit geometry. Thus, the objective was to better understand the
rupture mechanism and the performance of homogenisers fo r the
purpose of ce ll disruption. The results obtained are reported in the
following chapter.
99

4. SIGNIFICANCE OF MECHANICAL PARAMETERS IN CELL DISRUPTION
The part of the high pressure homogeniser equipment involved in ce ll disruption is the valve unit assembly (Section 1 .1 .2 .2 ) . An
essential feature 1n studying the e ffe c t of equipment configuration
on c e ll rupture was therefore the precise characterisation of the
geometry of the valve u n it.
4.1 Valve unit characterisation
The valve unit was housed in the homogeniser block assembly and
comprised a valve seat, a valve rod and an impact ring. As explained
in Section 1 .1 .2 .2 , on the power stroke of the piston, the
suspension was forced between the valve seat and the valve rod and
impinged on the impact ring on e x it . The pressure was adjusted by
means of a spring loaded handwheel set against the valve rod.
In the experiments carried out in th is study, a range of valve
geometries were examined (Section 2 .8 .2 , Table 2 .1 ). This included
three types of knife-edge units designated as CRF, CD and KE
respectively (Figure 4 .1 (b -d )) and a f la t valve unit (FV) (Figure4.1 (e ) ) . A ll these valve seats were used with a f la t valve rod. Further experiments were carried out with the valve seat of the CRF
unit but the valve rod was changed to a coned rod (CR) (Figure
4 .1 (a )) . The CR unit was widely used in the USA, w hilst the CRF unit was commonly used in the UK. These two valve seats have been
superseded by the CD unit (Cell Disruption) (Section 1 .1 .3 .1 ) .
100

(a) CR, Cell Rupture (coned valve Rod)
(c) CD, Celi Disruption
%
%
(b) CRF, Cell Rupture ( f la t valve rod)
%
(d) KE, K n i fe -ed g e
(e) FV, Flat Valve
7.7 J12.0
(f) CD, coned entry
v-->
All dimensions in mm.
Figure 4.1 Schematic diagram of valve units used.
101

Further experiments were undertaken where the Impact distance was
varied using a series of impact rings of varying bores together with
the valve geometry CD. Table 4.1 describes the impact distances and
respective bore sizes employed.
4.2 E ffect of valve unit geometry on disruption of R.nigricans
In i t ia l l y shake flask grown cultures of R.nigricans were disrupted
at 20 MPa using the CD and the KE valve units (Figure 4 .2 ) . No
differences could be detected between the levels of soluble protein
released when these two configurations were used. Given the weak
dependence of disruption on pressure for th is microorganism (Section
3 .4 .3 ) , i t was thought that a lower pressure of 10 MPa should be
used to better demonstrate the e ffe c t of d iffe re n t valve geometries. Figure 4.3 il lu s tra te s the results of soluble protein release at 10
MPa using CD, KE and FV valves. S im ilar results as before were
obtained for the former two valve units. However, the FV un it did
not appear to perform as w ell. The f a l l in the soluble protein
content a fte r several passes may be attribu ted to the d ilu tio n
e ffe c t caused by the addition of buffer a fte r each pass (thus
avoiding damage to the homogeniser when the suspension volume was
lim ited (Section 2 .8 .3 ) ) , specially as the in i t ia l ce ll concentration of the suspension was already low (8 g/L dry weight). In order to corroborate the above findings, fermenter-grown c e lls
which were less fra g ile than shake flask grown cultures (Section
3 .4 .1 ) were used. Results are shown in Figure 4 .4 . In a ll cases a
standard impact ring was used.
I t should be noted that at th is stage of experimentation, other
valve units illu s tra te d in Figure 4.1 were not tested as they were
not yet made available by the manufacturers.
102
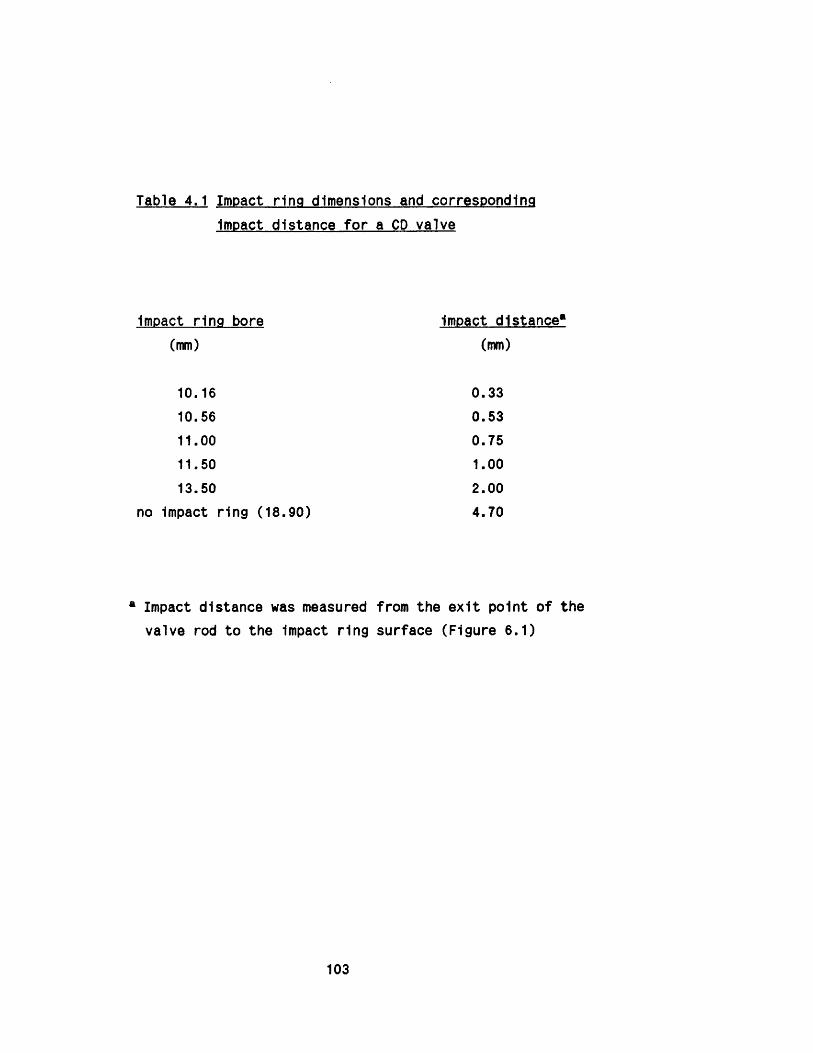
Table 4.1 Impact ring dimensions and corresponding
Impact distance fo r a CD valve
Impact ring bore
(mm)
10.1610.5611.00
11.5013.50
no impact ring (18.90)
impact distance*
(mm)
0.330.530.751.00
2.00
4.70
a Impact distance was measured from the e x it point of the
valve rod to the impact ring surface (Figure 6 .1 )
103

(mg/
mg
Cell
Dry
Wei
ght)
0.4
0.3
0.2
0.00 2 4
Number of Passes
□ KE
A CD
Figure 4.2 E ffect of valve geometry on disruption ofshake flask-grown Rhizopus nigricans at 20MPa.
104
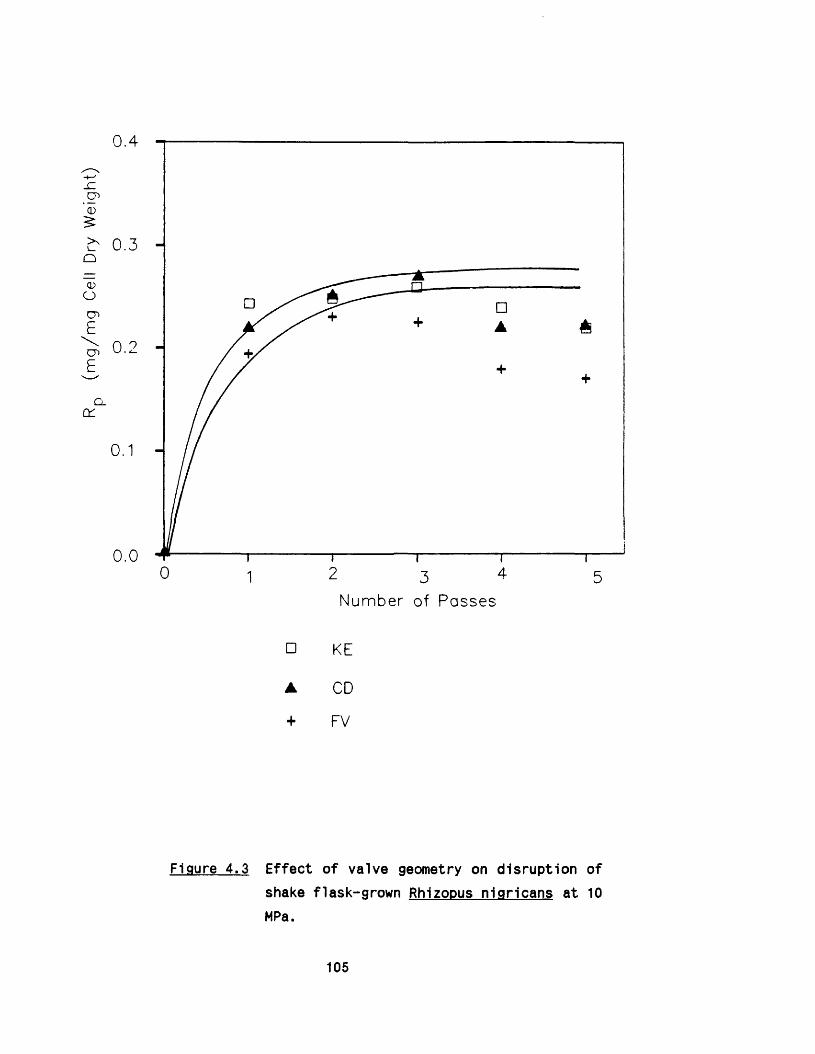
g/m
g Ce
ll Dr
y W
eigh
t)
0.4
0.3
0.2
0.00 2 4
Number of Passes
□ KE
A CD
+ FV
Figure 4.3 E ffect of valve geometry on disruption ofshake flask-grown Rhlzopus nigricans at 10MPa.
105

(mg/
mg
Cel
l Dr
y W
eigh
t)
0.4
0.3
0.2
0.00 1 2 3 4 5
Number of Passes
□ KE
A CD
+ FV
Figure 4.4 E ffect of valve geometry on disruption offermenter-grown Rhizopus nigricans at 10MPa.
106

4.3 E ffect of impact distance on disruption of R.nigricans
On e x it from the homogeniser, the suspension impinged on an impact ring which also served to protect the wall of the block from wear. To assess the e ffec t of impingement on the disruption of R.nigricans, following a s im ilar rationale as that in the above
experiments, c e lls from both shake flask and fermenter sources were
disrupted at 10 MPa using a CD valve unit with and without an impact
ring (Figures 4.5 and 4 .6 ) . S im ilar results were observed fo r both
types of cultures. The yields obtained when the Impact ring was
present was higher than when i t was removed. The possible reason fo r
the f a l l in the protein content of shake flask cultures a fte r
several passes is given in Section 4.2 above.
4.4 Discussion
The results of disruption with d iffe re n t valve unit configurations
indicated that impact distance was a s ig n ifica n t facto r in the
rupture of the filamentous R. nigricans c e lls . Less soluble protein
was released when the impact ring was removed i . e . , increasing the
impact distance from 0.75 mm to 4.70 mm, w hilst keeping the valve
geometry constant. Changing of valve geometry did not appear to have
affected the disruption s ig n ific a n tly . The FV unit exhibited poorer
disruption characteristics than e ith e r KE or CD valves; although the
e ffe c t was marginal.
In view of the special disruption k inetics displayed by R .nigricans,
i t was d i f f ic u lt to in fe r from the findings in the above sections
what e ffe c t mechanical parameters such as valve un it configuration
might have on u n ice llu la r microorganisms. I t was therefore decided
to examine the corresponding disruption characteristics of bakers’ yeast since i t was a well defined, reproducible u n ice llu la r
microorganism.
107

(mg/
mg
Cel
l Dr
y W
eigh
t)
0.4
0.3
0.2
Q_
0.00 2 4
Number of Passes
A CD, standard impact ring, 11.00 mm bore
A CD, no im pact ring
Figure 4.5 E ffect of impact distance on disruption ofshake flask-grown Rhizoous nigricans at 10MPa.
108

(mg/
mg
Cel
l Dr
y W
eigh
t)
0.4
0.3
0.2
0.00 2 4 531
Number of Passes
A CD, standard im pac t ring, 11.00 mm bore
A CD, no im pac t ring
Figure 4.6 E ffect of impact distance on disruption of
fermenter-grown Rhizopus nigricans at 10MPa.
109

4.5 Effect of valve unit geometry on disruption of bakers’ yeast
Bakers* yeast ce lls were disrupted at 46 MPa for up to fiv e passes
using fiv e valve unit configurations described in Figure 4 .1 (a -e ). A ll units were f it te d with a standard size impact ring. The results
are illu s tra te d in Figure 4.7 and summarised in Table 4 .2 . Maximum
performance was observed with the knife-edge (KE) configuration
w hilst the valve geometries consisting of the f la t valve seat and
f la t valve rod (FV and CRF) gave s im ilar lowest yields. Changing the
valve rod to a cone shape (CR) resulted in considerably higher
protein release, comparable to that obtained fo r the CD unit which
had a reduced seat surface. This las t finding did not support the
claim by the manufacturers that CD unit performed as much as 50 %
better than CR unit a fte r one pass at a s im ilar pressure (APV-Gaulin
1985). The results, however, confirmed the general findings of the
pioneering work carried out by Hetherington et a l . (1971) in which
knife-edge geometry was reported to perform better than f la t valve
un it.
4.5.1 Effect of geometry of valve seat central o r if ic e
In order to assess whether the geometry of the central o r if ic e of the valve seat Influenced ce ll d isruption, a unit was used
consisting of identical knife-edge dimensions to those of the
ceramic CD unit except that the entry o r if ic e was widened from 5 mm
diameter to 12 mm, into a conical shape (Figure 4 . 1 ( f ) ) . The amount of soluble protein released at 46 MPa fo r up to f iv e passes did not d if fe r from those obtained under the same conditions with the CD
unit (Figure 4 .8) . C learly the geometry of the central o r if ic e did
not contribute to the disruption process.
110
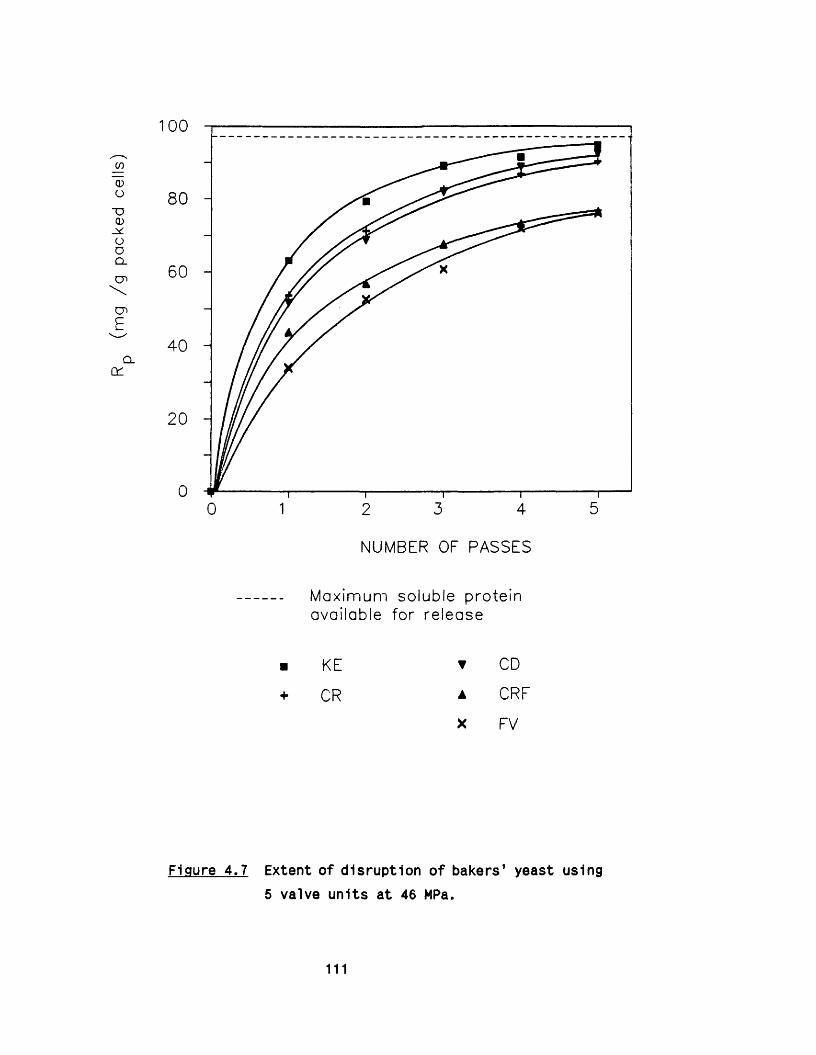
(mg
/g
pack
ed
cells
)100
80
60
40
20
530 1 2 4
NUMBER OF PASSES
Maximum soluble proteinavailable for release
■ KE ▼ CD
+ CR ▲ CRF
X FV
Figure 4.7 Extent of disruption of bakers’ yeast using
5 valve units a t 46 MPa.
111
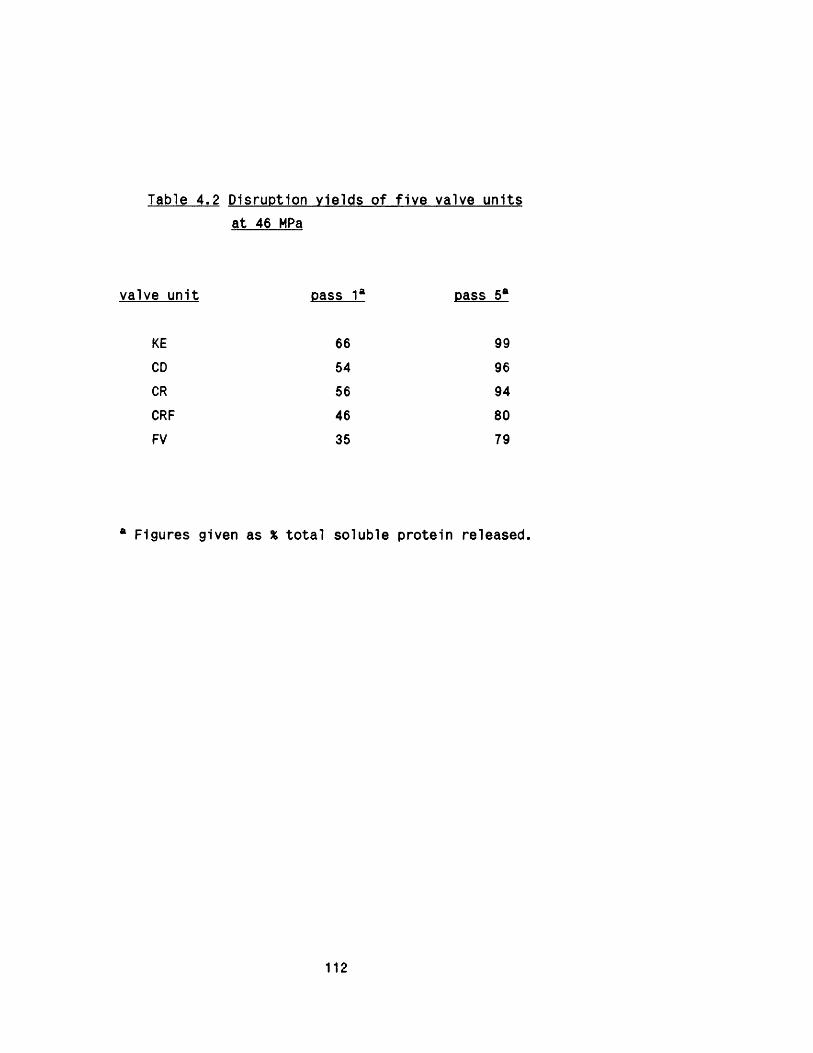
Table 4.2 Disruption yields of f iv e valve unitsat 46 MPa
valve un it
KECDCRCRFFV
pass 1a
66
54564635
pass 5a
9996948079
a Figures given as % to ta l soluble protein released.
112

(mg
/g
pack
ed
cells
)100
80
60
40
20
50 32 4
NUMBER OF PASSES
▼ CD
□ CD, (coned entry)
Figure 4.8 Effect of geometry of valve seat centralo r if ic e on disruption of bakers’ yeast at 46MPa.
113

4.6 Effect of impact distance on disruption of bakers* veast
To assess the e ffe c t of Impingement on the disruption of bakers’ yeast, the CD unit was tested with Impact rings of varying bore
sizes (10.16 mm to 13.5 mm corresponding to impact distances 0.33 mm
to 2.00 mm respectively (Table 4 .1 ) . The standard bore size was 11.0
mm. Figure 4.9 il lu s tra te s the variation of soluble protein release
with the impact ring bore size. The smaller the bore, the more
e ff ic ie n t the disruption became. The removal of the impact ring
(corresponding to 4.7 mm impact distance) resulted in the lowest release of soluble protein from c e lls . In Figure 4.10 the e ffec t of impact distance on the extent of disruption is shown. Maximum
disruption was obtained over a range of impact distances
corresponding to 10.16 mm to 11 mm bore sizes. The extent of disruption dropped markedly as the impact distance was increased.
The importance of the impact ring in the disruption process was
fu rther demonstrated by comparing the extent of disruption of ce lls
using an FV unit ( i . e . the least e ffec tive of geometries) with a
standard impact ring, and a CD unit (a highly e ffec tive geometry) with no impact ring (Figure 4 .11 ). The absence of an Impact ring for
the CD unit resulted in over 50% less disruption a fte r the f i r s t
pass even though the geometry of the valve unit was shown to be
superior (Figure 4 .7 ).
4.7 E ffect of scoring of the valve seat
The ceramic material of the CD valve u n it, even though resistant to
every day wear, was b r i t t le and therefore prone to scoring. In the
experiments carried out, new sets of valve units were employed for
a ll geometries, and regular inspections ensured that defective
components were not used. Nevertheless, since an already flawed CD
valve seat was made availab le by the manufacturers, i t was of in terest to check the performance of th is p a rtic u la r u n it.
114

(mg/
g pa
cked
ce
lls
)
00
80
60
40
20
00 2 43
NUMBER OF PASSES
Impact ring bore d iameter and im pac t distances are:
A 1 0 ,. 1 6 mm; 0.33 mm
X 10.56 mm; 0.53 mm■ 1 1 .. 0 0 mm; 0.75 mm (standard)
+ 1 1 ,,50 mm; 1 . 0 0 mm
♦ 13.50 mm; 2 . 0 0 mm
T no impact ring (i .e. 18.90 m m ); 4.70 mm
Figure 4.9 Extent of disruption of bakers’ yeast usinga CD unit with d if fe re n t Impact rings at 46MPa.
115
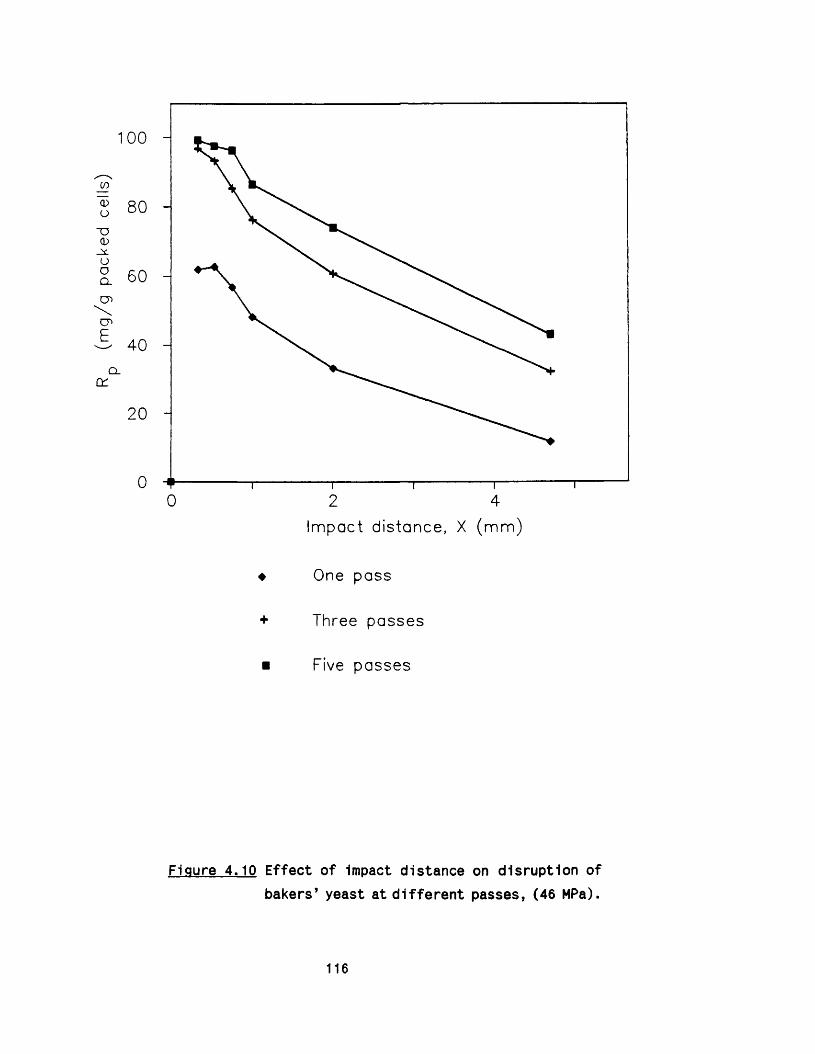
(mg/
g pa
cked
ce
lls)
100
80
60
40Q _
DC
20
0
Figure 4.10 Effect of impact distance on disruption ofbakers’ yeast at d if fe re n t passes, (46 MPa).
0 2 4
Impact distance, X (m m )
♦ One pass
+ Three passes
■ Five passes
116

(nng
/g
pack
ed
cells
)
80
60
40
20
0 ■ t -------------------------- 1----------------------------- 1------------------------------1----------------------------- 1------------------------------r
0 1 2 3 4 5
NUMBER OF PASSES
CD, standard impact ring
FV, standard impact ring
CD, no impact ring
Figure 4.11 Comparison between the e ffe c t o f impact ring
and valve geometry fo r bakers’ yeast, (46
MPa).
117
Figures 4 .12(a) and 4.12(b) show the photographs of the perfect and
imperfect valve seats respectively. The place where the seat was
chipped 1s shown with an arrow. I t indicates that the defect was on
the inner edge of the seat. The amount of soluble protein released
fo r these two valves were compared (resu lts not shown). No
differences were observed Indicating that the entry zone geometry
did not a ffec t the disruption of the c e lls .
118

1MTTTTTTTn
Figure 4 . 12(a) CD ceramic valve seat (perfect).
119
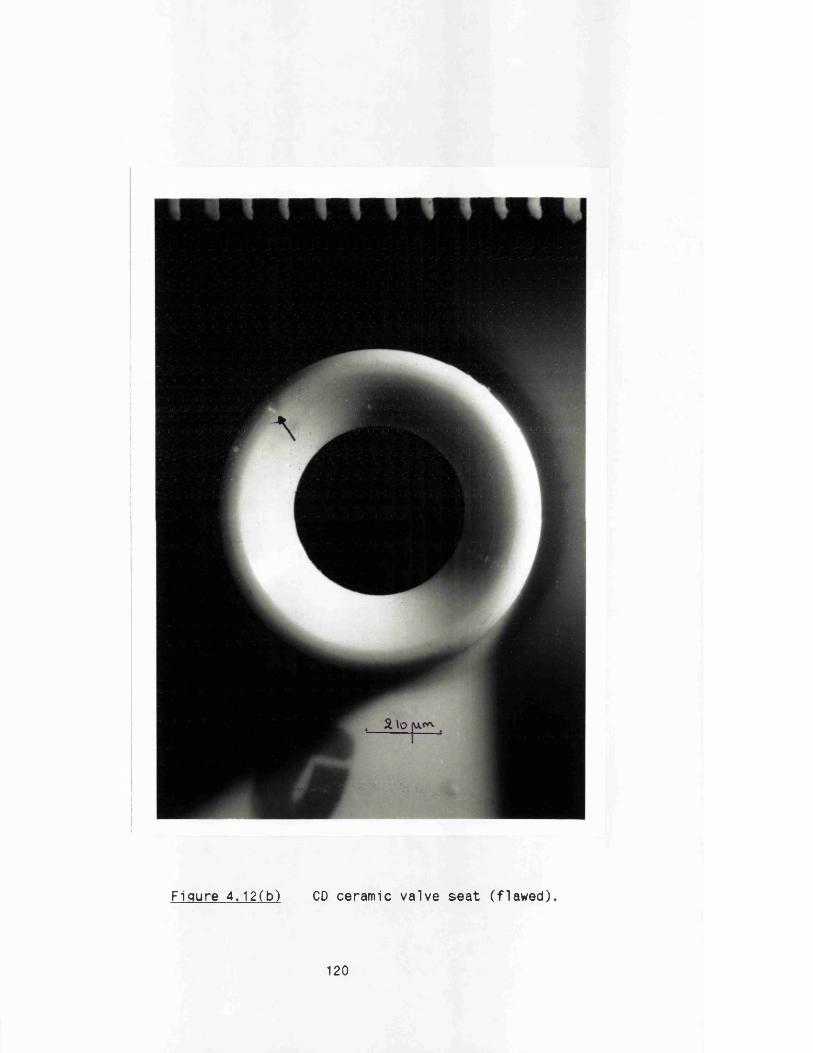
Figure 4 . 12(b) CD ceramic valve seat (flawed)
120

5. PARTICLE AND CELL DEBRIS FORMATION
The importance of characterisation of c e ll p artic les and ce ll debris
was outlined in Section 1 .4 .1 . Homogenisation 1s the downstream step
in which c e ll fragments are formed and in tra c e llu la r contents, and
on occasions partic les (e .g . inclusion bodies) are released. I t is
therefore evident that data on the resultant c e ll p artic les and
debris would provide invaluable information relevant to the
subsequent downstream processing stages.
5.1 Microsomal fractions from R.nigricans
The in terest in the microsomal fractions of R.nigricans stemmed from
the fac t that the enzyme complex progesterone 11a-hydroxylase is
believed to be located on the endoplasmic re tic u la r membrane which, upon disruption, forms microsomes (Section 1 .4 .3 ). This enzyme
complex is capable of hydroxylating progesterone and thus producing
a precursor of cortisone used in the pharmaceutical industry. In
th is part of the study an attempt was made to provide some
prelim inary information on the e ffe c t of disruption on microsomal formation.
5.1.1 Microsomal preparation
The well established laboratory scale procedure fo r microsomal preparation reported in the lite ra tu re (e .g . Talboys 1983) 1s the
d iffe re n tia l centrifugation of the c e ll homogenate. The disrupted
ce lls are spun fo r two minutes at 800 g; the resultant supernatant is then respun at 10000 g fo r 20 minutes to separate the post- mitochondrial frac tio n . This is followed by the u ltracentrifugation
121

of the supernatant at 105000 g fo r one hour. The presence of cytochrome P450, which is believed to be a constituent of the enzyme
complex, was detected by some workers (Breskvar and Hudnik-Plevnik
1981) in the 105000 g p e lle t which was thus considered as the
portion containing the enzyme bound microsomal frac tio n .
This protocol was repeated in the present study but no 11-a
progesterone a c tiv ity was detected in the microsomal p e lle t. This
was a ttribu ted to shear s e n s itiv ity of the enzyme complex (Talboys
1983). I t was thought lik e ly that one of the components of the
enzyme complex, NADPH-cytochrome P450 reductase was solubilised
during the microsomal separation process. This, according to Gosh
and Samanta (1981), is the resu lt of the dissociation of NADPH
reductase from the cytochrome P-450 during u ltracen trifugatio n . I t
was therefore decided to follow an a lte rn a tive method to minimise
the loss of enzyme a c tiv ity . This was based on reducing the number of enzyme damaging centrifugal steps and using gel f i l t r a t io n . Thus
ce lls were centrifuged at 2000 g fo r ten minutes and spun at 50000
g for 45 minutes. The supernatant was then passed through a gel f i l t r a t io n column. This method was based on work by Tangen e t a l . (1973) who developed a rapid technique fo r iso lation of liv e r
microsomes. Gel f i l t r a t io n of the post-mitochondrial supernatant had
resulted in the e lution of the microsomal fraction in the void
volume, which appeared in the f i r s t absorbance peak. The presence of
microsomal marker enzymes and cytochrome P450 was detected in th is
frac tion ; furthermore the spectra o f P450 from gel f i l te r e d samples
and control samples obtained by tra d itio n a l techniques were s im ilar. The second peak contained the solutes of the supernatant. The
authors fu rth er ju s t if ie d the v a lid ity of th e ir method on the basis
of the size of the microsomes reported by Claude (1969), which range
from 0.06 pm to 0.2 pm 1n diameter, thus allowing them to readily
pass through the spaces between the gel beads, which were estimated
to vary between 9 pm and 38 pm. In the present work, th is method was
used to separate the microsomes. Figure 5.1 shows a typ ical e lution
curve obtained. However, attempts to detect the a c tiv ity of the
122
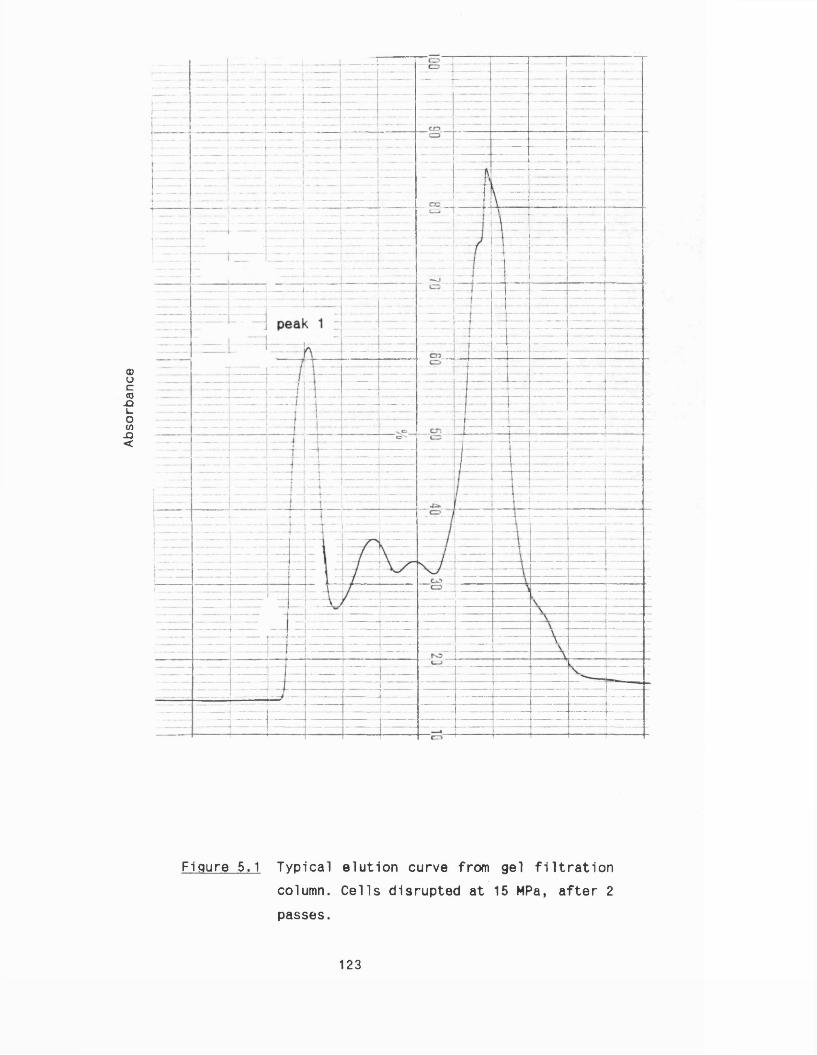
Abso
rban
ce
Figure 5.1 Typical elution curve from gel f i l t r a t io n
column. Cells disrupted at 15 MPa, a f te r 2
passes.
123

enzyme and also the presence of cytochrome P450 1n samples before
gel f i l t r a t io n and in the fractions obtained 1n the peaks were not
successful. Nevertheless, i t was decided to proceed with the
characterisation of the microsomal fractions in order to gain
insight into the e ffec t of ce ll disruption on vesicle formation.
5 .1 .2 Effect of ce ll disruption on microsomes
The in tensity d istributions of microsomal fractions from c e lls
disrupted at 15 MPa a fte r one, two and four passes through the
homogeniser were obtained (Section 2 .10 .1 ) and results compared (the
a p p lic a b ility of lig h t in tensity d is trib u tio n to p a rtic le size
measurements 1s discussed 1n Appendix B). The tran s itio n from the
f i r s t pass to the second pass indicated a reduction 1n the size of the partic les of at least 10 X (Figure 5 .2 ). However no s ig n ifican t fu rther reduction was observed from two to four passes (data not shown here). The d istributions were monomodal (but not narrow) with
a mean of 0.26 ± 0.02 pm and 0.22 ± 0.02 pm fo r one and two passes
respectively. These values were within the range reported by other
workers (Table 1 .4 ). Furthermore they provided an independent means
of confirming the findings that the in i t ia l passes through the
homogeniser were the most important in disrupting R.nigricans c e lls
(Chapter 3 ).
The in tensity d istributions from the intermediary centrifugation
steps i .e . supernatants from 2000 g and 50000 g spins were also
measured. The results showed a reduction in the size of the
p artic les a fte r the second spin (Figure 5 .3 ) . Evidently, the larger
p artic les were removed but the microsomal fractions remained,
together with smaller p a rtic le s , in the supernatant.
124

inte
nsity
ov
ersi
ze
100
80
60
fr? 4 0
20
100 150 200 300 400 600
particle size (nm)
A 1 pass
A 2 passes
Figure 5.2 In ten sity d is trib u tio n of microsomes. Cells
disrupted at 15 MPa a fte r 1 and 2 passes.
125

% in
tens
ity
over
size
120
80
60
40
20
100 150 200 300 400 600
particle size (nm)
■ 2 0 0 0 g
□ 50000 g
Figure 5.3 In ten sity d istribu tions of p artic les
obtained from the in te rm e d ia ry
centrifugation steps.Cells disrupted at 15 MPa, a fte r 2 passes.
126
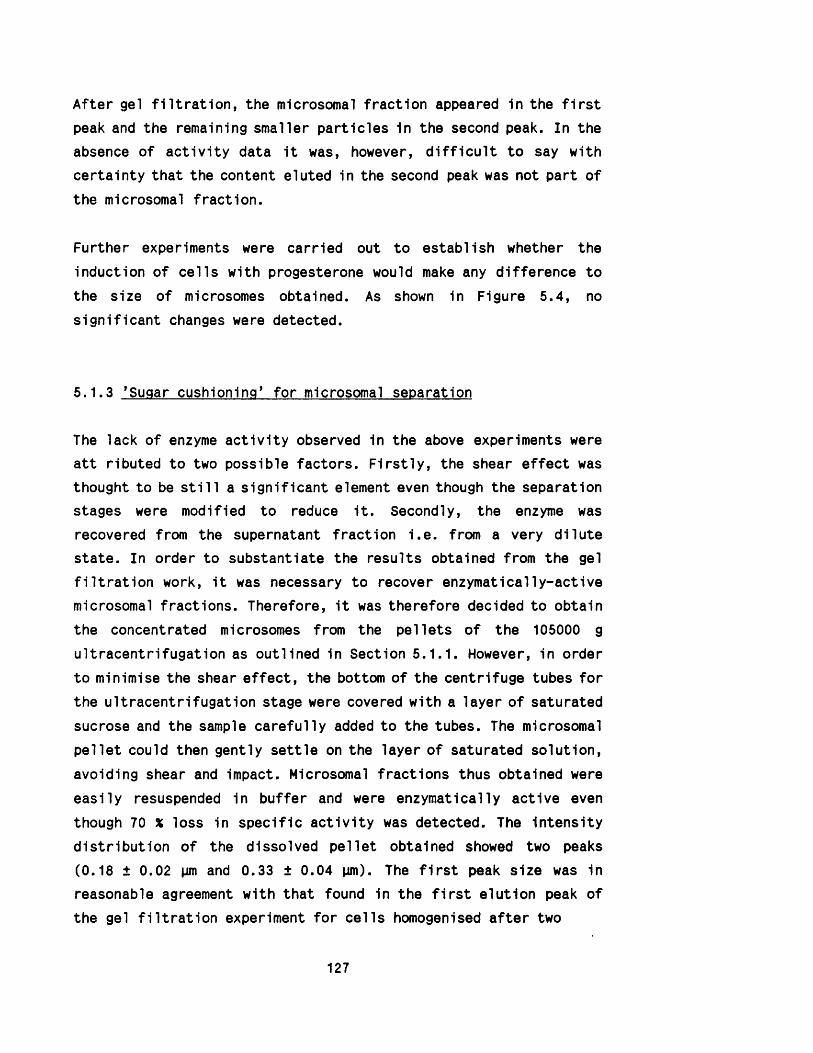
A fter gel f i l t r a t io n , the microsomal fraction appeared 1n the f i r s t
peak and the remaining smaller p artic les in the second peak. In the
absence of a c t iv ity data i t was, however, d i f f ic u lt to say with
certa in ty that the content eluted in the second peak was not part of the microsomal frac tio n .
Further experiments were carried out to establish whether the
induction of c e lls with progesterone would make any difference to
the size of microsomes obtained. As shown 1n Figure 5 .4 , no
s ig n ifican t changes were detected.
5 .1 .3 ’Sugar cushioning* fo r microsomal separation
The lack of enzyme a c tiv ity observed 1n the above experiments were
a tt ributed to two possible factors. F irs t ly , the shear e ffe c t was
thought to be s t i l l a s ig n ifican t element even though the separation
stages were modified to reduce i t . Secondly, the enzyme was
recovered from the supernatant fraction i .e . from a very d ilu te
sta te . In order to substantiate the results obtained from the gel f i l t r a t io n work, i t was necessary to recover enzym atically-active
microsomal fractions. Therefore, i t was therefore decided to obtain
the concentrated microsomes from the p e lle ts of the 105000 g
ultracentrifugation as outlined in Section 5 .1 .1 . However, in order
to minimise the shear e ffe c t, the bottom of the centrifuge tubes fo r
the u ltracentrifugation stage were covered with a layer of saturated
sucrose and the sample care fu lly added to the tubes. The microsomal p e lle t could then gently s e ttle on the layer of saturated solution, avoiding shear and impact. Microsomal fractions thus obtained were
easily resuspended in buffer and were enzymatically active even
though 70 X loss in specific a c tiv ity was detected. The In tensity
d is trib u tio n of the dissolved p e lle t obtained showed two peaks
(0.18 ± 0.02 pm and 0.33 ± 0.04 pm). The f i r s t peak size was in
reasonable agreement with that found in the f i r s t e lu tion peak of the gel f i l t r a t io n experiment fo r c e lls homogenised a fte r two
127

inte
nsity
ov
ersi
ze
120
1 0 0 %
80
60
40
20
100 150 200 300 400 600
particle size (nm)
% non —induced
# induced
Figure 5.4 In ten sity d istribu tions of microsomes
obtained from induced and non-Induced c e lls . Cells disrupted at 15 MPa, a fte r 2 passes.
128
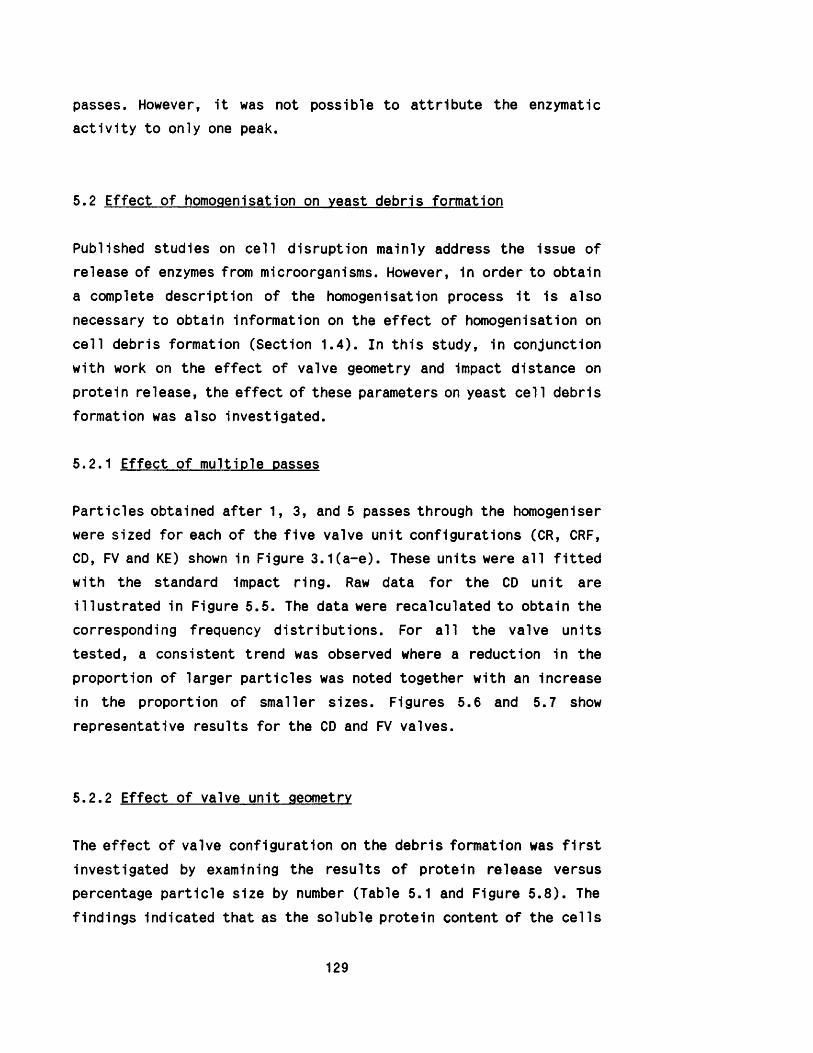
passes. However, i t was not possible to a ttr ib u te the enzymatic
a c tiv ity to only one peak.
5.2 E ffect of homogenisation on veast debris formation
Published studies on ce ll disruption mainly address the issue of release of enzymes from microorganisms. However, in order to obtain
a complete description of the homogenisation process i t is also
necessary to obtain information on the e ffe c t of homogenisation on
ce ll debris formation (Section 1 .4 ). In th is study, in conjunction
with work on the e ffec t of valve geometry and Impact distance on
protein release, the e ffe c t of these parameters on yeast ce ll debris
formation was also investigated.
5.2.1 E ffect of m ultiple passes
P artic les obtained a fte r 1, 3, and 5 passes through the homogeniser were sized fo r each of the fiv e valve unit configurations (CR, CRF, CD, FV and KE) shown in Figure 3 .1 (a -e ). These units were a ll f i t te d
with the standard Impact ring. Raw data fo r the CD un it are
il lu s tra te d in Figure 5 .5 . The data were recalculated to obtain the
corresponding frequency d istrib u tio ns . For a l l the valve units
tested, a consistent trend was observed where a reduction in the
proportion of larger partic les was noted together with an Increase
in the proportion of smaller sizes. Figures 5.6 and 5.7 show
representative results fo r the CD and FV valves.
5 .2 .2 E ffect of valve unit geometry
The e ffe c t o f valve configuration on the debris formation was f i r s t
investigated by examining the results of protein release versus
percentage p a rtic le size by number (Table 5.1 and Figure 5 .8 ) . The
findings indicated that as the soluble protein content o f the ce lls
129
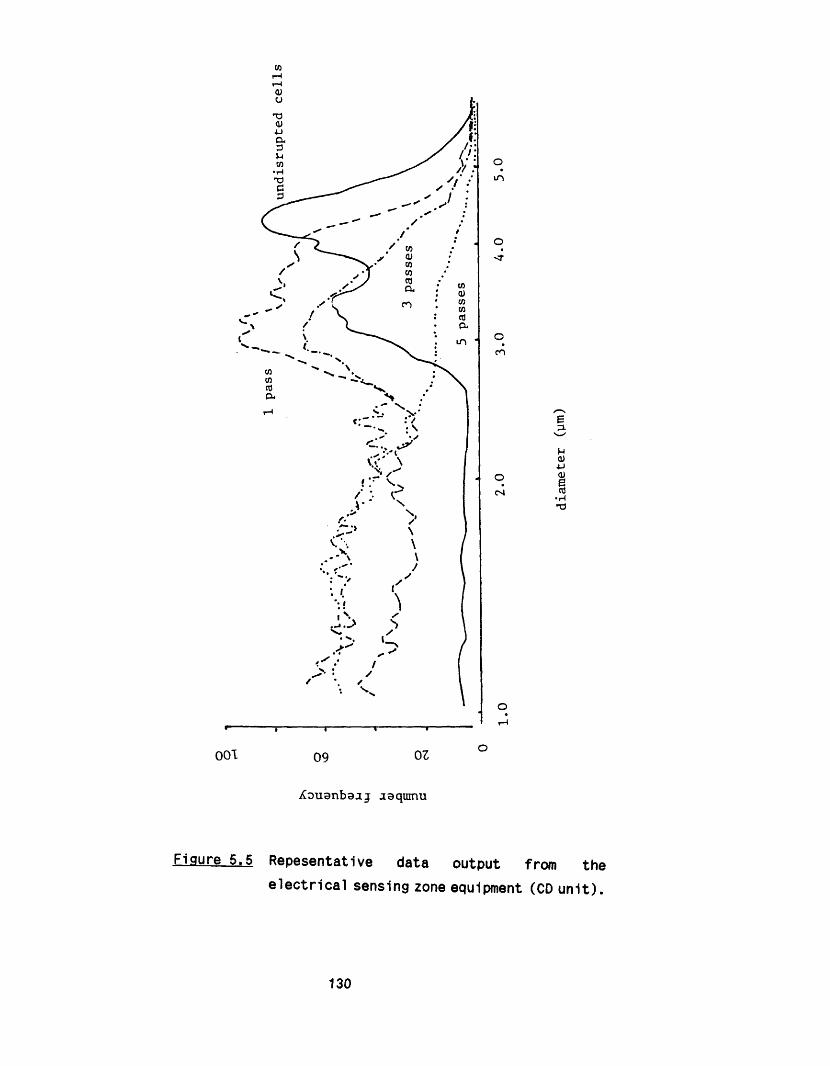
(
001
Figure 5.5
om
o<r
oCO
Bp .
VC'' '( / V
/
v. \
X
Om
M<u4-1<u§
•r4
I\ /
/
//S .
09 0Z
Xouanbajj aaqranu
Repesentative data output from the
e le c tr ic a l sensing zone equipment (CD u n it) .
130
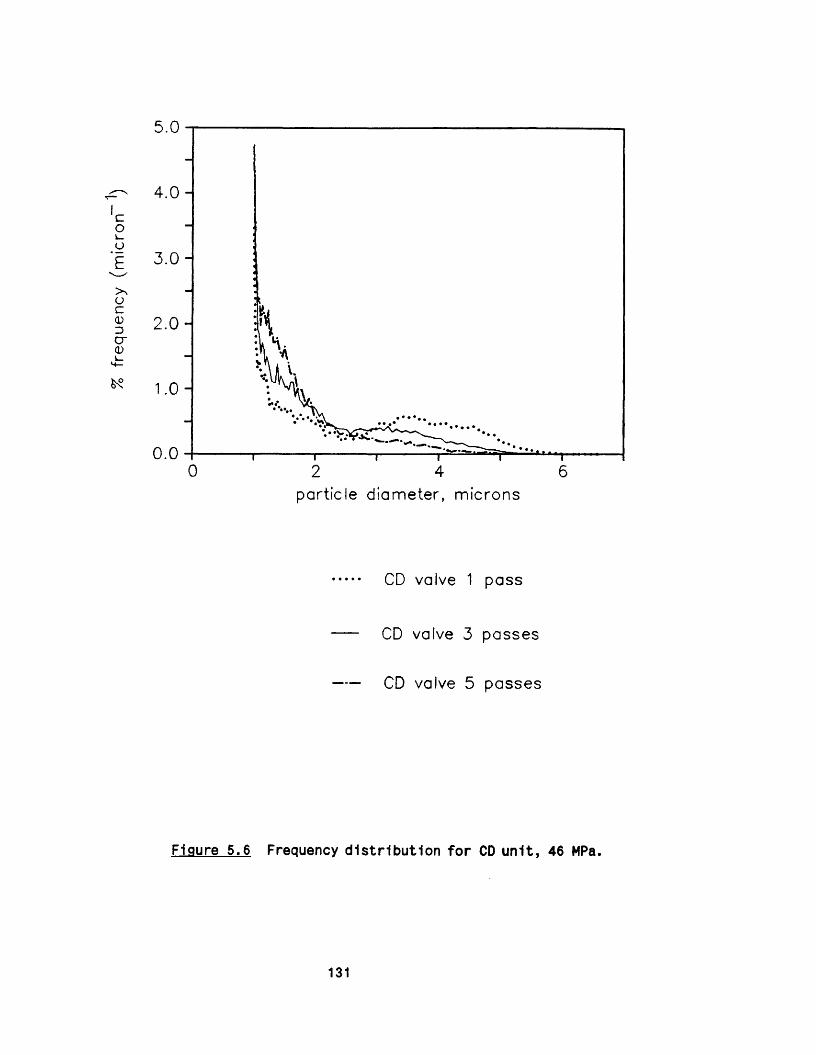
% fr
eque
ncy
(mic
ron
5.0 t
4 . 0 -
3 . 0 -
2 .0 -
0.00 2 64
partic le diameter, microns
CD valve 1 pass
CD valve 3 passes
CD valve 5 passes
Figure 5.6 Frequency d is trib u tio n fo r CD u n it, 46 MPa.
131

2.8
2 . 4 -
2.0 -
0 . 8 -
0 . 4 -
0.00 6o 4
particle diameter, microns
FV 1 pass
FV 3 passes
FV 5 passes
Figure 5.7 Frequency d is trib u tio n fo r FV u n it, 46 MPa.
132

Table 5.1 Protein release versus X p a rt ic le size (by number)
pass 1 pass 3 pass 5
valve protein %<2.5u protein %<2.5u protein %<2.5uunit (mg/g) (mg/g) (mg/g)
undisrupted 12.6 ce lls
KE 63 53 89 84 91 87
CR 64 48 83 83 90 90
CD 62 40 83 63 93 87
CRF 44 43 68 71 77 84
FV 33 24 61 44 70 50
133
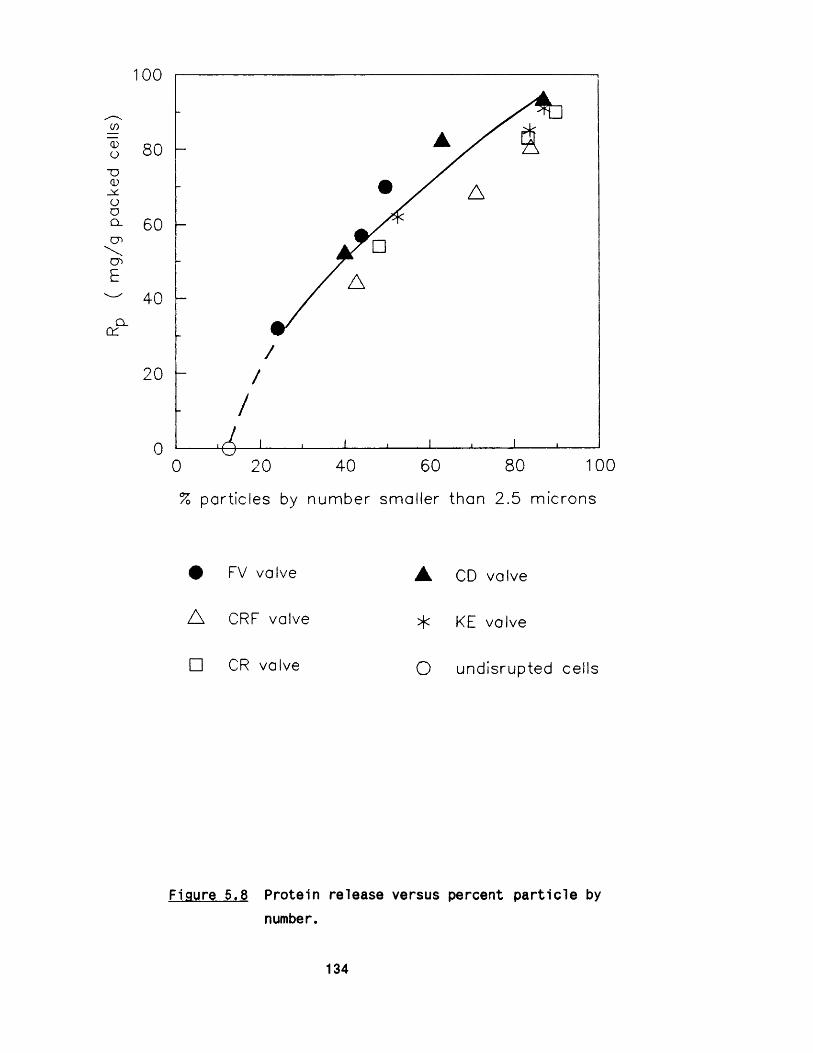
mg/
g pa
cked
ce
lls)
100
Q.
80
60
40
20
0
//
/4
0 20 40 60 80 100
% part icles by number smal ler than 2.5 microns
# FV valve
A CRF valve
□ CR valve
A CD valve
KE valve
O undisrupted cells
Figure 5.8 Protein release versus percent p a rtic le by
number.
134
Increased, the proportion of smaller sized partic les rose as w ell. Furthermore, a l l the valve geometries studied remained on the same
curve. There was a strong indication th a t although 1t may be
possible to reduce the number of passes by replacing the valve
geometry w hilst releasing the same quantity of soluble protein, the
p a rtic le size d is trib u tio n did not s h ift towards larger sizes. This
1s of importance 1n the downstream step of centrifugation where
larger partic les are more desirable as they are easier to remove
from the process stream. However, the analysis of data on the basis
of percentage p a rtic le size by number should be made with caution. At the fin e end of the p a rtic le size d is tr ib u tio n , as the lim it of op erab ility of the Instrument is approached, the results become
prone to equipment e rro r specially as the in terpreta tion of the data
by the equipment software at such a fin e level 1s not c lear. An
a lte rn a tiv e means of presenting the results was therefore sought. In
centrifugation , i t is the p a rtic le size d is trib u tio n below a
c r it ic a l size which determines the centrifuge capacity. Representative values are best taken at the fin e end of the size
d is trib u tio n , fo r example where 90, 95, or 99 % of the p artic les are
of greater size; i .e . d90, d95 or d99 respectively. Table 5.2 and
Figures 5 .9 (a -d ) summarise the results of percentage volume oversize
distrib u tio ns fo r the d iffe re n t valve units under study. In general, 1t may be argued that Irrespective of the type of valve geometry
used, higher protein release was related to a higher proportion of smaller p artic les . However, the comparative merits of using fewer
passes with d iffe re n t types of valves needed fu rther scrutiny. This
was Investigated by examining the frequency and cumulative volume
oversize d istribu tions of valve units which showed s im ilar levels of protein release at d iffe re n t number o f passes through the
homogeniser. Three sets of data were compared. The f i r s t set (Set A) presents p a rtic le data a fte r 1 pass with KE valve versus those a fte r
3 passes with FV valve. The second set (Set B) compares those a fte r
3 passes with CD valve versus those a fte r 5 passes with CRF valve, and the th ird set (Set C) matches the data fo r FV valve a fte r 5
passes against those fo r CRF valve a fte r 3 passes. The results are
135

Table 5.2 X volume oversize cut for d if fe re n t valve units
KE
% cut pass 1 pass 3 pass 5
(63 mg/g) (89 mg/g) (91 mg/g)
99 1.26 1.04 1.0495 1.98 1.29 1.2690 2.51 1.53 1.4750 3.70 3.32 2.74
CD
X cut pass 1 pass 3 pass 5
(52 mg/g) (83 mg/g) (93 mg/g)
99 1.26 1.02 1.0295 2.07 1.43 1.2490 2.57 1.82 1.4450 3.54 3.10 2.74
CR
X cut pass 1 pass 3 pass 5
(54 mg/g) (83 mg/g) (90 mg/g)
99 1.18 1.02 0.9995 1.86 1.29 1.1190 2.35 1.53 1.2650 3.37 2.92 2.30
136

Table 5.2 (continued)
CRF
% cut Dass 1 Dass 3 Dass 5
(44 mg/g) (68 mg/g) (77 mg/g)
99 1.40 1.09 1.0695 2.20 1.50 1.3290 2.73 1.82 1.5350 3.78 3.18 2.79
FV
% cut Dass 1 Dass 3 Dass 5
(33 mg/g) (61 mg/g) (70 mg/g)
99 1.86 1.40 1.3795 2.67 2.11 1.9490 2.92 2.56 2.3550 3.86 3.62 3.42
137

(mg/
g pa
cked
ce
lls)
100
90
80
70
60
50
40
301.8 20.8 1.2 1.61 1.4
Diameter (m icrons)
• FV A CD
A CRF * KE
□ CR
Figure 5 .9 (a ) Protein released versus partic lesize d9g.
138
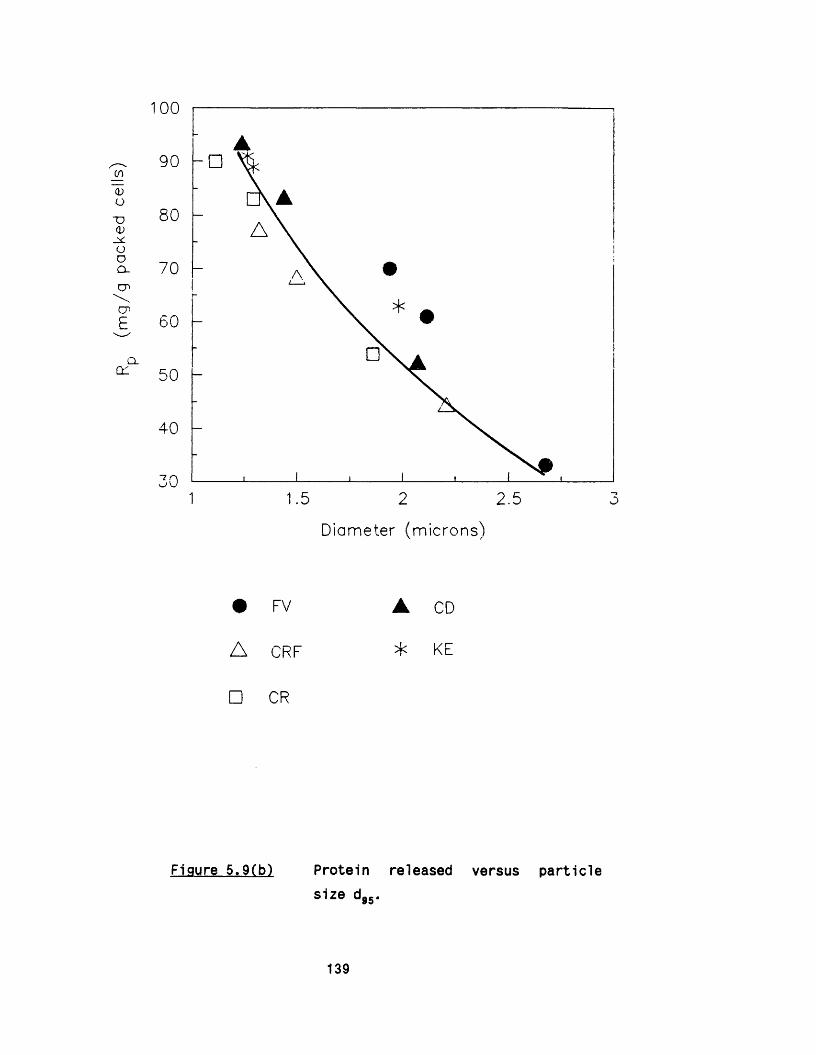
(mg/
g pa
cked
ce
lls) 90 - □
80
70
60
50
40
01.5 2 2.5
Diameter (m icrons)
• FV A CD
A CRF * KE
□ CR
Figure 5 .9(b) Protein released versus partic lesize d95.
139
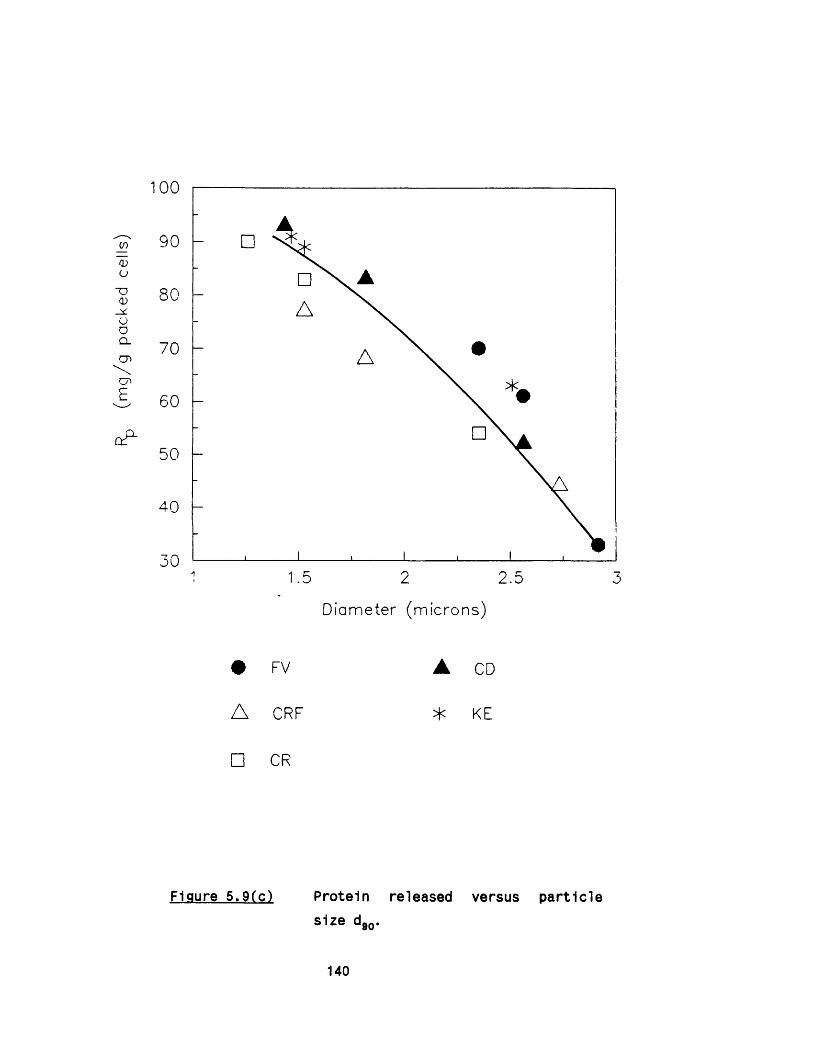
g/g
pack
ed
cells
)
100
q?-
90
80
70
60
50
40
1.5 2 2.5
• FV
A CRF
□ CR
Diameter (m icrons)
A CD
* KE
Figure 5 .9 (c ) Protein released versus p a rtic lesize d,0.
140

g/g
pack
ed
cells
) 90
80
70
60
50
40
303 3.52.5 4
Diameter (m icrons)
• FV ▲ CD
A CRF * KE
□ CR
Figure 5 .9(d) Protein released versus p artic lesize d,•so •
141

il lu s tra te d in Figures 5.10, 5.11 and 5.12 respectively. In the
f i r s t set (Figure 5 .1 0 ), the two valve geometries at the given
passes correlated closely 1n terms of protein release and size
d istrib u tio ns . However other valve geometries in the other sets
(Figures 5.11 and 5.12) showed d is tin c t differences.
In general, the analysis of the data reported in th is section shows
a small but d is tin c t trend to the FV and the KE valves giving larger
partic les fo r equivalent protein release compared to other
homogenisation valves. I t is in teresting to note that the FV valve
has the longest "land*’ width and the KE valve, the shortest (Figure4.1 and Table 6 .1 ). This observation seems to imply th a t the land
width is a contributing factor in p a rtic le a t t r i t io n .
5 .2 .3 Comparison between CD and CR valve units
Within the knife-edge category of valve geometries, th is study
showed that there was no s ig n ifican t difference between the
performance of the CD and the CR valve un its , expressed in terms of soluble protein release (Section 4 .5 ) . The p a rtic le size
distribu tions of the homogenate obtained using these two valve
configurations are Illu s tra te d in Figures 5 .1 3 (a ,b ). The CR unit resulted in a larger proportion of smaller p a rtic le s , w hilst the
cumulative volume oversize d istributions further demonstrated that although the released protein levels were s im ila r, the 95% cut fo r
the CR valve corresponded to a smaller p a rtic le size (1.29 microns) than that fo r the CD unit (1.43 microns). This gave an added
advantage to the ceramic CD valve which was designed to give a
better performance and longer l i f e .
142
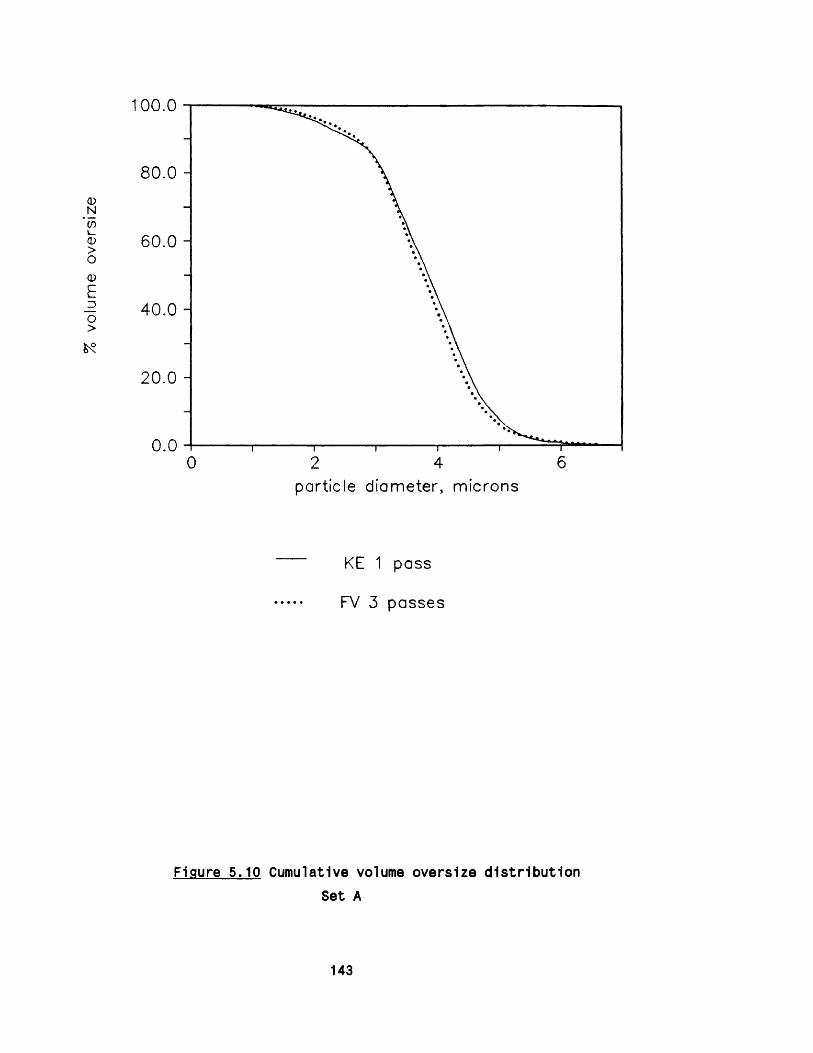
% vo
lum
e ov
ersi
ze1 0 0 .0
80.0 -
60.0 -
40.0 -
20.0 -
0.060 2 4
particle diameter, microns
KE 1 pass
FV 3 passes
Figure 5.10 Cumulative volume oversize d is trib u tio nSet A
143
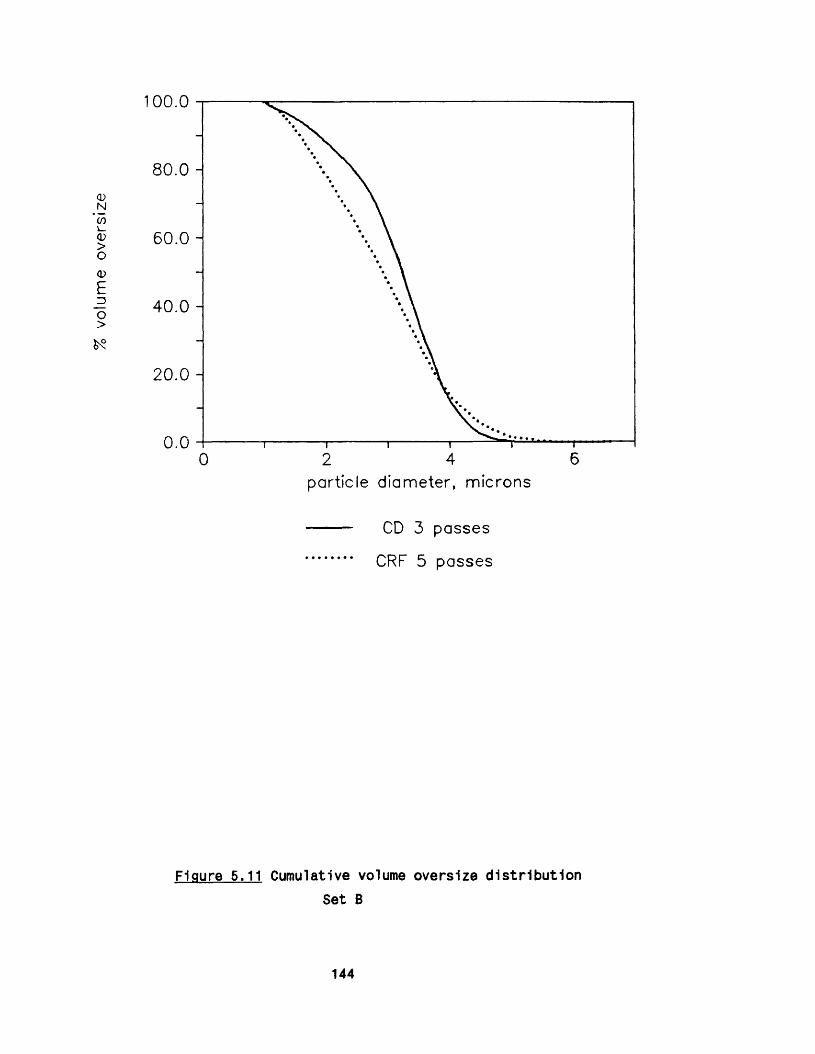
% vo
lum
e ov
ersi
ze1 0 0 .0
80.0 -
60.0 -
40.0 -
20.0 -
0.0640 2
particle diameter, microns
CD 3 passes
CRF 5 passes
Figure 5.11 Cumulative volume oversize d is trib u tio nSet B
144

% vo
lum
e ov
ersi
ze1 0 0 . 0
80.0 -
60.0 -
40.0 -
20.0 -
0.00 2 4 6
particle diameter, microns
CRF 3 passes
FV 5 passes
Figure 5.12 Cumulative volume oversize d is trib u tio nSet C
145
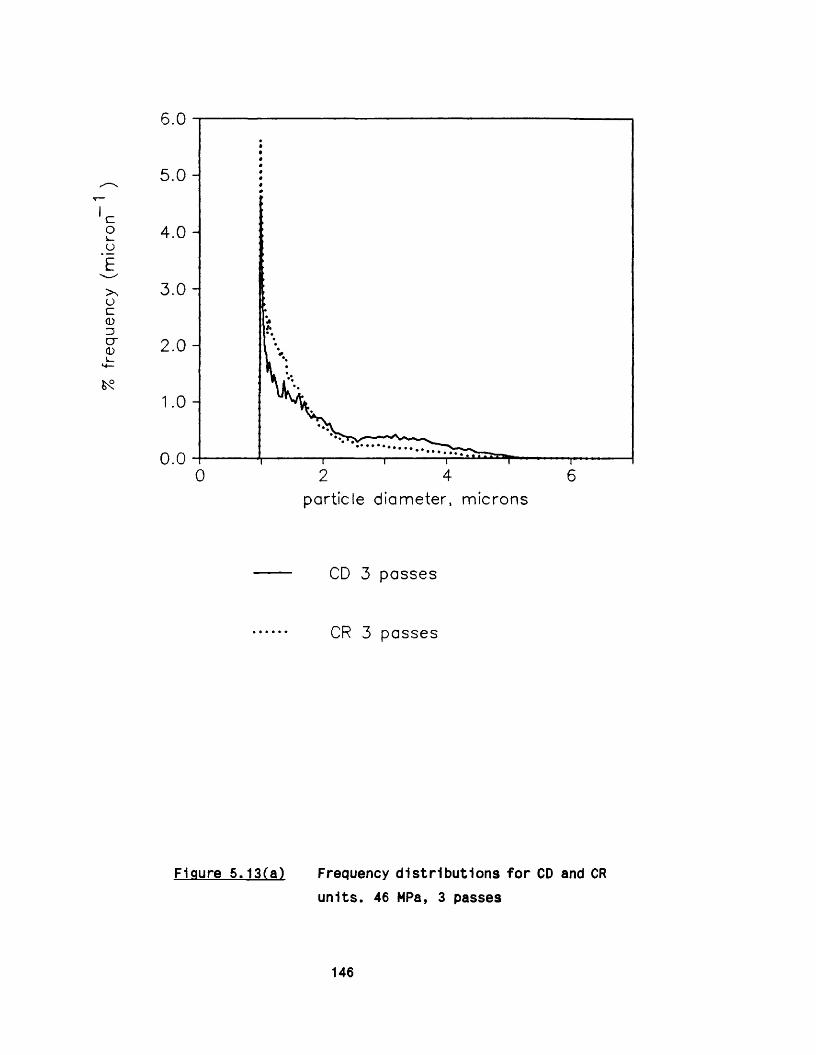
% fr
eque
ncy
(mic
ron
6 .0
5.0 -
4.0 -
3.0 -
2 .0 -
0.00 2 4 6
partic le d iameter, m icrons
CD 3 passes
CR 3 passes
Figure 5 .13(a) Frequency d istrib u tio ns fo r CD and CR
units. 46 MPa, 3 passes
146

% vo
lum
e ov
ersi
ze1 0 0 .0
80.0 -
60.0 -
40.0 -
20.0 -
2 4part ic le diameter, micron:
CD 3 passes
CR 3 passes
Figure 5 .13(b) C u m u la tive volume o v e rs iz e
d istrib u tio ns fo r CD and CR units. 46
MPa, 3 passes
147
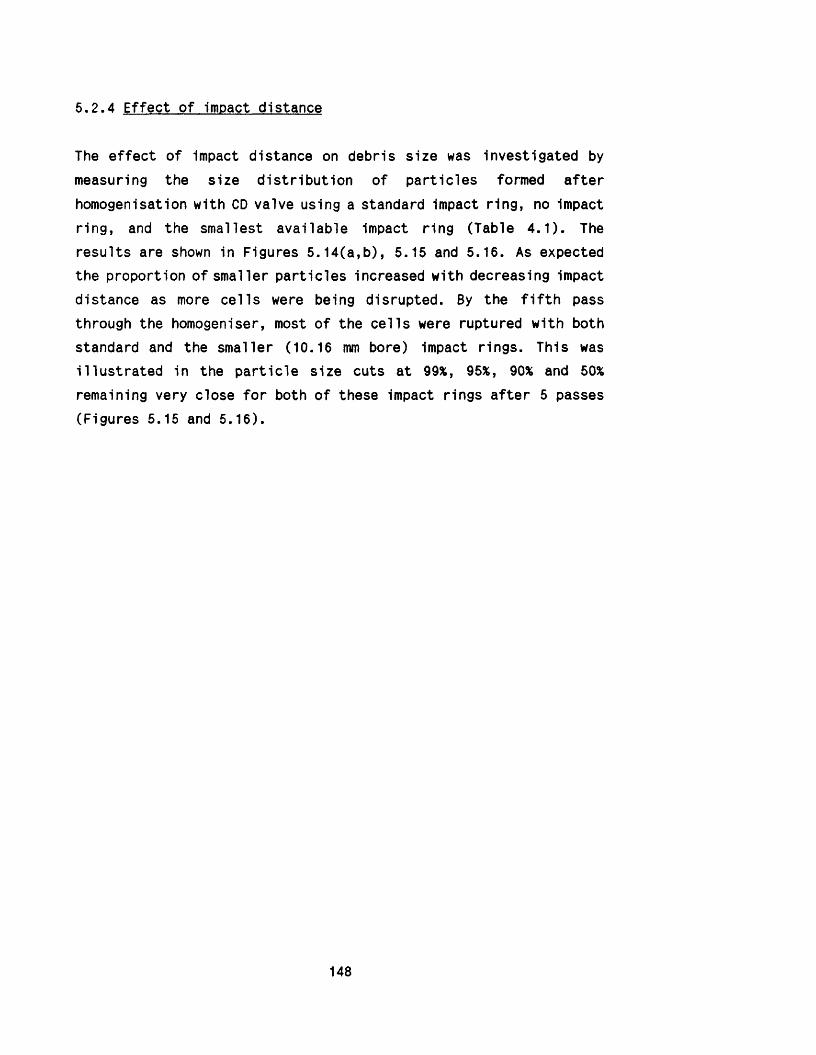
5 .2 .4 Effect of impact distance
The e ffec t of Impact distance on debris size was investigated by
measuring the size d is trib u tio n of partic les formed a fte r
homogenisation with CD valve using a standard impact ring, no impact ring, and the smallest available impact ring (Table 4 .1 ) . The
results are shown in Figures 5 .1 4 (a ,b ), 5.15 and 5.16. As expected
the proportion of smaller p artic les increased with decreasing impact distance as more ce lls were being disrupted. By the f i f t h pass
through the homogeniser, most of the ce lls were ruptured with both
standard and the smaller (10.16 mm bore) impact rings. This was
illu s tra te d in the p a rtic le size cuts at 99%, 95%, 90% and 50%
remaining very close fo r both of these impact rings a fte r 5 passes
(Figures 5.15 and 5 .16 ).
148

% fr
eque
ncy
(mic
ron
7.0
6.0 -
5.0 -
4.0 -
3.0 -
2.0 -
1.0 -
0.0 -
0 2 4 6
particle diameter, microns
— • CD, no impact ring, 3 passes
CD, standard impact ring, 3 passes
CD, smallest impact ring, 3 passes
Figure 5 .14(a) Frequency d istribu tions fo r CD using
a standard impact ring, no impact ring
and the smallest impact ring. 46 MPa, 3 passes.
149

%vo
lum
e ov
ersi
ze100.0
80.0 -
60.0 -
40.0 -
20.0 -
0.00 2 4 6
particle diameter, microns
CD, no impact ring, 3 passes
CD, standard impact ring, 3 passes
CD, smallest im pact ring, 3 passes
Figure 5.14(b) C u m u la tive volume o v e rs iz e
d istribu tions fo r CD using a standard
impact ring, no impact ring and the
smallest impact ring. 46 MPa, 3 passes
160
(mg
/g
pack
ed
cells
) 120
1 0 0
80
60Q_
40
20
0.5 1.5 2 2 .5 3
□Diam ete r (m ic ro n s )
CD, no im p a c t r ing
• CD, s ta n d a rd im p a c t r ing
A CD, s m a l le s t im p a c t r ing
Figure 5.15 Protein release versus partic le size d99 and
151

(mg
/g
pack
ed
cells
)
onCl
1 2 0
00
80
60
40
20
03 3.52 2.5 41.5
D iam ete r (m ic ro n s )
□ CD, no im p a c t r ing
# CD, s ta n da rd im p a c t r ing
A CD, s m a l le s t im p a c t r ing
Figure 5.16 Protein release versus p a rtic le size d90 and
“so.
152
6. MECHANISM OF CELL DISRUPTION
The investigation of the e ffe c t of mechanical parameters on c e ll disruption described in Chapter 4 revealed new information
previously unreported in the lite ra tu re . This was found to be of importance in explaining the mechanism of c e ll disruption. In th is
chapter, these findings are discussed and evidence is put forward
fo r a better understanding of ce ll rupture in high pressure
homogenisers.
6.1 Theoretical considerations
I t was mentioned e a r lie r (Section 4 .1 ) that an essential feature of th is work was the precise characterisation of the geometry of the
valve u n it. This is p a rtic u la r ly important in elucidating the
theoretica l argument 1n the study. A generalised diagram of the
valve unit 1s shown 1n Figure 6 .1 , iden tify ing the dimensions of importance. The diagram is approximately to scale except, as w ill be
discussed la te r , that the valve gap width h, is considerably smaller
than shown. The impact distance, X, is defined from the radius at which the annular liqu id je t leaving the valve geometry is allowed
to expand fre e ly on both sides.
The suspension flow path through a homogenisation valve is through
the central o r if ic e of the valve seat, across the "land"- which 1s
the length (R-R0) - where at a given pressure a gap (width h) is
created between the valve rod and the valve seat. The f lu id then
impinges on an impact ring a distance X from the valve. The various
valve unit geometries (Figure 4 .1 ) mainly d iffe red in the values of R, R0 and “land". The valve rod dimensions (except fo r the CR u n it)
153

im pac tRing
Im pactDistance
yoiveLand
ehtralOr i!f ice
Valve Seat
Figure 6.1 Schematic diagram of a typical valve unit.
154
were id en tic a l, s im ila rly the bore size of the standard impact ring
was the same. The land distance varied from near zero (0.1 mm) for
the KE unit to 1.5 mm for the FV u n it. The principal energy losses
in the valve unit consisted of an entry zone loss (radius >R0) , a
f r ic t io n loss across the land, and an e x it zone loss (radius >R). However, empirical data on these losses are scarce because of the
physical d i f f ic u lt ie s encountered in experimentation 1n the valve
zone of a high pressure homogenlser. The only available information
was put forward by Phipps (1975) in the form of a Bernoulli type
expression fo r the sum of the losses in the valve. For turbulent flow the following equation was given:
0U02/2
10 R0* x
( Ro ] 2/5>> \ _Ro
h Re3/5 ."In .+ a*R
(6 . 1)
i .e . to ta l = entry + fr ic t io n pressure zone lossloss loss
e x itzoneloss
Re =oU0h
where P is the to ta l pressure drop, Ue is the mean velocity at radius R0, o is the f lu id density, p is the f lu id v iscosity , a the
entry loss taken as 0.5 fo r sharp en tries , h is the gap width
between the valve rod and the valve seat, R0 and R are respective
entry and e x it diameters as shown in Figure 6 .1 , Re the Reynolds
number at the entry into the homogenisation zone of the valve unit
and a ’ is the e x it loss factor taken as unity. The pressure drop P
1s taken as the homogenisation pressure, the homogeniser discharging
to atmosphere.
The fr ic t io n loss term is an empirical modification of the fr ic t io n
loss determined by Kawaguchi (1971) fo r turbulent flow between two
p ara lle l plates to allow fo r smaller dimensions in a homogeniser.
155
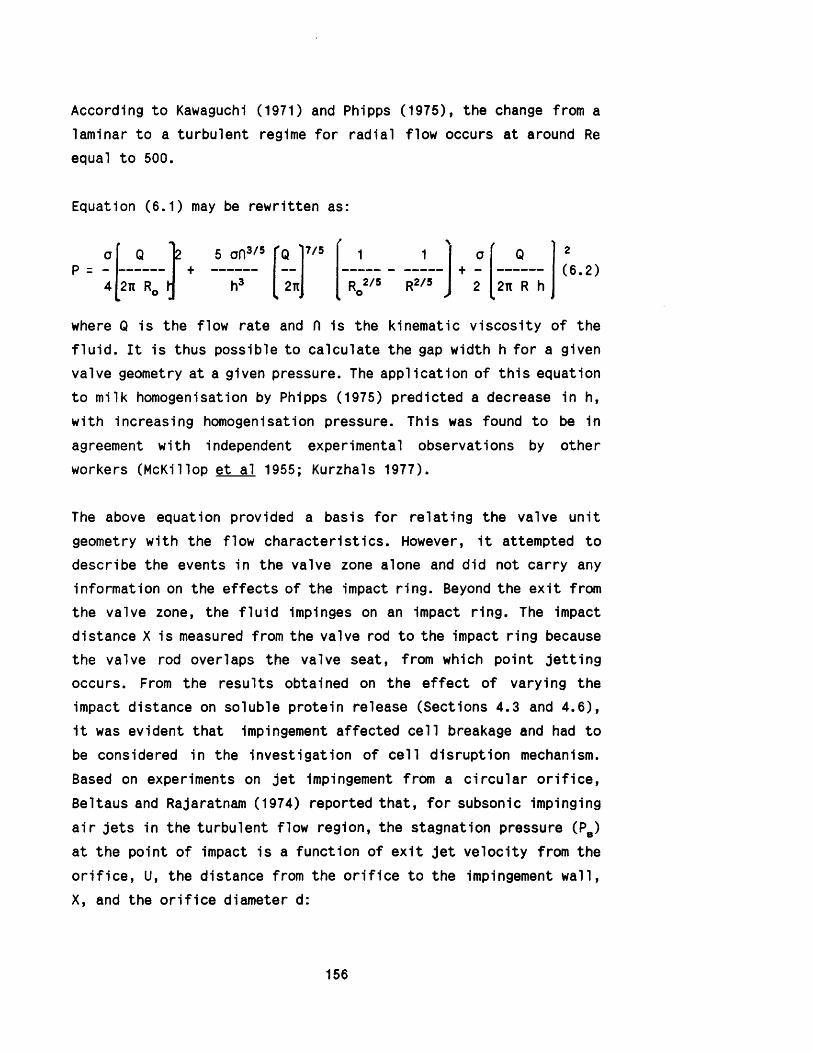
According to Kawaguchi (1971) and Phipps (1975), the change from a
laminar to a turbulent regime fo r radial flow occurs at around Re
equal to 500.
Equation (6 .1 ) may be rewritten as:
o► ^
Q 2 5 on3/5 ' q ’ 7/5r \
1 1 aj . —
Q
4 2n R_ h h3 2ti r 2/5 R2/5T
2 2n R h0 ° •
where Q is the flow rate and n is the kinematic viscosity of the
f lu id . I t is thus possible to calculate the gap width h fo r a given
valve geometry at a given pressure. The application of th is equation
to milk homogenisation by Phipps (1975) predicted a decrease in h, with increasing homogenisation pressure. This was found to be in
agreement with independent experimental observations by other
workers (McKillop et al 1955; Kurzhals 1977).
The above equation provided a basis fo r re la tin g the valve unit geometry with the flow characteris tics . However, i t attempted to
describe the events in the valve zone alone and did not carry any
information on the e ffects of the impact ring. Beyond the e x it from
the valve zone, the f lu id impinges on an impact ring. The impact distance X is measured from the valve rod to the impact ring because
the valve rod overlaps the valve seat, from which point je tt in g
occurs. From the results obtained on the e ffe c t of varying the
impact distance on soluble protein release (Sections 4.3 and 4 .6 ), 1t was evident that Impingement affected c e ll breakage and had to
be considered in the investigation of c e ll disruption mechanism. Based on experiments on je t impingement from a c ircu la r o r if ic e , Beltaus and Rajaratnam (1974) reported th a t, fo r subsonic impinging
a ir je ts in the turbulent flow region, the stagnation pressure (P8) at the point of impact is a function of e x it je t ve locity from the
o r if ic e , U, the distance from the o r if ic e to the impingement w all, X, and the o r if ic e diameter d:
156
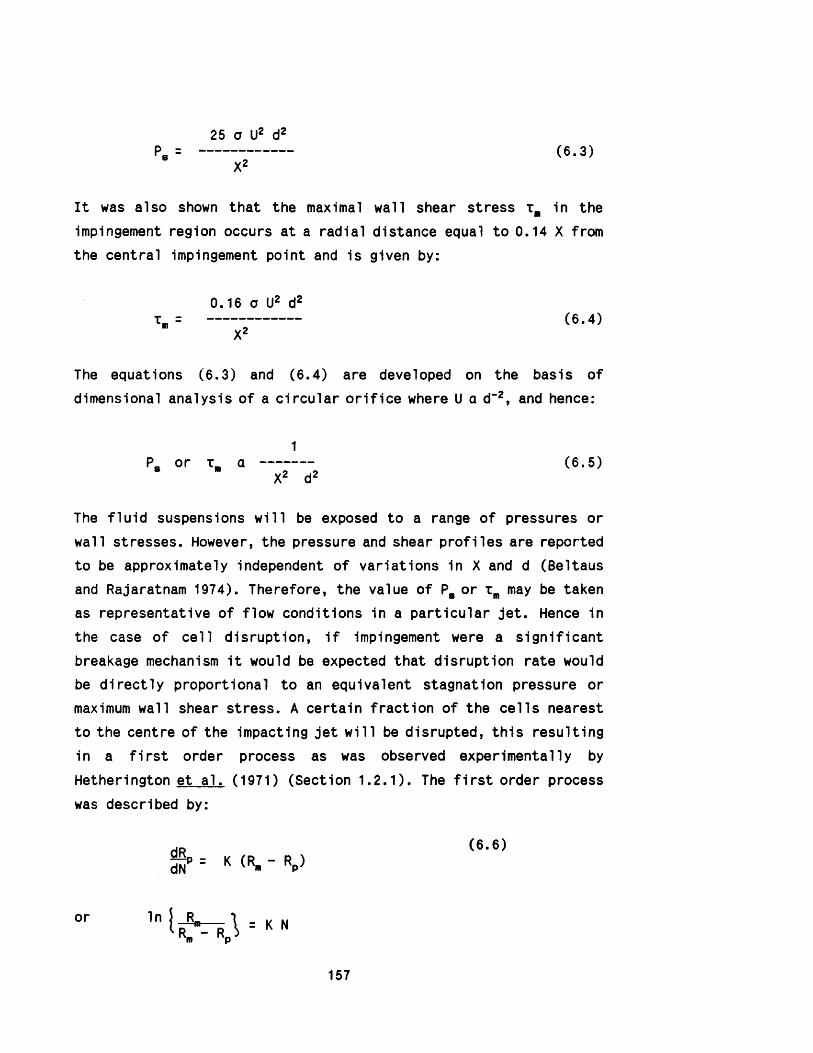
25 o U2 d2P,8 (6 .3 )
I t was also shown that the maximal wall shear stress t,, in the
impingement region occurs at a radial distance equal to 0.14 X from
the central impingement point and is given by:
The equations (6 .3 ) and (6 .4 ) are developed on the basis of dimensional analysis of a c ircu la r o r if ic e where U a d"2, and hence:
The f lu id suspensions w ill be exposed to a range of pressures or
wall stresses. However, the pressure and shear p ro files are reported
to be approximately independent of variations in X and d (Beltaus
and Rajaratnam 1974). Therefore, the value of P8 or xm may be taken
as representative of flow conditions in a p articu la r je t . Hence in
the case of ce ll disruption, i f impingement were a s ig n ifican t breakage mechanism i t would be expected that disruption rate would
be d ire c tly proportional to an equivalent stagnation pressure or
maximum wall shear stress. A certain fraction of the c e lls nearest to the centre of the impacting je t w ill be disrupted, th is resulting
in a f i r s t order process as was observed experimentally by
Hetherington et a l. (1971) (Section 1 .2 .1 ). The f i r s t order process
was described by:
0.16 o U2 d2t,m (6 .4 )
1(6 .5 )
dRdN
(6 . 6 )K (R, - Rp)
or
157

where Rp is the amount of released soluble protein a fte r N discrete
passes through the homogeniser, Rm is the maximum amount of soluble
protein availab le fo r release, and K is the rate constant or the
disruption y ie ld which is a function of homogenisation pressure and
valve geometry.
With the assumption that the dimensional analysis fo r an impinging
a ir je t may be applied to the more complex p a rtic le liqu id
suspension under consideration here, the relationship as derived in
equation (6 .5 ) may be used to describe impaction e ffec ts in the high
pressure homogeniser. In th is case the dimension, d, the je t
diameter w ill be replaced with the valve gap width, h:
1
6.2 Discussion
The application of a Bernoulli type expression (equation 6.1 or 6 .2 ) to describe the flow ve lo c ities through the valve unit and the
d e fin itio n of the properties of the impinging je t (equation 6 .7) required a number of assumptions which need fu rther comment. The
expressions used are fo r turbulent flow ( i . e . Re in the region of 500 or more). Table 6.1 describes the gap width as derived from
equation (6 .2 ) and the valve geometry, and also the resulting flow
conditions in the valve u n it. Based on the entry ve lo c ity , the
required Reynolds numbers fo r turbulent flow were attained . However, due to the cy lin drica l geometry of the o r if ic e , i t is
evident that the Reynolds number w ill decrease on flow through the
valve seat, in the case of the f la t valve seat to less than 500. Turbulent flow conditions may s t i l l be assumed as the presence of yeast ce lls which are only 2 to 4 fo ld smaller than the valve gap
158

Table 6.1 Flow characteristics with d if fe ren t valve geometries8
valve unit KE CD CRF FV
gap width, h (pm) 12.55 15.15 19.10 21.61entry ve lo c ity , UD (m/s) 206.0 144.1 154.4 127.5
e x it ve loc ity , U (m/s) 200.0 127.6 124.0 85.5entry Reynolds number, Re 517.1 436.6 589.8 551.1mean velocity gradient x 107, G (s_1)b
13.7 5.0 4.2 2.5
a
Assumptions: Q = 57 L/hpulse rate = 1 pulse/s fo r 0.3 s o = 1000 kg m-3 M = 5 x 10~3 Pa s concentration = 45% w/v P = 46 MPa
b p 1 / 2
— v G - ------
M
where Pv is the power dissipated per unit volume
P Q
n( R2 - R„2) h
159

width would tend to promote the formation of turbulent eddies. The
valve unit configuration with a 90° change in flow d irection on
entry would also promote turbulence. Hence 1t seems reasonable to
assume that equations (6 .1 ) , (6 .2 ) and (6 .7 ) may be used to id en tify
flow conditions within the homogeniser valve.
In determining the flow rate , i t was important to take account of the pulsating nature of the flow which is a characteris tic of single
piston homogenisers. One pulse per second (0 .3 second duration) was
used as the basis fo r the calculations. This was in accordance with
data reported by (Brookman 1975). Data on the viscosity of the
suspension was based on prelim inary experimental work carried out on
whole and disrupted yeast c e lls .
6 .2 .1 E ffect of impact ring
A major finding of th is study was the significance o f impingement in
c e ll disruption in high pressure homogenisers. Previous theories
pertaining to ce ll disruption in the type of equipment used in th is
work do not account fo r the importance of the Impact ring (Doulah et a l . 1975; Brookman 1975). Impingement has only been considered 1n
equipment d ire c tly designed to tes t the impact e ffe c t (Engler 1979; Kramer and Bomberg 1988a, 1988b).
Impact distance has two possible e ffects on homogeniser operation. F irs t ly , i t contributes to the back pressure of the system and
secondly i t is involved in the impingement phenomenon. The e ffe c t of back pressure is not s ig n ifican t because an increase in impact distance at constant to ta l pressure should resu lt in lower back
pressure and therefore better disruption. This is however, contrary
to the observations made (figu re 4 .9 ) where smaller Impact distance
resulted in better homogenisation. Furthermore the annular cross
sectional area fo r the e x it flow p a ra lle l to the impact ring was at least 50 times larger than the flow area in the homogenisation zone
of the valve u n it, based on the impact distance and gap width values
160

(Table 6 .1 ). The back pressure due to the impact ring has therefore
a minor e ffe c t on the valve gap width and hence fo r any p articu la r
valve configuration impingement e ffec ts are an Important parameter.
Early studies on milk homogenisation (McKillop e t a l . 1955) had
shown that the removal of the Impact ring ( i . e . an Increase in
impact distance) did not reduce the effectiveness o f homogenisation. This observation is at variance with that made fo r c e ll disruption. The fa ilu re to observe s im ilar results may be attribu ted to the fact that milk homogenisation was shown to be complete before the f lu id
le f t the area between the valve rod and valve seat (Loo and Carlton
1953) and that high v e lo c ities of over 250 m/s were required to
disrupt milk on impact (Mulder and Walstra 1974). Evidently the
mechanism of c e llu la r breakage is d iffe re n t from that of homogenisation of dairy products. This could explain the negative
results obtained in studies attempting to correlate milk
homogenisation with c e ll disruption (Brookman 1975).
6 .2 .2 E ffect of valve geometry
The finding that knife-edge geometries y ie ld better disruption than
the fla t-edge configuration is 1n accordance with previous studies
in which at least one of three types of knife-edge units (CD, CR and
CRF) were tested against a f la t valve unit (Hetherington et a l . 1971; APV Gaulln 1985). Within the knife-edge range of un its , the
experimental KE, which has the sharpest edge, was the most e ff ic ie n t . CD and CR valve units were s im ilar in performance despite
claims by the manufacturers that the CD un it resulted 1n better
y ie ld .
For the KE, CD, CRF and FV configurations 1t was possible to
estimate flow conditions in terms of mean ve locity gradient or
ve lo c ities of flow in the valve (Table 6 .1 ) . The ascending trend of
the disruption yields follows that o f the corresponding flow values
161

although i t is not possible to Id en tify whether the mean velocity
gradient or ve loc ity of flow was the relevant correlating parameter.
S im ila rly decreased valve gap width leads to increased disruption
rate and, since the yeast c e ll sizes are of s im ilar dimension
(approximately 5 pm diameter fo r a whole c e l l ) , then the effects of c e ll d is to rtio n on flow through the valve may also contribute
considerably to the disruption ra te . However, i t should be noted
that the land width 1s yet another variab le 1n the valve
configurations studied and is not possible to distinguish between
various contributory effects of the valve geometry without fu rther
research.
As fa r as the e ffec t of mechanical parameters on c e ll debris
formation is concerned, no simple correlation may be drawn between
the mechanism of ce ll disruption and debris size d is trib u tio n . I t 1s
however possible to speculate on the implications of the results
reported in Chapter 5. The e ffec t of impact ring is mainly related
to the breakage of whole ce lls on impaction. The reduction in debris
size however is most lik e ly a function of the valve unit geometry
and the dimensions in the valve zone. Repeated passages through the
homogeniser would not only break the undisrupted ce lls but also
micronise the c e ll debris.
6.3 Concluding remarks on the mechanism of ce ll disruption
The varia tion of disruption y ie ld with impact distance, X, and gap
width, h, expressed as 1/(X2 h2) , is shown 1n Figure 6 .2 , f i r s t ly at constant h, where one valve geometry was used at constant pressure
with a range of impact distances, and secondly at constant X, where
d iffe re n t valve geometries were used at constant pressure with the
same impact ring, resulting 1n varia tion in h. The two cases
correlate well as data fo r constant X and then constant h l ie on the
same curve. The relationship therefore describes well the operation
of the homogeniser within a narrow range of gap widths studied i .e .
162
12.6 pm < h< 21.6 pm which re late to 46 MPa pressure.
The results of the study therefore indicate that both valve geometry
and impact ring are relevant to the disruption process. Two
mechanisms are involved, that re la ting to the homogenisation zone
w ithin the valve u n it, and that connected with the impingement in
the e x it zone. Impingement is the predominant mechanism as
il lu s tra te d in Figure 4.11. For the CD un it 1t is estimated that only 20% of the disruption obtained a fte r the f i r s t pass under normal working conditions ( i . e . with a standard impact ring) 1s due
to the valve unit geometry; the rest (80%) is achieved by
impingement.
163

Rate
co
nst
ant,
K
(
2.0
0.8 KE
CD
0.4CR
FV
0.04000020000 300000 10000
1 / (X.h)^ (m m )
Figure 6.2 E ffect of impact distance and valve geometry
on soluble protein y ie ld from bakers’ yeast at 46 MPa. Yield is the rate constant K in
the equation 6.6.
164

7. BIOCHEMICAL ENGINEERING DESIGN OF AN INTEGRATED HOMOGENISATIONSYSTEM
7.1 Background
At the in i t ia l stages of the study, decisions had to be made
regarding possible ways of conducting the Investigation of the
mechanism of disruption in high pressure homogenisers. Previous
researchers had been faced with the problem of dealing with
essentia lly a ’ black box’ since the crucial features of a high
pressure homogeniser, namely the components of the valve u n it, are
encased in the assembly block. High operational pressures, very
small flow paths and valve un it dimensions made re lia b le
measurements within the unit v ir tu a lly Impossible. A lte rn a tive ly , other researchers had attempted to use experimental equipment with the intention to recreate the conditions within the homogeniser (Brookman 1977; Engler 1979). In th is study, in i t ia l experiments
were carried out using equipment s im ilar to that devised by Brookman
(1977). This consisted of an a ir driven liqu id pump capable of pumping 9 L/h at 69 MPa connected to an adjustable r e l ie f valve. The
system proved unsatisfactory because of d if f ic u lt ie s to control the
a ir supply and the aperture of the r e l ie f valve. Furthermore the
unit could not be used with filamentous microorganisms due to severe
blockage. The design of a system consisting of a high pressure
In te n s ifie r attached to an e x it aperture of well defined dimensions
was feasib le (Engler 1979). However, since 1t was never possible to
claim with certa in ty that the conditions w ithin high pressure
homogenisers were accurately emulated, 1t was decided to discontinue
the search fo r an experimental equipment and instead Investigate the
high pressure homogeniser I t s e lf by varying the operating parameters
and geometric configurations (Chapters 3 to 6 ).
165
During the course of the study, however, i t became clear that the
design of the homogenisation system could be improved in many ways.
The homogeniser i t s e l f was a single piston device with a high degree
of pulsation which made reproducible experimentation d i f f ic u l t . At the time, other three piston homogenisers availab le on the market were of high operating capacity (well above 200 L /h ). The range of operating pressures was also lim ited . Other researchers, who had
extended the pressure range by a lte rin g the pump u n it, noted
variations in th e ir results which were attribu ted to the non -
optimal design of the equipment (Dunnill and L i l ly 1975). Furthermore, the homogeniser did not have any provision fo r
containment at any leve l. Even fo r non contained processes, safety
regulations required operation with covered containers fo r feed and
collection to avoid splash back and possible aerosol discharge. Another aspect of the system which required much Improvement was the
need for suitable integration of an c illa ry equipment such as the
heat exchanger, pipework and instrumentation with the homogeniser. The manufacturers do not provide a to ta l integrated system. The
a n c illa r ie s , therefore, were usually f i t te d 1n house ’ piece - meal’ .
7.2 Design philosophy
In view of the above considerations, i t became clear that there was
a need fo r a new integrated homogenisation system which would
s a tis fy the following overall guidelines.a- A homogeniser that could be operated over a wide range of pressures, from very low to very high (eg. beyond 100 MPa), with
moderate flow capacity commensurate with p ilo t scale process
requirements.b- A uxilia ry equipment based on hygienic design and f it te d as one
single un it with the homogeniser.c- Some degree of b u ilt - in containment with provision fo r future
fu l l containment of the to ta l system.
166

d- Provision fo r CIP (cleaning in place) operation.
Discussions with APV Gaul in revealed that a new homogeniser (designated model 30 CD) was being developed and sp ec ific a lly
designed fo r the biotechnology industry and therefore in some ways
met the stated c r ite r ia . However, there was a need fo r some extra
features (Section 7 .3 .2 ) . Other recently marketed homogenisers such
as Lab 60 (APV Baker Ltd, Crawley, West Sussex, UK) did not have any
provisions fo r containment. The 30 CD was to be marketed, as a ll other homogenisers, without any a u x ilia ry units. I t was therefore
decided to design and construct a complete integrated homogenisation
system using the 30 CD as the centre piece. The work was carried out with the help of APV Gaul in and APV Baker. The system has been
intended fo r future research in the p ilo t p lant.
7.3 The homogeniser
7.3.1 Main features
The 30 CD is a three piston homogeniser which is based on the same
general princip le of operation as that of a single piston described
in Section 1 .1 .2 .2 . I t has, however, some unique features. I t has a
capacity of 113 L/h at a maximum operating pressure of 105 MPa in
continuous operation mode. The pressure may be increased by another
20 % fo r in term itten t runs of maximum 20 minutes duration. The CD
valve assembly which is made of a ceramic composite m ateria l, is
designed such that the valve seat is reversib le, providing two
workable surfaces which can be interchanged in case of damage
(Figure 7 .1 ). The pressure gauge is not coupled d ire c tly to the
discharge manifold but is isolated by a piston in order to prevent the mixing of the pumped product with the hydraulic f lu id .
Another feature which makes the equipment p a rtic u la r ly suitable fo r
use in the biotechnology industry is the prevention of leakage and
167

o2£
a.
ujoc.z>COCO
^ <0 °-s£3
liJ
UJ
o
Ss</5 Q_
Figure 7.1 Schematic diagram of the valve assembly fo r the 30 CD.
168

aerosol formation by means of double seals with drain ports between
them at locations of high pressure. These occur at several points in
the system. Double seals and drain ports are provided at the
coupling of the homogeniser valve assembly to the pump block (Figure
7 .1 ) , and the cylinder packing box to the block (not shown). S im ilar
arrangements are positioned in the suction and discharge valve
assemblies. Furthermore, a rupture disc assembly is f i t te d to
release any over pressure in the discharge manifold through a safety
r e l ie f port (not shown).
7 .3 .2 Additional features fo r the integrated system
Although the flow capacity of the homogeniser at 113 L/h was much
lower than those of other three piston homogenisers availab le in the
market, nevertheless i t was well above smaller homogenisers (57 to
60 L /h ). Given the small quantities of process material availab le
from fermentation sources, i t was desirable to be able to reduce the
flow rate of the 30 CD. This was achieved by decreasing the speed of the pump motor by means of a variable frequency inverter (IMO
Jaguar, VL550, IMO Ltd, London, UK). The inverter princip le 1s to
vary motor frequency along with motor supply voltage to achieve the
most e ff ic ie n t means of a lte rin g motor speed. I t was thus possible
to vary the flow rate from 113 L/h to 70 L/h. Although 1n theory i t
is possible to reduce the speed fu rther to allow fo r lower flow
rates, in practice the operation is lim ited by the pumping action
(pulsed flow in s ta b ility ) , large hold up volume in the pump and o il ac ce ss ib ility to the gear box.
Another feature of the homogeniser which needed some modification
was the pressure gauge. I t was desirable to be able to set the
pressure over the whole range from few MPas up to the maximum. The
existing pressure gauge was not sensitive to the small changes at the lower end of the scale. I t was however in princip le possible to
use a pressure transducer and adjust the pressure by means of a
169
hydrau lically operated actuator. Since th is mechanism was not fu lly
developed by the manufacturers at the time of th is study, an
a lte rn a tive design consisting of two pressure gauges was conceived
covering the low and high pressure ranges respectively. A cut o ff
mechanism was in sta lled to protect the low pressure gauge from over pressurisation.
7.4 Plan of the a u x ilia ry equipment
The f i r s t step in the design of the integrated system, once the
homogeniser was selected, was to id en tify the au x ilia ry items. These
consisted of hoppers fo r feed, co llection and waste, pipework and
valves, heat exchanger u n it, and instrumentation. The lay out of the
plant was the next important step. This was based on the
requirements fo r discrete pass disruption w hilst taking account of several constraints. The space a v a ila b il ity was a major consideration, lim itin g the dimensions of the plant to 1.53 m x 1.2
m. The height, weight and a b il i ty to physically transport the
equipment through the building into the p ilo t plant were also
considered. I t was also necessary to ensure ac cess ib ility of various
units fo r operation and maintenance by the operator. The to ta l package was to be assembled on a stainless steel skid with a ll termination points taken to the edge of the package.
The logic behind the discrete pass operation was based on the
methodology used in the study as outlined in Section 2 .8 .3 . Two
basic layouts were considered. One option to arrange the feed and
co llection receptacles in series (Figure 7.2 (a )) allowed fo r a
simpler homogenisation procedure but excluded the p o s s ib ility of interchanging the hopper usage. The system also had to allow fo r the
collection hopper to empty within 20 seconds to prevent the mixing
of process flu id s between d iffe re n t passes. This was based on the
assumption that the hold up volume would be around 600 ml and that the equipment was running at fu l l flow capacity. Therefore, fas t
170

WASTE
T
WASTE
30 CD
(a) Hoppers in series
30 CD
(b) Hoppers in parallel
Figure 7.2 A lternative hopper layout

acting, fu l l bore valves were to be considered together with e x it
pipes with a diameter greater than 3/4 inch to allow an average flow
rate of about 1000 L/h.
An a lte rn a tive layout was to arrange the feed and co llection hoppers
in p a ra lle l (Figure 7.2 (b ) ) . This was more practical as i t allowed
the interchange of the two tanks, i t did not necessitate the
stringent requirement fo r rapid discharge of the vessels and
a llev ia ted the associated problem of aerosol formation when an empty
hopper is being f i l le d . I t was therefore selected as the basis fo r
the rest of the design work.
7.5 Design of hoppers
Three stainless steel hoppers were required, each with 5 L working
volume ( 8.3 L to ta l volume). In the case of contained operation i t
would be necessary to fu l ly seal the hoppers and also be able to
steam s te r i l is e the contents. In such a case the hoppers would be
pressurised vessels s im ilar to s tirre d tank fermenters with the same
design considerations. For the purpose of the present work, simple
atmospheric conical bottom hoppers were used with appropriate
connections (Section 7 .6 ) fo r re tro f it t in g with pressurised vessels. The conical shape of the lower part of the hopper would allow easy
and quick release of the process f lu id . The feed and co llection
hoppers were to be jacketed to allow for cooling.
7.5.1 Level control
The operator has to be aware of the level of the process f lu id
inside the feed and co llection hoppers in order to open and close
the appropriate valves (Section 7 .6 ). One a lte rn a tive was to
incorporate a level sensor which, at a given le v e l, would
autom atically in it ia te the opening and closing of designated valves.
172

Three p o s s ib ilit ie s were considered which consisted of a load ce ll operating on the basis of weight changes in the hopper content, a
conductivity probe responding to a break in f lu id contact, and an
ultrasonic sensor detecting the change in the sound velocity through
a ir and liq u id . A ll these options were costly and had operational drawbacks, and given that non contained hoppers were selected, were
thought to be unnecessary at th is stage but would be reassessed when
re tro f it t in g fo r fu lly contained operation. Visual observation was
the a lte rn a tive solution. The use of a sight glass was considered. However, past experience had shown that the glass could easily get covered with p artic les and c e llu la r matter obscuring a clear view of the f lu id leve l. Observation from the top was the most re lia b le
method, but the hoppers had to be covered. Even though the vessels
were not contained, nevertheless i t was necessary to comply with the
safety regulations which required the process f lu id to be fu l ly
enclosed. In order to sa tis fy both safety and operational requirements, a lid made of perspex was designed with appropriate
ports fo r instrumentation. The lid consisted of two halves so that access to the contents would be easy without the need fo r
dismantling a ll attached instrumentation.
7 .5 .2 Instrumentation
In order to preserve the consistency of the homogenised process
f lu id , to prevent the c e lls from sedimentation in the hoppers which
may lead to homogeniser blockage - especially in the case of filamentous microorganisms - and to prevent a f i l t e r mat of filamentous organisms forming 1n the o u tle t pipe from hopper, an
overhead s t ir r e r unit with mechanical variab le speed control and a
stainless steel 2-blade Impeller rotor was in sta lled ( SS1, Stuart S c ie n tific Co Ltd, R edh ill, Surrey, UK) in both feed and co llection
hoppers. The height and the angle of the stem could be easily
adjusted by means of a re to rt stand clamp ( Climpex, Arnold Howell Ltd, London, UK). The s t ir r e r would be positioned at a minimum
173

height from the e x it of the hopper, and would be turned o ff as soon
as the f lu id f e l l below th is level to avoid aerosol formation. The
control of the s t ir r e r speed was important to prevent frothing and
disruption of fra g ile c e lls . In order to Increase mixing at the e x it
to the hopper, a stainless steel cross shaped removable b a ffle was
positioned over the o r if ic e .
The temperature of the suspension f lu id 1n the feed and co llection
hopper was monitored by means of a 63 mm d ia l thermometer ( type
VRS, Knowsley Instrument services Ltd, Liverpool, UK) with 3/8 inch
compression gland, in sta lled in each container.
To prevent damage to the homogeniser valve assembly, 1t is essential to ensure continuous flow of f lu id to the equipment. An alarm
mechanism was therefore in sta lled in the hoppers to inform the
operator of the low level of f lu id in the receptacles. This was an
emergency measure and was not intended as part of the routine
operational procedure. The system consisted of a conductivity probe
with the t ip close to the f lu id e x it point in the hopper, and
earthed via the body of the hopper. I f the level of the process
f lu id were to f a l l below the t ip of the probe, the c irc u it contact would break and an alarm would sound to a le r t the operator. Addition
of f lu id would reconnect the c irc u it and stop the alarm. A mute
mechanism allowed the operator to temporarily override the alarm i f
necessary.
The process f lu id downpipe into each hopper was positioned on the
side of the vessel with a discharge near the base of the cone away
from the s t ir r e r . This arrangement prevented splash back and aerosol
formation.
174
7.6 Pipework, f i t t in g s and valves
A ll pipings were in corrosion and p ittin g resistant 316 stainless
s te e l. A ll the jo in ts were fu lly welded. Where connecting seals were
unavoidable such as fo r the hoppers and the homogenlser in le t
connection, sanitary f it t in g s were used to elim inate accumulation of residual process suspension in the pipework. These f it t in g s were
Tri-C lover clamp type unions (H etior Hygienic f it t in g s Ltd, Stainless F ittin g s , Dudley, West Midlands, UK) designed to give
smooth, hygienic, crevice - free seals suitable fo r CIP. Pipes
connecting the feed and collection hoppers to the homogenlser had a
3/4 inch BSP external diameter to prevent blockage, w hilst the rest of the pipework had a 1/2 inch BSP diameter.
The valves selected to perform the discrete pass operation were APV
diaphragm valves (APV Baker, Crawley, West Sussex, UK) suitable fo r
hygienic systems. They could be cleaned in place, steam s te rilis e d
and dismantled. Four valves operating the in le ts and outlets to the
hoppers were fast acting pneumatically operated, w hilst the sample
point valves and the e x it to the waste hopper were manually
controlled (Figure 7 .2 ) ( la te r in the study, the la t te r valve was
re tro f it te d with a pneumatic version) as there was no need fo r fas t release. The bulk of the valves was of stainless steel and the
product contact seals, of V irgin PTFE. A molded PTFE diaphragm
provides a b a rrie r to the interspace of the containment chamber. Above th is interspace a steam chest 1s provided allowing fo r steam
s te r ilis a t io n . The valves may be re tro f it te d with feed back
information on valve seal positioning and e le c tr ic a l interlocking
f a c i l i t ie s . Calculations Indicated that the hold up volume was
around 12 mL in the valves. Two sample ports operated by manual APV
valves were positioned a fte r the homogenlser and a fte r the heat exchanger before the hoppers.One Important unit was an APV hygienic pressure release valve (APV
Gaul in , Crawley, West Sussex, UK) which was In sta lled Immediately
a fte r the homogeniser in order to provide a safeguard against back
175

pressure b u ilt up in the case of blockage in the heat exchanger w hils t the homogeniser was running. Although the homogeniser had its
own b u ilt - in burst disc (Section 7 .3 .1 ) , th is was designed to
release overpressure due to blockage within the valve I t s e l f ( ie
upstream). A pressure indicator comprised of a 63 mm hygienic
diaphragm gauge graduated in the range 0 - 0 . 4 MPa (Knowsley
Instrument services Ltd, Liverpool, UK) was also added in order to
allow the measurement of any back pressure. This also had the
unanticipated advantage of indicating the malfunction of the process
valves as some b u ilt up of pressure (although not large enough to
activate the release valve) could be easily detected.
In addition to the instruments related to the heat exchanger unit (Section 7 .7 ), two 100 mm d ia l thermometers (type VRS, Knowsley
Instrument services Ltd, Liverpool, UK) with 3/4 inch tri-c lam p
flanges were in sta lled in the p ipeline, one a fte r the homogeniser to
measure the temperature rise during homogenisation, and one at the
e x it from the heat exchanger.
7.7 Heat exchanger unit
The design of the heat exchanger unit was based on several c r ite r ia . I t was to be used for cooling the process stream and the jacketed
hoppers. No freezing of the product was permitted, minimum hold up
volume was desired and the unit had to f i t w ithin the space
allocated to the en tire homogenisation system. Hygienic operation
was required with consideration fo r possible containment.
The use of glycol as the cooling f lu id was considered. However, from
previous experience i t was known that unless a re lia b le , fas t responding control mechanism was used, the process stream was lia b le
to freezing in the heat exchanger. Furthermore the glycol was
supplied from a communal source in the plant and any possible
leakage of the process f lu id could not be contained. I t was
176

therefore decided to use ch illed water instead. A s e lf contained
c h illed water unit was designed with glycol as the coolant Figure
(7 .3 ) . This consisted of a glycol containing coil 1n a water bath. Allowance was made fo r possible b u ilt up of an ice film on the coil
without blockage of the sh e ll. The top of the water bath was covered
with a removable perspex lid to allow fo r the inspection of the
liq u id leve l. Water was recirculated by means of a centrifugal pump
suitable fo r low temperature flu id s (CR 2-20 v e rtica l in -lin e pump,
Grundfos Pumps Limited, Leighton Buzzard, Beds, UK). Due to
fluctuations in the glycol lin e pressure, a booster pump identical to that used for water recircu lation was in sta lled as 1t was
resistant to glycol corrosion. The temperature of the ch illed water
was kept constant at 3° C by contro lling the flow of glycol with a
Sarco temperature control unit (SBRA, Spirax Sarco Cheltenham, Gloucs, UK). I t consists of a sensor containing a temperature
sensitive f lu id which is connected via a c ap illa ry tube to a control valve actuator. The sensor was positioned 1n the o u tle t pipe from
the water heat exchanger. The expansion or contraction of the sensor f lu id would move the actuator piston to open or shut the control valve in sta lled in the glycol in le t pipe. A manual valve on the
sensor allowed for set point adjustment.
Within the constraints imposed by the in i t ia l c r ite r ia , several process heat exchangers were assessed. Based on data from other APV
three piston homogenisers (Hetherington et a l. 1971), a temperature
rise of 17.5° C per 100 MPa was expected. The process stream was to
be cooled to around 6° C. A co il type heat exchanger was considered
with the product passing through 10 meters of 1/4 inch c o il. Using
reducers, the co il ends would be welded to the larger 1/2 inch
process p ipeline. This would be a contained operation. Any possible
leak from the process stream into the water could also be contained
as the cooling water was recirculated and could be discharged into
a k i l l tank. The drawback of the design was large hold up volume
(over 160 mL). This could be reduced at the expense of an increase
in pressure drop creating a back pressure of around 0.2 MPa on the
177

TO PROCESS
HEAT EXCHANGER
FROM PROCESS HEAT EXCHANGER
© ® “
TO GLYCOL SUPPLY
FROM GLYCOL ^ „ SUPPLY{X3— « -
Figure 7.3 Chilled water u n it.
178

homogeniser. In normal operation th is does not cause any problems. However, fo r research studies on homogenisation, i t was desirable to
minimise extra variables.
Another p o ss ib ility was to use a miniature plate heat exchanger ( with a to ta l height of about 15 cm) which was to be marketed by APV
Baker fo r the home central heating market. I ts main feature was that the plates were welded together, thus making the unit suitable fo r
contained operation. This option had to be abandoned since, due to
the ra tio n a lisatio n plans of the company, the manufacture of the
unit was put under review. I t was however considered to weld the
plates of an existing small heat exchanger. The only reservation
about such a unit was the d if f ic u lty to clean the plates.
In view of the fact that the present operation was not contained, i t
was decided to choose a simple but functional ’o ff the s h e lf’ heat exchanger with the view to re tro f it t in g the co ll type heat exchanger in the fu ture . Based on the experience with the existing heat exchanger used with single piston homogeniser, a Junior Paraflow
plate heat exchanger (JNFLLP/1784, APV Baker Ltd, Crawley, WestSussex, UK) was selected consisting of a single ris ing pass (1 of 1fo r process, 1 of 2 fo r service). The advantages were small hold up
volume (56 mL) and hygienic design. The p o ss ib ility of blockage with
filamentous microorganisms was ruled out since previous experience
with Rhizopus nigricans and other mycella had been without any
s ig n ifican t problems. A fter commissioning, in i t ia l tests indicated
that with th is p articu la r homogeniser the temperature increase was
around 25° C per 100 Mpa which was much higher than expected even
though the pump power was the same as that of the three pistonhomogeniser previously used (hetherington e t a l . 1971). This was
a ttrib u ted to poor heat'd issipation to the environment by the 30 CD. The extra heat load was removed by increasing the heat transfer area
(1 of 2 fo r process, 1 of 3 fo r serv ice). The hold up volume was
Increased to 100 mL. However th is was s t i l l reasonably small in
comparison to other a lternatives previously considered.
179
A lin e diagram of the overall homogenisation system is illu s tra te d
in Figure (7 .4 ) . A photograph of the integrated system prio r to
in s ta lla tio n is shown in Figure (7 .5 ) .
7.8 Control panel
I t was desirable to allow the operator to control the homogenisation
process from a single monitoring position. For th is purpose, a
control panel was designed consisting of a frequency gauge together
with an adjustment d ia l to enable flow rate regulation. Manual switches to activate the pneumatic valves - including one for the
manual opening of the pressure release valve - and s tarters fo r the
glycol and the water pumps were also operated from the panel. Additional features included the alarm lig h t and mute connected to
the conductivity probe in the hoppers (Section 7 .5 .2 ) and an ammeter which was thought essential fo r routine checking of the pressure
gauge accuracy. The panel size was kept to minimum so that i t could
be mounted together with other parts of the homogeniser on a skid. The only piece of equipment separate from the integrated system was
the frequency drive unit and the main s tarters which could be
positioned anywhere in the p lant.
7.9 Steam s te r ilis a t io n and CIP
Provisions fo r steam s te r ilis a t io n of the system were made at two
points. The f i r s t was positioned at the most elevated position in
the pipeline above the hoppers (figu re 7 .5 ). This made the back
steaming of the process heat exchanger possible. I t also provided
steam access fo r future pressure vessels which would replace the
hoppers. I t was envisaged that these vessels would be steamed
through th e ir a ir in le t f i l t e r s . The second steam point was
positioned along the pipeline to the homogeniser 1n order to
s te r i l is e the 30 CD. A steam trap at the lowest point in the
180
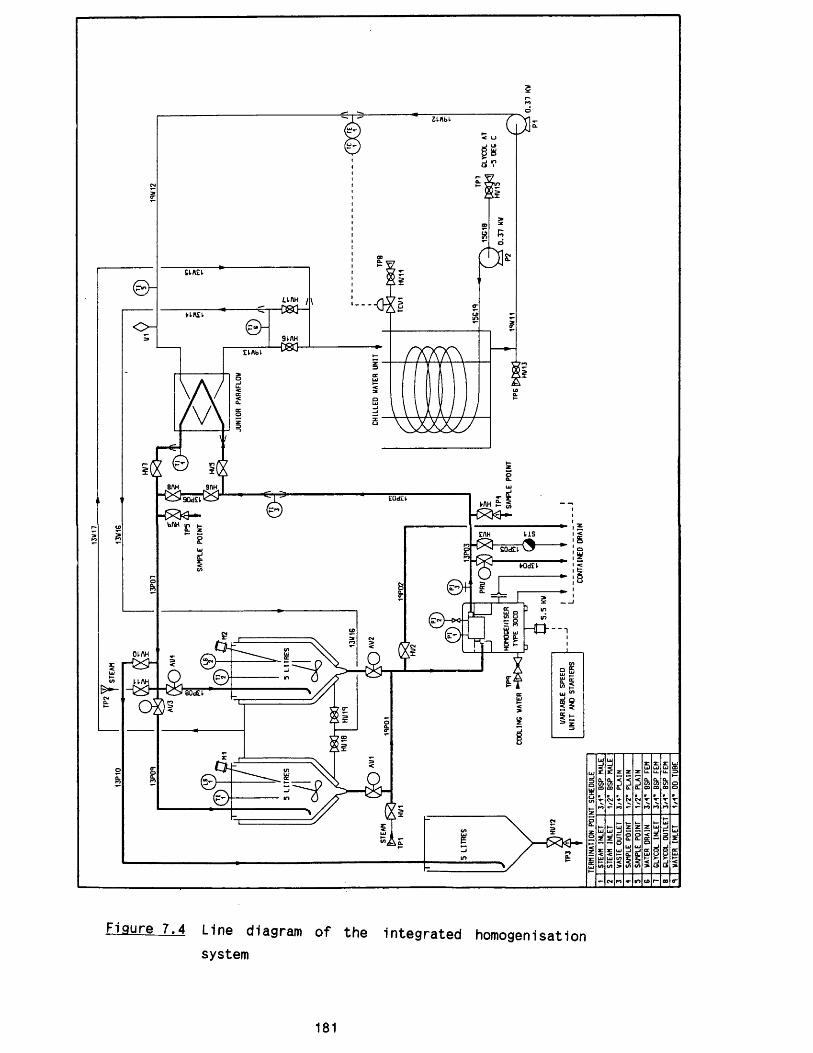
UAH l \
-080-
US
HD-
Figure 7.4 Line diagram of the integrated homogenisation system
181

Legend to Figure 7.4
AV Actuated Valve
HV Hand Valve
PRV Pressure Relief Valve
TCV Temperature Control Valve
TC Temperature Controller
TE Temperature Element
Tl Temperature Indicator
LS Level Signal
M Mixer
P Pump
PI Pressure Indicator
ST Steam Trap
TP Termination Point
V Vent
All pipes are identified by a letter indicating
the type of fluid they contain. The letter
is preceded by the size of the pipe in mm
followed by an arbitrary pipe number
182

Figure 7.5 Photograph of the integrated homogenisation
system (prio r to commissioning).
183

pipework allowed for condensate co llection from both steam lines. The water line fo r the lubrication and cooling of the homogeniser pistons, which was made of th in p las tic tubing, would be re tro fitte d
with steel piping to accommodate the steam s te r ilis a t io n of the
packing box.
At the steam termination points a three way valve and a non return
valve (not shown in Figure (7 .4 )) were in s ta lled to give access to
both soft water in the plant and steam. A by pass over the
homogenisation unit allowed for an increase in ve locity necessary
fo r cleaning the pipework. Drainage was provided to the edge of the
skid. For future CIP, i t was envisaged that a contained tank and
pipe would be necessary to recircu late 1% sodium hydroxide.
7.10 Conclusion - Future containment
In designing the present integrated homogenisation system, where
necessary, provisions were made or guidelines were drawn fo r the
future containment of the homogenisation process. Where appropriate, these were referred to in the design of Individual units 1n th is
chapter. In th is f in a l section, some of the sa lien t points are
summarised.
The 30 CD is one of few medium size homogenisers currently available
fo r applications in the biotechnology industry. Double gaskets with
leak detection at high pressure points minimise aerosol formation
and allow the immediate discovery of fa ile d seals. A ll the leak
pipings could be taken to one contained k i l l tank. Furthermore, lubricant water for the pistons could be recirculated w ithin a
closed u n it. The replacement of the present manually operated
pressure handwheel with a hydraulic actuator would enable the remote
operation of the homogeniser. This may be achieved in conjunction
with the fu l l automation of the existing hydraulic valves to control the flow in and out of the hoppers. These, in turn , would be
184

replaced by pressure vessels suitable fo r in s itu steam
s te r ilis a t io n . In the case where sampling is needed in between the
passes, sampling ports s im ilar to those used with fermenters may be
considered. However, fu rther evaluation o f th is aspect of
containment would be necessary, given the dynamics of discrete pass
operation. The process heat exchanger may be re tro fitte d with the
co il type equipment as outlined in Section 7 .7 .
185
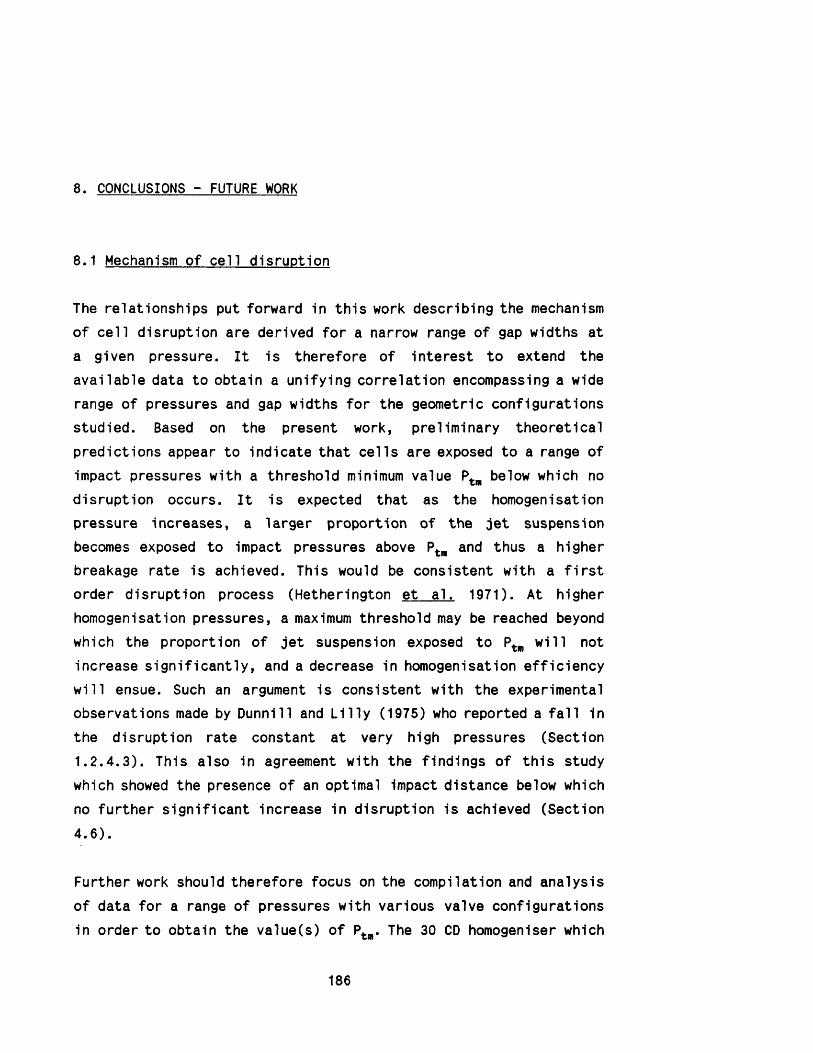
8. CONCLUSIONS - FUTURE WORK
8.1 Mechanism of c e ll disruption
The relationships put forward in th is work describing the mechanism
of c e ll disruption are derived fo r a narrow range of gap widths at a given pressure. I t is therefore of in terest to extend the
availab le data to obtain a unifying correlation encompassing a wide
range of pressures and gap widths fo r the geometric configurations
studied. Based on the present work, prelim inary theoretica l predictions appear to indicate th a t c e lls are exposed to a range of impact pressures with a threshold minimum value Ptm below which no
disruption occurs. I t is expected that as the homogenisation
pressure increases, a larger proportion of the je t suspension
becomes exposed to impact pressures above Ptm and thus a higher
breakage rate is achieved. This would be consistent with a f i r s t
order disruption process (Hetherington e t a l . 1971). At higherhomogenisation pressures, a maximum threshold may be reached beyond
which the proportion of je t suspension exposed to Ptll) w ill not increase s ig n ific a n tly , and a decrease in homogenisation e ffic ien cy
w ill ensue. Such an argument is consistent with the experimental observations made by Dunnill and L i l ly (1975) who reported a f a l l in
the disruption rate constant a t very high pressures (Section
1 .2 .4 .3 ) . This also in agreement with the findings of th is study
which showed the presence of an optimal impact distance below which
no fu rther s ig n ifican t increase in disruption is achieved (Section
4 .6 ) .
Further work should therefore focus on the compilation and analysis
of data fo r a range of pressures with various valve configurations
in order to obtain the value(s) o f PtBl. The 30 CD homogeniser which
186

is designed fo r ce ll disruption over a wide range of pressures is
well suited fo r the implementation of such a research programme.
8.2 P artic le sizing and valve design
The design of very high pressure homogenisers such as the 30 CD has
been a response, p a rtly , to the need fo r higher pressures to break
tougher microorganisms or release in tra c e llu la r m aterials not easily
accessible under milder conditions, and p a rtly , to the demand for
increasing e ffic ien cy and for minimising damage to the product by
reducing the number of passes. Each of these contentions, however, merits close scrutiny and therefore research is needed to establish
whether higher pressures with lower number of passes results in
optimal disruption conditions. This is p a rtic u la rly relevant in ce ll debris sizing as i t is necessary to investigate the way 1n which the
size d istributions of homogenised partic les change since, as
mentioned in Chapter 5, they are of importance to the centrifugal stage of downstream processing.
In general, smaller c e ll debris sizes are associated with higher
protein release, and knife edge valve units perform better than f la t
valve units. However, there is some indication that the f la t valve
(FV) results 1n larger partic les fo r equivalent protein release
compared with other geometries (Section 5 .2 .2 ) . These findings are
in teresting in th a t, together with Information on impingement, they
can form a basis fo r fu rther research into the optimised design of a homogeniser which can be used fo r scaled - down operations.
187

Appendix A Growth of Rhlzopus nigricans 1n fermenters
Fermentations were carried out 1n several baffled s tirred tank
reactors of d iffe re n t sizes as outlined 1n Section 2 .5 . Small scale
fermentations were performed 1n 14 L and 20 L fermenters
corresponding to 10 L and 15 L working volumes respectively. P ro files of these fermentations are Illu s tra te d 1n Figures A1 and
A2. For p ilo t scale fermentations, 42 L and 150 L vessels (working
volumes of 30 L and 100 L respectively) were used (Figures A3, A4
and A5).
Vigorous c e ll growth was obtained 1n the 100 L fermenter which 1s
reflected in the high levels of CER achieved. Furthermore, as
explained 1n Section 3 .3 .1 , the c e lls harvested from th is
fermentation showed d iffe re n t morphology, disruption properties and
were d i f f ic u l t to disrupt. Few factors may have contributed to the
differences observed between the growth pattern of these c e lls and
those cultured in the other fermenters. F irs t ly , the type of inoculum should be considered. A ll fermenters except the 100 L, were
inoculated with shake flask grown cultures. For the 100 L however, a 10 L fermenter grown seed culture was used. I t may be argued that these ce lls have already adopted to shear forces 1n the seed
fermenter and are therefore more robust when grown 1n the large
fermenter. As mentioned 1n Section 3 .3 .1 , shear conditions 1n the
fermenter resulting from d iffe re n t vessel geometry could also have
contributed to the changes observed. Furthermore, the aeration rate
1n the 100 L fermenter was higher than 1n other fermenters
contributing to the higher growth rate observed. The scale-up
features observed 1n th is study such as changes 1n c e ll morphology
were also experienced by other workers. Hanisch (1978) attempted to
scale up to 600 L (working volume) by using 5 L and 100 L
188

fermentations as consecutive seed cultures. P e lle t formation was
obtained. This was ascribed to the high ag ita tion ra te . The t ip
speed was reduced to 2 m/s. This resulted 1n th ick homogeneous
growth 1n the smaller vessels. However, the t ip speed reduction to
1.4 m/s 1n the 1000 L fermenter (600 L working volume) did not a lle v ia te the problem and p e lle t growth was s t i l l observed. Talboys
(1983) used shake flask grown c e lls as Inoculum fo r a 100 L fermentation. The t ip speed was set at 2.65 m/s with a low aeration
rate (0.1 WM). Some change in morphology was observed. The c e lls
consisted of fa t hyphae forming large matted clumps. However they
remained highly branched.
In view of the fac t that large quantities of ce lls are required fo r
disruption studies, the scale-up of Rhizopus nigricans fermentation
remains an in teresting problem. The use of a 42 L fermenter (30 L
working volume) resulted in adequate biomass fo r use 1n a single
piston homogeniser. For a larger capacity equipment, however, more
biomass may be necessary. This may be achieved by detailed
optimisation of fermentation in the 42 L fermenter and fu rth er
scale-up studies of 100 L fermentation.
189
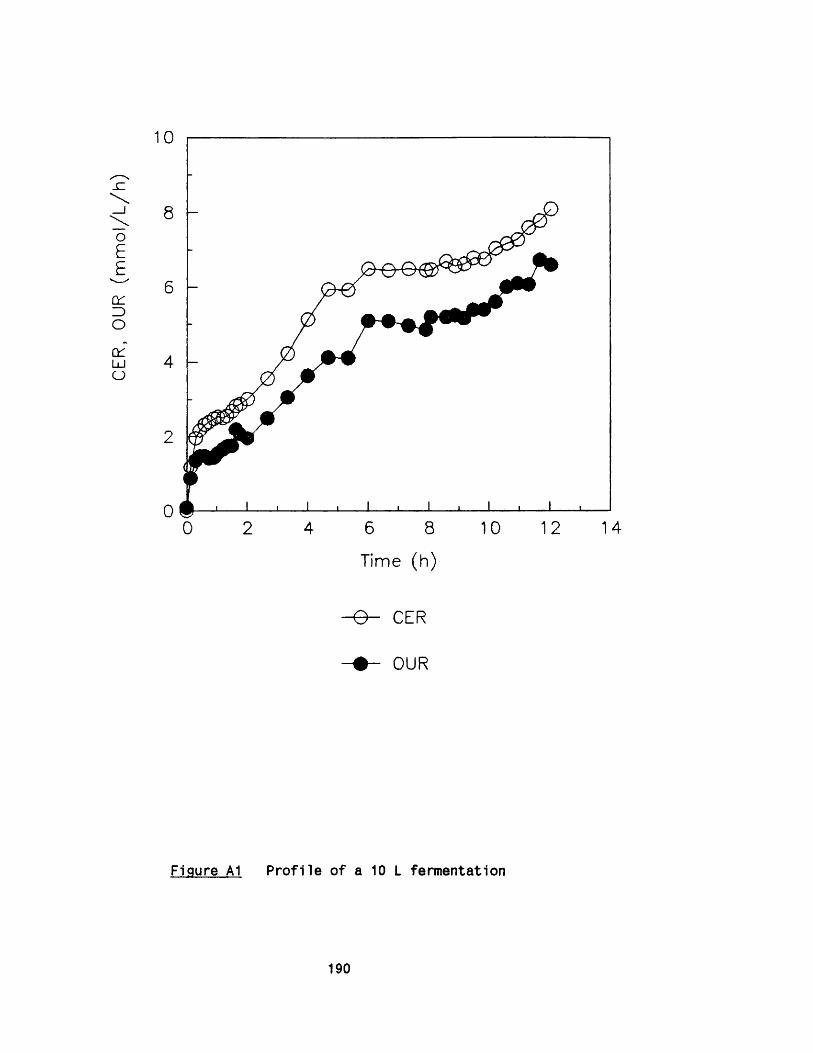
CER
, OU
R (m
mo
l/L
/h)
1 0
0 2 4 6 8 10 12 14
Time (h )
■ e - CER
OUR
Figure A1 P ro file of a 10 L fermentation
190

CER
, OU
R (m
mo
l/L
/h)
14
12
10
8
6
4
2
00 2 4 6 8 10 12 14 16
Time (h )
- © - CER
- e - o u r
Figure A2 P ro file of a 15 L fermentation
191

CER
, OU
R (m
mo
l/L
/h) 2 0
15
10
5
00 2 8 10 12 14 1664
Time (h)
■ e - CER
OUR
Figure A3 P ro file of a 30 L fermentation
192

CE
R,
OUR
(mm
ol/
L/h
) 20
5
0
5
010 12 14 1680 2 64
Time (h )
e - CER
♦ - OUR
Figure A4 P ro file of a 30 L fermentation (p e lle ted )
193
CER,
OU
R (m
mo
l/L
/h) 25
20
15
10
5
05 200 10 15
Time (h )
- © - CER
OUR
Figure A5 P ro file of a 100 L fermentation
194
APPENDIX B Application of Photon correlation spectroscopy (PCS)
The theory of PCS is based on recording the rate of lig h t in tensity
fluctuations when coherent monochromatic lig h t (eg. laser lig h t) 1s
scattered from p artic les 1n Brownian motion. The in ten sity 1s
In d ire c tly related to the phase of lig h t wave scattered from the
p a rtic le s , which 1n turn 1s dependent on the position of the
p artic le s . The in tensity 1s detected by a photom ultiplier and is
converted to an e le c tr ic a l s ignal. Signals are correlated with
delayed versions of themselves (hence, auto-corre lation) in a
corre lato r.
The form of a correlation function fo r a d iffusion process 1s
exponential in character. For a monosized p a rtic le , 1t would be a
pure exponential. Using a variable time expansion technique,1.e . a
process 1n which the correlato r operates at many sample times
simultaneously, the corre lato r measures a summed signal due to many
exponential functions combined together by a convolution process. The decay constant of the auto-correlation function is dependent on
the d iffus ion c o e ffic ie n t. The hydrodynamic radius of the p artic les
can therefore be derived via Stokes-Elnstein equation.
The Malvern 4700 which is based on a helium- neon continuous wave
laser lig h t source, contains a proprietary d is trib u tio n analysis
alogarithm which 1s essen tia lly model free (Malvern 4700 manual 1986). The instrument covers a size range ra tio of 100:1 which can
be reduced to 10:1 to increase data resolution, the results may be
presented as frequency or cumulative d istribu tions o f lig h t
in ten s ity , p a rtic le volume or p a rtic le number versus p a rtic le size.
195

B .1 Experiments with latex partic les
In order to understand and assess the a p p lic a b ility of the PCS
technique, a series of experiments with standard latex p artic les
were carried out.
Latex polystyrene p artic les in the range 0.1 to 1 pm (0.091 pm ±
0.0059, 0.305 pm ± 0.008 and 1.091 pm ± 0.0082) were measured. I t
was possible to tes t the resolution of a known bimodal d is trib u tio n
of the two closest p a rtic le sizes and also tes t the resolution of a
multimodal d is trib u tio n .
B.2 Monomodal d istributions
The latex partic les (10% solid contents) were d iluted in deionised
water (0.1 pm f i l te re d ) 804, 2010 and 5226 fold fo r 0.091, 0.305
and 1.091 pm sizes respectively. D ifferen t d ilu tions had to be used
fo r d iffe re n t sizes in order to elim inate m ultiscattering and also
p a rtic le in teraction which masks the Brownian motion of the
p artic les (Section B4). The theory of lig h t scattering which relates
the rate of lig h t scatter to the Brownian motion of p artic les in
suspension, assumes in f in ite d ilu tio n . Figures B1 and B2 show the
in ten sity d istribu tions for the three latex partic les mentioned
above. Figure B3 gives a typ ical output from the Malvern Instrument. I t must be noted that although the d istribu tions may be expressed in
terms of in ten s ity , volume or number of p artic les versus p a rtic le
size or d iffusion c o e ffic ie n t, the in tensity versus p a rtic le size is
recommended to be used fo r comparative studies. This 1s because the
scattering rate 1s very strongly dependent on p a rtic le s ize . The
instrument measures the in tensity d ire c tly which is then translated
into weight or number d is trib u tio ns . The mass transformation assumes
solid p artic les of equal density (since lig h t scattering is actually
sensitive to volume and not mass). This transformation u tilis e s a
scattering model which may re la te very
196

Intensity
Intensity
50
0.305 pm0.091 pm1052
10 20 50 100 200 500 1000 2000 5000Particle size ( nn, .) {log gra >50
10
5 1.091 pm
10 20 50 100. 200 . 500 1000 2000 5000Particle size ( nn. ) (log jra }Figure B1 In ten s ity d istrib utio ns fo r 0.091 pm, 0.305
pm and 1.091 pm latex partic les (a l l measured 1n separate suspensions).
197

0.091
20 59 100Particle size
500 1000 2000 5000( n«. ) -Cl in gra >
Figure B2 Cumulative in tensity undersize d istributionsfo r 0.091 pm, 0.305 pm and 1.091 pm latex

MALVERN AUTOMEASURE 4700
sam p le j 91nm l a t e x
L i v e D a ta -from C o r r e l a t o rT e m p e ra tu re 2 7 . 0 V i s c o s i t y 0 .8 5 1 3 R e f r a c t i v e Ind ex 1 .3 3 0 A n g le 9 0 .0
P a r t i c l e s i z e dis'i7 . 8 - 9 . 49 . 4 - 1 1 .4
1 1 .4 - 1 3 .81 3 .8 - 1 6 .71 6 .7 - 2 0 . 22 0 . 2 - 2 4 . 52 4 . 5 - 2 9 .72 9 . 7 - 3 6 . 03 6 . 0 - 4 3 . 64 3 . 6 - 5 2 . 85 2 . 8 - 6 4 . 06 4 . 0 - 7 7 . 57 7 . 5 - 9 3 . 99 3 . 9 - 1 1 3 .8
1 1 3 .8 - 1 3 7 .81 3 7 .8 - 1 6 7 .01 6 7 .0 - 2 0 2 . 32 0 2 . 3 - 2 4 5 . 12 4 5 . 1 - 2 9 6 .92 9 6 . 9 - 3 5 9 . 83 5 9 . 8 - 4 3 5 .94 3 5 . 9 - 5 2 8 . 15 2 8 . 1 - 6 3 9 . 86 3 9 . 8 - 7 7 5 . 1
b u t io n ( nm. ) Graph o f I n t e n s i t y d i s t r i b u t i o n
S i z e C la s s
7 . 8 - 9 . 49 . 4 - 1 1 .4
1 1 .4 - 1 3 .81 3 .8 - 1 6 .71 6 .7 - 2 0 . 22 0 . 2 - 2 4 . 52 4 . 5 - 2 9 . 72 9 . 7 - 3 6 . 03 6 . 0 - 4 3 . 64 3 . 6 ' 5 2 . 85 2 . 8 - 6 4 . 06 4 . 0 7 7 . 57 7 . 5 9 3 . 99 3 . 9 1 1 3 .8
1 1 3 .8 1 3 7 .81 3 7 .8 1 6 7 .01 6 7 .0 2 0 2 .32 0 2 .3 2 4 5 . 12 4 5 .1 2 9 6 . 92 9 6 . 9 3 5 9 .83 5 9 . 8 4 3 5 .94 3 5 . 9 - 5 2 8 . 15 2 8 . 1 6 3 9 . 86 3 9 . 8 7 7 5 . 1
V. by I n t e n s i t yUnder In Above0 . 0 0 . 0 1 00 .00 . 0 0 . 0 1 0 0 .00 . 0 0 . 0 1 0 0 .00 . 0 0 . 0 10 0 .00 . 0 0 . 0 10 0 .00 . 0 0 . 0 10 0 .00 . 0 0 . 0 10 0 .00 . 0 0 . 0 1 0 0 .00 . 0 0 . 0 100 .00 . 0 0 . 3 9 9 .70 . 3 4 . 9 9 4 .85 . 2 1 6 .0 7 8 .8
2 1 .2 2 4 .2 5 4 .64 5 .4 3 2 .7 2 1 .978 . 1 14. 1 7 . 89 2 .2 5 . 9 2 . 09 8 .0 2 . 0 0 . 0
1 0 0 .0 0 . 0 0 . 01 0 0 .0 0 . 0 0 . 01 0 0 .0 0 . 0 0 . 01 0 0 .0 0 . 0 0 . 01 0 0 .0 0 . 0 0 . 01 0 0 .0 0 . 0 0 . 01 0 0 .0 0 . 0 0 . 0
% by massUnder In Above0 . 0 0 . 0 1 0 0 .0
• 0 . 0 0 . 0 1 0 0 .00 . 0 0 . 0 1 0 0 .00 . 0 0 . 0 1 0 0 .00 . 0 0 . 0 1 0 0 .00 . 0 0 . 0 1 0 0 .00 . 0 0 . 0 1 0 0 .00 . 0 0 . 0 1 0 0 .00 . 0 0 . 0 1 0 0 .00 . 0 4 . 8 9 5 . 24 .8 1 5 .5 7 9 .7
2 0 .3 2 4 .9 5 4 . 84 5 .2 2 5 .4 2 9 .47 0 .6 1 8 .3 11 .18 8 .9 8 . 3 2 . 79 7 .3 2 . 2 0 . 59 9 .5 0 . 5 0 . 0
1 0 0 .0 0 . 0 0 . 01 0 0 .0 0 . 0 0 . 01 0 0 .0 0 . 0 0 . 01 0 0 .0 0 . 0 0 . 01 0 0 .0 0 . 0 0 . 01 0 0 .0 0 . 0 0 . 01 0 0 .0 0 . 0 0 . 0
'/. by numberUnder In Above0 . 0 0 . 0 1 0 0 .00 . 0 0 . 0 1 0 0 .00 . 0 0 . 0 1 0 0 .00 . 0 0 . 0 1 0 0 .00 . 0 0 . 0 1 0 0 .00 . 0 0 . 0 1 0 0 .00 . 0 0 . 0 1 0 0 .00 . 0 0 . 0 1 0 0 .00 . 0 0 . 0 1 0 0 .00 . 0 1 6 .9 83 . 1
1 6 .9 3 0 . 8 5 2 .34 7 .7 2 7 . 9 2 4 .47 5 . 6 1 6 .0 8 . 49 1 . 6 6 . 5 1 .99 8 . 1 1 .7 0 . 39 9 . 7 0 . 2 0 . 0
1 0 0 .0 0 . 0 0 . 01 0 0 .0 0 . 0 0 . 01 0 0 .0 0 . 0 0 . 01 0 0 .0 0 . 0 0 . 01 0 0 .0 0 . 0 0 . 01 0 0 .0 0 . 0 0 . 01 0 0 .0 0 . 0 0 . 01 0 0 .0 0 . 0 0 . 0
z A verag e Mean 8 6 .5 P o ly 0 .0 4 6 D i s t . mean 9 8 . 8 S t .D e v . 2 6 . 0 A n a l y s is ra n g e 100 : f i t i 0 .0 2 1 2
Run i c o u n t s /1 0 0 0 i % m e r i t t X in - r a n g e i Count r a t e 100 0 ’ s /s e c 7 2 3 3 5 9 .4 7 4 . 8 9 9 .2 2 7 8 .1
Figure B3 Typical data output from PCS Malvern 4700.
199

small signals to very large parts of the p a rtic le size d istrib u tio n
expressed by weight or number though not by the amount of lig h t the
p artic les scatter. Errors may therefore be introduced p a rticu la rly
fo r partic les over 0.5 pm in diameter.
B.3 Significance of parameters obtained in the results
Z average mean and polvdispersitv
The Z average mean of a monodisperse d is trib u tio n may be thought of as the size corresponding to the mean lig h t scattering response of that d is trib u tio n . The term "Z average” is used because no account is taken of the fac t that partic les of d iffe re n t sizes scatter
d iffe re n t amounts of lig h t. The Z average mean of a latex p a rtic le
dispersion is expected to agree well with the arithm etic mean of the
d is trib u tio n because of the narrowness of the d is trib u tio n . This is
generally true fo r standard latex p a rtic les .
The polydispersity index is a model free measure of the variance of the mathematical form of the auto-correlation function. The Z
average mean and polydispersity do not describe the form of the
d is trib u tio n ( i . e . monomodal or multimodal) except that i f
polydispersity is low (below 0 .1 ) i t means that the d is trib u tio n is
narrow.
Analysis range
I t is possible to set the range of p a rtic le sizes to be measured . This is ty p ic a lly 100:1 , which means that fo r a p a rtic le mean
diameter of 0.1 pm, the instrument measures a span of 0.01 to 1 pm. The range selected does not a ffec t the d is trib u tio n provided 1t is
wide enough to f i t a l l the information from the lig h t scattering
data. The reason fo r varying the range is to control the resolution
once the in ten sity d is trib u tio n is known.
200
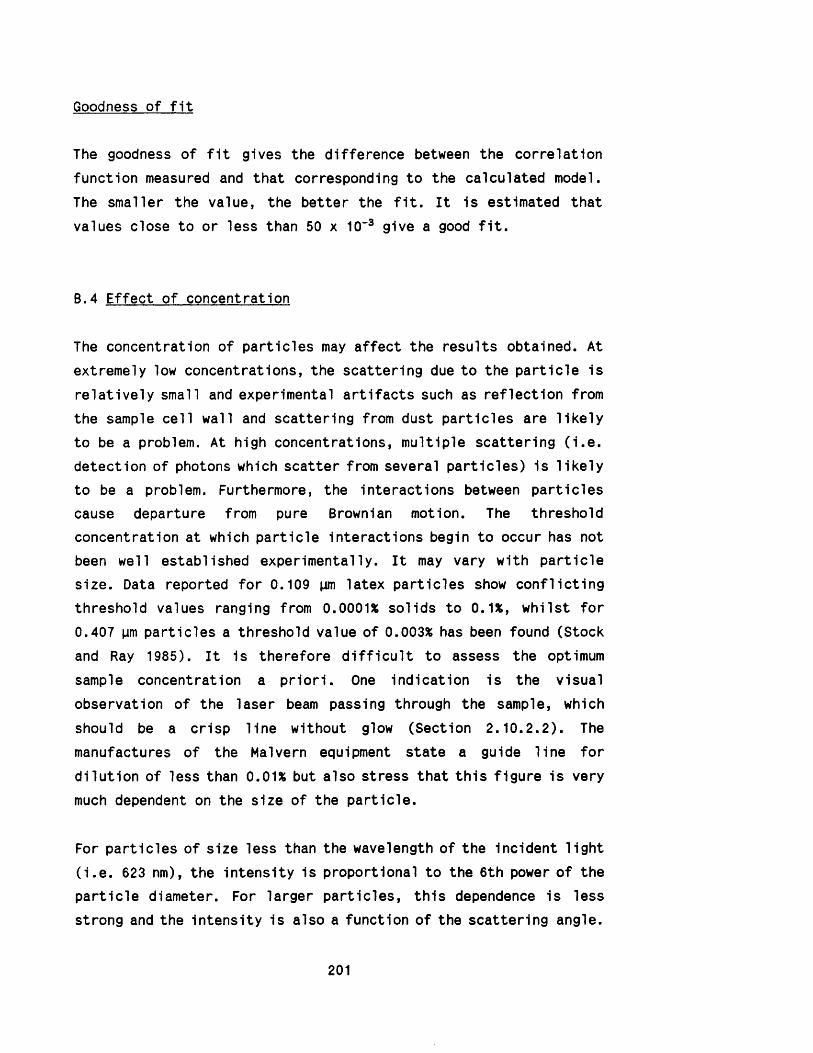
Goodness of f i t
The goodness of f i t gives the difference between the correlation
function measured and that corresponding to the calculated model. The smaller the value, the better the f i t . I t is estimated that
values close to or less than 50 x 10'3 give a good f i t .
B.4 Effect of concentration
The concentration of p artic les may a ffec t the results obtained. At extremely low concentrations, the scattering due to the p a rtic le is
re la tiv e ly small and experimental a r tifa c ts such as re flec tio n from
the sample ce ll wall and scattering from dust p artic les are lik e ly
to be a problem. At high concentrations, m ultiple scattering ( i . e . detection of photons which scatter from several p a rtic les ) is lik e ly
to be a problem. Furthermore, the interactions between p artic les
cause departure from pure Brownian motion. The threshold
concentration at which p a rtic le interactions begin to occur has not been well established experimentally. I t may vary with p a rtic le
size. Data reported fo r 0.109 pm latex p artic les show co n flic tin g
threshold values ranging from 0.0001% solids to 0.1%, w hilst fo r
0.407 pm partic les a threshold value of 0.003% has been found (Stock
and Ray 1985). I t is therefore d i f f ic u l t to assess the optimum
sample concentration a p r io r i. One indication is the visual observation of the laser beam passing through the sample, which
should be a crisp lin e without glow (Section 2 .1 0 .2 .2 ). The
manufactures of the Malvern equipment state a guide lin e fo r
d ilu tio n of less than 0.01% but also stress that th is figure is very
much dependent on the size of the p a rtic le .
For p artic les of size less than the wavelength of the Incident lig h t
( i . e . 623 nm), the in tensity is proportional to the 6th power of the
p a rtic le diameter. For larger p a rtic les , th is dependence is less
strong and the in tensity is also a function of the scattering angle.
201
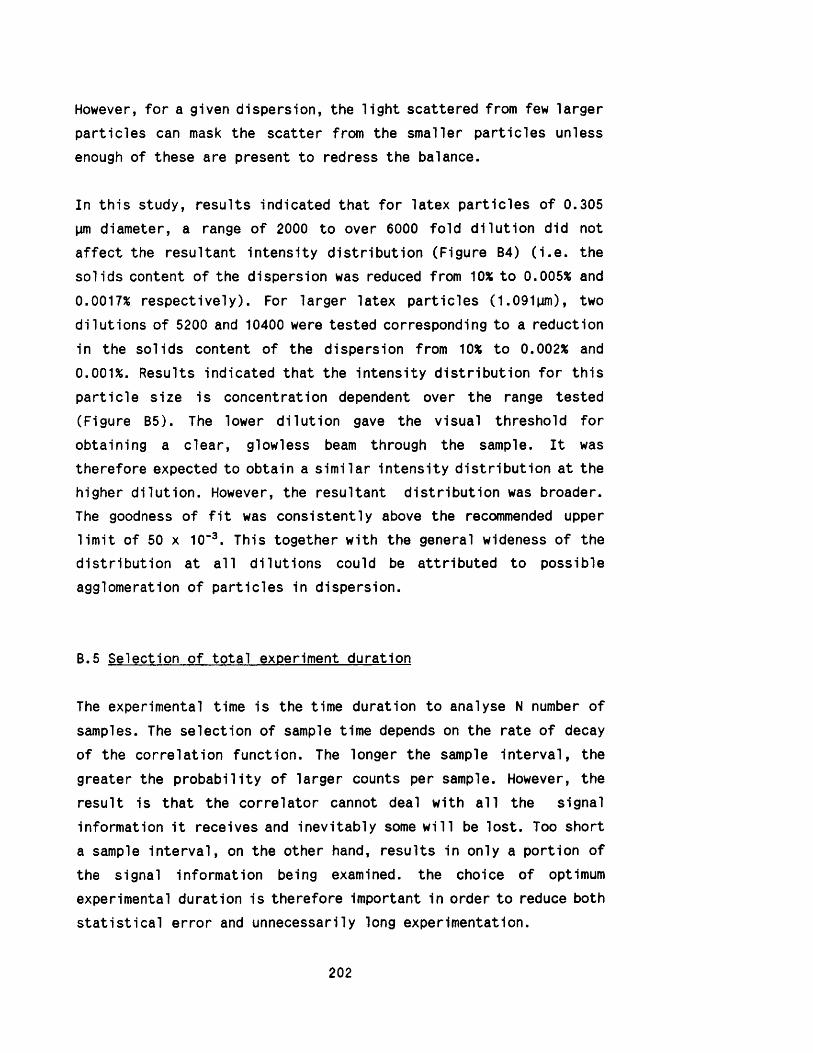
However, fo r a given dispersion, the lig h t scattered from few larger
partic les can mask the scatter from the smaller partic les unless
enough of these are present to redress the balance.
In th is study, results indicated that fo r latex partic les of 0.305
pm diameter, a range of 2000 to over 6000 fo ld d ilu tio n did not a ffec t the resultant in tensity d is trib u tio n (Figure B4) ( i . e . the
solids content of the dispersion was reduced from 10% to 0.005% and
0.0017% respectively). For larger latex partic les (1.091pm), two
dilu tions of 5200 and 10400 were tested corresponding to a reduction
in the solids content of the dispersion from 10% to 0.002% and
0.001%. Results indicated that the in tensity d is trib u tio n fo r th is
p artic le size is concentration dependent over the range tested
(Figure B5). The lower d ilu tio n gave the visual threshold for
obtaining a c lear, glowless beam through the sample. I t was
therefore expected to obtain a s im ilar In tensity d is trib u tio n at the
higher d ilu tio n . However, the resultant d is trib u tio n was broader. The goodness of f i t was consistently above the recommended upper l im it of 50 x 10-3. This together with the general wideness of the
d istrib u tio n at a l l d ilu tions could be a ttribu ted to possible
agglomeration of partic les in dispersion.
B.5 Selection of to ta l experiment duration
The experimental time is the time duration to analyse N number of samples. The selection of sample time depends on the rate of decay
of the correlation function. The longer the sample in te rv a l, the
greater the probab ility of larger counts per sample. However, the
result is that the correlator cannot deal with a l l the signal information i t receives and inevitab ly some w ill be lo st. Too short a sample in te rv a l, on the other hand, results in only a portion of the signal information being examined, the choice of optimum
experimental duration is therefore important in order to reduce both
s ta tis t ic a l erro r and unnecessarily long experimentation.
202

% in
tens
ity
ove
rsiz
e1 2 0
80
60
40
20 -
6 0 0 3150 20 0 3 0 0 4 0 0100
p a rt ic le size (n m )
A 6 0 3 0 fo ld d ilu t ion
A 2 0 1 0 fo ld d i lu t ion
Figure B4 E ffect of d ilu tio n on the In tensityd is trib u tio n of 0.305 pm latex p a rtic les .
203

% in
tens
ity
ove
rsiz
e1 2 0
1 0 0#
80
60
40
20
4 0 0 04 0 0 6 0 0 1000 1400 2 0 0 0
p a rt ic le size (n m )
O 5 2 2 6 fo ld d ilu t ion
0 1 0 4 5 2 fo ld d ilu t io n
Figure B5 E ffect of d ilu tio n on the In tensityd lstrinbutlon of 1.091 pm latex p artic les .
204

Larger partic les by v irtu e of th e ir slow motion require longer
experimental duration to provide adequate data fo r the correlato r. Figure B6 indicates that fo r submicron size partic les (e .g . 0.091um
diam eter), increasing the duration from 120 seconds to 300 seconds
did not a ffec t the d is trib u tio n s ig n ific a n tly . However, fo r 1.091 pm
p a rtic le s , an increase in the time from 120 seconds to 250 seconds
resulted in a comparatively better f i t (66.6 x 10"3 against 75.1 x
10"3) and less polydispersity (0.110 against 0.201) (Figures B7 and
B8).
B.6 Bimodal and polymodal d istributions
Experiments with latex p artic les demonstrated that with careful selection of instrument settings, the PCS was able to successfully
measure monodisperse d istributions (Figures B1, and B2). I t was also
possible to measure bimodal d is trib u tio ns . However, fo r polymodal d is trib u tio n s , information was truncated and presented as two peaks. This was to be expected as being the lim it of resolution of the
in s ta lled software.
The degree of resolution of two close p a rtic le sizes in a bimodal d is trib u tio n was tested using a dispersion containing 0.091 pm and
0.35 pm partic les (s ize ra tio 3 .35:1) (Figure B9(a) and B9(b)). I t
was not always possible to detect the bimodal nature of the
d is trib u tio n and at times i t was required to reduce the analysis
range from 100:1 to 10:1 before a bimodal trend became apparent.
For a mixture of 3 p a rtic le sizes (0.091 pm, 0.305 pm and 1.091 pm), a bimodal d is trib u tio n was obtained which truncated the results
towards the smaller size p artic les (Figure B10(a) and B 1 0 (b )).It
was found necessary to increase the experiment duration in order to
obtain s u ffic ie n t data fo r the larger partic les in the samples.
205

+ + + + + + + +
+ +
300 s
+ + + + +120 s v
T + i + [ + + + + ++ + / + V + + + ++ 1 + 1 + + + +
) 20 50 100 200 500 1000 2000 5000Particle size ( im. ) (log gra }
Figure B6 Effect of experimental duration on thein tensity d is trib u tio n of 0.091 pm latex
p artic les .

120 8
a r t i c l e s i z e d i s t r i b u t i o n ( n e . > G r a p h o f I n t e n s i t y d i s t r i b u t i o n1 2 3 . 7 - 1 5 2 . 3 ■+1 5 2 . 3 - 1 8 4 . 5 +1 8 4 . 5 - 2 2 3 . 5 ♦2 2 3 . 5 - 2 7 0 . 8 ♦2 7 0 . 8 - 3 2 8 . 1 ♦3 2 8 . 1 - 3 9 7 . 5 ♦3 9 7 . 5 - 4 8 1 . 5 ♦4 8 1 . 5 - 5 8 3 . 4 ♦5 8 3 . 4 - 7 0 6 . 87 0 6 . 8 - 8 5 6 . 38 5 6 . 3 - 1 0 3 7 . 4
1 0 3 7 . 4 - 1 2 5 6 . 91 2 5 6 . 9 - 1 5 2 2 . 81 5 2 2 . 8 - 1 8 4 4 . 91 8 4 4 . 9 - 2 2 3 5 . 12 2 3 5 . 1 - 2 7 0 7 . 92 7 0 7 . 9 - 3 2 8 0 . 73 2 8 0 . 7 - 3 9 7 4 . 63 9 7 4 . 6 - 4 8 1 5 . 44 8 1 5 . 4 - 5 8 3 4 . 05 8 3 4 . 0 - 7 0 6 8 . 07 0 6 8 . 0 - 8 5 6 3 . 18 . 5 6 E + 0 3 1 . 0 4 E + 0 4 +1 . 0 4 E + 0 4 1 . 2 6 E + 0 4
2 A v e r a g e Mean 1 2 5 3 . 1 P o l vA n a l y s i s r a n g e 1 00 : t i t
Run : c o u n t s / 1 0 0 0 s */. m e r i t :
0 . 2 0 1 D i s t . mean 1 . 7 3 E + 0 3 S t . D e v . 9 . 1 5 E + 0 2
V ^ T T - r a F q e : C o u n t r a t e 1 0 0 0 " s / s e c 9 4 . 2 2 1 6 . 9
250 8
l b u t i o n ( nm. ) G r a p h o f I n t e n s i t y d i s t r i b u t i is iz e d i s t r 1 5 2 .
- 1 8 4 . 51 8 4 . 5
2 7 0 . 82 2 3 . 52 7 0 . B
3 9 7 . 5481 .
7 0 6 . 85 8 3 . 48 5 6 .7 0 6 . 6
8 5 6 . 71 0 3 7 . 4
1 8 4 4 . 91 8 4 4 . 92 2 3 5 . 1
3 2 8 0 . 72 7 0 7 . 93 9 7 4 . 62 8 0 . 7
3 9 7 45 8 3 4 . 04 8 1 5 . 4
5 8 3 4 . 0 7 0 6 5 . 07 o 6 8 . 08 . 5 6E 1 . 0 4E +041 . 0 4 E + 0 4
z A v e r a g e Mean 1 2 0 4 . 6 P o l y 0 . 1 1 0 D i s t . me,A n a l y s i s r a n g e 1 00 : f i t : | o . 0 6 6 5 1
Run : c o u n t s / 1 0 0 0 : X m e r i t : ”/. i n - r a n g e : C o u n t r a t e 6 3 4 5 8 1 . 8 3 5 . 5 9 1 . 8 2 3 0 . 5
1 . 4 8 E + 0 3 S t . D e v .
1000’ s / s e c
7 . 3 7 E + 0
Figure B7 In tensity distributions for 1.091 Mm latex
partic les at 120 s and 250 s duration times.
207
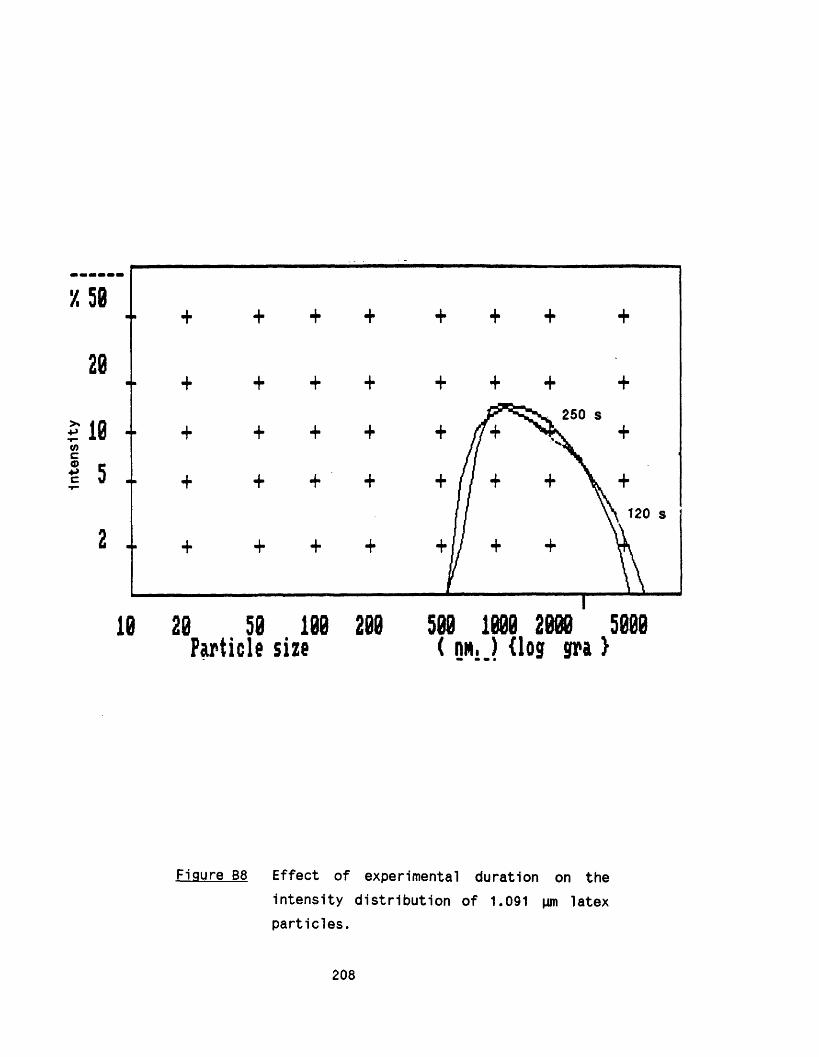
250 s
120 s
) 20 50 100 200 500 1000 2000 5000Particle size ( nn.J {log gra}
Figure B8 E ffect of experimental duration on the
in tensity d is trib u tio n of 1.091 pm latexp artic les .

Particle size distribution ( nm. ) Graph of Intensity distr ibution3 4 . 7 - 3 8 . 2 !+3 8 . 2 - 4 2 . 1 1+4 2 . 1 - 4 6 . 3 ! +4 6 . 3 — 5 1 . 0 I +5 1 . 0 - 5 6 . 1 !+5 6 . 1 — 6 1 . 8 ! +6 1 . 8 — 6 8 . 0 ! +
6 8 . 0 - 7 4 . 9 ! +7 4 . 9 - 8 2 . 4 ! ------------------------------ +8 2 . 4 - 9 0 . 7 1----------------------------------------------------+9 0 . 7 - 9 9 . 8 I ---------------+9 9 . 8 - 1 0 9 . 9 !+
1 0 9 . 9 - 1 2 1 . 01 2 1 . 0 - 1 3 3 . 1 : ----------------+1 3 3 . 1 - 1 4 6 . 5 ! ----------------------- +1 4 6 . 5 - 1 6 1 . 3 ! ---------------------------------- +1 6 1 . 3 - 1 7 7 . 5 ! ---------------------------------------------------------- +1 7 7 . 5 - 1 9 5 . 4 ! ------------------------------------------------------------------------------------------+1 9 5 . 4 - 2 1 5 . 1 J------------------------------------------------------------------------------------------------------------- +2 1 5 . 1 - 2 3 6 . 7 ! ------------------------------------------------------------------------------------------------------+2 3 6 . 7 - 2 6 0 . 6 ! f2 6 0 . 6 — 2 8 6 . 8 ! *■2 8 6 . 8 — 3 1 5 . 7 ! -------------------------------------- *■3 1 5 . 7 — 3 4 7 . 5 ! -----------------*■
z A v e ^ o e Mean 121.4 Poly 0.268 Dist. mean 198.3 St.Dev. 62.7Analysis ranoe 10 :fit : 0.0489
Run : counts/1000 : 7. merit : V. in-ranoe: Count rate 1000's /'sec 0 16780.0 75.1 99.5 233.1
Figure B9(a) Intensity d istribution of a mixedsuspension of 0.091 pm and 0.305 pm
latex partic les.
209
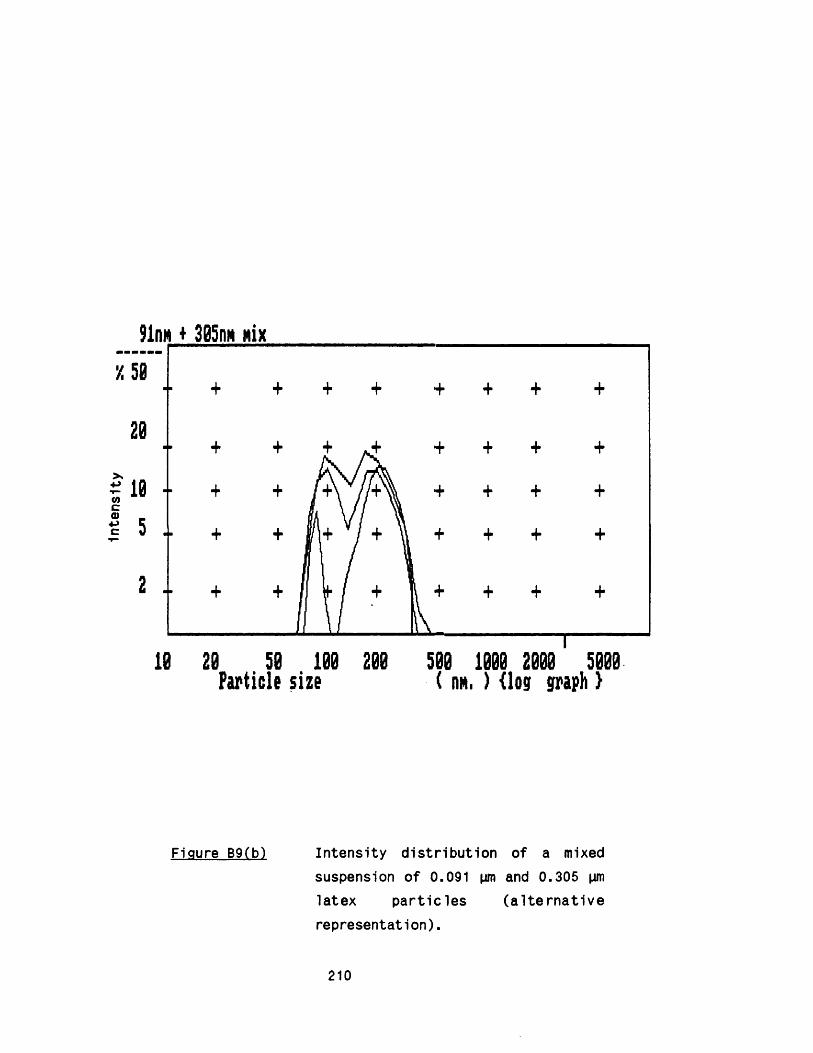
Inte
nsi
ty
♦ 305im Nix
10 20 50 100 200 500 1000 2000 5000Particle size ( i m . ) {log graph }
Figure B9(b) In ten s ity d is trib u tio n of a mixedsuspension of 0.091 pm and 0.305 pm
la tex p a rtic le s (a lte rn a t iv e
representation).
210

P a r t i c l e s i z e d i s t r i b u t i o n ( nm. ) Graph o-f I n t e n s i t y d i s t r i b u t i o n1 2 . 6 - 15. 2 +15. 2 - 18. 4 -f1 8 . 4 - 22. 4 +2 2 . 4 - 27. 1 +2 7 . 1 - 3 2 . 8 +3 2 . 8 - 3 9 . 7 +3 9 . 7 - 48. 2 +4 8 . 2 - 58 . 3 +5 8 . 3 - 70 . 7 +70 . 7 - 85 . 68 5 . 6 - 103. 7
103 . 7 - 125. 71 25 . 7 - 152. 31 5 2 . 3 - 184. 5184 . 5 -2 2 3 . 5 - 270 . 82 7 0 . 8 - 32 8 . 13 2 8 . 1 - 397 . 53 9 7 . 5 - 481 . 54 8 1 . 5 - 5 83 . 45 8 3 . 4 - 7 06 . 87 0 6 . 8 - 8 56 . 3 +8 5 6 . 3 - 1 0 3 7 . 4 +
1 0 3 7 . 4 - 1 2 5 6 . 9 +
0 . 3 8 5 D i s t . mean 2 4 2 . 7 S t . D e v . : 0 . 0 2 5 8’/. i n - r a n g e : Count r a t e 1 0 0 0 ' s / s e c
9 5 . 4 1 4 0 . 0
z A v e ra g e Mean 1 4 2 . 3 P o l vA n a l y s i s r a n g e 100 :fit
Run : c o u n t s / 1000 : */. m e r i t : 5 1 7 5 0 5 . 5 7 3 . 6
Figure B10(a) In tensity d istribution of a mixedsuspension of 0.091 pm, 0.305 pm and
1.091 |im latex partic les .
153. 2
211

Inte
nsi
ty
0.091 + 0 .3 0 5 MM + 1.091 p 4 .r' 1.091 IM
0.091 (in + 0 .3 05 <4 -/ 0 .3 05
0 .091
--------— I I ■ — ' ■ '■* ■■■ ' j '
10 20 50 100 200 500 1000 2000 5000Particle size < cm . ) <lin graph }
Figure B10(b) Cumulative in tensity undersize
d istribu tions fo r single and mixed
latex p a rtic le suspensions.
212

NOMENCLATURE
a pressure exponentd diameter mdm minimum diameter m6 c e ll wall strength N rrf2G mean velocity gradient s_1h valve gap width mK0 parameter fo r k inetic energy and viscous
losses (Equation 1.3)K disruption rate constantk disruption rate constant (Equation 1.1) Pa*L length of c ap illa ry mN pass numberP pressure Pa
pi i " P22 normal stress difference N m’ 2Ptm threshold minimum pressure PaP# stagnation pressure PaPv power dissipated per un it volume W m“3Q flow rate m3 s"1r radial position in a c a p illa ry mR e x it zone radius (Figure 6 .1 ) mRe Reynolds numberR,,, maximum protein released mg/g packed c e lls or
mg/mg c e ll dry weight R0 entry zone radius (Figure 6 .1 ) mRp soluble protein released mg/g packed c e lls or
mg/mg c e ll dry weightU e x it ve loc ity m s"1UG entry ve loc ity m s-1X impact distance m
213

a entry loss factora ’ e x it loss facto r0 kinematic v lscocity m2 s”1o density kg irf3
x shear stress N rrf2xm maximum wall shear stress N m"2\i viscosity Pa s
ABBREVIATIONS
ADH alcohol dehydrogenaseCD Cell Disruption unitCER Carbon dioxide evolution rateCR Cell Rupture unitCRF Cell Rupture type and f la t valve rodFV f la t valve unitKE Knife-edge unitOUR Oxygen uptake ratePCS Photon correlation spectroscopy
214

REFERENCES
Aldermann, B ., Hofer, H. J.Gen.Microbiol. 1984, 130, 711-723
APV-Gaul1n Technical B u lle tin 1985, 74
Augenstein, D.C., Thrasher, K ., Sinskey, A .J ., Wang, D .I.C . Biotechnol. Bloeng. 1974, 16,1433-1447
Asenjo, J .A ., Dunnlll, P. Biotechnol.Bloeng. 1981, 23, 1045-1056
Asenjo, J .A ., Andrews, B.A., Hunter, J .B ., Lecorre, S. Process Biochem. 1985, 20, 158-164
Bergmeyer, H .V ., Grabl, M., Walter, H.E. 1n Methods of EnzymaticAnalysis 1983 (Bergmayer, H .V ., e d .) , verlag Chemle, Weinhelm, 139— 140
Beltaus, S. and Rajaratnam, S. Proc. ASCE J.Hydraul. D1v. 1974, 100. 1313-1328
Berskvar, K. and Hudnlk-Plevnik, T. J.Steroid Biochem. 1981, 14. 395-391
Blanchardie, P ., Carde, J .-P ., Cassagne, C. B io l.C e llu la ire 1977,30, 127-136
Brookman, J.S.G. Biotechnol. Bioeng. 1974, 16, 371-383
Brookman, J.S.G. Biotechnol.Bioeng. 1975, H , 465-479
Brookman, J.S.G. Ph.D. thesis 1977, University of Wales, C ard iff, U.K.
C h ls ti, J.A. Moo-Young, M. Enzyme Microb.Technol. 1986, 8, 194-204
Claude, A ., Science 1940, 77, 91
Claude, A. 1n Microsomes and Drug Oxidations 1969 (G il le t te , J.R. e t a l . . e d s .), Academic Press, New York, 3
Coakley, W.T., Bater, A .J ., Lloyd D. Adv. Microb. Physiol. 1977, 16, 279-341
215
Currie, J .A ., Dunnill, P ., L i l ly , H.D. Biotechnol.Bioeng. 1972, 14, 725-736
Darbyshire, J. in Topics 1n Enzyme and Fermentation Biotechnology 1981 (Wiseman, A. e d .) , 5, E ll is Horwood, Chichester, 147-186
Depierre, J.W., Enster, L ., 1n Hicrosomes, Drug oxidation and Chemical carcinogenesis 1980 (Coon e t a l . . eds), 1 , Academic Press, New York, 431-440
Doulah, M.S., Hammond, T .H ., Brookman, J.S.G. Biotechnol.Bioeng. 1975, 17, 845-858
Doulah, M.S. Biotechnol.Bloeng. 1977, 19, 649-660
D unnill, P. Proc.IV IFS Ferment.Technol. Today 1972, 187-194
D unnill, P. Process Biochem. 1983, 18, 9-13
D unnill, P ., L i l ly , M.D. 1n Single Cell Protein I I 1975 (Tannenbaum, S.R ., Wang, D .I.C ., e d s .), MIT Press, Cambridge, MA U .S.A ., 179-207
Edebo, L. Ferment.adv. 1969, 249-271
Edebo, L. 1n Enzyme Technology 1983 (L a ffe rty , R.M., e d .) , Springer- Verlag, Heidelberg, 93-114
Edebo, L. and Magnusson K.-E. Pure Appl. Chem. 1973, 36> 325-338
Elsworth, R ., M ille r , G.A., Whitaker, A .R ., Kitchlng, D ., Sayer, P.D. J.Appl.Chem. 1968, 18, 157-166
Engler, C.R. Ph.D. thesis 1979, University of Waterloo, Ontario, Canada
Engler, C.R. in Comprehensive Biotechnology 1985 (Moo-Young, M .,e d .), 2, Pergamon Press, Oxford & N .Y ., 305-324
Engler, C .R., Robinson, C.W. Biotechnol.Bloeng. 1981a, 23, 765-780
Engler, C .R., Robinson, C.W. Biotechnol. L e tt. 1981b, 3, 83-88
Fraser, D. Nature 1951, 167, 33-34
Follows, M ., Hetherlngton, P .J ., D unnill, P ., L i l ly , M.D. Biotechnol.Bloeng. 1971, 13, 549-560
Gardiner, S.A.M., O lbrich, R ., Marston, F.A .O ., F1sh, N.M., Hoare, M., Proc. 4th European Congress on Biotechnol 1987, 2, 541-544
Gleason, F.H. Mycologia 1971, 63> 906-910
Gleason, F.H. Mycologia 1976, M i 426-429
216

Gosh, D. and Samanta, T.B. J. Steroid Biochem. 1981, 14, 1063-1067
Gray, P .P ., Dunnill, P ., L i l ly , M.D. Proc.IV IFS Ferment.Techno1. Today 1972, 347-351
Gray, P .P ., Dunnill, P ., L i l ly , M.D. Biotechnol.Bloeng. 1973, 15. 309-320
Greene, R .V ., Gould, J.M. Arch.Biochem.Biophys. 1984, 228. 97-104
Hanisch, W.H. Ph.D. Thesis 1978, University of London, London, U.K.
Harrison, J.S. Process Biochem. 1967, 2, 41-45
Hetherington, P .J ., Follows, M., D unnill, P ., L i l ly , M.D.Trans.Instn.Chem.Engrs. 1971, 49, 142-148
Hedenskog, G. and Mogren, H. Biotech.Bloeng. 1973, 15, 129-141
Higgins, J .J . , Lewis, D .J ., Daley, W.H., Mosqueira, F.G ., Dunnill, P ., L i l ly , M.D. Biotechnol.Bloeng. 1978, 2£, 159-182
Hoare, M., Dunnill, P. The Chemical Engineer 1986, 39-41
Hughes, D.E. B rit.J .E xp .P atho l. 1951, 32, 97-109
Hughes, D.E. J.Biochem.Microbiol.Engng. 1961, 3, 405-433
Hughes, D.E. and Cunningham, V.R. 1n Biochem. Soc. Symp. 1963, £3, 8-19
Hughes, D .E ., Wimpenny, J.W .T., Lloyd, D. 1n Methods 1n M icrobiol.1971 (N orris, J .R ., Ribbons, D.W., ed s .), 5B, AcademicPress, N .Y ., 1-54
Kane, J .F ., H artley, D.L. Trends 1n Biotechnol. 1988, 6, 95-101
Kawaguchi, T. B u ll. JSME 1971, 14, 355-363
Kltamura, K. and Tanabe,K. Agr1c.B1ol.Chem. 1982, 46, 553-554
Kramer, P ., Bomberg, A. Poster 1n Proc. Engineering Foundation IV Conf. on Recovery of Bioproducts 1988a
Kramer, P ., Bomberg, A. Chem.-Ing.-Tech. 1988b, 60, 776-778
Kurzhals, H .-A ., Ph.D. Thesis 1977, Tech.Univ., Hannover, W.G.
Liu, L .-C ., Prokopakis, G .J ., Asenjo, J.A. Biotech.Bioeng. 1988, 32, 1113-1127
L i l ly , M.D. and Dunnill, P. 1n Fermentation Advances 1969 (Perlman, D., e d .) , Academic Press, London, 225-247
217
L1mon-Lason, J . , Hoare, H . , Osborn, C.B., Doyle, D .J ., Dunnill, P. Biotechnol.Bloeng. 1979, 21, 745-774
Loo, C.C. and Carlton, W.M. J.Dairy Sc1. 1953, 36> 64-75
Lowry, O.H., Roseborough, N .J ., Farr, N .J ., Randall, R.J. J.Biol.Chem. 1951, 193, 265-275
HcKillop, A .A ., Dunkley, W.L., Brockmeyer, R .L ., Perry, R.L. J. Dairy Sci. 1955, 273-283
Hagnusson, K.E. and Edebo, L. Biotechnol.Bloeng. 1976a, 18, 449-463
Magnusson, K.E. and Edebo, L. Biotechnol.Bioeng. 1976b, 18, 865-883
Hagnusson, K.E. and Edebo, L. Biotechnol.Bioeng. 1976c, 18, 975-986
Marston, F . , Lowe, P .A ., Doel, H .T ., Schoemaker, J .H ., White, S .,Angal, S. Bio/Technol. 1984, 2, 800-804
Mohr, K.-H. LebensmlttelIndustrie 1980, 27, 399-403
Mohr, K.-H. J.Food Engng. 1987a, £ , 177-186
Mohr, K.-H. J.Food Engng. 1987b, 6, 311-324
Mosqueira, F .G ., Higgins, J .J . , D unnill, P ., L i l ly , M.D. Biotechnol.Bioeng. 1981, 23, 335-343
Mulder, H. and Walstra, P. 1n the M1lk Fat globule : Emulsion Science as Applied to Milk Products and Comparable Foods 1974,C.A.B., Farnham Royal and Pudoc, Wagenlngen, Chapter 9
N1ss1nen, V .J ., Markkanen P. Poster Third Eng. Foundation in Recovery of Bioproducts 1986, Uppsala, Sweden
Pandolfe, W.D. J.Dairy Sci. 1982, 65> 2035-2044
Phipps, L.W. Nature 1971, 2M , 617-619
Phipps, L.W. J.D airy Research 1974, 41* 1“8
Phipps, L.W. J. Phys. D: Appl.Phys. 1975, 8, 448-462
Ramaley, R.F. 1n Advances 1n Applied Microbiology 1979 ( Perlam D ., e d .), 25, Academic Press, N .Y ., 37-55
Sadler, A.M., Winkler, M., Wiseman, A. Chem.Eng.J. 1985, 80b, 43-49
218

Scawen, M.D., Atkinson, A. Darbyshlre, J. 1n J.Applied Protein Biochemistry 1980 (Grant, R .A .,e d .), Applied Science Publishers, London, 281-325
Schutte, H ., Kroner, K.H., Hustedt, H ., Kula, M.R. Enzyme MIcrob.Technol. 1983, 5, 143-148
Schutte, H. and Kula, M.R. Enzyme Mlcrob. Technol. 1988, 10, 552- 558
Scully, D.B. Biotechnol.Bloeng. 1975, 17, 1545-1550
Scully, D.B. and Wimpenny, J.W.T. Biotech.Bloeng. 1974, 16, 675-687
Seva, R ., Fieschko, J . , Sachdev, R ., Mann, M. Proc. Society Ind .M icrob io l. 1986
Smeds, A .L ., Enfors, S.-O. Enzyme Miocrob.Technol. 1985, I , 601-605
Stock, R.S. and Ray, W.H. J.Polymer Sci. 1985, 23, 1393-1447
Su, Z.G ., Kleinzen, H .H ., van Brakel, J . , Weesellngh, J.A. Proc. 4th European Congress on Biotechnol. 1987, 2, 554-557
Talboys, B.L. Ph.D. thesis 1983, University of London, London, U.K.
Talboys, B .L ., D unnill, P. Biotechnol.Bioeng. 1985, 27, 1726-1729
Tangen, 0 . , Jonsson, J . , Orrenius S. Anal.Biochem. 1973, 54, 597- 603
Taylor, G ., Hoare, M ., Gray, D.R., Marston, F.A.O. Bio/Technol. 1986, 4, 553-557
Thomas, V. Ph.D. thesis 1988, University of London, London, U.K.
Thorpe, N.O. Cell Biology 1984, J.Wisely & son, N.Y.
Tomlnaga, Y ., Tsujisaka, Y. Agr.Biol.Chem. 1981, 45, 1569-1575
Tsang, S ., Lee, C .-H ., Kyun Rha, C. J.Food Sc1. 1979, 44» 97-99
V lrkar, P .D ., Narendranathan, T .J ., Hoare, M., Dunnill, P. Biotechnol.Bioeng. 1981, 23, 425-429
Walstra, P. Neth. Milk Dairy J. 1969, 23, 290-292
Wase, D.A.J. and Patel, Y.R. J.Chem.Tech.Biotechnol. 1985, 35B, 165— 173
Washington, C. Laboratory Equipment Digest 1987
219

Washington, C ., Davis S .S ., Intern.J.Pharmaceutics 1988, 44, 169— 176
Whitworth, D.A. Compt.Rend.Trav.Lab. 1974a, Carlsbeg, 40» 19-32
Whitworth, D.A. Biotechnol.Bloeng. 1974b, 16, 1399-1406
Wiley, W.R. Methods 1n Enzymology 1974, 31» 609-626
Wiseman, A. Process Biochem. 1969, 4, 63-65
Wlmpenny, J.W.T. Process Biochem. 1967, 2, 41-44
Woodrow, J .R ., Quirk, A.V. Enzyme Microb.Technol. 1982, 4, 385-389
Yoneya, T. and Sato, Y. Appl.Environ.Microbiol. 1980, 40, 967-969
Z ete lak i, K. Process Biochem. 1969, 4, 19-22 and 27
Zomer, E ., E r-E l, Z ., Rokem, J.S. Enzyme microb. Technol. 1987, 9, 281-284
220