Embed Size (px)
Citation preview

AJCE, 2019, 9(1) ISSN 2227-5835
18
STUDENTS’ MISCONCEPTIONS OF ACID-BASE TITRATION
ASSESSMENTS USING A TWO - TIER MULTIPLE-CHOICE
DIAGNOSTIC TEST
Sri Supatmi, Arif Setiawan, and Yuli Rahmawati*
Chemical Education Study Program, Universitas Negeri Jakarta, Indonesia
*Email: [email protected]
ABSTRACT
The paper portrays students' misconceptions of acid-base titrations using two a tier
diagnostic test. The analysis will inform chemistry teaching and learning, especially about acid-
base concepts. The data were collected through a two-tier diagnostic test with 10 stratified multiple
choice questions that have been analysed for item validity (rphi = 0,415) and construct validity (V
= 0,98) which show that it a valid instrument. Open questions were administered to explore
students’ misconceptions. The results showed that 33.50% of students held misconceptions of
acid-base titrations in the curriculum. The highest percentage of misconceptions were on acid-base
titration indicators, with 40,42% students being more familiar with phenolphthalein for NaOH and
HCl titrations than with bromothymol blue. This misconception is sourced from chemistry
teaching due to limited understanding of acid-base concepts and the lack of titration practicum in
the laboratory with various indicators and types of titration. The lowest percentage of students’
misconceptions at the endpoint of the titration was 11.25% of the students having a good
understanding of the endpoint of the titration although some students still have difficulty in
distinguishing between the endpoints of a titration and the equivalent point. The results show that
the students should have deep understanding of acid-base reactions before learning acid-base
titrations. [African Journal of Chemical Education—AJCE 9(1), January 2019]

AJCE, 2019, 9(1) ISSN 2227-5835
19
INTRODUCTION
Students have difficulty in understanding about chemistry because of chemistry concepts
[31]. The difficulty is also caused by the complexity chemistry calculations, the language that is
rarely used in everyday life and the different levels of representation used by experts in explaining
chemical phenomena [30]. The students’ prior knowledge also influences students understanding
of chemistry concepts [9]. Students' prior knowledge was developed through their interaction with
the environment before classroom learning with usually faulty concepts or narrow understanding
of complex concepts called misconceptions [15].
A misconception is defined as a phenomenon that students’ have different concepts from
true concepts [2] [13] [20]. The students’ misconception are caused by teachers, textbooks, context
and learning methods [2]. This pre-conception is developed because students misinterpret the
symptoms or events that occur in everyday life [16]. The misconceptions come from teachers who
are less directional in teaching and learning process so that students are wrong in interpreting a
particular concept [4]. Misconceptions can also come from teachers who have misconceptions on
certain chemical concepts. This was stated in a study that found a misconception equation between
students of 8th grade and prospective teachers, this indicates that the misconceptions possessed by
students are derived from the misconceptions of their teachers [5]. In addition, students try to
interpret or create their own concepts that sometimes do not fit with the actual concept, thus raising
the wrong concept in the minds of the students [9]. The existence of these misconceptions can be
fatal because chemical concepts are taught in a hierarchical way from easy to difficult concepts,
from simple to complex concepts so that if simple concepts are wrongly interpreted, more students
will experience mistakes in understanding the complex concepts of chemistry [20].

AJCE, 2019, 9(1) ISSN 2227-5835
20
Misconceptions can be the result of the students showing decreasing levels of
understanding, so that misconceptions needs to be improved. Before the misconceptions be
improved, what needs to be done is to identify the misconceptions. One technique for diagnosing
student misconceptions is by administering a diagnostic test. For that reason, there is a needs for
an instrument that can identify misconceptions [1].
The techniques used to identify misconceptions included observations, descriptions, fact-
and-event interviews, conceptual interviews, word associations, and diagnostic tests. The most
commonly used techniques are diagnostic tests [17] [29] [36]. One of diagnostic test is the Two-
Tier Muliple Choice (TTMC) test. The TTMC is a two-tiered double-choice diagnostic test first
described by Davis F Treagust in 1998. The Two-tier diagnostic test is a multiple-choice test
consisting of two-tier selections. The first tier contains a number of answer choices, whereas the
second tier contains a number of choice reasons for the selected answer on the previous tier [6].
The reasons given consisted of one correct answer and the distractor. Students should choose the
reason on the second tier to provide reinforcement of the multiple-choice answers provided. This
makes the two tier diagnostic test effective in measuring students’ 'level of understanding and to
identify students' thinking and reasoning [3]. One of the advantages of two-tier dual choice versus
conventional dual choice tests is to reduce errors in measurement. The use of conventional
multiple-choice tests provides a true answer by guessing by 20%, whereas if using a two-tier
multiple choice test the chance to answer correctly by guessing is reduced by 4% [33]. This two-
tier diagnostic test can be used to help teachers evaluate the misconceptions caused by previous
teaching and plan follow-up learning based on the test results [24]. The limited use of two-tier
diagnostic tests has been due to the lack of time and lack of knowledge in the development of
multiple-choice test development [32].

AJCE, 2019, 9(1) ISSN 2227-5835
21
Titration of acid-base is one of the materials in class XI IPA during the even semester which
according to students is difficult, because the material demands students' understanding of acid-
base material, salt hydrolysis and buffer. The acid-base material is a relatively difficult material
[8] [11] [21] [27]. The concepts contained in solid acid base materials are conceptually and require
an understanding that is integrated into many chemical introductory concepts such as particle
characteristics in matter, the properties and composition of solutions, atomic structures, ionic and
covalent bonds, symbols, formulas and equations of reactions, ionization and equilibrium [30].
While salt hydrolysis material is an abstract material and buffer material (buffer) is a material that
is conceptual. Both materials require students' understanding in macroscopic, microscopic and
symbolic forms [10] [22]. Characteristics of acid-base material, salt hydrolysis and the buffer
solution causes students to have difficulty in understanding it. Difficulties in studying these three
materials must have an impact on students' difficulties in studying acid-base titration material,
because the three materials underlie acid-base titration material. The difficulties of students in
studying acid-base titration material are seen from the number of students who obtained daily test
scores below the minimal mastery criteria at the school where the study took place.
There has been a study of misconceptions in students using diagnostic tests. The result of
the analysis of acid-base material misconceptions with two-tier tests found that students have
difficulty in understanding acid-base material [3] and most students have difficulty in
understanding the pH concept as well as a small number of students who have difficulty in pH
calculations [26]. Two-tier diagnostic test instruments have been developed on acid-base material
by the Plomp’s methods with the stages of prelimenary investigation; design; realization; test,
evaluation and revision [34]. The misconception analysis on salt hydrolysis material found that in
general the students were able to infer the properties of the salt solution but it was difficult to write

AJCE, 2019, 9(1) ISSN 2227-5835
22
the equation of their hydrolysis reaction with the source of the school learning, misconceptions of
previous learning in chemical equilibrium, acid base and material structure and lack of practice in
the laboratory [23]. Analysis of misconceptions of buffer solutions also found that students have
difficulty in understanding buffer solutions conceptually because students were unable to visualize
buffers on the submicroscopic scale [22]. In the misconception analysis of the thermochemical
material, misconceptions that occur in students in the form of theoretical, correlational, and
classical concepts. The causes of misconceptions are less learning motivation and improper
preconception of students, lack of interaction between teacher and student, less handbook complete
and difficult to understand and learning methods that do not lead to the formation of concepts [35].
The use of a two-tier acid diagnostic test instrument is expected to identify students’
misconceptions on acid-base titration materials, since acid-base titration material is a complex
material requiring students' understanding of acid-base matter, salt hydrolysis and buffers and the
importance of a teacher's ability to identify misconceptions in students then conducted research on
"Students Misconceptions of Acid Base Titration Assessment Using a Two Tier Multiple Choice
Diagnostic Test".
METHODOLOGY
This study was conducted on the even semester of the academic year 2017/2018 in April -
May in one of the private high schools in North Jakarta. Subjects in this study were students of
class XI IPA consisting of 80 students. The study was conducted by giving a written test using a
two-tier diagnostic test instrument given to students to analyze student misconceptions on acid-
base titration materials. Response answers of students using the two-tier diagnostic test were
analyzed showing the students' answers on the first level and reason on the second level [18].

AJCE, 2019, 9(1) ISSN 2227-5835
23
Students got a score of 1 if the answer was correct on both levels of the question, and got a score
of 0 if the answer was wrong on one or both levels. In addition to the scores, misconceptions of
students are presented in percentages [25] [18]. according to the level of students' understanding
based on the following categories:
Table 1: Criteria level of student understanding [28] Score Pattern of student answers Category level of understanding
0 The answer on first and second level is correct Understand the concept
0 The answer on first level is correct, but on the
second level is wrong.
Misconception
0 The answer on first level is wrong, but on the
second level is correct
Misconception
0 The answer on first and second level is wrong Do not understand the concept
Results of student understanding is then followed up with in-depth interviews of 16 students
taken at random with the purposive sampling technique.
The two-tier diagnostic test instrument used in this research consisted of 10 items consisting
of 4 concepts of acid-base titrations. Distribution of indicator problem on each concept can be seen
in table 2 below.
Table 2: Distribution of indicator questions on each concept Concepts Indicator of question Number of
question
Indicator acid
base
Students can determine indicators used in strong acid base titrations 1
Students can mention the influencing factors in determining the indicator
used in acid-base titrations
3
Students can determine indicators used in weak acid and strong base
titration
8
Calculation of
pH
Students can calculate the pH of the solution formed on the addition of 10
ml of sodium hydroxide in a titration experiment of 25 ml of 0.1 M vinegar
by 0.1 M sodium hydroxide
2
Students can calculate the pH of the solution formed at the addition of 25 ml
of sodium hydroxide in an experimental titration of 25 ml of vinegar by 0.1
M sodium hydroxide 0.1 M
4
Curve titration Students can show the equivalence point on the presented titration curve 5
Students can determine the type of titration of the titration curve presented 7
Students can show the buffer zone on the titration curve presented 9
Students can determine the type of titration on the two titration curves
presented
10
End-point of
titration
Students can define the end-point of the titration 6

AJCE, 2019, 9(1) ISSN 2227-5835
24
At the first stage of the research a review of questions was done by colleagues and by
supervisors and followed by the development of research test instruments which are then verified
through the validity test, which is done in two ways: the validity of the subject matter and the
validity of the construct (construct validity) is done by six teachers who have experience in
teaching.
The validity of the item is calculated using the biserial point correlation technique and the
obtained value of rphi = 0,415 with rtabel = 0,220. This shows rphi> rtable then that the problem is
valid. While the construct validation is calculated by the Aiken formula, the average validity index
of Aiken (Vcount) of the six validators is 0.98 with Vtable = 0.78. From the validation result of the
construct then the matter is declared valid because Vcount > Vtable.
RESULT AND DISCUSSION
The percentage of students' level of understanding on the acid-base titration material can
be seen in the following table:
Table 3
Percentage of students' level of understanding on the acid-base titration material Level of student understanding Percentage (%)
Understand the concept 49,88
Misconception 33,50
Do not understand the concept 16,62
The table above shows that student misconceptions on acid base titration material is 33,50%.
The misconceptions are scattered on the various concepts of acid-base titration material that is on
the concept of indicator, pH calculation, titration curve. The distribution of misconceptions in each
of these concepts can be seen in the following table.
AJCE, 2019, 9(1) ISSN 2227-5835
25
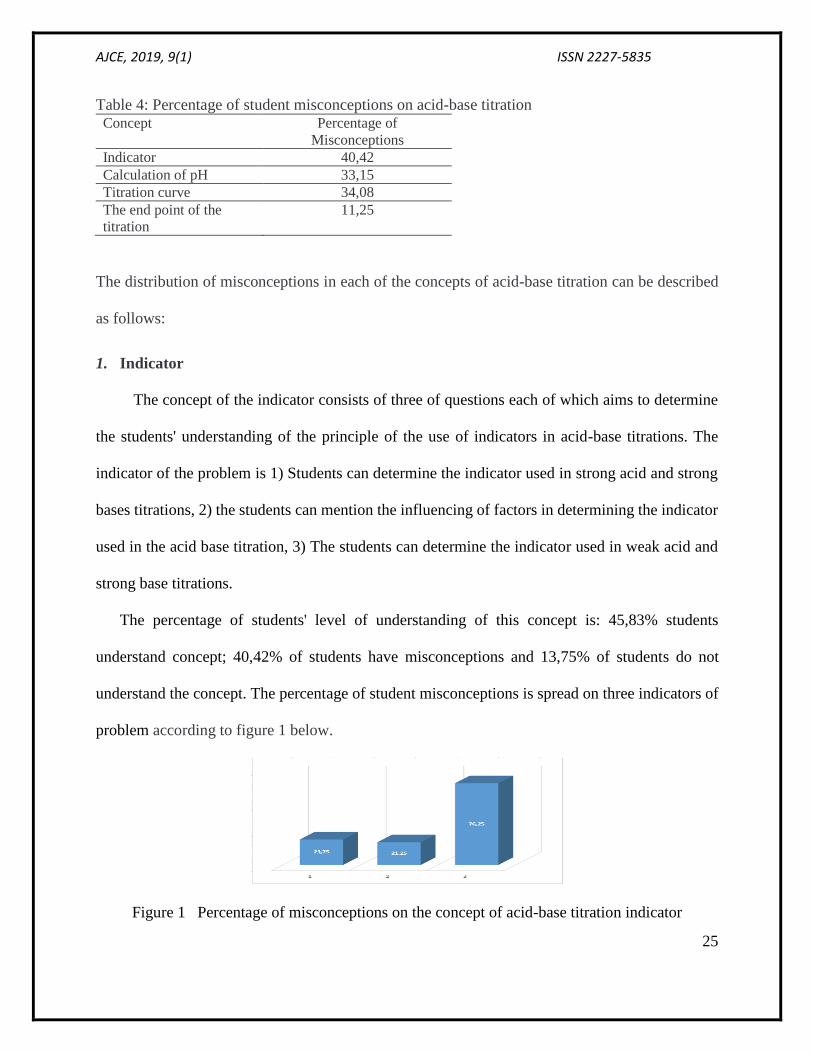
Table 4: Percentage of student misconceptions on acid-base titration Concept Percentage of
Misconceptions
Indicator 40,42
Calculation of pH 33,15
Titration curve 34,08
The end point of the
titration
11,25
The distribution of misconceptions in each of the concepts of acid-base titration can be described
as follows:
1. Indicator
The concept of the indicator consists of three of questions each of which aims to determine
the students' understanding of the principle of the use of indicators in acid-base titrations. The
indicator of the problem is 1) Students can determine the indicator used in strong acid and strong
bases titrations, 2) the students can mention the influencing of factors in determining the indicator
used in the acid base titration, 3) The students can determine the indicator used in weak acid and
strong base titrations.
The percentage of students' level of understanding of this concept is: 45,83% students
understand concept; 40,42% of students have misconceptions and 13,75% of students do not
understand the concept. The percentage of student misconceptions is spread on three indicators of
problem according to figure 1 below.
Figure 1 Percentage of misconceptions on the concept of acid-base titration indicator

AJCE, 2019, 9(1) ISSN 2227-5835
26
About 1 percentage of students who understand the concept is 53.75%. It shows that most
of the students have understood the concept well. This is indicated from the result of the student's
answer during the interview:
Maria Josephine : “ the indicators used for strong acid titrations with strong bases are methyl red,
bromthymol blue, and phenolpthalein due to the pH trajectory around the equivalence point. In
general practicum used phenolphthalein to facilitate in seeing the color and change (colorless -
pink) ”
While 23.75% of students experience misconceptions, most students with misconceptions
expressed phenolphthalein as a strong acid indicator with a strong base and a small proportion of
students declared blue bromothymol as an indicator of strong acid and strong base. Here are the
results of student interviews that state it.
Nathaniel Richard : “The indicator used for strong acid and strong bases titrations is
phenolphthalein (pp) because the color change can be easily observed ”
Kelly : “the indicator used for strong acids and strong bases titrations is blue bromthymol (pH
range 6.3 - 7.2) because strong acid titration and strong base will touch the equivalence point of
about 6 – 7 “
Most students mentioned phenolphthalein as a strong acid and a strong base indicator because
students are familiar with phenolphthalein. At the time of practicing strong acid titration with a
strong base in the laboratory, students used only the phenolphthalein indicator and rarely use other
indicators so that students are only familiar with the indicator of phenolphthalein as an indicator
of strong acid and a strong base titration. The understanding of the students is certainly not in
accordance with Chang [7] that in the titration of strong acid with a strong base methyl red
indicator, blue chlorophenol, bromtimol blue, red cresol and phenolphthalein could also be used
AJCE, 2019, 9(1) ISSN 2227-5835
27
because the indicator trajectory is around the equivalence point. In this case the teacher has a role
in the occurrence of misconceptions in students because it only uses phenolphthalein indicator in
strong acid and strong bases titrations and rarely uses other indicators. This misconception [2] can
be derived from a less precise school-made misconceptions of less directional in teaching and
learning process so that students are wrong in interpreting a particular concept [4].
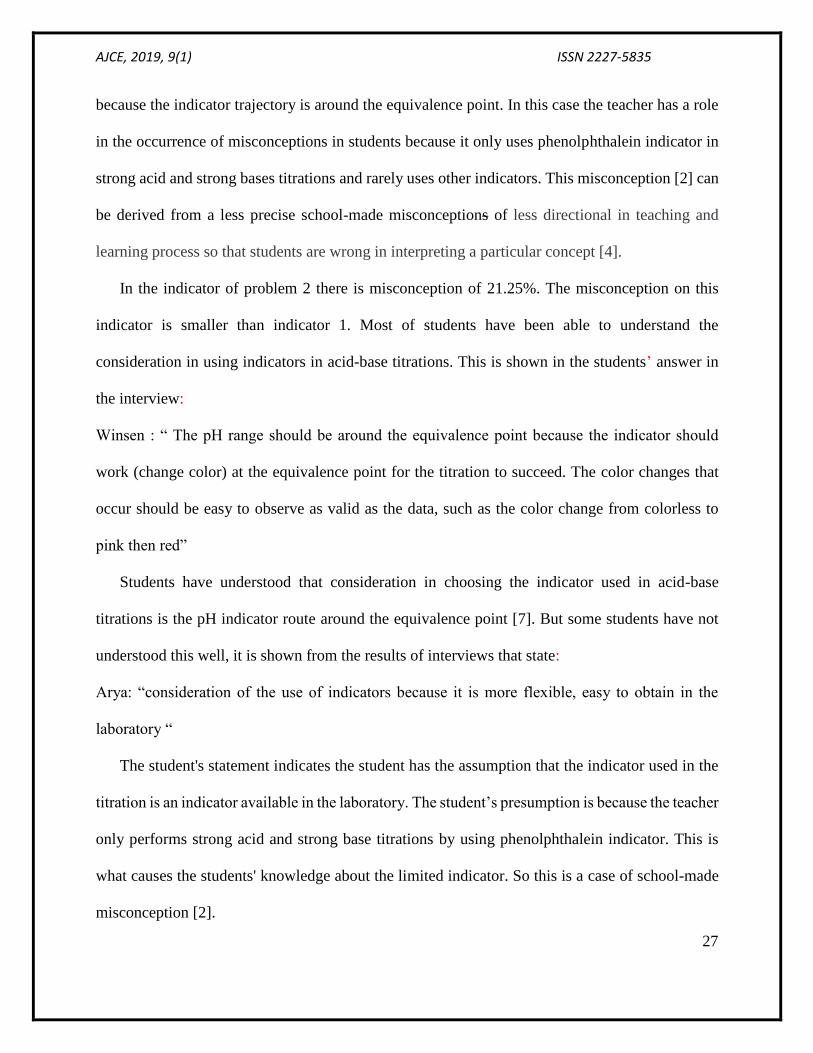
In the indicator of problem 2 there is misconception of 21.25%. The misconception on this
indicator is smaller than indicator 1. Most of students have been able to understand the
consideration in using indicators in acid-base titrations. This is shown in the students’ answer in
the interview:
Winsen : “ The pH range should be around the equivalence point because the indicator should
work (change color) at the equivalence point for the titration to succeed. The color changes that
occur should be easy to observe as valid as the data, such as the color change from colorless to
pink then red”
Students have understood that consideration in choosing the indicator used in acid-base
titrations is the pH indicator route around the equivalence point [7]. But some students have not
understood this well, it is shown from the results of interviews that state:
Arya: “consideration of the use of indicators because it is more flexible, easy to obtain in the
laboratory “
The student's statement indicates the student has the assumption that the indicator used in the
titration is an indicator available in the laboratory. The student’s presumption is because the teacher
only performs strong acid and strong base titrations by using phenolphthalein indicator. This is
what causes the students' knowledge about the limited indicator. So this is a case of school-made
misconception [2].

AJCE, 2019, 9(1) ISSN 2227-5835
28
The highest percentage of misconceptions is found in 3rd indicator that is 76,25%. This shows
that most students have not been able to understand the indicators used in weak acid and strong
bases titrations. This is shown from the student's answer during the interview:
Rio : “ the indicator used in weak acid and a strong base titration is phenolphthalein because the
color change is easily observed “
The student's reply shows that students have assumed that phenolphthalein is used as an
indicator on weak acid and a strong base titration because of its easily observable color change. In
this case students have a false interpretation of the use of the phenolphthalein indicator. Students
are less familiar with weak acids with strong bases titrations because in practicum learning they
rarely does weak acids with strong bases titrations.. For reasons of limited time the teacher
introduces only strong acid and strong base titrations with phenolphthalein indicator. Lack of
learning with a weak acid acid with a strong base titration is one of the sources of misconceptions
in this regard [23]. In addition, students also do not understand well the route (range pH) and the
color changes, so students do not understand the reasons for the use of phenolphthalein indicator
as a weak acid and strong base indicator. This is in accordance with Barke [2] which states that
misconceptions may be caused by previous preconceptions that students misinterpret the use of
phenolphthalein indicator is an easily observable color change.
2. Calculation of pH
This concept consists of two indicator questions which each aiming to find out the students'
conceptual understanding of the pH of the solution formed during acid-base titrations. The
indicator of the problem is 1) The student can calculate the pH of the solution formed on the
addition of 10 ml of sodium hydroxide in a titration experiments of 25 ml of 0.1 M vinegar by 0.1
M sodium hydroxide; 2) the student can calculate the pH of the solution formed by adding 25 ml

AJCE, 2019, 9(1) ISSN 2227-5835
29
of sodium hydroxide in a titration experiment of 25 ml of vinegar by 0.1 M to 0.1 M sodium
hydroxide.
On the concept of this pH calculation as much as 43.13% students understood the concept;
33.15% held misconceptions and 23.75% did not understand the concept. The percentage of
misconceptions is spread across the two question indicators as shown in Figure 2 below.
Figure 2 Percentage of misconceptions on pH calculation
Indicator 1 requires students 'understanding of the concept of buffer solution and indicator 2
requires students' understanding of the concept of hydrolysis of a salt. Figure 2 shows the
misconception of indicator 2 higher than the misconception of indicator 1. It shows that students
understanding of salt hydrolysis is very weak compared to students' understanding of buffer
solutions. This is evident from the student’s answer during an interview with a student named
Bryan Jonathan Yahya:
Figure 3. student answers about questions related to salt hydrolysis

AJCE, 2019, 9(1) ISSN 2227-5835
30
The student’s answers above show that the students have not understood the concept of salt
hydrolysis well. The student has ability to react an acid with a base and have understanding of the
concept of mole but the student is wrong in calculating salt pH. Students assume that salt always
has pH of 7, This is in accordance with research conducted by Sheppard [30] which finds that
students consider the product of neutralization reaction always has pH = 7. Besides students also
have no understanding in the use of buffer and salt formulas. This can be seen from the answer of
Aldo as follows:
Figure 4. student answers about the use of hydrolysis formula
The answer above shows that students have not understood the salt hydrolysis formula so
that students use the buffer formula in solving the problem in indicator 2. This is due to the
understanding of the concept of buffer and hydrolysis of a salt is weak. This is in accordance with
the research conducted by Indrayani [14] which states that to determine the pH of the solution in
the acid-base titration process requires a good understanding of the concept of strong strong base
acids, weak basic acids, buffer solutions and salt hydrolysis. The lack of understanding of
hydrolysis and buffer salts has an impact on the lack of understanding of acid-base titrations. This
is consistent with Beyza [3] who states that a lack of understanding of basic concepts will result in
subsequent learning. Students cannot connect between the concepts of hydrolysis of salts, buffers
AJCE, 2019, 9(1) ISSN 2227-5835
31
and titrations. Students consider each concept to be independent so it cannot connect with other
related concepts [19].
3. Titration curve
The acid-base titration curve consists of 4 indicators of problems that each aims to know
the students 'concepts of understanding of students' understanding of acid-base titration curve
reading. These indicators are 1) The student can show the equivalence point on the titration curve
presented, 2) The student can determine the titration type of the titration curve presented, 3) The
student can show the buffer region on the titration curve presented and 4) The student can
determine the type titration on the two titration curves presented.
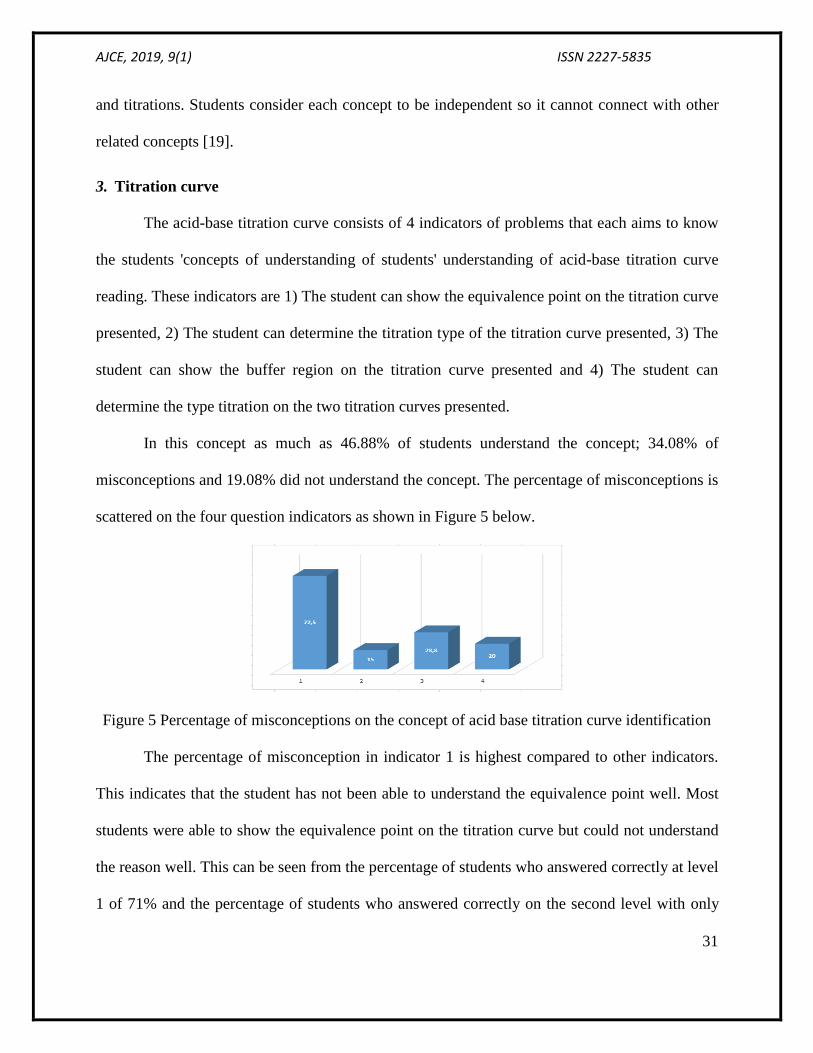
In this concept as much as 46.88% of students understand the concept; 34.08% of
misconceptions and 19.08% did not understand the concept. The percentage of misconceptions is
scattered on the four question indicators as shown in Figure 5 below.
Figure 5 Percentage of misconceptions on the concept of acid base titration curve identification
The percentage of misconception in indicator 1 is highest compared to other indicators.
This indicates that the student has not been able to understand the equivalence point well. Most
students were able to show the equivalence point on the titration curve but could not understand
the reason well. This can be seen from the percentage of students who answered correctly at level
1 of 71% and the percentage of students who answered correctly on the second level with only

AJCE, 2019, 9(1) ISSN 2227-5835
32
15%. Students have the assumption that the equivalence point occurs when pH = 7 or under neutral
conditions. This can be seen from the students' answers during the following interview.
Michelle CB : “ Equivalent point because at that time the solution is neutral “
Students This is in accordance with the research conducted by Indrayani [14] which states
that the student has not understood the relationship between the indicator color change with the
nature of the solution and the student determines the nature of the solution not based on the
indicator color but based on the number of moles of each reactant. Consequently, the student
considers the nature of the solution at the equivalence point is neutral.
Some students also have the assumption that the equivalence point is related to the number of
moles of reactants and moles of the product, this is indicated in the answer during the student
interview:
Winsen: “ point A is the equivalence point because at this pH the number of moles of reactants is
equal to the number of moles of the product “
This is inconsistent with the actual concept that the equivalent point occurs when the
number of moles of OH- ions added to the solution is equal to the amount of H+ ions originally
present [7], which means the H+ ions and the OH- ions both are reactants with moles at the same
one. Students do not understand the neutralization reaction that occurs in the titration process so
that students are wrong in interpreting the equivalence point. This is because the concept of
neutralization reaction is loaded with symbolic understanding so that students have difficulty in
writing the neutralization reaction of acid-base titrations [14]
In the indicator 3 students as many as 28.8% experience a misconception. The student is
able to show the buffer area on the curve but is wrong in interpreting the reason. This can be seen
from the student's answer at the interview:

AJCE, 2019, 9(1) ISSN 2227-5835
33
Aldo: “Point Q is a buffer zone because of the gentle curve shape “
The student's reply shows the student’s assumptions about the buffer region of the gentle
curve. Students do not understand the meaning of the sloping area that is associated with the
reaction between a weak acid and strong base in the case of the image of the curve. This is
consistent with a study conducted by Schmidt in Sheppard [30] who found that students had the
assumption that the titration curve before the equivalence point, at the equivalence point and after
the equivalence point is time-dependent.
4. The end point of the titration
The concept of titration end point aims to find out the students understanding of the acid-
base titration endpoint. As many as 87.50% of students have understood about the concept, 11.25%
of students have misconception and 1.25% of students do not understand the concept. It shows that
most students have understood this concept correctly and there are still a few students who do not
understand this concept well.
The student's understanding is seen from most students mentioning that:
Vincent Hadinata: “the titration process will be discontinued at the end point of the titration marked
by the change of color “
However, there are a small number of students giving the following answers:
Michelle CB: “titration is stopped when the equivalence point is marked by a change of color “
Students with misconceptions cannot distinguish between the equivalence point and the
end of point of the titration. Students have the assumption that is the same. According to Chang
[7], the equivalence point occurs when the number of moles of OH- ion added to the solution is
equal to the number of moles of H+ ion originally present, whereas the end point of the titration

AJCE, 2019, 9(1) ISSN 2227-5835
34
occurs when the indicator changes color. So the equivalence point and end point of titration are
two different things.
CONCLUSION
Based on this research, it can be concluded that the achievement of level students’
conceptions on acid acid titration material was 49,88%, As many ss 33,50% of students have
misconceptions and 16,62% students do not understand that concept. Student misconceptions on
the acid-base titration material are spread over all concepts. Percentage of indicator of
misconception on concept, pH calculation, titration curve and end point of titration obtained were
40,42%; 33.15%; 34.08% and 11.25% respectively. Interviews with students indicate student
misconceptions: 1) students were more familiar with the phenolphthalein indicator compared to
other indicators, the consideration of the use of indicators in the titration process because it was
available in the laboratory and the use of the phenolphthalein indicator in the titration is associated
with the easily observable color change without considering the range of pH. The misconceptions
were related to the lack of learning in the laboratory in the form of a practicum involving varied
indicators and types of titration; 2) Students observe salt has a pH = 7 and students have not
understood salt and buffer hydrolysis concept in solving pH calculation problems. This is related
to students' inability to connect the concept of salt, buffer and acid-base titration; 3) Students
considered the equivalence point to occur at pH = 7 (neutral). This was related to a false
interpretation of the equivalence point defined as the number of moles of OH- ions equal to the
number of moles of H+ ions so as to be equivalent in neutral condition, 4) Students experienced
difficulties in distinguishing between equivalence point and end point of titration.
AJCE, 2019, 9(1) ISSN 2227-5835
35
REFERENCES
1. Ayu, M. H., Halimah, H., & Sugiarti. (2017). Analisis Miskonsepsi Siswa Kelas X MIA 4
SMA Negeri 1 Pinrang pada Materi Ikatan Kimia Menggunakan Three-Tier Test.
Prosiding Seminar Nasional Kimia UNY 2017 (pp. 37 - 53). Yogyakarta, Indonesia: UNY.
2. Barke, H. D., Hazari, A., & Yitbarek, S. (2009). Chapter 2: Students’ misconceptions and
how to overcome them, in :Misconception in Chemistry Addresing Perception in Chemical
Education (pp. 21-36). Berlin: Springer-Verlag.
3. Beyza, B. K. (2013). Using Two-Tier Test to Identify Primary Students’ Conceptual
Understanding and Alternative Conceptions in Acid Base. Mevlana International Journal
Education (MIJE) 3(2), 19 - 26.
4. Bradley, J. D., & Mosimege, M. D. (1998). Misconceptions in acids and bases: A
comparative study of student teachers with different chemistry backgrounds. South African
Journal of Chemistry, 51(3), 137 - 145.
5. Calik, M., & Ayas, A. (2005). A Comparison of Level Understanding of Eight-Grade
Students and Science Teachers Related to Selected Chemisrty Concepts. Journal of
Research in Science Teaching, 42(6), 638 - 667.
6. Chandrasegaran, A. L., Treagust, D. F., & Mocerion. (2007). The Development of a Two-
Tier Multiple Choice Diagnostic Instruments for Evaluation Secondary School Students
Ability to Describe and Explain Chemical Reactions Using Multiple Level of
Representation. Journal of Chemistry Education Research and Practice, 8(3), 293 - 307.
7. Chang, R. (2005). Kimia Dasar Konsep-Konsep Inti Edisi ketiga Jilid 2. Jakarta, Indonesia:
Erlangga.
8. Cros, D., Maurin, M., Amouroux, R., Chastrette, M., Leber, J., & Fayol, M. (1986).
Conceptions of first year university students of the constituents of matter and the notions
of acids and bases. European Journal of Science Education, 8(3), 305-313.
9. Damanhuri, M. I., Treagust, D. F., Won, M., & Chandrasegaran, A. L. (2016). High school
students’ understanding of acid-base concepts: an ongoing challenge for teachers. The
International Journal of Environmental and Science Education, 11(1), 9 - 27.
10. Darmiyanti, W., Rahmawati, Y., Kurniadewi, F., & Ridwan. (2017). Analisis Model
mental Siswa Dalam Penerapan Model Pembelajaran Leraning Cycle 8 E pada Materi
Hidrolisis Garam. Jurnal Riset Pendidikan Kimia, (1), 38 - 51.
11. Demerouti, M., Kousathana, M., & Tsaparlis, G. (2004). Acid-base equilibria, part I: Upper
secondary students, misconceptions and difficulties. The Chemical Educator, 9(2), 122 -
131.
12. Demerouti, M., Kousathana, M., & Tsaparlis, G. (2004b). Acid-base equilibria, part II:
Effect of developmental level and disembedding ability on students’ conceptual
understanding and problem solving ability. The Chemical Educator, 9, 132 - 137.
13. Demircioglu, G. A. (2005). Conceptual Change Achieved Through A New Teaching
Program on Acid and Base. Journal of Chemistry Education Research and Practice, 6(1) ,
36 - 51.
14. Indrayani, P. (2013). Analisis Pemahaman Makroskopik, Mikroskopik dan Simbolik
Titrasi Asam Basa Siswa Kelas XI IPA SMA serta Upaya Perbaikannya dengan
Pendekatan Mikroskopik . Jurnal Pendidikan Sains 1 (2), 109 - 120.
15. Iskandar, S. M. (2011). Pendekatan Pembelajaran Sanis Berbasis Konstruktivistik.
Malang, Indonesia: Bayumedia Publishing.

AJCE, 2019, 9(1) ISSN 2227-5835
36
16. Jonassen, D. H. (1991). Objectivism versus constructivism: Do we need a new
philosophical paradigm, Educational Technology Research and Development, 39(3), 5-14.
17. Kabapınar, F. (2003). The Differences Between Misconception Assessment Scale and
Knowledge- Compherension Level İndicator. Kuram ve Uygulamada Eğitim Yönetimi,. 35,
398 - 417.
18. Karataş, F., Köse, S., & Coştu, B. (2003). Student Misconceptions and Understanding of
The Levels Used in The Determination of The Two-Stage Tests. Pamukkale Üniversitesi
Eğitim Fakültesi Dergisi, 13(1),54-69
19. Muchtar, Zainuddin, & Harizal. (2012). Analyzying of student’s Misconception on
AcidBase Chemistry at Senior High Schools in Medan. Journal of Education and Practice,
(15), 65-74
20. Nakhleh, M. B. (1992). Why Some Students dont Learn Chemistry Chemical
Misconceptions. Journal of Chemsitry Education, 69 (3),191.
21. Nakhleh, M. B., & Krajcik, J. S. (1994). Influence of levels of information as presented by
different technologies on students’ understanding of acid, base, and ph concepts. Journal
of Research in Science Teaching, 31(10), 1077 - 1096.
22. Orgill, M., & Sutherland, A. (2008). Undergraduate Chemistry Students' Perceptions of
and Misconceptions about buffers and buffer problems. Chemistry Education Research
and Practice, (2),131 - 143.
23. Orwat, K., Bernard, P., & Mikuli, A. M. (2017). Alternative Conceptions of Common Salt
Among Upper-Secondary-School Students. Journal od Baltic Science Education, (1), 64
- 76.
24. Özmen, H. (2005). Misconceptions in Chemistry Teaching: A Literature Review, .
http://www.tebd.gazi.edu.tr/arsiv/2005_cilt3/sayi_1/23-45.pdf .
25. Peterson, & Treagust, D. F. (1989). Grade-12 Students’ Misconception of Covalent
Bonding and Structure. Journal of Chemical Education, 66 (1), 459- 460.
26. Rositasari, D., Saridewi, N., & Agung, S. (2014). Pengembangan Tes Diagnostik Two Tier
untuk Mendeteksi Miskonsepsi Siswa SMA pada Topik Asam Basa. Edusains, (2), 170 -
176.
27. Ross, B., & Munby, H. (1991). Concept mapping and misconceptions: A study of high
school students’ understandings of acids and bases. International Journal of Science
Education, 13 (1),11 - 23.
28. Salirawati, D. (2011). Pengembangan Instrumen Pendeteksi Miskonsepsi Kesetimbangan
Kimia pada Peserta didik SMA . Jurnal Penelitian dan Evaluasi Pendidikan, (2), 237
29. Schmidt, H. (1997). Students’ Misconceptions: Looking for a Pattern. Science Education,
81, 123 - 135.
30. Sheppard, K. (2006). High School Student's Understanding of Titrations and Related Acid-
Base Phenomena. Journal of Chemistry Education Research and Practice, 7(1), 32-45.
31. Sirhan, G. (2007). Learning Difficulties in Chemistry : An Overview . Turki: Journal of
Turkish Science Education,4 (2), 2 – 20
32. Taber, K. S. (1999). Ideas About Ionization Energy: A Diagnostic Instrument. School
Science Review. 81,97 - 104.
33. Tuyuz, C. (2009). Developemnt of Two Tier Diagnostic Instrument and Assess Student
Understanding In Chemistry. Scientific Research and Essay,4(6), 626-631

AJCE, 2019, 9(1) ISSN 2227-5835
37
34. Urwatil, W. A., Rahayu, S., & Yahmin. (2016). Pengembangan Instrumen Tes Diagnostik
Two-Tier pada Materi Asam Basa. Seminar nasional pendidikan IPA Pascasarjana UM
(pp. 715 - 722). Malang, Indonesia: Universitas Negeri Malang.
35. Wahyu, L. P. (2012). Analisis Miskonsepsi Kimia pada Pembelajaran Termokimia Siswa
Kelas XI SMAN Sukorejo. Surakarta, Indonesia: FKIP Universitas Sebelas Maret.
36. White, R., & Gunstone, R. (1992). Probing Understanding. London, England: The Falmer
Press.