Embed Size (px)
Citation preview
1
King Fahd University of Petroleum & Minerals
Department of Mathematical Sciences
Students’ Learning Process in Pre-Calculus and Calculus Courses at KFUPM
Identification of Problems and Possible Remedies
by
M.A. Bokhari, M. Samman, B. Yushau
Final Report
Submitted to
Deanship of Academic Development
June 4, 2006

2
TABLE OF CONTENTS
1. Introduction 6
1.1. Project and project team
1.2. Calculus along with Pre-Calculus at undergraduate level
1.3. Literature Survey
1.4. Status of PCC courses at KFUPM
1.5. Problems in PCC courses at KFUPM and improvement measures
1.6. Identification of problems and pertinent corrective measures
1.7. Theme of the project
2. Literature Review Concerning Retention Level 11
3. Implementation Plan 16
3.1. Responsibilities
3.2. Initial planning
4. Tasks During the Term 042 (Phase I) 19
4.1. Survey I & Related Activities
4.2. Some Teaching Related Activities
4.3. Survey II & Midterm Exam
4.4. Survey III & Exit Quiz
5. Tasks During the Term 051 (Phase II) 23
5.1. Survey I & Related Activities
5.2. Some Teaching Related Activities
5.3. Survey II & Midterm Exam
5.4. Survey III & Exit Quiz
6. Conclusion I 26
6.1. Some definitions/terminologies
3
6.2. Deficient concepts when entering Calculus I class
6.3. Deficient concepts when entering Calculus II class & Consistent
Deficiencies
6.4. Retention level
7. Conclusion II 36
7.1. Comparative Study in Phase I (Term 042)
7.2. Comparative Study in Phase I (Term 051)
8. Statistical Analysis of Data 43
8.1. Data Analysis related to Term 042. (MATH 102)
8.2. Data Analysis related to Term 051 (MATH 101)
8.3. Summary of the finding in the statistical analysis
9. Recommendations 53
9.1. Pre-Calculus Courses (Prep-Year Level)
9.2. Calculus Courses
10. References 64
11. Appendices 67
11.1. A1 (i)-(iv)
11.1. A2 (i)-(iv)
11.1. A3 (i)-(iii)
4
Acknowledgement
We, the members of the project team, acknowledge with thanks the Research Grant
received from the Deanship of Academic Development during the completion of the
project. We also extend our sincere thanks to the faculty members of the Department of
Mathematical Sciences whose cooperation made it possible to include students of their
MATH 101/MATH 102 classes in the process of conducting surveys and some quizzes
which was an integral part of the project. At the final stage while composing the
outcomes of our various surveys and quizzes, we sought the generous support of our
colleague, Mr. Marwan Al-Momani, regarding relevant statistical analysis. His prompt
and timely response to our request is highly appreciable and indeed we are grateful for
the professional expertise he provided us for the accomplishment of our task.
5
Summary This project deals with the issues related to Pre-Calculus and Calculus (PCC) courses at
KFUPM. It was conducted in a form of experiment in the on-going Calculus classes
during the academic terms 042 and 051. As narrated in the Project Proposal, one of its
main objectives is to determine the students’ deficiencies which they carry from the Pre-
Calculus material at the time of entering Calculus I. Another objective of the project is
more or less of similar nature, i.e., to identify students’ retention level on basic Calculus
concepts around the completion of a Calculus course. In order to achieve these
objectives, we designed some surveys for the students taking Calculus I & II after
completion of their Prep-Year Math courses. These surveys were based mostly on mono-
concept questions which the students already covered in their past or current courses.
Each survey was followed by a short test (which we shall refer as the Follow-up Quiz or
Exit Quiz). The purpose of these tests was to authenticate the students’ perception what
they claimed to know or retain basic concepts introduced to them in the PCC courses.
Based on the outcomes of these activities, we developed, as a part of our project’s
strategic plan, some remedial measures that, to certain extent, helped the students
improving their level of understanding.
This report consists of nine chapters mainly dealing with the following topics:
A. Global status of PCC courses with particular focus on their set-up at KFUPM
B. Review of literature on Calculus reforms
C. Implementation planning of the project
D. Details of the experiment
E. Statistical analysis of data based on surveys and tests
F. Recommendations.
For further details on the nature of topics, please see the table of contents.
6
1. Introduction 1.1. Project and project team
During the year 2004, the Deanship of Academic Development (DAD) approved a
project entitled “Students’ Learning Process in Pre-Calculus and Calculus Courses at
KFUPM: Identification of Problems and Possible Remedies”. The team of three faculty
members from the Department of Mathematical Sciences who proposed the project
consists of: Dr. Muhammad Ashfaq Bokhari (Principal Investigator), Dr. Mohammad
Samman (Co-Investigator) and Mr. Belarabie Yushau (Co-Investigator). This project,
which has now been completed, deals with KFUPM students’ comprehension and
command on the material related to Pre-Calculus and Calculus (PCC). It was conducted
in the form of an experiment on the freshman students of KFUPM during the academic
terms 042 and 051.
1.2. Calculus along with Pre-Calculus at undergraduate level
Universally, Calculus is regarded as the backbone of any BS program in the disciplines of
Engineering, Computer and Physical Sciences. Not only that, its role is also quite
significant in the social and management sciences. It would not be an exaggeration to
state that the subject of Calculus initiates a solid process of learning among the students
in different dimensions, forces them to utilize all faculties of their brain and above all,
reshapes their mind to retain the material in this process. In the course of learning this
subject, a student undergoes an extensive exercise of designing a logical stream of
arguments required to solve a mathematical or physical problem. Calculus creates a
geometric visualization of basic real life problems leading to their formulation as
mathematical models. And finally, it helps the students in identifying analytic as well as
numerical techniques helpful in finding the solutions of these models.
1.3. Literature Survey
The foundation of Calculus by and large relies on the Pre-Calculus material, which is
usually distributed over two courses of College Algebra and Trigonometry. The
deficiency of the students in the preparation of both Pre-Calculus and Calculus (PCC)
7
has been registered over the past few decades in most of the developing as well as
developed countries. An inadequate comprehension of the concepts and high failure rate
among the students of PCC has been a matter of great concern for these countries till
now. As a consequence, the US and most of the European countries launched several
projects and held regular workshops that concentrate on the improvement of students’
learning in the PCC courses [e.g. see National Council of Teachers of Mathematics
(NCTM) 2000]. The theme of these projects and workshops, as we observe, vary from
the development of conformable curriculum [e.g 1, 4, 7] to the improvement of teaching
methodologies [e.g. 9, 15]; from the improvement of students’ comprehension to the
structure of meaningful evaluation system [e.g. 13]; from the use of technology [e.g. 13,
17] to the PCC applications that address the real life problems, and so on. It may be
interesting to note that the concern shown towards the issues of PCC is not curtailed to
projects and workshops. Comprehensive scientific research has also been conducted in
several institutions of the US. As a result, we find quite a few Ph.D. theses [e.g. 2, 3, 6, 7,
8, 11] as an outcome of these efforts from reputed schools. In short, keeping in view the
pivotal role of Calculus in almost all disciplines of university programs, its every aspect
is being evaluated from different angles particularly in the US and the European
countries. Particularly, Calculus Reforms has turned out an on-going process in the US.
Various issues related to Calculus ranging from “planning and implementation of
reformed curricula” to “use of technology” or from “comparison of learning
methodologies” to “students’ assessment” are presented at different forums [18 a-d] and
appear in the literature [19 a-e] on a regular basis over there.
1.4. Status of PCC courses at KFUPM
It may be worthwhile to mention that the best high school graduates from the entire
Kingdom of Saudi Arabia are admitted at KFUPM by observing a very stringent
admission policy. These students at the time of entering into a BS program are
immediately required to take two Pre-Calculus courses (Basic Algebra, Geometry,
Functions, Trigonometry, and Introductory Linear Algebra) where English is the
mandatory medium of instruction. The primary objective of these courses is to bridge a
gap that exists between high school mathematics (which they mostly do in an Arabic
8
medium of instruction) and the material prerequisite for the KFUPM Calculus Sequence
Courses (Calculus I, II & III). The three Calculus courses are an integral part of BS
curricula in the disciplines of engineering, computer and sciences.
1.5. Problems in PCC courses at KFUPM and improvement measures
Like other worldwide institutions, as indicated above, KFUPM also faces various kinds
of problems related to the students’ performance in PCC courses. Over the past few years
there has been a consistent complaint from the Calculus instructors referring to the poor
performance of students. This problem also persists beyond freshman level as instructors
teaching Differential Equations (Math 202, Math 260) and Applied Mathematics (Math
301, Math 302) complain about the poor background of students on the PCC topics. This
chain of complaints even extends up to senior level specialized courses that require an
adequate PCC background from the students.
During the last decade, a higher failure rate and a significant increase in the D and D+
grades was noticed in Pre-Calculus courses which involve approximately 1500 new
entrants to KFUPM every year. The university showed great concern to resolve this
problem by setting several committees which were partly assigned the task of finding the
cause(s) of this deterioration and suggesting some corrective measures. All of these
committees came with some recommendations, some of which were implemented as
well. Unfortunately however, no concrete improvement was noticed in this direction. As
a last resort, the university administration, in pursuance of increasing the number of good
quality students at the prep level, created an independent academic and administrative
set-up for these courses which is known as “Prep-Year Math Program”. Over the past few
years, several innovative ideas were introduced in different directions with the hope of
possible improvement in this set-up.
As far as the Calculus courses are concerned, the Department of Mathematical Sciences
at KFUPM has been monitoring the students’ academic accomplishments in these courses
with extensive responsibility, particularly after the abolishment of the “integrated type of
coordination” in these courses. Whenever the Math instructors observe a problem
9
leading to poor performance of students in the PCC courses, they usually recommend
corrective measures to overcome the problem. The Department tries its level best in
paying attention to the issues raised by the faculty and finding the ways for
implementation of their recommendations.
1.6. Identification of problems and pertinent corrective measures
The process of pinpointing a problem that is impairing a system plays a vital role in its
flourishing. After that, an appropriate choice of corrective measure and its
implementation needs due attention. These steps categorically lead to an improvement of
a system. Otherwise, any measure without properly focusing on a problem would be a
futile exercise and wastage of resources. The math faculty members at KFUPM, in
general, do not appear very comfortable with the current performance of students in the
PCC courses. On several occasions, during the academic terms as well as after the final
exams, they have pointed out various kinds of student deficiencies that range from their
high school preparation to study habits; language barrier to classroom attention; and time
management to retention of concepts etc. Based on these observations, the Department
usually constitutes ad-hoc committees that deal with issues like appropriate adjustment of
course contents, suitable choice of PCC textbooks, mode of recitation classes for
Calculus I & II, and the policies on students’ assessment and evaluation. However, in
spite of all the efforts, a noteworthy improvement has not yet been observed in the
students’ performance.
To the best of our observations, there are several points linked to both teacher and taught
that are influencing the performance of the students in the PCC courses and require our
due attention. These include measurement of students’ comprehension level at the start of
any PCC course, modification in teaching methodologies, interaction between PCC
course-instructors during the term, and an evaluation process based on learning
outcomes. With the above background about the global situation of PCC and having
realized the situation of this problem at KFUPM in particular, we thought of the need to
address the problem considering the following possible aspects:
10
1. Assessment of students’ comprehension level at the start of any PCC course.
2. The connection between the subject and the student.
3. Teaching methodology
4. Evaluation process.
1.7. Theme of the project
As explained in the proposal, the project team mainly addressed two issues related to
students in the context of PCC courses, namely,
• Comprehension and retention of course material
• Identification of parameters affecting students’ performance in these courses.
The project was based on classroom experiments associated with the project and was
carried out in two phases:
• Phase I. During the Term 042 (related to the students of MATH 102)
• Phase II. During the Term 051 (related to the students of MATH 101).
In both phases, we focused our attention on some specific teaching methodologies that
may help students in retaining the concepts and techniques they learn in a PCC course.
Also, we tried to design an evaluation process which hopefully measures the level of
students’ attainment in a PCC course.

11
2. Literature Review Concerning Retention Level A low level of students’ retention of definitions, concepts and theorems in a math course
is a matter of great concern to relevant academicians. There are quite a number of studies
that were conducted to investigate various problems related to students’ retention. The
issue of retention of knowledge is an important area of research that has the potential to
improve instructional practices and achieve school learning goals. Some studies have
specifically addressed this aspect in the area of mathematics. One such study was
conducted by Kwon, Oh Nam, Allen, Karen, Rasmussen, and Chris [12]. However, a few
studies were carried out about Calculus at the university level.
Central questions regarding retention of mathematical knowledge were considered in
[12]. Here, some discussion led to certain points that may help the educators to facilitate
students' retention of mathematical understanding and skills for longer periods of time.
Another type of question was directed to the relationship, if any, between instructional
approaches and retention of mathematical knowledge.
Garner and Garner [5], compared outcomes of traditional and reformed calculus courses
in terms of students' retention after a passage of time on basic concepts and skills. Among
other findings, it was observed that students subject to reformed calculus courses retain
better conceptual knowledge whereas the others (in traditional calculus) retain better
procedural knowledge. In addition, the former (in reformed calculus) understand concepts
before computational competence is achieved.
In [12], the authors investigated students' retention of mathematical knowledge and skills
in two differential equations classes. Post-tests and delayed post-tests after 1 year were
administered to students in inquiry-oriented and traditional classes. The results show that
students in the inquiry-oriented class retained conceptual knowledge, as seen by their
performance on modeling problems, and retained equal proficiency in procedural
problems, when compared with students in the traditionally taught classes. These results
add additional support to the claim that teaching for conceptual understanding can lead to
longer retention of mathematical knowledge.
12
In another study, Jeanetta du Preez, Ansie Harding, Johann Engelbrecht [10] investigated
the long-term effect of a technique mastering program in first year Calculus course which
involved a group of first year engineering students at the University of Pretoria. This
study investigated which and how much of the knowledge and skills embedded by the
technique mastering program in the first year, is retained after a further two years of
study. A quantitative and qualitative investigation shows that, in general, there is a
disappointing decline in performance over a period of two years. There are, however,
areas in which students performed better after the elapsed period. The research is of
diagnostic value in determining the future of the technique mastering program with
regard to its content.
As far as the retention of material issue is concerned, there are many aspects related to
the review of previous material that would be considered. One aspect, for instance, is
the reasons of reviewing.
There are many reasons for the reviewing to be considered. The review
• promotes continuity and helps students to attain a more comprehensive view of
the mathematical topics covered.
• summarizes main ideas, develop generalizations, and get an overall view of what
they have been learning piecemeal.
• helps students to assimilate or consolidate what they have learned, enabling them
to fit ideas into new patterns.
• serves as a diagnostic tool, revealing weaknesses and strengths to students and
teachers.
• helps teachers identify what is already known and what is not yet known; then re-
teaching can be planned.
• assures that the prerequisites needed for learning new content have been mastered.
• adds to students' confidence in their ability to move successfully to new
mathematical topics.
13
Again, when we discuss the reviewing issue, we may think about the timing of review.
Most textbooks incorporate review sections at both the beginning and the end of most
chapters. Some researchers take exception to this pattern, terming it "spastic." They argue
that review should be continuous. Instead of presenting 25 problems on a new topic, it is
suggested that only three or four be given, along with 25 review problems. Based on the
outcome of their surveys, they claimed that this approach helps students attain a high
level of understanding.
Research clearly indicates that review should be systematically planned and incorporated
into the instructional program. Before a new topic or unit is begun, an inventory can help
the teacher ascertain whether any prerequisite knowledge is missing. Such a review also
helps students pull together the mathematical ideas they will need for the new topic. The
inventory should range from simpler skills and concepts to the most difficult in order to
pinpoint those which need to be re-taught. It should be noticed that a daily review of
homework alone is not sufficient; it often concerns only a small portion of the needed
prerequisites for a new topic.
After a topic or unit is taught, key points or objectives should be reviewed. Students thus
become aware of the major highlights of the lesson so they can focus on the mathematical
skills or concepts that will be needed in future lessons. It should be made clear to students
that this is not simply a collection of exercises and problems; the review includes those
topics which are the most important to remember.
Long-term retention is best achieved if assignments on a particular skill are spread out in
time, rather than concentrated within a short interval. Reviewing immediately after
instruction consolidates the ideas from that instruction, while delayed reviewing aids in
the re-learning of forgotten material. Additionally, research has indicated that short
periods of intensive review are better than long periods. Interspersing review throughout
the textbook or curriculum is better than concentrating review at one time.
Once again, when we consider the reviewing issue, we have to think about the different
possible types of review. One type of review is outlining. The process of outlining
14
forces students to organize ideas and provides a structure that will help students put ideas
together. When students use the outline they have made as an aid in reviewing,
restructuring or recall of the mathematical ideas is promoted.
Review questions. Another type of review is solving relevant questions. Several
researchers have focused on review questions, finding them effective for revealing
content that has not been meaningful to students. Students who used the review questions
scored significantly higher than those using textbook drill pages. Review questions were
found to facilitate retention by promoting comprehension. Feedback helped students to
consolidate what they had learned in the course of answering the review questions, and
they developed their ability to transfer problem-solving skills. The word-type review
questions required a thorough understanding of the concepts and rules and the ability to
apply them to new situations. On the other hand, the calculation-type review questions
required only comprehension of a narrow range of concepts, rules, and often focused on
rote learning.
Testing. Another way of review is testing. A study sought to determine if the learning
and retention of mathematical knowledge was affected by any of the three types of
review procedures: testing, testing-with-explanation, and unit review. For the unit review,
a list of behavioral objectives for the topics taught was given to students, with a worked
example and an optional exercise identical to the corresponding test item. The test group
was only given a test, and then the answers. Both the unit review and testing-with-
explanation groups were given worked-out solutions for test items and optional exercises.
The reviews enhanced the learning and retention of mathematics, with testing-with-
explanation the most promising and testing alone the least promising. As in other studies,
the usefulness of feedback in promoting achievement was apparent.
Homework. A traditional way of review is the homework. The role of differing types of
homework designed for review in first-year algebra classes was explored by some
researchers. In this type of research, one group was given homework consisting of
exercises related to the topic taught that day. Another group was assigned fewer exercises
related to the topic taught that day, plus exploratory exercises on content taught on each
15
of the prior two days and review exercises on the first and third days after the teaching of
a topic. The group having exploratory and review exercises achieved and retained better
than the group having exercises related only to the daily topic.
It is worthwhile mentioning, that in our project, as will be observed in the latter chapters,
our approach of addressing the PCC based problems and exploring subsequent remedial
measures more or less conform to those appearing in the literature.

16
3. Implementation Plan
3.1. Responsibilities
In Phase I, the experiment was carried out in sections 3, 6, 14 and 19 of MATH 102
(Term 042). It may be noted that MATH 102 is a 4-credit hour course with three
lectures/wk and one recitation class/wk1. The principal investigator (Dr. M.A. Bokhari)
and the co-investigator (Dr. M. Samman) acted as the course-instructors respectively for
the sections 3, 6 and 14, 19 whereas the second co-investigator (Mr. B. Yushau) was
responsible to conduct the “Problem Solving Classes” for these sections.
Similar responsibilities were undertaken by the project team in Phase II of the experiment
for four sections of MATH 101 during the term 051.
As pointed out in the Project Proposal, the course contents and the contact hours (in terms
of number of classroom lectures/recitation classes) were maintained according to the
existing policy of the Department during the period of the experiment. The project
members maintained close interaction among themselves while implementing the plan.
3.2. Initial planning
The project team initiated the project in accordance with the plan given in the Revised
Proposal which was submitted in May 2004 to DAD2. The project team held several
meetings to accomplish the following tasks related to MATH 102 (Term 042) during the
period October 2004-January 2005:
• Literature survey
• Preparation of experiment for Phase I.
• Mode of recitation classes
• Use of technology
1 This class is also referred to as a problem solving class in which students are supposed to go over the problems of the course material covered during the preceding week. 2 Execution of this plan was further clarified in a memo addressed to the Dean (Academic Development) dated October 04, 2004.
17
3.2.a. Literature Survey
The team went over some reports on Calculus related matters available in the
Department, some papers on Calculus Reforms which appeared in the proceedings of the
“Orlando Sessions on Calculus Reforms (1996)”and some material on Calculus which
appeared in the MAA3 publications [1, 15-17, 19] and abstracts of some PhD
dissertations related to Calculus [6-8, 11, 14]. In addition, the team looked into some
material which specifically addressed the problem of students’ retention (See Chapter 2
for the details)
3.2.b. Preparation of Experiment for Phase I
The project team analyzed the material of MATH 102 in order to identify the concepts
from the prerequisite courses MATH 001/002/101, which are directly related to the
contents of MATH 102. A survey was designed on the basis of these concepts (See
Appendix 1(i)).
3.2.c. Mode of Recitation Classes
A plan for recitation classes was prepared to create momentous interaction among
students and the recitation class instructor. A specific strategy was planned in order to
utilize the recitation classes with respect to the following aspects
• Group Activity
• Use of Math software
• Maintaining close interaction between the course instructors and the recitation
class instructor.
3.2.d. Use of Technology
A joint WebCT account was arranged for the allocated sections of MATH 102. The main
components of the WebCT were designed for the enhancement of the project plan. It was
decided to introduce the software “Mathematica” just for awareness in the recitation
classes. Therefore, a handout summarizing the main commands of Mathematica was
prepared to facilitate the students’ learning (See Appendix 3(i)). Keeping in view the
3 Mathematical Association of America

18
length of the course, this activity was kept at a minimal level so that it does not affect the
course-coverage.
19
4. Activities during Term 042 (Phase I)
4.1. Survey I & Related Activities
4.1a. Survey I
Survey I was conducted among the MATH 102 students during the 1st week of classes. It
aimed to determine awareness of the students on the basic concepts of MATH
001/002/101 that are frequently used in MATH 102. The students were asked to tick the
appropriate box given against each survey item in case they understand the concept. 416
students from 18 sections of MATH 102 participated in the survey. In Appendix 1(i), the
figure given in a box against each question represents the percentage of students who
claimed that they were aware of the concept.
4.1b. Follow-up Quiz
In order to authenticate the survey, a quiz was prepared from the survey items where at
least 75% of the students claimed their awareness. This quiz was given to the sections of
those students who participated in the survey. 329 students sat in the quiz. It was
conducted during the 1st week of the classes. The Follow-up Quiz and its outcome may be
found in Appendix 1(ii).
4.1c. Preparation of Remedial Material
The concepts related to Survey I and the Follow-up Quiz where the students had a poor
response were classified as a part of Remedial Material. This material was posted on the
WebCT for students’ self-study. It is reiterated that the deficiency material identified
from the contents of MATH 001/002/101 was required in various parts of MATH 102
(See Appendix 3 (ii)).
4.2. Some Teaching Related Activities
4.2a. Teacher-Student Based Learning
The Project Team adopted the following format of teaching for the coverage of course
material:
20
After introducing a new concept in the class, the relevant exercises were divided into
three parts:
• Problems solved in the class lectures with partial involvement of students.
• A set of similar exercises for “Recitation Classes” involving group activity as
well.
• Homework problems similar to text exercises but with changed parameters.
The students were encouraged to consult the course instructor in case of difficulty on
homework or problems assigned for recitation classes.
A good number of students (not all) appreciated the structure of exercises. As a follow-
up, the students were given a quiz that was based on the material they covered in the
preceding week(s). The solution of quizzes and homework was posted on the WebCT. It
was noted that the students considered some of the homework problems challenging for
them. Those who put an effort in doing the homework came up with a good score on the
quizzes. Overall, the students made a better score on quizzes as compared to that on
homework.
4.2b. Recitation Classes
The students were divided into various groups in each class. Each group consisted of 5-6
students with lower to higher achievements in their earlier math courses. The weekly
recitation classes involved the following activities:
• Group activity for problem solving (20 minutes)
• Presentation of solution on board by randomly selected students (15-20 minutes)
• Pop quiz out of recitation material and/or explanation by the instructor (10-15
minutes)
• Assigning 1-2 exercises based on use of “Mathematica” (outside the class)
Further details on “Recitation Classes” may be found in Appendix 3(iii)
4.2c. Use of WebCT and Overhead Projector
21
Based on past experience, the project team identified part of the course material which
used to create a misunderstanding of concepts among students due to the overlapping of
concept/terminology, e.g.,
• Volume of solid of revolution by different methods
• Various convergence tests for infinite series
• Different methods for power series representation of functions
• Solution of an integral by different techniques.
This type of material was presented by an overhead projector and students were given a
chance to observe similarities and differences in closely related concepts and the relevant
techniques while solving the exercises. Solutions of some exercises were left incomplete
during the class lectures. It forced most of the students to practice on the partially solved
problems outside the classroom. The students were able to cover a large variety of
problems in the class by this approach. In some cases, part of the lecture material was
posted on the WebCT for the sake of students’ quick revision. This material was
particularly related to the concepts where the students were found in confusion. The
students were advised at the same time to go through the textbook and read the
corresponding examples therein as well.
4.3. Survey II & Midterm Exam
4.3a. Survey II
Student Survey II was designed only for the students of the Project Team (i.e, Sec. 3, 6,
14 and 19). This survey was conducted during the 7th week of the term. The purpose of
the survey was to determine the level of retention of the course material allocated for the
mid term exam. 100 students were present when the survey was conducted.
4.3b. Students’ awareness with their deficiency
It may be noted that the students were not informed about the outcome of Survey II.
However, some did realize their deficiency on some concepts while filling in the survey
form and made an effort to rectify their mistakes before the midterm exam.
22
4.3c. Midterm Exam
The mid term exam was given in the 8th week. Its outcome was used to determine the
reliability of Survey II. 115 students of sections 3, 6, 14 and 19 took the exam. The
details of the survey and mid term exam are given in Appendices 1(iii)-(iv).
4.4. Survey III & Exit Quiz
4.4a. Survey III
By the end of the 13th week, while approaching the end of the course material, the 3rd and
final Survey was conducted among the students involved in the experiment directly (i.e,
students of Sec. 3, 6, 14 and 19). The objective of the survey was to determine the
retention level of students on the course material covered up to the 12th week of the term
042. 100 students were present during the survey.
4.4b. Exit Quiz (For all the 18 sections which participated in Survey I)
The students of MATH 102 were given a comprehensive quiz during the 13th week. We
shall refer this quiz as to “Exit Quiz”. The purpose of this quiz was two-fold. The first
objective was to determine the reliability of Survey III which was designed for the
students subject to the experiment. The second objective was to determine the difference
of understanding among the students of two categories:
(i) Students involved directly in the experiment (101 students sat in the quiz)
(ii) Students belonging to instructors other than investigators (172 students sat in
the quiz).
In this regard, an analysis of outcomes of both the survey and the exit quiz was carried
out. The details of Survey III and the Exit Quiz appear in Appendices 1(v)-(vi).
23
5. Activities during Term 051 (Phase II)
Similar activities as conducted in the term 042 were carried out in Phase II with the same
objectives and a similar analysis of surveys and quizzes. Therefore, we shall avoid
repetition and briefly provide the description of these activities. It may be noted that
students of sections 4, 8 (Dr. M. Bokhari) and sections 12 and 17 (Dr M. Samman) were
subject to the experiment.
5.1. Survey I & Related Activities
5.1a. Survey I (Conducted during 1st week of classes)
Survey I was aimed at determining the awareness of the students on the basic concepts of
MATH 001/002 that are frequently used in MATH 101. 559 students from 15 sections
of MATH 101 participated in the survey. In Appendix 2(i), the figure given in a box
against each question represents the percentage of students who claimed that they were
aware of the concept.
5.1b. Follow-up Quiz
The surveyed questions where at least 67% of the students (with a couple of exceptions)
claimed their awareness were selected for a Quiz. As before,
• This quiz was given to the students of who participated in Survey I.
• It was conducted during the 1st week of the classes.
• The objective of the quiz was to determine the authenticity of the Survey
outcome.
The follow-up Quiz and its outcome may be found in Appendix 2(ii).
5.1c. Preparation of Remedial Material
The concepts related to Survey I and the Follow-up Quiz where the students’ response
was poor, were classified as a part of Remedial Material (Same as described in Section
4.1.c). Appendix 3(iv) describes the nature of review material.
24
5.2. Some Teaching Related Activities
5.2a. Teacher-Student based Learning & Recitation Classes
For the details, please see Section 4.2.a - 4.2b.
5.2b. Use of WebCT and Overhead Projector
Some topics like ( - )ε δ definition, differentials, and word-problems based on related rates
and maxima/minima consume a lot of lecture time when explained on the chalk-board in
calculus classes. In our view, it is wastage of class time to explain complex concepts
involving several notations or writing statements of lengthy word-problems. The students
made positive comments after receiving explanation of such topics through the overhead
projector in classrooms. The students in some cases were asked to look into the displayed
material and attempt relevant problems in the class. To provide additional help, the same
material was posted on the WebCT.
5.3. Survey II & Midterm Exam
5.3a. Survey II (Conducted during 7th week of classes)
Like in the case of MATH 102, this survey was also meant only for the sections involved
in the experiment directly (See Section 4.3.a for explanation). 93 students were present
at the time of survey. The outcomes of Survey II and Midterm Exams are given in
Appendices 2(iii)-(iv).
5.3b. Mid Term Exam
The mid term exam was given in the 8th week. Its outcome was used to determine the
reliability of Survey II. 109 students appeared in the exam.
5.4. Survey III & Exit Quiz
5.4a. Survey III (Conducted during 13th week of classes)
As already described in Section 4.4.a, this survey was conducted among the students of
the 4 sections with the Project Team. 100 students were present at time the survey. It was
designed to determine the retention level of the students on the course material they
covered up to the 12th week of classes.
25
5.4b. Exit Quiz (Conducted during 13th week of classes)
273 students (101 subject to experiment and 172 from other sections) sat in the Exit Quiz.
The details of the Survey III and Exit Quiz are given in Appendices 2(v)-(vi).

26
6. Conclusion I
(Deficiency & Retention) It is important to note that our items selected for the surveys and quizzes (both follow-up
and exit) were mostly based on a mono concept. After analyzing the data collected from
these surveys, quizzes, midterm exams and some other classroom activities during the
course of our experiment, we came across several observations concerning the
performance of the students in the PCC. In this regard we shall focus on the following
factors:
• Deficient concepts
• Consistent deficiency
• Retention level
• Authenticity of the surveys
• Study habits
6.1. Some definitions/terminologies
In our analysis, we shall define a “Deficient Concept” and make a distinction among the
levels of deficiency. The concept of “Consistent Deficiency” will also be introduced here.
In addition, we shall explain what we mean by the “Retention Level of the Students” in
the context of Calculus I/II.
Definition 1. We shall characterize a concept as a Deficient Concept if either one of the
following criterions holds:
i. the percentage of students that claim to know the concept is less than 75 on
Survey I
ii. the percentage of students who attempted a surveyed concept correctly in the
follow-up quiz is less than 75
Definition 2. The level of deficiency on a concept is based on its percentage value in
Survey I (MATH 101/MATH 102) or in the follow-up quiz I (MATH 101/MATH 102),
and is defined as follows:
1. High level deficiency if the percentage is < 50
27
2. Medium level deficiency if the percentage is between 50 and 64
3. Low level deficiency if the percentage is between 65 and 79.
Definition 3. Any deficient concept which appears more than once in Survey I (MATH
101/MATH 102) or the follow-up quiz I (MATH 101/MATH 102) will be termed as a
“Consistent Deficient Concept”.
Definition 4. The retention level of a course item will be based on its percentage value on
“Survey II and Midterm Exam” or “Survey III and Exit Quiz”. We shall identify the
retention level as
1. High if the outcome percentage is > 75
2. Medium if the outcome percentage is between 65 and 75
3. Low if outcome percentage is between 50 and 64
4. Very Low if the outcome is < 50
It may be worthwhile to differentiate between “Deficiency” and “Retention” in our
discussion:
• We shall say that a student has a deficiency in a concept while taking a
course XXX if the concept is related to one of its prerequisite course(s).
• We shall say that a student has a low level retention in a concept while
taking a course XXX if the concept is directly related to the same course.
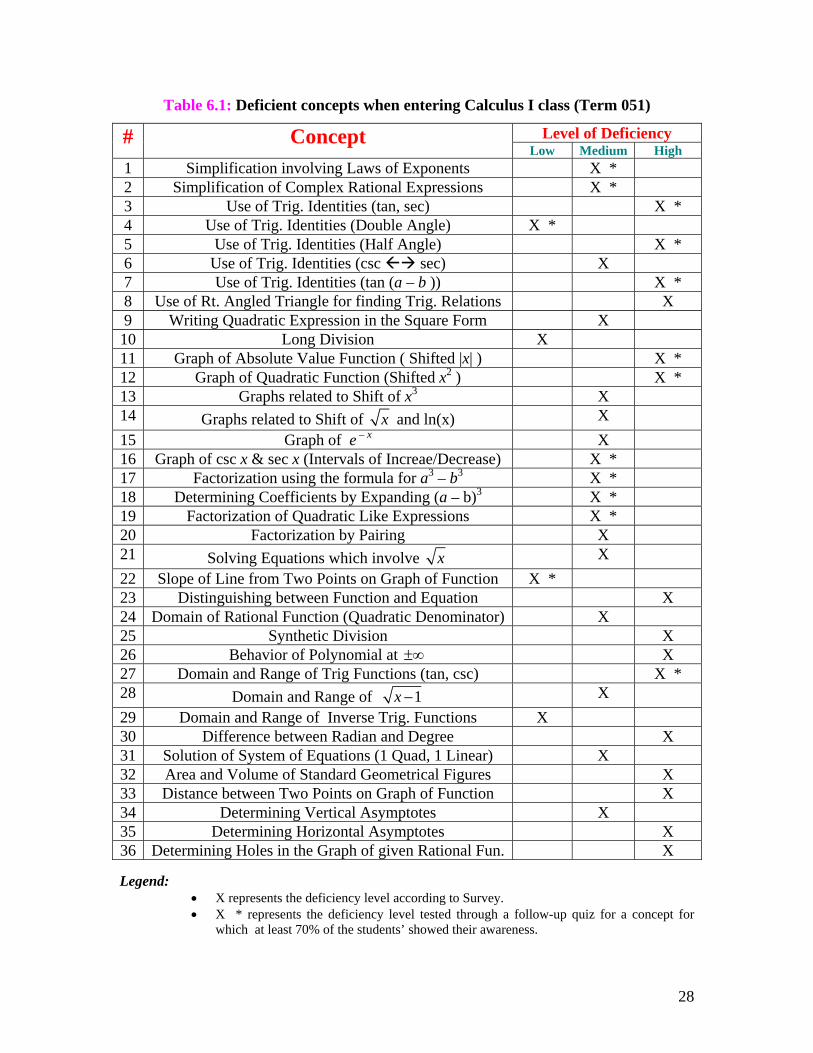
6.2. Deficient concepts when entering Calculus I class
The material covered by the students in the pre-calculus courses at KFUPM plays an
important role in the study of Calculus. Therefore, first we focus on the students’ aptitude
for these concepts at the time of entering Calculus I course (MATH 101). An analysis
based on Definitions 1 and 2 (Sec. 6.1) is summarized in Table 6.1.
28
Table 6.1: Deficient concepts when entering Calculus I class (Term 051)
Level of Deficiency # Concept Low Medium High
1 Simplification involving Laws of Exponents X * 2 Simplification of Complex Rational Expressions X * 3 Use of Trig. Identities (tan, sec) X * 4 Use of Trig. Identities (Double Angle) X * 5 Use of Trig. Identities (Half Angle) X * 6 Use of Trig. Identities (csc sec) X 7 Use of Trig. Identities (tan (a – b )) X * 8 Use of Rt. Angled Triangle for finding Trig. Relations X 9 Writing Quadratic Expression in the Square Form X 10 Long Division X 11 Graph of Absolute Value Function ( Shifted |x| ) X * 12 Graph of Quadratic Function (Shifted x2 ) X * 13 Graphs related to Shift of x3 X 14 Graphs related to Shift of x and ln(x) X 15 Graph of e – x X 16 Graph of csc x & sec x (Intervals of Increae/Decrease) X * 17 Factorization using the formula for a3 – b3 X * 18 Determining Coefficients by Expanding (a – b)3 X * 19 Factorization of Quadratic Like Expressions X * 20 Factorization by Pairing X 21 Solving Equations which involve x X 22 Slope of Line from Two Points on Graph of Function X * 23 Distinguishing between Function and Equation X 24 Domain of Rational Function (Quadratic Denominator) X 25 Synthetic Division X 26 Behavior of Polynomial at ±∞ X 27 Domain and Range of Trig Functions (tan, csc) X * 28 Domain and Range of 1x − X 29 Domain and Range of Inverse Trig. Functions X 30 Difference between Radian and Degree X 31 Solution of System of Equations (1 Quad, 1 Linear) X 32 Area and Volume of Standard Geometrical Figures X 33 Distance between Two Points on Graph of Function X 34 Determining Vertical Asymptotes X 35 Determining Horizontal Asymptotes X 36 Determining Holes in the Graph of given Rational Fun. X
Legend:
• X represents the deficiency level according to Survey. • X * represents the deficiency level tested through a follow-up quiz for a concept for
which at least 70% of the students’ showed their awareness.
29
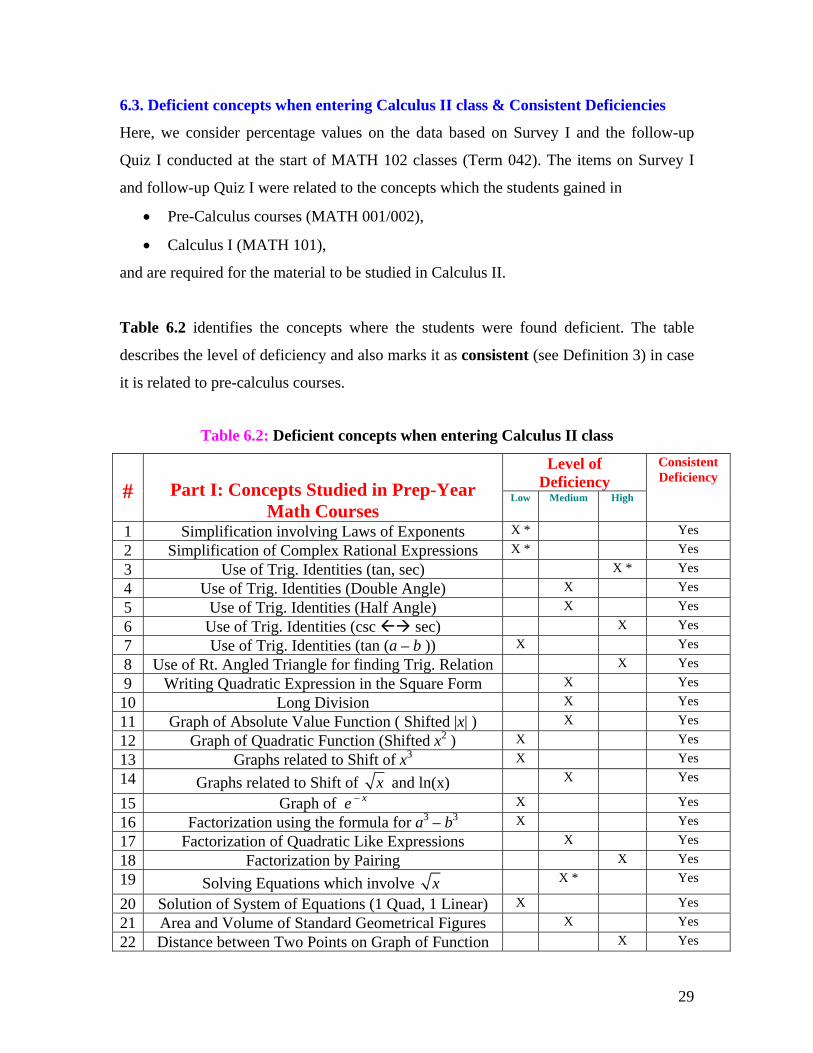
6.3. Deficient concepts when entering Calculus II class & Consistent Deficiencies
Here, we consider percentage values on the data based on Survey I and the follow-up
Quiz I conducted at the start of MATH 102 classes (Term 042). The items on Survey I
and follow-up Quiz I were related to the concepts which the students gained in
• Pre-Calculus courses (MATH 001/002),
• Calculus I (MATH 101),
and are required for the material to be studied in Calculus II.
Table 6.2 identifies the concepts where the students were found deficient. The table
describes the level of deficiency and also marks it as consistent (see Definition 3) in case
it is related to pre-calculus courses.
Table 6.2: Deficient concepts when entering Calculus II class
Level of Deficiency
#
Part I: Concepts Studied in Prep-Year
Math Courses Low Medium High
Consistent Deficiency
1 Simplification involving Laws of Exponents X * Yes 2 Simplification of Complex Rational Expressions X * Yes 3 Use of Trig. Identities (tan, sec) X * Yes 4 Use of Trig. Identities (Double Angle) X Yes 5 Use of Trig. Identities (Half Angle) X Yes 6 Use of Trig. Identities (csc sec) X Yes 7 Use of Trig. Identities (tan (a – b )) X Yes 8 Use of Rt. Angled Triangle for finding Trig. Relation X Yes 9 Writing Quadratic Expression in the Square Form X Yes 10 Long Division X Yes 11 Graph of Absolute Value Function ( Shifted |x| ) X Yes 12 Graph of Quadratic Function (Shifted x2 ) X Yes 13 Graphs related to Shift of x3 X Yes 14 Graphs related to Shift of x and ln(x) X Yes
15 Graph of e – x X Yes 16 Factorization using the formula for a3 – b3 X Yes 17 Factorization of Quadratic Like Expressions X Yes 18 Factorization by Pairing X Yes 19 Solving Equations which involve x X * Yes
20 Solution of System of Equations (1 Quad, 1 Linear) X Yes 21 Area and Volume of Standard Geometrical Figures X Yes 22 Distance between Two Points on Graph of Function X Yes
30
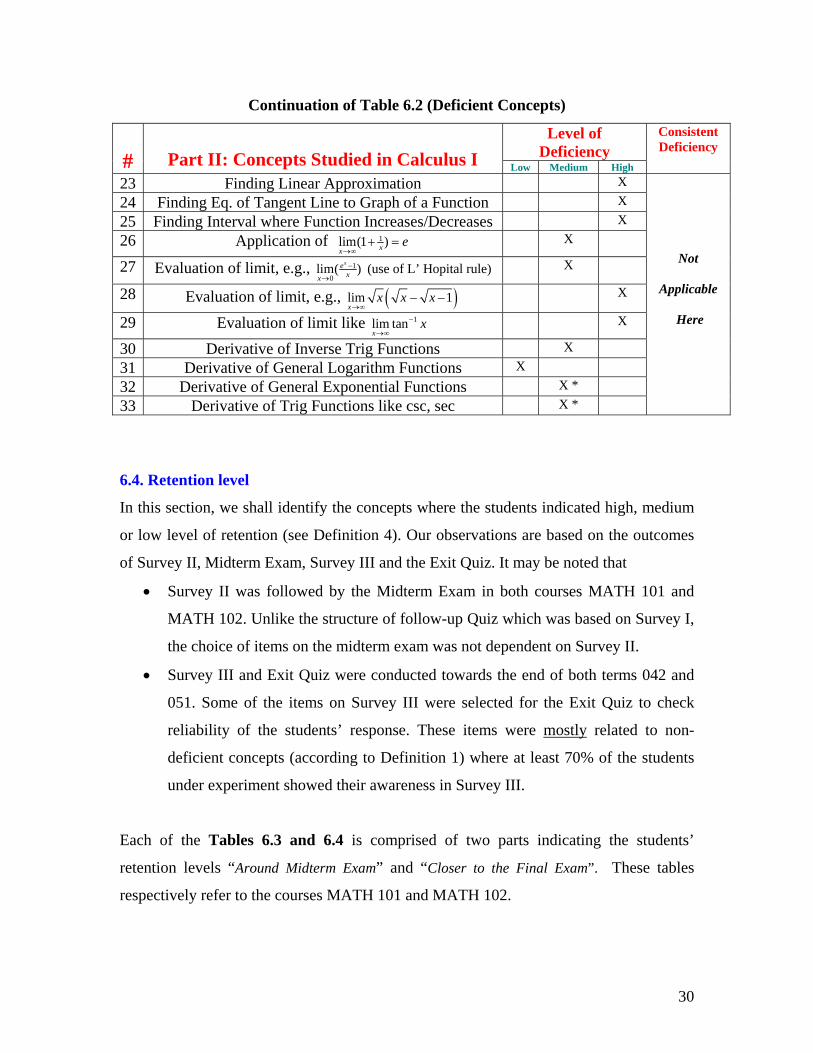
Continuation of Table 6.2 (Deficient Concepts)
Level of Deficiency
#
Part II: Concepts Studied in Calculus I Low Medium High
Consistent Deficiency
23 Finding Linear Approximation X 24 Finding Eq. of Tangent Line to Graph of a Function X 25 Finding Interval where Function Increases/Decreases X 26 Application of 1lim(1 )xx
e→∞
+ = X
27 Evaluation of limit, e.g., 1
0lim( )xe
xx
−
→ (use of L’ Hopital rule) X
28 Evaluation of limit, e.g., ( )lim 1x
x x x→∞
− − X
29 Evaluation of limit like 1lim tanx
x−
→∞ X
30 Derivative of Inverse Trig Functions X 31 Derivative of General Logarithm Functions X 32 Derivative of General Exponential Functions X * 33 Derivative of Trig Functions like csc, sec X *
Not
Applicable
Here
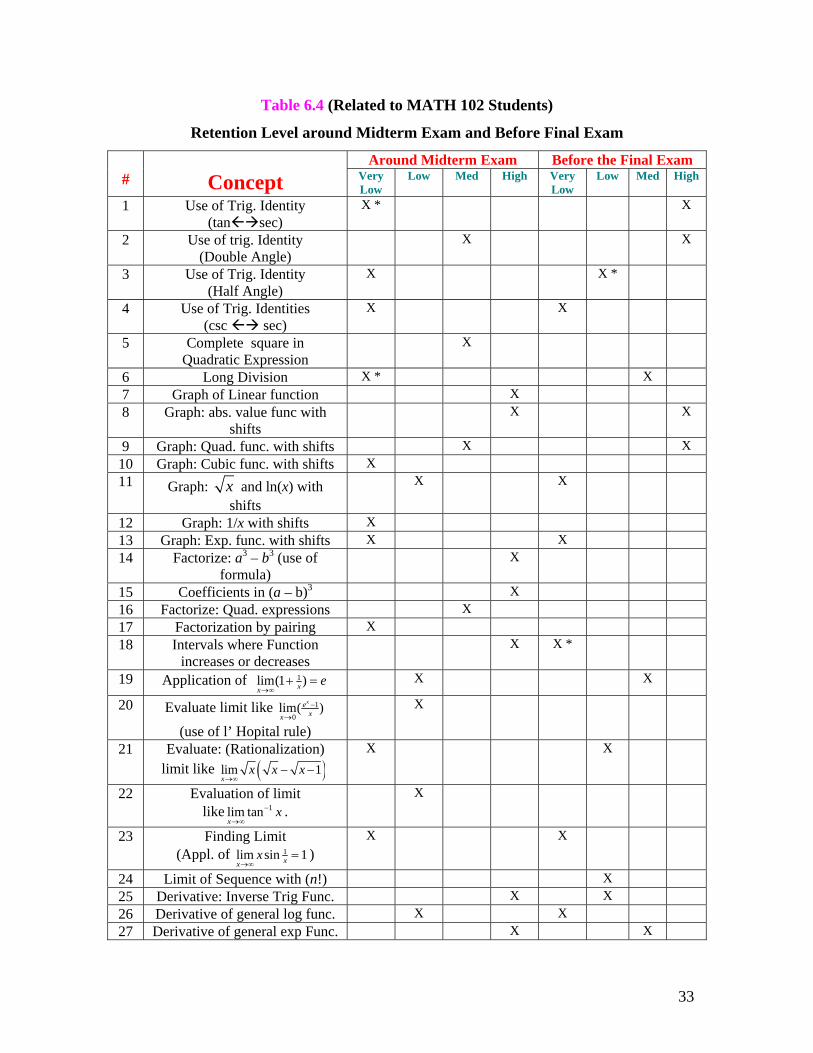
6.4. Retention level
In this section, we shall identify the concepts where the students indicated high, medium
or low level of retention (see Definition 4). Our observations are based on the outcomes
of Survey II, Midterm Exam, Survey III and the Exit Quiz. It may be noted that
• Survey II was followed by the Midterm Exam in both courses MATH 101 and
MATH 102. Unlike the structure of follow-up Quiz which was based on Survey I,
the choice of items on the midterm exam was not dependent on Survey II.
• Survey III and Exit Quiz were conducted towards the end of both terms 042 and
051. Some of the items on Survey III were selected for the Exit Quiz to check
reliability of the students’ response. These items were mostly related to non-
deficient concepts (according to Definition 1) where at least 70% of the students
under experiment showed their awareness in Survey III.
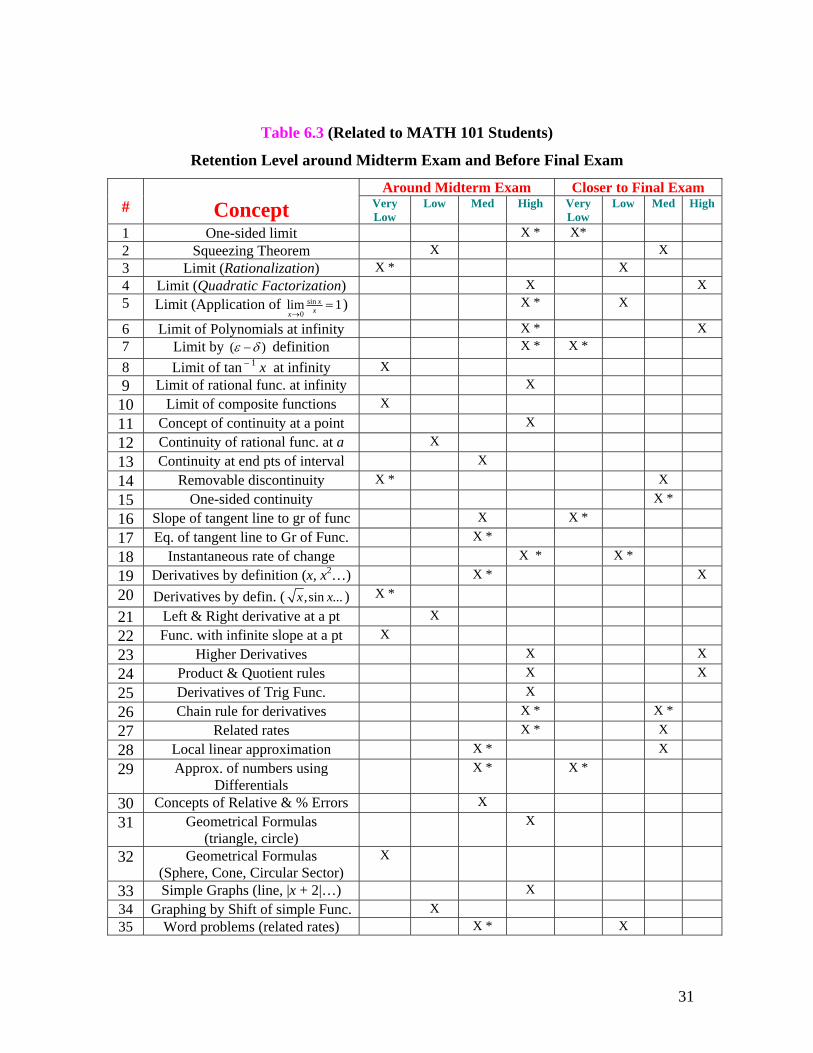
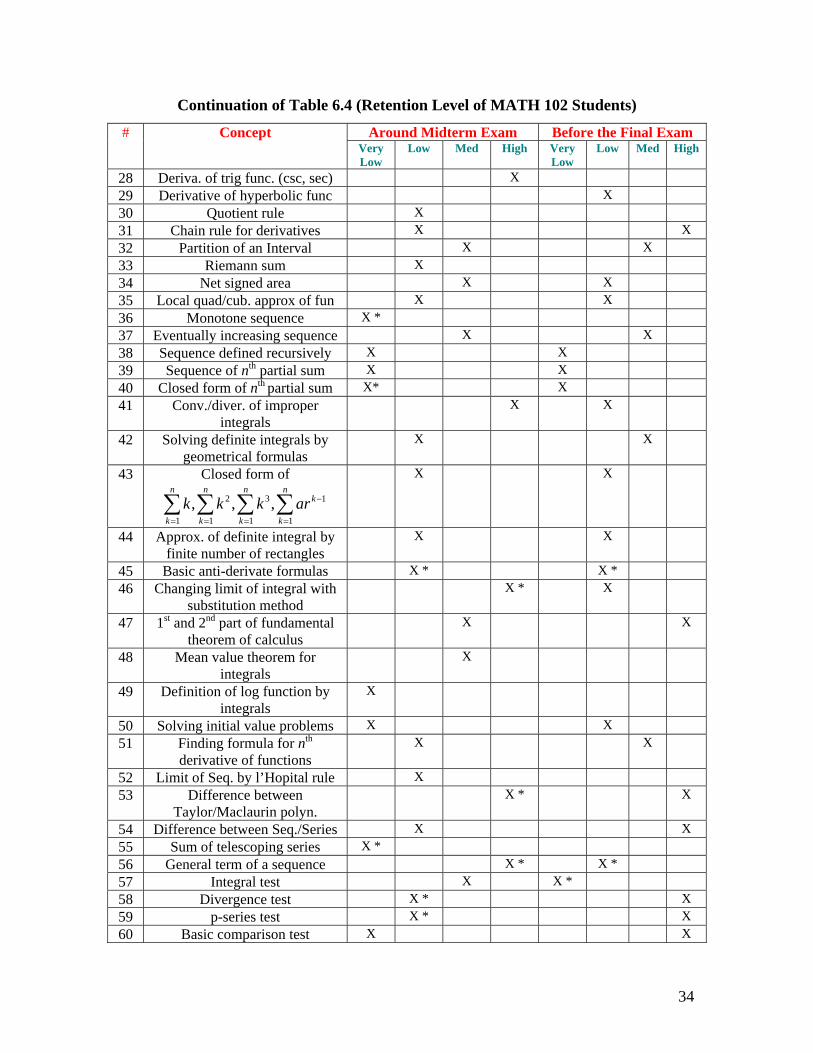
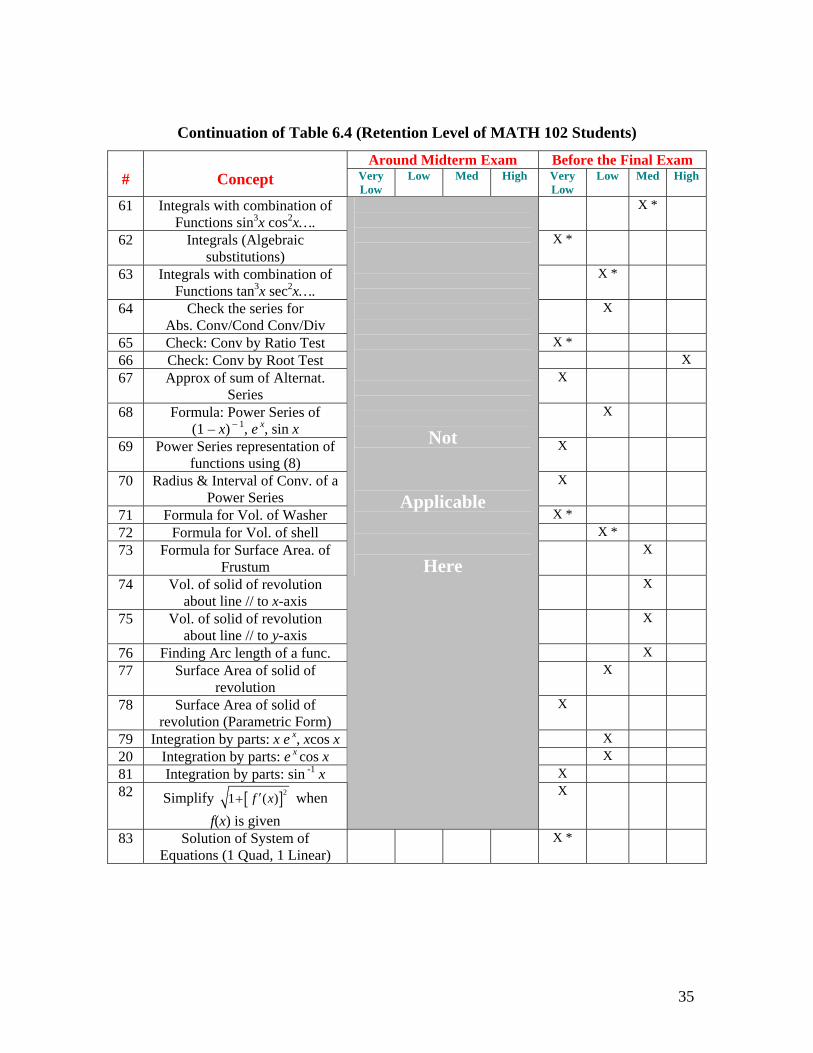
Each of the Tables 6.3 and 6.4 is comprised of two parts indicating the students’
retention levels “Around Midterm Exam” and “Closer to the Final Exam”. These tables
respectively refer to the courses MATH 101 and MATH 102.
31
Table 6.3 (Related to MATH 101 Students)
Retention Level around Midterm Exam and Before Final Exam
Around Midterm Exam Closer to Final Exam #
Concept Very
Low Low Med High Very
Low Low Med High
1 One-sided limit X * X* 2 Squeezing Theorem X X 3 Limit (Rationalization) X * X 4 Limit (Quadratic Factorization) X X 5 Limit (Application of sin
0lim 1x
xx→= ) X * X
6 Limit of Polynomials at infinity X * X 7 Limit by ( )ε δ− definition X * X *
8 Limit of tan – 1 x at infinity X 9 Limit of rational func. at infinity X 10 Limit of composite functions X 11 Concept of continuity at a point X 12 Continuity of rational func. at a X 13 Continuity at end pts of interval X 14 Removable discontinuity X * X 15 One-sided continuity X * 16 Slope of tangent line to gr of func X X * 17 Eq. of tangent line to Gr of Func. X * 18 Instantaneous rate of change X * X * 19 Derivatives by definition (x, x2…) X * X 20 Derivatives by defin. ( ,sin ...x x ) X *
21 Left & Right derivative at a pt X 22 Func. with infinite slope at a pt X 23 Higher Derivatives X X 24 Product & Quotient rules X X 25 Derivatives of Trig Func. X 26 Chain rule for derivatives X * X * 27 Related rates X * X 28 Local linear approximation X * X 29 Approx. of numbers using
Differentials X * X *
30 Concepts of Relative & % Errors X 31 Geometrical Formulas
(triangle, circle) X
32 Geometrical Formulas (Sphere, Cone, Circular Sector)
X
33 Simple Graphs (line, |x + 2|…) X 34 Graphing by Shift of simple Func. X 35 Word problems (related rates) X * X
32
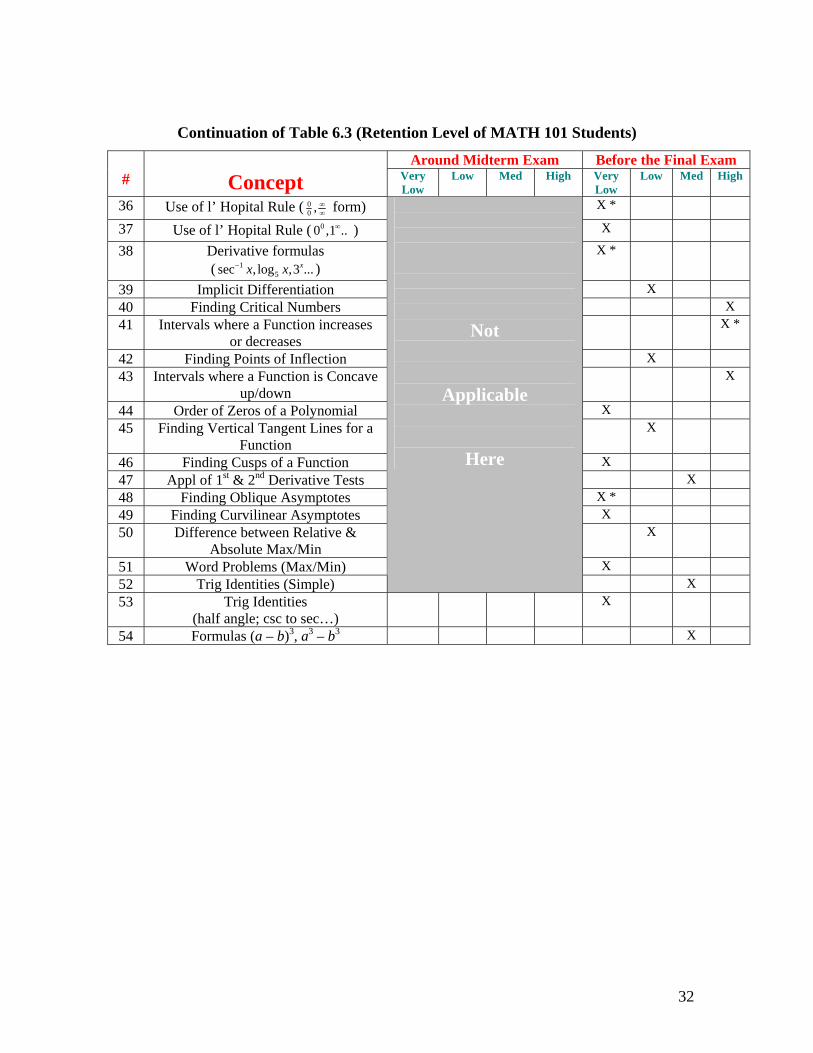
Continuation of Table 6.3 (Retention Level of MATH 101 Students)
Around Midterm Exam Before the Final Exam #
Concept Very
Low Low Med High Very
Low Low Med High
36 Use of l’ Hopital Rule ( 00 , ∞∞ form) X *
37 Use of l’ Hopital Rule ( 00 ,1 ..∞ ) X
38 Derivative formulas ( 1
5sec , log ,3 ...xx x− ) X *
39 Implicit Differentiation X 40 Finding Critical Numbers X 41 Intervals where a Function increases
or decreases X *
42 Finding Points of Inflection X 43 Intervals where a Function is Concave
up/down X
44 Order of Zeros of a Polynomial X 45 Finding Vertical Tangent Lines for a
Function X
46 Finding Cusps of a Function X 47 Appl of 1st & 2nd Derivative Tests X 48 Finding Oblique Asymptotes X * 49 Finding Curvilinear Asymptotes X 50 Difference between Relative &
Absolute Max/Min X
51 Word Problems (Max/Min) X 52 Trig Identities (Simple)
Not
Applicable
Here
X 53 Trig Identities
(half angle; csc to sec…) X
54 Formulas (a – b)3, a3 – b3 X
33
Table 6.4 (Related to MATH 102 Students)
Retention Level around Midterm Exam and Before Final Exam
Around Midterm Exam Before the Final Exam #
Concept Very
Low Low Med High Very
Low Low Med High
1 Use of Trig. Identity (tan sec)
X * X
2 Use of trig. Identity (Double Angle)
X X
3 Use of Trig. Identity (Half Angle)
X X *
4 Use of Trig. Identities (csc sec)
X X
5 Complete square in Quadratic Expression
X
6 Long Division X * X 7 Graph of Linear function X 8 Graph: abs. value func with
shifts X X
9 Graph: Quad. func. with shifts X X 10 Graph: Cubic func. with shifts X 11 Graph: x and ln(x) with
shifts
X X
12 Graph: 1/x with shifts X 13 Graph: Exp. func. with shifts X X 14 Factorize: a3 – b3 (use of
formula) X
15 Coefficients in (a – b)3 X 16 Factorize: Quad. expressions X 17 Factorization by pairing X 18 Intervals where Function
increases or decreases X X *
19 Application of 1lim(1 )xxe
→∞+ = X X
20 Evaluate limit like 10
lim( )xexx−
→
(use of l’ Hopital rule)
X
21 Evaluate: (Rationalization) limit like ( )lim 1
xx x x
→∞− −
X X
22 Evaluation of limit like 1lim tan
xx−
→∞.
X
23 Finding Limit (Appl. of 1lim sin 1xx
x→∞
= ) X X
24 Limit of Sequence with (n!) X 25 Derivative: Inverse Trig Func. X X 26 Derivative of general log func. X X 27 Derivative of general exp Func. X X
34
Continuation of Table 6.4 (Retention Level of MATH 102 Students)
Around Midterm Exam Before the Final Exam # Concept Very Low
Low Med High Very Low
Low Med High
28 Deriva. of trig func. (csc, sec) X 29 Derivative of hyperbolic func X 30 Quotient rule X 31 Chain rule for derivatives X X 32 Partition of an Interval X X 33 Riemann sum X 34 Net signed area X X 35 Local quad/cub. approx of fun X X 36 Monotone sequence X * 37 Eventually increasing sequence X X 38 Sequence defined recursively X X 39 Sequence of nth partial sum X X 40 Closed form of nth partial sum X* X 41 Conv./diver. of improper
integrals X X
42 Solving definite integrals by geometrical formulas
X X
43 Closed form of 2 3 1
1 1 1 1, , ,
n n n nk
k k k kk k k ar −
= = = =∑ ∑ ∑ ∑
X X
44 Approx. of definite integral by finite number of rectangles
X X
45 Basic anti-derivate formulas X * X * 46 Changing limit of integral with
substitution method X * X
47 1st and 2nd part of fundamental theorem of calculus
X X
48 Mean value theorem for integrals
X
49 Definition of log function by integrals
X
50 Solving initial value problems X X 51 Finding formula for nth
derivative of functions X X
52 Limit of Seq. by l’Hopital rule X 53 Difference between
Taylor/Maclaurin polyn. X * X
54 Difference between Seq./Series X X 55 Sum of telescoping series X * 56 General term of a sequence X * X * 57 Integral test X X * 58 Divergence test X * X 59 p-series test X * X 60 Basic comparison test X X
35
Continuation of Table 6.4 (Retention Level of MATH 102 Students)
Around Midterm Exam Before the Final Exam #
Concept Very
Low Low Med High Very
Low Low Med High
61 Integrals with combination of Functions sin3x cos2x….
X *
62 Integrals (Algebraic substitutions)
X *
63 Integrals with combination of Functions tan3x sec2x….
X *
64 Check the series for Abs. Conv/Cond Conv/Div
X
65 Check: Conv by Ratio Test X * 66 Check: Conv by Root Test X 67 Approx of sum of Alternat.
Series X
68 Formula: Power Series of (1 – x) – 1, e x, sin x
X
69 Power Series representation of functions using (8)
X
70 Radius & Interval of Conv. of a Power Series
X
71 Formula for Vol. of Washer X * 72 Formula for Vol. of shell X * 73 Formula for Surface Area. of
Frustum X
74 Vol. of solid of revolution about line // to x-axis
X
75 Vol. of solid of revolution about line // to y-axis
X
76 Finding Arc length of a func. X 77 Surface Area of solid of
revolution X
78 Surface Area of solid of revolution (Parametric Form)
X
79 Integration by parts: x e x, xcos x X 20 Integration by parts: e x cos x X 81 Integration by parts: sin -1 x X 82 Simplify [ ]21 ( )f x′+ when
f(x) is given
Not
Applicable
Here
X
83 Solution of System of Equations (1 Quad, 1 Linear)
X *
36
7. Conclusion II
(A Comparative Study of the Performance of Subject & Control)
As stated above, Survey III and the Exit Quiz were conducted by the end of the terms 042
and 051. Survey III was conducted among the students under experiment. However,
students from all those sections which participated in Survey I were invited to write the
Exit Quiz. The students were asked to declare their section numbers in order to identify
the sections under experiment. Here, our purpose was two-fold:
1. To authenticate the response of the students under experiment (High level
response on Survey III versus performance on the Exit Quiz)
2. To compare the performance of the students under experiment with those
from the other sections.
7.1. Comparative Study in Phase I (Term 042)
This section deals with the performance of the students of MATH 102 towards the end of
the academic term.
7.1. a. Some explanations
There are certain points which may be helpful to draw some conclusions out of the
comparison provided in Table 7.1:
1. Many students consult a solution manual of the text exercises, for the completion
of their homework. Keeping in view this aspect, an exclusive weekly home work
was designed for the students under experiment during the Term 042. The
problems on the homework, though similar (with some exceptions) to the
textbook exercises, were not selected from the textbook. This forced the students
to work out the solutions by themselves. This is the first time when the project
team noticed a higher achievement of students on Class Quizzes as compared to
the quizzes preceded by textbook homework problems. It was also observed that
the students frequently visited the instructors’ offices to discuss homework
problems.
37
2. The students were involved in group work in the recitation classes. Again, special
questions were designed for this activity. These questions were posted on the
WebCT at least 4 days prior to the respective recitation class. The students were
urged to take a “serious look” at these problems and the concerned material
covered in the classroom. 50 minutes allocated to recitation class were distributed
over various activities which are stated below:
a. Group work activity on the selective 3-4 problems: 20-25 minutes
b. Presentation of solutions, one by each group: 20-25 minutes
c. Explanation by instructor (if required) or A pop Quiz: 5 minutes
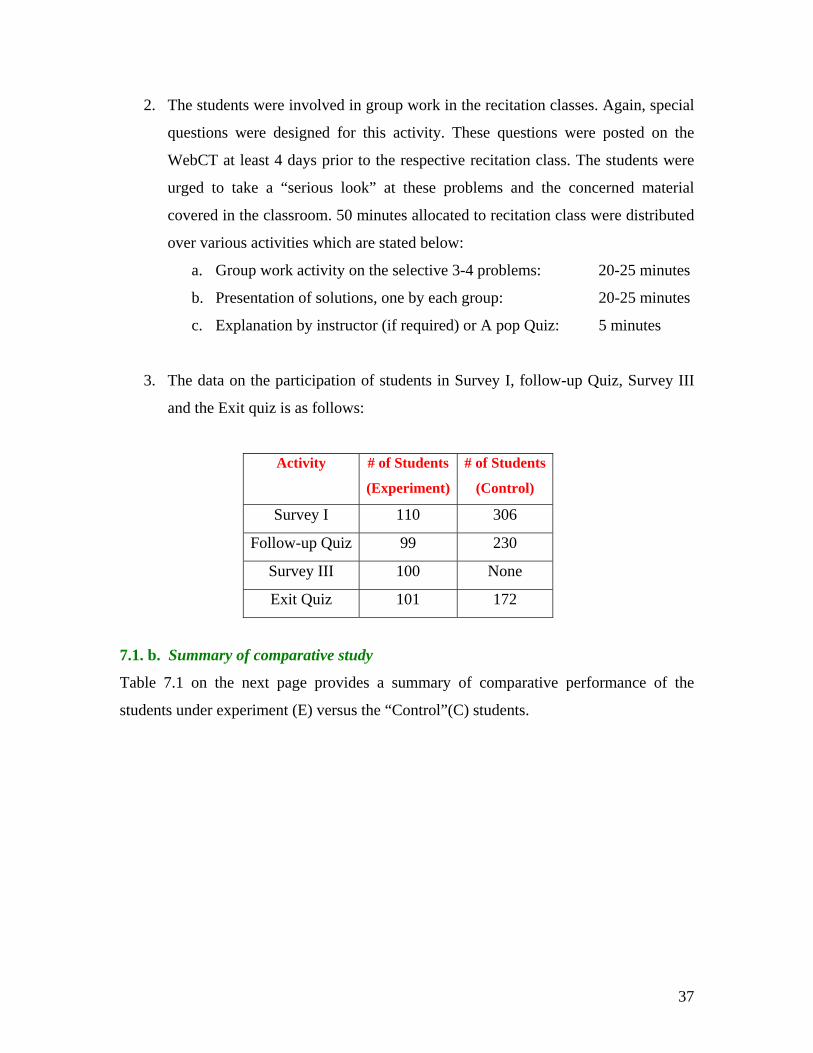
3. The data on the participation of students in Survey I, follow-up Quiz, Survey III
and the Exit quiz is as follows:
Activity # of Students
(Experiment)
# of Students
(Control)
Survey I 110 306
Follow-up Quiz 99 230
Survey III 100 None
Exit Quiz 101 172
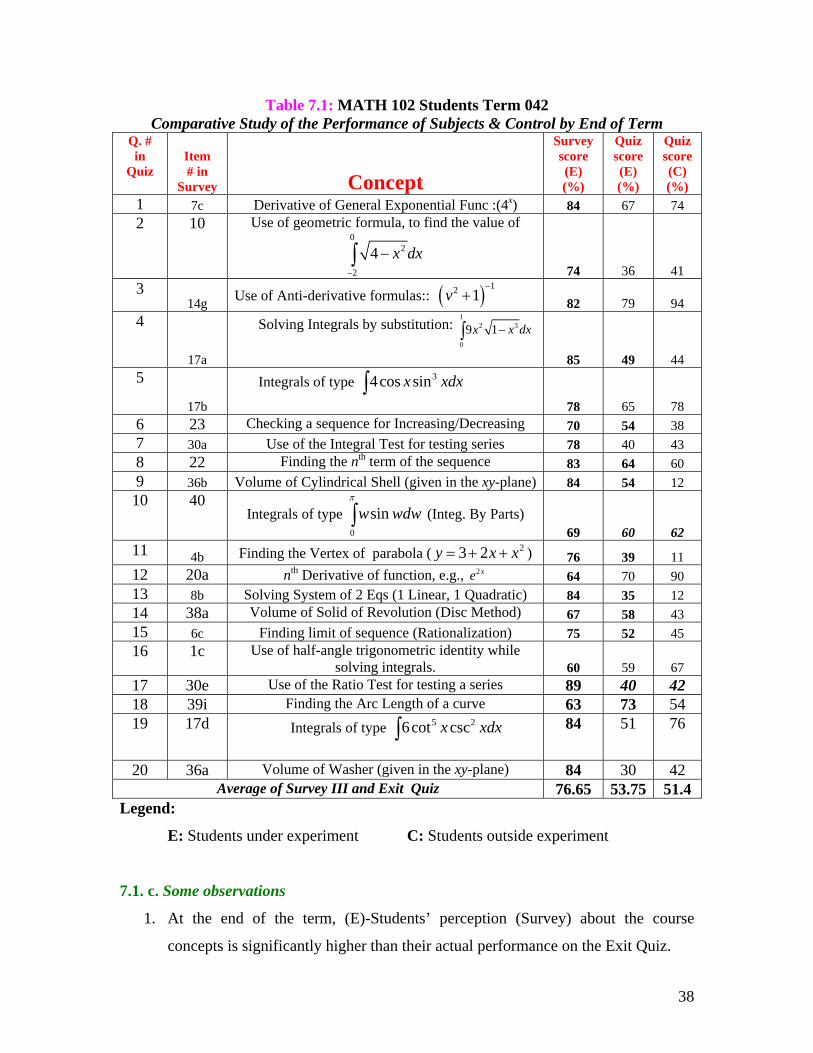
7.1. b. Summary of comparative study
Table 7.1 on the next page provides a summary of comparative performance of the
students under experiment (E) versus the “Control”(C) students.
38
Table 7.1: MATH 102 Students Term 042 Comparative Study of the Performance of Subjects & Control by End of Term
Q. # in
Quiz Item # in
Survey Concept
Survey score (E) (%)
Quiz score (E) (%)
Quiz score (C) (%)
1 7c Derivative of General Exponential Func :(4x) 84 67 74 2 10 Use of geometric formula, to find the value of
02
2
4 x dx−
−∫ 74 36 41
3 14g Use of Anti-derivative formulas:: ( ) 12 1v
−+ 82 79 94
4
17a
Solving Integrals by substitution: 1
2 3
0
9 1x x dx−∫
85 49 44 5
17b
Integrals of type 34cos sinx xdx∫
78 65 78 6 23 Checking a sequence for Increasing/Decreasing 70 54 38 7 30a Use of the Integral Test for testing series 78 40 43 8 22 Finding the nth term of the sequence 83 64 60 9 36b Volume of Cylindrical Shell (given in the xy-plane) 84 54 12 10 40
Integrals of type 0
sinw wdwπ
∫ (Integ. By Parts) 69 60 62
11 4b Finding the Vertex of parabola ( 23 2y x x= + + ) 76 39 11 12 20a nth Derivative of function, e.g., 2xe 64 70 90 13 8b Solving System of 2 Eqs (1 Linear, 1 Quadratic) 84 35 12 14 38a Volume of Solid of Revolution (Disc Method) 67 58 43 15 6c Finding limit of sequence (Rationalization) 75 52 45 16 1c Use of half-angle trigonometric identity while
solving integrals. 60 59 67 17 30e Use of the Ratio Test for testing a series 89 40 42 18 39i Finding the Arc Length of a curve 63 73 54 19 17d Integrals of type 5 26cot cscx xdx∫ 84 51 76
20 36a Volume of Washer (given in the xy-plane) 84 30 42 Average of Survey III and Exit Quiz 76.65 53.75 51.4
Legend:
E: Students under experiment C: Students outside experiment
7.1. c. Some observations
1. At the end of the term, (E)-Students’ perception (Survey) about the course
concepts is significantly higher than their actual performance on the Exit Quiz.
39
2. The students wrote the Exit Quiz out of the entire course material without proper
preparation. The low averages (53.75 & 51.4) may be due to this factor (see Table
7.1).
3. (E)-Students on the average basis performed better than (C)-Students. This
difference may be due to following factors:
a. Special homework problems, indeed, helped the students to improve their
conceptual understanding (see 7.1.a item 1).
b. The design of recitation class can be an instrumental factor for slightly
better performance of (E)-Students (see 7.1.a item 2).
c. The number of (C)-Students who participated in the Exit Quiz was 75% of
those who participated in the follow-up Quiz given at the start of the term
042. This number in our view is quite reasonable as the students at the end
of the term are occupied with several academic activities in different
courses (see 7.1.a item 3). As the average performance of an individual
indicates, several (C)-Students had a poor score on the Exit Quiz.
Therefore, we may expect a better performance of (E)-students as compared to
(C)-students.
7.2. Comparative Study in Phase II (Term 051)
This section deals with the performance of the students of MATH 101 towards the end of
the academic term.
7.2. a. Some explanations
Like Section 7.1.a, we present certain points which will enable us to draw some
conclusions out of the comparison given in Table 7.2:
1. We had a strong observation from the (E)-Students of MATH 102 about the
homework problems. They complained about the excessive amount of time which
they had to spend in order to solve exclusively designed homework problems. The
project team decided to give the (E)-Students of MATH 101 routine text exercises
for homework. The underlying idea for the change was to observe the
performance of these students with those of (C)-Students of MATH 101 and also
40
between the two (E)-Groups (i.e., (E)-students of MATH 101 and MATH 102).
As a consequence, we observed that the students scored on the homework almost
90% which was significantly higher than their performance on the class quizzes.
As mentioned earlier, several students consult the solution manual for homework
problems. This practice results in the students not digesting the course concepts
properly. Also, the project team noticed less interaction of the MATH 101 (E)-
students with their instructors as compared to what they observed with their (E)-
students of MATH 102.
2. The activity of recitation classes was kept the same as before (see 7.1.a item 2).
However, the students were given the text problems for this activity.
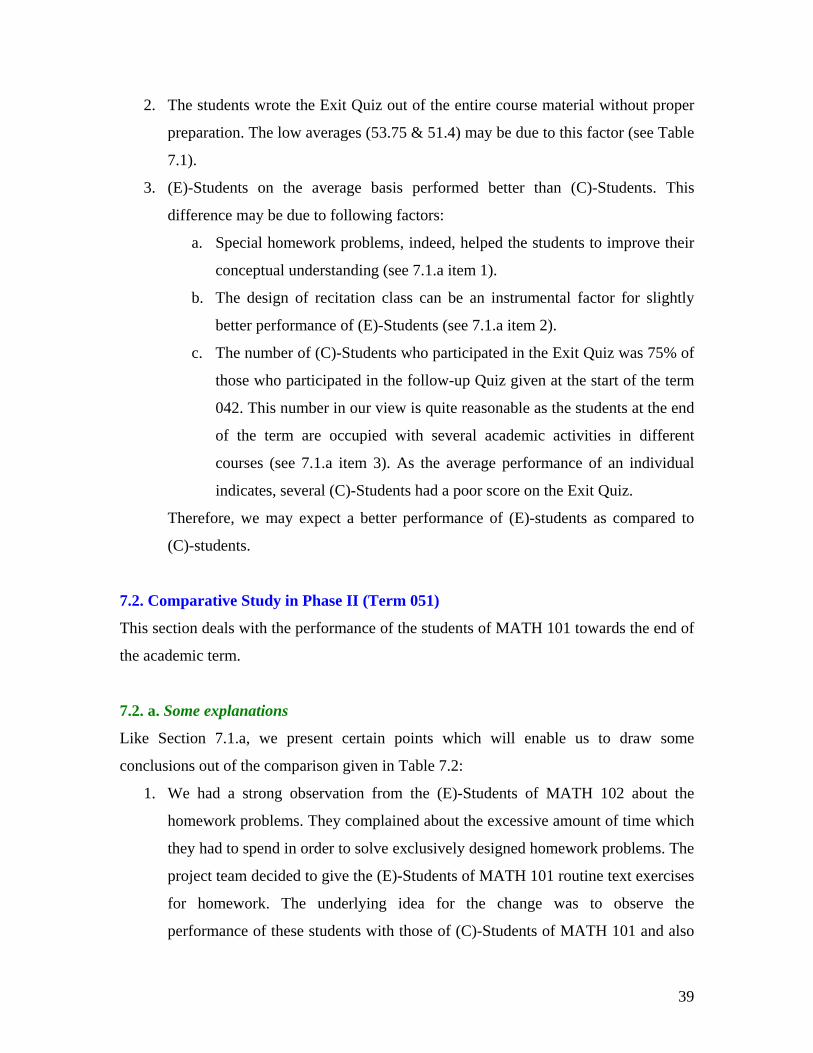
3. The data on the participation of students in Survey I, follow-up Quiz, Survey III
and the Exit quiz is as follows:
Activity # of Students
(Experiment)
# of Students
(Control)
Survey I 105 454
Follow-up Quiz 101 282
Survey III 100 None
Exit Quiz 87 141
7.2. b. Summary of comparative study
Table 7.2 provides a summary of comparative performance of the students under
experiment (E) versus the “Control”(C) students.
41
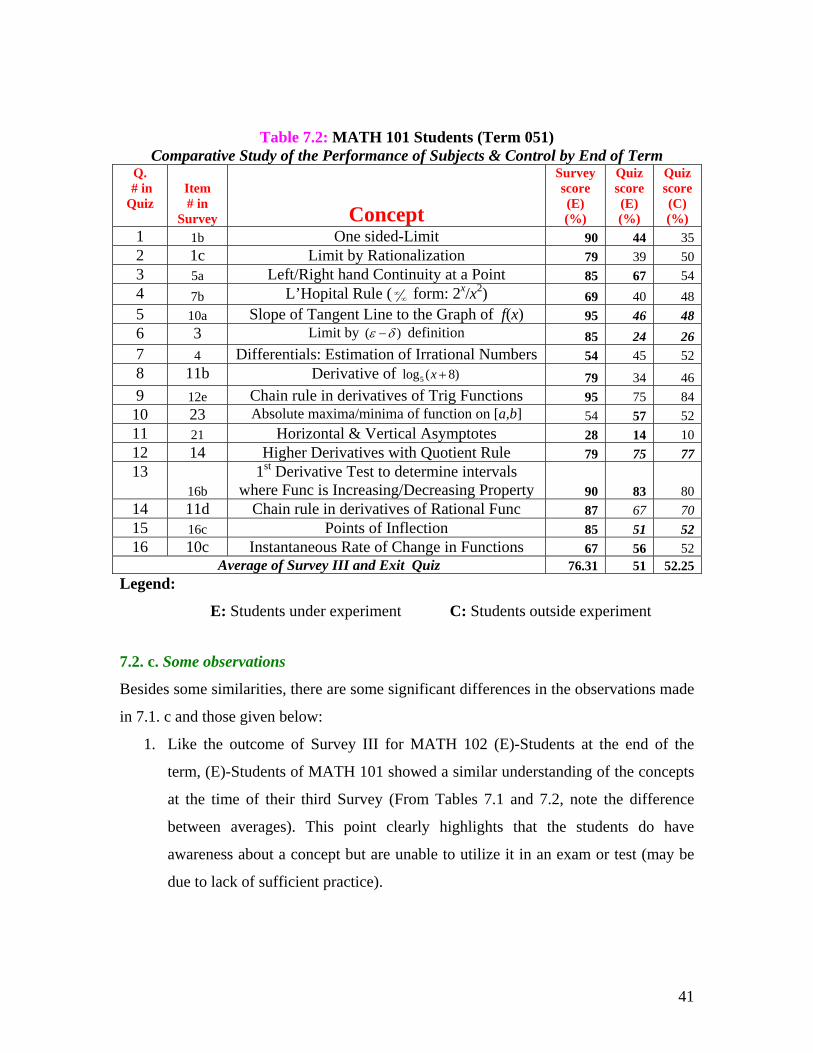
Table 7.2: MATH 101 Students (Term 051)
Comparative Study of the Performance of Subjects & Control by End of Term Q.
# in Quiz
Item # in
Survey Concept
Survey score (E) (%)
Quiz score (E) (%)
Quiz score (C) (%)
1 1b One sided-Limit 90 44 35 2 1c Limit by Rationalization 79 39 50 3 5a Left/Right hand Continuity at a Point 85 67 54 4 7b L’Hopital Rule ( ∞
∞ form: 2x/x2) 69 40 48 5 10a Slope of Tangent Line to the Graph of f(x) 95 46 48 6 3 Limit by ( )ε δ− definition 85 24 26 7 4 Differentials: Estimation of Irrational Numbers 54 45 52 8 11b Derivative of 5log ( 8)x + 79 34 46 9 12e Chain rule in derivatives of Trig Functions 95 75 84 10 23 Absolute maxima/minima of function on [a,b] 54 57 52 11 21 Horizontal & Vertical Asymptotes 28 14 10 12 14 Higher Derivatives with Quotient Rule 79 75 77 13
16b 1st Derivative Test to determine intervals
where Func is Increasing/Decreasing Property 90 83 80 14 11d Chain rule in derivatives of Rational Func 87 67 70 15 16c Points of Inflection 85 51 52 16 10c Instantaneous Rate of Change in Functions 67 56 52
Average of Survey III and Exit Quiz 76.31 51 52.25 Legend:
E: Students under experiment C: Students outside experiment 7.2. c. Some observations
Besides some similarities, there are some significant differences in the observations made
in 7.1. c and those given below:
1. Like the outcome of Survey III for MATH 102 (E)-Students at the end of the
term, (E)-Students of MATH 101 showed a similar understanding of the concepts
at the time of their third Survey (From Tables 7.1 and 7.2, note the difference
between averages). This point clearly highlights that the students do have
awareness about a concept but are unable to utilize it in an exam or test (may be
due to lack of sufficient practice).
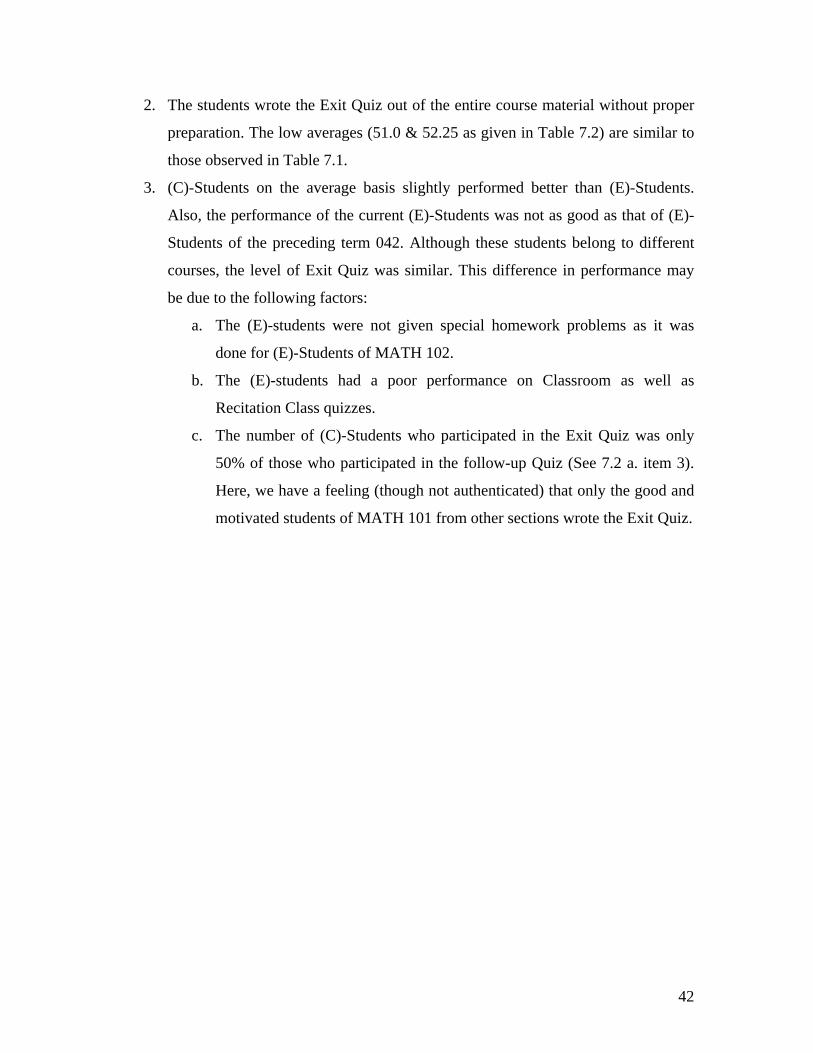
42
2. The students wrote the Exit Quiz out of the entire course material without proper
preparation. The low averages (51.0 & 52.25 as given in Table 7.2) are similar to
those observed in Table 7.1.
3. (C)-Students on the average basis slightly performed better than (E)-Students.
Also, the performance of the current (E)-Students was not as good as that of (E)-
Students of the preceding term 042. Although these students belong to different
courses, the level of Exit Quiz was similar. This difference in performance may
be due to the following factors:
a. The (E)-students were not given special homework problems as it was
done for (E)-Students of MATH 102.
b. The (E)-students had a poor performance on Classroom as well as
Recitation Class quizzes.
c. The number of (C)-Students who participated in the Exit Quiz was only
50% of those who participated in the follow-up Quiz (See 7.2 a. item 3).
Here, we have a feeling (though not authenticated) that only the good and
motivated students of MATH 101 from other sections wrote the Exit Quiz.
43
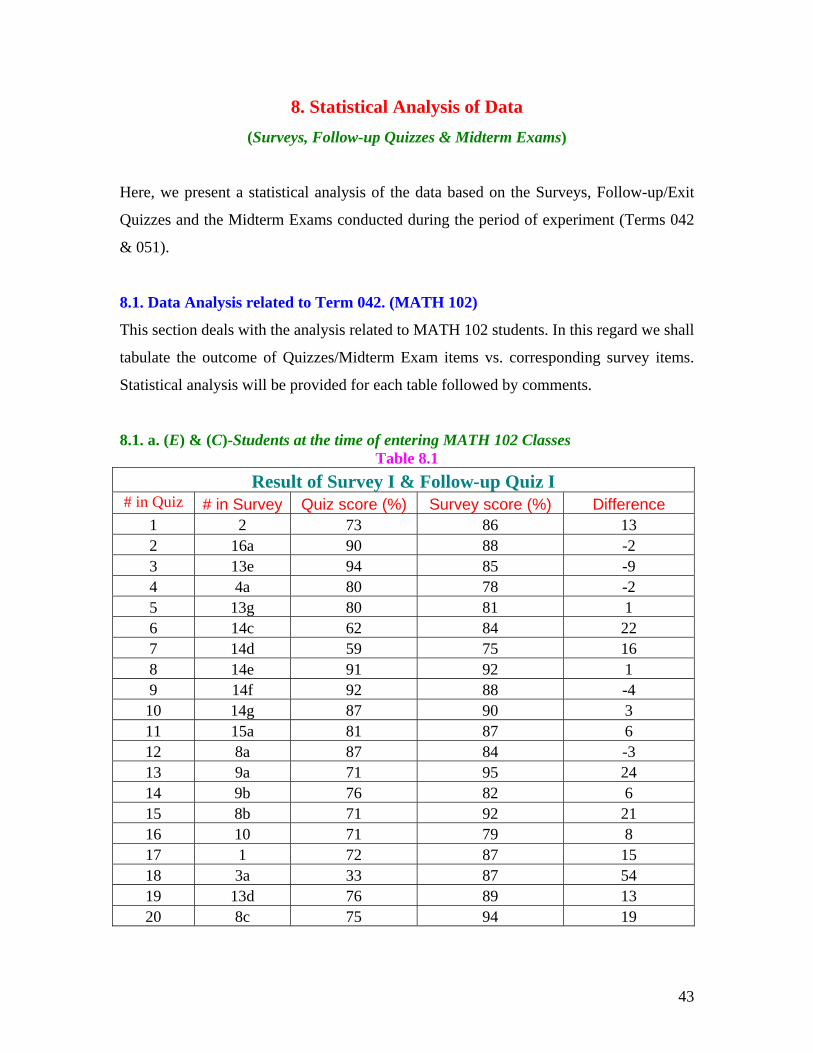
8. Statistical Analysis of Data (Surveys, Follow-up Quizzes & Midterm Exams)
Here, we present a statistical analysis of the data based on the Surveys, Follow-up/Exit
Quizzes and the Midterm Exams conducted during the period of experiment (Terms 042
& 051).
8.1. Data Analysis related to Term 042. (MATH 102)
This section deals with the analysis related to MATH 102 students. In this regard we shall
tabulate the outcome of Quizzes/Midterm Exam items vs. corresponding survey items.
Statistical analysis will be provided for each table followed by comments.
8.1. a. (E) & (C)-Students at the time of entering MATH 102 Classes Table 8.1
Result of Survey I & Follow-up Quiz I # in Quiz # in Survey Quiz score (%) Survey score (%) Difference
1 2 73 86 13 2 16a 90 88 -2 3 13e 94 85 -9 4 4a 80 78 -2 5 13g 80 81 1 6 14c 62 84 22 7 14d 59 75 16 8 14e 91 92 1 9 14f 92 88 -4 10 14g 87 90 3 11 15a 81 87 6 12 8a 87 84 -3 13 9a 71 95 24 14 9b 76 82 6 15 8b 71 92 21 16 10 71 79 8 17 1 72 87 15 18 3a 33 87 54 19 13d 76 89 13 20 8c 75 94 19

44
Analysis based on Table 8.1 Quiz score (%) Survey score (%) Mean 76.0500 86.1500 Variance 196.5763 28.2395 Number Of Observations 20 20 Hypothesized Mean Difference 0 df 24 t Stat -3.01247 P-value(One-Tail) 0.004592 P-value(Two-Tail) 0.005965
Comments: There is a significant statistical difference between the two means. We can therefore conclude that the students claim to know more than what they can actually do. Note: The test is based on that the two population variances are not equal, because there is a significant difference between them.
45
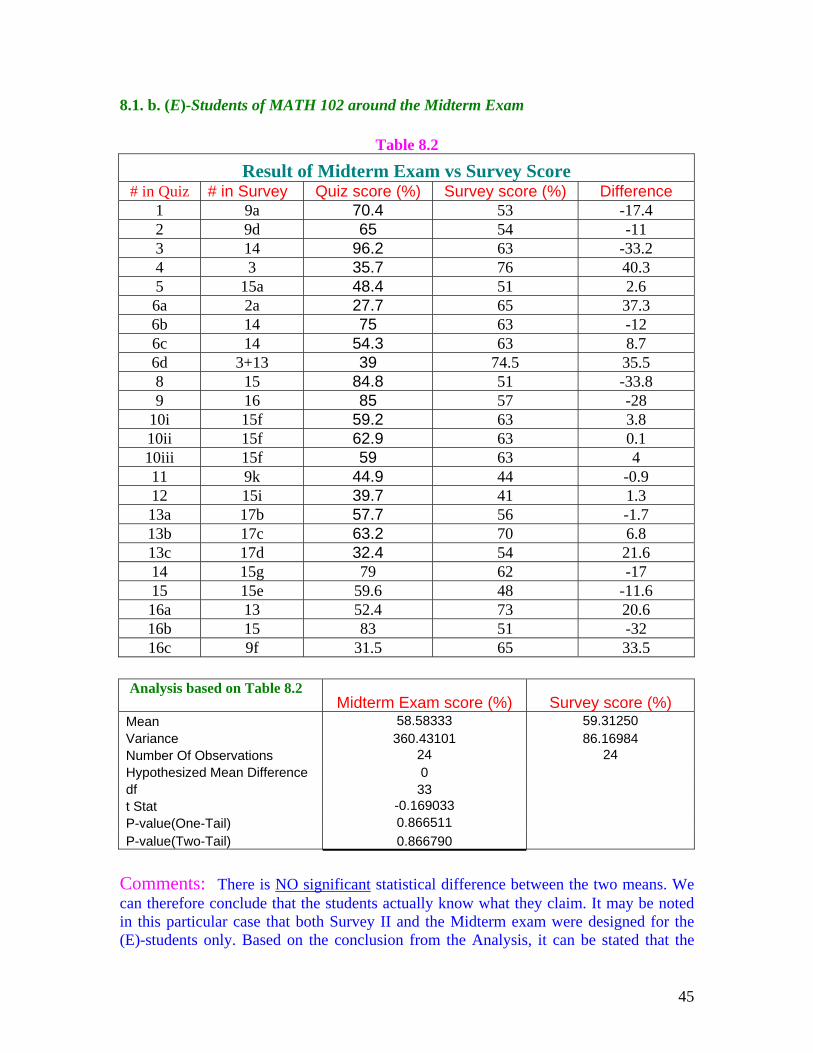
8.1. b. (E)-Students of MATH 102 around the Midterm Exam
Table 8.2
Result of Midterm Exam vs Survey Score # in Quiz # in Survey Quiz score (%) Survey score (%) Difference
1 9a 70.4 53 -17.4 2 9d 65 54 -11 3 14 96.2 63 -33.2 4 3 35.7 76 40.3 5 15a 48.4 51 2.6 6a 2a 27.7 65 37.3 6b 14 75 63 -12 6c 14 54.3 63 8.7 6d 3+13 39 74.5 35.5 8 15 84.8 51 -33.8 9 16 85 57 -28
10i 15f 59.2 63 3.8 10ii 15f 62.9 63 0.1 10iii 15f 59 63 4 11 9k 44.9 44 -0.9 12 15i 39.7 41 1.3 13a 17b 57.7 56 -1.7 13b 17c 63.2 70 6.8 13c 17d 32.4 54 21.6 14 15g 79 62 -17 15 15e 59.6 48 -11.6 16a 13 52.4 73 20.6 16b 15 83 51 -32 16c 9f 31.5 65 33.5
Analysis based on Table 8.2 Midterm Exam score (%) Survey score (%) Mean 58.58333 59.31250 Variance 360.43101 86.16984 Number Of Observations 24 24 Hypothesized Mean Difference 0 df 33 t Stat -0.169033 P-value(One-Tail) 0.866511 P-value(Two-Tail) 0.866790
Comments: There is NO significant statistical difference between the two means. We can therefore conclude that the students actually know what they claim. It may be noted in this particular case that both Survey II and the Midterm exam were designed for the (E)-students only. Based on the conclusion from the Analysis, it can be stated that the
46
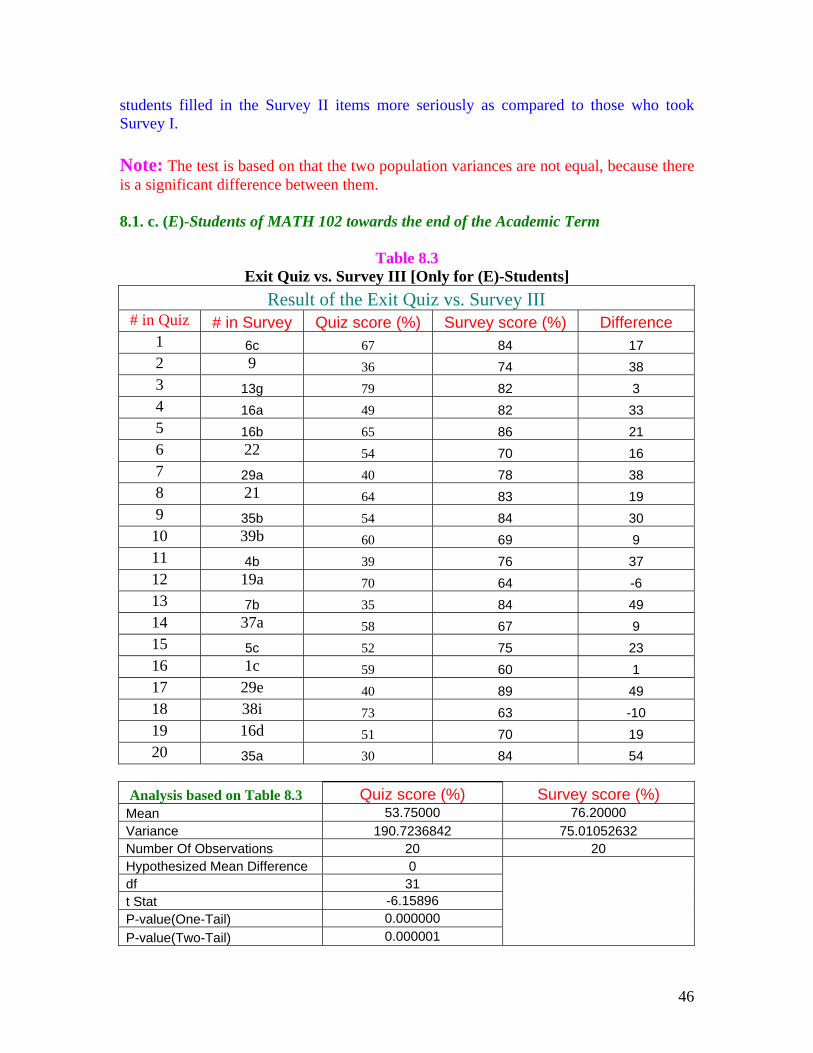
students filled in the Survey II items more seriously as compared to those who took Survey I. Note: The test is based on that the two population variances are not equal, because there is a significant difference between them. 8.1. c. (E)-Students of MATH 102 towards the end of the Academic Term
Table 8.3 Exit Quiz vs. Survey III [Only for (E)-Students]
Result of the Exit Quiz vs. Survey III # in Quiz # in Survey Quiz score (%) Survey score (%) Difference
1 6c 67 84 17 2 9 36 74 38 3 13g 79 82 3 4 16a 49 82 33 5 16b 65 86 21 6 22 54 70 16 7 29a 40 78 38 8 21 64 83 19 9 35b 54 84 30 10 39b 60 69 9 11 4b 39 76 37 12 19a 70 64 -6 13 7b 35 84 49 14 37a 58 67 9 15 5c 52 75 23 16 1c 59 60 1 17 29e 40 89 49 18 38i 73 63 -10 19 16d 51 70 19 20 35a 30 84 54
Analysis based on Table 8.3 Quiz score (%) Survey score (%) Mean 53.75000 76.20000 Variance 190.7236842 75.01052632 Number Of Observations 20 20 Hypothesized Mean Difference 0 df 31 t Stat -6.15896 P-value(One-Tail) 0.000000 P-value(Two-Tail) 0.000001
47
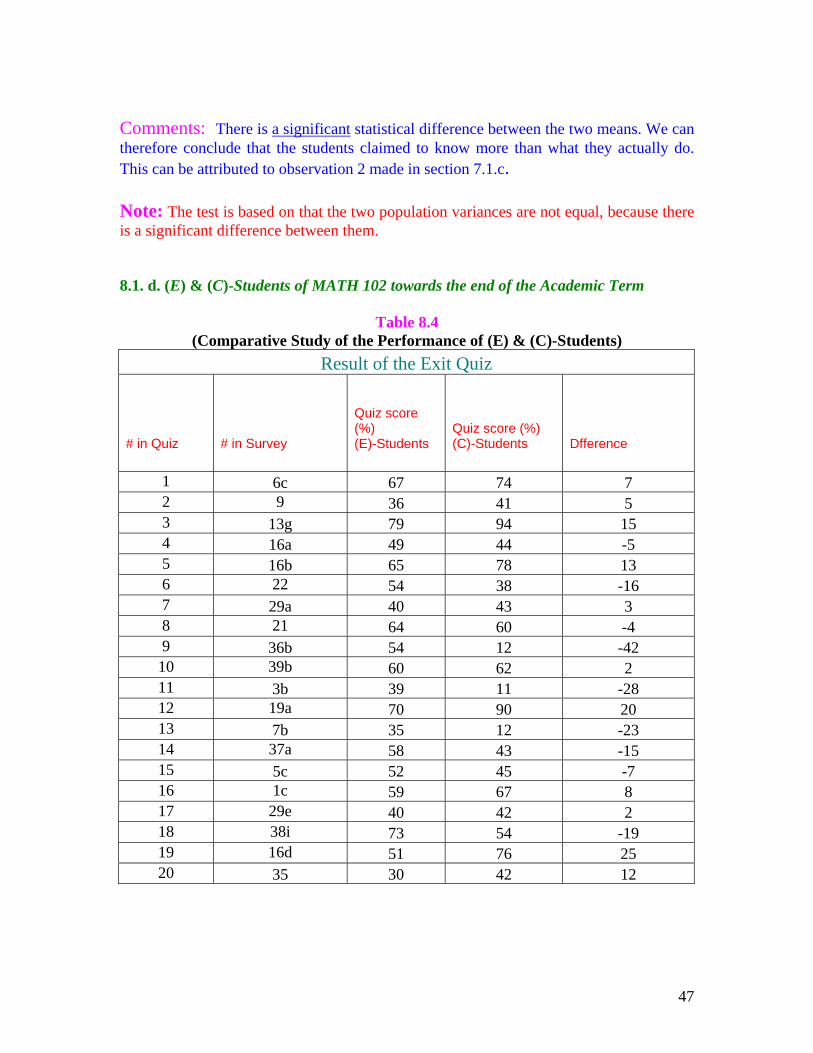
Comments: There is a significant statistical difference between the two means. We can therefore conclude that the students claimed to know more than what they actually do. This can be attributed to observation 2 made in section 7.1.c. Note: The test is based on that the two population variances are not equal, because there is a significant difference between them. 8.1. d. (E) & (C)-Students of MATH 102 towards the end of the Academic Term
Table 8.4 (Comparative Study of the Performance of (E) & (C)-Students)
Result of the Exit Quiz # in Quiz
# in Survey
Quiz score (%) (E)-Students
Quiz score (%) (C)-Students Dfference
1 6c 67 74 7 2 9 36 41 5 3 13g 79 94 15 4 16a 49 44 -5 5 16b 65 78 13 6 22 54 38 -16 7 29a 40 43 3 8 21 64 60 -4 9 36b 54 12 -42 10 39b 60 62 2 11 3b 39 11 -28 12 19a 70 90 20 13 7b 35 12 -23 14 37a 58 43 -15 15 5c 52 45 -7 16 1c 59 67 8 17 29e 40 42 2 18 38i 73 54 -19 19 16d 51 76 25 20 35 30 42 12
48
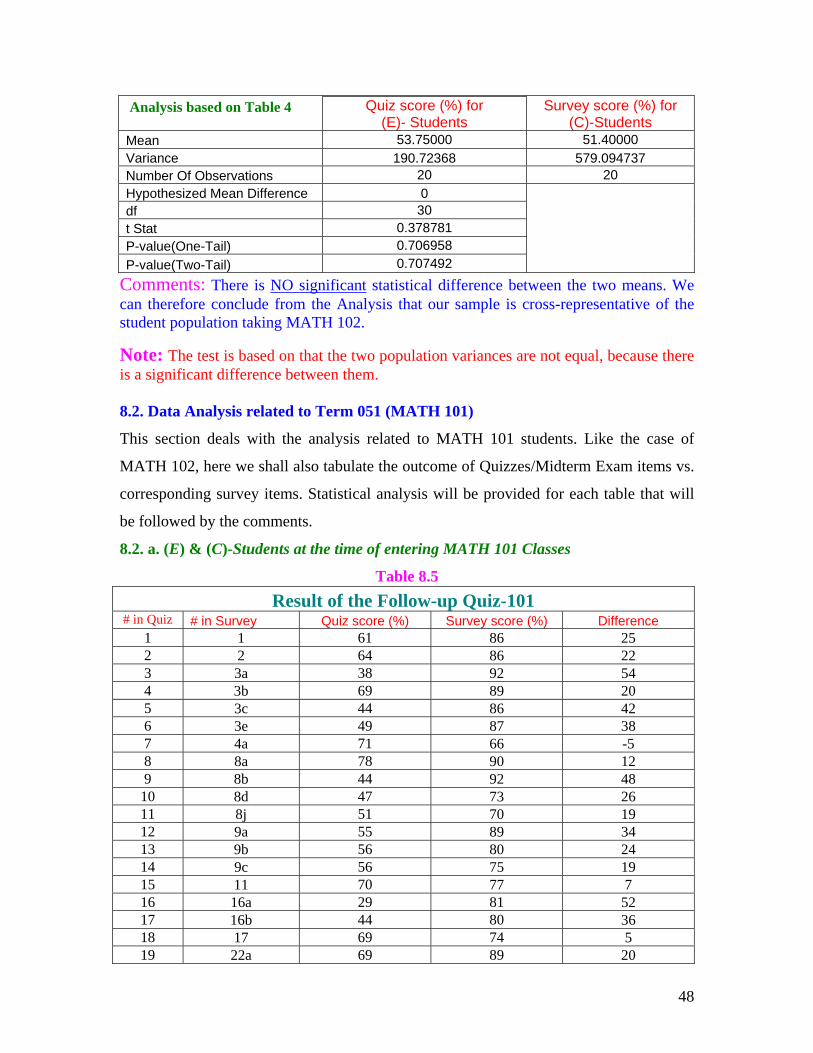
Analysis based on Table 4
Quiz score (%) for (E)- Students
Survey score (%) for (C)-Students
Mean 53.75000 51.40000 Variance 190.72368 579.094737 Number Of Observations 20 20 Hypothesized Mean Difference 0 df 30 t Stat 0.378781 P-value(One-Tail) 0.706958 P-value(Two-Tail) 0.707492
Comments: There is NO significant statistical difference between the two means. We can therefore conclude from the Analysis that our sample is cross-representative of the student population taking MATH 102.
Note: The test is based on that the two population variances are not equal, because there is a significant difference between them.
8.2. Data Analysis related to Term 051 (MATH 101)
This section deals with the analysis related to MATH 101 students. Like the case of
MATH 102, here we shall also tabulate the outcome of Quizzes/Midterm Exam items vs.
corresponding survey items. Statistical analysis will be provided for each table that will
be followed by the comments.
8.2. a. (E) & (C)-Students at the time of entering MATH 101 Classes
Table 8.5 Result of the Follow-up Quiz-101
# in Quiz # in Survey Quiz score (%) Survey score (%) Difference 1 1 61 86 25 2 2 64 86 22 3 3a 38 92 54 4 3b 69 89 20 5 3c 44 86 42 6 3e 49 87 38 7 4a 71 66 -5 8 8a 78 90 12 9 8b 44 92 48
10 8d 47 73 26 11 8j 51 70 19 12 9a 55 89 34 13 9b 56 80 24 14 9c 56 75 19 15 11 70 77 7 16 16a 29 81 52 17 16b 44 80 36 18 17 69 74 5 19 22a 69 89 20
49
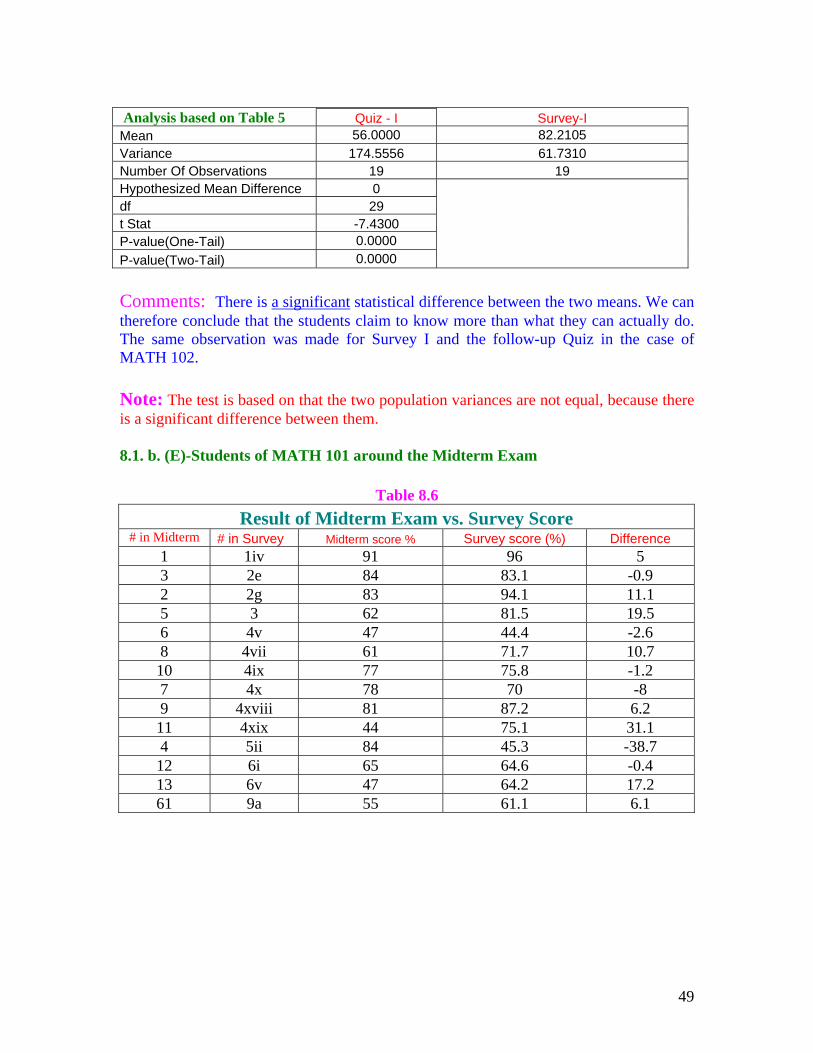
Comments: There is a significant statistical difference between the two means. We can therefore conclude that the students claim to know more than what they can actually do. The same observation was made for Survey I and the follow-up Quiz in the case of MATH 102. Note: The test is based on that the two population variances are not equal, because there is a significant difference between them. 8.1. b. (E)-Students of MATH 101 around the Midterm Exam
Table 8.6 Result of Midterm Exam vs. Survey Score
# in Midterm # in Survey Midterm score % Survey score (%) Difference 1 1iv 91 96 5 3 2e 84 83.1 -0.9 2 2g 83 94.1 11.1 5 3 62 81.5 19.5 6 4v 47 44.4 -2.6 8 4vii 61 71.7 10.7 10 4ix 77 75.8 -1.2 7 4x 78 70 -8 9 4xviii 81 87.2 6.2 11 4xix 44 75.1 31.1 4 5ii 84 45.3 -38.7 12 6i 65 64.6 -0.4 13 6v 47 64.2 17.2 61 9a 55 61.1 6.1
Analysis based on Table 5 Quiz - I Survey-I Mean 56.0000 82.2105 Variance 174.5556 61.7310 Number Of Observations 19 19 Hypothesized Mean Difference 0 df 29 t Stat -7.4300 P-value(One-Tail) 0.0000 P-value(Two-Tail) 0.0000
50
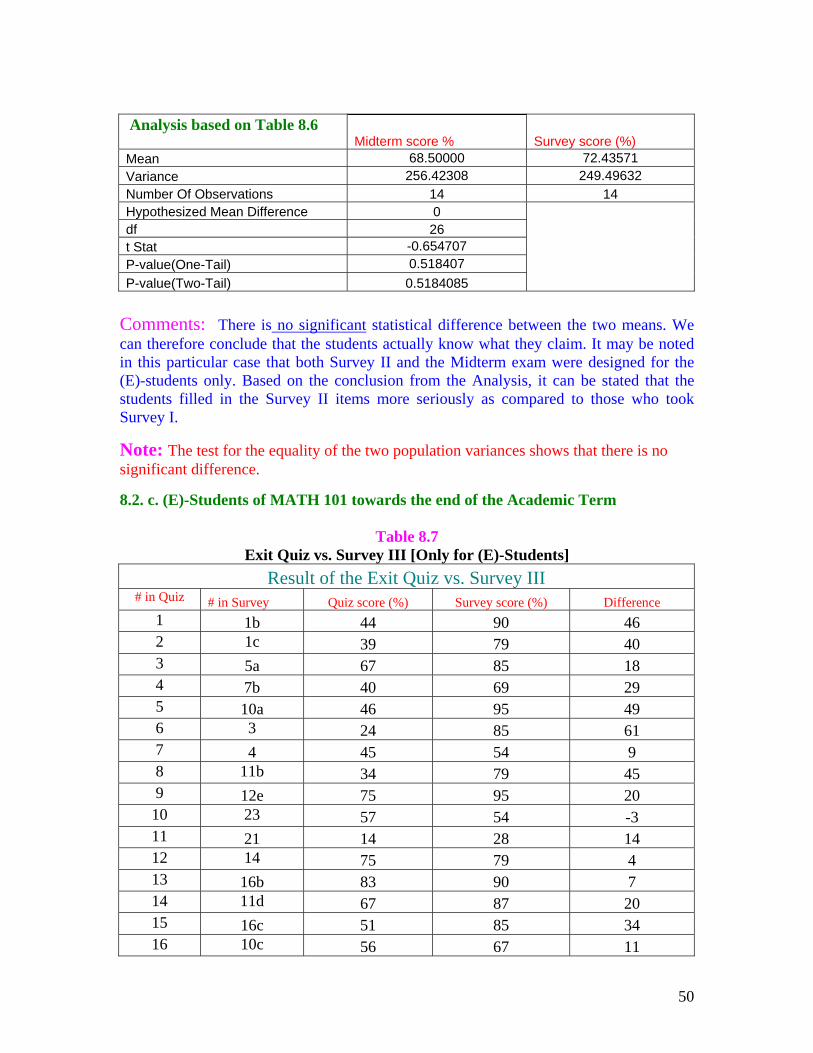
Analysis based on Table 8.6 Midterm score % Survey score (%) Mean 68.50000 72.43571 Variance 256.42308 249.49632 Number Of Observations 14 14 Hypothesized Mean Difference 0 df 26 t Stat -0.654707 P-value(One-Tail) 0.518407 P-value(Two-Tail) 0.5184085
Comments: There is no significant statistical difference between the two means. We can therefore conclude that the students actually know what they claim. It may be noted in this particular case that both Survey II and the Midterm exam were designed for the (E)-students only. Based on the conclusion from the Analysis, it can be stated that the students filled in the Survey II items more seriously as compared to those who took Survey I.
Note: The test for the equality of the two population variances shows that there is no significant difference. 8.2. c. (E)-Students of MATH 101 towards the end of the Academic Term
Table 8.7
Exit Quiz vs. Survey III [Only for (E)-Students] Result of the Exit Quiz vs. Survey III
# in Quiz # in Survey Quiz score (%) Survey score (%) Difference 1 1b 44 90 46 2 1c 39 79 40 3 5a 67 85 18 4 7b 40 69 29 5 10a 46 95 49 6 3 24 85 61 7 4 45 54 9 8 11b 34 79 45 9 12e 75 95 20 10 23 57 54 -3 11 21 14 28 14 12 14 75 79 4 13 16b 83 90 7 14 11d 67 87 20 15 16c 51 85 34 16 10c 56 67 11
51
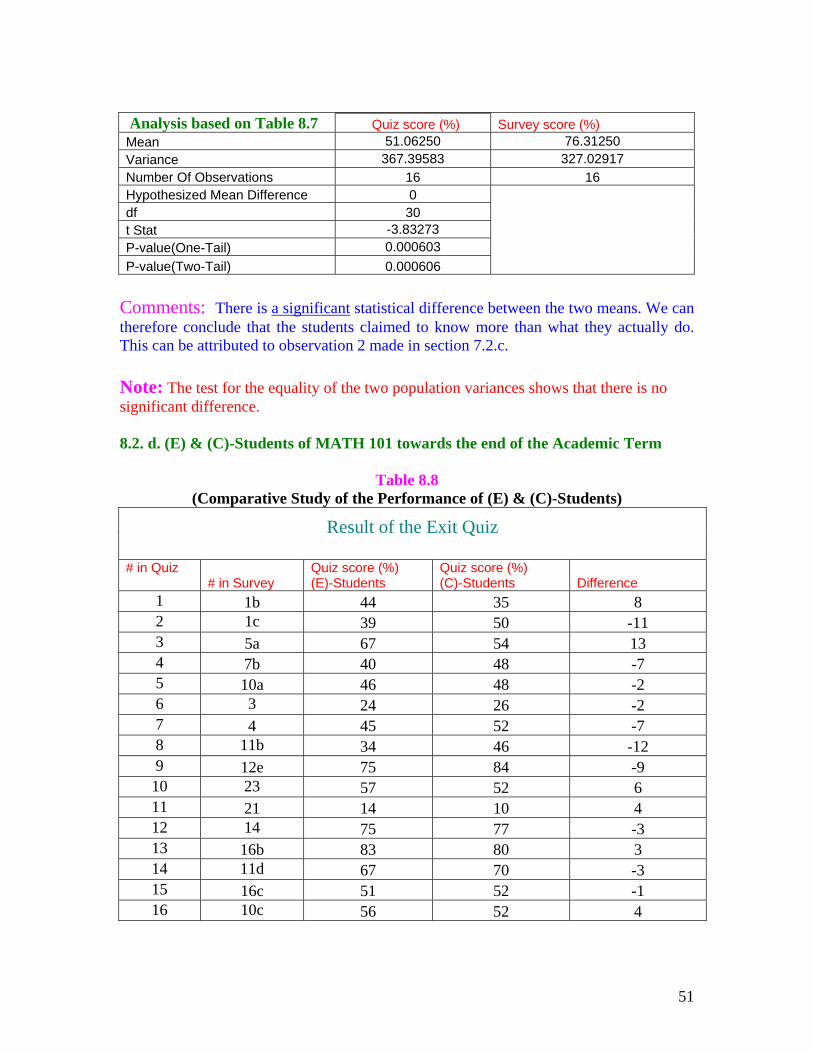
Analysis based on Table 8.7 Quiz score (%) Survey score (%) Mean 51.06250 76.31250 Variance 367.39583 327.02917 Number Of Observations 16 16 Hypothesized Mean Difference 0 df 30 t Stat -3.83273 P-value(One-Tail) 0.000603 P-value(Two-Tail) 0.000606
Comments: There is a significant statistical difference between the two means. We can therefore conclude that the students claimed to know more than what they actually do. This can be attributed to observation 2 made in section 7.2.c. Note: The test for the equality of the two population variances shows that there is no significant difference.
8.2. d. (E) & (C)-Students of MATH 101 towards the end of the Academic Term
Table 8.8
(Comparative Study of the Performance of (E) & (C)-Students)
Result of the Exit Quiz # in Quiz
# in Survey Quiz score (%) (E)-Students
Quiz score (%) (C)-Students Difference
1 1b 44 35 8 2 1c 39 50 -11 3 5a 67 54 13 4 7b 40 48 -7 5 10a 46 48 -2 6 3 24 26 -2 7 4 45 52 -7 8 11b 34 46 -12 9 12e 75 84 -9 10 23 57 52 6 11 21 14 10 4 12 14 75 77 -3 13 16b 83 80 3 14 11d 67 70 -3 15 16c 51 52 -1 16 10c 56 52 4
52
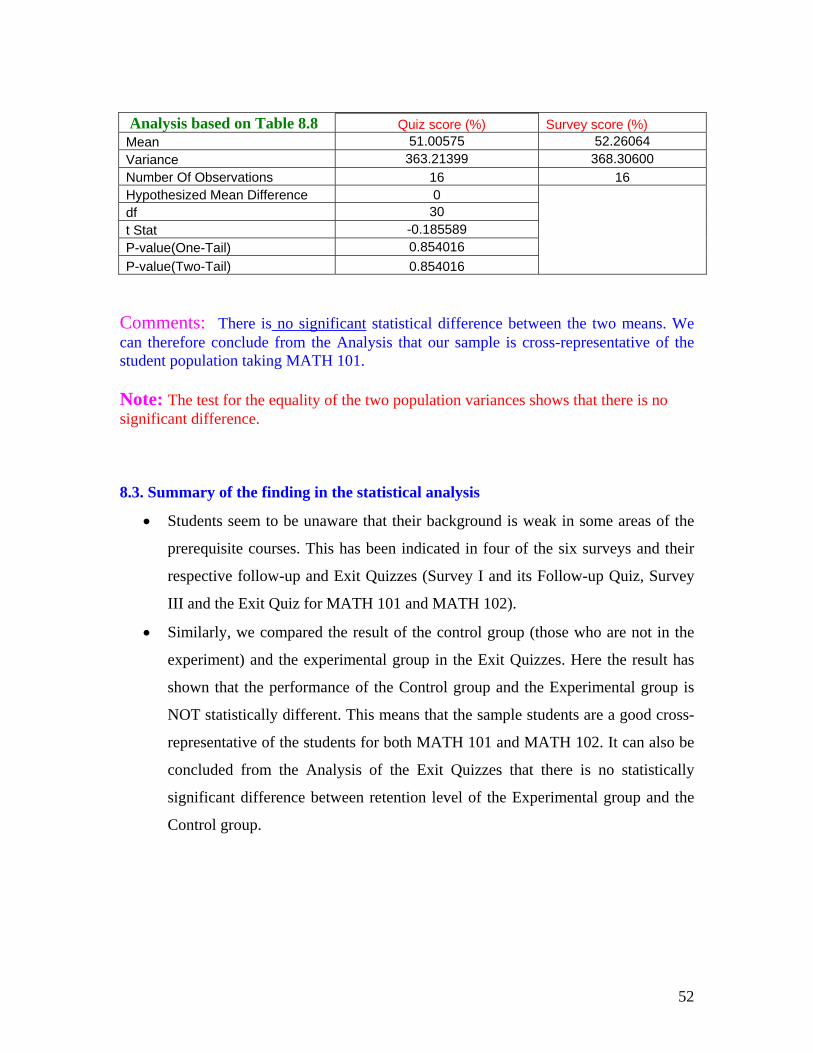
Analysis based on Table 8.8 Quiz score (%) Survey score (%) Mean 51.00575 52.26064 Variance 363.21399 368.30600 Number Of Observations 16 16 Hypothesized Mean Difference 0 df 30 t Stat -0.185589 P-value(One-Tail) 0.854016 P-value(Two-Tail) 0.854016
Comments: There is no significant statistical difference between the two means. We can therefore conclude from the Analysis that our sample is cross-representative of the student population taking MATH 101. Note: The test for the equality of the two population variances shows that there is no significant difference.
8.3. Summary of the finding in the statistical analysis
• Students seem to be unaware that their background is weak in some areas of the
prerequisite courses. This has been indicated in four of the six surveys and their
respective follow-up and Exit Quizzes (Survey I and its Follow-up Quiz, Survey
III and the Exit Quiz for MATH 101 and MATH 102).
• Similarly, we compared the result of the control group (those who are not in the
experiment) and the experimental group in the Exit Quizzes. Here the result has
shown that the performance of the Control group and the Experimental group is
NOT statistically different. This means that the sample students are a good cross-
representative of the students for both MATH 101 and MATH 102. It can also be
concluded from the Analysis of the Exit Quizzes that there is no statistically
significant difference between retention level of the Experimental group and the
Control group.
53
9. Recommendations
We feel responsible for what we bring in as an outcome of our experiment here. The
recommendations we are making in the context of PCC courses may be found unusual.
To us, the students entering in the PCC courses are not too bad; however, the current
status of the PCC is not up to the level of our satisfaction. In order to clarify the situation,
we stress that the students we are letting in KFUPM are not imprudent in general. Their
level of understanding in the Calculus Courses is not as bad as it appears on the surveys
and quizzes given in this experiment-based project. At the same time, the Department of
Mathematical Sciences at KFUPM has got an excellent contingent of faculty that is
capable of taking any teaching assignment whether based on conventional or innovative
methodology. Here, among the students entering KFUPM, we have to make a distinction
between students that are weak in terms of understanding and those in terms of having
problems while studying in the new environment. In our opinion, the latter class of
students is quite wide and faces problems of a diversified nature which vary from being
away from their homes to study related matters that include:
• study habits,
• classroom environment,
• learning process,
• time management,
• process of continuous evaluation.
This is absolutely an exclusive area where the University administration is already taking
measures for its improvement. On the other hand, regardless of the nature of the students’
deficiencies, if we, the custodians of the academic set-ups, do not rectify the basic
conceptual drawbacks of the students and are unable to give them a lead for good study
habits besides other points, the purpose of the entire PCC courses that act like a vertebral
column for various disciplines of engineering, computer and physical sciences will be
ditched. Below we provide our vision on the subject matter which is based mostly on the
current experiment and partly on our past experience.
54
9.1. Pre-Calculus Courses (Prep-Year Level)
Based on the data collected from Survey I and the Follow-up Quiz (Both in Phase I and
Phase II), we note that
1. The students at the time of entering the course Calculus I (MATH 101) carry
several deficiencies which are related to Pre-Calculus material, though covered
thoroughly at the prep-level at KFUPM. We have further noted during the course
of experiment that most of the observed deficiencies remain with the students
even up to the time of entering the Calculus II classes (See Sec. 6.3 & Table 6.2
for Consistent Deficiencies). In the presence of such weaknesses, we cannot
expect the students to perform well in the Calculus Courses.
Recommendation I: The KFUPM Prep-Year Math Program may be suggested to
look into the data provided in Table 6.1 and relevant parts of Tables 6.2 and 6.3.
In case the concerned body undertakes this exercise, they should also be
requested to review the level of items selected for Survey I (MATH 101) and in the
relevant Follow-up Quiz and bring these points to the attention of instructors.
2. In general, several students at the Prep-Year pay a little attention towards an
appropriate understanding of basic concepts. This is clearly evident from the low
average on the Follow-up Quiz (MATH 101). Keeping in view the level of the
Quiz-questions which were mostly based on elementary as well as mono
concepts, we expect that the students entering the Calculus I course must attain an
average of 75-80% on this type of quizzes. Otherwise, they will face consistent
adversity in their calculus classes. It may be noted that a large number of students
suffer from the language problem at the time of entering the Prep-Year Math
Program although they have taken a similar material on Algebra and
Trigonometry though in Arabic during their high school studies. In our opinion,
we should not let the students waste what they learnt earlier. Therefore, an
instructional strategy should be devised that may help the students use their high
school knowledge in the Prep-Year Math courses.
55
Recommendation II: There is a need to review the teaching methodologies
adopted in the Prep-Year. It is suggested that maintaining English as the
language of instruction, Arabic translation of terminologies be introduced during
the course of teaching MATH 001. Then the students should be invited to recall
the concept on the basis of Arabic terminology. These practices will not only help
the students utilize their high school knowledge but also rectify their
misconceptions, if any, which they carry on from their high school studies.
Secondly, keeping in view the nature of deficiencies of the students, it is not
necessary to follow the stream of material provided in the standard texts on
Algebra & Trigonometry. In our opinion, the students should be raised from the
level they enter the Prep-Year Math Program. It is suggested that the coverage of
MATH 001 material should be subdivided into four-five levels that involve
frequent visits of basic concepts already introduced in the course. As a specimen,
we present a design of course coverage for MATH 001 which may be considered
for implementation (with appropriate modification if necessary):
Level 1: (New terminology should be described with its Arabic Equivalence in the class)
Even & odd integers, Rational numbers, Laws of exponents (with examples
involving integer exponents only), Simple linear and quadratic equations,
Quadratic formula, Linear inequalities and their graphs, Multiplication and long
division of algebraic expressions, Function (Domain, Range), Graphs of f(x) = x
and f(x) = x2, ( ) f x x= and their behavior in (0,1) and outside (0,1), Graph of
f(x) = | x |, Geometrical shapes with related terminologies and formulas (Area,
perimeter, angles): Circle, different forms of triangle and quadrilateral, regular
pentagon, trapezium, Rectangular coordinate system, Equation of line (slope,
intercepts), Geometrical meaning of slope when it is between 0 and 1, greater than
1, between –1 and 0, less than –1.
Level 2: (New terminology should be described with its Arabic Equivalence in the class)
Prime and composite numbers, Irrational numbers, Real numbers system,
Complex numbers, Sets with examples based on number system, intervals,
56
Quadratic and cubic polynomials, Difference between polynomial expression and
equation, Synthetic division and its application in finding second factor when one
linear factor is known, Simple factorization by pairing, Algebraic formulas,
Rationalization of numbers, Completion of squares and its use in factorization,
Vertical & horizontal shifts and reflection of graphs related to f(x) = x, f(x) = x2
and f(x) = | x |, Relation obtained from the geometrical figures (Word problems
based on geometrical figures), Volume and surface area of standard geometrical
figures: Cuboids, Cylinders, Spheres, Cones.
Level 3: (New terminology should be described with its Arabic Equivalence in the class)
Laws of exponents (with examples involving rational exponents); Square root and
radicands, Operations on sets (Union, intersection, difference), Rationalization of
algebraic expressions, Quadratic inequalities and their solutions in set or interval
form, polynomial equations and inequalities with absolute value, Slope of line,
Parallel and perpendicular lines, Comparative study of the graphs of
( ) and ( ) , 2,3,4.nnf x x f x x n= = = Symmetries of function (about y-axis and
origin), Domain, range and graphs of 1( ) , 1, 2,3,4.nf x nx
= = Operations on
functions with the help of known examples, Composition of functions. Rational
zeros theorem for polynomials, Simple rational functions, Behavior of a
polynomial at infinity, Horizontal asymptotes.
Level 4: (New terminology should be described with its Arabic Equivalence in the class)
Word problems based on linear and quadratic equations, Sketching graphs of the
form ( ) ( )nf x x a b= ± + + ; ( ) ;nf x x a b= ± + + ( ) ( ) ,nf x x a b−= ± + +
2,3,4,5n = , by using horizontal/vertical shifts and/or reflections. Equation of
circle (shift of centre), Symmetries of graph of an equation (about x, y-axes and
origin) with simple examples, Algebra of complex numbers, Discriminant of
quadratic equation and its properties, Complex roots theorem, Fundamental
theorem of Algebra, Sketching graphs of simple rational functions (with linear
denominator, Vertical Asymptotes.

57
Level 5: (New terminology should be described with its Arabic Equivalence in the class)
Evaluation of difference-quotient for various functions, Variation, Simple
mathematical models (constructing functions), Oblique, quadratic and cubic
asymptotes, Rational functions and their graphs using all features learnt in the
course.
3. The texts on Algebra & Trigonometry accompanied with test banks in which the
test items assure the students understanding of course concepts. The level of
difficulty is also narrated beside each of the test items. The structure of questions
given in the test bank usually backs up the Calculus material and is not
unnecessarily twisted in nature. The students doing well on the tests based on
such items or alike do not possess any deficiency as we have observed in the
outcomes of follow-up quiz given to MATH 101 or MATH 102 students in our
experiment.
Recommendation III: It may be appropriate to devise an evaluation policy that
may ensure students’ comprehension level of basic concepts. We suggest that the
style of the exam-questions provided in the Test Bank accompanying the textbook
should be followed, and to keep the standard high, the passing marks should be
fixed at around 75%.
9.2. Calculus Courses
Based on the data collected from Survey III and the Exit Quiz (in Phases I & II) we note
that students’ retention level of basic Calculus concepts is not up to the desired level.
Although most of the students are found attentive during the Calculus lectures, they keep
on forgetting what they learn in the classroom environment. To us, this aspect is mostly
related to the students’ study habits as well as their deficiency on the Pre-Calculus
material which, in some cases, leads to consistent deficiency. The latter part of the
problem has already been addressed in the foregoing paragraphs. As far as the first point
is concerned, a collaborative effort is needed from both the teacher and the taught. Here,
we highlight some points that may enable the students to have a sound grip on the basic
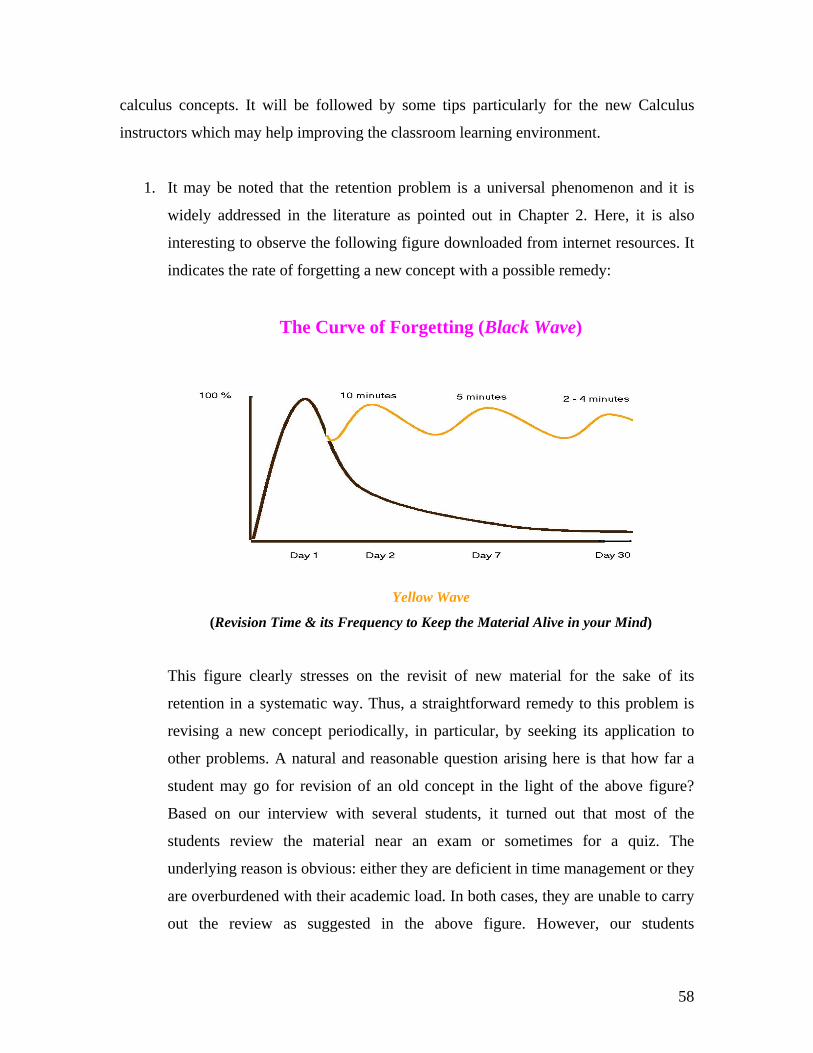
58
calculus concepts. It will be followed by some tips particularly for the new Calculus
instructors which may help improving the classroom learning environment.
1. It may be noted that the retention problem is a universal phenomenon and it is
widely addressed in the literature as pointed out in Chapter 2. Here, it is also
interesting to observe the following figure downloaded from internet resources. It
indicates the rate of forgetting a new concept with a possible remedy:
The Curve of Forgetting (Black Wave)
Yellow Wave
(Revision Time & its Frequency to Keep the Material Alive in your Mind)
This figure clearly stresses on the revisit of new material for the sake of its
retention in a systematic way. Thus, a straightforward remedy to this problem is
revising a new concept periodically, in particular, by seeking its application to
other problems. A natural and reasonable question arising here is that how far a
student may go for revision of an old concept in the light of the above figure?
Based on our interview with several students, it turned out that most of the
students review the material near an exam or sometimes for a quiz. The
underlying reason is obvious: either they are deficient in time management or they
are overburdened with their academic load. In both cases, they are unable to carry
out the review as suggested in the above figure. However, our students
59
appreciated the strategy of mixing the problems related to past and current
exercises for the weekly homework.
Recommendation IV: To cope with this situation, the prep-year material where
the students are found deficient should be made available to the students on the
WebCT or instructor’s homepage. Besides, the instructors may pay additional
attention while designing a Calculus course for classroom presentation. In this
regard,
• Some examples, which involve a couple of concepts covered in the past
lectures, should be picked up periodically in the classroom.
• 1-2 problems based on some of the past concepts should be exclusively
designed for a weekly homework (see Appendix 3(ix) where homework
includes some exercises based on past material for the sake of review).
• A short question concerning one of the past concepts may be included in a
classroom Quiz. However, the students may be asked to review the
relevant concepts at hand. The practice will remind the students about the
importance of going over the past concepts off and on.
2. An appropriate design of quizzes and exams forces the students to pay enough
attention on the basic concepts.
Recommendation V: A part of the quiz and exam should be based on mono
concept questions. We have experienced a positive impact on the retention level of
students where this strategy is applied.
3. The students should be indicated clearly what they have to understand and which
concept they have to revise to the extent that it should be retained in their mind.
Most of the time the students memorize a formula but they are unable to apply it
appropriately.
60
Recommendation VI: It may be appropriate to post on the WebCT or hand over
to the students a list of closely related formulas or specific techniques required in
the course related exercises. Each formula should be appended with a couple of
exercises (as an example see Appendix 3(v-vi): the list of integration techniques;
basic geometrical formulas related to application of integrals.)
4. Reorganization of course topics in contrast to the flow of the text material
sometimes helps the students to retain difficult concepts. In particular, if the
material having little connection with the preceding course concepts appears at
the end of the course, most of the students are unable to digest it. According to
our observation, most of the students felt overburdened at the end of the term and
therefore, could not pay attention to new concepts at that time. One such example
that we encountered in MATH 102 is related to the entire chapter of “Sequences
and Series”. This portion is usually covered during the last five weeks of the term.
Here, the final part which provides the crux of the entire topic “Approximation of
Integrals by Power Series Representation” is covered around the second last
lecture of the course. Therefore, a vast majority of the students are unable to
digest this concept. In our opinion, only a few students retain these concepts after
the completion of this course.
Recommendation VII: To cope with this situation, we strongly suggest
reordering some sections or even a chapter of the course according to its nature.
This practice may let the students have a thorough review of such topics during
the term. Sometimes the reshuffling requires certain uncovered concepts of the
course material. However, an instructor can easily find a way to bridge the gap.
(See reshuffling of contents in the Syllabus of MATH 102 in Appendix 3(vii).
Here, the entire topic of sequences & series is introduced in the second quarter of
the course. This change requires only a couple of concepts like elementary
treatment of improper integrals of the first kind and the integration by parts
which can be easily introduced to the students at hand. In our view, this change
helps the students to grasp this material which they find very much confusing
61
when offered at the end of the term. The left over course material after covering
this particular chapter is found relatively easier for the students).
5. Introducing Word Problem in the Calculus courses is another major task for the
instructors. Mathematics in general and Calculus in particular turns out not only
meaningless but also boring for the engineering, computer and business students
if they do not find applications of the subject in their disciplines. However, this
activity consumes a lot of class time if the material is not prepared in a
“presentable form”.
Recommendation VIII: The students should be referred to the guidelines given
in the text sections for solving the word problems. Alternatively, one-sheet
instructions on the subject matter (in simple English) may be posted on the
WebCT or the instructor’s homepage. Writing the statement of word problems on
the board should be avoided. Instead, overhead projectors or power point
presentation should be used for this purpose. Use of tables to complete the
required steps is found useful in this context. (See Appendix 3(viii) for introducing
the “Applications of Maxima/Minima” in MATH 101)
6. The weekly recitation classes meant for problem-solving in Calculus I & II
(MATH 101 and MATH 102) do help the students in increasing their
understanding of the subject and retention level if organized properly. The
students may benefit a lot from these classes when given an opportunity to solve
problems in a supervised environment.
Recommendation IX: The problem solving classes (Weekly Recitation Class)
should be designed in such a way that reflects maximum amount of students’
participation. In these classes we may:
• generate a group activity which is based on solving pre-assigned
problems,
• ask students to explain solutions on the board,
62
• introduce challenging problems,
• discuss the common mistakes/problems faced by the students,
• introduce and maintain use of technology, e.g., software like Mathematica,
• introduce any other activity which may help the students in increasing
their understanding as well as retention level.
If these classes are being conducted by a faculty/graduate assistant other than the
course instructor, a weekly interaction between the two is highly recommended.
(See Appendix 3(iii) regarding the design of Problem Session Classes carried out
during the period of experiment. Students found the designed activity helpful for
their understanding).
7. Evaluation & Exam Analysis are significant tools to assess the retention level of
students. However, designing an exam with this objective requires a lot of effort
on the part of a course instructor. In particular, a careful selection of test items is
required in order to measure the students’ retention level on the essential course
concepts. The current research on appropriately designing a Calculus exam
suggests that a student regularly attending his classes should be able to solve at
least 50% of the exam items correctly. A part of such exam items are in fact
referred to as mono concepts related to the course. An itemized analysis of such
exams provides an insight to an instructor regarding his students’ understanding
of course concepts.
Recommendation X: Here we recommend that an instructor should be clear
about what he intends to measure from an exam item in the PCC courses. The
exam items should be spread uniformly over the course material. Moreover, the
exams should be designed to check what the students know about the course and
not what they don’t. As indicated above, after grading an exam, its item analysis
should be given due attention as it provides a way to judge the students’
understanding of specific concepts and paves a way for the instructor to improve
his teaching abilities.
63
8. With the passage of time, technology (computers, overhead projectors, WebCT,
internet resources etc.) is becoming an integral part of teaching. In our opinion, an
advantage of this facility should be taken as far as its utilization improves the
students’ comprehension of course material. However, it is important to note that
no component of technology can substitute the role of an instructor, at least in the
Calculus courses.
Recommendation XI: There are various ways to make positive use of technology
in and outside the classroom. However, we suggest that the off and on use of an
overhead projector and power point should be considered by the instructors in
PCC courses. Some of the advantages in this regard are already mentioned
above. Also, the use of WebCT or other equivalent tools should be made
compulsory in order to interact with the students outside the classrooms. The
software like “Mathematica or MATLAB” is a good tool to introduce certain
tedious concepts related to the course material and its use motivates the students
for further exploration of related ideas outside the text. However, it is should not
be done at the expense of regular class timings. An instructor may arrange a part
of recitation class or a help session for this purpose. We recommend that such
activity should be left at the discretion of the course instructor unless the
department formulates a unified policy in this regard.
64
References
1. Anderson, R. D. & Loftsgaarden, D. O. (1987). A special calculus survey:
Preliminary report. In L. A. Steen (Ed.), Calculus for a new century (pp. 215-
216). Washington, DC: The Mathematical Association of America.
2. Beckmann, C. E. (1988). Effect of computer graphics use on student
understanding of calculus concepts. (Doctoral dissertation, Western Michigan
University, 1988). Dissertation Abstracts International, 50, 1974B.
3. Crocker, D. A. (1991). A qualitative study of interactions, concept development
and problem-solving in a calculus class immersed in the computer algebra system
Mathematica. (Doctoral dissertation, Ohio State University, 1991). Dissertation
Abstracts International, 52, 2850A.
4. Douglas, R. G. (1985a). The importance of calculus in core mathematics. In R. G.
Douglas (Ed.), Toward a lean and lively calculus (pp. 3-5).
5. Garner, B., & Garner, L. (2001). Retention of concepts and skills in traditional
and reformed applied calculus. Mathematics Education Research Journal, 13, 165-
184.
6. Hamm, D. M. (1989). The association between computer-oriented and
noncomputer-oriented mathematics instruction, student achievement, and attitude
towards mathematics in introductory calculus. (Doctoral dissertation, University
of North Texas, 1989). Dissertation Abstracts International, 50, 2817A.
7. Hawker, C. M. (1986). The effects of replacing some manual skills with computer
algebra manipulations on student performance in business calculus. (Doctoral
dissertation, Illinois State University, 1986). Dissertation Abstracts International,
47, 2934A.
8. Heid, M. K. (1984). An exploratory study to examine the effects of resequencing
skills and concepts in an applied calculus curriculum through the use of the
microcomputer. (Doctoral dissertation, University of Maryland, 1984).
Dissertation Abstracts International, 46, 1548A.
9. Janvier, C. (Ed.), (1987). Problems of representation in the teaching and learning
of mathematics Hillsdale, New Jersey: Lawrence Erlbaum Associates, Inc.
65
10. Jeanetta du Preez, Ansie Harding, Johann Engelbrecht, Long-term effect of a
technique mastering programme in first year Calculus.
11. Judson, P. T. (1988). Effects of modified sequencing of skills and applications in
introductory calculus. (Doctoral dissertation, The University of Texas at Austin,
1988). Dissertation Abstracts International, 49 1397A.
12. Kwon, Oh Nam, Allen, Karen, Rasmussen, Chris, (2005) Students' Retention of
Mathematical Knowledge and Skills in Differential Equations, School Science
and Mathematics, May 2005.
13. Park, K. & Travers, K. J. (1996). A comparative study of a computer-based and a
standard college first-year calculus course. CBMS Issues in Mathematics
Education, 6, 155-176.
14. Porzio, D. T. (1994). The effects of differing technological approaches to calculus
on students' use and understanding of multiple representations when solving
problems. (Doctoral dissertation, Ohio State University, 1994).
15. (B) Schoenfeld, A. H. (Chair), (1986). Notes on teaching calculus: Report of the
methods workshop. In R. G. Douglas (Ed.), Toward a lean and lively calculus
(pp. xv-xxi). Washington, DC: The Mathematical Association of America.
16. Schoenfeld, A (Ed.), (1997), Assessment in Calculus. Mathematical Association
of America
17. Small, D. B. & Hosack, J. M. (1986). Computer algebra system, tools for
reforming calculus instruction. In R. G. Douglas (Ed.), Toward a lean and lively
calculus (pp. 143-155). Washington, DC: The Mathematical Association of
America.
18. Some Presentation Summaries at Orlando Meeting (1996):
a. J. L. Beery, R. Cornez, A. Koonce, A. Killpatrick, M. Scherer, “Planning
and implementation of reform curricula: What worked and what we’re still
working”.
b. A. J. Salem, “A mathematics technology classroom: Evolution of a
calculus reform implementation”.
c. V. Kilibarda, “Students’retention in the light of calculus reform”.
66
d. S. L. Ganter, “A comparison of teaching methodologies: The need in
calculus reform”.
19. Some Abstracts from the MAA:
a. S. Ganter, Changing Calculus: A report on evaluation efforts and national
impact from 1988-1998, ISBN 0-88385-167-9 (2001).
b. M. Cohen, E. Gaughan, A. Knoebel, D. Kurz, D. Pengelly, Student
research projects in Calculus, ISBN 0-88385-503-8 (1992)
c. A. W. Roberts, Calculus: The dynamics of change, ISBN 0-88385-098-2
(1995)
d. W. E. Haver, Calculus: catalyzing a national community for reform, ISBN
0-88385-461-9 (1998)
e. A. Schoenfeld, Student assessment in Calculus, ISBN 0-88385-152-0
(1997).
67
11. Appendices
Appendix - I
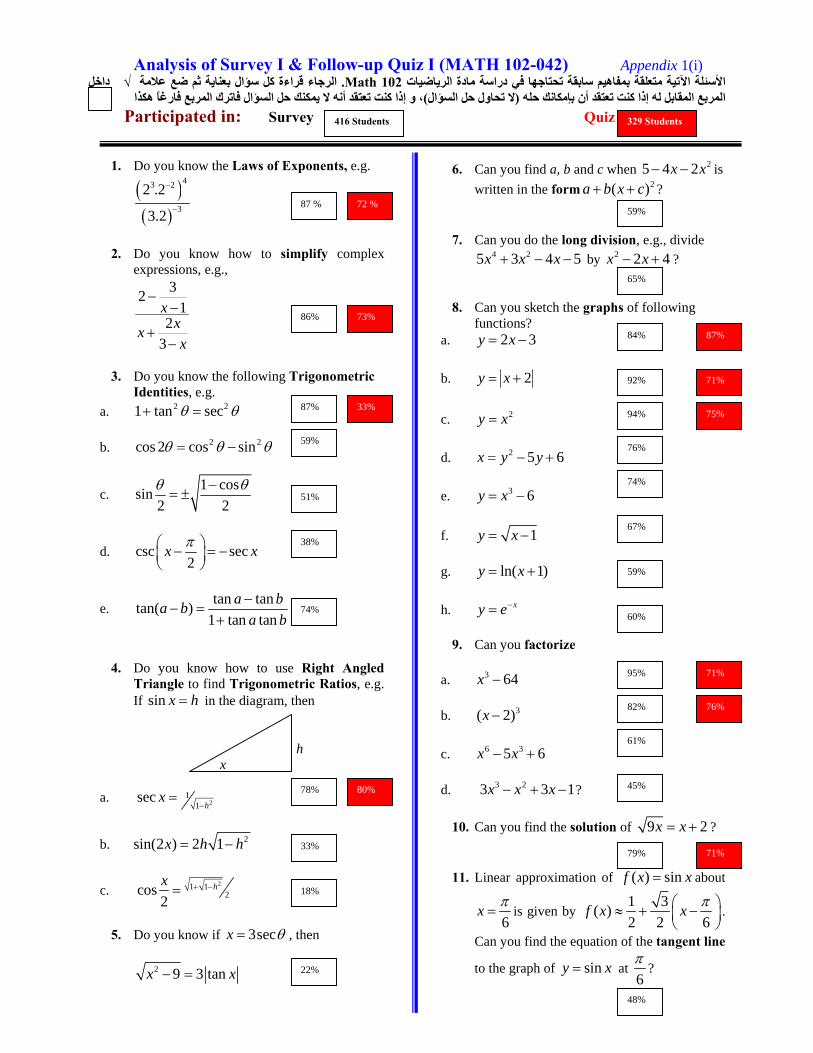
Analysis of Survey I & Follow-up Quiz I (MATH 102-042) Appendix 1(i) داخل √الرجاء قراءة آل سؤال بعناية ثم ضع علامة . Math 102الأسئلة الآتية متعلقة بمفاهيم سابقة تحتاجها في دراسة مادة الرياضيات
، و إذا آنت تعتقد أنه لا يمكنك حل السؤال فاترك المربع فارغاً هكذا )لا تحاول حل السؤال(المربع المقابل له إذا آنت تعتقد أن بإمكانك حله Participated in: Survey Quiz 1. Do you know the Laws of Exponents, e.g.
( )( )
43 2
3
2 .2
3.2
−
−
2. Do you know how to simplify complex
expressions, e.g., 32
12
3
xxxx
−−
+−
3. Do you know the following Trigonometric
Identities, e.g. a. 2 21 tan sec+ =θ θ
b. 2 2cos 2 cos sin= −θ θ θ
c. 1 cossin
2 2−
= ±θ θ
d. csc sec2
x x⎛ ⎞− = −⎜ ⎟⎝ ⎠
π
e. tan tantan( )
1 tan tana ba b
a b−
− =+
4. Do you know how to use Right Angled
Triangle to find Trigonometric Ratios, e.g. If sin x h= in the diagram, then
h x a. 2
11
sech
x−
=
b. 2sin(2 ) 2 1x h h= −
c. 21 12cos
2hx + −=
5. Do you know if 3secx θ= , then
2 9 3 tanx x− =
6. Can you find a, b and c when 25 4 2x x− − is
written in the form 2( )a b x c+ + ?
7. Can you do the long division, e.g., divide 4 25 3 4 5x x x+ − − by 2 2 4x x− + ?
8. Can you sketch the graphs of following functions?
a. 2 3y x= −
b. 2y x= +
c. 2y x=
d. 2 5 6x y y= − +
e. 3 6y x= −
f. 1y x= −
g. ln( 1)y x= +
h. xy e−=
9. Can you factorize
a. 3 64x −
b. 3( 2)x −
c. 6 35 6x x− +
d. 3 23 3 1x x x− + − ?
10. Can you find the solution of 9 2x x= + ?
11. Linear approximation of ( ) sinf x x= about
6x π= is given by
1 3( )2 2 6
f x x π⎛ ⎞≈ + −⎜ ⎟⎝ ⎠
.
Can you find the equation of the tangent line
to the graph of siny x= at 6π
?
87 %
86%
87%
59%
51%
38%
74%
78%
33%
18%
22%
59%
65%
87%
71%
75%
74%
67%
59%
60%
71%
82%
61%
45%
71%
48%
73%
33%
80%
72 %
416 Students 329 Students
84%
92%
94%
76%
95%
76%
79%
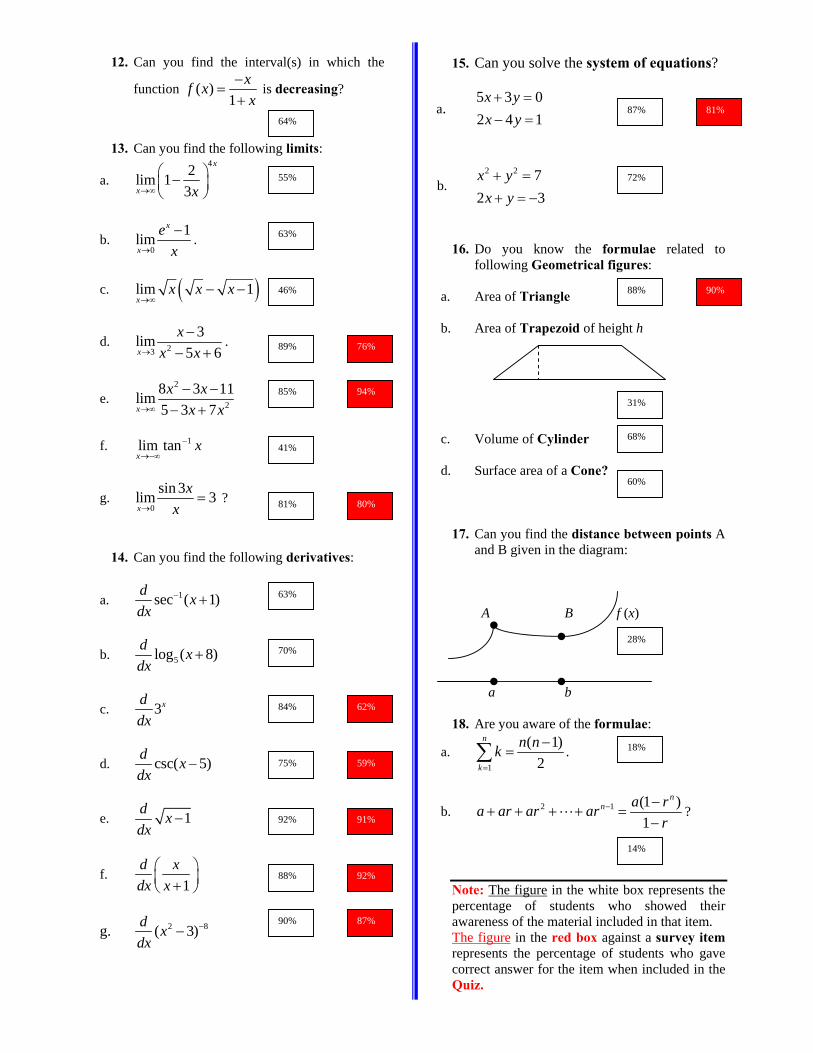
12. Can you find the interval(s) in which the
function ( )1
xf xx
−=
+ is decreasing?
13. Can you find the following limits:
a. 42lim 1
3
x
x x→∞
⎛ ⎞−⎜ ⎟⎝ ⎠
b. 0
1limx
x
ex→
−.
c. ( )lim 1x
x x x→∞
− −
d. 23
3lim5 6x
xx x→
−− +
.
e. 2
2
8 3 11lim5 3 7x
x xx x→∞
− −− +
f. 1lim tanx
x−
→−∞
g. 0
sin 3lim 3x
xx→
= ?
14. Can you find the following derivatives:
a. 1sec ( 1)d xdx
− +
b. 5log ( 8)d xdx
+
c. 3xddx
d. csc( 5)d xdx
−
e. 1d xdx
−
f. 1
d xdx x
⎛ ⎞⎜ ⎟+⎝ ⎠
g. 2 8( 3)d xdx
−−
15. Can you solve the system of equations?
a. 5 3 0 2 4 1
x yx y+ =− =
b. 2 2 7
2 3x y
x y+ =+ = −
16. Do you know the formulae related to
following Geometrical figures:
a. Area of Triangle
b. Area of Trapezoid of height h c. Volume of Cylinder
d. Surface area of a Cone?
17. Can you find the distance between points A and B given in the diagram:
A B f (x)
a b 18. Are you aware of the formulae:
a. 1
( 1)2
n
k
n nk=
−=∑ .
b. 2 1 (1 )1
nn a ra ar ar ar
r− −
+ + + + =−
?
Note: The figure in the white box represents the percentage of students who showed their awareness of the material included in that item. The figure in the red box against a survey item represents the percentage of students who gave correct answer for the item when included in the Quiz.
64%
72% 55%
63%
46%
76%
90%
31%
68%
94%
41%
60% 80%
28%
63%
70%
62%
59%18%
91%
14%
92%
87%
81%
90%
88%
92%
75%
84%
81%
85%
89%
87%
88%

Name:_________ Quiz (MATH 102) [C1] ID#_________ Appendix1(ii)
(Number of Students who wrote the Quiz: 329)
1.
311
242
xxx
−−
+−
=
2a.
12b.
2( 1)2c. 1
2d. 3( 1)
xxxx
xx
xx
−−−−
−−−−
2. Area of the given Triangle is 5 3
a. 15 b. 6 c. 8
d. 152
3. 3
3 2
5 2 11lim7 5 2x
x xx x→∞
− ++ −
=
a.
5b. 72c.
711d. 2
∞
−
−
.
4. If 1tan xh
= , then cos x =
2
2
2
2
2
a. 1
1b. 1
1c. 1
d. 1
hh
hh
h
h
+
+
−
+
+
73%
90%
94%
80%

5. 0
sin 3lim5x
xx→
=
a. 53
b. 35
c. 1 d. does not exist.
6. The value of (5 )xddx
at x = 0 is
a. 5
b. 5ln5
c. ln5
d. 1
7. The value of [csc( )]2
d xdx
π− at x = π is
a. 0
b. 1
c. – 1
d. 32
8. The value of 3( 1)d xdx
− at x = 2 is
a. 3
12 2
b. 13
c. 13
−
d. 3
13
9. 1
d xdx x
⎛ ⎞⎜ ⎟+⎝ ⎠
=
a. 2
1( 1)x−+
b. 2
1( 1)x +
c. 2
2( 1)x−+
d. 2
2( 1)x +
80%
62%
59%
91%
92%
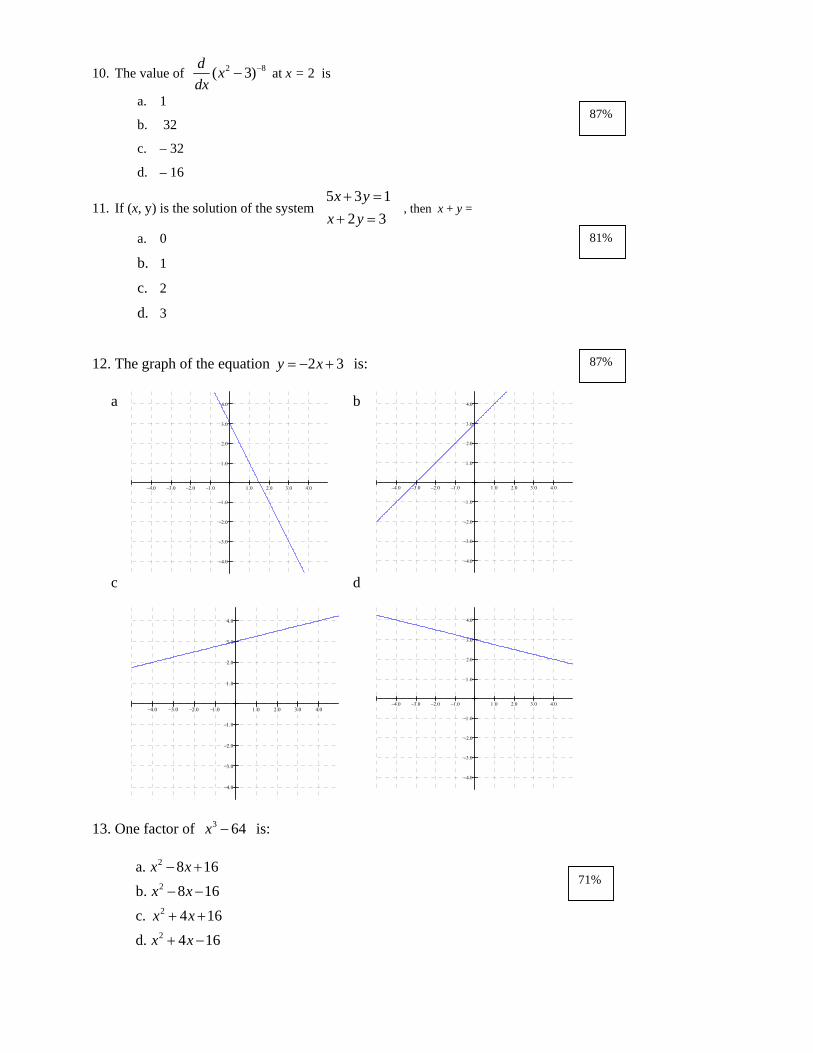
10. The value of 2 8( 3)d xdx
−− at x = 2 is
a. 1
b. 32
c. – 32
d. – 16
11. If (x, y) is the solution of the system 5 3 1
2 3x y
x y+ =+ =
, then x + y =
a. 0
b. 1
c. 2
d. 3
12. The graph of the equation 2 3y x= − + is: a
−4.0 −3.0 −2.0 −1.0 1.0 2.0 3.0 4.0
−4.0
−3.0
−2.0
−1.0
1.0
2.0
3.0
4.0
b
−4.0 −3.0 −2.0 −1.0 1.0 2.0 3.0 4.0
−4.0
−3.0
−2.0
−1.0
1.0
2.0
3.0
4.0
c
−4.0 −3.0 −2.0 −1.0 1.0 2.0 3.0 4.0
−4.0
−3.0
−2.0
−1.0
1.0
2.0
3.0
4.0
d
−4.0 −3.0 −2.0 −1.0 1.0 2.0 3.0 4.0
−4.0
−3.0
−2.0
−1.0
1.0
2.0
3.0
4.0
13. One factor of 3 64x − is:
2
2
2
2
a. 8 16b. 8 16c. 4 16d. 4 16
x xx xx xx x
− +
− −
+ +
+ −
87%
87%
81%
71%
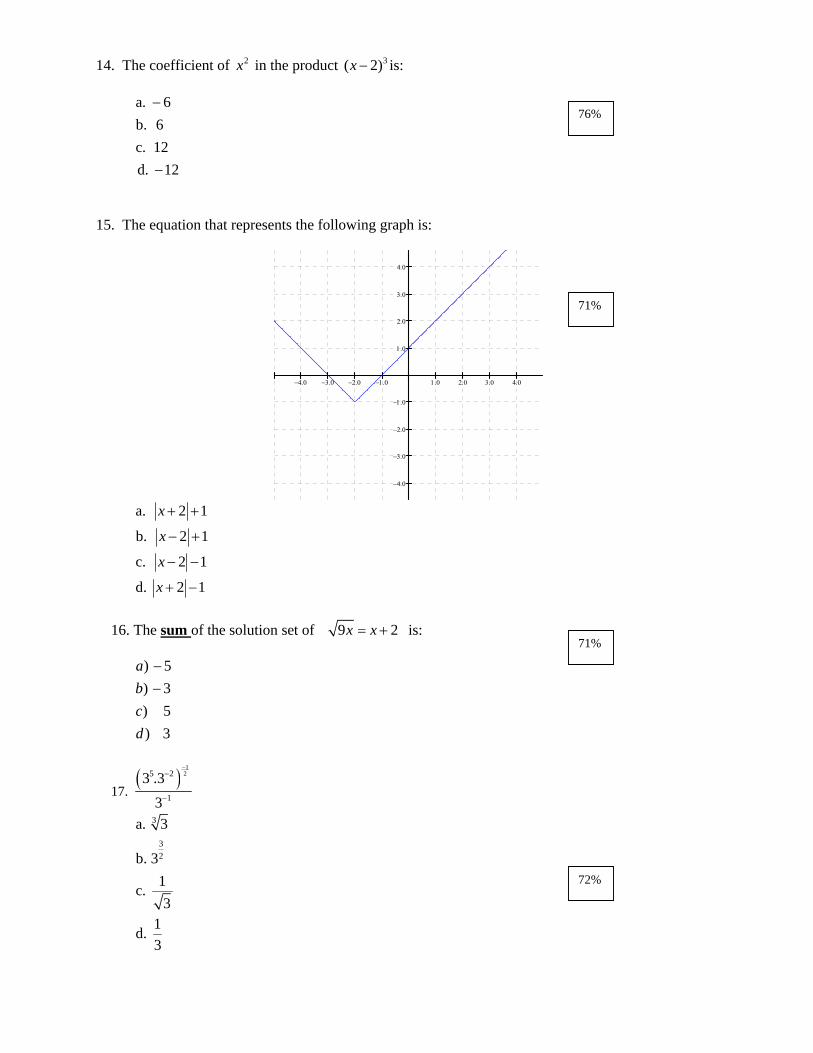
14. The coefficient of 2x in the product 3( 2)x − is:
a. 6b. 6c. 12d. 12
−
−
15. The equation that represents the following graph is:
−4.0 −3.0 −2.0 −1.0 1.0 2.0 3.0 4.0
−4.0
−3.0
−2.0
−1.0
1.0
2.0
3.0
4.0
a. 2 1
b. 2 1
c. 2 1
d. 2 1
x
x
x
x
+ +
− +
− −
+ −
16. The sum of the solution set of 9 2x x= + is:
) 5) 3) 5) 3
abcd
−−
17. ( )
125 2
1
3 .33
−−
−
3
32
a. 3
b. 31c. 3
1d. 3
76%
71%
71%
72%
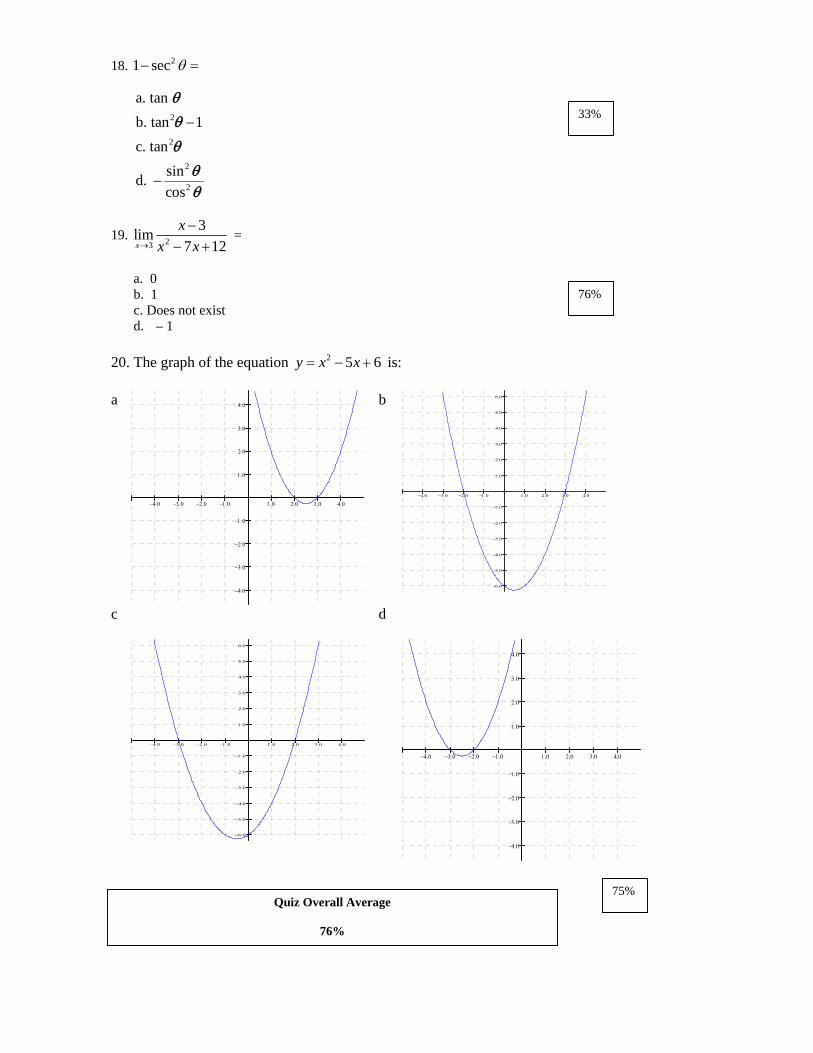
18. 21 sec− =θ
2
2
2
2
a. tan b. tan 1c. tan
sind. cos
θ
θ
θ
θθ
−
−
19. 23
3lim7 12x
xx x→
−− +
=
a. 0 b. 1 c. Does not exist d. – 1
20. The graph of the equation 2 5 6y x x= − + is:
a
−4.0 −3.0 −2.0 −1.0 1.0 2.0 3.0 4.0
−4.0
−3.0
−2.0
−1.0
1.0
2.0
3.0
4.0
b
−4.0 −3.0 −2.0 −1.0 1.0 2.0 3.0 4.0
−6.0
−5.0
−4.0
−3.0
−2.0
−1.0
1.0
2.0
3.0
4.0
5.0
6.0
c
−4.0 −3.0 −2.0 −1.0 1.0 2.0 3.0 4.0
−6.0
−5.0
−4.0
−3.0
−2.0
−1.0
1.0
2.0
3.0
4.0
5.0
6.0
d
−4.0 −3.0 −2.0 −1.0 1.0 2.0 3.0 4.0
−4.0
−3.0
−2.0
−1.0
1.0
2.0
3.0
4.0
33%
75%
76%
Quiz Overall Average
76%

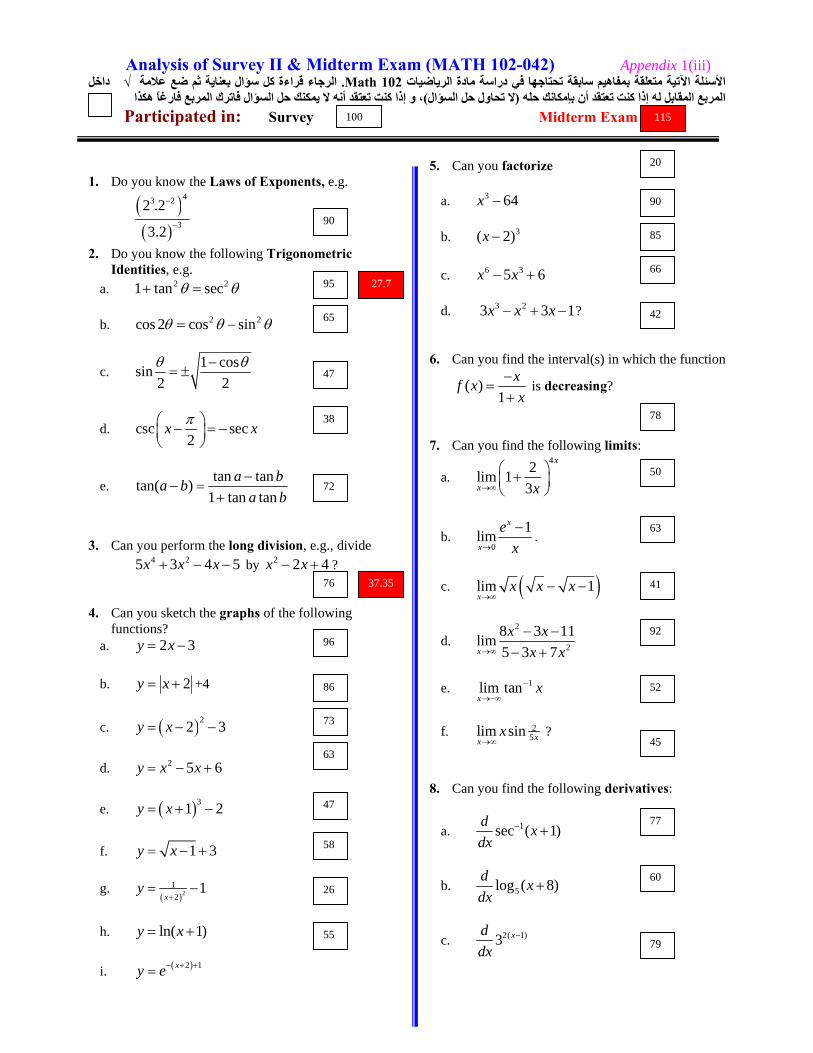
Analysis of Survey II & Midterm Exam (MATH 102-042) Appendix 1(iii) داخل √الرجاء قراءة آل سؤال بعناية ثم ضع علامة . Math 102الأسئلة الآتية متعلقة بمفاهيم سابقة تحتاجها في دراسة مادة الرياضيات
، و إذا آنت تعتقد أنه لا يمكنك حل السؤال فاترك المربع فارغاً هكذا )لا تحاول حل السؤال(له المربع المقابل له إذا آنت تعتقد أن بإمكانك ح Participated in: Survey Midterm Exam
1. Do you know the Laws of Exponents, e.g.
( )( )
43 2
3
2 .2
3.2
−
−
2. Do you know the following Trigonometric Identities, e.g.
a. 2 21 tan sec+ =θ θ
b. 2 2cos 2 cos sin= −θ θ θ
c. 1 cossin
2 2−
= ±θ θ
d. csc sec2
x x⎛ ⎞− = −⎜ ⎟⎝ ⎠
π
e. tan tantan( )
1 tan tana ba b
a b−
− =+
3. Can you perform the long division, e.g., divide
4 25 3 4 5x x x+ − − by 2 2 4x x− + ?
4. Can you sketch the graphs of the following functions?
a. 2 3y x= −
b. 2y x= + +4
c. ( )22 3y x= − −
d. 2 5 6y x x= − +
e. ( )31 2y x= + −
f. 1 3y x= − +
g. ( )2
12
1x
y+
= −
h. ln( 1)y x= +
i. ( )2 1xy e− + +=
5. Can you factorize
a. 3 64x −
b. 3( 2)x −
c. 6 35 6x x− +
d. 3 23 3 1x x x− + − ?
6. Can you find the interval(s) in which the function
( )1
xf xx
−=
+ is decreasing?
7. Can you find the following limits:
a. 42lim 1
3
x
x x→∞
⎛ ⎞+⎜ ⎟⎝ ⎠
b. 0
1limx
x
ex→
−.
c. ( )lim 1x
x x x→∞
− −
d. 2
2
8 3 11lim5 3 7x
x xx x→∞
− −− +
e. 1lim tanx
x−
→−∞
f. 25lim sin xx
x→∞
?
8. Can you find the following derivatives:
a. 1sec ( 1)d xdx
− +
b. 5log ( 8)d xdx
+
c. 2( 1)3 xddx
−
90
95
65
47
38
72
76
96
86
73
63
47
58
26
20
90
85
66
42
78
50
63
41
92
52
45
77
60
79 55
27.7
37.35
100 115
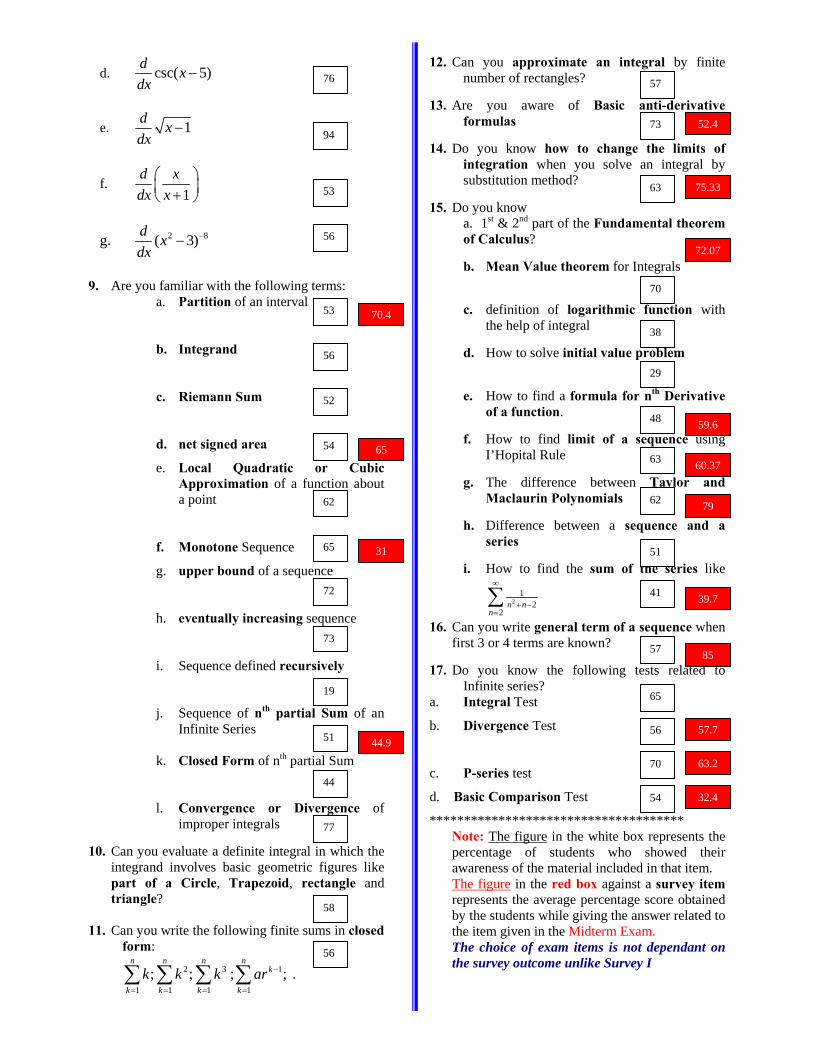
d. csc( 5)d xdx
−
e. 1d xdx
−
f. 1
d xdx x
⎛ ⎞⎜ ⎟+⎝ ⎠
g. 2 8( 3)d xdx
−−
9. Are you familiar with the following terms: a. Partition of an interval
b. Integrand
c. Riemann Sum
d. net signed area
e. Local Quadratic or Cubic Approximation of a function about a point
f. Monotone Sequence
g. upper bound of a sequence
h. eventually increasing sequence
i. Sequence defined recursively
j. Sequence of nth partial Sum of an Infinite Series
k. Closed Form of nth partial Sum
l. Convergence or Divergence of improper integrals
10. Can you evaluate a definite integral in which the
integrand involves basic geometric figures like part of a Circle, Trapezoid, rectangle and triangle?
11. Can you write the following finite sums in closed form:
2 3 1
1 1 1 1; ; ; ;
n n n nk
k k k kk k k ar −
= = = =∑ ∑ ∑ ∑ .
12. Can you approximate an integral by finite number of rectangles?
13. Are you aware of Basic anti-derivative
formulas 14. Do you know how to change the limits of
integration when you solve an integral by substitution method?
15. Do you know
a. 1st & 2nd part of the Fundamental theorem of Calculus?
b. Mean Value theorem for Integrals
c. definition of logarithmic function with the help of integral
d. How to solve initial value problem
e. How to find a formula for nth Derivative of a function.
f. How to find limit of a sequence using
I’Hopital Rule
g. The difference between Taylor and Maclaurin Polynomials
h. Difference between a sequence and a
series
i. How to find the sum of the series like
21
22
n nn
∞
+ −=∑
16. Can you write general term of a sequence when first 3 or 4 terms are known?
17. Do you know the following tests related to
Infinite series? a. Integral Test
b. Divergence Test
c. P-series test
d. Basic Comparison Test
************************************* Note: The figure in the white box represents the percentage of students who showed their awareness of the material included in that item. The figure in the red box against a survey item represents the average percentage score obtained by the students while giving the answer related to the item given in the Midterm Exam. The choice of exam items is not dependant on the survey outcome unlike Survey I
76
94
53
56
58
56
57
73
53
56
52
54
62
65
72
73
19
51
44
77
63
70
38
29
48
63
62
51
41
57
65
56
70
54
70.4
65
31
44.9
52.4
75.33
72.07
59.6
60.37
79
39.7
85
57.7
63.2
32.4
Appendix 1(iv)
Midterm Exam
MATH 102
1
King Fahd University of Petroleum and MineralsDepartment of Mathematical Sciences
(Mid-Term Exam 042)
Time 120 min
MATH 102
Name:
ID#
Serial#:
Sec.#:
No calculator is allowed in the exam.
Show all necessary work
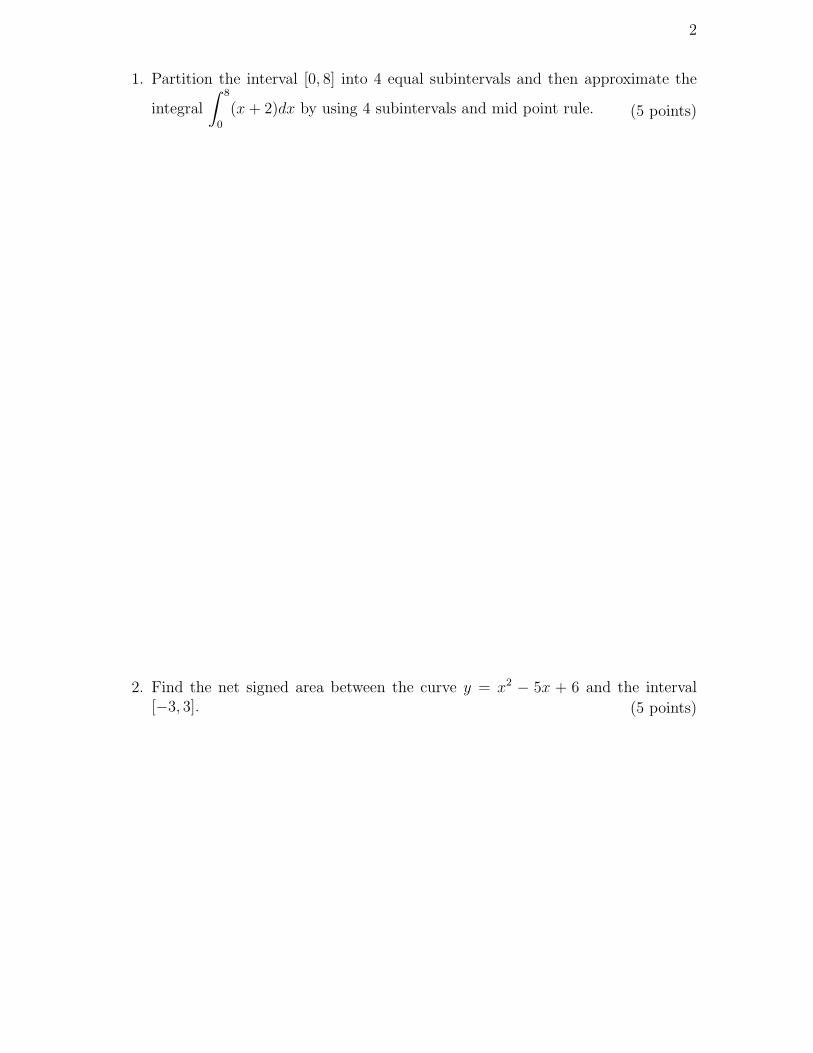
2
1. Partition the interval [0, 8] into 4 equal subintervals and then approximate the
integral
∫ 8
0
(x + 2)dx by using 4 subintervals and mid point rule. (5 points)
2. Find the net signed area between the curve y = x2 − 5x + 6 and the interval[−3, 3]. (5 points)
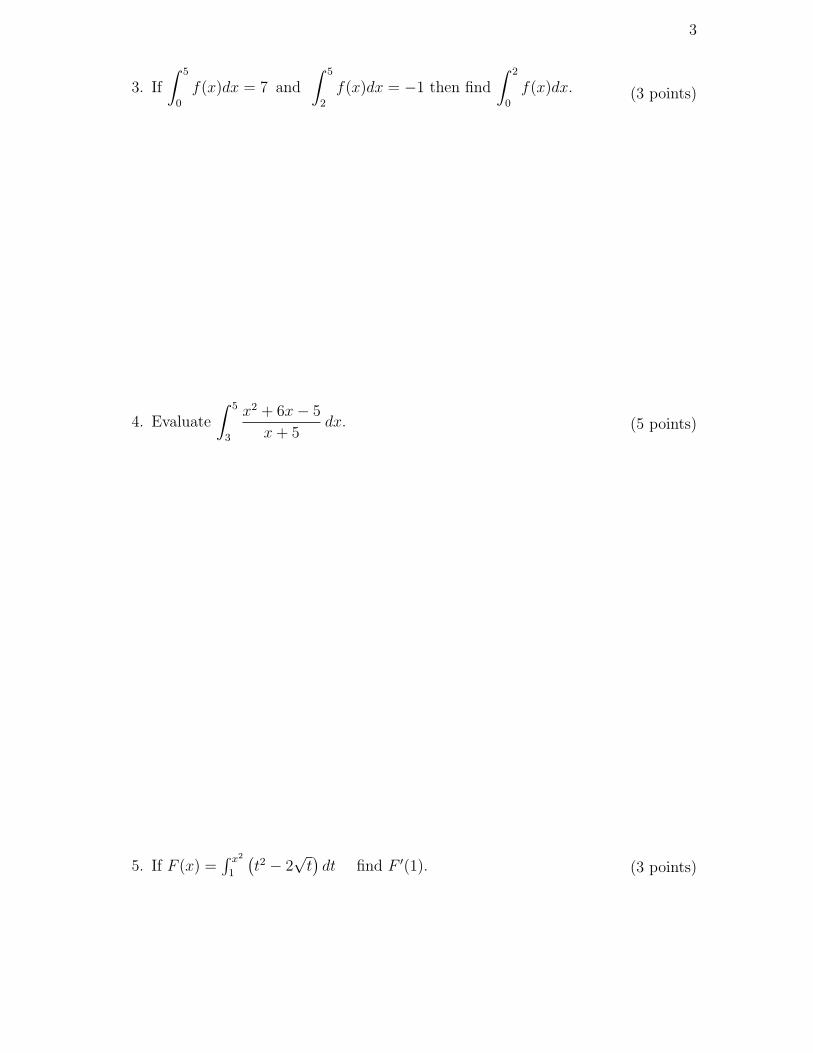
3
3. If
∫ 5
0
f(x)dx = 7 and
∫ 5
2
f(x)dx = −1 then find
∫ 2
0
f(x)dx. (3 points)
4. Evaluate
∫ 5
3
x2 + 6x− 5
x + 5dx. (5 points)
5. If F (x) =∫ x2
1
(t2 − 2
√t)dt find F ′(1). (3 points)
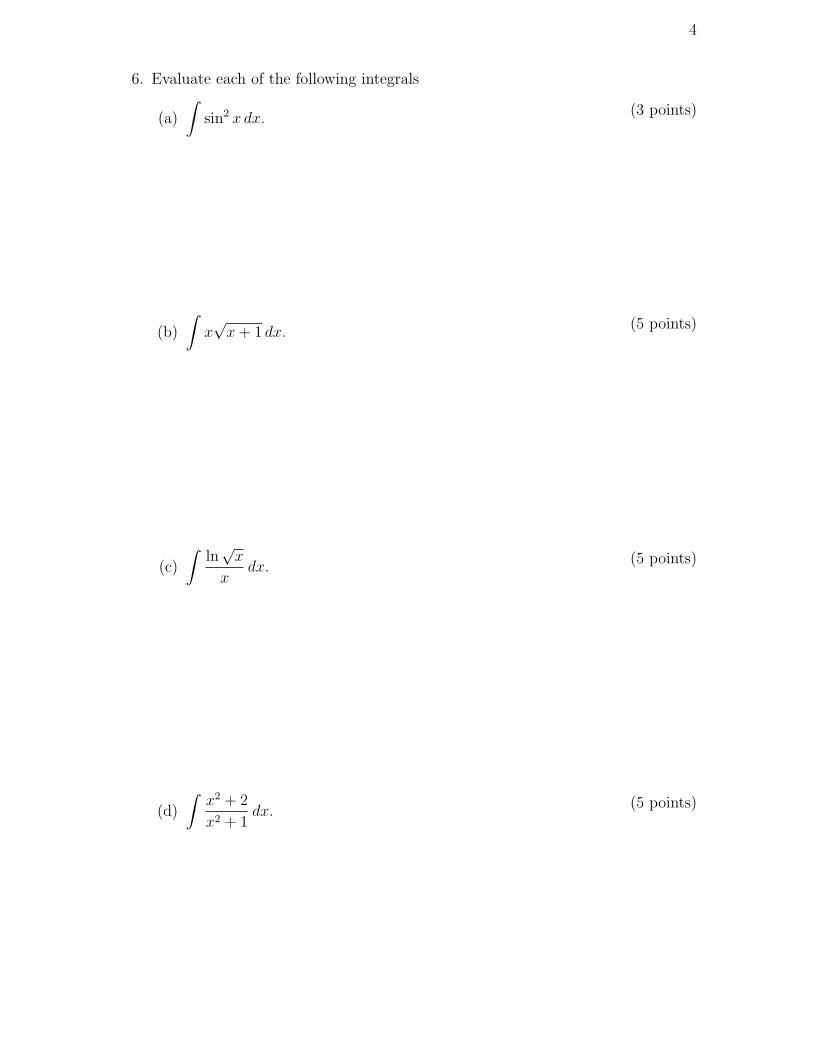
4
6. Evaluate each of the following integrals
(a)
∫sin2 x dx.
(3 points)
(b)
∫x√
x + 1 dx.(5 points)
(c)
∫ln√
x
xdx.
(5 points)
(d)
∫x2 + 2
x2 + 1dx.
(5 points)
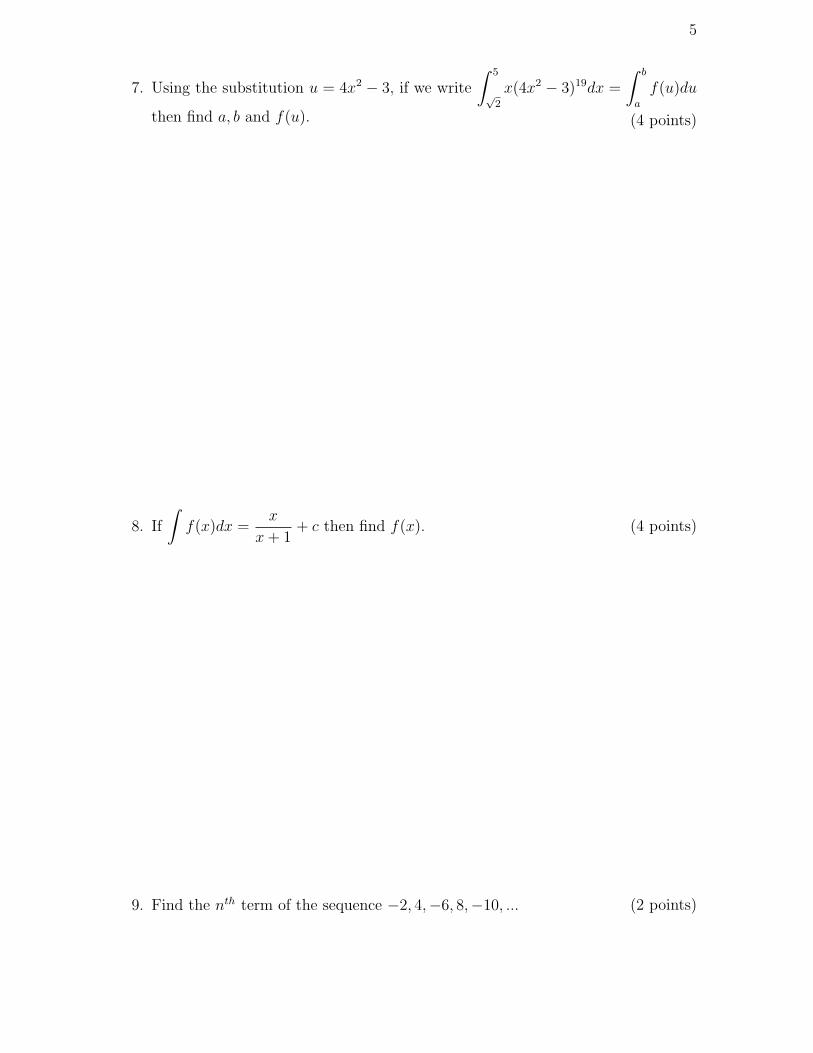
5
7. Using the substitution u = 4x2 − 3, if we write
∫ 5
√2
x(4x2 − 3)19dx =
∫ b
a
f(u)du
then find a, b and f(u). (4 points)
8. If
∫f(x)dx =
x
x + 1+ c then find f(x). (4 points)
9. Find the nth term of the sequence −2, 4,−6, 8,−10, ... (2 points)
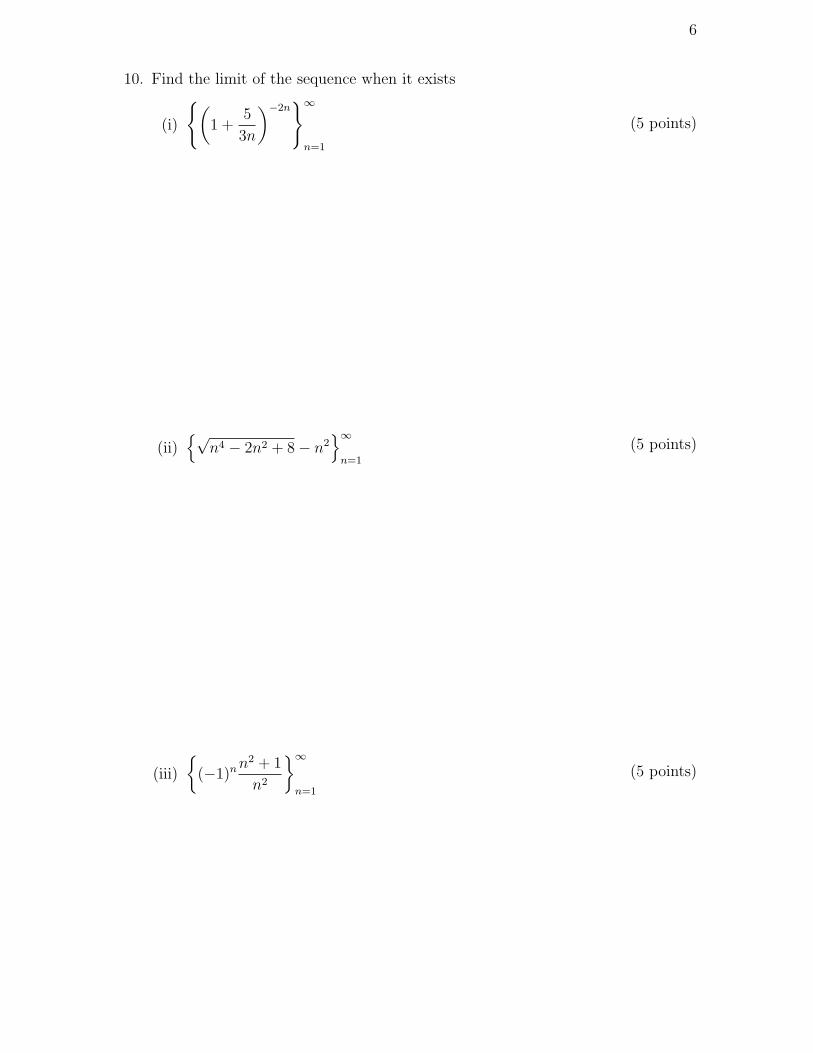
6
10. Find the limit of the sequence when it exists
(i)
{(1 +
5
3n
)−2n}∞
n=1
(5 points)
(ii){√
n4 − 2n2 + 8− n2}∞
n=1
(5 points)
(iii)
{(−1)n n2 + 1
n2
}∞
n=1
(5 points)
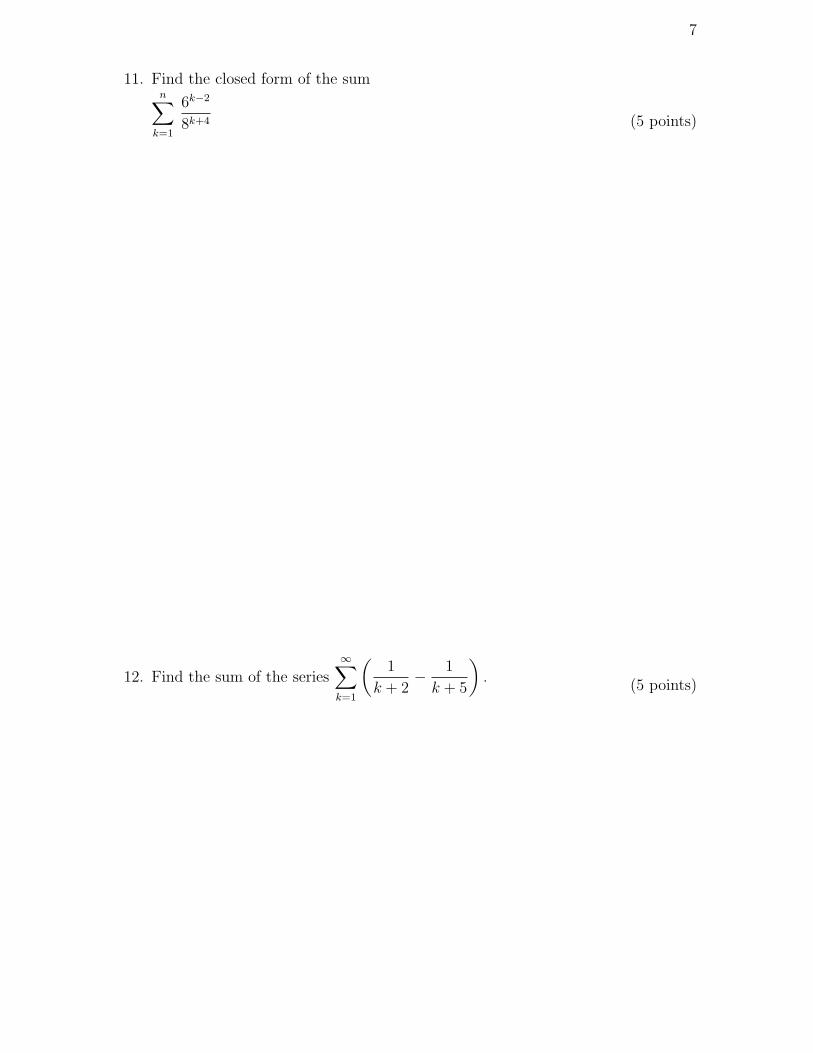
7
11. Find the closed form of the sumn∑
k=1
6k−2
8k+4 (5 points)
12. Find the sum of the series∞∑
k=1
(1
k + 2− 1
k + 5
).
(5 points)
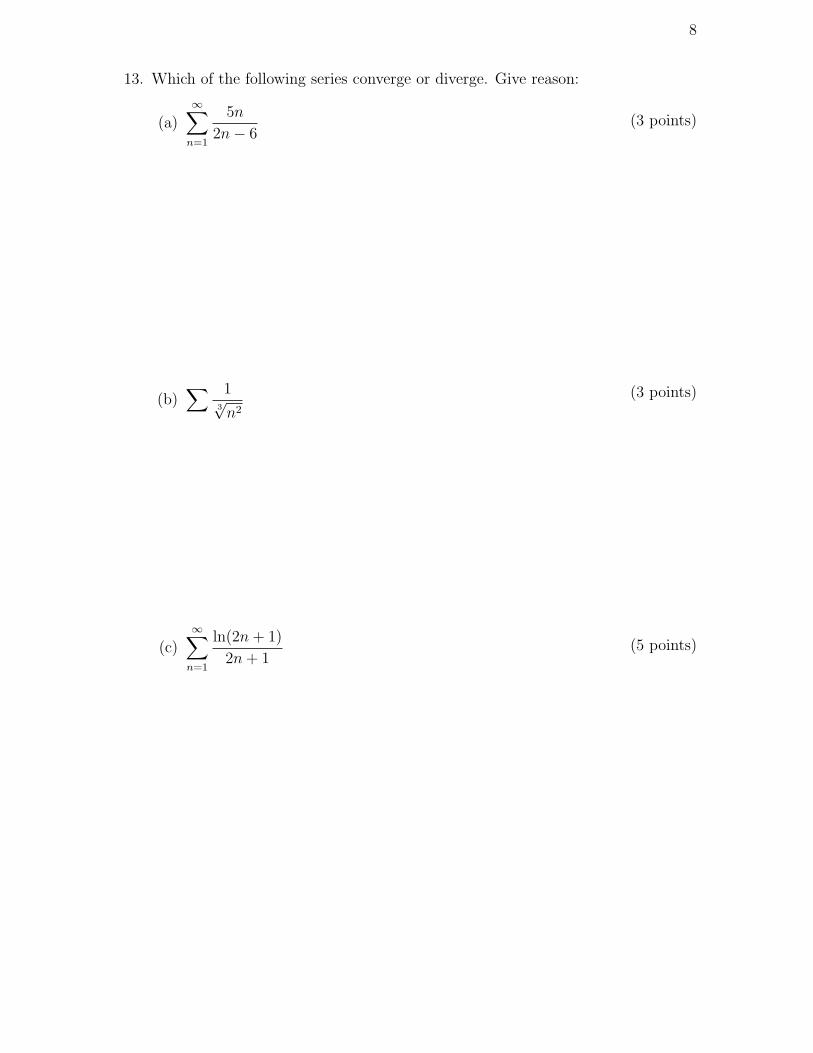
8
13. Which of the following series converge or diverge. Give reason:
(a)∞∑
n=1
5n
2n− 6(3 points)
(b)∑ 1
3√
n2
(3 points)
(c)∞∑
n=1
ln(2n + 1)
2n + 1(5 points)
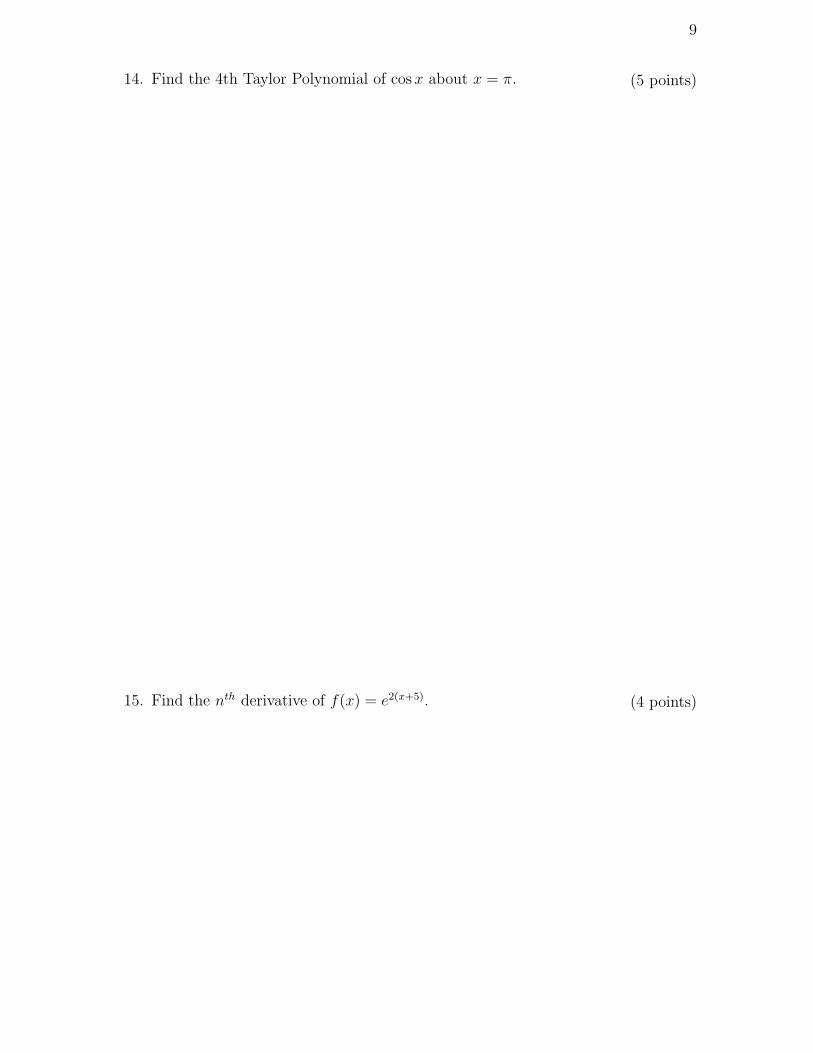
9
14. Find the 4th Taylor Polynomial of cos x about x = π. (5 points)
15. Find the nth derivative of f(x) = e2(x+5). (4 points)
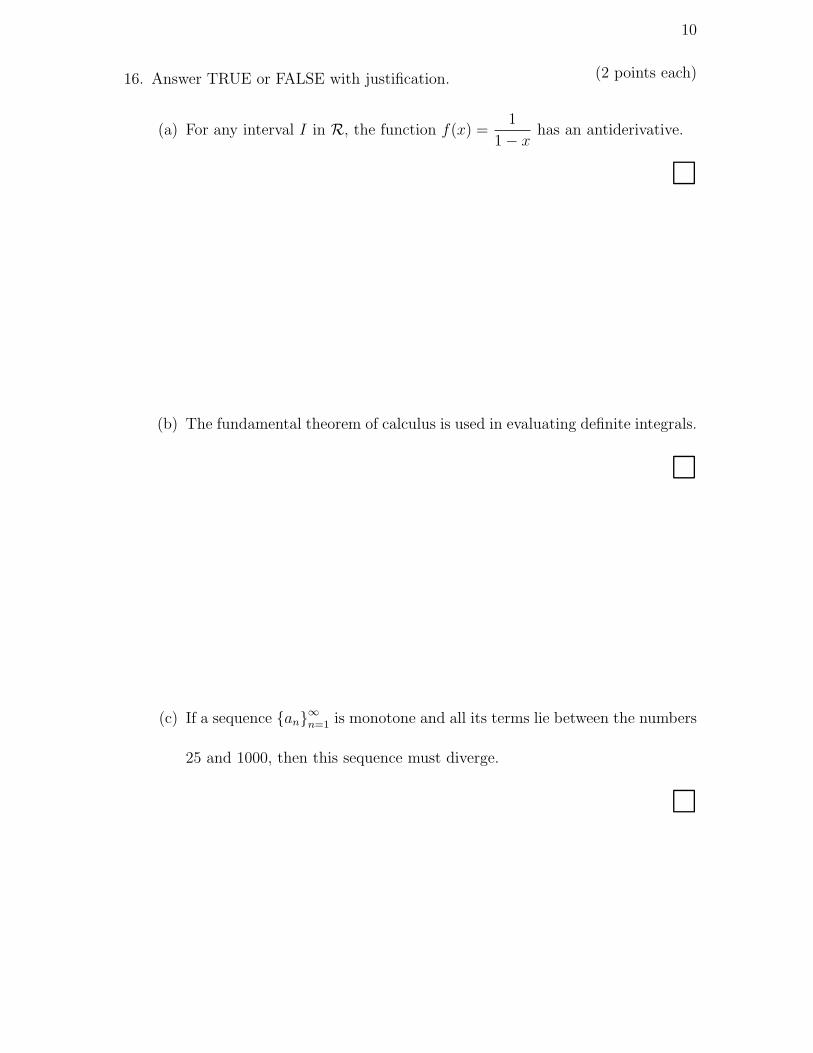
10
16. Answer TRUE or FALSE with justification. (2 points each)
(a) For any interval I in R, the function f(x) =1
1− xhas an antiderivative.
¤
(b) The fundamental theorem of calculus is used in evaluating definite integrals.
¤
(c) If a sequence {an}∞n=1 is monotone and all its terms lie between the numbers
25 and 1000, then this sequence must diverge.
¤
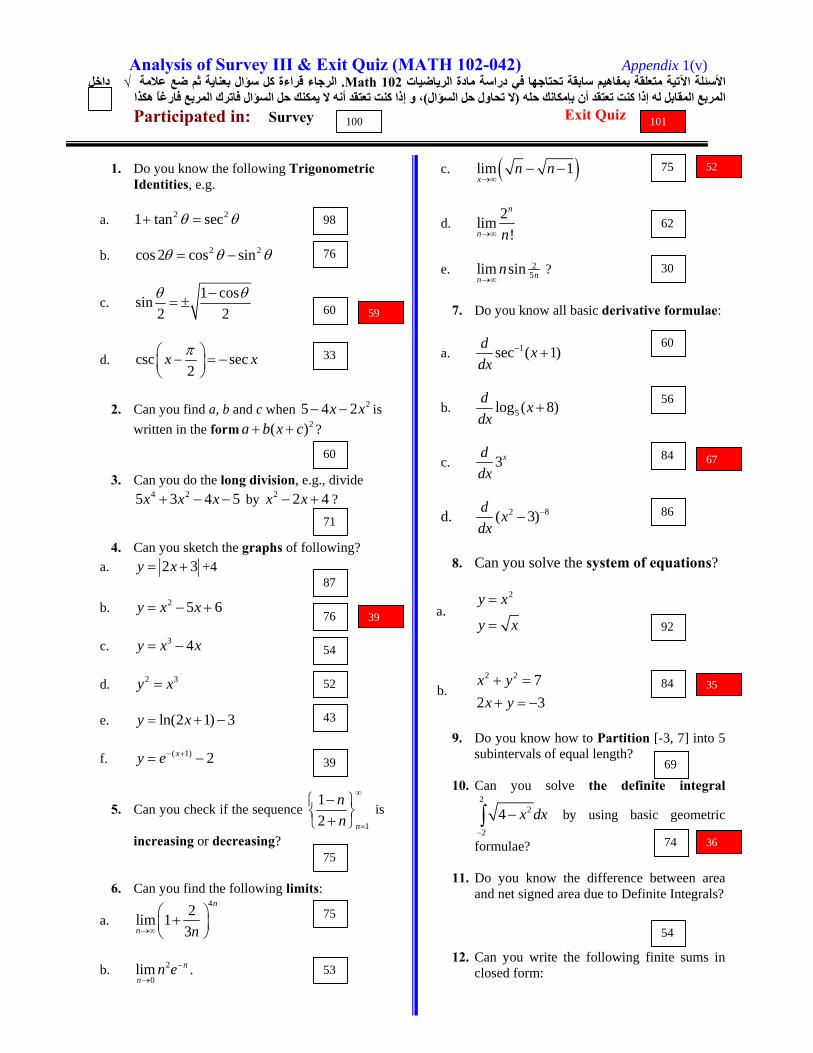
Analysis of Survey III & Exit Quiz (MATH 102-042) Appendix 1(v) داخل √الرجاء قراءة آل سؤال بعناية ثم ضع علامة . Math 102الأسئلة الآتية متعلقة بمفاهيم سابقة تحتاجها في دراسة مادة الرياضيات
، و إذا آنت تعتقد أنه لا يمكنك حل السؤال فاترك المربع فارغاً هكذا )لا تحاول حل السؤال(ك حله المربع المقابل له إذا آنت تعتقد أن بإمكانParticipated in: Survey
1. Do you know the following Trigonometric Identities, e.g.
a. 2 21 tan sec+ =θ θ
b. 2 2cos 2 cos sin= −θ θ θ
c. 1 cossin
2 2−
= ±θ θ
d. csc sec2
x x⎛ ⎞− = −⎜ ⎟⎝ ⎠
π
2. Can you find a, b and c when 25 4 2x x− − is written in the form 2( )a b x c+ + ?
3. Can you do the long division, e.g., divide 4 25 3 4 5x x x+ − − by 2 2 4x x− + ?
4. Can you sketch the graphs of following? a. 2 3y x= + +4
b. 2 5 6y x x= − +
c. 3 4y x x= −
d. 2 3y x=
e. ln(2 1) 3y x= + −
f. ( 1) 2xy e− += −
5. Can you check if the sequence 1
12 n
nn
∞
=
−⎧ ⎫⎨ ⎬+⎩ ⎭
is
increasing or decreasing?
6. Can you find the following limits:
a. 42lim 1
3
n
n n→∞
⎛ ⎞+⎜ ⎟⎝ ⎠
b. 2
0lim n
nn e−
→.
Exit Quiz
c. ( )lim 1x
n n→∞
− −
d. 2lim
!
n
n n→∞
e. 25lim sin nn
n→∞
?
7. Do you know all basic derivative formulae:
a. 1sec ( 1)d xdx
− +
b. 5log ( 8)d xdx
+
c. 3xddx
d. 2 8( 3)d xdx
−−
8. Can you solve the system of equations?
a. 2 y x
y x
=
=
b. 2 2 7
2 3x y
x y+ =+ = −
9. Do you know how to Partition [-3, 7] into 5 subintervals of equal length?
10. Can you solve the definite integral
22
2
4 x dx−
−∫ by using basic geometric
formulae? 11. Do you know the difference between area
and net signed area due to Definite Integrals?
12. Can you write the following finite sums in closed form:
98
76
60
33
60
71
87
54
52
43
39
92
75
84
75
53
75
62
30
60
56
84
86
74
54
76
69
100 101
67
35
52
59
39
36
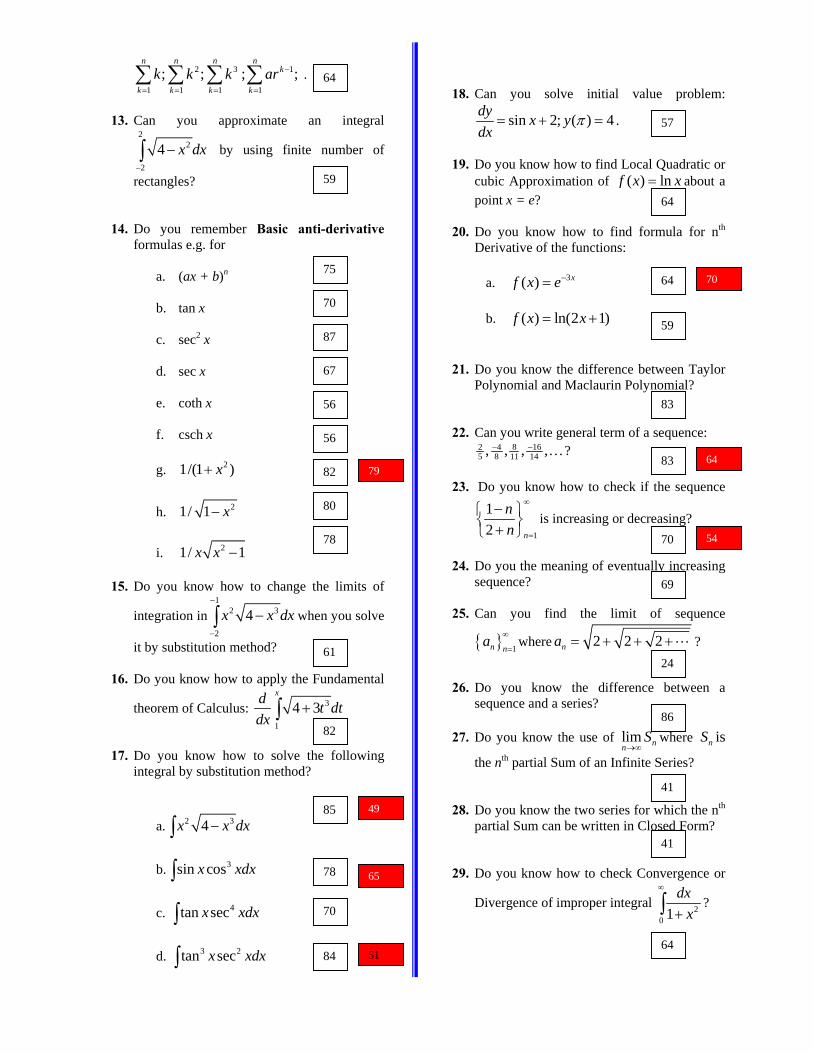
2 3 1
1 1 1 1; ; ; ;
n n n nk
k k k kk k k ar −
= = = =∑ ∑ ∑ ∑ .
13. Can you approximate an integral 2
2
2
4 x dx−
−∫ by using finite number of
rectangles? 14. Do you remember Basic anti-derivative
formulas e.g. for
a. (ax + b)n
b. tan x
c. sec2 x
d. sec x
e. coth x
f. csch x
g. 21/(1 )x+
h. 21/ 1 x−
i. 21/ 1x x −
15. Do you know how to change the limits of
integration in1
2 3
2
4x x dx−
−
−∫ when you solve
it by substitution method? 16. Do you know how to apply the Fundamental
theorem of Calculus: 3
1
4 3xd t dt
dx+∫
17. Do you know how to solve the following
integral by substitution method?
a. 2 34x x dx−∫
b. 3sin cosx xdx∫
c. 4tan secx xdx∫
d. 3 2tan secx xdx∫
18. Can you solve initial value problem:
sin 2; ( ) 4dy x ydx
π= + = .
19. Do you know how to find Local Quadratic or
cubic Approximation of ( ) lnf x x= about a point x = e?
20. Do you know how to find formula for nth
Derivative of the functions:
a. 3( ) xf x e−=
b. ( ) ln(2 1)f x x= +
21. Do you know the difference between Taylor
Polynomial and Maclaurin Polynomial? 22. Can you write general term of a sequence:
8 162 45 8 11 14, , , ,−− …?
23. Do you know how to check if the sequence
1
12 n
nn
∞
=
−⎧ ⎫⎨ ⎬+⎩ ⎭
is increasing or decreasing?
24. Do you the meaning of eventually increasing
sequence?
25. Can you find the limit of sequence
{ } 1n na ∞
=where 2 2 2na = + + + ?
26. Do you know the difference between a sequence and a series?
27. Do you know the use of lim nn
S→∞
where nS is
the nth partial Sum of an Infinite Series? 28. Do you know the two series for which the nth
partial Sum can be written in Closed Form?
29. Do you know how to check Convergence or
Divergence of improper integral 20 1
dxx
∞
+∫ ?
64
59
75
70
87
67
56
56
82
80
78
61
82
85
70
84
57
64
64
59
83
83
70
69
24
86
64
41
41
78
79
49
65
54
64
70
51
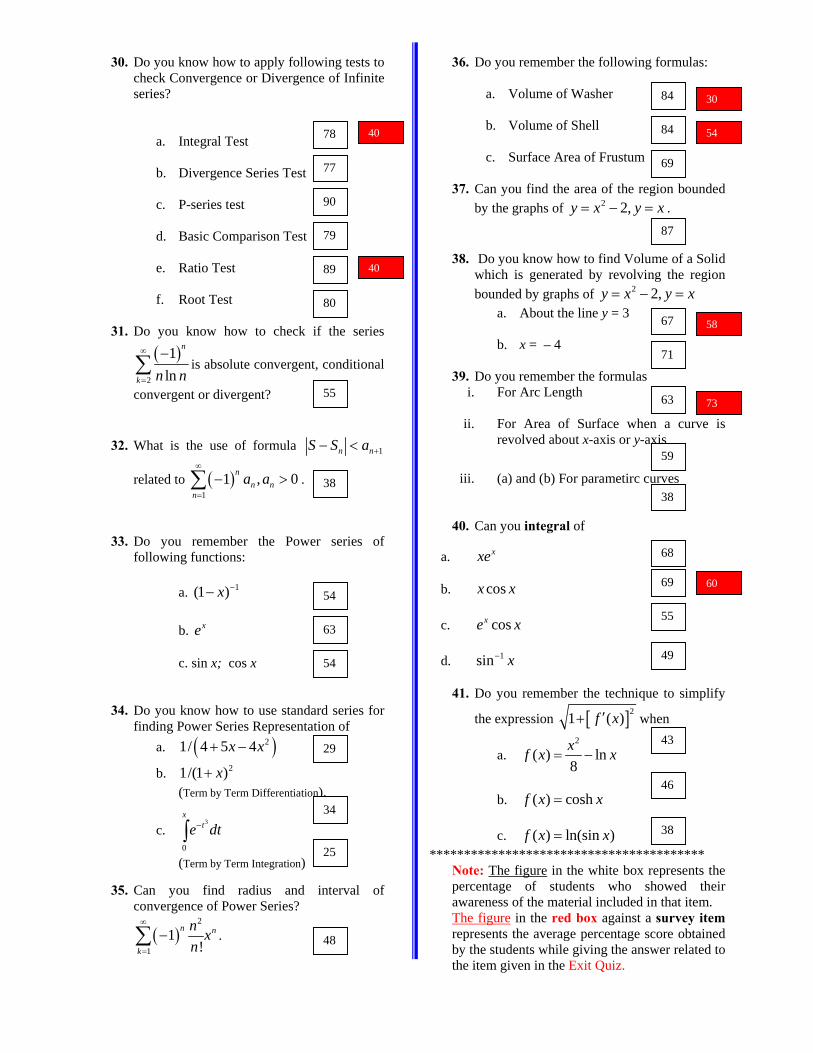
30. Do you know how to apply following tests to check Convergence or Divergence of Infinite series?
a. Integral Test
b. Divergence Series Test
c. P-series test
d. Basic Comparison Test
e. Ratio Test
f. Root Test
31. Do you know how to check if the series
( )2
1ln
n
k n n
∞
=
−∑ is absolute convergent, conditional
convergent or divergent? 32. What is the use of formula 1n nS S a +− <
related to ( )1
1 , 0nn n
na a
∞
=
− >∑ .
33. Do you remember the Power series of
following functions:
a. 1(1 )x −−
b. xe
c. sin x; cos x
34. Do you know how to use standard series for
finding Power Series Representation of a. ( )21/ 4 5 4x x+ −
b. 21/(1 )x+ (Term by Term Differentiation).
c. 3
0
xte dt−∫
(Term by Term Integration)
35. Can you find radius and interval of convergence of Power Series?
( )2
11
!n n
k
n xn
∞
=
−∑ .
36. Do you remember the following formulas:
a. Volume of Washer
b. Volume of Shell
c. Surface Area of Frustum
37. Can you find the area of the region bounded by the graphs of 2 2,y x y x= − = .
38. Do you know how to find Volume of a Solid
which is generated by revolving the region bounded by graphs of 2 2,y x y x= − =
a. About the line y = 3
b. x = – 4
39. Do you remember the formulas i. For Arc Length
ii. For Area of Surface when a curve is revolved about x-axis or y-axis
iii. (a) and (b) For parametirc curves
40. Can you integral of
a. xxe
b. cosx x
c. cosxe x
d. 1sin x−
41. Do you remember the technique to simplify
the expression [ ]21 ( )f x′+ when
a. 2
( ) ln8xf x x= −
b. ( ) coshf x x=
c. ( ) ln(sin )f x x= ****************************************
Note: The figure in the white box represents the percentage of students who showed their awareness of the material included in that item. The figure in the red box against a survey item represents the average percentage score obtained by the students while giving the answer related to the item given in the Exit Quiz.
29
34
25
69
84
84
48
54
77
78
90
38
59
38
55 63
71
67
87
38
46
43
54
63
80
89
79
68
69
55
49
58
40 54
60
30
40
73
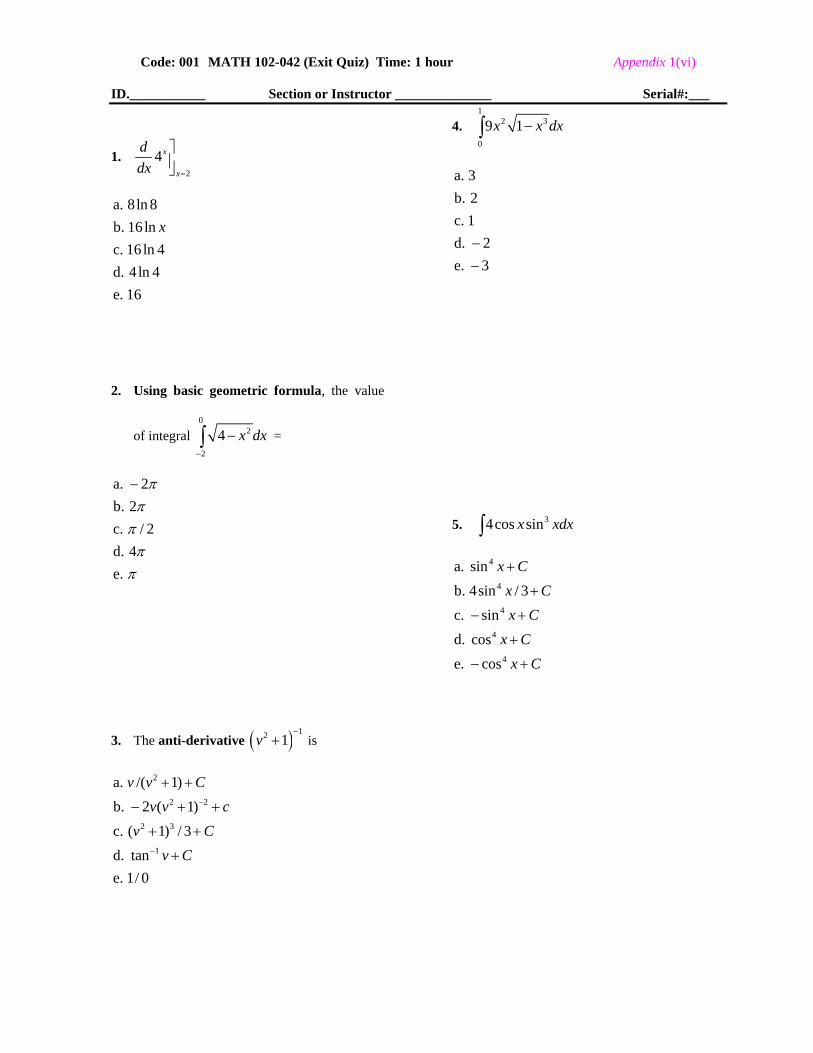
Code: 001 MATH 102-042 (Exit Quiz) Time: 1 hour Appendix 1(vi)
ID.___________ Section or Instructor ______________ Serial#:___
1. 2
4x
x
ddx =
⎤⎥⎦
a. 8ln 8b. 16 lnc. 16 ln 4d. 4 ln 4e. 16
x
2. Using basic geometric formula, the value
of integral 0
2
2
4 x dx−
−∫ =
a. 2b. 2c. / 2d. 4e.
ππ
ππ
π
−
3. The anti-derivative ( ) 12 1v−
+ is
2
2 2
2 3
1
a. /( 1)b. 2 ( 1)c. ( 1) / 3d. tane. 1/ 0
v v Cv v c
v Cv C
−
−
+ +
− + +
+ +
+
4. 1
2 3
0
9 1x x dx−∫
a. 3b. 2c. 1d. 2e. 3
−−
5. 34cos sinx xdx∫
4
4
4
4
4
a. sinb. 4sin / 3c. sind. cose. cos
x Cx Cx C
x Cx C
+
+
− +
+
− +
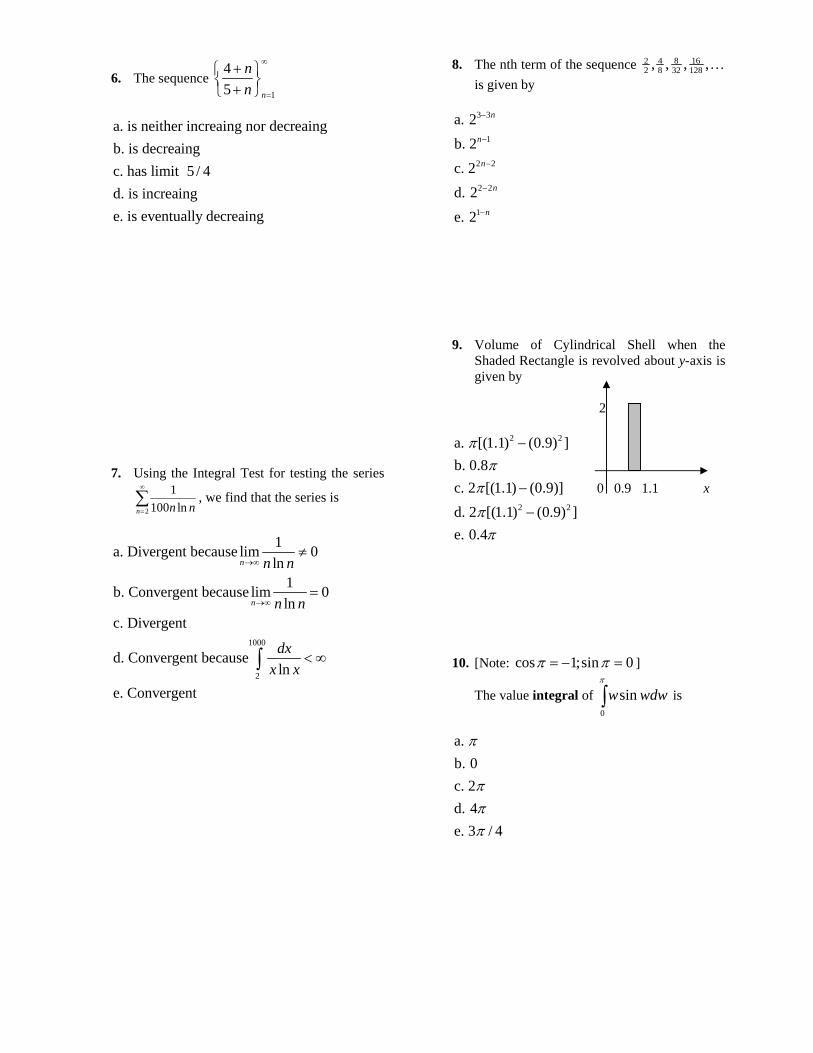
6. The sequence 1
45 n
nn
∞
=
+⎧ ⎫⎨ ⎬+⎩ ⎭
a. is neither increaing nor decreaingb. is decreaingc. has limit 5 / 4d. is increainge. is eventually decreaing
7. Using the Integral Test for testing the series
2
1100 lnn n n
∞
=∑ , we find that the series is
1000
2
1a. Divergent because lim 0ln
1b. Convergent because lim 0ln
c. Divergent
d. Convergent becauseln
e. Convergent
n
n
n n
n n
dxx x
→∞
→∞
≠
=
< ∞∫
8. The nth term of the sequence 8 162 42 8 32 128, , , ,…
is given by
3 3
1
2 2
2 2
1
a. 2b. 2c. 2d. 2e. 2
n
n
n
n
n
−
−
−
−
−
9. Volume of Cylindrical Shell when the Shaded Rectangle is revolved about y-axis is given by
2
2 2
2 2
a. [(1.1) (0.9) ]b. 0.8c. 2 [(1.1) (0.9)]d. 2 [(1.1) (0.9) ]e. 0.4
ππ
πππ
−
−
−
0 0.9 1.1 x
10. [Note: cos 1;sin 0π π= − = ]
The value integral of 0
sinw wdwπ
∫ is
a. b. 0c. 2d. 4e. 3 / 4
π
πππ
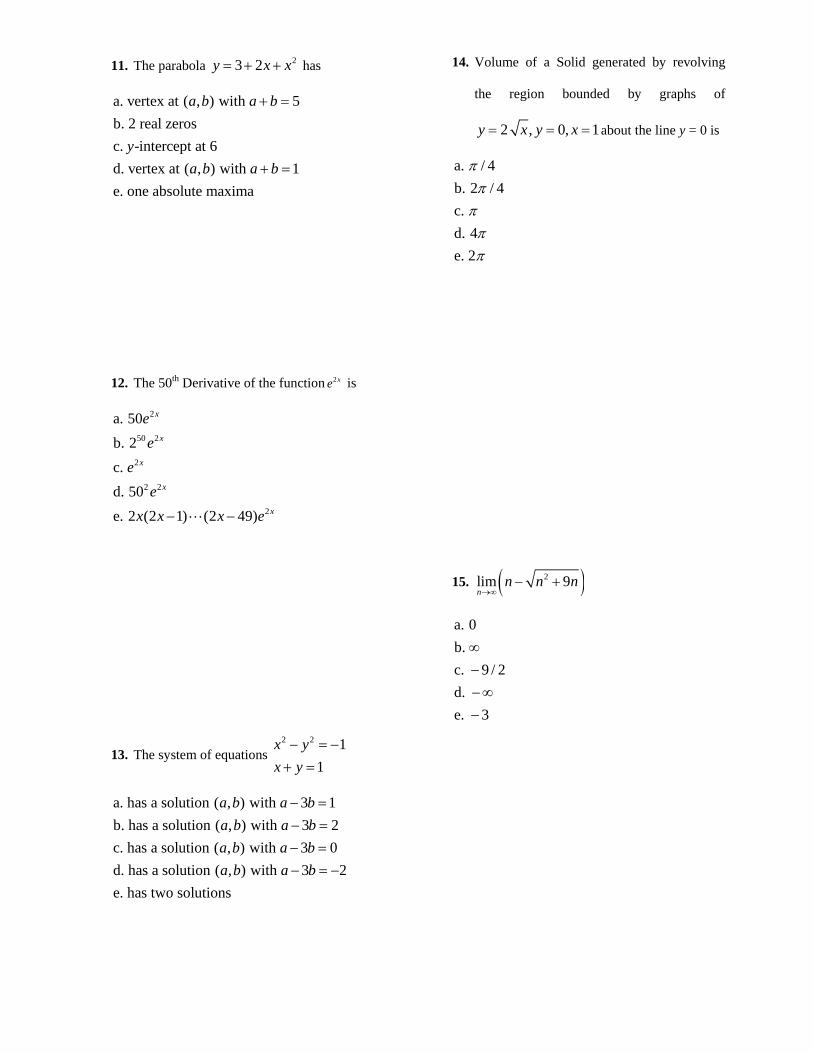
11. The parabola 23 2y x x= + + has
a. vertex at ( , ) with 5b. 2 real zerosc. -intercept at 6d. vertex at ( , ) with 1e. one absolute maxima
a b a b
ya b a b
+ =
+ =
12. The 50th Derivative of the function 2xe is
2
50 2
2
2 2
2
a. 50b. 2c. d. 50e. 2 (2 1) (2 49)
x
x
x
x
x
ee
ee
x x x e− −
13. The system of equations 2 2 1
1x yx y− = −+ =
a. has a solution ( , ) with 3 1b. has a solution ( , ) with 3 2c. has a solution ( , ) with 3 0d. has a solution ( , ) with 3 2e. has two solutions
a b a ba b a ba b a ba b a b
− =− =− =− = −
14. Volume of a Solid generated by revolving
the region bounded by graphs of
2 , 0, 1y x y x= = = about the line y = 0 is
a. / 4b. 2 / 4c. d. 4e. 2
ππ
πππ
15. ( )2lim 9n
n n n→∞
− +
a. 0b. c. 9 / 2d. e. 3
∞−−∞−
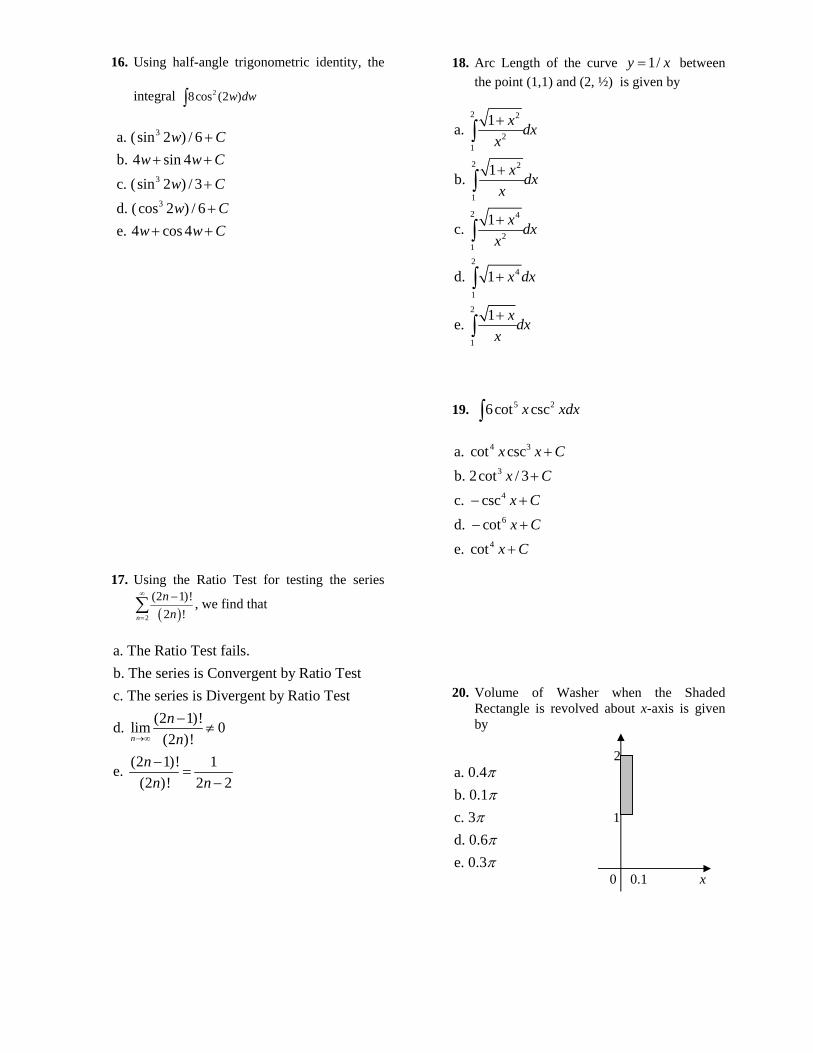
16. Using half-angle trigonometric identity, the
integral 28cos (2 )w dw∫
3
3
3
a. ( sin 2 ) / 6b. 4 sin 4c. ( sin 2 ) / 3d. ( cos 2 ) / 6e. 4 cos 4
w Cw w C
w Cw C
w w C
++ +
+
++ +
17. Using the Ratio Test for testing the series
( )2
(2 1)!2 !n
nn
∞
=
−∑ , we find that
a. The Ratio Test fails.b. The series is Convergent by Ratio Testc. The series is Divergent by Ratio Test
(2 1)!d. lim 0(2 )!
(2 1)! 1e. (2 )! 2 2
n
nn
nn n
→∞
−≠
−=
−
18. Arc Length of the curve 1/y x= between the point (1,1) and (2, ½) is given by
2 2
21
2 2
1
2 4
212
4
1
2
1
1a.
1b.
1c.
d. 1
1e.
x dxx
x dxx
x dxx
x dx
xdxx
+
+
+
+
+
∫
∫
∫
∫
∫
19. 5 26cot cscx xdx∫
4 3
3
4
6
4
a. cot cscb. 2cot / 3c. cscd. cote. cot
x x Cx Cx Cx C
x C
+
+
− +
− +
+
20. Volume of Washer when the Shaded
Rectangle is revolved about x-axis is given by
2 a. 0.4b. 0.1c. 3d. 0.6e. 0.3
ππ
πππ
1
0 0.1 x
Appendix - II
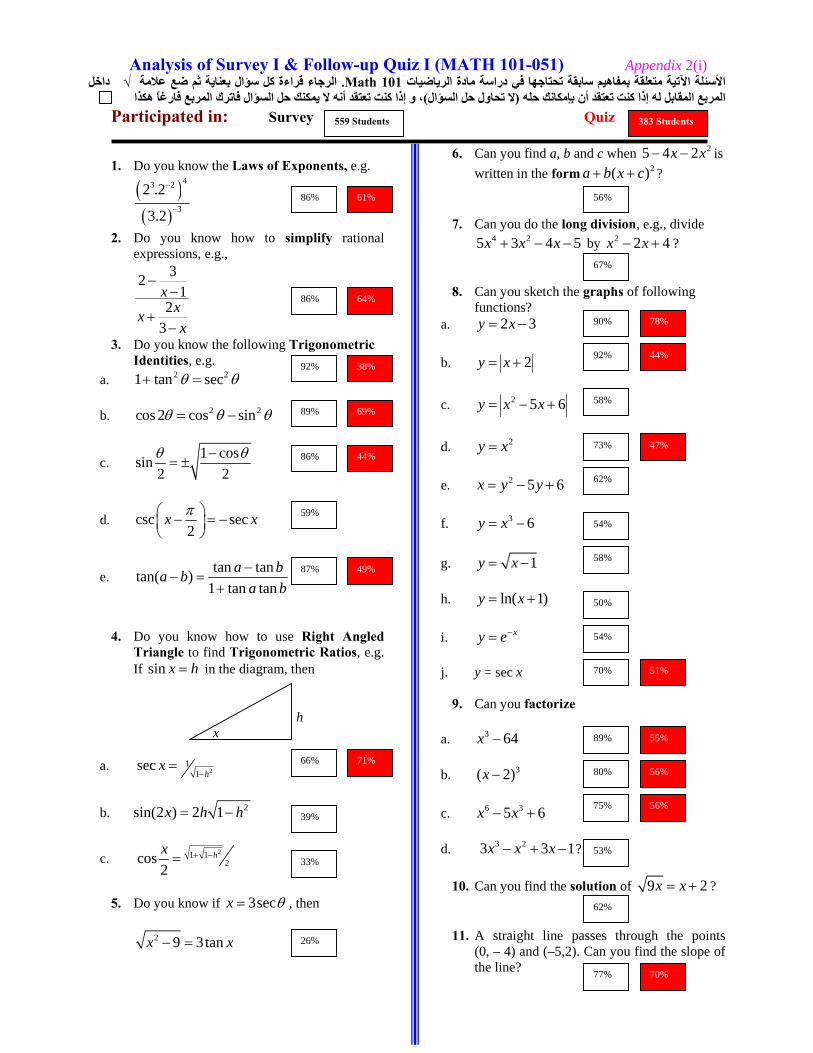
Analysis of Survey I & Follow-up Quiz I (MATH 101-051) Appendix 2(i) داخل √الرجاء قراءة آل سؤال بعناية ثم ضع علامة . Math 101الأسئلة الآتية متعلقة بمفاهيم سابقة تحتاجها في دراسة مادة الرياضيات
، و إذا آنت تعتقد أنه لا يمكنك حل السؤال فاترك المربع فارغاً هكذا )لا تحاول حل السؤال(ه المربع المقابل له إذا آنت تعتقد أن بإمكانك حلParticipated in: Survey Quiz
1. Do you know the Laws of Exponents, e.g.
( )( )
43 2
3
2 .2
3.2
−
−
2. Do you know how to simplify rational expressions, e.g.,
321
23
xxxx
−−
+−
3. Do you know the following Trigonometric Identities, e.g.
a. 2 21 tan sec+ =θ θ
b. 2 2cos 2 cos sin= −θ θ θ
c. 1 cossin
2 2−
= ±θ θ
d. csc sec2
x x⎛ ⎞− = −⎜ ⎟⎝ ⎠
π
e. tan tantan( )
1 tan tana ba b
a b−
− =+
4. Do you know how to use Right Angled
Triangle to find Trigonometric Ratios, e.g. If sin x h= in the diagram, then
h x a. 2
11
sech
x−
=
b. 2sin(2 ) 2 1x h h= −
c. 21 12cos
2hx + −=
5. Do you know if 3secx θ= , then
2 9 3tanx x− =
6. Can you find a, b and c when 25 4 2x x− − is written in the form 2( )a b x c+ + ?
7. Can you do the long division, e.g., divide 4 25 3 4 5x x x+ − − by 2 2 4x x− + ?
8. Can you sketch the graphs of following functions?
a. 2 3y x= −
b. 2y x= +
c. 2 5 6y x x= − +
d. 2y x=
e. 2 5 6x y y= − +
f. 3 6y x= −
g. 1y x= −
h. ln( 1)y x= +
i. xy e−=
j. y = sec x
9. Can you factorize
a. 3 64x −
b. 3( 2)x −
c. 6 35 6x x− +
d. 3 23 3 1x x x− + − ?
10. Can you find the solution of 9 2x x= + ?
11. A straight line passes through the points
(0, – 4) and (–5,2). Can you find the slope of the line?
86%
86%
92%
89%
86%
59%
87%
33%
39%
66%
67%
56%
26%
54%
50%
58%
54%
62%
73%
58%
92%
90%
53%
70%
75%
80%
89%
77%
62%
61%
64%
38%
69%
44%
49%
71%
78%
44%
47%
51%
55%
56%
56%
70%
559 Students 383 Students
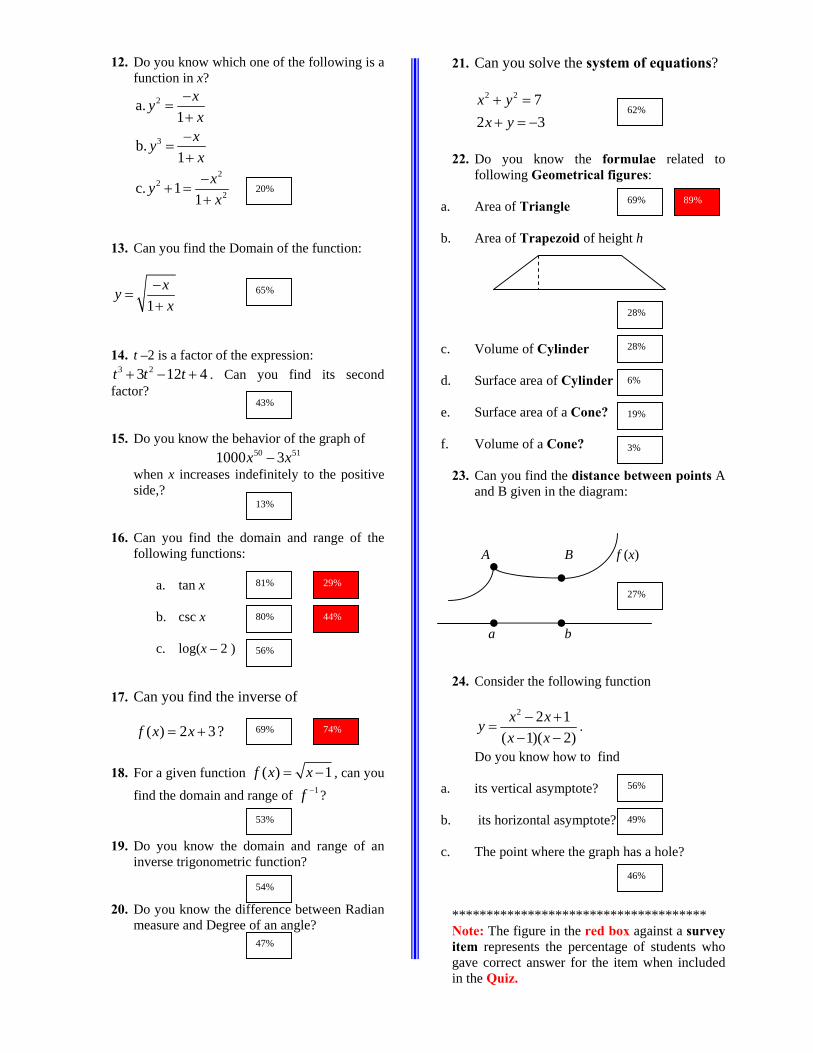
12. Do you know which one of the following is a function in x?
2
3
22
2
a.1
b.1
c. 11
xyx
xyx
xyx
−=
+−
=+−
+ =+
13. Can you find the Domain of the function:
1xyx
−=
+
14. t –2 is a factor of the expression: 3 23 12 4t t t+ − + . Can you find its second
factor? 15. Do you know the behavior of the graph of
50 511000 3x x− when x increases indefinitely to the positive side,?
16. Can you find the domain and range of the
following functions:
a. tan x b. csc x
c. log(x – 2 )
17. Can you find the inverse of
( ) 2 3f x x= + ?
18. For a given function ( ) 1f x x= − , can you
find the domain and range of 1f − ?
19. Do you know the domain and range of an inverse trigonometric function?
20. Do you know the difference between Radian
measure and Degree of an angle?
21. Can you solve the system of equations?
2 2 7
2 3x y
x y+ =+ = −
22. Do you know the formulae related to following Geometrical figures:
a. Area of Triangle
b. Area of Trapezoid of height h c. Volume of Cylinder
d. Surface area of Cylinder
e. Surface area of a Cone?
f. Volume of a Cone?
23. Can you find the distance between points A and B given in the diagram:
A B f (x)
a b 24. Consider the following function
2 2 1
( 1)( 2)x xyx x
− +=
− −.
Do you know how to find
a. its vertical asymptote?
b. its horizontal asymptote?
c. The point where the graph has a hole?
************************************* Note: The figure in the red box against a survey item represents the percentage of students who gave correct answer for the item when included in the Quiz.
20%
65%
43%
13%
81%
47%
80%
56%
53%
54%
69%
62%
69%
28%
28%
6%
19%
3%
46%
49%
56%
27% 29%
44%
74%
89%
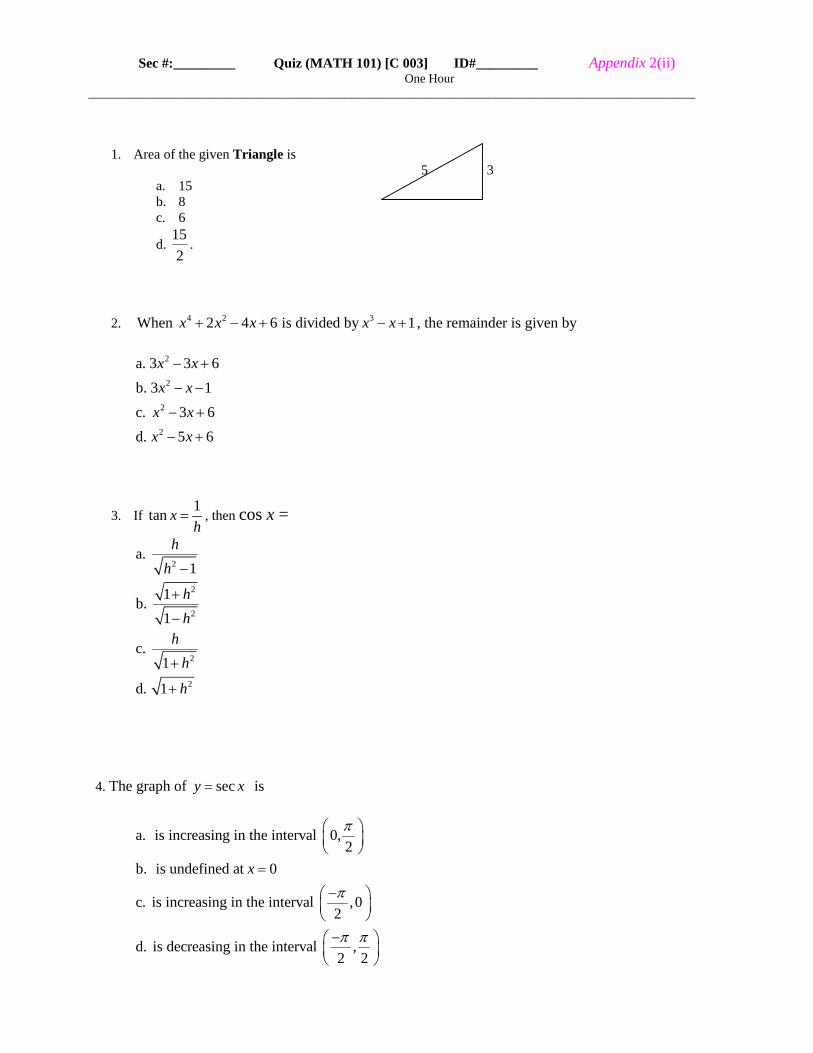
Sec #:_________ Quiz (MATH 101) [C 003] ID#_________ Appendix 2(ii) One Hour
_________________________________________________________________________________________________
1. Area of the given Triangle is 5 3
a. 15 b. 8 c. 6
d. 152
.
2. When 4 2 32 4 6 is divided by 1x x x x x+ − + − + , the remainder is given by
2
2
2
2
a. 3 3 6b. 3 1c. 3 6d. 5 6
x xx x
x xx x
− +
− −
− +
− +
3. If 1tan xh
= , then cos x =
2
2
2
2
2
a. 1
1b. 1
c. 1
d. 1
hh
hh
hh
h
−
+
−
+
+
4. The graph of secy x= is
a. is increasing in the interval 0,2
b. is undefined at 0
c. is increasing in the interval ,02
d. is decreasing in the interval ,2 2
x
π
π
π π
⎛ ⎞⎜ ⎟⎝ ⎠
=
−⎛ ⎞⎜ ⎟⎝ ⎠−⎛ ⎞
⎜ ⎟⎝ ⎠
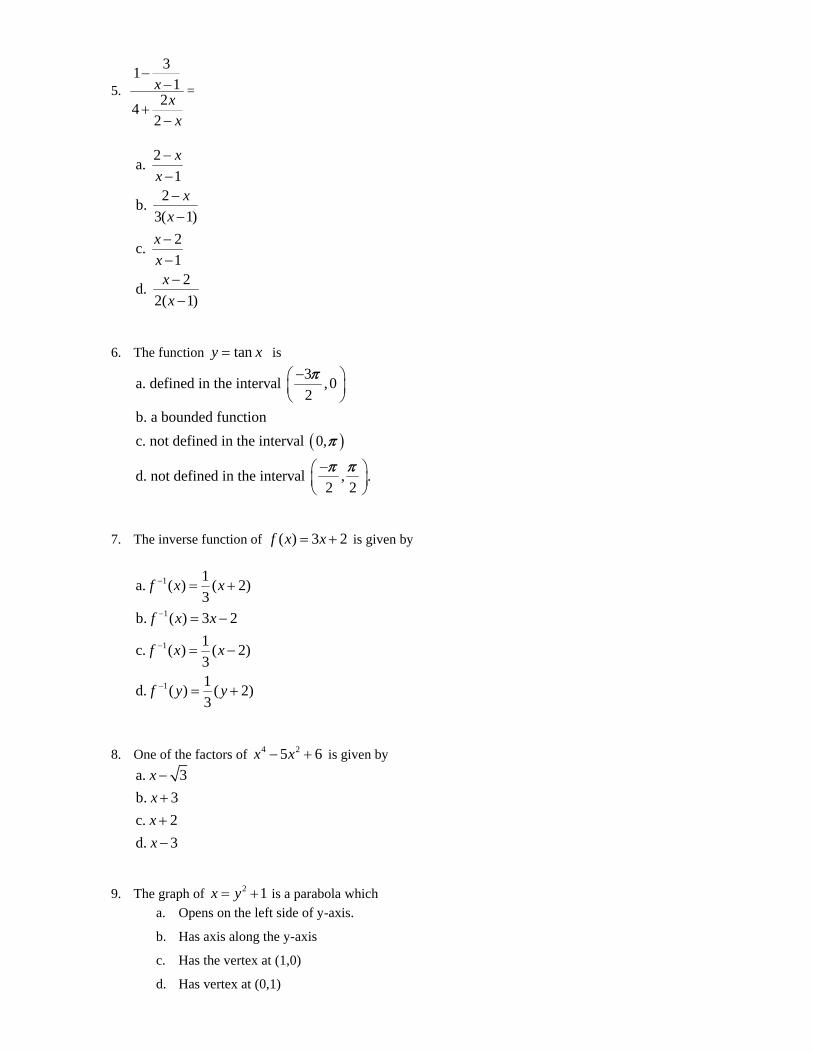
5.
311
242
xxx
−−
+−
=
2a.
12b.
3( 1)2c. 1
2d. 2( 1)
xx
xx
xxxx
−−−−
−−−−
6. The function tany x= is
( )
3a. defined in the interval ,02
b. a bounded functionc. not defined in the interval 0,
d. not defined in the interval , .2 2
−⎛ ⎞⎜ ⎟⎝ ⎠
−⎛ ⎞⎜ ⎟⎝ ⎠
π
π
π π
7. The inverse function of ( ) 3 2f x x= + is given by
1
1
1
1
1a. ( ) ( 2)3
b. ( ) 3 21c. ( ) ( 2)31d. ( ) ( 2)3
f x x
f x x
f x x
f y y
−
−
−
−
= +
= −
= −
= +
8. One of the factors of 4 25 6x x− + is given by a. 3b. 3c. 2d. 3
xxxx
−++−
9. The graph of 2 1x y= + is a parabola which a. Opens on the left side of y-axis.
b. Has axis along the y-axis
c. Has the vertex at (1,0)
d. Has vertex at (0,1)
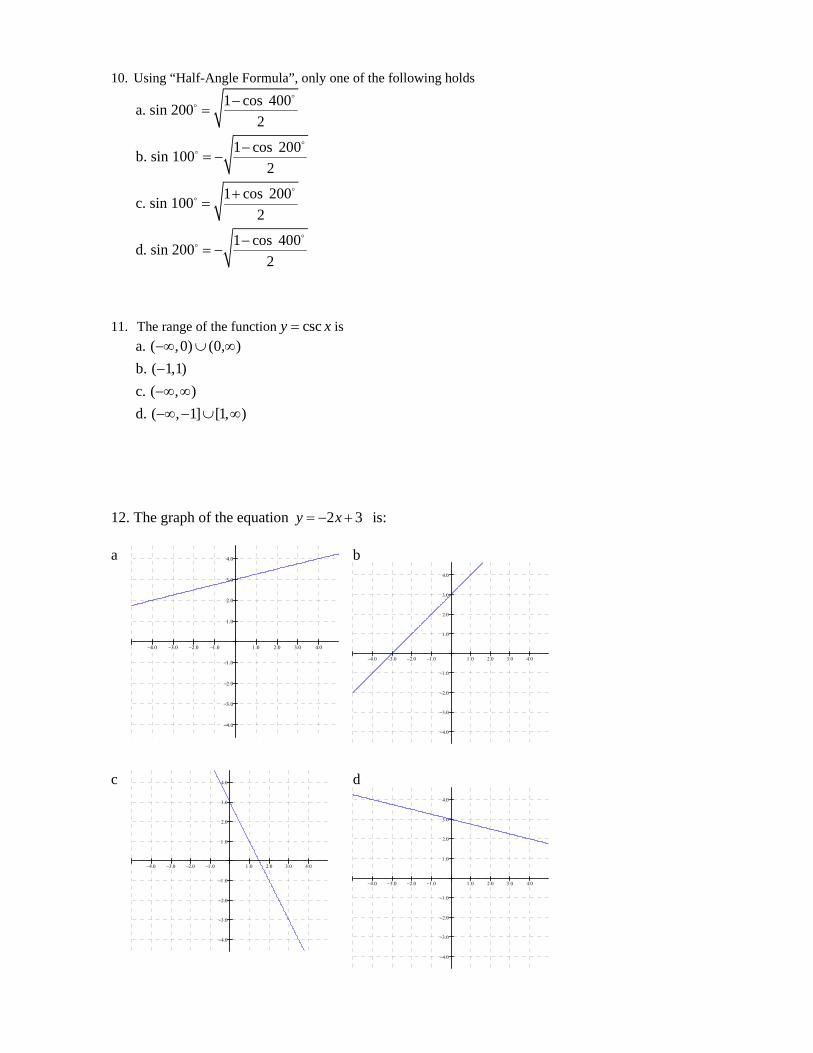
10. Using “Half-Angle Formula”, only one of the following holds
1 cos 400a. sin 2002
1 cos 200b. sin 1002
1 cos 200c. sin 1002
1 cos 400d. sin 2002
−=
−= −
+=
−= −
11. The range of the function cscy x= is
a. ( ,0) (0, )b. ( 1,1)c. ( , )d. ( , 1] [1, )
−∞ ∪ ∞−−∞ ∞−∞ − ∪ ∞
12. The graph of the equation 2 3y x= − + is: a
−4.0 −3.0 −2.0 −1.0 1.0 2.0 3.0 4.0
−4.0
−3.0
−2.0
−1.0
1.0
2.0
3.0
4.0
b
−4.0 −3.0 −2.0 −1.0 1.0 2.0 3.0 4.0
−4.0
−3.0
−2.0
−1.0
1.0
2.0
3.0
4.0
c
−4.0 −3.0 −2.0 −1.0 1.0 2.0 3.0 4.0
−4.0
−3.0
−2.0
−1.0
1.0
2.0
3.0
4.0
d
−4.0 −3.0 −2.0 −1.0 1.0 2.0 3.0 4.0
−4.0
−3.0
−2.0
−1.0
1.0
2.0
3.0
4.0
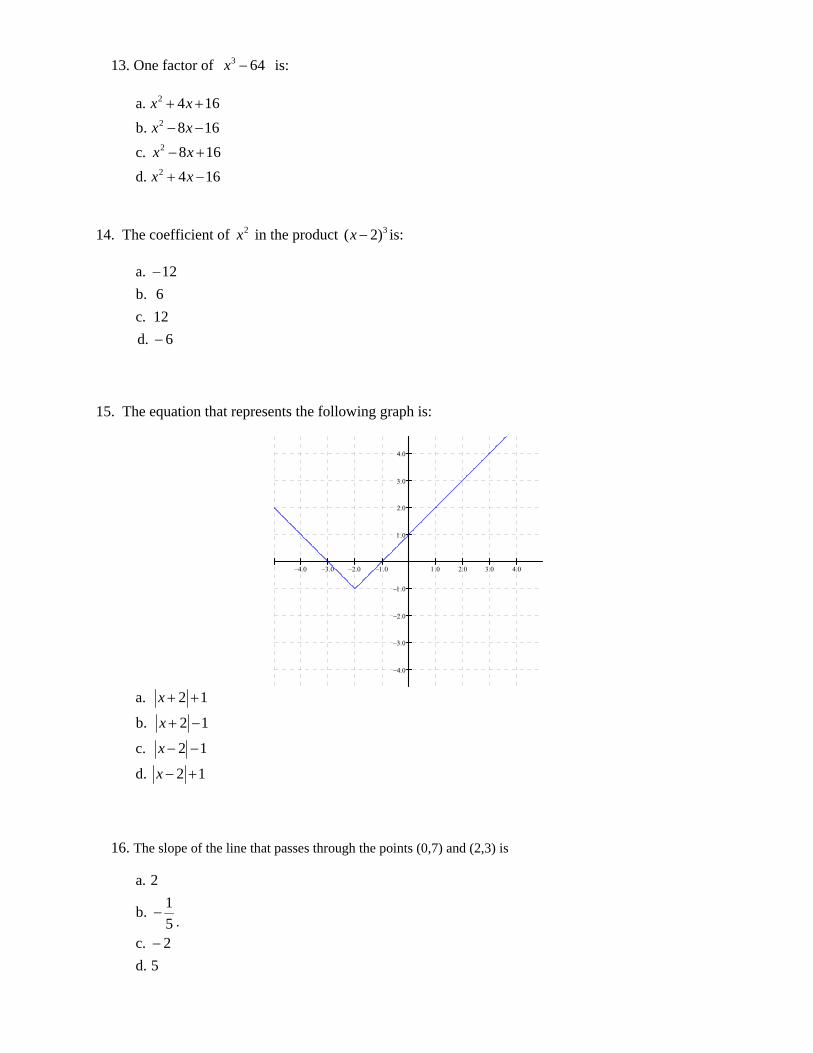
13. One factor of 3 64x − is:
2
2
2
2
a. 4 16b. 8 16c. 8 16d. 4 16
x xx xx xx x
+ +
− −
− +
+ −
14. The coefficient of 2x in the product 3( 2)x − is:
a. 12b. 6c. 12d. 6
−
−
15. The equation that represents the following graph is:
−4.0 −3.0 −2.0 −1.0 1.0 2.0 3.0 4.0
−4.0
−3.0
−2.0
−1.0
1.0
2.0
3.0
4.0
a. 2 1
b. 2 1
c. 2 1
d. 2 1
x
x
x
x
+ +
+ −
− −
− +
16. The slope of the line that passes through the points (0,7) and (2,3) is
a. 21b. 5
c. 2d. 5
−
−.
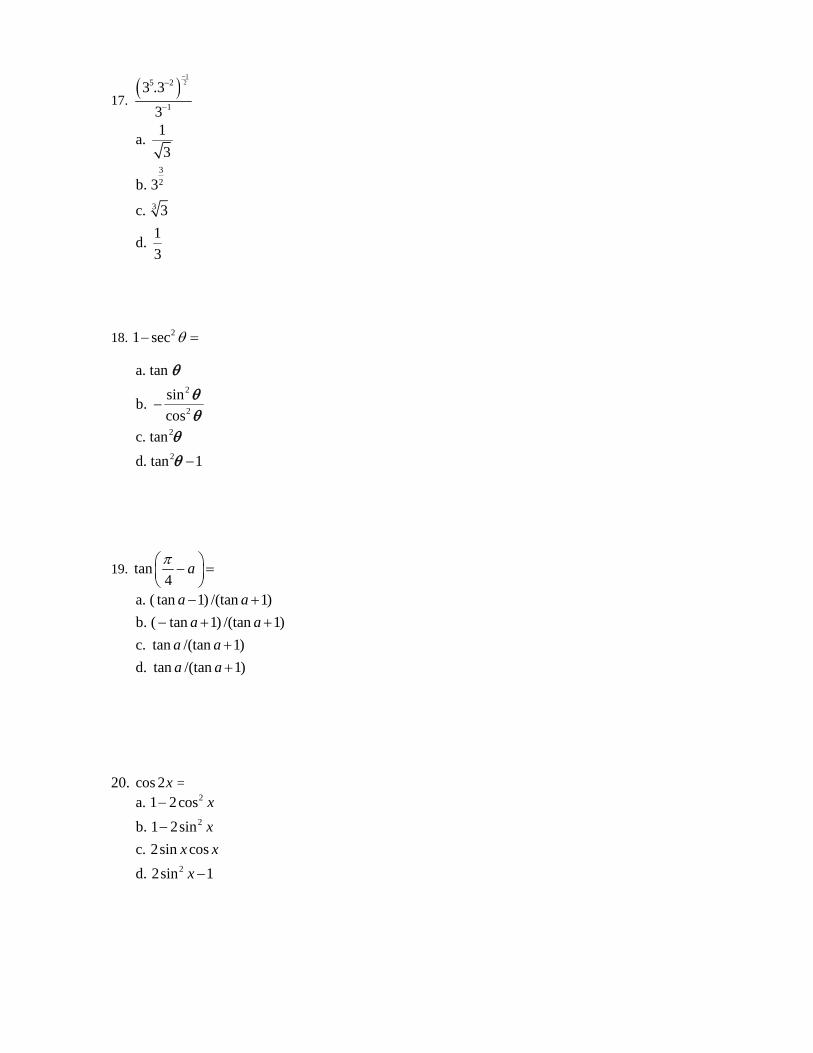
17. ( )
125 2
1
3 .33
−−
−
32
3
1a. 3
b. 3
c. 31d. 3
18. 21 sec− =θ
2
2
2
2
a. tan sinb. cos
c. tand. tan 1
−
−
θ
θθ
θ
θ
19. tan4
aπ⎛ ⎞− =⎜ ⎟⎝ ⎠
a. ( tan 1) /(tan 1)b. ( tan 1) /(tan 1)c. tan /(tan 1)d. tan /(tan 1)
a aa a
a aa a
− +− + +
++
20. cos 2x = 2
2
2
a. 1 2cosb. 1 2sinc. 2sin cosd. 2sin 1
xx
x xx
−
−
−

Analysis of Survey II & Midterm Exam (MATH 101-052) Appendix 2(iii) داخل √الرجاء قراءة آل سؤال بعناية ثم ضع علامة . Math 101الأسئلة الآتية متعلقة بمفاهيم سابقة تحتاجها في دراسة مادة الرياضيات
، و إذا آنت تعتقد أنه لا يمكنك حل السؤال فاترك المربع فارغاً هكذا )لا تحاول حل السؤال(حله المربع المقابل له إذا آنت تعتقد أن بإمكانك Participated in: Survey Midterm Exam
1. Do you know about
i. lim ( )x a
f x L→
= ?
ii. lim ( )x a
f x→
= ∞ ?
iii. lim ( )x
f x L→−∞
= ?
iv. one-sided limit?
v. relationship between one-sided and two
sided limit?
vi. Squeezing Theorem?
2. Do you know how to find following limits:
a. ( )lim 1x
x x x→∞
− −
b. 23
3lim5 6x
xx x→
−− +
.
c. 2
2
8 3 11lim5 3 7x
x xx x→∞
− −− +
d. 1lim tanx
x−
→−∞
e. 0
sin 3limx
xx→
=
f. 3
3
27lim3x
xx→
−−
g. 2 3lim (6 5 8)x
x x→−∞
− −
3. Do you know how to apply ( )ε δ− -definition of limit to show that
1lim(3 1) 4x
x→−
− = − ?
4. Do you know
i. how to show a function ( )f x is continuous at a point a?
ii. when is a rational function continuous at
a point a?
iii. under what condition can we write lim ( ( )) (lim ( ))x a x a
f g x f g x→ →
= ?
iv. when is a function continuous at an end
point of interval [a,b] ?
v. about removable discontinuity?
vi. about slope of tangent line to the graph of a function f (x) at a point a?
vii. equation of the tangent line to the
graph of siny x= at 6π
?
viii. about instantaneous velocity?
ix. about average and instantaneous rate of change?
x. the definition of derivative of a function?
xi. Left hand and right hand derivatives?
xii. Function with infinite slope at a point?
xiii. Function with corner point at a point?
xiv. Higher derivatives?
xv. Product rule for derivatives?
xvi. Quotient rule for derivatives, e.g.
1d xdx x
⎛ ⎞⎜ ⎟+⎝ ⎠
?
99
92
88
91
80
54
47
92
88
42
84
100
83
62
90
57
38
69
47
73
61
81
77
78
53
32
51
87
86
88
93 109
96
83.1
94.1
81.5
44.4
71.7
75.8
70

xvii. Formulas for derivative of Trigonometric functions?
xviii. Chain rule for derivatives
e.g. 2 8sin( 3)d xdx
−− ?
xix. the Related rates?
xx. Use of chain rule in Related rates?
5. Do you know how to find the derivatives of the following functions using the definition? i. ( )f x x=
ii. ( ) sinf x x=
6. Do you know about i. Local linear approximation (L. L. A.) of a
function at a point?
ii. Using L. L. A. to approximate numbers like 84.001,sin 31 , (10.03) ?
iii. Differential of a function?
iv. Differential form of L. L. A.?
v. Approximation of error using differentials?
vi. Relative error?
vii. Percentage error?
7. Do you know the formula for finding
i. Area of triangle?
ii. Area of circle?
iii. Area of circular sector?
iv. Volume of sphere?
v. Surface area of sphere?
vi. Volume of cone?
vii. Surface area of cone?
viii. Relation between x, y, u, v in the
following diagram (Similar Triangles)?
v
u y
x
8. Can you sketch the graphs of following functions?
a. 2 3y x= −
b. 2y x= +
c. 2y x=
d. 2 5 6y x x= − +
e. 3 6y x= −
f. 1y x= −
9. Word problems
a. I can solve with some effort
If your answer for 9 (a) is no, go to question 9(b).
b. I cannot solve because of difficulty in
i. English Language
ii. Sketching the Diagram
iii. Geometrical Formulas
iv. Identifying the variables
v. finding the relationship in variables
94
81
44
47
88
84
65
49
44
34
47
66
68
91
87
39
55
31
49
26
69
90
87
95
46
54
53
55
49
26
33
24
47
61.164.2
64.6
45.3
75.1
87.2
King Fahd Univesity of Petroleum & Minerals Appendix 2(iv) Department of Mathematical Sciences
MATH 101-051 (Midterm Exam)
(November 27, 2005)
Name:____________________________ ID:_____________ Sec. #:_____ Serial #________
Time: 90 minutes Max Points: 100
Show all necessary work
No calculator is allowed in the exam.
Points: ________/100
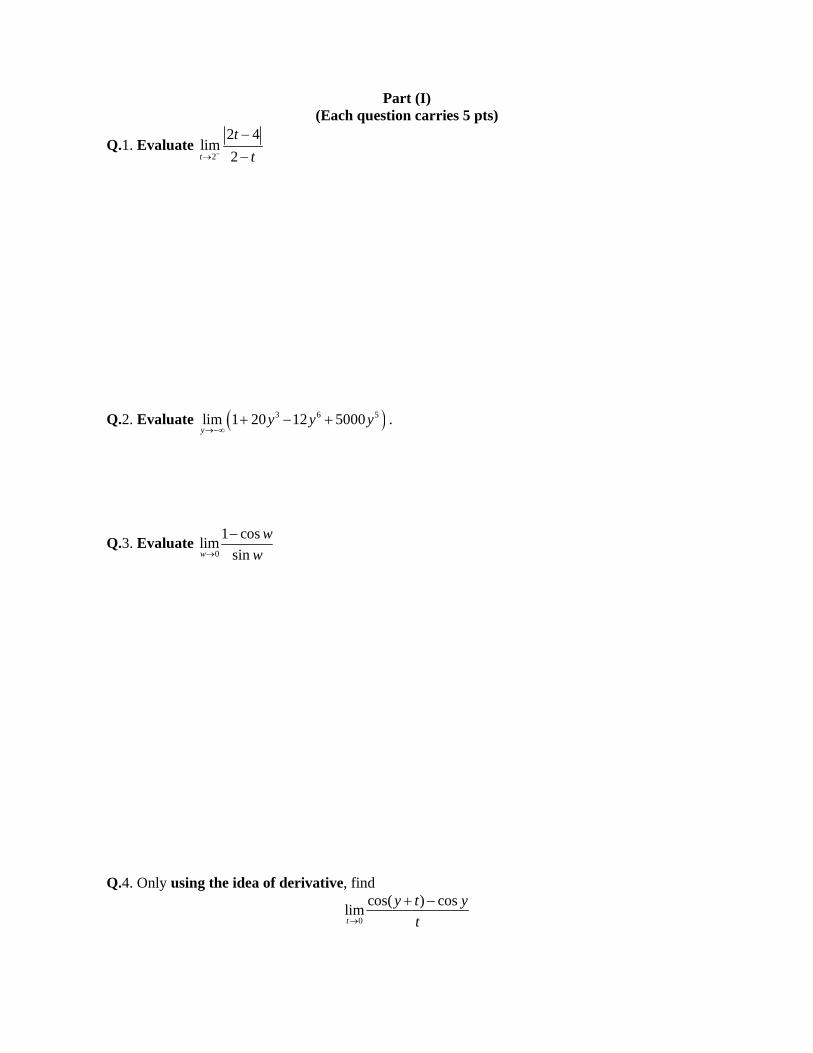
Part (I)
(Each question carries 5 pts)
Q.1. Evaluate 2
2 4lim
2t
tt−→
−−
Q.2. Evaluate ( )3 6 5lim 1 20 12 5000
yy y y
→−∞+ − + .
Q.3. Evaluate 0
1 coslimsinw
ww→
−
Q.4. Only using the idea of derivative, find
0
cos( ) coslimt
y t yt→
+ −
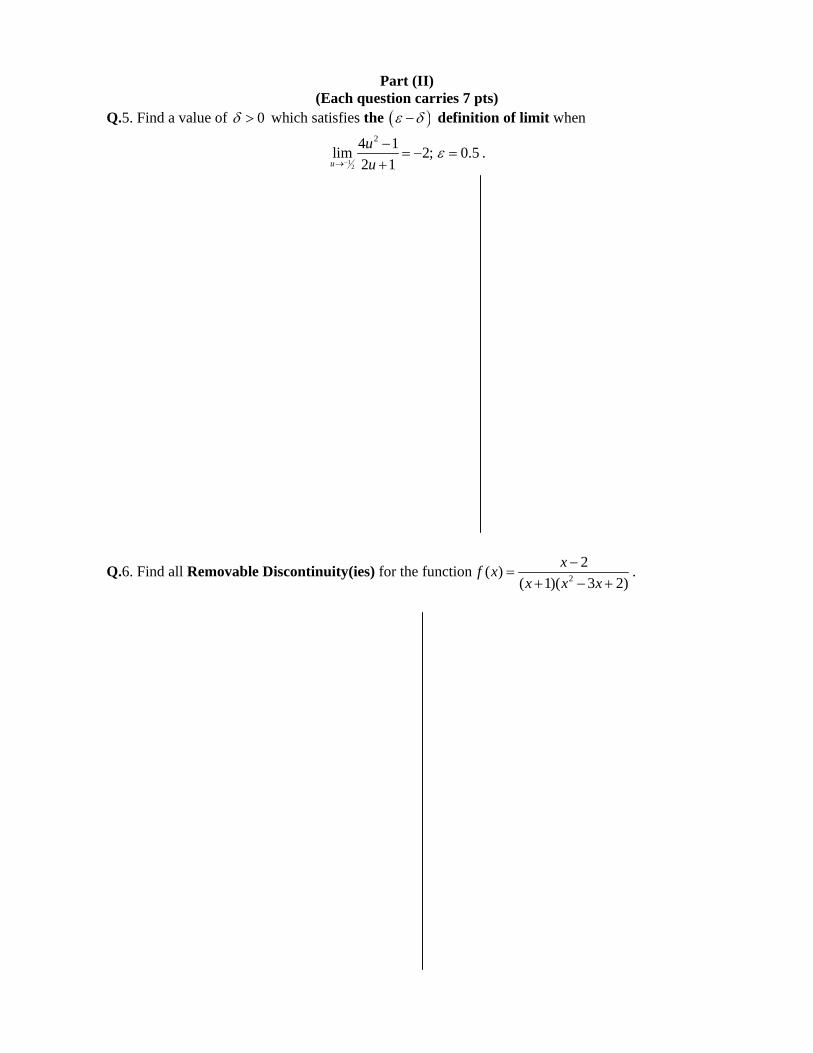
Part (II) (Each question carries 7 pts)
Q.5. Find a value of 0δ > which satisfies the ( )ε δ− definition of limit when
12
24 1lim 2; 0.52 1u
uu
ε−→
−= − =
+.
Q.6. Find all Removable Discontinuity(ies) for the function 2
2( )( 1)( 3 2)
xf xx x x
−=
+ − +.
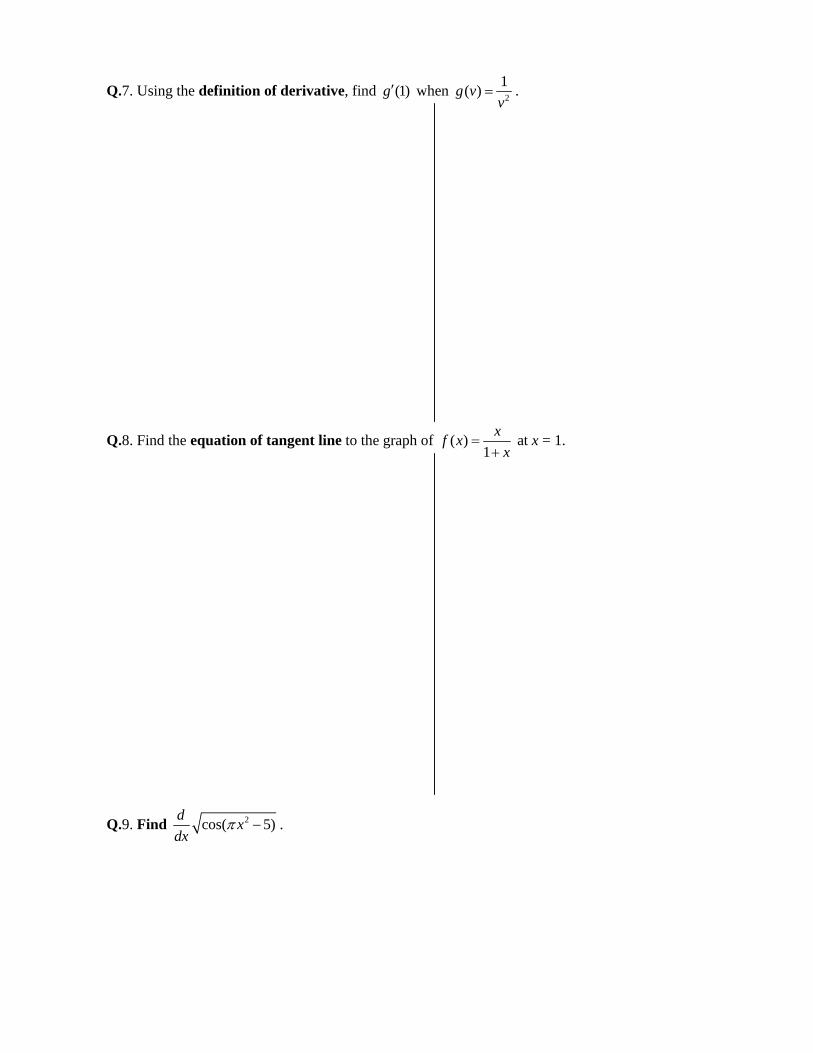
Q.7. Using the definition of derivative, find (1)g′ when 2
1( )g vv
= .
Q.8. Find the equation of tangent line to the graph of ( )1
xf xx
=+
at x = 1.
Q.9. Find 2cos( 5)d xdx
π − .

Q.10. A particle is moving along a straight line such that its position is given by 2( ) 5 5s t t t= − + . a) Find the average velocity of the particle in the time interval [1,3]. b) The instantaneous velocity of the particle at t=2.
Q.11. Let l be the length of the diagonal of a Rectangle. Suppose that Sides of the Rectangle have
lengths x and y. Assume that x and y are changing with time t. a) Draw a Picture of the Rectangle with the labels x, y and l.
b) How are x, y and l related?
c) How are dx/dt, dy/dt and dl/dt related?
d) As x increases at a constant rate of ½ ft/s and y decreases at a constant rate of ¼ ft/s, how fast is the size of Diagonal changing when x = 3 ft and y = 4 ft.
e) Is the length of Diagonal Increasing or Decreasing at that instant? Give Reason.
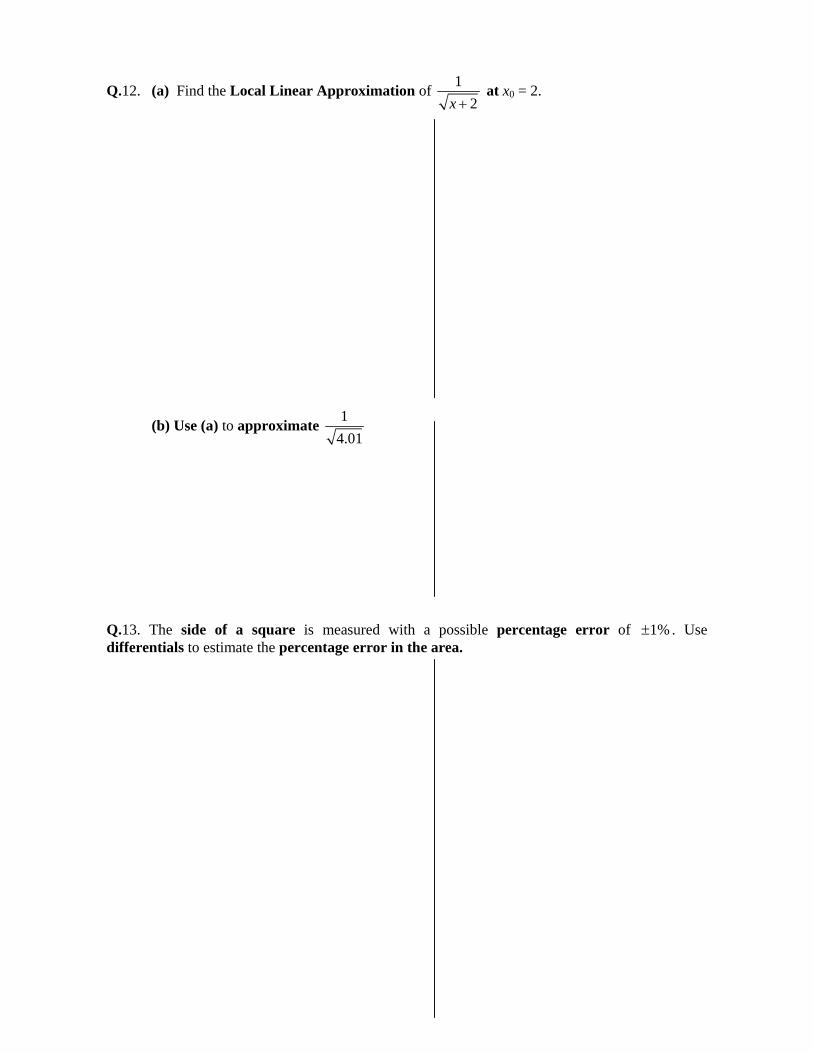
Q.12. (a) Find the Local Linear Approximation of 12x +
at x0 = 2.
(b) Use (a) to approximate 14.01
Q.13. The side of a square is measured with a possible percentage error of 1%± . Use differentials to estimate the percentage error in the area.
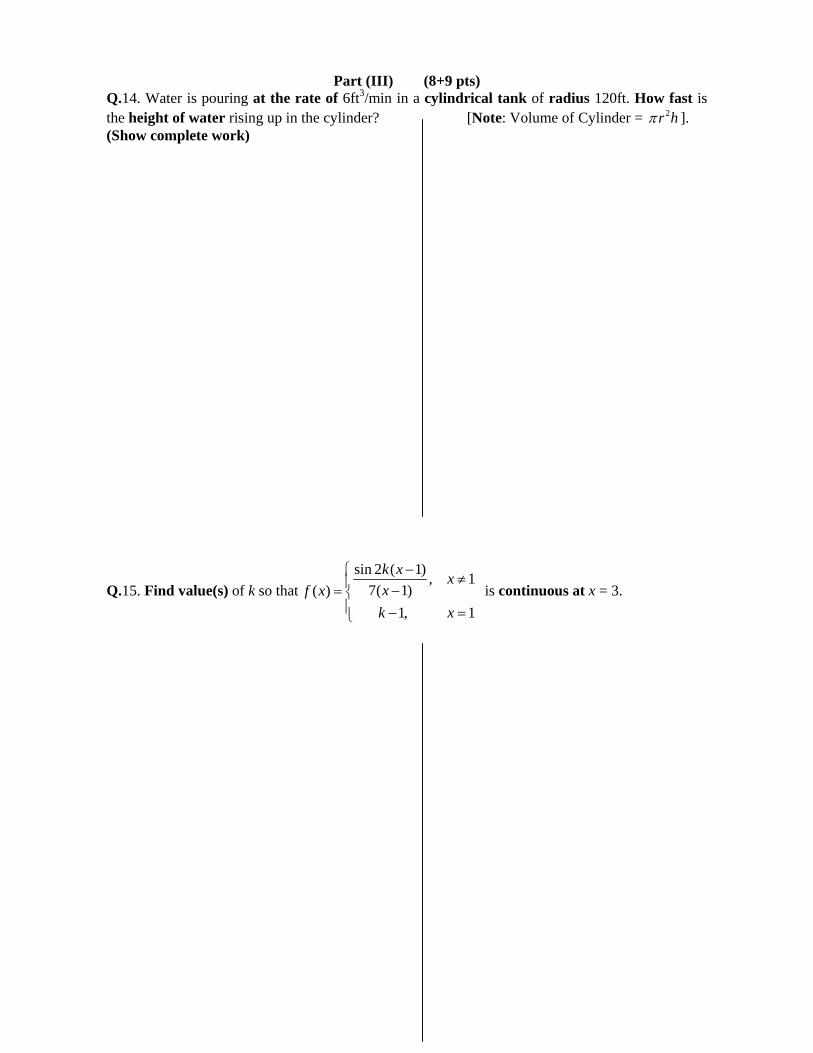
Part (III) (8+9 pts) Q.14. Water is pouring at the rate of 6ft3/min in a cylindrical tank of radius 120ft. How fast is the height of water rising up in the cylinder? [Note: Volume of Cylinder = 2r hπ ]. (Show complete work)
Q.15. Find value(s) of k so thatsin 2 ( 1) , 1
7( 1) ( )1, 1
k x xxf x
k x
−⎧ ≠⎪ −= ⎨⎪ − =⎩
is continuous at x = 3.
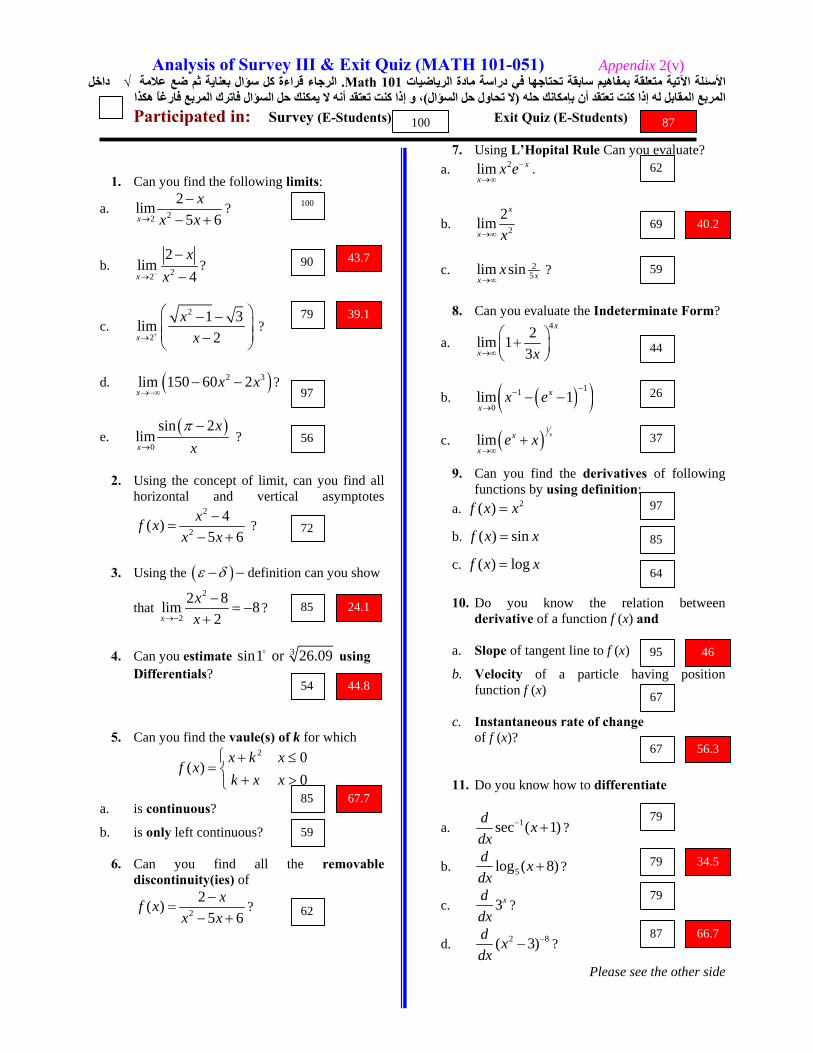
Analysis of Survey III & Exit Quiz (MATH 101-051) Appendix 2(v) داخل √الرجاء قراءة آل سؤال بعناية ثم ضع علامة . Math 101الأسئلة الآتية متعلقة بمفاهيم سابقة تحتاجها في دراسة مادة الرياضيات
، و إذا آنت تعتقد أنه لا يمكنك حل السؤال فاترك المربع فارغاً هكذا )حل السؤاللا تحاول (المربع المقابل له إذا آنت تعتقد أن بإمكانك حله Participated in: Survey (E-Students) Exit Quiz (E-Students)
1. Can you find the following limits:
a. 22
2lim5 6x
xx x→
−− +
?
b. 22
2lim
4x
xx−→
−−
?
c. 2
2
1 3lim2x
xx+→
⎛ ⎞− −⎜ ⎟⎜ ⎟−⎝ ⎠
?
d. ( )2 3lim 150 60 2x
x x→−∞
− − ?
e. ( )
0
sin 2limx
xxπ
→
− ?
2. Using the concept of limit, can you find all horizontal and vertical asymptotes
2
2
4( )5 6
xf xx x
−=
− + ?
3. Using the ( )ε δ− − definition can you show
that 2
2
2 8lim 82x
xx→−
−= −
+?
4. Can you estimate 3sin1 or 26.09 using
Differentials?
5. Can you find the vaule(s) of k for which 2 0
( )0
x k xf x
k x x⎧ + ≤
= ⎨+ >⎩
a. is continuous?
b. is only left continuous?
6. Can you find all the removable discontinuity(ies) of
2
2( )5 6
xf xx x
−=
− +?
7. Using L’Hopital Rule Can you evaluate? a. 2lim x
xx e−
→∞.
b. 2
2limx
x x→∞
c. 25lim sin xx
x→∞
?
8. Can you evaluate the Indeterminate Form?
a. 42lim 1
3
x
x x→∞
⎛ ⎞+⎜ ⎟⎝ ⎠
b. ( )( )11
0lim 1x
xx e
−−
→− −
c. ( )1
lim xx
xe x
→∞+
9. Can you find the derivatives of following functions by using definition:
a. 2( )f x x=
b. ( ) sinf x x=
c. ( ) logf x x=
10. Do you know the relation between
derivative of a function f (x) and a. Slope of tangent line to f (x)
b. Velocity of a particle having position function f (x)
c. Instantaneous rate of change
of f (x)?
11. Do you know how to differentiate
a. 1sec ( 1)d xdx
− + ?
b. 5log ( 8)d xdx
+ ?
c. 3xddx
?
d. 2 8( 3)d xdx
−− ?
Please see the other side
100
90
100 87
79
97
56
72
85
54
85
59
62
62
69
59
44
26
37
97
85
64
95
67
67
79
79
79
87
43.7
39.1
24.1
44.8
67.7
40.2
46
67.7
46
56.3
34.5
66.7
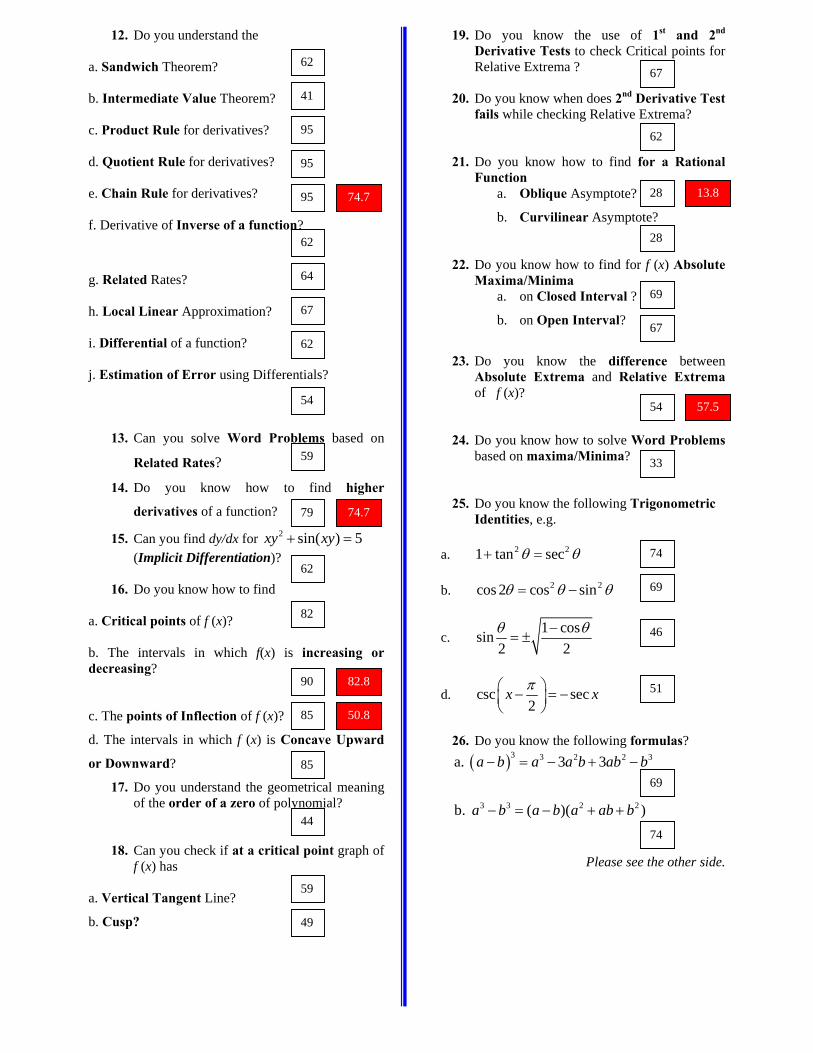
12. Do you understand the
a. Sandwich Theorem?
b. Intermediate Value Theorem?
c. Product Rule for derivatives?
d. Quotient Rule for derivatives?
e. Chain Rule for derivatives?
f. Derivative of Inverse of a function?
g. Related Rates?
h. Local Linear Approximation?
i. Differential of a function?
j. Estimation of Error using Differentials?
13. Can you solve Word Problems based on
Related Rates?
14. Do you know how to find higher
derivatives of a function?
15. Can you find dy/dx for 2 sin( ) 5xy xy+ = (Implicit Differentiation)?
16. Do you know how to find
a. Critical points of f (x)?
b. The intervals in which f(x) is increasing or decreasing? c. The points of Inflection of f (x)?
d. The intervals in which f (x) is Concave Upward
or Downward?
17. Do you understand the geometrical meaning of the order of a zero of polynomial?
18. Can you check if at a critical point graph of
f (x) has a. Vertical Tangent Line?
b. Cusp?
19. Do you know the use of 1st and 2nd Derivative Tests to check Critical points for Relative Extrema ?
20. Do you know when does 2nd Derivative Test
fails while checking Relative Extrema?
21. Do you know how to find for a Rational
Function a. Oblique Asymptote?
b. Curvilinear Asymptote?
22. Do you know how to find for f (x) Absolute Maxima/Minima
a. on Closed Interval ?
b. on Open Interval?
23. Do you know the difference between Absolute Extrema and Relative Extrema of f (x)?
24. Do you know how to solve Word Problems
based on maxima/Minima? 25. Do you know the following Trigonometric
Identities, e.g.
a. 2 21 tan sec+ =θ θ
b. 2 2cos 2 cos sin= −θ θ θ
c. 1 cossin
2 2−
= ±θ θ
d. csc sec2
x x⎛ ⎞− = −⎜ ⎟⎝ ⎠
π
26. Do you know the following formulas?
( )3 3 2 2 3
3 3 2 2
a. 3 3
b. ( )( )
a b a a b ab b
a b a b a ab b
− = − + −
− = − + +
Please see the other side.
62
41
95
95
95
64
67
62
54
62
59
79
62
82
90
85
85
44
59
49
67
62
28
28
69
67
54
33
74
69
46
51
74
69
74.7
74.7
82.8
50.8
13.8
57.5
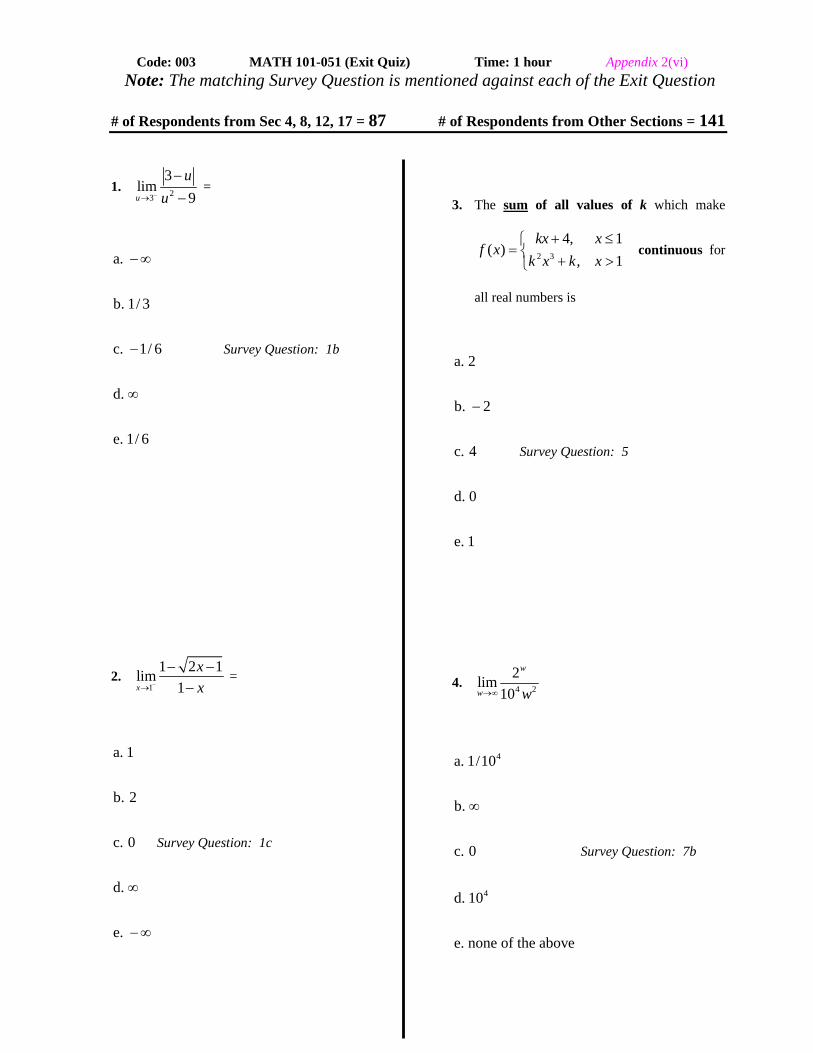
Code: 003 MATH 101-051 (Exit Quiz) Time: 1 hour Appendix 2(vi) Note: The matching Survey Question is mentioned against each of the Exit Question
# of Respondents from Sec 4, 8, 12, 17 = 87 # of Respondents from Other Sections = 141
1. 23
3lim
9u
uu−→
−−
=
a.
b. 1/ 3
c. 1/ 6
d.
e. 1/ 6
−∞
−
∞
Survey Question: 1b
2. 1
1 2 1lim1x
xx−→
− −−
=
a. 1
b. 2
c. 0
d.
e.
∞
−∞
Survey Question: 1c
3. The sum of all values of k which make
2 3
4, 1( )
, 1kx x
f xk x k x
+ ≤⎧= ⎨ + >⎩
continuous for
all real numbers is
a. 2
b. 2
c. 4
d. 0
e. 1
−
Survey Question: 5
4. 4 2
2lim10
w
w w→∞
4
4
a. 1/10
b.
c. 0
d. 10
e. none of the above
∞
Survey Question: 7b
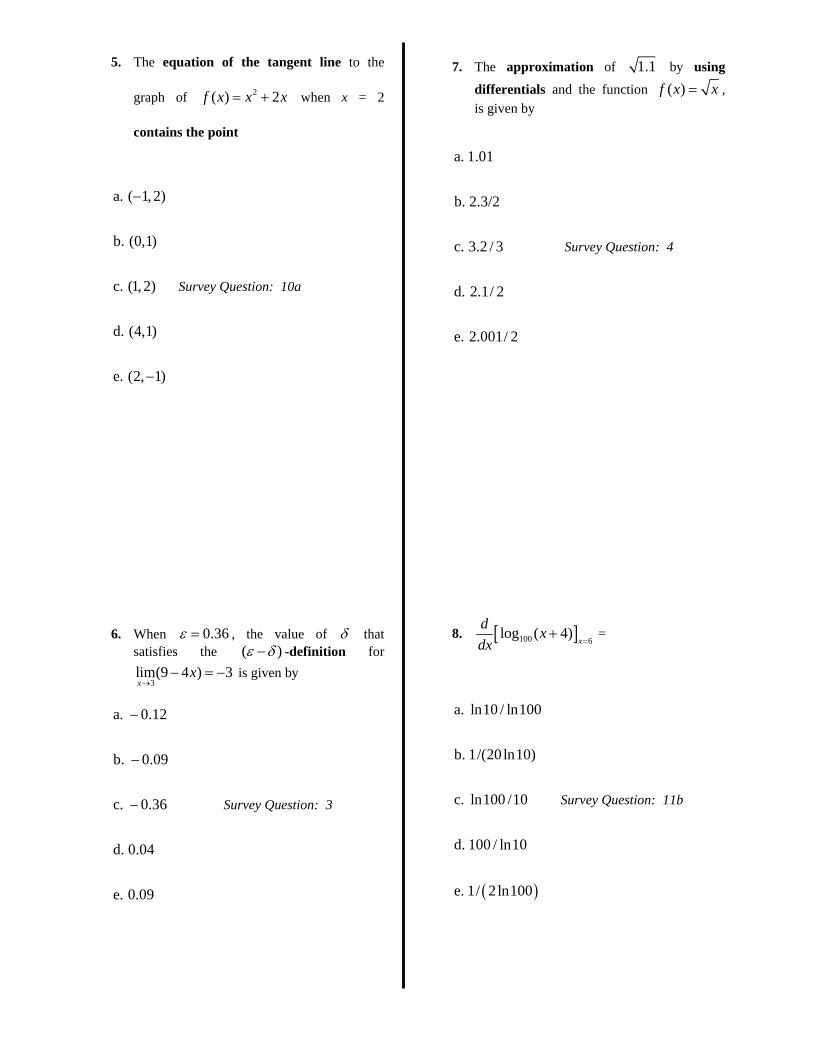
5. The equation of the tangent line to the
graph of 2( ) 2f x x x= + when x = 2
contains the point
a. ( 1, 2)
b. (0,1)
c. (1,2)
d. (4,1)
e. (2, 1)
−
−
Survey Question: 10a
6. When 0.36ε = , the value of δ that satisfies the ( )ε δ− -definition for
3lim(9 4 ) 3x
x→
− = − is given by
a. 0.12
b. 0.09
c. 0.36
d. 0.04
e. 0.09
−
−
− Survey Question: 3
7. The approximation of 1.1 by using
differentials and the function ( )f x x= , is given by
a. 1.01
b. 2.3/2
c. 3.2 / 3
d. 2.1/ 2
e. 2.001/ 2
Survey Question: 4
8. [ ]100 6log ( 4)
x
d xdx =
+ =
( )
a. ln10 / ln100
b. 1/(20 ln10)
c. ln100 /10
d. 100 / ln10
e. 1/ 2 ln100
Survey Question: 11b
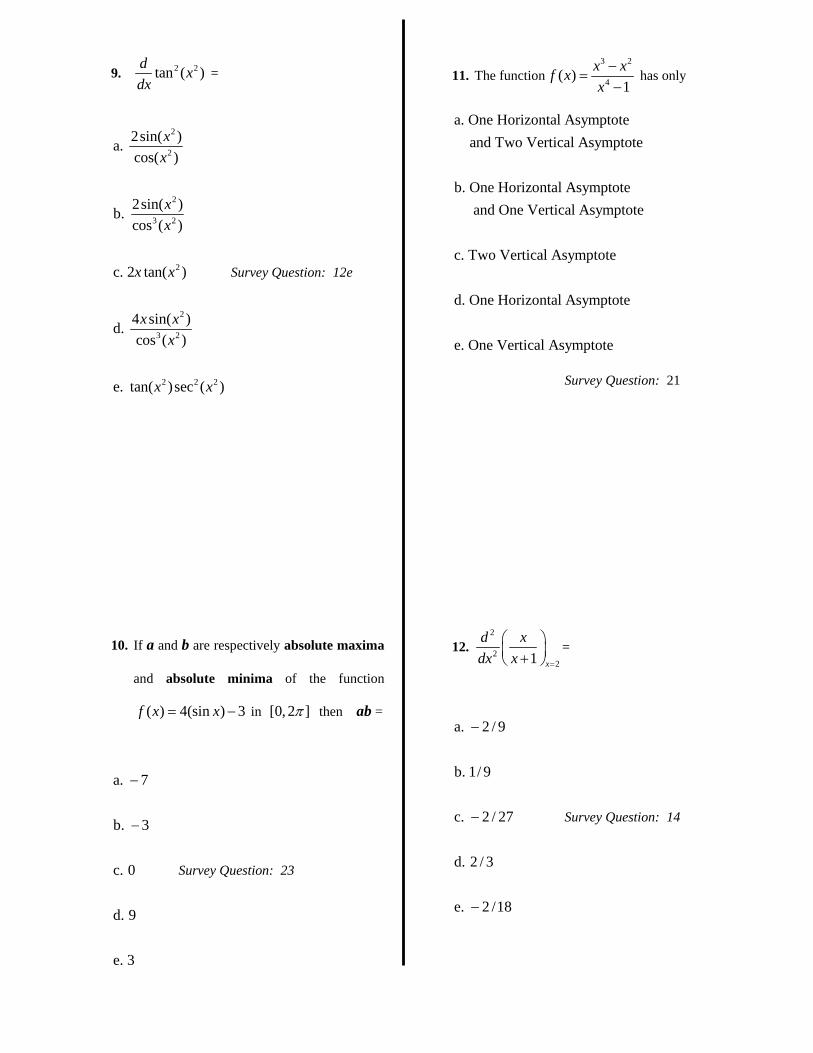
9. 2 2tan ( )d xdx
=
2
2
2
3 2
2
2
3 2
2 2 2
2sin( )a. cos( )
2sin( )b. cos ( )
c. 2 tan( )
4 sin( )d. cos ( )
e. tan( )sec ( )
xx
xx
x x
x xx
x x
Survey Question: 12e
10. If a and b are respectively absolute maxima
and absolute minima of the function
( ) 4(sin ) 3f x x= − in [0, 2 ]π then ab =
a. 7
b. 3
c. 0
d. 9
e. 3
−
−
Survey Question: 23
11. The function3 2
4( )1
x xf xx−
=−
has only
a. One Horizontal Asymptote and Two Vertical Asymptote
b. One Horizontal Asymptote and One Vertical Asymptote
c. Two Vertical Asymptote
d. One Horizontal Asymptote
e. One Vertical Asymptote
Survey Question: 21
12. 2
221 x
d xdx x =
⎛ ⎞⎜ ⎟+⎝ ⎠
=
a. 2 / 9
b. 1/ 9
c. 2 / 27
d. 2 / 3
e. 2 /18
−
−
−
Survey Question: 14

13. If the first derivative of a function f is given
by 2( 1) ( 3)x x x− + , then f is
a. increasing in ( , 3) ( 3,1)
b. decreasing in ( 3,0) (1, )
c. decreasing in ( ,0) (1, )
d. increasing in ( ,1)
e. increasing in ( , 3) (0, )
−∞ − ∪ −
− ∪ ∞
−∞ ∪ ∞
−∞
−∞ − ∪ ∞
Survey Question: 16b
14. 2 3
2
1( 3)
x
ddx x
=
⎡ ⎤⎢ ⎥⎢ − ⎥⎣ ⎦
=
a. 3 / 2
b. 6
c. 2 / 3
d. 3
e. 1/ 6
−
−
−
−
−
Survey Question: 11d
15. If Second Derivative of a function f is given
by 2 2 2( 1)( 2)x x x− + , then f has point of
inflection at (x, y) only when
a. 0, 1, 1, 2
b. 1, 1, 2
c. 0, 2
d. 0, 1, 1
e. 1, 1
x x x x
x x x
x x
x x x
x
= = − = = −
= − = = −
= = −
= = − =
= −
Survey Question: 16 c 16. The instantaneous rate of change in
2
( ) sin at 2
xg x x x ππ
= + = is equal to
a. 14
b. 2
c. 1
d.
e. 1
π
π
π
+
+
Survey Question: 10c
Appendix - III

How to Use Mathematica to solve Some Problems of Mathematics Appendix 3(i)
1. Introduction With the help of Mathematica, we can do i. Arithmatic and Algebraic Manipulations, ii. Solve Different Types of Equations, iii. Sketch Graphs of Functions and Equations.
2. How to Start i. Click on the icon “Mathematica”. ii. Click on the new file. iii. Type your operation iv. Press the keys: &
(We shall call these two keys: [SE] keys)
v. You will find the Answer in the Next Line.
3. Basic Algebra Operations Addition: + Subtration: – Square root: sqrt
Division: / Power: ^ Multiplication: *
(Examples) Example 1. Type: 5+3 outside the Existing Cell
i. Press the [SE] keys. ii. You will get on the screen:
In [1]:= 5+3 Out [1]= 8 Example 2. Type: – 7 ^3 outside Existing Cell
i. Press the [SE] keys. ii. You will get on the screen:
In [2]:= – 7 ^3 Out [2]= – 343 Example 3. Type: 4 + ¼ outside Existing Cell
i. Press the [SE] keys. ii. You will get on the screen:
In [3]:= 4 + ¼
Out [3]= 174
Example 4. Type: 4. + ¼
i. Press the [SE] keys. ii. You will get on the screen:
In [4]:= 4.+1/4 Out [4]= 4.25 [Check the difference between Examples 3 & 4]
Example 5. Type: 2 ^ (1/3) i. Press the [SE] keys. ii. You will get on the screen:
In [5]:= 2 ^ (1/3) Out [5]= 21/3
Example 6. Type: N[2 ^ (1/3)] i. Press the [SE] keys. ii. You will get on the screen: In [6]:= N[2 ^ (1/3)] Out [6]= 1.25992 Example 7. Type: 2 ^ (1/3) //N i. Press the [SE] keys. ii. You will get on the screen: In [7]:= 2 ^ (1/3) //N Out [7]= 1.25992 [Check the difference among Examples 5, 6 & 7]
4. Built in Functions For Type For Type |– 2 | Abs[– 2] e 2 Exp[2]
sin(5 radian) Sin[5] sin -1 (.3) ArcSin[.3]sin(5 Degrees) Sin[5 Degree] sinh(5) Sinh[5] Natural Log
of 5
Log[5] Log of 5 to base 3
Log[3,5]
Try the following Exercises
a. Find cos(30) and cos(30o). Use the methods of Examples 5 & 7. Explain the answers. b. Find ln(7.8), log(15), log4(9), e 8, tan2(12) c. Evaluate: 5-2(82-60)/4 [Ans: 3]
d. Evaluate:31 4(18 4 )9
3 8−
− +
e. Evaluate: 2sin-1(1/3) – cosh2 (4/5).
5. Manipulating Algebraic Expressions Example 1: Find the value of 56 3x− for x=3. Solution: Type: 6 3* ^ 5 / . 3x x− → i. Press the [SE] keys. You will get: In [6]:= 6 3* ^ 5 / . 3x x− → Out [6]= –723 Example 2: Find the value of 2 2x y+ when y=x+1 and x=3. Solution: Type: 2 23; 1;sqrt[ ]x y x x y= = + + Press the [SE] keys.You will get: In [6]:= 2 23; 1;sqrt[ ]x y x x y= = + + Out [6]= 5 Example 3: Expand 5( )x y+ . Solution: Type: Clear[x,y]; Expand[( ) ^ 5]x y+ Press the [SE] keys. You get In [6]:= Clear[x,y]; Expand[( ) ^ 5]x y+ Out [6]= 5 4 3 2 2 3 4 55 10 10 5x xy x y x y xy y+ + + + +
Shift Enter
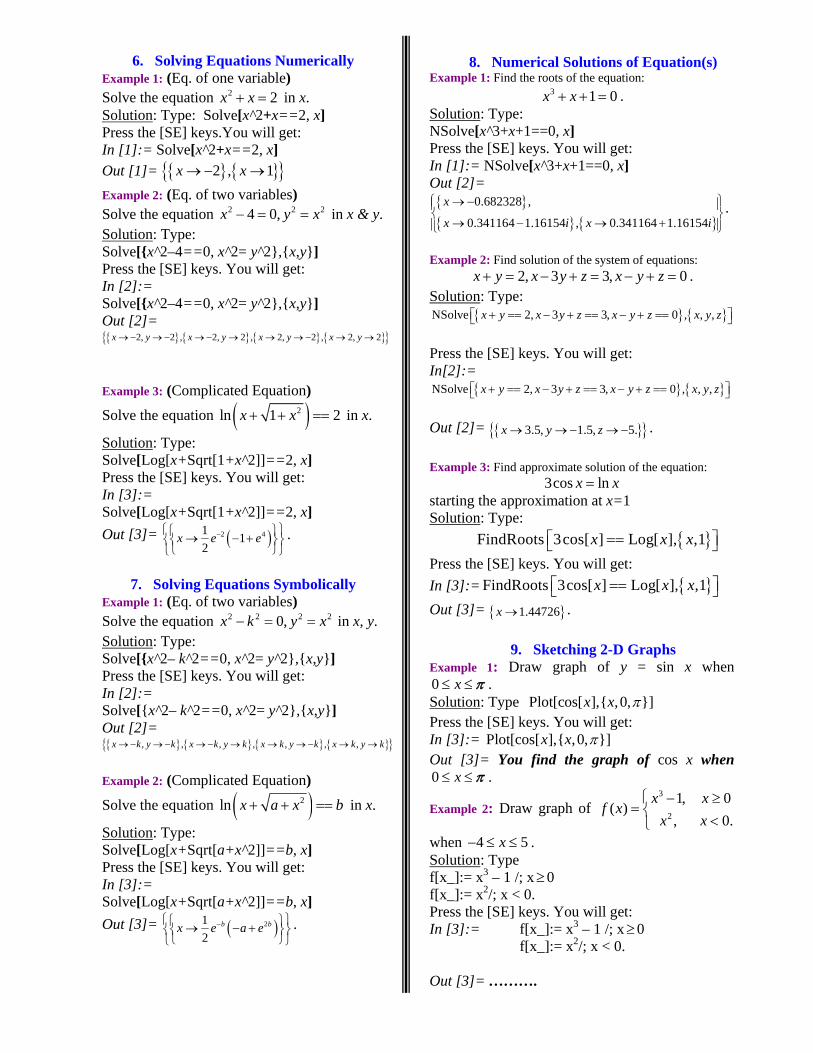
6. Solving Equations Numerically
Example 1: (Eq. of one variable) Solve the equation 2 2x x+ = in x. Solution: Type: Solve[x^2+x==2, x] Press the [SE] keys.You will get: In [1]:= Solve[x^2+x==2, x] Out [1]= { } { }{ }2 , 1x x→− → Example 2: (Eq. of two variables) Solve the equation 2 2 24 0,x y x− = = in x & y. Solution: Type: Solve[{x^2–4==0, x^2= y^2},{x,y}] Press the [SE] keys. You will get: In [2]:= Solve[{x^2–4==0, x^2= y^2},{x,y}] Out [2]= { } { } { } { }{ }2, 2 , 2, 2 , 2, 2 , 2, 2x y x y x y x y→− → − → − → → → − → →
Example 3: (Complicated Equation)
Solve the equation ( )2ln 1 2x x+ + == in x.
Solution: Type: Solve[Log[x+Sqrt[1+x^2]]==2, x] Press the [SE] keys. You will get: In [3]:= Solve[Log[x+Sqrt[1+x^2]]==2, x] Out [3]= ( )2 41 1
2x e e−⎧ ⎫⎧ ⎫→ − +⎨⎨ ⎬⎬
⎩ ⎭⎩ ⎭.
7. Solving Equations Symbolically
Example 1: (Eq. of two variables) Solve the equation 2 2 2 20,x k y x− = = in x, y. Solution: Type: Solve[{x^2– k^2==0, x^2= y^2},{x,y}] Press the [SE] keys. You will get: In [2]:= Solve[{x^2– k^2==0, x^2= y^2},{x,y}] Out [2]= { } { } { } { }{ }, , , , , , ,x k y k x k y k x k y k x k y k→− → − → − → → → − → →
Example 2: (Complicated Equation)
Solve the equation ( )2ln x a x b+ + == in x.
Solution: Type: Solve[Log[x+Sqrt[a+x^2]]==b, x] Press the [SE] keys. You will get: In [3]:= Solve[Log[x+Sqrt[a+x^2]]==b, x] Out [3]= ( )21
2b bx e a e−⎧ ⎫⎧ ⎫→ − +⎨⎨ ⎬⎬
⎩ ⎭⎩ ⎭.
8. Numerical Solutions of Equation(s)
Example 1: Find the roots of the equation: 3 1 0x x+ + = .
Solution: Type: NSolve[x^3+x+1==0, x] Press the [SE] keys. You will get: In [1]:= NSolve[x^3+x+1==0, x] Out [2]= { }{ } { }
0.682328 ,
0.341164 1.16154 , 0.341164 1.16154
x
x i x i
⎧ ⎫→ −⎪ ⎪⎨ ⎬
→ − → +⎪ ⎪⎩ ⎭.
Example 2: Find solution of the system of equations:
2, 3 3, 0x y x y z x y z+ = − + = − + = . Solution: Type:
{ } { }NSolve 2, 3 3, 0 , , ,x y x y z x y z x y z⎡ ⎤+ == − + == − + ==⎣ ⎦ Press the [SE] keys. You will get: In[2]:=
{ } { }NSolve 2, 3 3, 0 , , ,x y x y z x y z x y z⎡ ⎤+ == − + == − + ==⎣ ⎦ Out [2]= { }{ }3.5, 1.5, 5.x y z→ →− → − . Example 3: Find approximate solution of the equation:
3cos lnx x= starting the approximation at x=1 Solution: Type:
{ }FindRoots 3cos[ ] Log[ ], ,1x x x⎡ ⎤==⎣ ⎦ Press the [SE] keys. You will get: In [3]:= { }FindRoots 3cos[ ] Log[ ], ,1x x x⎡ ⎤==⎣ ⎦ Out [3]= { }1.44726x → .
9. Sketching 2-D Graphs Example 1: Draw graph of y = sin x when 0 x≤ ≤ π . Solution: Type Plot[cos[ ],{ ,0, }]x x π Press the [SE] keys. You will get: In [3]:= Plot[cos[ ],{ ,0, }]x x π Out [3]= You find the graph of cos x when 0 x≤ ≤ π .
Example 2: Draw graph of 3
2
1, 0( )
, 0.x x
f xx x
⎧ − ≥= ⎨
<⎩
when 4 5x− ≤ ≤ . Solution: Type f[x_]:= x3 – 1 /; x≥0 f[x_]:= x2/; x < 0. Press the [SE] keys. You will get: In [3]:= f[x_]:= x3 – 1 /; x≥0
f[x_]:= x2/; x < 0. Out [3]= ……….
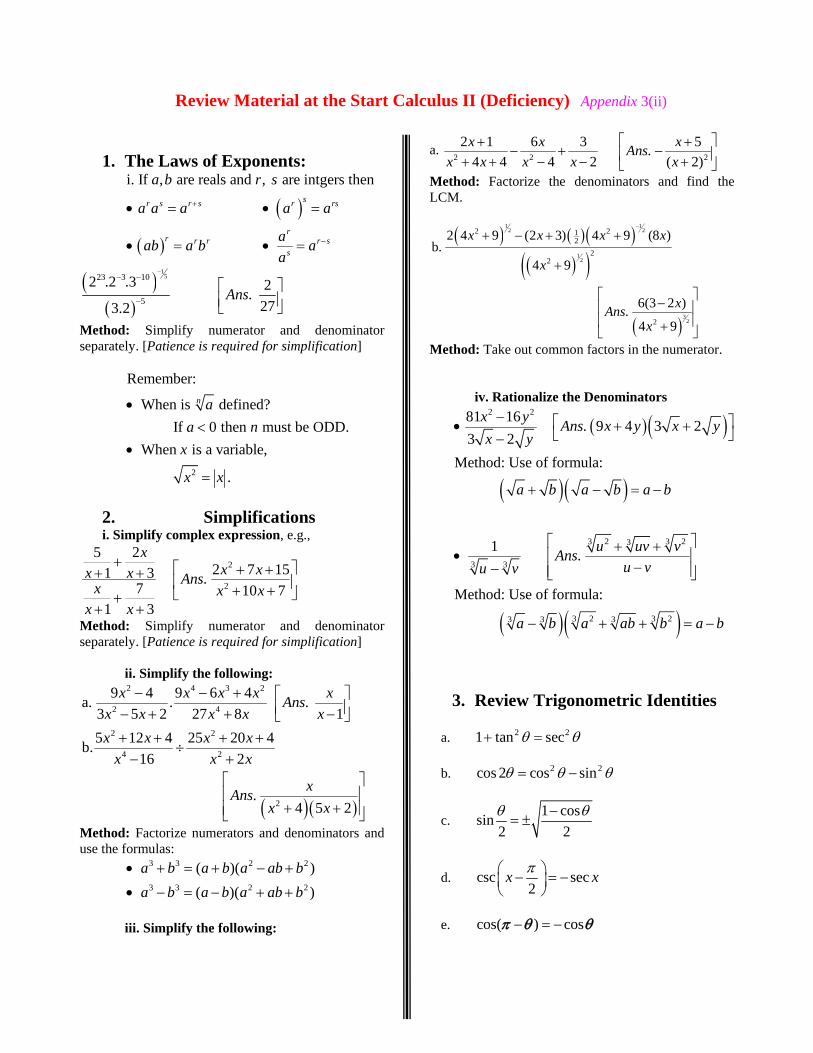
Review Material at the Start Calculus II (Deficiency) Appendix 3(ii)
1. The Laws of Exponents:
( )
( )
i. If , are reals and , are intgers then sr s r s r rs
rr r r r s
s
a b r s
a a a a a
aab a b aa
+
−
• = • =
• = • =
( )( )
1523 3 10
5
2 .2 .3 2.273.2
Ans
−− −
−⎡ ⎤⎢ ⎥⎣ ⎦
Method: Simplify numerator and denominator separately. [Patience is required for simplification]
2
Remember:
When is defined?If 0 then must be ODD.
When is a variable,
.
n aa n
x
x x
•<
•
=
2. Simplifications i. Simplify complex expression, e.g.,
2
2
5 22 7 151 3 .7 10 7
1 3
xx xx x Ansx x x
x x
+ ⎡ ⎤+ ++ +⎢ ⎥+ +⎣ ⎦+
+ +
Method: Simplify numerator and denominator separately. [Patience is required for simplification] ii. Simplify the following:
( )( )
2 4 3 2
2 4
2 2
4 2
2
9 4 9 6 4a. . .3 5 2 27 8 15 12 4 25 20 4b.
16 2
.4 5 2
x x x x xAnsx x x x xx x x x
x x x
xAnsx x
− − + ⎡ ⎤⎢ ⎥− + + −⎣ ⎦
+ + + +÷
− +⎡ ⎤⎢ ⎥
+ +⎢ ⎥⎣ ⎦
Method: Factorize numerators and denominators and use the formulas:
3 3 2 2
3 3 2 2
( )( )( )( )
a b a b a ab ba b a b a ab b
• + = + − +
• − = − + +
iii. Simplify the following:
a. 2 2 2
2 1 6 3 5.4 4 4 2 ( 2)
x x xAnsx x x x x
⎡ ⎤+ +− + −⎢ ⎥+ + − − +⎣ ⎦
Method: Factorize the denominators and find the LCM.
( ) ( ) ( )( )( )
( )
1 12 2
12
32
2 212
22
2
2 4 9 (2 3) 4 9 (8 )b.
4 9
6(3 2 ).4 9
x x x x
x
xAnsx
−
+ − + +
+
⎡ ⎤−⎢ ⎥⎢ ⎥+⎣ ⎦
Method: Take out common factors in the numerator.
iv. Rationalize the Denominators
( )( )
( )( )
( )( )
2 2
2 23 33
3 3
2 23 33 3 3
81 16 . 9 4 3 23 2
Method: Use of formula:
1 .
Method: Use of formula:
x y Ans x y x yx y
a b a b a b
u uv vAnsu vu v
a b a ab b a b
− ⎡ ⎤• + +⎣ ⎦−
+ − = −
⎡ ⎤+ +• ⎢ ⎥
−− ⎢ ⎥⎣ ⎦
− + + = −
3. Review Trigonometric Identities
a. 2 21 tan sec+ =θ θ
b. 2 2cos 2 cos sin= −θ θ θ
c. 1 cossin
2 2−
= ±θ θ
d. csc sec2
x x⎛ ⎞− = −⎜ ⎟⎝ ⎠
π
e. cos( ) cosπ θ θ− = −
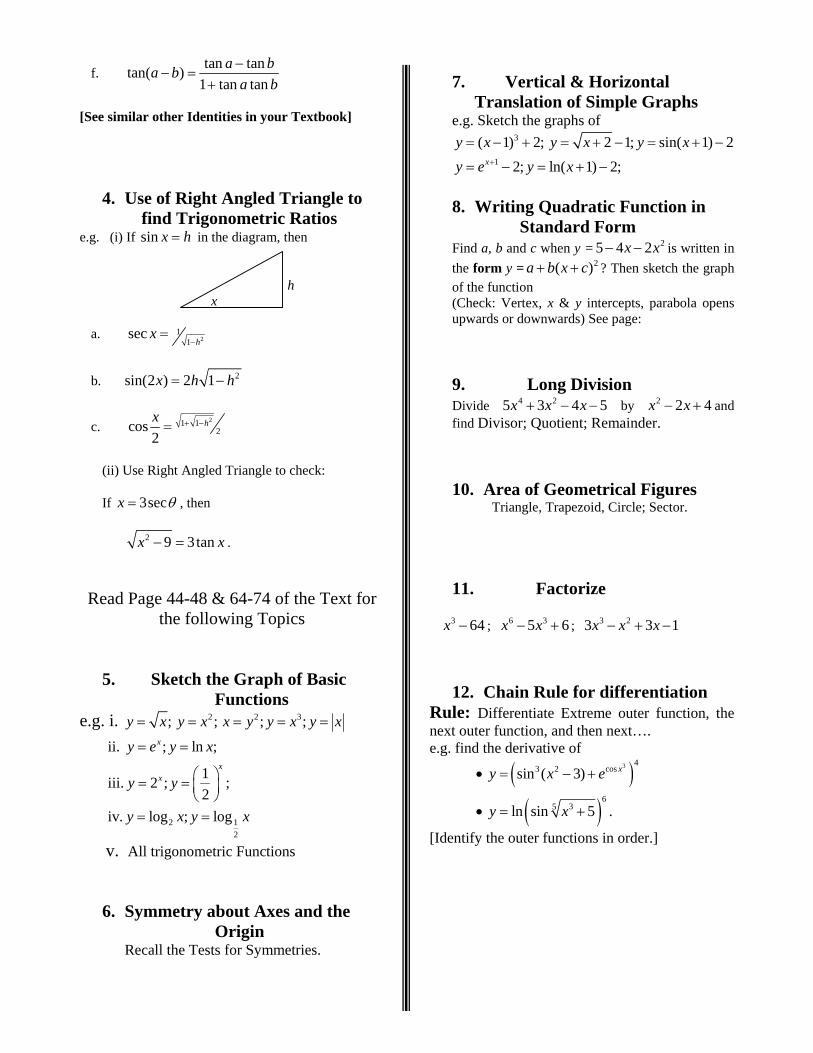
f. tan tantan( )
1 tan tana ba b
a b−
− =+
[See similar other Identities in your Textbook]
4. Use of Right Angled Triangle to find Trigonometric Ratios
e.g. (i) If sin x h= in the diagram, then
h
x a. 2
11
sech
x−
=
b. 2sin(2 ) 2 1x h h= −
c. 21 12cos
2hx + −=
(ii) Use Right Angled Triangle to check:
If 3secx θ= , then
2 9 3tanx x− = .
Read Page 44-48 & 64-74 of the Text for
the following Topics
5. Sketch the Graph of Basic Functions
e.g. i. 2 2 3; ; ; ;y x y x x y y x y x= = = = =
2 12
ii. ; ln ;
1iii. 2 ; ;2
iv. log ; log
x
xx
y e y x
y y
y x y x
= =
⎛ ⎞= = ⎜ ⎟⎝ ⎠
= =
v. All trigonometric Functions
6. Symmetry about Axes and the Origin
Recall the Tests for Symmetries.
7. Vertical & Horizontal
Translation of Simple Graphs e.g. Sketch the graphs of
3
1
( 1) 2; 2 1; sin( 1) 22; ln( 1) 2;x
y x y x y xy e y x+
= − + = + − = + −
= − = + −
8. Writing Quadratic Function in Standard Form
Find a, b and c when y = 25 4 2x x− − is written in the form y = 2( )a b x c+ + ? Then sketch the graph of the function (Check: Vertex, x & y intercepts, parabola opens upwards or downwards) See page:
9. Long Division Divide 4 25 3 4 5x x x+ − − by 2 2 4x x− + and find Divisor; Quotient; Remainder.
10. Area of Geometrical Figures Triangle, Trapezoid, Circle; Sector.
11. Factorize 3 64x − ; 6 35 6x x− + ; 3 23 3 1x x x− + −
12. Chain Rule for differentiation Rule: Differentiate Extreme outer function, the next outer function, and then next…. e.g. find the derivative of
( )( )
3 43 2 cos
635
sin ( 3)
ln sin 5 .
xy x e
y x
• = − +
• = +
[Identify the outer functions in order.]
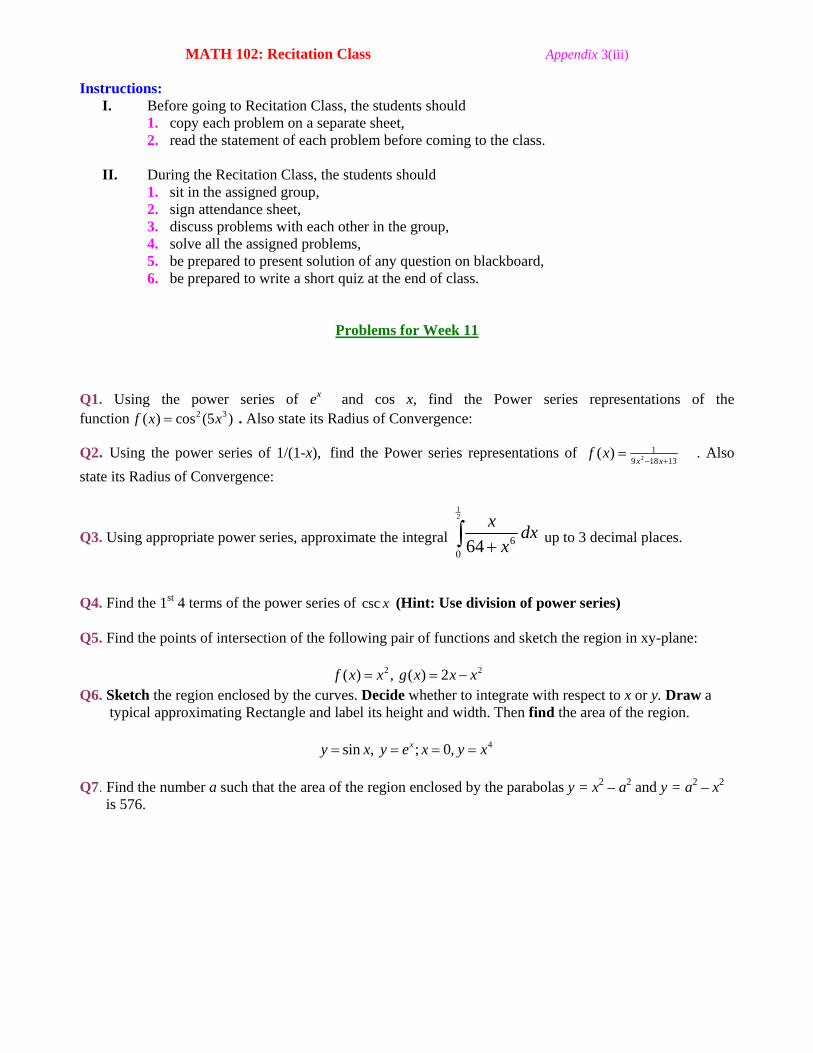
MATH 102: Recitation Class Appendix 3(iii)
Instructions: I. Before going to Recitation Class, the students should
1. copy each problem on a separate sheet, 2. read the statement of each problem before coming to the class.
II. During the Recitation Class, the students should 1. sit in the assigned group, 2. sign attendance sheet, 3. discuss problems with each other in the group, 4. solve all the assigned problems, 5. be prepared to present solution of any question on blackboard, 6. be prepared to write a short quiz at the end of class.
Problems for Week 11
Q1. Using the power series of ex and cos x, find the Power series representations of the function 2 3( ) cos (5 )f x x= . Also state its Radius of Convergence:
Q2. Using the power series of 1/(1-x), find the Power series representations of 21
9 18 13 ( )
x xf x
− += . Also
state its Radius of Convergence:
Q3. Using appropriate power series, approximate the integral
12
60 64
x dxx+∫ up to 3 decimal places.
Q4. Find the 1st 4 terms of the power series of csc x (Hint: Use division of power series) Q5. Find the points of intersection of the following pair of functions and sketch the region in xy-plane:
2 2 ( ) , ( ) 2f x x g x x x= = − Q6. Sketch the region enclosed by the curves. Decide whether to integrate with respect to x or y. Draw a typical approximating Rectangle and label its height and width. Then find the area of the region.
4 sin , ; 0,xy x y e x y x= = = = Q7. Find the number a such that the area of the region enclosed by the parabolas y = x2 – a2 and y = a2 – x2 is 576.
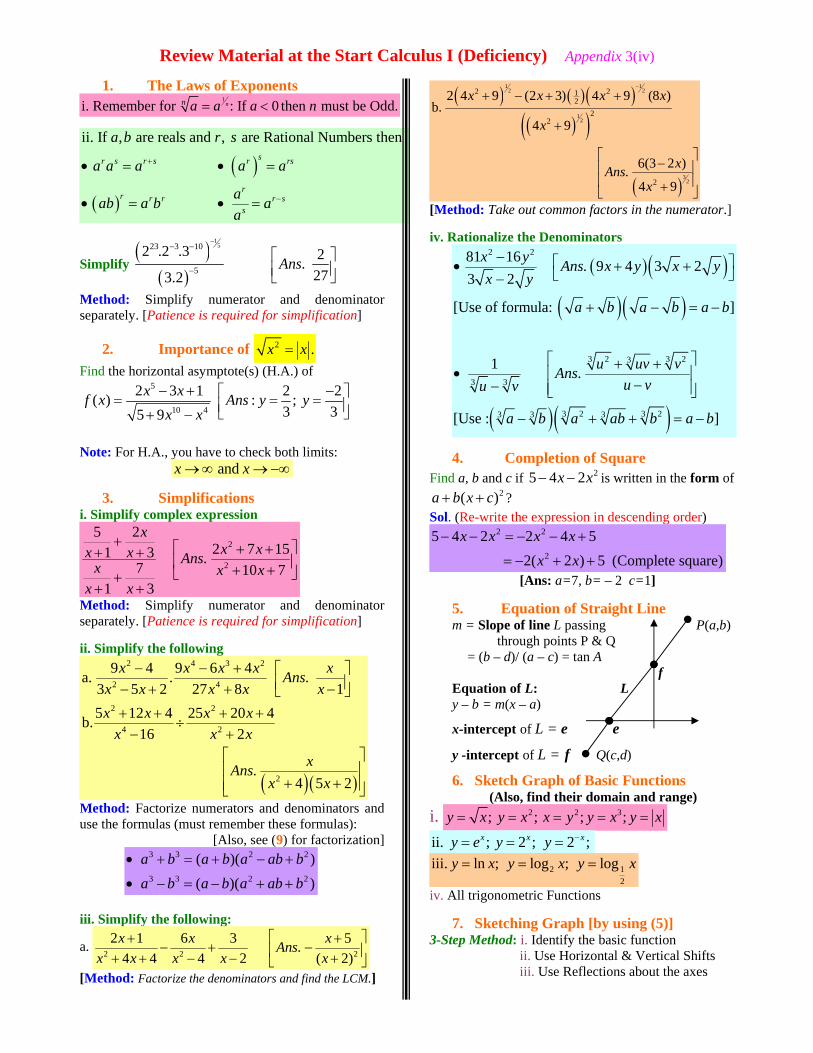
Review Material at the Start Calculus I (Deficiency) Appendix 3(iv)
1. The Laws of Exponents 1i. Remember for : If 0 then must be Odd.nn a a a n= <
( )
( )
ii. If , are reals and , are Rational Numbers then sr s r s r rs
rr r r r s
s
a b r s
a a a a a
aab a b aa
+
−
• = • =
• = • =
Simplify ( )
( )
1523 3 10
5
2 .2 .3 2.273.2
Ans
−− −
−⎡ ⎤⎢ ⎥⎣ ⎦
Method: Simplify numerator and denominator separately. [Patience is required for simplification]
2. Importance of 2 .x x= Find the horizontal asymptote(s) (H.A.) of
5
10 4
2 3 1 2 2( ) : ;3 35 9
x xf x Ans y yx x− + −⎡ ⎤= = =⎢ ⎥⎣ ⎦+ −
Note: For H.A., you have to check both limits:
and x x→∞ →−∞
3. Simplifications i. Simplify complex expression
2
2
5 22 7 151 3 .7 10 7
1 3
xx xx x Ansx x x
x x
+ ⎡ ⎤+ ++ +⎢ ⎥+ +⎣ ⎦+
+ +
Method: Simplify numerator and denominator separately. [Patience is required for simplification] ii. Simplify the following
( )( )
2 4 3 2
2 4
2 2
4 2
2
9 4 9 6 4a. . .3 5 2 27 8 15 12 4 25 20 4b.
16 2
.4 5 2
x x x x xAnsx x x x xx x x x
x x x
xAnsx x
− − + ⎡ ⎤⎢ ⎥− + + −⎣ ⎦
+ + + +÷
− +⎡ ⎤⎢ ⎥
+ +⎢ ⎥⎣ ⎦
Method: Factorize numerators and denominators and use the formulas (must remember these formulas):
[Also, see (9) for factorization]
3 3 2 2
3 3 2 2
( )( )( )( )
a b a b a ab ba b a b a ab b
• + = + − +
• − = − + +
iii. Simplify the following:
a. 2 2 2
2 1 6 3 5.4 4 4 2 ( 2)
x x xAnsx x x x x
⎡ ⎤+ +− + −⎢ ⎥+ + − − +⎣ ⎦
[Method: Factorize the denominators and find the LCM.]
( ) ( ) ( )( )( )
( )
1 12 2
12
32
2 212
22
2
2 4 9 (2 3) 4 9 (8 )b.
4 9
6(3 2 ).4 9
x x x x
x
xAnsx
−
+ − + +
+
⎡ ⎤−⎢ ⎥⎢ ⎥+⎣ ⎦
[Method: Take out common factors in the numerator.]
iv. Rationalize the Denominators
( )( )( )( )
( )( )
2 2
2 23 33
3 3
2 23 33 3 3
81 16 . 9 4 3 23 2
[Use of formula: ]
1 .
[Use : ]
x y Ans x y x yx y
a b a b a b
u uv vAnsu vu v
a b a ab b a b
− ⎡ ⎤• + +⎣ ⎦−
+ − = −
⎡ ⎤+ +• ⎢ ⎥
−− ⎢ ⎥⎣ ⎦
− + + = −
4. Completion of Square
Find a, b and c if 25 4 2x x− − is written in the form of 2( )a b x c+ + ?
Sol. (Re-write the expression in descending order) 2 2
2
5 4 2 2 4 52( 2 ) 5 (Complete square)
x x x xx x
− − = − − +
= − + +
[Ans: a=7, b= – 2 c=1]
5. Equation of Straight Line m = Slope of line L passing P(a,b)
through points P & Q = (b – d)/ (a – c) = tan A
f Equation of L: L y – b = m(x – a)
x-intercept of L = e e
y -intercept of L = f Q(c,d)
6. Sketch Graph of Basic Functions (Also, find their domain and range)
i. 2 2 3; ; ; ;y x y x x y y x y x= = = = = ii. ; 2 ; 2 ;x x xy e y y −= = =
2 12
iii. ln ; log ; logy x y x y x= = =
iv. All trigonometric Functions
7. Sketching Graph [by using (5)] 3-Step Method: i. Identify the basic function ii. Use Horizontal & Vertical Shifts
iii. Use Reflections about the axes
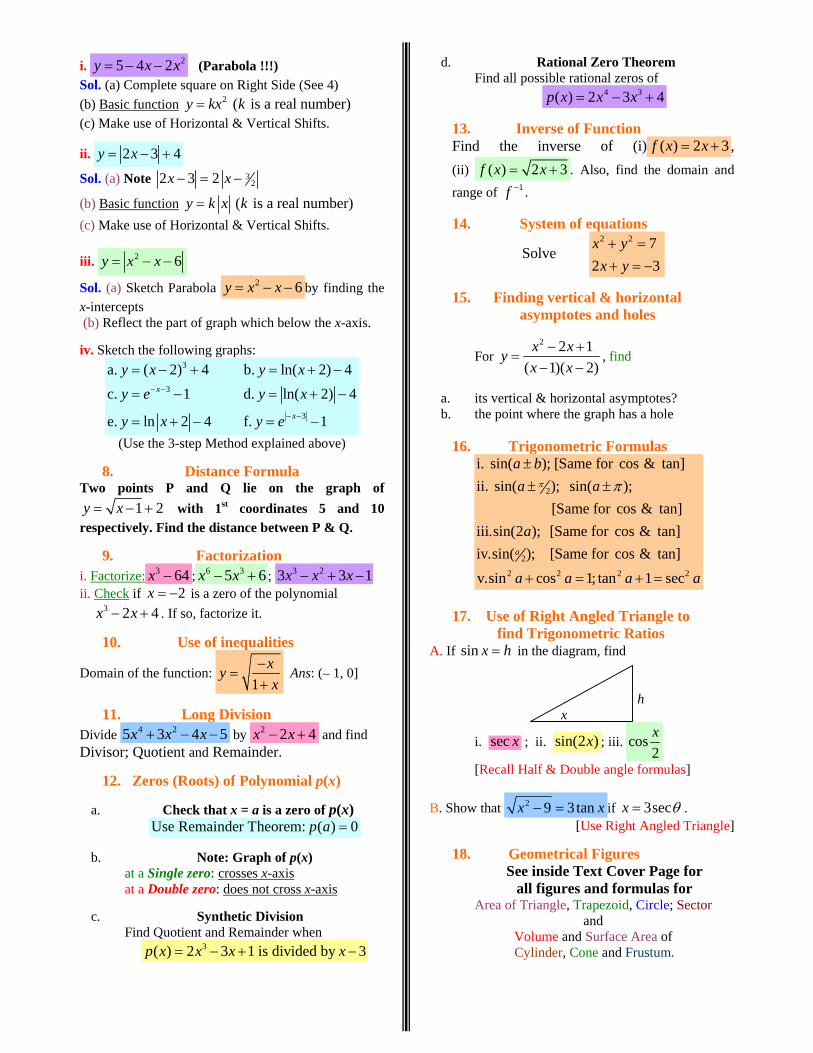
i. 25 4 2y x x= − − (Parabola !!!) Sol. (a) Complete square on Right Side (See 4) (b) Basic function 2 ( is a real number)y kx k= (c) Make use of Horizontal & Vertical Shifts.
ii. 2 3 4y x= − +
Sol. (a) Note 322 3 2x x− = −
(b) Basic function ( is a real number)y k x k= (c) Make use of Horizontal & Vertical Shifts. iii. 2 6y x x= − −
Sol. (a) Sketch Parabola 2 6y x x= − − by finding the x-intercepts (b) Reflect the part of graph which below the x-axis. iv. Sketch the following graphs:
3
3
3
a. ( 2) 4 b. ln( 2) 4c. 1 d. ln( 2) 4
e. ln 2 4 f. 1
x
x
y x y xy e y x
y x y e
− −
− −
= − + = + −
= − = + −
= + − = −
(Use the 3-step Method explained above)
8. Distance Formula Two points P and Q lie on the graph of
1 2y x= − + with 1st coordinates 5 and 10 respectively. Find the distance between P & Q.
9. Factorization
i. Factorize: 3 64x − ; 6 35 6x x− + ; 3 23 3 1x x x− + − ii. Check if 2x = − is a zero of the polynomial 3 2 4x x− + . If so, factorize it.
10. Use of inequalities
Domain of the function: 1
xyx
−=
+ Ans: (– 1, 0]
11. Long Division
Divide 4 25 3 4 5x x x+ − − by 2 2 4x x− + and find Divisor; Quotient and Remainder.
12. Zeros (Roots) of Polynomial p(x)
a. Check that x = a is a zero of p(x) Use Remainder Theorem: ( ) 0p a =
b. Note: Graph of p(x)
at a Single zero: crosses x-axis at a Double zero: does not cross x-axis
c. Synthetic Division Find Quotient and Remainder when
3( ) 2 3 1 is divided by 3p x x x x= − + −
d. Rational Zero Theorem Find all possible rational zeros of
4 3( ) 2 3 4p x x x= − +
13. Inverse of Function Find the inverse of (i) ( ) 2 3f x x= + , (ii) ( ) 2 3f x x= + . Also, find the domain and
range of 1f − .
14. System of equations
Solve 2 2 7
2 3x y
x y+ =+ = −
15. Finding vertical & horizontal asymptotes and holes
For 2 2 1
( 1)( 2)x xyx x
− +=
− −, find
a. its vertical & horizontal asymptotes? b. the point where the graph has a hole
16. Trigonometric Formulas
2
2
2 2 2 2
i. sin( ); [Same for cos & tan]ii. sin( ); sin( );
[Same for cos & tan]iii.sin(2 ); [Same for cos & tan]iv.sin( ); [Same for cos & tan]v.sin cos 1; tan 1 sec
a
a ba a
a
a a a a
π π±± ±
+ = + =
17. Use of Right Angled Triangle to find Trigonometric Ratios
A. If sin x h= in the diagram, find
h
x
i. sec x ; ii. sin(2 )x ; iii. cos2x
[Recall Half & Double angle formulas]
B. Show that 2 9 3 tanx x− = if 3secx θ= . [Use Right Angled Triangle]
18. Geometrical Figures
See inside Text Cover Page for all figures and formulas for
Area of Triangle, Trapezoid, Circle; Sector and
Volume and Surface Area of Cylinder, Cone and Frustum.
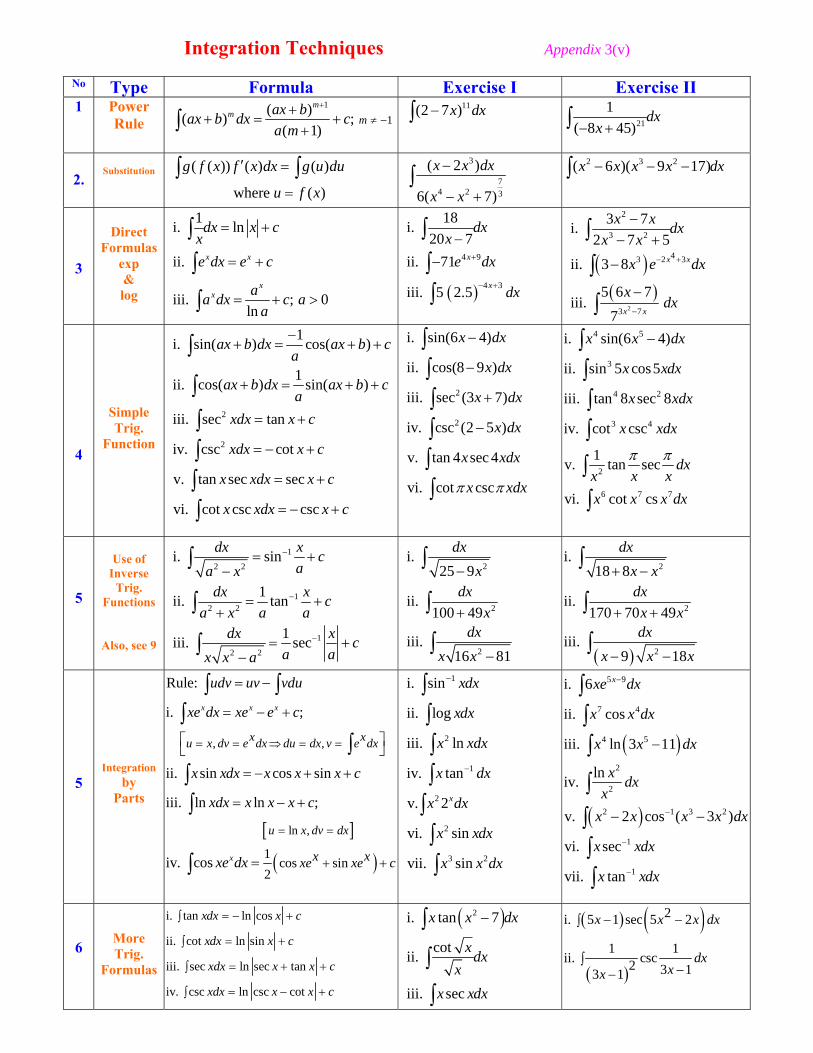
Integration Techniques Appendix 3(v)
No Type Formula Exercise I Exercise II 1 Power
Rule 1
1( )( ) ;
( 1)
mm m
ax bax b dx ca m
+
≠ −+
+ = ++∫
11(2 7 )x dx−∫ 21
1( 8 45)
dxx− +∫
2.
Substitution ( ( )) ( ) ( )
where ( )
g f x f x dx g u du
u f x
′ =
=∫ ∫
3
74 2 3
( 2 )
6( 7)
x x dx
x x
−
− +∫
2 3 2( 6 )( 9 17)x x x x dx− − −∫
3
Direct
Formulas exp & log
1i. ln
ii.
iii. ; 0ln
x x
xx
dx x cxe dx e c
aa dx c aa
= +
= +
= + >
∫∫
∫
( )
4 9
4 3
18i. 20 7
ii. 71
iii. 5 2.5
x
x
dxx
e dx
dx
+
− +
−−
∫∫∫
( )( )
2
2
3 2
43 2 3
3 7
3 7i. 2 7 5
ii. 3 8
5 6 7iii.
7
x x
x x
x x dxx x
x e dx
xdx
− +
−
−− +
−
−
∫
∫
∫
4
Simple Trig.
Function
2
2
1i. sin( ) cos( )
1ii. cos( ) sin( )
iii. sec tan
iv. csc cot
v. tan sec sec
vi. cot csc csc
ax b dx ax b ca
ax b dx ax b ca
xdx x c
xdx x c
x xdx x c
x xdx x c
−+ = + +
+ = + +
= +
= − +
= +
= − +
∫
∫∫∫∫∫
2
2
i. sin(6 4)
ii. cos(8 9 )
iii. sec (3 7)
iv. csc (2 5 )
v. tan 4 sec 4
vi. cot csc
x dx
x dx
x dx
x dx
x xdx
x xdxπ π
−
−
+
−
∫∫∫∫∫∫
4 5
3
4 2
3 4
2
6 7 7
i. sin(6 4)
ii. sin 5 cos5
iii. tan 8 sec 8
iv. cot csc
1v. tan sec
vi. cot cs
x x dx
x xdx
x xdx
x xdx
dxx x xx x x dx
π π
−∫∫∫∫
∫
∫
5
Use of
Inverse Trig.
Functions
Also, see 9
1
2 2
12 2
1
2 2
i. sin
1ii. tan
1iii. sec
dx x caa x
dx x ca x a a
dx x ca ax x a
−
−
−
= +−
= ++
= +−
∫
∫
∫
2
2
2
i. 25 9
ii. 100 49
iii. 16 81
dxx
dxx
dxx x
−
+
−
∫
∫
∫
( )
2
2
2
i. 18 8
ii. 170 70 49
iii. 9 18
dxx xdxx xdx
x x x
+ −
+ +
− −
∫
∫
∫
5
Integration by
Parts
[ ]
( )
, ,
ln ,
1cos sin
2
Rule:
i. ;
ii. sin cos sin
iii. ln ln ;
iv. cos
x x x
x
x xu x dv e dx du dx v e dx
u x dv dx
x xxe xe c
udv uv vdu
xe dx xe e c
x xdx x x x c
xdx x x x c
xe dx
= = ⇒ = =
= =
+ +
= −
= − +
⎡ ⎤⎣ ⎦
= − + +
= − +
=
∫ ∫∫
∫∫∫
∫
1
2
1
2
2
3 2
i. sin
ii. log
iii. ln
iv. tan
v. 2
vi. sin
vii. sin
x
xdx
xdx
x xdx
x dx
x dx
x xdx
x x dx
−
−
∫∫∫∫∫∫∫
( )
( )
5 9
7 4
4 5
2
2
2 1 3 2
1
1
i. 6
ii. cos
iii. ln 3 11
lniv.
v. 2 cos ( 3 )
vi. sec
vii. tan
xxe dx
x x dx
x x dx
x dxx
x x x x dx
x xdx
x xdx
−
−
−
−
−
− −
∫∫∫
∫∫∫∫
6
More Trig.
Formulas
i. tan ln cos
ii. cot ln sin
iii. sec ln sec tan
iv. csc ln csc cot
xdx x c
xdx x c
xdx x x c
xdx x x c
= − +∫
= +∫
= + +∫
= − +∫
( )2i. tan 7
cotii.
iii. sec
x x dx
xdxx
x xdx
−∫
∫
∫
( ) ( )
( )
2i. 5 1 sec 5 2
1 1ii. csc2 3 13 1
x x x dx
dxxx
− −∫
∫−−

Use of Trig. Identities in Integration Trig. Identities Exercises 7
2
2
1 cos 2i. cos2
1 cos 2ii. sin2
iii. sin 2 2sin cos
xx
xx
x x x
+=
−=
=
(See **)
2 4 2 2
2 3 2
2 2 3 2 2
i. sin (3 1) ii. sin 5 iii. sin (7 3)
iv. cos (3 1) v. cos 5 vi. cos(7 3)
vii. cos 3 sin 3 viii. sin ( 3)
x dx xdx x x dx
x x dx xdx x x dx
x xdx x x dx
+ +
+ +
+
∫ ∫ ∫∫ ∫ ∫∫ ∫
8
( ) ( ) [ ]
[ ] [ ]
1i. sin sin cos cos sin ; ii. cos cos cos sin sin ; iii.sin sin cos( ) cos( )
21 1
iv. sin cos sin( ) sin( ) v. cos cos cos( ) cos( )2 2
;
a b a b a b a b a b a b a b a b a b
a b a b a b a b a b a b
± = ± ± = = − − +
= + + − = + + −
∓
Exercises: i. sin 5 cos 3 ii. cos 5 cos 3 iii. sin 5 sin 3x xdx x xdx x xdx∫ ∫ ∫ 9
Example: [Completion of Square & Use of Right Triangle] 2 2 2
2
2 : 2 10 ( 1) 9;Set 1 3tan 3sec .2 10
xI dx x x x x u dx udux x
−= − + = − + − = ⇒ =∫
− + x – 1 √(x2 –2 x+ 1)
22 2 10 1(3tan 1) sec 3sec ln sec tan ln
3 32 10 x x xI u udu u u u c cx x − + −
= − = − + + = − + +∫ − +
3
Use of Partial Fractions Decomposition of Rational Functions N(x)/D(x) in Integration [ *Note: If deg (N) ≥ deg (D), first divide N by D. Then find Partial Fractions Decomposition. ]
Here, in (i-iv), we assume that deg (Numerator) < deg (Denominator)
10 Type Method Exercises i Non-
Repeated Linear
Factors
( )( )( )
p x A Bx a x b x a x b
= +− − − −
[Write: p(x)=A(x-b)+B(x-a)] 2
11 ;2 15 3 5
Ans: 1, 2
x A Bx x x x
A B
+= +
− − + −= − =
ii Repeated Linear
Factors ( )22
( )
( )( )
p x A B C
x a x b x a x b x b= + +
− − − − −
( )
2
2 22 7 ;
1( 1) 1
Ans: 7, 6, 10
x x A B Cx xx x x
A B C
+ += + +
−− −
= = − =
iii Non-Repeated
Non-Linear Factors
2 22 2
( )
( )( )
p x Ax B Cx Dx bx c x dx gx bx c x dx g
+ += +
+ + + ++ + + + 3 16 ;2 22( 2)( 7) 7
Ans: 2, 2, 1
x A Bx Cxx x x
A B C
+ += +
−− + +
= = − = −
iv Repeated Non-
Linear Factors
22 2 2 2
( )
( )( ) ( )
p x A Bx C Dx Ex a x bx cx a x bx c x dx g
+ += + +
− + +− + + + +
3 2
22 2 2 2
4 5 7 1 ;1( 1) ( 1)
Ans: 4, 1, 2, 2
x x x Ax B Cx Dx xx x x x
A B C D
+ + − + += +
+ ++ + + +
= = = = −
* v
deg (N) ≥
deg (D)
( ) ( ) ( )( ) ;( ) ( )( ) ( )( )
( )where ( )( )
N x N x R xQ xD x x a x b x a x b
R x A Bx a x b x a x b
= = +− − − −
= +− − − −
3 2
2 2
2 Ans: ( ) 3;
( ) 2 35; 4, 1, 2, 2
4 19 35 ( )( ) ;7 7( )where ;
77Q x x
R x x A B C D
x x x R xQ xx x x x
R x A Bx xx x
= +
= − = = = = −
− − −= +
− −
= +−−
** Trig. Identities: cos 2 θ + sin 2 θ =1; 1+ tan 2 θ = sec 2 θ; 1+ cot 2 θ = csc 2 θ
u
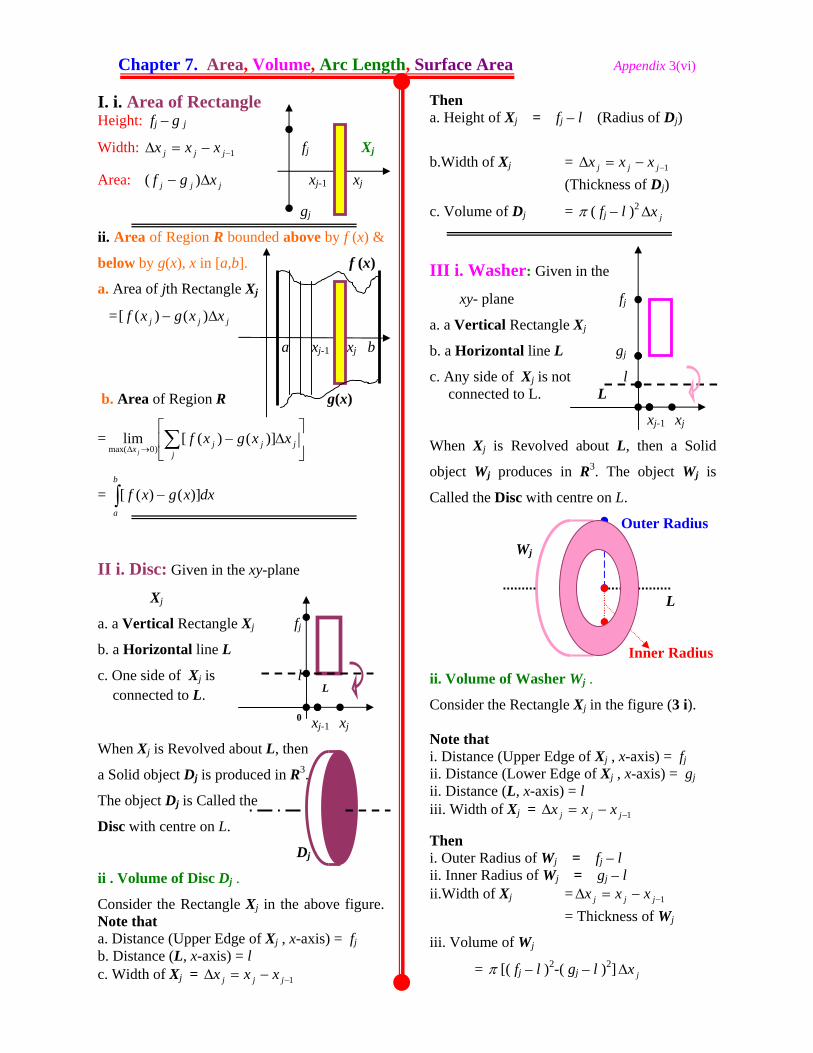
Chapter 7. Area, Volume, Arc Length, Surface Area Appendix 3(vi)
I. i. Area of Rectangle Height: fj – g j
Width: 1−−=Δ jjj xxx fj Xj
Area: jjj xgf Δ− )( xj-1 xj
gj
ii. Area of Region R bounded above by f (x) &
below by g(x), x in [a,b]. f (x)
a. Area of jth Rectangle Xj
= jjj xxgxf Δ− )()([
a xj-1 xj b
b. Area of Region R g(x)
= ⎥⎦
⎤⎢⎣
⎡Δ−∑→Δ j
jjjxxxgxf
j
)]()([lim)0max(
= ∫ −b
a
dxxgxf )]()([
II i. Disc: Given in the xy-plane
Xj
a. a Vertical Rectangle Xj fj
b. a Horizontal line L
c. One side of Xj is l connected to L. L
0 xj-1 xj
When Xj is Revolved about L, then
a Solid object Dj is produced in R3.
The object Dj is Called the
Disc with centre on L.
Dj
ii . Volume of Disc Dj .
Consider the Rectangle Xj in the above figure. Note that a. Distance (Upper Edge of Xj , x-axis) = fj b. Distance (L, x-axis) = l c. Width of Xj = 1−−=Δ jjj xxx
Then a. Height of Xj = fj – l (Radius of Dj)
b.Width of Xj = 1−−=Δ jjj xxx
(Thickness of Dj)
c. Volume of Dj = π ( fj – l )2jxΔ
III i. Washer: Given in the
xy- plane fj
a. a Vertical Rectangle Xj
b. a Horizontal line L gj
c. Any side of Xj is not l connected to L. L
xj-1 xj
When Xj is Revolved about L, then a Solid
object Wj produces in R3. The object Wj is
Called the Disc with centre on L.
Outer Radius
Wj
L
Inner Radius
ii. Volume of Washer Wj .
Consider the Rectangle Xj in the figure (3 i). Note that i. Distance (Upper Edge of Xj , x-axis) = fj ii. Distance (Lower Edge of Xj , x-axis) = gj ii. Distance (L, x-axis) = l iii. Width of Xj = 1−−=Δ jjj xxx
Then i. Outer Radius of Wj = fj – l ii. Inner Radius of Wj = gj – l ii.Width of Xj = 1−−=Δ jjj xxx
= Thickness of Wj
iii. Volume of Wj
= π [( fj – l )2-( gj – l )2] jxΔ
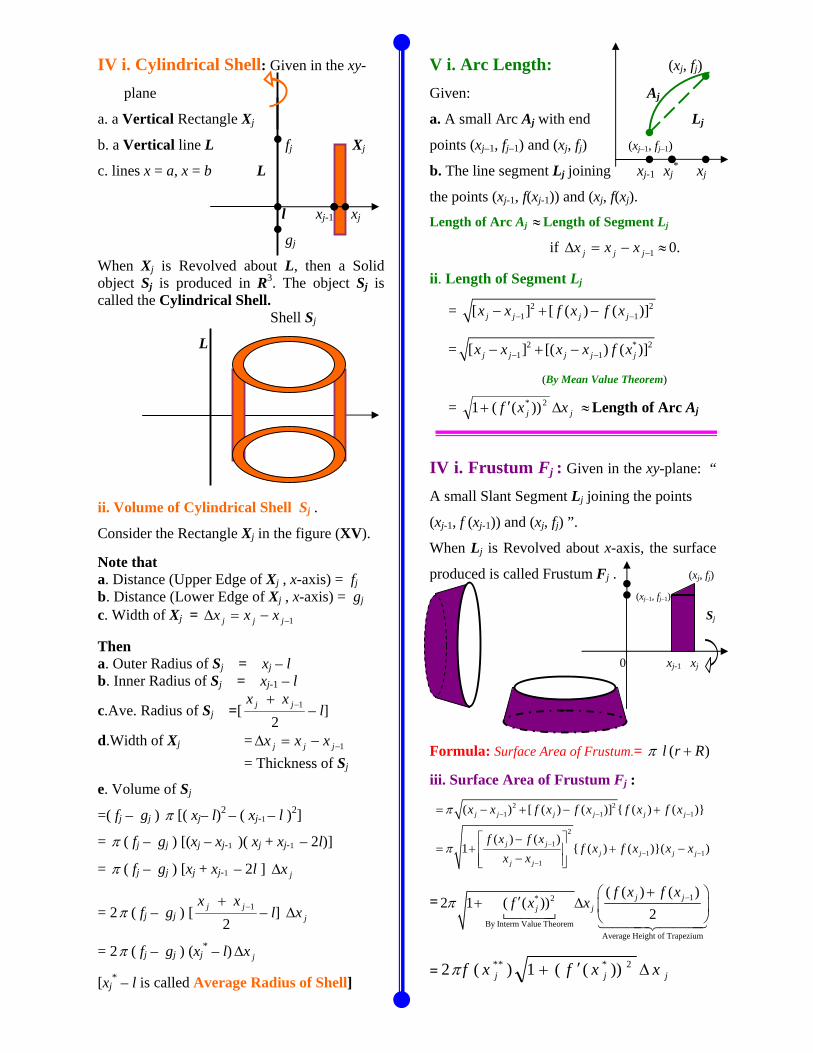
IV i. Cylindrical Shell: Given in the xy-
plane
a. a Vertical Rectangle Xj
b. a Vertical line L fj Xj
c. lines x = a, x = b L
l xj-1 xj
gj
When Xj is Revolved about L, then a Solid object Sj is produced in R3. The object Sj is called the Cylindrical Shell. Shell Sj
L
ii. Volume of Cylindrical Shell Sj .
Consider the Rectangle Xj in the figure (XV). Note that a. Distance (Upper Edge of Xj , x-axis) = fj b. Distance (Lower Edge of Xj , x-axis) = gj c. Width of Xj = 1−−=Δ jjj xxx
Then a. Outer Radius of Sj = xj – l b. Inner Radius of Sj = xj-1 – l
c.Ave. Radius of Sj =[2
1−+ jj x x– l]
d.Width of Xj = 1−−=Δ jjj xxx
= Thickness of Sj
e. Volume of Sj
=( fj – gj ) π [( xj– l)2 – ( xj-1 – l )2]
= π ( fj – gj ) [(xj – xj-1 )( xj + xj-1 – 2l)]
= π ( fj – gj ) [xj + xj-1 – 2l ] jxΔ
= 2π ( fj – gj ) [2
1−+ jj x x– l] jxΔ
= 2π ( fj – gj ) (xj* – l) jxΔ
[xj* – l is called Average Radius of Shell]
V i. Arc Length: (xj, fj)
Given: Aj
a. A small Arc Aj with end Lj
points (xj–1, fj–1) and (xj, fj) (xj–1, fj–1)
b. The line segment Lj joining xj-1 xj* xj
the points (xj-1, f(xj-1)) and (xj, f(xj).
Length of Arc Aj ≈Length of Segment Lj
if 1−−=Δ jjj xxx ≈0.
ii. Length of Segment Lj
= 2 21 1[ ] [ ( ) ( )]j j j jx x f x f x− −− + −
= 2 * 21 1[ ] [( ) ( )]j j j j jx x x x f x− −− + −
(By Mean Value Theorem)
= jj xxf Δ′+ 2* ))((1 ≈Length of Arc Aj
IV i. Frustum Fj : Given in the xy-plane: “
A small Slant Segment Lj joining the points
(xj-1, f (xj-1)) and (xj, fj) ”.
When Lj is Revolved about x-axis, the surface
produced is called Frustum Fj . (xj, fj) (xj–1, fj–1) Sj
0 xj-1 xj
Formula: Surface Area of Frustum.= ( )l r Rπ +
iii. Surface Area of Frustum Fj : 2 2
1 1 1
2
11 1
1
( ) [ ( ) ( )] { ( ) ( )}
( ) ( )1 { ( ) ( )}( )
j j j j j j
j jj j j j
j j
x x f x f x f x f x
f x f xf x f x x x
x x
π
π
− − −
−− −
−
= − + − +
⎡ ⎤−= + + −⎢ ⎥
−⎢ ⎥⎣ ⎦
= 1* 2
By Interm Value TheoremAverage Height of Trapezium
( ( ) ( )2 1 ( ( ))
2j j
j j
f x f xf x xπ −+⎛ ⎞′+ Δ ⎜ ⎟
⎝ ⎠
= jjj xxfxf Δ′+ 2*** ))((1)(2π
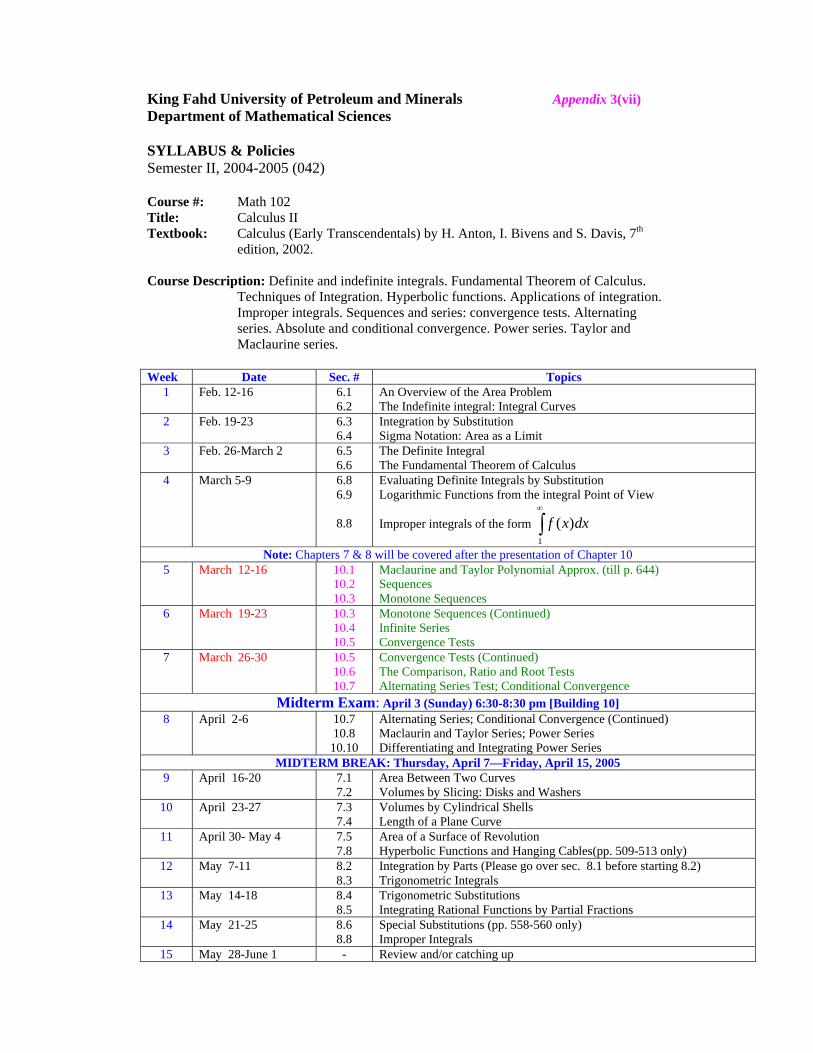
King Fahd University of Petroleum and Minerals Appendix 3(vii) Department of Mathematical Sciences SYLLABUS & Policies Semester II, 2004-2005 (042) Course #: Math 102 Title: Calculus II Textbook: Calculus (Early Transcendentals) by H. Anton, I. Bivens and S. Davis, 7th
edition, 2002. Course Description: Definite and indefinite integrals. Fundamental Theorem of Calculus.
Techniques of Integration. Hyperbolic functions. Applications of integration. Improper integrals. Sequences and series: convergence tests. Alternating series. Absolute and conditional convergence. Power series. Taylor and Maclaurine series.
Week Date Sec. # Topics
1 Feb. 12-16 6.1 6.2
An Overview of the Area Problem The Indefinite integral: Integral Curves
2 Feb. 19-23 6.3 6.4
Integration by Substitution Sigma Notation: Area as a Limit
3 Feb. 26-March 2 6.5 6.6
The Definite Integral The Fundamental Theorem of Calculus
4 March 5-9 6.8 6.9
8.8
Evaluating Definite Integrals by Substitution Logarithmic Functions from the integral Point of View
Improper integrals of the form 1
( )f x dx∞
∫
Note: Chapters 7 & 8 will be covered after the presentation of Chapter 10 5 March 12-16 10.1
10.2 10.3
Maclaurine and Taylor Polynomial Approx. (till p. 644) Sequences Monotone Sequences
6 March 19-23 10.3 10.4 10.5
Monotone Sequences (Continued) Infinite Series Convergence Tests
7 March 26-30 10.5 10.6 10.7
Convergence Tests (Continued) The Comparison, Ratio and Root Tests Alternating Series Test; Conditional Convergence
Midterm Exam: April 3 (Sunday) 6:30-8:30 pm [Building 10] 8 April 2-6 10.7
10.8 10.10
Alternating Series; Conditional Convergence (Continued) Maclaurin and Taylor Series; Power Series Differentiating and Integrating Power Series
MIDTERM BREAK: Thursday, April 7—Friday, April 15, 2005 9 April 16-20 7.1
7.2 Area Between Two Curves Volumes by Slicing: Disks and Washers
10 April 23-27 7.3 7.4
Volumes by Cylindrical Shells Length of a Plane Curve
11 April 30- May 4 7.5 7.8
Area of a Surface of Revolution Hyperbolic Functions and Hanging Cables(pp. 509-513 only)
12 May 7-11 8.2 8.3
Integration by Parts (Please go over sec. 8.1 before starting 8.2) Trigonometric Integrals
13 May 14-18 8.4 8.5
Trigonometric Substitutions Integrating Rational Functions by Partial Fractions
14 May 21-25 8.6 8.8
Special Substitutions (pp. 558-560 only) Improper Integrals
15 May 28-June 1 - Review and/or catching up
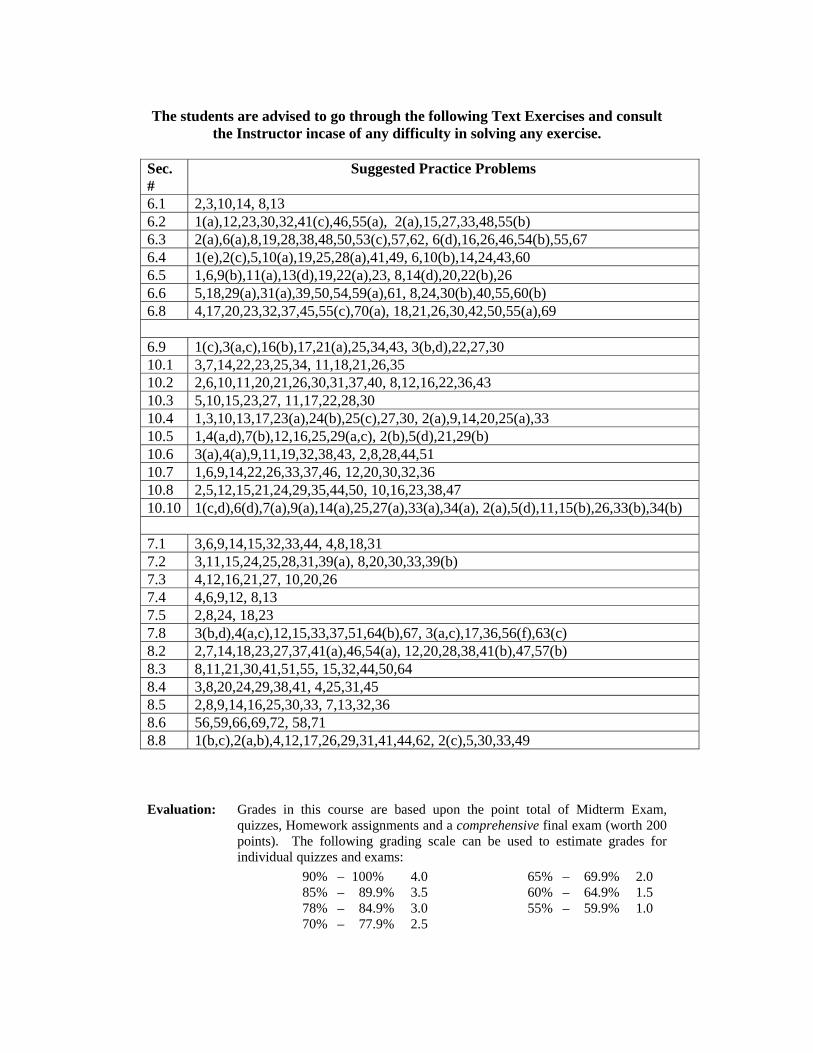
The students are advised to go through the following Text Exercises and consult
the Instructor incase of any difficulty in solving any exercise.
Sec. #
Suggested Practice Problems
6.1 2,3,10,14, 8,13 6.2 1(a),12,23,30,32,41(c),46,55(a), 2(a),15,27,33,48,55(b) 6.3 2(a),6(a),8,19,28,38,48,50,53(c),57,62, 6(d),16,26,46,54(b),55,67 6.4 1(e),2(c),5,10(a),19,25,28(a),41,49, 6,10(b),14,24,43,60 6.5 1,6,9(b),11(a),13(d),19,22(a),23, 8,14(d),20,22(b),26 6.6 5,18,29(a),31(a),39,50,54,59(a),61, 8,24,30(b),40,55,60(b) 6.8 4,17,20,23,32,37,45,55(c),70(a), 18,21,26,30,42,50,55(a),69 6.9 1(c),3(a,c),16(b),17,21(a),25,34,43, 3(b,d),22,27,30 10.1 3,7,14,22,23,25,34, 11,18,21,26,35 10.2 2,6,10,11,20,21,26,30,31,37,40, 8,12,16,22,36,43 10.3 5,10,15,23,27, 11,17,22,28,30 10.4 1,3,10,13,17,23(a),24(b),25(c),27,30, 2(a),9,14,20,25(a),33 10.5 1,4(a,d),7(b),12,16,25,29(a,c), 2(b),5(d),21,29(b) 10.6 3(a),4(a),9,11,19,32,38,43, 2,8,28,44,51 10.7 1,6,9,14,22,26,33,37,46, 12,20,30,32,36 10.8 2,5,12,15,21,24,29,35,44,50, 10,16,23,38,47 10.10 1(c,d),6(d),7(a),9(a),14(a),25,27(a),33(a),34(a), 2(a),5(d),11,15(b),26,33(b),34(b) 7.1 3,6,9,14,15,32,33,44, 4,8,18,31 7.2 3,11,15,24,25,28,31,39(a), 8,20,30,33,39(b) 7.3 4,12,16,21,27, 10,20,26 7.4 4,6,9,12, 8,13 7.5 2,8,24, 18,23 7.8 3(b,d),4(a,c),12,15,33,37,51,64(b),67, 3(a,c),17,36,56(f),63(c) 8.2 2,7,14,18,23,27,37,41(a),46,54(a), 12,20,28,38,41(b),47,57(b) 8.3 8,11,21,30,41,51,55, 15,32,44,50,64 8.4 3,8,20,24,29,38,41, 4,25,31,45 8.5 2,8,9,14,16,25,30,33, 7,13,32,36 8.6 56,59,66,69,72, 58,71 8.8 1(b,c),2(a,b),4,12,17,26,29,31,41,44,62, 2(c),5,30,33,49 Evaluation: Grades in this course are based upon the point total of Midterm Exam,
quizzes, Homework assignments and a comprehensive final exam (worth 200 points). The following grading scale can be used to estimate grades for individual quizzes and exams: 90% – 100% 4.0 65% – 69.9% 2.0 85% – 89.9% 3.5 60% – 64.9% 1.5 78% – 84.9% 3.0 55% – 59.9% 1.0 70% – 77.9% 2.5
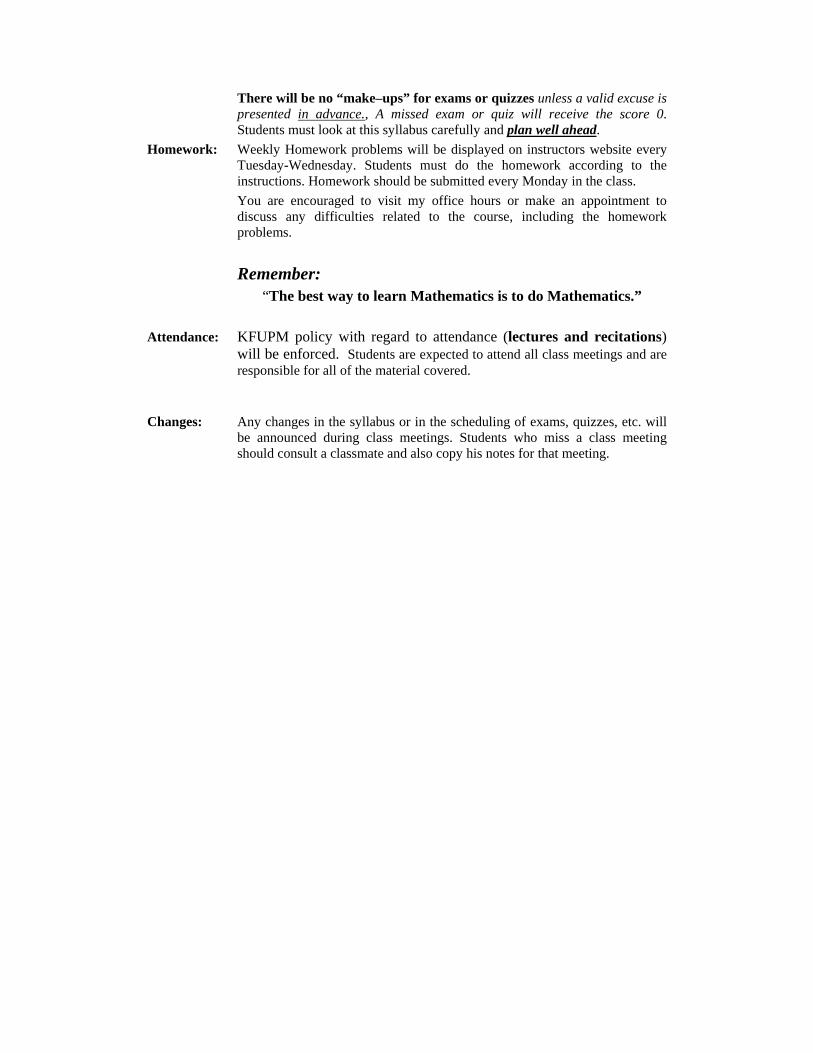
There will be no “make–ups” for exams or quizzes unless a valid excuse is presented in advance., A missed exam or quiz will receive the score 0. Students must look at this syllabus carefully and plan well ahead.
Homework: Weekly Homework problems will be displayed on instructors website every Tuesday-Wednesday. Students must do the homework according to the instructions. Homework should be submitted every Monday in the class. You are encouraged to visit my office hours or make an appointment to discuss any difficulties related to the course, including the homework problems.
Remember: “The best way to learn Mathematics is to do Mathematics.”
Attendance: KFUPM policy with regard to attendance (lectures and recitations)
will be enforced. Students are expected to attend all class meetings and are responsible for all of the material covered.
Changes: Any changes in the syllabus or in the scheduling of exams, quizzes, etc. will
be announced during class meetings. Students who miss a class meeting should consult a classmate and also copy his notes for that meeting.
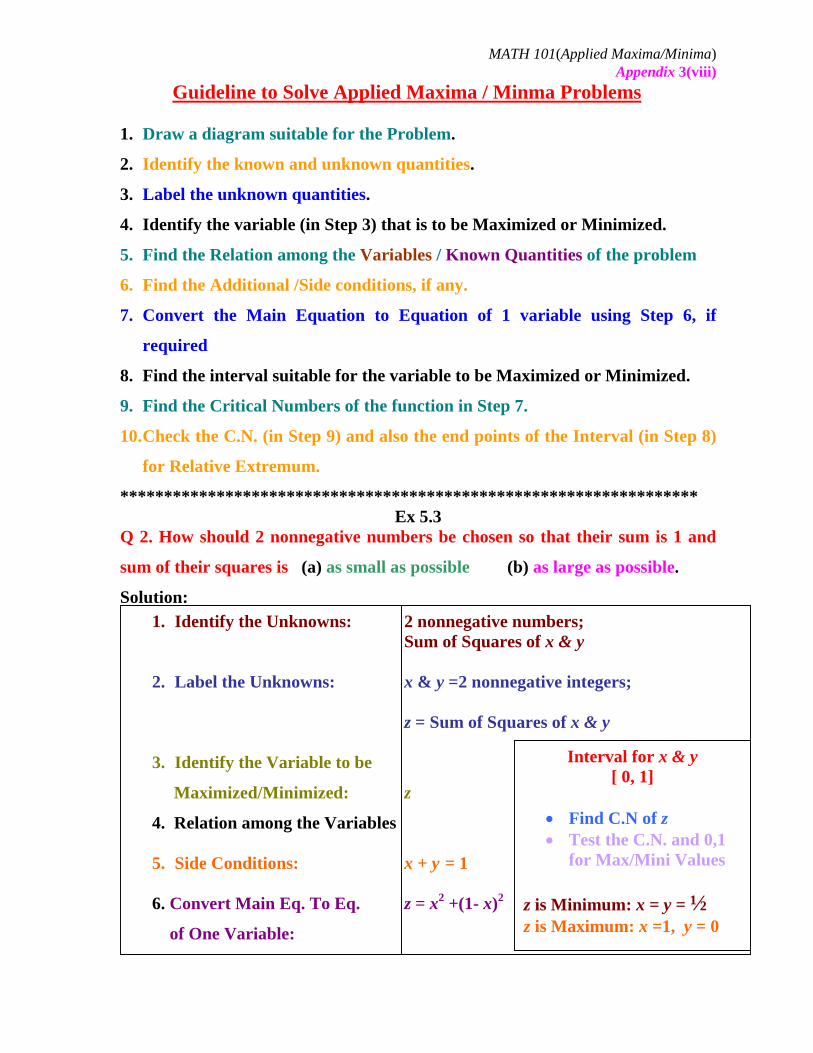
MATH 101(Applied Maxima/Minima)
Appendix 3(viii) Guideline to Solve Applied Maxima / Minma Problems
1. Draw a diagram suitable for the Problem.
2. Identify the known and unknown quantities.
3. Label the unknown quantities.
4. Identify the variable (in Step 3) that is to be Maximized or Minimized.
5. Find the Relation among the Variables / Known Quantities of the problem
6. Find the Additional /Side conditions, if any.
7. Convert the Main Equation to Equation of 1 variable using Step 6, if
required
8. Find the interval suitable for the variable to be Maximized or Minimized.
9. Find the Critical Numbers of the function in Step 7.
10. Check the C.N. (in Step 9) and also the end points of the Interval (in Step 8)
for Relative Extremum.
****************************************************************** Ex 5.3
Q 2. How should 2 nonnegative numbers be chosen so that their sum is 1 and
sum of their squares is (a) as small as possible (b) as large as possible.
Solution:
1. Identify the Unknowns: 2 nonnegative numbers; Sum of Squares of x & y
2. Label the Unknowns: x & y =2 nonnegative integers;
z = Sum of Squares of x & y
3. Identify the Variable to be
Maximized/Minimized: z
4. Relation among the Variables z = x2 + y2
5. Side Conditions: x + y = 1
6. Convert Main Eq. To Eq. z = x2 +(1- x)2
of One Variable:
Interval for x & y [ 0, 1]
• Find C.N of z • Test the C.N. and 0,1
for Max/Mini Values
z is Minimum: x = y = ½ z is Maximum: x =1, y = 0
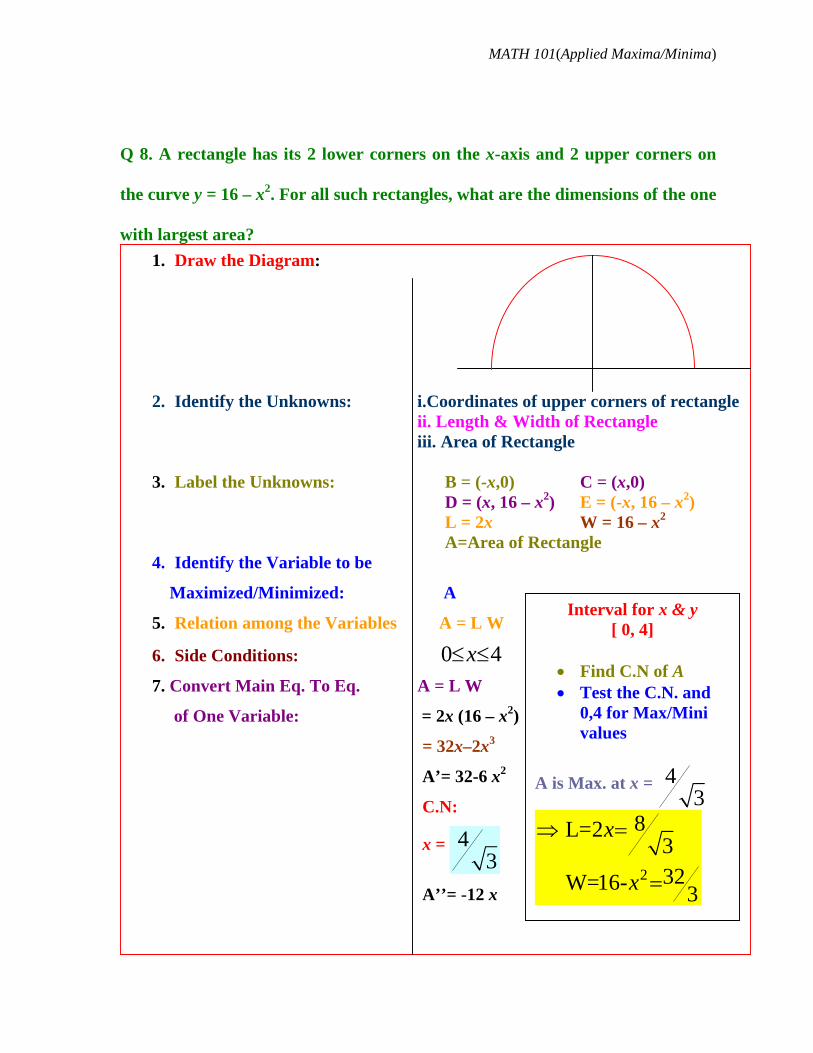
MATH 101(Applied Maxima/Minima)
Q 8. A rectangle has its 2 lower corners on the x-axis and 2 upper corners on
the curve y = 16 – x2. For all such rectangles, what are the dimensions of the one
with largest area?
1. Draw the Diagram: 2. Identify the Unknowns: i.Coordinates of upper corners of rectangle
ii. Length & Width of Rectangle iii. Area of Rectangle
3. Label the Unknowns: B = (-x,0) C = (x,0)
D = (x, 16 – x2) E = (-x, 16 – x2) L = 2x W = 16 – x2
A=Area of Rectangle 4. Identify the Variable to be
Maximized/Minimized: A
5. Relation among the Variables A = L W
6. Side Conditions: 0 4x≤ ≤
7. Convert Main Eq. To Eq. A = L W
of One Variable: = 2x (16 – x2)
= 32x–2x3
A’= 32-6 x2
C.N:
x = 43
A’’= -12 x
Interval for x & y [ 0, 4]
• Find C.N of A • Test the C.N. and
0,4 for Max/Mini values
A is Max. at x = 43
2
8 L=2332 W=16- 3
x
x
⇒ =
=
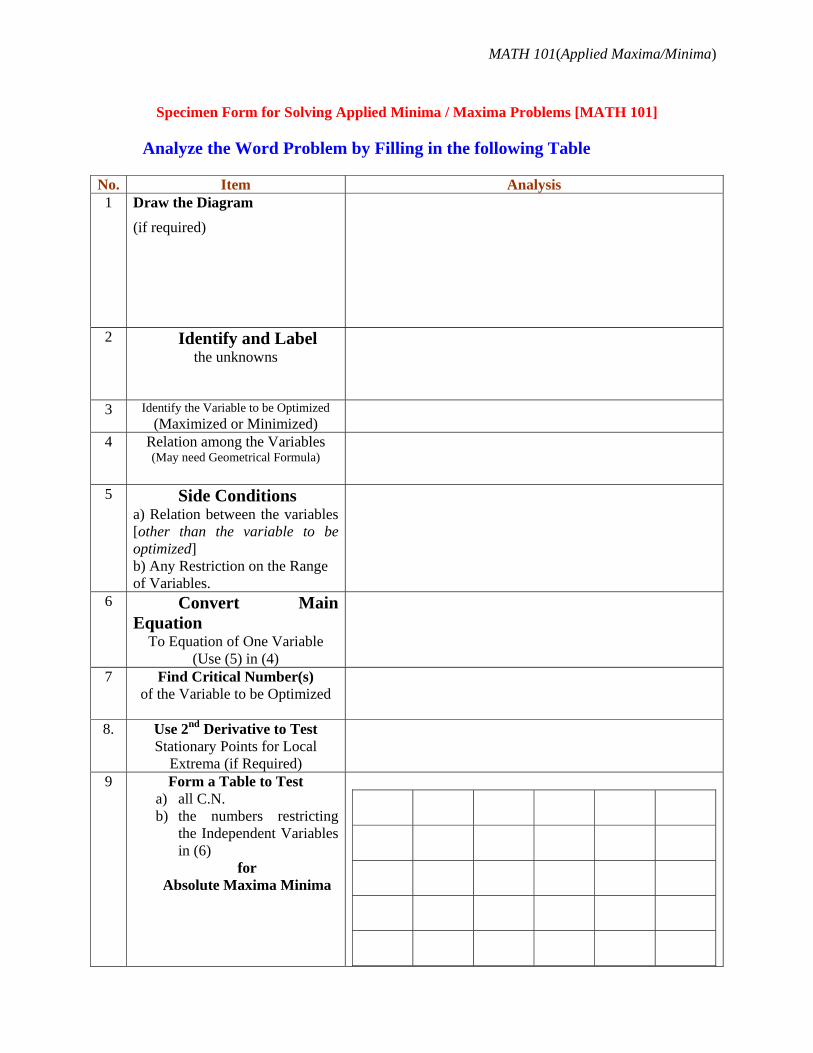
MATH 101(Applied Maxima/Minima)
Specimen Form for Solving Applied Minima / Maxima Problems [MATH 101]
Analyze the Word Problem by Filling in the following Table
No. Item Analysis 1 Draw the Diagram
(if required)
2 Identify and Label the unknowns
3 Identify the Variable to be Optimized (Maximized or Minimized)
4 Relation among the Variables (May need Geometrical Formula)
5 Side Conditions a) Relation between the variables [other than the variable to be optimized] b) Any Restriction on the Range of Variables.
6 Convert Main Equation
To Equation of One Variable (Use (5) in (4)
7 Find Critical Number(s) of the Variable to be Optimized
8. Use 2nd Derivative to Test
Stationary Points for Local Extrema (if Required)
9 Form a Table to Test
a) all C.N. b) the numbers restricting
the Independent Variables in (6)
for Absolute Maxima Minima
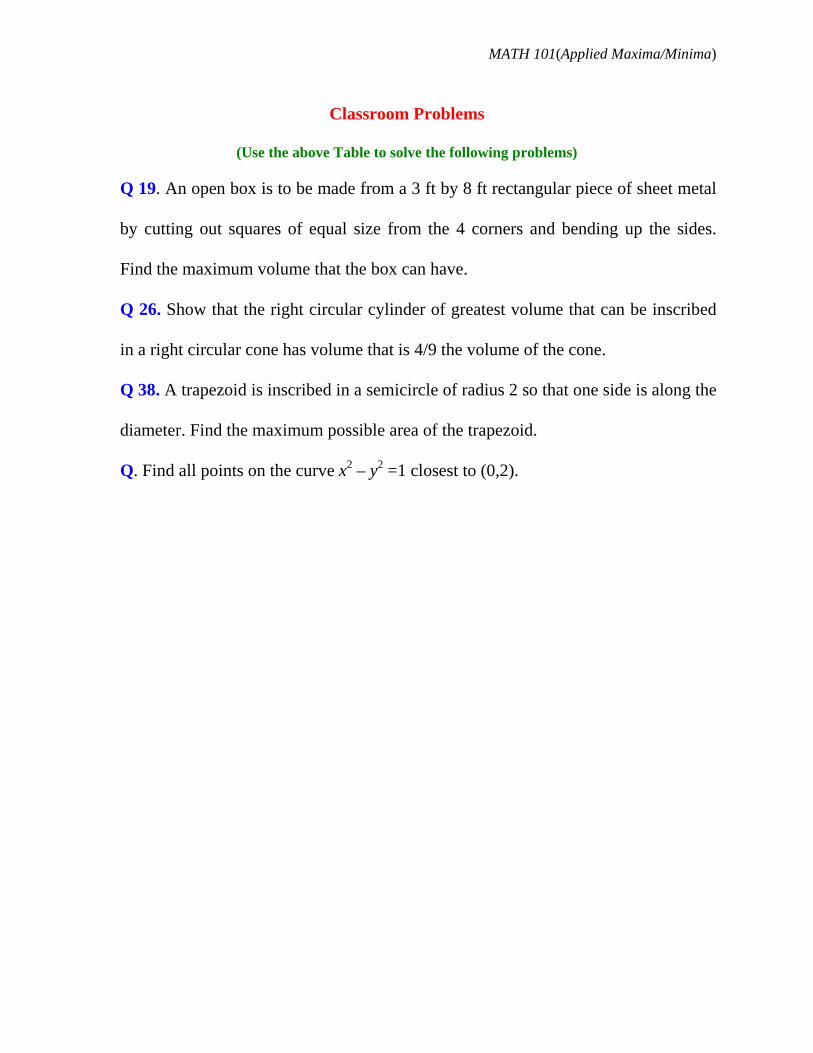
MATH 101(Applied Maxima/Minima)
Classroom Problems
(Use the above Table to solve the following problems)
Q 19. An open box is to be made from a 3 ft by 8 ft rectangular piece of sheet metal
by cutting out squares of equal size from the 4 corners and bending up the sides.
Find the maximum volume that the box can have.
Q 26. Show that the right circular cylinder of greatest volume that can be inscribed
in a right circular cone has volume that is 4/9 the volume of the cone.
Q 38. A trapezoid is inscribed in a semicircle of radius 2 so that one side is along the
diameter. Find the maximum possible area of the trapezoid.
Q. Find all points on the curve x2 – y2 =1 closest to (0,2).
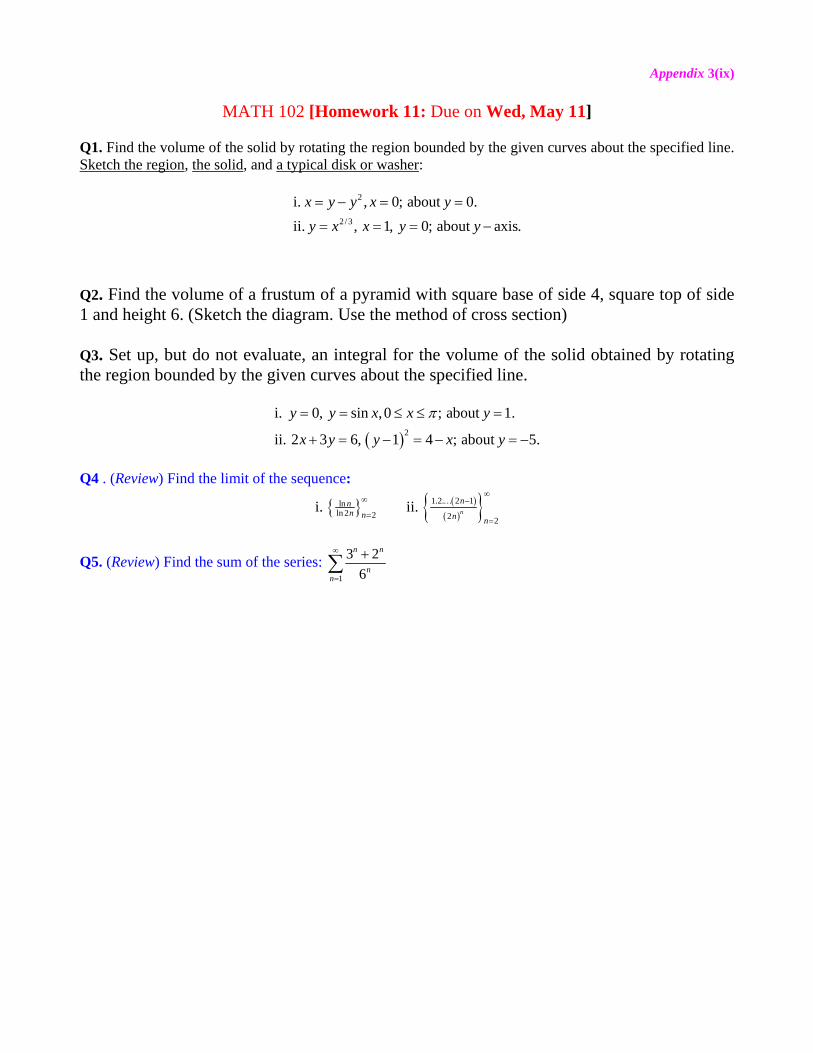
Appendix 3(ix)
MATH 102 [Homework 11: Due on Wed, May 11]
Q1. Find the volume of the solid by rotating the region bounded by the given curves about the specified line. Sketch the region, the solid, and a typical disk or washer:
2
2 /3
i. , 0; about 0.ii. , 1, 0; about axis.
x y y x yy x x y y= − = =
= = = −
Q2. Find the volume of a frustum of a pyramid with square base of side 4, square top of side 1 and height 6. (Sketch the diagram. Use the method of cross section) Q3. Set up, but do not evaluate, an integral for the volume of the solid obtained by rotating the region bounded by the given curves about the specified line.
( )2
i. 0, sin ,0 ; about 1.
ii. 2 3 6, 1 4 ; about 5.
y y x x y
x y y x y
π= = ≤ ≤ =
+ = − = − = −
Q4 . (Review) Find the limit of the sequence:
{ } ( )( ){ }1.2. 2 1ln
ln 2 2 2 2i. ii. n
nnn n n n
∞∞ −
==
…
Q5. (Review) Find the sum of the series: 1
3 26
n n
nn
∞
=
+∑
![Lecture 17 Lambda Calculus [0.5em] (Origin of Programming ...prl.korea.ac.kr/~pronto/home/courses/cose212/2018/slides/lec17.pdf · Lambda Calculus ( -Calculus) By removing all syntactic](https://img.pdfslide.us/doc/110x75/5fb2b5193e095c5efe6ac4f9/lecture-17-lambda-calculus-05em-origin-of-programming-prlkoreaackrprontohomecoursescose2122018slideslec17pdf.jpg)