Embed Size (px)
Citation preview

Journal of Statistics Education, Volume 23, Number 1 (2015)
1
Student Performance and Success Factors in Learning Business
Statistics in Online vs. On-ground Classes using a Web-Based
Assessment Platform
Mary Shotwell
Charles H. Apigian
Middle Tennessee State University
Journal of Statistics Education Volume 23, Number 1 (2015),
www.amstat.org/publications/jse/v23n1/shotwell.pdf
Copyright © 2015 by Mary Shotwell and Charles H. Apigian, all rights reserved. This text may
be freely shared among individuals, but it may not be republished in any medium without
express written consent from the authors and advance notification of the editor.
Key Words: Online assessment; Homework manager; Learning preferences.
Abstract
This study aimed to quantify the influence of student attributes, coursework resources, and
online assessments on student learning in business statistics. Surveys were administered to
students at the completion of both online and on-ground classes, covering student perception and
utilization of internal and external academic resources, as well as intrinsic motivating factors for
success in the course. Student performance as defined by quality points, various assignment
points, and time spent on assignments, was not significantly different between on-ground and
online students. However, use of resources and tools to complete homework and learn new topics
differed. As a whole, students predominantly utilized homework as the first tool to learn new
topics and complete homework, suggesting a paradigm shift in the way instructors should cater
to student’s learning habits.
1. Introduction
It has become the new standard for universities and colleges across the country to offer online
versions of their courses. During the progression of online course offerings, a vast number of
studies have been conducted to compare online courses with their traditional lecture
counterparts, including courses in education (Kirtman 2009), elementary statistics (Ward 2004),
and business statistics (Dutton and Dutton 2005). A website motivated by Thomas Russell’s
book The No Significant Difference Phenomenon (1999) highlights and updates the

Journal of Statistics Education, Volume 23, Number 1 (2015)
2
overwhelming majority of studies concluding no differences in performance outcomes between
online (or hybrid) and traditional courses (www.nosignificantdifference.org).
Other areas of online course research have focused on the creation, technique, and
implementation of course material (Salmon 2004; D’Orsie and Day 2006), engaging students in
the online environment (Oliver 1999), and finding differences in student composition (Dutton,
Dutton, and Perry 2002; Dutton and Dutton 2005). Dutton and Dutton (2005) found that students
across online and lecture offerings of business statistics were demographically and academically
similar, with the only differences being a higher grade point average (GPA) and level of maturity
of students in the online course.
Although these are important avenues to address when comparing course delivery modes, it is
additionally important to determine how students learn material and complete assignments.
Much emphasis has been placed on identifying student learning styles. Several learning style
models exist, including Myers-Briggs Type IndicatorTM (Myers and Myers 1980),
Kolb/McCarthy Learning Cycle (Kolb 1981), Felder-Silverman Model (Felder and Silverman
1988; Felder 1993), and Gardner’s Multiple Intelligences theory (1983). Montgomery and Groat
(1998) summarize several of these learning styles and discuss their implications for educators,
suggesting teachers can use knowledge of learning styles to their advantage. According to Guterl
(2013), over 70 hypotheses on learning styles exist, with few peer-reviewed studies supporting
advantages to identifying and implementing these styles in teaching strategies. Guterl’s article
quotes Daniel Willingham of the University of Virginia stating, “It’s the material, not the
differences among the students, that ought to be the determinant of how the teacher is going to
present a lesson.”
With so much emphasis on presenting the material, studies on the usefulness of student resources
are sparse. No longer do students work solely out of the classic textbook, but have multiple
materials at hand—e-books, Internet, homework management tools, discussion boards, etc.
Increasing technological advances mean increasing media with which to learn, but they do not
necessarily translate to better ways of learning. McNeish, Foster, Francescucci, and West (2012)
found that students surprisingly still prefer printed textbooks, and such preference translates to
students finding e-textbooks unsatisfactory in the benefits they provide. This coincides with
other studies supporting printed textbooks (Li, Poe, Potter, Quigley, and Wilson 2011; Thayer et
al. 2011). The recent advent of homework managers brings about new avenues for learning.
Bonham, Deardorff, and Beichner (2003) compared computer and paper homework and found no
difference in conceptual learning measures. Lenz (2010) reported that students have a higher
affinity to attempt web-based homework and perform better than using the standard paper and
pencil homework, but performance on exams did not change. Grinder (2008) reported improved
test scores when students had the ability to not only check their answers in a homework manager,
but additionally see the process in getting the answer using FlashTM movies. Gaffney, Ryan, and
Wurst (2010) reported no difference in exam scores even when the answer process was given,
but did see improvement in written cases and the comprehensive accounting cycle problem in
finance courses. With these mixed results, it is imperative to analyze all resources collectively
that students have at hand and assess student value and perception of these resources.

Journal of Statistics Education, Volume 23, Number 1 (2015)
3
The evolution of the introductory Business Statistics courses to include new resources such as
McGraw Hill’s Connect homework manager led to this study’s three goals: (1) to compare
student performance in the online versus on-ground introductory Business Statistics course using
quality points, assignment points, and time spent on assignments; (2) to investigate possible
factors, including steps taken and resources used, to learn material and complete assignments;
and (3) to identify student learning preferences for the course. Knowing the mechanisms used to
learn material may help in identifying additional student success factors in an online course
versus the on-ground equivalent. Determining student success factors can directly help with
student course selection, faculty advising, course delivery, and development of academic
requirements for online course registration.
2. The Courses
This study looked at the two-course sequence of business statistics within the College of
Business at a mid-size public university. The courses have been traditionally taught in an on-
campus environment to all business majors. The first course, taught at the sophomore level,
covers foundational principles of statistics, such as descriptive statistics, probability, normal
distribution and one-sample hypothesis testing. The second course, at the junior level, starts with
hypothesis testing and includes ANOVA, regression, and several other hypothesis tests. These
courses have been traditionally taught within a classroom setting with no more than 43 students
per class in a lecture format. Each instructor made his or her own homework assignments, tests,
and presentation materials.
Both courses were redesigned to incorporate a new textbook, an online homework manager, and
standardized tests and assignments. Online courses were also developed to include online video
instruction and tutorials utilizing Prezi (www.prezi.com) and Adobe Captivate
(www.adobe.com/products/captivate.html). However, online video tutorials were provided for
both class structures. Videos ranged from 5 to 10 minutes and were organized and available
through the online class management system, Desire2Learn (www.desire2learn.com).
The online homework manager used was McGraw-Hill Connect, incorporated directly with the
adopted textbook. All students had to use Connect to complete homework. Most problems were
algorithmically generated, ensuring that each student had a different set of numbers or data for
each question. Most of the problems were fill-in-the-blank, with some key concepts as multiple
choice questions. Each student was also allowed to check the answer twice per question without
penalty and receive feedback with explanations after submitting the homework assignment.
Points were earned based on correct responses. They were then given a second attempt at the
entire homework assignment, if they chose to do so, and the higher grade of the two attempts
was recorded.
McGraw-Hill Connect’s homework manager additionally has a learning tool called LearnSmart.
This tool quizzes students on topics and concepts from the book and awards points based on
participation. For example, to receive a perfect score of 10, a student would need to answer a
total of 10 questions correctly, with as many questions needed to achieve 10 correct answers.
Upon reaching 10, a perfect score was received.

Journal of Statistics Education, Volume 23, Number 1 (2015)
4
McGraw-Hill Connect also includes an e-book, which allows direct access to content within the
book to aid in answering the questions. Students had the choice of purchasing the hard copy of
the book, which came with a license for McGraw-Hill Connect, or buying the online option of e-
book and McGraw-Hill Connect. Both options included the e-book and gave students instant
access to material when completing their homework.
3. Methodology
3.1 Sample
The study sample of 138 included 68 female and 70 male students, but did not include students
that did not finish the semester or fill out the survey. The three Statistical Methods 1 courses
included 72 students and the second course totaled 66 students. Most students in the first course
(on-ground and online) were sophomores and juniors, while the second statistical methods
courses comprised of juniors and seniors. It is interesting to note that all students in the online
Statistical Methods 2 course were seniors. Also, the majority of all sampled students (52%) had
completed an online course before and 81% had used the McGraw-Hill Connect homework
manager (Table 1).
Table 1. Course section student numbers by gender, class rank, and previous experience.
OG1-1 OG1-2 OL1-3 OG2-4 OG2-5 OL2-6 Grand Total
Gender
Female 14 15 8 12 12 7 68 (49.3%)
Male 15 13 7 12 16 7 70 (50.7%)
Class Rank
Sophomore 6 11 1 0 0 0 18 (13.0%)
Junior 17 11 5 10 12 0 55 (39.9%)
Senior 6 6 9 14 16 14 65 (47.1%)
Q1* …completed a distance education (online) course prior to this semester
N 14 17 3 13 17 1 65
Y 14 11 12 11 10 13 71
Q2 …used Connect in a class before?
N 7 7 4 3 3 2 26 (18.8%)
Y 22 21 11 21 25 12 112 (81.2%)
Total 29 28 15 24 28 14 138
Classes are categorized by on-ground statistical methods 1 (OG1), online statistical methods 1 (OL1),
on-ground statistical methods 2 (OG2), and online statistical methods 2 (OL2). The number after each
dash represents a different section of the course.
*Note: Two respondents did not answer Question 1
Data could only be linked to students through their university identification number. If students
did not provide this or if they did not fill out a survey, they could not be matched with their
course performance (n = 38). Students who withdrew from the course were not included, nor did
they participate in the survey (n = 7).

Journal of Statistics Education, Volume 23, Number 1 (2015)
5
The overall average GPA for all students was a 3.002, with each class ranging from 2.884 to
3.026 (Table 2). Also included in Table 2 is the performance within the class, which includes
LearnSmart (LS), homework (HW), time spent on LearnSmart, and quality points for the class.
Quality points at this institution are calculated on a 4.0 scale with an A equaling a 4.0, a B
equaling a 3.0 and so on. This institution also includes plus and minus grades, which equate to a
0.33 increase or decrease in the QP. For example a C would equal 2.0, a C+ would be a 2.33 and
a C- would equal 1.67. It is expected that hours would vary from the first to the second course,
but it is interesting to note the difference between online and on-ground hours (Hours in Table
2), with the average for OL2-6 extremely high at 142.69 hours (a student at this institution needs
120 hours to graduate).
Table 2. Averages for performance in the class, GPA, and Hours.
Count GPA Hours
LS Points
(out of 100)
HW Points
(out of 300)
LS
Time* QP
OG1-1 29 2.893 89.79 84.03 218.67 13.49 2.56
OG1-2 28 3.131 83.14 91.58 250.13 13.89 2.88
OL1-3 15 2.884 100.29 92.28 226.87 13.24 2.29
OG2-4 28 2.932 112.07 90.83 235.60 16.12 3.12
OG2-5 24 3.135 111.53 89.68 238.72 16.40 3.18
OL2-6 14 3.002 142.69 88.35 226.62 19.09 2.74
On-ground 109 3.018 98.59 88.92 235.51 14.90 2.93
Online 29 2.941 120.76 90.38 226.75 16.06 2.50
Grand Total 138 3.002 103.25 89.23 233.67 15.15 2.84 Classes are categorized by on-ground statistical methods 1 (OG1), online statistical methods 1 (OL1),
on-ground statistical methods 2 (OG2), and online statistical methods 2 (OL2). The number after each
dash represents a different section of the course.
*Note: LS Time refers to minutes per Learn Smart assignment
3.2 Data collection and measures
To measure student performance and success factors between online and on-ground classes, a
survey (Appendix A) was administered and completed by 138 students in 6 classes. A total of
three Statistical Methods 1 courses (2 on-ground and 1 online) and 3 Statistical Methods 2
courses (2 on-ground and 1 online) were surveyed at the end of the fifteen-week 2013 fall
semester. The survey asked students to rank the resources and tools (in order) used to learn
topics and complete assignments. They were also asked about agreement to statements based on
the five-point Likert scale regarding frequency of accessing tools, coursework, and personnel
resources, as well as learning preferences. Survey statements were adapted from Dutton and
Dutton (2005) and Dutton et al. (2002) to include resources specific to the study.
3.3 Analysis methods
To further compare responses between online and on-ground courses, the survey responses were
then integrated with student course performance as defined by final letter grades (quality points),
assignment points, LearnSmart points, and time spent online using LearnSmart. For each course,

Journal of Statistics Education, Volume 23, Number 1 (2015)
6
all homework and LearnSmart assignments were the same in terms of questions and points (30%
and 10% of course grade respectively), and letter grades were assigned based on a standard cut-
off of percentages, making comparisons possible. LearnSmart time equaled the time it took
students to complete the course of flashcards for each section. Students may log on and off
multiple times, but the time ‘clock’ only recorded when the LearnSmart flashcards were open.
All on-ground courses were taught by the same instructor, while online courses were split
amongst two instructors. The only subjective portion of the online course was in grading the
exams (60% of course grade). Therefore, exam grades were not individually examined as
performance measures.
Questionnaire groupings were identified based on specific topics for homework, technology use,
textbook use, extra help, class instruction, flexibility to learn, and personal contact as prescribed
in previous research (Dutton and Dutton 2005). These groupings allowed us to compare online
vs. on-ground learning preferences and coursework resources (Appendix B).
4. Results
To identify differences between online and on-ground students, answers were compared for all
survey questions. The first set of questions stressed the weekly habits of students (Table 3).
These four questions looked at the frequency a student visited Connect, viewed online course
content (available for all classes online and on-ground in Desire2Learn), emailed the instructor,
and utilized the statistics tutoring lab. The Stats Lab comprised of graduate assistants providing
free tutoring sessions in person (in 30 minute increments) to all statistics students Monday
through Friday on campus within the department. Most students indicated they visited Connect
and the online content between 1 and 4 times. The Stats Lab was not used by more than 80% of
the students and the frequency of emailing the instructor did vary based on the type of class
(online or on-ground).

Journal of Statistics Education, Volume 23, Number 1 (2015)
7
Table 3. Student activity per week.
On average, about how many times per week did you …
Never
Between
1 and 4
Between
5 and 10
More
than 10
Visit the
course section
on Connect
OG1 0.0% 93.0% 7.0% 0.0%
OL1 0.0% 93.3% 6.7% 0.0%
OG2 0.0% 86.5% 9.6% 3.8%
OL2 0.0% 78.6% 21.4% 0.0%
Visit the
course
material on
D2L
OG1 10.5% 71.9% 15.8% 1.8%
OL1 0.0% 80.0% 20.0% 0.0%
OG2 19.2% 57.7% 19.2% 3.8%
OL2 7.1% 78.6% 14.3% 0.0%
Visit the Stats
Lab
OG1 84.2% 5.3% 5.3% 3.5%
OL1 73.3% 13.3% 6.7% 6.7%
OG2 84.6% 13.5% 1.9% 0.0%
OL2 85.7% 14.3% 0.0% 0.0%
Email the
instructor
OG1 50.9% 43.9% 3.5% 1.8%
OL1 13.3% 66.7% 20.0% 0.0%
OG2 50.0% 50.0% 0.0% 0.0%
OL2 28.6% 57.1% 14.3% 0.0%
For the next areas of analysis, t-tests were performed in a few different areas: 1) performance; 2)
order of preference of material and tools; and 3) motivating factors. These three areas offer
insight not only to the differences and similarities between these two types of instruction, but
also help to better understand the motives and habits of today’s student. F-tests were performed
first to test for equality of variances. The appropriate t-test statistic was then chosen and reported
here. A significance level of 0.05 was used for all testing procedures.
4.1 Performance factors and their differences between online and on-ground
courses
We compared a student’s performance in the class based on online versus on-ground instruction
by performing t-tests for differences (Table 4). To measure performance, the quality points for
the letter grade, current GPA (as of the end of their semester), points earned for homework
assignments and LearnSmart assignments, and time spent on LearnSmart were compared. As
indicated in Table 4, there were no significant differences between current GPA (p = 0.510),
points earned on LearnSmart (p = 0.696), points earned on homework assignments (p = 0.450),
and time spent on LearnSmart (p = 0.439). The difference in quality points between online and
on-ground students initially looked to be large with on-ground students (2.926) performing better
than online (2.505), but was not statistically significant (p = 0.080).

Journal of Statistics Education, Volume 23, Number 1 (2015)
8
Table 4. Performance and use in class and school between online and on-ground courses.
Performance in class and school Online On-ground Differences
Quality Points for Class �̅� = 2.505
s = 1.433
�̅� = 2.926
s = 1.052
t = -1.767
(0.080)
Current GPA �̅� = 2.941
s = 0.509
�̅� = 3.017
s = 0.563
t = -0.661
(0.510)
LearnSmart Total Points Earned �̅� = 90.383
s = 15.519
�̅� = 88.918
s = 18.495
t = 0.391
(0.696)
HW Assignment Points Earned �̅� = 226.751
s = 64.305
�̅� = 235.513
s = 52.800
t = -0.757
(0.450)
Total Time Spent on LearnSmart �̅� = 23:07.98
s = 09:17.27
�̅� = 21:28.08
s = 10:29:67
t = 0.777
(0.439)
4.2 Preferences of use for materials and tools for learning and completing work
As part of our analysis, the survey asked students to rank six resources and tools (Table 5) used
to either learn new topics or complete assignments. Students were to assign each resource or tool
a 1 if used first and a 6 if used last, with ranking between 2 and 5 for other varying degrees of
use. The resources or tools offered for ranking included homework assignments, LearnSmart, use
of textbook, online video tutorials, other Connect material, and other uses of the Internet. ‘Use of
Textbook’ referred to a hard copy of the assigned textbook, and ‘Other Connect Material’
referred to the e-book and other tutorials that were available within Connect. The video lectures
and tutorials in Desire2Learn comprised the online video tutorials. Lastly, the use of the Internet
referred to any other materials that were not part of the class management system or Connect.
Table 5. Order of preference to learn topics and complete coursework based on the means of
rank orderings. () indicates overall order of ranking.
Resources/Tools To learn new
topics
To complete
work
Assignments �̅� = 2.182 (1)
s = 1.629
�̅� = 2.030 (1)
s = 1.727
LearnSmart �̅� = 2.964 (2)
s = 1.307
�̅� = 2.526 (2)
s = 1.19
Use of Textbook �̅� = 3.277 (3)
s = 1.375
�̅� = 3.614 (3)
s = 1.319
Online
Video Tutorials �̅� = 4.073 (4)
s = 1.527
�̅� = 4.197 (4)
s = 1.395
Other
Connect Material �̅� = 4.270 (6)
s = 1.769
�̅� = 4.121 (5)
s = 1.642
Use of Internet �̅� = 4.219 (5)
s = 1.542
�̅� = 4.366 (6)
s = 1.510

Journal of Statistics Education, Volume 23, Number 1 (2015)
9
As indicated in Table 5, students tend to go to the assignment first (2.182 for new topics and
2.030 for completing work), followed by LearnSmart, and then the textbook. The last three
resources or tools were the online content, either through D2L (online course management
system) or Connect, and other sources on the Internet.
There were differences between online and on-ground students in the order they viewed tools or
resources (Table 6). The order does not change much, but the varying degree of first preference
is statistically significant. In terms of learning new topics, LearnSmart (p = 0.696), use of
Internet (p = 0.281), and use of textbook (p = 0.059) were not significantly different.
Assignments (0.002), other Connect material (p = 0.017), and D2L content (p = 0.000) were
significantly different. Online students indicated their rankings for use of textbook, assignments,
D2L content, and LearnSmart to be the most preferred, with the range of these four tools or
resources being 2.714 to 3.071. Other Connect material and the use of the Internet were far
behind at 4.821 and 4.500.
Table 6. Differences between tools and materials used to learn new topics between online and
on-ground courses.
Resources/Tools Online On-ground Significance
LearnSmart �̅� = 3.071 (4)
s = 1.804
�̅� = 2.936 (2)
s = 1.589
t = 0.392
(0.696)
Assignments �̅� = 2.857 (2)
s = 1.297
�̅� = 2.009 (1)
s = 1.258
t = 3.161
(0.002)
Other Connect Material �̅� = 4.821 (6)
s = 1.249
�̅� = 4.128 (4)
s = 1.375
t = 2.422
(0.017)
Online Video Tutorials �̅� = 3.036 (3)
s = 1.527
�̅� = 4.339 (6)
s = 1.416
t = -4.277
(0.000)
Use of Textbook �̅� = 2.714 (1)
s = 1.697
�̅� = 3.422 (3)
s = 1.765
t = -1.907
(0.059)
Use of Internet �̅� = 4.500 (5)
s = 1.453
�̅� = 4.147 (5)
s = 1.562
t = 1.082
(0.281)
On-ground students overwhelming went to their assignments (2.009) first with the next highest
being LearnSmart (2.936). Next came the use of the textbook (3.422), followed by the other
Connect material, use of the Internet, and then D2L content.
Table 7 shows the equivalent summary for preferences in completing work. Although there was
no difference in ranking for LearnSmart (p = 0.373), it was still indicated that students in online
courses have an even higher preference for going straight to the assignment to complete the work
(p = 0.006), regardless of whether they know the material or not. The other resources (other
Connect, D2L content, textbook, and Internet) were also significantly different, with use of
textbook and D2L content having a higher preference for online students as opposed to on-ground.

Journal of Statistics Education, Volume 23, Number 1 (2015)
10
Table 7. Differences between tools and materials used to complete assignments between online
and on-ground courses.
Resources/Tools Online On-ground Significance
LearnSmart �̅� = 2.786 (2)
s = 1.729
�̅� = 2.458 (2)
s = 1.728
t = 0.893
(0.373)
Assignments �̅� = 2.571 (1)
s = 1.345
�̅� = 1.888 (1)
s = 1.110
t = 2.772
(0.006)
Other Connect Material �̅� = 4.500 (5)
s = 1.106
�̅� = 4.019 (4)
s = 1.358
t = 1.724
(0.087)
Online Video Tutorials �̅� = 3.429 (4)
s = 1.526
�̅� = 4.404 (6)
s = 1.289
t = -3.415
(0.001)
Use of Textbook �̅� = 2.893 (3)
s = 1.729
�̅� = 3.808 (3)
s = 1.571
t = -2.617
(0.008)
Use of Internet �̅� = 4.821 (6)
s = 1.467
�̅� = 4.243 (5)
s = 1.505
t = 1.814
(0.072)
4.3 Differences of Coursework and Learning Preferences
Students were given several statements that pertained to their motivating factors for learning and
completing coursework. Based on the Likert scale, students were to determine their agreement
from strongly disagree (1) to strongly agree (5) (See Appendix A for questionnaire). After
grouping the data (see Appendix B), tests (as described in Section 4) were performed to indicate
differences between online and on-ground courses (Table 8).
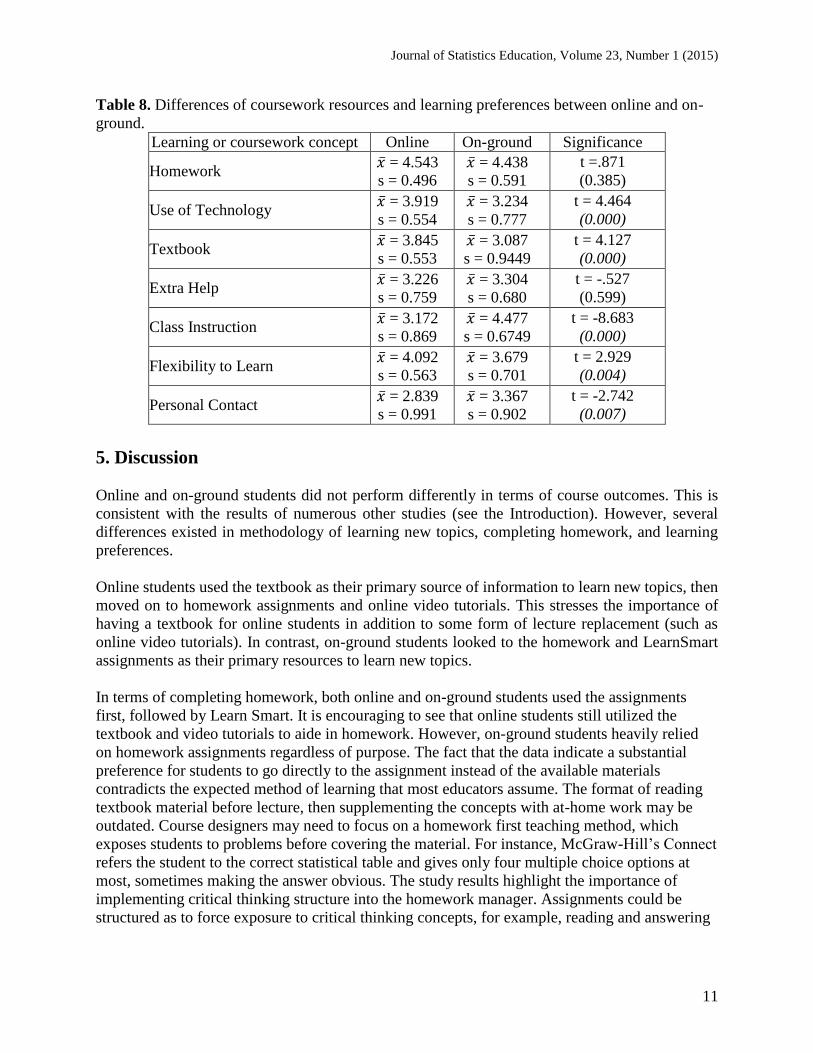
Homework and extra help were the only concepts not significantly different between the two
types of classes. For homework, based on the mean of its four items, students felt homework
assignments were useful (4.543 for online and 4.438 for on-ground). Students were neutral on
the usefulness of extra help.
The other five concepts showed a significant difference between online and on-ground.
Technology use and the textbook were indicated as more useful to online students than on-
ground. For on-ground students, it was indicated that class instruction and personal contact were
more useful.
Journal of Statistics Education, Volume 23, Number 1 (2015)
11
Table 8. Differences of coursework resources and learning preferences between online and on-
ground.
Learning or coursework concept Online On-ground Significance
Homework �̅� = 4.543
s = 0.496
�̅� = 4.438
s = 0.591
t =.871
(0.385)
Use of Technology �̅� = 3.919
s = 0.554
�̅� = 3.234
s = 0.777
t = 4.464
(0.000)
Textbook �̅� = 3.845
s = 0.553
�̅� = 3.087
s = 0.9449
t = 4.127
(0.000)
Extra Help �̅� = 3.226
s = 0.759
�̅� = 3.304
s = 0.680
t = -.527
(0.599)
Class Instruction �̅� = 3.172
s = 0.869
�̅� = 4.477
s = 0.6749
t = -8.683
(0.000)
Flexibility to Learn �̅� = 4.092
s = 0.563
�̅� = 3.679
s = 0.701
t = 2.929
(0.004)
Personal Contact �̅� = 2.839
s = 0.991
�̅� = 3.367
s = 0.902
t = -2.742
(0.007)
5. Discussion
Online and on-ground students did not perform differently in terms of course outcomes. This is
consistent with the results of numerous other studies (see the Introduction). However, several
differences existed in methodology of learning new topics, completing homework, and learning
preferences.
Online students used the textbook as their primary source of information to learn new topics, then
moved on to homework assignments and online video tutorials. This stresses the importance of
having a textbook for online students in addition to some form of lecture replacement (such as
online video tutorials). In contrast, on-ground students looked to the homework and LearnSmart
assignments as their primary resources to learn new topics.
In terms of completing homework, both online and on-ground students used the assignments
first, followed by Learn Smart. It is encouraging to see that online students still utilized the
textbook and video tutorials to aide in homework. However, on-ground students heavily relied
on homework assignments regardless of purpose. The fact that the data indicate a substantial
preference for students to go directly to the assignment instead of the available materials
contradicts the expected method of learning that most educators assume. The format of reading
textbook material before lecture, then supplementing the concepts with at-home work may be
outdated. Course designers may need to focus on a homework first teaching method, which
exposes students to problems before covering the material. For instance, McGraw-Hill’s Connect
refers the student to the correct statistical table and gives only four multiple choice options at
most, sometimes making the answer obvious. The study results highlight the importance of
implementing critical thinking structure into the homework manager. Assignments could be
structured as to force exposure to critical thinking concepts, for example, reading and answering

Journal of Statistics Education, Volume 23, Number 1 (2015)
12
contextual questions first before encountering problems to solve, or having to choose the
appropriate test without answer guidance.
It seems students are good at gauging the type of class to enroll in based on their learning
preferences. Based on the survey, students from both groups found the homework assignments to
be most helpful. This is reflected in the fact that collectively they went to the homework
assignments first to both learn new concepts and complete assignments. However, several
differences did exist. Online students have catered to their own set of learning preferences, opting
for schedule flexibility and utilization of multiple resources. When given the same resources, on-
ground students tended to de-emphasize such materials and placed high emphasis on class
instruction for content outside of homework. This may not be surprising, but is useful in guiding
an undecided student to the type of class during enrollment.
6. Conclusion
This study examined the mechanisms used to learn coursework material and complete homework,
as well as student success factors in completing online and on-ground business statistics. The
research findings suggest that students displaying more resourcefulness and desire for flexibility
should be guided toward online courses, as opposed to students heavily relying on the face-to-face
contact present in the lecture format. The findings also suggest a change in the way educators
should view the habits of their students from learning and then trying assignments to trying
assignments and then learning the material to complete the assignment. The implications for this
are quite interesting if this information is embraced and educators cater to students’ habits by
creating homework assignments that enable students to learn the material as they go. Further
research should include the implementation of this new approach to learning concepts, and
comparing student outcomes and preferences between the standard and new approach.

Journal of Statistics Education, Volume 23, Number 1 (2015)
13
Appendix A
Student survey administered to both online and on-ground students.
Student Activity Questionnaire Please answer these questions based on your experience and perceptions of this course. There are no right or wrong
answers and this is completely voluntary and you may stop at any time.
Please circle the best answer for each question.
1. Have you successfully completed a distance education (online) course prior to
this semester?
Yes No
2. Have you used Connect in a class before? Yes No
3. What percentage of your computer work for this course did you do in each of the following places (percentages
should total 100%):
Computer lab in BAS ________________
Computer labs elsewhere on campus ________________
In your home or apartment off campus ________________
In your home or apartment off campus ________________
In your home or apartment off campus ________________
Other:
Please State_________________________
________________
Total (100%)
For questions 4 – 7, please indicate the number of times that
have used/visited the following resources:
Never Between
1 and 4
Between
5 and 10
More than
10
4. On average, about how many times per week did you visit
the course section on Connect? 1 2 3 4
5. On average, about how many times per week did you visit
the course material on D2L? 1 2 3 4
6. During the semester, how many times did you consult the
Stats Lab? 1 2 3 4
7. During the semester, how many times did you email the
instructor? 1 2 3 4
Never A few
At least
once each
question
Multiple
times per
question
8. How often do you leave an assignment to review
additional material or to stop before completion? 1 2 3 4

Journal of Statistics Education, Volume 23, Number 1 (2015)
14
9. Rank the following resources from 1 (used first) to 6 (used last) in:
Order for learning new
topics (1 – 6)
Order for completing
assignments (1-6)
Learn Smart _________ _________
Assignment Problems _________ _________
Other Connect Materials _________ _________
Course Content in D2L _________ _________
Textbook _________ _________
Internet _________ _________
Coursework and Personnel Resources
Answer questions 10 – 23 based on your agreement to the following statements.
I found …
Strongly
Disagree Disagree Neutral Agree
Strongly
Agree
10. …the Learn Smart assignments useful in learning
the course material. 1 2 3 4 5
11. …the homework assignment problems useful in
learning the course material. 1 2 3 4 5
12. …the homework guided examples useful in
learning the course material. 1 2 3 4 5
13. …the homework two attempts useful in learning
the course material. 1 2 3 4 5
14. …the ‘check my work’ option in Connect useful
in learning the course material. 1 2 3 4 5
15. …other Connect materials useful in learning the
course material. 1 2 3 4 5
16. …course content in D2L useful in learning the
course material. 1 2 3 4 5
17. …the Excel tutorials in D2L useful in learning
the course material. 1 2 3 4 5
18. …the course textbook (hardcopy) useful in
learning the course material. 1 2 3 4 5
19. …the course textbook (e-book) useful in learning
the course material. 1 2 3 4 5
20. …the Internet useful in learning the course
material. 1 2 3 4 5
21. … the Stats Lab to be beneficial in learning the
course material. 1 2 3 4 5
22. … the professor’s office hours to be beneficial in
learning the course material. 1 2 3 4 5
23. … emailing the instructor to be beneficial in
learning the course material. 1 2 3 4 5

Journal of Statistics Education, Volume 23, Number 1 (2015)
15
Learning Preference
Answer questions 24 – 33 based on your agreement to the following statements.
Strongly
Disagree Disagree Neutral Agree
Strongly
Agree
24. Attending regular class meetings is an important
motivator for me. 1 2 3 4 5
25. Flexibility in setting pace and time for studying is
important to me. 1 2 3 4 5
26. I learn better from hearing a lecture. 1 2 3 4 5
27. I learn better from reading lecture materials. 1 2 3 4 5
28. I learn better from watching videos. 1 2 3 4 5
29. I learn better when I have face-to-face contact
with my fellow students. 1 2 3 4 5
30. I learn better from student study groups. 1 2 3 4 5
31. If I need help, I’m more likely to email my
instructor than to meet with him/her face-to-face. 1 2 3 4 5
32. Face-to-face contact with the instructors of my
classes is very important to me. 1 2 3 4 5
33. Face-to-face contact with fellow students in my
classes is very important to me. 1 2 3 4 5

Journal of Statistics Education, Volume 23, Number 1 (2015)
16
Appendix B
Questionnaire groupings based on topics.
Coursework and Personnel Resources
Homework Q11 I found the homework assignment problems useful in learning the course
material.
Q12 I found the homework guided examples useful in learning the course material.
Q13 I found the homework two attempts useful in learning the course material.
Q14 I found the ‘check my work’ option in Connect useful in learning the course
material.
Technology
Use
Q15 I found other Connect materials useful in learning the course material.
Q16 I found course content in D2L useful in learning the course material.
Q17 I found the Excel tutorials in D2L useful in learning the course material.
Textbook Use Q18 I found the course textbook (hardcopy) useful in learning the course material.
Q19 I found the course textbook (e-book) useful in learning the course material.
Extra Help Q21 I found the Stats Lab to be beneficial in learning the course material.
Q22 I found the professor’s office hours to be beneficial in learning the course
material.
Q23 I found emailing the instructor to be beneficial in learning the course material.
Class
Instruction
Q24 Attending regular class meetings is an important motivator for me.
Q26 I learn better from hearing a lecture.
Flexibility to
Learn
Q25 Flexibility in setting pace and time for studying is important to me.
Q27 I learn better from reading lecture materials.
Q28 I learn better from watching videos.
Personal
contact
Q29 I learn better when I have face-to-face contact with my fellow students.
Q30 I learn better from student study groups.
Q33 Face-to-face contact with fellow students in my classes is very important to me.

Journal of Statistics Education, Volume 23, Number 1 (2015)
17
References
Bonham, S. W., Deardorff, D. L., and Beichner, R. J. (2003), “Comparison of Student
Performance Using Web and Paper-based Homework in College-level Physics,” Journal of
Research in Science Teaching, 40(10), 1050-1071.
D’Orsie, S., and Day, K. (2006), “Ten Tips for Teaching a Web Course,” Tech Directions, 65(7),
18-20.
Dutton, J., Dutton, M., and Perry, J. (2002), “How do Online Students Differ from Lecture
Students?” Journal of Asynchronous Learning Networks, 6(1), 1-20.
Dutton, J., and Dutton, M. (2005), “Characteristics and Performance of Students in an Online
Section of Business Statistics,” Journal of Statistics Education, 13(3). Available at
http://www.amstat.org/publications/jse/v13n3/Dutton.html.
Felder, R. M., and Silverman, L. K. (1988), “Learning Styles and Teaching Styles in Engineering
Education,” Engineering Education, 78(7), 674-681.
Felder, R. M. (1993), “Reaching the Second Tier—Learning and Teaching Styles in College
Science Education,” Journal of College Science Teaching, 23(5), 286-290.
Gaffney, M. A., Ryan, D., and Wurst, C. (2010), “Do Online Homework Systems Improve
Student Performance?” Advances in Accounting Education [online], 49-68. Available at
http://www.researchgate.net/publication/235253051_Do_Online_homework_systems_improve_s
tudent_performance.
Gardner, H. (1983), Frames of Mind, New York: Basic Book Inc.
Grinder, B. (2008), “Automated Online Homework Managers: Filling the Gaps with FlashTM,”
Journal of Financial Education, 34, 137-156.
Guterl, S. (2013), “Is Teaching to a Student’s “Learning Style” a Bogus Idea?” Scientific
American [online]. Available at http://www.scientificamerican.com/article/is-teaching-to-a-
students-learning-style-a-bogus-idea.
Kirtman, L. (2009), “Online Versus In-Class Courses: An Examination of Differences in
Learning Outcomes,” Issues in Teacher Education, 8(2), 103-116.
Kolb, D. A. (1981), “Learning Styles and Disciplinary Differences,” in The Modern American
College, ed. A. W. Chickering, San Francisco: Jossey-Bass.
Lenz, L. (2010), “The Effect of a Web-Based Homework System on Student Outcomes in a
First-Year Mathematics Course,” Journal of Computers in Mathematics and Science Teaching,
29(3), 233-246.

Journal of Statistics Education, Volume 23, Number 1 (2015)
18
Li, C., Poe, F., Potter, M., Quigley, B. and Wilson, J. (2011), UC Libraries Academic e-Book
Usage Survey [online], Springer e-Book Pilot Project. Available at
http://www.cdlib.org/services/uxdesign/docs/2011/academic_ebook_usage_survey.pdf.
McNeish, J., Foster, M., Francescucci, A., and West, B. (2012), “The Surprising Foil to Online
Education: Why Students Won’t Give up Paper Textbooks,” Journal for Advancement of
Marketing Education, 20(3), 58-69.
Montgomery, S. M. and Groat, L. N. (1998), “Student Learning Styles and Their Implications for
Teaching,” The Center for Research on Learning and Teaching Occasional Papers, The
University of Michigan, 10, 1-8.
Myers, I. B. and Myers, P. B. (1980), Gifts Differing: Understanding Personality Type,
Mountain View, CA: Davies-Black Publishing.
Oliver, R. (1999), “Exploring Strategies for Online Teaching and Learning,” Distance
Education, 20(3), 240-254.
Russell, T. (1999), The No Significant Difference Phenomenon, North Carolina State University.
Salmon, G. (2004), E-moderating: The Key to Teaching and Learning Online, New York:
Routledge.
Thayer, A., Lee, C., Hwang, L., Sales, H., Sen, P. and Dalal, N. (2011), “The Imposition and
Superimposition of Digital Reading Technology: The Academic Potential of E-Readers,” CH1
Proceedings of the SIGCHI Conference on Human Factors in Computing Systems, 2917-2926.
Ward, B. (2004), “The Best of Both Worlds: A Hybrid Statistics Course,” Journal of Statistics
Education [online], 12(3). Available at http://www.amstat.org/publications/jse/v12n3/ward.html.
Mary Shotwell
Dept. of Computer Information Systems
Jones College of Business
Middle Tennessee State University
1301 E Main St
Murfreesboro, TN 37132
Charles Apigian
Dept. of Computer Information Systems
Jones College of Business
Middle Tennessee State University
1301 E Main St
Murfreesboro, TN 37132

Journal of Statistics Education, Volume 23, Number 1 (2015)
19
Volume 23 (2015) | Archive | Index | Data Archive | Resources | Editorial Board | Guidelines for
Authors | Guidelines for Data Contributors | Guidelines for Readers/Data Users | Home Page |
Contact JSE | ASA Publications


![IJDST V23N1 [2017] Paper 2 [Paper BEGIN Template …europia.org/IJDST/Vol23/IJDST V23N1 [2017] Paper 2.pdf · BECUE, Vincent (Université de Mons, Belgium) BEHESHTI , Reza (Design](https://img.pdfslide.us/doc/110x75/5ba99c4209d3f2155e8d0b4c/ijdst-v23n1-2017-paper-2-paper-begin-template-v23n1-2017-paper-2pdf-becue.jpg)


![IJDST V23N1 [2017] Paper 1 [Paper BEGIN Template 2016-0101]]](https://img.pdfslide.us/doc/110x75/620243fe85b7c0616f579d9d/ijdst-v23n1-2017-paper-1-paper-begin-template-2016-0101.jpg)