Embed Size (px)
Citation preview
Page | 1
Algebra 1
Standard – Linear Functions
Categories
• Graphs
• Tables
• Equations
• Context
Summative Assessment Date:
Friday, September 14th

Page | 2

Page | 3
Page | 4
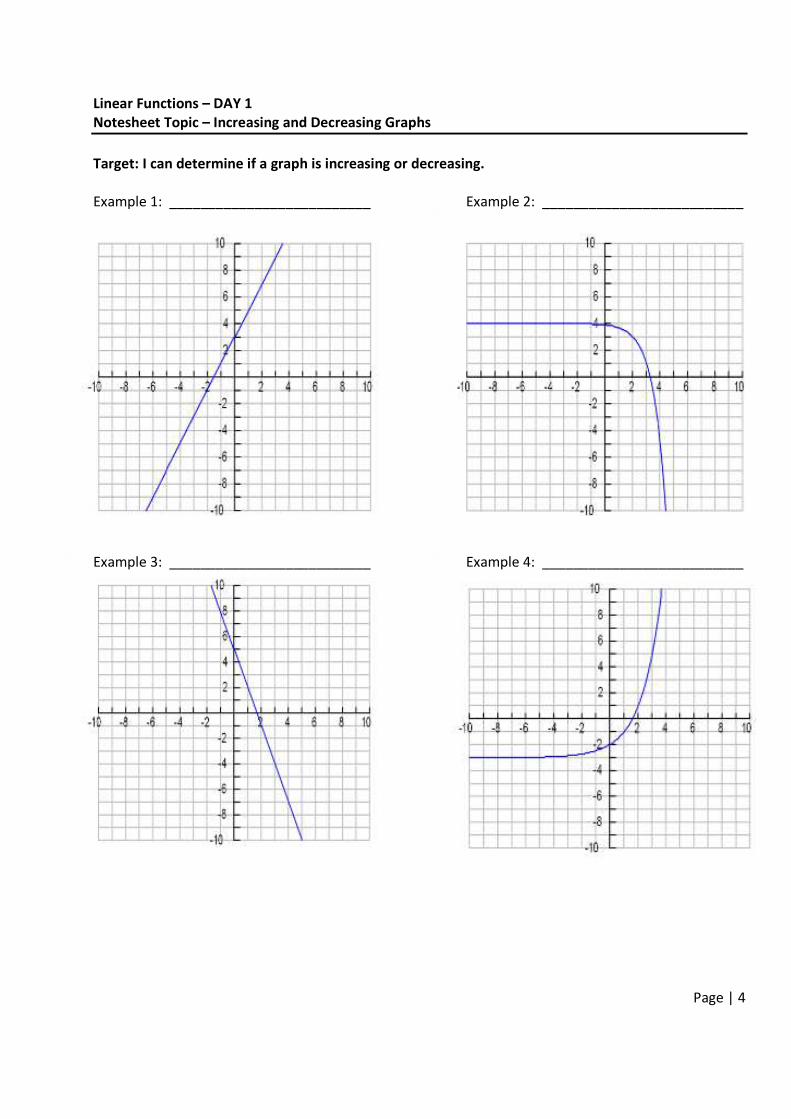
Linear Functions – DAY 1
Notesheet Topic – Increasing and Decreasing Graphs
Target: I can determine if a graph is increasing or decreasing.
Example 1: __________________________ Example 2: __________________________
Example 3: __________________________ Example 4: __________________________
Page | 5
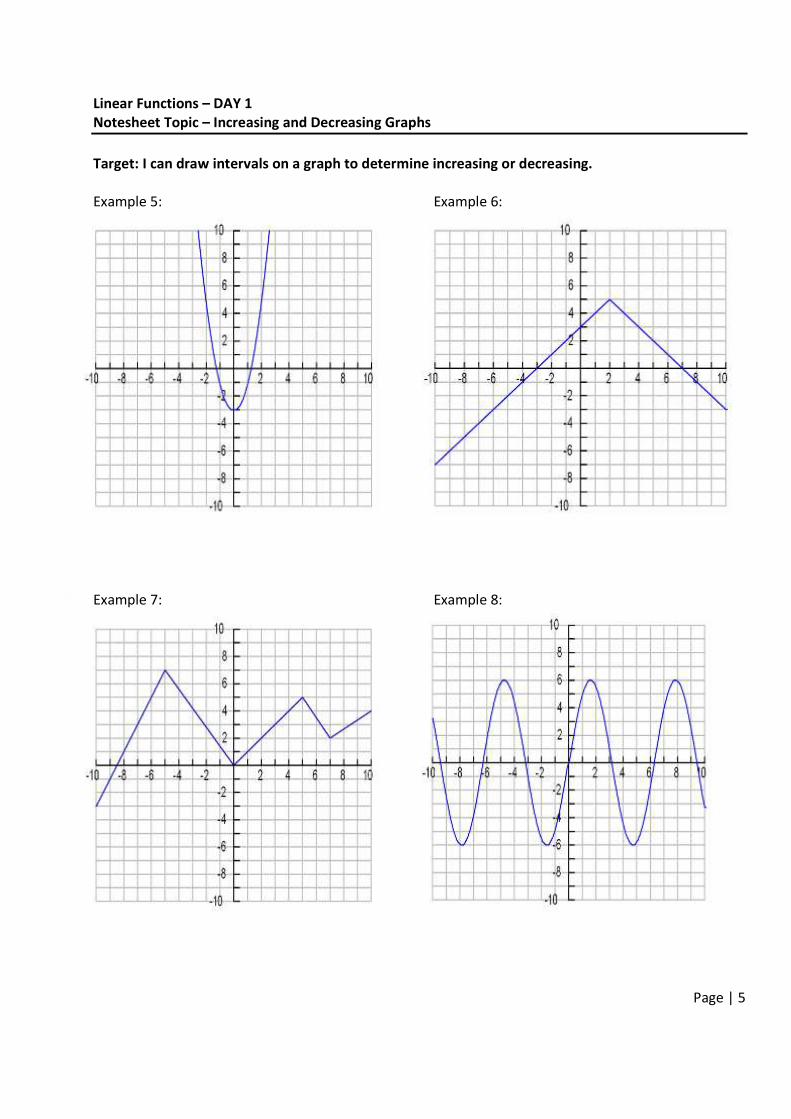
Linear Functions – DAY 1
Notesheet Topic – Increasing and Decreasing Graphs
Target: I can draw intervals on a graph to determine increasing or decreasing.
Example 5: Example 6:
Example 7: Example 8:
Page | 6
x
y
x
y
x
y
x
y
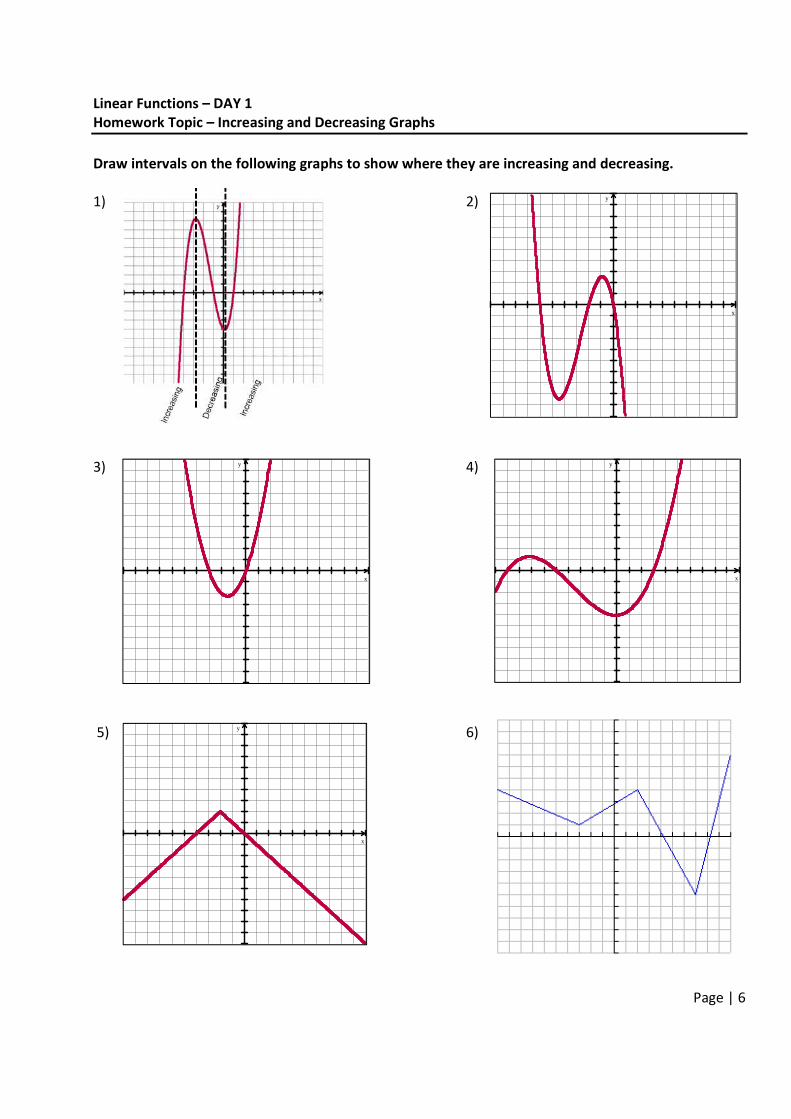
Linear Functions – DAY 1
Homework Topic – Increasing and Decreasing Graphs
Draw intervals on the following graphs to show where they are increasing and decreasing.
1) 2)
3) 4)
5) 6)
Page | 7
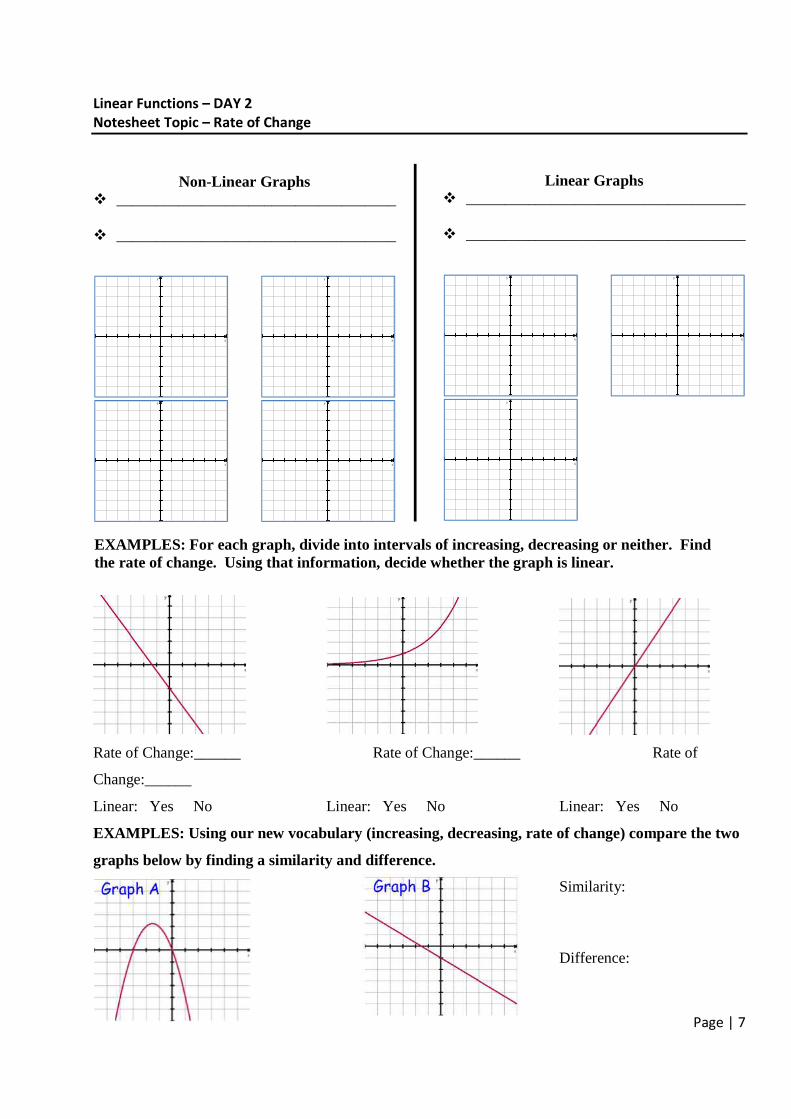
Linear Functions – DAY 2
Notesheet Topic – Rate of Change
Non-Linear Graphs � ____________________________________
� ____________________________________
Linear Graphs
� ____________________________________
� ____________________________________
Rate of Change:______ Rate of Change:______ Rate of
Change:______
Linear: Yes No Linear: Yes No Linear: Yes No
EXAMPLES: Using our new vocabulary (increasing, decreasing, rate of change) compare the two
graphs below by finding a similarity and difference.
Similarity:
Difference:
x
y
x
y
x
y
x
y
x
y
x
y
x
y
EXAMPLES: For each graph, divide into intervals of increasing, decreasing or neither. Find the rate of change. Using that information, decide whether the graph is linear.
Page | 8
Linear Functions – DAY 2
Homework Topic – Rate of Change
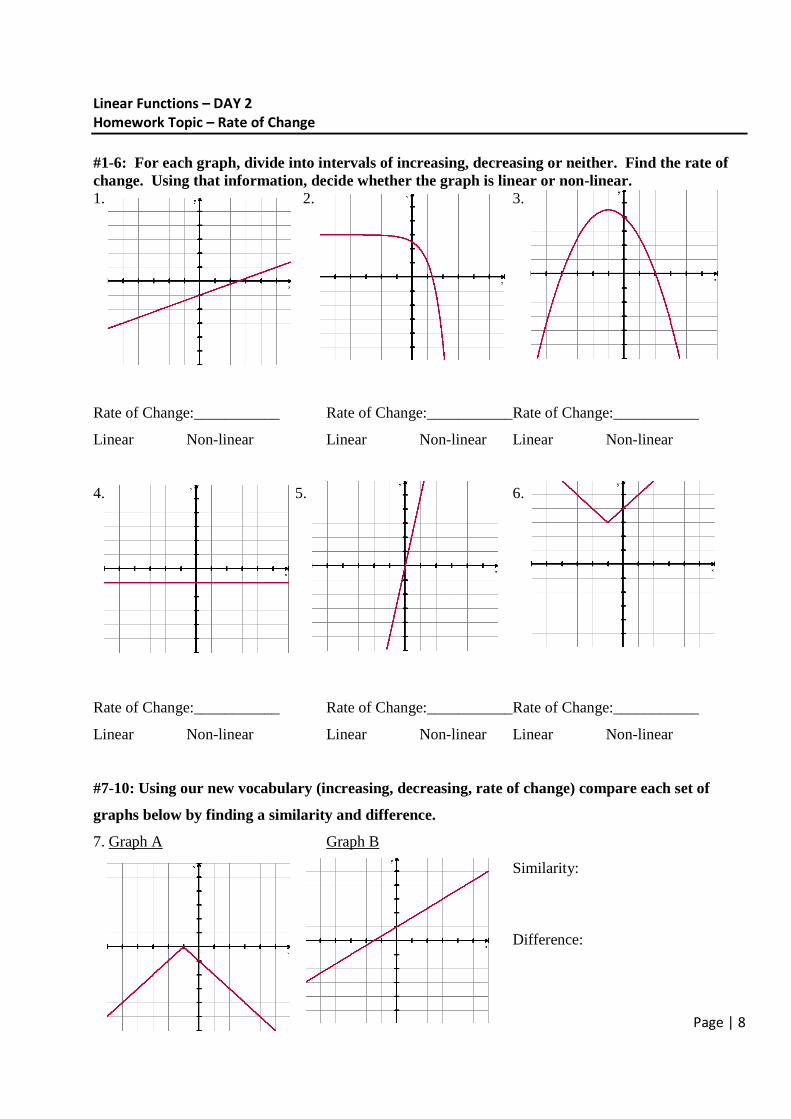
#1-6: For each graph, divide into intervals of increasing, decreasing or neither. Find the rate of change. Using that information, decide whether the graph is linear or non-linear. 1. 2. 3.
Rate of Change:___________ Rate of Change:___________Rate of Change:___________
Linear Non-linear Linear Non-linear Linear Non-linear
4. 5. 6.
Rate of Change:___________ Rate of Change:___________Rate of Change:___________
Linear Non-linear Linear Non-linear Linear Non-linear
#7-10: Using our new vocabulary (increasing, decreasing, rate of change) compare each set of
graphs below by finding a similarity and difference.
7. Graph A Graph B
Similarity: Difference:
Page | 9
Linear Functions – DAY 2
Homework Topic – Rate of Change
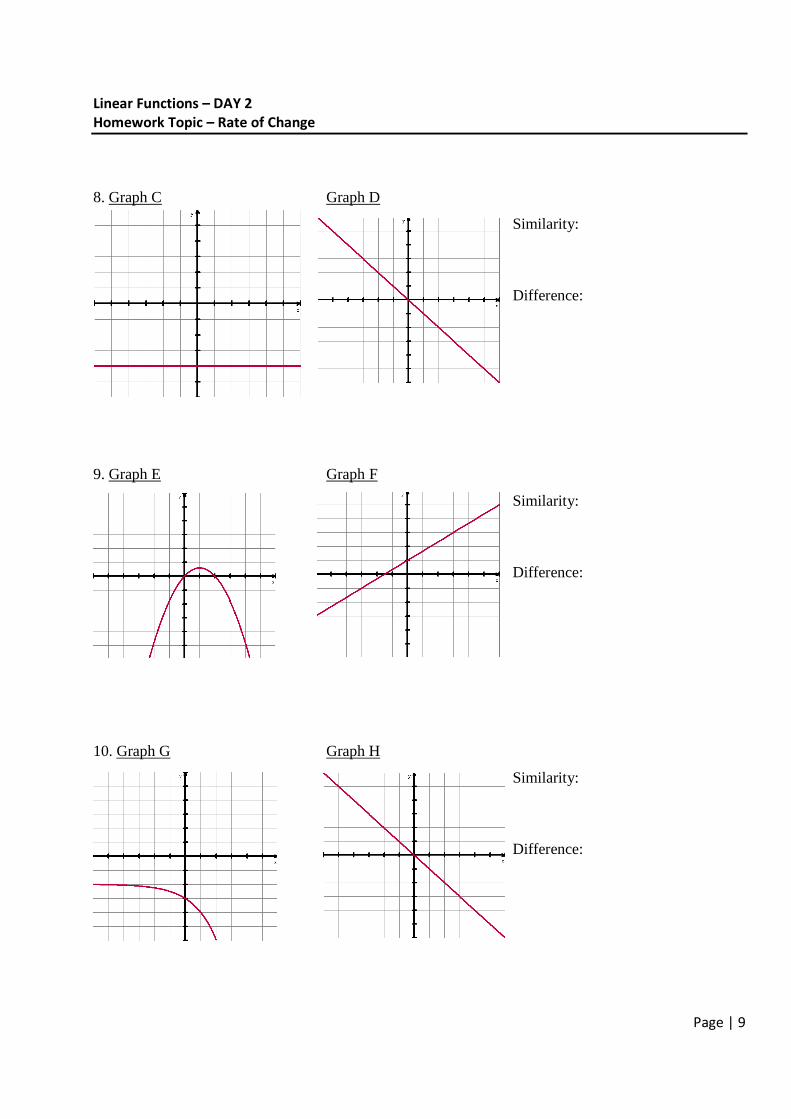
8. Graph C Graph D
Similarity:
Difference:
9. Graph E Graph F
Similarity:
Difference:
10. Graph G Graph H
Similarity:
Difference:
Page | 10
Linear Functions – DAY 3
Notesheet Topic – Linear Tables
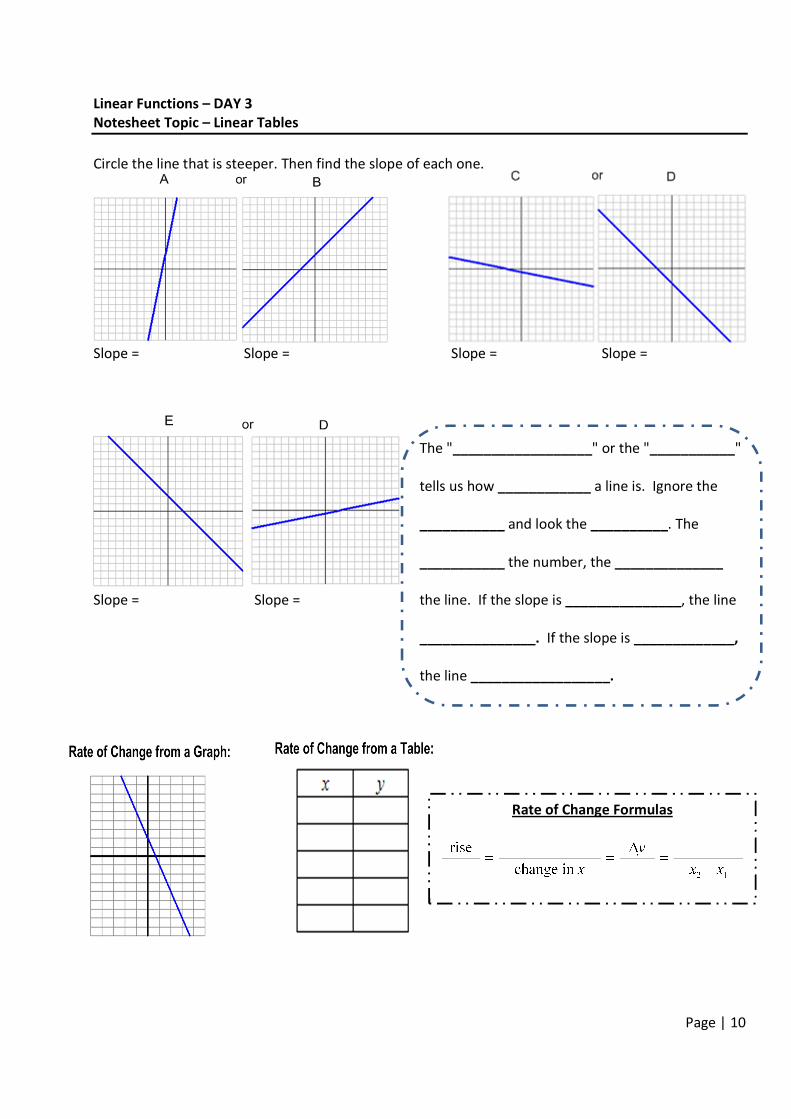
Circle the line that is steeper. Then find the slope of each one.
Slope = Slope = Slope = Slope =
The "__________________" or the "___________"
tells us how ____________ a line is. Ignore the
___________ and look the __________. The
___________ the number, the ______________
Slope = Slope = the line. If the slope is _______________, the line
_______________. If the slope is _____________,
the line __________________.
Rate of Change Formulas
Page | 11
Linear Functions – DAY 3
Notesheet Topic – Linear Tables
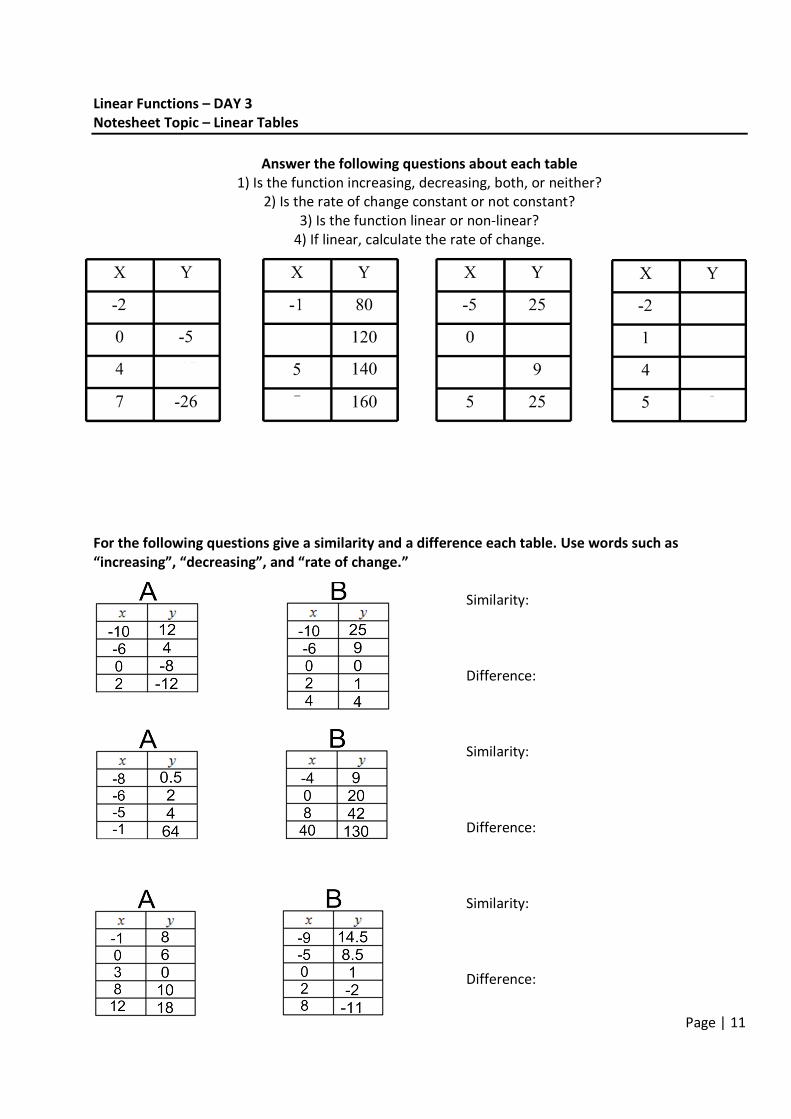
Answer the following questions about each table
1) Is the function increasing, decreasing, both, or neither?
2) Is the rate of change constant or not constant?
3) Is the function linear or non-linear?
4) If linear, calculate the rate of change.
For the following questions give a similarity and a difference each table. Use words such as
“increasing”, “decreasing”, and “rate of change.”
Similarity:
Difference:
Similarity:
Difference:
Similarity:
Difference:
Page | 12
Linear Functions – DAY 3
Homework Topic – Linear Tables
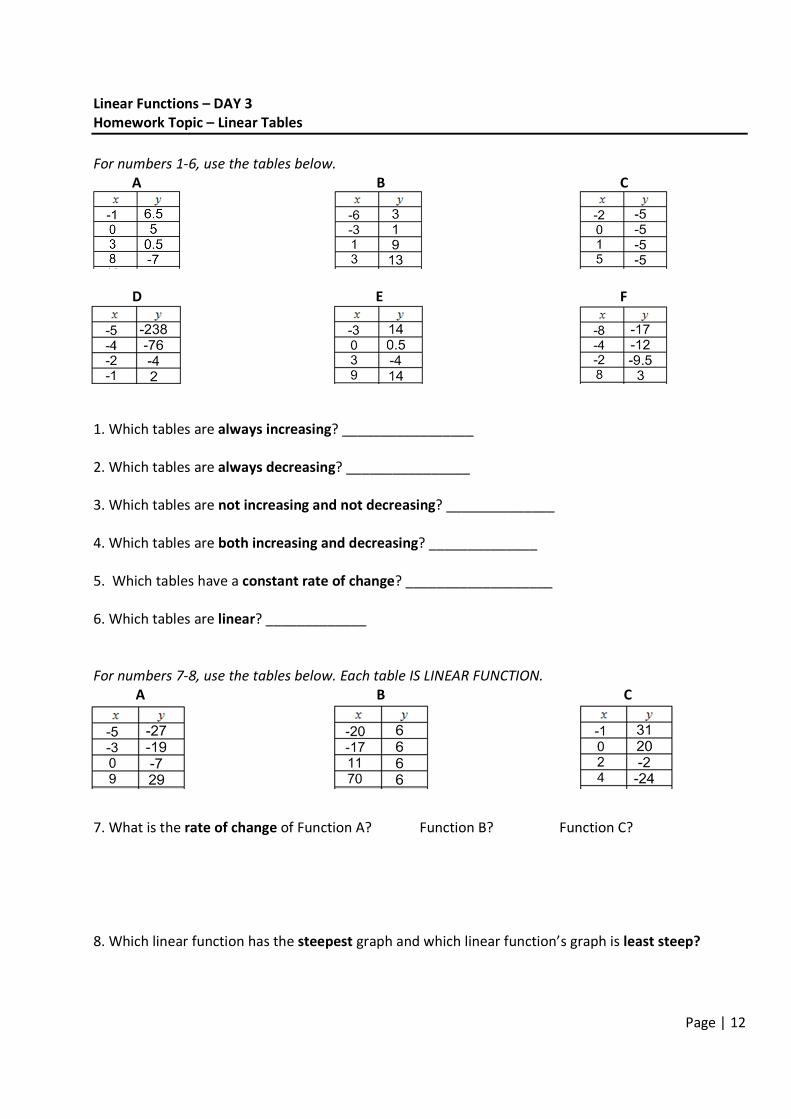
For numbers 1-6, use the tables below.
A B C
D E F
1. Which tables are always increasing? _________________
2. Which tables are always decreasing? ________________
3. Which tables are not increasing and not decreasing? ______________
4. Which tables are both increasing and decreasing? ______________
5. Which tables have a constant rate of change? ___________________
6. Which tables are linear? _____________
For numbers 7-8, use the tables below. Each table IS LINEAR FUNCTION.
A B C
7. What is the rate of change of Function A? Function B? Function C?
8. Which linear function has the steepest graph and which linear function’s graph is least steep?
Page | 13
Linear Functions – DAY 3
Homework Topic – Linear Tables
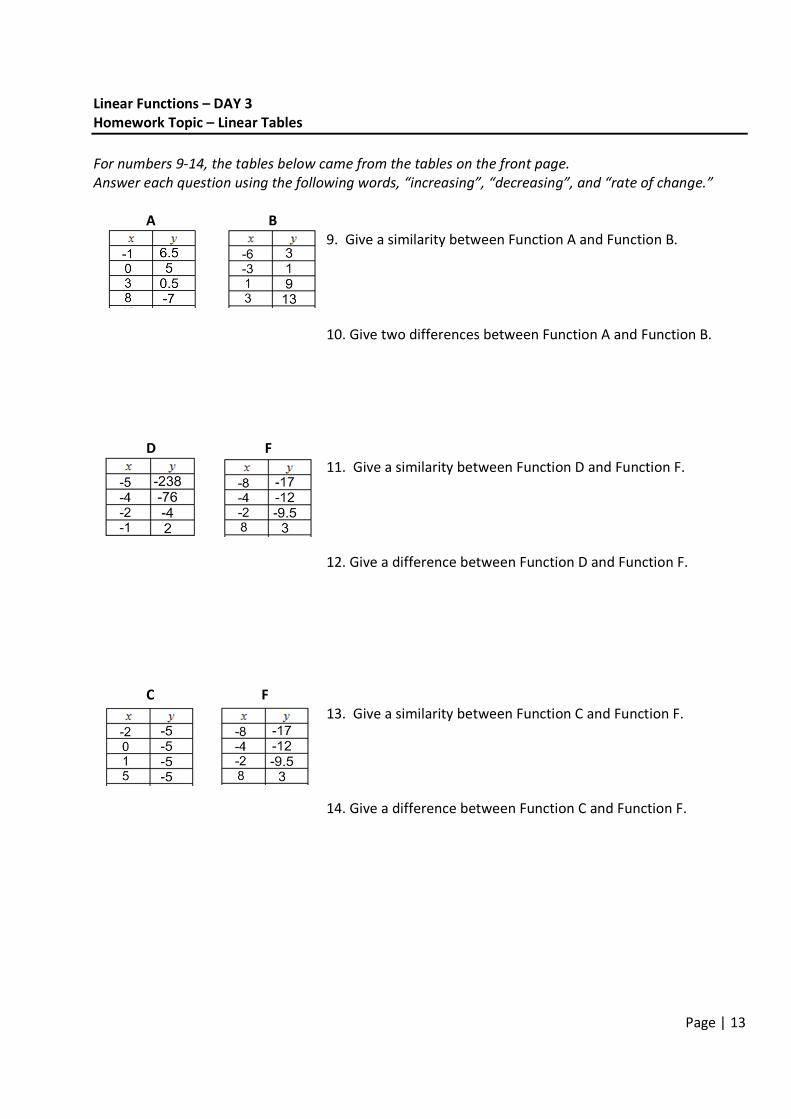
For numbers 9-14, the tables below came from the tables on the front page.
Answer each question using the following words, “increasing”, “decreasing”, and “rate of change.”
A B
9. Give a similarity between Function A and Function B.
10. Give two differences between Function A and Function B.
D F
11. Give a similarity between Function D and Function F.
12. Give a difference between Function D and Function F.
C F
13. Give a similarity between Function C and Function F.
14. Give a difference between Function C and Function F.

Page | 14
Linear Functions – DAY 4
Notesheet Topic – Linear Equations
All functions can be modeled with.... ____________________
____________________
____________________
What makes a graph linear? What makes a table linear?
Page | 15
Linear Functions – DAY 4
Notesheet Topic – Linear Equations
Note: Tables on bottom right to help make graphs
Equation:
Linear or non:
Equation:
Linear or non:
Equation:
Linear or non:
Equation:
Linear or non:
Equation:
Linear or non:
Page | 16
Linear Functions – DAY 4
Notesheet Topic – Linear Equations
Linear Equations: Non-Linear Equations:
Can NOT have any __________________ Can NOT have an _____________________ symbol Can NOT have_____ in the __________________ The most common linear equation is _______________________________.
y = ___________________ where m =______________ b=_______________
Identify the ___________________ in the following equations.
3 9
4
5
2
y x
y x
y x
= − += − +
=
0.25 3
24
315
y x
y x
y x
= −
= − +
= −
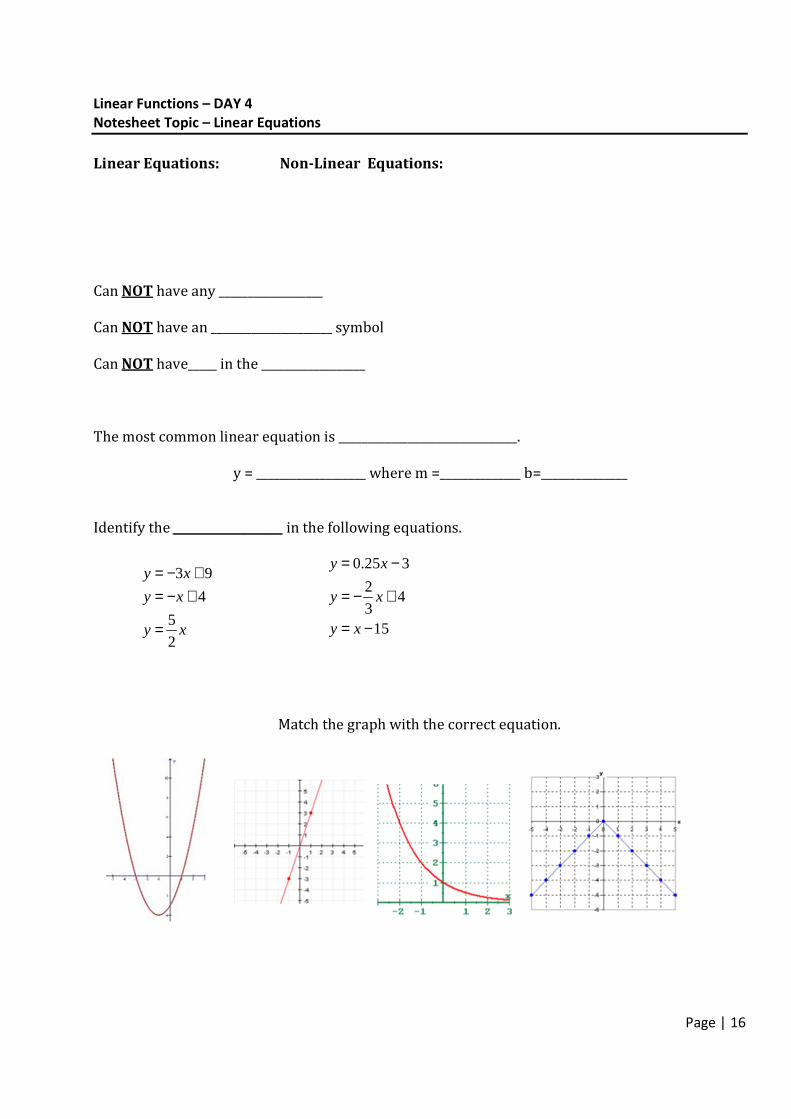
Match the graph with the correct equation.
Page | 17
Linear Functions – DAY 4
Homework Topic – Linear Equations
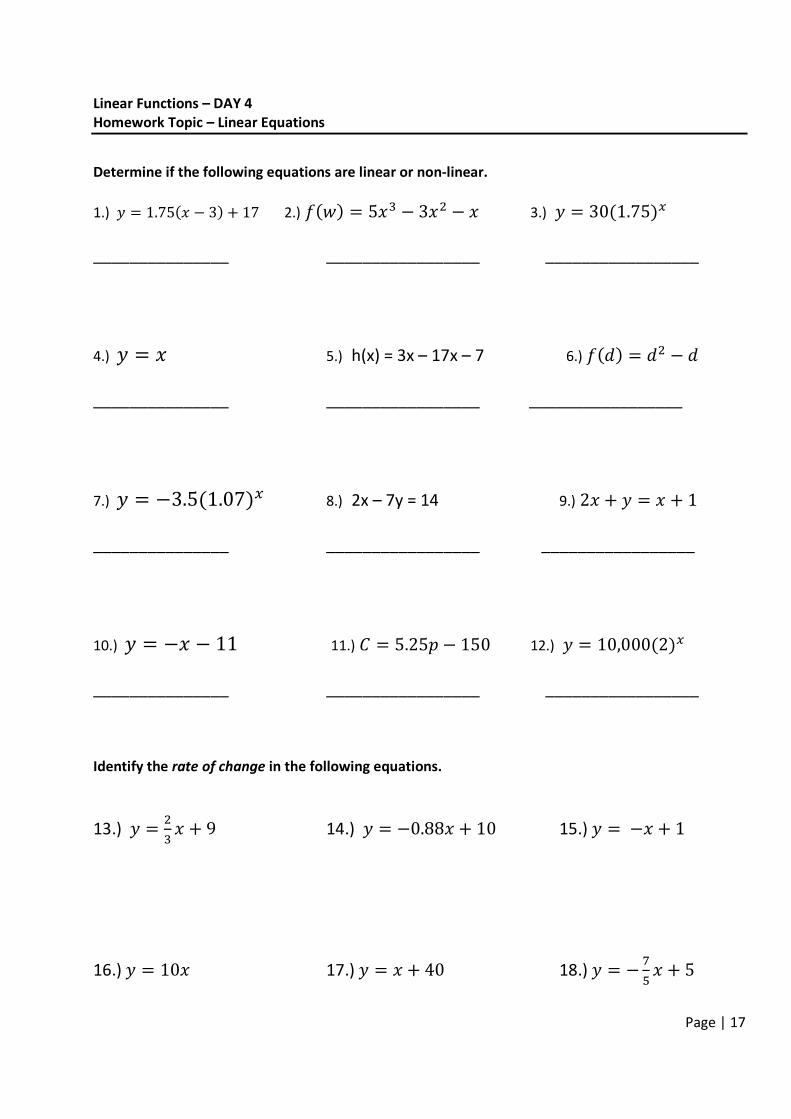
Determine if the following equations are linear or non-linear.
1.) � � 1.75�� 3� � 17 2.) ��� � 5�� 3�� � 3.) � � 30�1.75��
_______________ _________________ _________________
4.) � � � 5.) h(x) = 3x – 17x – 7 6.) ��� � �� �
_______________ _________________ _________________
7.) � � 3.5�1.07�� 8.) 2x – 7y = 14 9.) 2� � � � � � 1
_______________ _________________ _________________
10.) � � � 11 11.) � � 5.25� 150 12.) � � 10,000�2��
_______________ _________________ _________________
Identify the rate of change in the following equations.
13.) � ��
�� � 9 14.) � � 0.88� � 10 15.) � � � � 1
16.) � � 10� 17.) � � � � 40 18.) � � �
�� � 5
Page | 18
Linear Functions – DAY 4
Homework Topic – Linear Equations
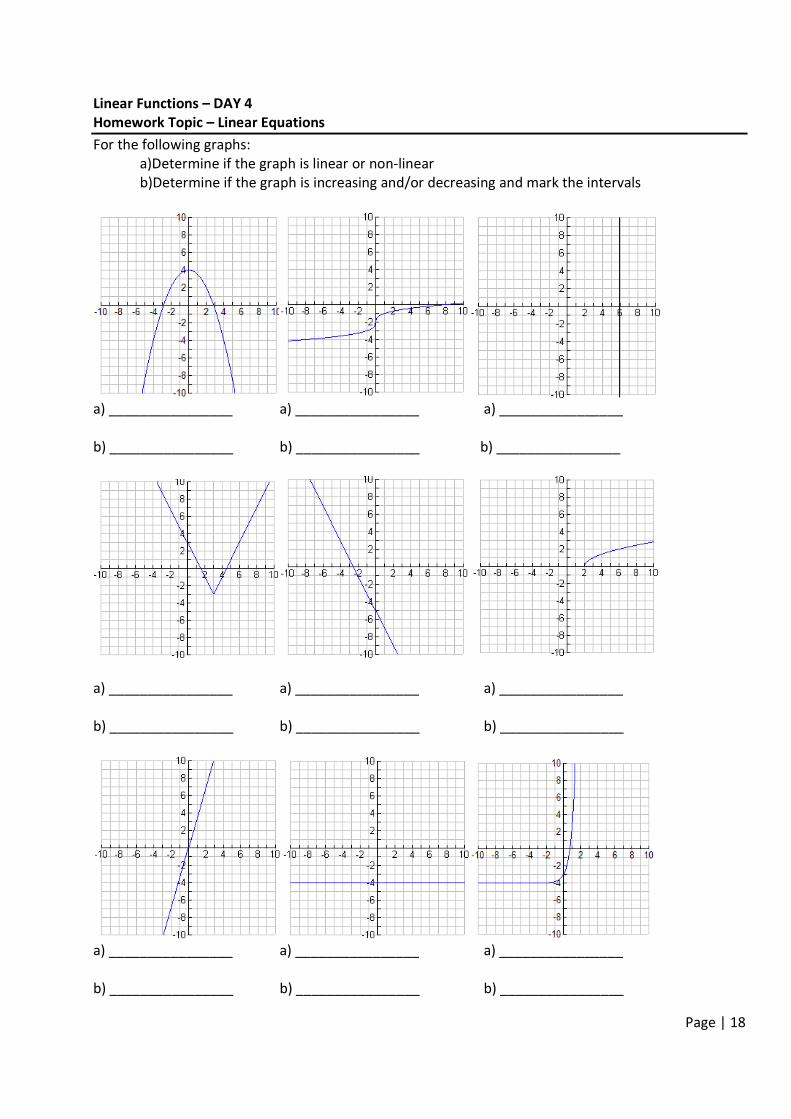
For the following graphs:
a)Determine if the graph is linear or non-linear
b)Determine if the graph is increasing and/or decreasing and mark the intervals
a) ________________ a) ________________ a) ________________
b) ________________ b) ________________ b) ________________
a) ________________ a) ________________ a) ________________
b) ________________ b) ________________ b) ________________
a) ________________ a) ________________ a) ________________
b) ________________ b) ________________ b) ________________
Page | 19
Linear Functions – DAY 5
Notesheet Topic – Recognizing Linear Relationships in Context
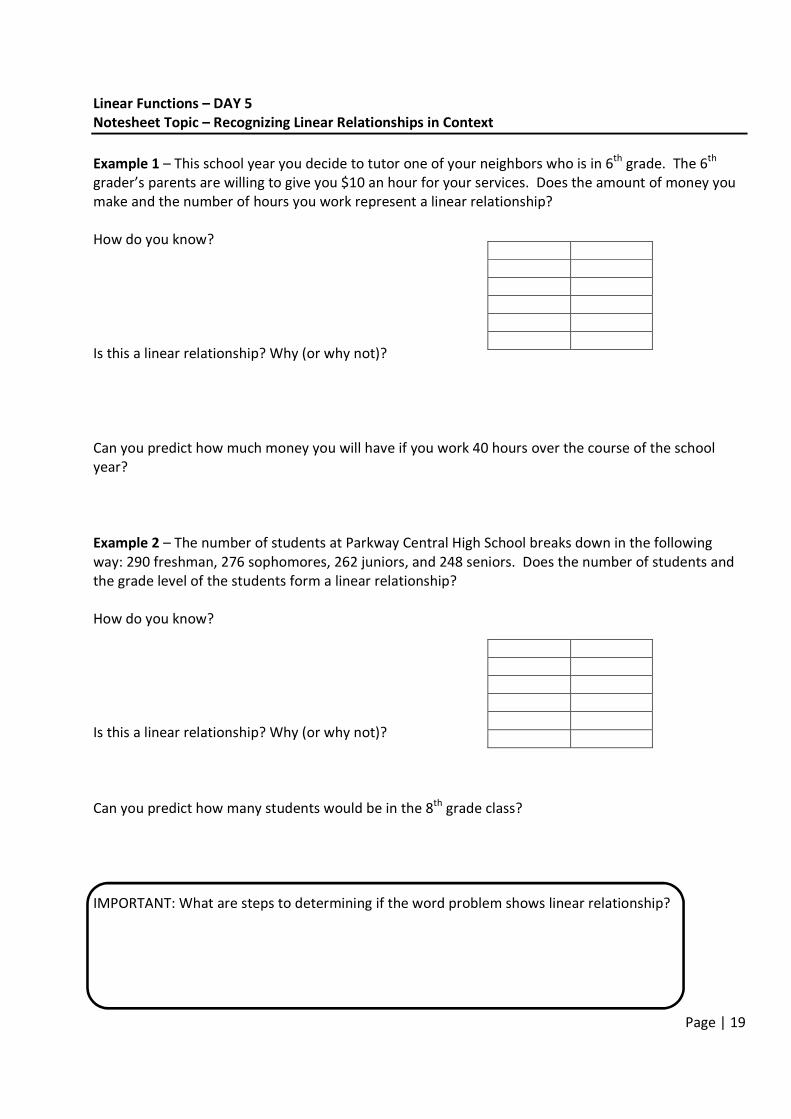
Example 1 – This school year you decide to tutor one of your neighbors who is in 6th
grade. The 6th
grader’s parents are willing to give you $10 an hour for your services. Does the amount of money you
make and the number of hours you work represent a linear relationship?
How do you know?
Is this a linear relationship? Why (or why not)?
Can you predict how much money you will have if you work 40 hours over the course of the school
year?
Example 2 – The number of students at Parkway Central High School breaks down in the following
way: 290 freshman, 276 sophomores, 262 juniors, and 248 seniors. Does the number of students and
the grade level of the students form a linear relationship?
How do you know?
Is this a linear relationship? Why (or why not)?
Can you predict how many students would be in the 8th grade class?
IMPORTANT: What are steps to determining if the word problem shows linear relationship?
Page | 20
Linear Functions – DAY 5
Notesheet Topic – Recognizing Linear Relationships in Context
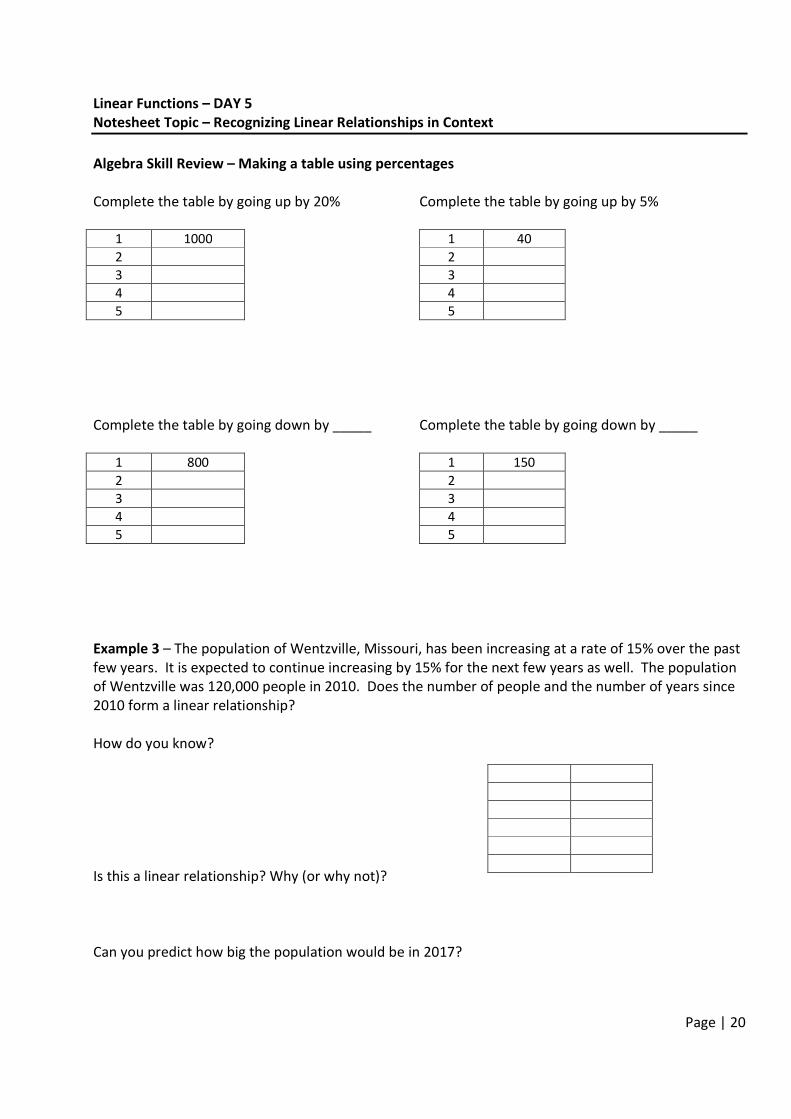
Algebra Skill Review – Making a table using percentages
Complete the table by going up by 20% Complete the table by going up by 5%
1 1000 1 40
2 2
3 3
4 4
5 5
Complete the table by going down by _____ Complete the table by going down by _____
1 800 1 150
2 2
3 3
4 4
5 5
Example 3 – The population of Wentzville, Missouri, has been increasing at a rate of 15% over the past
few years. It is expected to continue increasing by 15% for the next few years as well. The population
of Wentzville was 120,000 people in 2010. Does the number of people and the number of years since
2010 form a linear relationship?
How do you know?
Is this a linear relationship? Why (or why not)?
Can you predict how big the population would be in 2017?
Page | 21
Linear Functions – DAY 5
Notesheet Topic – Recognizing Linear Relationships in Context
Example 4 – To rent a bulldozer a company charges a deposit of $400 and an additional $50 per hour
while it is in use. Does the amount of time you rent the bulldozer and the amount of money you spend
represent a linear relationship?
How do you know?
Is this a linear relationship? Why (or why not)?
Can you predict how long you could rent the bulldozer if you had $830 to spend?
Example 5 – You bought a new video game over the summer and you played it for 12 hours the first
day! However, like most things, they get boring. So each day you played half as much as the day
before. Does the number of days and the number of hours playing your video game represent a linear
relationship?
How do you know?
Is this a linear relationship? Why (or why not)?
Can you predict how long you will play the game (in minutes or seconds) after 8 days?
Page | 22
Linear Functions – DAY 5
Homework Topic – Recognizing Linear Relationships in Context
1. Right now there is $50 in your savings account (August) and starting next month you plan to
put in $15 each month. Does the number of months and the amount of money saved represent a
linear relationship? Justify your answer.
If it is linear, can you predict how long it will take you to have saved $100?
2. Your parents just bought a new car that cost $15,000. The amount of money that the car is actually
worth (it’s value) goes down by 15% each year for the next few years. Does the number of years and
the amount of money the car is worth represent a linear relationship? Justify your answer.
If it is linear, can you predict the value of the car in 5 years?
3. The local ice cream shop has a menu that allows you to buy ice cream cones and charges you
different prices based on the number of scoops you want. Their prices include a 1-scoop cone for
$3.10, a 2-scoop cone for $4.25, a 3-scoop cone for $4.95, and a 4-scoop cone for $5.50. Does the
number of scoops and the cost of the cone represent a linear relationship? Justify your answer.
If it is linear, can you predict the price of a 6 scoop cone?
Page | 23
Linear Functions – DAY 5
Homework Topic – Recognizing Linear Relationships in Context
4. In middle school math you learned that there is an equation that relates distance, time, and the
rate: d r t= ⋅ . Does this equation represent a linear relationship between time traveled and distance
traveled for a given speed? Justify your answer.
5. Come up with your own linear relationship. Justify how you know it is linear. Write a prediction you
would have someone make with the information you provide, and then give an answer to your
question.
6. Come up with your own non-linear relationship. Justify how you know it is linear. Write a
prediction you would have someone make with the information you provide, and then give an answer
to your question.
Review Questions:
1. Describe the characteristics of the graph of a linear function. (Use the words increasing, decreasing,
and rate of change in your answer.)
__________________________________________________________________________________
__________________________________________________________________________________
2. Give an example of a linear equation and a non-linear equation. How would you explain to a friend
the differences?
__________________________________________________________________________________
__________________________________________________________________________________