Embed Size (px)
Citation preview
Student Manual
SMALL-SCALE SHAKE TABLE EXPERIMENTS AND COMPARISON TO
ANALYTICAL PREDICTIONS
A PROJECT DEVELOPED FOR THE UNIVERSITY CONSORTIUM ON INSTRUCTIONAL SHAKE TABLES
http://ucist.cive.wustl.edu/
Developed by: Brenda E. Shonkwiler
Thomas H. Miller Oregon State University
This project is supported in part by the National Science Foundation Grant No. DUE-
9950340.
Student Manual Oregon State University 2
1.0 Overview This student manual contains instructions for a set of experiments to be performed with the UCIST Shake Table. The ultimate goal is to compare results from an earthquake simulation on the UCIST Shake Table to analytical results using SAP 2000 software.
1.1 Introduction This manual progresses through the necessary steps to run an earthquake simulation on the UCIST Shake Table and to create the corresponding SAP 2000 model. The manual starts with some basic information about the UCIST Equipment and explains how to build a 3D model. It goes on to explain how to determine properties of the 3D model, including stiffness and damping. There is also a section on how to determine the scale used by the UCIST Shake Table for each earthquake. This is followed by explanations on how to determine accelerations as a function of time for each floor and the maximum relative displacement of the top floor. The manual ends with the steps for developing the SAP 2000 model.
1.2 Student Manual Contents 1.0 Overview...................................................................................................................2
1.1 Introduction.......................................................................................................... 2
1.2 Student Manual Contents ..................................................................................... 2
2.0 UCIST Equipment and Table Specifications ............................................................3
3.0 3D Model Specifications ..........................................................................................4
3.1 How to Construct the 3D Model.......................................................................... 4
3.2 Plan Views of 3D Model...................................................................................... 6
3.3 3D Model Schematic............................................................................................ 8
3.4 3D Model Material Properties ............................................................................. 8
3.5 3D Model Properties Experiment ........................................................................ 9
3.6 Stiffness Experiment .......................................................................................... 10
3.7 Damping – Free Vibration Test ......................................................................... 13
4.0 Earthquake Scale Determination ............................................................................16
5.0 UCIST Shake Table Experiments...........................................................................18
5.1 Shake Table Accelerations Experiment ............................................................. 18
5.2 Displacement Experiment .................................................................................. 19
6.0 SAP 2000 Model.....................................................................................................20
Student Manual Oregon State University 3
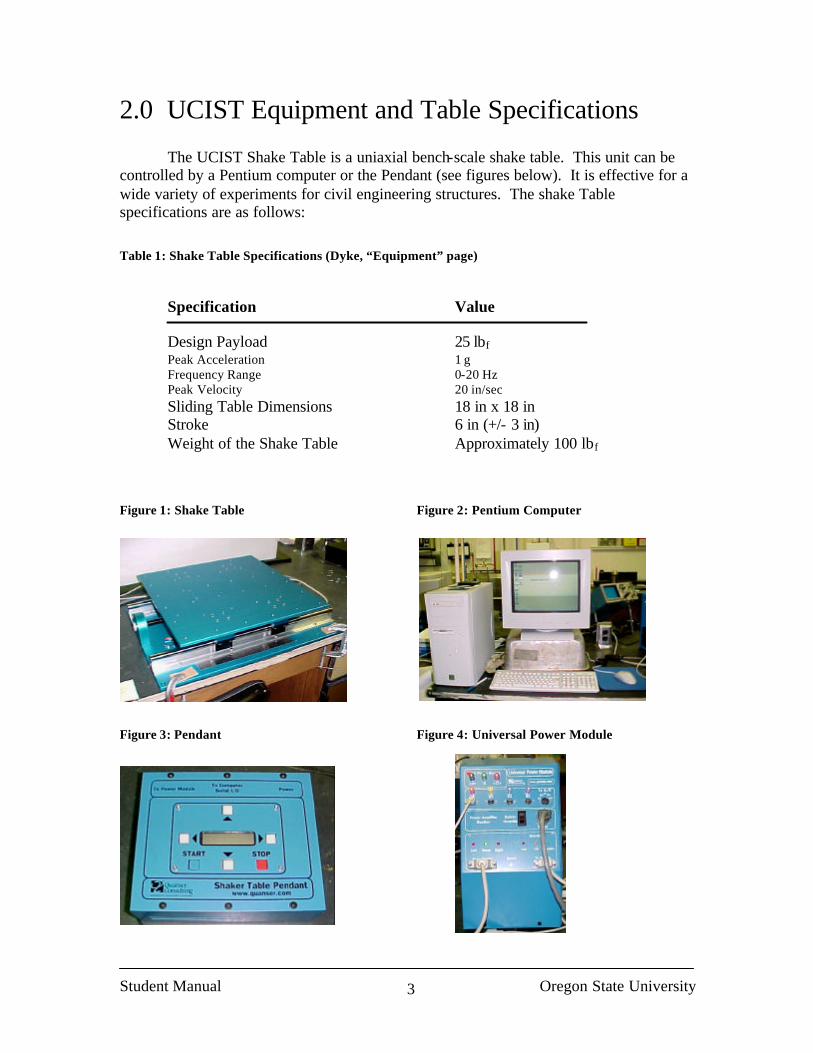
2.0 UCIST Equipment and Table Specifications The UCIST Shake Table is a uniaxial bench-scale shake table. This unit can be controlled by a Pentium computer or the Pendant (see figures below). It is effective for a wide variety of experiments for civil engineering structures. The shake Table specifications are as follows: Table 1: Shake Table Specifications (Dyke, “Equipment” page)
Specification Value
Design Payload 25 lbf Peak Acceleration 1 g Frequency Range 0-20 Hz Peak Velocity 20 in/sec Sliding Table Dimensions 18 in x 18 in Stroke 6 in (+/- 3 in) Weight of the Shake Table Approximately 100 lbf
Figure 1: Shake Table Figure 2: Pentium Computer
Figure 3: Pendant Figure 4: Universal Power Module
Student Manual Oregon State University 4
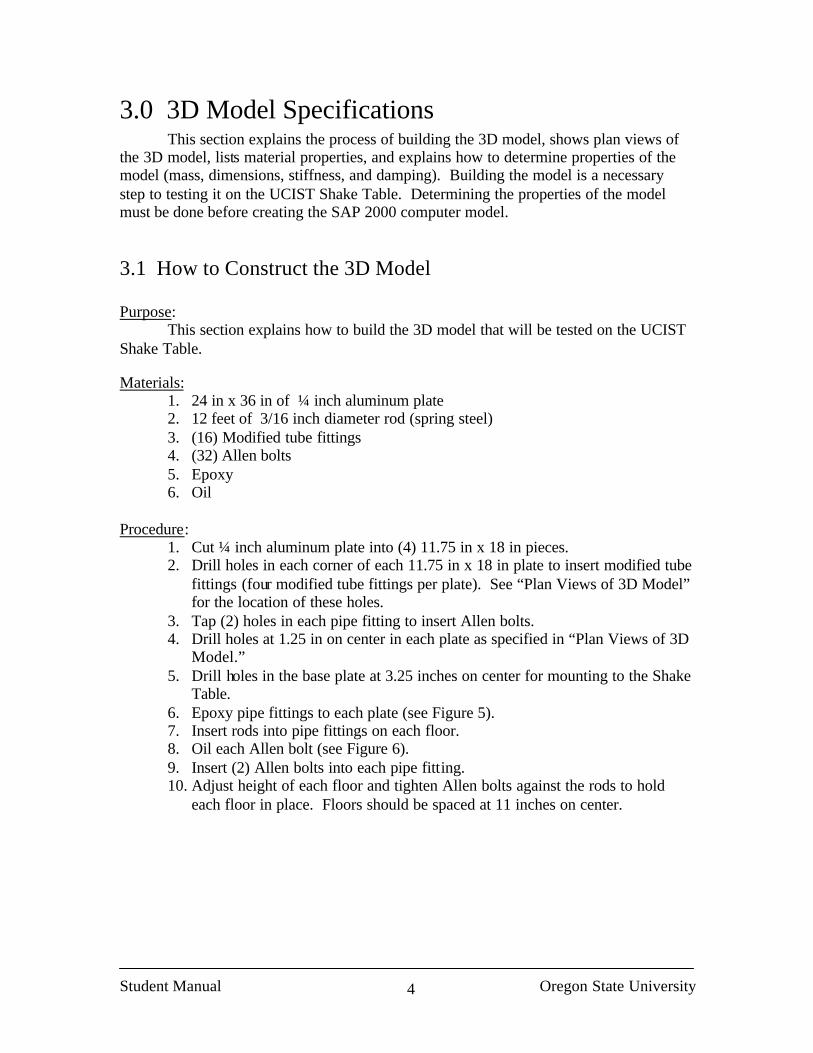
3.0 3D Model Specifications This section explains the process of building the 3D model, shows plan views of
the 3D model, lists material properties, and explains how to determine properties of the model (mass, dimensions, stiffness, and damping). Building the model is a necessary step to testing it on the UCIST Shake Table. Determining the properties of the model must be done before creating the SAP 2000 computer model.
3.1 How to Construct the 3D Model Purpose: This section explains how to build the 3D model that will be tested on the UCIST Shake Table. Materials:
1. 24 in x 36 in of ¼ inch aluminum plate 2. 12 feet of 3/16 inch diameter rod (spring steel) 3. (16) Modified tube fittings 4. (32) Allen bolts 5. Epoxy 6. Oil
Procedure:
1. Cut ¼ inch aluminum plate into (4) 11.75 in x 18 in pieces. 2. Drill holes in each corner of each 11.75 in x 18 in plate to insert modified tube
fittings (four modified tube fittings per plate). See “Plan Views of 3D Model” for the location of these holes.
3. Tap (2) holes in each pipe fitting to insert Allen bolts. 4. Drill holes at 1.25 in on center in each plate as specified in “Plan Views of 3D
Model.” 5. Drill holes in the base plate at 3.25 inches on center for mounting to the Shake
Table. 6. Epoxy pipe fittings to each plate (see Figure 5). 7. Insert rods into pipe fittings on each floor. 8. Oil each Allen bolt (see Figure 6). 9. Insert (2) Allen bolts into each pipe fitting. 10. Adjust height of each floor and tighten Allen bolts against the rods to hold
each floor in place. Floors should be spaced at 11 inches on center.
Student Manual Oregon State University 5
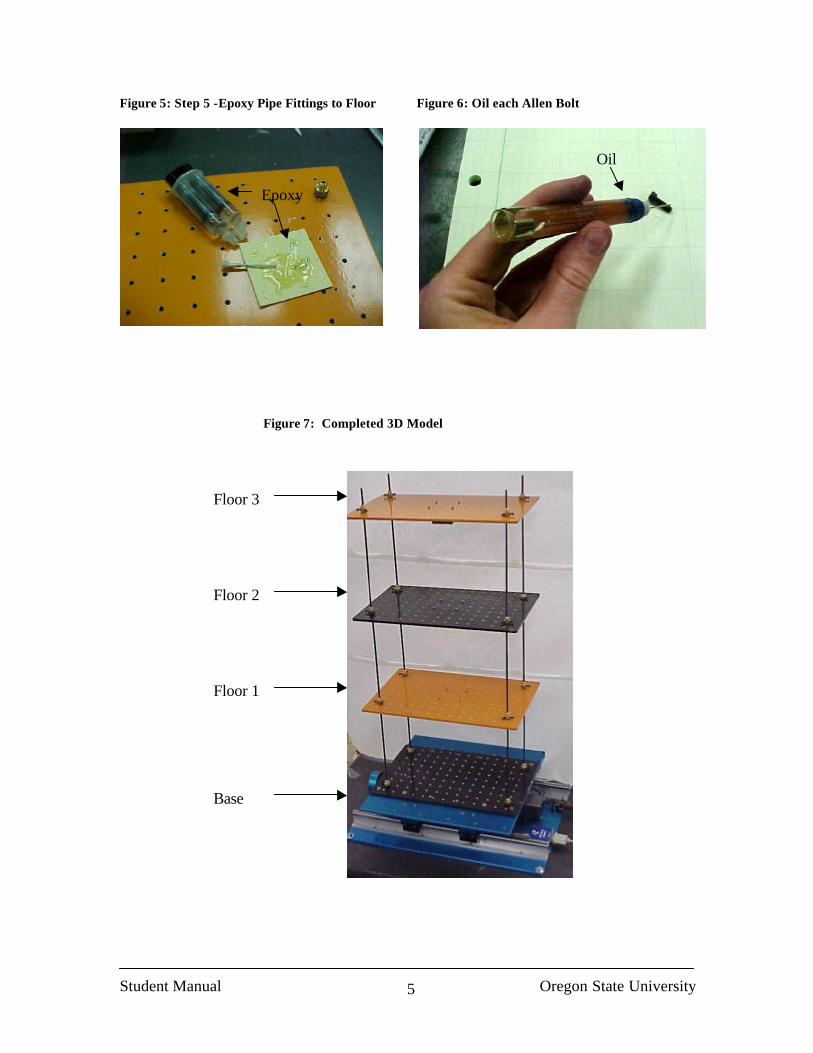
Figure 5: Step 5 -Epoxy Pipe Fittings to Floor Figure 6: Oil each Allen Bolt
Figure 7: Completed 3D Model
Epoxy
Oil
Floor 3
Floor 2
Base
Floor 1
Student Manual Oregon State University 6
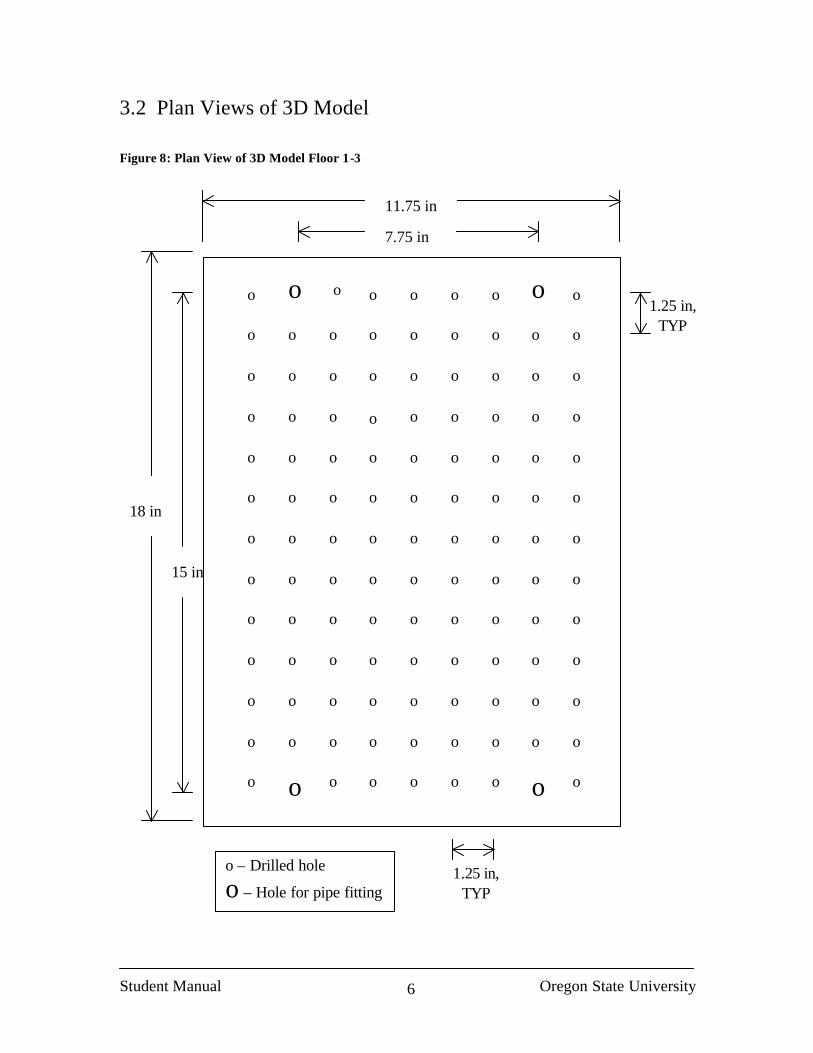
3.2 Plan Views of 3D Model Figure 8: Plan View of 3D Model Floor 1-3
15 in
1.25 in, TYP
1.25 in, TYP
11.75 in
18 in
7.75 in
o – Drilled hole
o – Hole for pipe fitting
o o o o o o o o o
o o o o o o o o o
o o o o o o o o
o o o o o o o o o
o o o o o o o o o
o o o o o o o o o
o o o o o o o o o
o o o o o o o o o
o o o o o o o o o
o o o o o o o o o
o o o o o o o o o
o o o o o o o o
o o o o o o o o o
o
o
Student Manual Oregon State University 7
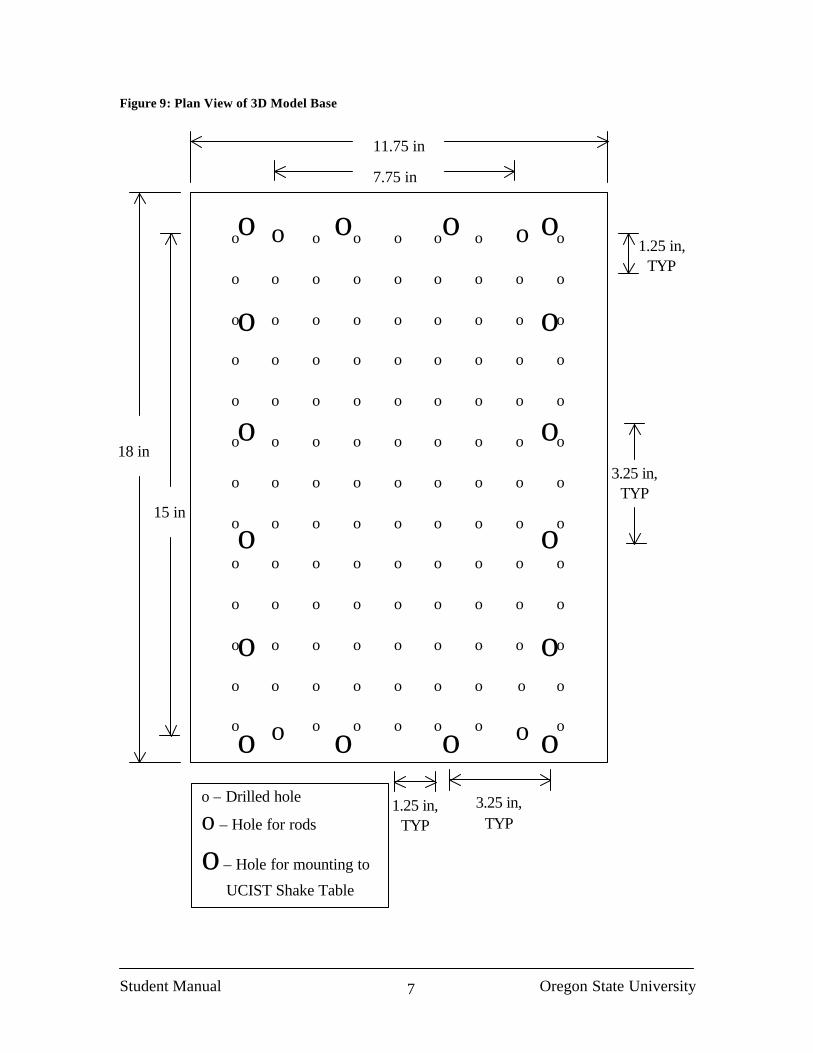
Figure 9: Plan View of 3D Model Base
1.25 in, TYP
o o o o o o o o o
o o o o o o o o o
o o o o o o o o o
o o o o o o o o o
o o o o o o o o o
o o o o o o o o o
o o o o o o o o o
o o o o o o o o o
o o o o o o o o o
o o o o o o o o o
o o o o o o o o o
1.25 in, TYP
o o o o o o o o o
o o o o o o o o o
11.75 in
18 in
15 in
7.75 in
o o o o
o o
o o
o
o
o
o
o o o o o – Drilled hole
o – Hole for rods
o – Hole for mounting to
UCIST Shake Table
3.25 in, TYP
3.25 in, TYP
Student Manual Oregon State University 8
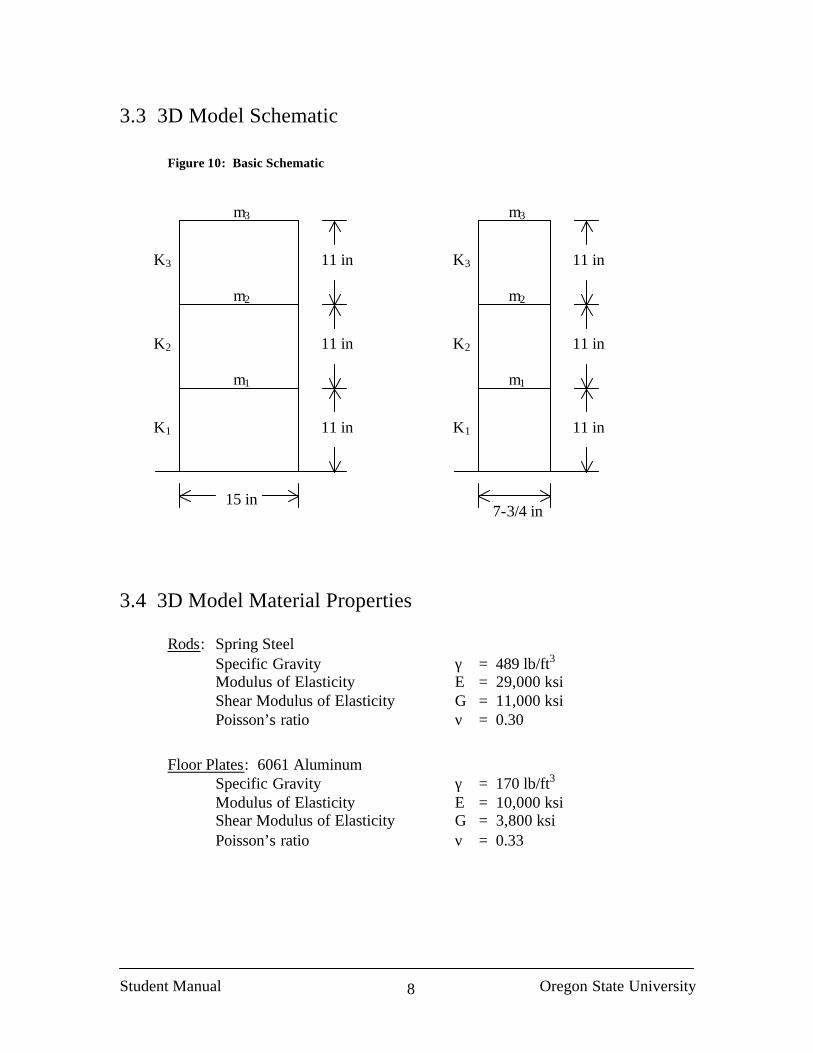
3.3 3D Model Schematic
Figure 10: Basic Schematic
3.4 3D Model Material Properties
Rods: Spring Steel Specific Gravity γ = 489 lb/ft3 Modulus of Elasticity E = 29,000 ksi Shear Modulus of Elasticity G = 11,000 ksi Poisson’s ratio ν = 0.30
Floor Plates: 6061 Aluminum Specific Gravity γ = 170 lb/ft3 Modulus of Elasticity E = 10,000 ksi Shear Modulus of Elasticity G = 3,800 ksi Poisson’s ratio ν = 0.33
K1
m1
m2
m3
K3
K2
11 in
11 in
11 in
7-3/4 in
K1
m1
m2
K2
K3
m3
11 in
11 in
11 in
15 in
Student Manual Oregon State University 9
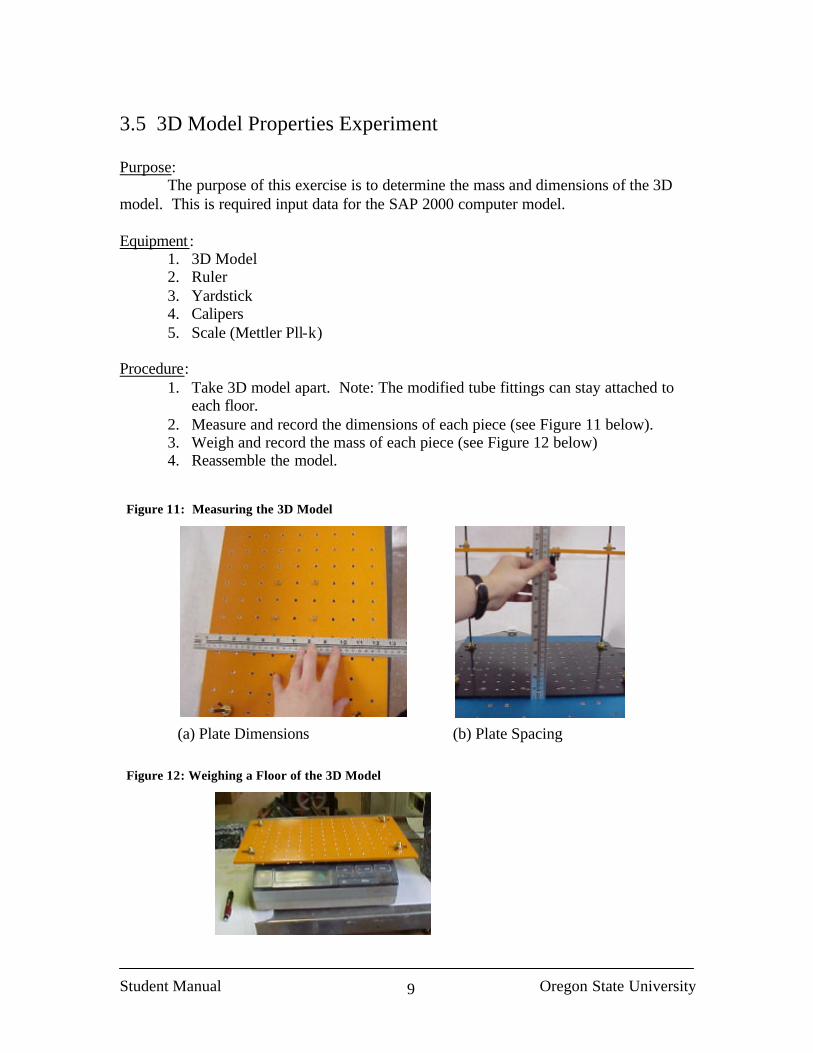
3.5 3D Model Properties Experiment Purpose: The purpose of this exercise is to determine the mass and dimensions of the 3D model. This is required input data for the SAP 2000 computer model. Equipment :
1. 3D Model 2. Ruler 3. Yardstick 4. Calipers 5. Scale (Mettler Pll-k)
Procedure:
1. Take 3D model apart. Note: The modified tube fittings can stay attached to each floor.
2. Measure and record the dimensions of each piece (see Figure 11 below). 3. Weigh and record the mass of each piece (see Figure 12 below) 4. Reassemble the model.
Figure 11: Measuring the 3D Model
Figure 12: Weighing a Floor of the 3D Model
(a) Plate Dimensions (b) Plate Spacing
Student Manual Oregon State University 10
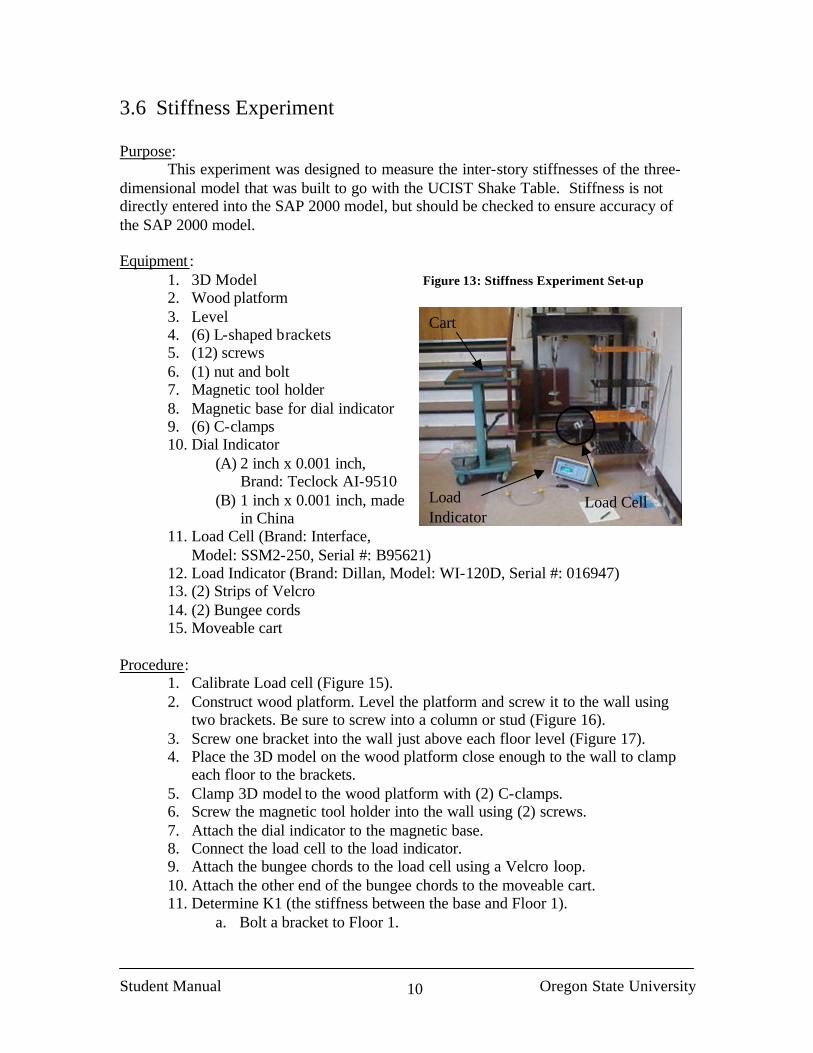
3.6 Stiffness Experiment Purpose: This experiment was designed to measure the inter-story stiffnesses of the three-dimensional model that was built to go with the UCIST Shake Table. Stiffness is not directly entered into the SAP 2000 model, but should be checked to ensure accuracy of the SAP 2000 model. Equipment :
1. 3D Model Figure 13: Stiffness Experiment Set-up 2. Wood platform 3. Level 4. (6) L-shaped brackets 5. (12) screws 6. (1) nut and bolt 7. Magnetic tool holder 8. Magnetic base for dial indicator 9. (6) C-clamps 10. Dial Indicator
(A) 2 inch x 0.001 inch, Brand: Teclock AI-9510
(B) 1 inch x 0.001 inch, made in China
11. Load Cell (Brand: Interface, Model: SSM2-250, Serial #: B95621)
12. Load Indicator (Brand: Dillan, Model: WI-120D, Serial #: 016947) 13. (2) Strips of Velcro 14. (2) Bungee cords 15. Moveable cart
Procedure: 1. Calibrate Load cell (Figure 15). 2. Construct wood platform. Level the platform and screw it to the wall using
two brackets. Be sure to screw into a column or stud (Figure 16). 3. Screw one bracket into the wall just above each floor level (Figure 17). 4. Place the 3D model on the wood platform close enough to the wall to clamp
each floor to the brackets. 5. Clamp 3D model to the wood platform with (2) C-clamps. 6. Screw the magnetic tool holder into the wall using (2) screws. 7. Attach the dial indicator to the magnetic base. 8. Connect the load cell to the load indicator. 9. Attach the bungee chords to the load cell using a Velcro loop. 10. Attach the other end of the bungee chords to the moveable cart. 11. Determine K1 (the stiffness between the base and Floor 1).
a. Bolt a bracket to Floor 1.
Cart
Load Indicator
Load Cell
Student Manual Oregon State University 11
b. Position the rod and dial indicator along the metal strip just above or below the level of Floor 1, so the dial indicator presses against the bracket on Floor 1 and reads displacements of that floor (Figures 18 and 19).
c. Attach a clamp to the end of Floor 1 (the end away from the wall). d. Attach the load cell to the clamp using a Velcro loop (Figure 20). e. With the model base clamped to the wood platform, incrementally pull
on Floor 1 (see Figure 21) f. Record displacements (read from dial indicator) and pull (read from
load indicator) at approximately 2 pound increments. 12. Determine K2 (the stiffness between Floor 1 and Floor 2).
a. Clamp Floor 1 to the bracket at that level, using a shim between the floor and the bracket.
b. Repeat the steps (a) through (d) in part 11 for Floor 2 instead of Floor 1.
c. With the model base clamped to the wood platform and Floor 1 clamped to the wall, incrementally pull on Floor 2.
d. Record displacements (read from dial indicator) and pull (read from load indicator) at approximately 2 pound increments.
13. Determine K3 (the stiffness between Floor 2 and Floor 3). a. Clamp Floor 2 to the bracket at that level, using a shim between the
floor and the bracket. b. Repeat the steps (a) through (d) in part 11 for Floor 3 instead of Floor
1. c. With the model base clamped to the wood platform and Floor 1 and
Floor 2 clamped to the wall, incrementally pull on Floor 3 (Figure 22). d. Record displacements (read from dial indicator) and pull (read from
load indicator) at approximately 2 pound increments. 14. Unscrew everything from the wall and put the equipment away.
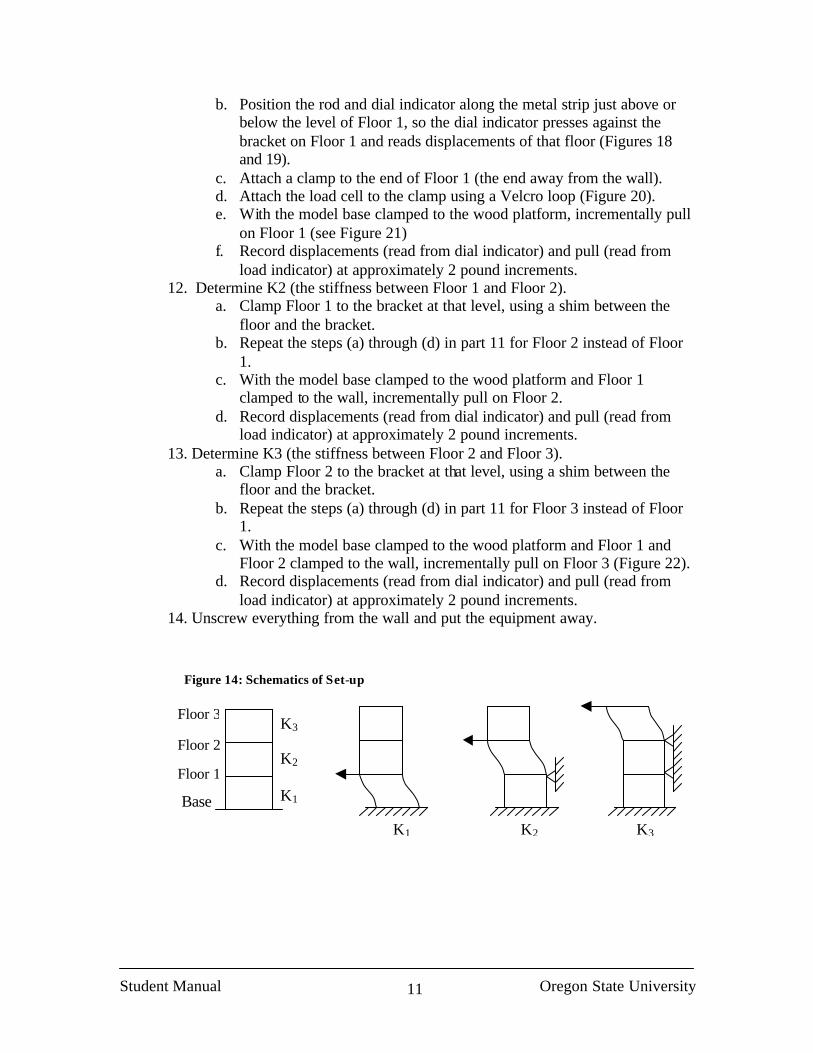
Figure 14: Schematics of Set-up
Base K1
K2
K3
Floor 1
Floor 2
Floor 3
K1 K2 K3
Student Manual Oregon State University 12
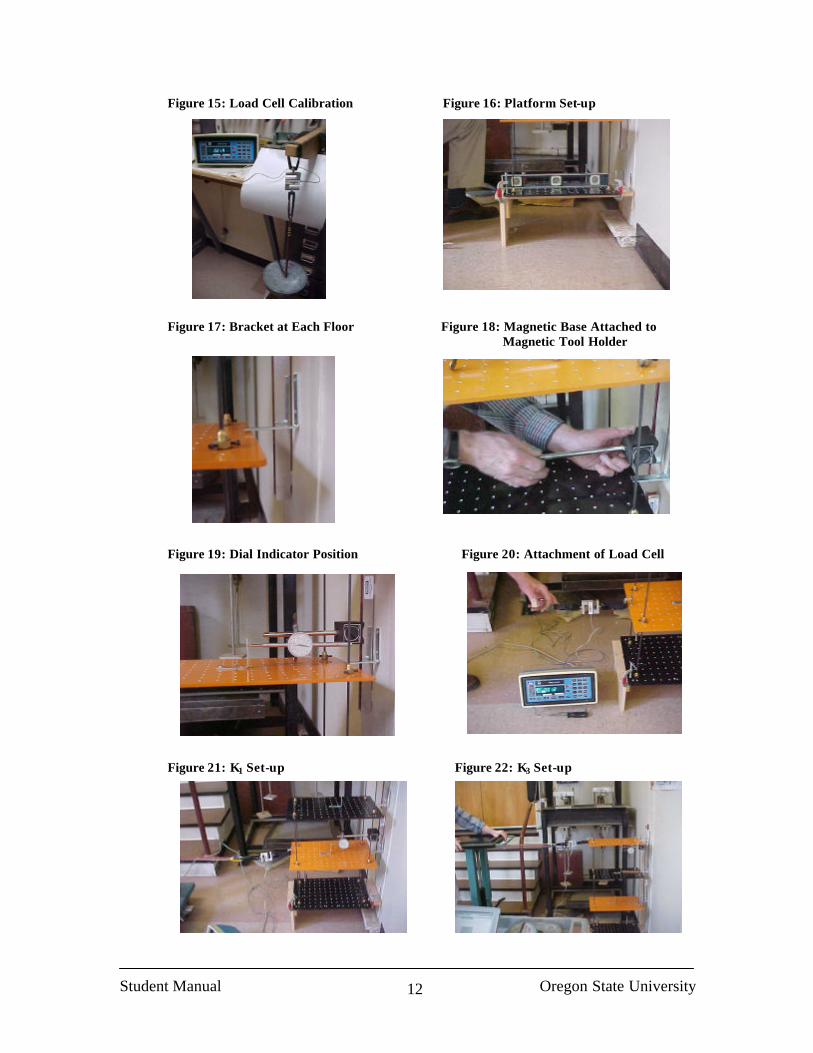
Figure 15: Load Cell Calibration Figure 16: Platform Set-up
Figure 17: Bracket at Each Floor Figure 18: Magnetic Base Attached to Magnetic Tool Holder
Figure 19: Dial Indicator Position Figure 20: Attachment of Load Cell
Figure 21: K1 Set-up Figure 22: K3 Set-up
Student Manual Oregon State University 13
3.7 Damping – Free Vibration Test Purpose: This experiment is designed to determine the damping ratio of the 3D model. The damping ratio is important input in the SAP 2000 model. Equipment :
1. Video Camera (Sony) 2. Yardstick with 1/10 inch scales 3. (2) Ring-stands 4. Masking tape 5. (4) Clamps (to clamp to ring-stand and hold yardsticks) 6. (2) C-clamps (to secure model to a stable surface) 7. Ladder 8. Spot light if room lighting not sufficient 9. 3D Model 10. VCR that will play videos frame-by-frame 11. Television
Procedure:
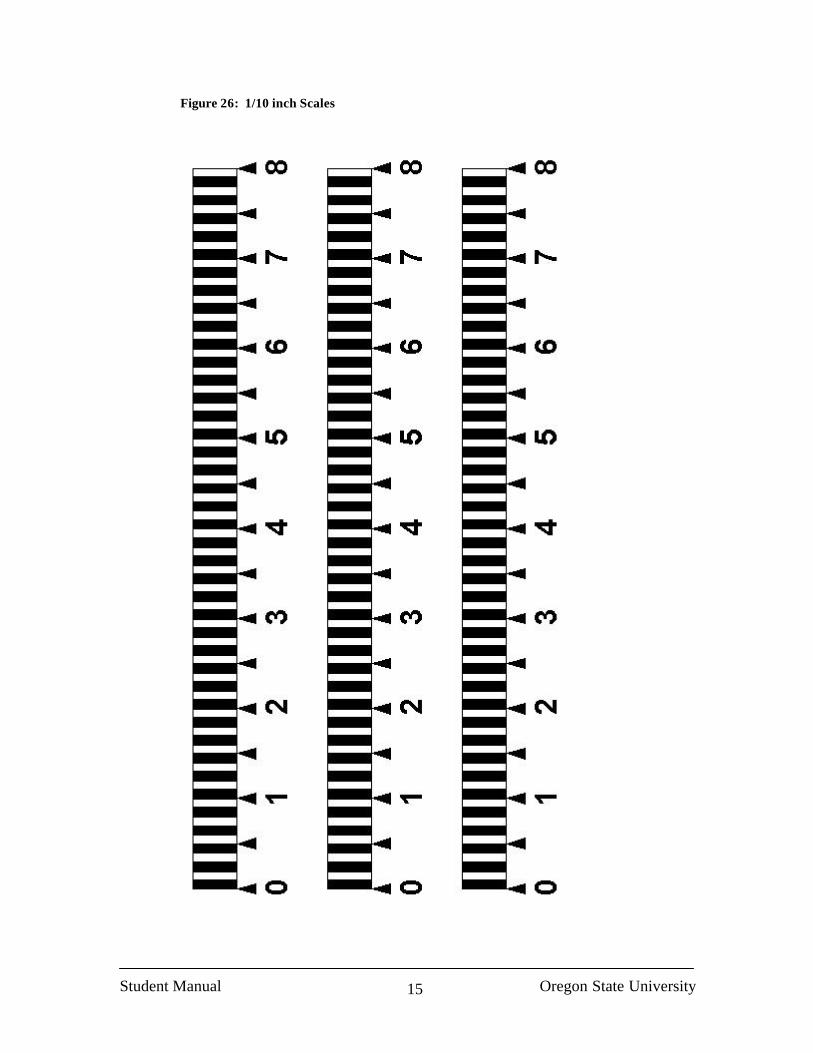
1. Place the ring-stands on either side of the shake table. 2. Tape the 1/10 inch scale rulers to the yardsticks. See Figure 26 for samples
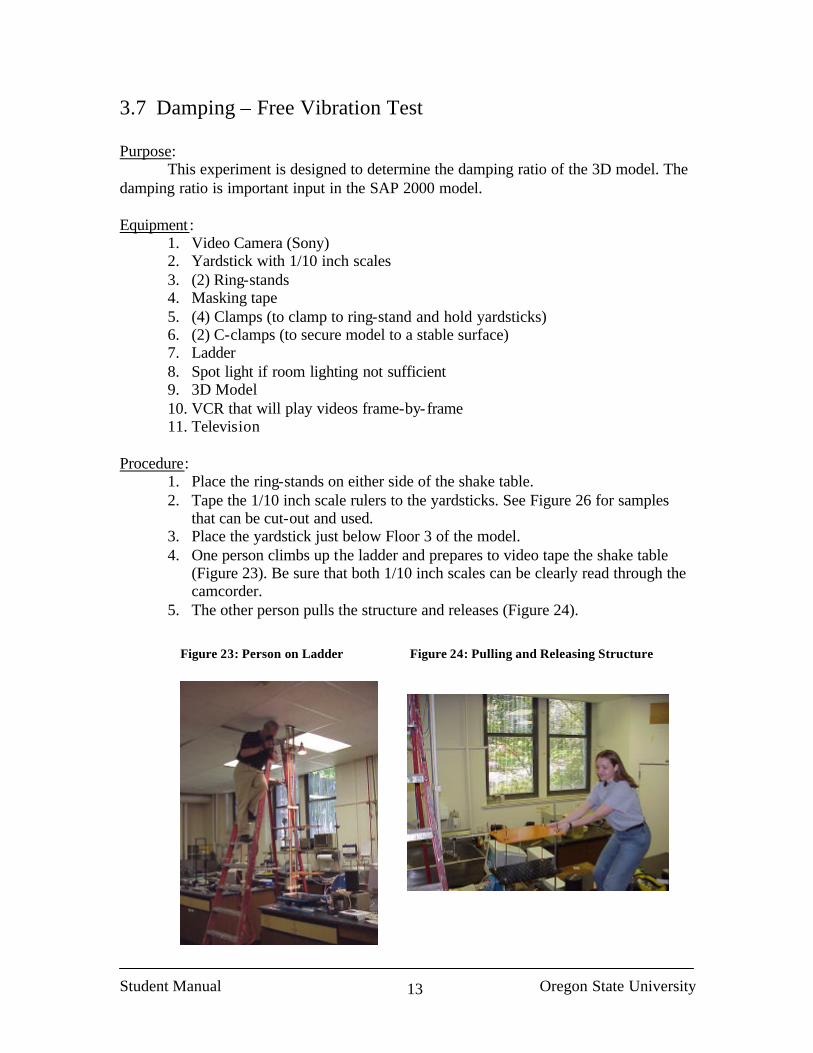
that can be cut-out and used. 3. Place the yardstick just below Floor 3 of the model. 4. One person climbs up the ladder and prepares to video tape the shake table
(Figure 23). Be sure that both 1/10 inch scales can be clearly read through the camcorder.
5. The other person pulls the structure and releases (Figure 24).
Figure 23: Person on Ladder Figure 24: Pulling and Releasing Structure
Student Manual Oregon State University 14
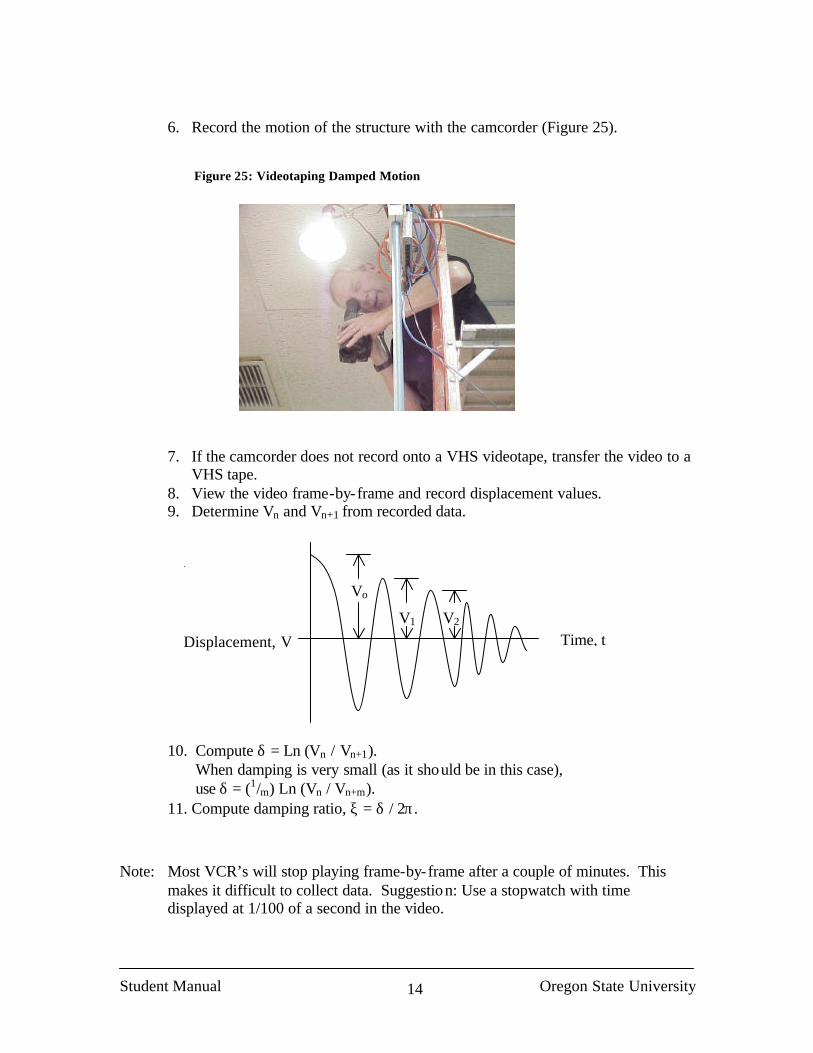
6. Record the motion of the structure with the camcorder (Figure 25).
Figure 25: Videotaping Damped Motion
7. If the camcorder does not record onto a VHS videotape, transfer the video to a VHS tape.
8. View the video frame-by-frame and record displacement values. 9. Determine Vn and Vn+1 from recorded data.
10. Compute δ = Ln (Vn / Vn+1). When damping is very small (as it should be in this case), use δ = (1/m) Ln (Vn / Vn+m).
11. Compute damping ratio, ξ = δ / 2π .
Note: Most VCR’s will stop playing frame-by-frame after a couple of minutes. This makes it difficult to collect data. Suggestion: Use a stopwatch with time displayed at 1/100 of a second in the video.
V2 V1
Vo
Displacement, V Time, t
Student Manual Oregon State University 15
Figure 26: 1/10 inch Scales

Student Manual Oregon State University 16
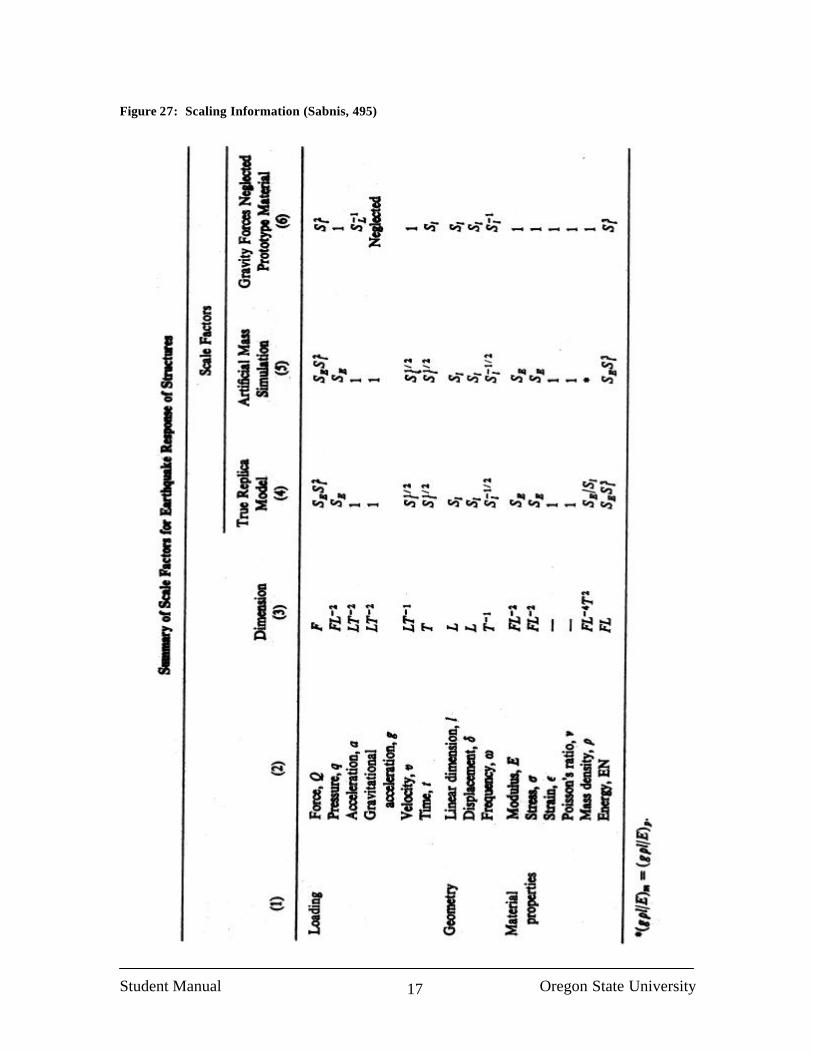
4.0 Earthquake Scale Determination Purpose: The purpose of this exercise is to determine what scale factor was used for scaling each earthquake. Theory: Let the scale factor be S. When scaling an earthquake, acceleration data is scaled at a 1:1 ratio. Time is scaled at a 1: S ratio. (See Figure 27) Equipment :
1. UCIST Shake table (Table and Universal Power Module) 2. Computer (with WinCon, MatLab, and Microsoft Excel)
Procedure:
1. Choose the earthquake to use. 2. Start WinCon, go to open model, and select the earthquake’s wcl file. (i.e.,
select Elcent.wcl) 3. Open a scope for Accel R. 4. Start the earthquake. 5. Save the plot as a MatLab file. (In the Scope’s screen, go to File, Save as, and
select Save as an M-file.) 6. Copy the Accel R data from the M-file, save it as a text file, and paste it into
an Excel file (or other spreadsheet program). 7. Open the MatLab file containing the earthquake’s original data. This should
be stored on the UCIST Computer. 8. Copy original earthquake data from the M-file, save it as a text file, and paste
it into the Excel file from step 6. 9. Plot the original and the scaled earthquake acceleration data versus time. The
plots should appear similar. The acceleration values should be of the same magnitude, but the duration of the scaled earthquake should be shorter than that of the original earthquake.
10. If there is a period of time at the beginning of the earthquake data where the acceleration is essentially zero, exclude this data from the analysis.
11. Find the duration (from the start of accelerations to the end of accelerations) for each set of earthquake data (scaled and original).
12. Use the knowledge that time is scaled as a function of S to back calculate the scale factor, S.
Time factor = S . Therefore, S = (Time Factor)2.
13. Report the scale factor as a 1: S ratio.
Student Manual Oregon State University 17
Figure 27: Scaling Information (Sabnis, 495)
Student Manual Oregon State University 18
5.0 UCIST Shake Table Experiments The following two experiments are designed to collect the necessary data for comparison to SAP 2000.
5.1 Shake Table Accelerations Experiment Purpose: The purpose of this experiment is to determine the seismic response of the three-dimensional model when shaken by the scaled El Centro earthquake. Equipment :
1. UCIST Shake table (Table, Universal Power Module, and Computer) 2. 3D Model
Procedure:
1. Securely attach the 3D model to the UCIST Shake Table. 2. Start WinCon and open El Centro earthquake wcl file. 3. Open Accel T, Floor 1, and Floor 2 scopes. 4. Connect accelerometers (one on each floor of the 3D model and one on the
table) to the Universal Power Module (UPM). Note: “Accel T” plots the accelerometer connected to S1 on the UPM, “Floor 1” plots S2, and “Floor 2” plots S3.
5. Run El Centro Earthquake (scaled). 6. Save each scope as an M-File. 7. Run the earthquake enough times to collect at least 3 sets of acceleration data
for each floor of the model (Table, Floor 1, Floor 2, and Floor 3). If you only have 3 accelerometers available, move the accelerometers around for each test. Sample test series: Test “Accel T” (S1) “Floor 1” (S2) “Floor 2” (S3) 1 Table Floor 1 Floor 3 2 Table Floor 1 Floor 3 3 Table Floor 2 Floor 3 4 Floor 1 Floor 2 Floor 3 5 Table Floor 1 Floor 2
8. Copy data from M-Files into Microsoft Excel (or other spreadsheet program). 9. Plot each graph to check consistency and to make comparisons.
Student Manual Oregon State University 19
5.2 Displacement Experiment Purpose: The purpose of this experiment is to determine the maximum displacements of the top floor (Floor 3) relative to the bottom floor (Base) when running the scaled El Centro earthquake on the UCIST Shake Table. The data collected in this experiment will be compared to SAP 2000 results. Equipment :
1. UCIST Shake table (Table, Universal Power Module, and Computer with WinCon and MatLab)
2. 3D Model 3. (2) Yardsticks 4. (2) 1/10 inch scale rulers 5. (2) Ring-stands 6. (4) Clamps (to clamp to ring-stand and ho ld yardsticks) 7. Masking tape 8. Ladder 9. Camcorder (Sony) 10. Spot light if room lighting is not sufficient 11. VCR that will play a video frame-by-frame 12. TV to view video
Procedure:
1. Securely attach the 3D model to the UCIST Shake Table. 2. Place the ring-stands on either side of the shake table. 3. Tape the 1/10 inch scale rulers to the yardsticks. See Figure 26 for sample
1/10 in scales that can be cut-out and used. 4. Place one yardstick just below the Shake Table base and one just below Floor
3 of the model. 5. One person climbs up the ladder and prepares to video tape the shake table.
Be sure that both 1/10 inch scales can be clearly read through the camcorder. 6. The other person opens and runs the El Centro Earthquake wcl file, while the
person on the ladder records the motions on the camcorder. 7. If the camcorder does not record onto a VHS videotape, transfer the video to a
VHS tape. 8. View the video frame-by-frame and record the maximum relative
displacement between Floor 3 and the Base of the model. Note: Most VCR’s will stop playing frame-by-frame after a couple of minutes. This
makes it difficult to collect data. Suggestion: Use a stopwatch with time displayed at 1/100 of a second in the video.
Student Manual Oregon State University 20
6.0 SAP 2000 Model Purpose: The purpose of this exercise is to develop data from a computer analysis (using structural analysis software), so these results can be compared to experimental results found with the UCIST shake table. Equipment :
1. Computer 2. SAP 2000 Software or similar computer program 3. Printer to print results
Procedure: 1. Input geometry and material properties of 3D model. (See “3D Model
Schematic” and “3D Model Material Properties” for input values.) 2. Input scaled El Centro earthquake using Time History analysis feature. 3. Run SAP 2000 model. 4. Display and print acceleration as a function of time for each floor of the
model. 5. Display and print displacement of the top floor as a function of time. Note the
value of the maximum displacement and at what time the maximum displacement occurred.
6. Compare these results to those found with the UCIST Shake table (see “Shake Table Experiment”) .
![HOME AUDIO SYSTEM - CNET Content Solutions€¦ · model name [SHAKE-99/SHAKE-77/SHAKE-55/SHAKE-33] [4-487-569-14(1)] GB2GB filename[D:\NORM'S JOB\SONY HA\SO140043\SHAKE-99_77_55_33](https://img.pdfslide.us/doc/110x75/5f6d806635b4b45b2279704e/home-audio-system-cnet-content-solutions-model-name-shake-99shake-77shake-55shake-33.jpg)