Embed Size (px)
Citation preview
Student Manual Lesson 3- Moisture Density Relationship
Version 1.0- 3/09 3-1
Student Manual Lesson 3- Moisture Density Relationship
Version 1.0- 3/09 3- 2
Student Manual Lesson 3- Moisture Density Relationship
3 - 3Version 1.0- 3/09
Student Manual Lesson 3- Moisture Density Relationship
Invented by Mr. R.R. Proctor in the early 1930’s. In his honor, the Standard Laboratoryy y yTest that he developed is called the Proctor Test.
The contractor uses compaction, a process, to achieve density, a product.
3- 4Version 1.0- 3/09
Student Manual Lesson 3- Moisture Density Relationship
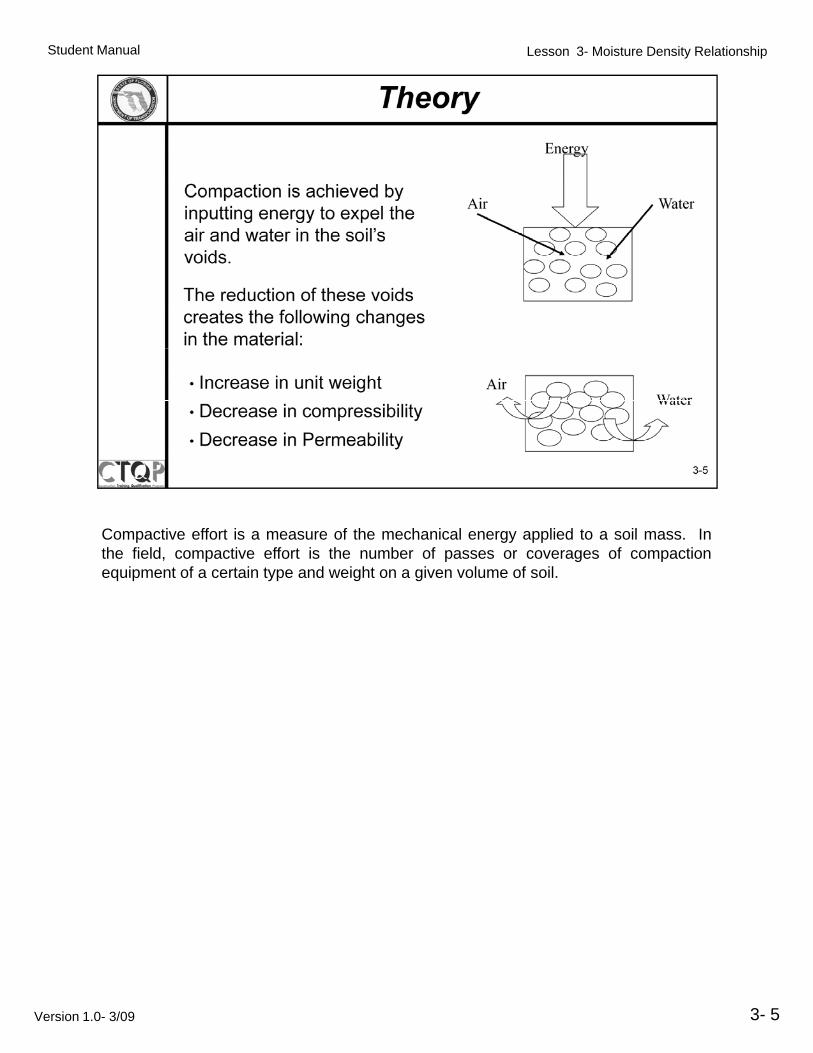
Compactive effort is a measure of the mechanical energy applied to a soil mass. Inthe field, compactive effort is the number of passes or coverages of compactionequipment of a certain type and weight on a given volume of soil.
3- 5Version 1.0- 3/09
Student Manual Lesson 3- Moisture Density Relationship
The project and/or design specifications and standards will set forth a certainThe project and/or design specifications and standards will set forth a certainpercentage of density value the contractor must achieve of the laboratory Proctor testperformed for that particular material. Greater control of compaction effort is obtainedin the laboratory. Field density is usually expressed as a percentage of lab maximumdensity (i.e. 100% of AASHTO T 99 or 98% of FM 1 T-180).
3- 6Version 1.0- 3/09
Student Manual Lesson 3- Moisture Density Relationship
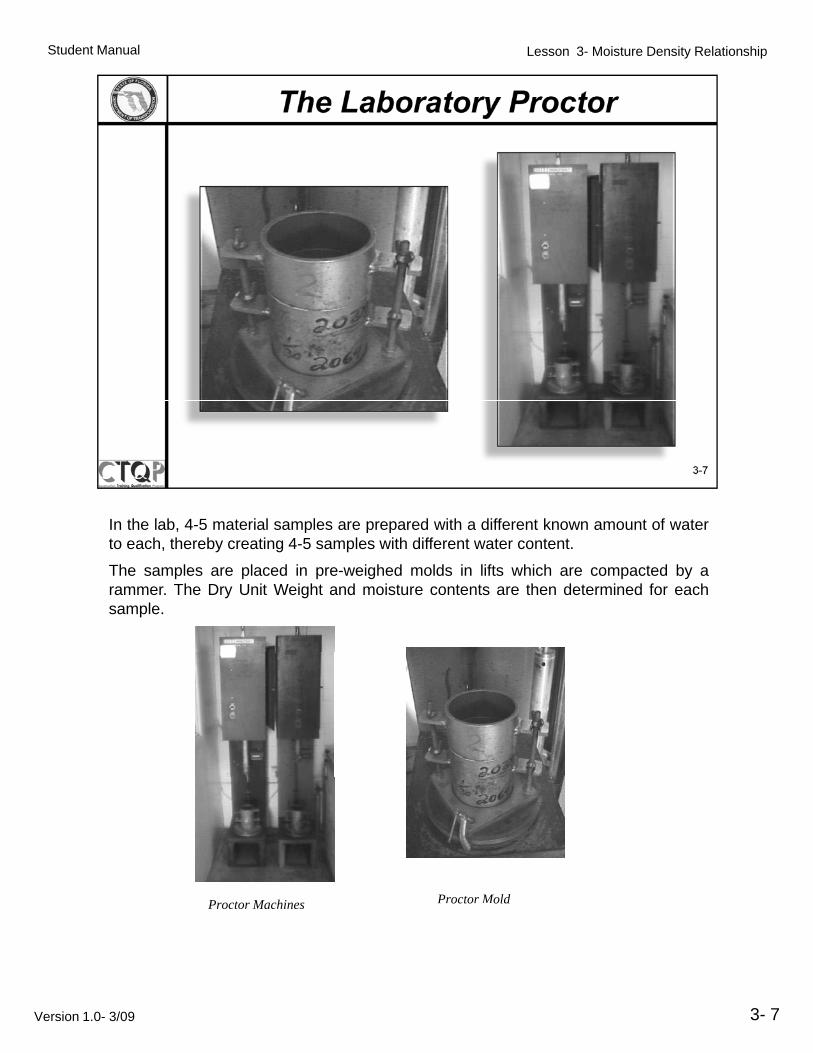
In the lab 4-5 material samples are prepared with a different known amount of waterIn the lab, 4-5 material samples are prepared with a different known amount of waterto each, thereby creating 4-5 samples with different water content.
The samples are placed in pre-weighed molds in lifts which are compacted by arammer. The Dry Unit Weight and moisture contents are then determined for eachsample.
Proctor Machines Proctor Mold
3- 7
Proctor Machines octo old
Version 1.0- 3/09
Student Manual Lesson 3- Moisture Density Relationship
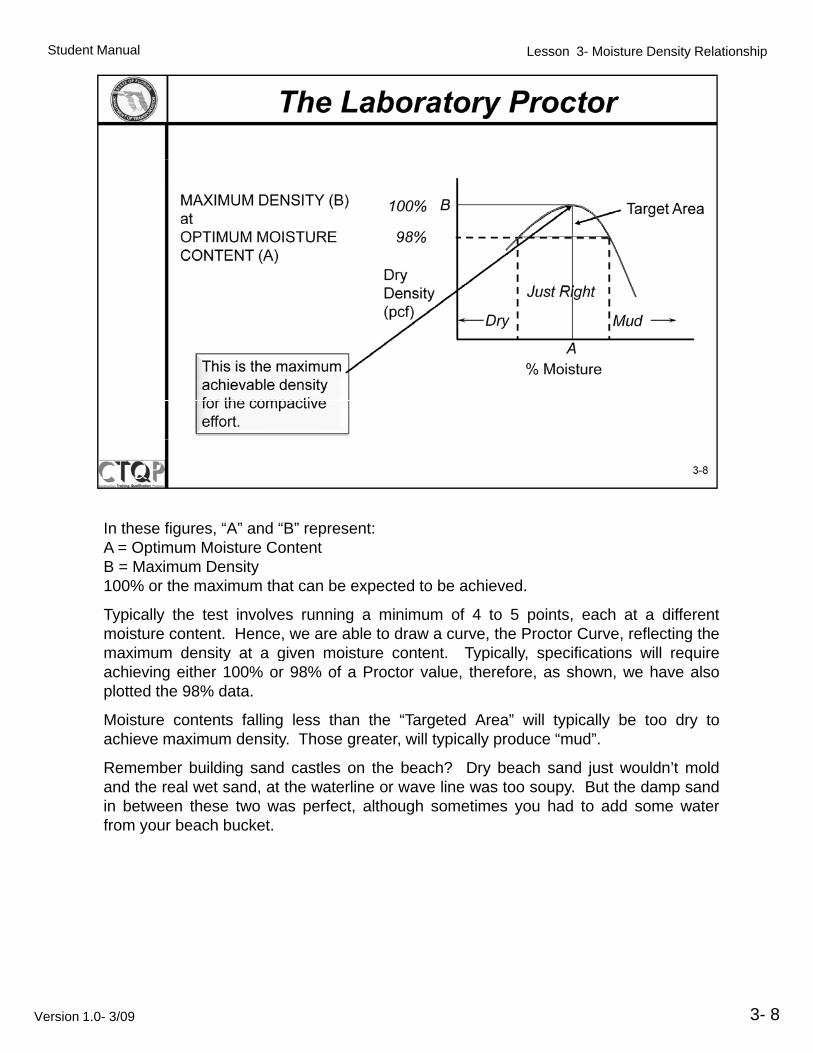
In these figures “A” and “B” represent:In these figures, A and B represent:A = Optimum Moisture ContentB = Maximum Density100% or the maximum that can be expected to be achieved.
Typically the test involves running a minimum of 4 to 5 points, each at a differentmoisture content. Hence, we are able to draw a curve, the Proctor Curve, reflecting themaximum density at a given moisture content Typically specifications will requiremaximum density at a given moisture content. Typically, specifications will requireachieving either 100% or 98% of a Proctor value, therefore, as shown, we have alsoplotted the 98% data.
Moisture contents falling less than the “Targeted Area” will typically be too dry toachieve maximum density. Those greater, will typically produce “mud”.
Remember building sand castles on the beach? Dry beach sand just wouldn’t moldand the real wet sand, at the waterline or wave line was too soupy. But the damp sandin between these two was perfect, although sometimes you had to add some waterfrom your beach bucket.
3- 8Version 1.0- 3/09
Student Manual Lesson 3- Moisture Density Relationship
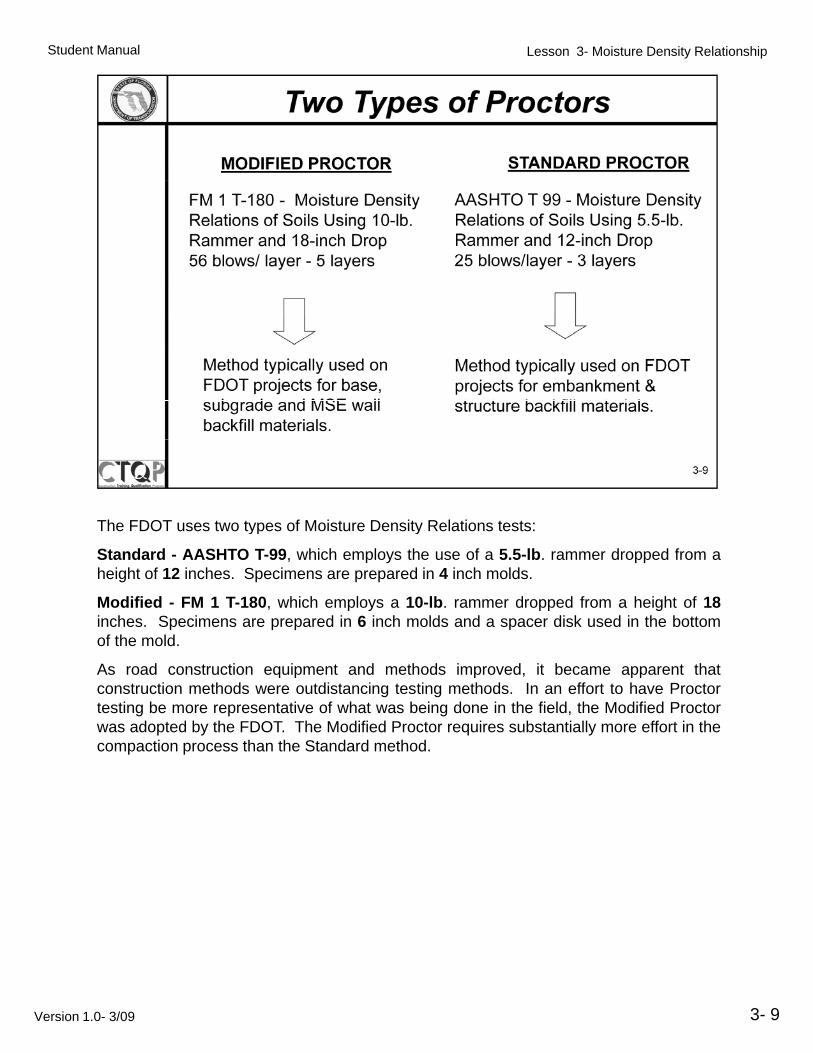
The FDOT uses two types of Moisture Density Relations tests:The FDOT uses two types of Moisture Density Relations tests:
Standard - AASHTO T-99, which employs the use of a 5.5-lb. rammer dropped from aheight of 12 inches. Specimens are prepared in 4 inch molds.
Modified - FM 1 T-180, which employs a 10-lb. rammer dropped from a height of 18inches. Specimens are prepared in 6 inch molds and a spacer disk used in the bottomof the mold.
As road construction equipment and methods improved, it became apparent thatconstruction methods were outdistancing testing methods. In an effort to have Proctortesting be more representative of what was being done in the field, the Modified Proctorwas adopted by the FDOT. The Modified Proctor requires substantially more effort in thecompaction process than the Standard method.
3- 9Version 1.0- 3/09
Student Manual Lesson 3- Moisture Density Relationship
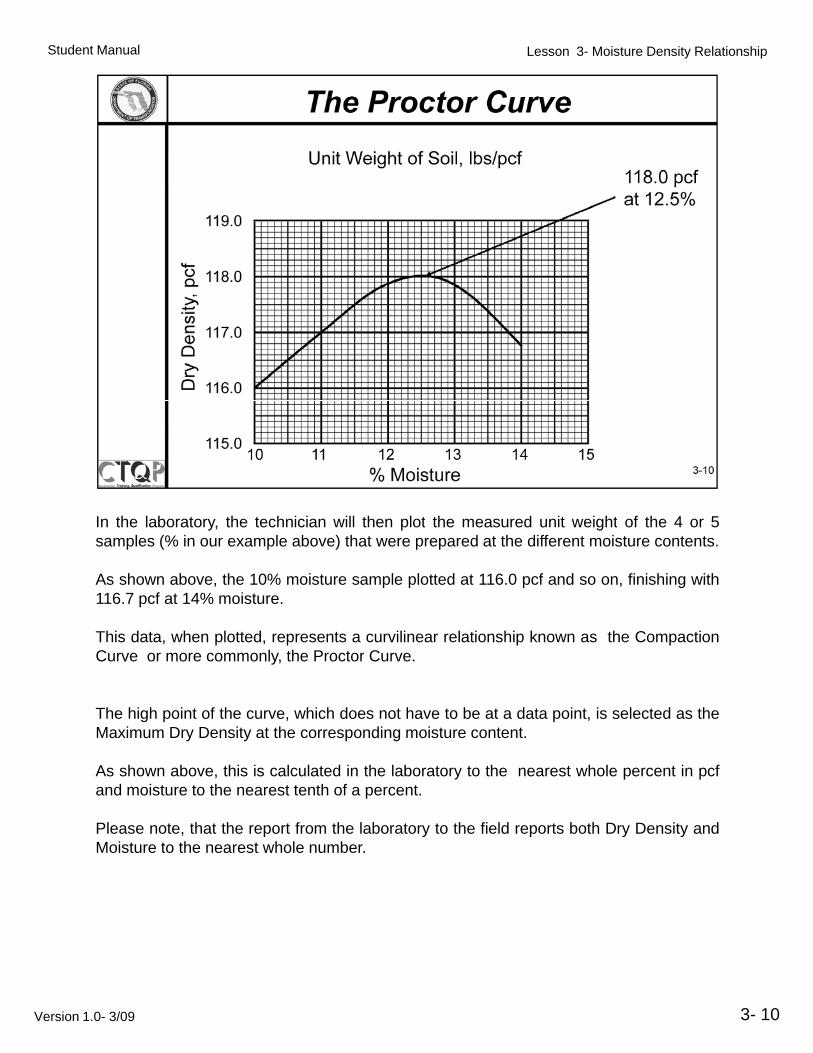
In the laboratory, the technician will then plot the measured unit weight of the 4 or 5In the laboratory, the technician will then plot the measured unit weight of the 4 or 5samples (% in our example above) that were prepared at the different moisture contents.
As shown above, the 10% moisture sample plotted at 116.0 pcf and so on, finishing with116.7 pcf at 14% moisture.
This data, when plotted, represents a curvilinear relationship known as the CompactionC l th P t CCurve or more commonly, the Proctor Curve.
The high point of the curve, which does not have to be at a data point, is selected as theMaximum Dry Density at the corresponding moisture content.
As shown above, this is calculated in the laboratory to the nearest whole percent in pcf, y p pand moisture to the nearest tenth of a percent.
Please note, that the report from the laboratory to the field reports both Dry Density andMoisture to the nearest whole number.
3- 10Version 1.0- 3/09
Student Manual Lesson 3- Moisture Density Relationship
3 - 11Version 1.0- 3/09
Student Manual Lesson 3- Moisture Density Relationship
3 - 12Version 1.0- 3/09
Student Manual Lesson 3- Moisture Density Relationship
3- 13Version 1.0- 3/09
Student Manual Lesson 3- Moisture Density Relationship
3- 14Version 1.0- 3/09

![Soil Moisture Content and Density Prediction Using ...ijetch.org/papers/652-EA1005.pdf · soil properties were moisture content, density ... groundwater resources [4] – [7] and](https://img.pdfslide.us/doc/110x75/5b33fc157f8b9a8b4b8b993a/soil-moisture-content-and-density-prediction-using-soil-properties-were.jpg)